NEXTERA ENERGY INC
10-Ks and 10-Qs
|
|
|
|
|
|
|
|
|
|
|
|
|
|
|
|
|
|
|
|
|
|
|
|
|
|
|
|
|
|
|
|
|
|
|
|
|
|
|
|
|
|
|
|
|
|
|
|
|
|
|
|
|
|
|
|
|
|
|

|

|
|
UNITED STATES SECURITIES AND EXCHANGE COMMISSION
Washington, D.C. 20549
FORM 10-K
ANNUAL REPORT PURSUANT TO SECTION 13 OR 15(d)
OF THE SECURITIES EXCHANGE ACT OF 1934
For the fiscal year ended
December 31, 2014
|
Commission
File
Number
|
Exact name of registrants as specified in their
charters, address of principal executive offices and
registrants' telephone number
|
IRS Employer
Identification
Number
|
||
|
1-8841
|
NEXTERA ENERGY, INC.
|
59-2449419
|
||
|
2-27612
|
FLORIDA POWER & LIGHT COMPANY
700 Universe Boulevard
Juno Beach, Florida 33408
(561) 694-4000
|
59-0247775
|
||
State or other jurisdiction of incorporation or organization:
Florida
|
Name of exchange on which registered
|
||
|
Securities registered pursuant to Section 12(b) of the Act:
|
||
|
NextEra Energy, Inc.:
|
Common Stock, $0.01 Par Value
|
New York Stock Exchange
|
|
5.889% Corporate Units
|
New York Stock Exchange
|
|
|
5.799% Corporate Units
|
New York Stock Exchange
|
|
|
Florida Power & Light Company:
None
|
||
Indicate by check mark if the registrants are well-known seasoned issuers, as defined in Rule 405 of the Securities Act of 1933.
|
NextEra Energy, Inc. Yes
þ
No
o
Florida Power & Light Company Yes
þ
No
o
|
Indicate by check mark if the registrants are not required to file reports pursuant to Section 13 or Section 15(d) of the Securities Exchange Act of 1934.
|
NextEra Energy, Inc. Yes
o
No
þ
Florida Power & Light Company Yes
o
No
þ
|
Indicate by check mark whether the registrants (1) have filed all reports required to be filed by Section 13 or 15(d) of the Securities Exchange Act of 1934 during the preceding 12 months, and (2) have been subject to such filing requirements for the past 90 days.
|
NextEra Energy, Inc. Yes
þ
No
o
Florida Power & Light Company Yes
þ
No
o
|
Indicate by check mark whether the registrants have submitted electronically and posted on their corporate website, if any, every Interactive Data File required to be submitted and posted pursuant to Rule 405 of Regulation S-T during the preceding 12 months.
|
NextEra Energy, Inc. Yes
þ
No
o
Florida Power & Light Company Yes
þ
No
o
|
Indicate by check mark if disclosure of delinquent filers pursuant to Item 405 of Regulation S-K is not contained herein, and will not be contained, to the best of registrants' knowledge, in definitive proxy or information statements incorporated by reference in Part III of this Form 10-K or any amendment to this Form 10-K.
þ
Indicate by check mark whether the registrants are a large accelerated filer, an accelerated filer, a non-accelerated filer, or a smaller reporting company. See the definitions of "large accelerated filer," "accelerated filer" and "smaller reporting company" in Rule 12b-2 of the Securities Exchange Act of 1934.
|
NextEra Energy, Inc.
|
Large Accelerated Filer
þ
|
Accelerated Filer
o
|
Non-Accelerated Filer
o
|
Smaller Reporting Company
o
|
|
Florida Power & Light Company
|
Large Accelerated Filer
o
|
Accelerated Filer
o
|
Non-Accelerated Filer
þ
|
Smaller Reporting Company
o
|
Indicate by check mark whether the registrants are shell companies (as defined in Rule 12b-2 of the Securities Exchange Act of 1934). Yes
¨
No
þ
Aggregate market value of the voting and non-voting common equity of NextEra Energy, Inc. held by non-affiliates as of
June 30, 2014
(based on the closing market price on the Composite Tape on
June 30, 2014
) was
$44,591,917,850
.
There was no voting or non-voting common equity of Florida Power & Light Company held by non-affiliates as of
June 30, 2014
.
Number of shares of NextEra Energy, Inc. common stock, $
0.01
par value, outstanding as of
January 31, 2015
:
443,453,049
Number of shares of Florida Power & Light Company common stock, without par value, outstanding as of
January 31, 2015
, all of which were held, beneficially and of record, by NextEra Energy, Inc.:
1,000
DOCUMENTS INCORPORATED BY REFERENCE
Portions of NextEra Energy, Inc.'s Proxy Statement for the 2014 Annual Meeting of Shareholders are incorporated by reference in Part III hereof.
________________________
This combined Form 10-K represents separate filings by NextEra Energy, Inc. and Florida Power & Light Company. Information contained herein relating to an individual registrant is filed by that registrant on its own behalf. Florida Power & Light Company makes no representations as to the information relating to NextEra Energy, Inc.'s other operations.
Florida Power & Light Company meets the conditions set forth in General Instruction I.(1)(a) and (b) of Form 10-K and is therefore filing this Form with the reduced disclosure format.
DEFINITIONS
Acronyms and defined terms used in the text include the following:
|
Term
|
Meaning
|
|
AFUDC
|
allowance for funds used during construction
|
|
AFUDC - debt
|
debt component of allowance for funds used during construction
|
|
AFUDC - equity
|
equity component of allowance for funds used during construction
|
|
AOCI
|
accumulated other comprehensive income
|
|
capacity clause
|
capacity cost recovery clause, as established by the FPSC
|
|
CFTC
|
U.S. Commodity Futures Trading Commission
|
|
CO
2
|
carbon dioxide
|
|
DOE
|
U.S. Department of Energy
|
|
Duane Arnold
|
Duane Arnold Energy Center
|
|
EPA
|
U.S. Environmental Protection Agency
|
|
ERCOT
|
Electric Reliability Council of Texas
|
|
FERC
|
U.S. Federal Energy Regulatory Commission
|
|
Florida Southeast Connection
|
Florida Southeast Connection, LLC, a wholly-owned NEECH subsidiary
|
|
FPL
|
Florida Power & Light Company
|
|
FPL FiberNet
|
fiber-optic telecommunications business
|
|
FPSC
|
Florida Public Service Commission
|
|
fuel clause
|
fuel and purchased power cost recovery clause, as established by the FPSC
|
|
GAAP
|
generally accepted accounting principles in the U.S.
|
|
GHG
|
greenhouse gas(es)
|
|
IPO
|
initial public offering
|
|
ISO
|
independent system operator
|
|
ITC
|
investment tax credit
|
|
kW
|
kilowatt
|
|
kWh
|
kilowatt-hour(s)
|
|
Lone Star
|
Lone Star Transmission, LLC
|
|
Management's Discussion
|
Item 7. Management's Discussion and Analysis of Financial Condition and Results of Operations
|
|
MMBtu
|
One million British thermal units
|
|
mortgage
|
mortgage and deed of trust dated as of January 1, 1944, from FPL to Deutsche Bank Trust Company Americas, as supplemented and amended
|
|
MW
|
megawatt(s)
|
|
MWh
|
megawatt-hour(s)
|
|
NEE
|
NextEra Energy, Inc.
|
|
NEECH
|
NextEra Energy Capital Holdings, Inc.
|
|
NEER
|
NextEra Energy Resources, LLC
|
|
NEET
|
NextEra Energy Transmission, LLC
|
|
NEP
|
NextEra Energy Partners, LP
|
|
NERC
|
North American Electric Reliability Corporation
|
|
NHT
|
New Hampshire Transmission, LLC
|
|
Note __
|
Note __ to consolidated financial statements
|
|
NOx
|
nitrogen oxide
|
|
NRC
|
U.S. Nuclear Regulatory Commission
|
|
O&M expenses
|
other operations and maintenance expenses in the consolidated statements of income
|
|
OCI
|
other comprehensive income
|
|
OTC
|
over-the-counter
|
|
OTTI
|
other than temporary impairment
|
|
PJM
|
PJM Interconnection, L.L.C.
|
|
PMI
|
NextEra Energy Power Marketing, LLC
|
|
Point Beach
|
Point Beach Nuclear Power Plant
|
|
PTC
|
production tax credit
|
|
PUCT
|
Public Utility Commission of Texas
|
|
PURPA
|
Public Utility Regulatory Policies Act of 1978, as amended
|
|
PV
|
photovoltaic
|
|
regulatory ROE
|
return on common equity as determined for regulatory purposes
|
|
RFP
|
request for proposal
|
|
ROE
|
return on common equity
|
|
RPS
|
renewable portfolio standards
|
|
RTO
|
regional transmission organization
|
|
Sabal Trail
|
Sabal Trail Transmission, LLC, an entity in which a NEECH subsidiary has a 33% ownership interest
|
|
Seabrook
|
Seabrook Station
|
|
SEC
|
U.S. Securities and Exchange Commission
|
|
SO
2
|
sulfur dioxide
|
|
U.S.
|
United States of America
|
|
WCEC
|
FPL's West County Energy Center in western Palm Beach County, Florida
|
NEE, FPL, NEECH and NEER each has subsidiaries and affiliates with names that may include NextEra Energy, FPL, NextEra Energy Resources, NextEra, FPL Group, FPL Group Capital, FPL Energy, FPLE and similar references. For convenience and simplicity, in this report the terms NEE, FPL, NEECH and NEER are sometimes used as abbreviated references to specific subsidiaries, affiliates or groups of subsidiaries or affiliates. The precise meaning depends on the context.
2
TABLE OF CONTENTS
|
Page No.
|
||
FORWARD-LOOKING STATEMENTS
This report includes forward-looking statements within the meaning of the Private Securities Litigation Reform Act of 1995. Any statements that express, or involve discussions as to, expectations, beliefs, plans, objectives, assumptions, strategies, future events or performance (often, but not always, through the use of words or phrases such as may result, are expected to, will continue, is anticipated, aim, believe, will, could, should, would, estimated, may, plan, potential, future, projection, goals, target, outlook, predict and intend or words of similar meaning) are not statements of historical facts and may be forward looking. Forward-looking statements involve estimates, assumptions and uncertainties. Accordingly, any such statements are qualified in their entirety by reference to, and are accompanied by, important factors included in Part I, Item 1A. Risk Factors (in addition to any assumptions and other factors referred to specifically in connection with such forward-looking statements) that could have a significant impact on NEE's and/or FPL's operations and financial results, and could cause NEE's and/or FPL's actual results to differ materially from those contained or implied in forward-looking statements made by or on behalf of NEE and/or FPL in this combined Form 10-K, in presentations, on their respective websites, in response to questions or otherwise.
Any forward-looking statement speaks only as of the date on which such statement is made, and NEE and FPL undertake no obligation to update any forward-looking statement to reflect events or circumstances, including, but not limited to, unanticipated events, after the date on which such statement is made, unless otherwise required by law. New factors emerge from time to time and it is not possible for management to predict all of such factors, nor can it assess the impact of each such factor on the business or the extent to which any factor, or combination of factors, may cause actual results to differ materially from those contained or implied in any forward-looking statement.
3
OVERVIEW
NextEra Energy, Inc. (hereafter, NEE), with approximately 44,900 MW of generating capacity, is one of the largest electric power companies in North America with electric generating facilities located in 27 states in the U.S. and 4 provinces in Canada, and employing approximately 13,800 people as of
December 31, 2014
. NEE provides retail and wholesale electric services to over 5 million customers and owns generation, transmission and distribution facilities to support its services. It also purchases electric power for resale to its customers and provides risk management services related to power and gas consumption related to its own generation assets and for a limited number of wholesale customers in selected markets. NEE is the largest generator in North America of renewable energy from the wind and sun. NEE owns and operates approximately 17% of the installed base of U.S. wind power production capacity and owns and/or operates approximately 11% of the installed base of U.S. utility-scale solar power production capacity as of
December 31, 2014
. NEE also owns and operates one of the largest fleets of nuclear power stations in the U.S., with eight reactors at five sites located in four states, representing approximately 6% of U.S. nuclear power electric generating capacity as of
December 31, 2014
. NEE's business strategy has emphasized the development, acquisition and operation of renewable, nuclear and natural gas-fired generation facilities in response to long-term federal policy trends supportive of zero and low air emissions sources of power. NEE's generation fleet has significantly lower rates of emissions of CO
2
, SO
2
and NOx than the average rates of the U.S. electric power industry with approximately 97% of its 2014 generation, measured by MWh produced, coming from renewable, nuclear and natural gas-fired facilities. Certain environmental attributes of the wholesale business' electric generating facilities, such as renewable energy credits (RECs), emissions reductions, offsets, allowances and the avoided emission of GHG pollutants, have been or likely will be sold or transferred to third parties, who are solely entitled to the reporting rights and ownership of the environmental attributes.
NEE was incorporated in 1984 under the laws of Florida and conducts its operations principally through two wholly-owned subsidiaries, Florida Power & Light Company (hereafter, FPL) and NextEra Energy Resources, LLC (hereafter, NEER). NextEra Energy Capital Holdings, Inc. (hereafter, NEECH), another wholly-owned subsidiary of NEE, owns and provides funding for NEER's and NEE's operating subsidiaries, other than FPL and its subsidiaries. NEE's two principal businesses also constitute NEE's reportable segments for financial reporting purposes. During 2014, NEE formed NEP to acquire, manage and own contracted clean energy projects with stable, long-term cash flows. See II. NEER for further discussion of NEP. NEE's and NEER's generating capacity discussed in this combined Form 10-K includes approximately 199 MW associated with noncontrolling interests related to NEP as of December 31, 2014. See Item 2. Properties.
FPL is a rate-regulated electric utility engaged primarily in the generation, transmission, distribution and sale of electric energy in Florida. FPL is the largest electric utility in the state of Florida and one of the largest electric utilities in the U.S. based on retail MWh sales. FPL is vertically integrated, with approximately 25,100 MW of generating capacity as of
December 31, 2014
. FPL's investments in its infrastructure since 2001, such as modernizing less-efficient fossil generating plants to produce more energy with less fuel and fewer air emissions, increasing generating capacity at its existing nuclear units and upgrading its transmission and distribution systems to deliver service reliability that is the best of the Florida investor-owned utilities, have provided significant benefits to FPL's customers, all while providing residential and commercial bills that were among the lowest in Florida and below the national average based on a rate per kWh as of July 2014 (the latest date for which this data is available). With approximately 95% of its power generation coming from natural gas, nuclear and solar, FPL is also one of the cleanest electric utilities in the nation. Based on 2014 information, FPL's emissions rates for CO
2
, SO
2
and NOx were 38%, 95% and 73% lower, respectively, than the average rates of the U.S. electric power industry.
4
NEER, with approximately 19,800 MW of generating capacity at
December 31, 2014
, is one of the largest wholesale generators of electric power in the U.S., with approximately 19,000 MW of generating capacity across 25 states, and with over 700 MW in 4 Canadian provinces. NEER produces the majority of its electricity from clean and renewable sources, including wind and solar. NEER also provides full energy and capacity requirements services, engages in power and gas marketing and trading activities, participates in natural gas, natural gas liquids and oil production and pipeline infrastructure development and owns a retail electricity provider.
NEECH's other business activities are primarily conducted through NEET and FPL FiberNet. NEET conducts its operations principally through two wholly-owned subsidiaries, Lone Star, a rate-regulated transmission service provider in Texas, and NHT, a rate-regulated transmission owner in New Hampshire. FPL FiberNet delivers wholesale and enterprise telecommunications services in Florida, Texas and certain areas of the South Central U.S. In addition, certain subsidiaries of NEECH are pursuing approvals to move forward with three natural gas pipeline projects.
NEE seeks to create value in its two principal businesses by meeting its customers' needs more economically and more reliably than its competitors, as described in more detail in the following sections. NEE's strategy has resulted in profitable growth over sustained periods at both FPL and NEER. Management seeks to grow each business in a manner consistent with the varying opportunities open to it; however, management believes that the diversification and balance represented by FPL and NEER is a valuable characteristic of the enterprise and recognizes that each business contributes to NEE's credit profile in different ways. FPL and NEER, as well as other NEE subsidiaries, share common support functions with the objective of lowering costs and creating efficiencies for their businesses. During 2013, NEE and its subsidiaries commenced an enterprise-wide initiative focused mainly on improving productivity and reducing O&M expenses (cost savings initiative), and management expects to continue those efforts over the near term.
In December 2014, NEE and Hawaiian Electric Industries, Inc. (HEI) announced a proposed merger pursuant to which Hawaiian Electric Company, Inc., HEI's wholly-owned electric utility subsidiary, will become a wholly-owned subsidiary of NEE. The companies are working to complete the merger by the end of 2015. However, completion of the merger and the actual closing date depend upon the satisfaction of a number of conditions, including approval by HEI's shareholders and the receipt of required regulatory approvals. See Note 1 - Proposed Merger for further discussion.
5
NEE'S OPERATING SUBSIDIARIES
I. FPL
FPL was incorporated under the laws of Florida in 1925 and is a wholly-owned subsidiary of NEE. FPL is a rate-regulated electric utility and is the largest electric utility in the state of Florida and one of the largest electric utilities in the U.S. based on retail MWh sales. FPL, with 25,092 MW of generating capacity at
December 31, 2014
, supplies electric service throughout most of the east and lower west coasts of Florida, serving more than 9 million people through approximately 4.7
million customer accounts. At
December 31, 2014
, FPL's service territory and plant locations are as follows (see Item 2. Properties - Generating Facilities):

FRANCHISE AGREEMENTS AND COMPETITION
FPL's service to its retail customers is provided primarily under franchise agreements negotiated with municipalities or counties. Alternatively, municipalities and counties may form their own utility companies to provide service to their residents. In a very few cases, an FPL franchise agreement provides the respective municipality the right to buy the electrical assets serving local residents at the end of the agreement. However, during the term of a franchise agreement, which is typically 30 years, the municipality or county agrees not to form its own utility, and FPL has the right to offer electric service to residents. FPL currently holds 177 franchise agreements with various municipalities and counties in Florida with varying expiration dates through 2044. One of these franchise agreements expires in 2015, three expire in 2016 and 173 expire during the period 2017 through 2044. These franchise agreements cover approximately 86% of FPL's retail customer base in Florida. Negotiations are ongoing to renew the franchise agreements that expire in 2015 and 2016. FPL considers its franchises to be adequate for the conduct of its business. FPL also provides service to 12 other municipalities and to
22 unincorporated areas within its service area without franchise agreements pursuant to the general obligation to serve as a public utility. FPL relies upon Florida law for access to public rights of way.
Because any customer may elect to provide his/her own electric services, FPL effectively must compete for an individual customer's business. As a practical matter, few customers provide their own service at the present time since FPL's cost of service is substantially lower than the cost of self-generation for the vast majority of customers. Changing technology, economic conditions and other factors could alter the favorable relative cost position that FPL currently enjoys; however, FPL seeks as a matter of strategy to ensure that it delivers superior value, in the form of high reliability, low bills and excellent customer service.
In addition to self-generation by residential, commercial and industrial customers, FPL also faces competition from other suppliers of electrical energy to wholesale customers and from alternative energy sources. In each of 2014, 2013 and 2012, operating revenues from wholesale and industrial customers combined represented approximately 5%, 3%
and 3%, respectively, of FPL's total operating revenues.
6
The FPSC promotes cost competitiveness in the building of new steam and solar generating capacity of 75 MW or greater by requiring investor-owned electric utilities, including FPL, to issue an RFP except when the FPSC determines that an exception from the RFP process is in the public interest. The RFP process allows independent power producers and others to bid to supply the new generating capacity. If a bidder has the most cost-effective alternative, meets other criteria such as financial viability and demonstrates adequate expertise and experience in building and/or operating generating capacity of the type proposed, the investor-owned electric utility would seek to negotiate a purchased power agreement with the selected bidder and request that the FPSC approve the terms of the purchased power agreement and, if appropriate, provide the required authorization for the construction of the bidder's generating capacity. In January 2015, FPL announced plans to issue an RFP during the first quarter of 2015 for a new natural gas-fired combined-cycle unit in Okeechobee County, Florida.
New nuclear power plants are exempt from the RFP requirement. See FPL Sources of Generation - Nuclear Operations below.
CUSTOMERS AND REVENUE
FPL's primary source of operating revenues is from its retail customer base; it also serves a limited number of wholesale customers within Florida. FPL revenues from wholesale sales increased in 2014 primarily due to an increase in contracted load served under existing and new wholesale contracts. Beginning in 2013, operating revenues include gains associated with an incentive mechanism allowed under the 2012 rate agreement (see FPL Regulation - FPL Rate Regulation - Base Rates - Rates Effective January 2013 - December 2016); such gains are included in other in the chart below. The percentage of FPL's operating revenues and customer accounts
by customer class were as follows:
|
|
|
For both retail and wholesale customers, the prices (or rates) that FPL may charge are approved by regulatory bodies, by the FPSC in the case of retail customers, and by the FERC in the case of wholesale customers. In general, under U.S. and Florida law, regulated rates are intended to cover the cost of providing service, including a reasonable rate of return on invested capital. Since the regulatory bodies have authority to determine the relevant cost of providing service and the appropriate rate of return on capital employed, there can be no guarantee that FPL will be able to earn any particular rate of return or recover all of its costs through regulated rates. See FPL Regulation below.
7
FPL seeks to maintain attractive rates for its customers. Since rates are largely cost-based, maintaining low rates requires a strategy focused on developing and maintaining a low cost position. The ideas generated from the cost savings initiative discussed above are expected to keep FPL's O&M expenses recovered through base rates flat through 2016 as compared to 2012. A common benchmark used in the electric power industry for comparing rates across companies is the price of 1,000 kWh of consumption per month for a residential customer. FPL's 2014 average bill for 1,000 kWh of monthly residential usage was the lowest among reporting electric utilities within Florida as indicated below:
POWER DELIVERY
FPL provides service to its customers through an integrated transmission and distribution system that links its generation facilities to its customers. FPL also maintains interconnection facilities with neighboring utilities and non-utility generators inside its service territory, enabling it to buy and sell wholesale electricity and to enhance the reliability of its own network and support the reliability of neighboring networks. FPL's transmission system carries high voltage electricity from its generating facilities to substations where the electricity is stepped down to lower voltage levels and is sent through the distribution system to its customers.
A key element of FPL's strategy is to provide highly reliable service to its customers. The transmission and distribution system is susceptible to interruptions or outages from a wide variety of sources including weather, animal and vegetation interference, traffic accidents, equipment failure and many others, and FPL seeks to reduce or eliminate outages where economically practical and to restore service rapidly when outages occur. A common industry benchmark for transmission and distribution system reliability is the system average interruption duration index (SAIDI), which represents the number of minutes the average customer is without power during a time period. For the five years 2009 - 2013, FPL's average annual SAIDI was the best of the investor-owned utilities in Florida. FPL is accelerating its existing storm hardening and reliability program, to continue strengthening its infrastructure against tropical storms and hurricanes. Also, as part of its commitment to building a smarter, more reliable and efficient electric infrastructure, FPL has installed 4.8 million smart meters and 11,500 intelligent devices throughout the electric grid.
FPL SYSTEM CAPABILITY AND LOAD
At
December 31, 2014
, FPL's resources for serving load consisted of 27,055 MW, of which 25,092 MW were from FPL-owned facilities (see Item 2. Properties - Generating Facilities) and 1,963 MW were available through purchased power agreements (see FPL Sources of Generation - Purchased Power below). FPL customer usage and operating revenues are typically higher during the summer months, largely due to the prevalent use of air conditioning in FPL's service territory. Occasionally, unusually cold temperatures during the winter months result in significant increases in electricity usage for short periods of time. The highest peak load FPL has served to date was 24,346 MW, which occurred on January 11, 2010. FPL had adequate resources available at the time of this peak to meet customer demand.
FPL's projected reserve margin for the summer of 2015 is approximately 27%. This reserve margin is expected to be achieved through the combination of available output from FPL's active generating units, purchased power agreements and the capability to reduce peak demand through the implementation of demand side management programs, including load management which was estimated at
December 31, 2014
to be capable of reducing demand by approximately 1,800 MW, and energy efficiency and conservation programs. See FPL Sources of Generation - Fossil Operations and - Nuclear Operations below regarding generation projects currently under construction.
8
FPL SOURCES OF GENERATION
FPL relies upon a mix of fuel sources for its generating facilities, along with purchased power, in order to maintain the flexibility to achieve a more economical fuel mix by responding to market and industry developments. See descriptions of fossil, nuclear and solar operations below and a listing of FPL's generating facilities in Item 2. Properties - Generating Facilities.
FPL's 2014 fuel mix based on MWh produced, including purchased power, was as follows:
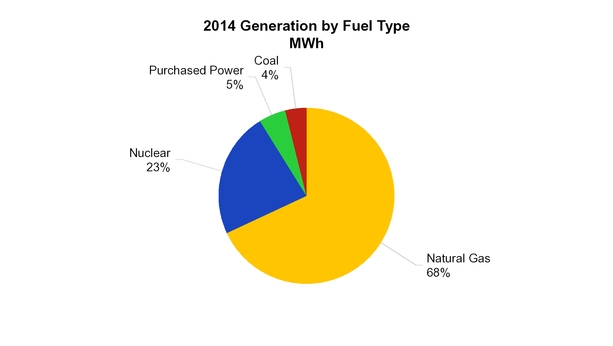
Oil and Solar are collectively less than 1%
Fossil Operations (Natural Gas, Coal and Oil)
At
December 31, 2014
, FPL owned and operated 70 units that used fossil fuels, primarily natural gas, and had a joint ownership interest in 3 coal units. Combined, the fossil fleet provided 21,604 MW of generating capacity for FPL. These fossil units are out of service from time to time for routine maintenance or on standby during periods of reduced electricity demand. A common industry benchmark for fossil unit reliability is the equivalent forced outage rate (EFOR), which represents a generating unit's inability to provide electricity when required to operate. For the five years 2009 - 2013, FPL's average annual EFOR was in the top decile among its electric utility fossil fleet peers in the U.S.
FPL's natural gas plants require natural gas transportation, supply and storage. FPL has firm transportation contracts in place for existing pipeline capacity with five
different transportation suppliers. These agreements provide for an aggregate maximum delivery quantity of 2,069,000
MMBtu/day with expiration dates ranging from 2015 to 2036
that together are
expected to satisfy substantially all of the currently anticipated needs for natural gas transportation through 2016. To the extent desirable, FPL also purchases interruptible natural gas transportation service from these natural gas transportation suppliers based on pipeline availability. FPL has several short- and medium-term natural gas supply contracts to provide a portion of FPL's anticipated needs for natural gas. The remainder of FPL's natural gas requirements is purchased in the spot market. FPL has an agreement for the storage of natural gas that expires in 2017. See Note 13 - Contracts.
In 2013, the FPSC approved FPL's 25-year natural gas transportation agreements with each of Sabal Trail and Florida Southeast Connection for a quantity of 400,000 MMBtu/day beginning on May 1, 2017 and increasing to 600,000 MMBtu/day on May 1, 2020. FPL's firm commitments under the agreements are contingent upon the occurrence of certain events, including FERC approval and completion of construction of the pipeline system to be built by Sabal Trail and Florida Southeast Connection. A FERC decision is expected in 2015. See Other NEE Operating Subsidiaries - Natural Gas Pipeline Systems - Florida Natural Gas Pipeline System below and Note 13 - Contracts. These new agreements, when combined with FPL's existing agreements, are expected to satisfy substantially all of FPL's natural gas transportation needs through at least 2020.
In December 2014, the FPSC approved FPL’s petition
to invest in long-term natural gas supplies in the Woodford Shale region in southeastern Oklahoma and for the recovery of costs associated with the investment through the fuel clause. A wholly-owned subsidiary of FPL will partner with a third party to develop up to 38 natural gas production wells in the Woodford Shale region and receive its ownership share of the natural gas produced from these wells. FPL’s projected investment in these natural gas production
9
wells as of December 31, 2014 is included in estimated capital expenditures set forth in Note 13 - Commitments. In 2015, the State of Florida Office of Public Counsel (OPC) and Florida Industrial Power Users Group each has filed notices of appeal to the Florida Supreme Court that relate to challenging the Woodford Shale natural gas reserves project, which appeals are pending. As part of FPL’s petition to invest in natural gas supplies in the Woodford Shale region, it also requested the FPSC approve a set of guidelines proposed by FPL under which FPL could participate in additional natural gas production projects and recover its costs through the fuel clause without prior FPSC approval. In 2015, the FPSC filed a motion with the Florida Supreme Court requesting that the Court issue an order confirming the FPSC has jurisdiction to consider and issue a decision on FPL’s proposed guidelines while the appeals regarding the Woodford Shale natural gas reserves project are pending. Also in 2015, the OPC filed a petition requesting the Florida Supreme Court prohibit the FPSC from ruling on the proposed guidelines while appeals concerning the Woodford Shale natural gas reserves project are pending.
St. Johns River Power Park (SJRPP) Units Nos.
1 and 2, coal-fired units in which FPL has a joint ownership interest, have firm coal supply and transportation contracts for a portion of their fuel and transportation needs through 2017. Scherer Unit No.
4, the other coal-fired unit in which FPL has a joint ownership interest, has firm coal supply and transportation contracts for a portion of its fuel needs and all of its transportation needs through 2016. Any of the remaining fuel requirements for these coal-fired units will be obtained in the spot market. See Note
13
- Contracts. With respect to its oil plants, FPL obtains its fuel requirements in the spot market.
Modernization Projects.
In April 2013 and in April 2014, FPL placed in service, at each of its Cape Canaveral and Riviera Beach power plants, a natural gas-fired combined-cycle modernized unit with generating capacity of 1,210 MW and 1,212 MW, respectively. FPL is in the process of modernizing its Port Everglades power plant to a high-efficiency natural gas-fired unit that is expected to provide approximately 1,240 MW of capacity and be placed in service by mid-2016.
Nuclear Operations
At
December 31, 2014
, FPL owned, or had undivided interests in, and operated the following four nuclear units with a total net generating capacity of 3,453 MW.
|
Facility
|
MW
|
Operating License
Expiration Dates
|
||
|
St. Lucie Unit No. 1
|
981
|
2036
|
||
|
St. Lucie Unit No. 2
|
840
|
2043
|
||
|
Turkey Point Unit No. 3
|
811
|
2032
|
||
|
Turkey Point Unit No. 4
|
821
|
2033
|
||
FPL has several contracts for the supply of uranium and the conversion, enrichment and fabrication of nuclear fuel with expiration dates ranging from late February 2015 through 2030. See Note 13 - Commitments. NRC regulations require FPL to submit a plan for decontamination and decommissioning five years before the projected end of plant operation. FPL's current plans, under the applicable operating licenses, provide for prompt dismantlement of Turkey Point Units Nos. 3 and 4 with decommissioning activities commencing in 2032 and 2033, respectively. Current plans provide for St. Lucie Unit No. 1 to be mothballed beginning in 2036 with decommissioning activities to be integrated with the prompt dismantlement of St. Lucie Unit No. 2 commencing in 2043.
Projects to Add Additional Capacity.
FPL's need petition for two additional nuclear units at its Turkey Point site was approved by the FPSC in 2008 and FPL is moving forward with activities necessary to obtain all permits, licenses and approvals necessary for construction and operation of the units. The two units are expected to add a total of approximately 2,200 MW of capacity. The timing of commercial operation will be subject to various regulatory approvals from the FPSC and other agencies which will be required throughout the licensing and development processes and the nuclear units are expected to be placed in-service in 2027 and 2028. The NRC has indicated that its consideration of the licenses for the two units will be complete by early 2017.
Nuclear Unit Scheduled Refueling Outages.
FPL's nuclear units are periodically removed from service to accommodate normal refueling and maintenance outages, including inspections, repairs and certain other modifications. Scheduled nuclear refueling outages typically require the unit to be removed from service for variable lengths of time. The following table summarizes each unit's next scheduled refueling outage:
|
Facility
|
Next Scheduled
Refueling Outage
|
|
|
St. Lucie Unit No. 1
|
March 2015
|
|
|
St. Lucie Unit No. 2
|
September 2015
|
|
|
Turkey Point Unit No. 3
|
October 2015
|
|
|
Turkey Point Unit No. 4
|
March 2016
|
|
10
Spent Nuclear Fuel.
FPL's nuclear facilities use both on-site storage pools and dry storage casks to store spent nuclear fuel generated by these facilities, which are expected to provide sufficient storage of spent nuclear fuel at these facilities through license expiration. In August 2014, the NRC issued its Continued Storage of Spent Nuclear Fuel Rule which supports the NRC's determination that licensees can safely store spent nuclear fuel at nuclear power plants indefinitely. Petitions have been filed with the NRC and the U.S. Court of Appeals for the District of Columbia Circuit (D.C. Circuit) challenging the rule and requesting that the NRC suspend final reactor licensing decisions in all open NRC licensing proceedings (including the licensing proceeding for two additional nuclear units at FPL's Turkey Point site) alleging that the rule is deficient. The petitions filed with the NRC have been fully briefed and a decision by the NRC is pending. The NRC requested that the D.C. Circuit defer briefing on the appellate case until the NRC decides the petitions pending before it.
Nuclear Waste Policy Act of 1982, as amended (Nuclear Waste Policy Act)
- Under the Nuclear Waste Policy Act, the DOE is responsible for the development of a repository for the disposal of spent nuclear fuel and high-level radioactive waste. As required by the Nuclear Waste Policy Act, FPL is a party to contracts with the DOE to provide for disposal of spent nuclear fuel from its nuclear units.
The DOE was required to construct permanent disposal facilities and take title to and provide transportation and disposal for spent nuclear fuel by January 31, 1998 for a specified fee based on current generation from nuclear power plants which fee was subsequently set to zero effective May 2014. The DOE did not meet its statutory obligation for disposal of spent nuclear fuel under the Nuclear Waste Policy Act. In 2009, FPL and certain of FPL's nuclear plant joint owners entered into a settlement agreement (spent fuel settlement agreement) with the U.S. government agreeing to dismiss with prejudice lawsuits filed against the U.S. government seeking damages caused by the DOE's failure to dispose of spent nuclear fuel from FPL's nuclear plants. The spent fuel settlement agreement permits FPL to make annual filings to recover certain spent fuel storage costs incurred by FPL which are reimbursable by the U.S. government on an annual basis.
Yucca Mountain
- In 2010, the DOE filed a motion with the NRC to withdraw its license application for a nuclear waste repository at Yucca Mountain, which request was denied. In 2011, the NRC issued an order suspending the Yucca Mountain licensing proceeding, which order was challenged, and in 2013, the D.C. Circuit issued an order requiring the NRC to proceed with the legally mandated licensing process for a nuclear waste repository at Yucca Mountain. As a result, the NRC has recently completed the technical review of the application and is planning to supplement the DOE's environmental impact statement. Certain requirements must be met before the NRC can issue a license for the repository.
Nuclear Regulatory Developments.
Based on the NRC's comprehensive review of processes and regulations relating to nuclear facilities in the U.S. following the 2011 earthquake and tsunami in Japan, the NRC established, among other things, actions to be completed at each nuclear site and issued various orders and requests for information with a prescribed timeline for implementation and completion by the end of 2016. The NRC continues to monitor industry implementation of the orders for, among others, enhanced venting capabilities for boiling water reactors for which implementation is expected to go beyond 2016 (FPL's nuclear units do not use boiling water reactors; see NEER - Generation and Other Operations - Nuclear Facilities - Nuclear Regulatory Developments). FPL is currently working with the NRC on the approval and implementation of actions required to meet new NRC requirements. A portion of the costs for these actions is being recovered through base rates based on estimated costs for 2013, with any incremental costs being recovered through the capacity clause, all of which are included in estimated capital expenditures. See FPL Regulation - FPL Rate Regulation - Cost Recovery Clauses below and Note 13 - Commitments.
The lessons learned from the events in Japan and the results of the NRC's actions have and will continue to, among other things, result in new licensing and safety-related requirements for U.S. nuclear facilities. Any new requirements could, among other things, impact future licensing and operations of U.S. nuclear facilities, including FPL's existing nuclear facilities and NRC approval of two additional nuclear units at FPL's Turkey Point site, and could, among other things, result in increased cost and capital expenditures associated with the operation and maintenance of FPL's nuclear units.
Solar Operations
Solar generation can be provided primarily through two conventions: utility-owned and customer-owned or leased. In utility-owned solar generation, the energy generated goes directly to the transmission grid, whereas customer-owned or leased solar generation generally goes directly to the location it is serving with any excess over that local need being fed back to the transmission grid. There are two principal solar technologies used for utility-scale projects: PV and thermal. At
December 31, 2014
, FPL owned and operated two solar PV generating facilities, which provided a total of 35 MW of generation capacity, and a 75 MW solar thermal hybrid facility. FPL supports the advancement of solar generation primarily for its fuel diversity and emissions reduction benefits, and plans to continue to support, study and pursue solar generation that is beneficial for FPL's customers. FPL plans to build three solar PV projects that are expected to provide approximately 74 MW each and be placed into service by the end of 2016.
Purchased Power
In addition to owning generation facilities, FPL also purchases power and capacity from non-utility generators and other utilities to meet customer demand through long-term purchased power agreements. As of
December 31, 2014
, FPL's long-term purchased power agreements provided for the purchase of approximately 1,963 MW of power with expiration dates ranging from December
11
2015 through 2032.
See Note 13 - Contracts. On occasion, FPL may procure short-term power and capacity for both economic and reliability purposes.
FPL ENERGY MARKETING AND TRADING
FPL's Energy Marketing & Trading division (EMT) buys and sells wholesale energy commodities, such as natural gas, oil and electricity. EMT procures natural gas and oil for FPL's use in power generation and sells excess natural gas, oil and electricity. EMT also uses derivative instruments (primarily swaps, options and forwards) to manage the commodity price risk inherent in the purchase and sale of fuel and electricity. Substantially all of the results of EMT's activities are passed through to customers in the fuel or capacity clauses. See FPL Regulation - FPL Rate Regulation below, Management's Discussion - Energy Marketing and Trading and Market Risk Sensitivity and Note 3.
FPL REGULATION
FPL's operations are subject to regulation by a number of federal, state and other organizations, including, but not limited to, the following:
|
•
|
the FPSC, which has jurisdiction over retail rates, service territory, issuances of securities, planning, siting and construction of facilities, among other things;
|
|
•
|
the FERC, which oversees the acquisition and disposition of generation, transmission and other facilities, transmission of electricity and natural gas in interstate commerce, proposals to build interstate natural gas pipelines and storage facilities, and wholesale purchases and sales of electric energy, among other things;
|
|
•
|
the NERC, which, through its regional entities, establishes and enforces mandatory reliability standards, subject to approval by the FERC, to ensure the reliability of the U.S. electric transmission and generation system and to prevent major system blackouts;
|
|
•
|
the NRC, which has jurisdiction over the operation of nuclear power plants through the issuance of operating licenses, rules, regulations and orders; and
|
|
•
|
the EPA, which has the responsibility to maintain and enforce national standards under a variety of environmental laws. The EPA also works with industries and all levels of government, including federal and state governments, in a wide variety of voluntary pollution prevention programs and energy conservation efforts.
|
FPL Rate Regulation
The FPSC sets rates at a level that is intended to allow FPL the opportunity to collect from retail customers total revenues (revenue requirements) equal to FPL's cost of providing service, including a reasonable rate of return on invested capital. To accomplish this, the FPSC uses various ratemaking mechanisms, including, among other things, base rates and cost recovery clauses.
Base Rates
.
In general, the basic costs of providing electric service, other than fuel and certain other costs, are recovered through base rates, which are designed to recover the costs of constructing, operating and maintaining the utility system. These basic costs include O&M expenses, depreciation and taxes, as well as a return on FPL's investment in assets used and useful in providing electric service (rate base). At the time base rates are determined, the allowed rate of return on rate base approximates the FPSC's determination of FPL's estimated weighted-average cost of capital, which includes its costs for outstanding debt and an allowed ROE. The FPSC monitors FPL's actual regulatory ROE through a surveillance report that is filed monthly by FPL with the FPSC. The FPSC does not provide assurance that any regulatory ROE will be achieved. Base rates are determined in rate proceedings or through negotiated settlements of those proceedings. Proceedings can occur at the initiative of FPL or upon action by the FPSC. Base rates remain in effect until new base rates are approved by the FPSC.
Rates Effective January 2013 - December 2016
- In January 2013, the FPSC issued a final order approving a stipulation and settlement between FPL and several intervenors in FPL's base rate proceeding (2012 rate agreement). Key elements of the 2012 rate agreement, which is effective from January 2013 through December 2016, include, among other things, the following:
|
•
|
New retail base rates and charges were established in January 2013 resulting in an increase in retail base revenues of $350 million on an annualized basis.
|
|
•
|
FPL's allowed regulatory ROE is 10.50%, with a range of plus or minus 100 basis points. If FPL's earned regulatory ROE falls below 9.50%, FPL may seek retail base rate relief. If the earned regulatory ROE rises above 11.50%, any party to the 2012 rate agreement other than FPL may seek a review of FPL's retail base rates.
|
|
•
|
Retail base rates will be increased by the annualized base revenue requirements for FPL's three modernization projects (Cape Canaveral, Riviera Beach and Port Everglades) as each of the modernized power plants becomes operational. (Cape Canaveral and Riviera Beach became operational in April 2013 and April 2014, respectively, and Port Everglades is expected to be operational by mid-2016.)
|
|
•
|
Cost recovery of WCEC Unit No. 3, which was placed in service in May 2011, will continue to occur through the capacity clause; however, such recovery will not be limited to the projected annual fuel cost savings as was the case in the previous rate agreement discussed below.
|
12
|
•
|
Subject to certain conditions, FPL may amortize, over the term of the 2012 rate agreement, a depreciation reserve surplus remaining at the end of 2012 under the 2010 rate agreement discussed below (approximately $224 million) and may amortize a portion of FPL's fossil dismantlement reserve up to a maximum of $176 million (collectively, the reserve), provided that in any year of the 2012 rate agreement, FPL must amortize at least enough reserve to maintain a 9.50% earned regulatory ROE but may not amortize any reserve that would result in an earned regulatory ROE in excess of 11.50%.
|
|
•
|
Future storm restoration costs would be recoverable on an interim basis beginning 60 days from the filing of a cost recovery petition, but capped at an amount that could produce a surcharge of no more than $4 for every 1,000 kWh of usage on residential bills during the first 12 months of cost recovery. Any additional costs would be eligible for recovery in subsequent years. If storm restoration costs exceed $800 million in any given calendar year, FPL may request an increase to the $4 surcharge to recover the amount above $800 million.
|
|
•
|
An incentive mechanism whereby customers will receive 100% of certain gains, including, but not limited to, gains from the purchase and sale of electricity and natural gas (including transportation and storage), up to a specified threshold; gains exceeding that specified threshold will be shared by FPL and its customers.
|
Rates Effective March 2010 - December 2012
- Effective March 1, 2010, pursuant to an FPSC final order (2010 FPSC rate order), new retail base rates for FPL were established, resulting in an increase in retail base revenues of approximately $75 million on an annualized basis. The 2010 FPSC rate order, among other things, also established a regulatory ROE of 10.0% with a range of plus or minus 100 basis points. In February 2011, the FPSC issued a final order approving a stipulation and settlement agreement between FPL and principal parties in FPL's 2009 rate case (2010 rate agreement). The 2010 rate agreement, which was effective through December 31, 2012, provided for, among other things, a reduction in depreciation expense (surplus depreciation credit) in any calendar year up to a cap in 2010 of $267 million, a cap in subsequent years of $267 million plus the amount of any unused portion from prior years, and a total cap of $776 million over the course of the 2010 rate agreement, provided that in any year of the 2010 rate agreement FPL was required to use enough surplus depreciation credit to maintain an earned regulatory ROE within the range of 9.0% - 11.0%. The 2010 rate agreement also permitted incremental cost recovery through FPL's capacity clause for WCEC Unit No. 3 up to the amount of the projected annual fuel savings for customers. See Cost Recovery Clauses below for additional information regarding the capacity clause.
Cost Recovery Clauses
.
Cost recovery clauses, which are designed to permit full recovery of certain costs and provide a return on certain assets allowed to be recovered through the various clauses, include substantially all fuel, purchased power and interchange costs, certain construction-related costs and conservation and certain environmental-related costs. Cost recovery clause costs are recovered through levelized monthly charges per kWh or kW, depending on the customer's rate class. These cost recovery clause charges are calculated at least annually based on estimated costs and estimated customer usage for the following year, plus or minus true-up adjustments to reflect the estimated over or under recovery of costs for the current and prior periods. An adjustment to the levelized charges may be approved during the course of a year to reflect revised estimates.
Fuel costs and energy charges under the purchased power agreements are recovered from customers through the fuel clause, the most significant of the cost recovery clauses in terms of operating revenues. FPL uses a risk management fuel procurement program which has been approved by the FPSC. The FPSC reviews the program activities and results for prudence annually as part of its review of fuel costs. The program is intended to manage fuel price volatility by locking in fuel prices for a portion of FPL's fuel requirements. See FPL Energy Marketing and Trading above, Note 1 - Regulation and Note 3. Costs associated with FPL’s investment in long-term natural gas supplies in the Woodford Shale region that have been approved by the FPSC will also be recovered through the fuel clause. See FPL Sources of Generation - Fossil Operations above.
Capacity payments to non-utility generators and other utilities are recovered from customers through the capacity clause. In accordance with the FPSC's nuclear cost recovery rule, FPL also recovers pre-construction costs and carrying charges (equal to a pretax AFUDC rate) on construction costs for new nuclear capacity through the capacity clause. As property related to the new nuclear capacity goes into service, construction costs and a return on investment are recovered through base rate increases effective beginning the following January. See FPL Sources of Generation - Nuclear Operations above. In January 2014, FPL began recovering, through the capacity clause, the incremental costs incurred to comply with new NRC requirements established following the 2011 earthquake and tsunami in Japan. See FPL Sources of Generation - Nuclear Operations - Nuclear Regulatory Developments above. In accordance with the 2012 and 2010 rate agreements, cost recovery for WCEC Unit No. 3 is permitted during the term of the agreements through FPL's capacity clause and is reported as retail base revenues.
Costs associated with implementing energy conservation programs are recovered from customers through the energy conservation cost recovery clause. Certain costs of complying with federal, state and local environmental regulations enacted after April 1993 and costs associated with FPL's three solar facilities are recovered through the environmental cost recovery clause (environmental clause).
The FPSC has the authority to disallow recovery of costs that it considers excessive or imprudently incurred. These costs may include, among others, fuel and O&M expenses, the cost of replacing power lost when fossil and nuclear units are unavailable, storm restoration costs and costs associated with the construction or acquisition of new facilities.
FERC
The Federal Power Act gives the FERC exclusive ratemaking jurisdiction over wholesale sales of electricity and the transmission
13
of electricity and natural gas in interstate commerce. Pursuant to the Federal Power Act, electric utilities must maintain tariffs and rate schedules on file with the FERC which govern the rates, terms and conditions for the provision of FERC-jurisdictional wholesale power and transmission services. The Federal Power Act also gives the FERC authority to certify and oversee a national electric reliability organization with authority to establish and independently enforce mandatory reliability standards applicable to all users, owners and operators of the bulk-power system. See NERC below. Electric utilities are subject to accounting, record-keeping and reporting requirements administered by the FERC. The FERC also places certain limitations on transactions between electric utilities and their affiliates.
NERC
The NERC has been certified by the FERC as the national electric reliability organization. The NERC's mandate is to ensure the reliability and security of the North American bulk-power system through the establishment and enforcement of reliability standards approved by FERC. The NERC's regional entities also enforce reliability standards approved by the FERC. FPL is subject to these reliability standards and incurs costs to ensure compliance with continually heightened requirements, and can incur significant penalties for failing to comply with them.
FPL Environmental Regulation
FPL is subject to environmental laws and regulations and is affected by some of the emerging issues described in the NEE Environmental Matters section below. FPL expects to seek recovery through the environmental clause for compliance costs associated with any new environmental laws and regulations.
FPL EMPLOYEES
FPL had approximately 8,700 employees at
December 31, 2014
. Approximately 33% of the employees are represented by the International Brotherhood of Electrical Workers (IBEW) under a collective bargaining agreement with FPL that expires October 31, 2017.
II. NEER
NEER was formed in 1998 to aggregate NEE's competitive energy businesses. It is a limited liability company organized under the laws of Delaware and is a wholly-owned subsidiary of NEECH. Through its subsidiaries, NEER currently owns, develops, constructs, manages and operates electric generating facilities in wholesale energy markets primarily in the U.S., as well as in Canada and Spain. See Note 14. NEER is one of the largest wholesale generators of electric power in the U.S., with approximately 19,777 MW of generating capacity across 25 states, 4 Canadian provinces and 1 Spanish province as of
December 31, 2014
. NEER produces the majority of its electricity from clean and renewable sources as described more fully below. NEER is the largest owner of wind and utility-scale solar energy projects in North America.
NEER engages in energy-related commodity marketing and trading activities, including entering into financial and physical contracts, to hedge the production from its generating assets that is not sold under long-term power supply agreements. These activities primarily include power and gas commodities and their related products, as well as providing full energy and capacity requirements services primarily to distribution utilities in certain markets and offering customized power and gas and related risk management services to wholesale customers. NEER also participates in natural gas, natural gas liquids and oil production through non-operating ownership interests and in pipeline infrastructure development, hereafter referred to as the gas infrastructure business, and owns a retail electricity provider. NEER also hedges the expected output from its gas infrastructure production assets to protect against price movements.
As discussed in the Overview above, during 2014, NEP was formed to acquire, manage and own contracted clean energy projects with stable, long-term cash flows through a limited partnership interest in NextEra Energy Operating Partners, LP (NEP OpCo). On July 1, 2014, NEP closed its IPO by issuing 18,687,500 common units representing limited partnership interests. Through an indirect wholly-owned subsidiary, NEE retained 74,440,000 units of NEP OpCo representing a 79.9% interest in NEP's operating projects. Additionally, NEE owns a controlling general partnership interest in NEP and consolidates NEP for financial reporting purposes. See Note 1 - NextEra Energy Partners, LP. Upon completion of the IPO, NEP, through NEER's contribution of energy projects to NEP OpCo, owned a portfolio of ten wind and solar projects with generation capacity totaling approximately 990 MW. In addition, NEER has given NEP OpCo the right of first offer for certain of its assets (ROFO assets) if NEER should seek to sell the assets. These assets include contracted wind and solar projects, some of which are still under construction, with a combined capacity of 1,549 MW. In October 2014, NEP entered into agreements to expand its portfolio through two project acquisitions from NEER. The first acquisition, which closed in January 2015, is a 250 MW wind project that was not included in the ROFO assets. The second acquisition is a 20 MW solar project included in the ROFO assets, which is currently under construction and is expected to close in the first quarter of 2015.
14
MARKETS AND COMPETITION
Electricity markets in the U.S. and Canada are regional and diverse in character. All are extensively regulated, and competition in these markets is shaped and constrained by regulation. The nature of the products offered varies based on the specifics of regulation in each region. Generally, in addition to the natural constraints on pricing freedom presented by competition, NEER may also face specific constraints in the form of price caps, or maximum allowed prices, for certain products. NEER's ability to sell the output of its generation facilities may also be constrained by available transmission capacity, which can vary from time to time and can have a significant impact on pricing.
The degree and nature of competition that NEER faces is different in wholesale markets and in retail markets. Approximately 90% of NEER's revenue is derived from wholesale markets.
Wholesale power generation is a capital-intensive, commodity-driven business with numerous industry participants. NEER primarily competes on the basis of price, but believes the green attributes of NEER's generating assets, its creditworthiness and its ability to offer and manage reliable customized risk solutions to wholesale customers are competitive advantages. Wholesale power generation is a regional business that is highly fragmented relative to many other commodity industries and diverse in terms of industry structure. As such, there is a wide variation in terms of the capabilities, resources, nature and identity of the companies NEER competes with depending on the market. In wholesale markets, customers' needs are met through a variety of means, including long-term bilateral contracts, standardized bilateral products such as full requirements service and customized supply and risk management services.
In general, U.S. electricity markets encompass three classes of services: energy, capacity and ancillary services. Energy services relate to the physical delivery of power; capacity services relate to the availability of MW capacity of a power generation asset; and ancillary services are other services related to power generation assets, such as load regulation and spinning and non-spinning reserves. The exact nature of these classes of services is defined in part by regional tariffs. Not all regions have a capacity services class, and the specific definitions of ancillary services vary from region to region.
RTOs and ISOs exist in a number of regions within which NEER operates to coordinate generation and transmission across wide geographic areas and to run markets. NEER also has operations that fall within the Western Electricity Coordinating Council reliability region that are not under the jurisdiction of an established RTO or ISO. Although each RTO and ISO may have differing objectives and structures, some benefits of these entities include regional planning, managing transmission congestion, developing larger wholesale markets for energy and capacity, maintaining reliability and facilitating competition among wholesale electricity providers. NEER has operations that fall within the following RTOs and ISOs:
|
•
|
Alberta Electric System Operator
|
|
•
|
California Independent System Operator
|
|
•
|
ERCOT
|
|
•
|
Independent Electricity System Operator (in Ontario)
|
|
•
|
ISO New England (ISO-NE)
|
|
•
|
Midcontinent Independent System Operator, Inc.
|
|
•
|
New York Independent System Operator
|
|
•
|
PJM
|
|
•
|
Southwest Power Pool
|
NEER competes in different regions to different degrees, but in general it seeks to enter into long-term bilateral contracts for the full output of its generating facilities, and, as of
December 31, 2014
, approximately 65% of NEER's generating capacity is fully committed under long-term contracts. Where long-term contracts are not in effect, NEER sells the output of its facilities into daily spot markets. In such cases, NEER will frequently enter into shorter term bilateral contracts, typically of less than three years duration, to hedge the price risk associated with selling into a daily spot market. Such bilateral contracts, which may be hedges either for physical delivery or for financial (pricing) offset, may only protect a portion of the revenue that NEER expects to derive from the associated generation facility and may not qualify for hedge accounting under GAAP. Contracts that serve the economic purpose of hedging some portion of the expected revenue of a generation facility but are not recorded as hedges under GAAP are referred to as “non-qualifying hedges” for adjusted earnings purposes. See Management's Discussion - Overview - Adjusted Earnings.
Certain facilities within the NEER wind and solar generation portfolio produce RECs and other environmental attributes which are typically sold along with the energy from the plants under long-term contracts. For the wind and solar generation not sold under long-term contracts, the RECs and other environmental attributes may be sold separately.
While the majority of NEER's revenue is derived from the output of its generating facilities, NEER is also an active competitor in several regions in the wholesale full requirements business and in providing structured and customized power and fuel products and services to a variety of customers. In the full requirements service, typically, the supplier agrees to meet the customer's needs for a full range of products for every hour of the day, at a fixed price, for a predetermined period of time, thereby assuming the risk of fluctuations in the customer's volume requirements.
15
The deregulated retail energy business is typically a highly competitive business. In general, competition in the retail energy business is on the basis of price, service, brand image, product offerings and market perceptions of creditworthiness. Electricity is sold pursuant to a variety of product types, including fixed, indexed and renewable products, and customers elect terms of service typically ranging from one month to five years. Retail energy rates are market-based, and not subject to traditional cost-of-service regulation by public utility commissions. Transmission and distribution service companies provide, on a non-discriminatory basis, the wires and metering services necessary to deliver service to customers. Subsidiaries of NEER compete in certain states for retail customers, which can be divided into two principal segments: residential and commercial and industrial (C&I). Residential customers largely require only energy services, which may be purchased on a month-to-month basis or under a multi-year contract. Small commercial customers behave and contract similarly to residential customers for an energy-only product. Large C&I customers share many of the same characteristics as wholesale utility customers and may require similarly customized and structured products.
In general, competitive retail electric providers are exposed to both volume and price risk: customers' volumes will vary, and competitive retail providers are committed to supplying the customer's full needs at all times and are therefore responsible for purchases in wholesale markets to meet those needs. Wholesale prices will fluctuate in ways that do not necessarily match the retail prices committed to the customer.
Expanded competition in a frequently changing regulatory environment presents both opportunities and risks for NEER. Opportunities exist for the selective acquisition of generation assets and for the construction and operation of efficient facilities that can sell power in competitive markets. NEER seeks to reduce its market risk by having a diversified portfolio by fuel type and location, as well as by contracting for the future sale of a significant amount of the electricity output of its facilities.
GENERATION AND OTHER OPERATIONS
NEER sells products associated with its own generating facilities (energy, capacity, RECs and ancillary services) in competitive markets in regions where those facilities are located. Customer transactions may be supplied from NEER generating facilities or from purchases in the wholesale markets, or from a combination thereof.
At
December 31, 2014
, the locations of NEER's generation facilities in North America are as follows:
At
December 31, 2014
, NEER managed or participated in the management of essentially all of its generation projects in which it has an ownership interest.
16
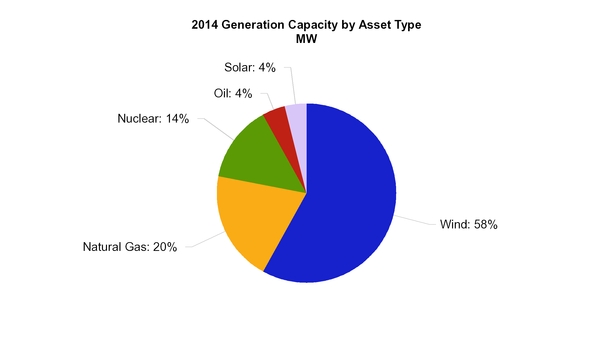
NEER categorizes its portfolio in a number of different ways for different business purposes. See a listing of NEER's generating facilities in Item 2. Properties - Generating Facilities. The following presentation details NEER operations and fuel/technology mix, which NEE commonly uses in communicating its business:
Contracted, Merchant and Other Operations
NEER's portfolio of operations based on the presence/absence of long-term contracts and other operations is described below.
Contracted Assets.
Contracted assets are projects with long-term power sales agreements for substantially all of their output and certain wind assets where long-term power contracts are expected to be executed. At
December 31, 2014
, NEER had 13,045 MW of contracted assets, substantially all of which have long-term power contracts. Essentially all of the output of these contracted assets were under power sales agreements, with a weighted-average remaining contract life of approximately 15 years, and some have firm fuel and transportation agreements with expiration dates ranging from April 2015 through 2022. See Note 13 - Contracts. Approximately 9,583 MW of this capacity is wind generation and 1,621 MW of this capacity is nuclear generation. The remaining 1,841 MW use a variety of fuels and technologies such as natural gas, oil and solar.
Merchant Assets.
Merchant assets are projects that do not have long-term power sales agreements to sell their output, or, in the case of certain wind assets, are not expected to have long-term power contracts, and therefore require active marketing and hedging. At
December 31, 2014
, NEER's portfolio of merchant assets consists of 6,732 MW of owned wind, nuclear, natural gas, oil and solar generating facilities, including 846 MW of peak generating facilities. Approximately 60% (based on net MW capability) of the natural gas-fueled merchant assets have natural gas transportation agreements to provide for fluctuating natural gas requirements. See Note 13 - Contracts. Derivative instruments (primarily swaps, options, futures and forwards) are generally used to lock in pricing and manage the commodity price risk inherent in power sales and fuel purchases. Managing market risk through these instruments introduces other types of risk, primarily counterparty, credit and operational risks.
Other Operations.
NEER's operations also include the gas infrastructure business and the customer supply and proprietary power and gas trading businesses. At
December 31, 2014
, the gas infrastructure business had non-operating ownership interests in investments located in oil and gas shale formations primarily in the Midwest and South regions of the U.S. NEER continues to pursue in a selective way opportunities in the upstream (exploration and production) area when it believes the return potential is attractive and to gain insight into the natural gas industry. Additionally, NEER has identified a small portfolio of projects that may provide additional opportunities to enter into the midstream area, primarily through the transportation of natural gas. See Other NEE Operating Subsidiaries - Natural Gas Pipeline Systems for a discussion of recent natural gas pipeline activity. See NEER Customer Supply and Proprietary Power and Gas Trading for a description of the customer supply and propriety power and gas trading businesses.
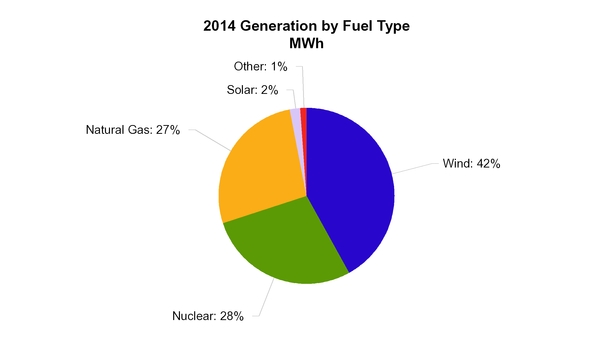
NEER Fuel/Technology Mix
NEER's generating output is produced using a variety of fuel sources as further described below.
17
NEER's power generation in terms of MWh produced for the year ended
December 31, 2014
by fuel type is as follows:
Wind Facilities
At
December 31, 2014
, NEER had ownership interests in wind generating facilities with a total generating capacity of 11,427 MW. NEER operates all of these wind facilities, which are located in 19 states in the U.S. and 4 provinces in Canada. During 2014, NEER added approximately 1,024 MW of new U.S. wind generation and 340 MW of new Canadian wind generation and sold or dismantled wind facilities with generation capacity totaling 147 MW. NEER is currently planning to add new contracted wind generation in 2015 and 2016 totaling approximately 175 MW in Canada and 980 MW in the U.S. See Policy Incentives for Renewable Energy Projects below for additional discussion of NEER's expectations regarding wind development and construction.
Natural Gas Facilities
At
December 31, 2014
, NEER had ownership interests in and operated natural gas facilities with net generating capacity (including only NEER's net ownership interest in facility capacity) of 3,991 MW. Approximately 1,004 MW of this net generating capacity is from contracted natural gas assets located throughout the Northeastern U.S.
Nuclear Facilities
At
December 31, 2014
, NEER owned, or had undivided interests in, and operated the following four nuclear units with a total net generating capacity of 2,721 MW.
|
Facility
|
Location
|
MW
|
Portfolio
Category
|
Operating License
Expiration Dates
|
||||||
|
Seabrook
|
New Hampshire
|
1,100
|
|
Merchant
|
2030
|
(a)
|
||||
|
Duane Arnold
|
Iowa
|
431
|
|
Contracted
(b)
|
2034
|
|||||
|
Point Beach Unit No. 1
|
Wisconsin
|
595
|
|
Contracted
(c)
|
2030
|
|||||
|
Point Beach Unit No. 2
|
Wisconsin
|
595
|
|
Contracted
(c)
|
2033
|
|||||
______________________
|
(a)
|
In 2010, NEER filed an application with the NRC to renew Seabrook's operating license for an additional 20 years, which license renewal is dependent on NRC regulatory approvals.
|
|
(b)
|
NEER sells all of its share of the output of Duane Arnold under a long-term contract expiring in February 2025.
|
|
(c)
|
NEER sells all of the output of Point Beach Units Nos. 1 and 2 under long-term contracts through their current operating license expiration dates.
|
NEER's nuclear facilities have several contracts for the supply of uranium and the conversion, enrichment and fabrication of nuclear fuel with expiration dates ranging from late February 2015 through 2024. See Note 13 - Contracts. NEER is responsible for all nuclear unit operations and the ultimate decommissioning of the nuclear units, the cost of which is shared on a pro-rata basis by
18
the joint owners for the jointly-owned units. NRC regulations require plant owners to submit a plan for decontamination and decommissioning five years before the projected end of plant operation.
Nuclear Unit Scheduled Refueling Outages.
NEER's nuclear units are periodically removed from service to accommodate normal refueling and maintenance outages, including inspections, repairs and certain other modifications. Scheduled nuclear refueling outages typically require the unit to be removed from service for variable lengths of time. The following table summarizes each unit's next scheduled refueling outage:
|
Facility
|
Next Scheduled
Refueling Outage
|
|
|
Seabrook
|
October 2015
|
|
|
Duane Arnold
|
October 2016
|
|
|
Point Beach Unit No. 1
|
March 2016
|
|
|
Point Beach Unit No. 2
|
October 2015
|
|
Spent Nuclear Fuel.
NEER's nuclear facilities use both on-site storage pools and dry storage casks to store spent nuclear fuel generated by these facilities, which are expected to provide sufficient storage of spent nuclear fuel at these facilities through license expiration.
As owners and operators of nuclear facilities, certain subsidiaries of NEER are subject to the Nuclear Waste Policy Act and are parties to the spent fuel settlement agreement described in FPL - FPL Sources of Generation - Nuclear Operations.
Nuclear Regulatory Developments.
For discussion of developments regarding the impact of the 2011 earthquake and tsunami in Japan as it relates to U.S. nuclear facilities, see FPL - FPL Sources of Generation - Nuclear Operations - Nuclear Regulatory Developments. NEER's nuclear facilities are subject to the same NRC requirements as described for FPL. Duane Arnold is NEER's only boiling water reactor unit. NEER is currently working with the NRC on the approval and implementation of actions required to meet new NRC requirements, the costs of which are included in estimated capital expenditures. See Note 13 - Commitments.
Solar Facilities
At
December 31, 2014
, NEER had ownership interests in solar facilities with a total net generating capacity of approximately 742 MW which are located in 4 states in the U.S. and 1 province in Canada. During 2014, NEER completed the construction of a 20 MW solar PV project in Nevada, a 250 MW solar thermal project in California and a 550 MW solar PV project in California, in which NEER has a 50% equity investment. NEER is currently planning to add new contracted solar generation in 2015 and 2016 totaling approximately 960 MW. In addition, NEER and its affiliates own solar thermal facilities with generating capacity of 99.8 MW in Spain (Spain solar projects). See Note 13 - Spain Solar Projects for developments that impact the Spain solar projects.
Other Assets
At
December 31, 2014
, NEER had 796 MW of oil-fired generating facilities located in Maine.
Policy Incentives for Renewable Energy Projects
U.S. federal, state and local governments have established various incentives to support the development of renewable energy projects. These incentives include accelerated tax depreciation, PTCs, ITCs, cash grants, tax abatements and RPS programs. Wind and solar projects qualify for the U.S. federal Modified Accelerated Cost Recovery System depreciation schedule. This schedule allows a taxpayer to recognize the depreciation of tangible property on a five-year basis even though the useful life of such property is generally greater than five years. The PTC currently provides an income tax credit for the production of electricity from utility-scale wind turbines for the first ten years of commercial operation. This incentive was created under the Energy Policy Act of 1992 and, under the Tax Increase Prevention Act of 2014, was extended for wind projects whose construction began before January 1, 2015. The Internal Revenue Service (IRS) previously issued guidance related to which projects will qualify for the PTC including, among other things, criteria for the beginning of construction of a project and the continuous program of construction or the continuous efforts to advance the project to completion. Pursuant to the IRS guidance, NEER expects its projects currently in development or under construction in the U.S. will qualify for the PTC. Alternatively, wind project developers can choose to receive a 30% ITC, in lieu of the PTC, with the same requirement that construction of the wind project began before January 1, 2015. The IRS has not updated its guidance for the change in law extending the requirement for a wind project to be under construction from 2013 to 2014.
Solar project developers are also eligible to receive a 30% ITC for new solar projects that achieve commercial operation before 2017. Solar project developers can elect to receive an equivalent cash payment from the U.S. Department of Treasury for the value of the 30% ITC (convertible ITC) for qualifying solar projects where construction began before the end of 2011 and the projects are placed in service before 2017. Solar projects that achieve commercial operations after December 31, 2016 may qualify for an ITC of 10% of eligible installed costs.
19
Other countries, including Canada and Spain, provide for incentives like feed-in-tariffs for renewable energy projects. The feed-in-tariffs promote renewable energy investments by offering long-term contracts to renewable energy producers, typically based on the cost of generation of each technology. See Note 13 - Spain Solar Projects for developments in Spain.
NEER CUSTOMER SUPPLY AND PROPRIETARY POWER AND GAS TRADING
NEER's customer supply and proprietary power and gas trading businesses engage in energy-related commodity marketing and trading activities, provide commodities-related products to customers and include the operations of a retail electricity provider. PMI, a subsidiary of NEER, buys and sells wholesale energy commodities, such as electricity, natural gas and oil. PMI sells the output from NEER's plants that is not sold under long-term contracts and procures the fossil fuel for use by NEER's generation fleet. One of its primary roles is to manage the commodity risk of NEER's portfolio. PMI uses derivative instruments such as swaps, options, futures and forwards to manage the risk associated with fluctuating commodity prices and to optimize the value of NEER's power generation and gas infrastructure assets. PMI also markets and trades energy-related commodity products and provides a wide range of electricity and gas commodity products as well as marketing and trading services to customers. PMI's customer supply business provides full energy and capacity requirements to customers.
The results of the customer supply and proprietary power and gas trading activities are included in NEER's operating results. See Management's Discussion - Energy Marketing and Trading and Market Risk Sensitivity, Note 1 - Energy Trading and Note 3.
NEER REGULATION
The energy markets in which NEER operates are subject to domestic and foreign regulation, as the case may be, including local, state and federal regulation, and other specific rules.
At
December 31, 2014
, NEER had ownership interests in operating independent power projects located in the U.S. that have received exempt wholesale generator status as defined under the Public Utility Holding Company Act of 2005, which represent approximately 97% of NEER's net generating capacity in the U.S. Exempt wholesale generators own or operate a facility exclusively to sell electricity to wholesale customers. They are barred from selling electricity directly to retail customers. NEER's exempt wholesale generators produce electricity from wind, fossil fuels, solar and nuclear facilities. Essentially all of the remaining 3% of NEER's net generating capacity has qualifying facility status under the PURPA. NEER's qualifying facilities generate electricity primarily from wind, solar and fossil fuels. Qualifying facility status exempts the projects from, among other things, many of the provisions of the Federal Power Act, as well as state laws and regulations relating to rates and financial or organizational regulation of electric utilities. While projects with qualifying facility and/or exempt wholesale generator status are exempt from various restrictions, each project must still comply with other federal, state and local laws, including, but not limited to, those regarding siting, construction, operation, licensing, pollution abatement and other environmental laws.
Additionally, most of the NEER facilities located in the U.S. are subject to FERC regulations and market rules, the NERC's mandatory reliability standards and the EPA's environmental laws, and its nuclear facilities are also subject to the jurisdiction of the NRC. See FPL - FPL Regulation for additional discussion of FERC, NERC, NRC and EPA regulations. With the exception of facilities located in ERCOT, the FERC has jurisdiction over various aspects of NEER's business in the U.S., including the oversight and investigation of competitive wholesale energy markets, regulation of the transmission and sale of natural gas, and oversight of environmental matters related to natural gas projects and major electricity policy initiatives. The PUCT has jurisdiction, including the regulation of rates and services, oversight of competitive markets, and enforcement of statutes and rules, over NEER facilities located in ERCOT.
NEER and its affiliates are also subject to federal and provincial or regional regulations in Canada and Spain related to energy operations, energy markets and environmental standards. In Canada, activities related to owning and operating wind and solar projects and participating in wholesale and retail energy markets are regulated at the provincial level. In Ontario, for example, electricity generation facilities must be licensed by the Ontario Energy Board and may also be required to complete registrations and maintain market participant status with the Independent Electricity System Operator, in which case they must agree to be bound by and comply with the provisions of the market rules for the Ontario electricity market as well as the mandatory reliability standards of the NERC.
NEER is subject to environmental laws and regulations, and is affected by some of the emerging issues related to renewable energy resources as described in the NEE Environmental Matters section below. In order to better anticipate potential regulatory changes, NEER continues to actively evaluate and participate in regional market redesigns of existing operating rules for the integration of renewable energy resources and for the purchase and sale of energy commodities.
NEER EMPLOYEES
NEER and its subsidiaries had approximately 4,700 employees at
December 31, 2014
. Certain subsidiaries of NEER have collective bargaining agreements with the IBEW, the Utility Workers Union of America, the Security Police and Fire Professionals of America and the International Union of Operating Engineers, which collectively represent approximately 20% of NEER's employees. The collective bargaining agreements have one- to three-year terms and expire between late February 2015 and 2016.
20
III. OTHER NEE OPERATING SUBSIDIARIES
Corporate and Other represents other business activities, primarily NEET and FPL FiberNet, that are not separately reportable. See Note 14. In addition, certain subsidiaries of NEECH are pursuing approvals to invest in, build, own and operate an approximately 600-mile natural gas pipeline system to provide new natural gas transportation infrastructure in Florida and an approximately 300-mile natural gas pipeline to connect the natural gas supply in the Marcellus and Utica shale regions with markets in the Southeast region of the U.S.
NEET
NEET, a wholly-owned subsidiary of NEECH, is a limited liability company organized under the laws of Delaware. NEET conducts its business primarily through two subsidiaries, Lone Star and NHT, and is pursuing opportunities to develop, build and operate new transmission facilities throughout North America. In 2013, an entity in which an affiliate of NEET has a joint venture investment was selected to complete development work for a 250-mile transmission line in Northwestern Ontario, Canada. Once development is complete, subject to Ontario Energy Board approval, the NEET affiliate, through its joint venture, is expected to construct, own and operate the new transmission line that is projected to begin service in 2020.
Lone Star
Lone Star, a rate-regulated transmission service provider in Texas, is a limited liability company organized under the laws of Delaware. Lone Star owns and operates approximately 330 miles of 345 kilovolt (kV) transmission lines and other associated facilities that were placed in service in 2012 and 2013. Lone Star is subject to regulation by a number of federal, state and other agencies, including, but not limited to, the PUCT, the ERCOT, the NERC and the EPA, as well as certain limited regulations of the FERC. See FPL - FPL Regulation for further discussion of FERC, NERC and EPA regulations and NEE Environmental Matters. The PUCT has jurisdiction over a wide range of Lone Star's business activities, including, among others, rates charged to customers and certain aspects of the operation of transmission systems. The PUCT sets rates at a level that allows Lone Star the opportunity to collect from customers total revenues (revenue requirements) equal to Lone Star's cost of providing service, including a reasonable rate of return on invested capital.
In September 2014, the PUCT approved a stipulation and settlement between Lone Star and all intervenors relating to Lone Star’s base rate petition. The stipulation and settlement provides for an annual revenue requirement of approximately $102 million based on a $694 million rate base, a regulatory equity ratio of 45%, an allowed regulatory ROE of 9.6% and certain operating expenses.
NHT
NHT, a rate-regulated transmission owner in ISO-NE, is a limited liability company organized under the laws of Delaware. NHT owns transmission facilities which connect NEER's Seabrook nuclear facility to the New England transmission grid and interconnect three 345 kV transmission lines in New England. NHT is subject to regulation by a number of federal, state and other agencies, including, but not limited to, the New Hampshire Public Utility Commission, ISO-NE, the FERC, the NERC and the EPA. See FPL - FPL Regulation for further discussion of FERC, NERC and EPA regulations and NEE Environmental Matters. NHT wholesale transmission revenues are provided through an ISO-NE tariff.
FPL FIBERNET
FPL FiberNet conducts its business through two separate wholly-owned subsidiaries of NEECH. One subsidiary was formed in 2000 to enhance the value of NEE's fiber-optic network assets that were originally built to support FPL operations and the other was formed in 2011 to hold fiber-optic network assets which were acquired. Both subsidiaries are limited liability companies organized under the laws of Delaware. FPL FiberNet leases fiber-optic network capacity and dark fiber to FPL and other customers, primarily telephone, wireless, internet and other telecommunications companies. FPL FiberNet's networks cover most of the metropolitan areas in Florida and several in Texas. FPL FiberNet also has a long-haul network providing bandwidth at wholesale rates. The long-haul network connects major cities in Florida and Texas with additional connectivity to Atlanta, Georgia, New York and the South Central U.S., including Arkansas, Louisiana and Oklahoma. At
December 31, 2014
, FPL FiberNet's network consisted of approximately 9,050 route miles. FPL FiberNet is subject to regulation by the Federal Communications Commission which has jurisdiction over wire and wireless communication networks and by the public utility commissions in the states in which it provides intrastate telecommunication services.
NATURAL GAS PIPELINE SYSTEMS
Florida Natural Gas Pipeline System
In 2013, FPL announced the winning proposals from its 2012 RFP for an approximately 600-mile natural gas pipeline system for new natural gas transportation infrastructure in Florida. The proposed pipeline system will be composed of two pipelines, each of which is expected to be operational beginning in mid-2017. Sabal Trail, which is 33% owned by a wholly-owned NEECH subsidiary
21
and will be a FERC-regulated entity, was selected to build, own and operate the northern pipeline that would originate in southwestern Alabama and end at a new hub to be built in Central Florida (Central Florida Hub). Florida Southeast Connection, which is a wholly-owned NEECH subsidiary and will be a FERC-regulated entity, was selected to build, own and operate the southern pipeline that would originate at the Central Florida Hub and end in Martin County, Florida at FPL's Martin power plant.
Total estimated capital expenditures for the 33% portion of the northern pipeline plus the entire southern pipeline are estimated to be approximately $1.5 billion. At
December 31, 2014
, NEE's investment in the proposed pipeline system totaled approximately $103 million. The obligations of Sabal Trail and Florida Southeast Connection to build and operate the northern pipeline and southern pipeline, respectively, are subject to certain conditions, including FERC approval. A FERC decision is expected by the end of 2015.
See FPL - FPL Sources of Generation - Fossil Operations and Note 13 - Commitments and - Contracts.
Mountain Valley Pipeline
In October 2014, a wholly-owned NEECH subsidiary committed to make an equity investment in a joint venture which plans to construct an approximately 300-mile natural gas pipeline to connect the natural gas supply in the Marcellus and Utica shale regions with markets in the Southeast region of the U.S. Based on the NEECH subsidiary's expected ownership share, expected equity contributions by the NEECH subsidiary are approximately $1.0 billion to $1.3 billion depending on the ultimate size and scope of the natural gas pipeline project. The pipeline is expected to be placed in service by the end of 2018. Construction of the natural gas pipeline is subject to certain conditions, including FERC approval.
NEE ENVIRONMENTAL MATTERS
NEE and FPL are subject to domestic and foreign environmental laws and regulations, including extensive federal, state and local environmental statutes, rules and regulations. The following is a discussion of certain existing and emerging federal and state initiatives and rules, some of which could potentially have a material effect (either positive or negative) on NEE and its subsidiaries. FPL expects to seek recovery through the environmental clause for compliance costs associated with any new environmental laws and regulations.
|
•
|
Clean Water Act Section 316(b).
In May 2014, the EPA issued its final rule under Section 316(b) of the Clean Water Act outlining the process and framework for determining the Best Technology Available to reduce the impact on aquatic organisms from once-through cooling water intake systems. Under the rule, potentially eleven of FPL's facilities and five of NEER's facilities may be required to add additional controls and/or make operational changes to comply. NEE and FPL are analyzing the final rule, and the ultimate impacts will evolve over years of site specific studies, permit evaluations and negotiations. Therefore, the impact of any final compliance obligations is uncertain at this time. During the third quarter of 2014, several groups filed petitions for review of the EPA's final rule and the U.S. Court of Appeals for the Second Circuit will hear the case.
|
|
•
|
Avian/Bat Regulations and Wind Turbine Siting Guidelines.
FPL, NEER and NEET are subject to numerous environmental regulations and guidelines related to threatened and endangered species and their habitats,
as well as avian and bat species, for the siting, construction and
ongoing operations of their facilities. The facilities most significantly affected are wind and solar facilities and transmission and distribution lines. The environmental laws in the U.S., including, among others, the Endangered Species Act, the Migratory Bird Treaty Act, and the Bald and Golden Eagle Protection Act and similar environmental laws in Canada provide for the protection of migratory birds, eagles and bats and endangered species of birds and bats and their habitats. Regulations have been adopted under some of these laws that contain provisions that allow the owner/operator of a facility to apply for a permit to undertake specific activities including those associated with certain siting decisions, construction activities and operations. In addition to regulations, voluntary wind turbine siting guidelines established by the U.S. Fish and Wildlife Service set forth siting, monitoring and coordination protocols that are designed to support wind development in the U.S. while also protecting both birds and bats and their habitats. These guidelines include provisions for specific monitoring and study conditions which need to be met in order for projects to be in adherence with these voluntary guidelines. Complying with these environmental regulations and adhering to the provisions set forth in the voluntary wind turbine siting guidelines could result in additional costs or reduced revenues at existing and new wind and solar facilities and transmission and distribution facilities at FPL, NEER and NEET and, in the case of environmental regulations, failure to comply could result in fines and penalties.
|
|
•
|
Regulation of GHG Emissions.
The U.S. Congress and certain states and regions continue to consider several legislative and regulatory proposals with respect to GHG emissions. The Government of Canada and its provinces are also taking certain actions, such as setting targets or goals, regarding the increase of renewable energy generation and the reduction of GHG emissions. The economic and operational impact of climate change legislation on NEE and FPL depends on a variety of factors, including, but not limited to, whether states choose a rate-based or mass-based (based on pounds of CO
2
) approach for the distribution of allowances, the allowed emissions cap, whether emission allowances will be allocated or auctioned, the cost to reduce emissions or buy allowances in the marketplace and the availability of offsets and mitigating factors to moderate the costs of compliance. Based on the most recent reference data available from government sources, NEE is among the lowest emitters, among electric generators, of GHG in the U.S. measured by its rate of emissions expressed as pounds of CO
2
per MWh of generation. However, the legislative and regulatory proposals have differing methods of implementation and the impact on FPL's and NEER's generating units and/or the financial impact (either positive or negative) to NEE and FPL could be material,
|
22
depending on the eventual structure of any specific implementation rules adopted.
In 2013, the EPA re-proposed standards for new fossil fuel-fired power units pursuant to a Presidential Memorandum related to the regulation of GHG emissions. The Presidential Memorandum also directed the EPA to issue a final rule for new fossil fuel-fired power units after considering all public comments and to propose a rule for existing fossil fuel-fired power units by June 2014 with a final rule by June 2015. In June 2014, as directed in the Presidential Memorandum, the EPA issued a proposed rule under Section 111(d) of the Clean Air Act to reduce carbon emissions from existing fossil fuel-fired power units. The proposed rule, named the Clean Power Plan, sets emission rate targets for each state and requires each state to develop a compliance plan by the summer of 2016 to meet these emissions targets. The proposed rule indicates that official compliance will start in 2020 with both interim and final target dates, each with specific emissions reductions. NEE and FPL are analyzing the proposed rule and the impact of any final compliance obligations is uncertain at this time. A final rule is expected in the summer of 2015.
NEER's plants operate in certain states and regions in the U.S. and provinces in Canada that continue to consider and implement regulatory proposals to reduce GHG emissions. RPS, currently in place in approximately 30 states and the District of Columbia, require electricity providers in the state or district to meet a certain percentage of their retail sales with energy from renewable sources. These standards vary, but the majority include requirements to meet 20% to 25% of the electricity providers' retail sales with energy from renewable sources by 2025. Approximately 7 other states in the U.S. have set renewable energy goals as well. Many Canadian provinces have enacted renewable energy goals and targets to reduce GHG emissions from historic levels which include various milestones and compliance mechanisms. NEER's plants operate in 24 states in the U.S. and 4 provinces in Canada that have a RPS or renewable energy goals and NEER believes that these standards and goals will create incremental demand for renewable energy in the future.
Other GHG reduction initiatives including, among others, the Regional Greenhouse Gas Initiative and the California Greenhouse Gas Regulation aim to reduce emissions through a variety of programs and under varying timelines. Based on its clean generating portfolio, NEER expects to continue experiencing a positive impact on earnings as a result of these GHG reduction initiatives. Additionally, these initiatives provide NEER opportunities with regards to wind and solar development as well as favorable energy pricing.
|
•
|
Waters of the U.S.
In March 2014, the EPA issued a proposed rule redefining "waters of the U.S." under the Clean Water Act to expand the definition of waters of the U.S. to encompass previously unregulated waters, such as intermittent streams, non-navigable tributaries, isolated wetlands and adjacent other waters. Under the proposed rule, subsidiaries of NEE could incur increased costs for siting and permitting new projects or when maintaining or making modifications to existing facilities and transmission and distribution lines. The ultimate economic and operational impact of the provisions of the proposed rule cannot be determined at this time. A final rule is not expected before the second quarter of 2015.
|
WEBSITE ACCESS TO SEC FILINGS
NEE and FPL make their SEC filings, including the annual report on Form 10-K, quarterly reports on Form 10-Q, current reports on Form 8-K, and any amendments to those reports, available free of charge on NEE's internet website, www.nexteraenergy.com, as soon as reasonably practicable after those documents are electronically filed with or furnished to the SEC. The information and materials available on NEE's website (or any of its subsidiaries' websites) are not incorporated by reference into this combined Form 10-K. The SEC maintains an internet website that contains reports, proxy and information statements, and other information regarding registrants that file electronically with the SEC at www.sec.gov.
23
EXECUTIVE OFFICERS OF NEE
(a)
|
Name
|
Age
|
Position
|
Effective Date
|
|||
|
Miguel Arechabala
|
54
|
Executive Vice President, Power Generation Division of NEE
Executive Vice President, Power Generation Division of FPL |
January 1, 2014
|
|||
|
Deborah H. Caplan
|
52
|
Executive Vice President, Human Resources and Corporate Services of NEE
Executive Vice President, Human Resources and Corporate Services of FPL |
April 15, 2013
|
|||
|
Paul I. Cutler
|
55
|
Treasurer of NEE
Treasurer of FPL
Assistant Secretary of NEE
|
February 19, 2003
February 18, 2003
December 10, 1997
|
|||
|
Moray P. Dewhurst
|
59
|
Vice Chairman and Chief Financial Officer, and Executive Vice President - Finance of NEE
Executive Vice President, Finance and Chief Financial Officer of FPL
|
October 5, 2011
|
|||
|
Chris N. Froggatt
|
57
|
Vice President, Controller and Chief Accounting Officer of NEE
|
February 27, 2010
|
|||
|
Joseph T. Kelliher
|
54
|
Executive Vice President, Federal Regulatory Affairs of NEE
|
May 18, 2009
|
|||
|
Manoochehr K. Nazar
|
60
|
President Nuclear Division and Chief Nuclear Officer of NEE
President Nuclear Division and Chief Nuclear Officer of FPL
|
May 23, 2014
May 30, 2014
|
|||
|
Armando Pimentel, Jr.
|
52
|
President and Chief Executive Officer of NEER
|
October 5, 2011
|
|||
|
James L. Robo
|
52
|
Chairman, President and Chief Executive Officer of NEE
Chairman of FPL
|
December 13, 2013
May 2, 2012
|
|||
|
Charles E. Sieving
|
42
|
Executive Vice President & General Counsel of NEE
Executive Vice President of FPL
|
December 1, 2008
January 1, 2009
|
|||
|
Eric E. Silagy
|
49
|
President and Chief Executive Officer of FPL
|
May 30, 2014
|
|||
|
William L. Yeager
|
56
|
Executive Vice President, Engineering, Construction & Integrated Supply Chain of NEE
Executive Vice President, Engineering, Construction & Integrated Supply Chain of FPL
|
January 1, 2013
|
|||
______________________
|
(a)
|
Information is as of
February 20, 2015
. Executive officers are elected annually by, and serve at the pleasure of, their respective boards of directors. Except as noted below, each officer has held his/her present position for five years or more and his/her employment history is continuous. Mr. Arechabala was president of NextEra Energy España, S.L., an indirect wholly-owned subsidiary of NEE, from February 2010 to December 2013. Ms. Caplan was vice president and chief operating officer of FPL from May 2011 to April 2013 and vice president, integrated supply chain of NEE and FPL from July 2005 to May 2011. Mr. Dewhurst has been vice chairman of NEE since August 2009 and was chief of staff of NEE from August 2009 to October 2011. Mr. Dewhurst has announced his intention to retire from NEE and FPL in the spring of 2016. Mr. Froggatt has been vice president of NEE since October 2009. Mr. Nazar has been chief nuclear officer of NEE and FPL since January 2010 and was executive vice president, nuclear division of NEE and FPL from January 2010 to May 2014. Mr. Pimentel was chief financial officer of NEE and FPL from May 2008 to October 2011 and executive vice president, finance of NEE and FPL from February 2008 to October 2011. Mr. Robo has been president and chief executive officer of NEE since July 2012. Mr. Robo was the chief executive officer of FPL from May 2012 to May 2014 and president and chief operating officer of NEE from December 2006 to June 2012. Mr. Sieving was also assistant secretary of NEE from May 2010 to May 2011 and general counsel of FPL from January 2009 to May 2010. Mr. Silagy has been president of FPL since December 2011. Mr. Silagy was senior vice president, regulatory and state governmental affairs of FPL from May 2010 to December 2011 and vice president and chief development officer of FPL from July 2008 to May 2010. Mr. Yeager was vice president, engineering, construction and integrated supply chain services of NEE and FPL from October 2012 to December 2012 and vice president, integrated supply chain of NEE and FPL from May 2011 to October 2012. From January 2005 to May 2011, Mr. Yeager was vice president, engineering and construction of FPL.
|
24
Risks Relating to NEE's and FPL's Business
The business, financial condition, results of operations and prospects of NEE and FPL are subject to a variety of risks, many of which are beyond the control of NEE and FPL. The following is a description of important risks that may materially adversely affect the business, financial condition, results of operations and prospects of NEE and FPL and may cause actual results of NEE and FPL to differ substantially from those that NEE or FPL currently expects or seeks. In that event, the market price for the securities of NEE or FPL could decline. Accordingly, the risks described below should be carefully considered together with the other information set forth in this report and in future reports that NEE and FPL file with the SEC. The risks described below are not the only risks facing NEE and FPL. Additional risks and uncertainties may also materially adversely affect NEE's or FPL's business, financial condition, results of operations and prospects. Each of NEE and FPL has disclosed the material risks known to it to affect its business at this time. However, there may be further risks and uncertainties that are not presently known or that are not currently believed to be material that may in the future materially adversely affect the business, financial condition, results of operations or prospects of NEE and FPL.
Regulatory, Legislative and Legal Risks
NEE's and FPL's business, financial condition, results of operations and prospects may be materially adversely affected by the extensive regulation of their business.
The operations of NEE and FPL are subject to complex and comprehensive federal, state and other regulation. This extensive regulatory framework, portions of which are more specifically identified in the following risk factors, regulates, among other things and to varying degrees, NEE's and FPL's industries, businesses, rates and cost structures, operation of nuclear power facilities, construction and operation of electricity generation, transmission and distribution facilities and natural gas and oil production, natural gas, oil and other fuel transportation, processing and storage facilities, acquisition, disposal, depreciation and amortization of facilities and other assets, decommissioning costs and funding, service reliability, wholesale and retail competition, and commodities trading and derivatives transactions. In their business planning and in the management of their operations, NEE and FPL must address the effects of regulation on their business and any inability or failure to do so adequately could have a material adverse effect on their business, financial condition, results of operations and prospects.
NEE's and FPL's business, financial condition, results of operations and prospects could be materially adversely affected if they are unable to recover in a timely manner any significant amount of costs, a return on certain assets or a reasonable return on invested capital through base rates, cost recovery clauses, other regulatory mechanisms or otherwise.
FPL is a regulated entity subject to the jurisdiction of the FPSC over a wide range of business activities, including, among other items, the retail rates charged to its customers through base rates and cost recovery clauses, the terms and conditions of its services, procurement of electricity for its customers, issuances of securities, and aspects of the siting, construction and operation of its generating plants and transmission and distribution systems for the sale of electric energy. The FPSC has the authority to disallow recovery by FPL of costs that it considers excessive or imprudently incurred and to determine the level of return that FPL is permitted to earn on invested capital. The regulatory process, which may be adversely affected by the political, regulatory and economic environment in Florida and elsewhere, limits FPL's ability to increase earnings and does not provide any assurance as to achievement of authorized or other earnings levels. NEE's and FPL's business, financial condition, results of operations and prospects could be materially adversely affected if any material amount of costs, a return on certain assets or a reasonable return on invested capital cannot be recovered through base rates, cost recovery clauses, other regulatory mechanisms or otherwise. Certain subsidiaries of NEET, which are indirect wholly-owned subsidiaries of NEE, are regulated electric transmission utilities subject to the jurisdiction of their regulators and subject to similar risks.
Regulatory decisions that are important to NEE and FPL may be materially adversely affected by political, regulatory and economic factors.
The local and national political, regulatory and economic environment has had, and may in the future have, an adverse effect on FPSC decisions with negative consequences for FPL. These decisions may require, for example, FPL to cancel or delay planned development activities, to reduce or delay other planned capital expenditures or to pay for investments or otherwise incur costs that it may not be able to recover through rates, each of which could have a material adverse effect on the business, financial condition, results of operations and prospects of NEE and FPL. Certain subsidiaries of NEET are subject to similar risks.
FPL's use of derivative instruments could be subject to prudence challenges and, if found imprudent, could result in disallowances of cost recovery for such use by the FPSC.
The FPSC engages in an annual prudence review of FPL's use of derivative instruments in its risk management fuel procurement program and should it find any such use to be imprudent, the FPSC could deny cost recovery for such use by FPL. Such an outcome could have a material adverse effect on FPL's business, financial condition, results of operations and prospects.
25
Any reductions to, or the elimination of, governmental incentives that support utility scale renewable energy, including, but not limited to, tax incentives, RPS or feed-in tariffs, or the imposition of additional taxes or other assessments on renewable energy, could result in, among other items, the lack of a satisfactory market for the development of new renewable energy projects, NEER abandoning the development of renewable energy projects, a loss of NEER's investments in renewable energy projects and reduced project returns, any of which could have a material adverse effect on NEE's business, financial condition, results of operations and prospects.
NEER depends heavily on government policies that support utility scale renewable energy and enhance the economic feasibility of developing and operating wind and solar energy projects in regions in which NEER operates or plans to develop and operate renewable energy facilities. The federal government, a majority of the 50 U.S. states and portions of Canada and Spain provide incentives, such as tax incentives, RPS or feed-in tariffs, that support the sale of energy from utility scale renewable energy facilities, such as wind and solar energy facilities. As a result of budgetary constraints, political factors or otherwise, governments from time to time may review their policies that support renewable energy and consider actions that would make the policies less conducive to the development and operation of renewable energy facilities. Any reductions to, or the elimination of, governmental incentives that support renewable energy, such as those reductions that have been enacted in Spain and are applicable to NEER's solar generating facilities in that country, or the imposition of additional taxes or other assessments on renewable energy, could result in, among other items, the lack of a satisfactory market for the development of new renewable energy projects, NEER abandoning the development of renewable energy projects, a loss of NEER's investments in the projects and reduced project returns, any of which could have a material adverse effect on NEE's business, financial condition, results of operations and prospects.
NEE's and FPL's business, financial condition, results of operations and prospects could be materially adversely affected as a result of new or revised laws, regulations or interpretations or other regulatory initiatives.
NEE's and FPL's business is influenced by various legislative and regulatory initiatives, including, but not limited to, new or revised laws, regulations or interpretations or other regulatory initiatives regarding deregulation or restructuring of the energy industry, regulation of the commodities trading and derivatives markets, and environmental regulation, such as regulation of air emissions, regulation of water consumption and water discharges, and regulation of gas and oil infrastructure operations, as well as associated environmental permitting. Changes in the nature of the regulation of NEE's and FPL's business could have a material adverse effect on NEE's and FPL's business, financial condition, results of operations and prospects. NEE and FPL are unable to predict future legislative or regulatory changes, initiatives or interpretations, although any such changes, initiatives or interpretations may increase costs and competitive pressures on NEE and FPL, which could have a material adverse effect on NEE's and FPL's business, financial condition, results of operations and prospects.
FPL has limited competition in the Florida market for retail electricity customers. Any changes in Florida law or regulation which introduce competition in the Florida retail electricity market, such as government incentives that facilitate the installation of solar generating facilities on residential or other rooftops at below cost, or would permit third-party sales of electricity, could have a material adverse effect on FPL's business, financial condition, results of operations and prospects. There can be no assurance that FPL will be able to respond adequately to such regulatory changes, which could have a material adverse effect on FPL's business, financial condition, results of operations and prospects.
NEER is subject to FERC rules related to transmission that are designed to facilitate competition in the wholesale market on practically a nationwide basis by providing greater certainty, flexibility and more choices to wholesale power customers. NEE cannot predict the impact of changing FERC rules or the effect of changes in levels of wholesale supply and demand, which are typically driven by factors beyond NEE's control. There can be no assurance that NEER will be able to respond adequately or sufficiently quickly to such rules and developments, or to any other changes that reverse or restrict the competitive restructuring of the energy industry in those jurisdictions in which such restructuring has occurred. Any of these events could have a material adverse effect on NEE's business, financial condition, results of operations and prospects.
NEE's and FPL's business, financial condition, results of operations and prospects could be materially adversely affected if the rules implementing the Dodd-Frank Wall Street Reform and Consumer Protection Act (Dodd-Frank Act) broaden the scope of its provisions regarding the regulation of OTC financial derivatives and make certain provisions applicable to NEE and FPL.
The Dodd-Frank Act, enacted into law in July 2010 provides for, among other things, substantially increased regulation of the OTC derivatives market and futures contract markets. While the legislation is broad and detailed, there are still portions of the legislation that either require implementing rules to be adopted by federal governmental agencies or otherwise require further interpretive guidance.
NEE and FPL continue to monitor the development of rules related to the Dodd-Frank Act and have taken steps to comply with those rules that affect their businesses. While a number of rules have been finalized and are effective, the rules related to margin requirements for OTC derivatives have yet to be finalized. If those rules, when finalized, require NEE and FPL to post significant amounts of cash collateral with respect to swap transactions, NEE's and FPL's liquidity could be materially adversely affected.
26
NEE and FPL cannot predict the impact these proposed rules will have on their ability to hedge their commodity and interest rate risks or on OTC derivatives markets as a whole, but they could potentially have a material adverse effect on NEE's and FPL's risk exposure, as well as reduce market liquidity and further increase the cost of hedging activities.
NEE and FPL are subject to numerous environmental laws, regulations and other standards that may result in capital expenditures, increased operating costs and various liabilities, and may require NEE and FPL to limit or eliminate certain operations.
NEE and FPL are subject to domestic and foreign environmental laws and regulations, including, but not limited to, extensive federal, state and local environmental statutes, rules and regulations relating to air quality, water quality and usage, climate change, emissions of greenhouse gases, including, but not limited to, CO
2
, waste management, hazardous wastes, marine, avian and other wildlife mortality and habitat protection, historical artifact preservation, natural resources, health (including, but not limited to, electric and magnetic fields from power lines and substations), safety and RPS, that could, among other things, prevent or delay the development of power generation, power or natural gas transmission, or other infrastructure projects, restrict the output of some existing facilities, limit the availability and use of some fuels required for the production of electricity, require additional pollution control equipment, and otherwise increase costs, increase capital expenditures and limit or eliminate certain operations.
There are significant capital, operating and other costs associated with compliance with these environmental statutes, rules and regulations, and those costs could be even more significant in the future as a result of new legislation, the current trend toward more stringent standards, and stricter and more expansive application of existing environmental regulations. For example, among other potential or pending changes, the use of hydraulic fracturing or similar technologies to drill for natural gas and related compounds used by NEE's gas infrastructure business is currently being discussed for regulation at state and federal levels.
Violations of current or future laws, rules, regulations or other standards could expose NEE and FPL to regulatory and legal proceedings, disputes with, and legal challenges by, third parties, and potentially significant civil fines, criminal penalties and other sanctions. Proceedings could include, for example, litigation regarding property damage, personal injury, common law nuisance and enforcement by citizens or governmental authorities of environmental requirements such as air, water and soil quality standards.
NEE's and FPL's business could be negatively affected by federal or state laws or regulations mandating new or additional limits on the production of greenhouse gas emissions.
Federal or state laws or regulations may be adopted that would impose new or additional limits on the emissions of greenhouse gases, including, but not limited to, CO
2
and methane, from electric generating units using fossil fuels like coal and natural gas. The potential effects of such greenhouse gas emission limits on NEE's and FPL's electric generating units are subject to significant uncertainties based on, among other things, the timing of the implementation of any new requirements, the required levels of emission reductions, the nature of any market-based or tax-based mechanisms adopted to facilitate reductions, the relative availability of greenhouse gas emission reduction offsets, the development of cost-effective, commercial-scale carbon capture and storage technology and supporting regulations and liability mitigation measures, and the range of available compliance alternatives.
While NEE's and FPL's electric generating units emit greenhouse gases at a lower rate of emissions than most of the U.S. electric generation sector, the results of operations of NEE and FPL could be materially adversely affected to the extent that new federal or state laws or regulations impose any new greenhouse gas emission limits. Any future limits on greenhouse gas emissions could:
|
•
|
create substantial additional costs in the form of taxes or emission allowances;
|
|
•
|
make some of NEE's and FPL's electric generating units uneconomical to operate in the long term;
|
|
•
|
require significant capital investment in carbon capture and storage technology, fuel switching, or the replacement of high-emitting generation facilities with lower-emitting generation facilities; or
|
|
•
|
affect the availability or cost of fossil fuels.
|
There can be no assurance that NEE or FPL would be able to completely recover any such costs or investments, which could have a material adverse effect on their business, financial condition, results of operations and prospects.
Extensive federal regulation of the operations of NEE and FPL exposes NEE and FPL to significant and increasing compliance costs and may also expose them to substantial monetary penalties and other sanctions for compliance failures.
NEE and FPL are subject to extensive federal regulation, which generally imposes significant and increasing compliance costs on NEE's and FPL's operations. Additionally, any actual or alleged compliance failures could result in significant costs and other potentially adverse effects of regulatory investigations, proceedings, settlements, decisions and claims, including, among other items, potentially significant monetary penalties. As an example, under the Energy Policy Act of 2005, NEE and FPL, as owners and operators of bulk-power transmission systems and/or electric generation facilities, are subject to mandatory reliability standards. Compliance with these mandatory reliability standards may subject NEE and FPL to higher operating costs and may result in increased capital expenditures. If FPL or NEE is found not to be in compliance with these standards, it may incur substantial monetary penalties and other sanctions. Both the costs of regulatory compliance and the costs that may be imposed as a result of any actual or alleged compliance failures could have a material adverse effect on NEE's and FPL's business, financial condition, results of operations and prospects.
27
Changes in tax laws, as well as judgments and estimates used in the determination of tax-related asset and liability amounts, could materially adversely affect NEE's and FPL's business, financial condition, results of operations and prospects.
NEE's and FPL's provision for income taxes and reporting of tax-related assets and liabilities require significant judgments and the use of estimates. Amounts of tax-related assets and liabilities involve judgments and estimates of the timing and probability of recognition of income, deductions and tax credits, including, but not limited to, estimates for potential adverse outcomes regarding tax positions that have been taken and the ability to utilize tax benefit carryforwards, such as net operating loss and tax credit carryforwards. Actual income taxes could vary significantly from estimated amounts due to the future impacts of, among other things, changes in tax laws, regulations and interpretations, the financial condition and results of operations of NEE and FPL, and the resolution of audit issues raised by taxing authorities. Ultimate resolution of income tax matters may result in material adjustments to tax-related assets and liabilities, which could materially adversely affect NEE's and FPL's business, financial condition, results of operations and prospects.
NEE's and FPL's business, financial condition, results of operations and prospects may be materially adversely affected due to adverse results of litigation.
NEE's and FPL's business, financial condition, results of operations and prospects may be materially affected by adverse results of litigation. Unfavorable resolution of legal proceedings in which NEE is involved or other future legal proceedings, including, but not limited to, class action lawsuits, may have a material adverse effect on the business, financial condition, results of operations and prospects of NEE and FPL.
Operational Risks
NEE's and FPL's business, financial condition, results of operations and prospects could suffer if NEE and FPL do not proceed with projects under development or are unable to complete the construction of, or capital improvements to, electric generation, transmission and distribution facilities, gas infrastructure facilities or other facilities on schedule or within budget.
NEE's and FPL's ability to complete construction of, and capital improvement projects for, their electric generation, transmission and distribution facilities, gas infrastructure facilities and other facilities on schedule and within budget may be adversely affected by escalating costs for materials and labor and regulatory compliance, inability to obtain or renew necessary licenses, rights-of-way, permits or other approvals on acceptable terms or on schedule, disputes involving contractors, labor organizations, land owners, governmental entities, environmental groups, Native American and aboriginal groups, and other third parties, negative publicity, transmission interconnection issues and other factors. If any development project or construction or capital improvement project is not completed, is delayed or is subject to cost overruns, certain associated costs may not be approved for recovery or recoverable through regulatory mechanisms that may otherwise be available, and NEE and FPL could become obligated to make delay or termination payments or become obligated for other damages under contracts, could experience the loss of tax credits or tax incentives, or delayed or diminished returns, and could be required to write off all or a portion of their investment in the project. Any of these events could have a material adverse effect on NEE's and FPL's business, financial condition, results of operations and prospects.
NEE and FPL may face risks related to project siting, financing, construction, permitting, governmental approvals and the negotiation of project development agreements that may impede their development and operating activities.
NEE and FPL own, develop, construct, manage and operate electric-generating and transmission facilities. A key component of NEE's and FPL's growth is their ability to construct and operate generation and transmission facilities to meet customer needs. As part of these operations, NEE and FPL must periodically apply for licenses and permits from various local, state, federal and other regulatory authorities and abide by their respective conditions. Should NEE or FPL be unsuccessful in obtaining necessary licenses or permits on acceptable terms, should there be a delay in obtaining or renewing necessary licenses or permits or should regulatory authorities initiate any associated investigations or enforcement actions or impose related penalties or disallowances on NEE or FPL, NEE's and FPL's business, financial condition, results of operations and prospects could be materially adversely affected. Any failure to negotiate successful project development agreements for new facilities with third parties could have similar results.
The operation and maintenance of NEE's and FPL's electric generation, transmission and distribution facilities, gas infrastructure facilities and other facilities are subject to many operational risks, the consequences of which could have a material adverse effect on NEE's and FPL's business, financial condition, results of operations and prospects.
NEE's and FPL's electric generation, transmission and distribution facilities, gas infrastructure facilities and other facilities are subject to many operational risks. Operational risks could result in, among other things, lost revenues due to prolonged outages, increased expenses due to monetary penalties or fines for compliance failures, liability to third parties for property and personal injury damage, a failure to perform under applicable power sales agreements and associated loss of revenues from terminated agreements or liability for liquidated damages under continuing agreements, and replacement equipment costs or an obligation to purchase or generate replacement power at higher prices.
28
Uncertainties and risks inherent in operating and maintaining NEE's and FPL's facilities include, but are not limited to:
|
•
|
risks associated with facility start-up operations, such as whether the facility will achieve projected operating performance on schedule and otherwise as planned;
|
|
•
|
failures in the availability, acquisition or transportation of fuel or other necessary supplies;
|
|
•
|
the impact of unusual or adverse weather conditions and natural disasters, including, but not limited to, hurricanes, floods, earthquakes and droughts;
|
|
•
|
performance below expected or contracted levels of output or efficiency;
|
|
•
|
breakdown or failure, including, but not limited to, explosions, fires or other major events, of equipment, transmission and distribution lines or pipelines;
|
|
•
|
availability of replacement equipment;
|
|
•
|
risks of property damage or human injury from energized equipment, hazardous substances or explosions, fires or other events;
|
|
•
|
availability of adequate water resources and ability to satisfy water intake and discharge requirements;
|
|
•
|
inability to identify, manage properly or mitigate equipment defects in NEE's and FPL's facilities;
|
|
•
|
use of new or unproven technology;
|
|
•
|
risks associated with dependence on a specific type of fuel or fuel source, such as commodity price risk, availability of adequate fuel supply and transportation, and lack of available alternative fuel sources;
|
|
•
|
increased competition due to, among other factors, new facilities, excess supply and shifting demand; and
|
|
•
|
insufficient insurance, warranties or performance guarantees to cover any or all lost revenues or increased expenses from the foregoing.
|
NEE's and FPL's business, financial condition, results of operations and prospects may be negatively affected by a lack of growth or slower growth in the number of customers or in customer usage.
Growth in customer accounts and growth of customer usage each directly influence the demand for electricity and the need for additional power generation and power delivery facilities. Customer growth and customer usage are affected by a number of factors outside the control of NEE and FPL, such as mandated energy efficiency measures, demand side management requirements, and economic and demographic conditions, such as population changes, job and income growth, housing starts, new business formation and the overall level of economic activity. A lack of growth, or a decline, in the number of customers or in customer demand for electricity may cause NEE and FPL to fail to fully realize the anticipated benefits from significant investments and expenditures and could have a material adverse effect on NEE's and FPL's growth, business, financial condition, results of operations and prospects.
NEE's and FPL's business, financial condition, results of operations and prospects can be materially adversely affected by weather conditions, including, but not limited to, the impact of severe weather.
Weather conditions directly influence the demand for electricity and natural gas and other fuels and affect the price of energy and energy-related commodities. In addition, severe weather and natural disasters, such as hurricanes, floods and earthquakes, can be destructive and cause power outages and property damage, reduce revenue, affect the availability of fuel and water, and require NEE and FPL to incur additional costs, for example, to restore service and repair damaged facilities, to obtain replacement power and to access available financing sources. Furthermore, NEE's and FPL's physical plant could be placed at greater risk of damage should changes in the global climate produce unusual variations in temperature and weather patterns, resulting in more intense, frequent and extreme weather events, abnormal levels of precipitation and, particularly relevant to FPL, a change in sea level. FPL operates in the east and lower west coasts of Florida, an area that historically has been prone to severe weather events, such as hurricanes. A disruption or failure of electric generation, transmission or distribution systems or natural gas production, transmission, storage or distribution systems in the event of a hurricane, tornado or other severe weather event, or otherwise, could prevent NEE and FPL from operating their business in the normal course and could result in any of the adverse consequences described above. Any of the foregoing could have a material adverse effect on NEE's and FPL's business, financial condition, results of operations and prospects.
At FPL and other businesses of NEE where cost recovery is available, recovery of costs to restore service and repair damaged facilities is or may be subject to regulatory approval, and any determination by the regulator not to permit timely and full recovery of the costs incurred could have a material adverse effect on NEE's and FPL's business, financial condition, results of operations and prospects.
Changes in weather can also affect the production of electricity at power generating facilities, including, but not limited to, NEER's wind and solar facilities. For example, the level of wind resource affects the revenue produced by wind generating facilities. Because the levels of wind and solar resources are variable and difficult to predict, NEER's results of operations for individual wind and solar facilities specifically, and NEE's results of operations generally, may vary significantly from period to period, depending on the level of available resources. To the extent that resources are not available at planned levels, the financial results from these facilities may be less than expected.
29
Threats of terrorism and catastrophic events that could result from terrorism, cyber attacks, or individuals and/or groups attempting to disrupt NEE's and FPL's business, or the businesses of third parties, may materially adversely affect NEE's and FPL's business, financial condition, results of operations and prospects.
NEE and FPL are subject to the potentially adverse operating and financial effects of terrorist acts and threats, as well as cyber attacks and other disruptive activities of individuals or groups. There have been cyber attacks on energy infrastructure such as substations, gas pipelines and related assets in the past and there may be such attacks in the future. NEE's and FPL's generation, transmission and distribution facilities, fuel storage facilities, information technology systems and other infrastructure facilities and systems could be direct targets of, or be indirectly affected by, such activities.
Terrorist acts, cyber attacks or other similar events affecting NEE's and FPL's systems and facilities, or those of third parties on which NEE and FPL rely, could harm NEE's and FPL's business, for example, by limiting their ability to generate, purchase or transmit power, by limiting their ability to bill customers and collect and process payments, and by delaying their development and construction of new generating facilities or capital improvements to existing facilities. These events, and governmental actions in response, could result in a material decrease in revenues, significant additional costs (for example, to repair assets, implement additional security requirements or maintain or acquire insurance), and reputational damage, could materially adversely affect NEE's and FPL's operations (for example, by contributing to disruption of supplies and markets for natural gas, oil and other fuels), and could impair NEE's and FPL's ability to raise capital (for example, by contributing to financial instability and lower economic activity). In addition, the implementation of security guidelines and measures has resulted in and is expected to continue to result in increased costs. Such events or actions may materially adversely affect NEE's and FPL's business, financial condition, results of operations and prospects.
The ability of NEE and FPL to obtain insurance and the terms of any available insurance coverage could be materially adversely affected by international, national, state or local events and company-specific events, as well as the financial condition of insurers. NEE's and FPL's insurance coverage does not provide protection against all significant losses.
Insurance coverage may not continue to be available or may not be available at rates or on terms similar to those presently available to NEE and FPL. The ability of NEE and FPL to obtain insurance and the terms of any available insurance coverage could be materially adversely affected by international, national, state or local events and company-specific events, as well as the financial condition of insurers. If insurance coverage is not available or obtainable on acceptable terms, NEE or FPL may be required to pay costs associated with adverse future events. NEE and FPL generally are not fully insured against all significant losses. For example, FPL is not fully insured against hurricane-related losses, but would instead seek recovery of such uninsured losses from customers subject to approval by the FPSC, to the extent losses exceed restricted funds set aside to cover the cost of storm damage. A loss for which NEE or FPL is not fully insured could have a material adverse effect on NEE's and FPL's business, financial condition, results of operations and prospects.
NEE invests in gas and oil producing assets through NEER’s gas infrastructure business. The gas infrastructure business is exposed to fluctuating market prices of natural gas, natural gas liquids, oil and other energy commodities. A prolonged period of low gas and oil prices could impact NEER’s gas infrastructure business and cause NEER to delay or cancel certain gas infrastructure projects and for certain existing projects to be impaired, which could materially adversely affect NEE's results of operations.
Natural gas and oil prices are affected by supply and demand, both globally and regionally. Factors that influence supply and demand include operational issues, natural disasters, weather, political instability, conflicts, economic conditions and actions by major oil-producing countries. There can be significant volatility in market prices for gas and oil, and price fluctuations could have a material effect on the financial performance of gas and oil producing assets. For example, in a low gas and oil price environment, NEER would generate less revenue from its gas infrastructure investments in gas and oil producing properties, and as a result certain investments might become less profitable or incur losses. Prolonged periods of low oil and gas prices could also result in oil and gas production projects being delayed or cancelled and for certain existing projects to be impaired, which could materially adversely affect NEE's results of operations.
If supply costs necessary to provide NEER's full energy and capacity requirement services are not favorable, operating costs could increase and materially adversely affect NEE's business, financial condition, results of operations and prospects.
NEER provides full energy and capacity requirements
services primarily to distribution utilities, which include load-following services and various ancillary services, to satisfy all or a portion of such utilities' power supply obligations to their customers. The supply costs for these transactions may be affected by a number of factors, including, but not limited to, events that may occur after such utilities have committed to supply power, such as weather conditions, fluctuating prices for energy and ancillary services, and the ability of the distribution utilities' customers to elect to receive service from competing suppliers. NEER may not be able to recover all of its increased supply costs, which could have a material adverse effect on NEE's business, financial condition, results of operations and prospects.
Due to the potential for significant volatility in market prices for fuel, electricity and renewable and other energy commodities, NEER's inability or failure to manage properly or hedge effectively the commodity risks within its portfolios
30
could materially adversely affect NEE's business, financial condition, results of operations and prospects.
There can be significant volatility in market prices for fuel, electricity and renewable and other energy commodities. NEE's inability or failure to manage properly or hedge effectively its assets or positions against changes in commodity prices, volumes, interest rates, counterparty credit risk or other risk measures, based on factors both from within, or wholly or partially outside of, NEE's control, may materially adversely affect NEE's business, financial condition, results of operations and prospects.
Sales of power on the spot market or on a short-term contractual basis may cause NEE's results of operations to be volatile.
A portion of NEER's power generation facilities operate wholly or partially without long-term power purchase agreements. Power from these facilities is sold on the spot market or on a short-term contractual basis. Spot market sales are subject to market volatility, and the revenue generated from these sales is subject to fluctuation that may cause NEE's results of operations to be volatile. NEER and NEE may not be able to manage volatility adequately, which could then have a material adverse effect on NEE's business, financial condition, results of operations and prospects.
Reductions in the liquidity of energy markets may restrict the ability of NEE to manage its operational risks, which, in turn, could negatively affect NEE's results of operations.
NEE is an active participant in energy markets. The liquidity of regional energy markets is an important factor in NEE's ability to manage risks in these operations. Over the past several years, other market participants have ceased or significantly reduced their activities in energy markets as a result of several factors, including, but not limited to, government investigations, changes in market design and deteriorating credit quality. Liquidity in the energy markets can be adversely affected by price volatility, restrictions on the availability of credit and other factors, and any reduction in the liquidity of energy markets could have a material adverse effect on NEE's business, financial condition, results of operations and prospects.
NEE's and FPL's hedging and trading procedures and associated risk management tools may not protect against significant losses.
NEE and FPL have hedging and trading procedures and associated risk management tools, such as separate but complementary financial, credit, operational, compliance and legal reporting systems, internal controls, management review processes and other mechanisms. NEE and FPL are unable to assure that such procedures and tools will be effective against all potential risks, including, without limitation, employee misconduct. If such procedures and tools are not effective, this could have a material adverse effect on NEE's business, financial condition, results of operations and prospects.
If price movements significantly or persistently deviate from historical behavior, NEE's and FPL's risk management tools associated with their hedging and trading procedures may not protect against significant losses.
NEE's and FPL's risk management tools and metrics associated with their hedging and trading procedures, such as daily value at risk, earnings at risk, stop loss limits and liquidity guidelines, are based on historical price movements. Due to the inherent uncertainty involved in price movements and potential deviation from historical pricing behavior, NEE and FPL are unable to assure that their risk management tools and metrics will be effective to protect against material adverse effects on their business, financial condition, results of operations and prospects.
If power transmission or natural gas, nuclear fuel or other commodity transportation facilities are unavailable or disrupted, FPL's and NEER's ability to sell and deliver power or natural gas may be limited.
FPL and NEER depend upon power transmission and natural gas, nuclear fuel and other commodity transportation facilities, many of which they do not own. Occurrences affecting the operation of these facilities that may or may not be beyond FPL's and NEER's control (such as severe weather or a generation or transmission facility outage, pipeline rupture, or sudden and significant increase or decrease in wind generation) may limit or halt the ability of FPL and NEER to sell and deliver power and natural gas, or to purchase necessary fuels and other commodities, which could materially adversely impact NEE's and FPL's business, financial condition, results of operations and prospects.
NEE and FPL are subject to credit and performance risk from customers, hedging counterparties and vendors.
NEE and FPL are exposed to risks associated with the creditworthiness and performance of their customers, hedging counterparties and vendors under contracts for the supply of equipment, materials, fuel and other goods and services required for their business operations and for the construction and operation of, and for capital improvements to, their facilities. Adverse conditions in the energy industry or the general economy, as well as circumstances of individual customers, hedging counterparties and vendors, may affect the ability of some customers, hedging counterparties and vendors to perform as required under their contracts with NEE and FPL.
If any hedging, vending or other counterparty fails to fulfill its contractual obligations, NEE and FPL may need to make arrangements with other counterparties or vendors, which could result in financial losses, higher costs, untimely completion of power generation
31
facilities and other projects, and/or a disruption of their operations. If a defaulting counterparty is in poor financial condition, NEE and FPL may not be able to recover damages for any contract breach.
NEE and FPL could recognize financial losses or a reduction in operating cash flows if a counterparty fails to perform or make payments in accordance with the terms of derivative contracts or if NEE or FPL is required to post margin cash collateral under derivative contracts.
NEE and FPL use derivative instruments, such as swaps, options, futures and forwards, some of which are traded in the OTC markets or on exchanges, to manage their commodity and financial market risks, and for NEE to engage in trading and marketing activities. Any failures by their counterparties to perform or make payments in accordance with the terms of those transactions could have a material adverse effect on NEE's or FPL's business, financial condition, results of operations and prospects. Similarly, any requirement for FPL or NEE to post margin cash collateral under its derivative contracts could have a material adverse effect on its business, financial condition, results of operations and prospects.
NEE and FPL are highly dependent on sensitive and complex information technology systems, and any failure or breach of those systems could have a material adverse effect on their business, financial condition, results of operations and prospects.
NEE and FPL operate in a highly regulated industry that requires the continuous functioning of sophisticated information technology systems and network infrastructure. Despite NEE's and FPL's implementation of security measures, all of their technology systems are vulnerable to disability, failures or unauthorized access due to such activities. If NEE's or FPL's information technology systems were to fail or be breached, sensitive confidential and other data could be compromised and NEE and FPL could be unable to fulfill critical business functions.
NEE's and FPL's business is highly dependent on their ability to process and monitor, on a daily basis, a very large number of transactions, many of which are highly complex and cross numerous and diverse markets. Due to the size, scope and geographical reach of NEE's and FPL's business, and due to the complexity of the process of power generation, transmission and distribution, the development and maintenance of information technology systems to keep track of and process information is critical and challenging. NEE's and FPL's operating systems and facilities may fail to operate properly or become disabled as a result of events that are either within, or wholly or partially outside of, their control, such as operator error, severe weather or terrorist activities. Any such failure or disabling event could materially adversely affect NEE's and FPL's ability to process transactions and provide services, and their business, financial condition, results of operations and prospects.
NEE and FPL add, modify and replace information systems on a regular basis. Modifying existing information systems or implementing new or replacement information systems is costly and involves risks, including, but not limited to, integrating the modified, new or replacement system with existing systems and processes, implementing associated changes in accounting procedures and controls, and ensuring that data conversion is accurate and consistent. Any disruptions or deficiencies in existing information systems, or disruptions, delays or deficiencies in the modification or implementation of new information systems, could result in increased costs, the inability to track or collect revenues and the diversion of management's and employees' attention and resources, and could negatively impact the effectiveness of the companies' control environment, and/or the companies' ability to timely file required regulatory reports.
NEE and FPL also face the risks of operational failure or capacity constraints of third parties, including, but not limited to, those who provide power transmission and natural gas transportation services.
NEE's and FPL's retail businesses are subject to the risk that sensitive customer data may be compromised, which could result in a material adverse impact to their reputation and/or the results of operations of the retail business.
NEE's and FPL's retail businesses require access to sensitive customer data in the ordinary course of business. NEE's and FPL's retail businesses may also need to provide sensitive customer data to vendors and service providers who require access to this information in order to provide services, such as call center services, to the retail businesses. If a significant breach occurred, the reputation of NEE and FPL could be materially adversely affected, customer confidence could be diminished, or customer information could be subject to identity theft. NEE and FPL would be subject to costs associated with the breach and/or NEE and FPL could be subject to fines and legal claims, any of which may have a material adverse effect on the business, financial condition, results of operations and prospects of NEE and FPL.
NEE and FPL could recognize financial losses as a result of volatility in the market values of derivative instruments and limited liquidity in OTC markets.
NEE and FPL execute transactions in derivative instruments on either recognized exchanges or via the OTC markets, depending on management's assessment of the most favorable credit and market execution factors. Transactions executed in OTC markets have the potential for greater volatility and less liquidity than transactions on recognized exchanges. As a result, NEE and FPL may not be able to execute desired OTC transactions due to such heightened volatility and limited liquidity.
32
In the absence of actively quoted market prices and pricing information from external sources, the valuation of derivative instruments involves management's judgment and use of estimates. As a result, changes in the underlying assumptions or use of alternative valuation methods could affect the reported fair value of these derivative instruments and have a material adverse effect on NEE's and FPL's business, financial condition, results of operations and prospects.
NEE and FPL may be materially adversely affected by negative publicity.
From time to time, political and public sentiment may result in a significant amount of adverse press coverage and other adverse public statements affecting NEE and FPL. Adverse press coverage and other adverse statements, whether or not driven by political or public sentiment, may also result in investigations by regulators, legislators and law enforcement officials or in legal claims. Responding to these investigations and lawsuits, regardless of the ultimate outcome of the proceeding, can divert the time and effort of senior management from NEE's and FPL's business.
Addressing any adverse publicity, governmental scrutiny or enforcement or other legal proceedings is time consuming and expensive and, regardless of the factual basis for the assertions being made, can have a negative impact on the reputation of NEE and FPL, on the morale and performance of their employees and on their relationships with their respective regulators. It may also have a negative impact on their ability to take timely advantage of various business and market opportunities. The direct and indirect effects of negative publicity, and the demands of responding to and addressing it, may have a material adverse effect on NEE's and FPL's business, financial condition, results of operations and prospects.
NEE's and FPL's business, financial condition, results of operations and prospects may be materially adversely affected if FPL is unable to maintain, negotiate or renegotiate franchise agreements on acceptable terms with municipalities and counties in Florida.
FPL must negotiate franchise agreements with municipalities and counties in Florida to provide electric services within such municipalities and counties, and electricity sales generated pursuant to these agreements represent a very substantial portion of FPL's revenues. If FPL is unable to maintain, negotiate or renegotiate such franchise agreements on acceptable terms, it could contribute to lower earnings and FPL may not fully realize the anticipated benefits from significant investments and expenditures, which could materially adversely affect NEE's and FPL's business, financial condition, results of operations and prospects.
Increasing costs associated with health care plans may materially adversely affect NEE's and FPL's results of operations.
The costs of providing health care benefits to employees and retirees have increased substantially in recent years. NEE and FPL anticipate that their employee benefit costs, including, but not limited to, costs related to health care plans for employees and former employees, will continue to rise. The increasing costs and funding requirements associated with NEE's and FPL's health care plans may materially adversely affect NEE's and FPL's business, financial condition, results of operations and prospects.
NEE's and FPL's business, financial condition, results of operations and prospects could be negatively affected by the lack of a qualified workforce or the loss or retirement of key employees.
NEE and FPL may not be able to service customers, grow their business or generally meet their other business plan goals effectively and profitably if they do not attract and retain a qualified workforce. Additionally, the loss or retirement of key executives and other employees may materially adversely affect service and productivity and contribute to higher training and safety costs.
Over the next several years, a significant portion of NEE's and FPL's workforce, including, but not limited to, many workers with specialized skills maintaining and servicing the nuclear generation facilities and electrical infrastructure, will be eligible to retire. Such highly skilled individuals may not be able to be replaced quickly due to the technically complex work they perform. If a significant amount of such workers retire and are not replaced, the subsequent loss in productivity and increased recruiting and training costs could result in a material adverse effect on NEE's and FPL's business, financial condition, results of operations and prospects.
NEE's and FPL's business, financial condition, results of operations and prospects could be materially adversely affected by work strikes or stoppages and increasing personnel costs.
Employee strikes or work stoppages could disrupt operations and lead to a loss of revenue and customers. Personnel costs may also increase due to inflationary or competitive pressures on payroll and benefits costs and revised terms of collective bargaining agreements with union employees. These consequences could have a material adverse effect on NEE's and FPL's business, financial condition, results of operations and prospects.
NEE's ability to successfully identify, complete and integrate acquisitions is subject to significant risks, including, but not limited to, the effect of increased competition for acquisitions resulting from the consolidation of the power industry.
NEE is likely to encounter significant competition for acquisition opportunities that may become available as a result of the consolidation of the power industry in general. In addition, NEE may be unable to identify attractive acquisition opportunities at favorable prices and to complete and integrate them successfully and in a timely manner.
33
Nuclear Generation Risks
The construction, operation and maintenance of NEE's and FPL's nuclear generation facilities involve environmental, health and financial risks that could result in fines or the closure of the facilities and in increased costs and capital expenditures.
NEE's and FPL's nuclear generation facilities are subject to environmental, health and financial risks, including, but not limited to, those relating to site storage of spent nuclear fuel, the disposition of spent nuclear fuel, leakage and emissions of tritium and other radioactive elements in the event of a nuclear accident or otherwise, the threat of a terrorist attack and other potential liabilities arising out of the ownership or operation of the facilities. NEE and FPL maintain decommissioning funds and external insurance coverage which are intended to reduce the financial exposure to some of these risks; however, the cost of decommissioning nuclear generation facilities could exceed the amount available in NEE's and FPL's decommissioning funds, and the exposure to liability and property damages could exceed the amount of insurance coverage. If NEE or FPL is unable to recover the additional costs incurred through insurance or, in the case of FPL, through regulatory mechanisms, their business, financial condition, results of operations and prospects could be materially adversely affected.
In the event of an incident at any nuclear generation facility in the U.S. or at certain nuclear generation facilities in Europe, NEE and FPL could be assessed significant retrospective assessments and/or retrospective insurance premiums as a result of their participation in a secondary financial protection system and nuclear insurance mutual companies.
Liability for accidents at nuclear power plants is governed by the Price-Anderson Act, which limits the liability of nuclear reactor owners to the amount of insurance available from both private sources and an industry retrospective payment plan. In accordance with this Act, NEE maintains $375 million of private liability insurance per site, which is the maximum obtainable, and participates in a secondary financial protection system, which provides up to $13.2 billion of liability insurance coverage per incident at any nuclear reactor in the U.S. Under the secondary financial protection system, NEE is subject to retrospective assessments and/or retrospective insurance premiums of up to $1 billion ($509 million for FPL), plus any applicable taxes, per incident at any nuclear reactor in the U.S. or at certain nuclear generation facilities in Europe, regardless of fault or proximity to the incident, payable at a rate not to exceed $152 million ($76 million for FPL) per incident per year. Such assessments, if levied, could materially adversely affect NEE's and FPL's business, financial condition, results of operations and prospects.
NRC orders or new regulations related to increased security measures and any future safety requirements promulgated by the NRC could require NEE and FPL to incur substantial operating and capital expenditures at their nuclear generation facilities.
The NRC has broad authority to impose licensing and safety-related requirements for the operation and maintenance of nuclear generation facilities, the addition of capacity at existing nuclear generation facilities and the construction of nuclear generation facilities, and these requirements are subject to change. In the event of non-compliance, the NRC has the authority to impose fines or shut down a nuclear generation facility, or to take both of these actions, depending upon its assessment of the severity of the situation, until compliance is achieved. Any of the foregoing events could require NEE and FPL to incur increased costs and capital expenditures, and could reduce revenues.
Any serious nuclear incident occurring at a NEE or FPL plant could result in substantial remediation costs and other expenses. A major incident at a nuclear facility anywhere in the world could cause the NRC to limit or prohibit the operation or licensing of any domestic nuclear generation facility. An incident at a nuclear facility anywhere in the world also could cause the NRC to impose additional conditions or other requirements on the industry, or on certain types of nuclear generation units, which could increase costs, reduce revenues and result in additional capital expenditures.
The inability to operate any of NEER's or FPL's nuclear generation units through the end of their respective operating licenses could have a material adverse effect on NEE's and FPL's business, financial condition, results of operations and prospects.
The operating licenses for NEE's and FPL's nuclear generation facilities extend through at least 2030. If the facilities cannot be operated for any reason through the life of those operating licenses, NEE or FPL may be required to increase depreciation rates, incur impairment charges and accelerate future decommissioning expenditures, any of which could materially adversely affect their business, financial condition, results of operations and prospects.
Various hazards posed to nuclear generation facilities, along with increased public attention to and awareness of such hazards, could result in increased nuclear licensing or compliance costs which are difficult or impossible to predict and could have a material adverse effect on NEE's and FPL's business, financial condition, results of operations and prospects.
The threat of terrorist activity, as well as recent international events implicating the safety of nuclear facilities, could result in more stringent or complex measures to keep facilities safe from a variety of hazards, including, but not limited to, natural disasters such as earthquakes and tsunamis, as well as terrorist or other criminal threats. This increased focus on safety could result in higher compliance costs which, at present, cannot be assessed with any measure of certainty and which could have a material adverse effect on NEE's and FPL's business, financial condition, results of operations and prospects.
34
NEE's and FPL's nuclear units are periodically removed from service to accommodate normal refueling and maintenance outages, and for other purposes. If planned outages last longer than anticipated or if there are unplanned outages, NEE's and FPL's results of operations and financial condition could be materially adversely affected.
NEE's and FPL's nuclear units are periodically removed from service to accommodate normal refueling and maintenance outages, including, but not limited to, inspections, repairs and certain other modifications. In addition, outages may be scheduled, often in connection with a refueling outage, to replace equipment, to increase the generation capacity at a particular nuclear unit, or for other purposes, and those planned activities increase the time the unit is not in operation. In the event that a scheduled outage lasts longer than anticipated or in the event of an unplanned outage due to, for example, equipment failure, such outages could materially adversely affect NEE's or FPL's business, financial condition, results of operations and prospects.
Liquidity, Capital Requirements and Common Stock Risks
Disruptions, uncertainty or volatility in the credit and capital markets may negatively affect NEE's and FPL's ability to fund their liquidity and capital needs and to meet their growth objectives, and can also materially adversely affect the results of operations and financial condition of NEE and FPL.
NEE and FPL rely on access to capital and credit markets as significant sources of liquidity for capital requirements and other operations requirements that are not satisfied by operating cash flows. Disruptions, uncertainty or volatility in those capital and credit markets, including, but not limited to, the conditions of the most recent financial crises in the U.S. and abroad, could increase NEE's and FPL's cost of capital. If NEE or FPL is unable to access regularly the capital and credit markets on terms that are reasonable, it may have to delay raising capital, issue shorter-term securities and incur an unfavorable cost of capital, which, in turn, could adversely affect its ability to grow its business, could contribute to lower earnings and reduced financial flexibility, and could have a material adverse effect on its business, financial condition, results of operations and prospects.
Although NEE's competitive energy subsidiaries have used non-recourse or limited-recourse, project-specific financing in the past, market conditions and other factors could adversely affect
the future availability of such financing. The inability of NEE's subsidiaries to access the capital and credit markets to provide project-specific financing for electric-generating and other facilities on favorable terms, whether because of disruptions or volatility in those markets or otherwise, could necessitate additional capital raising or borrowings by NEE and/or NEECH in the future.
The inability of subsidiaries that have existing project-specific financing arrangements to meet the requirements of various agreements relating to those financings could give rise to a project-specific financing default which, if not cured or waived, might result in the specific project, and potentially in some limited instances its parent companies, being required to repay the associated debt or other borrowings earlier than otherwise anticipated, and if such repayment were not made, the lenders or security holders would generally have rights to foreclose against the project assets and related collateral. Such an occurrence also could result in NEE expending additional funds or incurring additional obligations over the shorter term to ensure continuing compliance with project-specific financing arrangements based upon the expectation of improvement in the project's performance or financial returns over the longer term. Any of these actions could materially adversely affect NEE's business, financial condition, results of operations and prospects, as well as the availability or terms of future financings for NEE or its subsidiaries.
NEE's, NEECH's and FPL's inability to maintain their current credit ratings may materially adversely affect NEE's and FPL's liquidity and results of operations, limit the ability of NEE and FPL to grow their business, and increase interest costs.
The inability of NEE, NEECH and FPL to maintain their current credit ratings could materially adversely affect their ability to raise capital or obtain credit on favorable terms, which, in turn, could impact NEE's and FPL's ability to grow their business and service indebtedness and repay borrowings, and would likely increase their interest costs. Some of the factors that can affect credit ratings are cash flows, liquidity, the amount of debt as a component of total capitalization, and political, legislative and regulatory actions. There can be no assurance that one or more of the ratings of NEE, NEECH and FPL will not be lowered or withdrawn entirely by a rating agency.
NEE's and FPL's liquidity may be impaired if their credit providers are unable to fund their credit commitments to the companies or to maintain their current credit ratings.
The inability of NEE's, NEECH's and FPL's credit providers to fund their credit commitments or to maintain their current credit ratings could require NEE, NEECH or FPL, among other things, to renegotiate requirements in agreements, find an alternative credit provider with acceptable credit ratings to meet funding requirements, or post cash collateral and could have a material adverse effect on NEE's and FPL's liquidity.
Poor market performance and other economic factors could affect NEE's defined benefit pension plan's funded status, which may materially adversely affect NEE's and FPL's business, financial condition, liquidity and results of operations and prospects.
35
NEE sponsors a qualified noncontributory defined benefit pension plan for substantially all employees of NEE and its subsidiaries. A decline in the market value of the assets held in the defined benefit pension plan due to poor investment performance or other factors may increase the funding requirements for this obligation.
NEE's defined benefit pension plan is sensitive to changes in interest rates, since, as interest rates decrease the funding liabilities increase, potentially increasing benefits costs and funding requirements. Any increase in benefits costs or funding requirements may have a material adverse effect on NEE's and FPL's business, financial condition, liquidity, results of operations and prospects.
Poor market performance and other economic factors could adversely affect the asset values of NEE's and FPL's nuclear decommissioning funds, which may materially adversely affect NEE's and FPL's liquidity and results of operations.
NEE and FPL are required to maintain decommissioning funds to satisfy their future obligations to decommission their nuclear power plants. A decline in the market value of the assets held in the decommissioning funds due to poor investment performance or other factors may increase the funding requirements for these obligations. Any increase in funding requirements may have a material adverse effect on NEE's and FPL's business, financial condition, results of operations and prospects.
Certain of NEE's investments are subject to changes in market value and other risks, which may materially adversely affect NEE's liquidity, financial results and results of operations.
NEE holds other investments where changes in the fair value affect NEE's financial results. In some cases there may be no observable market values for these investments, requiring fair value estimates to be based on other valuation techniques. This type of analysis requires significant judgment and the actual values realized in a sale of these investments could differ materially from those estimated. A sale of an investment below previously estimated value, or other decline in the fair value of an investment, could result in losses or the write-off of such investment, and may have a material adverse effect on NEE's liquidity, financial condition and results of operations.
NEE may be unable to meet its ongoing and future financial obligations and to pay dividends on its common stock if its subsidiaries are unable to pay upstream dividends or repay funds to NEE.
NEE is a holding company and, as such, has no material operations of its own. Substantially all of NEE's consolidated assets are held by its subsidiaries. NEE's ability to meet its financial obligations, including, but not limited to, its guarantees, and to pay dividends on its common stock is primarily dependent on its subsidiaries' net income and cash flows, which are subject to the risks of their respective businesses, and their ability to pay upstream dividends or to repay funds to NEE.
NEE's subsidiaries are separate legal entities and have no independent obligation to provide NEE with funds for its payment obligations. The subsidiaries have financial obligations, including, but not limited to, payment of debt service, which they must satisfy before they can provide NEE with funds. In addition, in the event of a subsidiary's liquidation or reorganization, NEE's right to participate in a distribution of assets is subject to the prior claims of the subsidiary's creditors.
The dividend-paying ability of some of the subsidiaries is limited by contractual restrictions which are contained in outstanding financing agreements and which may be included in future financing agreements. The future enactment of laws or regulations also may prohibit or restrict the ability of NEE's subsidiaries to pay upstream dividends or to repay funds.
NEE may be unable to meet its ongoing and future financial obligations and to pay dividends on its common stock if NEE is required to perform under guarantees of obligations of its subsidiaries.
NEE guarantees many of the obligations of its consolidated subsidiaries, other than FPL, through guarantee agreements with NEECH. These guarantees may require NEE to provide substantial funds to its subsidiaries or their creditors or counterparties at a time when NEE is in need of liquidity to meet its own financial obligations. Funding such guarantees may materially adversely affect NEE's ability to meet its financial obligations or to pay dividends.
Disruptions, uncertainty or volatility in the credit and capital markets may exert downward pressure on the market price of NEE's common stock.
The market price and trading volume of NEE's common stock are subject to fluctuations as a result of, among other factors, general credit and capital market conditions and changes in market sentiment regarding the operations, business and financing strategies of NEE and its subsidiaries. As a result, disruptions, uncertainty or volatility in the credit and capital markets may, for example, have a material adverse effect on the market price of NEE's common stock.
None
36
NEE and its subsidiaries maintain properties which are adequate for their operations; the principal properties are described below.
Generating Facilities
FPL
At
December 31, 2014
, the electric generating, transmission, distribution and general facilities of FPL represented approximately
51%
,
11%
,
33%
and
5%
, respectively, of FPL's gross investment in electric utility plant in service and other property. At
December 31, 2014
, FPL had the following generating facilities:
|
FPL Facilities
|
Location
|
No.
of Units
|
Fuel
|
Net
Capability
(MW)
(a)
|
||||||
|
Fossil
|
||||||||||
|
Combined-cycle
|
||||||||||
|
Cape Canaveral
|
Cocoa, FL
|
1
|
Gas/Oil
|
1,210
|
|
|||||
|
Fort Myers
|
Fort Myers, FL
|
1
|
Gas
|
1,436
|
|
|||||
|
Lauderdale
|
Dania, FL
|
2
|
Gas/Oil
|
884
|
|
|||||
|
Manatee
|
Parrish, FL
|
1
|
Gas
|
1,143
|
|
|||||
|
Martin
|
Indiantown, FL
|
1
|
Gas/Oil/Solar Thermal
|
1,135
|
|
(b)
|
||||
|
Martin
|
Indiantown, FL
|
2
|
Gas
|
938
|
|
|||||
|
Riviera
|
Riviera Beach, FL
|
1
|
Gas/Oil
|
1,212
|
|
|||||
|
Sanford
|
Lake Monroe, FL
|
2
|
Gas
|
2,010
|
|
|||||
|
Turkey Point
|
Florida City, FL
|
1
|
Gas/Oil
|
1,192
|
|
|||||
|
West County
|
West Palm Beach, FL
|
3
|
Gas/Oil
|
3,657
|
|
|||||
|
Steam turbines
|
||||||||||
|
Manatee
|
Parrish, FL
|
2
|
Gas/Oil
|
1,618
|
|
|||||
|
Martin
|
Indiantown, FL
|
2
|
Gas/Oil
|
1,649
|
|
|||||
|
St. Johns River Power Park
|
Jacksonville, FL
|
2
|
Coal/Petroleum Coke
|
254
|
|
(c)
|
||||
|
Scherer
|
Monroe County, GA
|
1
|
Coal
|
643
|
|
(d)
|
||||
|
Turkey Point
|
Florida City, FL
|
1
|
Gas/Oil
|
396
|
|
|||||
|
Simple-cycle combustion turbines
|
||||||||||
|
Fort Myers
|
Fort Myers, FL
|
2
|
Gas/Oil
|
319
|
|
|||||
|
Gas turbines
|
||||||||||
|
Fort Myers
|
Fort Myers, FL
|
12
|
Oil
|
648
|
|
|||||
|
Lauderdale
|
Dania, FL
|
24
|
Gas/Oil
|
840
|
|
|||||
|
Port Everglades
|
Port Everglades, FL
|
12
|
Gas/Oil
|
420
|
|
|||||
|
Nuclear
|
||||||||||
|
St. Lucie
|
Hutchinson Island, FL
|
2
|
Nuclear
|
1,821
|
|
(e)
|
||||
|
Turkey Point
|
Florida City, FL
|
2
|
Nuclear
|
1,632
|
|
|||||
|
Solar PV
|
||||||||||
|
DeSoto
|
Arcadia, FL
|
1
|
Solar PV
|
25
|
|
|||||
|
Space Coast
|
Cocoa, FL
|
1
|
Solar PV
|
10
|
|
|||||
|
TOTAL
|
25,092
|
|
(f)
|
|||||||
______________________
|
(a)
|
Represents FPL's net ownership interest in warm weather peaking capability.
|
|
(b)
|
The megawatts generated by the 75 MW solar thermal hybrid facility replace steam produced by this unit and therefore are not incremental.
|
|
(c)
|
Represents FPL's 20% ownership interest in each of SJRPP Units Nos. 1 and 2, which are jointly owned with JEA.
|
|
(d)
|
Represents FPL's approximately 76% ownership of Scherer Unit No. 4, which is jointly owned with JEA.
|
|
(e)
|
Excludes Orlando Utilities Commission's and the Florida Municipal Power Agency's combined share of approximately 15% of St. Lucie Unit No. 2.
|
|
(f)
|
Substantially all of FPL's properties are subject to the lien of FPL's mortgage.
|
37
NEER
At
December 31, 2014
, NEER had the following generating facilities:
|
NEER Facilities
|
Location
|
Geographic
Region
|
No.
of Units
|
Fuel
|
Net
Capability
(MW)
(a)
|
|||||||
|
Wind
|
||||||||||||
|
Adelaide Wind
(b)
|
Middlesex County, Ontario, Canada
|
Canada
|
37
|
|
Wind
|
60
|
||||||
|
Ashtabula Wind
(b)(c)
|
Barnes County, ND
|
Midwest
|
99
|
|
Wind
|
148
|
||||||
|
Ashtabula Wind II
(c)(d)
|
Griggs & Steele Counties, ND
|
Midwest
|
80
|
|
Wind
|
120
|
||||||
|
Ashtabula Wind III
|
Barnes County, ND
|
Midwest
|
39
|
|
Wind
|
62
|
||||||
|
Baldwin Wind
(b)
|
Burleigh County, ND
|
Midwest
|
64
|
|
Wind
|
102
|
||||||
|
Blackwell Wind
(c)(d)
|
Kay County, OK
|
Other South
|
26
|
|
Wind
|
60
|
||||||
|
Blue Summit
(c)(d)
|
Wilbarger County, TX
|
Texas
|
85
|
|
Wind
|
135
|
||||||
|
Bluewater Wind
(b)(e)
|
Huron County, Ontario, Canada
|
Canada
|
37
|
|
Wind
|
60
|
||||||
|
Bornish Wind
(b)
|
Middlesex County, Ontario, Canada
|
Canada
|
45
|
|
Wind
|
73
|
||||||
|
Buffalo Ridge
|
Lincoln County, MN
|
Midwest
|
73
|
|
Wind
|
26
|
||||||
|
Butler Ridge Wind
(b)(c)
|
Dodge County, WI
|
Midwest
|
36
|
|
Wind
|
54
|
||||||
|
Cabazon
(b)
|
Riverside County, CA
|
West
|
52
|
|
Wind
|
39
|
||||||
|
Callahan Divide
(b)
|
Taylor County, TX
|
Texas
|
76
|
|
Wind
|
114
|
||||||
|
Capricorn Ridge
(c)
|
Sterling & Coke Counties, TX
|
Texas
|
208
|
|
Wind
|
364
|
||||||
|
Capricorn Ridge Expansion
(c)
|
Sterling & Coke Counties, TX
|
Texas
|
199
|
|
Wind
|
298
|
||||||
|
Cerro Gordo
(b)
|
Cerro Gordo County, IA
|
Midwest
|
55
|
|
Wind
|
41
|
||||||
|
Cimarron
(b)
|
Gray County, KS
|
Other South
|
72
|
|
Wind
|
166
|
||||||
|
Conestogo Wind
(b)(e)
|
Wellington County, Ontario, Canada
|
Canada
|
10
|
|
Wind
|
23
|
||||||
|
Crystal Lake I
(b)(c)
|
Hancock County, IA
|
Midwest
|
100
|
|
Wind
|
150
|
||||||
|
Crystal Lake II
|
Winnebago County, IA
|
Midwest
|
80
|
|
Wind
|
200
|
||||||
|
Crystal Lake III
|
Winnebago County, IA
|
Midwest
|
44
|
|
Wind
|
66
|
||||||
|
Day County Wind
(b)
|
Day County, SD
|
Midwest
|
66
|
|
Wind
|
99
|
||||||
|
Diablo Wind
(b)
|
Alameda County, CA
|
West
|
31
|
|
Wind
|
20
|
||||||
|
Elk City Wind
(b)(e)
|
Roger Mills & Beckham Counties, OK
|
Other South
|
43
|
|
Wind
|
99
|
||||||
|
Elk City Wind II
|
Roger Mills & Beckham Counties, OK
|
Other South
|
66
|
|
Wind
|
101
|
||||||
|
Endeavor Wind
|
Osceola County, IA
|
Midwest
|
40
|
|
Wind
|
100
|
||||||
|
Endeavor Wind II
|
Osceola County, IA
|
Midwest
|
20
|
|
Wind
|
50
|
||||||
|
Ensign Wind
|
Gray County, KS
|
Other South
|
43
|
|
Wind
|
99
|
||||||
|
Ghost Pine Wind
|
Kneehill County, Alberta, Canada
|
Canada
|
51
|
|
Wind
|
82
|
||||||
|
Gray County
|
Gray County, KS
|
Other South
|
170
|
|
Wind
|
112
|
||||||
|
Green Mountain
(b)
|
Somerset County, PA
|
Northeast
|
8
|
|
Wind
|
10
|
||||||
|
Green Power
|
Riverside County, CA
|
West
|
22
|
|
Wind
|
17
|
||||||
|
Green Ridge Power
|
Alameda & Contra Costa Counties, CA
|
West
|
803
|
|
Wind
|
87
|
||||||
|
Hancock County
(b)
|
Hancock County, IA
|
Midwest
|
148
|
|
Wind
|
98
|
||||||
|
High Winds
(b)
|
Solano County, CA
|
West
|
90
|
|
Wind
|
162
|
||||||
|
Horse Hollow Wind
(b)
|
Taylor County, TX
|
Texas
|
142
|
|
Wind
|
213
|
||||||
|
Horse Hollow Wind II
(b)
|
Taylor & Nolan Counties, TX
|
Texas
|
130
|
|
Wind
|
299
|
||||||
|
Horse Hollow Wind III
(b)
|
Nolan County, TX
|
Texas
|
149
|
|
Wind
|
224
|
||||||
|
Indian Mesa
|
Pecos County, TX
|
Texas
|
125
|
|
Wind
|
83
|
||||||
|
Jericho Wind
|
Lambton & Middlesex Counties, Ontario, Canada
|
Canada
|
91
|
|
Wind
|
147
|
||||||
|
King Mountain
(b)
|
Upton County, TX
|
Texas
|
214
|
|
Wind
|
278
|
||||||
|
Lake Benton II
(b)
|
Pipestone County, MN
|
Midwest
|
137
|
|
Wind
|
103
|
||||||
|
Langdon Wind
(b)(c)
|
Cavalier County, ND
|
Midwest
|
79
|
|
Wind
|
118
|
||||||
|
Langdon Wind II
(b)(c)
|
Cavalier County, ND
|
Midwest
|
27
|
|
Wind
|
41
|
||||||
|
Lee / DeKalb Wind
|
Lee & DeKalb Counties, IL
|
Midwest
|
145
|
|
Wind
|
217
|
||||||
|
Limon I
(c)(d)
|
Lincoln, Elbert & Arapahoe Counties, CO
|
West
|
125
|
|
Wind
|
200
|
||||||
|
Limon II
(c)(d)
|
Lincoln, Elbert & Arapahoe Counties, CO
|
West
|
125
|
|
Wind
|
200
|
||||||
|
Limon III
(c)(d)
|
Lincoln County, CO
|
West
|
117
|
|
Wind
|
201
|
||||||
|
Logan Wind
(c)
|
Logan County, CO
|
West
|
134
|
|
Wind
|
201
|
||||||
|
Majestic Wind
(b)(c)
|
Carson County, TX
|
Texas
|
53
|
|
Wind
|
79
|
||||||
|
Majestic Wind II
(c)
|
Carson & Potter Counties, TX
|
Texas
|
51
|
|
Wind
|
80
|
||||||
|
Mammoth Plains Wind
(c)
|
Dewey & Blaine Counties, OK
|
Other South
|
117
|
|
Wind
|
199
|
||||||
|
Meyersdale
(b)
|
Somerset County, PA
|
Northeast
|
20
|
|
Wind
|
30
|
||||||
|
Mill Run
(b)
|
Fayette County, PA
|
Northeast
|
10
|
|
Wind
|
15
|
||||||
|
Minco Wind
(b)
|
Grady County, OK
|
Other South
|
62
|
|
Wind
|
99
|
||||||
|
Minco Wind II
(b)
|
Grady & Caddo Counties, OK
|
Other South
|
63
|
|
Wind
|
101
|
||||||
38
|
NEER Facilities
|
Location
|
Geographic
Region
|
No.
of Units
|
Fuel
|
Net
Capability
(MW)
(a)
|
|||||||
|
Minco Wind III
(c)(d)
|
Grady, Caddo & Canadian Counties, OK
|
Other South
|
63
|
|
Wind
|
101
|
||||||
|
Mojave 3/4/5
|
Kern County, CA
|
West
|
246
|
|
Wind
|
41
|
||||||
|
Montezuma Wind
(b)
|
Solano County, CA
|
West
|
16
|
|
Wind
|
37
|
||||||
|
Montezuma Wind II
(c)(d)
|
Solano County, CA
|
West
|
34
|
|
Wind
|
78
|
||||||
|
Mount Copper
(b)
|
Gaspésie, Quebec, Canada
|
Canada
|
30
|
|
Wind
|
52
|
||||||
|
Mount Miller
(b)
|
Gaspésie, Quebec, Canada
|
Canada
|
30
|
|
Wind
|
52
|
||||||
|
Mountaineer Wind
(b)
|
Preston & Tucker Counties, WV
|
Northeast
|
44
|
|
Wind
|
66
|
||||||
|
Mower County Wind
(c)
|
Mower County, MN
|
Midwest
|
43
|
|
Wind
|
99
|
||||||
|
New Mexico Wind
(b)
|
Quay & Debaca Counties, NM
|
West
|
136
|
|
Wind
|
204
|
||||||
|
North Dakota Wind
(b)
|
LaMoure County, ND
|
Midwest
|
41
|
|
Wind
|
62
|
||||||
|
North Sky River
(b)
|
Kern County, CA
|
West
|
100
|
|
Wind
|
162
|
||||||
|
Northern Colorado
(b)(e)
|
Logan County, CO
|
West
|
81
|
|
Wind
|
174
|
||||||
|
Oklahoma / Sooner Wind
(b)
|
Harper & Woodward Counties, OK
|
Other South
|
68
|
|
Wind
|
102
|
||||||
|
Oliver County Wind I
(c)
|
Oliver County, ND
|
Midwest
|
22
|
|
Wind
|
51
|
||||||
|
Oliver County Wind II
(c)
|
Oliver County, ND
|
Midwest
|
32
|
|
Wind
|
48
|
||||||
|
Palo Duro Wind
(c)(f)
|
Hansford & Ochiltree Counties, TX
|
Texas
|
147
|
|
Wind
|
250
|
||||||
|
Peetz Table Wind
(c)
|
Logan County, CO
|
West
|
133
|
|
Wind
|
199
|
||||||
|
Perrin Ranch Wind
(b)(e)
|
Coconino County, AZ
|
West
|
62
|
|
Wind
|
99
|
||||||
|
Pheasant Run I
(b)
|
Huron County, MI
|
Midwest
|
44
|
|
Wind
|
75
|
||||||
|
Pubnico Point
(b)
|
Yarmouth County, Nova Scotia, Canada
|
Canada
|
17
|
|
Wind
|
31
|
||||||
|
Red Canyon Wind
(b)
|
Borden, Garza & Scurry Counties, TX
|
Texas
|
56
|
|
Wind
|
84
|
||||||
|
Red Mesa Wind
|
Cibola County, NM
|
West
|
64
|
|
Wind
|
102
|
||||||
|
Seiling Wind
(c)
|
Dewey County, OK
|
Other South
|
117
|
|
Wind
|
199
|
||||||
|
Seiling Wind II
(c)
|
Dewey & Woodward Counties, OK
|
Other South
|
59
|
|
Wind
|
100
|
||||||
|
Sky River
(b)
|
Kern County, CA
|
West
|
322
|
|
Wind
|
73
|
||||||
|
Somerset Wind Power
(b)
|
Somerset County, PA
|
Northeast
|
6
|
|
Wind
|
9
|
||||||
|
South Dakota Wind
(b)
|
Hyde County, SD
|
Midwest
|
27
|
|
Wind
|
41
|
||||||
|
Southwest Mesa
(b)
|
Upton & Crockett Counties, TX
|
Texas
|
106
|
|
Wind
|
74
|
||||||
|
Stateline
(b)
|
Umatilla County, OR and Walla Walla County, WA
|
West
|
454
|
|
Wind
|
300
|
||||||
|
Steele Flats
(c)(d)
|
Jefferson & Gage Counties, NE
|
Other South
|
44
|
|
Wind
|
75
|
||||||
|
Story County Wind
(b)(c)
|
Story County, IA
|
Midwest
|
100
|
|
Wind
|
150
|
||||||
|
Story County Wind II
(b)
|
Story & Hardin Counties, IA
|
Midwest
|
100
|
|
Wind
|
150
|
||||||
|
Summerhaven
(b)(e)
|
Haldimand County, Ontario, Canada
|
Canada
|
56
|
|
Wind
|
124
|
||||||
|
Tuscola Bay
(b)(e)
|
Tuscola, Bay & Saginaw Counties, MI
|
Midwest
|
75
|
|
Wind
|
120
|
||||||
|
Tuscola II
|
Tuscola & Bay Counties, MI
|
Midwest
|
59
|
|
Wind
|
100
|
||||||
|
Vansycle
(b)
|
Umatilla County, OR
|
West
|
38
|
|
Wind
|
25
|
||||||
|
Vansycle II
|
Umatilla County, OR
|
West
|
43
|
|
Wind
|
99
|
||||||
|
Vasco Winds
(c)(d)
|
Contra Costa County, CA
|
West
|
33
|
|
Wind
|
78
|
||||||
|
Waymart
(b)
|
Wayne County, PA
|
Northeast
|
43
|
|
Wind
|
65
|
||||||
|
Weatherford Wind
(b)
|
Custer & Washita Counties, OK
|
Other South
|
98
|
|
Wind
|
147
|
||||||
|
Wessington Springs Wind
(b)(c)
|
Jerauld County, SD
|
Midwest
|
34
|
|
Wind
|
51
|
||||||
|
White Oak
(c)(d)
|
McLean County, IL
|
Midwest
|
100
|
|
Wind
|
150
|
||||||
|
Wilton Wind
(b)
|
Burleigh County, ND
|
Midwest
|
33
|
|
Wind
|
49
|
||||||
|
Wilton Wind II
(c)(d)
|
Burleigh County, ND
|
Midwest
|
33
|
|
Wind
|
50
|
||||||
|
Windpower Partners 1990
|
Alameda & Contra Costa Counties, CA
|
West
|
141
|
|
Wind
|
14
|
||||||
|
Windpower Partners 1991
|
Alameda & Contra Costa Counties, CA
|
West
|
162
|
|
Wind
|
16
|
||||||
|
Windpower Partners 1991-92
|
Alameda & Contra Costa Counties, CA
|
West
|
223
|
|
Wind
|
22
|
||||||
|
Windpower Partners 1992
|
Alameda & Contra Costa Counties, CA
|
West
|
300
|
|
Wind
|
30
|
||||||
|
Windpower Partners 1993
(c)(d)
|
Riverside County, CA
|
West
|
33
|
|
Wind
|
50
|
||||||
|
Wolf Ridge Wind
(c)(d)
|
Cooke County, TX
|
Texas
|
75
|
|
Wind
|
112
|
||||||
|
Woodward Mountain
|
Upton & Pecos Counties, TX
|
Texas
|
242
|
|
Wind
|
160
|
||||||
|
Total Wind
|
11,427
|
|||||||||||
|
Contracted
|
||||||||||||
|
Bayswater
(b)
|
Far Rockaway, NY
|
Northeast
|
2
|
|
Gas
|
56
|
||||||
|
Duane Arnold
|
Palo, IA
|
Midwest
|
1
|
|
Nuclear
|
431
|
(g)
|
|||||
|
Genesis
(b)(e)
|
Riverside County, CA
|
West
|
2
|
|
Solar Thermal
|
250
|
||||||
|
Hatch Solar
|
Hatch, NM
|
West
|
1
|
|
Solar CPV
|
5
|
||||||
|
Jamaica Bay
(b)
|
Far Rockaway, NY
|
Northeast
|
2
|
|
Gas/Oil
|
54
|
||||||
|
Marcus Hook 750
(b)
|
Marcus Hook, PA
|
Northeast
|
4
|
|
Gas
|
744
|
||||||
|
Moore Solar
(b)(e)
|
Lambton County, Ontario, Canada
|
Canada
|
1
|
|
Solar PV
|
20
|
||||||
|
Mountain View Solar
(b)
|
Clark County, NV
|
West
|
1
|
|
Solar PV
|
20
|
||||||
39
|
NEER Facilities
|
Location
|
Geographic
Region
|
No.
of Units
|
Fuel
|
Net
Capability
(MW)
(a)
|
|||||||
|
Planta Termosolar I & II
(b)
|
Madrigalejo, Spain
|
Other
|
2
|
|
Solar Thermal
|
100
|
||||||
|
Point Beach
|
Two Rivers, WI
|
Midwest
|
2
|
|
Nuclear
|
1,190
|
||||||
|
Sombra Solar
(b)(e)
|
Lambton County, Ontario, Canada
|
Canada
|
1
|
|
Solar PV
|
20
|
||||||
|
Investments in joint ventures:
|
||||||||||||
|
Desert Sunlight
(b)
|
Riverside County, CA
|
West
|
2
|
|
Solar PV
|
275
|
||||||
|
SEGS III-IX
(b)
|
Kramer Junction & Harper Lake, CA
|
West
|
7
|
|
Solar Thermal
|
147
|
||||||
|
Bellingham
|
Bellingham, MA
|
Northeast
|
3
|
|
Gas
|
150
|
||||||
|
Total Contracted
|
3,462
|
|||||||||||
|
Merchant
|
||||||||||||
|
Forney
(b)
|
Forney, TX
|
Texas
|
8
|
|
Gas
|
1,792
|
||||||
|
Lamar Power Partners
(b)
|
Paris, TX
|
Texas
|
6
|
|
Gas
|
1,000
|
||||||
|
Maine - Cape, Wyman
|
Various - ME
|
Northeast
|
6
|
|
Oil
|
796
|
(h)
|
|||||
|
Marcus Hook 50
|
Marcus Hook, PA
|
Northeast
|
1
|
|
Gas
|
50
|
||||||
|
Paradise Solar
|
West Deptford, NJ
|
Northeast
|
1
|
|
Solar PV
|
5
|
||||||
|
Seabrook
|
Seabrook, NH
|
Northeast
|
1
|
|
Nuclear
|
1,100
|
(i)
|
|||||
|
Investment in joint venture - Sayreville
|
Sayreville, NJ
|
Northeast
|
3
|
|
Gas
|
145
|
||||||
|
Total Merchant
|
4,888
|
|||||||||||
|
Total Generating Capability
|
19,777
|
|||||||||||
|
Less noncontrolling interest
|
(199)
|
|||||||||||
|
Total Net Generating Capability
|
19,578
|
|||||||||||
______________________
|
(a)
|
Represents NEER's net ownership interest in plant capacity.
|
|
(b)
|
These generating facilities are encumbered by liens against their assets securing various financings.
|
|
(c)
|
NEER owns these wind facilities together with third-party investors with differential membership interests. See Note 1 - Sale of Differential Membership Interests.
|
|
(d)
|
Various financings are secured by the pledge of NEER's membership interests in the entities owning these wind facilities.
|
|
(e)
|
These generating facilities are part of the NEP portfolio and subject to a 20.1% noncontrolling interest.
|
|
(f)
|
This facility became part of the NEP portfolio in January 2015 and is subject to a 20.1% noncontrolling interest.
|
|
(g)
|
Excludes Central Iowa Power Cooperative and Corn Belt Power Cooperative's combined share of 30%.
|
|
(h)
|
Excludes six other energy-related partners' combined share of 16%.
|
|
(i)
|
Excludes Massachusetts Municipal Wholesale Electric Company's, Taunton Municipal Lighting Plant's and Hudson Light & Power Department's combined share of 11.77%.
|
Transmission and Distribution
At
December 31, 2014
, FPL owned and operated 596 substations and the following electric transmission and distribution lines:
|
Nominal
Voltage
|
Overhead Lines
Circuit/Pole Miles
|
Trench and
Submarine
Cables Miles
|
|||||
|
500
|
kV
|
1,106
|
|
(a)
|
—
|
|
|
|
230
|
kV
|
3,188
|
|
25
|
|
||
|
138
|
kV
|
1,580
|
|
52
|
|
||
|
115
|
kV
|
758
|
|
—
|
|
||
|
69
|
kV
|
164
|
|
14
|
|
||
|
Total circuit miles
|
6,796
|
|
91
|
|
|||
|
Less than 69 kV (pole miles)
|
42,321
|
|
25,411
|
|
|||
______________________
(a) Includes approximately 75 miles owned jointly with JEA.
At
December 31, 2014
, NEER owned and operated 171 substations and approximately 993 circuit miles of transmission lines ranging from 69 kV to 345 kV and NEET owned and operated 6 substations and approximately 624 circuit miles of 345 kV transmission lines.
Character of Ownership
Substantially all of FPL's properties are subject to the lien of FPL's mortgage, which secures most debt securities issued by FPL. The majority of FPL's real property is held in fee and is free from other encumbrances, subject to minor exceptions which are not of a nature as to substantially impair the usefulness to FPL of such properties. Some of FPL's electric lines are located on parcels of land which are not owned in fee by FPL but are covered by necessary consents of governmental authorities or rights obtained from owners of private property. The majority of NEER's generating facilities and transmission assets are owned by NEER
40
subsidiaries and a number of those facilities are encumbered by liens securing various financings. Additionally, the majority of NEER's generating facilities and transmission lines are located on land leased or under easement from owners of private property. The majority of NEET’s transmission assets are encumbered by liens securing financings and the majority of its transmission lines are located on land leased or under easement from owners of private property. See Generating Facilities and Note 1 - Electric Plant, Depreciation and Amortization.
NEE and FPL are parties to various legal and regulatory proceedings in the ordinary course of their respective businesses. For information regarding legal proceedings that could have a material adverse effect on NEE or FPL, see Note 13 - Legal Proceedings. Such descriptions are incorporated herein by reference.
Not applicable
Common Stock Data.
All of FPL's common stock is owned by NEE. NEE's common stock is traded on the New York Stock Exchange under the symbol "NEE." The high and low sales prices for the common stock of NEE as reported in the consolidated transaction reporting system of the New York Stock Exchange and the cash dividends per share declared for each quarter during the past two years are as follows:
|
2014
|
2013
|
|||||||||||||||||||||||
|
Quarter
|
High
|
Low
|
Cash
Dividends
|
High
|
Low
|
Cash
Dividends
|
||||||||||||||||||
|
First
|
$
|
96.13
|
|
$
|
83.97
|
|
$
|
0.725
|
|
$
|
77.79
|
|
$
|
69.81
|
|
$
|
0.66
|
|
||||||
|
Second
|
$
|
102.51
|
|
$
|
93.28
|
|
$
|
0.725
|
|
$
|
82.65
|
|
$
|
74.78
|
|
$
|
0.66
|
|
||||||
|
Third
|
$
|
102.46
|
|
$
|
91.79
|
|
$
|
0.725
|
|
$
|
88.39
|
|
$
|
78.81
|
|
$
|
0.66
|
|
||||||
|
Fourth
|
$
|
110.84
|
|
$
|
90.33
|
|
$
|
0.725
|
|
$
|
89.75
|
|
$
|
78.97
|
|
$
|
0.66
|
|
||||||
The amount and timing of dividends payable on NEE's common stock are within the sole discretion of NEE's Board of Directors. The Board of Directors reviews the dividend rate at least annually (generally in February) to determine its appropriateness in light of NEE's financial position and results of operations, legislative and regulatory developments affecting the electric utility industry in general and FPL in particular, competitive conditions, change in business mix and any other factors the Board of Directors deems relevant. The ability of NEE to pay dividends on its common stock is dependent upon, among other things, dividends paid to it by its subsidiaries. There are no restrictions in effect that currently limit FPL's ability to pay dividends to NEE. In February 2015, NEE announced that it would increase its quarterly dividend on its common stock from $0.725 per share to $0.77 per share. See Management's Discussion - Liquidity and Capital Resources - Covenants with respect to dividend restrictions and Note 10 - Common Stock Dividend Restrictions regarding dividends paid by FPL to NEE.
As of the close of business on January 31, 2015, there were 22,023 holders of record of NEE's common stock.
Issuer Purchases of Equity Securities.
Information regarding purchases made by NEE of its common stock during the three months ended
December 31, 2014
is as follows:
|
Period
|
Total
Number
of Shares
Purchased
(a)
|
Average
Price Paid
Per Share
|
Total Number of Shares
Purchased as Part of a
Publicly Announced Program
|
Maximum Number of
Shares that May Yet be
Purchased Under the
Program
(b)
|
|||||||
|
10/1/2014 - 10/31/14
|
—
|
|
—
|
|
—
|
13,274,748
|
|||||
|
11/1/2014 - 11/30/14
|
—
|
|
—
|
|
—
|
13,274,748
|
|||||
|
12/1/2014 - 12/31/14
|
462
|
|
$
|
100.76
|
|
—
|
13,274,748
|
||||
|
Total
|
462
|
|
$
|
100.76
|
|
—
|
|
||||
______________________
|
(a)
|
Consists of shares of common stock purchased as a reinvestment of dividends by the trustee of a grantor trust in connection with NEE's obligation under a February 2006 grant under the NextEra Energy, Inc. Amended and Restated Long-Term Incentive Plan (former LTIP) to an executive officer of deferred retirement share awards.
|
|
(b)
|
In February 2005, NEE's Board of Directors authorized common stock repurchases of up to 20 million shares of common stock over an unspecified period, which authorization was most recently reaffirmed and ratified by the Board of Directors in July 2011.
|
41
|
Years Ended December 31,
|
|||||||||||||||||||
|
2014
|
2013
|
2012
|
2011
|
2010
|
|||||||||||||||
|
SELECTED DATA OF NEE (millions, except per share amounts):
|
|||||||||||||||||||
|
Operating revenues
|
$
|
17,021
|
|
$
|
15,136
|
|
$
|
14,256
|
|
$
|
15,341
|
|
$
|
15,317
|
|
||||
|
Income from continuing operations
(a)(b)
|
$
|
2,469
|
|
$
|
1,677
|
|
$
|
1,911
|
|
$
|
1,923
|
|
$
|
1,957
|
|
||||
|
Net income
(b)(c)
|
$
|
2,469
|
|
$
|
1,908
|
|
$
|
1,911
|
|
$
|
1,923
|
|
$
|
1,957
|
|
||||
|
Net income attributable to NEE:
|
|||||||||||||||||||
|
Income from continuing operations
(a)(b)
|
$
|
2,465
|
|
$
|
1,677
|
|
$
|
1,911
|
|
$
|
1,923
|
|
$
|
1,957
|
|
||||
|
Gain from discontinued operations
(a)(c)
|
—
|
|
231
|
|
—
|
|
—
|
|
—
|
|
|||||||||
|
Total
(b)(c)
|
$
|
2,465
|
|
$
|
1,908
|
|
$
|
1,911
|
|
$
|
1,923
|
|
$
|
1,957
|
|
||||
|
Earnings per share attributable to NEE - basic:
|
|||||||||||||||||||
|
Continuing operations
(a)(b)
|
$
|
5.67
|
|
$
|
3.95
|
|
$
|
4.59
|
|
$
|
4.62
|
|
$
|
4.77
|
|
||||
|
Net income
(b)(c)
|
$
|
5.67
|
|
$
|
4.50
|
|
$
|
4.59
|
|
$
|
4.62
|
|
$
|
4.77
|
|
||||
|
Earnings per share attributable to NEE - assuming dilution:
|
|||||||||||||||||||
|
Continuing operations
(a)(b)
|
$
|
5.60
|
|
$
|
3.93
|
|
$
|
4.56
|
|
$
|
4.59
|
|
$
|
4.74
|
|
||||
|
Net income
(b)(c)
|
$
|
5.60
|
|
$
|
4.47
|
|
$
|
4.56
|
|
$
|
4.59
|
|
$
|
4.74
|
|
||||
|
Dividends paid per share of common stock
|
$
|
2.90
|
|
$
|
2.64
|
|
$
|
2.40
|
|
$
|
2.20
|
|
$
|
2.00
|
|
||||
|
Total assets
(d)
|
$
|
74,929
|
|
$
|
69,306
|
|
$
|
64,439
|
|
$
|
57,188
|
|
$
|
52,994
|
|
||||
|
Long-term debt, excluding current maturities
|
$
|
24,367
|
|
$
|
23,969
|
|
$
|
23,177
|
|
$
|
20,810
|
|
$
|
18,013
|
|
||||
|
SELECTED DATA OF FPL (millions):
|
|
||||||||||||||||||
|
Operating revenues
|
$
|
11,421
|
|
$
|
10,445
|
|
$
|
10,114
|
|
$
|
10,613
|
|
$
|
10,485
|
|
||||
|
Net income
|
$
|
1,517
|
|
$
|
1,349
|
|
$
|
1,240
|
|
$
|
1,068
|
|
$
|
945
|
|
||||
|
Total assets
|
$
|
39,307
|
|
$
|
36,488
|
|
$
|
34,853
|
|
$
|
31,816
|
|
$
|
28,698
|
|
||||
|
Long-term debt, excluding current maturities
|
$
|
9,413
|
|
$
|
8,473
|
|
$
|
8,329
|
|
$
|
7,483
|
|
$
|
6,682
|
|
||||
|
Energy sales (kWh)
|
113,196
|
|
107,643
|
|
105,109
|
|
106,662
|
|
107,978
|
|
|||||||||
|
Energy sales:
|
|||||||||||||||||||
|
Residential
|
48.8
|
%
|
50.1
|
%
|
50.8
|
%
|
51.2
|
%
|
52.2
|
%
|
|||||||||
|
Commercial
|
40.4
|
|
42.1
|
|
43.0
|
|
42.2
|
|
41.3
|
|
|||||||||
|
Industrial
|
2.6
|
|
2.7
|
|
2.9
|
|
2.9
|
|
2.9
|
|
|||||||||
|
Interchange power sales
|
2.8
|
|
2.3
|
|
0.7
|
|
0.9
|
|
0.8
|
|
|||||||||
|
Other
(e)
|
5.4
|
|
2.8
|
|
2.6
|
|
2.8
|
|
2.8
|
|
|||||||||
|
Total
|
100.0
|
%
|
100.0
|
%
|
100.0
|
%
|
100.0
|
%
|
100.0
|
%
|
|||||||||
|
Approximate 60-minute peak load (MW):
(f)
|
|||||||||||||||||||
|
Summer season
|
22,900
|
|
21,576
|
|
21,440
|
|
21,619
|
|
22,256
|
|
|||||||||
|
Winter season
|
17,830
|
|
18,028
|
|
16,025
|
|
17,934
|
|
21,153
|
|
|||||||||
|
Average number of customer accounts (thousands):
|
|
||||||||||||||||||
|
Residential
|
4,169
|
|
4,097
|
|
4,052
|
|
4,027
|
|
4,004
|
|
|||||||||
|
Commercial
|
526
|
|
517
|
|
512
|
|
508
|
|
504
|
|
|||||||||
|
Industrial
|
10
|
|
10
|
|
9
|
|
9
|
|
9
|
|
|||||||||
|
Other
|
4
|
|
3
|
|
3
|
|
3
|
|
3
|
|
|||||||||
|
Total
|
4,709
|
|
4,627
|
|
4,576
|
|
4,547
|
|
4,520
|
|
|||||||||
|
Average price billed to customers (cents per kWh)
|
9.97
|
|
9.47
|
|
9.51
|
|
9.83
|
|
9.34
|
|
|||||||||
______________________
|
(a)
|
2013 amounts were reclassified to conform to current year's presentation. See Note 4 - Nonrecurring Fair Value Measurements.
|
|
(b)
|
Includes net unrealized mark-to-market after-tax gains (losses) associated with non-qualifying hedges of approximately
$153 million
,
$(53) million
,
$(34) million
, $190 million and $175 million and OTTI after-tax income (losses), net of OTTI reversals of
$(2) million
,
$1 million
,
$31 million
, $(6) million and $4 million for the years ended
December 31, 2014
,
2013
,
2012
,
2011
and
2010
, respectively. Additionally, 2014 and 2013 includes after-tax operating loss of NEER's Spain solar projects of
$32 million
and
$4 million
, respectively, and after-tax gain (loss) associated with Maine fossil of
$12 million
and
$(43) million
, respectively (see Note 4 - Nonrecurring Fair Value Measurements). Also, on an after-tax basis, 2013 includes impairment and other charges related to the Spain Solar projects of approximately
$342 million
(see Note 4 - Nonrecurring Fair Value Measurements) and 2011 includes loss on the sale of natural gas-fired generating assets of approximately $98 million.
|
|
(c)
|
2013 includes an after-tax gain from discontinued operations of
$231 million
. See Note 6.
|
|
(d)
|
2012 includes assets held for sale of approximately $335 million.
|
|
(e)
|
Includes the net change in unbilled sales.
|
|
(f)
|
Winter season includes November and December of the current year and January to March of the following year (for
2014
, through
February 20, 2015
).
|
42
OVERVIEW
NEE’s operating performance is driven primarily by the operations of its two principal subsidiaries, FPL, which serves approximately 4.7 million customer accounts in Florida and is one of the largest rate-regulated electric utilities in the U.S., and NEER, which together with affiliated entities is the largest generator in North America
of renewable energy from the wind and sun. The table below presents net income
(loss) attributable to NEE and earnings (loss) per share attributable to NEE by reportable segment - FPL, NEER and
Corporate and Other, which is primarily comprised of the operating results of NEET, FPL FiberNet and other business activities, as well as other income and expense items, including interest expense, income taxes and eliminating entries (
see Note
14
for additional segment information, including reported results from continuing operations). The following discussions should be read in conjunction with the Notes to Consolidated Financial Statements contained herein and all comparisons are with the corresponding items in the prior year.
|
Net Income (Loss) Attributable
to NEE
|
Earnings (Loss) Per Share,
assuming dilution
|
||||||||||||||||||||||
|
Years Ended December 31,
|
Years Ended December 31,
|
||||||||||||||||||||||
|
2014
|
2013
|
2012
|
2014
|
2013
|
2012
|
||||||||||||||||||
|
(millions)
|
|||||||||||||||||||||||
|
FPL
|
$
|
1,517
|
|
$
|
1,349
|
|
$
|
1,240
|
|
$
|
3.45
|
|
$
|
3.16
|
|
$
|
2.96
|
|
|||||
|
NEER
(a)
|
985
|
|
556
|
|
687
|
|
2.24
|
|
1.30
|
|
1.64
|
|
|||||||||||
|
Corporate and Other
|
(37
|
)
|
3
|
|
(16
|
)
|
(0.09
|
)
|
0.01
|
|
(0.04
|
)
|
|||||||||||
|
NEE
|
$
|
2,465
|
|
$
|
1,908
|
|
$
|
1,911
|
|
$
|
5.60
|
|
$
|
4.47
|
|
$
|
4.56
|
|
|||||
|
(a)
|
NEER’s results reflect an allocation of interest expense from NEECH based on a deemed capital structure of 70% debt and allocated shared service costs.
|
During 2014, NEP, through NEER, was formed to acquire, manage and own contracted clean energy projects with stable, long-term cash flows through a limited partnership interest in NEP OpCo. On July 1, 2014, NEP completed its IPO as further described in Note 1 - NextEra Energy Partners, LP. In October 2014, NEP entered into agreements to expand its portfolio through two project acquisitions from NEER. The first acquisition, which closed in January 2015, is a 250 MW wind project that was not included in the ROFO assets. The second acquisition is a 20 MW solar project included in the ROFO assets, which is currently under construction and is expected to close in the first quarter of 2015. In December 2014, NEE and HEI announced a proposed merger. See Item 1. Business - Overview.
For the five years ended
December 31, 2014
, NEE delivered a total shareholder return of approximately 140.9%, above the S&P 500’s 105.1% return, the S&P 500 Utilities' 87.0% return and the Dow Jones U.S. Electricity's 79.9% return. The historical stock performance of NEE's common stock shown in the performance graph below is not necessarily indicative of future stock price performance.

43
Adjusted Earnings
NEE prepares its financial statements under GAAP. However, management uses earnings excluding certain items (adjusted earnings), a non-GAAP financial measure, internally for financial planning, for analysis of performance, for reporting of results to the Board of Directors and as an input in determining performance-based compensation under NEE’s employee incentive compensation plans. NEE also uses adjusted earnings when communicating its financial results and earnings outlook to analysts and investors.
NEE
’s management believes adjusted earnings provides a more meaningful representation of the company’s fundamental earnings power. Although the excluded amounts are properly included in the determination of net income under GAAP, management believes that the amount and/or nature of such items make period to period comparisons of operations difficult and potentially confusing. Adjusted earnings do not represent a substitute for net income, as prepared under GAAP.
Adjusted earnings exclude the unrealized mark-to-market effect of non-qualifying hedges (as described below) and OTTI losses on securities held in NEER’s nuclear decommissioning funds, net of the reversal of previously recognized OTTI losses on securities sold and losses on securities where price recovery was deemed unlikely (collectively, OTTI reversals). However, other adjustments may be made from time to time with the intent to provide more meaningful and comparable results of ongoing operations.
NEE and NEER segregate into two categories unrealized mark-to-market gains and losses on derivative transactions. The first category, referred to as non-qualifying hedges, represents certain energy derivative transactions, and, beginning in 2013, certain interest rate derivative transactions entered into as economic hedges, which do not meet the requirements for hedge accounting, or for which hedge accounting treatment is not elected or has been discontinued. Changes in the fair value of those transactions are marked to market and reported in the consolidated statements of income, resulting in earnings volatility because the economic offset to the positions are not marked to market. As a consequence, NEE's net income reflects only the movement in one part of economically-linked transactions. For example, a gain (loss) in the non-qualifying hedge category for certain energy derivatives is offset by decreases (increases) in the fair value of related physical asset positions in the portfolio or contracts, which are not marked to market under GAAP. For this reason, NEE's management views results expressed excluding the unrealized mark-to-market impact of the non-qualifying hedges as a meaningful measure of current period performance. The second category, referred to as trading activities, which is included in adjusted earnings, represents the net unrealized effect of actively traded positions entered into to take advantage of expected market price movements and all other commodity hedging activities. At FPL, substantially all changes in the fair value of energy derivative transactions are deferred as a regulatory asset or liability until the contracts are settled, and, upon settlement, any gains or losses are passed through the fuel clause. See Note
3.
In 2013, an after-tax gain from discontinued operations of $231 million ($216 million recorded at NEER and $15 million recorded at Corporate and Other) was recorded in NEE's consolidated statements of income related to the sale of its ownership interest in a portfolio of hydropower generation plants and related assets located in Maine and New Hampshire (see Note 6). In addition, during 2013, an after-tax loss of $43 million ($41 million recorded at NEER and $2 million recorded at Corporate and Other) was recorded associated with the decision to pursue the sale of NEER's ownership interests in oil-fired generating plants located in Maine (Maine fossil). During 2014, NEER decided not to pursue the sale of Maine fossil and recorded an after-tax gain of $12 million to increase Maine fossil's carrying value to its estimated fair value. See Note 4 - Nonrecurring Fair Value Measurements. Also in 2013, NEER recorded an impairment of $300 million and other related charges ($342 million after-tax) related to the Spain solar projects in NEE's consolidated statements of income. See Note 4 - Nonrecurring Fair Value Measurements and Note 13 - Spain Solar Projects. In order to make period to period comparisons more meaningful,
adjusted earnings also exc
lude the items discussed above, and, beginning in the third quarter of 2013, the after-tax operating results associated with the Spain solar projects.
The following table provides details of the adjustments to net income considered in computing NEE's adjusted earnings discussed above.
|
Years Ended December 31,
|
|||||||||||||
|
2014
|
2013
|
2012
|
|||||||||||
|
(millions)
|
|||||||||||||
|
Net unrealized mark-to-market after-tax gains (losses) from non-qualifying hedge activity
(a)
|
$
|
153
|
|
$
|
(53
|
)
|
$
|
(34
|
)
|
||||
|
Income (loss) from OTTI after-tax losses on securities held in NEER's nuclear decommissioning funds, net of OTTI reversals
(b)
|
$
|
(2
|
)
|
$
|
1
|
$
|
31
|
||||||
|
After-tax gain from discontinued operations
(c)
|
$
|
—
|
|
$
|
231
|
$
|
—
|
||||||
|
After-tax gain (loss) associated with Maine fossil
(d)
|
$
|
12
|
|
$
|
(43
|
)
|
$
|
—
|
|||||
|
After-tax charges recorded by NEER associated with the impairment of the Spain solar projects
|
$
|
—
|
|
$
|
(342
|
)
|
$
|
—
|
|||||
|
After-tax operating loss of NEER's Spain solar projects
|
$
|
(32
|
)
|
$
|
(4
|
)
|
$
|
—
|
|||||
______________________
|
(a)
|
For
2014
,
2013
and
2012
, $171 million of the gains, $54 million of losses and $37 million of losses, respectively, are included in NEER's net income; the balance is included in Corporate and Other.
|
|
(b)
|
For 2014, $1 million of gains are included in NEER's net income; the balance is included in Corporate and Other. For 2013 and 2012, all of the gains are included in NEER's net income.
|
|
(c)
|
For 2013, $216 million of the gain is included in NEER's net income; the balance is included in Corporate and Other.
|
|
(d)
|
For 2014, all of the gain is included in NEER's net income. For 2013, $41 million of the loss is included in NEER's net income; the balance is included in Corporate and Other.
|
44
The change in unrealized mark-to-market activity from non-qualifying hedges is primarily attributable to changes in forward power and natural gas prices and interest rates, as well as the reversal of previously recognized unrealized mark-to-market gains or losses as the underlying transactions were realized.
2014
Summary
Net income attributable to NEE for
2014
was higher than 2013 by
$557 million
, or
$1.13
per share, primarily due to higher results
at FPL and NEER
.
During 2014, NEE and its subsidiaries implemented initiatives determined during a 2013 enterprise-wide process focused mainly on improving productivity and reducing O&M expenses (cost savings initiative). The transition costs associated with the cost savings initiative recorded by NEE in 2013 amounted to approximately $72 million ($44 million after-tax), of which $32 million of such after-tax costs were recorded by FPL and $12 million by NEER.
FPL's increase in net income in
2014
was primarily driven by continued investments in plant in service
while earning an 11.50% regulatory ROE on its retail rate base
. During 2014,
FPL placed in service the 1,212 MW natural gas-fired combined-cycle Riviera Beach power plant and began construction on the modernization project at the Port Everglades power plant. In 2014, FPL's average typical residential 1,000 kWh bill was the lowest among reporting electric utilities within Florida and 25% below the national average based on a rate per kWh as of July 2014. In December 2014, the FPSC approved FPL’s petition
to invest in long-term natural gas supplies in the Woodford Shale region in southeastern Oklahoma and for the recovery of costs associated with the investment through the fuel clause (see Item 1. Business - FPL - FPL Sources of Generation - Fossil Operations).
NEER's results increased in
2014
reflecting higher results from new investments, net unrealized gain from non-qualifying hedge activity compared to losses on such hedges in the prior year period, and the absence of $342 million of after-tax charges associated with the impairment of the Spain solar projects recorded in 2013, partly offset by the absence of the $231 million after-tax gain from discontinued operations recorded in 2013. In
2014
, NEER added approximately 1,217 MW of wind capacity in the U.S. and Canada, net of sales and dismantlements, and 265 MW of solar capacity in the U.S. and increased its backlog of contracted renewable development projects.
Corporate and Other's results in
2014
decl
ined primarily due to consolidating tax adjustments and higher investment losses. In 2014, NEE committed to make an equity investment in a joint venture which plans to construct an approximately 300-mile natural gas pipeline. See Item 1. Business - Other NEE Operating Subsidiaries - Natural Gas Pipeline Systems - Mountain Valley Pipeline.
NEE and its subsidiaries, including FPL, require funds to support and grow their businesses. These funds are primarily provided by cash flow from operations, short- and long-term borrowings and proceeds from the sale of differential membership interests and of noncontrolling interests in subsidiaries associated with NEP and, from time to time, issuance of equity securities. As of
December 31, 2014
,
NEE's total net available liquidity was approximately
$7.0 billion
, of which FPL's portion was approximately
$2.1 billion
.
RESULTS OF OPERATIONS
Net income attributable to NEE for
2014
was
$2.47 billion
, compared to
$1.91 billion
in
2013
and
$1.91 billion
in
2012
. In
2014
, net income attributable to NEE improved due to higher results at FPL and NEER partly offset by lower results at Corporate and Other.
In
2013
, net income was unfavorably affected by lower results at NEER, offset by higher results at FPL and Corporate and Other.
NEE's effective income tax rate for all periods presented reflects PTCs for wind projects at NEER and deferred income tax benefits associated with convertible ITCs under the American Recovery and Reinvestment Act of 2009, as amended (Recovery Act). PTCs and deferred income tax benefits associated with convertible ITCs can significantly affect NEE's effective income tax rate depending on the amount of pretax income. The amount of PTCs recognized can be significantly affected by wind generation and by the roll off of PTCs on certain wind projects after ten years of production (PTC roll off). In addition,
NEE's effective income tax rate for 2014 was unfavorably affected by a noncash income tax charge of approximately $45 million associated with structuring Canadian assets and
for 2013 was unfavorably affected by the establishment of a full valuation allowance on the deferred tax assets associated with the Spain solar projects. See Note 1 - Income Taxes and - Sale of Differential Membership Interests, Note 4 - Nonrecurring Fair Value Measurements and Note 5. Also see Item 1. Business - NEER - Generation and Other Operations - NEER Fuel/Technology Mix - Policy Incentives for Renewable Energy Projects for a discussion of the Tax Increase Prevention Act of 2014.
FPL: Results of Operations
FPL obtains its operating revenues primarily from the sale of electricity to retail customers at rates established by the FPSC through base rates and cost recovery clause mechanisms. FPL’s net income for
2014
,
2013
and
2012
was
$1,517 million
,
$1,349 million
and
$1,240 million
, respectively, representing an increase in
2014
of
$168 million
and an increase in
2013
of
$109 million
.
The use of reserve amortization in 2014 and 2013 is permitted by the 2012 rate agreement and, for 2012, the 2010 rate agreement, subject to limitations provided in the rate agreements. See Item 1. Business - FPL - FPL Regulation - FPL Rate Regulation - Base Rates for additional information on the 2012 and 2010 rate agreements. In order to earn a targeted regulatory ROE in each reporting
45
period under the 2012 and 2010 rate agreements, reserve amortization is calculated using a trailing thirteen-month average of retail rate base and capital structure in conjunction with the trailing twelve months regulatory retail base net operating income, which primarily includes the retail base portion of base and other revenues, net of O&M, depreciation and amortization, interest and tax expenses. In general, the net impact of these income statement line items is adjusted, in part, by reserve amortization to earn a targeted regulatory ROE. In certain periods, reserve amortization must be reversed so as not to exceed the targeted regulatory ROE. The drivers of FPL
'
s net income not reflected in the reserve amortization calculation typically include wholesale and transmission service revenues and expenses, cost recovery clause revenues and expenses, AFUDC - equity and costs not allowed to be recovered from customers by the FPSC. In 2014, FPL reversed reserve amortization of approximately $33 million and, in 2013 and 2012, FPL recorded reserve amortization of $155 million and $480 million, respectively.
FPL's regulatory ROE for
2014
was 11.50%, compared to 10.96% in
2013
and 11.00% in
2012
. The
2013
regulatory ROE of 10.96% reflects approximately $32 million of after-tax charges associated with the cost savings initiative (see
2014
Summary above). These charges were not offset by additional reserve amortization. Excluding the impact of these charges, FPL's regulatory ROE for
2013
would have been approximately 11.25%.
In
2014
, the growth in earnings for FPL was primarily driven by the following:
|
•
|
higher earnings on investment in plant in service of approximately $105 million. Investment in plant in service grew FPL's average retail rate base in
2014
by $2.3 billion reflecting, among other things, the modernized Riviera Beach power plant and ongoing transmission and distribution additions,
|
|
•
|
growth in wholesale services provided which increased earnings by $47 million,
|
|
•
|
the absence of $32 million of after-tax charges associated with the cost savings initiative recorded in 2013, and
|
|
•
|
higher earnings of $30 million related to the increase in the targeted regulatory ROE from 11.25% to 11.50%,
|
partly offset by,
|
•
|
lower cost recovery clause results of $22 million primarily due to the transfer of new nuclear capacity to retail rate base as discussed below under Retail Base, Cost Recovery Clauses and Interest Expense, and
|
|
•
|
lower AFUDC - equity of $19 million primarily related to the Riviera Beach and Cape Canaveral power plants being placed in service in April 2014 and April 2013, respectively.
|
In
2013
, the growth in earnings for FPL was primarily driven by the following:
|
•
|
higher earnings on investment in plant in service of approximately $175 million. Investment in plant in service grew FPL's average retail rate base in
2013
by $3.4 billion reflecting, among other things, the modernized Cape Canaveral power plant, generation power uprates at FPL's nuclear units and ongoing transmission and distribution additions,
|
partly offset by,
|
•
|
lower cost recovery clause results of $45 million primarily due to the transfer of new nuclear capacity to retail rate base as discussed below under Retail Base, Cost Recovery Clauses and Interest Expense, and
|
|
•
|
the $32 million of after-tax charges associated with the cost savings initiative.
|
FPL's operating revenues consisted of the following:
|
Years Ended December 31,
|
|||||||||||
|
2014
|
2013
|
2012
|
|||||||||
|
(millions)
|
|||||||||||
|
Retail base
|
$
|
5,347
|
|
$
|
4,951
|
|
$
|
4,246
|
|
||
|
Fuel cost recovery
|
3,876
|
|
3,334
|
|
3,815
|
|
|||||
|
Net deferral of retail fuel revenues
|
—
|
|
—
|
|
(44
|
)
|
|||||
|
Net recognition of previously deferred retail fuel revenues
|
—
|
|
44
|
|
—
|
|
|||||
|
Other cost recovery clauses and pass-through costs, net of any deferrals
|
1,766
|
|
1,837
|
|
1,858
|
|
|||||
|
Other, primarily wholesale and transmission sales, customer-related fees and pole attachment rentals
|
432
|
|
279
|
|
239
|
|
|||||
|
Total
|
$
|
11,421
|
|
$
|
10,445
|
|
$
|
10,114
|
|
||
Retail Base
FPSC Rate Orders
In 2014 and 2013, FPL’s retail base revenues benefited from the 2012 rate agreement as retail base rates and charges were designed to increase approximately $350 million on an annualized basis, as well as a $164 million annualized retail base rate increase associated with the Cape Canaveral power plant, which was placed in service in April 2013 and a $234 million annualized retail base rate increase associated with the Riviera Beach power plant which was placed in service in April 2014. The 2012 rate agreement:
46
|
•
|
remains in effect until December 2016,
|
|
•
|
establishes FPL's allowed regulatory ROE at 10.50%, with a range of plus or minus 100 basis points, and
|
|
•
|
allows for an additional retail base rate increase as the modernized Port Everglades project becomes operational (which is expected by mid-2016).
|
In 2012, FPL's retail base revenues were impacted by the 2010 rate agreement. See Item 1. Business - FPL - FPL Regulation - FPL Rate Regulation - Base Rates for additional information on the 2012 and 2010 rate agreements.
Included in retail base revenues for 2014 was approximately $192 million of additional base revenues related to the Riviera Beach power plant which was placed in service in April 2014 and $53 million of additional retail base revenues related to the Cape Canaveral power plant which was placed in service in April 2013. Included in retail base revenues for 2013 was approximately $302 million of additional revenues associated with new retail base rates under the 2012 rate agreement and $129 million of additional retail base revenues related to the Cape Canaveral power plant. Additional retail base revenues of approximately $115 million and $237 million were recorded in 2014 and 2013, respectively, primarily related to new nuclear capacity which was placed in service in 2013 and 2012 as permitted by the FPSC's nuclear cost recovery rule. See Cost Recovery Clauses below for discussion of the nuclear cost recovery rule.
Retail Customer Usage and Growth
In 2014 and 2013, FPL experienced a 1.8% and 1.1% increase, respectively, in the average number of customer accounts and a 0.4% and 0.2% decrease, respectively, in the average usage per retail customer, which collectively, together with other factors, increased revenues by approximately $36 million and $37 million, respectively. A portion of the increase in the average number of customer accounts in 2014 and 2013 can be attributed to the remote disconnection of inactive meters (meters at premises where electric service is available but no customer is requesting service) through the use of smart meters and the subsequent establishment of valid customer accounts (reactivated customers). Generally the usage of these reactivated customers was lower than average usage customers and, accordingly, did not increase revenues proportionally. An improvement in the Florida economy contributed to the increased revenues for both periods and favorable weather contributed to the increased revenues in 2013.
Cost Recovery Clauses
Revenues from fuel and other cost recovery clauses and pass-through costs, such as franchise fees, revenue taxes and storm-related surcharges, are largely a pass-through of costs. Such revenues also include a return on investment allowed to be recovered through the cost recovery clauses on certain assets, primarily related to nuclear capacity, solar and environmental projects.
In
2014
,
2013
and
2012
, cost recovery clauses contributed $93 million, $115 million and $160 million, respectively, to FPL’s net income. The decrease in 2014 and 2013 in cost recovery clause results is primarily due to the collection in both years of retail base revenues related to new nuclear capacity which was placed in service in 2013
and 2012 (see Retail Base above). In 2014, there was minimal contribution to net income from the nuclear cost recovery rule as all nuclear uprates have been placed in service and associated costs are now collected through base rates.
Fluctuations in fuel cost recovery revenues are primarily driven by changes in fuel and energy charges which are included in fuel, purchased power and interchange expense in the consolidated statements of income, as well as by changes in energy sales. Fluctuations in revenues from other cost recovery clauses and
pass-through costs
are primarily driven by changes in storm-related surcharges, capacity charges, franchise fee costs, the impact of changes in O&M and depreciation expenses on the underlying cost recovery clause, investment in solar and environmental projects, investment in nuclear capacity until such capacity goes into service and is recovered in base rates, pre-construction costs associated with the development of two additional nuclear units at the Turkey Point site and changes in energy sales. Capacity charges are included in fuel, purchased power and interchange and franchise fee costs are included in taxes other than income taxes and other in the consolidated statements of income.
Underrecovery or overrecovery of cost recovery clause and other pass-through costs can significantly affect NEE's and FPL's operating cash flows. The change from December 31, 2013 to December 31, 2014 in deferred clause and franchise expenses and in deferred clause and franchise revenues was approximately $67 million and negatively affected NEE’s and FPL’s cash flows from operating activities in 2014.
The increase in fuel cost recovery revenues in
2014
is primarily due to a higher average fuel factor of approximately $329 million and higher energy sales of $158 million. In addition, higher interchange power sales, partly offset by lower gas sales associated with an incentive mechanism allowed under the 2012 rate agreement (incentive gas sales), increased fuel cost recovery revenues in 2014 by approximately $55 million. The decrease in fuel cost recovery revenues in
2013
is primarily due to a lower average fuel factor, partly offset by incentive gas sales and higher interchange power sales (collectively, approximately $200 million).
The decrease in revenues from other cost recovery clauses and pass-through costs in
2014
and
2013
primarily reflects higher revenues in 2012 associated with the FPSC’s nuclear cost recovery rule reflective of higher earnings on additional nuclear capacity investments and the shift, in 2013 and 2014, to the collection of nuclear capacity recovery through retail base revenues (see Retail Base above). The nuclear cost recovery rule provides for the recovery of prudently incurred pre-construction costs and carrying charges (equal to the pretax AFUDC rate) on construction costs and a return on investment for new nuclear capacity through levelized charges under the capacity clause. The same rule provides for the recovery of construction costs, once property related to the new nuclear capacity goes into service, through a retail base rate increase effective beginning the following January.
47
Other
The increase in other revenues for 2014 primarily reflects higher wholesale revenues of approximately $131 million associated with an increase in contracted load served under existing contracts. The increase in other revenues for 2013 is primarily due to an increase in customer-related fees associated with the 2012 rate agreement.
Other Items Impacting FPL's Consolidated Statements of Income
Fuel, Purchased Power and Interchange
The major components of FPL's fuel, purchased power and interchange expense are as follows:
|
Years Ended December 31,
|
||||||||||||||
|
2014
|
2013
|
2012
|
||||||||||||
|
(millions)
|
||||||||||||||
|
Fuel and energy charges during the period
|
$
|
3,951
|
$
|
3,519
|
$
|
3,657
|
||||||||
|
Net deferral of retail fuel costs
|
(109
|
)
|
(148
|
)
|
—
|
|||||||||
|
Net recognition of previously deferred retail fuel costs
|
—
|
—
|
103
|
|||||||||||
|
Other, primarily capacity charges, net of any capacity deferral
|
533
|
554
|
505
|
|||||||||||
|
Total
|
$
|
4,375
|
$
|
3,925
|
$
|
4,265
|
||||||||
The increase in fuel and energy charges in
2014
was primarily due to higher fuel and energy prices of approximately $202 million, higher energy sales of approximately $187 million and an increase of $43 million related to incentive gas sales. The decrease in fuel and energy charges in
2013
was primarily due to lower fuel and energy prices of approximately $306 million, reflecting additional nuclear generation in 2013, which has a lower fuel cost, partly offset by gas purchased for incentive gas sales of $88 million and higher energy sales of $80 million. The additional nuclear generation in 2013 was primarily due to increased capacity of the nuclear units as a result of the nuclear uprate project and higher nuclear production reflecting lower outage duration in 2013.
O&M Expenses
FPL's O&M expenses decreased $79 million in
2014
, primarily due the absence of 2013 transition costs associated with the cost savings initiative, as well as realized costs savings from this initiative. The ideas generated from the cost savings initiative are expected to keep FPL's O&M expenses recovered through base rates flat through 2016 as compared to 2012. FPL's O&M expenses decreased $74 million in
2013
, reflecting lower cost recovery clause costs, which do not have a significant impact on net income, of approximately $54 million, the absence of nuclear outage costs incurred during an outage in the prior year and company-wide reductions in O&M expenses, partly offset by $52 million of transition costs associated with the cost savings initiative.
Depreciation and Amortization Expense
The major components of FPL’s depreciation and amortization expense are as follows:
|
Years Ended December 31,
|
|||||||||||
|
2014
|
2013
|
2012
|
|||||||||
|
(millions)
|
|||||||||||
|
Reserve reversal (amortization) recorded under the 2012 and 2010 rate agreements
|
$
|
33
|
|
$
|
(155
|
)
|
$
|
(480
|
)
|
||
|
Other depreciation and amortization recovered under base rates
|
1,211
|
|
1,105
|
|
1,013
|
|
|||||
|
Depreciation and amortization recovered under cost recovery clauses and securitized storm-recovery cost amortization
|
188
|
|
209
|
|
126
|
|
|||||
|
Total
|
$
|
1,432
|
|
$
|
1,159
|
|
$
|
659
|
|
||
The reserve amortization, or reversal of such amortization, recorded in 2014 and 2013 reflects adjustments to the depreciation and fossil dismantlement reserve provided under the 2012 rate agreement. At December 31, 2014, approximately $278 million of the reserve remains available for future amortization over the term of the 2012 rate agreement. Beginning in 2013, reserve amortization is recorded as a reduction of regulatory liabilities - accrued asset removal costs on the consolidated balance sheets. The reduction in the use of reserve amortization in 2014 and 2013 was primarily due to additional base revenues collected and lower base O&M expenses in the respective periods compared to the amounts recorded in the prior year periods. The increase in other depreciation and amortization expense recovered under base rates for 2014 and 2013 is primarily due to higher plant in service balances.
The increase in depreciation and amortization recovered under cost recovery clauses and securitized storm-recovery cost amortization in 2013 is primarily due to recoveries of prior year investment under the FPSC's nuclear cost recovery rule and higher plant in service balances associated with environmental projects under the environmental clause
.
48
Taxes Other Than Income Taxes and Other
Taxes other than income taxes and other increased $43 million in
2014
primarily due to
higher franchise and revenue taxes, neither of which impact net income, as well as higher property taxes reflecting growth in plant in service balances, partly offset by lower payroll taxes.
The increase of $63 million in
2013
was primarily due to
higher property taxes, reflecting growth in plant in service balances, and higher payroll taxes
.
Interest Expense
The increase in interest expense in
2014
reflects higher average interest rates related to higher fixed rate debt balances, lower AFUDC - debt and higher average debt balances. The change in AFUDC - debt is due to the same factors as described below in AFUDC - equity.
Interest expense on storm-recovery bonds, as well as certain other interest expense on clause-recoverable investments (collectively, clause interest), do not significantly affect net income, as the clause interest is recovered either under cost recovery clause mechanisms or through a storm-recovery bond surcharge. Clause interest for
2014
,
2013
and
2012
amounted to approximately $42 million, $58 million and $81 million, respectively, and reflect
the shift of nuclear capacity recovery through retail base revenues
(see Retail Base and Cost Recovery Clauses above).
AFUDC - Equity
The decrease in AFUDC - equity in
2014
was primarily due to lower AFUDC - equity associated with the Riviera Beach power plant which was placed in service in April 2014 and the Cape Canaveral power plant which was placed in service in April 2013, partly offset by additional AFUDC - equity recorded on construction expenditures associated with the Port Everglades modernization project.
Capital Initiatives
FPL's 2012 rate agreement continues to provide, among other things, a high degree of base rate predictability through December 2016, including allowances for rate increases when the modernized Cape Canaveral, Riviera Beach and Port Everglades power plants are placed in service. The Cape Canaveral power plant was placed in service in April 2013 and the Riviera Beach power plant was placed in service in April 2014. The Port Everglades power plant is expected to provide approximately 1,240 MW of capacity and be placed in service by mid-2016. FPL plans to continue to strengthen the transmission and distribution infrastructure, to build three solar PV projects that are expected to provide approximately 74 MW each and be placed into service by the end of 2016 and to invest in long-term natural gas supplies. See Item 1. Business - FPL.
49
NEER: Results of Operations
NEER owns, develops, constructs, manages and operates electric generating facilities in wholesale energy markets primarily in the U.S. and Canada.
NEER’s net income less net income attributable to noncontrolling interests for
2014
,
2013
and
2012
was
$985 million
,
$556 million
and
$687 million
, respectively, resulting in an
increase
in
2014
of
$429 million
and a decrease in
2013
of
$131 million
. The primary drivers, on an after-tax basis, of these changes are in the following table.
|
Increase (Decrease)
From Prior Period
|
|||||||||
|
Years Ended
December 31, |
|||||||||
|
2014
|
2013
|
||||||||
|
(millions)
|
|||||||||
|
New investments
(a)
|
$
|
129
|
$
|
132
|
|||||
|
Existing assets
(a)
|
26
|
(13
|
)
|
||||||
|
Gas infrastructure
(b)
|
(27
|
)
|
17
|
||||||
|
Customer supply and proprietary power and gas trading
(b)
|
16
|
(4
|
)
|
||||||
|
Asset sales and restructuring activities
|
6
|
(12
|
)
|
||||||
|
NEP-related charge and costs
|
(67
|
)
|
—
|
||||||
|
Interest expense, differential membership costs and other
|
(30
|
)
|
(33
|
)
|
|||||
|
Change in unrealized mark-to-market non-qualifying hedge activity
(c)(d)
|
225
|
(17
|
)
|
||||||
|
Change in OTTI losses on securities held in nuclear decommissioning funds, net of OTTI reversals
(d)
|
—
|
(30
|
)
|
||||||
|
Gain on 2013 discontinued operations
(e)
|
(216
|
)
|
216
|
||||||
|
Change in Maine fossil gain/loss
(f)
|
53
|
(41
|
)
|
||||||
|
Charges associated with the 2013 impairment of the Spain solar projects
(f)
|
342
|
(342
|
)
|
||||||
|
Operating loss of the Spain solar projects
(f)
|
(28
|
)
|
(4
|
)
|
|||||
|
Increase (decrease) in net income less net income attributable to noncontrolling interests
|
$
|
429
|
$
|
(131
|
)
|
||||
|
(a)
|
Includes PTCs and state ITCs on wind projects and, for new investments, deferred income tax and other benefits associated with convertible ITCs (see Note 1 -Electric Plant, Depreciation and Amortization, - Income Taxes and - Sale of Differential Membership Interests and Note 5) but excludes allocation of interest expense or corporate general and administrative expenses. Results from new projects are included in new investments during the first twelve months of operation. A project's results are included in existing assets beginning with the thirteenth month of operation. Excludes the 99.8 MW associated with the Spain solar projects and the related operating results.
|
|
(b)
|
Excludes allocation of interest expense and corporate general and administrative expenses.
|
|
(c)
|
See Note 3 and Overview - Adjusted Earnings related to derivative instruments.
|
|
(d)
|
See table in Overview - Adjusted Earnings for additional detail.
|
|
(e)
|
See Note 6 and Overview - Adjusted Earnings for additional information.
|
|
(f)
|
See Note 4 - Nonrecurring Fair Value Measurements and Overview - Adjusted Earnings for additional information.
|
New Investments
In
2014
, results from new investments increased primarily due to:
|
•
|
the addition of approximately 1,678 MW of wind generation and 545 MW of solar generation during or after 2013, and
|
|
•
|
higher deferred income tax and other benefits associated with ITCs of $25 million,
|
partly offset by,
|
•
|
lower deferred income tax and other benefits associated with convertible ITCs of $15 million.
|
In
2013
, results from new investments increased primarily due to:
|
•
|
the addition of approximately 1,897 MW of wind generation during or after 2012, and
|
|
•
|
higher deferred income tax and other benefits associated with convertible ITCs of $18 million,
|
partly offset by,
|
•
|
lower state ITCs of $8 million.
|
Existing Assets
In
2014
, results from NEER's existing asset portfolio increased primarily due to:
|
•
|
higher results from wind assets of $29 million reflecting stronger wind resource and increased availability, favorable pricing and lower operating expenses, partly offset by PTC roll off,
|
|
•
|
higher results of $19 million from merchant assets in the ERCOT region and $11 million from other contracted natural gas assets primarily due to favorable market conditions, and
|
|
•
|
increased results of $11 million at Maine fossil due to additional generation and favorable pricing related to extreme winter
|
50
weather,
partly offset by,
|
•
|
lower results from the nuclear assets of approximately $30 million primarily due to lower pricing and scheduled outages in 2014, offset in part by higher nuclear decommissioning gains, and
|
|
•
|
lower results of $14 million due to the absence of the hydro assets which were sold in the first quarter of 2013.
|
In
2013
, results from NEER's existing asset portfolio decreased primarily due to:
|
•
|
lower wind generation of approximately $26 million,
|
|
•
|
PTC roll off of $26 million, and
|
|
•
|
lower results of $25 million due to the absence of the hydro assets which were sold in the first quarter of 2013,
|
partly offset by,
|
•
|
increased generation at Seabrook, primarily due to the absence of a 2012 reduction in capacity, as well as lower operating costs at that facility,
|
|
•
|
improved results of $16 million at Duane Arnold, primarily due to the absence of a 2012 refueling outage and favorable pricing, and
|
|
•
|
improved results of $11 million in the ERCOT region, primarily due to the absence of outages that occurred in 2012 at the natural gas facilities, and favorable market conditions.
|
Gas Infrastructure
The decrease in gas infrastructure results in
2014
is primarily due to increased depreciation expense mainly related to higher depletion rates and operating lease expenses and lower revenues (collectively, approximately $31 million) as well as $5 million of after-tax impairment charges on two oil and gas producing properties reflecting a decline in oil and natural gas prices, partly offset by gains on the sale of investments in certain wells. The increase in gas infrastructure results in
2013
is primarily due to income from additional production in 2013, partly offset by the absence of gains recorded in 2012 from exiting the hedged positions on a number of future gas production opportunities. Further declines in the price of oil and natural gas commodity products could result in additional impairments of NEER’s oil and gas producing properties. However, an impairment analysis performed under GAAP does not take into consideration the mark-to-market value of hedged positions. NEER hedges the expected output from its oil and gas producing properties for a period of time to protect against price movements; the fair value of such hedged positions at December 31, 2014 was approximately $315 million. At December 31, 2014, approximately $1.8 billion of NEE’s property, plant and equipment, net relates to the gas infrastructure business.
Customer Supply and Proprietary Power and Gas Trading
Results from customer supply and proprietary power and gas trading increased in
2014
primarily due to higher power and gas trading results and gains on gas purchase contracts, partly offset by lower results in the full requirements business reflecting the impact of extreme winter weather and market conditions in the Northeast. In
2013
, results from customer supply and proprietary power and gas trading decreased primarily due to lower results in the customer supply business reflecting lower margins and mild weather conditions, partly offset by higher power and gas trading results
.
Asset Sales and Restructuring Activities
Asset sales and restructuring activities in
2014
primarily include an after-tax gain of approximately $14 million on the sale of a 75 MW wind project that became operational during 2014, offset by after-tax gains of approximately $8 million recorded in 2013. Asset sales and restructuring activities in
2013
primarily include an after-tax gain of approximately $8 million on the sale of a portfolio of wind projects with net generating capacity totaling 223 MW, offset by after-tax gains of approximately $19 million related to project sales recorded in 2012.
NEP-related Charge and Costs
For 2014, NEER's results reflect an approximately $45 million noncash income tax charge associated with structuring Canadian assets and $22 million in NEP IPO transaction costs.
Interest Expense, Differential Membership Costs and Other
In
2014
, interest expense, differential membership costs and other reflects higher borrowing and other costs to support the growth of the business, partly offset by favorable income tax benefits. In
2013
, interest expense, differential membership costs and other reflects higher borrowing and other costs to support the growth of the business and transition costs associated with the cost savings initiative (approximately $12 million after-tax), partly offset by lower average interest rates and favorable income tax benefits.
51
Other Factors
Supplemental to the primary drivers of the changes in NEER's net income less net income attributable to noncontrolling interests discussed above, the discussion below describes changes in certain line items set forth in NEE's consolidated statements of income as they relate to NEER.
Operating Revenues
Operating revenues for
2014
increased
$858 million
primarily due to:
|
•
|
higher unrealized mark-to-market gains from non-qualifying hedges ($372 million for 2014 compared to $116 million of losses on such hedges for 2013),
|
|
•
|
higher revenues from new investments of approximately $282 million, and
|
|
•
|
higher revenues from the customer supply business of $120 million,
|
partly offset by,
|
•
|
lower revenues from existing assets of $13 million reflecting lower contracted revenues at Duane Arnold and the Spain solar projects and lower revenues in the New England Power Pool (NEPOOL) region reflecting a scheduled outage at Seabrook, partly offset by higher wind generation due to stronger wind resource and increased availability and higher revenues in the ERCOT region primarily due to favorable market conditions, and
|
|
•
|
lower revenues from the gas infrastructure business and other O&M service agreements.
|
Operating revenues for
2013
increased
$438 million
primarily due to:
|
•
|
higher revenues in the NEPOOL region primarily due to higher generation at Seabrook due to the absence of a 2012 reduction in capacity, higher gas infrastructure revenues and higher revenues in the ERCOT region primarily due to the absence of outages that occurred in 2012 at the natural gas facilities, offset in part by lower customer supply and proprietary power and gas trading revenues (collectively, $419 million), and
|
|
•
|
higher revenues from new investments of approximately $262 million, including $56 million associated with the Spain solar projects,
|
partly offset by,
|
•
|
higher unrealized mark-to-market losses from non-qualifying hedges ($116 million in 2013 compared to $115 million of gains on such hedges in 2012).
|
Operating Expenses
Operating expenses for
2014
decreased
$6 million
primarily due to:
|
•
|
the absence of a $300 million impairment charge in 2013 related to the Spain solar projects, and
|
|
•
|
lower other operating expenses reflecting the reimbursement by a vendor of certain O&M-related costs as well as the absence of implementation costs recorded in 2013 related to the cost savings initiative, partly offset by the NEP-related expenses,
|
partly offset by,
|
•
|
higher fuel expense of approximately $171 million primarily in the ERCOT region and the customer supply business,
|
|
•
|
higher operating expenses associated with new investments of approximately $123 million, and
|
|
•
|
higher depreciation expense of approximately $24 million associated with the gas infrastructure business primarily related to higher depletion rates.
|
Operating expenses for
2013
increased
$706 million
primarily due to:
|
•
|
an impairment charge of $300 million related to the Spain solar projects,
|
|
•
|
higher fuel expenses primarily in the NEPOOL and ERCOT regions and higher gas infrastructure operating expenses, offset in part by lower customer supply and proprietary power and gas trading fuel expense (collectively, $369 million),
|
|
•
|
higher operating expenses associated with new investments of approximately $149 million, including $42 million associated with the Spain solar projects, and
|
|
•
|
higher corporate operating expenses of approximately $68 million,
|
partly offset by,
|
•
|
higher unrealized mark-to-market gains from non-qualifying hedges ($1 million in 2013 compared to $184 million of losses on such hedges in 2012).
|
Interest Expense
NEER’s interest expense for
2014
increased $138 million primarily due to higher average debt balances. In a
ddition, NEER's interest expense for 2014 reflects a $64 million unfavorable change in the fair value of cash flow hedges related to interest rate swaps for which hedge accounting was discontinued in 2013, compared to approximately $3 million of favorable changes in 2013. NEER’s interest expense for
2013
increased $54 million primarily due to higher average debt balances, partly offset by lower average interest rates. NEER's interest expense in 2013 also includes approximately $23 million of additional interest expense associated with the Spain solar projects, primarily due to the absence of capitalized interest during part of the year as the projects were placed in service in 2013.
52
Benefits Associated with Differential Membership Interests - net
Benefits associated with differential membership interests - net in NEE's consolidated statements of income for all periods presented reflect benefits recognized by NEER as third-party investors received their portion of the economic attributes, including income tax attributes, of the underlying wind project, net of associated costs. See Note 1 - Sale of Differential Membership Interests. For 2012, benefits associated with differential membership interests - net also includes $13 million of benefits where the investors elected to receive the convertible ITCs related to the underlying wind project.
Equity in Earnings of Equity Method Investees
Equity in earnings of equity method investees increased in 2014 primarily due to NEER's 50% equity investment in a 550 MW solar project that commenced partial operations at the end of 2013 and full operations by the end of 2014.
Gains on Disposal of Assets - net
Gains on disposal of assets - net in NEE’s consolidated statements of income for
2014
,
2013
and 2012 primarily reflect gains on sales of securities held in NEER’s nuclear decommissioning funds and, for these respective periods, include approximately $14 million, $14 million and $69 million of OTTI reversals. Gains on disposal of assets - net also reflect, in 2014, a pretax gain of approximately $23 million on the sale of a 75 MW wind project, in 2013, a pretax gain of approximately $14 million on the sale of a portfolio of wind assets with generation capacity totaling 223 MW, and in 2012, a pretax gain of $13 million on the sale o
f a 30 MW wind project and
a pretax gain of $7 million
related to an investment previously accounted for under the equity method in which NEER obtained a controlling interest
.
Tax Credits, Benefits and Expenses
PTCs from NEER’s wind projects are reflected in NEER’s earnings. PTCs are recognized as wind energy is generated and sold based on a per kWh rate prescribed in applicable federal and state statutes, and were approximately $186 million, $209 million and $203 million in
2014
,
2013
and
2012
, respectively. A portion of the PTCs have been allocated to investors in connection with sales of differential membership interests. In addition, NEE’s effective income tax rate for
2014
,
2013
and
2012
was affected by deferred income tax benefits associated with convertible ITCs of $57 million, $71 million and $44 million, respectively. NEE's effective income tax rate for 2014 was unfavorably affected by a noncash income tax charge of approximately $45 million associated with structuring Canadian assets and
for 2013 was unfavorably affected by the establishment of a full valuation allowance on the deferred tax assets associated with the Spain solar projects.
See Note 5
and Overview - Adjusted Earnings for additional information.
Capital Initiatives
NEER is planning to add approximately 980 MW of new contracted U.S. wind generation, 175 MW of new contracted Canadian wind generation and 960 MW of new contracted solar generation during 2015 through 2016 and will continue to pursue other additional investment opportunities that may develop. Projects developed by NEER might be offered for sale to NEP if NEER should seek to sell the projects.
Corporate and Other: Results of Operations
Corporate and Other is primarily comprised of the operating results of NEET, FPL FiberNet and other business activities, as well as corporate interest income and expenses. Corporate and Other allocates a portion of NEECH's corporate interest expense and shared service costs to NEER. Interest expense is allocated based on a deemed capital structure of 70% debt and, for purposes of allocating NEECH's corporate interest expense, the deferred credit associated with differential membership interests sold by NEER’s subsidiaries is included with debt. Each subsidiary’s income taxes are calculated based on the "separate return method," except that tax benefits that could not be used on a separate return basis, but are used on the consolidated tax return, are recorded by the subsidiary that generated the tax benefits. Any remaining consolidated income tax benefits or expenses are recorded at Corporate and Other. The major components of Corporate and Other’s results, on an after-tax basis, are as follows:
|
Years Ended December 31,
|
|||||||||||
|
2014
|
2013
|
2012
|
|||||||||
|
(millions)
|
|||||||||||
|
Interest expense, net of allocations to NEER
|
$
|
(95
|
)
|
$
|
(109
|
)
|
$
|
(90
|
)
|
||
|
Interest income
|
31
|
|
32
|
|
36
|
|
|||||
|
Federal and state income tax benefits (expenses)
|
(7
|
)
|
15
|
|
20
|
|
|||||
|
Other
|
34
|
|
65
|
|
18
|
|
|||||
|
Net income (loss)
|
$
|
(37
|
)
|
$
|
3
|
|
$
|
(16
|
)
|
||
The decrease in interest expense, net of allocations to NEER in
2014
primarily relates to a larger allocation of interest costs to NEER reflecting a need for additional capital at NEER. The increase in interest expense, net of allocations to NEER in
2013
reflects higher average debt balances, partly offset by lower average interest rates. The federal and state income tax benefits (expenses) reflect consolidating income tax adjustments and, in 2013, include a $15 million income tax benefit recorded as a gain from discontinued operations, net of federal income taxes (see Overview - Adjusted Earnings).
53
Other includes all other corporate income and expenses, as well as other business activities. The decrease in other in 2014 primarily reflects after-tax investment losses in 2014 and lower results from NEET. The increase in other in 2013 reflects higher results from NEET and after-tax investment gains compared to after-tax investment losses in 2012. Substantially all of such investment losses and gains, on a pretax basis, is reflected in other - net in NEE's consolidated statements of income.
Capital Initiatives
NEE will continue efforts toward regulatory approval and development of the Florida Natural Gas Pipeline System and the Mountain Valley Pipeline, as well expansion of its transmission business. See Item 1. Business - Other NEE Operating Subsidiaries.
LIQUIDITY AND CAPITAL RESOURCES
NEE and its subsidiaries, including FPL, require funds to support and grow their businesses. These funds are used for, among other things, working capital, capital expenditures, investments in or acquisitions of assets and businesses, payment of maturing debt obligations and, from time to time, redemption or repurchase of outstanding debt or equity securities. It is anticipated that these requirements will be satisfied through a combination of cash flows from operations, short- and long-term borrowings, the issuance, from time to time, of short- and long-term debt and equity securities and proceeds from the sale of differential membership interests and of noncontrolling interests in subsidiaries associated with NEP, consistent with NEE’s and FPL’s objective of maintaining, on a long-term basis, a capital structure that will support a strong investment grade credit rating. In 2013, NEE entered into a confirmation of forward sale transaction to issue 6.6 million shares to a forward counterparty, on a settlement date or dates to be specified at NEE's direction, which settlement occurred on December 22, 2014. See Note 10 - Issuance of Common Stock and Forward Sale Agreement. NEE, FPL and NEECH rely on access to credit and capital markets as significant sources of liquidity for capital requirements and other operations that are not satisfied by operating cash flows. The inability of NEE, FPL and NEECH to maintain their current credit ratings could affect their ability to raise short- and long-term capital, their cost of capital and the execution of their respective financing strategies, and could require the posting of additional collateral under certain agreements.
Cash Flows
NEE’s increase in cash flows from operating activities for 2014 reflects operating cash generated from additional wind and solar facilities that were placed in service during or after 2013. FPL’s cash flows from operating activities remained essentially flat in 2014.
NEE's and FPL's increase in cash flows from operating activities for 2013 reflect an increase in retail base rates and charges associated with FPL's 2012 rate agreement and, for NEE, also reflects operating cash generated from approximately 1,500 MW of NEER wind projects placed in service in 2012, primarily in the fourth quarter.
54
Sources and uses of NEE's and FPL's cash for
2014
,
2013
and
2012
were as follows:
|
NEE
|
FPL
|
||||||||||||||||||||||
|
Years Ended December 31,
|
Years Ended December 31,
|
||||||||||||||||||||||
|
2014
|
2013
|
2012
|
2014
|
2013
|
2012
|
||||||||||||||||||
|
(millions)
|
|||||||||||||||||||||||
|
Sources of cash:
|
|||||||||||||||||||||||
|
Cash flows from operating activities
|
$
|
5,500
|
|
$
|
5,102
|
|
$
|
3,992
|
|
$
|
3,454
|
|
$
|
3,558
|
|
$
|
2,823
|
|
|||||
|
Long-term borrowings
|
5,054
|
|
4,371
|
|
6,630
|
|
997
|
|
497
|
|
1,296
|
|
|||||||||||
|
Change in loan proceeds restricted for construction
|
—
|
|
228
|
|
314
|
|
—
|
|
—
|
|
—
|
|
|||||||||||
|
Proceeds from sale of differential membership interests, net of payments
|
907
|
|
385
|
|
669
|
|
—
|
|
—
|
|
—
|
|
|||||||||||
|
Sale of independent power and other investments
|
307
|
|
165
|
|
—
|
|
—
|
|
—
|
|
—
|
|
|||||||||||
|
Capital contributions from NEE
|
—
|
|
—
|
|
—
|
|
100
|
|
275
|
|
440
|
|
|||||||||||
|
Cash grants under the Recovery Act
|
343
|
|
165
|
|
196
|
|
—
|
|
—
|
|
—
|
|
|||||||||||
|
Issuances of common stock - net
|
633
|
|
842
|
|
405
|
|
—
|
|
—
|
|
—
|
|
|||||||||||
|
Net increase in short-term debt
|
451
|
|
—
|
|
61
|
|
938
|
|
99
|
|
—
|
|
|||||||||||
|
Proceeds from sale of noncontrolling interest in subsidiaries
|
438
|
|
—
|
|
—
|
|
—
|
|
—
|
|
—
|
|
|||||||||||
|
Other sources - net
|
—
|
|
66
|
|
141
|
|
—
|
|
30
|
|
68
|
|
|||||||||||
|
Total sources of cash
|
13,633
|
|
11,324
|
|
12,408
|
|
5,489
|
|
4,459
|
|
4,627
|
|
|||||||||||
|
Uses of cash:
|
|||||||||||||||||||||||
|
Capital expenditures, independent power and other investments and nuclear fuel purchases
|
(7,017
|
)
|
(6,682
|
)
|
(9,461
|
)
|
(3,241
|
)
|
(2,903
|
)
|
(4,285
|
)
|
|||||||||||
|
Retirements of long-term debt
|
(4,750
|
)
|
(2,396
|
)
|
(1,612
|
)
|
(355
|
)
|
(453
|
)
|
(50
|
)
|
|||||||||||
|
Net decrease in short-term debt
|
—
|
|
(720
|
)
|
—
|
|
—
|
|
—
|
|
(225
|
)
|
|||||||||||
|
Dividends
|
(1,261
|
)
|
(1,122
|
)
|
(1,004
|
)
|
(1,550
|
)
|
(1,070
|
)
|
—
|
|
|||||||||||
|
Repurchases of common stock
|
—
|
|
—
|
|
(19
|
)
|
—
|
|
—
|
|
—
|
|
|||||||||||
|
Other uses - net
|
(466
|
)
|
(295
|
)
|
(360
|
)
|
(348
|
)
|
(54
|
)
|
(63
|
)
|
|||||||||||
|
Total uses of cash
|
(13,494
|
)
|
(11,215
|
)
|
(12,456
|
)
|
(5,494
|
)
|
(4,480
|
)
|
(4,623
|
)
|
|||||||||||
|
Net increase (decrease) in cash and cash equivalents
|
$
|
139
|
|
$
|
109
|
|
$
|
(48
|
)
|
$
|
(5
|
)
|
$
|
(21
|
)
|
$
|
4
|
|
|||||
NEE's primary capital requirements are for expanding and enhancing FPL's electric system and generating facilities to continue to provide reliable service to meet customer electricity demands and for funding NEER's investments in independent power and other projects. The following table provides a summary of the major capital investments for
2014
,
2013
and
2012
.
|
Years Ended December 31,
|
|||||||||||
|
2014
|
2013
|
2012
|
|||||||||
|
(millions)
|
|||||||||||
|
FPL:
|
|||||||||||
|
Generation:
|
|||||||||||
|
New
|
$
|
744
|
|
$
|
931
|
|
$
|
2,488
|
|
||
|
Existing
|
905
|
|
655
|
|
520
|
|
|||||
|
Transmission and distribution
|
1,307
|
|
873
|
|
966
|
|
|||||
|
Nuclear fuel
|
174
|
|
212
|
|
215
|
|
|||||
|
General and other
|
148
|
|
162
|
|
95
|
|
|||||
|
Other, primarily change in accrued property additions and exclusion of AFUDC - equity
|
(37
|
)
|
70
|
|
1
|
|
|||||
|
Total
|
3,241
|
|
2,903
|
|
4,285
|
|
|||||
|
NEER:
|
|
|
|
|
|||||||
|
Wind
|
2,136
|
|
1,725
|
|
2,365
|
|
|||||
|
Solar
|
546
|
|
914
|
|
1,235
|
|
|||||
|
Nuclear, including nuclear fuel
|
262
|
|
269
|
|
286
|
|
|||||
|
Other
|
683
|
|
705
|
|
795
|
|
|||||
|
Total
|
3,627
|
|
3,613
|
|
4,681
|
|
|||||
|
Corporate and Other
|
149
|
|
166
|
|
495
|
|
|||||
|
Total capital expenditures, independent power and other investments and nuclear fuel purchases
|
$
|
7,017
|
|
$
|
6,682
|
|
$
|
9,461
|
|
||
55
Liquidity
At December 31, 2014, NEE's total net available liquidity was approximately $7.0 billion, of which FPL's portion was approximately $2.1 billion. The table below provides the components of FPL's and NEECH's net available liquidity at December 31, 2014.
|
Maturity Date
|
|||||||||||||||
|
FPL
|
NEECH
|
Total
|
FPL
|
NEECH
|
|||||||||||
|
(millions)
|
|||||||||||||||
|
Bank revolving line of credit facilities
(a)
|
$
|
3,000
|
|
$
|
4,850
|
|
$
|
7,850
|
|
(b)
|
(b)
|
||||
|
Less letters of credit
|
(3
|
)
|
(843
|
)
|
(846
|
)
|
|||||||||
|
2,997
|
|
4,007
|
|
7,004
|
|
||||||||||
|
Revolving credit facility
|
235
|
|
—
|
|
235
|
|
May 2015
|
||||||||
|
Less borrowings
|
—
|
|
—
|
|
—
|
|
|||||||||
|
235
|
|
—
|
|
235
|
|
||||||||||
|
Letter of credit facilities
(c)
|
—
|
|
650
|
|
650
|
|
2017
|
||||||||
|
Less letters of credit
|
—
|
|
(313
|
)
|
(313
|
)
|
|||||||||
|
—
|
|
337
|
|
337
|
|
||||||||||
|
Subtotal
|
3,232
|
|
4,344
|
|
7,576
|
|
|||||||||
|
Cash and cash equivalents
|
14
|
|
562
|
|
576
|
|
|||||||||
|
Less commercial paper
|
(1,142
|
)
|
-
|
|
(1,142
|
)
|
|||||||||
|
Net available liquidity
|
$
|
2,104
|
|
$
|
4,906
|
|
$
|
7,010
|
|
||||||
______________________
|
(a)
|
Provide for the funding of loans up to $7,850 million ($3,000 million for FPL) and the issuance of letters of credit up to $6,600 million ($2,500 million for FPL). The entire amount of the credit facilities is available for general corporate purposes and to provide additional liquidity in the event of a loss to the companies’ or their subsidiaries’ operating facilities (including, in the case of FPL, a transmission and distribution property loss). FPL’s bank revolving line of credit facilities are also available to support the purchase of $633 million of pollution control, solid waste disposal and industrial development revenue bonds (tax exempt bonds) in the event they are tendered by individual bond holders and not remarketed prior to maturity.
|
|
(b)
|
$500 million of FPL's and $750 million of NEECH's bank revolving line of credit facilities expire in 2016, essentially all of the remaining facilities at each of FPL and NEECH expire in 2020.
|
|
(c)
|
Only available for the issuance of letters of credit.
|
As of
February 20, 2015
, 68
b
anks participate in FPL’s and NEECH’s revolving credit facilities, with no one bank providing more than 6% of the combined revolving credit facilities. European banks provide approximately 32
%
of the combined revolving credit facilities. Pursuant to a 1998 guarantee agreement, NEE guarantees the payment of NEECH’s debt obligations under the revolving credit facilities.
In order for FPL or NEECH to borrow or to have letters of credit issued under the terms of their respective revolving credit facilities, FPL, in the case of FPL, and NEE, in the case of NEECH, are required, among other things, to maintain a ratio of funded debt to total capitalization that does not exceed a stated ratio.
The FPL and NEECH revolving credit facilities also contain default and related acceleration provisions relating to, among other things, failure of FPL and NEE, as the case may be, to maintain the respective ratio of funded debt to total capitalization at or below the specified ratio. At
December 31, 2014
, each of NEE and FPL was in compliance with its required ratio.
Additionally, an indirect wholly-owned subsidiary of NEER has four variable rate Canadian revolving credit agreements with a capacity totaling
C$1,000 million and expiration dates ranging from March 2015 to 2016. These facilities are available for general corporate purposes; however, the current intent is to use these facilities for the purchase, development, construction and/or operation of Canadian renewable generating assets. In order to borrow or issue letters of credit under the terms of these agreements, among other things, NEE is required to maintain a ratio of funded debt to total capitalization that does not exceed a stated ratio. These agreements also contain certain covenants and default and related acceleration provisions relating to, among other things, failure of NEE to maintain a ratio of funded debt to total capitalization at or below the specified ratio. The payment obligations under these agreements are ultimately guaranteed by NEE. As of
December 31, 2014
, approximately $157 million of capacity remained available under these revolving credit agreements.
Also, an indirect wholly-owned subsidiary of NEER, has a $425 million limited-recourse variable rate construction and term loan facility maturing in 2035 and a $154 million variable rate cash grant bridge loan facility maturing in 2017. Proceeds from the borrowings under the construction and term loan facility and the cash grant bridge loan facility (cash grant loans) are available to fund a portion of the costs associated with the construction and development of a 250 MW solar PV project in California, which is expected to be completed by the end of 2016. The financing documents relating to the facilities contain default and related acceleration provisions relating to, among other things, the failure to make required payments or to observe other covenants in the financing documents (including a requirement that the solar PV project must be completed by a certain date). The payment obligations under the cash grant loans are guaranteed by NEECH, which are in turn guaranteed by NEE. Pursuant to the NEECH guarantee, if NEECH’s senior unsecured debt rating falls below a specified threshold, the guaranty shall be replaced by an acceptable guarantee of another
56
person, an acceptable letter of credit, or cash. As of
December 31, 2014
, $425 million of the construction and term loan facility and approximately $29 million of the cash grant bridge loan facility remained available.
Also, NEP OpCo and NEP OpCo's direct subsidiaries (Loan Parties) entered into a $250 million variable rate, senior secured revolving credit facility that expires in 2019. The revolving credit facility includes borrowing capacity for letters of credit and incremental commitments to increase the revolving credit facility to up to $1 billion in the aggregate, subject to certain conditions. Borrowings under the revolving credit facility can be used by the Loan Parties to fund working capital and expansion projects, to make acquisitions and for general business purposes. The financing documents related to the revolving credit facility contain default and related acceleration provisions relating to the failure to make required payments or to observe other covenants in the revolving credit facility and related documents. Additionally, NEP OpCo and one of its direct subsidiaries are required to comply with certain financial covenants on a quarterly basis and NEP OpCo's ability to pay cash distributions is subject to certain other restrictions. All borrowings under the revolving credit facility are guaranteed by NEP OpCo and NEP, and must be repaid by the end of the revolving credit term. As of
December 31, 2014
, there were no amounts drawn under the revolving credit facility.
Storm Restoration Costs
As of
December 31, 2014
, FPL had the capacity to absorb up to approximately
$122
million in future prudently incurred storm restoration costs without seeking recovery through a rate adjustment from the FPSC or filing a petition with the FPSC. See Note 1 – Revenue and Rates.
Dodd-Frank Act
The Dodd-Frank Act, enacted into law in July 2010, provides for, among other things, substantially increased regulation of the OTC derivatives and futures contract markets. The Dodd-Frank Act includes provisions that require certain OTC derivatives, or swaps, to be centrally cleared and executed through an exchange or other approved trading platform. While the legislation is broad and detailed, there are still portions of the legislation that either require implementing rules to be adopted by federal governmental agencies including, but not limited to, the SEC and the CFTC or otherwise require further interpretive guidance from federal government agencies. NEE and FPL continue to monitor the development of rules related to the Dodd-Frank Act and have taken steps to comply with those rules that affect their businesses. A number of rules have been finalized and are effective, including the swap reporting and recordkeeping obligations applicable to derivative end users such as NEE and FPL. The implementation of these rules has not had a material effect on NEE and FPL; however, the rules have added and are expected to add more cost and compliance risks related to hedging activities. One set of rules that has been proposed, but not yet adopted, relates to mandatory margin for OTC derivatives. In addition to the U.S. proposals under the Dodd-Frank Act, European regulators have proposed similar rules that could impact trading between European dealers and U.S. counterparties. If these or similar rules, when finalized, require NEE and FPL to post significant amounts of cash collateral with respect to swap transactions, NEE's and FPL's liquidity could be materially adversely affected.
NEE and FPL cannot predict the impact these proposed rules will have on their ability to hedge their commodity and interest rate risks or on OTC derivatives markets as a whole, but management believes that they could potentially have a material adverse effect on NEE's and FPL's risk exposure, as well as reduce market liquidity and further increase the cost of hedging activities.
Capital Support
Letters of Credit, Surety Bonds and Guarantees
Certain subsidiaries of NEE, including FPL, obtain letters of credit and surety bonds and issue guarantees to facilitate commercial transactions with third parties and financings. Letters of credit, surety bonds and guarantees support, among other things, the buying and selling of wholesale energy commodities, debt and related reserves, capital expenditures for NEER's wind and solar development, nuclear activities and other contractual agreements.
Substantially all of NEE's and FPL's guarantee arrangements are on behalf of their consolidated subsidiaries for their related payment obligations.
In addition, as part of contract negotiations in the normal course of business, NEE and certain of its subsidiaries, including FPL, may agree to make payments to compensate or indemnify other parties for possible future unfavorable financial consequences resulting from specified events. The specified events may include, but are not limited to, an adverse judgment in a lawsuit, the imposition of additional taxes due to a change in tax law or interpretations of the tax law or the non-receipt of renewable tax credits or proceeds from cash grants under the Recovery Act. NEE and FPL are unable to develop an estimate of the maximum potential amount of future payments under some of these contracts because events that would obligate them to make payments have not yet occurred or, if any such event has occurred, they have not been notified of its occurrence.
In addition, NEE has guaranteed certain payment obligations of NEECH, including most of its debt and all of its debentures and commercial paper issuances, as well as most of its payment guarantees and indemnifications, and NEECH has guaranteed certain debt and other obligations of NEER and its subsidiaries.
At
December 31, 2014
, NEE had approximately $1.3 billion of standby letters of credit ($3 million for FPL), approximately $203 million of surety bonds ($30 million for FPL) and approximately $11.2 billion notional amount of guarantees and indemnifications
57
($25 million for FPL), of which approximately $7.0 billion of letters of credit, guarantees and indemnifications ($6 million for FPL)
have expiration dates within the next five years.
Each of NEE and FPL believe it is unlikely that it would incur any liabilities associated with these letters of credit, surety bonds, guarantees and indemnifications. Accordingly, at
December 31, 2014
, NEE and FPL did not have any liabilities recorded for these letters of credit, surety bonds, guarantees and indemnifications.
Shelf Registration
In August 2012, NE
E, NEECH and FPL filed a shelf registration statement with the SEC for an unspecified amount of securities which became effective upon filing. The amount of securities issuable by the companies is established from time to time by their respective boards of directors. As of
February 20, 2015
, securities that may be issued under the registration statement include, depending on the registrant, senior debt securities, subordinated debt securities, junior subordinated debentures, first mortgage bonds, common stock, preferred stock, stock purchase contracts, stock purchase units, warrants and guarantees related to certain of those securities. As of
February 20, 2015
, the board-authorized capacity available to issue securities was approximately $6.5 billion
for NEE and NEECH (issuable by either or both of them up to such aggregate amount) and $2.5 billion for FPL.
Contractual Obligations and Estimated Capital Expenditures
NEE’s and FPL’s commitments at
December 31, 2014
were as follows:
|
2015
|
2016
|
2017
|
2018
|
2019
|
Thereafter
|
Total
|
|||||||||||||||||||||
|
(millions)
|
|||||||||||||||||||||||||||
|
Long-term debt, including interest:
(a)
|
|||||||||||||||||||||||||||
|
FPL
|
$
|
499
|
|
$
|
500
|
|
$
|
801
|
|
$
|
484
|
|
$
|
485
|
|
$
|
15,989
|
|
(b)
|
$
|
18,758
|
|
|||||
|
NEER
|
2,008
|
|
1,257
|
|
775
|
|
990
|
|
503
|
|
4,750
|
|
10,283
|
|
|||||||||||||
|
Corporate and Other
|
2,221
|
|
657
|
|
2,084
|
|
937
|
|
1,832
|
|
13,065
|
|
20,796
|
|
|||||||||||||
|
Purchase obligations:
|
|||||||||||||||||||||||||||
|
FPL
(c)
|
5,208
|
|
4,578
|
|
3,832
|
|
3,532
|
|
3,517
|
|
15,432
|
|
36,099
|
|
|||||||||||||
|
NEER
(d)
|
1,770
|
|
860
|
|
135
|
|
125
|
|
75
|
|
380
|
|
3,345
|
|
|||||||||||||
|
Corporate and Other
(e)
|
370
|
|
880
|
|
445
|
|
385
|
|
70
|
|
40
|
|
2,190
|
|
|||||||||||||
|
Elimination of FPL's purchase obligations to NEECH
(f)
|
—
|
|
—
|
|
(59
|
)
|
(87
|
)
|
(84
|
)
|
(1,327
|
)
|
(1,557
|
)
|
|||||||||||||
|
Asset retirement activities:
(g)
|
|||||||||||||||||||||||||||
|
FPL
(h)
|
19
|
|
—
|
|
—
|
|
—
|
|
—
|
|
6,972
|
|
6,991
|
|
|||||||||||||
|
NEER
(i)
|
—
|
|
—
|
|
—
|
|
—
|
|
—
|
|
13,217
|
|
13,217
|
|
|||||||||||||
|
Other commitments:
|
|||||||||||||||||||||||||||
|
NEER
(j)
|
97
|
|
111
|
|
130
|
|
180
|
|
166
|
|
455
|
|
1,139
|
|
|||||||||||||
|
Total
|
$
|
12,192
|
|
$
|
8,843
|
|
$
|
8,143
|
|
$
|
6,546
|
|
$
|
6,564
|
|
$
|
68,973
|
|
$
|
111,261
|
|
||||||
______________________
|
(a)
|
Includes principal, interest and interest rate swaps. Variable rate interest was computed using
December 31, 2014
rates. See Note 11.
|
|
(b)
|
Includes $633 million of tax exempt bonds that permit individual bond holders to tender the bonds for purchase at any time prior to maturity. In the event bonds are tendered for purchase, they would be remarketed by a designated remarketing agent in accordance with the related indenture. If the remarketing is unsuccessful, FPL would be required to purchase the tax exempt bonds. As of
December 31, 2014
, all tax exempt bonds tendered for purchase have been successfully remarketed. FPL’s bank revolving line of credit facilities are available to support the purchase of tax exempt bonds.
|
|
(c)
|
Represents required capacity and minimum charges under long-term purchased power and fuel contracts (see Note 13 - Contracts), and projected capital expenditures through 2019 (see Note 13 - Commitments).
|
|
(d)
|
Represents firm commitments primarily in connection with construction and development activities and fuel-related contracts. See Note 13 - Commitments and - Contracts.
|
|
(e)
|
Represents firm commitments primarily related to construction of natural gas pipelines. See Note 13 - Contracts.
|
|
(f)
|
See Note 13 - Contracts.
|
|
(g)
|
Represents expected cash payments adjusted for inflation for estimated costs to perform asset retirement activities.
|
|
(h)
|
At
December 31, 2014
, FPL had approximately $3,449 million in restricted funds for the payment of future expenditures to decommission FPL’s nuclear units, which are included in NEE’s and FPL’s special use funds. See Note 12.
|
|
(i)
|
At
December 31, 2014
, NEER’s 88.23% portion of Seabrook’s and 70% portion of Duane Arnold’s and its Point Beach’s restricted funds for the payment of future expenditures to decommission its nuclear units totaled approximately $1,642 million and are included in NEE’s special use funds. See Note 12.
|
|
(j)
|
Represents estimated cash distributions related to differential membership interests and payments related to the acquisition of certain development rights. For further discussion of differential membership interests, see Note 1 - Sale of Differential Membership Interests.
|
58
Credit Ratings
NEE’s and FPL’s liquidity, ability to access credit and capital markets, cost of borrowings and collateral posting requirements under certain agreements are dependent on their credit ratings. At
February 20, 2015
, Moody’s Investors Service, Inc. (Moody’s), Standard & Poor’s Ratings Services (S&P) and Fitch Ratings (Fitch) had assigned the following credit ratings to NEE, FPL and NEECH:
|
Moody's
(a)
|
S&P
(a)
|
Fitch
(a)
|
|||
|
NEE:
(b)
|
|||||
|
Corporate credit rating
|
Baa1
|
A-
|
A-
|
||
|
FPL:
(b)
|
|||||
|
Corporate credit rating
|
A1
|
A-
|
A
|
||
|
First mortgage bonds
|
Aa2
|
A
|
AA-
|
||
|
Pollution control, solid waste disposal and industrial development revenue bonds
|
VMIG-1
|
A
|
A+
|
||
|
Commercial paper
|
P-1
|
A-2
|
F1
|
||
|
NEECH:
(b)
|
|||||
|
Corporate credit rating
|
Baa1
|
A-
|
A-
|
||
|
Debentures
|
Baa1
|
BBB+
|
A-
|
||
|
Junior subordinated debentures
|
Baa2
|
BBB
|
BBB
|
||
|
Commercial paper
|
P-2
|
A-2
|
F1
|
||
______________________
|
(a)
|
A security rating is not a recommendation to buy, sell or hold securities and should be evaluated independently of any other rating. The rating is subject to revision or withdrawal at any time by the assigning rating organization.
|
|
(b)
|
The outlook indicated by each of Moody's, S&P and Fitch is stable.
|
NEE and its subsidiaries, including FPL, have no credit rating downgrade triggers that would accelerate the maturity dates of outstanding debt. A change in ratings is not an event of default under applicable debt instruments, and while there are conditions to drawing on the credit facilities noted above, the maintenance of a specific minimum credit rating is not a condition to drawing on these credit facilities.
Commitment fees and interest rates on loans under these credit facilities’ agreements are tied to credit ratings. A ratings downgrade also could reduce the accessibility and increase the cost of commercial paper and other short-term debt issuances and additional or replacement credit facilities. In addition, a ratings downgrade could result in, among other things, the requirement that NEE subsidiaries, including FPL, post collateral under certain agreements, including, but not limited to, those related to fuel procurement, power sales and purchases, nuclear decommissioning funding, debt-related reserves and trading activities. FPL’s and NEECH’s credit facilities are available to support these potential requirements.
Covenants
NEE's charter does not limit the dividends that may be paid on its common stock. As a practical matter, the ability of NEE to pay dividends on its common stock is dependent upon, among other things, dividends paid to it by its subsidiaries. For example, FPL pays dividends to NEE in a manner consistent with FPL's long-term targeted capital structure. However, the mortgage securing FPL's first mortgage bonds contains provisions which, under certain conditions, restrict the payment of dividends to NEE and the issuance of additional first mortgage bonds. Additionally, in some circumstances, the mortgage restricts the amount of retained earnings that FPL can use to pay cash dividends on its common stock. The restricted amount may change based on factors set out in the mortgage. Other than this restriction on the payment of common stock dividends, the mortgage does not restrict FPL's use of retained earnings. As of
December 31, 2014
, no retained earnings were restricted by these provisions of the mortgage and, in light of FPL's current financial condition and level of earnings, management does not expect that planned financing activities or dividends would be affected by these limitations.
FPL may issue first mortgage bonds under its mortgage subject to its meeting an adjusted net earnings test set forth in the mortgage, wh
ich generally requires adjusted net earnings to be at least twice the annual interest requirements on, or at least 10% of the aggregate principal amount of, FPL’s first mortgage bonds including those to be issued and any other non-junior FPL indebtedness. As of
December 31, 2014
, coverage for the 12 months ended
December 31, 2014
would have been approximately 7.2 times the annual interest requirements and approximately 3.6 times the aggregate principal requirements. New first mortgage bonds are also limited to an amount equal to the sum of 60% of unfunded property additions after adjustments to offset property retirements, the amount of retired first mortgage bonds or qualified lien bonds and the amount of cash on deposit with the mortgage trustee. As of
December 31, 2014
, FPL could have issued in excess of $10.7 billion of additional first mortgage bonds based on the unfunded property additions and in excess of $5.8 billion based on retired first mortgage bonds. As of
December 31, 2014
, no cash was deposited with the mortgage trustee for these purposes.
In September 2006, NEE and NEECH executed a Replacement Capital Covenant (September 2006 RCC) in connection with NEECH's offering of $350 million principal amount of Series B Enhanced Junior Subordinated Debentures due 2066 (Series B junior
59
subordinated debentures). The September 2006 RCC is for the benefit of persons that buy, hold or sell a specified series of long‑term indebtedness (covered debt) of NEECH (other than the Series B junior subordinated debentures) or, in certain cases, of NEE. FPL Group Capital Trust I's 5 7/8% Preferred Trust Securities have been initially designated as the covered debt under the September 2006 RCC. The September 2006 RCC provides that NEECH may redeem, and NEE or NEECH may purchase, any Series B junior subordinated debentures on or before October 1, 2036, only to the extent that the redemption or purchase price does not exceed a specified amount of proceeds from the sale of qualifying securities, subject to certain limitations described in the September 2006 RCC. Qualifying securities are securities that have equity-like characteristics that are the same as, or more equity-like than, the Series B junior subordinated debentures at the time of redemption or purchase, which are sold within 180 days prior to the date of the redemption or repurchase of the Series B junior subordinated debentures.
In June 2007, NEE and NEECH executed a Replacement Capital Covenant (June 2007 RCC) in connection with NEECH's offering of $400 million principal amount of its Series C Junior Subordinated Debentures due 2067 (Series C junior subordinated debentures). The June 2007 RCC is for the benefit of persons that buy, hold or sell a specified series of covered debt of NEECH (other than the Series C junior subordinated debentures) or, in certain cases, of NEE. FPL Group Capital Trust I's 5 7/8% Preferred Trust Securities have been initially designated as the covered debt under the June 2007 RCC. The June 2007 RCC provides that NEECH may redeem or purchase, or satisfy, discharge or defease (collectively, defease), and NEE and any majority-owned subsidiary of NEE or NEECH may purchase, any Series C junior subordinated debentures on or before June 15, 2037, only to the extent that the principal amount defeased or the applicable redemption or purchase price does not exceed a specified amount raised from the issuance, during the 180 days prior to the date of that redemption, purchase or defeasance, of qualifying securities that have equity-like characteristics that are the same as, or more equity-like than, the applicable characteristics of the Series C junior subordinated debentures at the time of redemption, purchase or defeasance, subject to certain limitations described in the June 2007 RCC.
In September 2007, NEE and NEECH executed a Replacement Capital Covenant (September 2007 RCC) in connection with NEECH's offering of $250 million principal amount of its Series D Junior Subordinated Debentures due 2067 (Series D junior subordinated debentures). The September 2007 RCC is for the benefit of persons that buy, hold or sell a specified series of covered debt of NEECH (other than the Series D junior subordinated debentures) or, in certain cases, of NEE. FPL Group Capital Trust I's 5 7/8% Preferred Trust Securities have been initially designated as the covered debt under the September 2007 RCC. The September 2007 RCC provides that NEECH may redeem, purchase, or defease, and NEE and any majority-owned subsidiary of NEE or NEECH may purchase, any Series D junior subordinated debentures on or before September 1, 2037, only to the extent that the principal amount defeased or the applicable redemption or purchase price does not exceed a specified amount raised from the issuance, during the 180 days prior to the date of that redemption, purchase or defeasance, of qualifying securities that have equity-like characteristics that are the same as, or more equity-like than, the applicable characteristics of the Series D junior subordinated debentures at the time of redemption, purchase or defeasance, subject to certain limitations described in the September 2007 RCC.
New Accounting Rules and Interpretations
Revenue Recognition -
In May 2014, the Financial Accounting Standards Board issued a new accounting standard related to the recognition of revenue from contracts with customers and required disclosures. See Note 1 - Revenue and Rates.
CRITICAL ACCOUNTING POLICIES AND ESTIMATES
NEE’s and FPL’s significant accounting policies are described in Note 1 to the consolidated financial statements, which were prepared under GAAP. Critical accounting policies are those that NEE and FPL believe are both most important to the portrayal of their financial condition and results of operations, and require complex, subjective judgments, often as a result of the need to make estimates and assumptions about the effect of matters that are inherently uncertain. Judgments and uncertainties affecting the application of those policies may result in materially different amounts being reported under different conditions or using different assumptions.
NEE and FPL consider the following policies to be the most critical in understanding the judgments that are involved in preparing their consolidated financial statements:
Accounting for Derivatives and Hedging Activities
NEE and FPL use derivative instruments (primarily swaps, options, futures and forwards) to manage the commodity price risk inherent in the purchase and sale of fuel and electricity, as well as interest rate and foreign currency exchange rate risk associated with outstanding and forecasted debt issuances. In addition, NEE, through NEER, uses derivatives to optimize the value of power generation and gas infrastructure assets and engages in power and gas marketing and trading activities to take advantage of expected future favorable price movements.
60
Nature of Accounting Estimates
Accounting pronouncements require the use of fair value accounting if certain conditions are met, which requires significant judgment to measure the fair value of assets and liabilities. This applies not only to traditional financial derivative instruments, but to any contract having the accounting characteristics of a derivative. Much of the existing accounting guidance related to derivatives focuses on when certain contracts for the purchase and sale of power and certain fuel supply contracts can be excluded from derivative accounting rules, however the guidance does not address all contract issues. As a result, significant judgment must be used in applying derivatives accounting guidance to contracts. In the event changes in interpretation occur, it is possible that contracts that currently are excluded from derivatives accounting rules would have to be recorded on the balance sheet at fair value, with changes in the fair value recorded in the statement of income.
Assumptions and Accounting Approach
NEE's and FPL’s derivative instruments, when required to be marked to market, are recorded on the balance sheet at fair value. Fair values for some of the longer-term contracts where liquid markets are not available are derived through internally developed models which estimate the fair value of a contract by calculating the present value of the difference between the contract price and the forward prices. Forward prices represent the price at which a buyer or seller could contract today to purchase or sell a commodity at a future date.
The near-term forward market for electricity is generally liquid and therefore the prices in the early years of the forward curves reflect observable market quotes. However, in the later years, the market is much less liquid and forward price curves must be developed using factors including the forward prices for the commodities used as fuel to generate electricity, the expected system heat rate (which measures the efficiency of power plants in converting fuel to electricity) in the region where the purchase or sale takes place, and a fundamental forecast of expected spot prices based on modeled supply and demand in the region. NEE estimates the fair value of interest rate and foreign currency derivatives using a discounted cash flows valuation technique based on the net amount of estimated future cash inflows and outflows related to the derivative agreements. The assumptions in these models are critical since any changes therein could have a significant impact on the fair value of the derivative.
At FPL, substantially all changes in the fair value of energy derivative transactions are deferred as a regulatory asset or liability until the contracts are settled, and, upon settlement, any gains or losses are passed through the
fuel clause
. See Note 3.
In NEE’s non-rate regulated operations, predominantly NEER, essentially all changes in the derivatives’ fair value for power purchases and sales, fuel sales and trading activities are recognized on a net basis in operating revenues; fuel purchases used in the production of electricity are recognized in fuel, purchased power and interchange expense; and the equity method investees’ related activity is recognized in equity in earnings of equity method investees in NEE’s consolidated statements of income.
For those transactions accounted for as cash flow hedges, much of the effects of changes in fair value are reflected in OCI, a component of common shareholders’ equity, rather than being recognized in current earnings. For those transactions accounted for as fair value hedges, the effects of changes in fair value are reflected in current earnings offset by changes in the fair value of the item being hedged.
Certain hedging transactions at NEER are entered into as economic hedges but the transactions do not meet the requirements for hedge accounting, hedge accounting treatment is not elected or hedge accounting has been discontinued.
Changes in the fair value of those transactions are marked to market and reported in the consolidated statements of income, resulting in earnings volatility. These changes in fair value are captured in the non-qualifying hedge category in computing adjusted earnings. This could be significant to NEER’s results because the economic offset to the positions are not marked to market. As a consequence, NEE's net income reflects only the movement in one part of economically-linked transactions. For example, a gain (loss) in the non-qualifying hedge category for certain energy derivatives is offset by decreases (increases) in the fair value of related physical asset positions in the portfolio or contracts, which are not marked to market under GAAP. For this reason, NEE’s management views results expressed excluding the unrealized mark-to-market impact of the non-qualifying hedges as a meaningful measure of current period performance. For additional information regarding derivative instruments, see Note 3, Overview and Energy Marketing and Trading and Market Risk Sensitivity.
Accounting for Pensions and Other Postretirement Benefits
NEE sponsors a qualified noncontributory defined benefit pension plan for substantially all employees of NEE and its subsidiaries. NEE also has a supplemental executive retirement plan (SERP) which includes a non-qualified supplemental defined benefit pension component that provides benefits to a select group of management and highly compensated employees. The impact of the SERP component is included within the pension plan as discussed below. Management believes that, based on actuarial assumptions and the well-funded status of the pension plan, NEE will not be required to make any cash contributions to the qualified pension plan in the near future.
In addition to pension benefits, NEE sponsors a contributory postretirement plan for health care and life insurance benefits (other benefits plan) for retirees of NEE and its subsidiaries meeting certain eligibility requirements. The qualified pension plan has a fully funded trust dedicated to providing the benefits under the plan. The other benefits plan has a partially funded trust dedicated to providing benefits related to life insurance. NEE allocates net periodic benefit income or cost associated with the pension and other benefits plans to its subsidiaries annually using specific criteria.
61
Nature of Accounting Estimates
For the pension plan, the benefit obligation is the actuarial present value as of the December 31 measurement date, of all benefits attributed by the pension benefit formula to employee service rendered to that date. The amount of benefit to be paid depends on a number of future events incorporated into the pension benefit formula, including estimates of the average life of employees/survivors and average years of service rendered. The projected benefit obligation is measured based on assumptions concerning future interest rates and future employee compensation levels. For the other benefits plan, the benefit obligation is the actuarial present value as of the December 31 measurement date of all future benefits attributed under the terms of the other benefits plan to employee service rendered to that date. NEE derives pension income and the cost of the other benefits plan from actuarial calculations based on each plan’s provisions and management’s assumptions regarding discount rate, rate of increase in compensation levels and expected long-term rate of return on plan assets and, in the case of the other benefits plan, health care cost trend rates.
Assumptions and Accounting Approach
Accounting guidance requires recognition of the funded status of benefit plans in the balance sheet, with changes in the funded status recognized in other comprehensive income within shareholders’ equity in the year in which the changes occur. Since NEE is the plan sponsor, and its subsidiaries do not have separate rights to the plan assets or direct obligations to their employees, this accounting guidance is reflected at NEE and not allocated to the subsidiaries. The portion of previously unrecognized actuarial gains and losses, prior service costs or credits and transition obligations that are estimated to be allocable to FPL as net periodic benefit (income) cost in future periods and that otherwise would be recorded in AOCI are classified as regulatory assets and liabilities at NEE in accordance with regulatory treatment.
Pension income and the cost of the other benefits plan are included in O&M expenses, and are calculated using a number of actuarial assumptions. Those assumptions for the years ended
December 31, 2014, 2013 and 2012
include:
|
•
|
an expected long-term rate of return on qualified plan assets of
7.75%
for the pension plan and
7.25%
,
7.75%
and
8.00%
for the other benefits plan, respectively,
|
|
•
|
assumed increases in salary of
4.00%
, and
|
|
•
|
weighted-average discount rates of
4.80%
,
4.00%
and
4.65%
for the pension plan and
4.60%
,
3.75%
and
4.53%
for the other benefits plan, respectively.
|
In developing these assumptions, NEE evaluated input, including other qualitative and quantitative factors, from its actuaries and consultants, as well as information available in the marketplace. In addition, for the expected long-term rate of return on fund assets, NEE considered different models, capital market return assumptions and historical returns for a portfolio with an equity/bond asset mix similar to its funds, as well as its funds' historical compounded returns. NEE believes that
7.75%
and
7.25%
are reasonable long-term rates of return on its pension plan and other benefits plan assets. NEE will continue to evaluate all of its actuarial assumptions, including its expected rate of return, at least annually, and will adjust them as necessary.
NEE utilizes in its determination of pension and other benefits plan expense or income a market-related valuation of plan assets. This market-related valuation reduces year-to-year volatility and recognizes investment gains or losses over a five-year period following the year in which they occur. Investment gains or losses for this purpose are the difference between the expected return calculated using the market-related value of plan assets and the actual return realized on those plan assets. Since the market-related value of plan assets recognizes gains or losses over a five-year period, the future value of plan assets will be affected as previously deferred gains or losses are recognized. Such gains and losses together with other differences between actual results and the estimates used in the actuarial valuations are deferred and recognized in determining pension income and other benefits plan expense only to the extent they exceed 10% of the greater of projected benefit obligations or the market-related value of plan assets.
The following table illustrates the effect on net periodic benefit income of changing the critical actuarial assumptions discussed above, while holding all other assumptions constant:
|
Increase (Decrease) in 2014
Net Periodic Benefit Income
|
|||||||||
|
Change in
Assumption
|
NEE
|
FPL
|
|||||||
|
(millions)
|
|||||||||
|
Expected long-term rate of return
|
(0.5)%
|
$
|
(17
|
)
|
$
|
(11
|
)
|
||
|
Discount rate
|
(0.5)%
|
$
|
2
|
|
$
|
1
|
|
||
|
Salary increase
|
0.5%
|
$
|
(1
|
)
|
$
|
(1
|
)
|
||
NEE also utilizes actuarial assumptions about mortality to help estimate obligations of both the pension and other benefits plans. In 2014, the Society of Actuaries released revised mortality tables and mortality improvement scales, which NEE adopted effective
62
December 31, 2014. The adoption of the new mortality tables and mortality improvement scales did not have a material impact on the pension and other benefits plans’ obligations.
See Note 2.
Carrying Value of Long-Lived Assets
NEE evaluates long-lived assets for impairment when events or changes in circumstances indicate that the carrying amount may not be recoverable.
Nature of Accounting Estimates
The amount of future net cash flows, the timing of the cash flows and the determination of an appropriate interest rate all involve estimates and judgments about future events. In particular, the aggregate amount of cash flows determines whether an impairment exists, and the timing of the cash flows is critical in determining fair value. Because each assessment is based on the facts and circumstances associated with each long-lived asset, the effects of changes in assumptions cannot be generalized.
Assumptions and Accounting Approach
An impairment loss is required to be recognized if the carrying value of the asset exceeds the undiscounted future net cash flows associated with that asset. The impairment loss to be recognized is the amount by which the carrying value of the long-lived asset exceeds the asset’s fair value. In most instances, the fair value is determined by discounting estimated future cash flows using an appropriate interest rate. See Note 4 - Nonrecurring Fair Value Measurements.
Decommissioning and Dismantlement
The components of NEE’s and FPL’s decommissioning of nuclear plants, dismantlement of plants and other accrued asset removal costs are as follows:
|
FPL
|
|||||||||||||||||||||||||||||||||||||||
|
Nuclear
Decommissioning
|
Fossil/Solar
Dismantlement
|
Interim Removal
Costs and Other
|
NEECH
(a)
|
NEE
|
|||||||||||||||||||||||||||||||||||
|
December 31,
|
December 31,
|
December 31,
|
December 31,
|
December 31,
|
|||||||||||||||||||||||||||||||||||
|
2014
|
|
2013
|
|
2014
|
|
2013
|
|
2014
|
|
2013
|
|
2014
|
|
2013
|
|
2014
|
|
2013
|
|
||||||||||||||||||||
|
(millions)
|
|||||||||||||||||||||||||||||||||||||||
|
AROs
|
$
|
1,303
|
|
$
|
1,237
|
|
$
|
48
|
|
$
|
44
|
|
$
|
4
|
|
$
|
4
|
|
$
|
631
|
|
$
|
565
|
|
$
|
1,986
|
|
$
|
1,850
|
|
|||||||||
|
Less capitalized ARO asset net of accumulated depreciation
|
—
|
|
—
|
|
(18
|
)
|
(19
|
)
|
—
|
|
—
|
|
—
|
|
—
|
|
(18
|
)
|
(19
|
)
|
|||||||||||||||||||
|
Accrued asset removal costs
(b)
|
280
|
|
260
|
|
311
|
|
323
|
|
1,307
|
|
1,256
|
|
6
|
|
—
|
|
1,904
|
|
1,839
|
|
|||||||||||||||||||
|
Asset retirement obligation regulatory expense difference
(b)
|
2,239
|
|
2,062
|
|
20
|
|
22
|
|
(2
|
)
|
(2
|
)
|
—
|
|
—
|
|
2,257
|
|
2,082
|
|
|||||||||||||||||||
|
Accrued decommissioning, dismantlement and other accrued asset removal costs
|
$
|
3,822
|
|
(c)
|
$
|
3,559
|
|
(c)
|
$
|
361
|
|
(c)
|
$
|
370
|
|
(c)
|
$
|
1,309
|
|
(c)
|
$
|
1,258
|
|
(c)
|
$
|
637
|
|
$
|
565
|
|
$
|
6,129
|
|
$
|
5,752
|
|
|||
______________________
|
(a)
|
Primarily NEER.
|
|
(b)
|
Regulatory liability on NEE’s and FPL’s consolidated balance sheets.
|
|
(c)
|
Represents total amount accrued for ratemaking purposes.
|
Nature of Accounting Estimates
The calculation of the future cost of retiring long-lived assets, including nuclear decommissioning and plant dismantlement costs, involves estimating the amount and timing of future expenditures and making judgments concerning whether or not such costs are considered a legal obligation. Estimating the amount and timing of future expenditures includes, among other things, making projections of when assets will be retired and ultimately decommissioned and how costs will escalate with inflation. In addition, NEE and FPL also make interest rate and rate of return projections on their investments in determining recommended funding requirements for nuclear decommissioning costs. Periodically, NEE and FPL are required to update these estimates and projections which can affect the annual expense amounts recognized, the liabilities recorded and the annual funding requirements for nuclear decommissioning costs. For example, an increase of 0.25% in the assumed escalation rates would increase NEE’s and FPL’s asset retirement obligations and conditional asset retirement obligations (collectively, AROs) as of
December 31, 2014
by $125 million and $103 million, respectively.
63
Assumptions and Accounting Approach
NEE and FPL each account for AROs under accounting guidance that requires a liability for the fair value of an ARO to be recognized in the period in which it is incurred if it can be reasonably estimated, with the offsetting associated asset retirement costs capitalized as part of the carrying amount of the long-lived assets.
FPL -
For ratemaking purposes, FPL accrues and funds for nuclear plant decommissioning costs over the expected service life of each unit based on studies that are filed with the FPSC. The studies reflect, among other things, the expiration dates of the operating licenses for FPL’s nuclear units. The most recent studies, filed in 2010, indicate that FPL’s portion of the future cost of decommissioning its four nuclear units, including spent fuel storage above what is expected to be refunded by the DOE under the spent fuel settlement agreement, is approximately $6.2 billion, or $2.6 billion expressed in
2014
dollars.
FPL accrues the cost of dismantling its fossil and solar plants over the expected service life of each unit based on studies filed with the FPSC. Unlike nuclear decommissioning, dismantlement costs are not funded. The most recent studies became effective January 1, 2010. At
December 31, 2014
, FPL’s portion of the ultimate cost to dismantle its fossil and solar units is approximately $746 million, or $385 million expressed in
2014
dollars. The majority of the dismantlement costs are not considered AROs. FPL accrues for interim removal costs over the life of the related assets based on depreciation studies approved by the FPSC. Any differences between the ARO amount recorded and the amount recorded for ratemaking purposes are reported as a regulatory liability in accordance with regulatory accounting.
NEER -
NEER records a liability for the present value of its expected decommissioning costs which is determined using various internal and external data and applying a probability percentage to a variety of scenarios regarding the life of the plant and timing of decommissioning. The liability is being accreted using the interest method through the date decommissioning activities are expected to be complete. At
December 31, 2014
, the ARO for nuclear decommissioning of NEER’s nuclear plants totaled approximately $462 million. NEER’s portion of the ultimate cost of decommissioning its nuclear plants, including costs associated with spent fuel storage above what is expected to be refunded by the DOE under the spent fuel settlement agreement, is estimated to be approximately $11.9 billion, or $2.0 billion expressed in
2014
dollars.
See Note 1 - Asset Retirement Obligations and - Decommissioning of Nuclear Plants, Dismantlement of Plants and Other Accrued Asset Removal Costs and Note 12.
Regulatory Accounting
NEE’s and FPL’s regulatory assets and liabilities are as follows:
|
NEE
|
FPL
|
||||||||||||||
|
December 31,
|
December 31,
|
||||||||||||||
|
2014
|
2013
|
2014
|
2013
|
||||||||||||
|
(millions)
|
|||||||||||||||
|
Regulatory assets:
|
|||||||||||||||
|
Current:
|
|||||||||||||||
|
Deferred clause and franchise expenses
|
$
|
268
|
|
$
|
192
|
|
$
|
268
|
|
$
|
192
|
|
|||
|
Derivatives
|
$
|
364
|
|
$
|
—
|
|
$
|
364
|
|
$
|
—
|
|
|||
|
Other
|
$
|
116
|
|
$
|
116
|
|
$
|
111
|
|
$
|
105
|
|
|||
|
Noncurrent:
|
|
|
|
|
|
|
|
|
|||||||
|
Securitized storm-recovery costs
|
$
|
294
|
|
$
|
372
|
|
$
|
294
|
|
$
|
372
|
|
|||
|
Other
|
$
|
657
|
|
$
|
426
|
|
$
|
468
|
|
$
|
396
|
|
|||
|
Regulatory liabilities:
|
|
|
|
|
|
|
|
|
|||||||
|
Current, included in other current liabilities
|
$
|
26
|
|
$
|
65
|
|
$
|
24
|
|
$
|
63
|
|
|||
|
Noncurrent:
|
|
|
|
|
|
|
|
|
|||||||
|
Accrued asset removal costs
|
$
|
1,904
|
|
$
|
1,839
|
|
$
|
1,898
|
|
$
|
1,839
|
|
|||
|
Asset retirement obligation regulatory expense difference
|
$
|
2,257
|
|
$
|
2,082
|
|
$
|
2,257
|
|
$
|
2,082
|
|
|||
|
Other
|
$
|
476
|
|
$
|
462
|
|
$
|
476
|
|
$
|
386
|
|
|||
Nature of Accounting Estimates
Regulatory assets and liabilities represent probable future revenues that will be recovered from or refunded to customers through the ratemaking process. Regulatory assets and liabilities are included in rate base or otherwise earn (pay) a return on investment during the recovery period.
64
Assumptions and Accounting Approach
Accounting guidance allows regulators to create assets and impose liabilities that would not be recorded by non-rate regulated entities. If NEE's rate-regulated entities, primarily FPL, were no longer subject to cost-based rate regulation, the existing regulatory assets and liabilities would be written off unless regulators specify an alternative means of recovery or refund. In addition, the regulators, including the FPSC for FPL, have the authority to disallow recovery of costs that it considers excessive or imprudently incurred. Such costs may include, among others, fuel and O&M expenses, the cost of replacing power lost when fossil and nuclear units are unavailable, storm restoration costs and costs associated with the construction or acquisition of new facilities. The continued applicability of regulatory accounting is assessed at each reporting period.
ENERGY MARKETING AND TRADING AND MARKET RISK SENSITIVITY
NEE and FPL are exposed to risks associated with adverse changes in commodity prices, interest rates and equity prices.
Financial instruments and positions affecting the financial statements of NEE and FPL described below are held primarily for purposes other than trading. Market risk is measured as the potential loss in fair value resulting from hypothetical reasonably possible changes in commodity prices, interest rates or equity prices over the next year.
Management has established risk management policies to monitor and manage such market risks, as well as credit risks.
Commodity Price Risk
NEE and FPL use derivative instruments (primarily swaps, options, futures and forwards) to manage the commodity price risk inherent in the purchase and sale of fuel and electricity. In addition, NEE, through NEER, uses derivatives to optimize the value of power generation and gas infrastructure assets and engages in power and gas marketing and trading activities to take advantage of expected future favorable price movements. See Critical Accounting Policies and Estimates - Accounting for Derivatives and Hedging Activities and Note 3.
During
2013
and
2014
, the changes in the fair value of NEE’s consolidated subsidiaries’ energy contract derivative instruments were as follows:
|
Hedges on Owned Assets
|
|||||||||||||||
|
Trading
|
Non-
Qualifying
|
FPL Cost
Recovery
Clauses
|
NEE Total
|
||||||||||||
|
(millions)
|
|||||||||||||||
|
Fair value of contracts outstanding at December 31, 2012
|
$
|
261
|
|
$
|
674
|
|
$
|
(15
|
)
|
$
|
920
|
|
|||
|
Reclassification to realized at settlement of contracts
|
(35
|
)
|
(42
|
)
|
(20
|
)
|
(97
|
)
|
|||||||
|
Inception value of new contracts and contracts sold
|
3
|
|
—
|
|
—
|
|
3
|
|
|||||||
|
Net option premium purchases (issuances)
|
(61
|
)
|
(12
|
)
|
—
|
|
(73
|
)
|
|||||||
|
Changes in fair value excluding reclassification to realized
|
133
|
|
(57
|
)
|
81
|
|
157
|
|
|||||||
|
Fair value of contracts outstanding at December 31, 2013
|
301
|
|
563
|
|
46
|
|
910
|
|
|||||||
|
Reclassification to realized at settlement of contracts
|
(51
|
)
|
58
|
|
(121
|
)
|
(114
|
)
|
|||||||
|
Inception value of new contracts and contracts sold
|
(4
|
)
|
—
|
|
—
|
|
(4
|
)
|
|||||||
|
Net option premium purchases (issuances)
|
(65
|
)
|
2
|
|
—
|
|
(63
|
)
|
|||||||
|
Changes in fair value excluding reclassification to realized
|
139
|
|
275
|
|
(288
|
)
|
126
|
|
|||||||
|
Fair value of contracts outstanding at December 31, 2014
|
320
|
|
898
|
|
(363
|
)
|
855
|
|
|||||||
|
Net margin cash collateral paid (received)
|
(264
|
)
|
|||||||||||||
|
Total mark-to-market energy contract net assets (liabilities) at December 31, 2014
|
$
|
320
|
|
$
|
898
|
|
$
|
(363
|
)
|
$
|
591
|
|
|||
NEE’s total mark-to-market energy contract net assets (liabilities) at
December 31, 2014
shown above are included on the consolidated balance sheets as follows:
|
December 31, 2014
|
|||
|
(millions)
|
|||
|
Current derivative assets
|
$
|
955
|
|
|
Noncurrent derivative assets
|
994
|
|
|
|
Current derivative liabilities
|
(1,090
|
)
|
|
|
Noncurrent derivative liabilities
|
(268
|
)
|
|
|
NEE's total mark-to-market energy contract net assets
|
$
|
591
|
|
65
The sources of fair value estimates and maturity of energy contract derivative instruments at
December 31, 2014
were as follows:
|
Maturity
|
|||||||||||||||||||||||||||
|
2015
|
2016
|
2017
|
2018
|
2019
|
Thereafter
|
Total
|
|||||||||||||||||||||
|
(millions)
|
|||||||||||||||||||||||||||
|
Trading:
|
|||||||||||||||||||||||||||
|
Quoted prices in active markets for identical assets
|
$
|
60
|
|
$
|
(5
|
)
|
$
|
—
|
|
$
|
—
|
|
$
|
—
|
|
$
|
—
|
|
$
|
55
|
|
||||||
|
Significant other observable inputs
|
(153
|
)
|
37
|
|
27
|
|
4
|
|
2
|
|
(3
|
)
|
(86
|
)
|
|||||||||||||
|
Significant unobservable inputs
|
271
|
|
45
|
|
41
|
|
(3
|
)
|
6
|
|
(9
|
)
|
351
|
|
|||||||||||||
|
Total
|
178
|
|
77
|
|
68
|
|
1
|
|
8
|
|
(12
|
)
|
320
|
|
|||||||||||||
|
Owned Assets - Non-Qualifying:
|
|
|
|
|
|
|
|||||||||||||||||||||
|
Quoted prices in active markets for identical assets
|
24
|
|
1
|
|
—
|
|
—
|
|
1
|
|
—
|
|
26
|
|
|||||||||||||
|
Significant other observable inputs
|
144
|
|
138
|
|
67
|
|
43
|
|
31
|
|
58
|
|
481
|
|
|||||||||||||
|
Significant unobservable inputs
|
60
|
|
40
|
|
43
|
|
37
|
|
30
|
|
181
|
|
391
|
|
|||||||||||||
|
Total
|
228
|
|
179
|
|
110
|
|
80
|
|
62
|
|
239
|
|
898
|
|
|||||||||||||
|
Owned Assets - FPL Cost Recovery Clauses:
|
|
|
|
|
|
|
|||||||||||||||||||||
|
Quoted prices in active markets for identical assets
|
—
|
|
—
|
|
—
|
|
—
|
|
—
|
|
—
|
|
—
|
|
|||||||||||||
|
Significant other observable inputs
|
(369
|
)
|
1
|
|
—
|
|
—
|
|
—
|
|
—
|
|
(368
|
)
|
|||||||||||||
|
Significant unobservable inputs
|
5
|
|
—
|
|
—
|
|
—
|
|
—
|
|
—
|
|
5
|
|
|||||||||||||
|
Total
|
(364
|
)
|
1
|
|
—
|
|
—
|
|
—
|
|
—
|
|
(363
|
)
|
|||||||||||||
|
Total sources of fair value
|
$
|
42
|
|
$
|
257
|
|
$
|
178
|
|
$
|
81
|
|
$
|
70
|
|
$
|
227
|
|
$
|
855
|
|
||||||
With respect to commodities, NEE’s Exposure Management Committee (EMC), which is comprised of certain members of senior management, and NEE's chief executive officer are responsible for the overall approval of market risk management policies and the delegation of approval and authorization levels. The EMC and NEE's chief executive officer receive periodic updates on market positions and related exposures, credit exposures and overall risk management activities.
NEE uses a value-at-risk (VaR) model to measure commodity price market risk in its trading and mark-to-market portfolios. The VaR is the estimated nominal loss of market value based on a one-day holding period at a 95% confidence level using historical simulation methodology. As of
December 31, 2014 and 2013
, the VaR figures are as follows:
|
Trading
|
Non-Qualifying Hedges
and Hedges in FPL Cost Recovery Clauses
(a)
|
Total
|
|||||||||||||||||||||||||||||||||
|
FPL
|
NEER
|
NEE
|
FPL
|
NEER
|
NEE
|
FPL
|
NEER
|
NEE
|
|||||||||||||||||||||||||||
|
(millions)
|
|||||||||||||||||||||||||||||||||||
|
December 31, 2013
|
$
|
—
|
|
$
|
2
|
|
$
|
2
|
|
$
|
36
|
|
$
|
54
|
|
$
|
43
|
|
$
|
36
|
|
$
|
55
|
|
$
|
42
|
|
||||||||
|
December 31, 2014
|
$
|
—
|
|
$
|
2
|
|
$
|
2
|
|
$
|
65
|
|
$
|
62
|
|
$
|
24
|
|
$
|
65
|
|
$
|
64
|
|
$
|
24
|
|
||||||||
|
Average for the year ended December 31, 2014
|
$
|
—
|
|
$
|
2
|
|
$
|
2
|
|
$
|
42
|
|
$
|
49
|
|
$
|
37
|
|
$
|
42
|
|
$
|
50
|
|
$
|
37
|
|
||||||||
______________________
|
(a)
|
Non-qualifying hedges are employed to reduce the market risk exposure to physical assets or contracts which are not marked to market. The VaR figures for the non-qualifying hedges and hedges in FPL cost recovery clauses category do not represent the economic exposure to commodity price movements.
|
Interest Rate Risk
NEE's and FPL's financial results are exposed to risk resulting from changes in interest rates as a result of their respective issuances of debt, investments in special use funds and other investments. NEE and FPL manage their respective interest rate exposure by monitoring current interest rates, entering into interest rate contracts and using a combination of fixed rate and variable rate debt. Interest rate contracts are used to mitigate and adjust interest rate exposure when deemed appropriate based upon market conditions or when required by financing agreements.
66
The following are estimates of the fair value of NEE's and FPL's financial instruments that are exposed to interest rate risk:
|
|
December 31, 2014
|
|
December 31, 2013
|
|
||||||||||||
|
|
Carrying
Amount
|
Estimated
Fair Value
|
|
Carrying
Amount
|
Estimated
Fair Value
|
|
||||||||||
|
|
(millions)
|
|
||||||||||||||
|
NEE:
|
|
|
|
|
|
|
||||||||||
|
Fixed income securities:
|
|
|
|
|
|
|
||||||||||
|
Special use funds
|
$
|
1,965
|
|
$
|
1,965
|
|
(a)
|
$
|
2,195
|
|
$
|
2,195
|
|
(a)
|
||
|
Other investments:
|
|
|
|
|
|
|
||||||||||
|
Debt securities
|
$
|
124
|
|
$
|
124
|
|
(a)
|
$
|
113
|
|
$
|
113
|
|
(a)
|
||
|
Primarily notes receivable
|
$
|
525
|
|
$
|
679
|
|
(b)
|
$
|
531
|
|
$
|
627
|
|
(b)
|
||
|
Long-term debt, including current maturities
|
$
|
27,876
|
|
$
|
30,337
|
|
(c)
|
$
|
27,728
|
|
$
|
28,612
|
|
(c)
|
||
|
Interest rate contracts - net unrealized losses
|
$
|
(216
|
)
|
$
|
(216
|
)
|
(d)
|
$
|
(130
|
)
|
$
|
(130
|
)
|
(d)
|
||
|
FPL:
|
|
|
|
|
|
|
||||||||||
|
Fixed income securities - special use funds
|
$
|
1,568
|
|
$
|
1,568
|
|
(a)
|
$
|
1,735
|
|
$
|
1,735
|
|
(a)
|
||
|
Long-term debt, including current maturities
|
$
|
9,473
|
|
$
|
11,105
|
|
(c)
|
$
|
8,829
|
|
$
|
9,451
|
|
(c)
|
||
|
(a)
|
Primarily estimated using quoted market prices for these or similar issues.
|
|
(b)
|
Primarily estimated using a discounted cash flow valuation technique based on certain observable yield curves and indices considering the credit profile of the borrower.
|
|
(c)
|
Estimated using either quoted market prices for the same or similar issues or discounted cash flow valuation technique, considering the current credit spread of the debtor.
|
|
(d)
|
Modeled internally using discounted cash flow valuation technique and applying a credit valuation adjustment.
|
The special use funds of NEE and FPL consist of restricted funds set aside to cover the cost of storm damage for FPL and for the decommissioning of NEE's and FPL's nuclear power plants. A portion of these funds is invested in fixed income debt securities primarily carried at estimated fair value. At FPL, changes in fair value, including any OTTI losses, result in a corresponding adjustment to the related liability accounts based on current regulatory treatment. The changes in fair value of NEE's non-rate regulated operations result in a corresponding adjustment to OCI, except for impairments deemed to be other than temporary, including any credit losses, which are reported in current period earnings. Because the funds set aside by FPL for storm damage could be needed at any time, the related investments are generally more liquid and, therefore, are less sensitive to changes in interest rates. The nuclear decommissioning funds, in contrast, are generally invested in longer-term securities, as decommissioning activities are not scheduled to begin until at least 2030 (2032 at FPL).
As of
December 31, 2014
, NEE had interest rate contracts with a notional amount of approximately $7.4 billion related to long-term debt issuances, of which $2.4 billion are fair value hedges at NEECH that effectively convert fixed-rate debt to a variable-rate instrument. The remaining $5.0 billion of notional amount of interest rate contracts relate to cash flow hedges to manage exposure to the variability of cash flows associated with variable-rate debt instruments, which primarily relate to NEER debt issuances. At
December 31, 2014
, the estimated fair value of NEE's fair value hedges and cash flow hedges was approximately $30 million and $(246) million, respectively. See Note 3.
Based upon a hypothetical 10% decrease in interest rates, which is a reasonable near-term market change, the net fair value of NEE’s net liabilities would increase by approximately $913 million ($502 million for FPL) at
December 31, 2014
.
Equity Price Risk
NEE and FPL are exposed to risk resulting from changes in prices for equity securities. For example, NEE’s nuclear decommissioning reserve funds include marketable equity securities primarily carried at their market value of approximately $2,634 million and $2,585 million ($1,561 million and $1,538 million for FPL) at
December 31, 2014 and 2013
, respectively.
At
December 31, 2014
, a hypothetical 10% decrease in the prices quoted by stock exchanges, which is a reasonable near-term market change, would result in a $249 million ($147 million for FPL) reduction in fair value. For FPL, a corresponding adjustment would be made to the related liability accounts based on current regulatory treatment, and for NEE’s non-rate regulated operations, a corresponding adjustment would be made to OCI to the extent the market value of the securities exceeded amortized cost and to OTTI loss to the extent the market value is below amortized cost.
Credit Risk
NEE and its subsidiaries are also exposed to credit risk through their energy marketing and trading operations. Credit risk is the risk that a financial loss will be incurred if a counterparty to a transaction does not fulfill its financial obligation. NEE manages counterparty credit risk for its subsidiaries with energy marketing and trading operations through established policies, including counterparty credit limits, and in some cases credit enhancements, such as cash prepayments, letters of credit, cash and other collateral and guarantees.
67
Credit risk is also managed through the use of master netting agreements. NEE’s credit department monitors current and forward credit exposure to counterparties and their affiliates, both on an individual and an aggregate basis. For all derivative and contractual transactions, NEE’s energy marketing and trading operations, which include FPL’s energy marketing and trading division, are exposed to losses in the event of nonperformance by counterparties to these transactions. Some relevant considerations when assessing NEE’s energy marketing and trading operations’ credit risk exposure include the following:
|
•
|
Operations are primarily concentrated in the energy industry.
|
|
•
|
Trade receivables and other financial instruments are predominately with energy, utility and financial services related companies, as well as municipalities, cooperatives and other trading companies in the U.S.
|
|
•
|
Overall credit risk is managed through established credit policies and is overseen by the EMC.
|
|
•
|
Prospective and existing customers are reviewed for creditworthiness based upon established standards, with customers not meeting minimum standards providing various credit enhancements or secured payment terms, such as letters of credit or the posting of margin cash collateral.
|
|
•
|
Master netting agreements are used to offset cash and non-cash gains and losses arising from derivative instruments with the same counterparty. NEE’s policy is to have master netting agreements in place with significant counterparties.
|
Based on NEE’s policies and risk exposures related to credit, NEE and FPL do not anticipate a material adverse effect on their financial statements as a result of counterparty nonperformance. As of
December 31, 2014
, approximately 92% of NEE’s and 93% of FPL’s energy marketing and trading counterparty credit risk exposure is associated with companies that have investment grade credit ratings.
See Management’s Discussion – Energy Marketing and Trading and Market Risk Sensitivity.
68
MANAGEMENT'S REPORT ON INTERNAL CONTROL OVER FINANCIAL REPORTING
NextEra Energy, Inc.'s (NEE) and Florida Power & Light Company's (FPL) management are responsible for establishing and maintaining adequate internal control over financial reporting as defined in the Securities Exchange Act of 1934 Rules 13a-15(f) and 15d-15(f). The consolidated financial statements, which in part are based on informed judgments and estimates made by management, have been prepared in conformity with generally accepted accounting principles applied on a consistent basis.
To aid in carrying out this responsibility, we, along with all other members of management, maintain a system of internal accounting control which is established after weighing the cost of such controls against the benefits derived. In the opinion of management, the overall system of internal accounting control provides reasonable assurance that the assets of NEE and FPL and their subsidiaries are safeguarded and that transactions are executed in accordance with management's authorization and are properly recorded for the preparation of financial statements. In addition, management believes the overall system of internal accounting control provides reasonable assurance that material errors or irregularities would be prevented or detected on a timely basis by employees in the normal course of their duties. Any system of internal accounting control, no matter how well designed, has inherent limitations, including the possibility that controls can be circumvented or overridden and misstatements due to error or fraud may occur and not be detected. Also, because of changes in conditions, internal control effectiveness may vary over time. Accordingly, even an effective system of internal control will provide only reasonable assurance with respect to financial statement preparation and reporting.
The system of internal accounting control is supported by written policies and guidelines, the selection and training of qualified employees, an organizational structure that provides an appropriate division of responsibility and a program of internal auditing. NEE's written policies include a Code of Business Conduct & Ethics that states management's policy on conflicts of interest and ethical conduct. Compliance with the Code of Business Conduct & Ethics is confirmed annually by key personnel.
The Board of Directors pursues its oversight responsibility for financial reporting and accounting through its Audit Committee. This Committee, which is comprised entirely of independent directors, meets regularly with management, the internal auditors and the independent auditors to make inquiries as to the manner in which the responsibilities of each are being discharged. The independent auditors and the internal audit staff have free access to the Committee without management's presence to discuss auditing, internal accounting control and financial reporting matters.
Management assessed the effectiveness of NEE's and FPL's internal control over financial reporting as of
December 31, 2014
, using the criteria set forth by the Committee of Sponsoring Organizations of the Treadway Commission in the
Internal Control - Integrated Framework (2013)
. Based on this assessment, management believes that NEE's and FPL's internal control over financial reporting was effective as of
December 31, 2014
.
NEE's and FPL's independent registered public accounting firm, Deloitte & Touche LLP, is engaged to express an opinion on NEE's and FPL's consolidated financial statements and an opinion on NEE's and FPL's internal control over financial reporting. Their reports are based on procedures believed by them to provide a reasonable basis to support such opinions. These reports appear on the following pages.
|
JAMES L. ROBO
|
MORAY P. DEWHURST
|
|
|
James L. Robo
Chairman, President and Chief Executive Officer of NEE and Chairman of FPL
|
Moray P. Dewhurst
Vice Chairman and Chief Financial Officer, and Executive
Vice President - Finance of NEE and Executive Vice
President, Finance and Chief Financial Officer of FPL
|
|
|
CHRIS N. FROGGATT
|
||
|
Chris N. Froggatt
Vice President, Controller and Chief Accounting Officer of NEE |
||
|
ERIC E. SILAGY
|
KIMBERLY OUSDAHL
|
|
|
Eric E. Silagy
President and Chief Executive Officer of FPL
|
Kimberly Ousdahl
Vice President, Controller and Chief Accounting Officer of FPL
|
|
69
REPORT OF INDEPENDENT REGISTERED PUBLIC ACCOUNTING FIRM
To the Board of Directors and Shareholders
NextEra Energy, Inc. and Florida Power & Light Company:
We have audited the internal control over financial reporting of NextEra Energy, Inc. and subsidiaries (NextEra Energy) and Florida Power & Light Company and subsidiaries (FPL) as of
December 31, 2014
, based on criteria established in
Internal Control — Integrated Framework
(2013)
issued by the Committee of Sponsoring Organizations of the Treadway Commission. NextEra Energy's and FPL’s management are responsible for maintaining effective internal control over financial reporting and for their assessments of the effectiveness of internal control over financial reporting, included in the accompanying Management's Report on Internal Control Over Financial Reporting. Our responsibility is to express an opinion on NextEra Energy’s and FPL’s internal control over financial reporting based on our audits.
We conducted our audits in accordance with the standards of the Public Company Accounting Oversight Board (United States). Those standards require that we plan and perform the audits to obtain reasonable assurance about whether effective internal control over financial reporting was maintained in all material respects. Our audits included obtaining an understanding of internal control over financial reporting, assessing the risk that a material weakness exists, testing and evaluating the design and operating effectiveness of internal control based on the assessed risk, and performing such other procedures as we considered necessary in the circumstances. We believe that our audits provide a reasonable basis for our opinion.
A company's internal control over financial reporting is a process designed by, or under the supervision of, the company's principal executive and principal financial officers, or persons performing similar functions, and effected by the company's board of directors, management, and other personnel to provide reasonable assurance regarding the reliability of financial reporting and the preparation of financial statements for external purposes in accordance with generally accepted accounting principles. A company's internal control over financial reporting includes those policies and procedures that (1) pertain to the maintenance of records that, in reasonable detail, accurately and fairly reflect the transactions and dispositions of the assets of the company; (2) provide reasonable assurance that transactions are recorded as necessary to permit preparation of financial statements in accordance with generally accepted accounting principles, and that receipts and expenditures of the company are being made only in accordance with authorizations of management and directors of the company; and (3) provide reasonable assurance regarding prevention or timely detection of unauthorized acquisition, use, or disposition of the company's assets that could have a material effect on the financial statements.
Because of the inherent limitations of internal control over financial reporting, including the possibility of collusion or improper management override of controls, material misstatements due to error or fraud may not be prevented or detected on a timely basis. Also, projections of any evaluation of the effectiveness of the internal control over financial reporting to future periods are subject to the risk that the controls may become inadequate because of changes in conditions, or that the degree of compliance with the policies or procedures may deteriorate.
In our opinion, NextEra Energy and FPL maintained, in all material respects, effective internal control over financial reporting as of
December 31, 2014
, based on the criteria established in
Internal Control — Integrated Framework (2013)
issued by the Committee of Sponsoring Organizations of the Treadway Commission.
We have also audited, in accordance with the standards of the Public Company Accounting Oversight Board (United States), the consolidated financial statements as of and for the year ended
December 31, 2014
of NextEra Energy and FPL and our report dated
February 20, 2015
expressed an unqualified opinion on those financial statements.
DELOITTE & TOUCHE LLP
Certified Public Accountants
Boca Raton, Florida
February 20, 2015
70
REPORT OF INDEPENDENT REGISTERED PUBLIC ACCOUNTING FIRM
To the Board of Directors and Shareholders
NextEra Energy, Inc. and Florida Power & Light Company:
We have audited the accompanying consolidated balance sheets of NextEra Energy, Inc. and subsidiaries (NextEra Energy) and the separate consolidated balance sheets of Florida Power & Light Company and subsidiaries (FPL) as of
December 31, 2014
and
2013
, and NextEra Energy's and FPL's related consolidated statements of income, NextEra Energy's consolidated statements of comprehensive income, NextEra Energy's and FPL's consolidated statements of cash flows, NextEra Energy’s consolidated statements of equity, and FPL’s consolidated statements of common shareholder’s equity for each of the three years in the period ended
December 31, 2014
. These financial statements are the responsibility of NextEra Energy's and FPL's management. Our responsibility is to express an opinion on these financial statements based on our audits.
We conducted our audits in accordance with the standards of the Public Company Accounting Oversight Board (United States). Those standards require that we plan and perform the audits to obtain reasonable assurance about whether the financial statements are free of material misstatement. An audit includes examining, on a test basis, evidence supporting the amounts and disclosures in the financial statements. An audit also includes assessing the accounting principles used and significant estimates made by management, as well as evaluating the overall financial statement presentation. We believe that our audits provide a reasonable basis for our opinion.
In our opinion, such consolidated financial statements present fairly, in all material respects, the financial position of NextEra Energy, Inc. and subsidiaries and the financial position of Florida Power & Light Company and subsidiaries at
December 31, 2014
and
2013
, and the results of their operations and their cash flows for each of the three years in the period ended
December 31, 2014
, in conformity with accounting principles generally accepted in the United States of America.
We have also audited, in accordance with the standards of the Public Company Accounting Oversight Board (United States), NextEra Energy’s and FPL’s internal control over financial reporting as of
December 31, 2014
, based on the criteria established in
Internal Control — Integrated Framework (2013)
issued by the Committee of Sponsoring Organizations of the Treadway Commission and our report dated
February 20, 2015
expressed an unqualified opinion on NextEra Energy’s and FPL’s internal control over financial reporting.
DELOITTE & TOUCHE LLP
Certified Public Accountants
Boca Raton, Florida
February 20, 2015
71
NEXTERA ENERGY, INC.
(millions, except per share amounts)
|
|
Years Ended December 31,
|
|||||||||||
|
2014
|
2013
|
2012
|
||||||||||
|
OPERATING REVENUES
|
$
|
17,021
|
|
$
|
15,136
|
|
$
|
14,256
|
|
|||
|
OPERATING EXPENSES
|
|
|
|
|
|
|
||||||
|
Fuel, purchased power and interchange
|
5,602
|
|
4,958
|
|
5,121
|
|
||||||
|
Other operations and maintenance
|
3,149
|
|
3,194
|
|
3,155
|
|
||||||
|
Impairment charges
|
11
|
|
300
|
|
—
|
|
||||||
|
Depreciation and amortization
|
2,551
|
|
2,163
|
|
1,518
|
|
||||||
|
Taxes other than income taxes and other
|
1,324
|
|
1,280
|
|
1,186
|
|
||||||
|
Total operating expenses
|
12,637
|
|
11,895
|
|
10,980
|
|
||||||
|
OPERATING INCOME
|
4,384
|
|
3,241
|
|
3,276
|
|
||||||
|
OTHER INCOME (DEDUCTIONS)
|
|
|
|
|
|
|
||||||
|
Interest expense
|
(1,261
|
)
|
(1,121
|
)
|
(1,038
|
)
|
||||||
|
Benefits associated with differential membership interests - net
|
199
|
|
165
|
|
81
|
|
||||||
|
Equity in earnings of equity method investees
|
93
|
|
25
|
|
13
|
|
||||||
|
Allowance for equity funds used during construction
|
37
|
|
63
|
|
67
|
|
||||||
|
Interest income
|
80
|
|
78
|
|
86
|
|
||||||
|
Gains on disposal of assets - net
|
105
|
|
54
|
|
157
|
|
||||||
|
Gain (loss) associated with Maine fossil
|
21
|
|
(67
|
)
|
—
|
|
||||||
|
Other than temporary impairment losses on securities held in nuclear decommissioning funds
|
(13
|
)
|
(11
|
)
|
(16
|
)
|
||||||
|
Other - net
|
—
|
|
27
|
|
(23
|
)
|
||||||
|
Total other deductions - net
|
(739
|
)
|
(787
|
)
|
(673
|
)
|
||||||
|
INCOME FROM CONTINUING OPERATIONS BEFORE INCOME TAXES
|
3,645
|
|
2,454
|
|
2,603
|
|
||||||
|
INCOME TAXES
|
1,176
|
|
777
|
|
692
|
|
||||||
|
INCOME FROM CONTINUING OPERATIONS
|
2,469
|
|
|
1,677
|
|
|
1,911
|
|
||||
|
GAIN FROM DISCONTINUED OPERATIONS, NET OF INCOME TAXES
|
—
|
|
231
|
|
—
|
|
||||||
|
NET INCOME
|
2,469
|
|
1,908
|
|
1,911
|
|
||||||
|
LESS NET INCOME ATTRIBUTABLE TO NONCONTROLLING INTERESTS
|
(4
|
)
|
|
—
|
|
|
—
|
|
||||
|
NET INCOME ATTRIBUTABLE TO NEE
|
$
|
2,465
|
|
$
|
1,908
|
|
$
|
1,911
|
|
|||
|
Earnings per share attributable to NEE - basic:
|
|
|
|
|
|
|
||||||
|
Continuing operations
|
$
|
5.67
|
|
$
|
3.95
|
|
$
|
4.59
|
|
|||
|
Discontinued operations
|
—
|
|
0.55
|
|
—
|
|
||||||
|
Total
|
$
|
5.67
|
|
$
|
4.50
|
|
$
|
4.59
|
|
|||
|
Earnings per share attributable to NEE - assuming dilution:
|
||||||||||||
|
Continuing operations
|
$
|
5.60
|
|
$
|
3.93
|
|
$
|
4.56
|
|
|||
|
Discontinued operations
|
—
|
|
0.54
|
|
—
|
|
||||||
|
Total
|
$
|
5.60
|
|
$
|
4.47
|
|
$
|
4.56
|
|
|||
|
Weighted-average number of common shares outstanding:
|
|
|
|
|
|
|
||||||
|
Basic
|
434.4
|
|
424.2
|
|
416.7
|
|
||||||
|
Assuming dilution
|
440.1
|
|
427.0
|
|
419.2
|
|
||||||
The accompanying Notes to Consolidated Financial Statements are an integral part of these statements.
72
NEXTERA ENERGY, INC.
CONSOLIDATED STATEMENTS OF COMPREHENSIVE INCOME
(millions)
|
Years Ended December 31,
|
|||||||||||
|
2014
|
2013
|
2012
|
|||||||||
|
NET INCOME
|
$
|
2,469
|
|
$
|
1,908
|
|
$
|
1,911
|
|
||
|
OTHER COMPREHENSIVE INCOME (LOSS), NET OF TAX
|
|||||||||||
|
Net unrealized gains (losses) on cash flow hedges:
|
|
|
|
|
|||||||
|
Effective portion of net unrealized gains (losses) (net of $80 tax benefit, $45 tax expense and $55 tax benefit, respectively)
|
(141
|
)
|
84
|
|
(106
|
)
|
|||||
|
Reclassification from accumulated other comprehensive income to net income (net of $57, $38 and $25 tax expense, respectively)
|
98
|
|
67
|
|
44
|
|
|||||
|
Net unrealized gains (losses) on available for sale securities:
|
|
||||||||||
|
Net unrealized gains on securities still held (net of $45, $84 and $48 tax expense, respectively)
|
62
|
|
118
|
|
70
|
|
|||||
|
Reclassification from accumulated other comprehensive income to net income (net of $26, $10 and $52 tax benefit, respectively)
|
(41
|
)
|
(17
|
)
|
(77
|
)
|
|||||
|
Defined benefit pension and other benefits plans (net of $27 tax benefit, $61 tax expense and $19 tax benefit, respectively)
|
(43
|
)
|
97
|
|
(28
|
)
|
|||||
|
Net unrealized gains (losses) on foreign currency translation (net of $12 and $22 tax benefit and $3 tax expense, respectively)
|
(25
|
)
|
(45
|
)
|
7
|
|
|||||
|
Other comprehensive income (loss) related to equity method investee (net of $5 tax benefit, $5 tax expense and $7 tax benefit, respectively)
|
(8
|
)
|
7
|
|
(11
|
)
|
|||||
|
Total other comprehensive income (loss), net of tax
|
(98
|
)
|
311
|
|
(101
|
)
|
|||||
|
COMPREHENSIVE INCOME
|
2,371
|
|
2,219
|
|
1,810
|
|
|||||
|
LESS COMPREHENSIVE INCOME ATTRIBUTABLE TO NONCONTROLLING INTERESTS
|
(2
|
)
|
—
|
|
—
|
|
|||||
|
COMPREHENSIVE INCOME ATTRIBUTABLE TO NEE
|
$
|
2,369
|
|
$
|
2,219
|
|
$
|
1,810
|
|
||
The accompanying Notes to Consolidated Financial Statements are an integral part of these statements.
73
NEXTERA ENERGY, INC.
(millions, except par value)
|
December 31,
|
||||||||
|
2014
|
2013
|
|||||||
|
PROPERTY, PLANT AND EQUIPMENT
|
|
|
||||||
|
Electric plant in service and other property
|
$
|
68,042
|
|
$
|
62,699
|
|
||
|
Nuclear fuel
|
2,006
|
|
2,059
|
|
||||
|
Construction work in progress
|
3,591
|
|
4,690
|
|
||||
|
Less accumulated depreciation and amortization
|
(17,934
|
)
|
(16,728
|
)
|
||||
|
Total property, plant and equipment - net ($6,414 and $5,127 related to VIEs, respectively)
|
55,705
|
|
52,720
|
|
||||
|
CURRENT ASSETS
|
|
|
|
|
||||
|
Cash and cash equivalents
|
577
|
|
438
|
|
||||
|
Customer receivables, net of allowances of $27 and $14, respectively
|
1,805
|
|
1,777
|
|
||||
|
Other receivables
|
354
|
|
512
|
|
||||
|
Materials, supplies and fossil fuel inventory
|
1,292
|
|
1,153
|
|
||||
|
Regulatory assets:
|
|
|
|
|
||||
|
Deferred clause and franchise expenses
|
268
|
|
192
|
|
||||
|
Derivatives
|
364
|
|
—
|
|
||||
|
Other
|
116
|
|
116
|
|
||||
|
Derivatives
|
990
|
|
498
|
|
||||
|
Deferred income taxes
|
739
|
|
753
|
|
||||
|
Other
|
439
|
|
403
|
|
||||
|
Total current assets
|
6,944
|
|
5,842
|
|
||||
|
OTHER ASSETS
|
|
|
|
|
||||
|
Special use funds
|
5,166
|
|
4,780
|
|
||||
|
Other investments
|
1,399
|
|
1,121
|
|
||||
|
Prepaid benefit costs
|
1,244
|
|
1,456
|
|
||||
|
Regulatory assets:
|
|
|
|
|
||||
|
Securitized storm-recovery costs ($180 and $228 related to a VIE, respectively)
|
294
|
|
372
|
|
||||
|
Other
|
657
|
|
426
|
|
||||
|
Derivatives
|
1,009
|
|
1,163
|
|
||||
|
Other
|
2,511
|
|
1,426
|
|
||||
|
Total other assets
|
12,280
|
|
10,744
|
|
||||
|
TOTAL ASSETS
|
$
|
74,929
|
|
$
|
69,306
|
|
||
|
CAPITALIZATION
|
|
|
|
|
||||
|
Common stock ($0.01 par value, authorized shares - 800; outstanding shares - 443 and 435, respectively)
|
$
|
4
|
|
$
|
4
|
|
||
|
Additional paid-in capital
|
7,179
|
|
6,411
|
|
||||
|
Retained earnings
|
12,773
|
|
11,569
|
|
||||
|
Accumulated other comprehensive income (loss)
|
(40
|
)
|
56
|
|
||||
|
Total common shareholders' equity
|
19,916
|
|
18,040
|
|
||||
|
Noncontrolling interests
|
252
|
|
—
|
|
||||
|
Total equity
|
20,168
|
|
18,040
|
|
||||
|
Long-term debt ($1,077 and $1,207 related to VIEs, respectively)
|
24,367
|
|
23,969
|
|
||||
|
Total capitalization
|
44,535
|
|
42,009
|
|
||||
|
CURRENT LIABILITIES
|
|
|
|
|
||||
|
Commercial paper
|
1,142
|
|
691
|
|
||||
|
Current maturities of long-term debt
|
3,515
|
|
3,766
|
|
||||
|
Accounts payable
|
1,354
|
|
1,200
|
|
||||
|
Customer deposits
|
462
|
|
452
|
|
||||
|
Accrued interest and taxes
|
474
|
|
473
|
|
||||
|
Derivatives
|
1,289
|
|
838
|
|
||||
|
Accrued construction-related expenditures
|
676
|
|
839
|
|
||||
|
Other
|
751
|
|
930
|
|
||||
|
Total current liabilities
|
9,663
|
|
9,189
|
|
||||
|
OTHER LIABILITIES AND DEFERRED CREDITS
|
|
|
|
|
||||
|
Asset retirement obligations
|
1,986
|
|
1,850
|
|
||||
|
Deferred income taxes
|
9,261
|
|
8,144
|
|
||||
|
Regulatory liabilities:
|
|
|
|
|
||||
|
Accrued asset removal costs
|
1,904
|
|
1,839
|
|
||||
|
Asset retirement obligation regulatory expense difference
|
2,257
|
|
2,082
|
|
||||
|
Other
|
476
|
|
462
|
|
||||
|
Derivatives
|
466
|
|
473
|
|
||||
|
Deferral related to differential membership interests - VIEs
|
2,704
|
|
2,001
|
|
||||
|
Other
|
1,677
|
|
1,257
|
|
||||
|
Total other liabilities and deferred credits
|
20,731
|
|
18,108
|
|
||||
|
COMMITMENTS AND CONTINGENCIES
|
|
|
|
|
||||
|
TOTAL CAPITALIZATION AND LIABILITIES
|
$
|
74,929
|
|
$
|
69,306
|
|
||
The accompanying Notes to Consolidated Financial Statements are an integral part of these statements.
74
NEXTERA ENERGY, INC.
(millions)
|
Years Ended December 31,
|
|||||||||||
|
2014
|
2013
|
2012
|
|||||||||
|
CASH FLOWS FROM OPERATING ACTIVITIES
|
|
|
|
||||||||
|
Net income
|
$
|
2,469
|
|
$
|
1,908
|
|
$
|
1,911
|
|
||
|
Adjustments to reconcile net income to net cash provided by (used in) operating activities:
|
|||||||||||
|
Depreciation and amortization
|
2,551
|
|
2,163
|
|
1,518
|
|
|||||
|
Nuclear fuel and other amortization
|
345
|
|
358
|
|
259
|
|
|||||
|
Impairment charges
|
11
|
|
300
|
|
—
|
|
|||||
|
Unrealized gains on marked to market energy contracts
|
(411
|
)
|
(10
|
)
|
(85
|
)
|
|||||
|
Deferred income taxes
|
1,205
|
|
853
|
|
682
|
|
|||||
|
Cost recovery clauses and franchise fees
|
(67
|
)
|
(166
|
)
|
129
|
|
|||||
|
Benefits associated with differential membership interests - net
|
(199
|
)
|
(165
|
)
|
(81
|
)
|
|||||
|
Gain from discontinued operations, net of income taxes
|
—
|
|
(231
|
)
|
—
|
|
|||||
|
Loss (gain) associated with Maine fossil
|
(21
|
)
|
67
|
|
—
|
|
|||||
|
Other - net
|
155
|
|
77
|
|
(151
|
)
|
|||||
|
Changes in operating assets and liabilities:
|
|
|
|
|
|
||||||
|
Customer and other receivables
|
(7
|
)
|
(268
|
)
|
(286
|
)
|
|||||
|
Materials, supplies and fossil fuel inventory
|
(135
|
)
|
(81
|
)
|
1
|
|
|||||
|
Other current assets
|
(30
|
)
|
8
|
|
(46
|
)
|
|||||
|
Other assets
|
(220
|
)
|
8
|
|
3
|
|
|||||
|
Accounts payable and customer deposits
|
110
|
|
122
|
|
(56
|
)
|
|||||
|
Margin cash collateral
|
(59
|
)
|
156
|
|
104
|
|
|||||
|
Income taxes
|
(75
|
)
|
(56
|
)
|
(20
|
)
|
|||||
|
Other current liabilities
|
(110
|
)
|
143
|
|
154
|
|
|||||
|
Other liabilities
|
(12
|
)
|
(84
|
)
|
(44
|
)
|
|||||
|
Net cash provided by operating activities
|
5,500
|
|
5,102
|
|
3,992
|
|
|||||
|
CASH FLOWS FROM INVESTING ACTIVITIES
|
|
|
|
|
|
|
|||||
|
Capital expenditures of FPL
|
(3,067
|
)
|
(2,691
|
)
|
(4,070
|
)
|
|||||
|
Independent power and other investments of NEER
|
(3,514
|
)
|
(3,454
|
)
|
(4,591
|
)
|
|||||
|
Cash grants under the American Recovery and Reinvestment Act of 2009
|
343
|
|
165
|
|
196
|
|
|||||
|
Nuclear fuel purchases
|
(287
|
)
|
(371
|
)
|
(305
|
)
|
|||||
|
Other capital expenditures and other investments
|
(149
|
)
|
(166
|
)
|
(495
|
)
|
|||||
|
Sale of independent power and other investments of NEER
|
307
|
|
165
|
|
—
|
|
|||||
|
Change in loan proceeds restricted for construction
|
(40
|
)
|
228
|
|
314
|
|
|||||
|
Proceeds from sale or maturity of securities in special use funds and other investments
|
4,621
|
|
4,405
|
|
5,301
|
|
|||||
|
Purchases of securities in special use funds and other investments
|
(4,767
|
)
|
(4,470
|
)
|
(5,419
|
)
|
|||||
|
Proceeds from the sale of a noncontrolling interest in subsidiaries
|
438
|
|
—
|
|
—
|
|
|||||
|
Other - net
|
(246
|
)
|
66
|
|
141
|
|
|||||
|
Net cash used in investing activities
|
(6,361
|
)
|
(6,123
|
)
|
(8,928
|
)
|
|||||
|
CASH FLOWS FROM FINANCING ACTIVITIES
|
|
|
|
|
|
|
|||||
|
Issuances of long-term debt
|
5,054
|
|
4,371
|
|
6,630
|
|
|||||
|
Retirements of long-term debt
|
(4,750
|
)
|
(2,396
|
)
|
(1,612
|
)
|
|||||
|
Proceeds from sale of differential membership interests
|
978
|
|
448
|
|
808
|
|
|||||
|
Payments to differential membership investors
|
(71
|
)
|
(63
|
)
|
(139
|
)
|
|||||
|
Net change in short-term debt
|
451
|
|
(720
|
)
|
61
|
|
|||||
|
Issuances of common stock - net
|
633
|
|
842
|
|
405
|
|
|||||
|
Repurchases of common stock
|
—
|
|
—
|
|
(19
|
)
|
|||||
|
Dividends on common stock
|
(1,261
|
)
|
(1,122
|
)
|
(1,004
|
)
|
|||||
|
Other - net
|
(34
|
)
|
(230
|
)
|
(242
|
)
|
|||||
|
Net cash provided by financing activities
|
1,000
|
|
1,130
|
|
4,888
|
|
|||||
|
Net increase (decrease) in cash and cash equivalents
|
139
|
|
109
|
|
(48
|
)
|
|||||
|
Cash and cash equivalents at beginning of year
|
438
|
|
329
|
|
377
|
|
|||||
|
Cash and cash equivalents at end of year
|
$
|
577
|
|
$
|
438
|
|
$
|
329
|
|
||
|
SUPPLEMENTAL DISCLOSURES OF CASH FLOW INFORMATION
|
|
|
|
|
|
|
|||||
|
Cash paid for interest (net of amount capitalized)
|
$
|
1,181
|
|
$
|
1,070
|
|
$
|
1,001
|
|
||
|
Cash paid (received) for income taxes - net
|
$
|
46
|
|
$
|
(20
|
)
|
$
|
25
|
|
||
|
SUPPLEMENTAL SCHEDULE OF NONCASH INVESTING AND FINANCING ACTIVITIES
|
|
|
|
|
|
|
|||||
|
Accrued property additions
|
$
|
956
|
|
$
|
1,098
|
|
$
|
970
|
|
||
|
Sale of hydropower generation plants through assumption of debt by buyer
|
$
|
—
|
|
$
|
700
|
|
$
|
—
|
|
||
|
Changes in property, plant and equipment as a result of a settlement
|
$
|
181
|
|
$
|
—
|
|
$
|
—
|
|
||
The accompanying Notes to Consolidated Financial Statements are an integral part of these statements.
75
NEXTERA ENERGY, INC.
CONSOLIDATED STATEMENTS OF EQUITY
(millions)
|
Common Stock
|
Additional
Paid-In
Capital
|
Unearned
ESOP
Compensation
|
Accumulated
Other
Comprehensive
Income
(Loss)
|
Retained
Earnings
|
Total
Common
Shareholders'
Equity
|
Non-
controlling
Interests
|
Total
Equity
|
|||||||||||||||||||||||||||
|
Shares
|
Aggregate
Par Value
|
|||||||||||||||||||||||||||||||||
|
Balances, December 31, 2011
|
416
|
|
$
|
4
|
|
$
|
5,270
|
|
$
|
(53
|
)
|
$
|
(154
|
)
|
$
|
9,876
|
|
$
|
14,943
|
|
$
|
—
|
|
$
|
14,943
|
|
||||||||
|
Net income
|
—
|
|
|
—
|
|
—
|
|
—
|
|
—
|
|
1,911
|
|
1,911
|
|
—
|
|
|
||||||||||||||||
|
Issuances of common stock, net of issuance cost of less than $1
|
6
|
|
—
|
|
367
|
|
4
|
|
—
|
|
—
|
|
371
|
|
—
|
|
|
|||||||||||||||||
|
Repurchases of common stock
|
—
|
|
—
|
|
(19
|
)
|
—
|
|
—
|
|
—
|
|
(19
|
)
|
—
|
|
|
|||||||||||||||||
|
Exercise of stock options and other incentive plan activity
|
2
|
|
—
|
|
98
|
|
—
|
|
—
|
|
—
|
|
98
|
|
—
|
|
|
|||||||||||||||||
|
Dividends on common stock
(a)
|
—
|
|
—
|
|
—
|
|
—
|
|
—
|
|
(1,004
|
)
|
(1,004
|
)
|
—
|
|
|
|||||||||||||||||
|
Earned compensation under ESOP
|
—
|
|
—
|
|
34
|
|
10
|
|
—
|
|
—
|
|
44
|
|
—
|
|
|
|||||||||||||||||
|
Other comprehensive loss
|
—
|
|
—
|
|
—
|
|
—
|
|
(101
|
)
|
—
|
|
(101
|
)
|
—
|
|
||||||||||||||||||
|
Premium on equity units
|
—
|
|
—
|
|
(151
|
)
|
—
|
|
—
|
|
—
|
|
(151
|
)
|
—
|
|
||||||||||||||||||
|
Issuance costs on equity units
|
—
|
|
—
|
|
(24
|
)
|
—
|
|
—
|
|
—
|
|
(24
|
)
|
—
|
|
||||||||||||||||||
|
Balances, December 31, 2012
|
424
|
|
(b)
|
4
|
|
5,575
|
|
(39
|
)
|
(255
|
)
|
10,783
|
|
16,068
|
|
—
|
|
$
|
16,068
|
|
||||||||||||||
|
Net income
|
—
|
|
|
—
|
|
—
|
|
—
|
|
—
|
|
1,908
|
|
1,908
|
|
—
|
|
|
||||||||||||||||
|
Issuances of common stock, net of issuance cost of less than $1
|
10
|
|
—
|
|
823
|
|
4
|
|
—
|
|
—
|
|
827
|
|
—
|
|
|
|||||||||||||||||
|
Exercise of stock options and other incentive plan activity
|
1
|
|
—
|
|
74
|
|
—
|
|
—
|
|
—
|
|
74
|
|
—
|
|
|
|||||||||||||||||
|
Dividends on common stock
(a)
|
—
|
|
—
|
|
—
|
|
—
|
|
—
|
|
(1,122
|
)
|
(1,122
|
)
|
—
|
|
|
|||||||||||||||||
|
Earned compensation under ESOP
|
—
|
|
—
|
|
37
|
|
9
|
|
—
|
|
—
|
|
46
|
|
—
|
|
|
|||||||||||||||||
|
Other comprehensive income
|
—
|
|
—
|
|
—
|
|
—
|
|
311
|
|
—
|
|
311
|
|
—
|
|
|
|||||||||||||||||
|
Premium on equity units
|
—
|
|
—
|
|
(62
|
)
|
—
|
|
—
|
|
—
|
|
(62
|
)
|
—
|
|
|
|||||||||||||||||
|
Issuance costs on equity units
|
—
|
|
—
|
|
(10
|
)
|
—
|
|
—
|
|
—
|
|
(10
|
)
|
—
|
|
|
|||||||||||||||||
|
Balances, December 31, 2013
|
435
|
|
(b)
|
4
|
|
6,437
|
|
(26
|
)
|
56
|
|
11,569
|
|
18,040
|
|
—
|
|
$
|
18,040
|
|
||||||||||||||
|
Net income
|
—
|
|
|
—
|
|
—
|
|
—
|
|
—
|
|
2,465
|
|
2,465
|
|
4
|
|
|
||||||||||||||||
|
Issuances of common stock, net of issuance cost of less than $1
|
7
|
|
—
|
|
604
|
|
3
|
|
—
|
|
—
|
|
607
|
|
—
|
|
|
|||||||||||||||||
|
Exercise of stock options and other incentive plan activity
|
1
|
|
—
|
|
102
|
|
—
|
|
—
|
|
—
|
|
102
|
|
—
|
|
|
|||||||||||||||||
|
Dividends on common stock
(a)
|
—
|
|
—
|
|
—
|
|
—
|
|
—
|
|
(1,261
|
)
|
(1,261
|
)
|
—
|
|
|
|||||||||||||||||
|
Earned compensation under ESOP
|
—
|
|
—
|
|
50
|
|
9
|
|
—
|
|
—
|
|
59
|
|
—
|
|
|
|||||||||||||||||
|
Other comprehensive loss
|
—
|
|
—
|
|
—
|
|
—
|
|
(96
|
)
|
—
|
|
(96
|
)
|
(2
|
)
|
|
|||||||||||||||||
|
NEP acquisition of limited partnership interest in NEP OpCo
|
—
|
|
—
|
|
—
|
|
—
|
|
—
|
|
—
|
|
—
|
|
232
|
|
||||||||||||||||||
|
Other changes in noncontrolling interests in subsidiaries
|
—
|
|
—
|
|
—
|
|
—
|
|
—
|
|
—
|
|
—
|
|
18
|
|
||||||||||||||||||
|
Balances, December 31, 2014
|
443
|
|
(b)
|
$
|
4
|
|
$
|
7,193
|
|
$
|
(14
|
)
|
$
|
(40
|
)
|
$
|
12,773
|
|
$
|
19,916
|
|
$
|
252
|
|
$
|
20,168
|
|
|||||||
______________________
|
(a)
|
Dividends per share were
$2.90
,
$2.64
and
$2.40
for the years ended December 31,
2014
,
2013
and
2012
, respectively.
|
|
(b)
|
Outstanding and unallocated shares held by the Employee Stock Ownership Plan (ESOP) Trust totaled approximately
1 million
,
2 million
and
3 million
at December 31,
2014
,
2013
and
2012
, respectively; the original number of shares purchased and held by the ESOP Trust was approximately
25 million
shares.
|
The accompanying Notes to Consolidated Financial Statements are an integral part of these statements.
76
FLORIDA POWER & LIGHT COMPANY
CONSOLIDATED STATEMENTS OF INCOME
(millions)
|
|
Years Ended December 31,
|
||||||||||
|
|
2014
|
2013
|
2012
|
||||||||
|
OPERATING REVENUES
|
$
|
11,421
|
|
$
|
10,445
|
|
$
|
10,114
|
|
||
|
OPERATING EXPENSES
|
|
|
|
|
|
|
|||||
|
Fuel, purchased power and interchange
|
4,375
|
|
3,925
|
|
4,265
|
|
|||||
|
Other operations and maintenance
|
1,620
|
|
1,699
|
|
1,773
|
|
|||||
|
Depreciation and amortization
|
1,432
|
|
1,159
|
|
659
|
|
|||||
|
Taxes other than income taxes and other
|
1,166
|
|
1,123
|
|
1,060
|
|
|||||
|
Total operating expenses
|
8,593
|
|
7,906
|
|
7,757
|
|
|||||
|
OPERATING INCOME
|
2,828
|
|
2,539
|
|
2,357
|
|
|||||
|
OTHER INCOME (DEDUCTIONS)
|
|
|
|
|
|
|
|||||
|
Interest expense
|
(439
|
)
|
(415
|
)
|
(417
|
)
|
|||||
|
Allowance for equity funds used during construction
|
36
|
|
55
|
|
52
|
|
|||||
|
Other - net
|
2
|
|
5
|
|
—
|
|
|||||
|
Total other deductions - net
|
(401
|
)
|
(355
|
)
|
(365
|
)
|
|||||
|
INCOME BEFORE INCOME TAXES
|
2,427
|
|
2,184
|
|
1,992
|
|
|||||
|
INCOME TAXES
|
910
|
|
835
|
|
752
|
|
|||||
|
NET INCOME
(a)
|
$
|
1,517
|
|
$
|
1,349
|
|
$
|
1,240
|
|
||
______________________
|
(a)
|
FPL's comprehensive income is the same as reported net income.
|
The accompanying Notes to Consolidated Financial Statements are an integral part of these statements.
77
FLORIDA POWER & LIGHT COMPANY
CONSOLIDATED BALANCE SHEETS
(millions, except share amount)
|
|
December 31,
|
||||||
|
2014
|
2013
|
||||||
|
ELECTRIC UTILITY PLANT
|
|
|
|||||
|
Plant in service and other property
|
$
|
39,027
|
|
$
|
36,838
|
|
|
|
Nuclear fuel
|
1,217
|
|
1,240
|
|
|||
|
Construction work in progress
|
1,694
|
|
1,818
|
|
|||
|
Less accumulated depreciation and amortization
|
(11,282
|
)
|
(10,944
|
)
|
|||
|
Total electric utility plant - net
|
30,656
|
|
28,952
|
|
|||
|
CURRENT ASSETS
|
|
|
|
|
|||
|
Cash and cash equivalents
|
14
|
|
19
|
|
|||
|
Customer receivables, net of allowances of $5 and $5, respectively
|
773
|
|
757
|
|
|||
|
Other receivables
|
136
|
|
137
|
|
|||
|
Materials, supplies and fossil fuel inventory
|
848
|
|
742
|
|
|||
|
Regulatory assets:
|
|
|
|
|
|||
|
Deferred clause and franchise expenses
|
268
|
|
192
|
|
|||
|
Derivatives
|
364
|
|
—
|
|
|||
|
Other
|
111
|
|
105
|
|
|||
|
Other
|
120
|
|
261
|
|
|||
|
Total current assets
|
2,634
|
|
2,213
|
|
|||
|
OTHER ASSETS
|
|
|
|
|
|||
|
Special use funds
|
3,524
|
|
3,273
|
|
|||
|
Prepaid benefit costs
|
1,189
|
|
1,142
|
|
|||
|
Regulatory assets:
|
|
|
|
|
|||
|
Securitized storm-recovery costs ($180 and $228 related to a VIE, respectively)
|
294
|
|
372
|
|
|||
|
Other
|
468
|
|
396
|
|
|||
|
Other
|
542
|
|
140
|
|
|||
|
Total other assets
|
6,017
|
|
5,323
|
|
|||
|
TOTAL ASSETS
|
$
|
39,307
|
|
$
|
36,488
|
|
|
|
CAPITALIZATION
|
|
|
|
|
|||
|
Common stock (no par value, 1,000 shares authorized, issued and outstanding)
|
$
|
1,373
|
|
$
|
1,373
|
|
|
|
Additional paid-in capital
|
6,279
|
|
6,179
|
|
|||
|
Retained earnings
|
5,499
|
|
5,532
|
|
|||
|
Total common shareholder's equity
|
13,151
|
|
13,084
|
|
|||
|
Long-term debt ($273 and $331 related to a VIE, respectively)
|
9,413
|
|
8,473
|
|
|||
|
Total capitalization
|
22,564
|
|
21,557
|
|
|||
|
CURRENT LIABILITIES
|
|
|
|
|
|||
|
Commercial paper
|
1,142
|
|
204
|
|
|||
|
Current maturities of long-term debt
|
60
|
|
356
|
|
|||
|
Accounts payable
|
647
|
|
611
|
|
|||
|
Customer deposits
|
458
|
|
447
|
|
|||
|
Accrued interest and taxes
|
245
|
|
272
|
|
|||
|
Derivatives
|
370
|
|
1
|
|
|||
|
Accrued construction-related expenditures
|
233
|
|
202
|
|
|||
|
Other
|
331
|
|
437
|
|
|||
|
Total current liabilities
|
3,486
|
|
2,530
|
|
|||
|
OTHER LIABILITIES AND DEFERRED CREDITS
|
|
|
|
|
|||
|
Asset retirement obligations
|
1,355
|
|
1,285
|
|
|||
|
Deferred income taxes
|
6,835
|
|
6,355
|
|
|||
|
Regulatory liabilities:
|
|
|
|
|
|||
|
Accrued asset removal costs
|
1,898
|
|
1,839
|
|
|||
|
Asset retirement obligation regulatory expense difference
|
2,257
|
|
2,082
|
|
|||
|
Other
|
476
|
|
386
|
|
|||
|
Other
|
436
|
|
454
|
|
|||
|
Total other liabilities and deferred credits
|
13,257
|
|
12,401
|
|
|||
|
COMMITMENTS AND CONTINGENCIES
|
|
|
|
|
|||
|
TOTAL CAPITALIZATION AND LIABILITIES
|
$
|
39,307
|
|
$
|
36,488
|
|
|
The accompanying Notes to Consolidated Financial Statements are an integral part of these statements.
78
FLORIDA POWER & LIGHT COMPANY
CONSOLIDATED STATEMENTS OF CASH FLOWS
(millions)
|
|
Years Ended December 31,
|
||||||||||
|
|
2014
|
2013
|
2012
|
||||||||
|
CASH FLOWS FROM OPERATING ACTIVITIES
|
|
|
|
||||||||
|
Net income
|
$
|
1,517
|
|
$
|
1,349
|
|
$
|
1,240
|
|
||
|
Adjustments to reconcile net income to net cash provided by (used in) operating activities:
|
|
|
|
|
|
|
|||||
|
Depreciation and amortization
|
1,432
|
|
1,159
|
|
659
|
|
|||||
|
Nuclear fuel and other amortization
|
201
|
|
184
|
|
122
|
|
|||||
|
Deferred income taxes
|
601
|
|
617
|
|
988
|
|
|||||
|
Cost recovery clauses and franchise fees
|
(67
|
)
|
(166
|
)
|
129
|
|
|||||
|
Other - net
|
94
|
|
46
|
|
(94
|
)
|
|||||
|
Changes in operating assets and liabilities:
|
|
|
|
|
|
|
|||||
|
Customer and other receivables
|
(10
|
)
|
(5
|
)
|
(96
|
)
|
|||||
|
Materials, supplies and fossil fuel inventory
|
(106
|
)
|
(16
|
)
|
33
|
|
|||||
|
Other current assets
|
(9
|
)
|
15
|
|
(20
|
)
|
|||||
|
Other assets
|
(103
|
)
|
(12
|
)
|
(41
|
)
|
|||||
|
Accounts payable and customer deposits
|
28
|
|
(1
|
)
|
(33
|
)
|
|||||
|
Income taxes
|
(34
|
)
|
384
|
|
(111
|
)
|
|||||
|
Other current liabilities
|
(64
|
)
|
11
|
|
68
|
|
|||||
|
Other liabilities
|
(26
|
)
|
(7
|
)
|
(21
|
)
|
|||||
|
Net cash provided by operating activities
|
3,454
|
|
3,558
|
|
2,823
|
|
|||||
|
CASH FLOWS FROM INVESTING ACTIVITIES
|
|
|
|
|
|
|
|||||
|
Capital expenditures
|
(3,067
|
)
|
(2,691
|
)
|
(4,070
|
)
|
|||||
|
Nuclear fuel purchases
|
(174
|
)
|
(212
|
)
|
(215
|
)
|
|||||
|
Proceeds from sale or maturity of securities in special use funds
|
3,349
|
|
3,342
|
|
3,790
|
|
|||||
|
Purchases of securities in special use funds
|
(3,414
|
)
|
(3,389
|
)
|
(3,838
|
)
|
|||||
|
Other - net
|
(268
|
)
|
30
|
|
68
|
|
|||||
|
Net cash used in investing activities
|
(3,574
|
)
|
(2,920
|
)
|
(4,265
|
)
|
|||||
|
CASH FLOWS FROM FINANCING ACTIVITIES
|
|
|
|
|
|
|
|||||
|
Issuances of long-term debt
|
997
|
|
497
|
|
1,296
|
|
|||||
|
Retirements of long-term debt
|
(355
|
)
|
(453
|
)
|
(50
|
)
|
|||||
|
Net change in short-term debt
|
938
|
|
99
|
|
(225
|
)
|
|||||
|
Capital contributions from NEE
|
100
|
|
275
|
|
440
|
|
|||||
|
Dividends to NEE
|
(1,550
|
)
|
(1,070
|
)
|
—
|
|
|||||
|
Other - net
|
(15
|
)
|
(7
|
)
|
(15
|
)
|
|||||
|
Net cash provided by (used in) financing activities
|
115
|
|
(659
|
)
|
1,446
|
|
|||||
|
Net increase (decrease) in cash and cash equivalents
|
(5
|
)
|
(21
|
)
|
4
|
|
|||||
|
Cash and cash equivalents at beginning of year
|
19
|
|
40
|
|
36
|
|
|||||
|
Cash and cash equivalents at end of year
|
$
|
14
|
|
$
|
19
|
|
$
|
40
|
|
||
|
SUPPLEMENTAL DISCLOSURES OF CASH FLOW INFORMATION
|
|
|
|
|
|
|
|||||
|
Cash paid for interest (net of amount capitalized)
|
$
|
417
|
|
$
|
410
|
|
$
|
400
|
|
||
|
Cash paid (received) for income taxes - net
|
$
|
342
|
|
$
|
(166
|
)
|
$
|
(124
|
)
|
||
|
SUPPLEMENTAL SCHEDULE OF NONCASH INVESTING AND FINANCING ACTIVITIES
|
|
|
|
|
|
|
|||||
|
Accrued property additions
|
$
|
404
|
|
$
|
386
|
|
$
|
472
|
|
||
The accompanying Notes to Consolidated Financial Statements are an integral part of these statements.
79
FLORIDA POWER & LIGHT COMPANY
CONSOLIDATED STATEMENTS OF COMMON SHAREHOLDER'S EQUITY
(millions)
|
Common
Stock
|
Additional
Paid-In Capital
|
Retained
Earnings
|
Common
Shareholder's
Equity
|
||||||||||||
|
Balances, December 31, 2011
|
$
|
1,373
|
|
$
|
5,464
|
|
$
|
4,013
|
|
$
|
10,850
|
|
|||
|
Net income
|
—
|
|
—
|
|
1,240
|
|
|
||||||||
|
Capital contributions from NEE
|
—
|
|
440
|
|
—
|
|
|||||||||
|
Other
|
—
|
|
(1
|
)
|
1
|
|
|
||||||||
|
Balances, December 31, 2012
|
1,373
|
|
5,903
|
|
5,254
|
|
$
|
12,530
|
|
||||||
|
Net income
|
—
|
|
—
|
|
1,349
|
|
|
||||||||
|
Capital contributions from NEE
|
—
|
|
275
|
|
—
|
|
|||||||||
|
Dividends to NEE
|
—
|
|
—
|
|
(1,070
|
)
|
|
||||||||
|
Other
|
—
|
|
1
|
|
(1
|
)
|
|
||||||||
|
Balances, December 31, 2013
|
1,373
|
|
6,179
|
|
5,532
|
|
$
|
13,084
|
|
||||||
|
Net income
|
—
|
|
—
|
|
1,517
|
|
|
||||||||
|
Capital contributions from NEE
|
—
|
|
100
|
|
—
|
|
|
||||||||
|
Dividends to NEE
|
—
|
|
—
|
|
(1,550
|
)
|
|
||||||||
|
Balances, December 31, 2014
|
$
|
1,373
|
|
$
|
6,279
|
|
$
|
5,499
|
|
$
|
13,151
|
|
|||
The accompanying Notes to Consolidated Financial Statements are an integral part of these statements.
80
NEXTERA ENERGY, INC. AND FLORIDA POWER & LIGHT COMPANY
NOTES TO CONSOLIDATED FINANCIAL STATEMENTS
Years Ended December 31, 2014, 2013 and 2012
1. Summary of Significant Accounting and Reporting Policies
Basis of Presentation
- The operations of NextEra Energy, Inc. (NEE) are conducted primarily through its wholly-owned subsidiary Florida Power & Light Company (FPL) and its wholly-owned indirect subsidiary NextEra Energy Resources, LLC (NEER). FPL, a rate-regulated electric utility, supplies electric service to approximately
4.7
million customer accounts throughout most of the east and lower west coasts of Florida. NEER invests in independent power projects through both controlled and consolidated entities and non-controlling ownership interests in joint ventures essentially all of which are accounted for under the equity method.
The consolidated financial statements of NEE and FPL include the accounts of their respective majority-owned and controlled subsidiaries. Intercompany balances and transactions have been eliminated in consolidation. Certain amounts included in prior years' consolidated financial statements have been reclassified to conform to the current year's presentation. The preparation of financial statements requires the use of estimates and assumptions that affect the reported amounts of assets, liabilities, revenues and expenses and the disclosure of contingent assets and liabilities. Actual results could differ from those estimates.
NextEra Energy Partners, LP
- NEE, through NEER, formed NextEra Energy Partners, LP (NEP) to acquire, manage and own contracted clean energy projects with stable, long-term cash flows through a limited partnership interest in NextEra Energy Operating Partners, LP (NEP OpCo). On July 1, 2014, NEP closed its initial public offering (IPO) by issuing
18,687,500
common units representing limited partnership interests. The proceeds from the sale of the common units, net of underwriting discounts, commissions and structuring fees, were approximately $
438 million
. NEP used such proceeds to purchase
18,687,500
common units of NEP OpCo, of which approximately $
288 million
was used to purchase common units from an indirect wholly-owned subsidiary of NEE and $
150 million
was used to purchase common units from NEP OpCo. Through an indirect wholly-owned subsidiary, NEE retained
74,440,000
units of NEP OpCo representing a
79.9%
interest in NEP's operating projects. Additionally, NEE owns a controlling general partnership interest in NEP and consolidates this entity for financial reporting purposes and presents NEP's limited partnership interest as a noncontrolling interest in NEE's consolidated financial statements. The IPO resulted in a deferred gain of approximately $
299 million
which is reflected in noncurrent other liabilities on NEE's consolidated balance sheet at December 31, 2014. Upon completion of the IPO, NEP, through NEER's contribution of energy projects to NEP OpCo, owned a portfolio of ten wind and solar projects with generation capacity totaling approximately
990
megawatts (MW).
Regulation
- FPL is subject to rate regulation by the Florida Public Service Commission (FPSC) and the Federal Energy Regulatory Commission (FERC). Its rates are designed to recover the cost of providing electric service to its customers including a reasonable rate of return on invested capital. As a result of this cost-based regulation, FPL follows the accounting guidance that allows regulators to create assets and impose liabilities that would not be recorded by non-rate regulated entities. Regulatory assets and liabilities represent probable future revenues that will be recovered from or refunded to customers through the ratemaking process.
Cost recovery clauses, which are designed to permit full recovery of certain costs and provide a return on certain assets allowed to be recovered through the various clauses, include substantially all fuel, purchased power and interchange costs, certain construction-related costs for FPL's planned additional nuclear units at Turkey Point and FPL's solar generating facilities, and conservation and certain environmental-related costs.
Revenues from cost recovery clauses are recorded when billed; FPL achieves matching of costs and related revenues by deferring the net underrecovery or overrecovery. Any underrecovered costs or overrecovered revenues are collected from or returned to customers in subsequent periods.
If FPL were no longer subject to cost-based rate regulation, the existing regulatory assets and liabilities would be written off unless regulators specify an alternative means of recovery or refund. In addition, the FPSC has the authority to disallow recovery of costs that it considers excessive or imprudently incurred. The continued applicability of regulatory accounting is assessed at each reporting period.
Revenues and Rates
- FPL's retail and wholesale utility rate schedules are approved by the FPSC and the FERC, respectively. FPL records unbilled base revenues for the estimated amount of energy delivered to customers but not yet billed. FPL's unbilled base revenues are included in customer receivables on NEE's and FPL's consolidated balance sheets and amounted to approximately
$223 million
and
$200 million
at
December 31, 2014 and 2013
, respectively. FPL's operating revenues also include amounts resulting from cost recovery clauses (see Regulation above), franchise fees, gross receipts taxes and surcharges related to storm-recovery bonds (see Note 8 - FPL). Franchise fees and gross receipts taxes are imposed on FPL; however, the FPSC allows FPL to include in the amounts charged to customers the amount of the gross receipts tax for all customers and the franchise amount for those customers located in the jurisdiction that imposes the fee. Accordingly, franchise fees and gross receipts taxes are reported gross in operating revenues and taxes other than income taxes and other in NEE's and FPL's consolidated statements of income and were approximately
$716 million
,
$680 million
and
$684 million
in 2014, 2013 and 2012, respectively. The revenues from the surcharges related to storm-recovery bonds included in operating revenues in NEE's and FPL's consolidated statements of income were approximately
$109 million
,
$108 million
and
$106 million
in 2014, 2013 and 2012, respectively. FPL also collects municipal utility taxes which are reported gross in customer receivables and accounts payable on NEE's and FPL's consolidated balance sheets.
81
NEXTERA ENERGY, INC. AND FLORIDA POWER & LIGHT COMPANY
NOTES TO CONSOLIDATED FINANCIAL STATEMENTS (Continued)
FPL Rates Effective January 2013 - December 2016 - In January 2013, the FPSC issued a final order approving a stipulation and settlement between FPL and several intervenors in FPL's base rate proceeding (2012 rate agreement). Key elements of the 2012 rate agreement, which is effective from January 2013 through December 2016, include, among other things, the following:
|
•
|
New retail base rates and charges were established in January 2013 resulting in an increase in retail base revenues of
$350 million
on an annualized basis.
|
|
•
|
FPL's allowed regulatory return on common equity (ROE) is
10.50%
, with a range of plus or minus
100
basis points. If FPL's earned regulatory ROE falls below
9.50%
, FPL may seek retail base rate relief. If the earned regulatory ROE rises above
11.50%
, any party to the 2012 rate agreement other than FPL may seek a review of FPL's retail base rates.
|
|
•
|
Retail base rates will be increased by the annualized base revenue requirements for FPL's three modernization projects (Cape Canaveral, Riviera Beach and Port Everglades) as each of the modernized power plants becomes operational. (Cape Canaveral and Riviera Beach became operational in April 2013 and April 2014, respectively, and Port Everglades is expected to be operational by mid-2016.)
|
|
•
|
Cost recovery of FPL's West County Energy Center (WCEC) Unit No. 3 will continue to occur through the capacity cost recovery clause (capacity clause) (reported as retail base revenues); however, such recovery will not be limited to the projected annual fuel cost savings as was the case in the previous rate agreement discussed below.
|
|
•
|
Subject to certain conditions, FPL may amortize, over the term of the 2012 rate agreement, a depreciation reserve surplus remaining at the end of 2012 under the 2010 rate agreement discussed below (approximately
$224 million
) and may amortize a portion of FPL's fossil dismantlement reserve up to a maximum of
$176 million
(collectively, the reserve), provided that in any year of the 2012 rate agreement, FPL must amortize at least enough reserve to maintain a
9.50%
earned regulatory ROE but may not amortize any reserve that would result in an earned regulatory ROE in excess of
11.50%
.
|
|
•
|
Future storm restoration costs would be recoverable on an interim basis beginning 60 days from the filing of a cost recovery petition, but capped at an amount that could produce a surcharge of no more than
$4
for every
1,000
kilowatt-hours (kWh) of usage on residential bills during the first 12 months of cost recovery. Any additional costs would be eligible for recovery in subsequent years. If storm restoration costs exceed
$800 million
in any given calendar year, FPL may request an increase to the
$4
surcharge to recover the amount above
$800 million
.
|
|
•
|
An incentive mechanism whereby customers will receive 100% of certain gains, including but not limited to, gains from the purchase and sale of electricity and natural gas (including transportation and storage), up to a specified threshold. The gains exceeding that specified threshold will be shared by FPL and its customers.
|
FPL Rates Effective March 2010 - December 2012 - Effective March 1, 2010, pursuant to an FPSC final order (2010 FPSC rate order), new retail base rates for FPL were established, resulting in an increase in retail base revenues of approximately
$75 million
on an annualized basis. The 2010 FPSC rate order, among other things, also established a regulatory ROE of
10.0%
with a range of plus or minus
100
basis points. In February 2011, the FPSC issued a final order approving a stipulation and settlement agreement between FPL and principal parties in FPL's 2009 rate case (2010 rate agreement). The 2010 rate agreement, which was effective through December 31, 2012, provided for, among other things, a reduction in depreciation expense (surplus depreciation credit) in any calendar year up to a cap in 2010 of
$267 million
, a cap in subsequent years of
$267 million
plus the amount of any unused portion from prior years, and a total cap of
$776 million
over the course of the 2010 rate agreement, provided that in any year of the 2010 rate agreement FPL was required to use enough surplus depreciation credit to maintain an earned regulatory ROE within the range of
9.0%
-
11.0%
. The 2010 rate agreement also permitted incremental cost recovery through FPL's capacity clause for WCEC Unit No. 3 up to the amount of the projected annual fuel savings for customers.
NEER's revenue is recorded on the basis of commodities delivered, contracts settled or services rendered and includes estimated amounts yet to be billed to customers. Certain commodity contracts for the purchase and sale of power that meet the definition of a derivative are recorded at fair value with subsequent changes in fair value recognized as revenue. See Energy Trading below and Note 3.
In May 2014, the Financial Accounting Standards Board issued a new accounting standard which provides guidance on the recognition of revenue from contracts with customers and requires additional disclosures about the nature, amount, timing and uncertainty of revenue and cash flows from an entity's contracts with customers. The standard is effective for NEE and FPL beginning January 1, 2017. NEE and FPL are currently evaluating the effect the adoption of this standard will have, if any, on their consolidated financial statements.
Electric Plant, Depreciation and Amortization
- The cost of additions to units of property of FPL and NEER is added to electric plant in service. In accordance with regulatory accounting, the cost of FPL's units of utility property retired, less estimated net salvage value, is charged to accumulated depreciation. Maintenance and repairs of property as well as replacements and renewals of items determined to be less than units of utility property are charged to other operations and maintenance (O&M) expenses. At
December 31, 2014
, the electric generating, transmission, distribution and general facilities of FPL represented approximately
51%
,
11%
,
33%
and
5%
, respectively, of FPL's gross investment in electric utility plant in service and other property. Substantially all of FPL's properties are subject to the lien of FPL's mortgage, which secures most debt securities issued by FPL. A number of NEER's generating facilities are encumbered by liens securing various financings. The net book value of NEER's assets serving as collateral was approximately
$10.4 billion
at
December 31, 2014
. The American Recovery and Reinvestment Act of 2009, as amended (Recovery Act), provided for an option to elect a cash grant (convertible investment tax credits (ITCs)) for certain renewable energy
82
NEXTERA ENERGY, INC. AND FLORIDA POWER & LIGHT COMPANY
NOTES TO CONSOLIDATED FINANCIAL STATEMENTS (Continued)
property (renewable property). Convertible ITCs are recorded as a reduction in property, plant and equipment on NEE's and FPL's consolidated balance sheets and are amortized as a reduction to depreciation and amortization expense over the estimated life of the related property. At
December 31, 2014
and
2013
, convertible ITCs, net of amortization, were approximately
$1.6 billion
(
$159 million
at FPL) and
$1.5 billion
(
$165 million
at FPL). At
December 31, 2014
and
2013
, approximately
$1 million
and
$182 million
, respectively, of such convertible ITCs are included in other receivables on NEE's consolidated balance sheets.
Depreciation of FPL's electric property is primarily provided on a straight-line average remaining life basis. FPL includes in depreciation expense a provision for fossil and solar plant dismantlement, interim asset removal costs, accretion related to asset retirement obligations (see Decommissioning of Nuclear Plants, Dismantlement of Plants and Other Accrued Asset Removal Costs below), storm recovery amortization and amortization of pre-construction costs associated with planned nuclear units recovered through a cost recovery clause. For substantially all of FPL's property, depreciation studies are typically performed and filed with the FPSC at least every
four
years. As part of the 2010 FPSC rate order, the FPSC approved new depreciation rates which became effective January 1, 2010. In accordance with the 2012 rate agreement, FPL is not required to file depreciation studies during the effective period of the agreement and the previously approved depreciation rates remain in effect. As discussed in Revenue and Rates above, the use of reserve amortization (the reduction of the reserve under the 2012 rate agreement and the surplus depreciation credit under the 2010 rate agreement) is permitted under the 2012 and 2010 rate agreements. FPL files a twelve-month forecast with the FPSC each year which contains a regulatory ROE intended to be earned based on the best information FPL has at that time assuming normal weather. This forecast establishes a fixed targeted regulatory ROE. In order to earn the targeted regulatory ROE in each reporting period under the 2012 and 2010 rate agreements, reserve amortization is calculated using a trailing thirteen-month average of retail rate base and capital structure in conjunction with the trailing twelve months regulatory retail base net operating income, which primarily includes the retail base portion of base and other revenues, net of O&M, depreciation and amortization, interest and tax expenses. In general, the net impact of these income statement line items is adjusted, in part, by reserve amortization or reversal to earn the targeted regulatory ROE. In accordance with the 2012 and 2010 rate agreements, FPL recorded approximately
$(33) million
,
$155 million
and
$480 million
of reserve (reversal) amortization in 2014, 2013 and 2012, respectively. Beginning in 2013, the reserve is amortized as a reduction of (or reversed as an increase to) regulatory liabilities - accrued asset removal costs on NEE's and FPL's consolidated balance sheets. The weighted annual composite depreciation and amortization rate for FPL's electric utility plant in service, including capitalized software, but excluding the effects of decommissioning, dismantlement and the depreciation adjustments discussed above, was approximately
3.3%
,
3.4%
and
3.3%
for 2014, 2013 and 2012, respectively.
NEER's electric plant in service less salvage value, if any, are depreciated primarily using the straight-line method over their estimated useful lives. At
December 31, 2014 and 2013
, wind, nuclear, natural gas and solar plants represented approximately
63%
and
62%
,
12%
and
13%
,
8%
and
9%
, and
7%
and
6%
, respectively, of NEER's depreciable electric plant in service and other property. The estimated useful lives of NEER's plants range primarily from
25
to
30
years for wind, natural gas and solar plants and from
25
to
47
years for nuclear plants. NEER reviews the estimated useful lives of its fixed assets on an ongoing basis. NEER's oil and gas production assets, representing approximately
6%
of NEER's depreciable electric plant in service and other property at both
December 31, 2014 and 2013
, are accounted for under the successful efforts method. Depletion expenses for the acquisition of reserve rights and development costs are recognized using the unit of production method.
Nuclear Fuel
- FPL and NEER have several contracts for the supply of uranium, conversion, enrichment and fabrication of nuclear fuel. See Note 13 - Contracts. FPL's and NEER's nuclear fuel costs are charged to fuel expense on a unit of production method.
Construction Activity
- Allowance for funds used during construction (AFUDC) is a non-cash item which represents the allowed cost of capital, including an ROE, used to finance FPL construction projects. The portion of AFUDC attributable to borrowed funds is recorded as a reduction of interest expense and the remainder is recorded as other income. FPSC rules limit the recording of AFUDC to projects that have an estimated cost in excess of
0.5%
of a utility's plant in service balance and require more than one year to complete. FPSC rules allow construction projects below the
0.5%
threshold as a component of rate base. During 2014, 2013 and 2012, FPL capitalized AFUDC at a rate of
6.34%
,
6.52%
and
6.41%
, respectively, which amounted to approximately
$50 million
,
$81 million
and
$74 million
, respectively. See Note 13 - Commitments.
FPL's construction work in progress includes construction materials, progress payments on major equipment contracts, engineering costs, AFUDC and other costs directly associated with the construction of various projects. Upon completion of the projects, these costs are transferred to electric utility plant in service and other property. Capitalized costs associated with construction activities are charged to O&M expenses when recoverability is no longer probable. See Regulation above for information on recovery of costs associated with new nuclear capacity and solar generating facilities.
NEER capitalizes project development costs once it is probable that such costs will be realized through the ultimate construction of a power plant or sale of development rights. At
December 31, 2014 and 2013
, NEER's capitalized development costs totaled approximately
$122 million
and
$162 million
, respectively, which are included in noncurrent other assets on NEE's consolidated balance sheets. These costs include land rights and other third-party costs directly associated with the development of a new project. Upon commencement of construction, these costs either are transferred to construction work in progress or remain in other assets, depending upon the nature of the cost. Capitalized development costs are charged to O&M expenses when it is no longer probable that these costs will be realized.
83
NEXTERA ENERGY, INC. AND FLORIDA POWER & LIGHT COMPANY
NOTES TO CONSOLIDATED FINANCIAL STATEMENTS (Continued)
NEER's construction work in progress includes construction materials, prepayments on turbine generators and other equipment, third-party engineering costs, capitalized interest and other costs directly associated with the construction and development of various projects. Interest capitalized on construction projects amounted to approximately
$104 million
,
$109 million
and
$139 million
during
2014, 2013 and 2012
, respectively. Interest expense allocated from NextEra Energy Capital Holdings, Inc. (NEECH) to NEER is based on a deemed capital structure of
70%
debt. Upon commencement of plant operation, costs associated with construction work in progress are transferred to electric plant in service and other property.
Asset Retirement Obligations
- NEE and FPL each account for asset retirement obligations and conditional asset retirement obligations (collectively, AROs) under accounting guidance that requires a liability for the fair value of an ARO to be recognized in the period in which it is incurred if it can be reasonably estimated, with the offsetting associated asset retirement costs capitalized as part of the carrying amount of the long-lived assets. The asset retirement cost is subsequently allocated to expense using a systematic and rational method over the asset’s estimated useful life. Changes in the ARO resulting from the passage of time are recognized as an increase in the carrying amount of the liability and as accretion expense, which is included in depreciation and amortization expense in the consolidated statements of income. Changes resulting from revisions to the timing or amount of the original estimate of cash flows are recognized as an increase or a decrease in the asset retirement cost, or income when asset retirement cost is depleted, in the case of NEE's non-rate regulated operations, and ARO and regulatory liability, in the case of FPL. See Decommissioning of Nuclear Plants, Dismantlement of Plants and Other Accrued Asset Removal Costs below and Note 12.
Decommissioning of Nuclear Plants, Dismantlement of Plants and Other Accrued Asset Removal Costs
- For ratemaking purposes, FPL accrues for the cost of end of life retirement and disposal of its nuclear, fossil and solar plants over the expected service life of each unit based on nuclear decommissioning and fossil and solar dismantlement studies periodically filed with the FPSC. In addition, FPL accrues for interim removal costs over the life of the related assets based on depreciation studies approved by the FPSC. As approved by the FPSC, FPL previously suspended its annual decommissioning accrual. For financial reporting purposes, FPL recognizes decommissioning and dismantlement liabilities in accordance with accounting guidance that requires a liability for the fair value of an ARO to be recognized in the period in which it is incurred. Any differences between expense recognized for financial reporting purposes and the amount recovered through rates are reported as a regulatory liability in accordance with regulatory accounting. See Revenues and Rates, Electric Plant, Depreciation and Amortization, Asset Retirement Obligations above and Note 12.
Nuclear decommissioning studies are performed at least every
five
years and are submitted to the FPSC for approval. FPL filed updated nuclear decommissioning studies with the FPSC in December 2010. These studies reflect FPL's current plans, under the operating licenses, for prompt dismantlement of Turkey Point Units Nos. 3 and 4 following the end of plant operation with decommissioning activities commencing in 2032 and 2033, respectively, and provide for St. Lucie Unit No. 1 to be mothballed beginning in 2036 with decommissioning activities to be integrated with the prompt dismantlement of St. Lucie Unit No. 2 in 2043. These studies also assume that FPL will be storing spent fuel on site pending removal to a U.S. government facility. The studies indicate FPL's portion of the ultimate costs of decommissioning its
four
nuclear units, including costs associated with spent fuel storage above what is expected to be refunded by the U.S. Department of Energy (DOE) under a spent fuel settlement agreement, to be approximately
$6.2 billion
, or
$2.6 billion
expressed in 2014 dollars.
Restricted funds for the payment of future expenditures to decommission FPL's nuclear units are included in nuclear decommissioning reserve funds, which are included in special use funds on NEE's and FPL's consolidated balance sheets. Marketable securities held in the decommissioning funds are primarily classified as available for sale and carried at fair value. See Note 4. FPL does not currently make contributions to the decommissioning funds, other than the reinvestment of dividends and interest. Fund earnings, consisting of dividends, interest and realized gains and losses, as well as any changes in unrealized gains and losses are not recognized in income and are reflected as a corresponding offset in the related regulatory liability accounts. During 2014, 2013 and 2012 fund earnings on decommissioning funds were approximately
$91 million
,
$167 million
and
$98 million
, respectively. The tax effects of amounts not yet recognized for tax purposes are included in accumulated deferred income taxes.
Fossil and solar plant dismantlement studies are typically performed at least every
four
years and are submitted to the FPSC for approval. FPL's latest fossil and solar plant dismantlement studies became effective January 1, 2010 and resulted in an annual expense of
$18 million
which is recorded in depreciation and amortization expense in NEE's and FPL's consolidated statements of income. At
December 31, 2014
, FPL's portion of the ultimate cost to dismantle its fossil and solar units is approximately
$746 million
, or
$385 million
expressed in 2014 dollars. In accordance with the 2012 rate agreement, FPL is not required to file fossil and solar dismantlement studies during the effective period of the agreement.
NEER records nuclear decommissioning liabilities for Seabrook Station (Seabrook), Duane Arnold Energy Center (Duane Arnold) and Point Beach Nuclear Power Plant (Point Beach) in accordance with accounting guidance that requires a liability for the fair value of an ARO to be recognized in the period in which it is incurred. The liability is being accreted using the interest method through the date decommissioning activities are expected to be complete. See Note 12. At
December 31, 2014 and 2013
, NEER's ARO related to nuclear decommissioning was approximately
$462 million
and
$434 million
, respectively, and was determined using various internal and external data and applying a probability percentage to a variety of scenarios regarding the life of the plant and timing of decommissioning. NEER's portion of the ultimate cost of decommissioning its nuclear plants, including costs associated
84
NEXTERA ENERGY, INC. AND FLORIDA POWER & LIGHT COMPANY
NOTES TO CONSOLIDATED FINANCIAL STATEMENTS (Continued)
with spent fuel storage above what is expected to be refunded by the DOE under a spent fuel settlement agreement, is estimated to be approximately
$11.9 billion
, or
$2.0 billion
expressed in 2014 dollars.
Seabrook files a comprehensive nuclear decommissioning study with the New Hampshire Nuclear Decommissioning Financing Committee (NDFC) every
four
years; the most recent study was filed in 2011. Seabrook's decommissioning funding plan is also subject to annual review by the NDFC. Currently, there are no ongoing decommissioning funding requirements for Seabrook, Duane Arnold and Point Beach, however, the U.S. Nuclear Regulatory Commission (NRC), and in the case of Seabrook, the NDFC, has the authority to require additional funding in the future. NEER's portion of Seabrook's, Duane Arnold's and Point Beach's restricted funds for the payment of future expenditures to decommission these plants is included in nuclear decommissioning reserve funds, which are included in special use funds on NEE's consolidated balance sheets. Marketable securities held in the decommissioning funds are primarily classified as available for sale and carried at fair value. Market adjustments result in a corresponding adjustment to other comprehensive income (OCI), except for unrealized losses associated with marketable securities considered to be other than temporary, including any credit losses, which are recognized as other than temporary impairment losses on securities held in nuclear decommissioning funds in NEE's consolidated statements of income. Fund earnings are recognized in income and are reinvested in the funds. See Note 4. The tax effects of amounts not yet recognized for tax purposes are included in accumulated deferred income taxes.
Major Maintenance Costs
- FPL uses the accrue-in-advance method for recognizing costs associated with planned major nuclear maintenance, in accordance with regulatory treatment, and records the related accrual as a regulatory liability. FPL expenses costs associated with planned fossil maintenance as incurred. FPL's estimated nuclear maintenance costs for each nuclear unit's next planned outage are accrued over the period from the end of the last outage to the end of the next planned outage. Any difference between the estimated and actual costs is included in O&M expenses when known. The accrued liability for nuclear maintenance costs at
December 31, 2014 and 2013
totaled approximately
$50 million
and
$70 million
, respectively, and is included in regulatory liabilities - other on NEE's and FPL's consolidated balance sheets. For the years ended
December 31, 2014, 2013 and 2012
, FPL recognized approximately
$76 million
,
$92 million
and
$104 million
, respectively, in nuclear maintenance costs which are primarily included in O&M expenses in NEE's and FPL's consolidated statements of income.
NEER uses the deferral method to account for certain planned major maintenance costs. NEER's major maintenance costs for its nuclear generating units and combustion turbines are capitalized and amortized on a unit of production method over the period from the end of the last outage to the beginning of the next planned outage. NEER's capitalized major maintenance costs, net of accumulated amortization, totaled approximately
$141 million
and
$92 million
at
December 31, 2014 and 2013
, respectively, and are included in noncurrent other assets on NEE's consolidated balance sheets. For the years ended
December 31, 2014, 2013 and 2012
, NEER amortized approximately
$81 million
,
$93 million
and
$100 million
in major maintenance costs which are included in O&M expenses in NEE's consolidated statements of income.
Cash Equivalents
- Cash equivalents consist of short-term, highly liquid investments with original maturities of three months or less.
Restricted Cash
- At
December 31, 2014 and 2013
, NEE had approximately
$228 million
(
$38 million
for FPL) and
$215 million
($
38 million
for FPL), respectively, of restricted cash included in other current assets on NEE's and FPL's consolidated balance sheets, which was restricted primarily for margin cash collateral and debt service payments. Where offsetting positions exist, restricted cash related to margin cash collateral is netted against derivative instruments. See Note 3.
Allowance for Doubtful Accounts
- FPL maintains an accumulated provision for uncollectible customer accounts receivable that is estimated using a percentage, derived from historical revenue and write-off trends, of the previous five months of revenue. Additional amounts are included in the provision to address specific items that are not considered in the calculation described above. NEER regularly reviews collectibility of its receivables and establishes a provision for losses estimated as a percentage of accounts receivable based on the historical bad debt write-off trends for its retail electricity provider operations and, when necessary, using the specific identification method for all other receivables.
Inventory
- FPL values materials, supplies and fossil fuel inventory using a weighted-average cost method. NEER's materials, supplies and fossil fuel inventories are carried at the lower of weighted-average cost or market, unless evidence indicates that the weighted-average cost (even if in excess of market) will be recovered with a normal profit upon sale in the ordinary course of business.
Energy Trading
- NEE provides full energy and capacity requirements services primarily to distribution utilities, which include load-following services and various ancillary services, in certain markets and engages in power and gas marketing and trading activities to optimize the value of electricity and fuel contracts, generating facilities and gas infrastructure assets, as well as to take advantage of projected favorable commodity price movements. Trading contracts that meet the definition of a derivative are accounted for at fair value and realized gains and losses from all trading contracts, including those where physical delivery is required, are recorded net for all periods presented. See Note 3.
Securitized Storm-Recovery Costs, Storm Fund and Storm Reserve
- In connection with the 2007 storm-recovery bond financing (see Note 8 - FPL), the net proceeds to FPL from the sale of the storm-recovery property were used primarily to reimburse FPL for
85
NEXTERA ENERGY, INC. AND FLORIDA POWER & LIGHT COMPANY
NOTES TO CONSOLIDATED FINANCIAL STATEMENTS (Continued)
its estimated net of tax deficiency in its storm and property insurance reserve (storm reserve) and provide for a storm and property insurance reserve fund (storm fund). Upon the issuance of the storm-recovery bonds, the storm reserve deficiency was reclassified to securitized storm-recovery costs and is recorded as a regulatory asset on NEE's and FPL's consolidated balance sheets. As storm-recovery charges are billed to customers, the securitized storm-recovery costs are amortized and included in depreciation and amortization in NEE's and FPL's consolidated statements of income. Marketable securities held in the storm fund are classified as available for sale and are carried at fair value with market adjustments, including any other than temporary impairment losses, resulting in a corresponding adjustment to the storm reserve. Fund earnings, net of taxes, are reinvested in the fund. The tax effects of amounts not yet recognized for tax purposes are included in accumulated deferred income taxes. The storm fund is included in special use funds on NEE's and FPL's consolidated balance sheets and was approximately
$75 million
and
$74 million
at
December 31, 2014 and 2013
, respectively. See Note 4.
The storm reserve that was reestablished in an FPSC financing order related to the issuance of the storm-recovery bonds was not initially reflected on NEE's and FPL's consolidated balance sheets because the associated regulatory asset did not meet the specific recognition criteria under the accounting guidance for certain regulated entities. As a result, the storm reserve will be recognized as a regulatory liability as the storm-recovery charges are billed to customers and charged to depreciation and amortization in NEE's and FPL's consolidated statements of income. Furthermore, the storm reserve will be reduced as storm costs are reimbursed. As of December 31, 2014, FPL had the capacity to absorb up to approximately
$122 million
in future prudently incurred storm restoration costs without seeking recovery through a rate adjustment from the FPSC or filing a petition with the FPSC.
Impairment of Long-Lived Assets
-
NEE evaluates long-lived assets for impairment when events or changes in circumstances indicate that the carrying amount may not be recoverable.
An impairment loss is required to be recognized if the carrying value of the asset exceeds the undiscounted future net cash flows associated with that asset. The impairment loss to be recognized is the amount by which the carrying value of the long-lived asset exceeds the asset's fair value. In most instances, the fair value is determined by discounting estimated future cash flows using an appropriate interest rate. See Note 4 - Nonrecurring Fair Value Measurements.
Goodwill and Other Intangible Assets
- NEE's goodwill and other intangible assets are as follows:
|
Weighted-
Average
Useful Lives
|
December 31,
|
||||||||
|
2014
|
2013
|
||||||||
|
(years)
|
(millions)
|
||||||||
|
Goodwill:
|
|||||||||
|
Merchant reporting unit
|
$
|
72
|
|
$
|
72
|
|
|||
|
Wind reporting unit
|
47
|
|
49
|
|
|||||
|
Fiber-optic telecommunications reporting unit
|
28
|
|
28
|
|
|||||
|
Total goodwill
|
$
|
147
|
|
$
|
149
|
|
|||
|
Other intangible assets not subject to amortization, primarily land easements
|
$
|
143
|
|
$
|
143
|
|
|||
|
Other intangible assets subject to amortization:
|
|
||||||||
|
Purchased power agreements
|
22
|
$
|
348
|
|
$
|
70
|
|
||
|
Customer lists
|
5
|
34
|
|
35
|
|
||||
|
Other, primarily transmission and development rights, permits and licenses
|
24
|
105
|
|
98
|
|
||||
|
Total
|
487
|
|
203
|
|
|||||
|
Less accumulated amortization
|
(125
|
)
|
(112
|
)
|
|||||
|
Total other intangible assets subject to amortization - net
|
$
|
362
|
|
$
|
91
|
|
|||
NEE's goodwill relates to various acquisitions which were accounted for using the purchase method of accounting. Other intangible assets subject to amortization are amortized, primarily on a straight-line basis, over their estimated useful lives. For the years ended
December 31, 2014, 2013 and 2012
, amortization expense was approximately
$15 million
,
$13 million
and
$14 million
, respectively, and is expected to be approximately $
14 million
,
$24 million
,
$20 million
,
$19 million
and
$17 million
for 2015, 2016, 2017, 2018 and 2019, respectively.
Goodwill and other intangible assets are included in noncurrent other assets on NEE's consolidated balance sheets. Goodwill and other intangible assets not subject to amortization are assessed for impairment at least annually by applying a fair value-based analysis. Other intangible assets subject to amortization are periodically reviewed when impairment indicators are present to assess recoverability from future operations using undiscounted future cash flows.
Pension and Other Postretirement Plans
- NEE allocates net periodic pension benefit income to its subsidiaries based on the pensionable earnings of the subsidiaries' employees; net periodic supplemental executive retirement plan (SERP) benefit costs to
86
NEXTERA ENERGY, INC. AND FLORIDA POWER & LIGHT COMPANY
NOTES TO CONSOLIDATED FINANCIAL STATEMENTS (Continued)
its subsidiaries based upon actuarial calculations by participant; and postretirement health care and life insurance benefits (other benefits) net periodic benefit costs to its subsidiaries based upon the number of eligible employees at each subsidiary.
Accounting guidance requires recognition of the funded status of benefit plans in the balance sheet, with changes in the funded status recognized in other comprehensive income within shareholders' equity in the year in which the changes occur. Since NEE is the plan sponsor, and its subsidiaries do not have separate rights to the plan assets or direct obligations to their employees, this accounting guidance is reflected at NEE and not allocated to the subsidiaries. The portion of previously unrecognized actuarial gains and losses and prior service costs or credits that are estimated to be allocable to FPL as net periodic benefit (income) cost in future periods and that otherwise would be recorded in accumulated other comprehensive income (AOCI) are classified as regulatory assets and liabilities at NEE in accordance with regulatory treatment.
Stock-Based Compensation
- NEE accounts for stock-based payment transactions based on grant-date fair value. Compensation costs for awards with graded vesting are recognized on a straight-line basis over the requisite service period for the entire award. See Note 10 - Stock-Based Compensation.
Income Taxes
- Deferred income taxes are recognized on all significant temporary differences between the financial statement and tax bases of assets and liabilities. In connection with the tax sharing agreement between NEE and its subsidiaries, the income tax provision at each subsidiary reflects the use of the "separate return method," except that tax benefits that could not be used on a separate return basis, but are used on the consolidated tax return, are recorded by the subsidiary that generated the tax benefits. Any remaining consolidated income tax benefits or expenses are recorded at the corporate level. Included in other regulatory assets and other regulatory liabilities on NEE's and FPL's consolidated balance sheets is the revenue equivalent of the difference in accumulated deferred income taxes computed under accounting rules, as compared to regulatory accounting rules. The net regulatory asset totaled $
250 million
(
$236 million
for FPL) and $
233 million
(
$218 million
for FPL) at
December 31, 2014
and
2013
, respectively, and is being amortized in accordance with the regulatory treatment over the estimated lives of the assets or liabilities for which the deferred tax amount was initially recognized.
NEER recognizes ITCs as a reduction to income tax expense when the related energy property is placed into service. Production tax credits (PTCs) are recognized as wind energy is generated and sold based on a per kWh rate prescribed in applicable federal and state statutes and are recorded as a reduction of current income taxes payable, unless limited by tax law in which instance they are recorded as deferred tax assets. NEE and FPL record a deferred income tax benefit created by the convertible ITCs on the difference between the financial statement and tax bases of renewable property. For NEER, this deferred income tax benefit is recorded in income tax expense in the year that the renewable property is placed in service. For FPL, this deferred income tax benefit is offset by a regulatory liability, which is amortized as a reduction of depreciation expense over the approximate lives of the related renewable property in accordance with the regulatory treatment. At
December 31, 2014
and
2013
, the net deferred income tax benefits associated with FPL's convertible ITCs were approximately $
50 million
and $
52 million
, respectively, and are included in other regulatory assets and regulatory liabilities on NEE's and FPL's consolidated balance sheets.
A valuation allowance is recorded to reduce the carrying amounts of deferred tax assets when it is more likely than not that such assets will not be realized. NEE recognizes interest income (expense) related to unrecognized tax benefits (liabilities) in interest income and interest expense, respectively, net of the amount deferred at FPL. At FPL, the offset to accrued interest receivable (payable) on income taxes is classified as a regulatory liability (regulatory asset) which will be amortized to income (expense) over a five-year period upon settlement in accordance with regulatory treatment. All tax positions taken by NEE in its income tax returns that are recognized in the financial statements must satisfy a more-likely-than-not threshold. See Note 5.
Sale of Differential Membership Interests
- Certain subsidiaries of NEER sold their Class B membership interest in entities that have ownership interests in wind facilities, with generating capacity totaling approximately
4,490
MW at
December 31, 2014
, to third-party investors. In exchange for the cash received, the holders of the Class B membership interests will receive a portion of the economic attributes of the facilities, including income tax attributes, for variable periods. The transactions are not treated as a sale under the accounting rules and the proceeds received are deferred and recorded as a liability in deferral related to differential membership interests - VIEs on NEE's consolidated balance sheets. The deferred amount is being recognized in benefits associated with differential membership interests - net in NEE's consolidated statements of income as the Class B members receive their portion of the economic attributes. NEE continues to operate and manage the wind facilities, and consolidates the entities that own the wind facilities.
Variable Interest Entities (VIEs)
- An entity is considered to be a VIE when its total equity investment at risk is not sufficient to permit the entity to finance its activities without additional subordinated financial support, or its equity investors, as a group, lack the characteristics of having a controlling financial interest. A reporting company is required to consolidate a VIE as its primary beneficiary when it has both the power to direct the activities of the VIE that most significantly impact the VIE's economic performance, and the obligation to absorb losses or the right to receive benefits from the VIE that could potentially be significant to the VIE. NEE and FPL evaluate whether an entity is a VIE whenever reconsideration events as defined by the accounting guidance occur. See Note 8.
Proposed Merger
- In December 2014, NEE and Hawaiian Electric Industries, Inc. (HEI) entered into an Agreement and Plan of Merger (the merger agreement) pursuant to which Hawaiian Electric Company, Inc., HEI's wholly-owned electric utility subsidiary,
87
NEXTERA ENERGY, INC. AND FLORIDA POWER & LIGHT COMPANY
NOTES TO CONSOLIDATED FINANCIAL STATEMENTS (Continued)
will become a wholly-owned subsidiary of NEE and each outstanding share of HEI common stock will be converted into the right to receive
0.2413
shares of NEE common stock. The companies are working to complete the merger by the end of 2015. However, completion of the merger and the actual closing date depend upon the satisfaction of a number of conditions, including approval by HEI shareholders and the receipt of required regulatory approvals. The merger agreement contains certain termination rights and provides that, upon termination of the merger agreement under specified circumstances, HEI or NEE, as the case may be, would be required to pay to the other party a termination fee of
$90 million
and reimburse the other party for up to
$5 million
of its documented out-of-pocket expenses incurred in connection with the merger agreement.
2. Employee Retirement Benefits
Employee Benefit Plans and Other Postretirement Plan
- NEE sponsors a qualified noncontributory defined benefit pension plan for substantially all employees of NEE and its subsidiaries. NEE also has a SERP, which includes a non-qualified supplemental defined benefit pension component that provides benefits to a select group of management and highly compensated employees. The impact of this SERP component is included within pension benefits in the following tables, and was not material to NEE's financial statements for the years ended
December 31, 2014
,
2013
and
2012
. In addition to pension benefits, NEE sponsors a contributory postretirement plan for other benefits for retirees of NEE and its subsidiaries meeting certain eligibility requirements.
Plan Assets, Benefit Obligations and Funded Status - The changes in assets and benefit obligations of the plans and the plans' funded status are as follows:
|
|
Pension Benefits
|
Other Benefits
|
|||||||||||||
|
|
2014
|
2013
|
2014
|
2013
|
|||||||||||
|
|
(millions)
|
||||||||||||||
|
Change in plan assets:
|
|
|
|
|
|||||||||||
|
Fair value of plan assets at January 1
|
$
|
3,692
|
|
$
|
3,385
|
|
$
|
26
|
|
$
|
26
|
|
|||
|
Actual return on plan assets
|
203
|
|
455
|
|
2
|
|
2
|
|
|||||||
|
Employer contributions
(a)
|
3
|
|
1
|
|
28
|
|
28
|
|
|||||||
|
Participant contributions
|
—
|
|
—
|
|
6
|
|
5
|
|
|||||||
|
Benefit payments
(a)
|
(200
|
)
|
(149
|
)
|
(39
|
)
|
(35
|
)
|
|||||||
|
Fair value of plan assets at December 31
|
$
|
3,698
|
|
$
|
3,692
|
|
$
|
23
|
|
$
|
26
|
|
|||
|
Change in benefit obligation:
|
|
|
|
|
|
|
|
|
|||||||
|
Obligation at January 1
|
$
|
2,254
|
|
$
|
2,372
|
|
$
|
354
|
|
$
|
397
|
|
|||
|
Service cost
|
63
|
|
73
|
|
3
|
|
4
|
|
|||||||
|
Interest cost
|
102
|
|
95
|
|
16
|
|
14
|
|
|||||||
|
Participant contributions
|
—
|
|
—
|
|
6
|
|
5
|
|
|||||||
|
Plan amendments
|
(11
|
)
|
—
|
|
—
|
|
—
|
|
|||||||
|
Special termination benefits
(b)
|
—
|
|
46
|
|
—
|
|
—
|
|
|||||||
|
Actuarial losses (gains) - net
|
264
|
|
(183
|
)
|
20
|
|
(31
|
)
|
|||||||
|
Benefit payments
(a)
|
(200
|
)
|
(149
|
)
|
(39
|
)
|
(35
|
)
|
|||||||
|
Obligation at December 31
(c)
|
$
|
2,472
|
|
$
|
2,254
|
|
$
|
360
|
|
$
|
354
|
|
|||
|
Funded status:
|
|
|
|
|
|
|
|
|
|||||||
|
Prepaid (accrued) benefit cost at NEE at December 31
|
$
|
1,226
|
|
$
|
1,438
|
|
$
|
(337
|
)
|
$
|
(328
|
)
|
|||
|
Prepaid (accrued) benefit cost at FPL at December 31
|
$
|
1,186
|
|
$
|
1,139
|
|
$
|
(234
|
)
|
$
|
(249
|
)
|
|||
______________________
|
(a)
|
Employer contributions and benefit payments include only those amounts contributed directly to, or paid directly from, plan assets. FPL's portion of contributions related to SERP benefits was less than $
1 million
for
2014
and
2013
, respectively. FPL's portion of contributions related to other benefits was $
27 million
and $
25 million
for
2014
and
2013
, respectively.
|
|
(b)
|
Reflects an enhanced early retirement program offered in 2013 as part of an enterprise-wide cost savings initiative.
|
|
(c)
|
NEE's accumulated pension benefit obligation, which includes no assumption about future salary levels, for its pension plans at
December 31, 2014
and
2013
was $
2,417 million
and $
2,197 million
, respectively.
|
88
NEXTERA ENERGY, INC. AND FLORIDA POWER & LIGHT COMPANY
NOTES TO CONSOLIDATED FINANCIAL STATEMENTS (Continued)
NEE's and FPL's prepaid (accrued) benefit cost shown above are included on the consolidated balance sheets as follows:
|
NEE
|
FPL
|
||||||||||||||||||||||||||||||
|
Pension Benefits
|
Other Benefits
|
Pension Benefits
|
Other Benefits
|
||||||||||||||||||||||||||||
|
2014
|
2013
|
2014
|
2013
|
2014
|
2013
|
2014
|
2013
|
||||||||||||||||||||||||
|
|
|
|
|
(millions)
|
|
|
|
||||||||||||||||||||||||
|
Prepaid benefit costs
|
$
|
1,244
|
|
$
|
1,456
|
|
$
|
—
|
|
$
|
—
|
|
$
|
1,189
|
|
$
|
1,142
|
|
$
|
—
|
|
$
|
—
|
|
|||||||
|
Accrued benefit cost included in other current liabilities
|
(4
|
)
|
(5
|
)
|
(23
|
)
|
(26
|
)
|
(2
|
)
|
(2
|
)
|
(19
|
)
|
(22
|
)
|
|||||||||||||||
|
Accrued benefit cost included in other liabilities
|
(14
|
)
|
(13
|
)
|
(314
|
)
|
(302
|
)
|
(1
|
)
|
(1
|
)
|
(215
|
)
|
(227
|
)
|
|||||||||||||||
|
Prepaid (accrued) benefit cost at December 31
|
$
|
1,226
|
|
$
|
1,438
|
|
$
|
(337
|
)
|
$
|
(328
|
)
|
$
|
1,186
|
|
$
|
1,139
|
|
$
|
(234
|
)
|
$
|
(249
|
)
|
|||||||
NEE's unrecognized amounts included in accumulated other comprehensive income (loss) yet to be recognized as components of prepaid (accrued) benefit cost are as follows:
|
Pension Benefits
|
Other Benefits
|
||||||||||||||
|
2014
|
|
2013
|
2014
|
|
2013
|
||||||||||
|
(millions)
|
|||||||||||||||
|
Components of AOCI:
|
|||||||||||||||
|
Unrecognized prior service benefit (cost) (net of $1 and $4 tax benefit and $2 and $2 tax expense, respectively)
|
$
|
(2
|
)
|
$
|
(8
|
)
|
$
|
3
|
|
$
|
4
|
|
|||
|
Unrecognized gain (loss) (net of $10 tax benefit, $18 tax expense and $5 and $3 tax benefit, respectively)
|
(16
|
)
|
30
|
|
(5
|
)
|
(3
|
)
|
|||||||
|
Total
|
$
|
(18
|
)
|
$
|
22
|
|
$
|
(2
|
)
|
$
|
1
|
|
|||
NEE's unrecognized amounts included in regulatory assets (liabilities) yet to be recognized as components of net prepaid (accrued) benefit cost are as follows:
|
Regulatory
Assets (Liabilities) (Pension) |
Regulatory
Assets (Liabilities) (SERP and Other) |
||||||||||||||
|
2014
|
2013
|
2014
|
2013
|
||||||||||||
|
(millions)
|
|||||||||||||||
|
Unrecognized prior service cost (benefit)
|
$
|
10
|
|
$
|
25
|
|
$
|
(13
|
)
|
$
|
(14
|
)
|
|||
|
Unrecognized losses (gains)
|
128
|
|
(98
|
)
|
46
|
|
29
|
|
|||||||
|
Total
|
$
|
138
|
|
$
|
(73
|
)
|
$
|
33
|
|
$
|
15
|
|
|||
The following table provides the weighted-average assumptions used to determine benefit obligations for the plans. These rates are used in determining net periodic benefit cost in the following year.
|
Pension Benefits
|
Other Benefits
|
||||||||||
|
2014
|
2013
|
2014
|
2013
|
||||||||
|
Discount rate
|
3.95
|
%
|
4.80
|
%
|
3.85
|
%
|
4.60
|
%
|
|||
|
Salary increase
|
4.10
|
%
|
4.00
|
%
|
4.10
|
%
|
4.00
|
%
|
|||
With regard to the other benefits plan, currently the retiree cost sharing structure largely insulates NEE and FPL from the effects of any future increase in health care costs. An increase or decrease of one percentage point in assumed health care cost trend rates would have a corresponding effect on the other benefits accumulated obligation of approximately $
2 million
at
December 31, 2014
.
NEE's investment policy for the pension plan recognizes the benefit of protecting the plan's funded status, thereby avoiding the necessity of future employer contributions. Its broad objectives are to achieve a high rate of total return with a prudent level of risk taking while maintaining sufficient liquidity and diversification to avoid large losses and preserve capital over the long term.
89
NEXTERA ENERGY, INC. AND FLORIDA POWER & LIGHT COMPANY
NOTES TO CONSOLIDATED FINANCIAL STATEMENTS (Continued)
The NEE pension plan fund's current target asset allocation, which is expected to be reached over time, is
45%
equity investments,
32%
fixed income investments,
13%
alternative investments and
10%
convertible securities. The pension fund's investment strategy emphasizes traditional investments, broadly diversified across the global equity and fixed income markets, using a combination of different investment styles and vehicles. The pension fund's equity and fixed income holdings consist of both directly held securities as well as commingled investment arrangements such as common and collective trusts, pooled separate accounts, registered investment companies and limited partnerships. The pension fund's convertible security assets are principally direct holdings of convertible securities and includes a convertible security oriented limited partnership. The pension fund's alternative investment holdings are primarily absolute return oriented limited partnerships that use a broad range of investment strategies on a global basis and real estate oriented investments in limited partnerships.
The fair value measurements of NEE's pension plan assets by fair value hierarchy level are as follows:
|
December 31, 2014
(a)
|
|||||||||||||||
|
Quoted Prices
in Active
Markets for
Identical Assets
or Liabilities
(Level 1)
|
Significant
Other
Observable
Inputs
(Level 2)
|
Significant
Unobservable
Inputs
(Level 3)
|
Total
|
||||||||||||
|
(millions)
|
|||||||||||||||
|
Equity securities
(b)
|
$
|
984
|
|
$
|
31
|
|
$
|
—
|
|
$
|
1,015
|
|
|||
|
Equity commingled vehicles
(c)
|
—
|
|
767
|
|
—
|
|
767
|
|
|||||||
|
U.S. Government and municipal bonds
|
144
|
|
20
|
|
—
|
|
164
|
|
|||||||
|
Corporate debt securities
(d)
|
—
|
|
355
|
|
—
|
|
355
|
|
|||||||
|
Asset-backed securities
|
—
|
|
223
|
|
—
|
|
223
|
|
|||||||
|
Debt security commingled vehicles
(e)
|
—
|
|
209
|
|
—
|
|
209
|
|
|||||||
|
Convertible securities
|
45
|
|
229
|
|
—
|
|
274
|
|
|||||||
|
Limited partnerships
(f)
|
—
|
|
293
|
|
398
|
|
691
|
|
|||||||
|
Total
|
$
|
1,173
|
|
$
|
2,127
|
|
$
|
398
|
|
$
|
3,698
|
|
|||
______________________
|
(a)
|
See Note 4 for discussion of fair value measurement techniques and inputs.
|
|
(b)
|
Includes foreign investments of $
321 million
.
|
|
(c)
|
Includes foreign investments of $
306 million
. Fair values have been estimated using net asset value (NAV) per share of the investments.
|
|
(d)
|
Includes foreign investments of $
88 million
.
|
|
(e)
|
Includes foreign investments of $
15 million
and $
148 million
of short-term commingled vehicles. Fair values have been estimated using NAV per share of the investments.
|
|
(f)
|
Includes foreign investments of $
185 million
. Also includes fixed income oriented commingled investment arrangements of $
426 million
, convertible security oriented limited partnerships of $
77 million
and alternative investments of $
188 million
. Fair values have been estimated using NAV per share of the investments. Those investments subject to certain restrictions have been classified as Level 3.
|
90
NEXTERA ENERGY, INC. AND FLORIDA POWER & LIGHT COMPANY
NOTES TO CONSOLIDATED FINANCIAL STATEMENTS (Continued)
|
|
December 31, 2013
(a)
|
||||||||||||||
|
|
Quoted Prices
in Active
Markets for
Identical Assets
or Liabilities
(Level 1)
|
Significant
Other
Observable
Inputs
(Level 2)
|
Significant
Unobservable
Inputs
(Level 3)
|
Total
|
|||||||||||
|
|
(millions)
|
||||||||||||||
|
Equity securities
(b)
|
$
|
1,028
|
|
$
|
—
|
|
$
|
—
|
|
$
|
1,028
|
|
|||
|
Equity commingled vehicles
(c)
|
—
|
|
656
|
|
—
|
|
656
|
|
|||||||
|
U.S. Government and municipal bonds
|
115
|
|
35
|
|
—
|
|
150
|
|
|||||||
|
Corporate debt securities
(d)
|
—
|
|
348
|
|
—
|
|
348
|
|
|||||||
|
Asset-backed securities
|
—
|
|
249
|
|
—
|
|
249
|
|
|||||||
|
Debt security commingled vehicles
(e)
|
—
|
|
526
|
|
—
|
|
526
|
|
|||||||
|
Convertible securities
|
46
|
|
236
|
|
—
|
|
282
|
|
|||||||
|
Limited partnerships
(f)
|
—
|
|
226
|
|
227
|
|
453
|
|
|||||||
|
Total
|
$
|
1,189
|
|
$
|
2,276
|
|
$
|
227
|
|
$
|
3,692
|
|
|||
______________________
|
(a)
|
See Note 4 for discussion of fair value measurement techniques and inputs.
|
|
(b)
|
Includes foreign investments of $
337 million
.
|
|
(c)
|
Includes foreign investments of $
234 million
. Fair values have been estimated using NAV per share of the investments.
|
|
(d)
|
Includes foreign investments of $
67 million
.
|
|
(e)
|
Includes foreign investments of $
54 million
and $
145 million
of short-term commingled vehicles. Fair values have been estimated using NAV per share of the investments.
|
|
(f)
|
Includes foreign investments of $
104 million
. Also, includes fixed income oriented commingled investment arrangements of $
244 million
, convertible security oriented limited partnerships of $
80 million
and alternative investments of $
129 million
. Fair values have been estimated using NAV per share of the investments. Those investments subject to certain restrictions have been classified as Level 3.
|
With regard to its other benefits plan, NEE's policy is to fund claims as incurred during the year through NEE contributions, participant contributions and plan assets. The other benefits plan's assets are invested with a focus on assuring the availability of funds to pay benefits while maintaining sufficient diversification to avoid large losses and preserve capital. The other benefits plan's fund has a strategic asset allocation that targets a mix of
60%
equity investments and
40%
fixed income investments. The fund's investment strategy consists of traditional investments, diversified across the global equity and fixed income markets. The fund's equity and fixed income investments are comprised of assets classified as commingled vehicles such as common and collective trusts, pooled separate accounts, registered investment companies or other forms of pooled investment arrangements.
The fair value measurements of NEE's other benefits plan assets at
December 31, 2014
and
2013
are substantially all Level 2 and include approximately $
14 million
and $
18 million
of equity commingled vehicles (of which $
3 million
and $
5 million
were foreign investments) and $
8 million
and $
6 million
of debt security commingled vehicles, respectively.
Expected Cash Flows - NEE anticipates paying approximately $
23 million
for eligible retiree medical expenses on behalf of the other benefits plan during
2015
.
The following table provides information about benefit payments expected to be paid by the plans, net of government drug subsidy, for each of the following calendar years:
|
Pension
Benefits
|
Other
Benefits
|
||||||
|
(millions)
|
|||||||
|
2015
|
$
|
154
|
|
$
|
28
|
|
|
|
2016
|
$
|
157
|
|
$
|
27
|
|
|
|
2017
|
$
|
162
|
|
$
|
29
|
|
|
|
2018
|
$
|
167
|
|
$
|
28
|
|
|
|
2019
|
$
|
169
|
|
$
|
27
|
|
|
|
2020 - 2024
|
$
|
880
|
|
$
|
123
|
|
|
91
NEXTERA ENERGY, INC. AND FLORIDA POWER & LIGHT COMPANY
NOTES TO CONSOLIDATED FINANCIAL STATEMENTS (Continued)
Net Periodic Cost - The components of net periodic benefit (income) cost for the plans are as follows:
|
Pension Benefits
|
Other Benefits
|
||||||||||||||||||||||
|
2014
|
2013
|
2012
|
2014
|
2013
|
2012
|
||||||||||||||||||
|
|
|
(millions)
|
|
|
|||||||||||||||||||
|
Service cost
|
$
|
63
|
|
$
|
73
|
|
$
|
65
|
|
$
|
3
|
|
$
|
4
|
|
$
|
5
|
|
|||||
|
Interest cost
|
102
|
|
95
|
|
98
|
|
16
|
|
14
|
|
18
|
|
|||||||||||
|
Expected return on plan assets
|
(241
|
)
|
(237
|
)
|
(238
|
)
|
(1
|
)
|
(1
|
)
|
(2
|
)
|
|||||||||||
|
Amortization of transition obligation
|
—
|
|
—
|
|
—
|
|
—
|
|
—
|
|
1
|
|
|||||||||||
|
Amortization of prior service cost (benefit)
|
5
|
|
7
|
|
5
|
|
(3
|
)
|
(2
|
)
|
(1
|
)
|
|||||||||||
|
Amortization of losses
|
—
|
|
2
|
|
—
|
|
—
|
|
2
|
|
—
|
|
|||||||||||
|
SERP settlements
|
—
|
|
—
|
|
3
|
|
—
|
|
—
|
|
—
|
|
|||||||||||
|
Special termination benefits
|
—
|
|
46
|
|
—
|
|
—
|
|
—
|
|
—
|
|
|||||||||||
|
Net periodic benefit (income) cost at NEE
|
$
|
(71
|
)
|
$
|
(14
|
)
|
$
|
(67
|
)
|
$
|
15
|
|
$
|
17
|
|
$
|
21
|
|
|||||
|
Net periodic benefit (income) cost at FPL
|
$
|
(46
|
)
|
$
|
(5
|
)
|
$
|
(43
|
)
|
$
|
11
|
|
$
|
13
|
|
$
|
16
|
|
|||||
Other Comprehensive Income - The components of net periodic benefit income (cost) recognized in OCI for the plans are as follows:
|
|
Pension Benefits
|
Other Benefits
|
|||||||||||||||||||||
|
|
2014
|
2013
|
2012
|
2014
|
2013
|
2012
|
|||||||||||||||||
|
|
|
(millions)
|
|
||||||||||||||||||||
|
Prior service benefit (cost) (net of $3 tax expense, $3 tax benefit and $4 tax expense, respectively)
|
$
|
4
|
|
$
|
—
|
|
$
|
(6
|
)
|
$
|
—
|
|
$
|
—
|
|
$
|
7
|
|
|||||
|
Net gains (losses) (net of $29 tax benefit, $58 tax expense, $16 tax benefit, $1 tax benefit, $3 tax expense and $3 tax benefit, respectively)
|
(45
|
)
|
91
|
|
(25
|
)
|
(3
|
)
|
4
|
|
(5
|
)
|
|||||||||||
|
Amortization of prior service benefit
|
1
|
|
2
|
|
1
|
|
—
|
|
—
|
|
—
|
|
|||||||||||
|
Total
|
$
|
(40
|
)
|
$
|
93
|
|
$
|
(30
|
)
|
$
|
(3
|
)
|
$
|
4
|
|
$
|
2
|
|
|||||
Regulatory Assets (Liabilities) - The components of net periodic benefit (income) cost recognized during the year in regulatory assets (liabilities) for the plans are as follows:
|
|
Regulatory
Assets (Liabilities)
(Pension)
|
Regulatory
Assets (Liabilities)
(SERP and Other)
|
|||||||||||||
|
|
2014
|
2013
|
2014
|
2013
|
|||||||||||
|
|
(millions)
|
||||||||||||||
|
Prior service benefit
|
$
|
(12
|
)
|
$
|
—
|
|
$
|
(1
|
)
|
$
|
—
|
|
|||
|
Unrecognized losses (gains)
|
226
|
|
(252
|
)
|
17
|
|
(26
|
)
|
|||||||
|
Amortization of prior service cost (benefit)
|
(3
|
)
|
(4
|
)
|
2
|
|
1
|
|
|||||||
|
Amortization of unrecognized losses
|
—
|
|
(1
|
)
|
—
|
|
(2
|
)
|
|||||||
|
Total
|
$
|
211
|
|
$
|
(257
|
)
|
$
|
18
|
|
$
|
(27
|
)
|
|||
The weighted-average assumptions used to determine net periodic benefit (income) cost for the plans are as follows:
|
|
Pension Benefits
|
Other Benefits
|
||||||||||||||||
|
|
2014
|
2013
|
2012
|
2014
|
2013
|
2012
|
||||||||||||
|
Discount rate
|
4.80
|
%
|
4.00
|
%
|
4.65
|
%
|
4.60
|
%
|
3.75
|
%
|
4.53
|
%
|
(a)
|
|||||
|
Salary increase
|
4.00
|
%
|
4.00
|
%
|
4.00
|
%
|
4.00
|
%
|
4.00
|
%
|
4.00
|
%
|
||||||
|
Expected long-term rate of return
(b)
|
7.75
|
%
|
7.75
|
%
|
7.75
|
%
|
7.25
|
%
|
7.75
|
%
|
8.00
|
%
|
||||||
______________________
|
(a)
|
Reflects a mid-year rate change due to cost remeasurement resulting from a plan amendment.
|
|
(b)
|
In developing the expected long-term rate of return on assets assumption for its plans, NEE evaluated input, including other qualitative and quantitative factors, from its actuaries and consultants, as well as information available in the marketplace. NEE considered different models, capital market return assumptions and historical returns for a portfolio with an equity/bond asset mix similar to its funds. NEE also considered its funds' historical compounded returns.
|
92
NEXTERA ENERGY, INC. AND FLORIDA POWER & LIGHT COMPANY
NOTES TO CONSOLIDATED FINANCIAL STATEMENTS (Continued)
Employee Contribution Plans
- NEE offers employee retirement savings plans which allow eligible participants to contribute a percentage of qualified compensation through payroll deductions. NEE makes matching contributions to participants' accounts. Defined contribution expense pursuant to these plans was approximately $
59 million
, $
46 million
and $
44 million
for NEE ($
37 million
, $
30 million
and $
29 million
for FPL) for the years ended
December 31, 2014
,
2013
and
2012
, respectively. See Note 10 - Employee Stock Ownership Plan.
3. Derivative Instruments
NEE and FPL use derivative instruments (primarily swaps, options, futures and forwards) to manage the commodity price risk inherent in the purchase and sale of fuel and electricity, as well as interest rate and foreign currency exchange rate risk associated with outstanding and forecasted debt issuances, and to optimize the value of NEER's power generation and gas infrastructure assets.
With respect to commodities related to NEE's competitive energy business, NEER employs risk management procedures to conduct its activities related to optimizing the value of its power generation and gas infrastructure assets, providing full energy and capacity requirements services primarily to distribution utilities, and engaging in power and gas marketing and trading activities to take advantage of expected future favorable price movements and changes in the expected volatility of prices in the energy markets. These risk management activities involve the use of derivative instruments executed within prescribed limits to manage the risk associated with fluctuating commodity prices. Transactions in derivative instruments are executed on recognized exchanges or via the over-the-counter (OTC) markets, depending on the most favorable credit terms and market execution factors. For NEER's power generation and gas infrastructure assets, derivative instruments are used to hedge the commodity price risk associated with the fuel requirements of the assets, where applicable, as well as to hedge all or a portion of the expected output of these assets. These hedges are designed to reduce the effect of adverse changes in the wholesale forward commodity markets associated with NEER's power generation and gas infrastructure assets. With regard to full energy and capacity requirements services, NEER is required to vary the quantity of energy and related services based on the load demands of the customers served. For this type of transaction, derivative instruments are used to hedge the anticipated electricity quantities required to serve these customers and reduce the effect of unfavorable changes in the forward energy markets. Additionally, NEER takes positions in the energy markets based on differences between actual forward market levels and management's view of fundamental market conditions, including supply/demand imbalances, changes in traditional flows of energy, changes in short- and long-term weather patterns and anticipated regulatory and legislative outcomes. NEER uses derivative instruments to realize value from these market dislocations, subject to strict risk management limits around market, operational and credit exposure.
Derivative instruments, when required to be marked to market, are recorded on NEE's and FPL's consolidated balance sheets as either an asset or liability measured at fair value. At FPL, substantially all changes in the derivatives' fair value are deferred as a regulatory asset or liability until the contracts are settled, and, upon settlement, any gains or losses are passed through the fuel and purchased power cost recovery clause (fuel clause). For NEE's non-rate regulated operations, predominantly NEER, essentially all changes in the derivatives' fair value for power purchases and sales, fuel sales and trading activities are recognized on a net basis in operating revenues; fuel purchases used in the production of electricity are recognized in fuel, purchased power and interchange expense; and the equity method investees' related activity is recognized in equity in earnings of equity method investees in NEE's consolidated statements of income. Settlement gains and losses are included within the line items in the consolidated statements of income to which they relate. Transactions for which physical delivery is deemed not to have occurred are presented on a net basis in the consolidated statements of income. For commodity derivatives, NEE believes that, where offsetting positions exist at the same location for the same time, the transactions are considered to have been netted and therefore physical delivery has been deemed not to have occurred for financial reporting purposes. Settlements related to derivative instruments are primarily recognized in net cash provided by operating activities in NEE's and FPL's consolidated statements of cash flows.
While most of NEE's derivatives are entered into for the purpose of managing commodity price risk, optimizing the value of NEER's power generation and gas infrastructure assets, reducing the impact of volatility in interest rates on outstanding and forecasted debt issuances and managing foreign currency risk, hedge accounting is only applied where specific criteria are met and it is practicable to do so. In order to apply hedge accounting, the transaction must be designated as a hedge and it must be highly effective in offsetting the hedged risk. Additionally, for hedges of forecasted transactions, the forecasted transactions must be probable. For interest rate and foreign currency derivative instruments, generally NEE assesses a hedging instrument's effectiveness by using nonstatistical methods including dollar value comparisons of the change in the fair value of the derivative to the change in the fair value or cash flows of the hedged item. Hedge effectiveness is tested at the inception of the hedge and on at least a quarterly basis throughout its life. The effective portion of the gain or loss on a derivative instrument designated as a cash flow hedge is reported as a component of OCI and is reclassified into earnings in the period(s) during which the transaction being hedged affects earnings or when it becomes probable that a forecasted transaction being hedged would not occur. The ineffective portion of net unrealized gains (losses) on these hedges is reported in earnings in the current period. In April 2013, NEE discontinued hedge accounting for cash flow hedges related to interest rate swaps associated with the solar projects in Spain (see Note 13 - Spain Solar Projects). At
December 31, 2014
, NEE's AOCI included amounts related to interest rate cash flow hedges with expiration dates through
March 2035
and foreign currency cash flow hedges with expiration dates through
September 2030
. Approximately
$53 million
of net losses included in AOCI at
December 31, 2014
is expected to be reclassified into earnings within the next 12
93
NEXTERA ENERGY, INC. AND FLORIDA POWER & LIGHT COMPANY
NOTES TO CONSOLIDATED FINANCIAL STATEMENTS (Continued)
months as the principal and/or interest payments are made. Such amounts assume no change in interest rates, currency exchange rates or scheduled principal payments.
Fair Value of Derivative Instruments
- The tables below present NEE's and FPL's gross derivative positions at
December 31, 2014
and
December 31, 2013
, as required by disclosure rules. However, the majority of the underlying contracts are subject to master netting agreements and generally would not be contractually settled on a gross basis. Therefore, the tables below also present the derivative positions on a net basis, which reflect the offsetting of positions of certain transactions within the portfolio, the contractual ability to settle contracts under master netting arrangements and the netting of margin cash collateral (see Note 4 - Recurring Fair Value Measurements for netting information), as well as the location of the net derivative position on the consolidated balance sheets.
|
December 31, 2014
|
|||||||||||||||||||||||
|
Fair Values of Derivatives
Designated as Hedging
Instruments for Accounting
Purposes - Gross Basis
|
Fair Values of Derivatives Not
Designated as Hedging
Instruments for Accounting
Purposes - Gross Basis
|
Total Derivatives Combined -
Net Basis
|
|||||||||||||||||||||
|
Assets
|
Liabilities
|
Assets
|
Liabilities
|
Assets
|
Liabilities
|
||||||||||||||||||
|
(millions)
|
|||||||||||||||||||||||
|
NEE:
|
|||||||||||||||||||||||
|
Commodity contracts
|
$
|
—
|
|
$
|
—
|
|
$
|
6,145
|
|
$
|
5,290
|
|
$
|
1,949
|
|
$
|
1,358
|
|
|||||
|
Interest rate contracts
|
35
|
|
126
|
|
—
|
|
125
|
|
50
|
|
266
|
|
|||||||||||
|
Foreign currency swaps
|
—
|
|
131
|
|
—
|
|
—
|
|
—
|
|
131
|
|
|||||||||||
|
Total fair values
|
$
|
35
|
|
$
|
257
|
|
$
|
6,145
|
|
$
|
5,415
|
|
$
|
1,999
|
|
$
|
1,755
|
|
|||||
|
FPL:
|
|||||||||||||||||||||||
|
Commodity contracts
|
$
|
—
|
|
$
|
—
|
|
$
|
8
|
|
$
|
371
|
|
$
|
7
|
|
$
|
370
|
|
|||||
|
Net fair value by NEE balance sheet line item:
|
|||||||||||||||||||||||
|
Current derivative assets
(a)
|
$
|
990
|
|
||||||||||||||||||||
|
Noncurrent derivative assets
(b)
|
1,009
|
|
|||||||||||||||||||||
|
Current derivative liabilities
(c)
|
$
|
1,289
|
|
||||||||||||||||||||
|
Noncurrent derivative liabilities
(d)
|
466
|
|
|||||||||||||||||||||
|
Total derivatives
|
$
|
1,999
|
|
$
|
1,755
|
|
|||||||||||||||||
|
Net fair value by FPL balance sheet line item:
|
|||||||||||||||||||||||
|
Current other assets
|
$
|
6
|
|
||||||||||||||||||||
|
Noncurrent other assets
|
1
|
|
|||||||||||||||||||||
|
Current derivative liabilities
|
$
|
370
|
|
||||||||||||||||||||
|
Total derivatives
|
$
|
7
|
|
$
|
370
|
|
|||||||||||||||||
______________________
|
(a)
|
Reflects the netting of approximately
$197 million
in margin cash collateral received from counterparties.
|
|
(b)
|
Reflects the netting of approximately
$97 million
in margin cash collateral received from counterparties.
|
|
(c)
|
Reflects the netting of approximately
$20 million
in margin cash collateral paid to counterparties.
|
|
(d)
|
Reflects the netting of approximately
$10 million
in margin cash collateral paid to counterparties.
|
94
NEXTERA ENERGY, INC. AND FLORIDA POWER & LIGHT COMPANY
NOTES TO CONSOLIDATED FINANCIAL STATEMENTS (Continued)
|
December 31, 2013
|
|||||||||||||||||||||||
|
Fair Values of Derivatives
Designated as Hedging
Instruments for Accounting
Purposes - Gross Basis
|
Fair Values of Derivatives Not
Designated as Hedging
Instruments for Accounting
Purposes - Gross Basis
|
Total Derivatives Combined -
Net Basis
|
|||||||||||||||||||||
|
Assets
|
Liabilities
|
Assets
|
Liabilities
|
Assets
|
Liabilities
|
||||||||||||||||||
|
(millions)
|
|||||||||||||||||||||||
|
NEE:
|
|||||||||||||||||||||||
|
Commodity contracts
|
$
|
—
|
|
$
|
—
|
|
$
|
4,543
|
|
$
|
3,633
|
|
$
|
1,571
|
|
$
|
940
|
|
|||||
|
Interest rate contracts
|
89
|
|
127
|
|
1
|
|
93
|
|
90
|
|
220
|
|
|||||||||||
|
Foreign currency swaps
|
—
|
|
50
|
|
—
|
|
101
|
|
—
|
|
151
|
|
|||||||||||
|
Total fair values
|
$
|
89
|
|
$
|
177
|
|
$
|
4,544
|
|
$
|
3,827
|
|
$
|
1,661
|
|
$
|
1,311
|
|
|||||
|
FPL:
|
|||||||||||||||||||||||
|
Commodity contracts
|
$
|
—
|
|
$
|
—
|
|
$
|
55
|
|
$
|
9
|
|
$
|
48
|
|
$
|
2
|
|
|||||
|
Net fair value by NEE balance sheet line item:
|
|||||||||||||||||||||||
|
Current derivative assets
(a)
|
$
|
498
|
|
||||||||||||||||||||
|
Noncurrent derivative assets
(b)
|
1,163
|
|
|||||||||||||||||||||
|
Current derivative liabilities
|
$
|
838
|
|
||||||||||||||||||||
|
Noncurrent derivative liabilities
|
473
|
|
|||||||||||||||||||||
|
Total derivatives
|
$
|
1,661
|
|
$
|
1,311
|
|
|||||||||||||||||
|
Net fair value by FPL balance sheet line item:
|
|||||||||||||||||||||||
|
Current other assets
|
$
|
48
|
|
||||||||||||||||||||
|
Current derivative liabilities
|
$
|
1
|
|
||||||||||||||||||||
|
Noncurrent other liabilities
|
1
|
|
|||||||||||||||||||||
|
Total derivatives
|
$
|
48
|
|
$
|
2
|
|
|||||||||||||||||
______________________
|
(a)
|
Reflects the netting of approximately
$181 million
in margin cash collateral received from counterparties.
|
|
(b)
|
Reflects the netting of approximately
$98 million
in margin cash collateral received from counterparties.
|
At
December 31, 2014 and 2013
, NEE had approximately
$60 million
and
$24 million
(none at FPL), respectively, in margin cash collateral received from counterparties that was not offset against derivative assets in the above presentation. These amounts are included in current other liabilities on NEE's consolidated balance sheets. Additionally, at
December 31, 2014 and 2013
, NEE had approximately
$122 million
and
$42 million
(none at FPL), respectively, in margin cash collateral provided to counterparties that was not offset against derivative assets or liabilities in the above presentation. These amounts are included in current other assets on NEE's consolidated balance sheets.
Income Statement Impact of Derivative Instruments
- Gains (losses) related to NEE's cash flow hedges are recorded in NEE's consolidated financial statements (none at FPL) as follows:
|
Year Ended
December 31, 2014 |
Year Ended
December 31, 2013 |
Year Ended
December 31, 2012 |
||||||||||||||||||||||||||||||||||||||
|
Interest
Rate
Contracts
|
Foreign
Currency
Swaps
|
Total
|
Interest
Rate
Contracts
|
Foreign
Currency
Swaps
|
Total
|
Commodity
Contracts
|
Interest
Rate
Contracts
|
Foreign
Currency
Swaps
|
Total
|
|||||||||||||||||||||||||||||||
|
(millions)
|
||||||||||||||||||||||||||||||||||||||||
|
Gains (losses) recognized in OCI
|
$
|
(132
|
)
|
$
|
(89
|
)
|
$
|
(221
|
)
|
$
|
150
|
|
$
|
(21
|
)
|
$
|
129
|
|
$
|
—
|
|
$
|
(131
|
)
|
$
|
(30
|
)
|
$
|
(161
|
)
|
||||||||||
|
Gains (losses) reclassified from AOCI to net income
(a)
|
$
|
(77
|
)
|
$
|
(78
|
)
|
(b)
|
$
|
(155
|
)
|
$
|
(61
|
)
|
$
|
(44
|
)
|
(b)
|
$
|
(105
|
)
|
$
|
8
|
|
$
|
(56
|
)
|
$
|
(21
|
)
|
(b)
|
$
|
(69
|
)
|
|||||||
______________________
|
(a)
|
Included in operating revenues for commodity contracts and interest expense for interest rate contracts.
|
|
(b)
|
For 2014, 2013 and 2012, losses of approximately
$8 million
,
$4 million
and
$3 million
, respectively, are included in interest expense and the balances are included in other - net.
|
For the years ended
December 31, 2014
, 2013 and
2012
, NEE recorded gains (losses) of approximately
$20 million
,
$(65) million
and
$44 million
, respectively, on fair value hedges which resulted in corresponding increases (decreases) in the related debt.
95
NEXTERA ENERGY, INC. AND FLORIDA POWER & LIGHT COMPANY
NOTES TO CONSOLIDATED FINANCIAL STATEMENTS (Continued)
Gains (losses) related to NEE's derivatives not designated as hedging instruments are recorded in NEE's consolidated statements of income as follows:
|
Years Ended December 31,
|
|||||||||||
|
2014
|
|
2013
|
|
2012
|
|||||||
|
(millions)
|
|||||||||||
|
Commodity contracts:
(a)
|
|
|
|
|
|
||||||
|
Operating revenues
|
$
|
420
|
|
$
|
76
|
|
$
|
171
|
|
||
|
Fuel, purchased power and interchange
|
1
|
|
|
—
|
|
|
38
|
|
|||
|
Foreign currency swap - other - net
|
(1
|
)
|
|
(72
|
)
|
|
(60
|
)
|
|||
|
Interest rate contracts - interest expense
|
(64
|
)
|
|
3
|
|
—
|
|
||||
|
Total
|
$
|
356
|
|
|
$
|
7
|
|
|
$
|
149
|
|
______________________
|
(a)
|
For the years ended
December 31, 2014
, 2013 and 2012, FPL recorded gains (losses) of approximately
$(289) million
,
$81 million
and
$(177) million
, respectively, related to commodity contracts as regulatory liabilities (assets) on its consolidated balance sheets.
|
Notional Volumes of Derivative Instruments
- The following table represents net notional volumes associated with derivative instruments that are required to be reported at fair value in NEE's and FPL's consolidated financial statements. The table includes significant volumes of transactions that have minimal exposure to commodity price changes because they are variably priced agreements. These volumes are only an indication of the commodity exposure that is managed through the use of derivatives. They do not represent net physical asset positions or non-derivative positions and their hedges, nor do they represent NEE's and FPL's net economic exposure, but only the net notional derivative positions that fully or partially hedge the related asset positions. NEE and FPL had derivative commodity contracts for the following net notional volumes:
|
December 31, 2014
|
December 31, 2013
|
|||||||||||||||||||
|
Commodity Type
|
NEE
|
FPL
|
NEE
|
FPL
|
||||||||||||||||
|
(millions)
|
||||||||||||||||||||
|
Power
|
(73
|
)
|
MWh
(a)
|
—
|
|
(276
|
)
|
MWh
(a)
|
—
|
|
||||||||||
|
Natural gas
|
1,436
|
|
MMBtu
(b)
|
845
|
|
MMBtu
(b)
|
1,140
|
|
MMBtu
(b)
|
674
|
|
MMBtu
(b)
|
||||||||
|
Oil
|
(11
|
)
|
barrels
|
—
|
|
(10
|
)
|
barrels
|
—
|
|
||||||||||
______________________
|
(a)
|
Megawatt-hours
|
|
(b)
|
One million British thermal units
|
At
December 31, 2014
and
2013
, NEE had interest rate contracts with notional amounts totaling approximately
$7.4 billion
and
$6.5 billion
, respectively, and foreign currency swaps with notional amounts totaling
$661 million
and
$662 million
, respectively.
Credit-Risk-Related Contingent Features
- Certain derivative instruments contain credit-risk-related contingent features including, among other things, the requirement to maintain an investment grade credit rating from specified credit rating agencies and certain financial ratios, as well as credit-related cross-default and material adverse change triggers. At
December 31, 2014
and
2013
, the aggregate fair value of NEE's derivative instruments with credit-risk-related contingent features that were in a liability position was approximately
$2.7 billion
(
$369 million
for FPL) and
$2.1 billion
(
$9 million
for FPL), respectively.
If the credit-risk-related contingent features underlying these agreements and other commodity-related contracts were triggered, certain subsidiaries of NEE, including FPL, could be required to post collateral or settle contracts according to contractual terms which generally allow netting of contracts in offsetting positions. Certain contracts contain multiple types of credit-related triggers. To the extent these contracts contain a credit ratings downgrade trigger, the maximum exposure is included in the following credit ratings collateral posting requirements. If FPL's and NEECH's credit ratings were downgraded to BBB/Baa2 (a two level downgrade for FPL and a one level downgrade for NEECH from the current lowest applicable rating), applicable NEE subsidiaries would be required to post collateral such that the total posted collateral would be approximately
$700 million
(
$130 million
at FPL) as of
December 31, 2014
and
$400 million
(
$20 million
at FPL) as of
December 31, 2013
. If FPL's and NEECH's credit ratings were downgraded to below investment grade, applicable NEE subsidiaries would be required to post additional collateral such that the total posted collateral would be approximately
$2.8 billion
(
$0.7 billion
at FPL) and
$2.3 billion
(
$0.4 billion
at FPL) as of
December 31, 2014
and
2013
, respectively. Some contracts do not contain credit ratings downgrade triggers, but do contain provisions that require certain financial measures be maintained and/or have credit-related cross-default triggers. In the event these provisions were triggered, applicable NEE subsidiaries could be required to post additional collateral of up to approximately
$850 million
(
$200 million
at FPL) and
$800 million
(
$150 million
at FPL) as of
December 31, 2014
and
2013
, respectively.
96
NEXTERA ENERGY, INC. AND FLORIDA POWER & LIGHT COMPANY
NOTES TO CONSOLIDATED FINANCIAL STATEMENTS (Continued)
Collateral related to derivatives may be posted in the form of cash or credit support in the normal course of business. At
December 31, 2014
, applicable NEE subsidiaries have posted approximately
$20 million
(none at FPL) in cash which could be applied toward the collateral requirements described above. In addition, at
December 31, 2014
and
2013
, applicable NEE subsidiaries have posted approximately
$236 million
(
none
at FPL) and
$210 million
(
none
at FPL), respectively, in the form of letters of credit which could be applied toward the collateral requirements described above. FPL and NEECH have credit facilities generally in excess of the collateral requirements described above that would be available to support, among other things, derivative activities. Under the terms of the credit facilities, maintenance of a specific credit rating is not a condition to drawing on these credit facilities, although there are other conditions to drawing on these credit facilities.
Additionally, some contracts contain certain adequate assurance provisions where a counterparty may demand additional collateral based on subjective events and/or conditions. Due to the subjective nature of these provisions, NEE and FPL are unable to determine an exact value for these items and they are not included in any of the quantitative disclosures above.
4. Fair Value Measurements
The fair value of assets and liabilities are determined using either unadjusted quoted prices in active markets (Level 1) or pricing inputs that are observable (Level 2) whenever that information is available and using unobservable inputs (Level 3) to estimate fair value only when relevant observable inputs are not available. NEE and FPL use several different valuation techniques to measure the fair value of assets and liabilities, relying primarily on the market approach of using prices and other market information for identical and/or comparable assets and liabilities for those assets and liabilities that are measured at fair value on a recurring basis. NEE's and FPL's assessment of the significance of any particular input to the fair value measurement requires judgment and may affect their placement within the fair value hierarchy levels. Non-performance risk, including the consideration of a credit valuation adjustment, is also considered in the determination of fair value for all assets and liabilities measured at fair value.
Cash Equivalents
- Cash equivalents consist of short-term, highly liquid investments with original maturities of three months or less. NEE primarily holds investments in money market funds. The fair value of these funds is calculated using current market prices.
Special Use Funds and Other Investments -
NEE and FPL hold primarily debt and equity securities directly, as well as indirectly through commingled funds. Substantially all directly held equity securities are valued at their quoted market prices. For directly held debt securities, multiple prices and price types are obtained from pricing vendors whenever possible, which enables cross-provider validations. A primary price source is identified based on asset type, class or issue of each security. Commingled funds, which are similar to mutual funds, are maintained by banks or investment companies and hold certain investments in accordance with a stated set of objectives. The fair value of commingled funds is primarily derived from the quoted prices in active markets of the underlying securities. Because the fund shares are offered to a limited group of investors, they are not considered to be traded in an active market.
Derivative Instruments
- NEE and FPL measure the fair value of commodity contracts using prices observed on commodities exchanges and in the OTC markets, or through the use of industry-standard valuation techniques, such as option modeling or discounted cash flows techniques, incorporating both observable and unobservable valuation inputs. The resulting measurements are the best estimate of fair value as represented by the transfer of the asset or liability through an orderly transaction in the marketplace at the measurement date.
Most exchange-traded derivative assets and liabilities are valued directly using unadjusted quoted prices. For exchange-traded derivative assets and liabilities where the principal market is deemed to be inactive based on average daily volumes and open interest, the measurement is established using settlement prices from the exchanges, and therefore considered to be valued using other observable inputs.
NEE, through its subsidiaries, including FPL, also enters into OTC commodity contract derivatives. The majority of these contracts are transacted at liquid trading points, and the prices for these contracts are verified using quoted prices in active markets from exchanges, brokers or pricing services for similar contracts.
NEE, through NEER, also enters into full requirements contracts, which, in most cases, meet the definition of derivatives and are measured at fair value. These contracts typically have one or more inputs that are not observable and are significant to the valuation of the contract. In addition, certain exchange and non-exchange traded derivative options at NEE have one or more significant inputs that are not observable, and are valued using industry-standard option models.
In all cases where NEE and FPL use significant unobservable inputs for the valuation of a commodity contract, consideration is given to the assumptions that market participants would use in valuing the asset or liability. The primary input to the valuation models for commodity contracts is the forward commodity curve for the respective instruments. Other inputs include, but are not limited to, assumptions about market liquidity, volatility, correlation and contract duration as more fully described below in Significant Unobservable Inputs Used in Recurring Fair Value Measurements. In instances where the reference markets are deemed to be inactive or do not have transactions for a similar contract, the derivative assets and liabilities may be valued using significant other observable inputs and potentially significant unobservable inputs. In such instances, the valuation for these contracts is established
97
NEXTERA ENERGY, INC. AND FLORIDA POWER & LIGHT COMPANY
NOTES TO CONSOLIDATED FINANCIAL STATEMENTS (Continued)
using techniques including extrapolation from or interpolation between actively traded contracts, or estimated basis adjustments from liquid trading points. NEE and FPL regularly evaluate and validate the inputs used to determine fair value by a number of methods, consisting of various market price verification procedures, including the use of pricing services and multiple broker quotes to support the market price of the various commodities. In all cases where there are assumptions and models used to generate inputs for valuing derivative assets and liabilities, the review and verification of the assumptions, models and changes to the models are undertaken by individuals that are independent of those responsible for estimating fair value.
NEE uses interest rate contracts and foreign currency swaps to mitigate and adjust interest rate and foreign currency exposure related to certain outstanding and forecasted debt issuances and borrowings when deemed appropriate based on market conditions or when required by financing agreements. NEE estimates the fair value of these derivatives using a discounted cash flows valuation technique based on the net amount of estimated future cash inflows and outflows related to the agreements.
Recurring Fair Value Measurements
- NEE's and FPL's financial assets and liabilities and other fair value measurements made on a recurring basis by fair value hierarchy level are as follows:
|
|
December 31, 2014
|
|
||||||||||||||||||
|
|
Level 1
|
Level 2
|
|
Level 3
|
Netting
(a)
|
Total
|
|
|||||||||||||
|
|
(millions)
|
|
||||||||||||||||||
|
Assets:
|
|
|
|
|
|
|
|
|||||||||||||
|
Cash equivalents:
|
|
|
|
|
|
|
|
|||||||||||||
|
NEE - equity securities
|
$
|
32
|
|
$
|
—
|
|
|
$
|
—
|
|
$
|
32
|
|
|
||||||
|
Special use funds:
(b)
|
|
|
|
|||||||||||||||||
|
NEE:
|
|
|
|
|||||||||||||||||
|
Equity securities
|
$
|
1,217
|
|
$
|
1,417
|
|
(c)
|
$
|
—
|
|
$
|
2,634
|
|
|
||||||
|
U.S. Government and municipal bonds
|
$
|
520
|
|
$
|
191
|
|
|
$
|
—
|
|
$
|
711
|
|
|
||||||
|
Corporate debt securities
|
$
|
—
|
|
$
|
704
|
|
|
$
|
—
|
|
$
|
704
|
|
|
||||||
|
Mortgage-backed securities
|
$
|
—
|
|
$
|
493
|
|
|
$
|
—
|
|
$
|
493
|
|
|
||||||
|
Other debt securities
|
$
|
25
|
|
$
|
32
|
|
|
$
|
—
|
|
$
|
57
|
|
|
||||||
|
FPL:
|
|
|
|
|||||||||||||||||
|
Equity securities
|
$
|
324
|
|
$
|
1,237
|
|
(c)
|
$
|
—
|
|
$
|
1,561
|
|
|
||||||
|
U.S. Government and municipal bonds
|
$
|
435
|
|
$
|
165
|
|
|
$
|
—
|
|
$
|
600
|
|
|
||||||
|
Corporate debt securities
|
$
|
—
|
|
$
|
501
|
|
|
$
|
—
|
|
$
|
501
|
|
|
||||||
|
Mortgage-backed securities
|
$
|
—
|
|
$
|
422
|
|
|
$
|
—
|
|
$
|
422
|
|
|
||||||
|
Other debt securities
|
$
|
25
|
|
$
|
20
|
|
|
$
|
—
|
|
$
|
45
|
|
|
||||||
|
Other investments:
|
|
|
|
|||||||||||||||||
|
NEE:
|
|
|
|
|||||||||||||||||
|
Equity securities
|
$
|
35
|
|
$
|
1
|
|
|
$
|
—
|
|
$
|
36
|
|
|
||||||
|
Debt securities
|
$
|
5
|
|
$
|
170
|
|
|
$
|
—
|
|
$
|
175
|
|
|
||||||
|
Derivatives:
|
|
|
|
|||||||||||||||||
|
NEE:
|
|
|
|
|||||||||||||||||
|
Commodity contracts
|
$
|
1,801
|
|
$
|
3,177
|
|
|
$
|
1,167
|
|
$
|
(4,196
|
)
|
$
|
1,949
|
|
(d)
|
|||
|
Interest rate contracts
|
$
|
—
|
|
$
|
35
|
|
|
$
|
—
|
|
$
|
15
|
|
$
|
50
|
|
(d)
|
|||
|
FPL - commodity contracts
|
$
|
—
|
|
$
|
2
|
|
|
$
|
6
|
|
$
|
(1
|
)
|
$
|
7
|
|
(d)
|
|||
|
Liabilities:
|
|
|
|
|||||||||||||||||
|
Derivatives:
|
|
|
|
|||||||||||||||||
|
NEE:
|
|
|
|
|||||||||||||||||
|
Commodity contracts
|
$
|
1,720
|
|
$
|
3,150
|
|
|
$
|
420
|
|
$
|
(3,932
|
)
|
$
|
1,358
|
|
(d)
|
|||
|
Interest rate contracts
|
$
|
—
|
|
$
|
126
|
|
|
$
|
125
|
|
$
|
15
|
|
$
|
266
|
|
(d)
|
|||
|
Foreign currency swaps
|
$
|
—
|
|
$
|
131
|
|
|
$
|
—
|
|
$
|
—
|
|
$
|
131
|
|
(d)
|
|||
|
FPL - commodity contracts
|
$
|
—
|
|
$
|
370
|
|
|
$
|
1
|
|
$
|
(1
|
)
|
$
|
370
|
|
(d)
|
|||
______________________
|
(a)
|
Includes the effect of the contractual ability to settle contracts under master netting arrangements and margin cash collateral payments and receipts. NEE and FPL also have contract settlement receivable and payable balances that are subject to the master netting arrangements but are not offset within the consolidated balance sheets and are recorded in customer receivables - net and accounts payable, respectively.
|
|
(b)
|
Excludes investments accounted for under the equity method and loans not measured at fair value on a recurring basis. See Fair Value of Financial Instruments Recorded at the Carrying Amount below.
|
|
(c)
|
Primarily invested in commingled funds whose underlying securities would be Level 1 if those securities were held directly by NEE or FPL.
|
|
(d)
|
See Note 3 - Fair Value of Derivative Instruments for a reconciliation of net derivatives to NEE's and FPL's consolidated balance sheets.
|
98
NEXTERA ENERGY, INC. AND FLORIDA POWER & LIGHT COMPANY
NOTES TO CONSOLIDATED FINANCIAL STATEMENTS (Continued)
|
December 31, 2013
|
||||||||||||||||||||
|
Level 1
|
Level 2
|
Level 3
|
Netting
(a)
|
Total
|
||||||||||||||||
|
(millions)
|
||||||||||||||||||||
|
Assets:
|
|
|
|
|
|
|
||||||||||||||
|
Cash equivalents:
|
|
|
|
|
|
|
||||||||||||||
|
NEE - equity securities
|
$
|
20
|
|
$
|
—
|
|
$
|
—
|
|
$
|
20
|
|
||||||||
|
Special use funds:
(b)
|
|
|
|
|
|
|||||||||||||||
|
NEE:
|
|
|
|
|
|
|||||||||||||||
|
Equity securities
|
$
|
1,170
|
|
$
|
1,336
|
|
(c)
|
$
|
—
|
|
$
|
2,506
|
|
|||||||
|
U.S. Government and municipal bonds
|
$
|
647
|
|
$
|
180
|
|
|
$
|
—
|
|
$
|
827
|
|
|||||||
|
Corporate debt securities
|
$
|
—
|
|
$
|
597
|
|
|
$
|
—
|
|
$
|
597
|
|
|||||||
|
Mortgage-backed securities
|
$
|
—
|
|
$
|
479
|
|
|
$
|
—
|
|
$
|
479
|
|
|||||||
|
Other debt securities
|
$
|
16
|
|
$
|
44
|
|
|
$
|
—
|
|
$
|
60
|
|
|||||||
|
FPL:
|
|
|
|
|
|
|||||||||||||||
|
Equity securities
|
$
|
291
|
|
$
|
1,176
|
|
(c)
|
$
|
—
|
|
$
|
1,467
|
|
|||||||
|
U.S. Government and municipal bonds
|
$
|
584
|
|
$
|
154
|
|
|
$
|
—
|
|
$
|
738
|
|
|||||||
|
Corporate debt securities
|
$
|
—
|
|
$
|
421
|
|
|
$
|
—
|
|
$
|
421
|
|
|||||||
|
Mortgage-backed securities
|
$
|
—
|
|
$
|
401
|
|
|
$
|
—
|
|
$
|
401
|
|
|||||||
|
Other debt securities
|
$
|
16
|
|
$
|
30
|
|
|
$
|
—
|
|
$
|
46
|
|
|||||||
|
Other investments:
|
|
|
|
|
|
|||||||||||||||
|
NEE:
|
|
|
|
|
|
|||||||||||||||
|
Equity securities
|
$
|
51
|
|
$
|
—
|
|
$
|
—
|
|
$
|
51
|
|
||||||||
|
Debt securities
|
$
|
11
|
|
$
|
107
|
|
$
|
—
|
|
$
|
118
|
|
||||||||
|
Derivatives:
|
|
|
|
|
|
|||||||||||||||
|
NEE:
|
|
|
|
|
|
|||||||||||||||
|
Commodity contracts
|
$
|
1,368
|
|
$
|
2,106
|
|
|
$
|
1,069
|
|
$
|
(2,972
|
)
|
$
|
1,571
|
|
(d)
|
|||
|
Interest rate contracts
|
$
|
—
|
|
$
|
90
|
|
|
$
|
—
|
|
$
|
—
|
|
$
|
90
|
|
(d)
|
|||
|
FPL - commodity contracts
|
$
|
—
|
|
$
|
53
|
|
|
$
|
2
|
|
$
|
(7
|
)
|
$
|
48
|
|
(d)
|
|||
|
Liabilities:
|
||||||||||||||||||||
|
Derivatives:
|
||||||||||||||||||||
|
NEE:
|
||||||||||||||||||||
|
Commodity contracts
|
$
|
1,285
|
|
$
|
1,994
|
|
|
$
|
354
|
|
$
|
(2,693
|
)
|
$
|
940
|
|
(d)
|
|||
|
Interest rate contracts
|
$
|
—
|
|
$
|
127
|
|
|
$
|
93
|
|
$
|
—
|
|
$
|
220
|
|
(d)
|
|||
|
Foreign currency swaps
|
$
|
—
|
|
$
|
151
|
|
|
$
|
—
|
|
$
|
—
|
|
$
|
151
|
|
(d)
|
|||
|
FPL - commodity contracts
|
$
|
—
|
|
$
|
7
|
|
|
$
|
2
|
|
$
|
(7
|
)
|
$
|
2
|
|
(d)
|
|||
______________________
|
(a)
|
Includes the effect of the contractual ability to settle contracts under master netting arrangements and margin cash collateral payments and receipts. NEE and FPL also have contract settlement receivable and payable balances that are subject to the master netting arrangements but are not offset within the consolidated balance sheets and are recorded in customer receivables - net and accounts payable, respectively.
|
|
(b)
|
Excludes investments accounted for under the equity method and loans not measured at fair value on a recurring basis. See Fair Value of Financial Instruments Recorded at the Carrying Amount below.
|
|
(c)
|
Primarily invested in commingled funds whose underlying investments would be Level 1 if those investments were held directly by NEE or FPL.
|
|
(d)
|
See Note 3 - Fair Value of Derivative Instruments for a reconciliation of net derivatives to NEE's and FPL's consolidated balance sheets.
|
Significant Unobservable Inputs Used in Recurring Fair Value Measurements
- The valuation of certain commodity contracts requires the use of significant unobservable inputs. All forward price, implied volatility, implied correlation and interest rate inputs used in the valuation of such contracts are directly based on third-party market data, such as broker quotes and exchange settlements, when that data is available. If third-party market data is not available, then industry standard methodologies are used to develop inputs that maximize the use of relevant observable inputs and minimize the use of unobservable inputs. Observable inputs, including some forward prices, implied volatilities and interest rates used for determining fair value are updated daily to reflect the best available market information. Unobservable inputs which are related to observable inputs, such as illiquid portions of forward price or volatility curves, are updated daily as well, using industry standard techniques such as interpolation and extrapolation, combining observable forward inputs supplemented by historical market and other relevant data. Other unobservable inputs, such as implied correlations, customer migration rates from full requirements contracts and some implied volatility curves, are modeled using proprietary models based on historical data and industry standard techniques.
All price, volatility, correlation and customer migration inputs used in valuation are subject to validation by the Trading Risk
99
NEXTERA ENERGY, INC. AND FLORIDA POWER & LIGHT COMPANY
NOTES TO CONSOLIDATED FINANCIAL STATEMENTS (Continued)
Management group. The Trading Risk Management group performs a risk management function responsible for assessing credit, market and operational risk impact, reviewing valuation methodology and modeling, confirming transactions, monitoring approval processes and developing and monitoring trading limits. The Trading Risk Management group is separate from the transacting group. For markets where independent third-party data is readily available, validation is conducted daily by directly reviewing this market data against inputs utilized by the transacting group, and indirectly by critically reviewing daily risk reports. For markets where independent third-party data is not readily available, additional analytical reviews are performed on at least a quarterly basis. These analytical reviews are designed to ensure that all price and volatility curves used for fair valuing transactions are adequately validated each quarter, and are reviewed and approved by the Trading Risk Management group. In addition, other valuation assumptions such as implied correlations and customer migration rates are reviewed and approved by the Trading Risk Management group on a periodic basis. Newly created models used in the valuation process are also subject to testing and approval by the Trading Risk Management group prior to use and established models are reviewed annually, or more often as needed, by the Trading Risk Management group.
On a monthly basis, the Exposure Management Committee (EMC), which is comprised of certain members of senior management, meets with representatives from the Trading Risk Management group and the transacting group to discuss NEE's and FPL's energy risk profile and operations, to review risk reports and to discuss fair value issues as necessary. The EMC develops guidelines required for an appropriate risk management control infrastructure, which includes implementation and monitoring of compliance with Trading Risk Management policy. The EMC executes its risk management responsibilities through direct oversight and delegation of its responsibilities to the Trading Risk Management group, as well as to other corporate and business unit personnel.
The significant unobservable inputs used in the valuation of NEE's commodity contracts categorized as Level 3 of the fair value hierarchy at
December 31, 2014
are as follows:
|
Transaction Type
|
Fair Value at
December 31, 2014
|
Valuation
Technique(s)
|
Significant
Unobservable Inputs
|
Range
|
||||||||||||
|
Assets
|
Liabilities
|
|||||||||||||||
|
(millions)
|
||||||||||||||||
|
Forward contracts - power
|
$
|
487
|
|
$
|
97
|
|
Discounted cash flow
|
Forward price (per MWh)
|
$6
|
—
|
$119
|
|||||
|
Forward contracts - gas
|
74
|
|
55
|
|
Discounted cash flow
|
Forward price (per MMBtu)
|
$1
|
—
|
$6
|
|||||||
|
Forward contracts - other commodity related
|
44
|
|
41
|
|
Discounted cash flow
|
Forward price (various)
|
$—
|
—
|
$13
|
|||||||
|
Options - power
|
114
|
|
92
|
|
Option models
|
Implied correlations
|
(4)%
|
—
|
98%
|
|||||||
|
Implied volatilities
|
1%
|
—
|
166%
|
|||||||||||||
|
Options - gas
|
54
|
|
98
|
|
Option models
|
Implied correlations
|
(4)%
|
—
|
98%
|
|||||||
|
Implied volatilities
|
1%
|
—
|
146%
|
|||||||||||||
|
Full requirements and unit contingent contracts
|
394
|
|
37
|
|
Discounted cash flow
|
Forward price (per MWh)
|
$(16)
|
—
|
$184
|
|||||||
|
Customer migration rate
(a)
|
—%
|
—
|
20%
|
|||||||||||||
|
Total
|
$
|
1,167
|
|
$
|
420
|
|
||||||||||
______________________
|
(a)
|
Applies only to full requirements contracts.
|
The sensitivity of NEE's fair value measurements to increases (decreases) in the significant unobservable inputs is as follows:
|
Significant Unobservable Input
|
Position
|
Impact on
Fair Value Measurement
|
||
|
Forward price
|
Purchase power/gas
|
Increase (decrease)
|
||
|
Sell power/gas
|
Decrease (increase)
|
|||
|
Implied correlations
|
Purchase option
|
Decrease (increase)
|
||
|
Sell option
|
Increase (decrease)
|
|||
|
Implied volatilities
|
Purchase option
|
Increase (decrease)
|
||
|
Sell option
|
Decrease (increase)
|
|||
|
Customer migration rate
|
Sell power
(a)
|
Decrease (increase)
|
||
————————————
|
(a)
|
Assumes the contract is in a gain position.
|
In addition, the fair value measurement of interest rate swap liabilities related to the solar projects in Spain of approximately
$125 million
at
December 31, 2014
includes a significant credit valuation adjustment. The credit valuation adjustment, considered an unobservable input, reflects management's assessment of non-performance risk of the subsidiaries related to the solar projects in Spain that are party to the swap agreements.
100
NEXTERA ENERGY, INC. AND FLORIDA POWER & LIGHT COMPANY
NOTES TO CONSOLIDATED FINANCIAL STATEMENTS (Continued)
The reconciliation of changes in the fair value of derivatives that are based on significant unobservable inputs is as follows:
|
Years Ended December 31,
|
|||||||||||||||||||||||
|
2014
|
2013
|
2012
|
|||||||||||||||||||||
|
NEE
|
FPL
|
NEE
|
FPL
|
NEE
|
FPL
|
||||||||||||||||||
|
(millions)
|
|||||||||||||||||||||||
|
Fair value of net derivatives based on significant unobservable inputs at December 31 of prior year
|
$
|
622
|
|
$
|
—
|
|
$
|
566
|
|
$
|
2
|
|
$
|
486
|
|
$
|
4
|
|
|||||
|
Realized and unrealized gains (losses):
|
|
|
|
|
|
|
|
|
|
|
|
|
|||||||||||
|
Included in earnings
(a)
|
(77
|
)
|
—
|
|
299
|
|
—
|
|
218
|
|
—
|
|
|||||||||||
|
Included in other comprehensive income
|
18
|
|
—
|
|
—
|
|
—
|
|
—
|
|
—
|
|
|||||||||||
|
Included in regulatory assets and liabilities
|
7
|
|
7
|
|
—
|
|
—
|
|
5
|
|
5
|
|
|||||||||||
|
Purchases
|
55
|
|
—
|
|
101
|
|
—
|
|
273
|
|
(7
|
)
|
|||||||||||
|
Settlements
|
194
|
|
(2
|
)
|
(55
|
)
|
(2
|
)
|
(181
|
)
|
—
|
|
|||||||||||
|
Issuances
|
(122
|
)
|
—
|
|
(173
|
)
|
—
|
|
(243
|
)
|
—
|
|
|||||||||||
|
Transfers in
(b)
|
80
|
|
—
|
|
(120
|
)
|
—
|
|
20
|
|
—
|
|
|||||||||||
|
Transfers out
(b)
|
(155
|
)
|
—
|
|
4
|
|
—
|
|
(12
|
)
|
—
|
|
|||||||||||
|
Fair value of net derivatives based on significant unobservable inputs at December 31
|
$
|
622
|
|
$
|
5
|
|
$
|
622
|
|
$
|
—
|
|
$
|
566
|
|
$
|
2
|
|
|||||
|
The amount of gains (losses) for the period included in earnings attributable to the change in unrealized gains (losses) relating to derivatives still held at the reporting date
(c)
|
$
|
248
|
|
$
|
—
|
|
$
|
329
|
|
$
|
—
|
|
$
|
152
|
|
$
|
—
|
|
|||||
______________________
|
(a)
|
For the year ended
December 31, 2014
,
$79 million
of realized and unrealized losses are reflected in the consolidated statements of income in interest expense and the balance is primarily reflected in operating revenues. For the year December 31, 2013,
$302 million
of realized and unrealized gains are reflected in the consolidated statements of income in operating revenues and the balance is primarily reflected in interest expense. For the year ended December 31, 2012,
$220 million
of realized and unrealized gains are reflected in the consolidated statements of income in operating revenues and the balance is reflected in fuel, purchased power and interchange.
|
|
(b)
|
Transfers into Level 3 were a result of decreased observability of market data and, in 2013, a significant credit valuation adjustment. Transfers from Level 3 to Level 2 were a result of increased observability of market data. NEE's and FPL's policy is to recognize all transfers at the beginning of the reporting period.
|
|
(c)
|
For the years ended
December 31, 2014
and 2013,
$328 million
and
$330 million
of unrealized gains are reflected in the consolidated statements of income in operating revenues and the balance is reflected in interest expense. For the year ended December 31, 2012,
$157 million
of unrealized gains are reflected in the consolidated statements of income in operating revenues and the balance is reflected in fuel, purchased power and interchange.
|
Nonrecurring Fair Value Measurements -
NEE tests long-lived assets for recoverability whenever events or changes in circumstances indicate that the carrying amount may not be recoverable. In February 2013, the Spanish government enacted a new law that made further changes to the economic framework of renewable energy projects including, among other things, changes that negatively affect the projected economics of the
99.8
MW of solar thermal facilities that affiliates of NEER were constructing in Spain (Spain solar projects) (see Note 13 - Spain Solar Projects). Due to the February 2013 change in law, NEER performed a recoverability analysis, considering, among other things, working with lenders to restructure the financing agreements, abandoning the projects or selling the projects, and concluded that the undiscounted cash flows of the Spain solar projects were less than the carrying value of the projects. Accordingly, NEER performed a fair value analysis based on the income approach to determine the amount of the impairment. Based on the fair value analysis, property, plant and equipment with a carrying amount of approximately
$800 million
were written down to their estimated fair value of
$500 million
as of March 31, 2013, resulting in an impairment of
$300 million
(which is recorded as a separate line item in NEE's consolidated statements of income for the year ended December 31, 2013) and other related charges (
$342 million
after-tax, see Note 5).
The estimate of the fair value was based on the discounted cash flows which were determined using a market participant view of the Spain solar projects upon completion and final commissioning of the projects. As part of the valuation, NEER used observable inputs where available, including the revised renewable energy pricing under the February 2013 change in law. Significant unobservable inputs (Level 3), including forecasts of generation, estimates of tariff escalation rates and estimated costs of debt and equity capital, were also used in the estimation of fair value. In addition, NEER made certain assumptions regarding the projected capital and maintenance expenditures based on the estimated costs to complete the Spain solar projects and ongoing capital and maintenance expenditures. An increase in the revenue and generation forecasts, a decrease in the projected capital and maintenance expenditures or a decrease in the weighted-average cost of capital each would result in an increased fair market value. Changes in the opposite direction of those unobservable inputs would result in a decreased fair market value. See Note 13 - Spain Solar Projects for a discussion of additional developments that could potentially impact the Spain solar projects.
In 2013, NEER initiated a plan and received internal authorization to pursue the sale of its ownership interests in oil-fired generating plants located in Maine (Maine fossil) with a total generating capacity of
796
MW. In connection with the decision to sell Maine fossil, a loss of approximately $
67 million
($
43 million
after-tax) was originally reflected in net gain from discontinued operations, net of income taxes in NEE's consolidated statements of income for the year ended December 31, 2013. The fair value measurement (Level 3) was based on the estimated sales price less the estimated costs to sell. The estimated sales price was estimated using an income approach based primarily on capacity revenue forecasts. In March 2014, NEER decided not to pursue the sale of Maine fossil due to the divergence between the achievable sales price and management's view of the assets' value, which increased as
101
NEXTERA ENERGY, INC. AND FLORIDA POWER & LIGHT COMPANY
NOTES TO CONSOLIDATED FINANCIAL STATEMENTS (Continued)
a result of significant market changes. Accordingly, the Maine fossil assets were written-up to management's current estimate of fair value resulting in a gain of approximately $
21 million
($
12 million
after-tax). The fair value measurement (Level 3) was estimated using an income approach based primarily on the updated capacity revenue forecasts. Based on NEER's decision to retain Maine fossil, the $
67 million
loss recorded during the year ended December 31, 2013 was reclassified from discontinued operations to income from continuing operations and together with the $
21 million
gain recorded during the year ended December 31, 2014 are included as a separate line item in NEE's consolidated statements of income.
Fair Value of Financial Instruments Recorded at the Carrying Amount
- The carrying amounts of cash equivalents and commercial paper approximate their fair values. The carrying amounts and estimated fair values of other financial instruments, excluding those recorded at fair value and disclosed above in Recurring Fair Value Measurements, are as follows:
|
December 31, 2014
|
December 31, 2013
|
|||||||||||||||
|
Carrying
Amount
|
Estimated
Fair Value
|
Carrying
Amount
|
Estimated
Fair Value
|
|||||||||||||
|
|
(millions)
|
|
||||||||||||||
|
NEE:
|
||||||||||||||||
|
Special use funds
(a)
|
$
|
567
|
|
$
|
567
|
|
$
|
311
|
|
$
|
311
|
|
||||
|
Other investments - primarily notes receivable
|
$
|
525
|
|
$
|
679
|
|
(b)
|
$
|
531
|
|
$
|
627
|
|
(b)
|
||
|
Long-term debt, including current maturities
|
$
|
27,876
|
|
$
|
30,337
|
|
(c)
|
$
|
27,728
|
|
$
|
28,612
|
|
(c)
|
||
|
FPL:
|
||||||||||||||||
|
Special use funds
(a)
|
$
|
395
|
|
$
|
395
|
|
$
|
200
|
|
$
|
200
|
|
||||
|
Long-term debt, including current maturities
|
$
|
9,473
|
|
$
|
11,105
|
|
(c)
|
$
|
8,829
|
|
$
|
9,451
|
|
(c)
|
||
______________________
|
(a)
|
Primarily represents investments accounted for under the equity method and loans not measured at fair value on a recurring basis.
|
|
(b)
|
Primarily classified as held to maturity. Fair values are primarily estimated using a discounted cash flow valuation technique based on certain observable yield curves and indices considering the credit profile of the borrower (Level 3). Notes receivable bear interest primarily at fixed rates and mature by
2029
. Notes receivable are considered impaired and placed in non-accrual status when it becomes probable that all amounts due cannot be collected in accordance with the contractual terms of the agreement. The assessment to place notes receivable in non-accrual status considers various credit indicators, such as credit ratings and market-related information. As of
December 31, 2014
and
2013
, NEE had no notes receivable reported in non-accrual status.
|
|
(c)
|
As of
December 31, 2014 and 2013
, for NEE, approximately
$19,973 million
and
$17,921 million
, respectively, is estimated using quoted market prices for the same or similar issues (Level 2); the balance is estimated using a discounted cash flow valuation technique, considering the current credit spread of the debtor (Level 3). For FPL, estimated using quoted market prices for the same or similar issues (Level 2).
|
Special Use Funds
- The special use funds noted above and those carried at fair value (see Recurring Fair Value Measurements above) consist of FPL's storm fund assets of approximately $
75 million
and NEE's and FPL's nuclear decommissioning fund assets of $
5,091 million
and $
3,449 million
, respectively, at
December 31, 2014
. The investments held in the special use funds consist of equity and debt securities which are primarily classified as available for sale and carried at estimated fair value. The amortized cost of debt and equity securities is approximately $
1,906 million
and $
1,366 million
, respectively, at
December 31, 2014
and $
1,954 million
and $
1,384 million
, respectively, at
December 31, 2013
($
1,519 million
and $
664 million
, respectively, at
December 31, 2014
and $
1,595 million
and $
694 million
, respectively, at
December 31, 2013
for FPL). For FPL's special use funds, consistent with regulatory treatment, changes in fair value, including any other than temporary impairment losses, result in a corresponding adjustment to the related regulatory liability accounts. For NEE's non-rate regulated operations, changes in fair value result in a corresponding adjustment to OCI, except for unrealized losses associated with marketable securities considered to be other than temporary, including any credit losses, which are recognized as other than temporary impairment losses on securities held in nuclear decommissioning funds in NEE's consolidated statements of income. Debt securities included in the nuclear decommissioning funds have a weighted-average maturity at
December 31, 2014
of approximately
eight
years at both NEE and FPL. FPL's storm fund primarily consists of debt securities with a weighted-average maturity at
December 31, 2014
of approximately
three
years. The cost of securities sold is determined using the specific identification method.
Realized gains and losses and proceeds from the sale or maturity of available for sale securities are as follows:
|
NEE
|
FPL
|
||||||||||||||||||||||
|
Years Ended December 31,
|
Years Ended December 31,
|
||||||||||||||||||||||
|
2014
|
2013
|
2012
|
2014
|
2013
|
2012
|
||||||||||||||||||
|
(millions)
|
|||||||||||||||||||||||
|
Realized gains
|
$
|
211
|
|
$
|
246
|
|
$
|
252
|
|
$
|
120
|
|
$
|
182
|
|
$
|
98
|
|
|||||
|
Realized losses
|
$
|
115
|
|
$
|
88
|
|
$
|
67
|
|
$
|
94
|
|
$
|
59
|
|
$
|
46
|
|
|||||
|
Proceeds from sale or maturity of securities
|
$
|
4,092
|
|
$
|
4,190
|
|
$
|
5,028
|
|
$
|
3,349
|
|
$
|
3,342
|
|
$
|
3,790
|
|
|||||
102
NEXTERA ENERGY, INC. AND FLORIDA POWER & LIGHT COMPANY
NOTES TO CONSOLIDATED FINANCIAL STATEMENTS (Continued)
The unrealized gains on available for sale securities are as follows:
|
NEE
|
FPL
|
||||||||||||||
|
December 31,
|
December 31,
|
||||||||||||||
|
2014
|
2013
|
2014
|
2013
|
||||||||||||
|
|
(millions)
|
|
|||||||||||||
|
Equity securities
|
$
|
1,267
|
|
$
|
1,125
|
|
$
|
896
|
|
$
|
777
|
|
|||
|
Debt securities
|
$
|
66
|
|
$
|
42
|
|
$
|
54
|
|
$
|
36
|
|
|||
The unrealized losses on available for sale debt securities and the fair value of available for sale debt securities in an unrealized loss position are as follows:
|
NEE
|
FPL
|
||||||||||||||
|
December 31,
|
December 31,
|
||||||||||||||
|
2014
|
2013
|
2014
|
2013
|
||||||||||||
|
|
(millions)
|
|
|||||||||||||
|
Unrealized losses
(a)
|
$
|
7
|
|
$
|
32
|
|
$
|
5
|
|
$
|
25
|
|
|||
|
Fair value
|
$
|
542
|
|
$
|
1,069
|
|
$
|
434
|
|
$
|
844
|
|
|||
______________________
|
(a)
|
Unrealized losses on available for sale debt securities for securities in an unrealized loss position for greater than twelve months at
December 31, 2014 and 2013
were not material to NEE or FPL.
|
Regulations issued by the FERC and the NRC provide general risk management guidelines to protect nuclear decommissioning funds and to allow such funds to earn a reasonable return. The FERC regulations prohibit, among other investments, investments in any securities of NEE or its subsidiaries, affiliates or associates, excluding investments tied to market indices or mutual funds. Similar restrictions applicable to the decommissioning funds for NEER's nuclear plants are included in the NRC operating licenses for those facilities or in NRC regulations applicable to NRC licensees not in cost-of-service environments. With respect to the decommissioning fund for Seabrook, decommissioning fund contributions and withdrawals are also regulated by the NDFC pursuant to New Hampshire law.
The nuclear decommissioning reserve funds are managed by investment managers who must comply with the guidelines of NEE and FPL and the rules of the applicable regulatory authorities. The funds' assets are invested giving consideration to taxes, liquidity, risk, diversification and other prudent investment objectives.
5. Income Taxes
The components of income taxes are as follows:
|
NEE
|
FPL
|
||||||||||||||||||||||
|
Years Ended December 31,
|
Years Ended December 31,
|
||||||||||||||||||||||
|
2014
|
2013
|
2012
|
2014
|
2013
|
2012
|
||||||||||||||||||
|
(millions)
|
|||||||||||||||||||||||
|
Federal:
|
|||||||||||||||||||||||
|
Current
(a)
|
$
|
—
|
|
$
|
(145
|
)
|
$
|
(4
|
)
|
$
|
240
|
|
$
|
174
|
|
$
|
(261
|
)
|
|||||
|
Deferred
|
1,077
|
|
853
|
|
636
|
|
542
|
|
540
|
|
906
|
|
|||||||||||
|
Total federal
|
1,077
|
|
708
|
|
632
|
|
782
|
|
714
|
|
645
|
|
|||||||||||
|
State:
|
|
|
|
|
|
|
|
|
|
|
|
|
|||||||||||
|
Current
(a)
|
(29
|
)
|
69
|
|
14
|
|
68
|
|
44
|
|
26
|
|
|||||||||||
|
Deferred
|
128
|
|
—
|
|
46
|
|
60
|
|
77
|
|
81
|
|
|||||||||||
|
Total state
|
99
|
|
69
|
|
60
|
|
128
|
|
121
|
|
107
|
|
|||||||||||
|
Total income taxes
|
$
|
1,176
|
|
$
|
777
|
|
$
|
692
|
|
$
|
910
|
|
$
|
835
|
|
$
|
752
|
|
|||||
______________________
|
(a)
|
Includes provision for unrecognized tax benefits.
|
103
NEXTERA ENERGY, INC. AND FLORIDA POWER & LIGHT COMPANY
NOTES TO CONSOLIDATED FINANCIAL STATEMENTS (Continued)
A reconciliation between the effective income tax rates and the applicable statutory rate is as follows:
|
|
NEE
|
FPL
|
|||||||||||||||
|
|
Years Ended December 31,
|
Years Ended December 31,
|
|||||||||||||||
|
|
2014
|
2013
|
2012
|
2014
|
2013
|
2012
|
|||||||||||
|
Statutory federal income tax rate
|
35.0
|
%
|
35.0
|
%
|
35.0
|
%
|
35.0
|
%
|
35.0
|
%
|
35.0
|
%
|
|||||
|
Increases (reductions) resulting from:
|
|
|
|
|
|
|
|
|
|
|
|
|
|||||
|
State income taxes - net of federal income tax benefit
|
1.8
|
|
1.8
|
|
1.5
|
|
3.4
|
|
3.6
|
|
3.5
|
|
|||||
|
PTCs and ITCs - NEER
|
(5.1
|
)
|
(8.5
|
)
|
(7.8
|
)
|
—
|
|
—
|
|
—
|
|
|||||
|
Convertible ITCs - NEER
|
(1.4
|
)
|
(2.5
|
)
|
(1.5
|
)
|
—
|
|
—
|
|
—
|
|
|||||
|
Valuation allowance associated with Spain solar projects
(a)
|
0.7
|
|
5.2
|
|
—
|
|
—
|
|
—
|
|
—
|
|
|||||
|
Charges associated with Canadian assets
|
1.3
|
|
—
|
|
—
|
|
—
|
|
—
|
|
—
|
|
|||||
|
Other - net
|
—
|
|
0.7
|
|
(0.6
|
)
|
(0.9
|
)
|
(0.4
|
)
|
(0.7
|
)
|
|||||
|
Effective income tax rate
|
32.3
|
%
|
31.7
|
%
|
26.6
|
%
|
37.5
|
%
|
38.2
|
%
|
37.8
|
%
|
|||||
______________________
|
(a)
|
Reflects a full valuation allowance on deferred tax assets associated with the Spain solar projects. See Note 4 - Nonrecurring Fair Value Measurements.
|
The income tax effects of temporary differences giving rise to consolidated deferred income tax liabilities and assets are as follows:
|
NEE
|
FPL
|
||||||||||||||
|
December 31,
|
December 31,
|
||||||||||||||
|
2014
|
2013
|
2014
|
2013
|
||||||||||||
|
(millions)
|
|||||||||||||||
|
Deferred tax liabilities:
|
|||||||||||||||
|
Property-related
|
$
|
11,700
|
|
$
|
11,247
|
|
$
|
7,457
|
|
$
|
6,948
|
|
|||
|
Pension
|
489
|
|
567
|
|
459
|
|
441
|
|
|||||||
|
Nuclear decommissioning trusts
|
258
|
|
188
|
|
—
|
|
—
|
|
|||||||
|
Net unrealized gains on derivatives
|
390
|
|
260
|
|
—
|
|
—
|
|
|||||||
|
Investments in partnerships and joint ventures
|
291
|
|
166
|
|
—
|
|
—
|
|
|||||||
|
Other
|
769
|
|
700
|
|
435
|
|
399
|
|
|||||||
|
Total deferred tax liabilities
|
13,897
|
|
13,128
|
|
8,351
|
|
7,788
|
|
|||||||
|
Deferred tax assets and valuation allowance:
|
|||||||||||||||
|
Decommissioning reserves
|
427
|
|
431
|
|
374
|
|
361
|
|
|||||||
|
Postretirement benefits
|
154
|
|
145
|
|
99
|
|
107
|
|
|||||||
|
Net operating loss carryforwards
|
1,070
|
|
1,343
|
|
—
|
|
96
|
|
|||||||
|
Tax credit carryforwards
|
2,742
|
|
2,522
|
|
—
|
|
—
|
|
|||||||
|
ARO and accrued asset removal costs
|
737
|
|
795
|
|
686
|
|
670
|
|
|||||||
|
Other
|
820
|
|
959
|
|
318
|
|
297
|
|
|||||||
|
Valuation allowance
(a)
|
(323
|
)
|
(325
|
)
|
—
|
|
—
|
|
|||||||
|
Net deferred tax assets
|
5,627
|
|
5,870
|
|
1,477
|
|
1,531
|
|
|||||||
|
Net accumulated deferred income taxes
|
$
|
8,270
|
|
$
|
7,258
|
|
$
|
6,874
|
|
$
|
6,257
|
|
|||
______________________
|
(a)
|
Amount relates to a valuation allowance related to the Spain solar projects, deferred state tax credits and state operating loss carryforwards.
|
104
NEXTERA ENERGY, INC. AND FLORIDA POWER & LIGHT COMPANY
NOTES TO CONSOLIDATED FINANCIAL STATEMENTS (Continued)
Deferred tax assets and liabilities are included on the consolidated balance sheets as follows:
|
NEE
|
FPL
|
|||||||||||||||
|
December 31,
|
December 31,
|
|||||||||||||||
|
2014
|
2013
|
2014
|
2013
|
|||||||||||||
|
(millions)
|
||||||||||||||||
|
Deferred income taxes - current assets
|
$
|
739
|
|
$
|
753
|
|
$
|
—
|
|
$
|
98
|
|
(a)
|
|||
|
Noncurrent other assets
|
264
|
|
139
|
|
—
|
|
—
|
|
||||||||
|
Other current liabilities
|
(12
|
)
|
(6
|
)
|
(39
|
)
|
—
|
|
||||||||
|
Deferred income taxes - noncurrent liabilities
|
(9,261
|
)
|
(8,144
|
)
|
(6,835
|
)
|
(6,355
|
)
|
||||||||
|
Net accumulated deferred income taxes
|
$
|
(8,270
|
)
|
$
|
(7,258
|
)
|
$
|
(6,874
|
)
|
$
|
(6,257
|
)
|
||||
______________________
|
(a)
|
Included in other current assets on FPL's consolidated balance sheets.
|
The components of NEE's deferred tax assets relating to net operating loss carryforwards and tax credit carryforwards at
December 31, 2014
are as follows:
|
Amount
|
Expiration
Dates
|
||||
|
(millions)
|
|||||
|
Net operating loss carryforwards:
|
|||||
|
Federal
|
$
|
752
|
|
2026-2034
|
|
|
State
|
169
|
|
2015-2034
|
||
|
Foreign
|
149
|
|
(a)
|
2017-2033
|
|
|
Net operating loss carryforwards
|
$
|
1,070
|
|
||
|
Tax credit carryforwards:
|
|
||||
|
Federal
|
$
|
2,409
|
|
2022-2034
|
|
|
State
|
333
|
|
(b)
|
2015-2036
|
|
|
Tax credit carryforwards
|
$
|
2,742
|
|
||
______________________
|
(a)
|
Includes $
119 million
of net operating loss carryforwards with an indefinite expiration period.
|
|
(b)
|
Includes $
149 million
of ITC carryforwards with an indefinite expiration period.
|
6. Discontinued Operations
In 2013, a subsidiary of NEER completed the sale of its ownership interest in a portfolio of hydropower generation plants and related assets with a total generating capacity of
351
MW located in Maine and New Hampshire. The sales price primarily included the assumption by the buyer of
$700 million
in related debt. In connection with the sale, a gain of approximately
$372 million
(
$231 million
after-tax) is reflected in gain from discontinued operations, net of income taxes in NEE's consolidated statements of income for the year ended
December 31, 2013
. The operations of the hydropower generation plants, exclusive of the gain, were not material to NEE's consolidated statements of income for the years ended December 31, 2013 and 2012.
See Note 4 - Nonrecurring Fair Value Measurements for a discussion of the decision not to pursue the sale of Maine fossil and the related financial statement impacts.
7. Jointly-Owned Electric Plants
Certain NEE subsidiaries own undivided interests in the jointly-owned facilities described below, and are entitled to a proportionate share of the output from those facilities. The subsidiaries are responsible for their share of the operating costs, as well as providing their own financing. Accordingly, each subsidiary includes its proportionate share of the facilities and related revenues and expenses in the appropriate balance sheet and statement of income captions. NEE's and FPL's respective shares of direct expenses for these facilities are included in fuel, purchased power and interchange, O&M, depreciation and amortization and taxes other than income taxes and other in NEE's and FPL's consolidated statements of income.
105
NEXTERA ENERGY, INC. AND FLORIDA POWER & LIGHT COMPANY
NOTES TO CONSOLIDATED FINANCIAL STATEMENTS (Continued)
NEE's and FPL's proportionate ownership interest in jointly-owned facilities is as follows:
|
|
December 31, 2014
|
|||||||||||||
|
|
Ownership
Interest
|
Gross
Investment
(a)
|
Accumulated
Depreciation
(a)
|
Construction
Work
in Progress
|
||||||||||
|
|
|
(millions)
|
||||||||||||
|
FPL:
|
|
|
|
|
||||||||||
|
St. Lucie Unit No. 2
|
85
|
%
|
$
|
2,112
|
|
$
|
752
|
|
$
|
21
|
|
|||
|
St. Johns River Power Park units and coal terminal
|
20
|
%
|
$
|
399
|
|
$
|
201
|
|
$
|
1
|
|
|||
|
Scherer Unit No. 4
|
76
|
%
|
$
|
1,105
|
|
$
|
352
|
|
$
|
14
|
|
|||
|
NEER:
|
|
|
|
|
||||||||||
|
Duane Arnold
|
70
|
%
|
$
|
449
|
|
$
|
120
|
|
$
|
22
|
|
|||
|
Seabrook
|
88.23
|
%
|
$
|
1,010
|
|
$
|
212
|
|
$
|
90
|
|
|||
|
Wyman Station Unit No. 4
|
84.35
|
%
|
$
|
24
|
|
$
|
1
|
|
$
|
1
|
|
|||
|
Corporate and Other:
|
|
|
|
|
||||||||||
|
Transmission substation assets located in Seabrook, New Hampshire
|
88.23
|
%
|
$
|
72
|
|
$
|
17
|
|
$
|
2
|
|
|||
______________________
|
(a)
|
Excludes nuclear fuel.
|
8. Variable Interest Entities
As of
December 31, 2014
, NEE has
eighteen
VIEs which it consolidates and has interests in certain other VIEs which it does not consolidate.
FPL
- FPL is considered the primary beneficiary of, and therefore consolidates, a VIE that is a wholly-owned bankruptcy remote special purpose subsidiary that it formed in 2007 for the sole purpose of issuing storm-recovery bonds pursuant to the securitization provisions of the Florida Statutes and a financing order of the FPSC. FPL is considered the primary beneficiary because FPL has the power to direct the significant activities of the VIE, and its equity investment, which is subordinate to the bondholder's interest in the VIE, is at risk. Storm restoration costs incurred by FPL during 2005 and 2004 exceeded the amount in FPL's funded storm and property insurance reserve, resulting in a storm reserve deficiency. In 2007, the VIE issued $
652 million
aggregate principal amount of senior secured bonds (storm-recovery bonds), primarily for the after-tax equivalent of the total of FPL's unrecovered balance of the 2004 storm restoration costs, the 2005 storm restoration costs and to reestablish FPL's storm and property insurance reserve. In connection with this financing, net proceeds, after debt issuance costs, to the VIE (approximately $
644 million
) were used to acquire the storm-recovery property, which includes the right to impose, collect and receive a storm-recovery charge from all customers receiving electric transmission or distribution service from FPL under rate schedules approved by the FPSC or under special contracts, certain other rights and interests that arise under the financing order issued by the FPSC and certain other collateral pledged by the VIE that issued the bonds. The storm-recovery bonds are payable only from and are secured by the storm-recovery property. The bondholders have no recourse to the general credit of FPL. The assets of the VIE were approximately $
279 million
and $
324 million
at
December 31, 2014
and
2013
, respectively, and consisted primarily of storm-recovery property, which are included in securitized storm-recovery costs on NEE's and FPL's consolidated balance sheets. The liabilities of the VIE were approximately $
338 million
and $
394 million
at
December 31, 2014
and
2013
, respectively, and consisted primarily of storm-recovery bonds, which are included in long-term debt on NEE's and FPL's consolidated balance sheets.
FPL entered into a purchased power agreement effective in 1994 with a
250
MW coal-fired qualifying facility and a purchased power agreement effective in 1995 with a
330
MW coal-fired qualifying facility to purchase substantially all of each facility's capacity and electrical output over a substantial portion of their estimated useful life. These facilities are considered VIEs because FPL absorbs a portion of each facility's variability related to changes in the market price of coal through the price it pays per MWh (energy payment). Since FPL does not control the most significant activities of each facility, including operations and maintenance, FPL is not the primary beneficiary and does not consolidate these VIEs. The energy payments paid by FPL will fluctuate as coal prices change. This fluctuation does not expose FPL to losses since the energy payments paid by FPL to each facility are recovered through the fuel clause as approved by the FPSC.
NEER
- NEE consolidates
seventeen
NEER VIEs. NEER is considered the primary beneficiary of these VIEs since NEER controls the most significant activities of these VIEs, including operations and maintenance, and through its
100
% equity ownership has the obligation to absorb expected losses of these VIEs.
A
NEER VIE consolidates two entities which own and operate natural gas/oil electric generating facilities with the capability of producing
110
MW. This VIE sells its electric output under power sales contracts to a third party, with expiration dates in
2018
and
106
NEXTERA ENERGY, INC. AND FLORIDA POWER & LIGHT COMPANY
NOTES TO CONSOLIDATED FINANCIAL STATEMENTS (Continued)
2020
. The power sales contracts provide the offtaker the ability to dispatch the facilities and require the offtaker to absorb the cost of fuel. This VIE uses third party debt and equity to finance its operations. The debt is secured by liens against the generating facilities and the other assets of these entities. The debt holders have no recourse to the general credit of NEER for the repayment of debt. The assets and liabilities of the VIE were approximately $
85 million
and $
55 million
, respectively, at
December 31, 2014
and $
85 million
and $
63 million
, respectively, at
December 31, 2013
, and consisted primarily of property, plant and equipment and long-term debt.
The other
sixteen
NEER VIEs consolidate several entities which own and operate wind electric generating facilities with the capability of producing a total of
4,490
MW. These VIEs sell their electric output either under power sales contracts to third parties with expiration dates ranging from
2018
through
2039
or in the spot market. The VIEs use third-party debt and/or equity to finance their operations. Certain investors that hold no equity interest in the VIEs hold differential membership interests, which give them the right to receive a portion of the economic attributes of the generating facilities, including certain tax attributes. The debt is secured by liens against the generating facilities and the other assets of these entities or by pledges of NEER's ownership interest in these entities. The debt holders have no recourse to the general credit of NEER for the repayment of debt. The assets and liabilities of these VIEs totaled approximately $
6.6 billion
and $
4.1 billion
, respectively, at
December 31, 2014
.
Twelve
of the sixteen were VIEs at
December 31, 2013
and were consolidated; the assets and liabilities of those VIEs totaled approximately $
5.3 billion
and $
3.3 billion
, respectively, at
December 31, 2013
. At
December 31, 2014
and
2013
, the assets and liabilities of the VIEs consisted primarily of property, plant and equipment, deferral related to differential membership interests and long-term debt.
Other
- As of
December 31, 2014
and
2013
, several NEE subsidiaries have investments totaling approximately $
716 million
($
606 million
at FPL) and $
668 million
($
505 million
at FPL), respectively, in certain special purpose entities, which consisted primarily of investments in mortgage-backed securities. These investments are included in special use funds and other investments on NEE's consolidated balance sheets and in special use funds on FPL's consolidated balance sheets. As of
December 31, 2014
, NEE subsidiaries, including FPL, are not the primary beneficiary and therefore do not consolidate any of these entities because they do not control any of the ongoing activities of these entities, were not involved in the initial design of these entities and do not have a controlling financial interest in these entities.
9. Investments in Partnerships and Joint Ventures
Certain subsidiaries of NEE, primarily NEER, have non-controlling non-majority owned interests in various partnerships and joint ventures, essentially all of which own electric generating facilities. At
December 31, 2014
and
2013
, NEE's investments in partnerships and joint ventures totaled approximately
$663 million
and
$422 million
, respectively, which are included in other investments on NEE's consolidated balance sheets. NEER's interest in these partnerships and joint ventures range from approximately
29%
to
50%
. At
December 31, 2014
and 2013, the principal entities included in NEER's investments in partnerships and joint ventures were Desert Sunlight Investment Holdings, LLC and Northeast Energy, LP.
Summarized combined information for these principal entities is as follows:
|
|
2014
|
2013
|
|||||
|
|
(millions)
|
||||||
|
Net income
|
$
|
171
|
|
$
|
37
|
|
|
|
Total assets
|
$
|
2,636
|
|
$
|
1,955
|
|
|
|
Total liabilities
|
$
|
1,645
|
|
$
|
1,299
|
|
|
|
Partners'/members' equity
|
$
|
991
|
|
$
|
656
|
|
|
|
NEER's share of underlying equity in the principal entities
|
$
|
495
|
|
$
|
328
|
|
|
|
Difference between investment carrying amount and underlying equity in net assets
(a)
|
(4
|
)
|
(5
|
)
|
|||
|
NEER's investment carrying amount for the principal entities
|
$
|
491
|
|
$
|
323
|
|
|
______________________
|
(a)
|
The majority of the difference between the investment carrying amount and the underlying equity in net assets is being amortized over the remaining life of the investee's assets.
|
In 2004, a trust created by NEE sold $
300 million
of 5 7/8% preferred trust securities to the public and $
9 million
of common trust securities to NEE. The trust is an unconsolidated
100%
-owned finance subsidiary. The proceeds from the sale of the preferred and common trust securities were used to buy 5 7/8% junior subordinated debentures maturing in March 2044 from NEECH. NEE has fully and unconditionally guaranteed the preferred trust securities and the junior subordinated debentures.
107
NEXTERA ENERGY, INC. AND FLORIDA POWER & LIGHT COMPANY
NOTES TO CONSOLIDATED FINANCIAL STATEMENTS (Continued)
10. Common Shareholders' Equity
Earnings Per Share
- The reconciliation of NEE's basic and diluted earnings per share attributable to NEE from continuing operations is as follows:
|
|
Years Ended December 31,
|
||||||||||
|
|
2014
|
2013
|
2012
|
||||||||
|
|
(millions, except per share amounts)
|
||||||||||
|
Numerator - income from continuing operations attributable to NEE
(a)(b)
|
$
|
2,465
|
|
$
|
1,677
|
|
$
|
1,911
|
|
||
|
Denominator:
|
|
|
|
|
|
|
|||||
|
Weighted-average number of common shares outstanding - basic
|
434.4
|
|
424.2
|
|
416.7
|
|
|||||
|
Equity units, performance share awards, options, forward sale agreements and restricted stock
(c)
|
5.7
|
|
2.8
|
|
2.5
|
|
|||||
|
Weighted-average number of common shares outstanding - assuming dilution
|
440.1
|
|
427.0
|
|
419.2
|
|
|||||
|
Earnings per share attributable to NEE from continuing operations:
(b)
|
|
|
|
|
|||||||
|
Basic
|
$
|
5.67
|
|
$
|
3.95
|
|
$
|
4.59
|
|
||
|
Assuming dilution
|
$
|
5.60
|
|
$
|
3.93
|
|
$
|
4.56
|
|
||
______________________
|
(a)
|
Calculated as income from continuing operations less net income attributable to noncontrolling interests from NEE's consolidated statements of income.
|
|
(b)
|
2013 amounts were reclassified to conform to current year's presentation. See Note 4 - Nonrecurring Fair Value Measurements.
|
|
(c)
|
Calculated using the treasury stock method. Performance share awards are included in diluted weighted-average number of common shares outstanding based upon what would be issued if the end of the reporting period was the end of the term of the award.
|
Common shares issuable pursuant to equity units, the forward sale agreement described below, stock options and performance share awards and restricted stock which were not included in the denominator above due to their antidilutive effect were approximately
2.6 million
,
7.1 million
and
11.4 million
for the years ended December 31,
2014
,
2013
and
2012
, respectively.
Issuance of Common Stock and Forward Sale Agreement
- In November 2013, NEE sold
4.5 million
shares of its common stock at a price of
$88.03
per share, and a forward counterparty borrowed and sold
6.6 million
shares of NEE's common stock in connection with a forward sale agreement. In December 2014, NEE physically settled the forward sale agreement by delivering
6.6 million
shares of its common stock to the forward counterparty in exchange for cash proceeds of approximately
$552 million
. The forward sale price used to determine the cash proceeds received by NEE was calculated based on the initial forward sale price of
$88.03
per share less certain adjustments as specified in the forward sale agreement. Prior to the settlement date, the forward sale agreement had a dilutive effect on NEE’s earnings per share when the average market price per share of NEE’s common stock was above the adjusted forward sale price per share.
Common Stock Dividend Restrictions
- NEE's charter does not limit the dividends that may be paid on its common stock. FPL's mortgage securing FPL's first mortgage bonds contains provisions which, under certain conditions, restrict the payment of dividends and other distributions to NEE. These restrictions do not currently limit FPL's ability to pay dividends to NEE.
Employee Stock Ownership Plan
- The employee retirement savings plans of NEE include a leveraged ESOP feature. Shares of common stock held by the trust for the employee retirement savings plans (Trust) are used to provide all or a portion of the employers' matching contributions. Dividends received on all shares, along with cash contributions from the employers, are used to pay principal and interest on an ESOP loan held by a subsidiary of NEECH. Dividends on shares allocated to employee accounts and used by the Trust for debt service are replaced with shares of common stock, at prevailing market prices, in an equivalent amount. For purposes of computing basic and fully diluted earnings per share, ESOP shares that have been committed to be released are considered outstanding.
ESOP-related compensation expense was approximately $
59 million
, $
46 million
and $
44 million
in
2014
,
2013
and
2012
, respectively. The related share release was based on the fair value of shares allocated to employee accounts during the period. Interest income on the ESOP loan is eliminated in consolidation. ESOP-related unearned compensation included as a reduction of common shareholders' equity at December 31,
2014
was approximately $
14 million
, representing unallocated shares at the original issue price. The fair value of the ESOP-related unearned compensation account using the closing price of NEE common stock at December 31,
2014
was approximately $
103 million
.
Stock-Based Compensation
- Net income for the years ended December 31,
2014
,
2013
and
2012
includes approximately $
60 million
, $
67 million
and $
57 million
, respectively, of compensation costs and $
23 million
, $
26 million
and $
22 million
, respectively, of income tax benefits related to stock-based compensation arrangements. Compensation cost capitalized for the years ended December 31,
2014
,
2013
and
2012
was not material. As of December 31,
2014
, there were approximately $
63 million
of unrecognized compensation costs related to nonvested/nonexercisable stock-based compensation arrangements. These costs are expected to be recognized over a weighted-average period of
1.9
years.
108
NEXTERA ENERGY, INC. AND FLORIDA POWER & LIGHT COMPANY
NOTES TO CONSOLIDATED FINANCIAL STATEMENTS (Continued)
At December 31,
2014
, approximately
17 million
shares of common stock were authorized for awards to officers, employees and non-employee directors of NEE and its subsidiaries under NEE's: (a) Amended and Restated 2011 Long Term Incentive Plan, (b) 2007 Non-Employee Directors Stock Plan and (c) earlier equity compensation plans under which shares are reserved for issuance under existing grants, but no additional shares are available for grant under the earlier plans. NEE satisfies restricted stock and performance share awards by issuing new shares of its common stock or by purchasing shares of its common stock in the open market. NEE satisfies stock option exercises by issuing new shares of its common stock. NEE generally grants most of its stock-based compensation awards in the first quarter of each year.
Restricted Stock and Performance Share Awards
- Restricted stock typically vests within
three
years after the date of grant and is subject to, among other things, restrictions on transferability prior to vesting. The fair value of restricted stock is measured based upon the closing market price of NEE common stock as of the date of grant. Performance share awards are typically payable at the end of a
three
-year performance period if the specified performance criteria are met. The fair value of performance share awards is estimated primarily based upon the closing market price of NEE common stock as of the date of grant less the present value of expected dividends, multiplied by an estimated performance multiple which is subsequently trued up based on actual performance.
The activity in restricted stock and performance share awards for the year ended December 31,
2014
was as follows:
|
Shares
|
Weighted-
Average
Grant Date
Fair Value
Per Share
|
|||||
|
Restricted Stock:
|
||||||
|
Nonvested balance, January 1, 2014
|
713,836
|
|
$
|
63.59
|
|
|
|
Granted
|
238,986
|
|
$
|
93.46
|
|
|
|
Vested
|
(356,187
|
)
|
$
|
63.77
|
|
|
|
Forfeited
|
(17,138
|
)
|
$
|
74.87
|
|
|
|
Nonvested balance, December 31, 2014
|
579,497
|
|
$
|
75.65
|
|
|
|
Performance Share Awards:
|
|
|
||||
|
Nonvested balance, January 1, 2014
|
1,195,917
|
|
$
|
55.55
|
|
|
|
Granted
|
553,963
|
|
$
|
71.52
|
|
|
|
Vested
|
(708,323
|
)
|
$
|
50.89
|
|
|
|
Forfeited
|
(45,330
|
)
|
$
|
63.58
|
|
|
|
Nonvested balance, December 31, 2014
|
996,227
|
|
$
|
67.19
|
|
|
The weighted-average grant date fair value per share of restricted stock granted for the years ended
December 31, 2013
and
2012
was $
74.02
and $
60.78
respectively. The weighted-average grant date fair value per share of performance share awards granted for the years ended
December 31, 2013
and
2012
was $
58.53
and $
51.23
, respectively.
The total fair value of restricted stock and performance share awards vested was $
85 million
, $
82 million
and $
71 million
for the years ended December 31,
2014
,
2013
and
2012
, respectively.
Options - Options typically vest within
three
years after the date of grant and have a maximum term of
ten
years. The exercise price of each option granted equals the closing market price of NEE common stock on the date of grant. The fair value of the options is estimated on the date of the grant using the Black-Scholes option-pricing model and based on the following assumptions:
|
|
2014
|
2013
|
2012
|
||
|
Expected volatility
(a)
|
20.32%
|
20.08 - 20.15%
|
21.00%
|
||
|
Expected dividends
|
3.11%
|
3.28 - 3.64%
|
3.99%
|
||
|
Expected term (years)
(b)
|
7.0
|
7.0
|
6.7
|
||
|
Risk-free rate
|
2.17%
|
1.15 - 1.40%
|
1.37%
|
||
______________________
|
(a)
|
Based on historical experience.
|
|
(b)
|
Based on historical exercise and post-vesting cancellation experience adjusted for outstanding awards.
|
109
NEXTERA ENERGY, INC. AND FLORIDA POWER & LIGHT COMPANY
NOTES TO CONSOLIDATED FINANCIAL STATEMENTS (Continued)
Option activity for the year ended December 31,
2014
was as follows:
|
|
Shares
Underlying
Options
|
Weighted-
Average
Exercise
Price
Per Share
|
Weighted-
Average
Remaining
Contractual
Term
(years)
|
Aggregate
Intrinsic
Value
(millions)
|
||||||||
|
Balance, January 1, 2014
|
3,191,547
|
|
$
|
54.70
|
|
|
|
|||||
|
Granted
|
198,358
|
|
$
|
93.27
|
|
|
|
|||||
|
Exercised
|
(564,870
|
)
|
$
|
46.51
|
|
|
|
|||||
|
Forfeited
|
—
|
|
—
|
|
|
|
||||||
|
Expired
|
—
|
|
—
|
|
|
|
||||||
|
Balance, December 31, 2014
|
2,825,035
|
|
$
|
59.04
|
|
5.8
|
$
|
133
|
|
|||
|
Exercisable, December 31, 2014
|
2,344,937
|
|
$
|
55.08
|
|
5.2
|
$
|
120
|
|
|||
The weighted-average grant date fair value of options granted was $
14.09
, $
9.20
and $
7.69
per share for the years ended December 31,
2014
,
2013
and
2012
, respectively. The total intrinsic value of stock options exercised was approximately $
30 million
, $
14 million
and $
57 million
for the years ended December 31,
2014
,
2013
and
2012
, respectively.
Cash received from option exercises was approximately $
26 million
, $
14 million
and $
55 million
for the years ended December 31,
2014
,
2013
and
2012
, respectively. The tax benefits realized from options exercised were approximately
$11 million
, $
5 million
and $
22 million
for the years ended December 31,
2014
,
2013
and
2012
, respectively.
Preferred Stock
- NEE's charter authorizes the issuance of
100 million
shares of serial preferred stock, $
0.01
par value,
none
of which are outstanding. FPL's charter authorizes the issuance of
10,414,100
shares of preferred stock, $
100
par value,
5 million
shares of subordinated preferred stock,
no
par value, and
5 million
shares of preferred stock,
no
par value,
none
of which are outstanding.
Accumulated Other Comprehensive Income (Loss)
- The components of AOCI, net of tax, are as follows:
|
Accumulated Other Comprehensive Income (Loss)
|
|||||||||||||||||||||||
|
Net Unrealized
Gains (Losses)
on Cash Flow
Hedges
|
Net Unrealized
Gains (Losses)
on Available for
Sale Securities
|
Defined Benefit
Pension and
Other Benefits
Plans
|
Net Unrealized
Gains (Losses)
on Foreign
Currency
Translation
|
Other
Comprehensive
Income (Loss)
Related to Equity
Method Investee
|
Total
|
||||||||||||||||||
|
(millions)
|
|||||||||||||||||||||||
|
Balances, December 31, 2011
|
$
|
(204
|
)
|
$
|
103
|
|
$
|
(46
|
)
|
$
|
5
|
|
$
|
(12
|
)
|
$
|
(154
|
)
|
|||||
|
Other comprehensive income (loss)
|
(62
|
)
|
(7
|
)
|
(28
|
)
|
7
|
|
(11
|
)
|
(101
|
)
|
|||||||||||
|
Balances, December 31, 2012
|
(266
|
)
|
96
|
|
(74
|
)
|
12
|
|
(23
|
)
|
(255
|
)
|
|||||||||||
|
Other comprehensive income (loss) before reclassifications
|
84
|
|
118
|
|
95
|
|
(45
|
)
|
7
|
|
259
|
|
|||||||||||
|
Amounts reclassified from AOCI
|
67
|
|
(a)
|
(17
|
)
|
(b)
|
2
|
|
—
|
|
—
|
|
52
|
|
|||||||||
|
Net other comprehensive income (loss)
|
151
|
|
|
101
|
|
|
97
|
|
(45
|
)
|
7
|
|
311
|
|
|||||||||
|
Balances, December 31, 2013
|
(115
|
)
|
197
|
|
23
|
|
(33
|
)
|
(16
|
)
|
56
|
|
|||||||||||
|
Other comprehensive income (loss) before reclassifications
|
(141
|
)
|
62
|
|
(44
|
)
|
(25
|
)
|
(8
|
)
|
(156
|
)
|
|||||||||||
|
Amounts reclassified from AOCI
|
98
|
|
(a)
|
(41
|
)
|
(b)
|
1
|
|
—
|
|
—
|
|
58
|
|
|||||||||
|
Net other comprehensive income (loss)
|
(43
|
)
|
21
|
|
(43
|
)
|
(25
|
)
|
(8
|
)
|
(98
|
)
|
|||||||||||
|
Less other comprehensive loss attributable to noncontrolling interests
|
2
|
|
—
|
|
—
|
|
—
|
|
—
|
|
2
|
|
|||||||||||
|
Balances, December 31, 2014
|
$
|
(156
|
)
|
$
|
218
|
|
$
|
(20
|
)
|
$
|
(58
|
)
|
$
|
(24
|
)
|
$
|
(40
|
)
|
|||||
————————————
|
(a)
|
Reclassified to interest expense and other - net in NEE's consolidated statements of income. See Note 3 - Income Statement Impact of Derivative Instruments.
|
|
(b)
|
Reclassified to gains on disposal of assets - net in NEE's consolidated statements of income.
|
110
NEXTERA ENERGY, INC. AND FLORIDA POWER & LIGHT COMPANY
NOTES TO CONSOLIDATED FINANCIAL STATEMENTS (Continued)
Long-term debt consists of the following:
|
December 31,
|
|||||||||||||||
|
2014
|
2013
|
||||||||||||||
|
Maturity
Date |
Balance
|
Weighted-
Average Interest Rate |
Balance
|
Weighted-
Average Interest Rate |
|||||||||||
|
(millions)
|
(millions)
|
||||||||||||||
|
FPL:
|
|
||||||||||||||
|
First mortgage bonds - fixed
|
2017 - 2044
|
$
|
8,490
|
|
4.95
|
%
|
$
|
7,490
|
|
5.12
|
%
|
||||
|
Storm-recovery bonds - fixed
(a)
|
2017 - 2021
|
331
|
|
5.24
|
%
|
386
|
|
5.22
|
%
|
||||||
|
Pollution control, solid waste disposal and industrial development revenue bonds - variable
(b)(c)
|
2020 - 2029
|
633
|
|
0.05
|
%
|
633
|
|
0.07
|
%
|
||||||
|
Other long-term debt - variable
(c)
|
2014
|
—
|
|
300
|
|
0.66
|
%
|
||||||||
|
Other long-term debt - fixed
|
2014 - 2040
|
55
|
|
4.96
|
%
|
55
|
|
4.96
|
%
|
||||||
|
Unamortized discount
|
(36
|
)
|
(35
|
)
|
|||||||||||
|
Total long-term debt of FPL
|
9,473
|
|
8,829
|
|
|||||||||||
|
Less current maturities of long-term debt
|
60
|
|
356
|
|
|||||||||||
|
Long-term debt of FPL, excluding current maturities
|
9,413
|
|
8,473
|
|
|||||||||||
|
NEECH:
|
|
|
|||||||||||||
|
Debentures - fixed
(d)
|
2015 - 2023
|
3,125
|
|
3.87
|
%
|
2,550
|
|
4.43
|
%
|
||||||
|
Debentures, related to NEE's equity units - fixed
|
2014 - 2018
|
2,152
|
|
1.54
|
%
|
2,503
|
|
1.55
|
%
|
||||||
|
Junior subordinated debentures - fixed
|
2044 - 2073
|
2,978
|
|
5.84
|
%
|
3,353
|
|
6.16
|
%
|
||||||
|
Senior secured bonds - fixed
(e)
|
2030
|
500
|
|
7.50
|
%
|
500
|
|
7.50
|
%
|
||||||
|
Japanese yen denominated senior notes - fixed
(d)
|
2030
|
83
|
|
5.13
|
%
|
95
|
|
5.13
|
%
|
||||||
|
Japanese yen denominated term loans - variable
(c)(d)
|
2014 - 2017
|
459
|
|
1.83
|
%
|
419
|
|
1.45
|
%
|
||||||
|
Other long-term debt - fixed
|
2016 - 2044
|
510
|
|
2.70
|
%
|
150
|
|
0.86
|
%
|
||||||
|
Other long-term debt - variable
(c)
|
2014 - 2019
|
716
|
|
2.44
|
%
|
1,665
|
|
1.27
|
%
|
||||||
|
Fair value hedge adjustment (see Note 3)
|
20
|
|
4
|
|
|||||||||||
|
Unamortized discount
|
(1
|
)
|
—
|
|
|||||||||||
|
Total long-term debt of NEECH
|
10,542
|
|
11,239
|
|
|||||||||||
|
Less current maturities of long-term debt
|
1,787
|
|
1,469
|
|
|||||||||||
|
Long-term debt of NEECH, excluding current maturities
|
8,755
|
|
9,770
|
|
|||||||||||
|
NEER:
|
|
|
|||||||||||||
|
Senior secured limited-recourse bonds and notes - fixed
|
2017 - 2038
|
2,273
|
|
6.02
|
%
|
2,523
|
|
5.84
|
%
|
||||||
|
Senior secured limited-recourse term loans - primarily variable
(c)(d)
|
2015 - 2032
|
4,242
|
|
3.12
|
%
|
3,874
|
|
3.18
|
%
|
||||||
|
Other long-term debt - primarily variable
(c)(d)(f)
|
2015 - 2030
|
656
|
|
3.71
|
%
|
808
|
|
3.48
|
%
|
||||||
|
Canadian revolving credit facilities - variable
(c)
|
2014 - 2016
|
704
|
|
2.33
|
%
|
472
|
|
2.33
|
%
|
||||||
|
Unamortized discount
|
(8
|
)
|
(10
|
)
|
|||||||||||
|
Total long-term debt of NEER
|
7,867
|
|
7,667
|
|
|||||||||||
|
Less current maturities of long-term debt
(f)
|
1,668
|
|
1,941
|
|
|||||||||||
|
Long-term debt of NEER, excluding current maturities
|
6,199
|
|
5,726
|
|
|||||||||||
|
Total long-term debt
|
$
|
24,367
|
|
$
|
23,969
|
|
|||||||||
______________________
|
(a)
|
Principal on the storm-recovery bonds is due on the final maturity date (the date by which the principal must be repaid to prevent a default) for each tranche, however, it is being paid semiannually and sequentially.
|
|
(b)
|
Tax exempt bonds that permit individual bond holders to tender the bonds for purchase at any time prior to maturity. In the event bonds are tendered for purchase, they would be remarketed by a designated remarketing agent in accordance with the related indenture. If the remarketing is unsuccessful, FPL would be required to purchase the tax exempt bonds. As of
December 31, 2014
, all tax exempt bonds tendered for purchase have been successfully remarketed. FPL's bank revolving line of credit facilities are available to support the purchase of tax exempt bonds.
|
|
(c)
|
Variable rate is based on an underlying index plus a margin except for in 2014 approximately
$983 million
and in 2013 approximately
$1.1 billion
of NEER's senior secured limited-recourse term loans is based on the greater of an underlying index or a floor, plus a margin.
|
|
(d)
|
Interest rate contracts, primarily swaps, have been entered into for the majority of these debt issuances. See Note 3.
|
|
(e)
|
Issued by a wholly-owned subsidiary of NEECH and collateralized by a third-party note receivable held by that subsidiary. See Note 4 - Fair Value of Financial Instruments Recorded at the Carrying Amount.
|
|
(f)
|
See Note 13 - Spain Solar Projects for discussion of events of default related to debt associated with the Spain solar projects.
|
111
NEXTERA ENERGY, INC. AND FLORIDA POWER & LIGHT COMPANY
NOTES TO CONSOLIDATED FINANCIAL STATEMENTS (Continued)
Minimum annual maturities of long
-
term debt for NEE are approximately
$3,515 million
,
$1,285 million
,
$2,608 million
,
$1,440 million
and
$1,943 million
for
2015
,
2016
,
2017
,
2018
and
2019
, respectively. The respective amounts for FPL are approximately
$60 million
,
$64 million
,
$367 million
,
$72 million
and
$76 million
.
At
December 31, 2014 and 2013
, short-term borrowings had a weighted-average interest rate of
0.40%
(
0.40%
for FPL) and
0.20%
(
0.11%
for FPL), respectively. Available lines of credit aggregated approximately
$7.9 billion
(
$4.9 billion
for NEECH and
$3.0 billion
for FPL) at
December 31, 2014
. These facilities provide for the issuance of letters of credit of up to approximately
$6.6 billion
(
$4.1 billion
for NEECH and
$2.5 billion
for FPL). The issuance of letters of credit is subject to the aggregate commitment under the applicable facility. While no direct borrowings were outstanding at
December 31, 2014
, letters of credit totaling
$843 million
and
$3 million
were outstanding under the NEECH and FPL credit facilities, respectively.
NEE has guaranteed certain payment obligations of NEECH, including most of those under NEECH's debt, including all of its debentures and commercial paper issuances, as well as most of its payment guarantees and indemnifications. NEECH has guaranteed certain debt and other obligations of NEER and its subsidiaries.
In May 2012, NEE sold
$600 million
of equity units (initially consisting of Corporate Units). Each equity unit has a stated amount of
$50
and consists of a contract to purchase NEE common stock (stock purchase contract) and, initially, a
5%
undivided beneficial ownership interest in a Series E Debenture due June 1, 2017 issued in the principal amount of
$1,000
by NEECH (see table above). Each stock purchase contract requires the holder to purchase by no later than June 1, 2015 (the final settlement date) for a price of
$50
in cash, a number of shares of NEE common stock (subject to antidilution adjustments) based on a price per share range of
$64.35
to
$77.22
. If purchased on the final settlement date, as of December 31, 2014, the number of shares issued would (subject to antidilution adjustments) range from
0.7835
shares if the applicable market value of a share of common stock is less than or equal to
$64.35
, to
0.6529
shares if the applicable market value of a share is equal to or greater than
$77.22
, with applicable market value to be determined using the average closing prices of NEE common stock over a
20
-day trading period ending May 27, 2015. Total annual distributions on the equity units will be at the rate of
5.599%
, consisting of interest on the debentures (
1.70%
per year) and payments under the stock purchase contracts (
3.899%
per year). The interest rate on the debentures is expected to be reset on or after March 1, 2015. The holder of the equity unit may satisfy its purchase obligation with proceeds raised from remarketing the NEECH debentures that are part of its equity unit. The undivided beneficial ownership interest in the NEECH debenture that is a component of each Corporate Unit is pledged to NEE to secure the holder’s obligation to purchase NEE common stock under the related stock purchase contract. If a successful remarketing does not occur on or before the third business day prior to the final settlement date, and a holder has not notified NEE of its intention to settle the stock purchase contract with cash, the debentures that are components of the Corporate Units will be used to satisfy in full the holders' obligations to purchase NEE common stock under the related stock purchase contracts on the final settlement date. The debentures are fully and unconditionally guaranteed by NEE.
Also, in May 2012, NEECH completed a remarketing of
$350 million
aggregate principal amount of its Series C Debentures due June 1, 2014 (Debentures). The Debentures were issued in May 2009 as components of equity units issued concurrently by NEE (2009 equity units). The Debentures were fully and unconditionally guaranteed by NEE. In connection with the remarketing of the Debentures, the interest rate on the Debentures was reset to
1.611%
per year, and interest was payable on June 1 and December 1 of each year, commencing June 1, 2012. In connection with the settlement of the contracts to purchase NEE common stock that were issued as components of the 2009 equity units, on June 1, 2012, NEE issued
5,400,500
shares of common stock in exchange for
$350 million
.
In September 2012, NEE sold
$650 million
of equity units (initially consisting of Corporate Units). Each equity unit has a stated amount of
$50
and consists of a contract to purchase NEE common stock (stock purchase contract) and, initially, a
5%
undivided beneficial ownership interest in a Series F Debenture due September 1, 2017 issued in the principal amount of
$1,000
by NEECH (see table above). Each stock purchase contract requires the holder to purchase by no later than September 1, 2015 (the final settlement date) for a price of
$50
in cash, a number of shares of NEE common stock (subject to antidilution adjustments) based on a price per share range of
$67.15
to
$80.58
. If purchased on the final settlement date, as of December 31, 2014, the number of shares issued would (subject to antidilution adjustments) range from
0.7507
shares if the applicable market value of a share of common stock is less than or equal to
$67.15
, to
0.6256
shares if the applicable market value of a share is equal to or greater than
$80.58
, with applicable market value to be determined using the average closing prices of NEE common stock over a
20
-day trading period ending August 27, 2015. Total annual distributions on the equity units will be at the rate of
5.889%
, consisting of interest on the debentures (
1.60%
per year) and payments under the stock purchase contracts (
4.289%
per year). The interest rate on the debentures is expected to be reset on or after March 1, 2015. The holder of the equity unit may satisfy its purchase obligation with proceeds raised from remarketing the NEECH debentures that are part of its equity unit. The undivided beneficial ownership interest in the NEECH debenture that is a component of each Corporate Unit is pledged to NEE to secure the holder’s obligation to purchase NEE common stock under the related stock purchase contract. If a successful remarketing does not occur on or before the third business day prior to the final settlement date, and a holder has not notified NEE of its intention to settle the stock purchase contract with cash, the debentures that are components of the Corporate Units will be used to satisfy in full the holders' obligations to purchase NEE common stock under the related stock purchase contracts on the final settlement date. The debentures are fully and unconditionally guaranteed by NEE.
112
NEXTERA ENERGY, INC. AND FLORIDA POWER & LIGHT COMPANY
NOTES TO CONSOLIDATED FINANCIAL STATEMENTS (Continued)
In August 2013, NEECH completed a remarketing of approximately $
402.4 million
aggregate principal amount of its Series D Debentures due September 1, 2015, which constitutes a portion of the $
402.5 million
aggregate principal amount of such debentures (Debentures) that were issued in September 2010 as components of equity units issued concurrently by NEE (2010 equity units). The Debentures are fully and unconditionally guaranteed by NEE. In connection with the remarketing of the Debentures, the interest rate on the Debentures was reset to
1.339%
per year, and interest is payable on March 1 and September 1 of each year, commencing September 1, 2013. In connection with the settlement of the contracts to purchase NEE common stock that were issued as components of the 2010 equity units, in August and September 2013, NEE issued a total of
5,946,530
shares of common stock in exchange for $
402.5 million
.
In September 2013, NEE sold
$500 million
of equity units (initially consisting of Corporate Units). Each equity unit has a stated amount of
$50
and consists of a contract to purchase NEE common stock (stock purchase contract) and, initially, a
5%
undivided beneficial ownership interest in a Series G Debenture due September 1, 2018 issued in the principal amount of
$1,000
by NEECH (see table above). Each stock purchase contract requires the holder to purchase by no later than September 1, 2016 (the final settlement date) for a price of
$50
in cash, a number of shares of NEE common stock (subject to antidilution adjustments) based on a price per share range of
$82.70
to
$99.24
. If purchased on the final settlement date, as of December 31, 2014, the number of shares issued would (subject to antidilution adjustments) range from
0.6062
shares if the applicable market value of a share of common stock is less than or equal to
$82.70
to
0.5051
shares if the applicable market value of a share is equal to or greater than
$99.24
, with applicable market value to be determined using the average closing prices of NEE common stock over a
20
-day trading period ending August 29, 2016. Total annual distributions on the equity units will be at the rate of
5.799%
, consisting of interest on the debentures (
1.45%
per year) and payments under the stock purchase contracts (
4.349%
per year). The interest rate on the debentures is expected to be reset on or after March 1, 2016. The holder of the equity unit may satisfy its purchase obligation with proceeds raised from remarketing the NEECH debentures that are part of its equity unit. The undivided beneficial ownership interest in the NEECH debenture that is a component of each Corporate Unit is pledged to NEE to secure the holder's obligation to purchase NEE common stock under the related stock purchase contract. If a successful remarketing does not occur on or before the third business day prior to the final settlement date, and a holder has not notified NEE of its intention to settle the stock purchase contract with cash, the debentures that are components of the Corporate Units will be used to satisfy in full the holders' obligations to purchase NEE common stock under the related stock purchase contracts on the final settlement date. The debentures are fully and unconditionally guaranteed by NEE.
Prior to the issuance of NEE’s common stock, the stock purchase contracts, if dilutive, will be reflected in NEE’s diluted earnings per share calculations using the treasury stock method. Under this method, the number of shares of NEE common stock used in calculating diluted earnings per share is deemed to be increased by the excess, if any, of the number of shares that would be issued upon settlement of the stock purchase contracts over the number of shares that could be purchased by NEE in the market, at the average market price during the period, using the proceeds receivable upon settlement.
12. Asset Retirement Obligations
FPL's ARO relates primarily to the nuclear decommissioning obligation of its nuclear units. FPL's AROs other than nuclear decommissioning are not significant. The accounting provisions result in timing differences in the recognition of legal asset retirement costs for financial reporting purposes and the method the FPSC allows FPL to recover in rates. NEER's ARO relates primarily to the nuclear decommissioning obligation of its nuclear plants and obligations for the dismantlement of its wind facilities located on leased property. See Note 1 - Decommissioning of Nuclear Plants, Dismantlement of Plants and Other Accrued Asset Removal Costs.
A rollforward of NEE's and FPL's ARO is as follows:
|
FPL
|
NEER
|
NEE
|
|||||||||
|
(millions)
|
|||||||||||
|
Balances, December 31, 2012
|
$
|
1,206
|
|
|
$
|
509
|
|
|
$
|
1,715
|
|
|
Liabilities incurred
|
1
|
|
|
24
|
|
|
25
|
|
|||
|
Accretion expense
|
64
|
|
|
35
|
|
|
99
|
|
|||
|
Liabilities settled
|
(1
|
)
|
(2
|
)
|
(3
|
)
|
|||||
|
Revision in estimated cash flows - net
|
15
|
|
(1
|
)
|
14
|
|
|||||
|
Balances, December 31, 2013
|
1,285
|
|
|
565
|
|
|
1,850
|
|
|||
|
Liabilities incurred
|
1
|
|
|
29
|
|
|
30
|
|
|||
|
Accretion expense
|
70
|
|
|
38
|
|
|
108
|
|
|||
|
Liabilities settled
|
—
|
|
|
(1
|
)
|
(1
|
)
|
||||
|
Revision in estimated cash flows - net
|
(1
|
)
|
—
|
|
(1
|
)
|
|||||
|
Balances, December 31, 2014
|
$
|
1,355
|
|
|
$
|
631
|
|
|
$
|
1,986
|
|
113
NEXTERA ENERGY, INC. AND FLORIDA POWER & LIGHT COMPANY
NOTES TO CONSOLIDATED FINANCIAL STATEMENTS (Continued)
Restricted funds for the payment of future expenditures to decommission NEE's and FPL's nuclear units included in special use funds on NEE's and FPL's consolidated balance sheets are as follows (see Note 4 - Special Use Funds):
|
FPL
|
NEER
|
NEE
|
|||||||||
|
(millions)
|
|||||||||||
|
Balances, December 31, 2014
|
$
|
3,449
|
|
$
|
1,642
|
|
$
|
5,091
|
|
||
|
Balances, December 31, 2013
|
$
|
3,199
|
|
$
|
1,507
|
|
$
|
4,706
|
|
||
NEE and FPL have identified but not recognized ARO liabilities related to electric transmission and distribution and telecommunications assets resulting from easements over property not owned by NEE or FPL. These easements are generally perpetual and only require retirement action upon abandonment or cessation of use of the property or facility for its specified purpose. The ARO liability is not estimable for such easements as NEE and FPL intend to use these properties indefinitely. In the event NEE and FPL decide to abandon or cease the use of a particular easement, an ARO liability would be recorded at that time.
13. Commitments and Contingencies
Commitments
- NEE and its subsidiaries have made commitments in connection with a portion of their projected capital expenditures. Capital expenditures at FPL include, among other things, the cost for construction or acquisition of additional facilities and equipment to meet customer demand, as well as capital improvements to and maintenance of existing facilities and the procurement of nuclear fuel. At NEER, capital expenditures include, among other things, the cost, including capitalized interest, for construction and development of wind and solar projects and the procurement of nuclear fuel. Capital expenditures for Corporate and Other primarily include the cost for construction of two natural gas pipeline systems, consisting of three separate pipelines, as well as the cost to meet customer-specific requirements and maintain the fiber-optic network for the fiber-optic telecommunications business (FPL FiberNet) and the cost to maintain existing transmission facilities at NextEra Energy Transmission, LLC.
At
December 31, 2014
, estimated capital expenditures for
2015
through
2019
were as follows:
|
2015
|
2016
|
2017
|
2018
|
2019
|
Total
|
||||||||||||||||||
|
(millions)
|
|||||||||||||||||||||||
|
FPL:
|
|
|
|
|
|
|
|||||||||||||||||
|
Generation:
(a)
|
|
|
|
|
|
|
|||||||||||||||||
|
New
(b)(c)
|
$
|
395
|
|
$
|
400
|
|
$
|
5
|
|
$
|
5
|
|
$
|
—
|
|
$
|
805
|
|
|||||
|
Existing
|
785
|
|
635
|
|
640
|
|
495
|
|
440
|
|
2,995
|
|
|||||||||||
|
Transmission and distribution
|
1,725
|
|
1,965
|
|
1,760
|
|
1,625
|
|
1,680
|
|
8,755
|
|
|||||||||||
|
Nuclear fuel
|
205
|
|
220
|
|
125
|
|
150
|
|
175
|
|
875
|
|
|||||||||||
|
General and other
|
325
|
|
230
|
|
215
|
|
160
|
|
130
|
|
1,060
|
|
|||||||||||
|
Total
(d)
|
$
|
3,435
|
|
$
|
3,450
|
|
$
|
2,745
|
|
$
|
2,435
|
|
$
|
2,425
|
|
$
|
14,490
|
|
|||||
|
NEER:
(e)
|
|
|
|
|
|
|
|
|
|
|
|
|
|||||||||||
|
Wind
|
$
|
1,345
|
|
$
|
275
|
|
$
|
10
|
|
$
|
15
|
|
$
|
10
|
|
$
|
1,655
|
|
|||||
|
Solar
|
1,210
|
|
555
|
|
—
|
|
—
|
|
—
|
|
1,765
|
|
|||||||||||
|
Nuclear, including nuclear fuel
|
270
|
|
295
|
|
245
|
|
240
|
|
280
|
|
1,330
|
|
|||||||||||
|
Other
|
275
|
|
60
|
|
50
|
|
120
|
|
100
|
|
605
|
|
|||||||||||
|
Total
|
$
|
3,100
|
|
$
|
1,185
|
|
$
|
305
|
|
$
|
375
|
|
$
|
390
|
|
$
|
5,355
|
|
|||||
|
Corporate and Other
(f)
|
$
|
510
|
|
$
|
1,200
|
|
$
|
695
|
|
$
|
455
|
|
$
|
145
|
|
$
|
3,005
|
|
|||||
______________________
|
(a)
|
Includes AFUDC of approximately $
54 million
and $
17 million
for 2015 and 2016, respectively.
|
|
(b)
|
Includes land, generating structures, transmission interconnection and integration and licensing.
|
|
(c)
|
Consists of projects that have received FPSC approval or applicable internal approvals. Excludes capital expenditures for the construction costs for the two additional nuclear units at FPL's Turkey Point site beyond what is required to receive an NRC license for each unit.
|
|
(d)
|
FPL has identified $
800 million
to $
1.1 billion
in potential incremental capital expenditures through 2016 in addition to what is included in the table above.
|
|
(e)
|
Consists of capital expenditures for new wind and solar projects and related transmission totaling approximately
1,760
MW and gas infrastructure investments that have received applicable internal approvals. Excludes new wind and solar projects in advanced development requiring internal approvals.
|
|
(f)
|
Includes capital expenditures totaling approximately
$2.5 billion
for construction of three natural gas pipelines that have received applicable internal approvals, including
$2.0 billion
of equity contributions associated with equity investments in joint ventures for two pipelines and
$515 million
, which includes AFUDC of approximately $
3 million
, $
17 million
, and $
11 million
for 2015 through 2017, respectively, associated with the third pipeline. The natural gas pipelines are subject to certain conditions, including FERC approval. See Contracts below.
|
The above estimates are subject to continuing review and adjustment and actual capital expenditures may vary significantly from these estimates.
114
NEXTERA ENERGY, INC. AND FLORIDA POWER & LIGHT COMPANY
NOTES TO CONSOLIDATED FINANCIAL STATEMENTS (Continued)
Contracts
- In addition to the commitments made in connection with the estimated capital expenditures included in the table in Commitments above, FPL has commitments under long-term purchased power and fuel contracts. As of
December 31, 2014
, FPL is obligated under take-or-pay purchased power contracts with JEA and with subsidiaries of The Southern Company (Southern subsidiaries) to pay for approximately
1,330
MW annually
through December 2015
and
375
MW annually thereafter
through 2021
. FPL also has various firm pay-for-performance contracts to purchase approximately
705
MW from certain cogenerators and small power producers (qualifying facilities) with expiration dates ranging from
2024
through
2034
. The purchased power contracts provide for capacity and energy payments. Energy payments are based on the actual power taken under these contracts. Capacity payments for the pay-for-performance contracts are subject to the qualifying facilities meeting certain contract conditions. FPL has contracts with expiration dates
through 2036
for the purchase and transportation of natural gas and coal, and storage of natural gas. In addition, FPL has entered into
25
-year natural gas transportation agreements with each of Sabal Trail Transmission, LLC (Sabal Trail, an entity in which a wholly-owned NEECH subsidiary has a
33%
ownership interest), and Florida Southeast Connection, LLC (Florida Southeast Connection, a wholly-owned NEECH subsidiary), each of which will build, own and operate a pipeline that will be part of a natural gas pipeline system, for a quantity of
400,000
MMBtu/day beginning on May 1, 2017 and increasing to
600,000
MMBtu/day on May 1, 2020. These agreements contain firm commitments that are contingent upon the occurrence of certain events, including FERC approval and completion of construction of the pipeline system to be built by Sabal Trail and Florida Southeast Connection. See Commitments above.
As of
December 31, 2014
, NEER has entered into contracts with expiration dates ranging from
March 2015
through
2030
primarily for the purchase of wind turbines, wind towers and solar modules and related construction and development activities, as well as for the supply of uranium, conversion, enrichment and fabrication of nuclear fuel. Approximately
$2.7 billion
of commitments under such contracts are included in the estimated capital expenditures table in Commitments above. In addition, NEER has contracts primarily for the purchase, transportation and storage of natural gas and firm transmission service with expiration dates ranging from
March 2015
through
2033
.
Included in Corporate and Other in the table below is the remaining commitment by NEECH subsidiaries of approximately
$2.1 billion
for the construction of the natural gas pipelines. Amounts committed for 2015 through 2019 are also included in the estimated capital expenditures table in Commitments above.
The required capacity and/or minimum payments under the contracts discussed above as of
December 31, 2014
were estimated as follows:
|
2015
|
2016
|
2017
|
2018
|
2019
|
Thereafter
|
||||||||||||||||||
|
(millions)
|
|||||||||||||||||||||||
|
FPL:
|
|||||||||||||||||||||||
|
Capacity charges:
(a)
|
|
|
|
|
|
|
|||||||||||||||||
|
Qualifying facilities
|
$
|
290
|
|
$
|
250
|
|
$
|
255
|
|
$
|
260
|
|
$
|
265
|
|
$
|
1,700
|
|
|||||
|
JEA and Southern subsidiaries
|
$
|
195
|
|
$
|
70
|
|
$
|
50
|
|
$
|
10
|
|
$
|
—
|
|
$
|
—
|
|
|||||
|
Minimum charges, at projected prices:
(b)
|
|||||||||||||||||||||||
|
Natural gas, including transportation and storage
(c)
|
$
|
1,175
|
|
$
|
760
|
|
$
|
750
|
|
$
|
830
|
|
$
|
830
|
|
$
|
13,780
|
|
|||||
|
Coal, including transportation
|
$
|
115
|
|
$
|
50
|
|
$
|
35
|
|
$
|
—
|
|
$
|
—
|
|
$
|
—
|
|
|||||
|
NEER
|
$
|
1,770
|
|
$
|
860
|
|
$
|
140
|
|
$
|
135
|
|
$
|
85
|
|
$
|
390
|
|
|||||
|
Corporate and Other
(d)(e)
|
$
|
370
|
|
$
|
880
|
|
$
|
445
|
|
$
|
385
|
|
$
|
70
|
|
$
|
40
|
|
|||||
______________________
|
(a)
|
Capacity charges under these contracts, substantially all of which are recoverable through the capacity clause, totaled approximately $
485 million
, $
487 million
and $
523 million
for the years ended
December 31, 2014, 2013 and 2012
, respectively. Energy charges under these contracts, which are recoverable through the fuel clause, totaled approximately $
299 million
, $
263 million
and $
276 million
for the years ended
December 31, 2014, 2013 and 2012
, respectively.
|
|
(b)
|
Recoverable through the fuel clause.
|
|
(c)
|
Includes approximately $
200 million
, $
295 million
, $
290 million
and $
8,245 million
in 2017, 2018, 2019 and thereafter, respectively, of firm commitments, subject to certain conditions as noted above, related to the natural gas transportation agreements with Sabal Trail and Florida Southeast Connection.
|
|
(d)
|
Includes an approximately
$45 million
commitment to invest in clean power and technology businesses through 2021.
|
|
(e)
|
Excludes approximately
$555 million
, in 2015, of joint obligations of NEECH and NEER which are included in the NEER amounts above.
|
Insurance
- Liability for accidents at nuclear power plants is governed by the Price-Anderson Act, which limits the liability of nuclear reactor owners to the amount of insurance available from both private sources and an industry retrospective payment plan. In accordance with this Act, NEE maintains $
375 million
of private liability insurance per site, which is the maximum obtainable, and participates in a secondary financial protection system, which provides up to $
13.2 billion
of liability insurance coverage per incident at any nuclear reactor in the United States. Under the secondary financial protection system, NEE is subject to retrospective assessments of up to $
1.0 billion
($
509 million
for FPL), plus any applicable taxes, per incident at any nuclear reactor in the United States, payable at a rate not to exceed $
152 million
($
76 million
for FPL) per incident per year. NEE and FPL are contractually entitled to recover a proportionate share of such assessments from the owners of minority interests in Seabrook, Duane Arnold and St. Lucie Unit No. 2, which approximates $
15 million
, $
38 million
and $
19 million
, plus any applicable taxes, per incident, respectively.
115
NEXTERA ENERGY, INC. AND FLORIDA POWER & LIGHT COMPANY
NOTES TO CONSOLIDATED FINANCIAL STATEMENTS (Continued)
NEE participates in a nuclear insurance mutual company that provides $
2.75 billion
of limited insurance coverage per occurrence per site for property damage, decontamination and premature decommissioning risks at its nuclear plants and a sublimit of
$1.5 billion
for non-nuclear perils. The proceeds from such insurance, however, must first be used for reactor stabilization and site decontamination before they can be used for plant repair. NEE also participates in an insurance program that provides limited coverage for replacement power costs if a nuclear plant is out of service for an extended period of time because of an accident. In the event of an accident at one of NEE's or another participating insured's nuclear plants, NEE could be assessed up to $
175 million
($
106 million
for FPL), plus any applicable taxes, in retrospective premiums in a policy year. NEE and FPL are contractually entitled to recover a proportionate share of such assessments from the owners of minority interests in Seabrook, Duane Arnold and St. Lucie Unit No. 2, which approximates $
2 million
, $
5 million
and $
4 million
, plus any applicable taxes, respectively.
Due to the high cost and limited coverage available from third-party insurers, NEE does not have property insurance coverage for a substantial portion of its transmission and distribution property and has no property insurance coverage for FPL FiberNet's fiber-optic cable. Should FPL's future storm restoration costs exceed the reserve amount established through the issuance of storm-recovery bonds by a VIE in 2007, FPL may recover storm restoration costs, subject to prudence review by the FPSC, either through surcharges approved by the FPSC or through securitization provisions pursuant to Florida law.
In the event of a loss, the amount of insurance available might not be adequate to cover property damage and other expenses incurred. Uninsured losses and other expenses, to the extent not recovered from customers in the case of FPL or Lone Star Transmission, LLC, would be borne by NEE and/or FPL and/or their affiliates, as the case may be, and could have a material adverse effect on NEE's and FPL's financial condition, results of operations and liquidity.
Spain Solar Projects
- In March 2013 and May 2013, events of default occurred under the project-level financing agreements for the Spain solar projects (project-level financing) as a result of changes of law that occurred in December 2012 and February 2013. These changes of law negatively affected the projected economics of the projects and caused the project-level financing to be unsupportable by expected future project cash flows. Under the project-level financing, events of default (including those discussed below) provide for, among other things, a right by the lenders (which they have not exercised) to accelerate the payment of the project-level debt. Accordingly, in 2013, the project-level debt and the associated derivative liabilities related to interest rate swaps were classified as current maturities of long-term debt and current derivative liabilities, respectively, on NEE's consolidated balance sheets, and totaled $
647 million
and $
125 million
, respectively, as of
December 31, 2014
. In July 2013, the Spanish government published a new law that created a new economic framework for the Spanish renewable energy sector. Additional regulatory pronouncements from the Spanish government needed to complete and implement the framework were finalized in June 2014. Based on NEE's assessment, the regulatory pronouncements do not indicate a further impairment of the Spain solar projects. However, the Spanish government's interpretation of the new remuneration scheme resulted in a reduction to 2013 revenues of approximately $
19 million
which was reflected in operating revenues for the year ended
December 31, 2014
in NEE's consolidated statements of income. During the third quarter of 2014, events of default occurred under the project-level financing agreements related to certain debt service coverage ratio covenants not being met. The project-level subsidiaries have requested the lenders to waive the events of default related to the debt service coverage ratio.
As part of a settlement agreement reached in December 2013 between NEECH, NextEra Energy España, S.L. (NEE España), which is the NEER subsidiary in Spain that is the direct shareholder of the project-level subsidiaries, the project-level subsidiaries and the lenders, the future recourse of the lenders under the project-level financing is effectively limited to the letters of credit described below and to the assets of the project-level subsidiaries. Under the settlement agreement, the lenders, among other things, irrevocably waived events of default related to changes of law that existed at the time of the settlement as described above, and NEECH affiliates provided for the project-level subsidiaries to post approximately
€37 million
(approximately $
45 million
as of
December 31, 2014
) in letters of credit to fund operating and debt service reserves under the project-level financing. NEE España, the project-level subsidiaries and the lenders will continue to seek to restructure the project-level financing; however, there can be no assurance that the project-level financing will be successfully restructured or that additional events of default under the project-level financing will not occur.
Legal Proceedings
- In November 1999, the Attorney General of the United States, on behalf of the U.S. Environmental Protection Agency (EPA), brought an action in the U.S. District Court for the Northern District of Georgia against Georgia Power Company and other subsidiaries of The Southern Company for certain alleged violations of the Prevention of Significant Deterioration (PSD) provisions and the New Source Performance Standards (NSPS) of the Clean Air Act. In May 2001, the EPA amended its complaint to allege, among other things, that Georgia Power Company constructed and is continuing to operate Scherer Unit No. 4, in which FPL owns an interest of approximately
76%
, without obtaining a PSD permit, without complying with NSPS requirements, and without applying best available control technology for nitrogen oxides, sulfur dioxides and particulate matter as required by the Clean Air Act. It also alleges that unspecified major modifications have been made at Scherer Unit No. 4 that require its compliance with the aforementioned Clean Air Act provisions. The EPA seeks injunctive relief requiring the installation of best available control technology and civil penalties. Under the EPA's civil penalty rules, the EPA could assess up to $
25,000
per day for each violation from an unspecified date after June 1, 1975 through January 30, 1997, up to $
27,500
per day for each violation from January 31, 1997 through March 15, 2004, up to $
32,500
per day for each violation from March 16, 2004 through January 12, 2009 and up to $
37,500
per day for each violation thereafter. Georgia Power Company has answered the amended complaint, asserting that it has complied with all requirements of the Clean Air Act, denying the plaintiff's allegations of liability, denying that the plaintiff is entitled
116
NEXTERA ENERGY, INC. AND FLORIDA POWER & LIGHT COMPANY
NOTES TO CONSOLIDATED FINANCIAL STATEMENTS (Continued)
to any of the relief that it seeks and raising various other defenses. In June 2001, a federal district court stayed discovery and administratively closed the case and the EPA has not yet moved to reopen the case. In April 2007, the U.S. Supreme Court in a separate unrelated case rejected an argument that a "major modification" occurs at a plant only when there is a resulting increase in the hourly rate of air emissions. Georgia Power Company has made a similar argument in defense of its case, but has other factual and legal defenses that are unaffected by the U.S. Supreme Court's decision.
In 1995 and 1996, NEE, through an indirect subsidiary, purchased from Adelphia Communications Corporation (Adelphia)
1,091,524
shares of Adelphia common stock and
20,000
shares of Adelphia preferred stock (convertible into
2,358,490
shares of Adelphia common stock) for an aggregate price of approximately $
35,900,000
. On January 29, 1999, Adelphia repurchased all of these shares for $
149,213,130
in cash. In June 2004, Adelphia, Adelphia Cablevision, L.L.C. and the Official Committee of Unsecured Creditors of Adelphia filed a complaint against NEE and its indirect subsidiary in the U.S. Bankruptcy Court, Southern District of New York. The complaint alleges that the repurchase of these shares by Adelphia was a fraudulent transfer, in that at the time of the transaction Adelphia (i) was insolvent or was rendered insolvent, (ii) did not receive reasonably equivalent value in exchange for the cash it paid, and (iii) was engaged or about to engage in a business or transaction for which any property remaining with Adelphia had unreasonably small capital. The complaint seeks the recovery for the benefit of Adelphia's bankruptcy estate of the cash paid for the repurchased shares, plus interest from January 29, 1999. NEE filed an answer to the complaint. NEE believes that the complaint is without merit because, among other reasons, Adelphia will be unable to demonstrate that (i) Adelphia's repurchase of shares from NEE, which repurchase was at the market value for those shares, was not for reasonably equivalent value, (ii) Adelphia was insolvent at the time of the stock repurchase, or (iii) the stock repurchase left Adelphia with unreasonably small capital. The trial was completed in May 2012 and closing arguments were heard in July 2012. In May 2014, the U.S. Bankruptcy Court, Southern District of New York, issued its decision after trial, finding, among other things, that Adelphia was not insolvent, or rendered insolvent, at the time of the stock repurchase. The bankruptcy court further ruled that Adelphia was not left with inadequate capital or equitably insolvent at the time of the stock repurchase. The decision after trial represents proposed findings of fact and conclusions of law which are subject to de novo review by the U.S. District Court for the Southern District of New York. Adelphia filed its objections to the decision in June 2014 and NEE filed its response to those objections in July 2014. The issuance of a final order by the district court is pending.
NEE and FPL are vigorously defending, and believe that they or their affiliates have meritorious defenses to, the lawsuits described above. In addition to the legal proceedings discussed above, NEE and its subsidiaries, including FPL, are involved in other legal and regulatory proceedings, actions and claims in the ordinary course of their businesses. Generating plants in which subsidiaries of NEE, including FPL, have an ownership interest are also involved in legal and regulatory proceedings, actions and claims, the liabilities from which, if any, would be shared by such subsidiary. In the event that NEE and FPL, or their affiliates, do not prevail in the lawsuits described above or these other legal and regulatory proceedings, actions and claims, there may be a material adverse effect on their financial statements. While management is unable to predict with certainty the outcome of the lawsuits described above or these other legal and regulatory proceedings, actions and claims, based on current knowledge it is not expected that their ultimate resolution, individually or collectively, will have a material adverse effect on the financial statements of NEE or FPL.
14. Segment Information
NEE's reportable segments are FPL, a rate-regulated electric utility, and NEER, a competitive energy business. NEER's segment information includes an allocation of interest expense from NEECH based on a deemed capital structure of
70%
debt and allocated shared service costs. Corporate and Other represents other business activities, other segments that are not separately reportable and eliminating entries. NEE's operating revenues derived from the sale of electricity represented approximately
91%
,
92%
and
93%
of NEE's operating revenues for the years ended December 31,
2014
,
2013
and
2012
. Approximately
2%
,
1%
and
1%
of operating revenues were from foreign sources for each of the three years ended December 31,
2014
,
2013
and
2012
, respectively. At December 31,
2014
and
2013
, approximately
4%
of long-lived assets were located in foreign countries.
117
NEXTERA ENERGY, INC. AND FLORIDA POWER & LIGHT COMPANY
NOTES TO CONSOLIDATED FINANCIAL STATEMENTS (Continued)
NEE's segment information is as follows:
|
2014
|
2013
|
2012
|
|||||||||||||||||||||||||||||||||||||||||||||
|
FPL
|
NEER
(a)
|
Corp.
and
Other
|
NEE
Consoli-
dated
|
FPL
|
NEER
(a)
|
Corp.
and
Other
|
NEE
Consoli-
dated
|
FPL
|
NEER
(a)
|
Corp.
and
Other
|
NEE
Consoli-
dated
|
||||||||||||||||||||||||||||||||||||
|
(millions)
|
|||||||||||||||||||||||||||||||||||||||||||||||
|
Operating revenues
|
$
|
11,421
|
|
$
|
5,191
|
|
$
|
409
|
|
$
|
17,021
|
|
$
|
10,445
|
|
$
|
4,333
|
|
$
|
358
|
|
$
|
15,136
|
|
$
|
10,114
|
|
$
|
3,895
|
|
$
|
247
|
|
$
|
14,256
|
|
|||||||||||
|
Operating expenses
(b)
|
$
|
8,593
|
|
$
|
3,724
|
|
$
|
320
|
|
$
|
12,637
|
|
$
|
7,906
|
|
$
|
3,730
|
|
$
|
259
|
|
$
|
11,895
|
|
$
|
7,757
|
|
$
|
3,024
|
|
$
|
199
|
|
$
|
10,980
|
|
|||||||||||
|
Interest expense
|
$
|
439
|
|
$
|
666
|
|
$
|
156
|
|
$
|
1,261
|
|
$
|
415
|
|
$
|
528
|
|
$
|
178
|
|
$
|
1,121
|
|
$
|
417
|
|
$
|
474
|
|
$
|
147
|
|
$
|
1,038
|
|
|||||||||||
|
Interest income
|
$
|
3
|
|
$
|
26
|
|
$
|
51
|
|
$
|
80
|
|
$
|
6
|
|
$
|
19
|
|
$
|
53
|
|
$
|
78
|
|
$
|
6
|
|
$
|
20
|
|
$
|
60
|
|
$
|
86
|
|
|||||||||||
|
Depreciation and amortization
|
$
|
1,432
|
|
$
|
1,051
|
|
$
|
68
|
|
$
|
2,551
|
|
$
|
1,159
|
|
$
|
949
|
|
$
|
55
|
|
$
|
2,163
|
|
$
|
659
|
|
$
|
818
|
|
$
|
41
|
|
$
|
1,518
|
|
|||||||||||
|
Equity in earnings (losses) of equity method investees
|
$
|
—
|
|
$
|
93
|
|
$
|
—
|
|
$
|
93
|
|
$
|
—
|
|
$
|
26
|
|
$
|
(1
|
)
|
$
|
25
|
|
$
|
—
|
|
$
|
19
|
|
$
|
(6
|
)
|
$
|
13
|
|
|||||||||||
|
Income tax expense (benefit)
(c)(d)(e)
|
$
|
910
|
|
$
|
282
|
|
$
|
(16
|
)
|
$
|
1,176
|
|
$
|
835
|
|
$
|
(42
|
)
|
$
|
(16
|
)
|
$
|
777
|
|
$
|
752
|
|
$
|
(7
|
)
|
$
|
(53
|
)
|
$
|
692
|
|
|||||||||||
|
Income (loss) from continuing operations
(d)(e)
|
$
|
1,517
|
|
$
|
989
|
|
$
|
(37
|
)
|
$
|
2,469
|
|
$
|
1,349
|
|
$
|
340
|
|
$
|
(12
|
)
|
$
|
1,677
|
|
$
|
1,240
|
|
$
|
687
|
|
$
|
(16
|
)
|
$
|
1,911
|
|
|||||||||||
|
Gain from discontinued operations, net of income taxes
(e)(f)
|
$
|
—
|
|
$
|
—
|
|
$
|
—
|
|
$
|
—
|
|
$
|
—
|
|
$
|
216
|
|
$
|
15
|
|
$
|
231
|
|
$
|
—
|
|
$
|
—
|
|
$
|
—
|
|
$
|
—
|
|
|||||||||||
|
Net income (loss) attributable to NEE
(d)
|
$
|
1,517
|
|
$
|
985
|
|
$
|
(37
|
)
|
$
|
2,465
|
|
$
|
1,349
|
|
$
|
556
|
|
$
|
3
|
|
$
|
1,908
|
|
$
|
1,240
|
|
$
|
687
|
|
$
|
(16
|
)
|
$
|
1,911
|
|
|||||||||||
|
Capital expenditures, independent power and other investments and nuclear fuel purchases
|
$
|
3,241
|
|
$
|
3,627
|
|
$
|
149
|
|
$
|
7,017
|
|
$
|
2,903
|
|
$
|
3,613
|
|
$
|
166
|
|
$
|
6,682
|
|
$
|
4,285
|
|
$
|
4,681
|
|
$
|
495
|
|
$
|
9,461
|
|
|||||||||||
|
Property, plant and equipment
|
$
|
41,938
|
|
$
|
30,155
|
|
$
|
1,546
|
|
$
|
73,639
|
|
$
|
39,896
|
|
$
|
28,080
|
|
$
|
1,472
|
|
$
|
69,448
|
|
$
|
38,249
|
|
$
|
25,333
|
|
$
|
1,335
|
|
$
|
64,917
|
|
|||||||||||
|
Accumulated depreciation and amortization
|
$
|
11,282
|
|
$
|
6,268
|
|
$
|
384
|
|
$
|
17,934
|
|
$
|
10,944
|
|
$
|
5,455
|
|
$
|
329
|
|
$
|
16,728
|
|
$
|
10,698
|
|
$
|
4,535
|
|
$
|
271
|
|
$
|
15,504
|
|
|||||||||||
|
Total assets
(g)
|
$
|
39,307
|
|
$
|
32,919
|
|
$
|
2,703
|
|
$
|
74,929
|
|
$
|
36,488
|
|
$
|
30,154
|
|
$
|
2,664
|
|
$
|
69,306
|
|
$
|
34,853
|
|
$
|
27,139
|
|
$
|
2,447
|
|
$
|
64,439
|
|
|||||||||||
|
Investment in equity method investees
|
$
|
—
|
|
$
|
537
|
|
$
|
126
|
|
$
|
663
|
|
$
|
—
|
|
$
|
365
|
|
$
|
57
|
|
$
|
422
|
|
$
|
—
|
|
$
|
243
|
|
$
|
19
|
|
$
|
262
|
|
|||||||||||
______________________
|
(a)
|
Interest expense allocated from NEECH is based on a deemed capital structure of
70%
debt. For this purpose, the deferred credit associated with differential membership interests sold by NEER subsidiaries is included with debt. Residual NEECH corporate interest expense is included in Corporate and Other.
|
|
(b)
|
NEER includes an impairment charge of
$300 million
in 2013 related to the Spain solar projects. See Note 4 - Nonrecurring Fair Value Measurements.
|
|
(c)
|
NEER includes PTCs that were recognized based on its tax sharing agreement with NEE. See Note 1 - Income Taxes.
|
|
(d)
|
NEER includes after-tax charges of
$342 million
in 2013 associated with the impairment of the Spain solar projects. See Note 4 - Nonrecurring Fair Value Measurements.
|
|
(e)
|
2013 amounts were reclassified to conform to current year's presentation. See Note 4 - Nonrecurring Fair Value Measurements.
|
|
(f)
|
See Note 6.
|
|
(g)
|
In 2012, NEER includes assets held for sale of approximately
$335 million
.
|
118
NEXTERA ENERGY, INC. AND FLORIDA POWER & LIGHT COMPANY
NOTES TO CONSOLIDATED FINANCIAL STATEMENTS (Continued)
15. Summarized Financial Information of NEECH
NEECH, a
100%
owned subsidiary of NEE, provides funding for, and holds ownership interests in, NEE's operating subsidiaries other than FPL. NEECH’s debentures and junior subordinated debentures that are registered pursuant to the Securities Act of 1933, as amended, are fully and unconditionally guaranteed by NEE. Condensed consolidating financial information is as follows:
Condensed Consolidating Statements of Income
|
Year Ended
December 31, 2014 |
Year Ended
December 31, 2013 |
Year Ended
December 31, 2012 |
|||||||||||||||||||||||||||||||||||||||||||||
|
NEE
(Guaran- tor) |
NEECH
|
Other
(a)
|
NEE
Consoli- dated |
NEE
(Guaran- tor) |
NEECH
|
Other
(a)
|
NEE
Consoli- dated |
NEE
(Guaran- tor) |
NEECH
|
Other
(a)
|
NEE
Consoli- dated |
||||||||||||||||||||||||||||||||||||
|
(millions)
|
|||||||||||||||||||||||||||||||||||||||||||||||
|
Operating revenues
|
$
|
—
|
|
$
|
5,614
|
|
$
|
11,407
|
|
$
|
17,021
|
|
$
|
—
|
|
$
|
4,703
|
|
$
|
10,433
|
|
$
|
15,136
|
|
$
|
—
|
|
$
|
4,154
|
|
$
|
10,102
|
|
$
|
14,256
|
|
|||||||||||
|
Operating expenses
|
(19
|
)
|
(4,039
|
)
|
(8,579
|
)
|
(12,637
|
)
|
(18
|
)
|
(3,983
|
)
|
(7,894
|
)
|
(11,895
|
)
|
(21
|
)
|
(3,214
|
)
|
(7,745
|
)
|
(10,980
|
)
|
|||||||||||||||||||||||
|
Interest expense
|
(6
|
)
|
(819
|
)
|
(436
|
)
|
(1,261
|
)
|
(8
|
)
|
(705
|
)
|
(408
|
)
|
(1,121
|
)
|
(11
|
)
|
(619
|
)
|
(408
|
)
|
(1,038
|
)
|
|||||||||||||||||||||||
|
Equity in earnings of subsidiaries
|
2,494
|
|
—
|
|
(2,494
|
)
|
—
|
|
1,915
|
|
—
|
|
(1,915
|
)
|
—
|
|
1,925
|
|
—
|
|
(1,925
|
)
|
—
|
|
|||||||||||||||||||||||
|
Other income (deductions) - net
(b)
|
1
|
|
487
|
|
34
|
|
522
|
|
2
|
|
281
|
|
51
|
|
334
|
|
7
|
|
313
|
|
45
|
|
365
|
|
|||||||||||||||||||||||
|
Income from continuing operations before income taxes
(b)
|
2,470
|
|
1,243
|
|
(68
|
)
|
3,645
|
|
1,891
|
|
296
|
|
267
|
|
2,454
|
|
1,900
|
|
634
|
|
69
|
|
2,603
|
|
|||||||||||||||||||||||
|
Income tax expense (benefit)
(b)
|
5
|
|
262
|
|
909
|
|
1,176
|
|
(2
|
)
|
(55
|
)
|
834
|
|
777
|
|
(11
|
)
|
(50
|
)
|
753
|
|
692
|
|
|||||||||||||||||||||||
|
Income (loss) from continuing operations
(b)
|
2,465
|
|
981
|
|
(977
|
)
|
2,469
|
|
1,893
|
|
351
|
|
(567
|
)
|
1,677
|
|
1,911
|
|
684
|
|
(684
|
)
|
1,911
|
|
|||||||||||||||||||||||
|
Gain from discontinued operations, net of income taxes
(b)
|
—
|
|
—
|
|
—
|
|
—
|
|
15
|
|
216
|
|
—
|
|
231
|
|
—
|
|
—
|
|
—
|
|
—
|
|
|||||||||||||||||||||||
|
Net income (loss)
|
2,465
|
|
981
|
|
(977
|
)
|
2,469
|
|
1,908
|
|
567
|
|
(567
|
)
|
1,908
|
|
1,911
|
|
684
|
|
(684
|
)
|
1,911
|
|
|||||||||||||||||||||||
|
Less net income attributable to noncontrolling interests
|
—
|
|
(4
|
)
|
—
|
|
(4
|
)
|
—
|
|
—
|
|
—
|
|
—
|
|
—
|
|
—
|
|
—
|
|
—
|
|
|||||||||||||||||||||||
|
Net income (loss) attributable to NEE
|
$
|
2,465
|
|
$
|
977
|
|
$
|
(977
|
)
|
$
|
2,465
|
|
$
|
1,908
|
|
$
|
567
|
|
$
|
(567
|
)
|
$
|
1,908
|
|
$
|
1,911
|
|
$
|
684
|
|
$
|
(684
|
)
|
$
|
1,911
|
|
|||||||||||
______________________
|
(a)
|
Represents FPL and consolidating adjustments.
|
|
(b)
|
2013 amounts were reclassified to conform to current year's presentation. See Note 4 - Nonrecurring Fair Value Measurements.
|
Condensed Consolidating Statements of Comprehensive Income
|
|
Year Ended
December 31, 2014 |
Year Ended
December 31, 2013 |
Year Ended
December 31, 2012 |
||||||||||||||||||||||||||||||||||||||||||||
|
|
NEE
(Guaran- tor) |
NEECH
|
Other
(a)
|
NEE
Consoli- dated |
NEE
(Guaran- tor) |
NEECH
|
Other
(a)
|
NEE
Consoli- dated |
NEE
(Guaran- tor) |
NEECH
|
Other
(a)
|
NEE
Consoli- dated |
|||||||||||||||||||||||||||||||||||
|
|
(millions)
|
||||||||||||||||||||||||||||||||||||||||||||||
|
Comprehensive income (loss) attributable to NEE
|
$
|
2,369
|
|
$
|
924
|
|
$
|
(924
|
)
|
$
|
2,369
|
|
$
|
2,219
|
|
$
|
781
|
|
$
|
(781
|
)
|
$
|
2,219
|
|
$
|
1,810
|
|
$
|
611
|
|
$
|
(611
|
)
|
$
|
1,810
|
|
|||||||||||
______________________
|
(a)
|
Represents FPL and consolidating adjustments.
|
119
NEXTERA ENERGY, INC. AND FLORIDA POWER & LIGHT COMPANY
NOTES TO CONSOLIDATED FINANCIAL STATEMENTS (Continued)
Condensed Consolidating Balance Sheets
|
December 31, 2014
|
December 31, 2013
|
||||||||||||||||||||||||||||||
|
NEE
(Guaran-
tor) |
NEECH
|
Other
(a)
|
NEE
Consoli- dated |
NEE
(Guaran-
tor) |
NEECH
|
Other
(a)
|
NEE
Consoli- dated |
||||||||||||||||||||||||
|
(millions)
|
|||||||||||||||||||||||||||||||
|
PROPERTY, PLANT AND EQUIPMENT
|
|||||||||||||||||||||||||||||||
|
Electric plant in service and other property
|
$
|
27
|
|
$
|
31,674
|
|
$
|
41,938
|
|
$
|
73,639
|
|
$
|
31
|
|
$
|
29,511
|
|
$
|
39,906
|
|
$
|
69,448
|
|
|||||||
|
Less accumulated depreciation and amortization
|
(12
|
)
|
(6,640
|
)
|
(11,282
|
)
|
(17,934
|
)
|
(10
|
)
|
(5,774
|
)
|
(10,944
|
)
|
(16,728
|
)
|
|||||||||||||||
|
Total property, plant and equipment - net
|
15
|
|
25,034
|
|
30,656
|
|
55,705
|
|
21
|
|
23,737
|
|
28,962
|
|
52,720
|
|
|||||||||||||||
|
CURRENT ASSETS
|
|
|
|
|
|
|
|
|
|
|
|||||||||||||||||||||
|
Cash and cash equivalents
|
—
|
|
562
|
|
15
|
|
577
|
|
—
|
|
418
|
|
20
|
|
438
|
|
|||||||||||||||
|
Receivables
|
82
|
|
1,378
|
|
699
|
|
2,159
|
|
78
|
|
1,542
|
|
669
|
|
2,289
|
|
|||||||||||||||
|
Other
|
19
|
|
2,512
|
|
1,677
|
|
4,208
|
|
6
|
|
1,814
|
|
1,295
|
|
3,115
|
|
|||||||||||||||
|
Total current assets
|
101
|
|
4,452
|
|
2,391
|
|
6,944
|
|
84
|
|
3,774
|
|
1,984
|
|
5,842
|
|
|||||||||||||||
|
OTHER ASSETS
|
|
|
|
|
|
|
|
|
|
|
|||||||||||||||||||||
|
Investment in subsidiaries
|
19,703
|
|
—
|
|
(19,703
|
)
|
—
|
|
17,910
|
|
—
|
|
(17,910
|
)
|
—
|
|
|||||||||||||||
|
Other
|
736
|
|
6,066
|
|
5,478
|
|
12,280
|
|
694
|
|
5,129
|
|
4,921
|
|
10,744
|
|
|||||||||||||||
|
Total other assets
|
20,439
|
|
6,066
|
|
(14,225
|
)
|
12,280
|
|
18,604
|
|
5,129
|
|
(12,989
|
)
|
10,744
|
|
|||||||||||||||
|
TOTAL ASSETS
|
$
|
20,555
|
|
$
|
35,552
|
|
$
|
18,822
|
|
$
|
74,929
|
|
$
|
18,709
|
|
$
|
32,640
|
|
$
|
17,957
|
|
$
|
69,306
|
|
|||||||
|
CAPITALIZATION
|
|
|
|
|
|
|
|
|
|
|
|||||||||||||||||||||
|
Common shareholders' equity
|
$
|
19,916
|
|
$
|
6,552
|
|
$
|
(6,552
|
)
|
$
|
19,916
|
|
$
|
18,040
|
|
$
|
4,816
|
|
$
|
(4,816
|
)
|
$
|
18,040
|
|
|||||||
|
Noncontrolling interests
|
—
|
|
252
|
|
—
|
|
252
|
|
—
|
|
—
|
|
—
|
|
—
|
|
|||||||||||||||
|
Long-term debt
|
—
|
|
14,954
|
|
9,413
|
|
24,367
|
|
—
|
|
15,496
|
|
8,473
|
|
23,969
|
|
|||||||||||||||
|
Total capitalization
|
19,916
|
|
21,758
|
|
2,861
|
|
44,535
|
|
18,040
|
|
20,312
|
|
3,657
|
|
42,009
|
|
|||||||||||||||
|
CURRENT LIABILITIES
|
|
|
|
|
|
|
|
|
|
|
|||||||||||||||||||||
|
Debt due within one year
|
—
|
|
3,455
|
|
1,202
|
|
4,657
|
|
—
|
|
3,896
|
|
561
|
|
4,457
|
|
|||||||||||||||
|
Accounts payable
|
—
|
|
707
|
|
647
|
|
1,354
|
|
—
|
|
589
|
|
611
|
|
1,200
|
|
|||||||||||||||
|
Other
|
182
|
|
2,075
|
|
1,395
|
|
3,652
|
|
199
|
|
2,203
|
|
1,130
|
|
3,532
|
|
|||||||||||||||
|
Total current liabilities
|
182
|
|
6,237
|
|
3,244
|
|
9,663
|
|
199
|
|
6,688
|
|
2,302
|
|
9,189
|
|
|||||||||||||||
|
OTHER LIABILITIES AND DEFERRED CREDITS
|
|
|
|
|
|
|
|
|
|
|
|||||||||||||||||||||
|
Asset retirement obligations
|
—
|
|
631
|
|
1,355
|
|
1,986
|
|
—
|
|
565
|
|
1,285
|
|
1,850
|
|
|||||||||||||||
|
Deferred income taxes
|
149
|
|
2,608
|
|
6,504
|
|
9,261
|
|
166
|
|
1,963
|
|
6,015
|
|
8,144
|
|
|||||||||||||||
|
Other
|
308
|
|
4,318
|
|
4,858
|
|
9,484
|
|
304
|
|
3,112
|
|
4,698
|
|
8,114
|
|
|||||||||||||||
|
Total other liabilities and deferred credits
|
457
|
|
7,557
|
|
12,717
|
|
20,731
|
|
470
|
|
5,640
|
|
11,998
|
|
18,108
|
|
|||||||||||||||
|
COMMITMENTS AND CONTINGENCIES
|
|||||||||||||||||||||||||||||||
|
TOTAL CAPITALIZATION AND LIABILITIES
|
$
|
20,555
|
|
$
|
35,552
|
|
$
|
18,822
|
|
$
|
74,929
|
|
$
|
18,709
|
|
$
|
32,640
|
|
$
|
17,957
|
|
$
|
69,306
|
|
|||||||
______________________
|
(a)
|
Represents FPL and consolidating adjustments.
|
120
NEXTERA ENERGY, INC. AND FLORIDA POWER & LIGHT COMPANY
NOTES TO CONSOLIDATED FINANCIAL STATEMENTS (Continued)
Condensed Consolidating Statements of Cash Flows
|
Year Ended
December 31, 2014 |
Year Ended
December 31, 2013 |
Year Ended
December 31, 2012 |
|||||||||||||||||||||||||||||||||||||||||||||
|
NEE
(Guar-
antor)
|
NEECH
|
Other
(a)
|
NEE
Consoli-
dated
|
NEE
(Guar-
antor)
|
NEECH
|
Other
(a)
|
NEE
Consoli-
dated
|
NEE
(Guar-
antor)
|
NEECH
|
Other
(a)
|
NEE
Consoli-
dated
|
||||||||||||||||||||||||||||||||||||
|
|
(millions)
|
||||||||||||||||||||||||||||||||||||||||||||||
|
NET CASH PROVIDED BY OPERATING ACTIVITIES
|
$
|
1,615
|
|
$
|
1,976
|
|
$
|
1,909
|
|
$
|
5,500
|
|
$
|
1,147
|
|
$
|
1,466
|
|
$
|
2,489
|
|
$
|
5,102
|
|
$
|
1,166
|
|
$
|
1,091
|
|
$
|
1,735
|
|
$
|
3,992
|
|
|||||||||||
|
CASH FLOWS FROM INVESTING ACTIVITIES
|
|||||||||||||||||||||||||||||||||||||||||||||||
|
Capital expenditures, independent power and other investments and nuclear fuel purchases
|
(1
|
)
|
(3,741
|
)
|
(3,275
|
)
|
(7,017
|
)
|
—
|
|
(3,756
|
)
|
(2,926
|
)
|
(6,682
|
)
|
—
|
|
(5,176
|
)
|
(4,285
|
)
|
(9,461
|
)
|
|||||||||||||||||||||||
|
Capital contributions from NEE
|
(912
|
)
|
—
|
|
912
|
|
—
|
|
(777
|
)
|
—
|
|
777
|
|
—
|
|
(440
|
)
|
—
|
|
440
|
|
—
|
|
|||||||||||||||||||||||
|
Cash grants under the Recovery Act
|
—
|
|
343
|
|
—
|
|
343
|
|
—
|
|
165
|
|
—
|
|
165
|
|
—
|
|
196
|
|
—
|
|
196
|
|
|||||||||||||||||||||||
|
Sale of independent power and other investments of NEER
|
—
|
|
307
|
|
—
|
|
307
|
|
—
|
|
165
|
|
—
|
|
165
|
|
—
|
|
—
|
|
—
|
|
—
|
|
|||||||||||||||||||||||
|
Change in loan proceeds restricted for construction
|
—
|
|
(40
|
)
|
—
|
|
(40
|
)
|
—
|
|
228
|
|
—
|
|
228
|
|
—
|
|
314
|
|
—
|
|
314
|
|
|||||||||||||||||||||||
|
Proceeds from the sale of a noncontrolling interest in subsidiaries
|
—
|
|
438
|
|
—
|
|
438
|
|
—
|
|
—
|
|
—
|
|
—
|
|
—
|
|
—
|
|
—
|
|
—
|
|
|||||||||||||||||||||||
|
Other - net
|
10
|
|
(73
|
)
|
(329
|
)
|
(392
|
)
|
—
|
|
17
|
|
(16
|
)
|
1
|
|
1
|
|
20
|
|
2
|
|
23
|
|
|||||||||||||||||||||||
|
Net cash used in investing activities
|
(903
|
)
|
(2,766
|
)
|
(2,692
|
)
|
(6,361
|
)
|
(777
|
)
|
(3,181
|
)
|
(2,165
|
)
|
(6,123
|
)
|
(439
|
)
|
(4,646
|
)
|
(3,843
|
)
|
(8,928
|
)
|
|||||||||||||||||||||||
|
CASH FLOWS FROM FINANCING ACTIVITIES
|
|
|
|
|
|
|
|
|
|
|
|
|
|
|
|
|
|
|
|
|
|
|
|
|
|||||||||||||||||||||||
|
Issuances of long-term debt
|
—
|
|
4,057
|
|
997
|
|
5,054
|
|
—
|
|
3,874
|
|
497
|
|
4,371
|
|
—
|
|
5,334
|
|
1,296
|
|
6,630
|
|
|||||||||||||||||||||||
|
Retirements of long-term debt
|
—
|
|
(4,395
|
)
|
(355
|
)
|
(4,750
|
)
|
—
|
|
(1,943
|
)
|
(453
|
)
|
(2,396
|
)
|
—
|
|
(1,562
|
)
|
(50
|
)
|
(1,612
|
)
|
|||||||||||||||||||||||
|
Proceeds from sale of differential membership interests
|
—
|
|
978
|
|
—
|
|
978
|
|
—
|
|
448
|
|
—
|
|
448
|
|
—
|
|
808
|
|
—
|
|
808
|
|
|||||||||||||||||||||||
|
Net change in short-term debt
|
—
|
|
(487
|
)
|
938
|
|
451
|
|
—
|
|
(819
|
)
|
99
|
|
(720
|
)
|
—
|
|
286
|
|
(225
|
)
|
61
|
|
|||||||||||||||||||||||
|
Issuances of common stock - net
|
633
|
|
—
|
|
—
|
|
633
|
|
842
|
|
—
|
|
—
|
|
842
|
|
405
|
|
—
|
|
—
|
|
405
|
|
|||||||||||||||||||||||
|
Dividends on common stock
|
(1,261
|
)
|
—
|
|
—
|
|
(1,261
|
)
|
(1,122
|
)
|
—
|
|
—
|
|
(1,122
|
)
|
(1,004
|
)
|
—
|
|
—
|
|
(1,004
|
)
|
|||||||||||||||||||||||
|
Other - net
|
(84
|
)
|
781
|
|
(802
|
)
|
(105
|
)
|
(92
|
)
|
286
|
|
(487
|
)
|
(293
|
)
|
(127
|
)
|
(1,363
|
)
|
1,090
|
|
(400
|
)
|
|||||||||||||||||||||||
|
Net cash provided by (used in) financing activities
|
(712
|
)
|
934
|
|
778
|
|
1,000
|
|
(372
|
)
|
1,846
|
|
(344
|
)
|
1,130
|
|
(726
|
)
|
3,503
|
|
2,111
|
|
4,888
|
|
|||||||||||||||||||||||
|
Net increase (decrease) in cash and cash equivalents
|
—
|
|
144
|
|
(5
|
)
|
139
|
|
(2
|
)
|
131
|
|
(20
|
)
|
109
|
|
1
|
|
(52
|
)
|
3
|
|
(48
|
)
|
|||||||||||||||||||||||
|
Cash and cash equivalents at beginning of year
|
—
|
|
418
|
|
20
|
|
438
|
|
2
|
|
287
|
|
40
|
|
329
|
|
1
|
|
339
|
|
37
|
|
377
|
|
|||||||||||||||||||||||
|
Cash and cash equivalents at end of year
|
$
|
—
|
|
$
|
562
|
|
$
|
15
|
|
$
|
577
|
|
$
|
—
|
|
$
|
418
|
|
$
|
20
|
|
$
|
438
|
|
$
|
2
|
|
$
|
287
|
|
$
|
40
|
|
$
|
329
|
|
|||||||||||
______________________
|
(a)
|
Represents FPL and consolidating adjustments.
|
121
NEXTERA ENERGY, INC. AND FLORIDA POWER & LIGHT COMPANY
NOTES TO CONSOLIDATED FINANCIAL STATEMENTS (Concluded)
16. Quarterly Data (Unaudited)
Condensed consolidated quarterly financial information is as follows:
|
March 31
(a)
|
June 30
(a)
|
September 30
(a)
|
December 31
(a)
|
||||||||||||
|
(millions, except per share amounts)
|
|||||||||||||||
|
NEE:
|
|||||||||||||||
|
2014
|
|||||||||||||||
|
Operating revenues
(b)
|
$
|
3,674
|
|
$
|
4,029
|
|
$
|
4,654
|
|
$
|
4,664
|
|
|||
|
Operating income
(b)
|
$
|
738
|
|
$
|
951
|
|
$
|
1,163
|
|
$
|
1,532
|
|
|||
|
Income from continuing operations
(b)
|
$
|
430
|
|
$
|
492
|
|
$
|
664
|
|
$
|
884
|
|
|||
|
Net income
(b)
|
$
|
430
|
|
$
|
492
|
|
$
|
664
|
|
$
|
884
|
|
|||
|
Net income attributable to NEE
(b)
|
$
|
430
|
|
$
|
492
|
|
$
|
660
|
|
$
|
884
|
|
|||
|
Earnings per share attributable to NEE - basic:
(f)
|
|||||||||||||||
|
Continuing operations
|
$
|
0.99
|
|
$
|
1.13
|
|
$
|
1.52
|
|
$
|
2.03
|
|
|||
|
Net income
|
$
|
0.99
|
|
$
|
1.13
|
|
$
|
1.52
|
|
$
|
2.03
|
|
|||
|
Earnings per share attributable to NEE - assuming dilution:
(f)
|
|||||||||||||||
|
Continuing operations
|
$
|
0.98
|
|
$
|
1.12
|
|
$
|
1.50
|
|
$
|
2.00
|
|
|||
|
Net income
|
$
|
0.98
|
|
$
|
1.12
|
|
$
|
1.50
|
|
$
|
2.00
|
|
|||
|
Dividends per share
|
$
|
0.725
|
|
$
|
0.725
|
|
$
|
0.725
|
|
$
|
0.725
|
|
|||
|
High-low common stock sales prices
|
$96.13 - $83.97
|
|
$102.51 - $93.28
|
|
$102.46 - $91.79
|
|
$110.84 - $90.33
|
|
|||||||
|
2013
|
|
|
|
|
|||||||||||
|
Operating revenues
(b)
|
$
|
3,279
|
|
$
|
3,833
|
|
$
|
4,394
|
|
$
|
3,630
|
|
|||
|
Operating income
(b)(c)
|
$
|
434
|
|
$
|
981
|
|
$
|
1,185
|
|
$
|
641
|
|
|||
|
Income from continuing operations
(b)(c)(d)
|
$
|
41
|
|
$
|
610
|
|
$
|
698
|
|
$
|
327
|
|
|||
|
Net income
(b)(c)(e)
|
$
|
272
|
|
$
|
610
|
|
$
|
698
|
|
$
|
327
|
|
|||
|
Earnings per share - basic:
(f)
|
|
|
|
|
|
|
|
|
|||||||
|
Continuing operations
(c)(d)
|
$
|
0.10
|
|
$
|
1.45
|
|
$
|
1.65
|
|
$
|
0.76
|
|
|||
|
Net income
(c)(e)
|
$
|
0.65
|
|
$
|
1.45
|
|
$
|
1.65
|
|
$
|
0.76
|
|
|||
|
Earnings per share - assuming dilution:
(f)
|
|
|
|
|
|
|
|
|
|||||||
|
Continuing operations
(c)(d)
|
$
|
0.10
|
|
$
|
1.44
|
|
$
|
1.64
|
|
$
|
0.75
|
|
|||
|
Net income
(c)(e)
|
$
|
0.64
|
|
$
|
1.44
|
|
$
|
1.64
|
|
$
|
0.75
|
|
|||
|
Dividends per share
|
$
|
0.66
|
|
$
|
0.66
|
|
$
|
0.66
|
|
$
|
0.66
|
|
|||
|
High-low common stock sales prices
|
$77.79 - 69.81
|
|
$82.65 - 74.78
|
|
$88.39 - 78.81
|
|
$89.75 - 78.97
|
|
|||||||
|
FPL:
|
|||||||||||||||
|
2014
|
|||||||||||||||
|
Operating revenues
(b)
|
$
|
2,535
|
|
$
|
2,889
|
|
$
|
3,315
|
|
$
|
2,682
|
|
|||
|
Operating income
(b)
|
$
|
632
|
|
$
|
782
|
|
$
|
834
|
|
$
|
580
|
|
|||
|
Net income
(b)
|
$
|
347
|
|
$
|
423
|
|
$
|
462
|
|
$
|
286
|
|
|||
|
2013
|
|
|
|
|
|||||||||||
|
Operating revenues
(b)
|
$
|
2,188
|
|
$
|
2,696
|
|
$
|
3,020
|
|
$
|
2,541
|
|
|||
|
Operating income
(b)
|
$
|
543
|
|
$
|
724
|
|
$
|
778
|
|
$
|
495
|
|
|||
|
Net income
(b)
|
$
|
288
|
|
$
|
391
|
|
$
|
422
|
|
$
|
248
|
|
|||
______________________
|
(a)
|
In the opinion of NEE and FPL, all adjustments, which consist of normal recurring accruals necessary to present a fair statement of the amounts shown for such periods, have been made. Results of operations for an interim period generally will not give a true indication of results for the year.
|
|
(b)
|
The sum of the quarterly amounts may not equal the total for the year due to rounding.
|
|
(c)
|
First quarter of 2013 includes impairment and other related charges. See Note 4 - Nonrecurring Fair Value Measurements.
|
|
(d)
|
First quarter of 2013 was reclassified to conform to current year's presentation. See Note 4 - Nonrecurring Fair Value Measurements.
|
|
(e)
|
First quarter of 2013 includes an after-tax gain from discontinued operations. See Note 6.
|
|
(f)
|
The sum of the quarterly amounts may not equal the total for the year due to rounding and changes in weighted-average number of common shares outstanding.
|
122
None
Disclosure Controls and Procedures
As of
December 31, 2014
, each of NEE and FPL had performed an evaluation, under the supervision and with the participation of its management, including NEE's and FPL's chief executive officer and chief financial officer, of the effectiveness of the design and operation of each company's disclosure controls and procedures (as defined in the Securities Exchange Act of 1934 Rules 13a-15(e) and 15d-15(e)). Based upon that evaluation, the chief executive officer and chief financial officer of each of NEE and FPL concluded that the company's disclosure controls and procedures were effective as of
December 31, 2014
.
Internal Control Over Financial Reporting
|
(a)
|
Management's Annual Report on Internal Control Over Financial Reporting
|
See Item 8. Financial Statements and Supplementary Data.
|
(b)
|
Attestation Report of the Independent Registered Public Accounting Firm
|
See Item 8. Financial Statements and Supplementary Data.
|
(c)
|
Changes in Internal Control Over Financial Reporting
|
NEE and FPL are continuously seeking to improve the efficiency and effectiveness of their operations and of their internal controls. This results in refinements to processes throughout NEE and FPL. However, there has been no change in NEE's or FPL's internal control over financial reporting (as defined in the Securities Exchange Act of 1934 Rules 13a-15(f) and 15d-15(f)) that occurred during NEE's and FPL's most recent fiscal quarter that has materially affected, or is reasonably likely to materially affect, NEE's or FPL's internal control over financial reporting.
None
123
The information required by this item will be included under the headings "Business of the Annual Meeting," "Information About NextEra Energy and Management" and "Corporate Governance and Board Matters" in NEE's Proxy Statement which will be filed with the SEC in connection with the
2015
Annual Meeting of Shareholders (NEE's Proxy Statement) and is incorporated herein by reference, or is included in Item 1. Business - Executive Officers of NEE.
NEE has adopted the NextEra Energy, Inc. Code of Ethics for Senior Executive and Financial Officers (the Senior Financial Executive Code), which is applicable to the chief executive officer, the chief financial officer, the chief accounting officer and other senior executive and financial officers. The Senior Financial Executive Code is available under Corporate Governance in the Investor Relations section of NEE’s internet website at www.nexteraenergy.com. Any amendments or waivers of the Senior Financial Executive Code which are required to be disclosed to shareholders under SEC rules will be disclosed on the NEE website at the address listed above.
The information required by this item will be included in NEE's Proxy Statement under the headings "Executive Compensation" and "Corporate Governance and Board Matters" and is incorporated herein by reference.
The information required by this item relating to security ownership of certain beneficial owners and management will be included in NEE's Proxy Statement under the heading "Information About NextEra Energy and Management" and is incorporated herein by reference.
Securities Authorized For Issuance Under Equity Compensation Plans
NEE's equity compensation plan information as of
December 31, 2014
is as follows:
|
Plan Category
|
Number of securities to be issued upon exercise of outstanding options, warrants and rights
(a)
|
Weighted-average exercise price of outstanding options, warrants and rights
(b)
|
Number of securities remaining available for future issuance under equity compensation plans (excluding securities reflected in column (a))
(c)
|
|||||||
|
Equity compensation plans approved by security holders
|
5,374,254
|
|
(a)
|
$
|
59.04
|
|
(b)
|
11,541,854
|
|
|
|
Equity compensation plans not approved by security holders
|
—
|
|
—
|
|
—
|
|
||||
|
Total
|
5,374,254
|
|
$
|
59.04
|
|
11,541,854
|
|
|||
__________________________________
|
(a)
|
Includes an aggregate of 2,825,035 outstanding options, 2,285,882 unvested performance share awards (at maximum payout), 64,484 deferred fully vested performance shares and 179,513 deferred stock awards (including future reinvested dividends) under the NextEra Energy, Inc. Amended and Restated 2011 Long Term Incentive Plan and former LTIP, and 19,340 fully vested shares deferred by directors under the NextEra Energy, Inc. 2007 Non-Employee Directors Stock Plan and its predecessor, the FPL Group, Inc. Amended and Restated Non-Employee Directors Stock Plan.
|
|
(b)
|
Relates to outstanding options only.
|
The information required by this item, to the extent applicable, will be included in NEE's Proxy Statement under the heading "Corporate Governance and Board Matters" and is incorporated herein by reference.
124
NEE
- The information required by this item will be included in NEE's Proxy Statement under the heading "Audit-Related Matters" and is incorporated herein by reference.
FPL
- The following table presents fees billed for professional services rendered by Deloitte & Touche LLP, the member firms of Deloitte Touche Tohmatsu, and their respective affiliates (collectively, Deloitte & Touche) for the fiscal years ended
December 31, 2014
and
2013
. The amounts presented below reflect allocations from NEE for FPL's portion of the fees, as well as amounts billed directly to FPL.
|
|
2014
|
2013
|
|||||
|
Audit fees
(a)
|
$
|
3,939,000
|
|
$
|
3,567,000
|
|
|
|
Audit-related fees
(b)
|
128,000
|
|
160,000
|
|
|||
|
Tax fees
(c)
|
59,000
|
|
34,000
|
|
|||
|
All other fees
(d)
|
21,000
|
|
15,000
|
|
|||
|
Total
|
$
|
4,147,000
|
|
$
|
3,776,000
|
|
|
______________________
|
(a)
|
Audit fees consist of fees billed for professional services rendered for the audit of FPL's and NEE's annual consolidated financial statements for the fiscal year, the reviews of the financial statements included in FPL's and NEE's Quarterly Reports on Form 10-Q during the fiscal year and the audit of the effectiveness of internal control over financial reporting, comfort letters, consents, and other services related to SEC matters and services in connection with annual and semi-annual filings of NEE's financial statements with the Japanese Ministry of Finance.
|
|
(b)
|
Audit-related fees consist of fees billed for assurance and related services that are reasonably related to the performance of the audit or review of FPL's and NEE's consolidated financial statements and are not reported under audit fees. These fees primarily related to agreed-upon procedures and attestation services.
|
|
(c)
|
Tax fees consist of fees billed for professional services rendered for tax compliance, tax advice and tax planning.
In 2014, approximately $24,000 was paid related to tax advice and planning services. All other tax fees in 2014 and all tax fees in 2013 related to tax compliance services.
|
|
(d)
|
All other fees consist of fees for products and services other than the services reported under the other named categories. In 2014 and 2013, these fees related to training.
|
In accordance with the requirements of Sarbanes-Oxley Act of 2002, the Audit Committee Charter and the Audit Committee's pre-approval policy for services provided by the independent registered public accounting firm, all services performed by Deloitte & Touche are approved in advance by the Audit Committee, except for audits of certain trust funds where the fees are paid by the trust. Audit and audit-related services specifically identified in an appendix to the pre-approval policy are pre-approved by the Audit Committee each year. This pre-approval allows management to request the specified audit and audit-related services on an as-needed basis during the year, provided any such services are reviewed with the Audit Committee at its next regularly scheduled meeting. Any audit or audit-related service for which the fee is expected to exceed $250,000, or that involves a service not listed on the pre-approval list, must be specifically approved by the Audit Committee prior to commencement of such service. In addition, the Audit Committee approves all services other than audit and audit-related services performed by Deloitte & Touche in advance of the commencement of such work. The Audit Committee has delegated to the Chair of the committee the right to approve audit, audit-related, tax and other services, within certain limitations, between meetings of the Audit Committee, provided any such decision is presented to the Audit Committee at its next regularly scheduled meeting. At each Audit Committee meeting (other than meetings held to review earnings materials), the Audit Committee reviews a schedule of services for which Deloitte & Touche has been engaged since the prior Audit Committee meeting under existing pre-approvals and the estimated fees for those services. In
2014
and
2013
, none of the amounts presented above represent services provided to NEE or FPL by Deloitte & Touche that were approved by the Audit Committee after services were rendered pursuant to Rule 2-01(c)(7)(i)(C) of Regulation S-X
(which provides for a waiver of the otherwise applicable pre-approval requirement if certain conditions are met).
125
|
Page(s)
|
|||
|
(a)
|
1.
|
Financial Statements
|
|
|
Management's Report on Internal Control Over Financial Reporting
|
|||
|
Attestation Report of Independent Registered Public Accounting Firm
|
|||
|
Report of Independent Registered Public Accounting Firm
|
|||
|
NEE:
|
|||
|
Consolidated Statements of Income
|
|||
|
Consolidated Statements of Comprehensive Income
|
|||
|
Consolidated Balance Sheets
|
|||
|
Consolidated Statements of Cash Flows
|
|||
|
Consolidated Statements of Equity
|
|||
|
FPL:
|
|||
|
Consolidated Statements of Income
|
|||
|
Consolidated Balance Sheets
|
|||
|
Consolidated Statements of Cash Flows
|
|||
|
Consolidated Statements of Common Shareholder's Equity
|
|||
|
Notes to Consolidated Financial Statements
|
81 - 122
|
||
|
2.
|
Financial Statement Schedules - Schedules are omitted as not applicable or not required.
|
||
|
3.
|
Exhibits (including those incorporated by reference)
|
||
|
Certain exhibits listed below refer to "FPL Group" and "FPL Group Capital," and were effective prior to the change of the name FPL Group, Inc. to NextEra Energy, Inc., and of the name FPL Group Capital Inc to NextEra Energy Capital Holdings, Inc., during 2010.
|
|||
|
Exhibit
Number
|
Description
|
NEE
|
FPL
|
||||
|
*2
|
Agreement and Plan of Merger, dated as of December 3, 2014, by and among NextEra Energy, Inc., NEE Acquisition Sub I, LLC, NEE Acquisition Sub II, Inc. and Hawaiian Electric Industries, Inc. (filed as Exhibit 2 to Form 8-K dated December 3, 2014, File No. 1-8841)
|
x
|
|||||
|
*3(i)a
|
Restated Articles of Incorporation of NextEra Energy, Inc. (filed as Exhibit 3(i) to Form 10-Q for the quarter ended June 30, 2010, File No. 1-8841)
|
x
|
|||||
|
*3(i)b
|
Restated Articles of Incorporation of Florida Power & Light Company (filed as Exhibit 3(i)b to Form 10-K for the year ended December 31, 2010, File No. 2-27612)
|
x
|
|||||
|
*3(ii)a
|
Amended and Restated Bylaws of NextEra Energy, Inc., as amended through May 21, 2010 (filed as Exhibit 3(ii) to Form 10-Q for the quarter ended June 30, 2010, File No. 1-8841)
|
x
|
|||||
|
*3(ii)b
|
Amended and Restated Bylaws of Florida Power & Light Company, Inc., as amended through October 17, 2008 (filed as Exhibit 3(ii)b to Form 10-Q for the quarter ended September 30, 2008, File No. 2-27612)
|
x
|
|||||
126
|
Exhibit
Number
|
Description
|
NEE
|
FPL
|
||||
|
|
*4(a)
|
Mortgage and Deed of Trust dated as of January 1, 1944, and One hundred and twenty-three Supplements thereto, between Florida Power & Light Company and Deutsche Bank Trust Company Americas, Trustee (filed as Exhibit B-3, File No. 2-4845; Exhibit 7(a), File No. 2-7126; Exhibit 7(a), File No. 2-7523; Exhibit 7(a), File No. 2-7990; Exhibit 7(a), File No. 2-9217; Exhibit 4(a)-5, File No. 2-10093; Exhibit 4(c), File No. 2-11491; Exhibit 4(b)-1, File No. 2-12900; Exhibit 4(b)-1, File No. 2-13255; Exhibit 4(b)-1, File No. 2-13705; Exhibit 4(b)-1, File No. 2-13925; Exhibit 4(b)-1, File No. 2-15088; Exhibit 4(b)-1, File No. 2-15677; Exhibit 4(b)-1, File No. 2-20501; Exhibit 4(b)-1, File No. 2-22104; Exhibit 2(c), File No. 2-23142; Exhibit 2(c), File No. 2-24195; Exhibit 4(b)-1, File No. 2-25677; Exhibit 2(c), File No. 2-27612; Exhibit 2(c), File No. 2-29001; Exhibit 2(c), File No. 2-30542; Exhibit 2(c), File No. 2-33038; Exhibit 2(c), File No. 2-37679; Exhibit 2(c), File No. 2-39006; Exhibit 2(c), File No. 2-41312; Exhibit 2(c), File No. 2-44234; Exhibit 2(c), File No. 2-46502; Exhibit 2(c), File No. 2-48679; Exhibit 2(c), File No. 2-49726; Exhibit 2(c), File No. 2-50712; Exhibit 2(c), File No. 2-52826; Exhibit 2(c), File No. 2-53272; Exhibit 2(c), File No. 2-54242; Exhibit 2(c), File No. 2-56228; Exhibits 2(c) and 2(d), File No. 2-60413; Exhibits 2(c) and 2(d), File No. 2-65701; Exhibit 2(c), File No. 2-66524; Exhibit 2(c), File No. 2-67239; Exhibit 4(c), File No. 2-69716; Exhibit 4(c), File No. 2-70767; Exhibit 4(b), File No. 2-71542; Exhibit 4(b), File No. 2-73799; Exhibits 4(c), 4(d) and 4(e), File No. 2-75762; Exhibit 4(c), File No. 2-77629; Exhibit 4(c), File No. 2-79557; Exhibit 99(a) to Post-Effective Amendment No. 5 to Form S-8, File No. 33-18669; Exhibit 99(a) to Post-Effective Amendment No. 1 to Form S-3, File No. 33-46076; Exhibit 4(b) to Form 10-K for the year ended December 31, 1993, File No. 1-3545; Exhibit 4(i) to Form 10-Q for the quarter ended June 30, 1994, File No. 1-3545; Exhibit 4(b) to Form 10-Q for the quarter ended June 30, 1995, File No. 1-3545; Exhibit 4(a) to Form 10-Q for the quarter ended March 31,1996, File No. 1-3545; Exhibit 4 to Form 10-Q for the quarter ended June 30, 1998, File No. 1-3545; Exhibit 4 to Form 10-Q for the quarter ended March 31, 1999, File No. 1-3545; Exhibit 4(f) to Form 10-K for the year ended December 31, 2000, File No. 1-3545; Exhibit 4(g) to Form 10-K for the year ended December 31, 2000, File No. 1-3545; Exhibit 4(o), File No. 333-102169; Exhibit 4(k) to Post-Effective Amendment No. 1 to Form S-3, File No. 333-102172; Exhibit 4(l) to Post-Effective Amendment No. 2 to Form S-3, File No. 333-102172; Exhibit 4(m) to Post-Effective Amendment No. 3 to Form S-3, File No. 333-102172; Exhibit 4(a) to Form 10-Q for the quarter ended September 30, 2004, File No. 2-27612; Exhibit 4(f) to Amendment No. 1 to Form S-3, File No. 333-125275; Exhibit 4(y) to Post-Effective Amendment No. 2 to Form S-3, File Nos. 333-116300, 333-116300-01 and 333-116300-02; Exhibit 4(z) to Post-Effective Amendment No. 3 to Form S-3, File Nos. 333-116300, 333-116300-01 and 333-116300-02; Exhibit 4(b) to Form 10-Q for the quarter ended March 31, 2006, File No. 2-27612; Exhibit 4(a) to Form 8-K dated April 17, 2007, File No. 2-27612; Exhibit 4 to Form 8-K dated October 10, 2007, File No. 2-27612; Exhibit 4 to Form 8-K dated January 16, 2008, File No. 2-27612; Exhibit 4(a) to Form 8-K dated March 17, 2009, File No. 2-27612; Exhibit 4 to Form 8-K dated February 9, 2010, File No. 2-27612; Exhibit 4 to Form 8-K dated December 9, 2010, File No. 2-27612; Exhibit 4(a) to Form 8-K dated June 10, 2011, File No. 2-27612; Exhibit 4 to Form 8-K dated December 13, 2011, File No. 2-27612; Exhibit 4 to Form 8-K dated May 15, 2012, File No. 2-27612; Exhibit 4 to Form 8-K dated December 20, 2012, File No. 2-27612; Exhibit 4 to Form 8-K dated June 5, 2013, File No. 2-27612; Exhibit 4 to Form 8-K dated May 15, 2014, File No. 2-27612; and Exhibit 4 to Form 8-K dated September 10, 2014, File No. 2-27612)
|
x
|
x
|
|||
|
*4(b)
|
Indenture (For Unsecured Debt Securities), dated as of June 1, 1999, between FPL Group Capital Inc and The Bank of New York Mellon, as Trustee (filed as Exhibit 4(a) to Form 8-K dated July 16, 1999, File No. 1-8841)
|
x
|
|||||
|
*4(c)
|
First Supplemental Indenture to Indenture (For Unsecured Debt Securities) dated as of June 1, 1999, dated as of September 21, 2012, between NextEra Energy Capital Holdings, Inc. and The Bank of New York Mellon, as Trustee (filed as Exhibit 4(e) to Form 10-Q for the quarter ended September 30, 2012, File No. 1-8841)
|
x
|
|||||
|
*4(d)
|
Guarantee Agreement, dated as of June 1, 1999, between FPL Group, Inc. (as Guarantor) and The Bank of New York Mellon (as Guarantee Trustee) (filed as Exhibit 4(b) to Form 8-K dated July 16, 1999, File No. 1-8841)
|
x
|
|||||
127
|
Exhibit
Number
|
Description
|
NEE
|
FPL
|
||||
|
*4(e)
|
Officer's Certificate of FPL Group Capital Inc, dated December 12, 2008, creating the 7 7/8% Debentures, Series due December 15, 2015 (filed as Exhibit 4 to Form 8-K dated December 12, 2008, File No. 1-8841)
|
x
|
|||||
|
*4(f)
|
Officer's Certificate of FPL Group Capital Inc, dated March 9, 2009, creating the 6.00% Debentures, Series due March 1, 2019 (filed as Exhibit 4 to Form 8-K dated March 9, 2009, File No. 1-8841)
|
x
|
|||||
|
*4(g)
|
Officer's Certificate of FPL Group Capital Inc, dated August 31, 2010, creating the Debentures, 2.60% Series due September 1, 2015 (filed as Exhibit 4 to Form 8-K dated August 31, 2010, File No. 1-8841)
|
x
|
|
||||
|
*4(h)
|
Officer's Certificate of FPL Group Capital Inc, dated September 21, 2010, creating the Series D Debentures due September 1, 2015 (filed as Exhibit 4(c) to Form 8-K dated September 15, 2010, File No. 1-8841)
|
x
|
|
||||
|
*4(i)
|
Letter, dated August 9, 2013, from NextEra Energy Capital Holdings, Inc. to The Bank of New York Mellon, as trustee, setting forth certain terms of the Series D Debentures due September 1, 2015, effective August 9, 2013 (filed as Exhibit 4(b) to Form 8-K dated August 9, 2013, File No. 1-8841)
|
x
|
|||||
|
*4(j)
|
Officer's Certificate of NextEra Energy Capital Holdings, Inc., dated June 10, 2011, creating the 4.50% Debentures, Series due June 1, 2021 (filed as Exhibit 4(b) to Form 8-K dated June 10, 2011, File No. 1-8841)
|
x
|
|||||
|
*4(k)
|
Officer's Certificate of NextEra Energy Capital Holdings, Inc., dated May 4, 2012, creating the Series E Debentures due June 1, 2017 (filed as Exhibit 4(c) to Form 8-K dated May 4, 2012, File No. 1-8841)
|
x
|
|||||
|
*4(l)
|
Officer's Certificate of NextEra Energy Capital Holdings, Inc., dated September 11, 2012, creating the Series F Debentures due September 1, 2017 (filed as Exhibit 4(c) to Form 8-K dated September 11, 2012, File No. 1-8841)
|
x
|
|||||
|
*4(m)
|
Officer's Certificate of NextEra Energy Capital Holdings, Inc., dated September 21, 2012, creating the 1.20% Debentures, Series due June 1, 2015 (filed as Exhibit 4 to Form 8-K dated September 21, 2012, File No. 1-8841)
|
x
|
|||||
|
*4(n)
|
Officer's Certificate of NextEra Energy Capital Holdings, Inc. dated June 6, 2013, creating the 3.625% Debentures, Series due June 15, 2023 (filed as Exhibit 4 to Form 8-K dated June 6, 2013, File No. 1-8841)
|
x
|
|||||
|
*4(o)
|
Officer's Certificate of NextEra Energy Capital Holdings, Inc., dated September 25, 2013, creating the Series G Debentures due September 1, 2018 (filed as Exhibit 4(c) to Form 8-K dated September 25, 2013, File No. 1-8841)
|
x
|
|||||
|
*4(p)
|
Officer's Certificate of NextEra Energy Capital Holdings, Inc., dated March 11, 2014, creating the 2.700% Debentures, Series due September 15, 2019 (filed as Exhibit 4 to Form 8-K dated March 11, 2014, File No. 1-8841)
|
x
|
|||||
|
*4(q)
|
Officer's Certificate of NextEra Energy Capital Holdings, Inc., dated June 6, 2014, creating the 2.40% Debentures, Series due September 15, 2019 (filed as Exhibit 4 to Form 8-K dated June 6, 2014, File No. 1-8841)
|
x
|
|||||
|
*4(r)
|
Indenture (For Unsecured Subordinated Debt Securities relating to Trust Securities), dated as of March 1, 2004, among FPL Group Capital Inc, FPL Group, Inc. (as Guarantor) and The Bank of New York Mellon (as Trustee) (filed as Exhibit 4(au) to Post-Effective Amendment No. 3 to Form S-3, File Nos. 333-102173, 333-102173-01, 333-102173-02 and 333-102173-03)
|
x
|
|
||||
|
*4(s)
|
Preferred Trust Securities Guarantee Agreement, dated as of March 15, 2004, between FPL Group, Inc. (as Guarantor) and The Bank of New York Mellon (as Guarantee Trustee) relating to FPL Group Capital Trust I (filed as Exhibit 4(aw) to Post-Effective Amendment No. 3 to Form S-3, File Nos. 333-102173, 333-102173-01, 333-102173-02 and 333-102173-03)
|
x
|
|
||||
|
*4(t)
|
Amended and Restated Trust Agreement relating to FPL Group Capital Trust I, dated as of March 15, 2004 (filed as Exhibit 4(at) to Post-Effective Amendment No. 3 to Form S-3, File Nos. 333-102173, 333-102173-01, 333-102173-02 and 333-102173-03)
|
x
|
|
||||
|
*4(u)
|
Agreement as to Expenses and Liabilities of FPL Group Capital Trust I, dated as of March 15, 2004 (filed as Exhibit 4(ax) to Post-Effective Amendment No. 3 to Form S-3, File Nos. 333-102173, 333-102173-01, 333-102173-02 and 333-102173-03)
|
x
|
|
||||
128
|
Exhibit
Number
|
Description
|
NEE
|
FPL
|
||||
|
*4(v)
|
Officer's Certificate of FPL Group Capital Inc and FPL Group, Inc., dated March 15, 2004, creating the 5 7/8% Junior Subordinated Debentures, Series due March 15, 2044 (filed as Exhibit 4(av) to Post-Effective Amendment No. 3 to Form S-3, File Nos. 333-102173, 333-102173-01, 333-102173-02 and 333-102173-03)
|
x
|
|
||||
|
*4(w)
|
Indenture (For Unsecured Subordinated Debt Securities), dated as of September 1, 2006, among FPL Group Capital Inc, FPL Group, Inc. (as Guarantor) and The Bank of New York Mellon (as Trustee) (filed as Exhibit 4(a) to Form 8-K dated September 19, 2006, File No. 1-8841)
|
x
|
|
||||
|
*4(x)
|
First Supplemental Indenture to Indenture (For Unsecured Debt Securities) dated as of September 1, 2006, dated as of November 19, 2012, between NextEra Energy Capital Holdings, Inc., NextEra Energy, Inc. as Guarantor, and The Bank of New York Mellon, as Trustee (filed as Exhibit 2 to Form 8-A dated January 16, 2013, File No. 1-33028)
|
x
|
|||||
|
*4(y)
|
Officer's Certificate of FPL Group Capital Inc and FPL Group, Inc., dated September 19, 2006, creating the Series B Enhanced Junior Subordinated Debentures due 2066 (filed as Exhibit 4(c) to Form 8-K dated September 19, 2006, File No. 1-8841)
|
x
|
|||||
|
*4(z)
|
Replacement Capital Covenant, dated September 19, 2006, by FPL Group Capital Inc and FPL Group, Inc. relating to FPL Group Capital Inc's Series B Enhanced Junior Subordinated Debentures due 2066 (filed as Exhibit 4(d) to Form 8-K dated September 19, 2006, File No. 1-8841)
|
x
|
|||||
|
*4(aa)
|
Officer's Certificate of FPL Group Capital Inc and FPL Group, Inc., dated June 12, 2007, creating the Series C Junior Subordinated Debentures due 2067 (filed as Exhibit 4(a) to Form 8-K dated June 12, 2007, File No. 1-8841)
|
x
|
|||||
|
*4(bb)
|
Replacement Capital Covenant, dated June 12, 2007, by FPL Group Capital Inc and FPL Group, Inc. relating to FPL Group Capital Inc's Series C Junior Subordinated Debentures due 2067 (filed as Exhibit 4(b) to Form 8-K dated June 12, 2007, File No. 1-8841)
|
x
|
|
||||
|
*4(cc)
|
Officer's Certificate of FPL Group Capital Inc and FPL Group, Inc., dated September 17, 2007, creating the Series D Junior Subordinated Debentures due 2067 (filed as Exhibit 4(a) to Form 8-K dated September 17, 2007, File No. 1-8841)
|
x
|
|
||||
|
*4(dd)
|
Replacement Capital Covenant, dated September 18, 2007, by FPL Group Capital Inc and FPL Group, Inc. relating to FPL Group Capital Inc's Series D Junior Subordinated Debentures due 2067 (filed as Exhibit 4(c) to Form 8-K dated September 17, 2007, File No. 1-8841)
|
x
|
|
||||
|
*4(ee)
|
Officer's Certificate of NextEra Energy Capital Holdings, Inc. and NextEra Energy, Inc., dated March 27, 2012, creating the Series G Junior Subordinated Debentures due March 1, 2072 (filed as Exhibit 4 to Form 8-K dated March 27, 2012, File No. 1-8841)
|
x
|
|||||
|
*4(ff)
|
Officer's Certificate of NextEra Energy Capital Holdings, Inc. and NextEra Energy, Inc., dated June 15, 2012, creating the Series H Junior Subordinated Debentures due June 15, 2072 (filed as Exhibit 4 to Form 8-K dated June 15, 2012, File No. 1-8841)
|
x
|
|||||
|
*4(gg)
|
Officer's Certificate of NextEra Energy Capital Holdings, Inc. and NextEra Energy, Inc., dated November 19, 2012, creating the Series I Junior Subordinated Debentures due November 15, 2072 (filed as Exhibit 4 to Form 8-K dated November 19, 2012, File No. 1-8841)
|
x
|
|||||
|
*4(hh)
|
Officer's Certificate of NextEra Energy Capital Holdings, Inc. and NextEra Energy, Inc., dated January 18, 2013, creating the Series J Junior Subordinated Debentures due January 15, 2073 (filed as Exhibit 4 to Form 8-K dated January 18, 2013, File No. 1-8841)
|
x
|
|||||
|
*4(ii)
|
Indenture (For Securing Senior Secured Bonds, Series A), dated May 22, 2007, between FPL Recovery Funding LLC (as Issuer) and The Bank of New York Mellon (as Trustee and Securities Intermediary) (filed as Exhibit 4.1 to Form 8-K dated May 22, 2007 and filed June 1, 2007, File No. 333-141357)
|
|
x
|
||||
|
*4(jj)
|
Purchase Contract Agreement dated as of May 1, 2012, between NextEra Energy, Inc. and The Bank of New York Mellon, as Purchase Contract Agent (filed as Exhibit 4(a) to Form 8-K dated May 4, 2012, File No. 1-8841)
|
x
|
|||||
129
|
Exhibit
Number
|
Description
|
NEE
|
FPL
|
||||
|
*4(kk)
|
Pledge Agreement, dated as of May 1, 2012, between NextEra Energy, Inc., Deutsche Bank Trust Company Americas, as Collateral Agent, Custodial Agent and Securities Intermediary, and The Bank of New York Mellon, as Purchase Contract Agent (filed as Exhibit 4(b) to Form 8-K dated May 4, 2012, File No. 1-8841)
|
x
|
|||||
|
*4(ll)
|
Purchase Contract Agreement dated as of September 1, 2012, between NextEra Energy, Inc. and The Bank of New York Mellon, as Purchase Contract Agent (filed as Exhibit 4(a) to Form 8-K dated September 11, 2012, File No. 1-8841)
|
x
|
|||||
|
*4(mm)
|
Pledge Agreement, dated as of September 1, 2012, between NextEra Energy, Inc., Deutsche Bank Trust Company Americas, as Collateral Agent, Custodial Agent and Securities Intermediary, and The Bank of New York Mellon, as Purchase Contract Agent (filed as Exhibit 4(b) to Form 8-K dated September 11, 2012, File No. 1-8841)
|
x
|
|||||
|
*4(nn)
|
Purchase Contract Agreement, dated as of September 1, 2013, between NextEra Energy, Inc. and The Bank of New York Mellon, as Purchase Contract Agent (filed as Exhibit 4(a) to Form 8-K dated September 25, 2013, File No. 1-8841)
|
x
|
|||||
|
*4(oo)
|
Pledge Agreement, dated as of September 1, 2013, between NextEra Energy, Inc., Deutsche Bank Trust Company Americas, as Collateral Agent, Custodial Agent and Securities Intermediary, and The Bank of New York Mellon, as Purchase Contract Agent (filed as Exhibit 4(b) to Form 8-K dated September 25, 2013, File No. 1-8841)
|
x
|
|||||
|
*10(a)
|
FPL Group, Inc. Supplemental Executive Retirement Plan, amended and restated effective April 1, 1997 (SERP) (filed as Exhibit 10(a) to Form 10-K for the year ended December 31, 1999, File No. 1-8841)
|
x
|
x
|
||||
|
*10(b)
|
FPL Group, Inc. Supplemental Executive Retirement Plan, amended and restated effective January 1, 2005 (Restated SERP) (filed as Exhibit 10(b) to Form 8-K dated December 12, 2008, File No. 1-8841)
|
x
|
x
|
||||
|
*10(c)
|
Amendment Number 1 to the Restated SERP changing name to NextEra Energy, Inc. Supplemental Executive Retirement Plan (filed as Exhibit 10(b) to Form 10-Q for the quarter ended June 30, 2010, File No. 1-8841)
|
x
|
x
|
||||
|
*10(d)
|
Appendix A1 (revised as of December 1, 2012) to the Restated SERP filed as Exhibit 10(f) to Form 10-K for the year ended December 31, 2012, File No. 1-8841)
|
x
|
x
|
||||
|
*10(e)
|
Appendix A2 (revised as of December 12, 2013) to the Restated SERP (filed as Exhibit 10(e) to Form 10-K dated December 31, 2013, File No.1-8841)
|
x
|
x
|
||||
|
*10(f)
|
Amended and Restated Supplement to the Restated SERP as it applies to Lewis Hay, III effective January 1, 2005 (filed as Exhibit 10(c) to Form 8-K dated December 12, 2008, File No. 1-8841)
|
x
|
x
|
||||
|
*10(g)
|
Supplement to the SERP as it applies to Lewis Hay, III effective March 22, 2002 (filed as Exhibit 10(g) to Form 10-K for the year ended December 31, 2001, File No. 1-8841)
|
x
|
x
|
||||
|
*10(h)
|
Supplement to the Restated SERP relating to a special credit to certain executive officers and other officers effective February 15, 2008 (filed as Exhibit 10(g) to Form 10-K for the year ended December 31, 2007, File No. 1-8841)
|
x
|
x
|
||||
|
*10(i)
|
Supplement to the Restated SERP effective February 15, 2008 as it applies to Armando Pimentel, Jr. (filed as Exhibit 10(i) to Form 10-K for the year ended December 31, 2007, File No. 1-8841)
|
x
|
x
|
||||
|
*10(j)
|
Supplement to the SERP effective December 14, 2007 as it applies to Manoochehr K. Nazar (filed as Exhibit 10(j) to Form 10-K for the year ended December 31, 2009, File No. 1-8841)
|
x
|
x
|
||||
|
*10(k)
|
FPL Group, Inc. Long-Term Incentive Plan of 1985, as amended (filed as Exhibit 99(h) to Post-Effective Amendment No. 5 to Form S-8, File No. 33-18669)
|
x
|
x
|
||||
|
*10(l)
|
NextEra Energy, Inc. (formerly known as FPL Group, Inc.) Amended and Restated Long-Term Incentive Plan, most recently amended and restated on May 22, 2009 (filed as Exhibit 10(a) to Form 10-Q for the quarter ended June 30, 2009, File No. 1-8841)
|
x
|
x
|
||||
|
*10(m)
|
NextEra Energy, Inc. Amended and Restated 2011 Long Term Incentive Plan (filed as Exhibit 10(c) to Form 8-K dated March 16, 2012, File No. 1-8841)
|
x
|
x
|
||||
|
*10(n)
|
Form of NextEra Energy, Inc. Amended and Restated Long-Term Incentive Plan Performance Share Award Agreement effective February 18, 2011 (filed as Exhibit 10(b) to Form 10-Q for the quarter ended March 31, 2011, File No. 1-8841)
|
x
|
x
|
||||
130
|
Exhibit
Number
|
Description
|
NEE
|
FPL
|
||||
|
*10(o)
|
Form of Performance Share Award Agreement under the NextEra Energy, Inc. 2011 Long Term Incentive Plan (filed as Exhibit 10(a) to Form 8-K dated October 13, 2011, File No. 1-8841)
|
x
|
x
|
||||
|
*10(p)
|
Form of Performance Share Award Agreement under the NextEra Energy, Inc. Amended and Restated 2011 Long Term Incentive Plan, as revised March 16, 2012 (filed as Exhibit 10(c) to Form 10-Q for the quarter ended March 31, 2012)
|
x
|
x
|
||||
|
*10(q)
|
Form of Performance Share Award Agreement under the NextEra Energy, Inc. Amended and Restated 2011 Long Term Incentive Plan for certain executive officers (filed as Exhibit 10(a) to Form 8-K dated October 11, 2012)
|
x
|
x
|
||||
|
*10(r)
|
Form of FPL Group, Inc. Amended and Restated Long-Term Incentive Plan Restricted Stock Award Agreement effective February 13, 2009 (filed as Exhibit 10(q) to Form 10-K for the year ended December 31, 2008, File No. 1-8841)
|
x
|
x
|
||||
|
*10(s)
|
Form of NextEra Energy, Inc. Amended and Restated Long-Term Incentive Plan Restricted Stock Award Agreement effective February 18, 2011 (filed as Exhibit 10(c) to Form 10-Q for the quarter ended March 31, 2011, File No. 1-8841)
|
x
|
x
|
||||
|
*10(t)
|
Form of Restricted Stock Award Agreement under the NextEra Energy, Inc. 2011 Long Term Incentive Plan (filed as Exhibit 10(c) to Form 8-K dated October 13, 2011, File No. 1-8841)
|
x
|
x
|
||||
|
*10(u)
|
Form of Restricted Stock Award Agreement under the NextEra Energy, Inc. Amended and Restated 2011 Long Term Incentive Plan for certain executive officers (filed as Exhibit 10(b) to Form 8-K dated October 11, 2012)
|
x
|
x
|
||||
|
*10(v)
|
Form of FPL Group, Inc. Amended and Restated Long-Term Incentive Plan Stock Option Award - Non-Qualified Stock Option Agreement (filed as Exhibit 10(c) to Form 8-K dated December 29, 2004, File No. 1-8841)
|
x
|
x
|
||||
|
*10(w)
|
Form of FPL Group, Inc. Amended and Restated Long-Term Incentive Plan Stock Option Award - Non-Qualified Stock Option Agreement (filed as Exhibit 10(d) to Form 8-K dated December 29, 2004, File No. 1-8841)
|
x
|
x
|
||||
|
*10(x)
|
Form of FPL Group, Inc. Amended and Restated Long-Term Incentive Plan Stock Option Award - Non-Qualified Stock Option Agreement effective February 15, 2008 (filed as Exhibit 10(b) to Form 8-K dated February 15, 2008, File No. 1-8841)
|
x
|
x
|
||||
|
*10(y)
|
Form of FPL Group, Inc. Amended and Restated Long-Term Incentive Plan Stock Option Award - Non-Qualified Stock Option Agreement effective February 13, 2009 (filed as Exhibit 10(u) to Form 10-K for the year ended December 31, 2008, File No. 1-8841)
|
x
|
x
|
||||
|
*10(z)
|
Form of FPL Group, Inc. Amended and Restated Long-Term Incentive Plan - Non-Qualified Stock Option Agreement effective February 12, 2010 (filed as Exhibit 10(bb) to Form 10-K for the year December 31, 2009, File No. 1-8841)
|
x
|
x
|
||||
|
*10(aa)
|
Form of NextEra Energy, Inc. Amended and Restated Long-Term Incentive Plan - Non-Qualified Stock Option Agreement effective February 18, 2011 (filed as Exhibit 10(d) to Form 10-Q for the quarter ended March 31, 2011, File No. 1-8841)
|
x
|
x
|
||||
|
*10(bb)
|
Form of Non-Qualified Stock Option Award Agreement under the NextEra Energy, Inc. 2011 Long Term Incentive Plan (filed as Exhibit 10(b) to Form 8-K dated October 13, 2011, File No. 1-8841)
|
x
|
x
|
||||
|
*10(cc)
|
Form of FPL Group, Inc. Amended and Restated Long-Term Incentive Plan Amended and Restated Deferred Stock Award Agreement effective February 12, 2010 between FPL Group, Inc. and each of Moray P. Dewhurst and James L. Robo (filed as Exhibit 10(dd) to Form 10-K for the year ended December 31, 2009, File No. 1-8841)
|
x
|
x
|
||||
|
*10(dd)
|
Form of Deferred Stock Award Agreement under NextEra Energy, Inc. Amended and Restated 2011 Long Term Incentive Plan (filed as Exhibit 10(a) to Form 8-K dated March 16, 2012, File No. 1-8841)
|
x
|
x
|
||||
|
*10(ee)
|
NextEra Energy, Inc. 2013 Executive Annual Incentive Plan (filed as Exhibit 10(c) to Form 8-K dated October 11, 2012, File No. 1-8841)
|
x
|
x
|
||||
|
*10(ff)
|
NextEra Energy, Inc. Deferred Compensation Plan effective January 1, 2005 as amended and restated through October 15, 2010 (filed as Exhibit 10(dd) to Form 10-K for the year ended December 31, 2010, File No. 1-8841)
|
x
|
x
|
||||
131
|
Exhibit
Number
|
Description
|
NEE
|
FPL
|
||||
|
*10(gg)
|
Amendment 1 (effective May 25, 2011) to the NextEra Energy, Inc. Deferred Compensation Plan effective January 1, 2005, as amended and restated through October 15, 2010 (filed as Exhibit 10(b) to Form 10-Q for the quarter ended June 30, 2011, File No. 1-8841)
|
x
|
x
|
||||
|
*10(hh)
|
Amendment 2 (effective November 16, 2011) to the NextEra Energy, Inc. Deferred Compensation Plan effective January 1, 2005, as amended and restated through October 15, 2010 (filed as Exhibit 10(ll) to Form 10-K for the year ended December 31, 2011, File No. 1-8841)
|
x
|
x
|
||||
|
*10(ii)
|
FPL Group, Inc. Deferred Compensation Plan, amended and restated effective January 1, 2003 (filed as Exhibit 10(k) to Form 10-K for the year ended December 31, 2002, File No. 1-8841)
|
x
|
x
|
||||
|
*10(jj)
|
FPL Group, Inc. Executive Long-Term Disability Plan effective January 1, 1995 (filed as Exhibit 10(g) to Form 10-K for the year ended December 31, 1995, File No. 1-8841)
|
x
|
x
|
||||
|
*10(kk)
|
FPL Group, Inc. Amended and Restated Non-Employee Directors Stock Plan, as amended and restated October 13, 2006 (filed as Exhibit 10(b) to Form 10-Q for the quarter ended September 30, 2006, File No. 1-8841)
|
x
|
|
||||
|
*10(ll)
|
FPL Group, Inc. 2007 Non-Employee Directors Stock Plan (filed as Exhibit 99 to Form S-8, File No. 333-143739)
|
x
|
|
||||
|
*10(mm)
|
NextEra Energy, Inc. Non-Employee Director Compensation Summary effective January 1, 2014 (filed as Exhibit 10(oo) to Form 10-K for the year ended December 31, 2013, File No. 1-8841)
|
x
|
|||||
|
10(nn)
|
NextEra Energy, Inc. Non-Employee Director Compensation Summary effective January 1, 2015
|
x
|
|||||
|
*10(oo)
|
Form of Amended and Restated Executive Retention Employment Agreement effective December 10, 2009 between FPL Group, Inc. and each of Moray P. Dewhurst, James L. Robo, Armando Pimentel, Jr., and Charles E. Sieving (filed as Exhibit 10(nn) to Form 10-K for the year ended December 31, 2009, File No. 1-8841)
|
x
|
x
|
||||
|
*10(pp)
|
Amended and Restated Employment Letter with Lewis Hay, III dated December 10, 2009 (filed as Exhibit 10(pp) to Form 10-K for the year ended December 31, 2009, File No. 1-8841)
|
x
|
x
|
||||
|
*10(qq)
|
409A Amendment dated October 12, 2012 to Amended and Restated Employment Letter between Lewis Hay, III and NextEra Energy, Inc. (filed as Exhibit 10(ww) to Form 10-K for the year ended December 31, 2012, File No. 1-8841)
|
x
|
x
|
||||
|
*10(rr)
|
Executive Retention Employment Agreement between FPL Group, Inc. and Joseph T. Kelliher dated as of May 21, 2009 (filed as Exhibit 10(b) to Form 10-Q for the quarter ended June 30, 2009, File No. 1-8841)
|
x
|
x
|
||||
|
*10(ss)
|
Executive Retention Employment Agreement between FPL Group, Inc. and Manoochehr K. Nazar dated as of January 1, 2010 (filed as Exhibit 10(rr) to Form 10‑K for the year ended December 31, 2009, File No. 1-8841)
|
x
|
x
|
||||
|
*10(tt)
|
Executive Retention Employment Agreement between NextEra Energy, Inc. and Eric E. Silagy dated as of May 2, 2012 (filed as Exhibit 10(b) to Form 10-Q for the quarter ended June 30, 2012, File No. 1-8841)
|
x
|
x
|
||||
|
*10(uu)
|
Executive Retention Employment Agreement between NextEra Energy, Inc. and William L. Yeager dated as of January 1, 2013 (filed as Exhibit 10(ccc) to Form 10-K for the year ended December 31, 2012, File No. 1-8841)
|
x
|
x
|
||||
|
*10(vv)
|
Form of 2012 409A Amendment to NextEra Energy, Inc. Executive Retention Employment Agreement effective October 11, 2012 between NextEra Energy, Inc. and each of James L. Robo, Moray P. Dewhurst, Armando Pimentel, Jr., Eric E. Silagy, Joseph T. Kelliher, Manoochehr K. Nazar and Charles E. Sieving (filed as Exhibit 10(ddd) to Form 10-K for the year ended December 31, 2012, File No. 1-8841)
|
x
|
x
|
||||
|
*10(ww)
|
Executive Retention Employment Agreement between NextEra Energy, Inc. and Deborah H. Caplan dated as of April 23, 2013 (filed as Exhibit 10(e) to Form 10-Q for the quarter ended June 30, 2013, File No. 1-8841)
|
x
|
x
|
||||
|
*10(xx)
|
Executive Retention Employment Agreement between NextEra Energy, Inc. and Miguel Arechabala dated as of January 1, 2014 (filed as Exhibit 10(bbb) to Form 10‑K for the year ended December 31, 2013, File No. 1-8841)
|
x
|
x
|
||||
132
|
Exhibit
Number
|
Description
|
NEE
|
FPL
|
||||
|
*10(yy)
|
NextEra Energy, Inc. Executive Severance Benefit Plan effective February 26, 2013 (filed as Exhibit 10(eee) to Form 10-K for the year ended December 31, 2012, File No. 1-8841)
|
x
|
x
|
||||
|
*10(zz)
|
Guarantee Agreement between FPL Group, Inc. and FPL Group Capital Inc, dated as of October 14, 1998 (filed as Exhibit 10(y) to Form 10-K for the year ended December 31, 2001, File No. 1-8841)
|
x
|
|
||||
|
12(a)
|
Computation of Ratios
|
x
|
|
||||
|
12(b)
|
Computation of Ratios
|
|
x
|
||||
|
21
|
Subsidiaries of NextEra Energy, Inc.
|
x
|
|
||||
|
23
|
Consent of Independent Registered Public Accounting Firm
|
x
|
x
|
||||
|
31(a)
|
Rule 13a-14(a)/15d-14(a) Certification of Chief Executive Officer of NextEra Energy, Inc.
|
x
|
|
||||
|
31(b)
|
Rule 13a-14(a)/15d-14(a) Certification of Chief Financial Officer of NextEra Energy, Inc.
|
x
|
|||||
|
31(c)
|
Rule 13a-14(a)/15d-14(a) Certification of Chief Executive Officer of Florida Power & Light Company
|
x
|
|||||
|
31(d)
|
Rule 13a-14(a)/15d-14(a) Certification of Chief Financial Officer of Florida Power & Light Company
|
x
|
|||||
|
32(a)
|
Section 1350 Certification of NextEra Energy, Inc.
|
x
|
|||||
|
32(b)
|
Section 1350 Certification of Florida Power & Light Company
|
x
|
|||||
|
101.INS
|
XBRL Instance Document
|
x
|
x
|
||||
|
101.SCH
|
XBRL Schema Document
|
x
|
x
|
||||
|
101.PRE
|
XBRL Presentation Linkbase Document
|
x
|
x
|
||||
|
101.CAL
|
XBRL Calculation Linkbase Document
|
x
|
x
|
||||
|
101.LAB
|
XBRL Label Linkbase Document
|
x
|
x
|
||||
|
101.DEF
|
XBRL Definition Linkbase Document
|
x
|
x
|
||||
______________________
* Incorporated herein by reference
NEE and FPL agree to furnish to the SEC upon request any instrument with respect to long-term debt that NEE and FPL have not filed as an exhibit pursuant to the exemption provided by Item 601(b)(4)(iii)(A) of Regulation S-K.
133
NEXTERA ENERGY, INC. SIGNATURES
Pursuant to the requirements of Section 13 or 15(d) of the Securities Exchange Act of 1934, the registrant has duly caused this report to be signed on its behalf by the undersigned, thereunto duly authorized and in the capacities and on the date indicated.
NextEra Energy, Inc.
|
JAMES L. ROBO
|
|
James L. Robo
Chairman, President and Chief Executive Officer and Director
(Principal Executive Officer)
|
Date:
February 20, 2015
Pursuant to the requirements of the Securities Exchange Act of 1934, this report has been signed below by the following persons on behalf of the registrant and in the capacities and on the date indicated.
Signature and Title as of
February 20, 2015
:
|
MORAY P. DEWHURST
|
|
CHRIS N. FROGGATT
|
|
Moray P. Dewhurst
Vice Chairman and Chief Financial Officer,
and Executive Vice President - Finance
(Principal Financial Officer)
|
|
Chris N. Froggatt
Vice President, Controller and Chief Accounting
Officer
(Principal Accounting Officer)
|
Directors:
|
SHERRY S. BARRAT
|
|
TONI JENNINGS
|
|
Sherry S. Barrat
|
|
Toni Jennings
|
|
ROBERT M. BEALL, II
|
|
AMY B. LANE
|
|
Robert M. Beall, II
|
|
Amy B. Lane
|
|
JAMES L. CAMAREN
|
|
RUDY E. SCHUPP
|
|
James L. Camaren
|
|
Rudy E. Schupp
|
|
KENNETH B. DUNN
|
|
JOHN L. SKOLDS
|
|
Kenneth B. Dunn
|
|
John L. Skolds
|
|
NAREN K. GURSAHANEY
|
|
WILLIAM H. SWANSON
|
|
Naren K. Gursahaney
|
|
William H. Swanson
|
|
KIRK S. HACHIGIAN
|
HANSEL E. TOOKES, II
|
|
|
Kirk S. Hachigian
|
Hansel E. Tookes, II
|
|
134
FLORIDA POWER & LIGHT COMPANY SIGNATURES
Pursuant to the requirements of Section 13 or 15(d) of the Securities Exchange Act of 1934, the registrant has duly caused this report to be signed on its behalf by the undersigned, thereunto duly authorized and in the capacities and on the date indicated.
Florida Power & Light Company
|
ERIC E. SILAGY
|
|
Eric E. Silagy
President and Chief Executive Officer and Director
(Principal Executive Officer)
|
Date:
February 20, 2015
Pursuant to the requirements of the Securities Exchange Act of 1934, this report has been signed below by the following persons on behalf of the registrant and in the capacities and on the date indicated.
Signature and Title as of
February 20, 2015
:
|
MORAY P. DEWHURST
|
|
KIMBERLY OUSDAHL
|
|
Moray P. Dewhurst
Executive Vice President, Finance
and Chief Financial Officer and Director
(Principal Financial Officer)
|
|
Kimberly Ousdahl
Vice President, Controller and Chief Accounting Officer
(Principal Accounting Officer)
|
Director:
|
JAMES L. ROBO
|
|
James L. Robo
|
135
Supplemental Information to be Furnished With Reports Filed Pursuant to Section 15(d) of the Securities Exchange Act of 1934 by Registrants Which Have Not Registered Securities Pursuant to Section 12 of the Securities Exchange Act of 1934
No annual report, proxy statement, form of proxy or other proxy soliciting material has been sent to security holders of FPL during the period covered by this Annual Report on Form 10-K for the fiscal year ended
December 31, 2014
.
136
TABLE OF CONTENTS
Part IItem 1. BusinessItem 1A. Risk FactorsItem 1B. Unresolved Staff CommentsItem 2. PropertiesItem 3. Legal ProceedingsItem 4. Mine Safety DisclosuresPart IIItem 5. Market For Registrants' Common Equity, Related Stockholder Matters and Issuer Purchases Of Equity SecuritiesItem 6. Selected Financial DataItem 7. Management S Discussion and Analysis Of Financial Condition and Results Of OperationsItem 7A. Quantitative and Qualitative Disclosures About Market RiskItem 8. Financial Statements and Supplementary DataItem 9. Changes in and Disagreements with Accountants on Accounting and Financial DisclosureItem 9A. Controls and ProceduresItem 9B. Other InformationPart IIIItem 10. Directors, Executive Officers and Corporate GovernanceItem 11. Executive CompensationItem 12. Security Ownership Of Certain Beneficial Owners and Management and Related Stockholder MattersItem 13. Certain Relationships and Related Transactions, and Director IndependenceItem 14. Principal Accounting Fees and ServicesPart IVItem 15. Exhibits, Financial Statement Schedules