NEWTEK BUSINESS SERVICES CORP.
10-Ks and 10-Qs
|
|
|
|
|
|
|
|
|
|
|
|
|
|
|
|
|
|
|
|
|
|
|
|
|
|
|
|
|
|
|
|
|
|
|
|
|
|
|
|
|
|
|
|
|
|
|
|
|
|
|
|
|
|
|
|
|
|
|
|
|
|
|
|
|
UNITED STATES
SECURITIES AND EXCHANGE COMMISSION
Washington, D.C. 20549
____________________________________________
FORM 10-K
____________________________________________
ANNUAL REPORT PURSUANT TO SECTION 13 OR 15(d)
OF THE SECURITIES EXCHANGE ACT OF 1934
For the fiscal year ended
December 31, 2014
Commission file number: 814-01035
____________________________________________
NEWTEK BUSINESS SERVICES CORP.
____________________________________________
|
Maryland
|
46-3755188
|
|
|
(State or other jurisdiction of
incorporation or organization)
|
(I.R.S. Employer
Identification No.)
|
|
|
212 West 35
th
Street, 2
nd
Floor New York, New York
|
10001
|
|
|
(Address of principal executive offices)
|
(Zip Code)
|
|
Registrant’s telephone number, including area code: (212) 356-9500
____________________________________________
Securities Registered Pursuant to Section 12(b) of the Act:
|
|
Name of Each Exchange
|
|
Title of Each Class
|
on Which Registered
|
|
|
|
|
Common Stock, par value $0.02 per share
|
NASDAQ Capital Market
|
Securities Registered Pursuant to Section 12(g) of the Act: None
____________________________________________
Indicate by check mark if the registrant is a well-known seasoned issuer, as defined in Rule 405 of the Securities Act. Yes
¨
No
x
Indicate by check mark if the registrant is not required to file reports pursuant to Section 13 or Section 15(d) of the Act. Yes
¨
No
x
Indicate by check mark whether the registrant: (1) has filed all reports required to be filed by Section 13 or 15(d) of the Securities Exchange Act of 1934 during the past 12 months (or for such shorter period that the registrant was required to file such reports) and (2) has been subject to such filing requirements for the past 90 days. Yes
x
No
¨
Indicate by check mark whether the registrant has submitted electronically and posted on its corporate website, if any, every Interactive Data File required to be submitted and posted pursuant to Rule 405 of Regulation S-T (Section 232.405 of this chapter) during the preceding 12 months (or for such shorter period that the registrant was required to submit and post such files). Yes
x
No
¨
Indicate by check mark if disclosure of delinquent filers pursuant to Item 405 of Regulation S-K (Section 229.405 of this chapter) is not contained herein, and will not be contained, to the best of registrant’s knowledge, in definitive proxy or information statements incorporated by reference in Part III of this Form 10-K or any amendment to this Form 10-K.
x
Indicate by check mark whether the registrant is a large accelerated filer, an accelerated filer, a non-accelerated filer, or a smaller reporting company (all as defined in Rule 12b-2 of the Exchange Act).
|
Large accelerated filer
|
¨
|
Accelerated filer
|
¨
|
||
|
Non-accelerated filer
|
x
|
Smaller reporting company
|
¨
|
||
Indicate by check mark whether the registrant is a shell company (as defined in Rule 12b-2 of the Exchange Act). Yes
¨
No
x
The aggregate market value of the voting and non-voting common equity held by non-affiliates of the registrant was approximately $71,516,000 as of the last business day of the registrant’s second fiscal quarter of
2014
, based on a closing price that date of $13.70. For the purposes of calculating this amount only, all directors and executive officers of the Registrant have been treated as affiliates.
As of
March 27, 2014
there were 10,206,301 shares issued and outstanding of the registrant’s Common Stock, par value $0.02 per share.
DOCUMENTS INCORPORATED BY REFERENCE
Portions of the registrant’s definitive Proxy Statement relating to the registrant’s 2015 Annual Meeting of Stockholders, to be filed with the Securities and Exchange Commission within 120 days following the end of the Company’s fiscal year, are incorporated by reference in Part III of this Annual Report on Form 10-K as indicated herein.
NEWTEK BUSINESS SERVICES CORP.
TABLE OF CONTENTS
|
Item
|
|
Page
|
On November 12, 2014, Newtek Business Services, Inc. merged with and into Newtek Business Services Corp., a newly-formed Maryland corporation, for the purpose of reincorporating in Maryland (the “Merger”), and thereafter filed an election to be regulated as a business development company
(a “BDC”)
under the Investment Company Act of 1940, as amended (referred to herein as the "Conversion" or "BDC Conversion"). All subsidiaries and controlled portfolio companies (as defined below) became the property of Newtek Business Services Corp as part of the Merger. Except as otherwise noted, the terms “we,” “us,” “our,” “Company” and “Newtek” refer to Newtek Business Services, Inc. prior to the Conversion and its successor, Newtek Business Services Corp. following the Conversion.
On October 22, 2014, we effectuated the 1-for- 5 reverse stock split (the “Reverse Stock Split”). On November 18, 2014 we completed an offering of 2,530,000 shares of our common stock at an offering price of $12.50 per share for total gross proceeds of $31,625,000. Unless otherwise indicated, the disclosure in this annual report on Form 10-K gives effect to the Conversion and Reverse Stock Split.
Overview
On November 12, 2014, we completed our conversion to a BDC. We are an internally managed, closed-end, non-diversified management investment company that has elected to be regulated as a BDC under the Investment Company Act of 1940, as amended. In addition, for U.S. federal income tax purposes, we plan to elect to be treated as a regulated investment company ("RIC) under Subchapter M of the Internal Revenue Code of 1986, as amended (the "Code"). As a BDC, we are required to comply with regulatory requirements, including limitations on our use of debt. We are permitted to, and expect to, finance our investments through borrowings. However, as a BDC, we are only generally allowed to borrow amounts such that our asset coverage, as defined in the 1940 Act, equals at least 200% after such borrowing. The amount of leverage that we employ depends on our assessment of market conditions and other factors at the time of any proposed borrowing. As a RIC, we generally will not have to pay corporate-level federal income taxes on any net ordinary income or net short-term capital gains that we distribute to our stockholders if we meet certain source-of-income, distribution, asset diversification and other requirements.
Newtek, “
The Small Business Authority
”
®
, is a leading national lender and owns and controls certain controlled portfolio companies that provide a wide range of business and financial products to the small- and medium-sized business ("SMB") market, which we estimate to be over 27 million businesses in the U.S.. Our website, www.thesba.com, and our heightened branding strategy enable us to offer small businesses the ability to grow and prosper by obtaining from us:
|
•
|
Business Lending:
Business loans for working capital, to acquire or expand a business or for the purchase of machinery and equipment
|
|
•
|
Electronic Payment Processing:
Credit card, debit card, check conversion and ACH processing solutions
|
|
•
|
Ecommerce Services:
Combinations of payment processing, online shopping cart tools, web site design, web hosting and web related services which enable businesses to establish a presence and commercial capability on the Internet in a quick and simple fashion
|
|
•
|
Managed Technology Solutions:
Full service web hosting, including domain registration and online shopping cart tools; cloud computing plans and customized web design and development services
|
|
•
|
The Newtek Advantage™:
A mobile, real-time operating platform for business intelligence putting all critical business transactions in real-time and enabling a business to access data on a smartphone, tablet, laptop or PC for eCommerce, credit/ debit transactions, website statistics, payroll, insurance and business loans.
|
|
•
|
Data Backup, Storage and Retrieval:
Fast, secure, off-site data backup, storage and retrieval
|
|
•
|
Accounts Receivable Financing:
Receivable financing and management services, lines of credit collateralized by receivable accounts
|
|
•
|
Insurance Services:
Nationwide commercial, health and benefits, and personal lines of insurance
|
|
•
|
Payroll:
Payroll management processing and employee tax filing.
|
1
During 2014 we derived revenue through the sale of a business service or product to over 100,000 SMB accounts. We believe these businesses have historically been underserved by traditional financial institutions and typically lack the capital resources to build a competitive business and marketing infrastructure on their own. We use state of the art, web-based proprietary technology to provide low cost products and services to our SMB clients. We are a FinTech company and consider our patented, proprietary NewTracker
®
referral and tracking system, similar to what Salesforce.com does for tracking sales leads. Our Newtracker system tracks business referrals through our entire sales and marketing process for all alliance partners. It is as if we are putting a barcode, like delivery services do for packages, on a business service process. This gives full transparency to referral or alliance partners as to what our business service specialists are doing with their clients 24 hours a day, 7 days per week. This gives alliance partners comfort as to what our processing personnel are doing with their customers. It gives both parties a complete audit trail. It markedly helps manage our staff as “big brother is always watching” and the system measures their competency in real time. We acquire our customers through the use of what we believe is our state of the art, web-based proprietary technology which eliminates the need for paying commission to “feet on the street” sales personnel. In addition, we acquire customers through referrals from alliances with Fortune 500
®
companies, community banks, credit unions and others, all of whom have elected to offer one or more of our business services and financial products rather than try to provide them directly for their customers or members. Our alliance partners have historically interfaced with Newtek through their use of our NewTracker
®
system which enables complete transparency in the referral process. In 2014, we continued our major emphasis on placing resources behind the development of our coordinated marketing and media program focused on our branding strategy, featuring
The Small Business Authority
website, all intended to present the Company to the small, independent business audience as the authoritative presence in the SMB space across many areas of operations.
In today’s economic climate, SMBs have particular difficulty obtaining capital from traditional lending sources. While we do not compete directly with alternative online lenders such as Lending Club, Prosper.com, OnDeck Capital, Inc. and Kabbage Inc., we do provide similar financing solutions as an alternative to traditional lending. We believe there is significant demand for such alternative financing among SMBs. Our lending solutions and our controlled portfolio companies’ outsourced business solutions help clients manage and grow their businesses and compete effectively in today’s marketplace. We obtain our customers through referrals from various business partners, such as banks, insurance companies, credit unions and other affinity groups, as well as through our own direct sales force and advertising campaigns. We source, acquire, and process SMB customers without reliance on high cost sales staff and time consuming application processes, which is highly cost effective as it relies on advanced technology, primarily our proprietary and patented prospect management system, NewTracker®.
In lending, we believe we are a leading capital provider to SMBs and we are currently the largest non-financial institution U.S. Small Business Administration (“SBA”) licensed lender under the federal Section 7(a) loan program based on annual origination volume and the tenth largest in the country as of December 31, 2014. We originate loans through a variety of sourcing channels and, through a rigorous underwriting process, seek to achieve attractive risk-weighted returns. Our multi-faceted relationships with certain borrowers allows us to closely monitor their credit profile and take an active role in managing our investment. Further, our lending capabilities coupled with the broad outsourced business solutions of our controlled portfolio companies creates attractive cross-selling opportunities within our client base. We believe our business model creates powerful network effects which will help drive growth and operating leverage in our business. In addition, our SBA loans are structured so that the government guaranteed portion can be rapidly sold, which, coupled with our historic ability to securitize the unguaranteed portions and assuming the continuation of current market conditions, allows us to quickly recover our principal and earn excess capital on each loan, usually in less than a year. We may in the future determine to retain the government guaranteed or unguaranteed portions of loans pending deployment of excess capital.
Our proprietary and patented technology platform which we make available to our controlled portfolio companies enables them to provide our clients with a real-time management solution that organizes all of a business’s critical transaction and economic, eCommerce and website traffic data on a smartphone, tablet, laptop or personal computer. This technology provides critical consumer and marketing intelligence, including data mining, and provides a range of differentiated solutions and analytical tools that may be easily customized and integrated within their clients’ existing business processes. It also provides clients with seamless connectivity to a payment and managed technology infrastructure that is secure, fully compliant and regularly updated with the latest capabilities, services and functionalities. The platform is highly scalable to facilitate growth and meet the needs of new clients and consists solely of cloud-based offerings.
History
Newtek was formed under the laws of New York as a holding company for several wholly- and majority-owned subsidiaries. We were founded in 1998 to provide debt and equity financing to SMBs. We have since developed our branded line of business and financial products and services for the SMB market. Prior to the Conversion, we had 6 principal subsidiaries, and 30 other minor controlled entities, most of which are direct providers of financial and business services.
2
Newtek Business Services Corp., a Maryland corporation, was formed in August 2013 for the purpose of reincorporating Newtek Business Services, Inc., in the state of Maryland through the Merger. As a result of the Merger, Newtek Business Services Corp assumed all of the assets and liabilities of Newtek Business Services, Inc., and in conjunction with the Merger, shares of the common stock of Newtek Business Services, Inc. were converted into shares of common stock of Newtek Business Services Corp.
Business Strategy
Key elements of our strategy to grow our business are:
|
•
|
Continue to focus our business model to serve the small- and medium-sized business market.
We are focused on developing and marketing business and financial products and services aimed at the SMB market and on developing a recognized brand for independent business owners. Our target market represents a very significant marketplace in the United States based on non-farm private gross domestic product (“GDP”). According to statistics published by the SBA, approximately 51% of the GDP in the United States comes from small businesses and approximately 99% of businesses in the United States which have one or more employees fit into this market segment. Our business model is to get that market to view us as The Small Business Authority
®
and come to depend on us as their source for business and financial services as well as the business information they need. We intend to continue to leverage the Newtek
®
and The Small Business Authority
®
brands, as well as other trademarked name brands, (The Cloud Authority, The Business Authority, The Health Insurance Authority, The IT Authority) as a one-stop-shop provider for the SMB market.
|
|
•
|
Continue to implement a strategy of acquiring customers and processing their business at low cost.
We seek to acquire customers at a low cost through a national strategy centered on our alliance partners, internet marketing, coordinated marketing, social media and our NewTracker technology. Our FinTech approach to acquiring business clients is a key to our success and we believe is a more cost effective acquiring strategy than one used by our industry peers. Our alliance partners use our proprietary NewTracker referral system to refer customers to us for sales and customer tracking and processing. NewTracker distributes the referral to our appropriate business segment or segments for fulfillment while keeping our alliance partners up to date on the customer’s progress in real time with detailed documentation. We use the same proprietary system as our gateway for direct sales through our websites and our BizExec program. In addition, during 2014 we placed significant resources into direct media advertising under the banner of our
The Small Business Authority
mark. This ties together significant national media exposure through television and radio advertising, design and production of our “Small Business Index”™ and “SB Market Sentiment Surveys”™ reflecting our polling and assessment of business conditions for SMBs, the active use of social media marketing, and website (www.thesba.com).
|
|
•
|
Continue to develop our state-of-the-art technology to process business applications and financial transactions.
We and our controlled portfolio companies continue to update our proprietary systems to take advantage of technological advances that provide state of the art enhancements in client service and process controls which lead to lower costs. During 2012 we completed the development of the Newtek Advantage™, our Internet (or cloud) based operating platform, which has a patent pending, to integrate customer reports for all of our business services and those offered by our controlled portfolio companies in a simple, straightforward mobile application accessible by the business in real time and at any time. The current working modules offered by our controlled portfolio companies are payroll, payment processing and web traffic statistics. We and our controlled portfolio companies intend to add insurance, lending and digital financial reports, and digital tax similar to Intuit’s offering through Quickbooks.
|
|
•
|
Continue our focus on the Internet and The Small Business Authority mark.
Our major goal continues to be to focus
the Small Business Authority
branding strategy and to establish thesba.com as the online destination spot for SMBs. Features of thesba.com that have impact on small business owners include:
|
|
•
|
Free monthly newsletters designed and written for independent, small business owners
|
|
•
|
The Small Business Authority Index™
|
|
•
|
The Small Business Authority Market Sentiment Survey
|
|
•
|
Regular news reports and updates about the economy for the small business owner
|
|
•
|
Informative and engaging SB authority informational videos
|
3
|
•
|
Pertinent information on acquiring products and services for independent business owners to prosper
|
|
•
|
Continue to fulfill our obligations under the current Capco programs.
Our emphasis is on continuing our exemplary regulatory compliance program in order to complete successfully the investment cycles for all Capcos. As of December 31, 2014, we have reached the final minimum investment requirements in all Capco programs in which we participated. We believe this ensures that 100% of the tax credits related to the programs are beyond risk of recapture. In addition, as of that date, all of the cash payments required to be made to the investors have been made. As the Capcos reach 100 percent investment we will seek to decertify them as Capcos, liquidate their remaining assets and thereby reduce our operational costs, particularly the legal and accounting costs associated with compliance. Six of our original Capcos have reached this stage.
|
|
•
|
We are adding to our strategy an increased emphasis on outbound telemarketing and data mining.
The business we do with small and medium-sized businesses has enabled us to develop a significant and growing database of customers and we are adding key staff and devoting resources to cross-selling opportunities this presents so we can develop the full potential of our business model.
|
Investment Objectives as a Business Development Company
We target our debt investments, which are principally made through our small business finance platform under the SBA 7(a) program, to produce a coupon rate of prime plus 2.75% which enables us to generate rapid sales of loans in the secondary market, producing gains with a yield on investment in excess of 30%. We typically structure our debt investments with the maximum seniority and collateral along with personal guarantees from portfolio company owners, in many cases collateralized by other assets including real estate. In most cases, our debt investment will be collateralized by a first lien on the assets of the portfolio company and a first or second lien on assets of guarantors, in both cases primarily real estate. All SBA loans are made with personal guarantees from any owner(s) of 20% or more of the portfolio company’s equity.
We typically structure our debt investments to include non-financial covenants that seek to minimize our risk of capital loss such as lien protection and prohibitions against change of control. Our debt investments have strong protections, including default penalties, information rights and, in some cases, board observation rights and affirmative, negative and financial covenants. Debt investments in portfolio companies, including the controlled portfolio companies, have historically and are expected to continue to comprise in excess of 95% of our overall investments in number and dollar volume
.
Equity Investments
While the vast majority of our investments have been structured as debt, we have in the past and expect in the future to make selective equity investments primarily as either strategic investments to enhance the integrated operating businesses or, to a lesser degree, under the Capco programs. For investments in our controlled portfolio companies, we focus more on tailoring them to the long term growth needs of the companies than to immediate return. Our objectives with these companies is to foster the development of the businesses as a part of the integrated operational business of serving the SMB market, so we may reduce the burden on these companies to enable them to grow faster than they would otherwise as another means of supporting their development and that of the integrated whole.
In Capco investments, we often make debt investments in conjunction with being granted equity in the company in the same class of security as the business owner receives upon funding. We generally seek to structure our equity investments to provide us with minority rights provisions and event-driven put rights. We also seek to obtain limited registration rights in connection with these investments, which may include “piggyback” registration rights.
Controlled Portfolio Companies and Principal Business Segments
In addition to our debt investments in portfolio companies, either directly or through our small business finance platform, we also hold controlling interests in certain portfolio companies. Specifically, either directly or through our subsidiaries, we hold a controlling interest in Universal Processing Services of Wisconsin, LLC, d/b/a Newtek Merchant Solutions (“NMS”), CrystalTech Web Hosting, Inc. d/b/a/ Newtek Technology Solutions® (“NTS”), CDS Business Services, Inc. d/b/a Newtek Business Credit (“NBC”); Newtek Insurance Agency, LLC (“NIA”); and PMTWorks Payroll, LLC, d/b/a Newtek Payroll Services (“NPS”). We refer to these entities, collectively, as our “controlled portfolio companies.” Our controlled portfolio companies provide us with an extensive network of business relationships that supplement our referral sources and that we believe will help us to maintain a robust pipeline of lending opportunities and expand our small business finance platform.
4
|
•
|
NMS, our “Electronic payment processing” segment, markets credit and debit card processing services, check approval services and ancillary processing equipment and software to merchants who accept credit cards, debit cards, checks and other non-cash forms of payment. As of December 31, 2014, NMS provided services to approximately 15,000 merchants. NMS’s merchant base consists of both eCommerce and brick-and-mortar clients and is principally focused on the SMB market, a segment that offers relatively attractive pricing margins and has been difficult for competitors to penetrate.
|
|
•
|
NTS, our “Managed technology solutions” segment, provides website hosting, dedicated server hosting, cloud hosting, web design and development, internet marketing, e-commerce, data storage and backup, and other related services to more than 106,000 business and customer accounts in 162 countries.
|
|
•
|
NIA serves as a retail and wholesale insurance agency specializing in the sale of commercial and health/benefits lines insurance products to the SMB market as well as various personal lines of insurance. NIA is licensed in all 50 states.
|
|
•
|
NPS offers an array of industry standard and competitively priced payroll management, payment and tax reporting services to SMBs.
|
|
•
|
NBC is a portion of our small business finance segment, offers traditional factoring and receivables purchase services to SMBs as well as back office services such as billing and cash collections.
|
Our controlled portfolio companies combined with our lending platform provide us with a network of business relationships that allows us to cross-sell our financing options and further establishes us as a “one-stop-shop” for SMBs
The revenues that our controlled portfolio companies generate, after deducting operational expenses, may be distributed to us. As a BDC, our board of directors will determine quarterly the fair value of our controlled portfolio companies in a similar manner as our other investments. In particular, our investments in our controlled portfolio companies are valued using a valuation methodology that incorporates both the market approach (public comparable company analysis) and the income approach (discounted cash flow analysis). In following these approaches, factors that we may take into account in fair value pricing our investments include, as relevant: available current market data, including relevant and applicable market trading comparables, the portfolio company’s earnings and discounted cash flows, comparisons of financial ratios of peer companies that are public, and enterprise values, among other factors.
Overview
The Company’s principal business segments prior to the BDC Conversion, operated in a coordinated manner in order to provide business and financial services to the SMB market, were:
Small Business Finance:
This segment is comprised of Newtek Small Business Finance, LLC (“NSBF”), a subsidiary which is a nationally licensed, SBA 7(a) lender that originates, sells and services loans to qualifying small businesses, which are partially guaranteed by the SBA, and CDS Business Services, Inc. d/b/a Newtek Business Credit (NBC), which provides receivable financing, revolving lines of credit and billing management services. An additional subsidiary, Small Business Lending, Inc., is a lender service provider for third-parties that primarily services government guaranteed SBA loans and other government guaranteed loans.
Electronic Payment Processing:
Marketing third party credit card processing and check approval services to the SMB market under the name of Newtek Merchant Solutions.
Managed Technology Solutions:
Offers shared and dedicated web hosting, data storage and backup services, cloud computing plans and related services to the small- and medium-sized business market.
All Other:
Businesses formed from investments made through Capco programs and others which cannot be aggregated with other operating segments, including NIA and payroll processing (PMT).
Corporate Activities:
Corporate implements business strategy, directs marketing, provides technology oversight and guidance, coordinates and integrates activities of the segments, contracts with alliance partners, acquires customer opportunities and owns our proprietary NewTracker referral system. This segment includes revenue and expenses not allocated to other segments, including interest income, Capco management fee income and corporate operations expenses.
5
Capcos:
Twelve certified capital companies which invest in SMBs. The Capcos generate non-cash income from tax credits and non-cash interest and insurance expenses in addition to cash management fees and expenses.
Financial information for each segment prior to the Conversion can be found in Management’s Discussion and Analysis of Results of Operations and Financial Condition, Segment Results and Note 26-Segment Reporting to the Consolidated Financial Statements, below.
Small Business Finance
We originate SBA loans and offer accounts receivable financing and other lending products essential for SMBs. In addition, we provide small business loan servicing and consulting to the Federal Deposit Insurance Corporation (“FDIC”) and to numerous other financial institutions.
Newtek Small Business Finance, LLC (NSBF), a subsidiary which specializes in originating, servicing and selling small business loans guaranteed by the SBA for the purpose of acquiring commercial real estate, machinery, equipment and inventory and to refinance debt and fund franchises, working capital and business acquisitions. NSBF is one of 14 SBA licensed Small Business Lending Corporations (SBLC) that, along with licensed financial institutions, provide loans nationwide under the federal Section 7(a) loan program (“SBA 7(a) loans”). NSBF has received preferred lender program (PLP) status, a designation whereby the SBA authorizes the most experienced SBA lenders to place SBA guarantees on loans without seeking prior SBA review and approval. Being a national lender, PLP status allows NSBF to serve its clients in an expedited manner since it is not required to present applications to the SBA for concurrent review and approval. In December 2010, Standard & Poor’s (“S&P”) Ratings Services added NSBF to their Select Servicer List which has been helpful to the Company in obtaining additional outside servicing contracts.
We originate loans ranging from $50,000 to $5,000,000 to both startup and existing businesses, which use the funds for a wide range of business needs including:
|
•
|
opening, expanding or acquiring a business or franchise: $50,000 to $5,000,000;
|
|
•
|
financing working capital:
|
|
•
|
SBA term loans: at least $50,000
|
|
•
|
Purchase equipment: $25,000 to $5,000,000
|
|
•
|
purchasing owner-occupied commercial real estate and leasehold improvements: up to $5,000,000; and
|
|
•
|
refinancing existing non-real-estate business debt: $25,000 to $5,000,000.
|
As of December 31, 2014 we:
|
•
|
service over $750 million in business loans for ourselves and third parties involving over 1,600 borrowers
|
|
•
|
have created successfully created and financed five Standard & Poors-rated securitizations
|
|
•
|
increased our revolving credit facility with Capital One, North America ("Capital One"), to $50,000,000 to finance and warehouse SBA 7(a) loans; and
|
|
•
|
funded in excess of $200,000,000 in SBA 7(a) loans for the year.
|
Under the SBA’s 7(a) lending program, a bank or other lender such as NSBF underwrites a loan between $50,000 and $5 million for a variety of general business purposes based on the SBA’s guidelines and the SBA provides a partial guarantee on the loan. Depending on the loan size, the SBA typically guarantees between 75% and 90% of the principal and interest due. The recoveries and expenses on the unguaranteed portions of these loans are shared
pari passu
between the SBA and the lender, which substantially reduces the loss severity on the unguaranteed portion of a loan for all SBA 7(a) loan investors. SBA 7(a) loans are typically between seven and 25 years in maturity, are four to five years in duration and bear interest at the prime rate plus a spread from 2.25% to 2.75%. Since the guaranteed portions of SBA 7(a) loans carry the full faith and credit of the U.S. government, lenders may, and frequently do, sell the guaranteed portion of SBA 7(a) loans in the capital markets, hold the unguaranteed portion and retain all loan servicing rights.
6
NSBF has a dedicated capital markets team that sells or securitizes the guaranteed and the unguaranteed portions of its SBA 7(a) loans. Historically, NSBF has sold the guaranteed portion of its originated SBA 7(a) loans within two weeks of origination and retained the unguaranteed portion until accumulating sufficient loans for a securitization. Since inception, NSBF has sold approximately $656 million of the SBA guaranteed portions of SBA 7(a) loans at premiums ranging from 106% to 120% of par value and typically any portion of the premium that was above 110% of par value was shared equally between NSBF and the SBA. In December 2010, NSBF launched its securitization program for unguaranteed portions of its SBA 7(a) loans and has since successfully completed five securitization transactions with Standard & Poor’s AA or A ratings and attractive advance rates of approximately 70% of par value. NSBF intends to do additional securitizations in the future which may be on comparable although not necessarily identical terms and conditions. We may determine to retain the government guaranteed or unguaranteed portions of loans pending deployment of excess capital
Late in 2009, we were selected by the FDIC as its contractor to manage and service portfolios of SBA 7(a) loans acquired by the FDIC from failed financial institutions. In addition, we assist the FDIC in the packaging of these loans for sale. Our existing servicing facilities and personnel perform these activities supplemented by contract workers as needed. The size of the portfolio we service for the FDIC varies and depends on the level of bank failures and the needs of the FDIC in managing portfolios acquired from those banks. On December 22, 2014, the Company’s wholly-owned portfolio company, Small Business Lending, Inc. (“SBL”), entered into a new contract (the “New Agreement”) with the FDIC, pursuant to which SBL will continue to provide the same or similar loan servicing and consulting services to the FDIC for SBA, United States Department of Agriculture and other loans acquired by the FDIC from failed banks, as it did under its previous contract with the FDIC. The New Agreement has an initial term of three (3) years, with an option in favor of the FDIC for two (2) additional three (3) year terms and one (l) additional one year term, for a total period of performance of up to ten (10) years. As of December 31, 2014, we were servicing approximately $122,000,000 in loans under this and all other third party contracts, in addition to the other approximately $631,000,000 loans originated by NSBF we service as of December 31, 2014.
Loan Securitizations:
NSBF typically retains the unguaranteed portions of the loans it originates and incurs related warehouse financing costs. Beginning in December 2010 NSBF developed a process to structure loan securitization transactions enabling it to move the unguaranteed portions of loans it originates into securitization trusts and to sell debt securities issued by these trusts. The securities sold were rated AA or A by S&P. In all, in transactions in 2010, 2012, 2013 and 2014, NSBF has transferred approximately $112,243,000 in unguaranteed loan portions in five transactions. With the loan securitization transactions, NSBF has been able to create significant liquidity which has been used to pay down the warehouse line and to fund new loans. The success of these securitization transactions has encouraged us to believe that we will be able to continue this process successfully as long as market and other conditions permit.
NSBF has in addition historically relied on bank financing to provide the revolving financing to support its lending activities. Currently Capital One provides a $50 million line for financing SBA guaranteed loans.
We also offer accounts receivable financing and management services through CDS Business Services, Inc. d/b/a Newtek Business Credit (NBC), another of our controlled portfolio companies. Through this service, SMBs can obtain $10,000 to $2,000,000 per month through the sale of their trade receivables or through a revolving line of credit collateralized by receivable accounts. NBC also offers back office receivables services for small businesses, such as billing and cash collections.
Small Business Lending, Inc. (SBL), has during 2014 become the focus of the Company’s efforts to expand loan servicing for third-parties in non-SBA areas.
Electronic Payment Processing
Newtek Merchant Solutions (NMS), a controlled portfolio company, markets credit and debit card processing services, check approval services and ancillary processing equipment and software to merchants who accept credit cards, debit cards, checks and other non-cash forms of payment. New merchants are acquired through several sales channels. Our primary focus is on developing new merchant sales leads as a result of internal sales efforts and our direct marketing under
The Small Business Authority
brand. NMS has targeted the marketing of its array of services under agreements with alliance partners, which are principally financial institutions, including banks, credit unions and other related businesses that are able to refer potential customers to NMS through Newtek’s NewTracker referral system. In addition, we enter into agreements with independent sales agents throughout the country. These referring organizations and associations are typically paid a percentage of the processing revenue derived from the respective merchants that they successfully refer to us. In 2014, we processed merchant transactions with a sales volume exceeding $4.6 billion, including merchant portfolios operated by our other subsidiaries which are serviced by NMS. Our customer base and the related sales volume processed by us has grown significantly during each year of operations since 2002 through a combination of organic growth in customers as well as selective merchant portfolio
7
acquisitions. Our merchant base has grown from approximately 1,200 merchants at the end of 2002 to approximately 14,300 merchants at the end of 2014.
We maintain two main customer service and sales support offices in Milwaukee, Wisconsin and Brownsville, Texas with additional specialists located in Phoenix, Arizona and New York. Our personnel at these locations assist merchants with initial installation of equipment and on-going service, as well as any other special processing needs that they may have.
Because we are not a bank, we are unable to belong to and directly access the Visa
®
and MasterCard
®
bankcard associations and we must be sponsored by a bank in order to process bankcard transactions. We are currently registered with Visa
®
and MasterCard
®
through the sponsorship of two banks that are members of the card associations, Wells Fargo Bank, N.A. and, since January 2011 Redwood Merchant Services, a division of WestAmerica Bank.
Our electronic payment processing business relies on our ability to obtain data processing services. There are two aspects to the processing of payments: the initial authorization of a payment (referred to as the “front-end processing”) and the merchant credit and cardholder charge transaction (the “back end processing”). In 2009, we signed agreements with Wells Fargo Bank to diversify our processing operations and with First Data Corporation to reduce our costs. We contract with several large-scale data processing companies to provide the front-end and back-end processing (Chase Paymentech Solutions, LLC, First Data Merchant Services Corporation (multiple platforms), Total Systems Services, Inc. and National Processing Company); these multiple platforms allow us to compete more effectively, reduce our risk of reliance on any one source, and give us the option of utilizing different processors to match the needs of particular merchants or situations. As our merchant base has grown, we believe that we have been able to achieve greater economies of scale in terms of negotiating the cost structure for providing such settlement services.
We continue to work with an affiliate, The Secure Gateway Services, LLC, which has the software and experience to provide a processing gateway facility for our payment processing business. This has resulted in increased integration of customer payment processing data with our Newtek Advantage software platform providing a mobile application allowing the customer to monitor charge processing activity in real time.
As a result of our exposure to liability for merchant fraud, charge-backs and other losses inherent in the merchant payment processing business, we have developed practices and policies which attempt to assess and reduce these risks. Activities in which we engage in order to mitigate such risks are:
|
•
|
underwriting the initial application of a merchant to identify unusual risks, structuring the relationship in a manner consistent with acceptable risks and, where possible, obtaining a personal or parent corporation guarantee from the merchant;
|
|
•
|
monitoring the daily and monthly activity of each merchant to identify any departures from normative charging behavior of each merchant and monitoring the largest of our merchants and those with high levels of refunds or charge-backs, so as to ensure an opportunity to address any credit or charge-back liability problems at the earliest possible time; and
|
|
•
|
requiring, when appropriate, merchants to agree to the establishment of cash reserves to protect NMS against merchant failures to pay for charge-backs and other fees, and making adjustments in these reserves as merchant experience indicates.
|
Our development and growth are focused on selling our services to internally generated referrals, merchant referrals identified for us by our alliance partners, and, with additional emphasis since January 2013, by our independent sales representatives. We are still different than most electronic payment processing companies who acquire their clients primarily through independent agents. We believe that our business model provides us with a competitive advantage by enabling NMS to acquire new electronic payment processing merchants at a lower cost level for third-party commissions than the industry average. Our business model allows NMS to own the customer as well as the stream of residual payments, as opposed to models which rely more heavily on independent sales agents. Since 2013 we have devoted resources to the design and testing of systems to allow us to offer to our merchant customers, state of the art technology in meeting the expected future requirements of the card associations for the implementation of the Europay, MasterCard, Visa (“EMV”) smart card technology. This is a global standard for interactive, integrated circuit cards and related point of sale terminals that will use cards imbedded with computer readable chips. We believe that this standard, which has been adopted in many areas outside the United States, will be implemented in the U.S. and we are positioning NMS to be a leader or authority in this field. In doing this we have the benefit of our affiliated technology companies who are able to provide the technological expertise needed for this project.
8
Managed Technology Solutions
Through our subsidiary, CrystalTech Web Hosting, Inc. d/b/a/ Newtek Technology Services
®
(NTS), we provide website hosting, dedicated server hosting, cloud hosting, web design and development, internet marketing, ecommerce, data storage and backup, and other related services to more than 106,000 customer accounts in 100 countries.
NTS provides a full suite of outsourced IT infrastructure services, including shared server hosting, dedicated server hosting, and cloud server (virtual) instances under the Newtek Technology Services
®
, Newtek Web Services
®
, Newtek Web Hosting, and CrystalTech
®
brands, for which it receives recurring monthly fees, as well as other fees such as set-up fees, consulting fees, domain name registration fees, among others. Ninety percent of all fees are paid in advance by credit card.
NTS has recognized the continuing decline in Microsoft being utilized in the design of web sites and the market shift to Linux, Nginx and a proliferation of Word Press sites being built on non-Microsoft based platforms. This decline has caused a marked downward trend in the historical site count of NTS hosted sites. NTS has responded by launching Linux Apache and Linux Nginx platforms within its environment and created associated control panels, service/support and billing to participate more fully in the market as compared to the present 33% of the new web design growth represented by Microsoft. All platforms are available within NTS’s Cloud and non-cloud environment and are fully managed offerings as compared to our competitors. In addition, Newtek has created a proprietary platform and filed an associated patent for Newtek Advantage which leverages NTS’s underlying technologies to deliver real time information and actionable business intelligence to its existing and new customer base.
NTS has launched a complete line of cloud based business and eCommerce packages to streamline the decision process for business owners and accommodate designers and developers that wish to build sites in both Microsoft and Linux environments. NTS’s Cloud offerings provide for a consumption-based hosting model that allows customers to pay only for the resources they need, which not only saves them money compared to traditional server hosting, but also enables them to scale larger or smaller on demand.
NTS delivers services not just to customers seeking hosting, but also to wholesalers, resellers and web developers by offering a range of tools for them to build, resell and deliver their web content. NTS primarily uses the Microsoft Windows® 2012 R2 platform to power its technology. NTS currently operates a 5,000 square foot fortress-strength data center located in Scottsdale, Arizona, utilizing redundant networking, electrical and back-up systems, affording customers what management believes to be a state-of-the-art level of performance and security. NTS is PCI certified, SSAE 16 (Service Organization Control 1 “SOC 1”) audited, all of which mean that it meets the highest industry standards for data security.
Throughout its operations as a Newtek portfolio company, over seventy percent of new NTS customers have come as a result of referrals without material expenditures by for marketing or advertising. Many of NTS’s competitors are very price sensitive, offering minimal services at cut-rate pricing. While being cost competitive with most Linux- and Windows-based web hosting services, NTS has emphasized higher quality uptime, service and support as well as multiple control panel environments for the designer and developer community.
NTS has diversified its product offerings to SMBs under different brands, all under Newtek Technology Services, including Newtek Hosting, Newtek Web Services, Newtek Data Storage
®
and Newtek Web Design and Development
®
. NTS focuses specifically on select markets such as restaurants, financial institutions, medical practices, law firms, accountants, retail and technology service providers for channel business and reselling. NTS has also launched a turnkey hosting service to meet financial institution needs for dedicated servers, hosting and/or data storage, enabling these entities to comply with strict regulatory requirements that demand very high security protocols and practices be in place.
NTS differentiates itself from its larger cloud hosting competitors, such as Amazon, Google and Microsoft, by offering what we believe these competitors cannot and yet is the one element absolutely critical to SMBs: a live person, available 24/7/365 to answer questions, address needs or problems with software or hardware. We have continued to add to our resources to ensure that our customers have access to the high quality support they need for the features, functions and services of their internal IT operations.
All Other: Insurance and Payroll Processing Services
We offer small business insurance products and services through Newtek Insurance Agency, LLC (“NIA”), which is licensed in 50 states. NIA serves as a retail and wholesale insurance agency specializing in the sale of personal, commercial and health/benefits lines insurance products to customers of all our affiliated companies as well as our alliance partners. We offer insurance products from multiple insurance carriers providing a wide range of choice for our customers. We have formed a
9
strategic alliance with American International Group, CTAA, Navy Federal Credit Union, Credit Union National Association, Pershing and others to provide agent services to small business clients. We are continuing our efforts to implement programs with alliance partners to market commercial and personal insurance. In December 2012, NIA working with another of our companies acquired a portfolio of insurance business from a major health care insurance agency based in the New York City area. This has added approximately 340 group health insurance policies that we are servicing and will form the basis on which we plan to grow this aspect of the insurance business. We expect also that recent health care legislation will increase the demand for these services among SMBs.
We have placed significant emphasis on developing the business conducted by our controlled portfolio company operating under the trade name of “Newtek Payroll Services.” This investment was originally made in 2010, and enables the Company to offer an array of industry standard and very competitively priced payroll management, payment and tax reporting services to SMBs. Based in New York, Newtek Payroll Services has built up its business during 2014 to approximately 470 customerss with total payroll under management of approximately 3,512 employees, of which approximately 10% were Newtek employees. These payroll services are being marketed through all of our available channels including the alliance partnerships and our direct marketing campaigns.
Corporate Activities
Corporate implements business strategy, directs marketing, provides technology oversight and guidance, coordinates and integrates activities of the segments, contracts with alliance partners, acquires customer opportunities and owns our proprietary NewTracker referral system and all other intellectual property rights. This segment includes revenue and expenses not allocated to other segments, including interest income, Capco management fee income and corporate operations expenses.
Certified Capital Companies
We have deemphasized our Capco business in favor of growing our portfolio companies and do not anticipate creating any new Capcos. While observing all requirements of the Capco programs and, in particular, financing qualified businesses meeting applicable state requirements as to limitations on the proportion of ownership of qualified businesses, we have been able to use this funding source as a means to facilitate the growth of our businesses, which are strategically focused on providing goods and services to small businesses such as those in which our Capcos invest. We continue to invest in and lend to small businesses through our existing Capcos and meet the goals of the Capco programs.
Marketing
Overview
We position ourselves as a provider of business and financial services to the SMB sector in the United States. Through integrated marketing and sales of each service line we control our customer’s experience in order to provide high quality service to both our marketing partners and potential customers. We reach potential customers through our multi-channel approach featuring direct, indirect and direct outbound solicitation efforts.
Although we continue to utilize and grow our core marketing channel of strategic alliance partners, we have initiated a direct marketing strategy to the SMB customers through our new “go to market” brand,
“The Small Business Authority.”
Through this brand we are establishing ourselves as the authority in each of the service lines our portfolio companies provide through a coordinated radio and television advertising campaign built around our new web presence,
www.thesba.com
. We continue to market through our bilingual 24/7 call center which we believe is a valuable feature for most small business owners that need help during non-business hours and on weekends. We use web-based applications as an in-house tool to help our employees and associates to be efficient, smart and productive. Instead of using expensive, six-figured salaried employees that a typical bank or an insurance agency would use to market financial products and business services to SMB customers, we use technology and dedicated loyal non-executive-salary-plus-bonus employees. The addition of the direct to market strategy through promotion of our new web site supports our goal to maintain costs and retain greater margin on each transaction as well as providing our competent in house business service specialists the ability to create a second and third product and service opportunities.
We believe that our business service specialists on all product lines understand the needs of the SMB owner. Each business service specialists in the enterprise has completed our “Newtek University” which provides in depth training and techniques in identifying qualified opportunities across all of our portfolio companies' service offerings. We conduct telephone interviews and targeted surveys with our customers across all product lines to deepen our understanding of their needs. We have tailored our procedures so our SMB customers do not have to fill out multiple handwritten forms or type multiple data entry screens,
10
which we believe is the most aggravating factor facing our customers. We have modeled our back-office and business operations after customer centered operational models. We stress our responsive customer service and we endeavor to excel in addressing and resolving issues and problems that our customers may face. We are now providing our 24/7 customer service functions in Spanish as well as English to service the growing Hispanic-owned and -operated SMB customer base in the United States.
We also market our portfolio companies' services through referrals from our alliance partners such as AIG, Amalgamated Bank, Credit Union National Association, Iberia Bank, Pershing, New York Community Bank, Morgan Stanley Smith Barney, ENT Federal Credit Union, Randolph Brooks Federal Credit Union and Nassau Educators Federal Credit Union using our proprietary NewTracker referral system as well as direct referrals from our new web presence, www.thesba.com. Additional referrals are obtained from individual professionals in geographic markets that have signed up to provide referrals and earn commissions through our BizExec and TechExec Programs. These individuals are traditionally information technology professionals, CPAs, independent insurance agents and sales and/or marketing professionals. In addition, electronic payment processing services are marketed through independent sales representatives and web technology and ecommerce services are marketed through internet-based marketing and third-party resellers. A common thread across all business lines relates to acquiring customers at low cost. We seek to bundle our marketing efforts through our brand, our portal, our proprietary NewTracker technology, our new web presence as
The Small Business Authority
and one easy entry point of contact.
We have implemented a multi-channel marketing strategy that consists of:
Direct:
The goal of the Newtek website,
www.thesba.com
,
is to focus on helping business owners succeed by providing them high quality business services, testimonials, case studies and a daily blog. In addition, the site delivers promotions to aid in acquiring clients and creating higher levels of customer referrals. The website is consistent with Newtek’s national television campaign and on-line messaging, positioning it as a national provider of business services and financial products to the more than 27 million small and independently owned and operated businesses across the United States.
To supplement our direct marketing efforts, we have developed two proprietary vehicles to enhance the visibility and credibility of
The Small Business Authority
and the related website
thesba.com.
The Small Business Index was developed internally and trademarked during 2011. It is a monthly assessment of various factors indicative of business conditions in the small business market. Since its introduction, it has received a great deal of publicity and is now quoted in numerous national publications. In addition, we also publish our internally developed
SB Market Sentiment Survey
, which captures responses from our website visitors on topics of significant importance to our small business customers. This survey has also gained much national attention. We believe that both of these efforts add significantly to our marketing efforts and further support our efforts to become the one-stop-shop for all SMBs.
A final addition to our direct marketing efforts is our effort to give
The Small Business Authority
a social media presence. We have dedicated staff familiar with the latest developments in social media and we have been active in placing blog articles, videos and special promotions on numerous social media sites. We distribute this type of content multiple times daily and attempt to engage with customers and others on a similar basis. Our staff follows numerous blog sites related to our businesses and attempts to post relevant materials and information that both addresses small and medium sized business needs and interests and identifies the ways in which The Small Business Authority can address many of those needs.
Indirect:
Our alliance partners market one or more of our services to their customer base or members, and utilize NewTracker to submit referrals to Newtek from either their website or directly by their staff. Through our BizExec and TechExec Programs, we are recruiting individual professionals such as insurance agents, lawyers and accountants, or website designers or software developers, who utilize NewTracker through a link to NewTracker from their own site or the establishment of a new website.
Direct Outbound:
We combined all data assets into a seamless, enterprise-wide, accessible master database in order to facilitate cross marketing, selling and servicing, real-time data mining and business intelligence. We have established a dedicated team to use our master database for cross marketing, selling and servicing.
The Newtek Referral System
Our patented NewTracker
®
referral system, allows us to process new business utilizing a web-based, centralized processing point. In-bound referrals from alliance partners, our website and other sources are transmitted to our businesses to provide the service or services our customers need. Our trained representatives use these web-based applications as a tool to acquire and process data through telephonic interviews, eliminating the need for face-to-face contact and the requirement that a customer complete multiple paper forms or data entry for multiple product lines. This approach is customer friendly, allows us to process applications very efficiently and allows us to store client information for further processing and cross-selling efforts while
11
offering what we believe to be the highest level of customer service. It also assures our alliance partners full transaction transparency. This system permits our alliance partners to have a window to our back office processing 24 hours a day, 7 days a week, to see every communication and interaction between our sales and processing representatives and their referred customers while still preserving the privacy of customer or alliance partner sensitive data on the application. NewTracker enables the processing and tracking of services in a manner similar to the bar code system used by overnight delivery services. We believe that NewTracker is a key differentiating component of our business. It enables us to scale our business services rapidly to meet the demands of our customers. NewTracker enables our alliance partners to offer our services immediately, without having to invest in marketing materials, sales and marketing personnel, training, licensing or office space. Because their customers or members are driven by our technology to our processing centers, which can handle increased volume of transactions without having to add specialized staff or infrastructure, there is no need for additional investment by our alliance partners. NewTracker additionally provides direct interface to business owners/operators accessing our new web site as they provide basic information regarding their need so that our Business Service Specialists can immediately respond to inquiry for any of our service offerings. The Company is also beginning to explore the possibility of marketing some aspect of the patented technology as it represents a unique capability for sales organizations as it not only manages intake of business but enables real time management of client service functions.
Alliances
Each of the portfolio companies benefit from the receipt of significant numbers of customer referrals from our alliance partners, pursuant to agreements negotiated and structured by our holding company management and staff. We are focused on using strategic business affiliations to identify likely SMB customers and others to be serviced by our operating businesses. We seek to ally Newtek with companies and organizations that wish to offer one or more of our portfolio companies' business lines to their customers or members. We provide one-stop shopping for alliance partners that want to launch or expand their business services. For example, many credit unions are serving small business owners with consumer lending applications, but can use our alliance with Credit Union National Association and scores of small to large credit unions and community banks to expand their offering of services. We are also able to private label any of our business services for any alliance partner.
These alliance partners are able to provide greater service to their customers and members and derive a steady flow of referral payments from us. On the other hand, our operating companies are receiving significant numbers of referrals for our services in the areas of small business loans, insurance and electronic payment processing and are thus acquiring customers at a low cost. NewTracker, our proprietary, internally developed referral system technology, facilitates this transfer of information and also permits our customer service representatives, their supervisors and the referring alliance partners to observe the real-time processing of each referral, from intake to completion. For example, an alliance partner financial advisor who refers a brokerage customer for electronic payment processing, can track our processing of their client and know when decisions are made, what they are, when the referral fees are earned, as well as observe and oversee the operational performance of our customer service representatives. The process is analogous to the bar code system used by overnight delivery services to track the movement of a package, where critical processing points are input and the customer is able to access the company’s password-protected web site and monitor the movement of the package from pick-up to delivery.
We have entered into agreements to provide one or more business services with numerous national and regional businesses or organizations including, but not limited to:
|
•
|
Morgan Stanley Smith Barney
|
|
•
|
New York Community Bank
|
|
•
|
Credit Union National Association (CUNA)
|
|
•
|
Microsoft
|
|
•
|
American International Group
|
|
•
|
Pershing
|
|
•
|
Members 1st Federal Credit Union
|
|
•
|
Ent Federal Credit Union
|
12
|
•
|
IBERIABANK
|
|
•
|
Bellco Credit Union
|
|
•
|
Wright Patt Credit Union
|
|
•
|
SpaceCoast Credit Union
|
|
•
|
Nassau Educators Federal Credit Union
|
|
•
|
Randolph Brooks Federal Credit Union
|
|
•
|
Desert Schools Federal Credit Union
|
|
•
|
Brownsville (TX) Chamber of Commerce
|
Intellectual Property
Newtek has developed patented software which is the core of its NewTracker referral system.
NTS uses specialized software to conduct its business under a perpetual, royalty-free license from its developer, the former owner of CrystalTech, acquired at the time of our acquisition of the business.
We and our controlled portfolio companies have several trademarks and service marks, all of which are of material importance to us. The following trademarks and service marks are the subject of trademark registrations issued by the USPTO:
|
1.
|
AT NEWTEK, WE DO IT BETTER
|
|
2.
|
BIZEXEC
|
|
3.
|
CRYSTALTECH
|
|
4.
|
CRYSTALTECH WEB HOSTING
|
|
5.
|
CT & Design
|
|
6.
|
NEWTEK
|
|
7.
|
NEWTEK BIZEXEC
|
|
8.
|
NEWTEK BUSINESS SERVICES
|
|
9.
|
NEWTEK BUSINESS SOLUTIONS
|
|
10.
|
NEWTEK + NEWT LOGO
|
|
11.
|
NEWTEK REFERRAL SYSTEM
|
|
12.
|
NEWTEK TECHNOLOGY SERVICES
|
|
13.
|
NEWTEK WEB SERVICES
|
|
14.
|
NEWTRACKER
|
|
15.
|
WEBCONTROLCENTER
|
|
16.
|
NEWTEK BUSINESS CREDIT
|
|
17.
|
NEWTEK DATA STORAGE
|
13
|
18.
|
NEWTEK WEB DESIGN AND DEVELOPMENT
|
|
19.
|
NEWTEK WEB HOSTING
|
|
20.
|
WE DO IT BETTER
|
|
21.
|
A NEW WAY TO THINK ABOUT SMALL-BUSINESS IT
|
|
22.
|
THE CLOUD AUTHORITY
|
|
23.
|
THESBA.COM THE SMALL BUSINESS AUTHORITY POWERED BY NEWTEK
|
|
24.
|
THE SMALL BUSINESS AUTHORITY
|
|
25.
|
THE SMALL BUSINESS AUTHORITY HOUR
|
|
26.
|
NEWTPAY PRO
|
|
27.
|
NEWTPAY
|
|
28.
|
NEWTEK BUSINESS SERVICES, INC. + NEWT LOGO
|
|
29.
|
THE CLOUD AUTHORITY + DESIGN
|
|
30.
|
THESBA
|
|
31.
|
THE SBAUTHORITY INDEX
|
|
32.
|
THE SMALL BUSINESS AUTHORITY INDEX
|
|
33.
|
THESBA INDEX
|
|
34.
|
NEWTEK SITECENTER
|
|
35.
|
NEWTEK PAYROLL
|
|
36.
|
CONTINUOUS CYBER SECURITY SCANNING
|
|
37.
|
THE BUSINESS AUTHORITY
|
|
38.
|
CLOUD AUTHORITY
|
|
39.
|
INSURED CLOUD COMPUTING
|
|
40.
|
THE PAYROLL AUTHORITY
|
|
41.
|
THE ECOMMERCE AUTHORITY
|
|
42.
|
THE MOBILE APPLICATION AUTHORITY
|
|
43.
|
THE HEALTH INSURANCE AUTHORITY
|
|
44.
|
THE IT AUTHORITY
|
|
45.
|
NEWTEK ADVANTAGE
|
|
46.
|
NEWTEK HOSTING
|
|
47.
|
NEWTPAY MOBILE
|
14
|
48.
|
THESBA.COM THE SMALL BUSINESS AUTHORITY
|
The following trademarks and service marks are the subject of pending trademark applications filed with the USPTO:
|
1.
|
NEWTEK INSURED CLOUD COMPUTING
|
|
2.
|
NEWTEK INSURED HOSTING
|
|
3.
|
NEWTEK INSURED PAYROLL
|
|
4.
|
THE SMALL BUSINESS TECHNOLOGY AUTHORITY
|
|
5.
|
THE TECHNOLOGY AUTHORITY
|
|
6.
|
NEWTEK INSURED ECOMMERCE
|
|
7.
|
NEWTEK INSURED MERCHANT SERVICES
|
|
8.
|
NEWTEK EDGE
|
|
9.
|
THE TECH AUTHORITY
|
|
10.
|
NEWTPAY- ECOMMERCE
|
|
11.
|
NEWTPAY- EMV
|
|
12.
|
NEWTPAY- POS
|
|
13.
|
NEWTPAY FREE PAYMENT PROCESSING
|
|
14.
|
NEWTPAY ZERO
|
|
15.
|
THE INSURANCE AND BENEFITS AUTHORITY
|
|
16.
|
THE SMALL BUSINESS INSURANCE AUTHORITY
|
Government Regulation
Overview
Newtek’s electronic payment processing, lending and insurance portfolio companies and/or subsidiaries, and Capco operations, are subject to regulation by federal, state and professional governing bodies. In addition, our financial institution customers, which include commercial banks and credit unions, operate in markets that are subject to rigorous regulatory oversight and supervision. The compliance of our products and services with these requirements depends on a variety of factors including the particular functionality, the interactive design and the charter or license of the financial institution. Our financial services customers must independently assess and determine what is required of them under these regulations and are responsible for ensuring that our systems and the design of their websites conform to their regulatory obligations. New laws or regulations are frequently adopted in these areas that require constant compliance and could increase our costs.
Certified Capital Companies
In return for the Capcos making investments in the targeted companies, the states provide tax credits, generally equal to funds invested in the Capco by the insurance companies that provide the funds to the Capcos. In order to maintain its status as a Capco and to avoid recapture or forfeiture of the tax credits, each Capco must meet a number of specific investment requirements, including a minimum investment schedule all of which have been met prior to required dates by all of our Capcos. As a result, we believe there is no basis for a loss of tax credits.
Each of the state Capco programs has a requirement that a Capco, in order to maintain its certified status, must meet certain investment requirements, both qualitative and quantitative, all of which the Company’s Capcos have met. These include limitations on the initial size of the recipients of the Capco funds, including the number of their employees, the location within
15
the respective state of the recipients and the recipients’ commitment to remain therein for a specified period of time, the types of business conducted by the recipients, and the terms of the investments in the recipients.
The states of Louisiana, Colorado and Texas and the state of New York have added to their Capco programs limitations on the equity investment Capcos can make in qualified businesses. These programs or program changes seek to preclude a Capco from owning all or a majority of the voting equity of the invested business. While Newtek has made profitable majority-owned investments in the past, we have also made minority or passive investments in qualified businesses. Newtek’s Capcos are in full compliance with all investment limitations, and management foresees no significant difficulty in continuing to remain in compliance.
When each of Newtek’s Capcos has invested in qualified businesses an amount equal to 100% of its initial certified capital, it is able to decertify (terminate its status as a Capco) and no longer be subject to any state Capco regulation. Upon voluntary decertification, the programs in about half of the states require that a Capco share any distributions to its equity holders with the state sponsoring the Capco. For those states that require a share of distributions, the sharing percentages vary, but are generally from 10 to 30%, usually on distributions above a specified internal rate of return for the equity owners of the Capco. States not requiring distributions are Texas and New York (Programs 1, 2 and 3). At this time, Newtek does not believe that the sharing requirements will have a material impact on the company’s financial condition or operations. Three of Newtek’s Capcos have reached the 100% investment level and a fourth, our Wisconsin based Capco, met its statutory requirements and voluntarily decertified and was subsequently dissolved. While the Company continues to attempt to achieve full (100%) investment in all of its Capcos, circumstances of individual programs may make this unachievable. If and when such an event arises, the Capco and the Company will evaluate alternatives and may seek to dissolve the Capco as permitted under the particular program. Such an event would represent a failure of the Capco but would not carry with it any financial consequences to the Company.
Managerial Assistance
A BDC must have been organized and have its principal place of business in the United States and must be operated for the purpose of making investments in the types of securities described above. However, in order to count portfolio securities as qualifying assets for the purpose of the 70% test (described below), the BDC must either control the issuer of the securities or must offer to make available to the issuer of the securities (other than small and solvent companies described below) significant managerial assistance; except that, where the BDC purchases such securities in conjunction with one or more other persons acting together, one of the other persons in the group may make available such managerial assistance. Making available significant managerial assistance means, among other things, any arrangement whereby the BDC, through its directors, officers or employees, offers to provide, and, if accepted, does so provide, significant guidance and counsel concerning the management, operations or business objectives and policies of a portfolio company through monitoring of portfolio company operations, selective participation in board and management meetings, consulting with and advising a portfolio company’s officers or other organizational or financial guidance.
We do not receive fees for these services, though we may allocate direct expenses related to providing such services to the portfolio companies.
Employees
As of December 31, 2014, we and our controlled portfolio companies collectively had a total of 335 employees, of which 329 were full-time employees. We believe our labor relations are good; none of our employees are covered by a collective bargaining agreement.
Confidentiality Agreements
All our employees have signed confidentiality agreements, and it is our standard practice to require newly hired employees and, when appropriate, independent consultants, to execute confidentiality agreements. These agreements provide that the employee or consultant may not use or disclose confidential information except in the performance of his or her duties for the Company, or in other limited circumstances. The steps taken by us may not, however, be adequate to prevent the misappropriation of our proprietary rights or technology.
Revenues and Assets by Geographic Area
During the years ended December 31, 2014, 2013 and 2012, virtually all of our revenue was derived from customers in the United States, although we provide pre-paid web site hosting services to customers in approximately 162 countries.
16
Available Information
We are subject to the informational requirements of the Securities Exchange Commission (the “SEC”) and in accordance with those requirements file reports, proxy statements and other information with the SEC. You may read and copy the reports, proxy statements and other information that we file with the SEC under the informational requirements of the Securities Exchange Act at the SEC’s Public Reference Room at 450 Fifth Street N.W., Washington, DC 20549. Please call 1-800-SEC-0339 for information about the SEC’s Public Reference Room. The SEC also maintains a web site that contains reports, proxy and information statements and other information regarding registrants that file electronically with the SEC. The address of the SEC’s web site is
http://www.sec.gov.
Our principal offices are located at 212 West 35
th
Street, 2
nd
Floor, New York, NY, 10001 and our telephone number is (212) 356-9500. Our website may be directly accessed at
http://www.thesba.com
. We make available through our website, free of charge, our Annual Reports on Form 10-K, Quarterly Reports on Form 10-Q, Current Reports on Form 8-K and amendments to those reports filed or furnished pursuant to Section 13(a) or 15(d) of the Securities Exchange Act of 1934, as amended, as soon as reasonably practicable after we electronically file such material with, or furnish it to, the SEC. These documents may be directly accessed at
http://investor.newtekbusinessservices.com
Information contained on our website is not a part of this report.
Competition
We compete to provide financing to small and medium sized businesses with other BDCs, as well as traditional financial services companies such as commercial banks and other financing sources. Some of our competitors are larger and have greater financial, technical, marketing and other resources than we have. We believe we compete effectively with these entities primarily on the basis of the experience, industry knowledge and expertise of our senior lending team. We offer a variety of attractive financing sources, as well as cost effective and efficient business services, to meet capital needs through our subsidiaries and controlled portfolio companies. For additional information concerning our competitive position and competitive risks, see “Item 1A - Risk Factors.”
We and our portfolio companies compete in a large number of markets for the sale of services to SMBs. Each of our controlled portfolio companies competes not only against suppliers in its particular state or region of the country but also against suppliers operating on a national or even a multi-national scale. None of the markets in which our portfolio companies compete are dominated by a small number of companies that could materially alter the terms of the competition.
Our Electronic payment processing portfolio company, NMS competes with entities including Heartland Payment Systems, First National Bank of Omaha, Jetpay Corporation (formerly Universal Business Payment Solutions) and Paymentech, L.P. Our Web hosting portfolio company competes with 1&1, Hosting.com, Discount ASP, Maxum ASP, GoDaddy
®
, Yahoo!
®
, BlueHost
®
, iPowerWeb
®
, Rackspace.com, Web.com, Endurance International Group (EIGI) and Microsoft Live among others. Our Small Business Finance subsidiary, NSBF competes with regional and national banks and non-bank lenders. Intuit
®
is bundling electronic payment processing, web hosting and payroll services similar to ours in offerings that compete in the same small- to midsize-business market.
In many cases, we believe the competitors of our portfolio companies and subsidiaries are not as able as we are to take advantage of changes in business practices due to technological developments and, for those with a larger size, are unable to offer the personalized service that many small business owners and operators seem to want.
While we compete with many different providers in our various businesses, we have been unable to identify any direct and comprehensive competitors that deliver the same broad suite of services focused on the needs of the SMB market with the same marketing strategy as we do. Some of our competitive advantages include:
|
•
|
Our compatible products such as our e-commerce offerings that we are able to bundle to increase sales, reduce costs and reduce risks for our customers and enable us to sell two, three, or four products at the same time;
|
|
•
|
Our proprietary NewTracker referral system, which allows us to process new business utilizing a web-based, centralized processing point and provides back end scalability;
|
|
•
|
Our focus on developing and marketing business services and financial products and services aimed at the small- and medium-sized business market;
|
|
•
|
Our scalability, which allows us to size our business services capabilities very quickly to meet customer and market needs;
|
17
|
•
|
Our ability to offer personalized service and competitive rates;
|
|
•
|
A strategy of multiple channel distribution, which gives us maximum exposure in the marketplace;
|
|
•
|
High quality customer service 24x7x365 across all business lines, with a focus primarily on absolute customer service;
|
|
•
|
Our telephonic interview process, as opposed to requiring handwritten or data-typing processes, which allows us to offer high levels of customer service and satisfaction, particularly for small business owners who do not get this service from our competitors; and
|
|
•
|
Our NewTracker Portal, which allows our alliance partners to offer a centralized access point for their small- to medium-sized business clients as part of their larger strategic approach to marketing and allows such partners to demonstrate that they are focused on providing a suite of services to the small business market in addition to their core service.
|
Competitive Advantages
We believe that we are well positioned to take advantage of investment opportunities in SMBs due to the following
competitive advantages:
|
•
|
Internally Managed Structure and Significant Management Resources. We are internally managed by our executive officers under the supervision of our board of directors and do not depend on an external investment advisor. As a result, we do not pay investment advisory fees and all of our income is available to pay our operating costs, which include employing investment and portfolio management professionals, and to make distributions to our stockholders. We believe that our internally managed structure provides us with a lower cost operating expense structure, when compared to other publicly traded and privately-held investment firms which are externally managed, and allows us the opportunity to leverage our non-interest operating expenses as we grow our investment portfolio. Our senior lending team has developed one of the largest independent loan origination and servicing platforms that focuses exclusively on SMBs.
|
|
•
|
Business Model Enables Attractive Risk-Weighted Return on Investment in SBA Lending.
Our loans are structured so as to permit rapid sale of the U.S. government guaranteed portions, often within weeks of origination, and the unguaranteed portions have been successfully securitized, usually within a year of origination. The return of principal and premium may result in a very advantageous risk-weighted return on our original investment in each loan. We may determine to retain the government guaranteed or unguaranteed portions of loans pending deployment of excess capital.
|
|
•
|
State of the Art Technology. Our patented NewTracker® software enables us to board a SMB customer, process the application or inquiry, assemble necessary documents, complete the transaction and create a daily reporting system that is sufficiently unique as to receive a U.S. patent. This system enables us to identify a transaction, similar to a merchandise barcode or the customer management system used by SalesForce.com, then process the business transaction and generate internal reports used by management and external reports for strategic referral partners. It allows our referral partners to have digital access into our back office and follow on a real time, 24/7 basis the processing of their referred customers. This technology has been made applicable to all of the service and product offerings we make directly or through our controlled portfolio companies.
|
|
•
|
Established Direct Origination Platform with Extensive Deal Sourcing Infrastructure. We have established a direct origination pipeline for investment opportunities without the necessity for investment banks or brokers as well as broad marketing channels that allow for highly selective underwriting. Over the past twelve years, the combination of our brand, our portal, our patented NewTracker® technology, and our new web presence as
The Small Business Authority®
have created an extensive deal sourcing infrastructure. Although we pay fees for loan originations that are referred to us by our alliance partners, our non-commissioned investment team works directly with the borrower to assemble and underwrite loans. We rarely invest in pre-assembled loans that are sold by investment banks or brokers. As a result, we believe that our unique national origination platform allows us to originate attractive credits at a low cost. We anticipate that our principal source of investment opportunities will continue to be in the same types of SMBs to which we currently provide financing. Our executive committee and senior lending team will also seek to leverage their extensive network of additional referral sources, including law firms, accounting firms, financial, operational and strategic consultants and financial institutions, with whom we have completed investments. Our current infrastructure
|
18
and expansive relationships should continue to enable us to review a significant amount of high quality, direct (or non-brokered) investment opportunities.
|
•
|
Experienced Senior Lending Team with Proven Track Record. We believe that our senior lending team is one of the leading capital providers to SMBs. Our senior lending team has expertise in managing the SBA process and has managed a diverse portfolio of investments with a broad geographic and industry mix. While our primary focus is to expand the debt financing activities of NSBF in SBA 7(a) loans, our executive committee also has substantial experience in making debt and equity investments through our Capcos.
|
|
•
|
Flexible, Customized Financing Solutions for Seasoned, Smaller Businesses. While our primary focus as a BDC is to expand NSBF’s lending by providing SBA 7(a) loans to SMBs, we also seek to offer SMBs a variety of attractive financing structures, as well as cost effective and efficient business services, to meet their capital needs through our subsidiaries and controlled portfolio companies. Unlike many of our competitors, we believe we have the platform to provide a complete package of service and financing options for SMBs, which allows for cross-selling opportunities and improved client retention. We expect that a large portion of our capital will be loaned to companies that need growth capital, acquisition financing or funding to recapitalize or refinance existing debt facilities. Our lending continues to focus on making loans to SMBs that:
|
|
◦
|
have 3 to 10 years of operational history;
|
|
◦
|
significant experience in management;
|
|
◦
|
credit worthy owners who provide a personal guarantee for our investment;
|
|
◦
|
show a strong balance sheet including primarily real estate to collateralize our investments; and
|
|
◦
|
show sufficient cash flow to be able to service the payments on our investments comfortably.
|
We generally seek to avoid investing in high-risk, early-stage enterprises that are only beginning to develop their market share or build their management and operational infrastructure with limited collateral.
|
•
|
We pursue rigorous due diligence of all prospective investments originated through our platform. Our senior lending team has developed an extensive underwriting due diligence process, which includes a review of the operational, financial, legal and industry performance and outlook for the prospective investment, including quantitative and qualitative stress tests, review of industry data and consultation with outside experts regarding the creditworthiness of the borrower. These processes continue during the portfolio monitoring process, when we conduct field examinations, review all compliance certificates and covenants and regularly assess the financial and business conditions and prospects of portfolio companies. We are also a Standard & Poor’s rated servicer for commercial loans and our exceptional servicing capabilities with a compact timeline for loan resolutions and dispositions has attracted various third-party portfolios.
|
Regulation
We have elected to be regulated as a BDC under the 1940 Act and we intend to elect to be treated, and qualify annually thereafter, as a RIC under Subchapter M of the Code, beginning with our 2015 taxable year. As with other companies regulated by the 1940 Act, a BDC must adhere to certain substantive regulatory requirements. The 1940 Act contains prohibitions and restrictions relating to transactions between BDCs and their affiliates (including any investment advisers or sub-advisers), principal underwriters and affiliates of those affiliates or underwriters. The 1940 Act also requires that a majority of the directors of the BDC be persons other than “interested persons,” as that term is defined in the 1940 Act. In addition, the 1940 Act provides that we may not change the nature of our business so as to cease to be, or to withdraw our election as, a BDC unless approved by “a majority of our outstanding voting securities” as defined in the 1940 Act. A majority of the outstanding voting securities of a company is defined under the 1940 Act as the lesser of: (i) 67% or more of such company’s outstanding voting securities present at a meeting if more than 50% of the outstanding voting securities of such company are present and represented by proxy or (ii) more than 50% of the outstanding shares of such company. Our bylaws provide for the calling of a special meeting of stockholders at which such action could be considered upon written notice of not less than ten or more than sixty days before the date of such meeting.
We may invest up to 100% of our assets in securities acquired directly from issuers in privately negotiated transactions. With respect to such securities, we may, for the purpose of public resale, be deemed an “underwriter” as that term is defined in the Securities Act of 1933, as amended, or the Securities Act. Our intention is to not write (sell) or buy put or call options to manage
19
risks associated with the publicly traded securities of our portfolio companies, except that we may enter into hedging transactions to manage the risks associated with interest rate fluctuations to the extent that we are permitted to engage in such hedging transactions under the 1940 Act and applicable commodities laws. We may also purchase or otherwise receive warrants to purchase the common stock of our portfolio companies in connection with acquisition financing or other investments. Similarly, in connection with an acquisition, we may acquire rights to require the issuers of acquired securities or their affiliates to repurchase them under certain circumstances. At December 31, 2014, we hold no investments in publicly traded securities. As a BDC, we are generally required to meet an asset coverage ratio, defined under the 1940 Act as the ratio of our gross assets (less all liabilities and indebtedness not represented by senior securities) to our outstanding senior securities, of at least 200% after each issuance of senior securities.
We may also be prohibited under the 1940 Act from knowingly participating in certain transactions with our affiliates without the prior approval of our Board who are not interested persons and, in some cases, prior approval by the SEC. For example, under the 1940 Act, absent receipt of exemptive relief from the SEC, we and our affiliates may be precluded from co-investing in private placements of securities. As a result of one or more of these situations, we may not be able to invest as much as we otherwise would in certain investments or may not be able to liquidate a position as quickly.
We are required to provide and maintain a bond issued by a reputable fidelity insurance company to protect us against larceny and embezzlement. Furthermore, as a BDC, we are prohibited from protecting any director or officer against any liability to us or our stockholders arising from willful misfeasance, bad faith, gross negligence or reckless disregard of the duties involved in the conduct of such person’s office.
We have adopted and implemented written policies and procedures reasonably designed to prevent violation of the federal securities laws and review these policies and procedures annually for their adequacy and the effectiveness of their implementation. We have designated a chief compliance officer to be responsible for administering the policies and procedures.
As a BDC, we are subject to certain risks and uncertainties. See “Risk Factors - Risks Relating to our Business and Structure.”
Qualifying Assets
Under the 1940 Act, a BDC may not acquire any asset other than assets of the type listed in Section 55(a) of the 1940 Act, which are referred to as qualifying assets, unless, at the time the acquisition is made, qualifying assets represent at least 70% of the company's total assets. The principal categories of qualifying assets relevant to our business are any of the following:
|
(1)
|
Securities purchased in transactions not involving any public offering from the issuer of such securities, which issuer (subject to certain limited exceptions) is an eligible portfolio company (as defined below), or from any person who is, or has been during the preceding 13 months, an affiliated person of an eligible portfolio company, or from any other person, subject to such rules as may be prescribed by the SEC.
|
|
(2)
|
Securities of any eligible portfolio company that we control.
|
|
(3)
|
Securities purchased in a private transaction from a U.S. issuer that is not an investment company or from an affiliated person of the issuer, or in transactions incident thereto, if the issuer is in bankruptcy and subject to reorganization or if the issuer, immediately prior to the purchase of its securities was unable to meet its obligations as they came due without material assistance other than conventional lending or financing arrangements.
|
|
(4)
|
Securities of an eligible portfolio company purchased from any person in a private transaction if there is no ready market for such securities and we already own 60% of the outstanding equity of the eligible portfolio company.
|
|
(5)
|
Securities received in exchange for or distributed on or with respect to securities described in (1) through (4) above, or pursuant to the exercise of warrants or rights relating to such securities.
|
|
(6)
|
Cash, cash equivalents, U.S. government securities or high-quality debt securities maturing in one year or less from the time of investment.
|
In addition, a BDC must have been organized and have its principal place of business in the United States and must be operated for the purpose of making investments in the types of securities described in (1), (2) or (3) above.
An eligible portfolio company is defined in the 1940 Act as any issuer which:
|
(a)
|
is organized under the laws of, and has its principal place of business in, the United States;
|
20
|
(b)
|
is not an investment company (other than a small business investment company wholly owned by the BDC) or a company that would be an investment company but for certain exclusions under the 1940 Act; and
|
|
(c)
|
satisfies any of the following:
|
|
(i)
|
does not have any class of securities that is traded on a national securities exchange or has a class of securities listed on a national securities exchange but has an aggregate market value of outstanding voting and non-voting common equity of less than $250 million;
|
|
(ii)
|
is controlled by a BDC or a group of companies including a BDC and the BDC has an affiliated person who is a director of the eligible portfolio company; or
|
|
(iii)
|
is a small and solvent company having total assets of not more than $4 million and capital and surplus of not less than $2 million.
|
Control, as defined by the 1940 Act, is presumed to exist where a business development company beneficially owns more than 25% of the outstanding voting securities of the portfolio company.
We do not intend to acquire securities issued by any investment company that exceed the limits imposed by the 1940 Act. Under these limits, we generally cannot acquire more than 3% of the voting stock of any investment company (as defined in the 1940 Act), invest more than 5% of the value of our total assets in the securities of one such investment company or invest more than 10% of the value of our total assets in the securities of such investment companies in the aggregate. With regard to that portion of our portfolio invested in securities issued by investment companies, it should be noted that such investments might subject our stockholders to additional expenses. None of our investment policies is fundamental and any may be changed without stockholder approval.
Significant Managerial Assistance
A BDC must have been organized and have its principal place of business in the United States and must be operated for the purpose of making investments in the types of securities described above. However, in order to count portfolio securities as qualifying assets for the purpose of the 70% test, the BDC must either control the issuer of the securities or must offer to make available to the issuer of the securities (other than small and solvent companies described above) significant managerial assistance; except that, where the BDC purchases such securities in conjunction with one or more other persons acting together, one of the other persons in the group may make available such managerial assistance. Making available significant managerial assistance means, among other things, any arrangement whereby the BDC, through its directors, officers or employees, offers to provide, and, if accepted, does so provide, significant guidance and counsel concerning the management, operations or business objectives and policies of a portfolio company through monitoring of portfolio company operations, selective participation in board and management meetings, consulting with and advising a portfolio company’s officers or other organizational or financial guidance.
Issuance of Additional Shares
We are not generally able to issue and sell our common stock at a price below net asset value, or NAV. We may, however, issue and sell our common stock, at a price below the current NAV of the common stock, or issue and sell warrants, options or rights to acquire such common stock, at a price below the current NAV of the common stock if our Board determines that such sale is in our best interest and in the best interests of our stockholders, and our stockholders have approved our policy and practice of making such sales within the preceding 12 months. On October 27, 2014 our stockholders approved our ability to issue common stock below our current NAV. In any such case, the price at which our securities are to be issued and sold may not be less than a price which, in the determination of our Board, closely approximates the market value of such securities.
In addition, under the 1940 Act, a BDC is subject to restrictions on the amount of warrants, options, restricted stock or rights to purchase shares of capital stock that it may have outstanding at any time. In particular, the amount of capital stock that would result from the conversion or exercise of all outstanding warrants, options or rights to purchase capital stock cannot exceed 25% of the BDC’s total outstanding shares of capital stock. This amount is reduced to 20% of the BDC’s total outstanding shares of capital stock if the amount of warrants, options or rights issued pursuant to an executive compensation plan would exceed 15% of the BDC’s total outstanding shares of capital stock
21
Temporary Investments
Pending investment in other types of qualifying assets, as described above, our investments may consist of cash, cash equivalents, U.S. government securities or high quality debt securities maturing in one year or less from the time of investment, which we refer to, collectively, as temporary investments, so that 70% of our assets are qualifying assets. Typically, we will invest in U.S. treasury bills or in repurchase agreements, provided that such agreements are fully collateralized by cash or securities issued by the U.S. government or its agencies. A repurchase agreement involves the purchase by an investor, such as us, of a specified security and the simultaneous agreement by the seller to repurchase it at an agreed upon future date and at a price which is greater than the purchase price by an amount that reflects an agreed-upon interest rate. There is no percentage restriction on the proportion of our assets that may be invested in such repurchase agreements. However, if more than 25% of our total assets constitute repurchase agreements from a single counterparty, we would not meet the diversification tests imposed on us by the Code in order to qualify as a RIC for federal income tax purposes. Thus, we do not intend to enter into repurchase agreements with a single counterparty in excess of this limit. We will monitor the creditworthiness of the counterparties with which we enter into repurchase agreement transactions.
Senior Securities; Coverage Ratio
We are permitted, under specified conditions, to issue multiple classes of indebtedness and one class of stock senior to our common stock if our asset coverage, as defined in the 1940 Act, is at least equal to 200% immediately after each such issuance. In addition, we may not be permitted to declare any cash dividend or other distribution on our outstanding common shares, or purchase any such shares, unless, at the time of such declaration or purchase, we have asset coverage of at least 200% after deducting the amount of such dividend, distribution, or purchase price. We may also borrow amounts up to 5% of the value of our total assets for temporary or emergency purposes. For a discussion of the risks associated with the resulting leverage, see “Risk Factors - Risks Related to Our Business Structure - Because we borrow money, the potential for loss on amounts invested in us is magnified and may increase the risk of investing in us.”
Code of Ethics
In connection with the BDC Conversion, we adopted a code of ethics pursuant to Rule 17j-1 under the 1940 Act that establishes procedures for personal investments and restricts certain transactions by our personnel. Our code of ethics generally will not permit investments by our employees in securities that may be purchased or held by us. You may read and copy our code of ethics at the SEC’s Public Reference Room in Washington, D.C. You may obtain information on the operation of the Public Reference Room by calling the SEC at 1-800-SEC-0330. In addition, the code of ethics is published and available on the Company’s website. at
www.thesba.com
and on the EDGAR database on the SEC website at
www,sec,gov
.
Proxy Voting Policies and Procedures
We vote proxies relating to our portfolio securities in a manner in which we believe is in the best interest of our stockholders. We review on a case-by-case basis each proposal submitted to a stockholder vote to determine its impact on the portfolio securities held by us. Although we generally vote against proposals that may have a negative impact on our portfolio securities, we may vote for such a proposal if there exists compelling long-term reasons to do so.
Our proxy voting decisions are made by our senior lending team and our executive committee, which are responsible for monitoring each of our investments. To ensure that our vote is not the product of a conflict of interest, we require that: (i) anyone involved in the decision making process disclose to our chief compliance officer any potential conflict that he or she is aware of and any contact that he or she has had with any interested party regarding a proxy vote; and (ii) employees involved in the decision making process or vote administration are prohibited from revealing how we intend to vote on a proposal in order to reduce any attempted influence from interested parties.
Stockholders may obtain information regarding how we voted proxies with respect to our portfolio securities by making a written request for information to: Chief Compliance Officer, 212 West 35th Street, 2nd Floor, New York, New York 10001.
Other
We will be periodically examined by the SEC for compliance with the Exchange Act and the 1940 Act.
We are required to provide and maintain a bond issued by a reputable fidelity insurance company to protect us against larceny and embezzlement. Furthermore, as a business development company, we are prohibited from protecting any director or officer
22
against any liability to our stockholders arising from willful misfeasance, bad faith, gross negligence or reckless disregard of the duties involved in the conduct of such person’s office.
We are required to adopt and implement written policies and procedures reasonably designed to prevent violation of the federal securities laws, review these policies and procedures annually for their adequacy and the effectiveness of their implementation. We have designated Matthew Ash to be our chief compliance officer to be responsible for administering these policies and procedures.
Privacy Principles
We are committed to maintaining the privacy of our stockholders and to safeguarding their non-public personal information. The following information is provided to help you understand what personal information we collect, how we protect that information and why, in certain cases, we may share information with select other parties.
Generally, we do not receive any non-public personal information relating to our stockholders, although certain non-public personal information of our stockholders may become available to us. We do not disclose any non-public personal information about our stockholders or former stockholders to anyone, except as permitted by law or as is necessary in order to service stockholder accounts (for example, to a transfer agent or third-party administrator).We will maintain physical, electronic and procedural safeguards designed to protect the non-public personal information of our stockholders.
NASDAQ Capital Market Requirements
We have adopted certain policies and procedures intended to comply with the NASDAQ Capital Market’s corporate governance rules. We will continue to monitor our compliance with all future listing standards that are approved by the SEC and will take actions necessary to ensure that we are in compliance therewith.
Election to be Taxed as a RIC
As a BDC, we intend to elect to be treated, and qualify annually thereafter, as a RIC under Subchapter M of the Code, beginning with our 2015 taxable year. As a RIC, we generally will not have to pay corporate-level U.S. federal income taxes on any income that we distribute to our stockholders as dividends. To qualify as a RIC, we must, among other things, meet certain source-of-income and asset diversification requirements (as described below). In addition, to qualify for RIC tax treatment we must distribute to our stockholders, for each taxable year, at least 90% of our “investment company taxable income,” which is generally our ordinary income plus the excess of our realized net short-term capital gains over our realized net long-term capital losses (the “Annual Distribution Requirement”).
Taxation as a Regulated Investment Company
For any taxable year in which we:
|
•
|
qualify as a RIC; and
|
|
•
|
satisfy the Annual Distribution Requirement,
|
we generally will not be subject to U.S. federal income tax on the portion of our income we distribute (or are deemed to distribute) to stockholders. We will be subject to U.S. federal income tax at the regular corporate rates on any income or capital gains not distributed (or deemed distributed) to our stockholders.
We will be subject to a 4% nondeductible U.S. federal excise tax on certain undistributed income unless we distribute in a timely manner an amount at least equal to the sum of (1) 98% of our net ordinary income for each calendar year, (2) 98.2% of our capital gain net income for the one-year period ending October 31 in that calendar year and (3) any income recognized, but not distributed, in preceding years and on which we paid no corporate-level income tax (the “Excise Tax Avoidance Requirement”). We generally will endeavor in each taxable year to make sufficient distributions to our stockholders to avoid any U.S. federal excise tax on our earnings.
In order to qualify as a RIC for U.S. federal income tax purposes, we must, among other things:
|
•
|
continue to qualify as a BDC under the 1940 Act at all times during each taxable year;
|
|
•
|
derive in each taxable year at least 90% of our gross income from dividends, interest, payments with respect to loans of certain securities, gains from the sale of stock or other securities, net income from certain “qualified publicly traded partnerships,” or other income derived with respect to our business of investing in such stock or securities (the “90% Income Test”); and
|
23
|
•
|
diversify our holdings so that at the end of each quarter of the taxable year:
|
|
•
|
at least 50% of the value of our assets consists of cash, cash equivalents, U.S. Government securities, securities of other RICs, and other securities if such other securities of any one issuer do not represent more than 5% of the value of our assets or more than 10% of the outstanding voting securities of the issuer; and
|
|
•
|
no more than 25% of the value of our assets is invested in the securities, other than U.S. government securities or securities of other RICs, of one issuer, of two or more issuers that are controlled, as determined under applicable Code rules, by us and that are engaged in the same or similar or related trades or businesses or of certain “qualified publicly traded partnerships” (the “Diversification Tests”).
|
Qualified earnings may exclude such income as management fees received in connection with our subsidiaries or other potential outside managed funds and certain other fees.
In accordance with certain applicable Treasury regulations and private letter rulings issued by the IRS, a RIC may treat a distribution of its own stock as fulfilling its RIC distribution requirements if each stockholder may elect to receive his or her entire distribution in either cash or stock of the RIC, subject to a limitation that the aggregate amount of cash to be distributed to all stockholders must be at least 20% of the aggregate declared distribution. If too many stockholders elect to receive cash, each stockholder electing to receive cash must receive a pro rata amount of cash (with the balance of the distribution paid in stock). In no event will any stockholder, electing to receive cash, receive less than 20% of his or her entire distribution in cash. If these and certain other requirements are met, for U.S. federal income tax purposes, the amount of the dividend paid in stock will be equal to the amount of cash that could have been received instead of stock. We have no current intention of paying dividends in shares of our stock in accordance with these Treasury regulations or private letter rulings.
We may be required to recognize taxable income in circumstances in which we do not receive cash. For example, if we hold debt obligations that are treated under applicable tax rules as having original issue discount (such as debt instruments with PIK interest or, in certain cases, increasing interest rates or issued with warrants), we must include in income each year a portion of the original issue discount that accrues over the life of the obligation, regardless of whether cash representing such income is received by us in the same taxable year. We may also have to include in income other amounts that we have not yet received in cash, such as PIK interest, deferred loan origination fees that are paid after origination of the loan or are paid in non-cash compensation such as warrants or stock, or certain income with respect to equity investments in foreign corporations. Because any original issue discount or other amounts accrued will be included in our investment company taxable income for the year of accrual, we may be required to make a distribution to our stockholders in order to satisfy the Annual Distribution Requirement, even though we will not have received any corresponding cash amount.
Gain or loss realized by us from the sale or exchange of warrants acquired by us as well as any loss attributable to the lapse of such warrants generally will be treated as capital gain or loss. Such gain or loss generally will be long-term or short-term, depending on how long we held a particular warrant.
Although we do not presently expect to do so, we are authorized to borrow funds and to sell assets in order to satisfy distribution requirements. However, under the 1940 Act, we are not permitted to make distributions to our stockholders while our debt obligations and other senior securities are outstanding unless certain “asset coverage” tests are met. Moreover, our ability to dispose of assets to meet our distribution requirements may be limited by (1) the illiquid nature of our portfolio and/or (2) other requirements relating to our status as a RIC, including the Diversification Tests. If we dispose of assets in order to meet the Annual Distribution Requirement or the Excise Tax Avoidance Requirement, we may make such dispositions at times that, from an investment standpoint, are not advantageous. If we are prohibited from making distributions or are unable to obtain cash from other sources to make the distributions, we may fail to qualify as a RIC, which would result in us becoming subject to corporate-level federal income tax.
In addition, we will be partially dependent on our subsidiaries for cash distributions to enable us to meet the RIC distribution requirements. Some of our subsidiaries may be limited by the Small Business Investment Act of 1958, and SBA regulations, from making certain distributions to us that may be necessary to maintain our status as a RIC. We may have to request a waiver of the SBA’s restrictions for our subsidiaries to make certain distributions to maintain our RIC status. We cannot assure you that the SBA will grant such waiver. If our subsidiaries are unable to obtain a waiver, compliance with the SBA regulations may cause us to fail to qualify as a RIC, which would result in us becoming subject to corporate-level federal income tax.
The remainder of this discussion assumes that we will qualify as a RIC and will have satisfied the Annual Distribution Requirement for the year ended December 31, 2015.
24
Any transactions in options, futures contracts, constructive sales, hedging, straddle, conversion or similar transactions, and forward contracts will be subject to special tax rules, the effect of which may be to accelerate income to us, defer losses, cause adjustments to the holding periods of our investments, convert long-term capital gains into short-term capital gains, convert short-term capital losses into long-term capital losses or have other tax consequences. These rules could affect the amount, timing and character of distributions to stockholders. We do not currently intend to engage in these types of transactions.
A RIC is limited in its ability to deduct expenses in excess of its “investment company taxable income” (which is, generally, ordinary income plus net realized short-term capital gains in excess of net realized long-term capital losses). If our expenses in a given year exceed gross taxable income (e.g., as the result of large amounts of equity-based compensation), we would experience a net operating loss for that year. However, a RIC is not permitted to carry forward net operating losses to subsequent years. In addition, expenses can be used only to offset investment company taxable income, not net capital gain. Due to these limits on the deductibility of expenses, we may for tax purposes have aggregate taxable income for several years that we are required to distribute and that is taxable to our stockholders even if such income is greater than the aggregate net income we actually earned during those years. Such required distributions may be made from our cash assets or by liquidation of investments, if necessary. We may realize gains or losses from such liquidations. In the event we realize net capital gains from such transactions, you may receive a larger capital gain distribution than you would have received in the absence of such transactions.
Investment income received from sources within foreign countries, or capital gains earned by investing in securities of foreign issuers, may be subject to foreign income taxes withheld at the source. In this regard, withholding tax rates in countries with which the United States does not have a tax treaty are often as high as 35% or more. The United States has entered into tax treaties with many foreign countries that may entitle us to a reduced rate of tax or exemption from tax on this related income and gains. The effective rate of foreign tax cannot be determined at this time since the amount of our assets to be invested within various countries is not now known. We do not anticipate being eligible for the special election that allows a RIC to treat foreign income taxes paid by such RIC as paid by its stockholders.
If we acquire stock in certain foreign corporations that receive at least 75% of their annual gross income from passive sources (such as interest, dividends, rents, royalties or capital gain) or hold at least 50% of their total assets in investments producing such passive income (“passive foreign investment companies”), we could be subject to federal income tax and additional interest charges on “excess distributions” received from such companies or gain from the sale of stock in such companies, even if all income or gain actually received by us is timely distributed to our stockholders. We would not be able to pass through to our stockholders any credit or deduction for such a tax. Certain elections may, if available, ameliorate these adverse tax consequences, but any such election requires us to recognize taxable income or gain without the concurrent receipt of cash. We intend to limit and/or manage our holdings in passive foreign investment companies to minimize our tax liability.
Foreign exchange gains and losses realized by us in connection with certain transactions involving non-dollar debt securities, certain foreign currency futures contracts, foreign currency option contracts, foreign currency forward contracts, foreign currencies, or payables or receivables denominated in a foreign currency are subject to Code provisions that generally treat such gains and losses as ordinary income and losses and may affect the amount, timing and character of distributions to our stockholders. Any such transactions that are not directly related to our investment in securities (possibly including speculative currency positions or currency derivatives not used for hedging purposes) could, under future Treasury regulations, produce income not among the types of “qualifying income” from which a RIC must derive at least 90% of its annual gross income.
Failure to Qualify as a RIC
If we fail to satisfy the Annual Distribution Requirement or fail to qualify as a RIC in any taxable year, assuming we do not qualify for or take advantage of certain remedial provisions, we will be subject to tax in that year on all of our taxable income, regardless of whether we make any distributions to our stockholders. In that case, all of our income will be subject to corporate-level federal income tax, reducing the amount available to be distributed to our stockholders. In contrast, assuming we qualify as a RIC, our corporate-level federal income tax liability should be substantially reduced or eliminated. See “Election to be Taxed as a RIC” above.
If we are unable to maintain our status as a RIC, we would be subject to tax on all of our taxable income at regular corporate rates. We would not be able to deduct distributions to stockholders, nor would they be required to be made. Distributions would generally be taxable to our stockholders as ordinary distribution income eligible for the 15% or 20% maximum rate to the extent of our current and accumulated earnings and profits. Subject to certain limitations under the Code, dividends paid by us to corporate distributees would be eligible for the dividends received deduction. Distributions in excess of our current and accumulated earnings and profits would be treated first as a return of capital to the extent of the stockholder’s tax basis in our common stock, and any remaining distributions would be treated as a capital gain.
25
Sarbanes-Oxley Act of 2002
The Sarbanes-Oxley Act of 2002 (the “Sarbanes-Oxley Act”) imposes a wide variety of new regulatory requirements on publicly-held companies and their insiders. Many of these requirements affect us. For example:
|
•
|
Pursuant to Rule 13a-14 of the 1934 Act, our Chief Executive Officer and Chief Accounting Officer must certify the accuracy of the consolidated financial statements contained in our periodic reports;
|
|
•
|
Pursuant to Item 307 of Regulation S-K, our periodic reports must disclose our conclusions about the effectiveness of our disclosure controls and procedures;
|
|
•
|
Pursuant to Rule 13a-15 of the 1934 Act, our management must prepare a report regarding its assessment of our internal controls over financial reporting; and
|
|
•
|
Pursuant to Item 308 of Regulation S-K and Rule 13a-15 of the 1934 Act, our periodic reports must disclose whether there were significant changes in our internal controls or in other factors that could significantly affect these controls subsequent to the date of their evaluation, including any corrective actions with regard to significant deficiencies and material weaknesses.
|
The Sarbanes-Oxley Act requires us to review our current policies and procedures to determine whether we comply with the Sarbanes-Oxley Act and the regulations promulgated thereunder. We will continue to monitor our compliance with all regulations that are adopted under the Sarbanes-Oxley Act and will take actions necessary to ensure that we are in compliance therewith.
The following is a summary of the risk factors that we believe are most relevant to our business. These are factors that, individually or in the aggregate, we think could cause our actual results to differ significantly from anticipated or historical results. If any of the following risks occur, our business, financial condition and results of operations could be materially and adversely affected. In that case, the value of our common stock could decline and stockholders may lose all or part of their investment. You should understand that it is not possible to predict or identify all such factors. Consequently, you should not consider the following to be a complete discussion of all potential risks or uncertainties. We undertake no obligation to publicly update forward-looking statements, whether as a result of new information, future events, or otherwise, unless required by law.
RISKS RELATING TO OUR BUSINESS AND STRUCTURE
Throughout our 16 year history we have never operated as a BDC
Although Newtek has operated since 1998, we have no operating history as a BDC. As a result, we can offer no assurance that we will achieve our investment objective and that the value of any investment in our Company will not decline substantially. As a BDC, we will be subject to the regulatory requirements of the SEC, in addition to the specific regulatory requirements applicable to BDCs under the 1940 Act and RICs under the Code. Our management has not had any prior experience operating under this BDC regulatory framework, and we may incur substantial additional costs, and expend significant time or other resources, to do so. In addition, we may be unable to generate sufficient revenue from our operations to make or sustain distributions to our stockholders.
Our investment portfolio will be recorded at fair value, with our board of directors having final responsibility for overseeing, reviewing and approving, in good faith, its estimate of fair value and, as a result, there will be uncertainty as to the value of our portfolio investments.
Under the 1940 Act, we will be required to carry our portfolio investments at market value or, if there is no readily available market value, at fair value as determined by us, with our board of directors having final responsibility for overseeing, reviewing and approving, in good faith, our estimate of fair value. Typically, there will not be a public market for the securities of the privately held companies in which we invest. As a result, we will value these securities annually and quarterly at fair value based on various inputs, including management, third-party valuation firms and our audit committee, and with the oversight, review and approval of our board of directors.
26
The determination of fair value and consequently, the amount of unrealized gains and losses in our portfolio, are to a certain degree, subjective and dependent on a valuation process approved by our board of directors. Certain factors that may be considered in determining the fair value of our investments include external events, such as private mergers, sales and acquisitions involving comparable companies. Because such valuations, and particularly valuations of private securities and private companies, are inherently uncertain, they may fluctuate over short periods of time and may be based on estimates. Our determinations of fair value may differ materially from the values that would have been used if a ready market for these securities existed. Due to this uncertainty, our fair value determinations may cause our net asset value on a given date to materially understate or overstate the value that we may ultimately realize on one or more of our investments. As a result, investors purchasing our common stock based on an overstated net asset value would pay a higher price than the value of our investments might warrant. Conversely, investors selling stock during a period in which the net asset value understates the value of our investments will receive a lower price for their stock than the value of our investments might warrant.
Our financial condition and results of operations will depend on our ability to manage and deploy capital effectively.
Our ability to achieve our investment objective will depend on our ability to manage and deploy capital, which will depend, in turn, on our management’s ability to identify, evaluate and monitor, and our ability to finance and invest in, companies that meet our investment criteria.
Accomplishing our investment objective on a cost-effective basis will largely be a function of our management’s handling of the investment process, its ability to provide competent, attentive and efficient services and our access to investments offering acceptable terms. In addition to monitoring the performance of our existing investments, our senior lending team and our executive committee will also be called upon, from time to time, to provide managerial assistance to some of our portfolio companies. These demands on their time may distract them or slow the rate of investment.
Even if we are able to grow and build upon our investment operations, any failure to manage our growth effectively could have a material adverse effect on our business, financial condition, results of operations and prospects. The results of our operations will depend on many factors, including the availability of opportunities for investment, readily accessible short and long-term funding alternatives in the financial markets and economic conditions. Furthermore, if we cannot successfully operate our business or implement our investment policies and strategies as described herein, it could negatively impact our ability to pay dividends.
We are dependent upon our senior lending team and our executive committee for our future success, and if we are unable to hire and retain qualified personnel or if we lose any member of our senior lending team or our executive committee our ability to achieve our investment objective could be significantly harmed.
We depend on our senior lending team and executive committee as well as other key personnel for the identification, final selection, structuring, closing and monitoring of our investments. These executive officers and employees have critical industry experience and relationships that we rely on to implement our business plan. Our future success depends on the continued service of our senior lending team and our executive committee and the replacement of any departing individuals with others of comparable skills and experience. The departure of any of the members of our senior lending team, our executive committee or a significant number of our senior personnel could have a material adverse effect on our ability to achieve our investment objective. As a result, we may not be able to operate our business as we expect, and our ability to compete could be harmed, which could cause our operating results to suffer.
We operate in a highly competitive market for investment opportunities, which could reduce returns and result in losses.
We will compete for investments with other BDCs with similar investment strategies, private equity funds with similar investment strategies, venture lending funds, finance companies with venture lending units and banks focused on venture lending. Many of our competitors will be substantially larger and have considerably greater financial, technical and marketing resources than us. For example, some competitors may have a lower cost of capital and access to funding sources that will not be available to us. In addition, some of our competitors may have higher risk tolerances or different risk assessments than we will have. These characteristics could allow our competitors to consider a wider variety of investments, establish more relationships and offer better pricing and more flexible structuring than we will be able to offer. We may lose investment opportunities if we do not match our competitors’ pricing, terms and structure. If we are forced to match our competitors’ pricing, terms and structure, we may not be able to achieve acceptable returns on our investments or may bear substantial risk of capital loss. Furthermore, many of our competitors will have greater experience operating under, or will not be subject to, the regulatory restrictions that the 1940 Act will impose on us as a BDC.
If we are unable to source investments effectively, we may be unable to achieve our investment objective.
27
Our ability to achieve our investment objective depends on our senior lending team’s and our executive committee’s ability to identify, evaluate and invest in suitable companies that meet our investment criteria. Accomplishing this result on a cost-effective basis is largely a function of our marketing capabilities, our management of the investment process, our ability to provide efficient services and our access to financing sources on acceptable terms. In addition to monitoring the performance of our existing investments, members of our senior lending team, our executive committee and our other investment professionals may also be called upon to provide managerial assistance to our portfolio companies. These demands on their time may distract them or slow the rate of investment. To grow, we need to continue to hire, train, supervise and manage new employees and to implement computer and other systems capable of effectively accommodating our growth. However, we cannot provide assurance that any such employees will contribute to the success of our business or that we will implement such systems effectively. Failure to manage our future growth effectively could have a material adverse effect on our business, financial condition and results of operations.
Our business model depends to a significant extent upon strong referral relationships, and our inability to maintain or further develop these relationships, as well as the failure of these relationships to generate investment opportunities, could adversely affect our business.
We expect that members of our senior lending team and our executive committee will maintain their relationships with intermediaries, financial institutions, investment bankers, commercial bankers, financial advisors, attorneys, accountants, consultants and other individuals within their networks, and we will rely to a significant extent upon these relationships to provide us with potential investment opportunities. If our senior lending team and our executive committee fail to maintain its existing relationships or develop new relationships with sources of investment opportunities, we will not be able to grow our investment portfolio. In addition, individuals with whom members of our senior lending team and our executive committee have relationships are not obligated to provide us with investment opportunities, and, therefore, there is no assurance that such relationships will generate investment opportunities for us.
Any failure on our part to maintain our status as a BDC would reduce our operating flexibility.
We have elected to be regulated as a BDC under the 1940 Act. The 1940 Act imposes numerous constraints on the operations of BDCs. For example, BDCs are required to invest at least 70% of their gross assets in specified types of securities, primarily in private companies or thinly-traded U.S. public companies, cash, cash equivalents, U.S. government securities and other high quality debt investments that mature in one year or less. Furthermore, any failure to comply with the requirements imposed on BDCs by the 1940 Act could cause the SEC to bring an enforcement action against us and/or expose us to claims of private litigants. In addition, upon approval of a majority of our stockholders, we may elect to withdraw our status as a BDC. If we decide to withdraw our election, or if we otherwise fail to qualify, or maintain our qualification, as a BDC, we may be subject to the substantially greater regulation under the 1940 Act as a closed-end investment company. Compliance with such regulations would significantly decrease our operating flexibility, and could significantly increase our costs of doing business.
Regulations governing our operation as a BDC affect our ability to raise additional capital and the way in which we do so. As a BDC, the necessity of raising additional capital may expose us to risks, including the typical risks associated with leverage.
We may issue debt securities or preferred stock and/or borrow money from banks or other financial institutions, which we refer to collectively as “senior securities,” up to the maximum amount permitted by the 1940 Act. Under the provisions of the 1940 Act, we will be permitted, as a BDC, to issue senior securities in amounts such that our asset coverage ratio, as defined in the 1940 Act, equals at least 200% of gross assets less all liabilities and indebtedness not represented by senior securities, after each issuance of senior securities. If the value of our assets declines, we may be unable to satisfy this test. If that happens, we may be required to sell a portion of our investments and, depending on the nature of our leverage, repay a portion of our indebtedness at a time when such sales may be disadvantageous. Also, any amounts that we use to service our indebtedness would not be available for distributions to our common stockholders. Continuing to expand our debt financing activities in SBA 7(a) loans will require us to raise additional capital. The failure to continue to generate such loans on a consistent basis could have a material impact on our results of operations, and accordingly, our ability to make distributions to our stockholders. Additionally, as a RIC, we will generally be unable to retain earnings in the same manner and to the same extent as we have historically, which consequently increases the need to raise additional debt and equity capital after completion of this offering. Furthermore, as a result of issuing senior securities, we would also be exposed to typical risks associated with leverage, including an increased risk of loss. If we issue preferred stock, the preferred stock would rank “senior” to common stock in our capital structure, preferred stockholders would have separate voting rights on certain matters and might have other rights, preferences, or privileges more favorable than those of our common stockholders, and the issuance of preferred stock could
28
have the effect of delaying, deferring or preventing a transaction or a change of control that might involve a premium price for holders of our common stock or otherwise be in your best interest.
We generally may not issue and sell our common stock at a price below net asset value per share. We may, however, sell our common stock, or warrants, options or rights to acquire our common stock, at a price below the then-current net asset value per share of our common stock if our board of directors determines that such sale is in our best interests and in the best interests of our stockholders, and our stockholders approve such sale. In any such case, the price at which our securities are to be issued and sold may not be less than a price that, in the determination of our board of directors, closely approximates the market value of such securities (less any distributing commission or discount). If we raise additional funds by issuing more common stock or senior securities convertible into, or exchangeable for, our common stock, then the percentage ownership of our stockholders at that time will decrease, and you may experience dilution.
Because we borrow money, the potential for loss on amounts invested in us is magnified and may increase the risk of investing in us.
Borrowings, also known as leverage, magnify the potential for loss on investments in our indebtedness and on invested equity capital. As we use leverage to partially finance our investments, you will experience increased risks of investing in our securities. If the value of our assets increases, then leveraging would cause the net asset value attributable to our common stock to increase more sharply than it would have had we not leveraged. Conversely, if the value of our assets decreases, leveraging would cause net asset value to decline more sharply than it otherwise would have had we not leveraged our business. Similarly, any increase in our income in excess of interest payable on the borrowed funds would cause our net investment income to increase more than it would without the leverage, while any decrease in our income would cause net investment income to decline more sharply than it would have had we not borrowed. Such a decline could negatively affect our ability to pay common stock dividends, scheduled debt payments or other payments related to our securities. Leverage is generally considered a speculative investment technique.
Illustration:
The following table illustrates the effect of leverage on returns from an investment in our common stock assuming various annual returns, net of expenses. The calculations in the table below are hypothetical and actual returns may be higher or lower than those appearing in the table below:
|
Assumed Return on Our Portfolio (1)
(net of expenses)
|
||||||||||
|
(10
|
)%
|
(5
|
)%
|
0
|
%
|
5
|
%
|
10
|
%
|
|
|
Corresponding net return to stockholders (2)
|
(20.82
|
)%
|
(11.76
|
)%
|
(2.69
|
)%
|
6.38
|
%
|
15.45
|
%
|
(1) Assumes $301.8 million in total assets, $122.5 million in debt outstanding, $166.4 million in net assets as of December 31, 2014, and an average cost of funds of 3.65%. Actual interest payments may be different.
(2) In order for us to cover our annual interest payments on indebtedness, we must achieve annuals returns on our December 31, 2014 total assets of at least 1.48%.
Our ability to achieve our investment objective may depend in part on our ability to access additional leverage on favorable terms, and there can be no assurance that such additional leverage can in fact be achieved.
To the extent we borrow money to finance our investments, changes in interest rates will affect our cost of capital and net investment income.
To the extent we borrow money to finance investments, our net investment income will depend, in part, upon the difference between the rate at which we borrow funds and the rate at which we invest those funds. As a result, we can offer no assurance that a significant change in market interest rates will not have a material adverse effect on our net investment income in the event we borrow money to finance our investments. In periods of rising interest rates, our cost of funds would increase, which could reduce our net investment income. We expect that our long-term fixed-rate investments will be financed primarily with equity and/or long-term debt. We may use interest rate risk management techniques in an effort to limit our exposure to interest rate fluctuations. Such techniques may include various interest rate hedging activities to the extent permitted by the 1940 Act. If we do not implement these techniques properly, we could experience losses on our hedging positions, which could be material.
We may experience fluctuations in our quarterly and annual results.
29
We may experience fluctuations in our quarterly and annual operating results due to a number of factors, including our ability or inability to make investments in companies that meet our investment criteria, the interest rate payable on the debt securities we acquire, the level of portfolio dividend and fee income, the level of our expenses, variations in and the timing of the recognition of realized and unrealized gains or losses, the degree to which we encounter competition in our markets and general economic conditions. As a result of these factors, results for any period should not be relied upon as being indicative of performance in future periods.
Our board of directors may change our investment objective, operating policies and strategies without prior notice or stockholder approval, the effects of which may be adverse.
Although we must obtain shareholder approval to cease to be, or withdraw our election as, a BDC, our board of directors will have the authority to modify or waive our investment objective, current operating policies, investment criteria and strategies without prior notice and without stockholder approval. We cannot predict the effect any changes to our current operating policies, investment criteria and strategies would have on our business, net asset value, operating results and value of our stock. However, the effects might be adverse, which could negatively impact our ability to make distributions and cause stockholders to lose all or part of their investment.
We will be subject to corporate-level income tax if we are unable to qualify as a RIC.
Although we intend to elect to be treated as a RIC commencing with our tax year ending December 31, 2015, no assurance can be given that we will be able to qualify for and maintain our qualification as a RIC. To obtain and maintain our qualification as a RIC, we must meet certain source-of-asset diversification, and distribution requirements.
The income source requirement will be satisfied if we obtain at least 90% of our income for each year from dividends, interest, gains from the sale of stock or securities or similar sources.
The asset diversification requirement will be satisfied if we meet certain asset diversification requirements at the end of each quarter of our taxable year. Failure to meet those requirements may result in our having to dispose of certain investments quickly in order to prevent the loss of our qualification as a RIC. Because most of our investments will be in private companies, and therefore will be relatively illiquid, any such dispositions could be made at disadvantageous prices and could result in substantial losses. The annual distribution requirement for a RIC will be satisfied if we distribute to our stockholders on an annual basis at least 90% of our net ordinary income and net short-term capital gains in excess of our net long-term capital losses, if any. Because we use debt financing, we are subject to certain asset coverage ratio requirements under the 1940 Act and financial covenants under loan and credit agreements that could, under certain circumstances, restrict us from making distributions necessary to satisfy the distribution requirement. If we are unable to obtain cash from other sources, we could fail to qualify as a RIC.
If we fail to qualify for RIC tax treatment for any reason and remain or become subject to corporate income tax, the resulting corporate taxes could substantially reduce our net assets, the amount of income available for distribution and the amount of our
distributions.
We may not be able to pay distributions to our stockholders, our distributions may not grow over time and a portion of our distributions may be a return of capital.
We intend to pay distributions to our stockholders out of assets legally available for distribution. We cannot assure investors that we will achieve investment results that will allow us to make a specified level of cash distributions or year-to-year increases in cash distributions. Our ability to pay distributions might be adversely affected by, among other things, the impact of one or more of the risk factors described in this prospectus. In addition, the inability to satisfy the asset coverage test applicable to us as a BDC can limit our ability to pay distributions. All distributions will be paid at the discretion of our board of directors and will depend on our earnings, our financial condition, maintenance of our RIC status, compliance with applicable BDC regulations and such other factors as our board of directors may deem relevant from time to time. We cannot assure investors that we will pay distributions to our stockholders in the future.
When we make distributions, we will be required to determine the extent to which such distributions are paid out of current or accumulated earnings and profits. Distributions in excess of current and accumulated earnings and profits will be treated as a non-taxable return of capital to the extent of an investor’s basis in our stock and, assuming that an investor holds our stock as a capital asset, thereafter as a capital gain. Generally, a non-taxable return of capital will reduce an investor’s basis in our stock for federal tax purposes, which will result in higher tax liability when the stock is sold. Stockholders should read any written
30
disclosure accompanying a distribution carefully and should not assume that the source of any distribution is our ordinary income or gains.
We may have difficulty paying our required distributions if we recognize income before or without receiving cash representing such income.
For U.S. federal income tax purposes, we will include in our taxable income certain amounts that we have not yet received in cash, such as original issue discount, which may arise if we receive warrants in connection with the origination of a loan or possibly in other circumstances, or PIK interest. Such original issue discount or increases in loan balances as a result of contractual PIK arrangements will be included in our taxable income before we receive any corresponding cash payments. We also may be required to include in our taxable income certain other amounts that we will not receive in cash.
Since, in certain cases, we may recognize taxable income before or without receiving corresponding cash payments, we may have difficulty meeting the annual distribution requirement necessary to maintain our qualification as a RIC. Accordingly, to satisfy our RIC distribution requirements, we may have to sell some of our investments at times and/or at prices we would not consider advantageous, raise additional debt or equity capital or forgo new investment opportunities. If we are not able to obtain cash from other sources, we may fail to qualify as a RIC and thus become subject to corporate-level income tax.
We may in the future choose to pay dividends in our own stock, in which case investors may be required to pay tax in excess of the cash they receive.
We may distribute taxable dividends that are payable in part in our stock. In accordance with certain applicable Treasury regulations and private letter rulings issued by the Internal Revenue Service (“IRS”), a RIC may treat a distribution of its own stock as fulfilling the RIC distribution requirements if each stockholder may elect to receive his or her entire distribution in either cash or stock of the RIC, subject to a limitation that the aggregate amount of cash to be distributed to all stockholders must be at least 20% of the aggregate declared distribution. If too many stockholders elect to receive cash, each stockholder electing to receive cash must receive a pro rata amount of cash (with the balance of the distribution paid in stock). In no event will any stockholder, electing to receive cash, receive less than 20% of his or her entire distribution in cash. If these and certain other requirements are met, for U.S. federal income tax purposes, the amount of the dividend paid in stock will be equal to the amount of cash that could have been received instead of stock. Taxable stockholders receiving such dividends will be required to include the amount of the dividends as ordinary income (or as long-term capital gain to the extent such distribution is properly reported as a capital gain dividend) to the extent of our current and accumulated earnings and profits for United States federal income tax purposes. As a result, a U.S. stockholder may be required to pay tax with respect to such dividends in excess of any cash received. If a U.S. stockholder sells the stock it receives as a dividend in order to pay this tax, the sales proceeds may be less than the amount included in income with respect to the dividend, depending on the market price of our stock at the time of the sale. Furthermore, with respect to non-U.S. stockholders, we may be required to withhold U.S. tax with respect to such dividends, including in respect of all or a portion of such dividend that is payable in stock. In addition, if a significant number of our stockholders determine to sell shares of our stock in order to pay taxes owed on dividends, it may put downward pressure on the trading price of our stock.
We have identified material weaknesses in our internal control over financial reporting for 2012. Future internal control deficiencies could impact the accuracy of our financial results or prevent the detection of fraud. As a result, stockholders could lose confidence in our financial and other public reporting, which would harm our business and the trading price of our common stock.
Effective internal controls over financial reporting are necessary for us to provide reliable financial reports and, together with adequate disclosure controls and procedures, are designed to prevent fraud. We identified material weaknesses in our internal control over financial reporting for 2012. A material weakness is a deficiency, or a combination of deficiencies, in internal control over financial reporting such that there is a reasonable possibility that a material misstatement of the Company’s annual or interim financial statements will not be prevented or detected on a timely basis. We have taken steps to remediate our internal control processes, but any failure by us to identify future deficiencies in our internal control over financial reporting in a timely manner or remediate any such deficiencies, could prevent us from accurately and timely reporting our financial results. Inferior internal controls could also cause investors to lose confidence in our reported financial information, which could have a negative effect on the trading price of our common stock.
We will be required to disclose changes made in our internal control and procedures on a quarterly basis and our management will be required to assess the effectiveness of these controls annually. An independent assessment of the effectiveness of our internal controls could detect problems that our management’s assessment might not. Undetected material weaknesses in our internal controls could lead to financial statement restatements and require us to incur the expense of remediation. In the event
31
that we are unable to maintain or achieve compliance with Section 404 of the Sarbanes-Oxley Act and related rules, the market price of our common stock may be adversely affected.
Changes in laws or regulations governing our operations may adversely affect our business or cause us to alter our business strategy.
We and our portfolio companies will be subject to applicable local, state and federal laws and regulations, including, without limitation, federal immigration laws and regulations. New legislation may be enacted or new interpretations, rulings or regulations could be adopted, including those governing the types of investments we are permitted to make, any of which could harm us and our stockholders, potentially with retroactive effect. Additionally, any changes to the laws and regulations governing our operations relating to permitted investments may cause us to alter our investment strategy in order to avail ourselves of new or different opportunities. Such changes could result in material differences to the strategies and plans set forth herein and may result in our investment focus shifting from the areas of expertise of our senior lending team and our executive committee to other types of investments in which our senior lending team and our executive committee may have less expertise or little or no experience. Thus, any such changes, if they occur, could have a material adverse effect on our results of operations and the value of your investment.
Curtailment of the government-guaranteed loan programs could cut off an important segment of our business.
Although the program has been in existence since 1953, there can be no assurance that the federal government will maintain the SBA program, or that it will continue to guarantee loans at current levels. If we cannot continue making and selling government-guaranteed loans, we will generate fewer origination fees and our ability to generate gains on sale of loans will decrease. From time-to-time, the government agencies that guarantee these loans reach their internal budgeted limits and cease to guarantee loans for a stated time period. In addition, these agencies may change their rules for extending loans. Also, Congress may adopt legislation that would have the effect of discontinuing or changing the programs. Non-governmental programs could replace government programs for some borrowers, but the terms might not be equally acceptable. If these changes occur, the volume of loans to SMBs and industrial borrowers of the types that now qualify for government-guaranteed loans could decline, as could the profitability of these loans.
Our business is subject to increasingly complex corporate governance, public disclosure and accounting requirements that are costly and could adversely affect our business and financial results.
As a publicly traded company, we incur legal, accounting and other expenses, including costs associated with the periodic reporting requirements applicable to a company whose securities are registered under the Securities Exchange Act of 1934, as amended, or the Exchange Act, as well as additional corporate governance requirements, including requirements under the Sarbanes-Oxley Act, and other rules implemented by the SEC. Also, we are subject to changing rules and regulations of federal and state government as well as the stock exchange on which our common stock is listed. These entities, including the Public Company Accounting Oversight Board, the SEC and the NASDAQ Global Select Market, have issued a significant number of new and increasingly complex requirements and regulations over the last several years and continue to develop additional regulations and requirements in response to laws enacted by Congress. For example, on July 21, 2010, the Dodd-Frank Wall Street Reform and Protection Act, or the Dodd-Frank Act, was enacted. There are significant corporate governance and executive compensation-related provisions in the Dodd-Frank Act that require the SEC to adopt additional rules and regulations in these areas such as “say on pay” and proxy access. Our efforts to comply with these requirements may result in an increase in expenses and a diversion of management’s time from other business activities.
Although passage of the Dodd-Frank Act has resulted in extensive rulemaking and regulatory changes that affect us and the financial industry as a whole, many of its provisions remain subject to extended implementation periods and delayed effective dates and will require extensive rulemaking by regulatory authorities. While the full impact of the Dodd-Frank Act on us and our portfolio companies may not be known for an extended period of time, the Dodd-Frank Act, including future rules implementing its provisions and the interpretation of those rules, along with other legislative and regulatory proposals directed at the financial services industry or affecting taxation that are proposed or pending in the U.S. Congress, may negatively impact the operations, cash flows or financial condition of us or our portfolio companies, impose additional costs on us or our portfolio companies, intensify the regulatory supervision of us or our portfolio companies or otherwise adversely affect our business or the business of our portfolio companies.
To the extent original issue discount and PIK interest constitute a portion of our income, we will be exposed to typical risks associated with such income being required to be included in taxable and accounting income prior to receipt of cash representing such income.
32
Our investments may include original issue discount, or original issue discount (“OID”), instruments and contractual PIK, interest, which represents contractual interest added to a loan balance and due at the end of such loan’s term. To the extent OID or PIK interest constitute a portion of our income, we are exposed to typical risks associated with such income being required to be included in taxable and accounting income prior to receipt of cash, including the following:
|
•
|
OID instruments may have higher yields, which reflect the payment deferral and credit risk associated with these instruments;
|
|
•
|
OID accruals may create uncertainty about the source of our distributions to stockholders;
|
|
•
|
OID and PIK instruments may have unreliable valuations because their continuing accruals require continuing judgments about the collectability of the deferred payments and the value of the collateral; and
|
|
•
|
OID and PIK instruments may represent a higher credit risk than coupon loans.
|
If we cannot obtain additional capital because of either regulatory or market price constraints, we could be forced to curtail or cease our new lending and investment activities, our net asset value could decrease and our level of distributions and liquidity could be affected adversely.
Our ability to secure additional financing and satisfy our financial obligations under indebtedness outstanding from time to time will depend upon our future operating performance, which is subject to the prevailing general economic and credit market conditions, including interest rate levels and the availability of credit generally, and financial, business and other factors, many of which are beyond our control. The prolonged continuation or worsening of current economic and capital market conditions could have a material adverse effect on our ability to secure financing on favorable terms, if at all.
If we are unable to obtain additional debt capital, then our equity investors will not benefit from the potential for increased returns on equity resulting from leverage to the extent that our investment strategy is successful and we may be limited in our ability to make new commitments or fundings to our portfolio companies.
Uncertainty about the financial stability of the United States and of several countries in the European Union (EU) could have a significant adverse effect on our business, results of operations and financial condition.
Due to federal budget deficit concerns, S&P downgraded the federal government’s credit rating from AAA to AA+ for the first time in history on August 5, 2011. Further, Moody’s and Fitch have warned that they may downgrade the federal government’s credit rating. Further downgrades or warnings by S&P or other rating agencies, and the government’s credit and deficit concerns in general, could cause interest rates and borrowing costs to rise, which may negatively impact both the perception of credit risk associated with our debt portfolio and our ability to access the debt markets on favorable terms. In addition, a decreased credit rating could create broader financial turmoil and uncertainty, which may weigh heavily on our financial performance and the value of our common stock.
In 2010, a financial crisis emerged in Europe, triggered by high budget deficits and rising direct and contingent sovereign debt in Greece, Ireland, Italy, Portugal and Spain, which created concerns about the ability of these nations to continue to service their sovereign debt obligations. Risks and ongoing concerns resulting from the debt crisis in Europe could have a detrimental impact on the global economic recovery, sovereign and non-sovereign debt in these countries and the financial condition of European financial institutions. Market and economic disruptions have affected, and may continue to affect, consumer confidence levels and spending, personal bankruptcy rates, levels of incurrence and default on consumer debt and home prices, among other factors. We cannot assure you that the market disruptions in Europe, including the increased cost of funding for certain governments and financial institutions, will not spread, and we cannot assure you that future assistance packages will be available, or if available, sufficient to stabilize the affected countries and markets in Europe or elsewhere. To the extent uncertainty regarding any economic recovery in Europe continues to negatively impact consumer confidence and consumer credit factors, our business and results of operations could be significantly and adversely affected.
In October 2014, the U.S. Federal Reserve announced that it has terminated its bond-buying program, or quantitative easing, which was designed to stimulate the economy and expand the Federal Reserve’s holdings of long-term securities until key economic indicators, such as the unemployment rate, showed signs of improvement. It is unclear what effect, if any, the Federal Reserve’s termination of quantitative easing will have on the value of our investments. However, it is possible that without quantitative easing by the Federal Reserve, these developments, along with the European sovereign debt crisis, could cause interest rates and borrowing costs to rise, which may negatively impact our ability to access the debt markets on favorable terms.
33
A failure or the perceived risk of a failure to raise the statutory debt limit of the United States could have a material adverse effect on our business, financial condition and results of operations.
In the future, the United States federal government may not be able to meet its debt payments unless the federal debt ceiling is raised. If legislation increasing the debt ceiling is not enacted, as needed, and the debt ceiling is reached, the federal government may stop or delay making payments on its obligations. A failure by Congress to raise the debt limit would increase the risk of default by the United States on its obligations, as well as the risk of other economic dislocations.
If the U.S. government fails to complete its budget process or to provide for a continuing resolution before the expiration of the current continuing resolution, a federal government shutdown may result. Such a failure or the perceived risk of such a failure, consequently, could have a material adverse effect on the financial markets and economic conditions in the United States and throughout the world. It could also limit our ability and the ability of our portfolio companies to obtain financing, and it could have a material adverse effect on the valuation of our portfolio companies. Consequently, the continued uncertainty in the general economic environment, including the recent government shutdown and potential debt ceiling implications, as well in specific economies of several individual geographic markets in which our portfolio companies operate, could adversely affect our business, financial condition and results of operations.
A disruption in the capital markets and the credit markets could impair our ability to raise capital and negatively affect our business.
As a BDC, we must maintain our ability to raise additional capital for investment purposes. Without sufficient access to the capital markets or credit markets, we may be forced to curtail our business operations or we may not be able to pursue new business opportunities.
In recent years, the capital markets and the credit markets have experienced periods of extreme volatility and disruption and, accordingly, there has been and may continue to be uncertainty in the financial markets in general. Continuing U.S. debt ceiling and budget deficit concerns, including automatic spending cuts stemming from sequestration and together with deteriorating sovereign debt conditions in Europe, have increased the possibility of additional credit-rating downgrades and economic slowdowns, or a recession in the United States. The impact of this or any further downgrades to the U.S. government’s sovereign credit rating or its perceived creditworthiness could adversely affect the U.S. and global financial markets and economic conditions. Absent further quantitative easing by the Federal Reserve Board, these developments, along with the European sovereign debt crisis, could cause interest rates and borrowing costs to rise, which may negatively impact our ability to access the debt markets on favorable terms. Continued adverse economic conditions could have a material adverse effect on our business, financial condition and results of operations. Any further disruptive conditions in the financial industry and the impact of new legislation in response to those conditions could restrict our business operations and could adversely impact our results of operations and financial condition.
If the fair value of our assets declines substantially, we may fail to maintain the asset coverage ratios imposed upon us by the 1940 Act. Any such failure would affect our ability to issue securities, including borrowings, and pay dividends, which could materially impair our business operations. Our liquidity could be impaired further by an inability to access the capital markets or to consummate new borrowing facilities to provide capital for normal operations, including new originations. In recent years, reflecting concern about the stability of the financial markets, many lenders and institutional investors have reduced or ceased providing funding to borrowers.
We are highly dependent on information systems and systems failures could significantly disrupt our business, which may, in turn, negatively affect the market price of our common stock and our ability to make distributions to our stockholders.
Our business is highly dependent on our communications and information systems. Certain of these systems are provided to us by third party service providers. Any failure or interruption of such systems, including as a result of the termination of an agreement with any such third party service provider, could cause delays or other problems in our activities. This, in turn, could have a material adverse effect on our operating results and negatively affect the market price of our common stock and our ability to make distributions to our stockholders.
Terrorist attacks, acts of war or natural disasters may affect any market for our common stock, impact the businesses in which we invest and harm our business, operating results and financial condition.
Terrorist acts, acts of war or natural disasters may disrupt our operations, as well as the operations of the businesses in which we invest. Such acts have created, and continue to create, economic and political uncertainties and have contributed to global
34
economic instability. Future terrorist activities, military or security operations, or natural disasters could further weaken the domestic/global economies and create additional uncertainties, which may negatively impact the businesses in which we invest directly or indirectly and, in turn, could have a material adverse impact on our business, operating results and financial condition. Losses from terrorist attacks and natural disasters are generally uninsurable.
RISKS RELATING TO OUR INVESTMENTS GENERALLY
Our investments are very risky and highly speculative.
We invest primarily in senior secured term loans and select equity investments issued by companies, some of which are highly leveraged.
Senior Secured Loans
. There is a risk that the collateral securing our loans, in most cases real estate, may decrease in value over time, may be difficult to sell in a timely manner, may be difficult to appraise and may fluctuate in value based upon the success of the business and market conditions, including as a result of the inability of the portfolio company to raise additional capital, and, in some circumstances, our lien could be subordinated to claims of other creditors. In addition, deterioration in a portfolio company’s financial condition and prospects, including its inability to raise additional capital, may be accompanied by deterioration in the value of the collateral for the loan. Consequently, the fact that a loan is secured does not guarantee that we will receive principal and interest payments according to the loan’s terms, or at all, or that we will be able to collect on the loan should we be forced to enforce our remedies. In some cases we may take second lien position on additional business or personal assets to secure further our first lien positions.
Equity Investments.
We occasionally invest directly in the equity securities of portfolio companies. The equity interests we receive may not appreciate in value and, in fact, may decline in value. Accordingly, we may not be able to realize gains from our equity interests, and any gains that we do realize on the disposition of any equity interests may not be sufficient to offset any other losses we experience.
In addition, investing in SMBs involves a number of significant risks, including:
|
•
|
these companies may have limited financial resources and may be unable to meet their obligations under their debt securities that we hold, which may be accompanied by a deterioration in the value of any collateral and a reduction in the likelihood of us realizing any guarantees we may have obtained in connection with our investment;
|
|
•
|
they typically have shorter operating histories, narrower product lines and smaller market shares than larger businesses, which tend to render them more vulnerable to competitors’ actions and market conditions, as well as general economic downturns;
|
|
•
|
they are more likely to depend on the management talents and efforts of a small group of persons; therefore, the death, disability, resignation or termination of one or more of these persons could have a material adverse impact on our portfolio company and, in turn, on us;
|
|
•
|
they generally have less predictable operating results, may from time to time be parties to litigation, may be engaged in rapidly changing businesses with products subject to a substantial risk of obsolescence, and may require substantial additional capital to support their operations, finance expansion or maintain their competitive position;
|
|
•
|
they may have difficulty accessing the capital markets to meet future capital needs, which may limit their ability to grow or to repay their outstanding indebtedness upon maturity; and
|
|
•
|
our executive officers and directors may, in the ordinary course of business, be named as defendants in litigation arising from our investments in the portfolio companies.
|
An investment strategy focused primarily on smaller privately held companies involves a high degree of risk and presents certain challenges, including the lack of available information about these companies, a dependence on the talents and efforts of only a few key portfolio company personnel and a greater vulnerability to economic downturns.
Our portfolio will consist primarily of debt and equity investments in smaller privately-owned companies. Investing in these types of companies involves a number of significant risks. Typically, the debt in which we will invest is not initially rated by any rating agency; however, we believe that if such investments were rated, they would be below investment grade. Compared
35
to larger publicly owned companies, these small companies may be in a weaker financial position and experience wider variations in their operating results, which may make them more vulnerable to economic downturns. Typically, these companies need more capital to compete; however, their access to capital is limited and their cost of capital is often higher than that of their competitors. Our portfolio companies often face intense competition from larger companies with greater financial, technical and marketing resources and their success typically depends on the managerial talents and efforts of an individual or a small group of persons. Therefore, any loss of its key employees could affect a portfolio company’s ability to compete effectively and harm its financial condition. Further, some of these companies conduct business in regulated industries that are susceptible to regulatory changes. These factors could impair the cash flow of our portfolio companies and result in other events, such as bankruptcy. These events could limit a portfolio company’s ability to repay its obligations to us, which may have an adverse effect on the return on, or the recovery of, our investment in these businesses. Deterioration in a borrower’s financial condition and prospects may be accompanied by deterioration in the value of the loan’s collateral.
Generally, little public information exists about these companies, and we are required to rely on the ability of our senior lending team and our executive committee to obtain adequate information to evaluate the potential returns from investing in these companies. If we are unable to uncover all material information about these companies, we may not make a fully informed investment decision, and we may lose money on our investments. Also, privately held companies frequently have less diverse product lines and smaller market presence than larger competitors. These factors could adversely affect our investment returns as compared to companies investing primarily in the securities of public companies.
Our investments in leveraged portfolio companies may be risky, and you could lose all or part of your investment.
Investment in leveraged companies involves a number of significant risks. Leveraged companies in which we invest may have limited financial resources and may be unable to meet their obligations under their loans and debt securities that we hold. Such developments may be accompanied by a deterioration in the value of any collateral and a reduction in the likelihood of our realizing any guarantees that we may have obtained in connection with our investment. Smaller leveraged companies also may have less predictable operating results and may require substantial additional capital to support their operations, finance their expansion or maintain their competitive position.
Our portfolio companies may incur debt that ranks equally with, or senior to, our investments in such companies.
Our portfolio companies may have, or may be permitted to incur, other debt that ranks equally with, or in some cases senior to, the debt in which we invest. By their terms, such debt instruments may entitle the holders to receive payment of interest or principal on or before the dates on which we are entitled to receive payments with respect to the debt instruments in which we invest. Also, in the event of insolvency, liquidation, dissolution, reorganization or bankruptcy of a portfolio company, holders of debt instruments ranking senior to our investment in that portfolio company would typically be entitled to receive payment in full before we receive any distribution. After repaying such senior creditors, such portfolio company may not have sufficient remaining assets to repay its obligation to us. In the case of debt ranking equally with debt instruments in which we invest, we would have to share on an equal basis any distributions with other creditors holding such debt in the event of an insolvency, liquidation, dissolution, reorganization or bankruptcy of the relevant portfolio company.
Second priority liens on collateral securing loans that we make to our portfolio companies may be subject to control by senior creditors with first priority liens. If there is a default, the value of the collateral may not be sufficient to repay in full both the first priority creditors and us.
Certain loans that we make are secured by a second priority security interest in the same collateral pledged by a portfolio company to secure senior first lien debt owed by the portfolio company to commercial banks or other traditional lenders. Often the senior lender has procured covenants from the portfolio company prohibiting the incurrence of additional secured debt without the senior lender’s consent. Prior to and as a condition of permitting the portfolio company to borrow money from us secured by the same collateral pledged to the senior lender, the senior lender will require assurances that it will control the disposition of any collateral in the event of bankruptcy or other default. In many such cases, the senior lender will require us to enter into an “intercreditor agreement” prior to permitting the portfolio company to borrow from us. Typically the intercreditor agreements we will be requested to expressly subordinate our debt instruments to those held by the senior lender and further provide that the senior lender shall control: (1) the commencement of foreclosure or other proceedings to liquidate and collect on the collateral; (2) the nature, timing and conduct of foreclosure or other collection proceedings; (3) the amendment of any collateral document; (4) the release of the security interests in respect of any collateral; and (5) the waiver of defaults under any security agreement. Because of the control we may cede to senior lenders under intercreditor agreements we may enter, we may be unable to realize the proceeds of any collateral securing some of our loans.
36
If we make subordinated investments, the obligors or the portfolio companies may not generate sufficient cash flow to service their debt obligations to us.
We may make subordinated investments that rank below other obligations of the obligor in right of payment. Subordinated investments are subject to greater risk of default than senior obligations as a result of adverse changes in the financial condition of the obligor or economic conditions in general. If we make a subordinated investment in a portfolio company, the portfolio company may be highly leveraged, and its relatively high debt-to-equity ratio may create increased risks that its operations might not generate sufficient cash flow to service all of its debt obligations.
The disposition of our investments may result in contingent liabilities.
We currently expect that substantially all of our investments will involve loans and private securities. In connection with the disposition of an investment in loans and private securities, we may be required to make representations about the business and financial affairs of the portfolio company typical of those made in connection with the sale of a business. We may also be required to indemnify the purchasers of such investment to the extent that any such representations turn out to be inaccurate or with respect to potential liabilities. These arrangements may result in contingent liabilities that ultimately result in funding obligations that we must satisfy through our return of distributions previously made to us.
There may be circumstances where our debt investments could be subordinated to claims of other creditors or we could be subject to lender liability claims.
Even though we may have structured certain of our investments as secured loans, if one of our portfolio companies were to go bankrupt, depending on the facts and circumstances, and based upon principles of equitable subordination as defined by existing case law, a bankruptcy court could subordinate all or a portion of our claim to that of other creditors and transfer any lien securing such subordinated claim to the bankruptcy estate. The principles of equitable subordination defined by case law have generally indicated that a claim may be subordinated only if its holder is guilty of misconduct or where the senior loan is re-characterized as an equity investment and the senior lender has actually provided significant managerial assistance to the bankrupt debtor. We may also be subject to lender liability claims for actions taken by us with respect to a borrower’s business or instances where we exercise control over the borrower. It is possible that we could become subject to a lender’s liability claim, including as a result of actions taken in rendering significant managerial assistance or actions to compel and collect payments from the borrower outside the ordinary course of business.
Economic recessions could impair our portfolio companies and harm our operating results.
Certain of our portfolio companies may be susceptible to an economic downturn and may be unable to repay our loans during this period. Therefore, assets may become non-performing and the value of our portfolio may decrease during this period. The adverse economic conditions also may decrease the value of collateral securing some of our loans and the value of our equity investments. A recession could lead to financial losses in our portfolio and a decrease in revenues, net income and the value of our assets.
The lack of liquidity in our investments may adversely affect our business.
We generally invest in companies whose securities are not publicly traded, and whose securities will be subject to legal and other restrictions on resale or will otherwise be less liquid than publicly traded securities. There is no established trading market for the securities in which we invest. The illiquidity of these investments may make it difficult for us to sell these investments when desired. In addition, if we are required to liquidate all or a portion of our portfolio quickly, we may realize significantly less than the value at which we had previously recorded these investments. As a result, we do not expect to achieve liquidity in our investments in the near-term. Further, we may face other restrictions on our ability to liquidate an investment in a portfolio company to the extent that we have material non-public information regarding such portfolio company.
Our failure to make follow-on investments in our portfolio companies could impair the value of our portfolio.
Following an initial investment in a portfolio company, we may make additional investments in that portfolio company as “follow-on” investments, in order to: (1) increase or maintain in whole or in part our equity ownership percentage; (2) exercise warrants, options or convertible securities that were acquired in the original or a subsequent financing; or (3) attempt to preserve or enhance the value of our investment. We may elect not to make follow-on investments or otherwise lack sufficient funds to make those investments. We will have the discretion to make any follow-on investments, subject to the availability of capital resources. The failure to make follow-on investments may, in some circumstances, jeopardize the continued viability of a portfolio company and our initial investment, or may result in a missed opportunity for us to increase our participation in a
37
successful operation. Even if we have sufficient capital to make a desired follow-on investment, we may elect not to make a follow-on investment because we do not want to increase our concentration of risk, we prefer other opportunities, we are subject to BDC requirements that would prevent such follow-on investments, or the follow-on investment would affect our qualification as a RIC.
Our portfolio may lack diversification among portfolio companies which may subject us to a risk of significant loss if one or more of these companies defaults on its obligations under any of its debt instruments.
Our portfolio may hold a limited number of portfolio companies. Beyond the asset diversification requirements associated with our qualification as a RIC under the Code, we will not have fixed guidelines for diversification, and our investments may be concentrated in relatively few companies. As our portfolio is less diversified than the portfolios of some larger funds, we are more susceptible to failure if a single loan fails. Similarly, the aggregate returns we realize may be significantly adversely affected if a small number of investments perform poorly or if we need to write down the value of any one investment.
We are a non-diversified investment company within the meaning of the 1940 Act, and therefore we may invest a significant portion of our assets in a relatively small number of issuers, which subjects us to a risk of significant loss if any of these
issuers defaults on its obligations under any of its debt instruments or as a result of a downturn in the particular industry.
We are classified as a non-diversified investment company within the meaning of the 1940 Act, and therefore we may invest a significant portion of our assets in a relatively small number of issuers in a limited number of industries. As of December 31, 2014, our two largest investments, Newtek Merchant Solutions and Newtek Technology Solutions, equaled approximately 15% and 7%, respectively, of the fair value of our total assets. Beyond the asset diversification requirements associated with our qualification as a RIC, we do not have fixed guidelines for diversification, and while we are not targeting any specific industries, relatively few industries may become significantly represented among our investments. To the extent that we assume large positions in the securities of a small number of issuers, our net asset value may fluctuate to a greater extent than that of a diversified investment company as a result of changes in the financial condition or the market’s assessment of the issuer, changes in fair value over time or a downturn in any particular industry. We may also be more susceptible to any single economic or regulatory occurrence than a diversified investment company.
Our portfolio may be concentrated in a limited number of industries, which may subject us to a risk of significant loss if there is a downturn in a particular industry in which a number of our investments are concentrated.
Our portfolio may be concentrated in a limited number of industries. A downturn in any particular industry in which we are invested could significantly impact the aggregate returns we realize. If an industry in which we have significant investments suffers from adverse business or economic conditions, as these industries have to varying degrees, a material portion of our investment portfolio could be affected adversely, which, in turn, could adversely affect our financial position and results of operations.
Because we may not hold controlling equity interests in certain of our portfolio companies, we may not be in a position to exercise control over our portfolio companies or to prevent decisions by management of our portfolio companies that could decrease the value of our investments.
We do not currently hold controlling equity positions in the majority of our portfolio companies where our investments are in the form of debt, particularly SBA loans. As a result, we are subject to the risk that a portfolio company may make business decisions with which we disagree, and that the management and/or stockholders of a portfolio company may take risks or otherwise act in ways that are adverse to our interests. Due to the lack of liquidity of the debt and equity investments that we typically hold in our portfolio companies, we may not be able to dispose of our investments in the event we disagree with the actions of a portfolio company and may therefore suffer a decrease in the value of our investments.
Defaults by our portfolio companies will harm our operating results.
A portfolio company’s failure to satisfy financial or operating covenants imposed by us or other lenders could lead to defaults and, potentially, termination of its loans and foreclosure on its secured assets, which could trigger cross-defaults under other agreements and jeopardize our portfolio company’s ability to meet its obligations under the debt securities that we hold. We may incur expenses to the extent necessary to seek recovery upon default or to negotiate new terms with a defaulting portfolio company. Any extension or restructuring of our loans could adversely affect our cash flows. In addition, if one of our portfolio companies were to go bankrupt, even though we may have structured our interest as senior debt, depending on the facts and circumstances, including the extent to which we actually provided managerial assistance to that portfolio company, a
38
bankruptcy court might recharacterize our debt holding and subordinate all or a portion of our claim to that of other creditors. If any of these occur, it could materially and adversely affect our operating results and cash flows.
If we and our portfolio companies are unable to protect our intellectual property rights, our business and prospects could be harmed, and if we and our portfolio companies are required to devote significant resources to protecting their intellectual property rights, the value of our investment could be reduced.
The proprietary software essential to our business and that of our controlled portfolio companies is owned by us and made available to them for their use. Our future success and competitive position will depend in part upon our ability to maintain and protect proprietary technology used in our products and services. We will rely, in part, on patent, trade secret and trademark law to protect that technology, but competitors may misappropriate our intellectual property, and disputes as to ownership of intellectual property may arise. We may, from time to time, be required to institute litigation to enforce the patents, copyrights or other intellectual property rights, protect trade secrets, determine the validity and scope of the proprietary rights of others or defend against claims of infringement. Such litigation could result in substantial costs and diversion of resources.
Prepayments of our debt investments by our portfolio companies could adversely impact our results of operations and reduce our return on equity.
We will be subject to the risk that the investments we make in our portfolio companies may be repaid prior to maturity; our SBA loans do not carry prepayment penalties. When this occurs, we will generally reinvest these proceeds in temporary investments or repay outstanding debt, depending on future investment in new portfolio companies. Temporary investments will typically have substantially lower yields than the debt being prepaid and we could experience significant delays in reinvesting these amounts. Any future investment in a new portfolio company may also be at lower yields than the debt that was repaid. As a result, our results of operations could be materially adversely affected if one or more of our portfolio companies elect to prepay amounts owed to us. Additionally, prepayments could negatively impact our return on equity, which could result in a decline in the market price of our common stock.
We may not realize gains from our equity investments.
Certain investments that we may make in the future include warrants or other equity securities. Investments in equity securities involve a number of significant risks, including the risk of further dilution as a result of additional issuances, inability to access additional capital and failure to pay current distributions. Investments in preferred securities involve special risks, such as the risk of deferred distributions, credit risk, illiquidity and limited voting rights. In addition, we may from time to time make non-control, equity investments in portfolio companies. Our goal is ultimately to realize gains upon our disposition of such equity interests. However, the equity interests we receive may not appreciate in value and, in fact, may decline in value. Accordingly, we may not be able to realize gains from our equity interests, and any gains that we do realize on the disposition of any equity interests may not be sufficient to offset any other losses we experience. We also may be unable to realize any value if a portfolio company does not have a liquidity event, such as a sale of the business, recapitalization or public offering, which would allow us to sell the underlying equity interests. We will often seek puts or similar rights to give us the right to sell our equity securities back to the portfolio company issuer. We may be unable to exercise these puts rights for the consideration provided in our investment documents if the issuer is in financial distress.
We may expose ourselves to risks if we engage in hedging transactions.
If we engage in hedging transactions, we may expose ourselves to certain risks associated with such transactions. We may utilize instruments such as forward contracts, currency options and interest rate swaps, caps, collars and floors to seek to hedge against fluctuations in the relative values of our portfolio positions from changes in currency exchange rates and market interest rates. Hedging against a decline in the values of our portfolio positions does not eliminate the possibility of fluctuations in the values of such positions or prevent losses if the values of such positions decline. However, such hedging can establish other positions designed to gain from those same developments, thereby offsetting the decline in the value of such portfolio positions. Such hedging transactions may also limit the opportunity for gain if the values of the underlying portfolio positions increase. It may not be possible to hedge against an exchange rate or interest rate fluctuation that is so generally anticipated that we are not able to enter into a hedging transaction at an acceptable price. Moreover, for a variety of reasons, we may not seek to establish a perfect correlation between such hedging instruments and the portfolio holdings being hedged. Any such imperfect correlation may prevent us from achieving the intended hedge and expose us to risk of loss. In addition, it may not be possible to hedge fully or perfectly against currency fluctuations affecting the value of securities denominated in non-U.S. currencies because the value of those securities is likely to fluctuate as a result of factors not related to currency fluctuations.
We have specific risks associated with SBA loans.
39
We have generally sold the guaranteed portion of SBA loans in the secondary market. Such sales have resulted in our earning premiums and creating a stream of servicing income. There can be no assurance that we will be able to continue originating these loans, or that a secondary market will exist for, or that we will continue to realize premiums upon the sale of the guaranteed portions of the SBA 7(a) loans.
Since we sell the guaranteed portion of substantially all of our SBA 7(a) loan portfolio, we retain credit risk on the non-guaranteed portion of the SBA loans. We share pro rata with the SBA in any recoveries. In the event of default on an SBA loan, our pursuit of remedies against a borrower is subject to SBA approval, and where the SBA establishes that its loss is attributable to deficiencies in the manner in which the loan application has been prepared, submitted and approved, the SBA may decline to honor its guarantee with respect to our SBA loans or it may seek the recovery of damages from us. If we should experience significant problems with our underwriting of SBA loans, such failure to honor a guarantee or the cost to correct the problems could have a material adverse effect on us.
An increase in non-performing assets would reduce our income and increase our expenses.
If our level of non-performing assets in our SBA lending business rises in the future, it could adversely affect our revenue and earnings. Non-performing assets are primarily loans on which borrowers are not making their required payments. Non-performing assets also include loans that have been restructured to permit the borrower to have smaller payments and real estate that has been acquired through foreclosure of unpaid loans. To the extent that our financial assets are non-performing, we will have less cash available for lending and other activities.
Our reserve for credit losses may not be sufficient to cover unexpected losses.
Our business depends on the behavior of our customers. In addition to our credit practices and procedures, we maintain a reserve for credit losses on our SBA loans, which management has judged to be adequate given the loans we originate. We periodically review our reserve for adequacy considering current economic conditions and trends, collateral values, charge-off experience, levels of past due loans and non-performing assets, and we adjust our reserve accordingly. However, because of the poor current economic conditions caused by the recession, our reserves may prove inadequate, which could have a material adverse effect on our financial condition and results of operations. As a BDC, we will no longer record reserves as all of our loans will be marked to market or carried at fair value.
If the assets securing the loans that we make decrease in value, then we may lack sufficient collateral to cover losses.
To attempt to mitigate credit risks, we will typically take a security interest in the available assets of our portfolio companies. There is no assurance that we will obtain or properly perfect our liens.
There is a risk that the collateral securing our loans may decrease in value over time, may be difficult to sell in a timely manner, may be difficult to appraise and may fluctuate in value based upon the success of the business and market conditions, including as a result of the inability of a portfolio company to raise additional capital. In some circumstances, our lien could be subordinated to claims of other creditors. Consequently, the fact that a loan is secured does not guarantee that we will receive principal and interest payments according to the loan’s terms, or that we will be able to collect on the loan should we be forced to enforce our remedies.
In addition, because we may invest in technology-related companies, a substantial portion of the assets securing our investment may be in the form of intellectual property, if any, inventory and equipment and, to a lesser extent, cash and accounts receivable. Intellectual property, if any, that is securing our loan could lose value if, among other things, the company’s rights to the intellectual property are challenged or if the company’s license to the intellectual property is revoked or expires, the technology fails to achieve its intended results or a new technology makes the intellectual property functionally obsolete. Inventory may not be adequate to secure our loan if our valuation of the inventory at the time that we made the loan was not accurate or if there is a reduction in the demand for the inventory.
Similarly, any equipment securing our loan may not provide us with the anticipated security if there are changes in technology or advances in new equipment that render the particular equipment obsolete or of limited value, or if the company fails to adequately maintain or repair the equipment. Any one or more of the preceding factors could materially impair our ability to recover principal in a foreclosure.
We could be adversely affected by weakness in the residential housing and commercial real estate markets.
Continued weakness in residential home and commercial real estate values could impair our ability to collect on defaulted SBA loans as real estate is pledged in many of our SBA loans as part of the collateral package.
40
RISKS RELATING TO OUR CONTROLLED PORTFOLIO COMPANIES - NEWTEK MERCHANT SOLUTIONS (NMS)
We could be adversely affected if either of NMS’s two bank sponsors is terminated.
NMS relies on two bank sponsors, which have substantial discretion with respect to certain elements of our electronic payment processing business practices, in order to process bankcard transactions. If either of the sponsorships is terminated, and we are not able to secure or transfer the respective merchant portfolio to a new bank sponsor or sponsors, the business, financial condition, results of operations and cash flows of electronic payment processing business could be materially adversely affected. If both sponsorships are terminated, and NMS is not able to secure or transfer the merchant portfolios to new bank sponsors, NMS will not be able to conduct its electronic payment processing business. NMS also relies on service providers who are critical to its business.
Because NMS is not a bank, it is unable to belong to and directly access the Visa® and MasterCard® bankcard associations. The Visa® and MasterCard® operating regulations require NMS to be sponsored by a bank in order to process bankcard transactions. NMS is currently sponsored by two banks. If both the sponsorships are terminated and NMS is unable to secure a bank sponsor for the merchant portfolios, it will not be able to process bankcard transactions for the affected portfolios. Consequently, the loss of both of NMS’s sponsorships would have a material adverse effect on our business. Furthermore, NMS’s agreement with sponsoring banks gives the sponsoring banks substantial discretion in approving certain elements of its business practices, including its solicitation, application and qualification procedures for merchants, the terms of our agreements with merchants, the processing fees that we charge, its customer service levels and its use of independent sales organizations and independent sales agents. We cannot guarantee that NMS’s sponsoring banks’ actions under these agreements will not be detrimental to us.
Other service providers, some of whom are NMS’s competitors, are necessary for the conduct of NMS’s business. The termination by service providers of these arrangements with NMS or their failure to perform these services efficiently and effectively may adversely affect NMS’s relationships with the merchants whose accounts it serves and may cause those merchants to terminate their processing agreements with NMS.
If NMS or its processors or bank sponsors fail to adhere to the standards of the Visa
®
and MasterCard
®
bankcard associations, its registrations with these associations could be terminated and it could be required to stop providing payment processing services for Visa
®
and MasterCard
®
.
Substantially all of the transactions NMS processes involve Visa® or MasterCard®. If NMS, its bank sponsors or its processors fail to comply with the applicable requirements of the Visa® and MasterCard® bankcard associations, Visa® or MasterCard® could suspend or terminate its registration. The termination of NMS’s registration or any changes in the Visa® or MasterCard® rules that would impair its registration could require it to stop providing payment processing services, which would have a material adverse effect on its business.
On occasion, NMS experiences increases in interchange and sponsorship fees. If it cannot pass along these increases to its merchants, its profit margins will be reduced.
Our electronic payment processing portfolio company pays interchange fees or assessments to bankcard associations for each transaction it processes using their credit, debit and gift cards. From time to time, the bankcard associations increase the interchange fees that they charge processors and the sponsoring banks, which generally pass on such increases to NMS. From time to time, the sponsoring banks increase their fees as well. If NMS is not able to pass these fee increases along to merchants through corresponding increases in its processing fees, its profit margins in this line of business will be reduced.
Unauthorized disclosure of merchant or cardholder data, whether through breach of our computer systems or otherwise, could expose us to liability and business losses.
Through NMS, we collect and store sensitive data about merchants and cardholders, and we maintain a database of cardholder data relating to specific transactions, including payment, card numbers and cardholder addresses, in order to process the transactions and for fraud prevention and other internal processes. If anyone penetrates our network security or otherwise misappropriates sensitive merchant or cardholder data, we could be subject to liability or business interruption. While we subject these systems to periodic independent testing and review, we cannot guarantee that our systems will not be penetrated in the future. If a breach of our system occurs, we may be subject to liability, including claims for unauthorized purchases with misappropriated card information, impersonation or other similar fraud claims. Similar risks exist with regard to the storage and transmission of such data by our processors. In the event of any such a breach, we may also be subject to a class action lawsuit.
41
SMBs are less prepared for the complexities of safeguarding cardholder data than their larger counterparts. In the event of noncompliance by a customer of card industry rules, we could face fines from payment card networks. There can be no assurance that we would be able to recover any such fines from such customer.
NMS is liable if its processing merchants refuse or cannot reimburse charge-backs resolved in favor of their customers.
If a billing dispute between a merchant and a cardholder is not ultimately resolved in favor of the merchant, the disputed transaction is “charged back” to the merchant’s bank and credited to the account of the cardholder. If NMS or our processing banks are unable to collect the charge-back from the merchant’s account, or if the merchant refuses or is financially unable due to bankruptcy or other reasons to reimburse the merchant’s bank for the charge-back, NMS must bear the loss for the amount of the refund paid to the cardholder’s bank. Most of NMS’s merchants deliver products or services when purchased, so a contingent liability for charge-backs is unlikely to arise, and credits are issued on returned items. However, some of its merchants do not provide services until sometime after a purchase, which increases the potential for contingent liability and future charge backs. NMS and the sponsoring bank can require that merchants maintain cash reserves under our control to cover charge back liabilities but such reserves may not be sufficient to cover the liability or may not even be available to us in the event of a bankruptcy or other legal action.
NMS has potential liability for customer or merchant fraud.
Credit card fraud occurs when a merchant’s customer uses a stolen card (or a stolen card number in a card-not-present transaction) to purchase merchandise or services. In a traditional card-present transaction, if the merchant swipes the card, receives authorization for the transaction from the card issuing bank and verifies the signature on the back of the card against the paper receipt signed by the customer, the card issuing bank remains liable for any loss. In a fraudulent card-not-present transaction, even if the merchant receives authorization for the transaction, the merchant is liable for any loss arising from the transaction. Many NMS customers are small and transact a substantial percentage of their sales over the Internet or by telephone or mail orders. Because their sales are card-not-present transactions, these merchants are more vulnerable to customer fraud than larger merchants, and NMS could experience charge-backs arising from cardholder fraud more frequently with these merchants.
Merchant fraud occurs when a merchant, rather than a customer, knowingly uses a stolen or counterfeit card or card number to record a false sales transaction or intentionally fails to deliver the merchandise or services sold in an otherwise valid transaction. Anytime a merchant is unable to satisfy a charge-back, NMS is ultimately responsible for that charge-back unless it has required that a cash reserve be established. We cannot assure that the systems and procedures we have established to detect and reduce the impact of merchant fraud are or will be effective. Failure to effectively manage risk and prevent fraud could increase NMS charge-back liability and adversely affect our results of operations.
NMS payment processing systems may fail due to factors beyond its control, which could interrupt its business or cause it to lose business and likely increase costs.
NMS depends on the uninterrupted operations of our computer network systems, software and our processors’ data centers. Defects in these systems or damage to them due to factors beyond its control could cause severe disruption to NMS’s business and other material adverse effects on its payment processing businesses.
The electronic payment processing business is undergoing very rapid technological changes which may make it difficult or impossible for NMS to compete effectively.
The introduction of new technologies, primarily mobile payment capabilities, and the entry into the payment processing market of new competitors, Apple, Inc., for example, could dramatically change the competitive environment and require significant changes and costs for NMS to remain competitive. There is no assurance that NMS will have the capability to stay competitive with such changes.
NMS and others in the payment processing industry have come under increasing pressures from various regulatory agencies seeking to use the leverage of the payment processing business to limit or modify the practices of merchants which could lead to increased costs.
Various agencies, particularly the Federal Trade Commission, have within the past few years attempted to pressure merchants to discontinue or modify various sales or other practices. As a part of the payment processing industry, processors such as NMS could experience pressure and/or litigation aimed at restricting access to credit card sales by such merchants. These efforts
42
could cause an increase in the cost to NMS of doing business or otherwise make its business less profitable and may subject NMS and others to attempts to assess penalties for not taking actions deemed sufficiently aggressive to limit such practices.
Increased regulatory focus on the payments industry may result in costly new compliance burdens on NMS’ clients and on NMS itself, leading to increased costs and decreased payments volume and revenues.
Regulation of the payments industry has increased significantly in recent years. Complying with these and other regulations increases costs and can reduce revenue opportunities. Similarly, the impact of such regulations on clients may reduce the volume of payments processed. Moreover, such regulations can limit the types of products and services that offered. Any of these occurrences can materially and adversely affect NMS’ business, prospects for future growth, financial condition and results of operations.
Examples include:
|
•
|
Data Protection and Information Security
. Aspects of NMS’ operations and business are subject to privacy and data protection regulation. NMS’ financial institution clients are subject to similar requirements under the guidelines issued by the federal banking agencies. In addition, many individual states have enacted legislation requiring consumer notification in the event of a security breach.
|
|
•
|
Anti-Money Laundering and Anti-Terrorism Financing
. The U.S.A. PATRIOT Act requires NMS to maintain an anti-money laundering program. Sanctions imposed by the U.S. Treasury Office of Foreign Assets Control, or OFAC, restrict NMS from dealing with certain parties considered to be connected with money laundering, terrorism or narcotics. NMS has controls in place designed to ensure OFAC compliance, but if those controls should fail, it could be subject to penalties, reputational damage and loss of business.
|
|
•
|
Money Transfer Regulations.
As NMS expands its product offerings, it may become subject to money transfer regulations, increasing regulatory oversight and costs of compliance.
|
|
•
|
Formal Investigation.
If NMS is suspected of violating government statutes, such as the Federal Trade Commission Act or the Telemarketing and Consumer Fraud and Abuse Prevention Act, governmental agencies may formally investigate NMS. As a result of such a formal investigation, criminal or civil charges could be filed against NMS and it could be required to pay significant fines or penalties in connection with such investigation or other governmental investigations. Any criminal or civil charges by a governmental agency, including any fines or penalties, could materially harm NMS’ business, results of operations, financial position and cash flows. Currently, NMS is subject to a complaint issued by the Federal Trade Commission.
|
RISKS RELATING TO OUR CONTROLLED PORTFOLIO COMPANIES - NEWTEK MANAGED TECHNOLOGY SOLUTIONS (NTS)
NTS operates in a highly competitive industry in which technological change can be rapid.
The information technology business and its related technology involve a broad range of rapidly changing technologies. NTS equipment and the technologies on which it is based may not remain competitive over time, and others may develop superior technologies that render its products non-competitive, without significant additional capital expenditures. Some of NTS’s competitors are significantly larger and have substantially greater market presence as well as greater financial, technical, operational, marketing and other resources and experience than NTS. In the event that such a competitor expends significant sales and marketing resources in one or several markets, NTS may not be able to compete successfully in such markets. We believe that competition will continue to increase, placing downward pressure on prices. Such pressure could adversely affect NTS gross margins if it is not able to reduce its costs commensurate with such price reductions. There can be no assurances that NTS will remain competitive.
NTS’s managed technology solutions business depends on the efficient and uninterrupted operation of its computer and communications hardware systems and infrastructure.
Despite precautions taken by NTS against possible failure of its systems, interruptions could result from natural disasters, power loss, the inability to acquire fuel for its backup generators, telecommunications failure, terrorist attacks and similar events. NTS also leases telecommunications lines from local, regional and national carriers whose service may be interrupted. NTS’s business, financial condition and results of operations could be harmed by any damage or failure that interrupts or delays
43
its operations. There can be no assurance that its insurance will cover all of the losses or compensate NTS for the possible loss of clients occurring during any period that NTS is unable to provide service.
NTS’s inability to maintain the integrity of its infrastructure and the privacy of confidential information would materially affect its business.
The NTS infrastructure is potentially vulnerable to physical or electronic break-ins, viruses or similar problems. If its security measures are circumvented, it could jeopardize the security of confidential information stored on NTS’s systems, misappropriate proprietary information or cause interruptions in NTS’s operations. We may be required to make significant additional investments and efforts to protect against or remedy security breaches. Security breaches that result in access to confidential information could damage our reputation and expose us to a risk of loss or liability. The security services that NTS offers in connection with customers’ networks cannot assure complete protection from computer viruses, break-ins and other disruptive problems. The occurrence of these problems may result in claims against NTS or us or liability on our part. These claims, regardless of their ultimate outcome, could result in costly litigation and could harm our business and reputation and impair NTS’s ability to attract and retain customers.
NTS’s business depends on Microsoft Corporation and others for the licenses to use software as well as other intellectual property in the managed technology solutions business.
NTS’s managed technology business is built on technological platforms relying on the Microsoft Windows® products and other intellectual property that NTS currently licenses. As a result, if NTS is unable to continue to have the benefit of those licensing arrangements or if the products upon which its platform is built become obsolete, its business could be materially and adversely affected.
RISKS RELATING TO OUR CONTROLLED PORTFOLIO COMPANIES - INSURANCE AGENCY BUSINESS (NIA)
NIA depends on third parties, particularly property and casualty insurance companies, to supply the products marketed by its agents.
NIA contracts with property and casualty insurance companies typically provide that the contracts can be terminated by the supplier without cause. NIA’s inability to enter into satisfactory arrangements with these suppliers or the loss of these relationships for any reason would adversely affect the results of its new insurance business. Also, NIA’s inability to obtain these products at competitive prices could make it difficult for it to compete with larger and better capitalized providers of such insurance services.
If NIA fails to comply with government regulations, its insurance agency business would be adversely affected.
NIA insurance agency business is subject to comprehensive regulation in the various states in which it conducts business. NIA’s success will depend in part upon its ability to satisfy these regulations and to obtain and maintain all required licenses and permits. NIA’s failure to comply with any statutes and regulations could have a material adverse effect on it. Furthermore, the adoption of additional statutes and regulations, changes in the interpretation and enforcement of current statutes and regulations could have a material adverse effect on it.
NIA does not have any control over the commissions it earns on the sale of insurance products which are based on premiums and commission rates set by insurers and the conditions prevalent in the insurance market.
NIA earns commissions on the sale of insurance products. Commission rates and premiums can change based on the prevailing economic and competitive factors that affect insurance underwriters. In addition, the insurance industry has been characterized by periods of intense price competition due to excessive underwriting capacity and periods of favorable premium levels due to shortages of capacity. We cannot predict the timing or extent of future changes in commission rates or premiums or the effect any of these changes will have on the operations of NIA’s insurance agency.
RISKS RELATING TO OUR CONTROLLED PORTFOLIO COMPANIES - PAYROLL PROCESSING BUSINESS (NPS)
Unauthorized disclosure of employee data, whether through a cyber-security breach of our computer systems or otherwise, could expose NPS to liability and business losses.
44
NPS collects and stores sensitive data about individuals in order to process the transactions and for other internal processes. If anyone penetrates its network security or otherwise misappropriates sensitive individual data, NPS could be subject to liability or business interruption. NPS is subject to laws and rules issued by different agencies concerning safeguarding and maintaining the confidentiality of this information. Its activities have been, and will continue to be, subject to an increasing risk of cyber-attacks, the nature of which is continually evolving. Cyber-security risks include unauthorized access to privileged and sensitive customer information, including passwords and account information of NPS’ customers. While it subjects its data systems to periodic independent testing and review, NPS cannot guarantee that its systems will not be penetrated in the future. Experienced computer programmers and hackers may be able to penetrate NPS’ network security, and misappropriate or compromise our confidential information, create system disruptions, or cause shutdowns. As a result, NPS’ customers’ information may be lost, disclosed, accessed or taken without our customers’ consent. If a breach of NPS’ system occurs, it may be subject to liability, including claims for impersonation or other similar fraud claims. In the event of any such a breach, NPS may also be subject to a class action lawsuit. Any significant violations of data privacy could result in the loss of business, litigation and regulatory investigations and penalties that could damage NPS’ reputation, and the growth of its business could be adversely affected.
NPS’ systems may be subject to disruptions that could adversely affect its business and reputation.
NPS’ payroll business relies heavily on its payroll, financial, accounting and other data processing systems. If any of these systems or any of the vendors which supply them fails to operate properly or becomes disabled even for a brief period of time, NPS could suffer financial loss, a disruption of its business, liability to clients, regulatory intervention or damage to its reputation. NPS has disaster recovery plans in place to protect its businesses against natural disasters, security breaches, military or terrorist actions, power or communication failures or similar events. Despite NPS’ preparations, its disaster recovery plans may not be successful in preventing the loss of client data, service interruptions, and disruptions to its operations or damage to its important facilities.
If NPS fails to adapt its technology to meet client needs and preferences, the demand for its services may diminish.
NPS operates in industries that are subject to rapid technological advances and changing client needs and preferences. In order to remain competitive and responsive to client demands, NPS continually upgrades, enhances and expands its existing solutions and services. If NPS fails to respond successfully to technology challenges, the demand for its services may diminish.
NPS could incur unreimbursed costs or damages due to delays in processing inherent in the banking system.
NPS generally determines the availability of customer (employer) funds prior to making payments to employees or taxing authorities, and such employer funds are generally transferred in to its accounts prior to making payments out. Due to the structure of the banking system however, there are times when NPS may make payroll or tax payments and not immediately receive the funds to do so from the employer. There can be no assurance that the procedures NPS has in place to prevent these occurrences or mitigate the damages will be sufficient to prevent loss to its business.
RISKS RELATING TO OUR CONTROLLED PORTFOLIO COMPANIES - RECEIVABLES FINANCING AND SERVICING BUSINESS (NBC)
An unexpected level of defaults in NBC’s accounts receivables portfolio would reduce its income and increase its expenses.
If NBC’s level of non-performing assets in its receivable financing business rises in the future, it could adversely affect its revenue, earnings and cash flow. Non-performing assets primarily consist of receivables for which the customer has not made timely payment. In certain situations, NBC may restructure the receivable to permit such a customer to have smaller payments over a longer period of time. Such a restructuring or non-payment by a receivables customer will result in lower revenue and less cash available for NBC’s operational activities.
NBC’s reserve for credit losses may not be sufficient to cover unexpected losses.
NBC’s business depends on the behavior of its customers. In addition to its credit practices and procedures, NBC maintains a reserve for credit losses on its accounts receivable portfolio, which it has judged to be adequate given the receivables it purchases. CDS periodically reviews its reserve for adequacy considering current economic conditions and trends, charge-off experience and levels of non-performing assets, and adjusts its reserve accordingly. However, because of recent unstable economic conditions, its reserves may prove inadequate, which could have a material adverse effect on its financial condition and results of operations.
45
NBC depends on outside financing to support its receivables financing business.
NBC’s receivables financing business depends on outside financing to support its acquisition of receivables. Termination of the credit lines for any reason would have a material adverse effect on its business, including but not limited to, the liquidation of its receivables portfolios to pay down the lines. If funds from such sale were insufficient to completely pay down the line of credit, NBC would be responsible for any short fall. In particular, NBC depends on a line of credit which matures in February 2016. Loss of this line and NBC’s inability to replace it would materially impact the business.
RISKS RELATING TO OUR CAPCO BUSINESS
The Capco programs and the tax credits they provide are created by state legislation and implemented through regulation, and such laws and rules are subject to possible action to repeal or retroactively revise the programs for political, economic or other reasons. Such an attempted repeal or revision would create substantial difficulty for the Capco programs and could, if ultimately successful, cause us material financial harm.
The tax credits associated with the Capco programs and provided to our Capcos’ investors are to be utilized by the investors over a period of time, which is typically ten years. Much can change during such a period and it is possible that one or more states may revise or eliminate the tax credits. Any such revision or repeal could have a material adverse economic impact on our Capcos, either directly or as a result of the Capco’s insurer’s actions. Any such final state action that jeopardizes the tax credits could result in the provider of our Capco insurance assuming partial of full control of the particular Capco in order to minimize its liability under the Capco insurance policies issued to our investors.
Because our Capcos are subject to requirements under state law, a failure of any of them to meet these requirements could subject the Capco and our stockholders to the loss of one or more Capcos.
Despite the fact that we have met all applicable minimum requirements of the Capco programs in which we still participate, each Capco remains subject to state regulation until it has invested 100 percent of its funds and otherwise remained in full legal compliance. There can be no assurance that we will continue to be able to do so. A major regulatory violation, while not fatal to our Capco business, would materially increase the cost of operating the Capcos.
RISKS RELATING TO OUR COMMON STOCK
Two of our stockholders, one a current and one a former executive officer, beneficially own approximately 19% of our common stock, and are able to exercise significant influence over the outcome of most stockholder actions.
Although there is no agreement or understanding between them, because of their ownership of our stock, Barry Sloane, our Chairman, Chief Executive Officer and President, and Jeffrey G. Rubin, former president of the Company, will be able to have significant influence over actions requiring stockholder approval, including the election of directors, the adoption of amendments to the certificate of incorporation, approval of stock incentive plans and approval of major transactions such as a merger or sale of assets. This could delay or prevent a change in control of our company, deprive our stockholders of an opportunity to receive a premium for their common stock as part of a change in control and have a negative effect on the market price of our common stock.
Our common stock price may be volatile and may decrease substantially.
The trading price of our common stock may fluctuate substantially. The price of our common stock may be higher or lower depending on many factors, some of which are beyond our control and may not be directly related to our operating performance. These factors include, but are not limited to, the following:
|
•
|
price and volume fluctuations in the overall stock market from time to time;
|
|
•
|
investor demand for our stock;
|
|
•
|
significant volatility in the market price and trading volume of securities of business development companies or
|
46
|
•
|
other companies in our sector, which are not necessarily related to the operating performance of these companies;
|
|
•
|
changes in regulatory policies or tax guidelines with respect to RICs, BDCs, or SBICs;
|
|
•
|
failure to qualify as a RIC, or the loss of RIC status;
|
|
•
|
any shortfall in revenue or net income or any increase in losses from levels expected by investors or securities analysts;
|
|
•
|
changes, or perceived changes, in the value of our portfolio investments;
|
|
•
|
departures of key Newtek personnel;
|
|
•
|
operating performance of companies comparable to us; or
|
|
•
|
general economic conditions and trends and other external factors.
|
In the past, following periods of volatility in the market price of a company’s securities, securities class action litigation has often been brought against that company. Due to the potential volatility of our stock price once a market for our stock is established, we may become the target of securities litigation in the future. Securities litigation could result in substantial costs and divert management’s attention and resources from our business.
Future issuances of our common stock or other securities, including preferred shares, may dilute the per share book value of our common stock or have other adverse consequences to our common stockholders.
Our board of directors has the authority, without the action or vote of our stockholders, to issue all or part of the approximately 190,000,000 authorized but unissued shares of our common stock. Our business strategy relies upon investments in and acquisitions of businesses using the resources available to us, including our common stock. We have made acquisitions during each of the years from 2002 to 2005 involving the issuance of our common stock and we expect to make additional acquisitions in the future using our common stock. Additionally, we anticipate granting additional options or restricted stock awards to our employees and directors in the future. We may also issue additional securities, through public or private offerings, in order to raise capital. Future issuances of our common stock will dilute the percentage of ownership interest of current stockholders and could decrease the per share book value of our common stock. In addition, option holders may exercise their options at a time when we would otherwise be able to obtain additional equity capital on more favorable terms.
Pursuant to our amended and restated charter, our board of directors is authorized to may classify any unissued shares of stock and reclassify any previously classified but unissued shares of stock of any class or series from time to time, into one or more classes or series of stock, including Preferred Stock. If we issue preferred stock, the preferred stock would rank “senior” to common stock in our capital structure, preferred stockholders would have separate voting rights on certain matters and might have other rights, preferences, or privileges more favorable than those of our common stockholders, and the issuance of preferred stock could have the effect of delaying, deferring or preventing a transaction or a change of control that might involve a premium price for holders of our common stock or otherwise be in your best interest. We will not generally be able to issue and sell our common stock at a price below net asset value per share. We may, however, sell our common stock, or warrants, options or rights to acquire our common stock, at a price below the then current net asset value per share of our common stock if our board of directors determines that such sale is in our best interests and in the best interests of our stockholders, and our stockholders approve such sale. In any such case, the price at which our securities are to be issued and sold may not be less than a price that, in the determination of our board of directors, closely approximates the market value of such securities (less any distributing commission or discount). If we raise additional funds by issuing more common stock or senior securities convertible into, or exchangeable for, our common stock, then the percentage ownership of our stockholders at that time will decrease, and you may experience dilution
The authorization and issuance of “blank check” preferred shares could have an anti-takeover effect detrimental to the interests of our stockholders.
47
Our certificate of incorporation allows our board of directors to issue preferred shares with rights and preferences set by the board without further stockholder approval. The issuance of these “blank check” preferred shares could have an anti-takeover effect detrimental to the interests of our stockholders. For example, in the event of a hostile takeover attempt, it may be possible for management and the board to impede the attempt by issuing the preferred shares, thereby diluting or impairing the voting power of the other outstanding common shares and increasing the potential costs to acquire control of us. Our board has the right to issue any new shares, including preferred shares, without first offering them to the holders of common shares, as they have no preemptive rights.
We know of no other publicly-held company that sponsors and operates Capcos as a part of its business. As such, there are, to our knowledge, no other companies against which investors may compare our Capco business and its operations, results of operations and financial and accounting structures.
In the absence of any meaningful peer group comparisons for our Capco business, investors may have a difficult time understanding and judging the strength of our business. This, in turn, may have a depressing effect on the value of our stock.
Provisions of the Maryland General Corporation Law and of our charter and bylaws could deter takeover attempts and have an adverse impact on the price of our common stock.
The Maryland General Corporation Law and our charter and bylaws contain provisions that may discourage, delay or make more difficult a change in control of Newtek or the removal of our directors. We are subject to the Maryland Business Combination Act, subject to any applicable requirements of the 1940 Act. Our board of directors has adopted a resolution exempting from the Business Combination Act any business combination between us and any other person, subject to prior approval of such business combination by our board, including approval by a majority of our independent directors. If the resolution exempting business combinations is repealed or our board does not approve a business combination, the Business Combination Act may discourage third parties from trying to acquire control of us and increase the difficulty of consummating such an offer. Our bylaws exempt from the Maryland Control Share Acquisition Act acquisitions of our stock by any person. If we amend our bylaws to repeal the exemption from the Control Share Acquisition Act, the Control Share Acquisition Act also may make it more difficult for a third party to obtain control of us and increase the difficulty of consummating such a transaction.
We have also adopted measures that may make it difficult for a third party to obtain control of us, including provisions of our charter classifying our board of directors in three classes serving staggered three-year terms in conjunction with the Conversion, and authorizing our board of directors to classify or reclassify shares of our stock in one or more classes or series, to cause the issuance of additional shares of our stock, to amend our charter without stockholder approval and to increase or decrease the number of shares of stock that we have authority to issue. These provisions, as well as other provisions of our charter and bylaws, may delay, defer or prevent a transaction or a change in control that might otherwise be in the best interests of our stockholders.
Sales of substantial amounts of our common stock in the public market may have an adverse effect on the market price of our common stock
All of the common stock held by our executive officers and directors, representing approximately 1,235,000 shares, or approximately 12% of our total outstanding shares, are subject to lock-up periods of at least 180 days as a result of our November 2014 stock offering. Upon expiration of this lock-up period, or earlier upon the consent of JMP Securities LLC, such shares will generally be freely tradable in the public market. Sales of substantial amounts of our common stock, or the availability of such common stock for sale, could adversely affect the prevailing market prices for our common stock. If this occurs and continues, it could impair our ability to raise additional capital through the sale of securities should we desire to do so.
Failure to maintain effective internal controls over financial reporting may lead investors and others to lose confidence in our financial data.
In evaluating the effectiveness of its internal controls over financial reporting in connection with the preparation of the Company’s Annual Report on Form 10-K for the fiscal year ended December 31, 2012, management concluded that there was a material weakness in internal control over financial reporting related to accounting for one bank account holding funds belonging to customers of our merchant processing portfolio company. These material weaknesses made it possible for a former senior manager to utilize funds in this account to conceal knowledge of growing merchant processing chargeback losses among a group of merchants solicited by one of the Company’s former agents. Following discovery, this resulted in the need for the restatement of the Company’s financial statements for the year ended December 31, 2011, together with financial
48
statements for the quarters ended March 31, 2012, June 30, 2012 and September 30, 2012, the periods over which these losses occurred.
The Company has remediated these material weaknesses and has, among other things, replaced the manager responsible, strengthened its internal control team by hiring a very seasoned Chief Risk Officer, augmented its finance team and has implemented and modified certain accounting and internal control procedures. If the Company fails to otherwise maintain effective controls over financial reporting in the future, it could again result in a material misstatement of its financial statements that might not be prevented or detected on a timely basis and which could then cause investors and others to lose confidence in the Company’s financial statements, which in turn could have a negative effect on the value of the Company’s equity securities.
Not applicable.
We conduct our principal business activities in facilities leased from unrelated parties at market rates. Our headquarters are located in New York, New York. Our operating subsidiaries and portfolio companies have properties which are material to the conduct of their business as noted below. In addition, our Capcos maintain offices in each of the states in which they operate.
Below is a list of our leased offices and space as of December 31, 2014 which are material to the conduct of our business:
|
Location
|
Lease expiration
|
Purpose
|
Approx. sq. ft
|
||||
|
212 West 35
th
Street
New York, NY 10001
|
Oct 2015
|
Lease of principal executive offices (Corporate activities and SBA lending)
|
5,700
|
|
|||
|
4 Park Plaza
Irvine, CA 92614
|
Feb 2016
|
Newtek Small Business Finance offices
|
3,300
|
|
|||
|
1440 Broadway
New York, New York 10018
|
Oct 2015
|
Sublet - former principal
executive offices
|
23,000
|
|
|||
|
60 Hempstead Avenue
West Hempstead, NY 11552
|
Apr 2019
|
Newtek Small Business Finance; Newtek Business Credit Offices (portfolio company) and NY Capco offices
|
22,000
|
|
|||
We believe that our leased facilities are adequate to meet our current needs and that additional facilities are available to meet our development and expansion needs in existing and projected target markets.
In the ordinary course of business, the Company may from time to time be party to lawsuits and claims. The Company evaluates such matters on a case by case basis and its policy is to contest vigorously any claims it believes are without compelling merit. The Company is currently involved in various litigation matters.
On January 21, 2014, NCMIC Finance Corporation (“NCMIC”) filed a complaint against Universal Processing Services of Wisconsin, LLC (“UPS”), the Company’s merchant processing portfolio company, in the United States District Court for the Southern District of Iowa. The Complaint asserts claims against UPS for breach of the UPS and NCMIC agreement for the processing of credit card transactions, and seeks monetary relief. The Company believes that the claims asserted in the complaint are wholly without merit and intends to vigorously defend the action.
As previously disclosed, during the quarter ended June 30, 2013, the Federal Trade Commission (the “FTC”) amended an existing complaint in the matter Federal Trade Commission v. WV Universal Management, LLC et al., pending in the United States District Court for the Middle District of Florida (the “Court”), to add UPS as an additional defendant on one count of providing substantial assistance in violation of the Telemarketing Sales Rule. On November 18, 2014, the Court issued an Order granting the FTC’s motion for summary judgment against UPS on the single count. Subsequently, the FTC filed motions for a permanent injunction and equitable monetary belief against UPS and the other remaining defendants. Prior to the Court hearing on the motions, UPS and the FTC reached a settlement on the FTC’s motion for a permanent injunction, subject to final
49
approval of the FTC. On February 11, 2015, the Court granted the FTC’s motion for equitable relief against UPS and the other remaining defendants, ordering that the remaining defendants pay $1,735,000 in equitable monetary relief. While the Court has yet to issue a judgement setting forth the terms of the relief granted, UPS has recorded a reserve for the full amount of the potential loss as of December 31, 2014, which is reflected in the full year pro forma results reported for the segment in Item 7. Management's Discussion and Analysis of Financial Condition and Results of Operations. The Company strongly disagrees with the court's Orders on summary judgment and equitable monetary relief, and once a judgment is issued, the Company will decide what actions to take, including taking an appeal of such rulings
Management has reviewed all other legal claims against the Company with counsel and has taken into consideration the views of such counsel, as to the outcome of the claims. In management’s opinion, final disposition of all such claims will not have a material adverse effect on the results of operations, cash flows or financial position of the Company.
Not applicable.
50
(a) Market Information: Our common stock is traded on the NASDAQ Capital Market under the symbol “NEWT.” High and low prices for the common stock over the previous two years are set forth below, based on the highest and lowest daily closing price during that period (adjusted for the 1-for-5 Reverse Stock Split).
|
Price Range
|
|||||||||||||||||
|
Period
|
High
|
Low
|
NAV (1)
|
Premium (Discount) of High Sales price to NAV(2)
|
Premium (Discount) of Low Sales price to NAV(2)
|
||||||||||||
|
First Quarter: January 1, 2013 Through March 31, 2013
|
$
|
11.05
|
|
$
|
8.30
|
|
$
|
10.00
|
|
10
|
%
|
(17
|
)%
|
||||
|
Second Quarter: April 1, 2013 Through June 30, 2013
|
$
|
11.25
|
|
$
|
9.50
|
|
$
|
10.26
|
|
10
|
%
|
(7
|
)%
|
||||
|
Third Quarter: July 1, 2013 Through September 30, 2013
|
$
|
15.35
|
|
$
|
10.30
|
|
$
|
10.54
|
|
46
|
%
|
(2
|
)%
|
||||
|
Fourth Quarter: October 1, 2013 Through December 31, 2013
|
$
|
16.00
|
|
$
|
12.50
|
|
$
|
10.88
|
|
47
|
%
|
15
|
%
|
||||
|
First Quarter: January 1, 2014 Through March 31, 2014
|
$
|
17.15
|
|
$
|
13.70
|
|
$
|
11.07
|
|
55
|
%
|
24
|
%
|
||||
|
Second Quarter: April 1, 2014 Through June 30, 2014
|
$
|
14.50
|
|
$
|
12.55
|
|
$
|
11.31
|
|
28
|
%
|
11
|
%
|
||||
|
Third Quarter: July 1, 2014 Through September 30, 2014
|
$
|
14.70
|
|
$
|
11.30
|
|
$
|
10.91
|
|
35
|
%
|
4
|
%
|
||||
|
Fourth Quarter: October 1, 2014 Through December 31, 2014
|
$
|
15.75
|
|
$
|
12.61
|
|
$
|
16.31
|
|
(3
|
)%
|
(23
|
)%
|
||||
(1) Net asset value per share is determined as of the last day in the relevant quarter and therefore may not reflect the net asset value per share on the date of the high and low sales price. The values reflect stockholders equity per share and are based on outstanding shares at the end of each period.
(2) Calculated as the respective high or low sales price less net asset value or stockholders equity per share, as applicable, divided by net asset value or stockholders equity per share, as applicable.
The last reported price for our common stock on March 18, 2015 was $18.70 per share. As of March 18, 2015 there were approximately 49 holders of record and beneficial holders of our common stock.
Shares of BDCs may trade at a market price that is less than the value of the net assets attributable to those shares. The possibility that our shares of common stock will trade at a discount from net asset value or at premiums that are unsustainable over the long term are separate and distinct from the risk that our net asset value will decrease.
Sales of Unregistered Securities
We did not engage in any sales of unregistered securities during the years ended December 31, 2014, 2013 and 2012.
Distributions
We have not declared or paid regular quarterly dividends during our prior three fiscal years, in view of our focus on retaining earnings for growth.
Beginning in the first quarter of 2015, and to the extent that we have income available, we intend to make quarterly distributions to our stockholders out of assets legally available for distribution. Our quarterly distributions, if any, will be determined by our board of directors.
51
Any distribution to our stockholders will be declared out of assets legally available for distribution. Distributions in excess of current and accumulated earnings and profits will be treated as a non-taxable return of capital to the extent of a stockholder's basis in our stock and, assuming that a stockholder holds our stock as a capital asset, thereafter as a capital gain. Generally, a non-taxable return of capital will reduce a stockholder’s basis in our stock for federal tax purposes, which will result in higher tax liability when the stock is sold.
We intend to elect to be treated, and intend to qualify annually thereafter, as a RIC under the Code, beginning with our first taxable year after the BDC Conversion, or 2015. To obtain and maintain RIC tax treatment, we must distribute at least 90% of our net ordinary income and net short-term capital gains in excess of our net long-term capital losses, if any, to our stockholders. In order to avoid certain excise taxes imposed on RICs, we currently intend to distribute during each calendar year an amount at least equal to the sum of: (a) 98% of our net ordinary income for such calendar year; (b) 98.2% of our capital gain net income for the one-year period ending on October 31 of the calendar year; and (c) any net ordinary income and capital gain net income for preceding years that were not distributed during such years and on which we previously paid no U.S. federal income tax.
We currently intend to distribute net capital gains (
i.e.
, net long-term capital gains in excess of net short-term capital losses), if any, at least annually out of the assets legally available for such distributions. However, we may decide in the future to retain such capital gains for investment and elect to treat such gains as deemed distributions to you. If this happens, stockholders will be treated for U.S. federal income tax purposes as if they had received an actual distribution of the capital gains that we retain and reinvested the net after tax proceeds in us. In this situation, stockholders would be eligible to claim a tax credit (or in certain circumstances a tax refund) equal to their allocable share of the tax we paid on the capital gains deemed distributed to them. We cannot assure stockholders that we will achieve results that will permit us to pay any cash distributions, and if we issue senior securities, we may be prohibited from making distributions if doing so would cause us to fail to maintain the asset coverage ratios stipulated by the 1940 Act or if such distributions are limited by the terms of any of our borrowings.
Unless stockholders elect to receive distributions in cash, we intend to make such distributions in additional shares of our common stock under our dividend reinvestment plan. Although distributions paid in the form of additional shares of our common stock will generally be subject to U.S. federal, state and local taxes in the same manner as cash distributions, investors participating in the dividend reinvestment plan will not receive any corresponding cash distributions with which to pay any such applicable taxes.
On March 19, 2015, our Board declared a distribution as set forth in the following table:
|
Record Date
|
Payment Date
|
Distribution Declared
|
||||
|
March 30, 2015
|
April 13, 2015
|
$
|
0.39
|
|
||
Securities authorized for issuance under equity compensation plans as of December 31, 2014:
|
Plan Category
|
(a)
Number of securities to be issued upon exercise of outstanding options, warrants and rights
|
(b)
Weighted-average exercise price of outstanding options, warrants and rights
|
(c)
Number of securities remaining available for future issuance under equity compensation plans (excluding securities reflected in column (a))
|
|||
|
Equity compensation plans approved by security holders
|
None
|
None
|
3,000,000 shares
|
|||
|
Equity compensation plans not approved by security holders
|
None
|
None
|
None
|
|||
__________
|
(b)
|
Not applicable.
|
|
(c)
|
Not applicable.
|
Stock Performance Graph
The following graph compares the return on our common stock with that of the Standard & Poor’s 500 Stock Index and the NASDAQ Composite Index, for the period from December 31, 2009 through December 31, 2014. The graph assumes that, on
52
January 1, 2010, a person invested $100 in each of our common stock, the S&P 500 Index, and the NASDAQ Financial Services Index. The graph measures total stockholder return, which takes into account both changes in stock price and dividends. It assumes that dividends paid are invested in like securities.
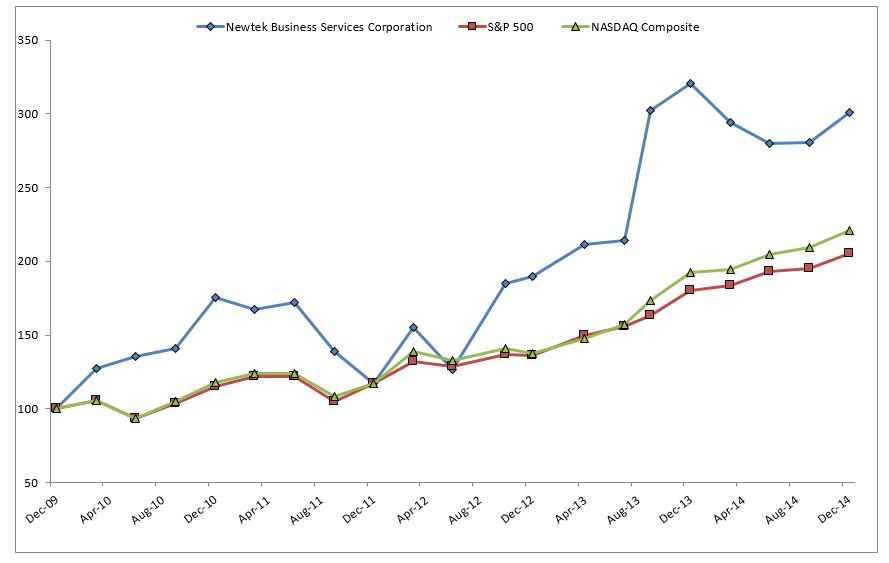
The following selected statements of income and balance sheet data have been derived from the audited financial statements for each of the five years ended December 31, 2014. The Consolidated Financial Statements for the three years ended December 31, 2012 have been audited by CohnReznick LLP. The Consolidated Financial Statements for the two years ended December 31, 2014 have been audited by McGladrey LLP. The selected financial data set forth below should be read in conjunction with, and is qualified by reference to, “Management’s Discussion and Analysis of Financial Condition and Results of Operations” and our Consolidated Financial Statements, including the Notes thereto, available at www.sec.gov.
|
November 12, 2014 to December 31, 2014
|
January 1, 2014 to November 11, 2014
|
2013
|
2012
|
2011
|
2010
|
|||||||||||||||||||
|
Investment income:
|
||||||||||||||||||||||||
|
From non-controlled/non-affiliate investments
|
||||||||||||||||||||||||
|
Interest income
|
$
|
1,076
|
|
—
|
|
—
|
|
—
|
|
—
|
|
—
|
|
|||||||||||
|
Servicing income
|
562
|
|
—
|
|
—
|
|
—
|
|
—
|
|
—
|
|
||||||||||||
|
Other income
|
270
|
|
—
|
|
—
|
|
—
|
|
—
|
|
—
|
|
||||||||||||
|
Total investment income from non-controlled/non-affiliate investments
|
1,908
|
|
||||||||||||||||||||||
|
From controlled/affiliate investments
|
—
|
|
—
|
|
—
|
|
—
|
|
—
|
|
||||||||||||||
|
Interest income
|
27
|
|
—
|
|
—
|
|
—
|
|
—
|
|
—
|
|
||||||||||||
|
Dividend income
|
37
|
|
—
|
|
—
|
|
—
|
|
—
|
|
—
|
|
||||||||||||
|
Other income
|
4
|
|
—
|
|
—
|
|
—
|
|
—
|
|
—
|
|
||||||||||||
|
Total investment income from controlled/affiliate investments
|
68
|
|
—
|
|
—
|
|
—
|
|
—
|
|
—
|
|
||||||||||||
|
Total investment income
|
1,976
|
|
—
|
|
—
|
|
—
|
|
—
|
|
—
|
|
||||||||||||
|
Operating revenues:
|
||||||||||||||||||||||||
|
Electronic payment processing
|
—
|
|
$
|
79,527
|
|
$
|
89,651
|
|
$
|
85,483
|
|
$
|
82,473
|
|
$
|
80,920
|
|
|||||||
|
Web hosting and design
|
—
|
|
13,730
|
|
17,375
|
|
18,208
|
|
19,181
|
|
19,164
|
|
||||||||||||
53
|
November 12, 2014 to December 31, 2014
|
January 1, 2014 to November 11, 2014
|
2013
|
2012
|
2011
|
2010
|
|||||||||||||||||||
|
Premium income
|
—
|
|
18,623
|
|
19,456
|
|
12,367
|
|
12,468
|
|
2,428
|
|
||||||||||||
|
Interest income
|
—
|
|
5,663
|
|
4,838
|
|
3,422
|
|
2,629
|
|
1,903
|
|
||||||||||||
|
Servicing fee income
|
—
|
|
9,253
|
|
6,565
|
|
6,862
|
|
3,101
|
|
2,568
|
|
||||||||||||
|
Income from tax credits
|
—
|
|
48
|
|
113
|
|
522
|
|
1,390
|
|
2,380
|
|
||||||||||||
|
Insurance commissions
|
—
|
|
1,480
|
|
1,737
|
|
1,205
|
|
1,071
|
|
886
|
|
||||||||||||
|
Other income
|
—
|
|
3,523
|
|
3,858
|
|
3,061
|
|
3,026
|
|
2,470
|
|
||||||||||||
|
Total operating revenues
|
—
|
|
131,847
|
|
143,593
|
|
131,130
|
|
125,339
|
|
112,719
|
|
||||||||||||
|
Net change in fair value of:
|
||||||||||||||||||||||||
|
SBA loans
|
(3,663
|
)
|
(1,226
|
)
|
(1,013
|
)
|
(5,493
|
)
|
3,494
|
|
||||||||||||||
|
Warrants
|
—
|
|
—
|
|
(111
|
)
|
—
|
|
—
|
|
||||||||||||||
|
Credits in lieu of cash and notes payable in credits in lieu of cash
|
(5
|
)
|
21
|
|
3
|
|
(131
|
)
|
38
|
|
||||||||||||||
|
Total net change in fair value
|
(3,668
|
)
|
(1,205
|
)
|
(1,121
|
)
|
(5,624
|
)
|
3,532
|
|
||||||||||||||
|
Expenses:
|
||||||||||||||||||||||||
|
Electronic payment processing costs
|
—
|
|
67,011
|
|
75,761
|
|
72,183
|
|
69,389
|
|
68,187
|
|
||||||||||||
|
Salaries and benefits
|
1,458
|
|
23,373
|
|
24,360
|
|
22,314
|
|
21,042
|
|
19,391
|
|
||||||||||||
|
Interest
|
568
|
|
7,323
|
|
5,863
|
|
4,495
|
|
3,416
|
|
4,479
|
|
||||||||||||
|
Depreciation and amortization
|
43
|
|
3,140
|
|
3,284
|
|
3,036
|
|
3,955
|
|
4,709
|
|
||||||||||||
|
Goodwill impairment
|
—
|
|
1,706
|
|
—
|
|
—
|
|
—
|
|
—
|
|
||||||||||||
|
Provision for loan losses
|
—
|
|
(53
|
)
|
1,322
|
|
810
|
|
763
|
|
1,909
|
|
||||||||||||
|
Other general and administrative costs
|
2,236
|
|
18,536
|
|
20,729
|
|
17,732
|
|
19,122
|
|
16,699
|
|
||||||||||||
|
Total expenses
|
4,305
|
|
121,036
|
|
131,319
|
|
120,570
|
|
117,687
|
|
115,374
|
|
||||||||||||
|
Net investment loss before income tax
|
(2,329
|
)
|
—
|
|
—
|
|
—
|
|
—
|
|
||||||||||||||
|
Provision for income tax - post BDC
|
194
|
|
—
|
|
—
|
|
—
|
|
—
|
|
—
|
|
||||||||||||
|
Net investment loss
|
(2,523
|
)
|
—
|
|
—
|
|
—
|
|
—
|
|
||||||||||||||
|
Net realized and unrealized gain (loss):
|
||||||||||||||||||||||||
|
Net realized gain on non-affiliate investments
|
595
|
|
—
|
|
—
|
|
—
|
|
—
|
|
—
|
|
||||||||||||
|
Net unrealized appreciation on non-affiliate investments
|
2,733
|
|
—
|
|
—
|
|
—
|
|
—
|
|
—
|
|
||||||||||||
|
Net unrealized depreciation on servicing assets
|
(120
|
)
|
—
|
|
—
|
|
—
|
|
—
|
|
—
|
|
||||||||||||
|
Net unrealized depreciation in credits in lieu of cash and notes payable in credits in lieu of cash
|
(4
|
)
|
—
|
|
—
|
|
—
|
|
—
|
|
—
|
|
||||||||||||
|
Net realized and unrealized gains
|
3,204
|
|
—
|
|
—
|
|
—
|
|
—
|
|
||||||||||||||
|
Income before income taxes
|
—
|
|
7,143
|
|
11,069
|
|
9,439
|
|
2,028
|
|
877
|
|
||||||||||||
|
Net increase in net assets resulting from operations
|
$
|
681
|
|
—
|
|
—
|
|
—
|
|
—
|
|
—
|
|
|||||||||||
|
Provision for income taxes
|
—
|
|
3,935
|
|
3,918
|
|
3,882
|
|
(1,195
|
)
|
(418
|
)
|
||||||||||||
|
Net income
|
—
|
|
3,208
|
|
7,151
|
|
5,557
|
|
3,223
|
|
1,295
|
|
||||||||||||
|
Net loss attributable to non-controlling interests
|
—
|
|
85
|
|
377
|
|
86
|
|
112
|
|
144
|
|
||||||||||||
|
Net income attributable to Newtek Business Services Corp.
|
—
|
|
3,293
|
|
$
|
7,528
|
|
$
|
5,643
|
|
$
|
3,335
|
|
$
|
1,439
|
|
||||||||
|
Weighted average common shares outstanding:
|
||||||||||||||||||||||||
54
|
November 12, 2014 to December 31, 2014
|
January 1, 2014 to November 11, 2014
|
2013
|
2012
|
2011
|
2010
|
|||||||||||||||||||
|
Basic
|
—
|
|
7,315
|
|
7,059
|
|
7,105
|
|
7,141
|
|
7,131
|
|
||||||||||||
|
Diluted
|
—
|
|
7,315
|
|
7,581
|
|
7,349
|
|
7,215
|
|
7,160
|
|
||||||||||||
|
Basic income per share
|
—
|
|
$
|
0.45
|
|
$
|
1.01
|
|
$
|
0.79
|
|
$
|
0.47
|
|
$
|
0.20
|
|
|||||||
|
Diluted income per share
|
—
|
|
$
|
0.45
|
|
$
|
0.94
|
|
$
|
0.77
|
|
$
|
0.46
|
|
$
|
0.20
|
|
|||||||
|
Net increase in net assets per share
|
$
|
0.09
|
|
—
|
|
—
|
|
—
|
|
—
|
|
—
|
|
|||||||||||
|
Net investment loss per share
|
$
|
(0.33
|
)
|
—
|
|
—
|
|
—
|
|
—
|
|
—
|
|
|||||||||||
|
Weighted average shares outstanding
|
7,620
|
|
—
|
|
—
|
|
—
|
|
—
|
|
—
|
|
||||||||||||
|
Balance Sheet Data (at end of period):
|
||||||||||||||||||||||||
|
Investments, at fair value
|
233,462
|
|
—
|
|
—
|
|
—
|
|
—
|
|
—
|
|
||||||||||||
|
Total assets
|
$
|
301,832
|
|
—
|
|
$
|
198,612
|
|
$
|
152,742
|
|
$
|
129,795
|
|
$
|
165,015
|
|
|||||||
|
Notes payable
|
$
|
43,023
|
|
—
|
|
$
|
41,218
|
|
$
|
39,823
|
|
$
|
13,565
|
|
$
|
28,053
|
|
|||||||
|
Securitization notes payable
|
$
|
79,520
|
|
—
|
|
$
|
60,140
|
|
$
|
22,039
|
|
$
|
26,368
|
|
$
|
15,104
|
|
|||||||
|
Notes payable in credits in lieu of cash
|
$
|
2,229
|
|
—
|
|
$
|
3,641
|
|
$
|
8,703
|
|
$
|
16,948
|
|
$
|
35,494
|
|
|||||||
|
Deferred tax asset (liability)
|
$
|
2,873
|
|
—
|
|
$
|
3,606
|
|
$
|
2,318
|
|
$
|
170
|
|
$
|
(3,002
|
)
|
|||||||
|
Non-controlling interests
|
$
|
—
|
|
—
|
|
$
|
1,665
|
|
$
|
2,055
|
|
$
|
1,180
|
|
$
|
1,309
|
|
|||||||
|
Net assets/stockholders' equity
|
$
|
166,418
|
|
—
|
|
$
|
77,009
|
|
$
|
68,902
|
|
$
|
59,153
|
|
$
|
55,594
|
|
|||||||
|
Common shares outstanding at year end
|
10,206
|
|
—
|
|
7,077
|
|
7,036
|
|
7,140
|
|
7,133
|
|
||||||||||||
|
Newtek Business Services Corp. net asset value/stockholders' equity per share
|
$
|
16.31
|
|
—
|
|
$
|
10.88
|
|
$
|
9.79
|
|
$
|
8.28
|
|
$
|
7.79
|
|
|||||||
Introduction and Certain Cautionary Statements
The following discussion and analysis of our financial condition and results of operations is intended to assist in the understanding and assessment of significant changes and trends related to the results of operations and financial position of the Company together with its subsidiaries. This discussion and analysis should be read in conjunction with the consolidated financial statements and the accompanying notes.
The statements in this Annual Report may contain forward-looking statements relating to such matters as anticipated future financial performance, business prospects, legislative developments and similar matters. We note that a variety of factors could cause our actual results to differ materially from the anticipated results expressed in the forward looking statements such as intensified competition and/or operating problems in its operating business projects and their impact on revenues and profit margins or additional factors as described under “Risk Factors” above.
We also need to point out that our Capcos operate under a different set of rules in each of the six jurisdictions and that these place varying requirements on the structure of our investments. In some cases, particularly in Louisiana, we do not control the equity or management of a qualified business.
The discussion and analysis of our results of operations below are discussed on a "pro forma" basis. As previously discussed, the Company completed it conversion to a business development company on November 12, 2014. As a result the Company will no longer have six reportable segments. Previously consolidated subsidiaries are now recorded as controlled portfolio companies for which the company records its investment at fair value. For purposes of the 2014 discussion and analysis below, the financial information is presented as if the conversion to a business development company had not occurred. We believe this provides the most useful comparison of our year over year results.
Executive Overview
55
We are a leading national lender and own and control certain portfolio companies (our “controlled portfolio companies,” as defined below) that provide a wide range of business and financial products to SMBs. In particular, we and our controlled portfolio companies provide comprehensive lending, payment processing, managed technology, personal and commercial insurance and payroll solutions to over 100,000 SMB accounts, across all industries. We have an established and reliable platform that is not limited by client size, industry type or location. As a result, we have a strong and diversified client base across every state in the U.S and across a variety of different industries. In addition, we have developed a financial and technology based business model that enables us and our controlled portfolio companies to acquire and process our SMB clients in a very cost effective manner. This capability is supported in large part by NewTracker®, our patented prospect management technology software, which is similar to but better than the system popularized by Salesforce.com. We believe that this technology and business model distinguishes us from our competitors.
Consolidated Pro Forma Results of Operations Before BDC Election
For the year ended December 31, 2014, the Company recorded pro forma pretax income of $7,497,000, a $3,572,000 decrease from $11,069,000 pretax income in 2013. Total pro forma revenues increased by $5,171,000, or 3.6%, to $148,764,000 compared to $143,593,000 for the year ended December 31, 2013 principally due to increased revenues in the Small business finance and Electronic payment processing segments. Total expenses increased by $8,832,000 to $140,151,000 for the year ended 2014 from $131,319,000 for 2013 primarily due to increases in electronic payment processing costs, goodwill impairment, other general and administrative costs, and salaries and benefits.
Contributing to the decrease in pro forma pretax income from $11,069,000 in 2013 to $8,154,000 in 2014 were a goodwill impairment charge of $1,706,000 in the Small business finance segment, a 19% decrease in pro forma pretax net income in the electronic processing segment which included a charge related to a potential legal judgment against the segment of $1,735,000. Decreases were offset by an increase in pro forma pretax net income in the small business finance segment related to an increase in servicing and interest income.
One of the primary contributors to Newtek’s continued profitability was the small business finance segment which generated pro forma pretax income of $12,873,000 in 2014 compared to $10,143,000 in 2013, an increase of $2,730,000. The primary drivers were servicing fee income on NSBF and external portfolios which in 2014 increased by $3,630,000, or 55% and interest income which increased $1,927,000 or 40%. Total SBA loans originated increased to $202,269,000 in 2014 compared with $177,941,000 for 2013. The weighted average sales price for the guaranteed portions of SBA loans sold increased slightly to 112.49% compared with 112.32% for 2014 and 2013, respectively.
The electronic payment processing segment recorded a 19% decrease in pro forma pretax net income, which decreased to $6,728,000 in 2014 from $8,304,000 compared with the 2013 period. Pro forma revenue increased by $1,505,000 or 2% to $91,160,000 during 2014 compared to 2013. The increase was related to growth in processing volumes and fee increases passed on to merchants. Processing revenue less processing costs increased from 15.5% in 2013 to 15.9% in 2014. While margin was favorably impacted by the implementation and growth of fees, the increase was offset by an increase in provision for chargebacks in 2014 attributed to a specific merchant that experienced a high level of chargebacks as well as a charge related to a potential legal judgment against the company.
Pro forma pretax net income for managed technology solutions decreased from $3,564,000 in the year ended December 31, 2013 to $3,081,000 for the year ended December 31, 2014. Segment pro forma revenue decreased by 10% due primarily to a reduction in web hosting revenue driven by a reduction in active plans. It continues to be management’s intent to increase revenue and margin per plan through higher service offerings to customers which include cloud-based applications. Management has broadened the Company’s focus beyond the Microsoft web platform by now providing its platform capabilities to include open source web applications which have become increasingly attractive to web developers and resellers.
In December 2014, a Company subsidiary closed its fifth securitization issuing an additional $31,700,000 in notes with an “A” rating under S&P; see Securitzation Transactions in Part II Item 7.
Consolidated Results of Operations Post BDC election:
As a BDC, we are subject to certain constraints on our operations, including limitations imposed by the 1940 Act. In addition, due to the conversion from an operating company to a BDC on November 12, 2014, there is no prior period results to compare the reportable period to, and the results below only reflect the results of the Company for the period November 12, 2014 through December 31, 2014.
56
Investment Income
Total investment income was $1,976,000 for the period November 12, 2014 through December 31, 2014. Investment income from non-controlled non-affiliates was $1,912,000 and consisted of $1,080,000 in interest income earned primarily from our SBA loan portfolio. Servicing income earned was $562,000 related to our SBA loan portfolio. Other income from non-controlled non-affiliates for the period was $270,000 and consists of fees earned such as closing, packaging, and late payment fees related to our SBA loan portfolio.
Investment income from controlled affiliate investments was $64,000 for the period November 12, 2014 through December 31, 2014 and consisted of $37,000 in dividend income from a controlled portfolio company and $23,000 of interest income from various controlled portfolio companies.
Expenses
Total expenses for the period post BDC election were $4,305,000. Total operating expenses for the period consisted principally of salaries and benefits, interest expense, professional fees and general and administrative expenses. Salaries and benefits relate to our lending subsidiary and corporate employees of the BDC. Interest expense relates to the term loan held by the BDC, the revolving credit facility of SBF and the securitization notes payable.
Since the Company will not be eligible for the RIC election until 2015, the company recorded a tax provision for the period which is reflective of the Company filing a consolidated C-Corp return for the full year. As a result, the Company recorded a tax provision for the period November 12, 2014 through December 31, 2014 of $194,000.
Net Realized Gains and Net Unrealized Appreciation and Depreciation
Realized gains or losses on investments are measured by the difference between the net proceeds from the repayment or sale and the cost basis of our investments without regard to unrealized appreciation or depreciation previously recognized and includes investments charged off during the period, net of recoveries. The net change in unrealized appreciation or depreciation on investments primarily reflects the change in portfolio investment fair values during the reporting period, including the reversal of previously recorded unrealized appreciation or depreciation when gains or losses are realized.
For the period November 12, 2014 through December 31, 2014, we had net realized gains totaling $595,000 primarily due to the sale of non-controlled non-affiliate investments (SBA loans) into a secondary market during the period.
For the period November 12, 2014 through December 31, 2014, net unrealized appreciation on non-affiliate investments totaled $2,733,000 which was primarily due to unrealized appreciation on 30 non-affiliate debt investments which have not yet traded as of December 31, 2014.
Business Segment Results:
The results of the Company’s reportable business segments presented for the full year on a pro forma basis are discussed below.
The tables below are presented to distinguish operating results for January 1, 2014 through November 11, 2014 (prior to BDC Conversion) and the period from November 12, 2014 to December 31, 2014 (post BDC Conversion). The combined results for 2014 are presented under the column "Pro Forma 2014 (Unaudited)" and represent the full year results for the segment. We believe this presentation provides the most useful comparison of our year over year results.
57
Electronic Payment Processing
|
|
|||||||||||||||||||
|
(In thousands):
|
Pro Forma 2014 (Unaudited)
|
For the period November 12, 2014 through December 31, 2014 (Unaudited)
|
For the period January 1, 2014 through November 11, 2014
|
2013
|
2012
|
||||||||||||||
|
Revenue:
|
|||||||||||||||||||
|
Electronic payment processing
|
$
|
91,158
|
|
$
|
11,631
|
|
$
|
79,527
|
|
$
|
89,651
|
|
$
|
85,483
|
|
||||
|
Interest income
|
2
|
|
—
|
|
2
|
|
4
|
|
6
|
|
|||||||||
|
Total revenue
|
91,160
|
|
11,631
|
|
79,529
|
|
89,655
|
|
85,489
|
|
|||||||||
|
Expenses:
|
|||||||||||||||||||
|
Electronic payment processing costs
|
76,620
|
|
9,659
|
|
66,961
|
|
75,761
|
|
72,183
|
|
|||||||||
|
Salaries and benefits
|
4,001
|
|
536
|
|
3,465
|
|
3,485
|
|
3,991
|
|
|||||||||
|
Professional fees
|
2,377
|
|
1,919
|
|
458
|
|
458
|
|
323
|
|
|||||||||
|
Depreciation and amortization
|
261
|
|
35
|
|
226
|
|
358
|
|
743
|
|
|||||||||
|
Insurance expense – related party
|
56
|
|
6
|
|
50
|
|
57
|
|
61
|
|
|||||||||
|
Other general and administrative costs
|
1,117
|
|
114
|
|
1,003
|
|
1,232
|
|
1,147
|
|
|||||||||
|
Total expenses
|
84,432
|
|
12,269
|
|
72,163
|
|
81,351
|
|
78,448
|
|
|||||||||
|
Income before income taxes
|
$
|
6,728
|
|
$
|
(638
|
)
|
$
|
7,366
|
|
$
|
8,304
|
|
$
|
7,041
|
|
||||
Comparison of the years ended December 31, 2014 (Pro forma) and December 31, 2013
EPP revenue increased $1,507,000 or 1.7% between years. Revenue increased primarily due to the implementation of a monthly non-compliance fee and annual compliance service fee, increase in discount fee rates to merchants and an increase in processing volume generated by an increase in the average monthly processing volume per merchant of 5.0% between periods. Offsetting this increase was a 3.3% decrease in the number of merchant transactions and a decrease in the average number of processing merchants of 3.5%, between periods. The decrease in merchants includes the expected attrition in previously acquired portfolios.
Processing revenues less electronic payment processing costs (“margin”) increased from 15.5% in 2013 to 15.9% in 2014. The increase in margin was primarily due to the implementation of a monthly non-compliance fee, implementation of an annual compliance service fee and an increase in rates to merchants.. This increase was partially offset by an increase in the provision for chargeback losses attributable to a specific merchant that experienced a high level of chargebacks. Overall, the increase in margin dollars was $648,000 between years.
Salaries and benefits increased $516,000 or 14.8% between years. This increase is due to the Company hiring additional senior level staff, which resulted in overall higher salaries, payroll taxes, benefits and stock compensation for the year. Salaries and benefits in the current year also include a severance payment of approximately $120,000 to a former senior executive. Partially offsetting this increase was a reduction in health insurance costs of $48,000 and a $27,000 increase in capitalized salaries as compared to last year. Salary costs related to the development of internally developed software is capitalized and as a result decreases salary expense and increases depreciation and amortization expense over the future service period.
Professional fees increased $1,919,000 or 419.0% between years due to a reserve established in the amount of approximately $1,700,000 related to the FTC matter which is discussed in detail in Item 3. Legal Proceedings. Depreciation and amortization decreased $97,000 between periods as the result of previously acquired customer merchant portfolios becoming fully amortized between periods. Remaining costs decreased $115, 000 or 9.3% between years largely due to a decrease in marketing expense of $212,000 as the result the discontinuation of a marketing cost allocation in early 2014. This decrease was partially offset by an increase of $56,000 in travel expenses and $42,000 in office expense.
Income before income taxes decreased $1,576,000 or 19.0% to $6,728,000 in 2014 from $8,304,000 in 2013. The decrease in income before income taxes was due to the increase in margin of $648,000, offset by a net increase in other operating expense between years principally due to the $1,700,000 FTC reserve in the 2014 period.
58
Comparison of the years ended December 31, 2013 and December 31, 2012
EPP revenue increased $4,168,000 or 5% between years, primarily due to growth in processing volumes and the effect of card association fee increases passed through to merchants. Processing volumes were favorably impacted by a 1% increase in the average number of processing merchants under contract between periods and an increase of approximately 6% in the average monthly processing volume per merchant. The increase in the average monthly processing volume per merchant is due in part to the addition of several larger volume processing merchants as well as year-over-year growth in processing volumes from existing merchants. This overall increase in revenue between years was partially offset by lower average pricing between years due to competitive pricing considerations, particularly for larger processing volume merchants with lower revenue per transaction, between periods.
Electronic payment processing (“EPP”) costs increased $3,578,000 or 5% between years. The increase in EPP costs includes a provision for charge-back losses of $579,000 and $1,832,000 in 2013 and 2012, respectively. The provision for charge-back losses in 2012 included losses of $1,312,000 related to a group of merchants affiliated with one of its independent sales agents, which were unilaterally approved by a former senior manager of the EPP division and such charge-back losses resulted from violations of credit policy by such senior manager. EPP revenue less EPP costs, or “margin” decreased from 15.6% in 2012 to 15.5% in 2013. Margin was favorably impacted by the reduction in provisions for chargebacks between years by 1.5%. However, the favorable impact on margin of the aforementioned factors were slightly more than offset by lower average pricing between years due to both competitive pricing considerations, particularly for larger volume merchants, and the mix of merchant sales volumes realized between periods. Overall, the increase in margin dollars was $590,000 between years.
Salaries and benefits decreased by $506,000 or 13% between years principally as the result of a reduction in staffing levels and a reduction in accrued bonuses for the year. Average FTE’s for the twelve month period decreased from 67.5 to 61.2 between years. Professional fees increased by $135,000 principally due to costs incurred in assessing the loss related to and the actions of the agent and the former senior management of EPP related to the charge-back losses associated with a group of merchants discussed above. Depreciation and amortization decreased $385,000 between periods as the result of previously acquired customer merchant portfolios becoming fully amortized between periods. Other costs increased $81,000 or 6% between years. During 2012, office relocation costs of approximately $50,000 were incurred.
Income before income taxes increased $1,263,000 to $8,304,000 in 2013 from $7,041,000 in 2012. The increase in income before income taxes was principally due to the increase in margin of $590,000 due to the reasons noted above and the decreases in other costs, principally payroll and related costs and depreciation and amortization cost between years
59
Small Business Finance
|
(In thousands):
|
Pro Forma 2014 (Unaudited)
|
For the period November 12, 2014 through December 31, 2014 (Unaudited)
|
For the period January 1, 2014 through November 11, 2014
|
2013
|
2012
|
||||||||||||||
|
Revenue:
|
|||||||||||||||||||
|
Premium on loan sales
|
$
|
19,493
|
|
$
|
870
|
|
$
|
18,623
|
|
$
|
19,456
|
|
$
|
12,367
|
|
||||
|
Servicing fee – NSBF Portfolio
|
3,671
|
|
561
|
|
3,110
|
|
2,769
|
|
2,298
|
|
|||||||||
|
Servicing fee – External Portfolio
|
6,524
|
|
382
|
|
6,142
|
|
3,796
|
|
4,564
|
|
|||||||||
|
Interest income
|
6,729
|
|
1,079
|
|
5,650
|
|
4,802
|
|
3,370
|
|
|||||||||
|
Management fees – related party
|
146
|
|
146
|
|
—
|
|
—
|
|
293
|
|
|||||||||
|
Other income
|
3,142
|
|
241
|
|
2,901
|
|
3,289
|
|
2,516
|
|
|||||||||
|
Total revenue
|
39,705
|
|
3,279
|
|
36,426
|
|
34,112
|
|
25,408
|
|
|||||||||
|
Net change in fair value of:
|
|||||||||||||||||||
|
Servicing Asset
|
(120
|
)
|
(120
|
)
|
—
|
|
—
|
|
—
|
|
|||||||||
|
SBA loans held for sale
|
2,872
|
|
2,950
|
|
(78
|
)
|
403
|
|
(163
|
)
|
|||||||||
|
SBA loans held for investment
|
(3,858
|
)
|
(273
|
)
|
(3,585
|
)
|
(1,629
|
)
|
(851
|
)
|
|||||||||
|
Warrants
|
—
|
|
—
|
|
—
|
|
—
|
|
(111
|
)
|
|||||||||
|
Total net change in fair value
|
(1,106
|
)
|
2,557
|
|
(3,663
|
)
|
(1,226
|
)
|
(1,125
|
)
|
|||||||||
|
Expenses:
|
|||||||||||||||||||
|
Salaries and benefits
|
10,101
|
|
1,486
|
|
8,615
|
|
7,649
|
|
6,124
|
|
|||||||||
|
Interest
|
5,549
|
|
611
|
|
4,938
|
|
5,568
|
|
3,836
|
|
|||||||||
|
Professional fees
|
1,395
|
|
488
|
|
907
|
|
1,011
|
|
700
|
|
|||||||||
|
Depreciation and amortization
|
1,452
|
|
12
|
|
1,440
|
|
1,241
|
|
919
|
|
|||||||||
|
Goodwill impairment
|
1,706
|
|
—
|
|
1,706
|
|
—
|
|
—
|
|
|||||||||
|
Provision for loan loss
|
(55
|
)
|
—
|
|
(55
|
)
|
1,322
|
|
805
|
|
|||||||||
|
Insurance expense-related party
|
32
|
|
—
|
|
32
|
|
24
|
|
20
|
|
|||||||||
|
Other general and administrative costs
|
7,251
|
|
1,161
|
|
6,090
|
|
5,928
|
|
3,785
|
|
|||||||||
|
Total expenses
|
27,431
|
|
3,758
|
|
23,673
|
|
22,743
|
|
16,189
|
|
|||||||||
|
Income before income taxes
|
$
|
11,168
|
|
$
|
2,078
|
|
$
|
9,090
|
|
$
|
10,143
|
|
$
|
8,094
|
|
||||
Business Overview
The small business finance segment is comprised of NSBF which is a non-bank SBA lender that originates, sells and services loans for its own portfolio as well as portfolios of other institutions, and NBC which provides accounts receivable financing and billing services to businesses. Revenue is derived primarily from premium income generated by the sale of the guaranteed portions of SBA loans, interest income on SBA loans held for investment and held for sale, servicing fee income on the guaranteed portions of SBA loans sold, servicing income for loans originated by other lenders for which NSBF is the servicer, and financing and billing services, classified as other income above, provided by NBC. Most SBA loans originated by NSBF charge an interest rate equal to the Prime rate plus an additional percentage amount; the interest rate resets to the current Prime rate on a monthly or quarterly basis, which will result in changes to the amount of interest accrued for that month and going forward and a re-amortization of a loan’s payment amount until maturity.
60
Small Business Finance Summary
|
|
For the Year ended December 31,
|
|||||||||||||||||||
|
|
2014
|
2013
|
2012
|
|||||||||||||||||
|
(In thousands):
|
# Loans
|
$ Amount
|
# Loans
|
$ Amount
|
# Loans
|
$ Amount
|
||||||||||||||
|
Guaranteed loans sold/transferred during the period
|
163
|
|
130,356
|
|
167
|
|
131,733
|
|
105
|
|
84,743
|
|
||||||||
|
Gross loans originated during the period
|
193
|
|
202,269
|
|
174
|
|
177,941
|
|
104
|
|
107,425
|
|
||||||||
|
Guaranteed loans that achieved sale status, originated in prior period
|
—
|
|
—
|
|
—
|
|
—
|
|
—
|
|
—
|
|
||||||||
|
Premium income recognized (1)
|
—
|
|
$
|
19,493
|
|
—
|
|
$
|
19,456
|
|
$
|
12,367
|
|
|||||||
|
Average sale price as a percent of principal balance
|
112.49
|
%
|
112.32
|
%
|
114.16
|
%
|
||||||||||||||
|
(1)
|
The premium income recognized and average sales price reflect that premiums greater than 110.00% must be split 50/50 with the SBA.
|
Comparison of the years ended December 31, 2014 (Pro forma) and December 31, 2013
For the year ended December 31, 2014, the Company recognized $19,493,000 of premium income from 163 guaranteed loans sold aggregating $130,356,000. During 2013, the Company recognized $19,456,000 of premium income from 167 guaranteed loans sold totaling $131,733,000. In December 2014, the Company made the decision to hold loans in the second half of the month in anticipation of better pricing in 2015. Had these loans been sold in 2014, they would have generated approximately $3,431,000 of premium income. Sale prices on guaranteed loan sales averaged 112.49% for the twelve months ended December 31, 2014 compared with 112.32% for the twelve months ended December 31, 2013.
Servicing Portfolios and related Servicing fee income of Loans Funded and Average Sales Price
|
|
Year ended December 31,
|
% Change
|
|||||||||||||||
|
(In thousands):
|
2014
|
2013
|
2012
|
2014
|
2013
|
||||||||||||
|
Total NSBF originated servicing portfolio (1)
|
$
|
631,285
|
|
$
|
488,800
|
|
$
|
351,736
|
|
29
|
%
|
39
|
%
|
||||
|
Third party servicing portfolio
|
122,236
|
|
561,368
|
|
176,988
|
|
(78
|
)%
|
217
|
%
|
|||||||
|
Aggregate servicing portfolio
|
$
|
753,521
|
|
$
|
1,050,168
|
|
$
|
528,724
|
|
(28
|
)%
|
99
|
%
|
||||
|
Total servicing income earned NSBF portfolio
|
$
|
3,671
|
|
$
|
2,769
|
|
$
|
2,298
|
|
33
|
%
|
20
|
%
|
||||
|
Total servicing income earned external portfolio
|
$
|
6,524
|
|
$
|
3,796
|
|
$
|
4,564
|
|
72
|
%
|
(17
|
)%
|
||||
|
Total servicing income earned
|
$
|
10,195
|
|
$
|
6,565
|
|
$
|
6,862
|
|
55
|
%
|
(4
|
)%
|
||||
|
(1)
|
Of this amount, the total average NSBF originated portfolio earning servicing income was $421,001,000, $314,486,000, and $238,590,000 for the years ended December 31, 2014, 2013 and 2012, respectively.
|
We are the contractor managing and servicing portfolios of SBA 7(a), USDA and other loans acquired by the FDIC from failed financial institutions, and we assist the FDIC in the packaging of these loans for sale. Our existing servicing facilities and personnel perform these activities supplemented by contract workers as needed. The size of the portfolio we will service for the FDIC, and thus the revenue earned, varies over time and depends on the level of bank failures and the needs of the FDIC in managing portfolios acquired from those banks as well as the success of being able to sell such portfolios. In October 2014, the FDIC was successful in selling a significant group of loans with our assistance, which resulted in the reduction in third-party servicing portfolio as of December 31, 2014.
Servicing fees received on the NSBF portfolio increased by $902,000 period over period and was attributable to the expansion of the NSBF portfolio in which we earn servicing income, which increased from an average of $314,486,000 for the twelve month period ending December 31, 2013 to an average of $421,001,000 for the same period in 2014. This increase was the direct result of increased loan originations throughout 2014. Third party servicing income increased by $2,728,000 and was attributable primarily to the increase in FDIC servicing income of $2,806,000 partially offset by a decline in other third party servicing in the
61
amount of $78,000. The average FDIC serviced portfolio increased from $148,600,000 as of December 31, 2013 to $390,618,000 as of December 31, 2014.
Interest income increased by $1,927,000 for the year ended December 31, 2014 as compared to the same period in 2013 as a result of the average outstanding performing portfolio of SBA loans held for investment increasing from $72,337,000 to $104,540,000 for the years ended December 31, 2013 and 2014, respectively.
Other income decreased by $147,000 for the year ended December 31, 2014 as compared to the same period in 2013. This decrease is mainly attributed to a decrease in NBC receivable income of $518,000 offset by net increases in NSBF and SBL fee related income of $416,000, consulting income of $119,000 and net realized losses on the loan portfolio of $166,000.
The change in the fair value loss of SBA loans held for investment of $2,229,000 is the result of an increase in loans originated held for investment partially offset by a decrease in the valuation adjustment applied to the loans held for investment portfolio. Loans originated held for investment aggregated $48,083,000 compared to $42,773,000 for the periods ended December 31, 2014 and 2013, respectively.
The period over period valuation adjustment of 7.5% remained unchanged from December 31, 2012 to September 30, 2013. As of December 31, 2013, a discounted cash flow methodology was applied resulting in a decrease in the valuation adjustment from 6.01% of total principal as of December 31, 2013, to 5.21% of total principal as of December 31, 2014.
The decrease in the change in fair value on SBA loans held for investment of $778,000 is the result of the increased amount of unguaranteed loans originated year over year, as well as a decrease in the valuation adjustment applied to our loans held for investment portfolio. During 2013, we adopted a discounted cash flow methodology resulting in a decrease in the valuation adjustment applied of 7.5% of total principal as of December 31, 2012, to 6.01% of total principal for the year ended December 31, 2013. Loans originated, held for investment aggregated $42,773,000 compared to $24,076,000 for the years ended December 31, 2013 and 2012, respectively.
The change in the valuation adjustment from 6.01% as of December 31, 2013 to 5.21% on performing loans as of December 31, 2014 is attributable primarily to increases in the weighted average remaining term of the retained loan portfolio from 16.55 years as December 31, 2013 to 16.81 years as of December 31, 2014 and the recovery rate from 65.84% as of December 31, 2013 to 67.45% as of December 31, 2014. The increase in the weighted average remaining term is attributable to an increase in the weighted average term of loans originated period over period, partially offset by normal portfolio amortization and prepayments of principal. The increase in the recovery rate is attributable primarily to the collateral composition of loans originated period over period secured by a greater percentage of real estate as an asset class, which typically yields more robust recovery rates as opposed to depreciable assets. For the periods ended December 31, 2014 and December 31, 2013, approximately 68.96% and 64.21% of the respective performing loan portfolio retained balances were principally secured by real estate.
Salaries and benefits increased by $2,452,000 primarily due to the addition of staff in all departments. Combined headcount increased by 26% from an average of 77 for the year ended December 31, 2013 to an average of 97 for the year ended December 31, 2014.
Interest expense decreased $19,000 for the period ended December 31, 2014 when compared to the year ended December 31, 2013. The execution of securitization transactions in December of 2014 and the end of December 2013 increased interest at NSBF by $970,000 and an additional $184,000 increase resulted from the Capital One line of credit which increased from an average outstanding balance of $16,587,000 for the year ended December 31, 2013 to $22,039,000 for the same period in 2014. These increases were offset by a decrease at NSBF of $1,053,000 due to the payoff of the Summit debt and a decrease of $119,000 at NBC due to a reduction in average outstanding borrowings under the Sterling line from $7,717,000 at December 31, 2013 to $5,482,000 at December 31, 2014.
During 2014, the Company concluded there was goodwill impairment at the NBC reporting unit. As such, an impairment charge of $1,706,000 was recorded.
Professional fees for the year ended December 31, 2014 increased by $384,000 when compared with the same period last year, primarily due to an increase in legal fees in connection with securing a line of credit of $404,000 and increased trustee fees of $84,000 for the loan portfolio securitization offset by a reduction in other consulting fees of $96,000.
The provision for loan losses decreased from $1,322,000 for the year ended December 31, 2013 to a net release of $55,000 for the same period in 2014, a decrease of $1,377,000 or 104.2%. In connection with the Company’s conversion to a BDC, and the related requirements to report all investments at fair value, the Company will no longer report loans on a cost basis.
62
In determining the net change in fair value of loans held for investment for the year ended December 31, 2014, the Company used a discounted cash flow model which incorporated a series of expected future cash flows for the performing SBA 7(a) loan portfolio, and discounts those cash flows at a market clearing yield of 5.38%. The key assumptions used in the model are considered unobservable inputs and include anticipated prepayment speeds, cumulative default rates, the cost of loan servicing, and Prime rate expectations. The Company used an assumed prepayment speed of 19% based on current market conditions and historical experience for the loan portfolio, against a prepayment curve developed from NSBF historical experience to calculate expected loan prepayments in a given year. Defaults are defined as any loan placed on non-accrual status as of December 31, 2014. The cumulative default rate, defined as the percent of loan balance that will enter final liquidation in a given year, was estimated to be 25%, and was derived from NSBF historical experience. The mix of NSBF’s loan portfolio continues to shift from start-up businesses, to predominately existing businesses. Our historical default and loss rates demonstrate that this particular segment (i.e. Existing Business) of our SBA loan portfolio continues to experience the lowest rate of defaults and ultimate losses over our twelve year history of originating loans. When computing the cumulative default rate to be applied to the performing portfolio loan balances, the Company excluded the last three years of originations as those loans have not seasoned yet. The discounted cash flow analysis resulted in a price equivalent of 94.80% of the par amount on our performing loans held for investment.
Other general and administrative costs increased by $1,323,000 when compared to the comparable period of the prior year. The increase was mainly attributed to increases in loan origination costs of $339,000, loan recovery and servicing expenses of $623,000 and additional marketing expense of $289,000 in connection with our television ad campaign for the year ended December 31, 2014.
The increase of loan originations and the size of the portfolio, combined with improvements in interest income, generated by the addition to and enhanced performance of the portfolio, were sufficient to offset additional salaries, servicing and origination expenses. The resulting pretax income of $12,874,000 was a 27% improvement over pretax income of $10,143,000 for the year ended December 31, 2013.
The following tables set forth distribution by business type of the Company’s SBA 7(a) loan portfolio for the years ended December 31, 2014 and December 31, 2013, respectively:
As of December 31, 2014
|
Distribution by Business Type
|
||||||||||||||
|
Business Type
|
# of Loans
|
Balance
|
Average Balance
|
% of Balance
|
||||||||||
|
Existing Business
|
529
|
|
$
|
104,672,731
|
|
$
|
197,869
|
|
79.9
|
%
|
||||
|
Business Acquisition
|
112
|
|
17,969,375
|
|
160,441
|
|
13.7
|
%
|
||||||
|
Start-Up Business
|
127
|
|
8,383,076
|
|
66,008
|
|
6.4
|
%
|
||||||
|
Total
|
768
|
|
$
|
131,025,182
|
|
$
|
170,606
|
|
100.0
|
%
|
||||
As of December 31, 2013
|
Distribution by Business Type
|
||||||||||||||
|
Business Type
|
# of Loans
|
Balance
|
Average Balance
|
% of Balance
|
||||||||||
|
Existing Business
|
451
|
|
$
|
78,673,835
|
|
$
|
174,443
|
|
80.9
|
%
|
||||
|
Business Acquisition
|
88
|
|
11,759,594
|
|
133,632
|
|
12.1
|
%
|
||||||
|
Start-Up Business
|
136
|
|
6,801,625
|
|
50,012
|
|
7.0
|
%
|
||||||
|
Total
|
675
|
|
$
|
97,235,054
|
|
$
|
144,052
|
|
100.0
|
%
|
||||
63
The following tables set forth distribution by borrower’s credit score of the Company’s SBA 7(a) loan portfolio for the years ended December 31, 2014 and December 31, 2013, respectively
As of December 31, 2014
|
Distribution by Borrower Credit Score
|
||||||||||||||
|
Credit Score
|
# of Loans
|
Aggregate Balance
|
Average Balance
|
% of Balance
|
||||||||||
|
500 to 550
|
11
|
|
$
|
1,454,210
|
|
$
|
132,201
|
|
1.1
|
%
|
||||
|
551 to 600
|
27
|
|
3,336,194
|
|
123,563
|
|
2.5
|
%
|
||||||
|
601 to 650
|
96
|
|
21,186,139
|
|
220,689
|
|
16.2
|
%
|
||||||
|
651 to 700
|
201
|
|
34,323,582
|
|
170,764
|
|
26.2
|
%
|
||||||
|
701 to 750
|
229
|
|
40,951,985
|
|
178,830
|
|
31.3
|
%
|
||||||
|
751 to 800
|
169
|
|
25,002,829
|
|
147,946
|
|
19.1
|
%
|
||||||
|
801 to 850
|
29
|
|
3,676,194
|
|
126,765
|
|
2.8
|
%
|
||||||
|
Not available
|
6
|
|
1,094,049
|
|
182,342
|
|
0.8
|
%
|
||||||
|
Total
|
768
|
|
$
|
131,025,182
|
|
$
|
170,606
|
|
100.0
|
%
|
||||
As of December 31, 2013
|
Distribution by Borrower Credit Score
|
||||||||||||||
|
Credit Score
|
# of Loans
|
Aggregate Balance
|
Average Balance
|
% of Balance
|
||||||||||
|
500 to 550
|
7
|
|
$
|
709,182
|
|
$
|
101,312
|
|
0.7
|
%
|
||||
|
551 to 600
|
23
|
|
2,582,899
|
|
112,300
|
|
2.7
|
%
|
||||||
|
601 to 650
|
78
|
|
14,384,252
|
|
184,413
|
|
14.8
|
%
|
||||||
|
651 to 700
|
172
|
|
24,169,633
|
|
140,521
|
|
24.9
|
%
|
||||||
|
701 to 750
|
201
|
|
28,551,718
|
|
142,048
|
|
29.4
|
%
|
||||||
|
751 to 800
|
160
|
|
22,437,745
|
|
140,236
|
|
23.1
|
%
|
||||||
|
801 to 850
|
28
|
|
3,219,554
|
|
114,984
|
|
3.3
|
%
|
||||||
|
Not available
|
6
|
|
1,180,071
|
|
196,679
|
|
1.1
|
%
|
||||||
|
Total
|
675
|
|
$
|
97,235,054
|
|
$
|
144,052
|
|
100.0
|
%
|
||||
The following tables set forth distribution by primary collateral type of the Company’s SBA 7(a) loan portfolio for the years ended December 31, 2014 and December 31, 2013, respectively:
As of December 31, 2014
64
|
Distribution by Primary Collateral Type
|
||||||||||||||
|
Collateral Type
|
# of Loans
|
Aggregate Balance
|
Average Balance
|
% of Balance
|
||||||||||
|
Commercial Real Estate
|
370
|
|
$
|
76,796,352
|
|
$
|
207,558
|
|
58.6
|
%
|
||||
|
Machinery and Equipment
|
136
|
|
25,446,282
|
|
187,105
|
|
19.4
|
%
|
||||||
|
Residential Real Estate
|
172
|
|
13,583,089
|
|
78,971
|
|
10.4
|
%
|
||||||
|
Other
|
34
|
|
8,457,906
|
|
248,762
|
|
6.5
|
%
|
||||||
|
Accounts Receivable and Inventory
|
38
|
|
5,690,665
|
|
149,754
|
|
4.3
|
%
|
||||||
|
Liquid Assets
|
11
|
|
837,699
|
|
76,154
|
|
0.6
|
%
|
||||||
|
Furniture and Fixtures
|
7
|
|
213,189
|
|
30,456
|
|
0.2
|
%
|
||||||
|
Total
|
768
|
|
$
|
131,025,182
|
|
$
|
170,606
|
|
100.0
|
%
|
||||
As of December 31, 2013
|
Distribution by Primary Collateral Type
|
||||||||||||||
|
Collateral Type
|
# of Loans
|
Aggregate Balance
|
Average Balance
|
% of Balance
|
||||||||||
|
Commercial Real Estate
|
294
|
|
$
|
51,656,092
|
|
$
|
175,701
|
|
53.1
|
%
|
||||
|
Machinery and Equipment
|
127
|
|
24,131,640
|
|
190,013
|
|
24.8
|
%
|
||||||
|
Residential Real Estate
|
181
|
|
11,426,283
|
|
63,129
|
|
11.8
|
%
|
||||||
|
Other
|
32
|
|
6,289,284
|
|
196,540
|
|
6.5
|
%
|
||||||
|
Accounts Receivable and Inventory
|
26
|
|
2,804,740
|
|
107,875
|
|
2.9
|
%
|
||||||
|
Liquid Assets
|
9
|
|
809,667
|
|
89,963
|
|
0.8
|
%
|
||||||
|
Furniture and Fixtures
|
6
|
|
117,348
|
|
19,558
|
|
0.1
|
%
|
||||||
|
Total
|
675
|
|
$
|
97,235,054
|
|
$
|
144,052
|
|
100.0
|
%
|
||||
The following tables set forth distribution by days delinquent of the Company’s SBA 7(a) loan portfolio for the years ended December 31, 2014 and December 31, 2013, respectively:
As of December 31, 2014
|
Distribution by Days Delinquent
|
||||||||||||||
|
Delinquency Status
|
# of Loans
|
Aggregate Balance
|
Average Balance
|
% of Balance
|
||||||||||
|
Current
|
676
|
|
$
|
117,517,316
|
|
$
|
173,842
|
|
89.7
|
%
|
||||
|
1 to 30 days
|
24
|
|
3,002,079
|
|
125,087
|
|
2.3
|
%
|
||||||
|
31 to 60 days
|
15
|
|
2,126,806
|
|
141,787
|
|
1.6
|
%
|
||||||
|
61 to 90 days
|
1
|
|
8,008
|
|
8,008
|
|
—
|
%
|
||||||
|
91 days or greater
|
52
|
|
8,370,973
|
|
160,980
|
|
6.4
|
%
|
||||||
|
Total
|
768
|
|
$
|
131,025,182
|
|
$
|
170,606
|
|
100.0
|
%
|
||||
As of December 31, 2013
65
|
Distribution by Days Delinquent
|
||||||||||||||
|
Delinquency Status
|
# of Loans
|
Aggregate Balance
|
Average Balance
|
% of Balance
|
||||||||||
|
Current
|
583
|
|
$
|
85,030,781
|
|
$
|
145,850
|
|
87.5
|
%
|
||||
|
1 to 30 days
|
29
|
|
2,558,002
|
|
88,207
|
|
2.6
|
%
|
||||||
|
31 to 60 days
|
12
|
|
2,703,858
|
|
225,322
|
|
2.8
|
%
|
||||||
|
61 to 90 days
|
—
|
|
—
|
|
—
|
|
—
|
%
|
||||||
|
91 days or greater
|
51
|
|
6,942,413
|
|
136,126
|
|
7.1
|
%
|
||||||
|
Total
|
675
|
|
$
|
97,235,054
|
|
$
|
144,052
|
|
100.0
|
%
|
||||
Comparison of the years ended December 31, 2013 and December 31, 2012
For the year ended December 31, 2013, the Company recognized $19,456,000 of premium income from 167 guaranteed loans sold aggregating $131,733,000. During 2012, the Company recognized $12,367,000 of premium income from 105 guaranteed loans sold totaling $84,743,000. The increase in premium income for the year ended December 31, 2013 is the result of an increased number of loans sold as compared with the prior period. Sale prices on guaranteed loan sales averaged 112.32% for the twelve months ended December 31, 2013 compared with 112.22% for the twelve months ended December 31, 2012.
The $297,000 decline in total servicing income was attributable primarily to the decrease in FDIC servicing income of $1,278,000 as a result of the sale of a portion of that portfolio, which was offset by an increase in other third party loan servicing of $511,000. With the addition in November 2013 of the Community South Bank portfolio, which we service for the FDIC, as well as the addition of other third party loan servicing contracts in 2013, the average third party servicing portfolio increased from $195,670,000 for the twelve month period ended December 31, 2012 to $232,410,000 for the same twelve month period in 2013. Servicing fees received on the NSBF portfolio increased by $471,000 period over period and was attributable to the expansion of the NSBF originated portfolio in which we earn servicing income. The portfolio increased from an average of $238,590,000 for the twelve month period ending December 31, 2012 to an average of $314,486,000 for the same twelve month period in 2013. This increase was the direct result of increased loan originations in 2013.
Interest income increased by $1,432,000 for the year ended December 31, 2013 as compared to the same period in 2012 as a result of the average outstanding performing portfolio of SBA loans held for investment increasing to $72,337,000 from $48,512,000 for the years ended December 31, 2013 and 2012, respectively.
Other income increased by $772,000 for the year ended December 31, 2013 as compared to the same period in 2012. The increase is primarily attributable to NSBF which increased $616,000 period over period and included an increase of $333,000 in consulting fee income from the FDIC and an increase in packaging and other servicing fee income of $188,000. The remaining increase was attributable to loan recovery and various loan-related fee income. Additionally, other income at NBC increased by $160,000 due to an increase in net investments on accounts receivable, which increased from an average of $7,707,000 in 2012 to an average of $8,688,000 in 2013, as well as an increase in the merchant cash advance program on which we earn commission revenue.
The change in fair value associated with SBA loans held for sale of $566,000 is related to the amount of unsold guaranteed loans during a period, the timing of when those loans sell and the change in premium being received on those loans. The amount of unsold guaranteed loans increased by $3,325,000 at December 31, 2013 compared with 2012.
The decrease in the change in fair value on SBA loans held for investment of $778,000 is the result of the increased amount of unguaranteed loans originated year over year, as well as a decrease in the valuation adjustment applied to our loans held for investment portfolio. During 2013, we adopted a discounted cash flow methodology resulting in a decrease in the valuation adjustment applied of 7.5% of total principal as of December 31, 2012, to 6.01% of total principal for the year ended December 31, 2013. Loans originated, held for investment aggregated $42,773,000 compared to $24,076,000 for the years ended December 31, 2013 and 2012, respectively.
Salaries and benefits increased by $1,525,000 primarily due to the addition of staff in all departments. Combined headcount increased by 24% from an average of 62 employees for the year ended December 31, 2012, to an average of 77 for the year ended December 31, 2013.
Interest expense increased by $1,732,000 for the year ended December 31, 2013 compared with the same period in 2012, due primarily to $663,000 of interest expense associated with the Summit financing transaction which closed in April 2012
66
reflecting only 8 months of expense for the period ending December 31, 2012 vs. twelve months expense for 2013. Interest expense for Summit includes interest, payment in kind interest, discount on the valuation of the warrant and amortization of deferred financing costs. Additionally, NSBF experienced an increase in interest expense of $638,000 in connection with the closing of the 2013 securitization transactions in March and December 2013, and an additional $334,000 increase related to the Capital One line of credit which increased from an average outstanding balance of $10,674,000 for the year ended December 31, 2012 to $16,587,000 for the same period in 2013. NBC experienced an increase in interest expense of $131,000 under the Sterling credit facility due to increased borrowings under the Sterling credit facility as a result of an increasing portfolio.
Professional fees for the year ended December 31, 2013 increased by $311,000 when compared with the year ended December 31, 2012, primarily due to the addition of temporary staffing costs of $166,000, increased accounting fees of $171,000 and increased trustee fees of $48,000. These increases were offset by a reduction in legal expense period over period of approximately $87,000 and a reduction in employee search fees of $16,000.
The combined provision for loan losses and net change in fair value increased from $1,656,000 for the year ended December 31, 2012 to $2,951,000 for year ended December 31, 2013, a net increase of $1,295,000 period over period. The allowance for loan loss together with the cumulative fair value adjustments to SBA loans held for investment increased from $6,092,000 or 9.4% of the gross portfolio balance of $64,609,000 at December 31, 2012 to $6,822,000 or 7.0% of the gross portfolio balance of $97,235,000 at December 31, 2013. Of this, $2,315,000 or 34.3% and $1,757,000 or 23.0% of the allowance for loan losses and fair value discount was allocated as specific reserve against such impaired loans, for the 2012 and 2013 periods, respectively. The year over year reduction in non-performing loans as a percentage of the gross performing portfolio balance results from an improvement in the overall economic climate. The year over year reduction in the specific reserve reflects both the relatively high level of overall collateralization on the non-performing portfolio as well as the increase in the portion of that portfolio making periodic payments pending return to performing status, reducing the need for a specific reserve at this time.
In determining the net change in fair value of loans held for investment for the year ended December 31, 2013, the Company used a discounted cash flow model which incorporated a series of expected future cash flows for the performing SBA 7(a) loan portfolio, and discounts those cash flows at a market clearing yield of 5.38%. The key assumptions used in the model are considered unobservable inputs and include anticipated prepayment speeds, cumulative default rates, the cost of loan servicing, and Prime rate expectations. The Company used an assumed prepayment speed of 10% based on current market conditions and historical experience for the loan portfolio, against a prepayment curve developed from NSBF historical experience to calculate expected loan prepayments in a given year. Defaults are defined as any loan placed on non-accrual status as of December 31, 2013. The cumulative default rate, defined as the percent of loan balance that will enter final liquidation in a given year, was estimated to be 25%, and was derived from NSBF historical experience. The mix of NSBF’s loan portfolio continues to shift from start-up businesses, to predominately originating to existing businesses. Our historical default and loss rates demonstrate that this particular segment (i.e. Existing Business) of our SBA loan portfolio continues to experience the lowest rate of defaults and ultimate losses over our nine year history of originating loans. When computing the cumulative default rate to be applied to the performing portfolio loan balances, the Company excluded the last three years of originations as those loans have not seasoned yet. The discounted cash flow analysis resulted in a price equivalent of 93.99% of the par amount on our loans held for investment.
Other general and administrative costs increased by $1,976,000 due primarily to the increase in loan origination, processing and servicing costs in the amount of $607,000 as a result of the increase in loans originated and portfolios serviced, an additional $360,000 in marketing costs relating to the Company’s television ad campaign, an additional $324,000 in rent, utilities and office expense due to the addition of office space and headcount and an increase of $122,000 in loan recovery costs, which includes expenses and losses associated with the sale of foreclosed properties and collateral preservation costs, as compared with the same period in 2012. $472,000 was attributable to additional reserves recorded at NBC to account for two customers. The rest of the increase was attributable to other miscellaneous expenses.
The increase of loan originations and interest, generated by the addition to and the reduction in non-performing loans in the SBF portfolio, were sufficient to offset additional staffing costs, interest and other general and administrative expenses. The resulting pretax income of $10,143,000 was a 25% improvement over pretax income of $8,094,000 for the year ended December 31, 2012.
Managed Technology Solutions
67
|
(In thousands):
|
Pro Forma 2014 (Unaudited)
|
For the period November 12, 2014 through December 31, 2014 (Unaudited)
|
For the period January 1, 2014 through November 11, 2014
|
2013
|
2012
|
||||||||||||||
|
Revenue:
|
|||||||||||||||||||
|
Web hosting and design
|
$
|
15,849
|
|
$
|
1,852
|
|
$
|
13,997
|
|
$
|
17,576
|
|
$
|
18,211
|
|
||||
|
Expenses:
|
|||||||||||||||||||
|
Salaries and benefits
|
4,945
|
|
643
|
|
4,302
|
|
5,103
|
|
5,216
|
|
|||||||||
|
Interest
|
44
|
|
3
|
|
41
|
|
94
|
|
80
|
|
|||||||||
|
Professional fees
|
483
|
|
71
|
|
412
|
|
507
|
|
465
|
|
|||||||||
|
Depreciation and amortization
|
1,324
|
|
159
|
|
1,165
|
|
1,316
|
|
1,214
|
|
|||||||||
|
Insurance expense – related party
|
12
|
|
—
|
|
12
|
|
14
|
|
17
|
|
|||||||||
|
Other general and administrative costs
|
5,960
|
|
713
|
|
5,247
|
|
6,978
|
|
6,965
|
|
|||||||||
|
Total expenses
|
12,768
|
|
1,589
|
|
11,179
|
|
14,012
|
|
13,957
|
|
|||||||||
|
Income before income taxes
|
$
|
3,081
|
|
$
|
263
|
|
$
|
2,818
|
|
$
|
3,564
|
|
$
|
4,254
|
|
||||
Comparison of the years ended December 31, 2014 (Pro forma) and December 31, 2013
Revenue is derived from recurring fees from hosting websites, primarily from monthly contracts for shared hosting, dedicated servers and cloud instances (the “plans”). In addition, less than 3.0% of revenues are derived from contracted services to design web sites. Revenue between years decreased 9.8% to $15,849,000 in 2014. The decrease in web hosting revenue is the result of a decrease of 5,287 in the average number of monthly plans managed. While the average number of web hosting plans decreased by 11.6% to 40,132 in 2014 from 45,419 in 2013, the average monthly revenue per plan increased by 1.1% to $31.05 in 2014 from $30.72 in 2013.
The average monthly number of cloud server plans in 2014, which generate a higher monthly fee than dedicated and shared hosting plans, decreased by 54, or 8.0% in 2014 to an average of 623 from 677 in 2013. The average monthly number of dedicated server plans in 2014, which generate a higher monthly fee versus shared hosting plans, decreased by 222, or 18.3% in 2014 to an average of 991 from 1,213 in 2013. The average monthly number of shared hosting plans in 2014 decreased by 5,011, or 11.5%, to an average of 38,518 from 43,529 in 2013. Competition from other web hosting providers as well as alternative website services continues to have a negative effect on web hosting plan count and revenue growth.
It continues to be management’s intent to increase revenues and margin per plan through higher cost service offerings to customers, although this may result in a lower number of plans in place overall. Management has broadened the Company’s focus beyond the Microsoft web platform by now providing its platform capabilities to include open source web applications which have become increasingly attractive to web developers and resellers.
Total expenses of $12,768,000 in 2014 decreased 8.9% from $14,012,000 in 2013. Salaries and benefits decreased $158,000 or 3.1% between years to $4,945,000. The number of full time employees decreased by 11.8%; however the average salary per employee increased by 14.3% resulting in an overall increase in salary and payroll tax expenses of $58,000. This increase was offset by decreases in benefits, bonus expense and stock compensation of approximately $216,000. Depreciation and amortization increased $8,000 between years to $1,324,000 due to timing of capital expenditures of approximately $1,119,000 made during 2014 offset by assets that were fully depreciated during the year. Interest expense decreased by $50,000 or 53.2%, due to the payoff of the Capital One term note in June 2014.
Other general and administrative costs decreased $1,018,000 or 14.6% between years. The decrease relates primarily due to a decrease in licensing expenses of approximately $350,000 due to a reduction in Microsoft servers in use which is a result of a decrease in web hosting plans. In addition, bad debt expense decreased by $207,000, which mostly related to the Company’s successful collection efforts. The Company reduced their marketing efforts, which decreased expenses between years by $172,000. In addition, credit card processing fees decreased by $92,000 due to lower revenue between years. Finally, there was a decrease in telephone expenses in the amount of $62,000, maintenance and support in the amount of $55,000, office expenses in the amount of $47,000 and travel expenses in the amount of $36,000 between years. These expenses decreased mainly due to the Company’s cost reduction efforts. This was partially offset by an increase in building occupancy costs (rent
68
and utility costs) of $86,000 between years. Rent increased by $134,000, which related to the Company entering into a five year lease extension for the Company’s data center, while utilities decreased by $48,000 between years.
Income before income taxes decreased 13.6% or $483,000 to $3,081,000 in 2014 from $3,564,000 in 2013. The decrease in profitability was principally due to the decline in web hosting revenue between years, partially offset by the reduction in salaries and benefits, interest expense and other general and administrative costs between years.
Comparison of the years ended December 31, 2013 and December 31, 2012
Revenue is derived primarily from recurring fees from hosting websites, primarily from monthly contracts for shared hosting, dedicated servers and cloud instances (the “plans”). In addition, less than 4% of revenues are derived from contracted services to design web sites. Revenue between years decreased 3% to $17,576,000 in 2013 and included an $856,000 reduction in web hosting revenue, which was partially offset by a $221,000 increase in web design revenue. While the average number of web hosting plans decreased by 11% to 44,988 in 2013 from 50,720 in 2012, the average monthly revenue per plan increased by 9% to $32.56 in 2013 from $29.92 in 2012. The increase in the average revenue per plan reflects a growth in cloud instances, and higher cost plans overall which include additional options and services. The average number of cloud instances increased by 6% to an average of 669 in 2013 from 634 during the year ago period. The decrease in the average total plans occurred in the dedicated and shared segments.
The average monthly number of dedicated server plans in 2013, which generate a higher monthly fee versus shared hosting plans, decreased by 19% in 2013 to an average of 1,206 from 1,485 in 2012. The average monthly number of shared hosting plans in 2013 decreased by 5,488, or 11%, to an average of 43,113 from 48,601 in 2012. Competition from other web hosting providers as well as alternative website services continues to have a negative effect on web hosting plan count and revenue growth.
It continues to be management’s intent to increase revenues and margin per plan through higher cost service offerings to customers, although this may result in a lower number of plans in place overall. In addition, management has begun to lessen its dependency on the Microsoft web platform by broadening its platform capabilities to include more open source web applications which have become increasingly more attractive to web developers and resellers. Overall this continues the trend away from shared hosting sites based on Microsoft software to other more competitive offerings.
Total expenses of $14,012,000 in 2013 increased from $13,957,000 in 2012. Salaries and benefits decreased $113,000 or 2% between years to $5,103,000. Depreciation and amortization cost increased $102,000 between years to $1,316,000 due to increased capital expenditures in the latter part of 2012 (including a capital lease obligation of $632,000 for a new company-wide telephone system) and the timing of 2013 planned capital expenditures. The increase of $42,000 in professional fees was principally due to an increase in web design costs incurred, which corresponds to the increase in web design revenues between periods. Other general and administrative costs increased $13,000 between years as a result of increases in hardware maintenance and support costs of $176,000, principally due to the restructuring of previous contracts in those areas, as well as an increase in bad debt expense by $114,000. These increases were offset by decreases in rent and utility costs of $176,000 in 2012, due to additional rent incurred in 2012 of $30,000 for a corporate apartment and $32,000 higher base rent from the former location as well as higher utility costs incurred in 2012. In addition, there was a decrease in telephone costs of $84,000 due to a new corporate- wide phone system implemented in 2013.
Income before income taxes decreased 16% or $690,000 to $3,564,000 in 2013 from $4,254,000 in 2012. The decrease in profitability is principally due to a decline in web hosting revenue between years as increases in revenue per site have not offset an overall decline in revenue due to site attrition.
All Other
69
|
(In thousands):
|
Pro Forma 2014 (Unaudited)
|
For the period November 12, 2014 through December 31, 2014 (Unaudited)
|
For the period January 1, 2014 through November 11, 2014
|
2013
|
2012
|
||||||||||||||
|
Revenue:
|
|||||||||||||||||||
|
Insurance commissions
|
$
|
1,667
|
|
$
|
184
|
|
$
|
1,483
|
|
$
|
1,737
|
|
$
|
1,204
|
|
||||
|
Insurance commissions – related party
|
223
|
|
16
|
|
207
|
|
235
|
|
153
|
|
|||||||||
|
Other income
|
620
|
|
101
|
|
519
|
|
516
|
|
419
|
|
|||||||||
|
Other income – related party
|
78
|
|
10
|
|
68
|
|
80
|
|
82
|
|
|||||||||
|
Interest income
|
—
|
|
—
|
|
—
|
|
—
|
|
2
|
|
|||||||||
|
Total revenue
|
2,588
|
|
311
|
|
2,277
|
|
2,568
|
|
1,860
|
|
|||||||||
|
Expenses:
|
|||||||||||||||||||
|
Salaries and benefits
|
2,332
|
|
259
|
|
2,073
|
|
2,511
|
|
2,040
|
|
|||||||||
|
Professional fees
|
437
|
|
48
|
|
389
|
|
621
|
|
253
|
|
|||||||||
|
Depreciation and amortization
|
209
|
|
29
|
|
180
|
|
203
|
|
36
|
|
|||||||||
|
Insurance expense – related party
|
9
|
|
—
|
|
9
|
|
9
|
|
9
|
|
|||||||||
|
Other general and administrative costs
|
882
|
|
103
|
|
779
|
|
830
|
|
560
|
|
|||||||||
|
Total expenses
|
3,869
|
|
439
|
|
3,430
|
|
4,174
|
|
2,898
|
|
|||||||||
|
Loss before income taxes
|
$
|
(1,281
|
)
|
$
|
(128
|
)
|
$
|
(1,153
|
)
|
$
|
(1,606
|
)
|
$
|
(1,038
|
)
|
||||
The All other segment includes revenues and expenses primarily from Newtek Insurance Agency, LLC (“NIA”), Newtek Payroll Services (“PAY”) and qualified businesses that received investments made through the Company’s Capcos which cannot be aggregated with other operating segments.
Comparison of the years ended December 31, 2014 (Pro forma) and December 31, 2013
Revenue increased by $20,000 for the year ended December 31, 2014 attributable primarily to a $102,000 increase in other income at PAY due to an increase in customers and total employees served. The increase was offset by a decrease of $82,000 combined insurance commission revenue. Insurance commissions decreased due to revenue decreases on health insurance policies, combined with decreases in related party commissions due to premium decreases on Newtek insurance policies.
Salaries and benefits decreased by $179,000 as a result of reduction in employee headcount at NIA, Summit Systems and Designs (“SUM”), and Advanced Cyber Security Systems (“ACS”). The $184,000 decrease in professional fees is mainly due to decreases in broker commissions as well as a decrease in legal expenses at PAY. The increase in other general and administrative costs was mainly related to a settlement of $162,000, increases in IT costs of $64,000 and referral fees of $10,000 at PAY. These increases were offset by a decrease of $177,000 in software licensing fees at ACS.
Comparison of the years ended December 31, 2013 and December 31, 2012
Revenue increased by $708,000, attributable primarily to a $615,000 improvement in combined insurance commission revenue for the year ended December 31, 2013 compared with the year ended December 31, 2012. Insurance commissions increased as a result of the acquisition of a commercial health insurance book of business, while the increase in related party commissions was due to premium increases on the Newtek insurance policies, as well as the shift to in-house management of the Newtek health policies, formerly managed by an outside broker. The $97,000 increase over 2012 in other income is the result of the growth in the number of PAY clients which increased to 465 at December 31, 2013 from 262 at December 31, 2012.
Salaries and benefits increased by $471,000 to $2,511,000 for the year ended December 31, 2013, as compared to $2,040,000 in the year ended December 31, 2014 as a result of the addition of staff at NIA and PAY, and Advanced Cyber Security Systems (“ACS”). The $368,000 increase in professional fees is mainly due to broker commissions for insurance sales related to the new health book of business at NIA, as well as an increase in legal expenses at PAY in connection with a matter related to a former
70
ACH provider. The increase in other general and administrative costs was related to additional software licensing expense, which increased by $186,000 at ACS and $83,000 at NIA to manage the expanded health book of business.
Corporate activities
|
(In thousands):
|
Pro Forma 2014 (Unaudited)
|
For the period November 12, 2014 through December 31, 2014 (Unaudited)
|
For the period January 1, 2014 through November 11, 2014
|
2013
|
2012
|
||||||||||||||
|
Revenue:
|
|||||||||||||||||||
|
Management fees – related party
|
$
|
796
|
|
$
|
100
|
|
$
|
696
|
|
$
|
896
|
|
$
|
776
|
|
||||
|
Interest income
|
5
|
|
$
|
2
|
|
3
|
|
2
|
|
4
|
|
||||||||
|
Other income
|
80
|
|
5
|
|
75
|
|
2
|
|
5
|
|
|||||||||
|
Total revenue
|
881
|
|
107
|
|
774
|
|
900
|
|
785
|
|
|||||||||
|
Expenses:
|
|||||||||||||||||||
|
Salaries and benefits
|
5,601
|
|
474
|
|
5,127
|
|
5,779
|
|
4,943
|
|
|||||||||
|
Interest expense
|
2,372
|
|
106
|
|
2,266
|
|
27
|
|
12
|
|
|||||||||
|
Professional fees
|
1,139
|
|
170
|
|
969
|
|
1,309
|
|
969
|
|
|||||||||
|
Depreciation and amortization
|
146
|
|
17
|
|
129
|
|
161
|
|
118
|
|
|||||||||
|
Lease restructuring charges (amortization)
|
(291
|
)
|
(36
|
)
|
(255
|
)
|
(291
|
)
|
(291
|
)
|
|||||||||
|
Insurance expense – related party
|
115
|
|
11
|
|
104
|
|
131
|
|
57
|
|
|||||||||
|
Other general and administrative costs
|
2,621
|
|
308
|
|
2,313
|
|
1,786
|
|
2,488
|
|
|||||||||
|
Total expenses
|
11,703
|
|
1,050
|
|
10,653
|
|
8,902
|
|
8,296
|
|
|||||||||
|
Loss before income taxes
|
$
|
(10,822
|
)
|
$
|
(943
|
)
|
$
|
(9,879
|
)
|
$
|
(8,002
|
)
|
$
|
(7,511
|
)
|
||||
The Corporate activities segment implements business strategy, directs marketing, provides technology oversight and guidance, coordinates and integrates activities of the other segments, contracts with alliance partners, acquires customer opportunities, and owns our proprietary NewTracker™ referral system and all other intellectual property rights. This segment includes revenue and expenses not allocated to other segments, including interest income, Capco management fee income, and corporate operating expenses. These operating expenses consist primarily of internal and external public accounting expenses, internal and external corporate legal expenses, corporate officer salaries, sales and marketing expense and rent for the principal executive offices.
Comparison of the years ended December 31, 2014 (Pro forma) and December 31, 2013
Revenue is derived primarily from management fees earned from the Capcos. These related party management fees decreased by $100,000 year over year due to the decision to no longer charge management fees to one of the Capcos. Related party management fees, which are eliminated upon consolidation, are expected to decline in the future as the Capcos mature and utilize their cash. If a Capco does not have current or projected cash sufficient to pay management fees, then such fees are not accrued.
Total expenses increased by $2,801,000, or 31%, for the year ended December 31, 2014 as compared with the same period in 2013. The increases were primarily driven by an increase in interest expense of which $1,905,000 was related to the closing of the new term loan and line of credit with Capital One which was used to repay Summit and the outstanding on the MTS term notes. The $1,905,000 increase relates to the amortization of deferred financing costs and debt discount related to the Summit note. Interest expense also increased by $371,000 related to the new Capital One term loan and line of credit. Other general and administrative costs increased mainly due to an increase in marketing expense related to increase in purchase of air time for our television ad campaign.
These increases were partially offset by a $170,000 reduction in professional fees due to higher legal fees in the prior year in connection with higher audit costs incurred in 2013.
The loss before income taxes increased by approximately $2,820,000 for the twelve months ended December 31, 2014 as compared to the prior year. The loss increase was primarily due to the increase in interest and advertising as previously discussed.
71
Comparison of the years ended December 31, 2013 and December 31, 2012
Revenue is derived primarily from management fees earned from the Capcos. These related party management fees increased by $120,000 to $896,000 for the year ended December 31, 2013 from $776,000 from the year ago period. Related party management fees, which are eliminated upon consolidation, are expected to decline in the future as the Capcos mature and utilize their cash. If a Capco does not have current or projected cash sufficient to pay management fees, then such fees are not accrued.
Total expenses increased $606,000, or 7%, for the year ended December 31, 2013 compared with 2012. Salaries and benefits increased a total of $836,000 due to the addition of new staff primarily in the sales, executive and the human resources departments. Professional fees increased by $340,000 year over year due to additional audit and legal fees incurred in connection with the restatement of the 2011 and 2012 financial statements, as well as additional costs associated with the Company exploring various financing transactions. The $43,000 increase in depreciation and amortization was related to the capitalization of website development costs, and insurance expense – related party rose by $74,000 as a result of increased premiums for the renewal of our corporate policies. These increases were partially offset by a decrease in other general and administrative costs that included a $244,000 reversal of an accrual for a contract dispute that was settled during the year, as well as reductions of $225,000 and $168,000 in IT expense and rent, respectively, as well as a decrease of $123,000 in other office related expenses.
Loss before income taxes increased $491,000 for the twelve months ended December 31, 2013 compared to the prior year, primarily due to the increases in salaries and benefits, professional fees and related party insurance expense.
Capco
As described in Note 3 to the consolidated financial statements, effective January 1, 2008, the Company adopted fair value accounting for its financial assets and financial liabilities concurrent with its election of the fair value option for substantially all credits in lieu of cash, notes payable in credits in lieu of cash and prepaid insurance. These are the financial assets and liabilities associated with the Company’s Capco notes that are reported within the Company’s Capco segment. The tables below reflect the effects of the adoption of fair value measurement on the income and expense items (income from tax credits, interest expense and insurance expense) related to the revalued financial assets and liability for the years ended December 31, 2014, 2013 and 2012. In addition, the net change to the revalued financial assets and liability for the years ended December 31, 2014 and 2013 is reported in the line “Net change in fair market value of Credits in lieu of cash and Notes payable in credits in lieu of cash” on the consolidated statements of income.
The Company does not anticipate creating any new Capcos in the foreseeable future and the Capco segment will continue to incur losses going forward. The Capcos will continue to earn cash investment income on their cash balances and incur cash management fees and operating expenses. The amount of cash available for investment and to pay management fees will be primarily dependent upon future returns generated from investments in qualified businesses. Income from tax credits will consist solely of accretion of the discounted value of the declining dollar amount of tax credits the Capcos will receive in the future; the Capcos will continue to incur non-cash interest expense.
72
|
(In thousands):
|
Pro Forma 2014 (Unaudited)
|
For the period November 12, 2014 through December 31, 2014 (Unaudited)
|
For the period January 1, 2014 through November 11, 2014
|
2013
|
2012
|
||||||||||||||
|
Revenue:
|
|||||||||||||||||||
|
Income from tax credits
|
$
|
61
|
|
$
|
13
|
|
$
|
48
|
|
$
|
113
|
|
$
|
522
|
|
||||
|
Interest income
|
13
|
|
3
|
|
10
|
|
29
|
|
40
|
|
|||||||||
|
Dividend income – related party
|
348
|
|
46
|
|
302
|
|
49
|
|
—
|
|
|||||||||
|
Other income
|
9
|
|
5
|
|
4
|
|
22
|
|
121
|
|
|||||||||
|
Total revenue
|
431
|
|
67
|
|
364
|
|
213
|
|
683
|
|
|||||||||
|
Net change in fair value of: Credits in lieu of cash and Notes payable in credits in lieu of cash
|
(8
|
)
|
(3
|
)
|
(5
|
)
|
21
|
|
3
|
|
|||||||||
|
Expenses:
|
|||||||||||||||||||
|
Interest expense
|
92
|
|
14
|
|
78
|
|
174
|
|
567
|
|
|||||||||
|
Management fees – related party
|
942
|
|
246
|
|
696
|
|
896
|
|
1,069
|
|
|||||||||
|
Professional fees
|
266
|
|
47
|
|
219
|
|
296
|
|
293
|
|
|||||||||
|
Other general and administrative costs
|
154
|
|
10
|
|
144
|
|
152
|
|
158
|
|
|||||||||
|
Total expenses
|
1,454
|
|
317
|
|
1,137
|
|
1,518
|
|
2,087
|
|
|||||||||
|
Loss before income taxes
|
$
|
(1,031
|
)
|
$
|
(253
|
)
|
$
|
(778
|
)
|
$
|
(1,284
|
)
|
$
|
(1,401
|
)
|
||||
Comparison of the years ended December 31, 2014 (Pro forma) and December 31, 2013
Revenue is derived primarily from non-cash income from tax credits, interest and dividend income. The decrease in tax credits for the year ended December 31, 2014 versus 2013 reflects the effect of the declining dollar amount of tax credits remaining in 2014. The amount of future income from tax credits revenue will fluctuate with future interest rates. However, over future periods through 2016, the amount of tax credits, and therefore the income the Company will recognize, will decrease to zero. Interest income decreased by $16,000 due to a reduction in the average cash balance during 2014. The increase in total revenue for the year ended December 31, 2014 compared to 2013 is primarily due to $296,000 in dividends received from a related party, earned by three of the Capcos on equity investments made in 2013 and $52,000 in dividends from a preferred interest in a related party, partially offset with income from previously written-off investments received in prior period.
For the year ended December 31, 2014, interest expense decreased by $82,000 as a result of the declining amount of tax credits payable in 2014. Related party management fees for the year ended December 31, 2014 increased by $46,000 due to $146,000 of fees charged in 2014 that were not charged in 2013, offset by a $100,000 decrease in fees charged to another Capco. Management fees are expected to decline in the future as the Capcos mature and utilize their cash. Professional fees decreased by $30,000 due mainly to a decrease in audit fees.
Overall, the pretax loss before income taxes in the Capco segment decreased by $253,000 in 2014, primarily due to an increase in dividend income and a decrease in interest expense.
Comparison of the years ended December 31, 2013 and December 31, 2012
Revenue is derived primarily from non-cash income from tax credits. The decrease in total revenue for the year ended December 31, 2013 versus 2012 reflects the effect of the declining dollar amount of tax credits remaining in 2013. The amount of future income from tax credits revenue will fluctuate with future interest rates. However, over future periods through 2016, the amount of tax credits and, therefore, the income the Company will recognize, will decrease to zero. Interest income decreased by $11,000 for the twelve months ended December 31, 2013 to $29,000 from $40,000 due to a reduction in the average cash balance during 2013. In 2013, three of the Capcos made an equity investment in Small Business Lending, Inc., a related party, which earns a 10% annual cumulative preferred dividend. The Company recorded $49,000 in accrued related
73
party dividends from these investments for the year ended December 31, 2013. Other income decreased $99,000, from $121,000 to $22,000 for the twelve months ended December 31, 2013 primarily due to a $100,000 gain on the sale of an investment with a zero carrying basis recognized in 2012.
For the year ended December 31, 2013, interest expense decreased by 69%, or $393,000, from $567,000 to $174,000 as a result of the declining dollar amount of tax credits payable in 2013, and related party management fees decreased 16%, or $173,000, to $896,000. Related party management fees, which are eliminated upon consolidation, are expected to continue to decline in the future as the Capcos mature and utilize their cash.
Liquidity and Capital Resources
Overview
Cash requirements and liquidity needs over the next twelve months are anticipated to be funded primarily through operating results, available cash and cash equivalents, existing credit lines, proposed new credit lines, additional securitizations of the Company’s SBA lender’s unguaranteed loan portions and additional issuances of common stocks.
In November 2014, the Company closed an underwritten offering of 2,530,000 shares of its common stock at a public offering price of $12.50 per share for total gross proceeds of $31,625,000. The Company is using the proceeds to expand its financing activities and to primarily increase its activity in SBA 7(a) lending and make direct investments in portfolio companies in accordance with its investment objectives and strategies.
As more fully described below, the Company’s SBA lender (“NSBF”) will require additional funding sources to maintain current SBA loan originations under anticipated conditions; although the failure to find these sources may require the reduction in the Company’s SBA lending and related operations, it will not impair the Company’s overall ability to operate.
NSBF depends on the availability of licensed SBA lenders to purchase SBA loans held for sale transferred to the secondary markets and the premium earned therein to support its lending operations. At this time the secondary market for the SBA loans held for sale is robust.
NSBF has historically financed the operations of its lending business through loans or credit facilities from various lenders and will need to continue to do so in the future, as well as raise capital through the issuance of the Company’s common stock. Such lenders invariably require a security interest in the SBA loans as collateral which, under the applicable law, requires the prior approval of the SBA. If the Company should ever be unable to obtain the approval for its financing arrangements from the SBA, or if it were otherwise unable to raise capital, it would likely be unable to continue to make loans.
As an alternative to holding indefinitely the portions of SBA loans remaining after sale of the guaranteed portions in the SBA supervised secondary market, NSBF has undertaken to securitize these unguaranteed portions. In December 2010, the first such securitization trust established by NSBF issued notes to one investor in the amount of $16,000,000 which received an S&P rating of AA. A second securitization, an amendment to the original transaction, was completed in December 2011, and resulted in an additional $14,900,000 of notes issued to the same investor. NSBF used the cash generated from the first transaction to retire its outstanding term loan from Capital One, North America (“Capital One”) and to fund a $3,000,000 account which during the first quarter of 2011 purchased unguaranteed portions originated subsequent to the securitization transaction. Similarly, the proceeds from the second securitization in 2011 were used to pay down its outstanding term loan with Capital One and to fund a $5,000,000 account used to fund additional originations in the first quarter of 2012. Additional securitizations were completed in March 2013 and December 2013 resulting in the issuance of notes in the amount of $20,909,000 and $24,434,000, respectively. Similarly, the proceeds of both transactions were used to pay down the outstanding term loan with Capital One, and a combined total of $12,945,000 was used to fund an account used to purchase unguaranteed portions of loans throughout 2013, and during the first quarter of 2014. While this securitization process can provide a long-term funding source for the SBA lender, there is no certainty that it can be conducted on an economic basis. In addition, the securitization mechanism itself does not provide liquidity in the short term for funding SBA loans. In December 2014, NSBF completed an additional securitization transaction which resulted in the transfer of $36,000,000 of unguaranteed portions of SBA loans and an additional $7,500,000 in loans which were issued subsequent to the transaction. The Newtek Small Business Loan Trust 2014-1in turn issued securitization notes for the par amount of $31,700,000 against the assets in a private placement. The notes received an “A” rating by S&P, and the final maturity date of the notes is July 2039. The proceeds of the transaction have been and will be used to repay debt and originate new loans.
74
In June 2014, the Company entered into a four year $20,000,000 credit agreement with Capital One consisting of a $10,000,000 term loan and a revolving line of credit of up to $10,000,000. Principal and interest on the term loan are payable quarterly in arrears and the interest rate is Prime plus 250 basis points. The term loan is being amortized over a six year period with a final payment due on the maturity date. The interest rate on the revolving line of credit is also Prime plus 250 basis points and is payable monthly in arrears with the principal due at maturity. In addition, the revolving line accrues interest of 0.375% on the unused portion of the line which is payable quarterly in arrears.
The purpose of the new facilities was to refinance the Company's existing debt from Summit Partners Credit Advisors, L.P., payoff the current portion of the NTS loan, and for general working capital purposes. The new Capital One facilities require the adherence to certain financial covenants including minimum EBITDA, fixed charge coverage ratios, funded debt to EBITDA ratios, as well as minimum cash balance requirements. As of December 31, 2014, the Company was in compliance with all financial covenants. During the fourth quarter of 2014, the Company received a waiver from Capital One under the facility related to the merger transaction, conversion to a BDC and stock offering. In addition, the Company is also seeking a waiver from Capital One to ensure the dividend restriction will be waived prior to declaration of the first quarter dividend.
In July 2013 the SBA lender, received an extension on the maturity of its warehouse lines of credit, totaling $27,000,000 with Capital One from September 30, 2013 to May 31, 2015, at which time the outstanding balance would be converted into a three-year term loan. The extension also enhanced the terms of the credit facilities by removing the $15,000,000 funding sublimit for the non-guaranteed portions of the SBA 7(a) loans NSBF originates, and increasing the advance rate to 55% from 50% for the non-guaranteed portions of the SBA 7(a) loans. As of December 31, 2014 and 2013, NSBF had $33,856,000 and $25,952,000 outstanding under the line of credit. The interest rate on the portion of the facility, collateralized by the government guaranteed portion of SBA 7(a) loans, is set at Prime plus 1.00%, and there is a quarterly facility fee equal to 25 basis points on the unused portion of the revolving credit calculated as of the end of each calendar quarter. The interest rate on the portion of the facility, collateralized by the non-guaranteed portion of SBA 7(a) loans, is set at Prime plus 1.875%, and there is a quarterly facility fee equal to 25 basis points on the unused portion of the revolving credit calculated as of the end of each calendar quarter. On October 29, 2014, NSBF, closed an additional $23,000,000 in financing with Capital One which increased the existing revolving credit facility from $27,000,000 to $50,000,000. The amendment also extended the term of the facility from May 31, 2015 to May 16, 2018. During the fourth quarter of 2014, NSBF received a waiver from Capital One under the facility related to the merger transaction and stock offering. During the first quarter of 2015, NSBF negotiated amendments to the existing facility including the elimination of the fixed charge coverage ratio in exchange for a debt service ratio, new EBITDA minimums, the elimination of restrictions on the Company’s ability to pay dividends to its shareholders, as well as the release of the guarantees of the Company’s former subsidiaries (now treated as portfolio companies). While these amendments are subject to the SBA’s approval, which is pending, the Company is also seeking a waiver from Capital One to ensure the dividend restriction will be waived prior to declaration of the first quarter dividend. At December 31, 2014, the Company was in full compliance with applicable loan covenants.
As of December 31, 2014, the Company’s unused sources of liquidity consisted of $10,000,000 available through the combined Capital One facilities.
Restricted cash of $15,389,000 as of December 31, 2014 is primarily held in NSBF. The majority, or $13,906,000 of restricted cash, is related to NSBF, and includes $4,029,000 held in a prefunding account to be used to originate new loans, $3,897,000 for a reserve in the event payments are insufficient to cover interest and/or principal with respect to the securitization, and $278,000 set aside for servicer and prepaid interest fees. The remaining $5,702,000 represents payments collected due to participants and amounts owed to the SBA. The remaining balance of $1,572,000 includes $750,000 in connection with the Company’s guarantee of the NBC Sterling line of credit, and other amounts held as security deposits.
75
In summary, Newtek generated and used cash as follows:
|
For the Period November 12 to December 31,
|
For the Period January 1 to November 11,
|
For the Years Ended December 31,
|
|||||||||||||
|
|
2014
|
2014
|
2013
|
2012
|
|||||||||||
|
Net cash provided by (used in) operating activities
|
$
|
(38,923
|
)
|
$
|
24,553
|
|
$
|
4,974
|
|
$
|
(4,354
|
)
|
|||
|
Net cash used in investing activities
|
(20
|
)
|
(30,016
|
)
|
(36,121
|
)
|
(22,498
|
)
|
|||||||
|
Net cash provided by financing activities
|
52,023
|
|
1,054
|
|
29,426
|
|
29,880
|
|
|||||||
|
Net (decrease) increase in cash and cash equivalents
|
13,080
|
|
(4,409
|
)
|
(1,721
|
)
|
3,028
|
|
|||||||
|
Cash and cash equivalents, beginning of year/period
|
4,733
|
|
12,508
|
|
14,229
|
|
11,201
|
|
|||||||
|
Cash and cash equivalents, end of year/period
|
$
|
17,813
|
|
$
|
8,099
|
|
$
|
12,508
|
|
$
|
14,229
|
|
|||
Net cash flows from operating activities decreased $19,344,000 to $14,370,000 of cash used for the year ended December 31, 2014 compared to $4,974,000 of cash provided during the year ended December 31, 2013. This change primarily reflects the origination of SBA loans of $39,484,000 offset by payments received of $6,421,000 which are included in operating activities for the period November 12, 2014 through December 31, 2014. As discussed below, originations and repayments were included in investing activities through November 11, 2014 and in 2013. The decrease was offset by an increase in broker receivable in 2014. Broker receivables arise from loans traded but not settled before period end and represent the amount of cash due from the purchasing broker; the amount varies depending on loan origination volume and timing of sales at year end.
Net cash used in investing activities primarily includes the originations and repayments of the unguaranteed portions of SBA loans through November 11, 2014. As a result of the BDC Conversion, originations and repayments of the unguaranteed portions of SBA loans are included in operating activities. Net cash used also includes the purchase of fixed assets and changes in restricted cash. Net cash used in investing activities decreased by $6,085,000 to cash used of $30,036,000 for the year ended December 31, 2014 compared to cash used of $36,121,000 for the year ended December 31, 2013. The decrease was due primarily to originations and repayments of SBA loans originated being included in operating activities subsequent to the Conversion. SBA loan originations, net of repayments were $28,933,000 from January 1, 2014 through November 11, 2014 compared to $35,476,000 in 2013.
Net cash provided by financing activities primarily includes the net borrowings and (repayments) on bank lines of credit and notes payable as well as securitization activities. Net cash provided by financing activities increased by $23,651,000 to cash provided of $53,077,000 for the year ended December 31, 2014, from cash provided of $29,426,000 for the year ended December 31, 2013. The increase in the current year is primarily attributed to the proceeds of $29,728,000, net of offering costs from the sale of shares during the year and net borrowings of $7,344,000 under bank lines of credit.
Financing Activities
In November 2014, the Company closed an underwritten offering of 2,530,000 shares of its common stock at a public offering price of $12.50 per share for total gross proceeds of $31,625,000. The Company is using the proceeds to expand its financing activities and to primarily increase its activity in SBA 7(a) lending and make direct investments in portfolio companies in accordance with its investment objectives and strategies.
In June 2014, the Company entered into a four year $20,000,000 credit agreement with Capital One consisting of a $10,000,000 term loan and a revolving line of credit of up to $10,000,000. Principal and interest on the term loan are payable quarterly in arrears and the interest rate is Prime plus 250 basis points. The term loan is being amortized over a six year period with a final payment due on the maturity date. The interest rate on the revolving line of credit is also Prime plus 250 basis points and is payable monthly in arrears with the principal due at maturity. In addition, the revolving line accrues interest of 0.375% on the unused portion of the line which is payable quarterly in arrears. The purpose of the new facilities was to refinance the Company's existing debt from Summit Partners Credit Advisors, L.P., payoff the current portion of the NTS loan, and for general working capital purposes. As of December 31, 2014 the outstanding balance of the term loan was approximately $9,167,000 and no amount was outstanding on the revolving line of credit.
76
Credit Lines and Term Loans
In June 2014, the Company entered into a four year $20,000,000 credit agreement with Capital One consisting of a $10,000,000 term loan and a revolving line of credit of up to $10,000,000. Principal and interest on the term loan are payable quarterly in arrears and the interest rate is Prime plus 250 basis points. The term loan is being amortized over a six year period with a final payment due on the maturity date. The interest rate on the revolving line of credit is also Prime plus 250 basis points and is payable monthly in arrears with the principal due at maturity. In addition, the revolving line accrues interest of 0.375% on the unused portion of the line which is payable quarterly in arrears. The purpose of the new facilities was to refinance the Company's debt from Summit Partners Credit Advisors, L.P., payoff the current portion of the NTS loan with Capital One Bank, and for general working capital purposes. The new Capital One, N.A. facilities require the adherence to certain financial covenants including minimum EBITDA, fixed charge coverage ratios, funded debt to EBITDA ratios, as well as minimum cash balance requirements. As of December 31, 2014, the Company was in compliance with all financial covenants.
In July 2013 the SBA lender received an extension on the maturity of its warehouse lines of credit, totaling $27,000,000 with Capital One from September 30, 2013 to May 31, 2015, at which time the outstanding balance will be converted into a three-year term loan. The extension also enhanced the terms of the credit facilities by removing the $15 million funding sublimit for the non-guaranteed portions of the SBA 7(a) loans NSBF originates, and increasing the advance rate to 55% from 50% for the non-guaranteed portions of the SBA 7(a) loans. The NSBF line of credit is collateralized by all of NSBF’s assets and Newtek guaranteed the repayment obligations. The interest rate on the portion of the facility collateralized by the government guaranteed portion of SBA 7(a) loans, is set at prime plus 1.00%, and there is a quarterly facility fee equal to 25 basis points on the unused portion of the revolving credit calculated as of the end of each calendar quarter. The interest rate on the portion of the facility collateralized by the non-guaranteed portion of SBA 7(a) loans, is set at prime plus 1.875%, and there is a quarterly facility fee equal to 25 basis points on the unused portion of the revolving credit calculated as of the end of each calendar quarter. The agreement includes financial covenants at the parent company level with its consolidated subsidiaries including a minimum fixed charge coverage ratio, minimum EBITDA requirements and minimum cash requirements held at Capital One. As of December 31, 2014, the Company and NSBF were in compliance with the financial covenants set in this line. On October 29, 2014, NSBF, closed an additional $23,000,000 in financing with Capital One which increased the existing revolving credit facility from $27,000,000 to $50,000,000. The amendment also extended the term of the facility from May 31, 2015 to May 16, 2018. During the fourth quarter of 2014, the Company received a waiver related to the merger transaction and conversion to a BDC. The existing facility has been amended to allow the Company to operate as a BDC and the amendment is currently pending final approval by the SBA. Changes to the existing facility include the elimination of the fixed charge coverage ratio in exchange for a debt service ratio, new EBITDA minimums, the elimination of restrictions on the Company’s ability to pay dividends to its shareholders, as well as the release of the guarantees of the Company’s former subsidiaries (now treated as portfolio companies). While the SBA is in the process of reviewing the amendment, the Company is also seeking a waiver from Capital One to ensure the dividend restriction will be waived prior to declaration of the first quarter dividend.
Securitization Transactions
In December 2010, NSBF created a financing channel for the sale of the unguaranteed portions of SBA 7(a) loans held on its books. NSBF transferred the unguaranteed portions of SBA loans of $19,615,000, and an additional $3,000,000 in loans issued subsequent to the transaction, to a special purpose entity created for this purpose, Newtek Small Business Loan Trust 2010-1 (the “Trust”), which in turn issued notes (the “securitization notes”) for the par amount of $16,000,000 against the assets in a private placement. The Trust is only permitted to purchase the unguaranteed portion of SBA 7(a) loans, issue asset-backed securities, and make payments on the securities. The Trust issued a single series of securitization notes to pay for the unguaranteed portions it acquired from NSBF and will be dissolved when those securities have been paid in full. The primary source for repayment of the securitization notes is the cash flows generated from the unguaranteed portion of SBA 7(a) loans now owned by the Trust; principal on the securitization notes will be paid by cash flow in excess of that needed to pay various fees related to the operation of the Trust and interest on the debt. The securitization notes have an expected maturity of about five years based on the expected performance of the underlying collateral and structure of the debt and a legal maturity of 30 years from the date of issuance. The assets of the Trust are legally isolated and are not available to pay NSBF’s creditors. NSBF continues to retain rights to cash reserves and all residual interests in the Trust and will receive servicing income. Proceeds from this transaction were used to repay the Capital One loan and for general corporate and lending purposes. Because the Company determined that as the primary beneficiary of the Trust it needed to consolidate the Trust into its financial statements, it continues to recognize the securitization notes in Notes payable. The investors and the Trust have no recourse to any of NSBF’s other assets for failure if the Trust has insufficient funds to pay its obligations when due; however, NSBF’s parent, Newtek, has provided a limited guaranty to the investors in the Trust in an amount not to exceed 10% of the original issuance amount (or $1,600,000), to be used after all of the assets of the Trust have been exhausted. The notes were issued with an “AA” rating from S&P based on the underlying collateral.
77
In December 2011, NSBF entered into a Supplemental Indenture by which the original $16,000,000 of securitization notes were amended to reflect a new principal amount of $12,880,000, as a result of principal payments made, and additional notes were issued in an initial principal amount of $14,899,000, so that the initial aggregate principal amount of all notes as of December 31, 2011 totaled $27,779,000. The notes are backed by approximately $40,500,000 of the unguaranteed portions of loans originated, and include an additional $5,000,000 to be originated and issued to the Trust by NSBF under the SBA loan program. The notes retained their AA rating under S&P, and the final maturity date of the amended notes is March 22, 2037. The proceeds of the transaction have been and will be used to repay debt and originate new loans.
In March 2013, NSBF transferred the unguaranteed portions of SBA loans of $23,569,000, and an additional $5,900,000 in loans issued subsequent to the transaction, to a special purpose entity Newtek Small Business Loan Trust 2013-1 (the “Trust”). The Trust in turn issued securitization notes for the par amount of $20,909,000 against the assets in a private placement. The notes received an “A” rating by S&P; and the final maturity date of the amended notes is June 25, 2038. The proceeds of the transaction have been and will be used to repay debt and originate new loans.
In December 2013, NSBF completed an additional transaction whereby the unguaranteed portions of SBA loans of $23,947,000, and an additional $3,642,000 in loans issued subsequent to the transaction, was transferred to a Trust. The Trust in turn issued securitization notes for the par amount of $24,433,000 against the assets in a private placement. The notes received an “A” rating by S&P, and the final maturity date of the amended notes is April 25, 2039. The proceeds of the transaction have been and will be used to repay debt and originate new loans.
In December 2014, NSBF completed an additional transaction which resulted in the transfer of $36,000,000 of unguaranteed portions of SBA loans and an additional $7,500,000 in loans which were issued subsequent to the transaction. The Trust in turn issued securitization notes for the par amount of $31,700,000 against the assets in a private placement. The notes received an “A” rating by S&P, and the final maturity date of the notes is April 2040. The proceeds of the transaction have been and will be used to repay debt and originate new loans.
Tabular Disclosure of Contractual Obligations
The following chart represents Newtek’s obligations and commitments as of December 31, 2014, other than Capco debt repayment discussed above, for future cash payments under debt, lease and employment agreements (in thousands):
|
|
Payments due by period
|
||||||||||||||||||
|
Contractual Obligations
|
Total
|
Less than 1 year
|
|
1-3 years
|
|
3-5 years
|
More than 5 years
|
||||||||||||
|
Bank Notes Payable (a)
|
$
|
43,023
|
|
30,389
|
|
(b)
|
7,500
|
|
(c)
|
—
|
|
5,134
|
|
||||||
|
Securitization Notes Payable (d)
|
79,520
|
|
—
|
|
|
—
|
|
|
—
|
|
79,520
|
|
|||||||
|
Capital Leases
|
33
|
|
16
|
|
|
17
|
|
|
—
|
|
—
|
|
|||||||
|
Operating Leases
|
3,701
|
|
1,671
|
|
|
1,223
|
|
|
807
|
|
—
|
|
|||||||
|
Employment Agreements
|
210
|
|
210
|
|
|
—
|
|
|
—
|
|
—
|
|
|||||||
|
Totals
|
$
|
126,487
|
|
$
|
32,286
|
|
|
$
|
8,740
|
|
|
$
|
807
|
|
$
|
84,654
|
|
||
|
(a)
|
Payable to Capital One: Interest rates range from 4.25% to 5.75%.
|
|
(b)
|
Includes:
|
The amount outstanding on the NSBF Capital One guaranteed line included in the "Less than 1 year" column was $28,722,000. The amount payable upon sale of the guaranteed portions of loans which generally occurs within 0-60 days. Also included in the "Less than 1 year" column is the Capital One term loan payments payable in 2015 of $1,667,000. The term loan is being amortized over a six year term with the balance due June 25, 2018.
|
(c)
|
Includes:
|
•
$5,134,000 outstanding on the NSBF Capital One unguaranteed line, which converts to a three year term loan on May 31, 2018.
•
$9,167,000 was outstanding on the Capital One term loan due June 25, 2018
|
(d)
|
Includes:
|
$80,121,000 or $79,520, 000 net of discount, of securitization notes with legal maturity of 30 years bearing interest at rates between London Interbank Offered Rate ("LIBOR") plus 3.45% to prime plus 0.75%; actual
78
principal payments will be paid by cash flow in excess of that needed to pay various fees related to the operation of the Trust and interest on the debt.
Critical Accounting Policies and Estimates Before Becoming a Business Development Company
The preparation of financial statements in conformity with accounting principles generally accepted in the United States of America requires management to make estimates and assumptions that affect the reported amounts of assets, liabilities and disclosures of contingent assets and liabilities at the date of the financial statements and reported amounts of revenues and expenses during the reporting period. The most significant estimates include:
|
•
|
allowance for loan losses;
|
|
•
|
sales and servicing of SBA loans;
|
|
•
|
chargeback reserves;
|
|
•
|
fair value measurement used to value certain financial assets and financial liabilities;
|
|
•
|
valuation of intangible assets and goodwill including the values assigned to acquired intangible assets;
|
|
•
|
stock-based compensation; and
|
|
•
|
income tax valuation allowance.
|
Management continually evaluates its accounting policies and the estimates it uses to prepare the consolidated financial statements. In general, the estimates are based on historical experience, on information from third-party professionals and on various other sources and assumptions that are believed to be reasonable under the facts and circumstances at the time such estimates are made. The Company’s critical accounting policies are reviewed periodically with the audit committee of the board of directors. Management considers an accounting estimate to be critical if:
|
•
|
it requires assumptions to be made that were uncertain at the time the estimate was made; and
|
|
•
|
changes in the estimate, or the use of different estimating methods, could have a material impact on the Company’s consolidated results of operations or financial condition.
|
Actual results could differ from those estimates. Significant accounting policies are described in Note 1 to the consolidated financial statements, which are included in Item 15 in this Form 10-K filing. In many cases, the accounting treatment of a particular transaction is specifically indicated by Accounting Principles Generally Accepted in the United States of America.
Certain of our accounting policies are deemed “critical,” as they require management’s highest degree of judgment, estimates and assumptions. The following critical accounting policies are not intended to be a comprehensive list of all of our accounting policies or estimates.
Fair Value Measurements
As discussed in Item 8. “Financial Statements and Supplementary Data, Note 3, Fair Value Measurements” we adopted fair value accounting effective January 1, 2008. Fair value is defined as the price that would be received to sell an asset or paid to transfer a liability in an orderly transaction between market participants at the measurement date (an exit price) and establishes a fair value hierarchy that prioritizes the inputs to valuation techniques used to measure fair value into three levels for disclosure purposes. The Company carries its credits in lieu of cash, prepaid insurance and notes payable in credits in lieu of cash at fair value. The Company also carries impaired loans, servicing asset and other real estate owned at fair value. The fair value hierarchy gives the highest priority (Level 1) to quoted prices in active markets for identical assets or liabilities and gives the lowest priority to unobservable inputs (Level 3). An asset or liability’s classification within the fair value hierarchy is based on the lowest level of significant input to its valuation. The levels of the fair value hierarchy are as follows
79
|
Level 1
|
|
Quoted prices in active markets for identical assets or liabilities. Level 1 assets and liabilities include debt and equity securities and derivative contracts that are traded in an active exchange market, as well as certain U.S. Treasury, other U.S. Government and agency mortgage-backed debt securities that are highly liquid and are actively traded in over-the-counter markets.
|
|
Level 2
|
|
Observable inputs other than Level 1 prices, such as quoted prices for similar assets or liabilities; quoted prices in markets that are not active; or other inputs that are observable or can be corroborated by observable market data for substantially the full term of the assets or liabilities. Level 2 assets and liabilities include debt securities with quoted prices that are traded less frequently than exchange-traded instruments and derivative contracts whose value is determined using a pricing model with inputs that are observable in the market or can be derived principally from or corroborated by observable market data. This category generally includes certain U.S. Government and agency mortgage-backed debt securities, corporate debt securities, derivative contracts and residential mortgage loans held-for-sale.
|
|
Level 3
|
|
Unobservable inputs that are supported by little or no market activity and that are significant to the fair value of the assets or liabilities. Level 3 assets and liabilities include financial instruments whose value is determined using pricing models, discounted cash flow methodologies, or similar techniques, as well as instruments for which the determination of fair value requires significant management judgment or estimation. This category generally includes certain private equity investments, retained residual interests in securitizations, residential mortgage servicing rights, and highly structured or long-term derivative contracts.
|
Revenue Recognition
Electronic payment processing revenue:
Electronic payment processing and fee income is derived from the electronic processing of credit and debit card transactions that are authorized and captured through third-party networks. Typically, merchants are charged for these processing services on a percentage of the dollar amount of each transaction plus a flat fee per transaction. Certain merchant customers are charged miscellaneous fees, including fees for handling charge-backs or returns, monthly minimum fees, statement fees and fees for other miscellaneous services. Revenues derived from the electronic processing of MasterCard
®
and Visa
®
sourced credit and debit card transactions are reported gross of amounts paid to sponsor banks.
Web hosting revenue
:
Managed technology solutions revenue is primarily derived from monthly recurring service fees for the use of its web hosting, web design and software support services. Customer set-up fees are billed upon service initiation and are recognized as revenue over the estimated customer relationship period of 2.5 years. Payment for web hosting and related services, excluding cloud plans, is generally received one month to one year in advance. Deferred revenues represent customer payments for web hosting and related services in advance of the reporting period date. Revenue for cloud related services is based on actual consumption used by a cloud customer.
Income from tax credits:
Following an application process, a state will notify a company that it has been certified as a Capco. The state or jurisdiction then allocates an aggregate dollar amount of tax credits to the Capco. However, such amount is neither recognized as income nor otherwise recorded in the financial statements since it has yet to be earned by the Capco. The Capco is entitled to earn tax credits upon satisfying defined investment percentage thresholds within specified time requirements. Newtek has Capcos in seven states and the District of Columbia. Each statute requires that the Capco invest a threshold percentage of “certified capital” (the funds provided by the insurance company investors) in businesses defined as qualified within the time frames specified. As the Capco meets these requirements, it avoids grounds under the statute for its disqualification for continued participation in the Capco program. Such a disqualification, or “decertification” as a Capco results in a permanent recapture of all or a portion of the allocated tax credits. The proportion of the possible recapture is reduced over time as the Capco remains in general compliance with the program rules and meets the progressively increasing investment benchmarks. As the Capco progresses in its investments in Qualified Businesses and, accordingly, places an increasing proportion of the tax credits beyond recapture, it earns an amount equal to the non-recapturable tax credits and records such amount as income, with a corresponding asset called “credits in lieu of cash” in the balance sheet.
The amount earned and recorded as income is determined by multiplying the total amount of tax credits allocated to the Capco by the percentage of tax credits immune from recapture (the earned income percentage) at that point. To the extent that the investment requirements are met ahead of schedule, and the percentage of non-recapturable tax credits is accelerated, the present value of the tax credit earned is recognized currently and the asset, credits in lieu of cash, is accreted up to the amount of tax credits deliverable to the certified investors. The obligation to deliver tax credits to the certified investors is recorded as notes payable in credits in lieu of cash. On the date the tax credits are utilizable by the certified investors, the Capco decreases credits in lieu of cash with a corresponding decrease to notes payable in credits in lieu of cash.
80
Interest and SBA Loan Fees
:
Interest income on loans is recognized as earned. Loans are placed on non-accrual status if they exceed 90 days past due with respect to principal or interest and, in the opinion of management, interest or principal on individual loans is not collectible, or at such earlier time as management determines that the collectability of such principal or interest is unlikely. Such loans are designated as impaired non-accrual loans. All other loans are defined as performing loans. When a loan is designated as non-accrual, the accrual of interest is discontinued, and any accrued but uncollected interest income is reversed and charged against current operations. While a loan is classified as non-accrual and the future collectability of the recorded loan balance is doubtful, collections of interest and principal are generally applied as a reduction to principal outstanding.
The Company passes certain expenditures it incurs to the borrower, such as forced placed insurance, insufficient funds fees, or fees it assesses, such as late fees, with respect to managing the loan. These expenditures are recorded when incurred. Due to the uncertainty with respect to collection of these passed through expenditures or assessed fees, any funds received to reimburse the Company are recorded on a cash basis as other income.
Insurance commissions:
Revenues are comprised of commissions earned on premiums paid for insurance policies and are recognized at the time the commission is earned. At that date, the earnings process has been completed and the Company can estimate the impact of policy cancellations for refunds and establish reserves. The reserve for policy cancellations is based on historical cancellation experience adjusted by known circumstances.
Other income:
Other income represents revenues derived from operating units that cannot be aggregated with other business segments. In addition, other income represents one time recoveries or gains on investments. Revenue is recorded when there is strong evidence of an agreement, the related fees are fixed, the service and, or product has been delivered, and the collection of the related receivable is assured.
Capco Debt Issuance:
The Capco notes require, as a condition precedent to the funding of the notes, that insurance be purchased to cover the risks associated with the operation of its Capcos. This insurance has been purchased from Chartis Specialty Insurance Company and National Union Fire Insurance Company of Pittsburgh, both subsidiaries of Chartis, Inc. (“Chartis”), an international insurer. In order to comply with this condition precedent to the funding, the notes closing is structured as follows: (1) the certified investors wire their funds directly into an escrow account; (2) the escrow agent, pursuant to the requirements under the note and escrow agreement, automatically and simultaneously funds the purchase of the insurance contract from the proceeds received. Newtek’s Capco is not entitled to the use and benefit of the net proceeds received until the escrow agent has completed the purchase of the insurance. The Chartis insurance subsidiaries noted above are “A+” credit rated by S&P.
Under the terms of this insurance, which is for the benefit of the certified investors, the Capco insurer incurs the primary obligation to repay the certified investors a substantial portion of the debt (including all cash payments) as well as to make compensatory payments in the event of a loss of the availability of the related tax credits. The Capco remains secondarily liable for such payments and must periodically assess the likelihood that it will become primarily liable and, if necessary, record a liability at that time. The parent company, Chartis, has not guaranteed the obligations of its subsidiary insurers, although it has committed to move the payment obligations to an affiliated company in the event the Capco insurer is materially downgraded in its credit rating.
Investment Accounting and Valuation:
The various interests that the Capcos and Newtek acquire as a result of their investments are accounted for under three methods: consolidation, equity method and cost method. The applicable accounting method is generally determined based on our voting interest in a company and whether the company is a variable interest entity where we are the primary beneficiary, and quarterly valuations are performed so as to keep our records current in reflecting the operations of all of its investments.
Companies in which we directly or indirectly owns more than 50% of the outstanding voting securities, those Newtek has effective control over, or are deemed as a variable interest entity that needs to be consolidated , are generally accounted for under the consolidation method of accounting. Under this method, an investment’s results of operations are reflected within the consolidated statement of operations. All significant inter-company accounts and transactions are eliminated. The results of operations and cash flows of a consolidated entity are included through the latest interim period in which Newtek owned a greater than 50% direct or indirect voting interest, exercised control over the entity for the entire interim period or was otherwise designated as the primary beneficiary. Upon dilution of voting interest at or below 50%, or upon occurrence of a triggering event requiring reconsideration as to the primary beneficiary of a variable interest entity, the accounting method is adjusted to the equity or cost method of accounting, as appropriate, for subsequent periods.
81
Companies that are not consolidated, but over which we exercise significant influence, are accounted for under the equity method of accounting. Whether or not Newtek exercises significant influence with respect to a company depends on an evaluation of several factors including, among others, representation on the board of directors and ownership level, which is generally a 20% to 50% interest in the voting securities, including voting rights associated with Newtek’s holdings in common, preferred and other convertible instruments. Under the equity method of accounting, a company’s accounts are not reflected within our consolidated statements of income; however, Newtek’s share of the investee’s earnings or losses are reflected in other income in the Company’s consolidated statements of income.
Companies not accounted for under the consolidation or the equity method of accounting are accounted for under the cost method of accounting, for which quarterly valuations are performed. Under this method, our share of the earnings or losses of such companies is not included in the consolidated statements of income, but the investment is carried at historical cost. In addition, cost method impairment charges are recognized as necessary, in the consolidated statements of income if circumstances suggest that this is an “other than temporary decline” in the value of the investment, particularly due to losses. Subsequent increases in value, if any, of the underlying companies are not reflected in our financial statements until realized in cash. We record as income amounts previously written off only when and if we receive cash in excess of its remaining investment balance.
On a quarterly basis, the investment committee of each Capco meets to evaluate each of our investments. Newtek considers several factors in determining whether an impairment exists on the investment, such as the companies’ net book value, cash flow, revenue growth and net income. In addition, the investment committee looks at larger variables, such as the economy and the particular company’s industry, to determine if an other than temporary decline in value exists in each Capco’s and Newtek’s investment.
Impairment of Goodwill:
Management of the Company considers the following to be some examples of important indicators that may trigger an impairment review outside its annual goodwill impairment review: (i) significant under-performance or loss of key contracts acquired in an acquisition relative to expected historical or projected future operating results; (ii) significant changes in the manner or use of the acquired assets or in the Company’s overall strategy with respect to the manner or use of the acquired assets or changes in the Company’s overall business strategy; (iii) significant negative industry or economic trends; (iv) increased competitive pressures; (v) a significant decline in our stock price for a sustained period of time; and (vi) regulatory changes. In assessing the recoverability of our goodwill and intangibles, we must make assumptions regarding estimated future cash flows and other factors to determine the fair value of the respective assets. The fair value of an asset could vary, depending upon the estimating method employed, as well as assumptions made. This may result in a possible impairment of the intangible assets and/or goodwill, or alternatively an acceleration in amortization expense. For the period ended November 11, 2014, the Company recorded an impairment of goodwill for $1,706,000. For the period November 12, 2014 through December 31, 2014 and the years ended December 31, 2013 and 2012, goodwill was determined to not be impaired.
SBA Loans Held for Investment:
For loans that completed funding before October 1, 2010, SBA loans held for investment are reported at their outstanding unpaid principal balances adjusted for charge-offs, net deferred loan origination costs and the allowance for loan losses. For loans that completed funding on or after October 1, 2010, management elected to fair value SBA loans held for investment within the fair value hierarchy that prioritizes observable and unobservable inputs utilizing Level 3 unobservable inputs which reflect the Company’s own expectations about the assumptions that market participants would use in pricing the asset (including assumptions about risk). Prior to 2013, the Company determined fair value based on its securitization pricing, as well as internal quantitative data on the portfolio with respect to historical default rates and future expected losses, and now uses a discounted cash flow method, which includes assumptions for cumulative default rates, prepayment speeds, servicing cost and a market yield. If a loan measured at fair value is subsequently impaired, then the fair value of the loan is measured based on the present value of expected future cash flows discounted at the loan’s market interest rate, or the fair value less estimated costs to sell, of the collateral if the loan is collateral dependent. Because the loans bear interest at a variable rate, NSBF does not have to factor in interest rate risk.
Allowance for SBA Loan Losses:
For loans funded before October 1, 2010, the allowance for loan losses is established by management through provisions for loan losses charged against income. The amount of the allowance for loan losses is inherently subjective, as it requires making material estimates which may vary from actual results. Management’s ongoing estimates of the allowance for loan losses are particularly affected by the changing composition of the loan portfolio over the last few years as well as other portfolio characteristics, such as industry concentrations and loan collateral. The adequacy of the allowance for loan losses is reviewed by management on a monthly basis at a minimum, and as adjustments become necessary, are reflected in operations during the periods in which they become known. Considerations in this evaluation include past and anticipated loss experience, risks inherent in the current portfolio and evaluation of real estate collateral as well as current economic conditions. In the opinion of management, the allowance, when taken as a whole, is adequate to absorb estimated
82
loan losses inherent in the Company’s entire loan portfolio. The allowance consists of specific and general reserves. The specific reserve relates to loans that are classified as either loss, doubtful, substandard or special mention, that are considered impaired. For such loans that are also classified as impaired, an allowance is established when the discounted cash flows (or collateral value or observable market price) of the impaired loan is lower than the carrying value of that loan. The general reserve covers non-classified loans and is based on historical loss experience adjusted for qualitative factors.
For loans funded on or after October 1, 2010, the loan is reported at its fair value. Changes in the value of the loan, whether performing or impaired, are reported as a net change in the fair value of SBA loans held for investment.
A loan is considered impaired when, based on current information and events, it is probable that the Company will be unable to collect the scheduled payments of principal or interest when due according to the contractual terms of the loan agreement, and includes troubled debt restructuring. Other factors considered by management in determining impairment include payment status and collateral value. Loans that experience insignificant payment delays and payment shortfalls generally are not classified as impaired. Management determines the significance of payment delays and payment shortfalls on a case-by-case basis, taking into consideration all of the circumstances surrounding the loan and the borrower, including the length of the delay, the reasons for the delay, the borrower’s prior payment record, and the amount of the shortfall in relation to the principal and interest owed.
Impairment of a loan is measured based on the present value of expected future cash flows discounted at the loan’s market interest rate, or the fair value of the collateral less estimated costs to sell, if the loan is collateral dependent. Impaired loans for which the carrying amount is based on fair value of the underlying collateral are included in assets and reported at estimated fair value on a non-recurring basis, both at initial recognition of impairment and on an on-going basis until recovery or charge-off of the loan amount. The determination of impairment involves management’s judgment in the use of market data and third party estimates regarding collateral values. For loans funded before October 1, 2010, the impairment of a loan resulted in management establishing an allowance for loan losses through provisions for loan losses charged against income; for subsequent loans at fair value, impairment results in a net change in the fair value of SBA loans held for investment. Amounts deemed to be uncollectible are charged against the allowance for loan losses or reduces the fair value and subsequent recoveries, if any, are credited to the allowance or increases the fair value.
The Company’s charge-off policy is based on a loan-by-loan review for which the estimated uncollectible portion of nonperforming loans is charged off against the corresponding loan receivable and the allowance for possible loan losses or against the reduction in fair value.
Troubled Debt Restructured Loans:
A loan is considered a troubled debt restructuring (“TDR”) when a borrower is experiencing financial difficulties that leads to a restructuring that the Company would not otherwise consider. Concessions per ASC Topic 310, Receivables, may include rate reductions, principal forgiveness, extension of the maturity date and other actions to minimize potential losses. All TDRs are modified loans; however, not all modified loans are TDRs.
The Company reviews its modified loans for TDR Classification. When a borrower is granted extended time to pay and there are no other concessions as to rate reductions or principal, the loan remains an accrual loan. Certain time extensions based on the time value of money require reserves to be established despite no interruption on payments being made. In the case of a default, the loan becomes non-accrual and reviewed by committee for adequate specific reserves to that loan.
SBA Loans Held for Sale:
For guaranteed portions funded, but not yet traded at each measurement date, management elected to fair value SBA loans held for sale within the fair value hierarchy that prioritizes observable and unobservable inputs used to measure fair value utilizing Level 2 assets. These inputs include debt securities with quoted prices that are traded less frequently than exchange-traded instruments or have values determined using a pricing model with inputs that are observable in the market. The secondary market for the guaranteed portions is extremely robust with broker dealers acting as primary dealers. NSBF sells regularly into the market and can quickly price its loans held for sale. The Company values the guaranteed portion based on observable market prices for similar assets.
Securitization Activities:
NSBF engaged in securitizations of the unguaranteed portions of its SBA 7(a) loans. Because the transfer of these assets did not meet the criteria of a sale, these transactions were treated as a secured borrowings. NSBF continues to recognize the assets of the secured borrowing in loans held for investment and recognize the associated financing in Note payable – Securitization trust VIE.
Sales and Servicing of SBA Loans:
NSBF originates loans to customers under the SBA program that generally provides for SBA guarantees of 50% to 90% of each loan, subject to a maximum guarantee amount. This guaranteed portion is generally sold to a third party via an SBA regulated secondary market transaction utilizing SBA Form 1086 for a price equal to the
83
guaranteed loan amount plus a premium that includes both an upfront cash payment and the fair value servicing assets recorded in conjunction with the loan sale. Prior to October 1, 2010, NSBF recognized the revenue item “Premium on loan sales” net of capitalized loan expenses and the discount on the retained unguaranteed portion; subsequent to the adoption of fair value of SBA 7(a) loans on October 1, 2010, NSBF recognizes premium on loan sales as equal to the cash premium plus the fair value of the servicing asset. Revenue is recognized on the trade date of the guaranteed portion.
Upon recognition of each loan sale, the Company retains servicing responsibilities and receives servicing fees of a minimum of 1% of the guaranteed loan portion sold. The Company is required to estimate its adequate servicing compensation in the calculation of its servicing asset. The purchasers of the loans sold have no recourse to the Company for failure of customers to pay amounts contractually due.
Subsequent measurements of each class of servicing assets and liabilities may use either the amortization method or the fair value measurement method. Prior to the BDC Conversion, NSBF had chosen to apply the amortization method to its servicing asset, amortizing the asset in proportion to, and over the period of, the estimated future net servicing income on the underlying sold guaranteed portion of the loans and assessing the servicing asset for impairment based on fair value at each reporting date. In the event future prepayments are significant or impairments are incurred and future expected cash flows are inadequate to cover the unamortized servicing assets, accelerated amortization or impairment charges would be recognized. In evaluating and measuring impairment of servicing assets, NSBF stratifies its servicing assets based on year of loan and loan term which are the key risk characteristics of the underlying loan pools. Subsequent to the BDC Conversion the Company measures servicing assets at fair value. The Company estimates the fair value of the servicing asset by calculating the present value of estimated future net servicing cash flows, using assumptions of prepayments, defaults, servicing costs and discount rates that NSBF believes market participants would use for similar assets.
Management’s impairment analysis indicated no valuation adjustment for 2013.
Share-Based Compensation.
The Company records all share-based payments to employees based on their fair values using an option-pricing model at the date of grant.
Income Taxes.
Deferred tax assets and liabilities are computed based upon the differences between the financial statement and income tax basis of assets and liabilities using the enacted tax rates in effect for the year in which those temporary differences are expected to be realized or settled. If available evidence suggests that it is more likely than not that some portion or all of the deferred tax assets will not be realized, a valuation allowance is required to reduce the deferred tax assets to the amount that is more likely than not to be realized.
Critical Accounting Policies and Estimates After Converting to a Business Development Company
Valuation of Investments.
Investments are recorded at fair value. Our Board determines the fair value of our portfolio investments. We apply fair value to all of our investments in accordance with relevant GAAP, which establishes a framework used to measure fair value and requires disclosures for fair value measurements. We have categorized our investments carried at fair value, based on the priority of the valuation technique, into a three-level fair value hierarchy as mentioned previously above. Fair value is a market-based measure considered from the perspective of the market participant who holds the financial instrument rather than an entity specific measure. Therefore, when market assumptions are not readily available, our own assumptions are set to reflect those that management believes market participants would use in pricing the financial instrument at the measurement date.
Our Board determines the fair value of investments in good faith, based on the input of management, the audit committee and independent valuation firms that have been engaged at the direction of our Board to assist in the valuation of each portfolio investment without a readily available market quotation at least once during a trailing 12-month period under our valuation policy and a consistently applied valuation process.
Income Recognition.
Interest on loan investments is accrued and included in income based on contractual rates applied to principal amounts outstanding. Interest income is determined using a method that results in a level rate of return on principal amounts outstanding. When a loan becomes 90 days or more past due, or if we otherwise do not expect to receive interest and principal repayments, the loan is placed on non-accrual status and the recognition of interest income is discontinued. Interest payments received on loans that are on non-accrual status are treated as reductions of principal until the principal is repaid.
We receive a variety of fees from borrowers in the ordinary course of conducting our business, including packaging and prepayment fees. All other income is recorded into income when earned.
84
New Accounting Standards
In January 2014, the FASB issued ASU 2014-04, “Receivables—Troubled Debt Restructurings by Creditors: Reclassification of Residential Real Estate Collateralized Consumer Mortgage Loans upon Foreclosure (a consensus of the FASB Emerging Issues Task Force).” The update clarifies that an in substance repossession or foreclosure occurs, and a creditor is considered to have received physical possession of residential real estate property collateralizing a consumer mortgage loan, upon either (1) the creditor obtaining legal title to the residential real estate property upon completion of a foreclosure or (2) the borrower conveying all interest in the residential real estate property to the creditor to satisfy that loan through completion of a deed in lieu of foreclosure or through a similar legal agreement. The ASU is effective for fiscal years and interim periods beginning after December 15, 2014. The adoption of this ASU is not expected to have a significant impact on the Company’s Consolidated Financial Statements or disclosures.
In May 2014, the FASB issued ASU No. 2014-09, “Revenue from Contracts with Customers.” ASU 2014-09 supersedes the revenue recognition requirements in “Accounting Standard Codification 605 – Revenue Recognition” and most industry-specific guidance. The standard requires that entities recognize revenue to depict the transfer of promised goods or services to customers in an amount that reflects the consideration to which a company expects to be entitled in exchange for those goods or services. This ASU is effective for fiscal years beginning after December 15, 2016. ASU 2014-09 permits the use of either the retrospective or cumulative effect transition method. The adoption of this ASU is not expected to have a material impact on the Company’s Consolidated Financial Statements or disclosures.
In June 2014, the FASB issued ASU 2014-11 “Repurchase-to-Maturity Transactions, Repurchase Financings, and Disclosures” which changes the accounting for repurchase-to-maturity transactions and linked repurchase financings to secured borrowing accounting, which is consistent with the accounting for other repurchase agreements. In addition, ASU 2014-11 requires disclosures about transfers accounted for as sales in transactions that are economically similar to repurchase agreements and about the types of collateral pledged in repurchase agreements and similar transactions accounted for as secured borrowings. The accounting changes in ASU 2014-11 and the disclosure for certain transactions accounted for as a sale are effective for public companies for the first interim or annual period beginning after December 15, 2014. For public companies, the disclosure for transactions accounted for as secured borrowings is required to be presented for annual periods beginning after December 15, 2014, and interim periods beginning after March 15, 2015. The adoption of this ASU is not expected to have a material impact on the Company’s Consolidated Financial Statements or disclosures.
In June 2014, the FASB issued ASU 2014-12 “Compensation – Stock Compensation (Topic 718): Accounting for Share-Based Payments When the Terms of an Award Provide That a Performance Target Could Be Achieved after the Requisite Service Period,” which requires that a performance target that affects vesting and that could be achieved after the requisite service period is treated as a performance condition and, as a result, should not be included in the estimation of the grant-date fair value of the award. ASU 2014-12 will be effective for annual periods beginning after December 15, 2015 and may be applied either prospectively to all awards granted or modified after the effective date or retrospectively, to all periods presented. The adoption of this ASU is not expected to have a material impact on the Company’s Consolidated Financial Statements or disclosures.
In June 2013, the FASB issued ASU 2013-08, "Financial Services — Investment Companies (Topic 946): Amendments to the Scope, Measurement and Disclosure Requirements, containing new guidance on assessing whether an entity is an investment company, requiring non-controlling ownership interests in investment companies to be measured at fair value and requiring certain additional disclosures. This guidance is effective for annual and interim periods beginning on or after December 15, 2013. This ASU did not have a material impact on the Company's Consolidated Financial Statements or disclosures.
Subsequent Events
The Company has evaluated subsequent events through the time of filing these consolidated financial statements with the SEC.
Off Balance Sheet Arrangements
None.
Impact of Inflation
The impact of inflation and changing prices on our results of operations is not material.
85
We consider the principal types of risk in our investing activities to be fluctuations in interest rates and loan portfolio valuations and the availability of the secondary market for our SBA loans held for sale. Risk management systems and procedures are designed to identify and analyze our risks, to set appropriate policies and limits and to continually monitor these risks and limits by means of reliable administrative and information systems and other policies and programs.
Our SBA lender primarily lends at an interest rate of prime, which resets on a quarterly basis, plus a fixed margin. The Capital One term loan and revolver lines as well as the securitization notes are on a prime plus a fixed factor basis. As a result the Company believes it has matched its cost of funds to its interest income in its financing activities. However, because of the differential between the amount lent and the smaller amount financed a significant change in market interest rates will have a material effect on our income. In periods of sharply rising interest rates, our cost of funds will increase at a slower rate than the interest income earned on the loans we have made; this should improve our net investment income, holding all other factors constant. However, a reduction in interest rates, as has occurred since 2008, has and will result in the Company experiencing a reduction in investment income; that is interest income will decline more quickly than interest expense resulting in a net reduction of benefit to investment income.
Our lender depends on the availability of secondary market purchasers for the guaranteed portions of SBA loans and the premium received on such sales to support its lending operations. At this time the secondary market for the guaranteed portions of SBA loans is robust but during the 2008 and 2009 financial crisis the Company had difficulty selling it loans for a premium; although not expected at this time, if such conditions did recur our SBA lender would most likely cease making new loans and could experience a substantial reduction in profitability.
We do not have significant exposure to changing interest rates on invested cash which was approximately $34,200,000 at December 31, 2014. We do not purchase or hold derivative financial instruments for trading purposes. All of our transactions are conducted in U.S. dollars and we do not have any foreign currency or foreign exchange risk. We do not trade commodities or have any commodity price risk.
We believe that we have placed our demand deposits, cash investments and their equivalents with high credit-quality financial institutions. Invested cash is held almost exclusively at financial institutions with ratings from S&P of A- or better. The Company invests cash not held in interest free checking accounts or bank money market accounts mainly in U.S. Treasury only money market instruments or funds and other investment-grade securities. As of December 31, 2014, cash deposits in excess of FDIC and SIPC insurance totaled approximately $23,228,000.
Our consolidated financial statements and related notes begin on Page F-1, which are included in this Annual Report on Form 10-K.
None.
a) Evaluation of Disclosure Controls and Procedures
.
Our management, with the participation of our Chief Executive Officer (Principal Executive Officer) and Chief Accounting Officer (Principal Financial Officer), evaluated the effectiveness of our disclosure controls and procedures as of the end of the period covered by this report. Based on that evaluation, the Chief Executive Officer (Principal Executive Officer) and Chief Accounting Officer (Principal Financial Officer) concluded that our disclosure controls and procedures were effective as of the end of the period covered by this report and provide reasonable assurance that the information required to be disclosed by us in reports filed under the Exchange Act is recorded, processed, summarized and reported within the time periods specified in the SEC’s rules and forms. Disclosure controls and procedures include, without limitation, controls and procedures designed to ensure that information required to be disclosed by an issuer in the reports that it files or submits under the Exchange Act is accumulated and communicated to the issuer’s management including its principal executive and principal financial officers, or persons performing similar functions, as appropriate to allow timely decisions regarding required disclosure.
(b) Change in Internal Control over Financial Reporting.
No change in our internal control over financial reporting occurred during the quarter ended December 31, 2014 that has materially affected, or is reasonably likely to materially affect, our internal control over financial reporting.
(c) Limitations.
A control system, no matter how well designed and operated, can provide only reasonable, not absolute, assurances that the control system’s objectives will be met. Furthermore, the design of a control system must reflect the fact that there are resource constraints, and the benefits of controls must be considered relative to their costs. Because of the inherent limitations in all control systems, no evaluation of controls can provide absolute assurance that all control issues and instances of fraud, if any, within the Company have been detected. These inherent limitations include the realities that judgments in decision-making can be faulty, and that breakdowns can occur because of simple errors or mistakes. Controls can also be circumvented by the individual acts of some persons, by collusion of two or more people, or by management override of the controls. The design of any system of controls is based in part upon certain assumptions about the likelihood of future events, and there can be no assurance that any design will succeed in achieving its stated goals under all potential future conditions. Over time, controls may become inadequate because of changes in conditions or deterioration in the degree of compliance with its policies or procedures. Because of the inherent limitations in a cost-effective control system, misstatements due to error or fraud may occur and not be detected. We periodically evaluate our internal controls and make changes to improve them.
MANAGEMENT’S REPORT TO THE STOCKHOLDERS OF NEWTEK BUSINESS SERVICES CORP. AND SUBSIDIARIES
Management’s Report on Internal Control Over Financial Reporting
As management, we are responsible for establishing and maintaining adequate internal control over financial reporting for Newtek Business Services Corp. and its subsidiaries. In order to evaluate the effectiveness of internal control over financial reporting, as required by Section 404 of the Sarbanes-Oxley Act of 2002, we have conducted an assessment, including testing, using the criteria in
Internal Control-Integral Framework
issued by the Committee of Sponsoring Organization of the Treadway Commission (COSO) in 2013. Newtek Business Services Corp's system of internal control over financial reporting is designed to provide reasonable assurance regarding the reliability of financial reporting and the preparation of financial statements for external purposes in accordance with accounting principles generally accepted in the United States of America. Because of its inherent limitation, internal control over financial reporting may not prevent or detect misstatements.
Based on our assessment, we have concluded that Newtek Business Services Corp. maintained effective internal control over financial reporting as of December 31, 2014, based on criteria in
Internal Control-Integrated Framework
issued by the COSO. As a non-accelerated filer, the effectiveness of Newtek Business Services Corp’s internal control over financial reporting is not required to be audited by our independent registered public accounting firm.
This Annual Report does not include an attestation report of the Company’s independent registered public accounting firm regarding internal control over financial reporting. Management’s report was not subject to attestation by the Company’s independent registered public accounting firm pursuant to rules of the Securities and Exchange Commission that permit the Company to provide only management’s report in this Annual Report.
None
The information required by Item 10 is hereby incorporated by reference from our definitive Proxy Statement relating to our 2015 Annual Meeting of Shareholders, to be filed with the Securities and Exchange Commission not later than 120 days following the end of our fiscal year.
The information required by Item 11 is hereby incorporated by reference from our definitive Proxy Statement relating to our 2015 Annual Meeting of Shareholders, to be filed with the Securities and Exchange Commission not later than 120 days following the end of our fiscal year.
The information required by Item 12 is hereby incorporated by reference from our definitive Proxy Statement relating to our 2015 Annual Meeting of Shareholders, to be filed with the Securities and Exchange Commission not later than 120 days following the end of our fiscal year.
The information required by Item 13 is hereby incorporated by reference from our definitive proxy Statement relating to our 2015 Annual Meeting of Shareholders, to be filed with the Securities and Exchange Commission not later than 120 days following the end of our fiscal year.
The information required by Item 14 is hereby incorporated by reference from our definitive proxy Statement relating to our 2015 Annual Meeting of Shareholders, to be filed with the Securities and Exchange Commission not later than 120 days following the end of our fiscal year.
86
(a)(1) Financial Statements.
(a)(2) Exhibits.
The following exhibits are filed herewith or are incorporated by reference to exhibits previously filed with the Securities and Exchange Commission.
|
Number
|
Description
|
|
|
1.1
|
Form of Underwriting Agreement (Previously filed in connection with Pre-Effective Amendment No. 3 to the Registrant’s Registration Statement on Form N-2 (File No. 333-191499) filed on November 3, 2014, and incorporated by reference herein).
|
|
|
3.1
|
Amended and Restated Articles of Incorporation of Newtek Business Services Corp. (Previously filed in connection with Pre-Effective Amendment No. 3 to the Registrant’s Registration Statement on Form N-2 (File No. 333-191499) filed on November 3, 2014, and incorporated by reference herein).
|
|
|
3.2
|
Bylaws of Newtek Business Services Corp. (Incorporated by reference to Exhibit 99.2 to Registrant’s Registration Statement on Form N-14 (File No. 333-195998), filed September 24, 2014).
|
|
|
4.1
|
Form of Common Stock Certificate (Incorporated by reference to Exhibit 99.5 to Registrant’s Registration Statement on Form N-14 (File No. 333-195998), filed September 24, 2014).
|
|
|
10.1
|
Form of Dividend Reinvestment Plan (Previously filed in connection with Pre-Effective Amendment No. 3 to the Registrant’s Registration Statement on Form N-2 (File No. 333-191499) filed on November 3, 2014, and incorporated by reference herein).
|
|
|
10.2
|
Employment Agreement with Barry Sloane, dated March 31, 2014 (Incorporated by reference to Exhibit 10.1 to Newtek Business Services, Inc.’s Annual Report on Form 10-K for the period ended December 31, 2013 (File No. 001-16123), filed March 31, 2014).
|
|
|
10.3
|
Employment Agreement with Craig J. Brunet, dated March 18, 2014 (Incorporated by reference to Exhibit 10.2 to Newtek Business Services, Inc.’s Annual Report on Form 10-K for the period ended December 31, 2013 (File No. 001-16123), filed March 31, 2014).
|
|
|
10.4
|
Employment Agreement with Jennifer C. Eddelson, dated March 17, 2014 (Incorporated by reference to Exhibit 10.3 to Newtek Business Services, Inc.’s Annual Report on Form 10-K for the period ended December 31, 2013 (File No. 001-16123), filed March 31, 2014).
|
|
|
10.5
|
Lease and Master Services Agreement dated March 15, 2007 between CrystalTech Web Hosting, Inc. and i/o Data Centers (Incorporated herein by reference to Exhibit 10.4 to Newtek Business Services, Inc.’s Quarterly Report on Form 10-Q for the quarter ended March 31, 2007 (File No. 001-16123), filed May 15, 2007).
|
|
|
10.6.1
|
Loan and Security Agreement, dated as of April 30, 2010, between CrystalTech Web Hosting, Inc., Newtek Small Business Finance, Inc. and Capital One, N.A. (Incorporated herein by reference to Exhibit 10.16.1 to Newtek Business Services, Inc.’s Current Report on Form 8-K (File No. 001-16123), filed May 5, 2010).
|
|
|
10.6.2
|
Guaranty of Payment and Performance, dated as of April 30, 2010, between Newtek Business Services, Inc. and Capital One Bank, N.A. (Incorporated herein by reference to Exhibit 10.16.2 to Newtek Business Services, Inc.’s Current Report on Form 8-K (File No. 001-16123), filed May 5, 2010).
|
|
|
10.7
|
Newtek Business Services Corp. 2014 Stock Incentive Plan (Incorporated herein by reference to Exhibit 8.6 to Registrant’s Registration Statement on Form N-14 (File No. 333-195998), filed September 24, 2014).
|
|
|
10.8.1
|
Loan and Security Agreement, dated as of December 15, 2010, between Newtek Small Business Finance, Inc. and Capital One Bank, N.A. (Incorporated herein by reference to Exhibit 10.18.1 to Newtek Business Services, Inc.’s Current Report on Form 8-K (File No. 001-16123), filed December 20, 2010, as amended on March 2, 2011).
|
|
|
10.8.2
|
Guaranty Agreement, dated as of December 15, 2010, between Newtek Business Services, Inc. and Capital One Bank, N.A. (Incorporated herein by reference to Exhibit 10.18.2 to Newtek Business Services, Inc.’s Current Report on Form 8-K (File No. 001-16123), filed December 20, 2010, as amended on March 2, 2011).
|
|
87
|
10.8.3
|
Amended and Restated Loan and Security Agreement, dated as of June 16, 2011, by and between Newtek Small Business Finance, Inc. and Capital One, N.A. (Incorporated herein by reference to Exhibit 10.8.3 to Newtek Business Services, Inc.’s Current Report on Form 8-K (File No. 001-16123), filed June 21, 2011).
|
|
|
10.8.4
|
Amended and Restated Guaranty of Payment and Performance, dated as of June 16, 2011, by and between Newtek Business Services, Inc., and Capital One, N.A. (Incorporated herein by reference to Exhibit 10.8.4 to Newtek Business Services, Inc.’s Current Report on Form 8-K (File No. 001-16123), filed June 21, 2011).
|
|
|
10.8.5
|
Amendment to Loan Documents, dated October 6, 2011, by and among Newtek Small Business Finance, Inc., Capital One Bank, N.A. and each of the guarantors listed on the signature pages thereto (Incorporated herein by reference to Exhibit 10.8.5 to Newtek Business Services, Inc.’s Current Report on Form 8-K (File No. 001-16123), filed October 11, 2011).
|
|
|
10.8.6
|
Amended and Restated Loan and Security Agreement, dated as of July 16, 2013, by and between Newtek Small Business Finance, Inc. and Capital One, National Association (Incorporated herein by reference to Exhibit 10.1 to Newtek Business Services, Inc.’s Current Report on Form 8-K (File No. 001-16123), filed July 19, 2013).
|
|
|
10.8.7
|
Guaranty and Security Agreement Letter Amendment, dated as of July 16, 2013, by and between Capital One, National Association and Newtek Business Services, Inc. (Incorporated herein by reference to Exhibit 10.2 to Newtek Business Services, Inc.’s Current Report on Form 8-K (File No. 001-16123), filed July 19, 2013).
|
|
|
10.8.8
|
Amended and Restated Loan and Security Agreement, dated as of October 29, 2014, by and between Newtek Small Business Finance, Inc. and Capital One, National Association (Incorporated herein by reference to Exhibit 10.1 to Newtek Business Services, Inc.’s Current Report on Form 8-K (File No. 001-16123), filed October 30, 2014).
|
|
|
10.8.9
|
Guaranty and Security Agreement Letter Agreement, dated as of October 29, 2014, by and between Capital One, National Association and Newtek Business Services, Inc. (Incorporated herein by reference to Exhibit 10.2 to Newtek Business Services, Inc.’s Current Report on Form 8-K (File No. 001-16123), filed October 30, 2014).
|
|
|
10.9.1
|
Newtek Small Business Loan Trust Class A Notes, dated December 22, 2010 (Incorporated herein by reference to Exhibit 10.19.1 to Newtek Business Services, Inc.’s Current Report on Form 8-K (File No. 001-16123), filed December 23, 2010).
|
|
|
10.9.2
|
Amended Newtek Small Business Loan Trust Class A Notes, dated December 29, 2011 (Incorporated herein by reference to Exhibit 10.19.2 to Newtek Business Services, Inc.’s Current Report on Form 8-K (File No. 001-16123), filed January 5, 2012).
|
|
|
10.9.3
|
Additional Newtek Small Business Loan Trust Class A Notes, dated December 29, 2011 (Incorporated herein by reference to Exhibit 10.19.3 to Newtek Business Services, Inc.’s Current Report on Form 8-K (File No. 001-16123), filed January 5, 2012).
|
|
|
10.10.1
|
Loan and Security Agreement, dated as of February 28, 2011, by and between CDS Business Services, Inc. and Sterling National Bank (Incorporated herein by reference to Exhibit 10.10.1 to Newtek Business Services, Inc.’s Current Report on Form 8-K (File No. 001-16123), filed March 3, 2011).
|
|
|
10.10.2
|
Guaranty, dated as of February 28, 2011, by and between Newtek Business Services, Inc. and Sterling National Bank (Incorporated herein by reference to Exhibit 10.10.2 to Newtek Business Services, Inc.’s Current Report on Form 8-K (File No. 001-16123), filed March 3, 2011).
|
|
|
10.10.3
|
Amendment No. 1, dated December 5, 2012, to Loan and Security Agreement, dated as of February 28, 2011, by and between CDS Business Services, Inc. and Sterling National Bank (Incorporated herein by reference to Exhibit 10.9.3 to Newtek Business Services, Inc.’s Current Report on Form 8-K (File No. 001-16123), filed December 11, 2012).
|
|
|
10.11
|
Credit Agreement by and between Newtek Business Services, Inc. and Capital One, National Association, dated as of June 26, 2014 (Incorporated herein by reference to Exhibit 10.1 to Newtek Business Services, Inc.’s Current Report on Form 8-K (File No. 001-16123), filed July 1, 2014).
|
|
|
10.12
|
Form of Custodian Agreement (Previously filed in connection with Pre-Effective Amendment No. 3 to the Registrant’s Registration Statement on Form N-2 (File No. 333-191499), filed on November 3, 2014, and incorporated by reference herein).
|
|
|
10.13
|
Newtek Small Business Loan Trust 2014-1 Class A Notes, dated December 3, 2014 (Incorporated herein by reference to Exhibit 10.1 to Registrant’s Current Report on Form 8-K (File No. 814-01035), filed on December 5, 2014).
|
|
|
14.1
|
Code of Ethics (Previously filed in connection with Pre-Effective Amendment No. 3 to the Registrant’s Registration Statement on Form N-2 (File No. 333-191499) filed on November 3, 2014, and incorporated by reference herein).
|
|
88
|
21.1
|
Subsidiaries of the Registrant filed herewith.
|
|
|
31.1
|
Certification by Principal Executive Officer required by Rule 13a-14 under the Securities Exchange Act of 1934, as amended, filed herewith.
|
|
|
31.2
|
Certification by Principal Financial Officer required by Rule 13a-14 under the Securities Exchange Act of 1934, as amended, filed herewith.
|
|
|
32.1
|
Certification by Principal Executive Officer pursuant to 18 U.S.C. Section 1350, as adopted pursuant to Section 906 of the Sarbanes-Oxley Act of 2002 filed herewith.
|
|
|
32.2
|
Certification by Principal Financial Officer pursuant to 18 U.S.C. Section 1350, as adopted pursuant to Section 906 of the Sarbanes-Oxley Act of 2002 filed herewith.
|
|
89
SIGNATURES
Pursuant to the requirements of Section 13 or 15(d) of the Securities Exchange Act of 1934, the registrant has duly caused this report to be signed on its behalf by the undersigned, thereunto duly authorized.
|
NEWTEK BUSINESS SERVICES CORP.
|
||
|
Date: March 31, 2015
|
By:
|
/
S
/ B
ARRY
S
LOANE
|
|
Barry Sloane
|
||
|
Chairman and Chief Executive Officer
(Principal Executive Officer)
|
||
|
Date: March 31, 2015
|
By:
|
/
S
/ J
ENNIFER
E
DDELSON
|
|
Jennifer Eddelson
|
||
|
Chief Accounting Officer
(Principal Financial Officer and Principal Accounting Officer)
|
||
In accordance with the Exchange Act, this report has been signed below by the following persons on behalf of the registrant and in the capacities and on the dates indicated.
|
Signature
|
Title
|
Date
|
|
/
S
/ B
ARRY
S
LOANE
|
Chairman of the Board, President and Chief Executive Officer (Principal Executive Officer)
|
March 31, 2015
|
|
Barry Sloane
|
||
|
/
S
/ J
ENNIFER
E
DDELSON
|
Chief Accounting Officer (Principal Financial Officer and Principal Accounting Officer)
|
March 31, 2015
|
|
Jennifer Eddelson
|
||
|
/
S
/ D
AVID
C. B
ECK
|
Director
|
March 31, 2015
|
|
David C. Beck
|
||
|
/
S
/ S
ALVATORE
M
ULIA
|
Director
|
March 31, 2015
|
|
Salvatore Mulia
|
||
|
/
S
/ S
AMUEL
K
IRSCHNER
|
Director
|
March 31, 2015
|
|
Samuel Kirschner
|
||
|
/S/ PETER DOWNS
|
Director
|
March 31, 2015
|
|
Peter Downs
|
||
90
NEWTEK BUSINESS SERVICES CORP AND SUBSIDIARIES
INDEX TO FINANCIAL STATEMENTS
Table of Contents
|
|
PAGE NO.
|
|
Consolidated Balance Sheets as of December 31, 2014 and 2013
|
|
|
Consolidated Statements of Income for the
period from November 12, 2014 to December 31, 2014, the period from January 1, 2014 to November 11, 2014, and the years ended December 31, 2013 and 2012
|
|
|
Consolidated Statements of Changes in
Net Assets for the period from November 12, 2014 to December 31, 2014 and Consolidated Statements of Changes in Stockholders' Equity for the period from January 1, 2014 to November 11, 2014 and the years ended December 31, 2013 and 2012
|
|
|
Consolidated Statements of Cash Flows for the
period from November 12, 2014 to December 31, 2014 and the period January 1, 2014 to November 11, 2014 and the years ended December 31, 2013 and 2012
|
|
|
Consolidated Schedule of Investments as of December 31, 2014
|
|
91
REPORT OF INDEPENDENT REGISTERED PUBLIC ACCOUNTING FIRM
To the Board of Directors and Stockholders
Newtek Business Services Corp. and Subsidiaries
We have audited the accompanying consolidated balance sheets of Newtek Business Services Corp. and Subsidiaries (the “Company”) (prior to November 12, 2014 Newtek Business Services, Inc.) as of December 31, 2014 and 2013, and the related consolidated statements of income, changes in net assets/stockholders’ equity and cash flows for the period from November 12, 2014 to December 31, 2014, the period from January 1, 2014 to November 11, 2014 and the year ended December 31, 2013. We have also audited the consolidated schedule of investments as of December 31, 2014. These consolidated financial statements are the responsibility of the Company's management. Our responsibility is to express an opinion on these financial statements based on our audits.
We conducted our audits in accordance with the standards of the Public Company Accounting Oversight Board (United States). Those standards require that we plan and perform the audit to obtain reasonable assurance about whether the financial statements are free of material misstatement. The Company is not required to have, nor were we engaged to perform an audit of its internal control over financial reporting. Our audit included consideration of internal control over financial reporting as a basis for designing audit procedures that are appropriate in the circumstances, but not for the purpose of expressing an opinion on the effectiveness of the Company’s internal control over financial reporting. Accordingly, we express no such opinion. An audit also includes examining, on a test basis, evidence supporting the amounts and disclosures in the financial statements, assessing the accounting principles used and significant estimates made by management, as well as evaluating the overall financial statement presentation. Our procedures included confirmation of investments owned by correspondence with the borrower or by other appropriate auditing procedures, where replies from the borrower were not received and by other appropriate auditing procedures with respect to affiliated investments. We believe that our audits provide a reasonable basis for our opinion.
In our opinion, the consolidated financial statements referred to above present fairly, in all material respects, the financial position of Newtek Business Services Corp. and Subsidiaries as of December 31, 2014 and 2013, and the results of their operations and their cash flows for the period from November 12, 2014 to December 31, 2014, the period from January 1, 2014 to November 11, 2014 and the year ended December 31, 2013, in conformity with U.S. generally accepted accounting principles.
McGladrey LLP
New York, NY
March 31, 2015
F-1
REPORT OF INDEPENDENT REGISTERED PUBLIC ACCOUNTING FIRM
To the Board of Directors and Stockholders of
Newtek Business Services, Inc.
We have audited the accompanying consolidated statements of income, changes in equity and cash flows for the year ended December 31, 2012 of Newtek Business Services, Inc. and Subsidiaries. Newtek Business Services, Inc. and Subsidiaries’ management is responsible for these financial statements. Our responsibility is to express an opinion on these consolidated financial statements based on our audit.
We conducted our audit in accordance with the standards of the Public Company Accounting Oversight Board (United States). Those standards require that we plan and perform the audit to obtain reasonable assurance about whether the consolidated financial statements are free of material misstatement. The Company is not required to have, nor were we engaged to perform, an audit of its internal control over financial reporting. Our audit included consideration of internal control over financial reporting as a basis for designing audit procedures that are appropriate in the circumstances, but not for the purpose of expressing an opinion on the effectiveness of the Company’s internal control over financial reporting. Accordingly, we express no such opinion. An audit also includes examining, on a test basis, evidence supporting the amounts and disclosures in the consolidated financial statements, assessing the accounting principles used and significant estimates made by management, as well as evaluating the overall consolidated financial statement presentation. We believe that our audit provides a reasonable basis for our opinion.
In our opinion, the consolidated financial statements referred to above present fairly, in all material respects, the results of operations and cash flows of Newtek Business Services, Inc. and Subsidiaries for the year ended December 31, 2012, in conformity with accounting principles generally accepted in the United States of America.
/s/ CohnReznick LLP
Jericho, New York
April 1, 2013, except for the retrospective adjustment discussed in
F-2
NEWTEK BUSINESS SERVICES CORP. AND SUBSIDIARIES (FORMERLY NEWTEK BUSINESS SERVICES, INC. AND SUBSIDIARIES)
(In Thousands, except for Per Share Data)
|
2014
|
2013
|
||||||
|
ASSETS
|
|||||||
|
Investments, at fair value
|
|||||||
|
SBA unguaranteed non-affiliate investments (cost of $131,093 at December 31, 2014; includes $120,990 and $74,387, respectively, related to securitization trust VIE)
|
$
|
121,477
|
|
$
|
78,951
|
|
|
|
Affiliate investments (cost of $12,521 at December 31, 2014)
|
77,499
|
|
—
|
|
|||
|
SBA guaranteed non-affiliate investments (cost of $28,057 at December 31, 2014)
|
31,486
|
|
4,734
|
|
|||
|
Investments in money market funds
|
3,000
|
|
—
|
|
|||
|
Total investments at fair value
|
233,462
|
|
83,685
|
|
|||
|
Cash and cash equivalents
|
17,813
|
|
12,508
|
|
|||
|
Restricted cash
|
15,389
|
|
16,877
|
|
|||
|
Broker receivable
|
—
|
|
13,606
|
|
|||
|
SBA loans held for investment, net (includes $10,894 related to securitization trust VIE; net of reserve for loan losses of $1,811 at December 31, 2013)
|
—
|
|
10,689
|
|
|||
|
Accounts receivable (net of allowance of $171 and $871, respectively)
|
147
|
|
11,602
|
|
|||
|
Prepaid expenses and other assets, net (includes $2,550 and $2,187, respectively, related to securitization trust VIE)
|
16,473
|
|
18,549
|
|
|||
|
Due from related parties
|
3,190
|
|
—
|
|
|||
|
Servicing assets (at fair value at December 31, 2014, net of accumulated amortization and allowances of $7,909 at December 31, 2013
|
9,483
|
|
6,776
|
|
|||
|
Fixed assets (net of accumulated depreciation and amortization of $3,798 and $10,547, respectively)
|
329
|
|
3,741
|
|
|||
|
Intangible assets (net of accumulated amortization of $296 and $2,243, respectively)
|
444
|
|
1,240
|
|
|||
|
Credits in lieu of cash, at fair value
|
2,229
|
|
3,641
|
|
|||
|
Goodwill
|
—
|
|
12,092
|
|
|||
|
Deferred tax asset, net
|
2,873
|
|
3,606
|
|
|||
|
Total assets
|
$
|
301,832
|
|
$
|
198,612
|
|
|
|
LIABILITIES AND NET ASSETS/EQUITY
|
|||||||
|
Liabilities:
|
|||||||
|
Accounts payable, accrued expenses and other liabilities
|
$
|
7,683
|
|
$
|
14,688
|
|
|
|
Notes payable
|
43,023
|
|
41,218
|
|
|||
|
Note payable – Securitization trust VIE
|
79,520
|
|
60,140
|
|
|||
|
Due to related parties
|
2,867
|
|
—
|
|
|||
|
Capital lease obligation
|
33
|
|
642
|
|
|||
|
Deferred revenue
|
59
|
|
1,274
|
|
|||
|
Notes payable in credits in lieu of cash, at fair value
|
2,229
|
|
3,641
|
|
|||
|
Total liabilities
|
135,414
|
|
121,603
|
|
|||
|
Commitments and contingencies
|
|||||||
|
Net Assets/Equity:
|
|||||||
|
Newtek Business Services Corp. net assets/stockholders’ equity:
|
|||||||
|
Preferred stock (par value $0.02 per share; authorized 1,000 shares, no shares issued and outstanding)
|
—
|
|
—
|
|
|||
F-3
|
Common stock (par value $0.02 per share; authorized 54,000 shares, 10,206 and 7,383 issued, respectively; 10,206 and 7,077 outstanding, respectively, not including 17 shares held in escrow)
|
205
|
|
148
|
|
|||
|
Additional paid-in capital
|
165,532
|
|
61,939
|
|
|||
|
Retained earnings
|
—
|
|
14,536
|
|
|||
|
Treasury stock, at cost (0 and 306 shares, respectively)
|
—
|
|
(1,279
|
)
|
|||
|
Accumulated net investment losses
|
(2,523
|
)
|
—
|
|
|||
|
Net unrealized appreciation
|
2,609
|
|
—
|
|
|||
|
Net realized gains
|
595
|
|
—
|
|
|||
|
Total Newtek Business Services Corp. net assets/stockholders’ equity
|
166,418
|
|
75,344
|
|
|||
|
Non-controlling interests
|
—
|
|
1,665
|
|
|||
|
Total net assets/equity
|
166,418
|
|
77,009
|
|
|||
|
Total liabilities and net assets/equity
|
$
|
301,832
|
|
$
|
198,612
|
|
|
|
Net asset value per common share
|
$
|
16.31
|
|
N/A
|
|
||
F-4
NEWTEK BUSINESS SERVICES CORP. AND SUBSIDIARIES (FORMERLY NEWTEK BUSINESS SERVICES, INC. AND SUBSIDIARIES)
(In Thousands, except for Per Share Data)
|
As a Business Development Company
|
Prior to becoming a Business Development Company
|
||||||||||||||
|
November 12, 2014 to December 31, 2014
|
January 1, 2014 to November 11, 2014
|
2013
|
2012
|
||||||||||||
|
Investment income:
|
|||||||||||||||
|
From non-controlled/non-affiliate investments
|
|||||||||||||||
|
Interest income
|
$
|
1,076
|
|
$
|
—
|
|
$
|
—
|
|
$
|
—
|
|
|||
|
Servicing income
|
562
|
|
—
|
|
—
|
|
—
|
|
|||||||
|
Other income
|
270
|
|
—
|
|
—
|
|
—
|
|
|||||||
|
Total investment income from non-controlled/non-affiliate investments
|
1,908
|
|
—
|
|
—
|
|
—
|
|
|||||||
|
From controlled/affiliate investments
|
|||||||||||||||
|
Interest income
|
27
|
|
—
|
|
—
|
|
—
|
|
|||||||
|
Dividend income
|
37
|
|
—
|
|
—
|
|
—
|
|
|||||||
|
Other income
|
4
|
|
—
|
|
—
|
|
—
|
|
|||||||
|
Total investment income from controlled/affiliate investments
|
68
|
|
—
|
|
—
|
|
—
|
|
|||||||
|
Total investment income
|
1,976
|
|
—
|
|
—
|
|
—
|
|
|||||||
|
Operating revenues:
|
|||||||||||||||
|
Electronic payment processing
|
—
|
|
$
|
79,527
|
|
$
|
89,651
|
|
$
|
85,483
|
|
||||
|
Web hosting and design
|
—
|
|
13,730
|
|
17,375
|
|
18,208
|
|
|||||||
|
Premium income
|
—
|
|
18,623
|
|
19,456
|
|
12,367
|
|
|||||||
|
Interest income
|
—
|
|
5,663
|
|
4,838
|
|
3,422
|
|
|||||||
|
Servicing fee income – NSBF portfolio
|
—
|
|
3,111
|
|
2,769
|
|
2,298
|
|
|||||||
|
Servicing fee income – external portfolios
|
—
|
|
6,142
|
|
3,796
|
|
4,564
|
|
|||||||
|
Income from tax credits
|
—
|
|
48
|
|
113
|
|
522
|
|
|||||||
|
Insurance commissions
|
—
|
|
1,480
|
|
1,737
|
|
1,205
|
|
|||||||
|
Other income
|
—
|
|
3,523
|
|
3,858
|
|
3,061
|
|
|||||||
|
Total operating revenues
|
—
|
|
131,847
|
|
143,593
|
|
131,130
|
|
|||||||
|
Net change in fair value of:
|
|||||||||||||||
|
SBA loans
|
—
|
|
(3,663
|
)
|
(1,226
|
)
|
(1,013
|
)
|
|||||||
|
Warrants
|
—
|
|
—
|
|
—
|
|
(111
|
)
|
|||||||
|
Credits in lieu of cash and notes payable in credits in lieu of cash
|
—
|
|
(5
|
)
|
21
|
|
3
|
|
|||||||
|
Total net change in fair value
|
—
|
|
(3,668
|
)
|
(1,205
|
)
|
(1,121
|
)
|
|||||||
|
Expenses:
|
|||||||||||||||
|
Electronic payment processing costs
|
—
|
|
67,011
|
|
75,761
|
|
72,183
|
|
|||||||
|
Salaries and benefits
|
1,458
|
|
23,373
|
|
24,360
|
|
22,314
|
|
|||||||
|
Interest
|
568
|
|
7,323
|
|
5,863
|
|
4,495
|
|
|||||||
|
Depreciation and amortization
|
43
|
|
3,140
|
|
3,284
|
|
3,036
|
|
|||||||
|
Goodwill impairment
|
—
|
|
1,706
|
|
—
|
|
—
|
|
|||||||
|
Provision for loan losses
|
—
|
|
(53
|
)
|
1,322
|
|
810
|
|
|||||||
|
Other general and administrative costs
|
2,236
|
|
18,536
|
|
20,729
|
|
17,732
|
|
|||||||
|
Total expenses
|
4,305
|
|
121,036
|
|
131,319
|
|
120,570
|
|
|||||||
|
Net investment loss before income tax
|
(2,329
|
)
|
—
|
|
—
|
|
—
|
|
|||||||
F-5
|
As a Business Development Company
|
Prior to becoming a Business Development Company
|
||||||||||||||
|
November 12, 2014 to December 31, 2014
|
January 1, 2014 to November 11, 2014
|
2013
|
2012
|
||||||||||||
|
Provision for income tax - post BDC
|
194
|
|
—
|
|
—
|
|
—
|
|
|||||||
|
Net investment loss
|
(2,523
|
)
|
—
|
|
—
|
|
—
|
|
|||||||
|
Net realized and unrealized gain (loss):
|
|||||||||||||||
|
Net realized gain on non-affiliate investments
|
595
|
|
—
|
|
—
|
|
—
|
|
|||||||
|
Net unrealized appreciation on non-affiliate investments
|
2,733
|
|
—
|
|
—
|
|
—
|
|
|||||||
|
Net unrealized depreciation on servicing assets
|
(120
|
)
|
—
|
|
—
|
|
—
|
|
|||||||
|
Net unrealized depreciation on credits in lieu of cash and notes payable in credits in lieu of cash
|
(4
|
)
|
—
|
|
—
|
|
—
|
|
|||||||
|
Net realized and unrealized gains
|
3,204
|
|
—
|
|
—
|
|
—
|
|
|||||||
|
Income before income taxes
|
—
|
|
7,143
|
|
11,069
|
|
9,439
|
|
|||||||
|
Net increase in net assets resulting from operations
|
$
|
681
|
|
||||||||||||
|
Provision for income taxes
|
3,935
|
|
3,918
|
|
3,882
|
|
|||||||||
|
Net income
|
3,208
|
|
7,151
|
|
5,557
|
|
|||||||||
|
Net loss attributable to non-controlling interests
|
85
|
|
377
|
|
86
|
|
|||||||||
|
Net income attributable to Newtek Business Services Corp.
|
$
|
3,293
|
|
$
|
7,528
|
|
$
|
5,643
|
|
||||||
|
Weighted average common shares outstanding:
|
|||||||||||||||
|
Basic
|
7,315
|
|
7,059
|
|
7,105
|
|
|||||||||
|
Diluted
|
7,315
|
|
7,581
|
|
7,349
|
|
|||||||||
|
Basic income per share
|
$
|
0.45
|
|
$
|
1.07
|
|
$
|
0.79
|
|
||||||
|
Diluted income per share
|
$
|
0.45
|
|
$
|
0.99
|
|
$
|
0.77
|
|
||||||
|
Net increase in net assets per share
|
$
|
0.09
|
|
||||||||||||
|
Net investment loss per share
|
$
|
(0.33
|
)
|
||||||||||||
|
Weighted average shares outstanding
|
7,620
|
|
|||||||||||||
See accompanying notes to these consolidated financial statements.
F-6
NEWTEK BUSINESS SERVICES CORP. AND SUBSIDIARIES (FORMERLY NEWTEK BUSINESS SERVICES, INC. AND SUBSIDIARIES)
CONSOLIDATED STATEMENTS OF CHANGES IN NET ASSETS/STOCKHOLDERS’ EQUITY
(In Thousands)
|
Number of
Shares of Common Stock |
Common
Stock
|
Additional
Paid-in
Capital
|
Retained
Earnings
|
Number of Shares of Treasury Stock
|
Treasury
Stock
|
Non-
controlling
Interest
|
Accumulated Net Investment Loss
|
Net Unrealized Appreciation
|
Net Realized Gains
|
Total
|
||||||||||||||||||||||||||||||
|
Balance at December 31, 2011
|
7,340
|
|
147
|
|
58,547
|
|
(101
|
)
|
200
|
|
(620
|
)
|
1,180
|
|
—
|
|
—
|
|
—
|
|
59,153
|
|
||||||||||||||||||
|
Cumulative-effect adjustment, consolidation of Expo
|
—
|
|
—
|
|
—
|
|
1,466
|
|
—
|
|
—
|
|
2,290
|
|
—
|
|
—
|
|
—
|
|
3,756
|
|
||||||||||||||||||
|
Deconsolidation of non-controlling interest for Expo’s interest in subsidiary
|
—
|
|
—
|
|
(231
|
)
|
—
|
|
—
|
|
—
|
|
(768
|
)
|
—
|
|
—
|
|
—
|
|
(999
|
)
|
||||||||||||||||||
|
Expiration of subsidiary non-controlling interest warrants
|
—
|
|
—
|
|
337
|
|
—
|
|
—
|
|
—
|
|
(337
|
)
|
—
|
|
—
|
|
—
|
|
—
|
|
||||||||||||||||||
|
Exercise of options
|
42
|
|
1
|
|
3
|
|
—
|
|
—
|
|
—
|
|
—
|
|
—
|
|
—
|
|
—
|
|
4
|
|
||||||||||||||||||
|
Issuance of treasury shares
|
—
|
|
—
|
|
25
|
|
—
|
|
(13
|
)
|
79
|
|
—
|
|
—
|
|
—
|
|
—
|
|
104
|
|
||||||||||||||||||
|
Purchase of treasury shares
|
—
|
|
—
|
|
—
|
|
—
|
|
161
|
|
(967
|
)
|
—
|
|
—
|
|
—
|
|
(967
|
)
|
||||||||||||||||||||
|
Grant of restricted stock award
|
—
|
|
—
|
|
499
|
|
—
|
|
—
|
|
—
|
|
—
|
|
—
|
|
—
|
|
—
|
|
499
|
|
||||||||||||||||||
|
Issuance of warrant to Summit
|
—
|
|
—
|
|
2,070
|
|
—
|
|
—
|
|
—
|
|
—
|
|
—
|
|
—
|
|
—
|
|
2,070
|
|
||||||||||||||||||
|
Purchase of non-controlling interest
|
—
|
|
—
|
|
(51
|
)
|
—
|
|
—
|
|
—
|
|
(224
|
)
|
—
|
|
—
|
|
—
|
|
(275
|
)
|
||||||||||||||||||
|
Net income
|
—
|
|
—
|
|
—
|
|
5,643
|
|
—
|
|
—
|
|
(86
|
)
|
—
|
|
—
|
|
—
|
|
5,557
|
|
||||||||||||||||||
|
Balance at December 31, 2012
|
7,382
|
|
148
|
|
61,199
|
|
7,008
|
|
348
|
|
(1,508
|
)
|
2,055
|
|
—
|
|
—
|
|
—
|
|
68,902
|
|
||||||||||||||||||
|
Issuance of restricted stock
|
—
|
|
—
|
|
—
|
|
—
|
|
(3
|
)
|
—
|
|
—
|
|
—
|
|
—
|
|
—
|
|
—
|
|
||||||||||||||||||
|
Grant of restricted stock awards
|
—
|
|
—
|
|
800
|
|
—
|
|
—
|
|
—
|
|
—
|
|
—
|
|
—
|
|
—
|
|
800
|
|
||||||||||||||||||
|
Forfeitures of restricted stock
|
—
|
|
—
|
|
(8
|
)
|
—
|
|
—
|
|
—
|
|
—
|
|
—
|
|
—
|
|
—
|
|
(8
|
)
|
||||||||||||||||||
F-7
|
Number of
Shares of Common Stock |
Common
Stock
|
Additional
Paid-in
Capital
|
Retained
Earnings
|
Number of Shares of Treasury Stock
|
Treasury
Stock
|
Non-
controlling
Interest
|
Accumulated Net Investment Loss
|
Net Unrealized Appreciation
|
Net Realized Gains
|
Total
|
||||||||||||||||||||||||||||||
|
Issuance of treasury shares
|
—
|
|
—
|
|
47
|
|
—
|
|
(10
|
)
|
59
|
|
—
|
|
—
|
|
—
|
|
—
|
|
106
|
|
||||||||||||||||||
|
Exercise of stock options
|
—
|
|
—
|
|
33
|
|
—
|
|
(29
|
)
|
170
|
|
—
|
|
—
|
|
—
|
|
—
|
|
203
|
|
||||||||||||||||||
|
Purchase of non-controlling interest
|
—
|
|
—
|
|
(132
|
)
|
—
|
|
—
|
|
—
|
|
(13
|
)
|
—
|
|
—
|
|
—
|
|
(145
|
)
|
||||||||||||||||||
|
Net income
|
—
|
|
—
|
|
—
|
|
7,528
|
|
—
|
|
—
|
|
(377
|
)
|
—
|
|
—
|
|
—
|
|
7,151
|
|
||||||||||||||||||
|
Balance at December 31, 2013
|
7,382
|
|
$
|
148
|
|
$
|
61,939
|
|
$
|
14,536
|
|
306
|
|
$
|
(1,279
|
)
|
$
|
1,665
|
|
$
|
—
|
|
$
|
—
|
|
$
|
—
|
|
$
|
77,009
|
|
|||||||||
|
Issuance of restricted stock
|
146
|
|
3
|
|
(3
|
)
|
—
|
|
(53
|
)
|
—
|
|
—
|
|
—
|
|
—
|
|
—
|
|
$
|
—
|
|
|||||||||||||||||
|
Grant of restricted stock awards
|
—
|
|
—
|
|
865
|
|
—
|
|
—
|
|
—
|
|
—
|
|
—
|
|
—
|
|
—
|
|
$
|
865
|
|
|||||||||||||||||
|
Issuance of treasury shares
|
10
|
|
—
|
|
70
|
|
—
|
|
—
|
|
60
|
|
—
|
|
—
|
|
—
|
|
—
|
|
$
|
130
|
|
|||||||||||||||||
|
Exercise of stock options
|
45
|
|
1
|
|
259
|
|
—
|
|
(9
|
)
|
(161
|
)
|
—
|
|
—
|
|
—
|
|
—
|
|
$
|
99
|
|
|||||||||||||||||
|
Warrant exercise
|
155
|
|
3
|
|
(973
|
)
|
—
|
|
(182
|
)
|
970
|
|
—
|
|
—
|
|
—
|
|
—
|
|
$
|
—
|
|
|||||||||||||||||
|
Shares withheld in lieu of payroll taxes
|
—
|
|
—
|
|
(1,290
|
)
|
—
|
|
—
|
|
—
|
|
—
|
|
—
|
|
—
|
|
—
|
|
$
|
(1,290
|
)
|
|||||||||||||||||
|
Tax benefit from exercise/vesting of share based awards
|
—
|
|
—
|
|
563
|
|
—
|
|
—
|
|
—
|
|
—
|
|
—
|
|
—
|
|
—
|
|
$
|
563
|
|
|||||||||||||||||
|
Share retirement
|
(62
|
)
|
(1
|
)
|
(409
|
)
|
—
|
|
(62
|
)
|
410
|
|
—
|
|
—
|
|
—
|
|
—
|
|
$
|
—
|
|
|||||||||||||||||
|
Distribution of non-controlling interest
|
—
|
|
—
|
|
—
|
|
—
|
|
—
|
|
—
|
|
(33
|
)
|
—
|
|
—
|
|
—
|
|
$
|
(33
|
)
|
|||||||||||||||||
|
Net income
|
—
|
|
—
|
|
—
|
|
3,293
|
|
—
|
|
—
|
|
(85
|
)
|
—
|
|
—
|
|
—
|
|
$
|
3,208
|
|
|||||||||||||||||
|
Balance at November 11, 2014
|
7,676
|
|
$
|
154
|
|
$
|
61,021
|
|
$
|
17,829
|
|
—
|
|
$
|
—
|
|
$
|
1,547
|
|
$
|
—
|
|
$
|
—
|
|
$
|
—
|
|
$
|
80,551
|
|
|||||||||
|
Election to business development company
|
—
|
|
—
|
|
76,679
|
|
(17,829
|
)
|
—
|
|
—
|
|
(1,547
|
)
|
—
|
|
—
|
|
$
|
57,303
|
|
|||||||||||||||||||
|
Issuance of common stock, net of offering costs (1)
|
2,530
|
|
51
|
|
27,832
|
|
—
|
|
—
|
|
—
|
|
—
|
|
—
|
|
—
|
|
—
|
|
$
|
27,883
|
|
|||||||||||||||||
F-8
|
Number of
Shares of Common Stock |
Common
Stock
|
Additional
Paid-in
Capital
|
Retained
Earnings
|
Number of Shares of Treasury Stock
|
Treasury
Stock
|
Non-
controlling
Interest
|
Accumulated Net Investment Loss
|
Net Unrealized Appreciation
|
Net Realized Gains
|
Total
|
||||||||||||||||||||||||||||||
|
Net increase in net assets from operations
|
(2,523
|
)
|
2,609
|
|
595
|
|
$
|
681
|
|
|||||||||||||||||||||||||||||||
|
Balance at December 31, 2014
|
10,206
|
|
$
|
205
|
|
$
|
165,532
|
|
$
|
—
|
|
—
|
|
$
|
—
|
|
$
|
—
|
|
$
|
(2,523
|
)
|
$
|
2,609
|
|
$
|
595
|
|
$
|
166,418
|
|
|||||||||
(1) On November 18, 2014 the Company completed an offering of 2,530,000 shares of common stock at a public offering price of $12.50 per share. Total offering costs were approximately $3,700,000.
See accompanying notes to these consolidated financial statements.
F-9
NEWTEK BUSINESS SERVICES CORP. AND SUBSIDIARIES (FORMERLY NEWTEK BUSINESS SERVICES, INC. AND SUBSIDIARIES)
(In Thousands)
|
As a Business Development Company
|
Prior to becoming a Business Development Company
|
||||||||||||||
|
November 12, 2014 to December 31, 2014
|
January 1, 2014 to November 11, 2014
|
2013
|
2012
|
||||||||||||
|
Cash flows from operating activities:
|
|||||||||||||||
|
Net increase in net assets resulting from operations/net income
|
$
|
681
|
|
$
|
3,208
|
|
$
|
7,151
|
|
$
|
5,557
|
|
|||
|
Adjustments to reconcile net increase in net assets resulting from operations/net income to net cash provided by (used in) operating activities:
|
|||||||||||||||
|
Income from tax credits
|
(13
|
)
|
(48
|
)
|
(113
|
)
|
(522
|
)
|
|||||||
|
Amortization of deferred financing costs and debt discount related to debt refinancing
|
—
|
|
1,905
|
|
—
|
|
—
|
|
|||||||
|
Accretion of interest expense
|
9
|
|
18
|
|
135
|
|
525
|
|
|||||||
|
Fair value adjustments on SBA loans
|
(2,733
|
)
|
3,663
|
|
1,226
|
|
1,013
|
|
|||||||
|
Fair value adjustments on servicing asset
|
120
|
|
|||||||||||||
|
Fair value adjustment of credits in lieu of cash and notes payable in credits in lieu of cash
|
4
|
|
30
|
|
(21
|
)
|
(3
|
)
|
|||||||
|
Fair value adjustment on warrants
|
—
|
|
—
|
|
—
|
|
111
|
|
|||||||
|
Deferred income taxes
|
16
|
|
328
|
|
(1,289
|
)
|
(2,245
|
)
|
|||||||
|
Depreciation and amortization
|
43
|
|
3,140
|
|
3,284
|
|
3,036
|
|
|||||||
|
Purchase of portfolio investment
|
(2,400
|
)
|
—
|
|
—
|
|
—
|
|
|||||||
|
Originations of non-affiliate SBA loans held for sale
|
(30,914
|
)
|
—
|
|
—
|
|
—
|
|
|||||||
|
Proceeds from sale of non-affiliate SBA loans held for sale
|
6,421
|
|
—
|
|
—
|
|
—
|
|
|||||||
|
Non-affiliate SBA loans originated for investment
|
(8,570
|
)
|
—
|
|
—
|
|
—
|
|
|||||||
|
Payments received on SBA loans
|
1,305
|
|
—
|
|
—
|
|
—
|
|
|||||||
|
Goodwill impairment
|
—
|
|
1,706
|
|
—
|
|
—
|
|
|||||||
|
Accretion of discount
|
18
|
|
1,553
|
|
515
|
|
247
|
|
|||||||
|
Provision for loan losses
|
—
|
|
(53
|
)
|
1,322
|
|
810
|
|
|||||||
|
Provision for doubtful accounts
|
—
|
|
559
|
|
547
|
|
75
|
|
|||||||
|
Lease restructuring charges
|
—
|
|
—
|
|
—
|
|
(291
|
)
|
|||||||
|
Other, net
|
302
|
|
384
|
|
1,382
|
|
871
|
|
|||||||
|
Changes in operating assets and liabilities:
|
|||||||||||||||
|
Investment in money market funds
|
(3,000
|
)
|
—
|
|
—
|
|
—
|
|
|||||||
|
Originations of SBA loans held for sale
|
—
|
|
(123,284
|
)
|
(135,167
|
)
|
(83,349
|
)
|
|||||||
|
Proceeds from sale of SBA loans held for sale
|
—
|
|
123,935
|
|
131,733
|
|
84,743
|
|
|||||||
|
Broker receivable
|
6,718
|
|
6,889
|
|
3,092
|
|
(11,788
|
)
|
|||||||
|
Due to/from related parties
|
829
|
|
—
|
|
—
|
|
—
|
|
|||||||
|
Accounts receivable
|
1,441
|
|
(873
|
)
|
(1,278
|
)
|
(2,766
|
)
|
|||||||
|
Prepaid expenses, accrued interest receivable and other assets
|
(4,425
|
)
|
4,607
|
|
(7,450
|
)
|
3,245
|
|
|||||||
F-10
|
As a Business Development Company
|
Prior to becoming a Business Development Company
|
||||||||||||||
|
November 12, 2014 to December 31, 2014
|
January 1, 2014 to November 11, 2014
|
2013
|
2012
|
||||||||||||
|
Accounts payable, accrued expenses, other liabilities and deferred revenue
|
(5,698
|
)
|
3,480
|
|
3,717
|
|
(597
|
)
|
|||||||
|
Change in restricted cash
|
1,061
|
|
(3,498
|
)
|
—
|
|
—
|
|
|||||||
|
Capitalized servicing asset
|
(138
|
)
|
(3,096
|
)
|
—
|
|
—
|
|
|||||||
|
Other, net
|
—
|
|
—
|
|
(3,812
|
)
|
(3,026
|
)
|
|||||||
|
Net cash provided by (used in) operating activities
|
(38,923
|
)
|
24,553
|
|
4,974
|
|
(4,354
|
)
|
|||||||
|
Cash flows from investing activities:
|
|||||||||||||||
|
Investments in qualified businesses
|
—
|
|
(214
|
)
|
—
|
|
(1,651
|
)
|
|||||||
|
Returns of investments in qualified businesses
|
—
|
|
—
|
|
1,532
|
|
233
|
|
|||||||
|
Purchase of fixed assets and customer accounts
|
(20
|
)
|
(1,369
|
)
|
(2,032
|
)
|
(3,055
|
)
|
|||||||
|
SBA loans originated for investment, net
|
—
|
|
(39,786
|
)
|
(42,885
|
)
|
(24,190
|
)
|
|||||||
|
Payments received on SBA loans
|
—
|
|
10,853
|
|
7,409
|
|
4,999
|
|
|||||||
|
Proceeds from sale of loan held for investment
|
—
|
|
500
|
|
—
|
|
—
|
|
|||||||
|
Change in restricted cash
|
—
|
|
—
|
|
—
|
|
1,441
|
|
|||||||
|
Purchase of non-controlling interest
|
—
|
|
—
|
|
(145
|
)
|
(275
|
)
|
|||||||
|
Net cash used in investing activities
|
(20
|
)
|
(30,016
|
)
|
(36,121
|
)
|
(22,498
|
)
|
|||||||
See accompanying notes to these consolidated financial statements.
F-11
NEWTEK BUSINESS SERVICES CORP. AND SUBSIDIARIES (FORMERLY NEWTEK BUSINESS SERVICES, INC. AND SUBSIDIARIES)
CONSOLIDATED STATEMENTS OF CASH FLOWS—(Continued)
(In Thousands)
|
As a Business Development Company
|
Prior to becoming a Business Development Company
|
||||||||||||||
|
November 12, 2014 to December 31, 2014
|
January 1, 2014 to November 11, 2014
|
2013
|
2012
|
||||||||||||
|
Cash flows from financing activities:
|
|||||||||||||||
|
Net borrowings on bank lines of credit
|
$
|
(1,091
|
)
|
$
|
8,435
|
|
$
|
1,450
|
|
$
|
18,387
|
|
|||
|
Proceeds from shares sold, net of offering costs
|
29,728
|
|
|||||||||||||
|
Increase in cash due to consolidation of new subsidiary
|
—
|
|
—
|
|
—
|
|
2,763
|
|
|||||||
|
Proceeds from term loan
|
—
|
|
10,000
|
|
—
|
|
10,000
|
|
|||||||
|
Payments on bank term note payable
|
(417
|
)
|
(11,007
|
)
|
(417
|
)
|
(417
|
)
|
|||||||
|
Payments on senior notes
|
(2,070
|
)
|
(10,527
|
)
|
(7,522
|
)
|
(4,561
|
)
|
|||||||
|
Issuance of senior notes, net of issuance costs
|
31,679
|
|
—
|
|
45,343
|
|
—
|
|
|||||||
|
Change in restricted cash related to securitization
|
(4,935
|
)
|
6,441
|
|
(7,769
|
)
|
5,053
|
|
|||||||
|
Additions to deferred financing costs
|
(869
|
)
|
(860
|
)
|
(1,867
|
)
|
(1,246
|
)
|
|||||||
|
Proceeds from exercise of stock options
|
—
|
|
15
|
|
198
|
|
—
|
|
|||||||
|
Payments on behalf of employees for payroll tax liability
|
—
|
|
(1,207
|
)
|
—
|
|
—
|
|
|||||||
|
Purchase of treasury shares
|
—
|
|
—
|
|
—
|
|
(967
|
)
|
|||||||
|
Other, net
|
(2
|
)
|
(236
|
)
|
10
|
|
868
|
|
|||||||
|
Net cash provided by financing activities
|
52,023
|
|
1,054
|
|
29,426
|
|
29,880
|
|
|||||||
|
Net (decrease) increase in cash and cash equivalents
|
13,080
|
|
(4,409
|
)
|
(1,721
|
)
|
3,028
|
|
|||||||
|
Cash and cash equivalents—beginning of year/period
|
4,733
|
|
12,508
|
|
14,229
|
|
11,201
|
|
|||||||
|
Cash and cash equivalents—end of year/period
|
$
|
17,813
|
|
$
|
8,099
|
|
$
|
12,508
|
|
$
|
14,229
|
|
|||
|
Supplemental disclosure of cash flow activities:
|
|||||||||||||||
|
Cash paid for interest
|
$
|
638
|
|
$
|
3,970
|
|
$
|
3,986
|
|
$
|
2,844
|
|
|||
|
Cash paid for taxes
|
$
|
—
|
|
$
|
6,187
|
|
$
|
5,783
|
|
$
|
5,402
|
|
|||
|
Non-cash investing and financing activities:
|
|||||||||||||||
|
Reduction of credits in lieu of cash and notes payable in credits in lieu of cash balances due to delivery of tax credits to Certified Investors
|
$
|
174
|
|
$
|
1,287
|
|
$
|
5,182
|
|
$
|
9,362
|
|
|||
|
Additional paid in capital, upon acquisition of subsidiaries non-controlling interests
|
$
|
—
|
|
$
|
—
|
|
$
|
129
|
|
$
|
—
|
|
|||
|
Conversion of loans held for investment to other real estate owned
|
$
|
—
|
|
$
|
136
|
|
$
|
625
|
|
$
|
426
|
|
|||
|
Addition to assets and liabilities on January 1, 2012 as a result of consolidation of Exponential of New York, LLC
|
|||||||||||||||
|
Assets
|
$
|
—
|
|
$
|
—
|
|
$
|
—
|
|
$
|
2,763
|
|
|||
|
Liabilities
|
—
|
|
—
|
|
—
|
|
7
|
|
|||||||
|
Equity
|
$
|
—
|
|
$
|
—
|
|
$
|
—
|
|
$
|
2,756
|
|
|||
|
Addition to additional paid-in capital for warrants expired previously attributable to non-controlling interests
|
$
|
—
|
|
$
|
—
|
|
$
|
—
|
|
$
|
338
|
|
|||
|
Initial allocation of value issued to warrants issued in financing transaction
|
$
|
—
|
|
$
|
—
|
|
$
|
—
|
|
$
|
1,959
|
|
|||
See accompanying notes to these consolidated financial statements.
F-12
NEWTEK BUSINESS SERVICES CORP. AND SUBSIDIARIES (FORMERLY NEWTEK BUSINESS SERVICES, INC. AND SUBSIDIARIES)
CONSOLIDATED SCHEDULE OF INVESTMENTS December 31, 2014
(In Thousands)
|
Portfolio Company
|
Industry
|
Type of Investment
|
Interest Rate
(2)
|
Maturity
|
Principal
|
Cost
|
Fair Value
|
% of Net Assets
|
|||||||||||||||||
|
Performing SBA unguaranteed investments
(1)
|
|||||||||||||||||||||||||
|
MLM Enterprises, LLC and Demand Printing Solutions Inc.
|
Printing and Related Support Activities
|
Term Loan
|
Prime plus 2.75%
|
11/18/2024
|
|
$
|
70.5
|
|
$
|
70.5
|
|
$
|
63.3
|
|
0.04
|
%
|
|||||||||
|
DC Real, LLC and DC Enterprises, LTD dba Lakeview True Value
|
Building Material and Garden Equipment and Supplies Dealers
|
Term Loan
|
Prime plus 2.75%
|
11/20/2039
|
|
119.4
|
|
93.9
|
|
94.0
|
|
0.06
|
%
|
||||||||||||
|
Legacy Estate Planning Inc. dba American Casket Enterprises
|
Personal and Laundry Services
|
Term Loan
|
Prime plus 2.75%
|
11/21/2024
|
|
42.0
|
|
42.0
|
|
33.5
|
|
0.02
|
%
|
||||||||||||
|
J&D Resources, LLC dba Aqua Science
|
Specialty Trade Contractors
|
Term Loan
|
Prime plus 2.75%
|
11/21/2024
|
|
767.9
|
|
767.9
|
|
627.3
|
|
0.38
|
%
|
||||||||||||
|
Teamnewman Enterprises, LLC dba Newmans at 988
|
Food Services and Drinking Places
|
Term Loan
|
Prime plus 2.75%
|
11/25/2039
|
|
148.8
|
|
148.8
|
|
138.5
|
|
0.08
|
%
|
||||||||||||
|
DeRidder Chiropractic, LLC
|
Ambulatory Health Care Services
|
Term Loan
|
Prime plus 2.75%
|
11/25/2024
|
|
13.2
|
|
13.2
|
|
12.5
|
|
0.01
|
%
|
||||||||||||
|
Stormrider Inc. dba Shirley's Stormrider, Inc.
|
Truck Transportation
|
Term Loan
|
Prime plus 2.75%
|
11/25/2024
|
|
150.0
|
|
150.0
|
|
119.5
|
|
0.07
|
%
|
||||||||||||
|
Modern Manhattan, LLC
|
Furniture and Home Furnishings Stores
|
Term Loan
|
Prime plus 2.75%
|
11/25/2024
|
|
220.0
|
|
220.0
|
|
178.3
|
|
0.11
|
%
|
||||||||||||
|
Meridian Hotels, LLC dba Best Western Jonesboro
|
Accommodation
|
Term Loan
|
Prime plus 2.75%
|
11/25/2039
|
|
228.0
|
|
228.0
|
|
228.3
|
|
0.14
|
%
|
||||||||||||
|
Trading Group 3, Inc.
|
Miscellaneous Store Retailers
|
Term Loan
|
Prime plus 2.75%
|
11/26/2024
|
|
22.5
|
|
22.5
|
|
17.9
|
|
0.01
|
%
|
||||||||||||
|
The Red Pill Management Inc. dba UFC Gym Matthews
|
Performing Arts, Spectator Sports, and Related Industries
|
Term Loan
|
Prime plus 2.75%
|
11/26/2024
|
|
54.3
|
|
28.7
|
|
24.6
|
|
0.01
|
%
|
||||||||||||
|
Homegrown For Good, LLC
|
Apparel Manufacturing
|
Term Loan
|
Prime plus 2.75%
|
11/26/2024
|
|
230.0
|
|
230.0
|
|
202.1
|
|
0.12
|
%
|
||||||||||||
|
Kemmer, LLC and Apples Tree Top Liquors, LLC
|
Food and Beverage Stores
|
Term Loan
|
Prime plus 2.75%
|
12/4/2039
|
|
138.4
|
|
138.4
|
|
125.1
|
|
0.08
|
%
|
||||||||||||
|
The Conibear Corporation and Conibear Trucking, LLC
|
Truck Transportation
|
Term Loan
|
Prime plus 2.75%
|
12/5/2024
|
|
12.0
|
|
12.0
|
|
10.5
|
|
0.01
|
%
|
||||||||||||
|
All American Games, LLC and Sportslink - The Game, LLC
|
Performing Arts, Spectator Sports, and Related Industries
|
Term Loan
|
Prime plus 2.75%
|
12/10/2024
|
|
400.0
|
|
400.0
|
|
341.6
|
|
0.21
|
%
|
||||||||||||
|
B & W Towing, LLC and Boychucks Fuel, LLC
|
Repair and Maintenance
|
Term Loan
|
Prime plus 2.75%
|
12/17/2039
|
|
164.5
|
|
164.5
|
|
151.3
|
|
0.09
|
%
|
||||||||||||
|
MM and M Management Inc. dba Pizza Artista
|
Food Services and Drinking Places
|
Term Loan
|
Prime plus 2.75%
|
4/19/2025
|
|
46.3
|
|
46.3
|
|
37.8
|
|
0.02
|
%
|
||||||||||||
F-13
|
Portfolio Company
|
Industry
|
Type of Investment
|
Interest Rate
(2)
|
Maturity
|
Principal
|
Cost
|
Fair Value
|
% of Net Assets
|
|||||||||||||||||
|
B.S. Ventures, LLC dba Dink's Market
|
Merchant Wholesalers, Nondurable Goods
|
Term Loan
|
Prime plus 2.75%
|
12/19/2039
|
|
53.8
|
|
53.8
|
|
53.4
|
|
0.03
|
%
|
||||||||||||
|
Will Zac Management, LLC dba Papa John's
|
Food Services and Drinking Places
|
Term Loan
|
Prime plus 2.75%
|
12/19/2024
|
|
48.8
|
|
48.8
|
|
47.9
|
|
0.03
|
%
|
||||||||||||
|
The Jewelers Inc. dba The Jewelers of Las Vegas
|
Clothing and Clothing Accessories Stores
|
Term Loan
|
Prime plus 2.75%
|
12/19/2024
|
|
1,250.0
|
|
1,250.0
|
|
1,008.4
|
|
0.61
|
%
|
||||||||||||
|
Beale Street Blues Company-West Palm Beach, LLC
|
Performing Arts, Spectator Sports, and Related Industries
|
Term Loan
|
Prime plus 2.75%
|
12/22/2024
|
|
187.5
|
|
187.5
|
|
158.8
|
|
0.10
|
%
|
||||||||||||
|
401 JJS Corporation and G Randazzo's Trattoria Corporation
|
Food Services and Drinking Places
|
Term Loan
|
Prime plus 2.75%
|
12/23/2039
|
|
473.5
|
|
378.8
|
|
379.2
|
|
0.23
|
%
|
||||||||||||
|
The Lodin Group, LLC and Lodin Health Imaging Inc.
|
Ambulatory Health Care Services
|
Term Loan
|
Prime plus 2.75%
|
12/23/2039
|
|
530.3
|
|
530.3
|
|
472.9
|
|
0.28
|
%
|
||||||||||||
|
Thermoplastic Services Inc. and Paragon Plastic Sheet, Inc
|
Plastics and Rubber Products Manufacturing
|
Term Loan
|
Prime plus 2.75%
|
12/23/2039
|
|
500.0
|
|
500.0
|
|
500.6
|
|
0.30
|
%
|
||||||||||||
|
Winter Ventures Inc. dba Qualitybargainbooks and Qualitybargainmall
|
Nonstore Retailers
|
Term Loan
|
Prime plus 2.75%
|
12/23/2024
|
|
156.1
|
|
156.1
|
|
132.5
|
|
0.08
|
%
|
||||||||||||
|
Carolina Flicks Inc. dba The Howell Theater
|
Motion Picture and Sound Recording Industries
|
Term Loan
|
Prime plus 2.75%
|
12/23/2032
|
|
163.3
|
|
163.3
|
|
149.9
|
|
0.09
|
%
|
||||||||||||
|
Atlantis of Daytona. LLC and Ocean Club Sportswear Inc.
|
Clothing and Clothing Accessories Stores
|
Term Loan
|
Prime plus 2.75%
|
12/23/2039
|
|
240.0
|
|
240.0
|
|
240.3
|
|
0.14
|
%
|
||||||||||||
|
Bowlerama, Inc.
|
Amusement, Gambling, and Recreation Industries
|
Term Loan
|
Prime plus 2.75%
|
12/24/2039
|
|
1,202.5
|
|
1,202.5
|
|
1,199.9
|
|
0.72
|
%
|
||||||||||||
|
Bear Creek Entertainment, LLC dba The Woods at Bear Creek
|
Accommodation
|
Term Loan
|
Prime plus 2.75%
|
12/30/2024
|
|
106.3
|
|
106.3
|
|
104.6
|
|
0.06
|
%
|
||||||||||||
|
Evans and Paul, LLC
|
Merchant Wholesalers, Durable Goods
|
Term Loan
|
Prime plus 2.75%
|
12/30/2024
|
|
223.8
|
|
223.8
|
|
207.6
|
|
0.12
|
%
|
||||||||||||
|
First Prevention and Dialysis Center, LLC
|
Ambulatory Health Care Services
|
Term Loan
|
Prime plus 2.75%
|
12/30/2024
|
|
238.3
|
|
78.1
|
|
76.9
|
|
0.05
|
%
|
||||||||||||
|
Grand Blanc Lanes, Inc. and H, H and H, LLC
|
Amusement, Gambling, and Recreation Industries
|
Term Loan
|
Prime plus 2.75%
|
12/31/2039
|
|
133.0
|
|
133.0
|
|
130.5
|
|
0.08
|
%
|
||||||||||||
|
FHJE Ventures, LLC and Eisenreich II Inc. dba Breakneck Tavern
|
Food Services and Drinking Places
|
Term Loan
|
Prime plus 2.75%
|
12/31/2039
|
|
245.5
|
|
161.6
|
|
161.8
|
|
0.10
|
%
|
||||||||||||
|
JEJE Realty, LLC and La Familia Inc.
|
Food Services and Drinking Places
|
Term Loan
|
Prime plus 2.75%
|
11/10/2039
|
|
205.8
|
|
205.8
|
|
191.9
|
|
0.12
|
%
|
||||||||||||
|
Joey O's, LLC and Jennifer Olszewski
|
Specialty Trade Contractors
|
Term Loan
|
Prime plus 2.75%
|
11/7/2024
|
|
13.1
|
|
13.0
|
|
10.3
|
|
0.01
|
%
|
||||||||||||
|
Laura L. Smith dba Lisa Smith Studio
|
Professional, Scientific, and Technical Services
|
Term Loan
|
Prime plus 2.75%
|
11/3/2024
|
|
15.0
|
|
14.9
|
|
11.9
|
|
0.01
|
%
|
||||||||||||
F-14
|
Portfolio Company
|
Industry
|
Type of Investment
|
Interest Rate
(2)
|
Maturity
|
Principal
|
Cost
|
Fair Value
|
% of Net Assets
|
|||||||||||||||||
|
Frontier Bulk Solutions, LLC
|
Building Material and Garden Equipment and Supplies Dealers
|
Term Loan
|
Prime plus 2.75%
|
10/31/2024
|
|
1,250.0
|
|
1,242.3
|
|
1,043.3
|
|
0.63
|
%
|
||||||||||||
|
Heartland American Properties, LLC and Skaggs RV Outlet, LLC
|
Motor Vehicle and Parts Dealers
|
Term Loan
|
Prime plus 2.75%
|
10/31/2039
|
|
479.0
|
|
478.3
|
|
459.3
|
|
0.28
|
%
|
||||||||||||
|
M and C Renovations Inc.
|
Construction of Buildings
|
Term Loan
|
Prime plus 2.75%
|
10/31/2024
|
|
20.3
|
|
20.1
|
|
16.2
|
|
0.01
|
%
|
||||||||||||
|
Golden Transaction Corporation dba Bleh Sunoco
|
Gasoline Stations
|
Term Loan
|
Prime plus 2.75%
|
10/30/2039
|
|
156.7
|
|
156.5
|
|
152.5
|
|
0.09
|
%
|
||||||||||||
|
Kantz, LLC and Kantz Auto, LLC dba Kantz's Hometown Auto
|
Motor Vehicle and Parts Dealers
|
Term Loan
|
Prime plus 2.75%
|
10/29/2039
|
|
68.1
|
|
68.0
|
|
65.0
|
|
0.04
|
%
|
||||||||||||
|
Seelan Inc. dba Candleridge Market
|
Gasoline Stations
|
Term Loan
|
Prime plus 2.75%
|
10/27/2039
|
|
90.5
|
|
90.4
|
|
84.0
|
|
0.05
|
%
|
||||||||||||
|
185 Summerfield Inc. and Valcon Contracting Corp.
|
Construction of Buildings
|
Term Loan
|
Prime plus 2.75%
|
10/24/2039
|
|
162.3
|
|
162.0
|
|
157.1
|
|
0.09
|
%
|
||||||||||||
|
Navdeep B Martins and Busy Bubbles, LLC dba Wishy Washy
|
Personal and Laundry Services
|
Term Loan
|
Prime plus 2.75%
|
10/24/2039
|
|
89.0
|
|
88.9
|
|
80.5
|
|
0.05
|
%
|
||||||||||||
|
3 F Management, LLC and ATC Port Charlotte, LLC
|
Amusement, Gambling, and Recreation Industries
|
Term Loan
|
Prime plus 2.75%
|
10/17/2024
|
|
131.3
|
|
130.4
|
|
110.9
|
|
0.07
|
%
|
||||||||||||
|
One Hour Jewelry Repair Inc.
|
Repair and Maintenance
|
Term Loan
|
Prime plus 2.75%
|
10/14/2024
|
|
20.6
|
|
20.4
|
|
16.3
|
|
0.01
|
%
|
||||||||||||
|
Return to Excellence, Inc. dba The Waynesville Inn Golf & Spa
|
Amusement, Gambling, and Recreation Industries
|
Term Loan
|
Prime plus 2.75%
|
10/10/2039
|
|
1,250.0
|
|
1,249.0
|
|
1,250.5
|
|
0.75
|
%
|
||||||||||||
|
Capitol Waste and Recycling Services, LLC
|
Waste Management and Remediation Services
|
Term Loan
|
Prime plus 2.75%
|
10/10/2024
|
|
257.8
|
|
256.2
|
|
220.3
|
|
0.13
|
%
|
||||||||||||
|
Sound Manufacturing Inc.
|
Fabricated Metal Product Manufacturing
|
Term Loan
|
Prime plus 2.75%
|
10/10/2024
|
|
187.5
|
|
186.5
|
|
157.1
|
|
0.09
|
%
|
||||||||||||
|
DNT Storage and Properties, LLC
|
Real Estate
|
Term Loan
|
Prime plus 2.75%
|
10/10/2039
|
|
101.8
|
|
101.6
|
|
99.2
|
|
0.06
|
%
|
||||||||||||
|
Boilermaker Industries, LLC dba PostNet
|
Administrative and Support Services
|
Term Loan
|
Prime plus 2.75%
|
10/9/2024
|
|
18.8
|
|
18.8
|
|
16.8
|
|
0.01
|
%
|
||||||||||||
|
Doctors Express Management of Central Texas, LLC
|
Ambulatory Health Care Services
|
Term Loan
|
Prime plus 2.75%
|
10/8/2024
|
|
105.0
|
|
92.4
|
|
85.0
|
|
0.05
|
%
|
||||||||||||
|
Smith Spinal Care Center P.C. and James C. Smith
|
Ambulatory Health Care Services
|
Term Loan
|
Prime plus 2.75%
|
10/8/2039
|
|
60.0
|
|
59.9
|
|
57.2
|
|
0.03
|
%
|
||||||||||||
|
Michael Rey Jr. and Lynn J. Williams (EPC) and GIG Petcare
|
Personal and Laundry Services
|
Term Loan
|
Prime plus 2.75%
|
10/3/2039
|
|
126.9
|
|
126.4
|
|
122.2
|
|
0.07
|
%
|
||||||||||||
|
Sumad, LLC dba BrightStar Care of Encinitas
|
Administrative and Support Services
|
Term Loan
|
Prime plus 2.75%
|
10/2/2024
|
|
92.5
|
|
92.5
|
|
90.1
|
|
0.05
|
%
|
||||||||||||
|
Route 130 SCPI Holdings LLC, (EPC) Route 130 SCPI Operations, LLC (OC)
|
Food Services and Drinking Places
|
Term Loan
|
Prime plus 2.75%
|
9/30/2039
|
|
538.8
|
|
538.8
|
|
494.2
|
|
0.30
|
%
|
||||||||||||
|
Roccos, LLC and Sullo Pantalone Inc. dba Rocco's
|
Food Services and Drinking Places
|
Term Loan
|
Prime plus 2.75%
|
9/30/2039
|
|
255.8
|
|
255.0
|
|
234.8
|
|
0.14
|
%
|
||||||||||||
F-15
|
Portfolio Company
|
Industry
|
Type of Investment
|
Interest Rate
(2)
|
Maturity
|
Principal
|
Cost
|
Fair Value
|
% of Net Assets
|
|||||||||||||||||
|
Keller Holdings, LLC and David H Keller III and Carie C Keller
|
Scenic and Sightseeing Transportation
|
Term Loan
|
Prime plus 2.75%
|
9/30/2039
|
|
100.0
|
|
99.7
|
|
98.4
|
|
0.06
|
%
|
||||||||||||
|
The Woods at Bear Creek, LLC and Bear Creek Entertainment, LLC
|
Accommodation
|
Term Loan
|
Prime plus 2.75%
|
9/29/2039
|
|
513.3
|
|
512.5
|
|
513.0
|
|
0.31
|
%
|
||||||||||||
|
Orange County Insurance Brokerage Inc. dba Beaty Insurance Agency
|
Insurance Carriers and Related Activities
|
Term Loan
|
Prime plus 2.75%
|
9/29/2039
|
|
325.1
|
|
324.6
|
|
324.7
|
|
0.20
|
%
|
||||||||||||
|
Keys Phase One, LLC dba The Grand Guesthouse
|
Accommodation
|
Term Loan
|
Prime plus 2.75%
|
9/26/2039
|
|
736.3
|
|
734.1
|
|
709.4
|
|
0.43
|
%
|
||||||||||||
|
Colts V, LLC and Nowatzke Service Center, Inc.
|
Repair and Maintenance
|
Term Loan
|
Prime plus 2.75%
|
9/26/2039
|
|
601.8
|
|
600.0
|
|
576.8
|
|
0.35
|
%
|
||||||||||||
|
Gordon E Rogers dba Stonehouse Motor Inn
|
Accommodation
|
Term Loan
|
Prime plus 2.75%
|
9/26/2039
|
|
57.5
|
|
57.3
|
|
57.4
|
|
0.03
|
%
|
||||||||||||
|
Auto Shine Carwash Inc. and AKM R. Hossain and Jessica F. Masud
|
Gasoline Stations
|
Term Loan
|
Prime plus 2.75%
|
9/26/2024
|
|
22.5
|
|
22.2
|
|
18.6
|
|
0.01
|
%
|
||||||||||||
|
6 Price Avenue, LLC and Pauley Tree & Lawn Care, Inc.
|
Administrative and Support Services
|
Term Loan
|
Prime plus 2.75%
|
9/24/2039
|
|
452.5
|
|
451.2
|
|
395.7
|
|
0.24
|
%
|
||||||||||||
|
North Columbia, LLC and Loop Liquor and Convenience Store, LLC
|
Food and Beverage Stores
|
Term Loan
|
Prime plus 2.75%
|
9/24/2039
|
|
159.3
|
|
158.8
|
|
153.0
|
|
0.09
|
%
|
||||||||||||
|
R A Johnson Inc. dba Rick Johnson Auto and Tire
|
Repair and Maintenance
|
Term Loan
|
Prime plus 2.75%
|
9/23/2039
|
|
301.3
|
|
300.4
|
|
300.7
|
|
0.18
|
%
|
||||||||||||
|
Andrene's, LLC dba Andrene's Caribbean Soul Food Carry Out
|
Food Services and Drinking Places
|
Term Loan
|
Prime plus 2.75%
|
9/23/2024
|
|
37.8
|
|
37.6
|
|
30.1
|
|
0.02
|
%
|
||||||||||||
|
Utek Corporation dba Arcade Car Wash
|
Repair and Maintenance
|
Term Loan
|
Prime plus 2.75%
|
9/22/2039
|
|
405.5
|
|
405.0
|
|
400.6
|
|
0.24
|
%
|
||||||||||||
|
Play and Stay, LLC dba Zoom Room Tinton Falls
|
Personal and Laundry Services
|
Term Loan
|
Prime plus 2.75%
|
9/18/2024
|
|
42.1
|
|
42.1
|
|
33.6
|
|
0.02
|
%
|
||||||||||||
|
Ryan Crick and Pamela J. Crick and Crick Enterprises Inc.
|
Repair and Maintenance
|
Term Loan
|
Prime plus 2.75%
|
9/17/2039
|
|
145.5
|
|
145.1
|
|
145.2
|
|
0.09
|
%
|
||||||||||||
|
Modern Leather Goods Repair Shop Inc.
|
Repair and Maintenance
|
Term Loan
|
Prime plus 2.75%
|
9/17/2024
|
|
58.8
|
|
57.6
|
|
45.9
|
|
0.03
|
%
|
||||||||||||
|
Animal Intrusion Prevention Systems Holding Company, LLC
|
Administrative and Support Services
|
Term Loan
|
Prime plus 2.75%
|
9/15/2024
|
|
272.5
|
|
269.1
|
|
230.1
|
|
0.14
|
%
|
||||||||||||
|
Tavern Properties, LLC and Wildwood Tavern, LLC
|
Food Services and Drinking Places
|
Term Loan
|
Prime plus 2.75%
|
9/15/2039
|
|
425.0
|
|
312.0
|
|
312.3
|
|
0.19
|
%
|
||||||||||||
|
RDT Enterprises, LLC
|
Specialty Trade Contractors
|
Term Loan
|
Prime plus 2.75%
|
9/15/2027
|
|
162.8
|
|
161.4
|
|
152.3
|
|
0.09
|
%
|
||||||||||||
|
KW Zion, LLC and Key West Gallery Inc.
|
Miscellaneous Store Retailers
|
Term Loan
|
Prime plus 2.75%
|
9/12/2039
|
|
1,250.0
|
|
1,246.4
|
|
1,203.3
|
|
0.72
|
%
|
||||||||||||
|
Indy East Smiles Youth Dentistry, LLC dba Prime Smile East
|
Ambulatory Health Care Services
|
Term Loan
|
Prime plus 2.75%
|
9/11/2024
|
|
630.2
|
|
622.4
|
|
499.6
|
|
0.30
|
%
|
||||||||||||
|
B&P Diners, LLC dba Engine House Restaurant
|
Food Services and Drinking Places
|
Term Loan
|
Prime plus 2.75%
|
9/10/2024
|
|
80.0
|
|
79.0
|
|
63.0
|
|
0.04
|
%
|
||||||||||||
|
Feel The World Inc. dba Xero Shoes and Invisible Shoes
|
Leather and Allied Product Manufacturing
|
Term Loan
|
Prime plus 2.75%
|
9/5/2024
|
|
51.9
|
|
51.3
|
|
42.2
|
|
0.03
|
%
|
||||||||||||
F-16
|
Portfolio Company
|
Industry
|
Type of Investment
|
Interest Rate
(2)
|
Maturity
|
Principal
|
Cost
|
Fair Value
|
% of Net Assets
|
|||||||||||||||||
|
Alberti and Cardoni, LLC dba Menchie's
|
Health and Personal Care Stores
|
Term Loan
|
Prime plus 2.75%
|
8/29/2024
|
|
77.3
|
|
77.3
|
|
64.3
|
|
0.04
|
%
|
||||||||||||
|
Delta Aggrigate, LLC
|
Mining (except Oil and Gas)
|
Term Loan
|
Prime plus 2.75%
|
8/28/2039
|
|
911.3
|
|
911.3
|
|
912.1
|
|
0.55
|
%
|
||||||||||||
|
Lamjam, LLC (EPC) Goldsmith Lambros Inc. (OC)
|
Clothing and Clothing Accessories Stores
|
Term Loan
|
Prime plus 2.75%
|
8/27/2024
|
|
133.8
|
|
131.3
|
|
129.3
|
|
0.08
|
%
|
||||||||||||
|
Orange County Cleaning Inc.
|
Administrative and Support Services
|
Term Loan
|
Prime plus 2.75%
|
8/27/2024
|
|
41.3
|
|
40.5
|
|
32.3
|
|
0.02
|
%
|
||||||||||||
|
Qycell Corporation
|
Plastics and Rubber Products Manufacturing
|
Term Loan
|
Prime plus 2.75%
|
8/26/2024
|
|
121.0
|
|
118.9
|
|
103.7
|
|
0.06
|
%
|
||||||||||||
|
Atlas Auto Body Inc. dba Atlas Auto Sales
|
Repair and Maintenance
|
Term Loan
|
Prime plus 2.75%
|
8/22/2039
|
|
51.6
|
|
51.3
|
|
47.9
|
|
0.03
|
%
|
||||||||||||
|
Grey Light Realty, LLC (EPC) NH Precision Metal Fabricators Inc. (OC)
|
Fabricated Metal Product Manufacturing
|
Term Loan
|
Prime plus 2.75%
|
8/21/2039
|
|
1,226.0
|
|
1,220.6
|
|
1,160.5
|
|
0.70
|
%
|
||||||||||||
|
S&P Holdings of Daytona LLC (EPC) S&P Corporation of Daytona Beach
|
Miscellaneous Store Retailers
|
Term Loan
|
Prime plus 2.75%
|
8/15/2039
|
|
433.5
|
|
431.6
|
|
432.0
|
|
0.26
|
%
|
||||||||||||
|
Barber Investments, LLC and Fieldstone Quickstop, LLC
|
Gasoline Stations
|
Term Loan
|
Prime plus 2.75%
|
8/15/2039
|
|
150.0
|
|
149.3
|
|
128.6
|
|
0.08
|
%
|
||||||||||||
|
Katie Senior Care, LLC dba Home Instead Senior Care
|
Social Assistance
|
Term Loan
|
Prime plus 2.75%
|
8/15/2024
|
|
124.3
|
|
121.9
|
|
97.2
|
|
0.06
|
%
|
||||||||||||
|
Alpha Preparatory Academy, LLC
|
Social Assistance
|
Term Loan
|
Prime plus 2.75%
|
8/15/2039
|
|
145.2
|
|
109.2
|
|
109.4
|
|
0.07
|
%
|
||||||||||||
|
Hamer Road Auto Salvage, LLC and Scott T. Cook and Nikki J. Cook
|
Motor Vehicle and Parts Dealers
|
Term Loan
|
Prime plus 2.75%
|
8/8/2039
|
|
188.4
|
|
187.6
|
|
187.8
|
|
0.11
|
%
|
||||||||||||
|
Almost Home Property, LLC and Almost Home Daycare, LLC
|
Social Assistance
|
Term Loan
|
Prime plus 2.75%
|
8/7/2039
|
|
715.8
|
|
713.6
|
|
698.8
|
|
0.42
|
%
|
||||||||||||
|
iFood, Inc. dba Steak N Shake
|
Food Services and Drinking Places
|
Term Loan
|
Prime plus 2.75%
|
7/31/2024
|
|
379.1
|
|
290.5
|
|
259.3
|
|
0.16
|
%
|
||||||||||||
|
AGV Enterprises, LLC dba Jet's Pizza #42
|
Food Services and Drinking Places
|
Term Loan
|
Prime plus 2.75%
|
7/31/2024
|
|
54.8
|
|
53.5
|
|
43.9
|
|
0.03
|
%
|
||||||||||||
|
575 Columbus Avenue Holding Company, LLC and LA-ZE, LLC
|
Food Services and Drinking Places
|
Term Loan
|
Prime plus 2.75%
|
7/30/2039
|
|
22.5
|
|
22.4
|
|
22.4
|
|
0.01
|
%
|
||||||||||||
|
L&S Insurance & Financial Services Inc.
|
Insurance Carriers and Related Activities
|
Term Loan
|
Prime plus 2.75%
|
7/25/2024
|
|
22.5
|
|
21.9
|
|
17.8
|
|
0.01
|
%
|
||||||||||||
|
Honeyspot Investors, LLP and Pace Motor Lines Inc.
|
Truck Transportation
|
Term Loan
|
Prime plus 2.75%
|
7/24/2039
|
|
150.0
|
|
149.1
|
|
147.6
|
|
0.09
|
%
|
||||||||||||
|
Miss Cranston Diner II, LLC and Miss Cranston II Realty, LLC
|
Food Services and Drinking Places
|
Term Loan
|
Prime plus 2.75%
|
7/17/2039
|
|
91.3
|
|
91.3
|
|
88.4
|
|
0.05
|
%
|
||||||||||||
|
Wired, LLC and Moulison North Corporation
|
Specialty Trade Contractors
|
Term Loan
|
Prime plus 2.75%
|
7/3/2024
|
|
150.1
|
|
146.4
|
|
126.6
|
|
0.08
|
%
|
||||||||||||
|
Honeyspot Investors, LLP and Pace Motor Lines Inc.
|
Truck Transportation
|
Term Loan
|
Prime plus 2.75%
|
6/30/2039
|
|
875.3
|
|
870.1
|
|
859.1
|
|
0.52
|
%
|
||||||||||||
|
iFood, Inc. dba Steak N Shake
|
Food Services and Drinking Places
|
Term Loan
|
Prime plus 2.75%
|
6/30/2039
|
|
629.8
|
|
625.2
|
|
549.0
|
|
0.33
|
%
|
||||||||||||
F-17
|
Portfolio Company
|
Industry
|
Type of Investment
|
Interest Rate
(2)
|
Maturity
|
Principal
|
Cost
|
Fair Value
|
% of Net Assets
|
|||||||||||||||||
|
Wired, LLC and Moulison North Corporation
|
Specialty Trade Contractors
|
Term Loan
|
Prime plus 2.75%
|
6/30/2024
|
|
500.0
|
|
484.4
|
|
419.1
|
|
0.25
|
%
|
||||||||||||
|
AMG Holding, LLC and Stetson Automotive, Inc.
|
Repair and Maintenance
|
Term Loan
|
Prime plus 2.75%
|
6/30/2039
|
|
208.0
|
|
206.5
|
|
206.3
|
|
0.12
|
%
|
||||||||||||
|
Lisle Lincoln II Limited Partnership dba Lisle Lanes LP
|
Amusement, Gambling, and Recreation Industries
|
Term Loan
|
Prime plus 2.75%
|
6/30/2024
|
|
100.0
|
|
96.9
|
|
92.5
|
|
0.06
|
%
|
||||||||||||
|
Highway Striping Inc.
|
Heavy and Civil Engineering Construction
|
Term Loan
|
Prime plus 2.75%
|
6/30/2024
|
|
53.1
|
|
51.5
|
|
43.1
|
|
0.03
|
%
|
||||||||||||
|
FHJE Ventures, LLC and Eisenreich II Inc. dba Breakneck Tavern
|
Food Services and Drinking Places
|
Term Loan
|
Prime plus 2.75%
|
6/27/2039
|
|
321.8
|
|
319.6
|
|
303.4
|
|
0.18
|
%
|
||||||||||||
|
JPM Investments, LLC and Carolina Family Foot Care P.A.
|
Ambulatory Health Care Services
|
Term Loan
|
Prime plus 2.75%
|
6/26/2039
|
|
136.1
|
|
135.5
|
|
130.5
|
|
0.08
|
%
|
||||||||||||
|
Zinger Hardware and General Merchant Inc.
|
Building Material and Garden Equipment and Supplies Dealers
|
Term Loan
|
Prime plus 2.75%
|
6/26/2024
|
|
110.5
|
|
107.1
|
|
94.9
|
|
0.06
|
%
|
||||||||||||
|
Nikobella Properties, LLC and JPO Inc. dba Village Car Wash
|
Repair and Maintenance
|
Term Loan
|
Prime plus 2.75%
|
6/25/2039
|
|
476.3
|
|
472.8
|
|
451.7
|
|
0.27
|
%
|
||||||||||||
|
RDJ Maayaa Inc. dba RDJ Distributors
|
Merchant Wholesalers, Nondurable Goods
|
Term Loan
|
Prime plus 2.75%
|
6/23/2024
|
|
8.7
|
|
8.3
|
|
6.7
|
|
—
|
%
|
||||||||||||
|
Big Sky Plaza, LLC and Strickland, Incorporated
|
Building Material and Garden Equipment and Supplies Dealers
|
Term Loan
|
Prime plus 2.75%
|
6/20/2039
|
|
233.4
|
|
231.7
|
|
220.0
|
|
0.13
|
%
|
||||||||||||
|
510 ROK Realty, LLC dba ROK Health and Fitness
|
Amusement, Gambling, and Recreation Industries
|
Term Loan
|
Prime plus 2.75%
|
6/19/2024
|
|
332.0
|
|
322.2
|
|
304.3
|
|
0.18
|
%
|
||||||||||||
|
Nirvi Enterprises, LLC dba Howard Johnson / Knights Inn
|
Accommodation
|
Term Loan
|
Prime plus 2.75%
|
6/17/2039
|
|
920.3
|
|
913.5
|
|
912.5
|
|
0.55
|
%
|
||||||||||||
|
Hotels of North Georgia, LLC dba Comfort Inn and Suites
|
Accommodation
|
Term Loan
|
Prime plus 2.75%
|
6/17/2039
|
|
837.5
|
|
831.4
|
|
825.4
|
|
0.50
|
%
|
||||||||||||
|
Global Educational Delivery Services, LLC
|
Educational Services
|
Term Loan
|
Prime plus 2.75%
|
6/16/2024
|
|
60.0
|
|
58.3
|
|
57.3
|
|
0.03
|
%
|
||||||||||||
|
GPG Real Estate Holdings, LLC and GPG Enterprises Inc.
|
Professional, Scientific, and Technical Services
|
Term Loan
|
Prime plus 2.75%
|
6/13/2039
|
|
322.1
|
|
319.7
|
|
299.2
|
|
0.18
|
%
|
||||||||||||
|
Rainbow Dry Cleaners
|
Personal and Laundry Services
|
Term Loan
|
Prime plus 2.75%
|
6/13/2024
|
|
122.5
|
|
118.7
|
|
100.1
|
|
0.06
|
%
|
||||||||||||
|
GPG Real Estate Holdings, LLC (OC) GPG Enterprises Inc.
|
Professional, Scientific, and Technical Services
|
Term Loan
|
Prime plus 2.75%
|
6/13/2039
|
|
162.5
|
|
40.4
|
|
40.4
|
|
0.02
|
%
|
||||||||||||
|
NVR Corporation dba Discount Food Mart
|
Food and Beverage Stores
|
Term Loan
|
Prime plus 2.75%
|
6/11/2039
|
|
68.3
|
|
67.5
|
|
67.4
|
|
0.04
|
%
|
||||||||||||
|
Sico & Walsh Insurance Agency Inc. and The AMS Trust
|
Insurance Carriers and Related Activities
|
Term Loan
|
Prime plus 2.75%
|
6/6/2039
|
|
250.0
|
|
249.2
|
|
232.9
|
|
0.14
|
%
|
||||||||||||
F-18
|
Portfolio Company
|
Industry
|
Type of Investment
|
Interest Rate
(2)
|
Maturity
|
Principal
|
Cost
|
Fair Value
|
% of Net Assets
|
|||||||||||||||||
|
Sujata Inc. dba Stop N Save Food Mart
|
Food and Beverage Stores
|
Term Loan
|
Prime plus 2.75%
|
6/3/2024
|
|
22.5
|
|
21.8
|
|
18.0
|
|
0.01
|
%
|
||||||||||||
|
Long Island Barber Institute Inc.
|
Educational Services
|
Term Loan
|
Prime plus 2.75%
|
6/2/2039
|
|
55.5
|
|
55.1
|
|
51.5
|
|
0.03
|
%
|
||||||||||||
|
CJR LLC (EPC) and PowerWash Plus, Inc. (OC)
|
Repair and Maintenance
|
Term Loan
|
Prime plus 2.75%
|
5/30/2024
|
|
53.0
|
|
51.0
|
|
46.6
|
|
0.03
|
%
|
||||||||||||
|
Pocono Coated Products, LLC
|
Printing and Related Support Activities
|
Term Loan
|
Prime plus 2.75%
|
5/30/2024
|
|
22.5
|
|
21.7
|
|
19.9
|
|
0.01
|
%
|
||||||||||||
|
R. A. Johnson, Inc. dba Rick Johnson Auto & Tire
|
Motor Vehicle and Parts Dealers
|
Term Loan
|
Prime plus 2.75%
|
5/29/2039
|
|
943.8
|
|
935.8
|
|
934.7
|
|
0.56
|
%
|
||||||||||||
|
Wilton Dental Care P.C.
|
Ambulatory Health Care Services
|
Term Loan
|
Prime plus 2.75%
|
5/29/2024
|
|
128.1
|
|
125.6
|
|
100.4
|
|
0.06
|
%
|
||||||||||||
|
EGM Food Services Inc. dba Gold Star Chili
|
Food Services and Drinking Places
|
Term Loan
|
Prime plus 2.75%
|
5/29/2024
|
|
19.2
|
|
18.5
|
|
15.4
|
|
0.01
|
%
|
||||||||||||
|
Jonesboro Health Food Center, LLC
|
Health and Personal Care Stores
|
Term Loan
|
Prime plus 2.75%
|
5/27/2024
|
|
60.0
|
|
57.8
|
|
45.7
|
|
0.03
|
%
|
||||||||||||
|
USI Properties, LLC dba U Store It
|
Real Estate
|
Term Loan
|
Prime plus 2.75%
|
5/23/2039
|
|
144.6
|
|
143.4
|
|
141.0
|
|
0.08
|
%
|
||||||||||||
|
Bay State Funeral Services, LLC (EPC) and Riley Funeral Home Inc.(OC)
|
Personal and Laundry Services
|
Term Loan
|
Prime plus 2.75%
|
5/21/2039
|
|
134.9
|
|
134.1
|
|
133.9
|
|
0.08
|
%
|
||||||||||||
|
Hae M. and Jin S. Park dba Buford Car Wash
|
Repair and Maintenance
|
Term Loan
|
Prime plus 2.75%
|
5/15/2039
|
|
166.5
|
|
164.3
|
|
151.0
|
|
0.09
|
%
|
||||||||||||
|
Moochie's, LLC
|
Food Services and Drinking Places
|
Term Loan
|
Prime plus 2.75%
|
5/13/2024
|
|
100.5
|
|
97.9
|
|
79.3
|
|
0.05
|
%
|
||||||||||||
|
The River Beas, LLC and Punam Singh
|
Food Services and Drinking Places
|
Term Loan
|
Prime plus 2.75%
|
5/8/2039
|
|
90.3
|
|
89.5
|
|
84.8
|
|
0.05
|
%
|
||||||||||||
|
AS Boyals, LLC dba Towne Liquors
|
Food and Beverage Stores
|
Term Loan
|
Prime plus 2.75%
|
4/29/2039
|
|
117.5
|
|
116.3
|
|
116.2
|
|
0.07
|
%
|
||||||||||||
|
Winter Ventures Inc. and 214 N Franklin LLC
|
Nonstore Retailers
|
Term Loan
|
Prime plus 2.75%
|
4/29/2024
|
|
62.6
|
|
59.9
|
|
53.0
|
|
0.03
|
%
|
||||||||||||
|
ENI Inc., Event Networks Inc., ENI Worldwide, LLC and Spot Shop Inc.
|
Professional, Scientific, and Technical Services
|
Term Loan
|
Prime plus 2.75%
|
4/25/2024
|
|
500.0
|
|
478.1
|
|
376.8
|
|
0.23
|
%
|
||||||||||||
|
Gerami Realty, LC (EPC) Sherrill Universal City Corral, LP
|
Food Services and Drinking Places
|
Term Loan
|
Prime plus 2.75%
|
4/23/2027
|
|
78.8
|
|
76.4
|
|
73.4
|
|
0.04
|
%
|
||||||||||||
|
Complete Body & Paint, Inc.
|
Repair and Maintenance
|
Term Loan
|
Prime plus 2.75%
|
4/23/2039
|
|
20.8
|
|
20.6
|
|
20.5
|
|
0.01
|
%
|
||||||||||||
|
Island Wide Realty, LLC and Long Island Partners, Inc.
|
Real Estate
|
Term Loan
|
Prime plus 2.75%
|
4/22/2039
|
|
103.8
|
|
102.7
|
|
102.6
|
|
0.06
|
%
|
||||||||||||
|
Aiello's Pizzeria, LLC
|
Food Services and Drinking Places
|
Term Loan
|
Prime plus 2.75%
|
4/18/2024
|
|
42.8
|
|
40.9
|
|
34.0
|
|
0.02
|
%
|
||||||||||||
|
Wilshire Media Systems Inc.
|
Specialty Trade Contractors
|
Term Loan
|
Prime plus 2.75%
|
4/17/2024
|
|
186.3
|
|
178.1
|
|
145.5
|
|
0.09
|
%
|
||||||||||||
|
Family Ties Supply Corp. dba Best Cookies & More dba Cookie Factory Out
|
Merchant Wholesalers, Nondurable Goods
|
Term Loan
|
Prime plus 2.75%
|
4/16/2024
|
|
53.1
|
|
50.8
|
|
39.8
|
|
0.02
|
%
|
||||||||||||
F-19
|
Portfolio Company
|
Industry
|
Type of Investment
|
Interest Rate
(2)
|
Maturity
|
Principal
|
Cost
|
Fair Value
|
% of Net Assets
|
|||||||||||||||||
|
R2 Tape Inc. dba Presto Tape
|
Merchant Wholesalers, Nondurable Goods
|
Term Loan
|
Prime plus 2.75%
|
4/10/2024
|
|
78.8
|
|
75.3
|
|
74.0
|
|
0.04
|
%
|
||||||||||||
|
1899 Tavern & Tap, LLC and Ale House Tavern & Tap, LLC
|
Food Services and Drinking Places
|
Term Loan
|
Prime plus 2.75%
|
4/9/2039
|
|
137.5
|
|
135.2
|
|
130.7
|
|
0.08
|
%
|
||||||||||||
|
Eagle Aggregate Transportation, LLC and Eagle Pneumatic Transport, LLC
|
Truck Transportation
|
Term Loan
|
Prime plus 2.75%
|
3/31/2024
|
|
1,250.0
|
|
712.3
|
|
689.3
|
|
0.41
|
%
|
||||||||||||
|
Hodges Properties, LLC and Echelon Enterprises Inc. dba Treads Bicycle
|
Sporting Goods, Hobby, Musical Instrument, and Book Stores
|
Term Loan
|
Prime plus 2.75%
|
3/31/2039
|
|
449.0
|
|
443.7
|
|
427.6
|
|
0.26
|
%
|
||||||||||||
|
Dantanna's Tavern, LLC
|
Food Services and Drinking Places
|
Term Loan
|
Prime plus 2.75%
|
6/30/2024
|
|
164.3
|
|
158.2
|
|
133.2
|
|
0.08
|
%
|
||||||||||||
|
RDT Enterprises, LLC
|
Specialty Trade Contractors
|
Term Loan
|
Prime plus 2.75%
|
12/31/2028
|
|
141.2
|
|
137.1
|
|
135.6
|
|
0.08
|
%
|
||||||||||||
|
Kemmer, LLC (EPC) and Pitts Package Store, Inc.(OC)
|
Food and Beverage Stores
|
Term Loan
|
Prime plus 2.75%
|
3/31/2039
|
|
117.5
|
|
116.3
|
|
99.7
|
|
0.06
|
%
|
||||||||||||
|
Little People's Village II, LLC (OC) and Iliopoulos Realty, LLC (EPC)
|
Social Assistance
|
Term Loan
|
Prime plus 2.75%
|
3/31/2039
|
|
101.5
|
|
100.9
|
|
91.1
|
|
0.05
|
%
|
||||||||||||
|
Little People's Village II, LLC (OC) and Iliopoulos Realty, LLC (EPC)
|
Social Assistance
|
Term Loan
|
Prime plus 2.75%
|
3/31/2039
|
|
92.1
|
|
91.5
|
|
82.6
|
|
0.05
|
%
|
||||||||||||
|
Wilban, LLC
|
Food Services and Drinking Places
|
Term Loan
|
Prime plus 2.75%
|
3/28/2039
|
|
427.5
|
|
422.5
|
|
403.8
|
|
0.24
|
%
|
||||||||||||
|
Lake Area Autosound, LLC and Ryan H. Whittington
|
Motor Vehicle and Parts Dealers
|
Term Loan
|
Prime plus 2.75%
|
7/28/2039
|
|
125.0
|
|
125.0
|
|
116.8
|
|
0.07
|
%
|
||||||||||||
|
TC Business Enterprises, LLC dba Sky Zone Indoor Trampoline Park
|
Amusement, Gambling, and Recreation Industries
|
Term Loan
|
Prime plus 2.75%
|
3/27/2024
|
|
290.1
|
|
280.8
|
|
229.0
|
|
0.14
|
%
|
||||||||||||
|
Sapienzo Properties, LLC (EPC) CNS Self-Storage Inc. (OC)
|
Real Estate
|
Term Loan
|
Prime plus 2.75%
|
3/27/2039
|
|
193.8
|
|
190.6
|
|
190.4
|
|
0.11
|
%
|
||||||||||||
|
Hascher Gabelstapler Inc.
|
Repair and Maintenance
|
Term Loan
|
Prime plus 2.75%
|
3/26/2024
|
|
143.3
|
|
136.1
|
|
122.5
|
|
0.07
|
%
|
||||||||||||
|
Knowledge First Inc. dba Magic Years of Learning and Kimberly Knox
|
Social Assistance
|
Term Loan
|
Prime plus 2.75%
|
3/21/2039
|
|
145.0
|
|
143.5
|
|
132.2
|
|
0.08
|
%
|
||||||||||||
|
636 South Center Holdings, LLC and New Mansfield Brass and Aluminum Co.
|
Primary Metal Manufacturing
|
Term Loan
|
Prime plus 2.75%
|
3/20/2039
|
|
497.5
|
|
491.5
|
|
490.9
|
|
0.29
|
%
|
||||||||||||
|
Cormac Enterprises and Wyoming Valley Beverage Incorporated
|
Food and Beverage Stores
|
Term Loan
|
Prime plus 2.75%
|
3/20/2039
|
|
110.8
|
|
109.6
|
|
109.5
|
|
0.07
|
%
|
||||||||||||
|
Kinisi, Inc. dba The River North UPS Store
|
Administrative and Support Services
|
Term Loan
|
Prime plus 2.75%
|
3/18/2024
|
|
41.3
|
|
38.4
|
|
33.8
|
|
0.02
|
%
|
||||||||||||
|
Tortilla King, Inc.
|
Food Manufacturing
|
Term Loan
|
Prime plus 2.75%
|
3/14/2029
|
|
1,033.1
|
|
1,011.0
|
|
903.2
|
|
0.54
|
%
|
||||||||||||
|
SE Properties 39 Old Route 146, LLC (EPC) SmartEarly Clifton Park, LLC
|
Social Assistance
|
Term Loan
|
Prime plus 2.75%
|
3/14/2039
|
|
408.0
|
|
404.4
|
|
400.5
|
|
0.24
|
%
|
||||||||||||
|
Tortilla King Inc.
|
Food Manufacturing
|
Term Loan
|
Prime plus 2.75%
|
3/14/2039
|
|
216.9
|
|
214.3
|
|
193.3
|
|
0.12
|
%
|
||||||||||||
F-20
|
Portfolio Company
|
Industry
|
Type of Investment
|
Interest Rate
(2)
|
Maturity
|
Principal
|
Cost
|
Fair Value
|
% of Net Assets
|
|||||||||||||||||
|
Bowl Mor, LLC dba Bowl Mor Lanes and Spare Lounge, Inc.
|
Amusement, Gambling, and Recreation Industries
|
Term Loan
|
Prime plus 2.75%
|
3/13/2039
|
|
223.5
|
|
220.9
|
|
220.6
|
|
0.13
|
%
|
||||||||||||
|
Avayaan2, LLC dba Island Cove
|
Gasoline Stations
|
Term Loan
|
Prime plus 2.75%
|
3/7/2039
|
|
157.5
|
|
155.6
|
|
148.6
|
|
0.09
|
%
|
||||||||||||
|
Onofrio's Fresh Cut Inc.
|
Merchant Wholesalers, Nondurable Goods
|
Term Loan
|
Prime plus 2.75%
|
3/6/2024
|
|
75.0
|
|
71.4
|
|
65.7
|
|
0.04
|
%
|
||||||||||||
|
J&M Concessions, Inc.dba A-1 Liquors
|
Food and Beverage Stores
|
Term Loan
|
Prime plus 2.75%
|
3/3/2039
|
|
135.6
|
|
134.0
|
|
120.8
|
|
0.07
|
%
|
||||||||||||
|
R & R Boyal, LLC dba Cap N Cat Clam Bar and Little Ease Tavern
|
Food and Beverage Stores
|
Term Loan
|
Prime plus 2.75%
|
2/28/2039
|
|
417.5
|
|
412.1
|
|
386.2
|
|
0.23
|
%
|
||||||||||||
|
Summit Beverage Group, LLC
|
Beverage and Tobacco Product Manufacturing
|
Term Loan
|
Prime plus 2.75%
|
2/28/2024
|
|
350.6
|
|
330.8
|
|
293.6
|
|
0.18
|
%
|
||||||||||||
|
Faith Memorial Chapel, LLC
|
Personal and Laundry Services
|
Term Loan
|
Prime plus 2.75%
|
2/28/2039
|
|
214.2
|
|
211.4
|
|
194.6
|
|
0.12
|
%
|
||||||||||||
|
952 Boston Post Road Realty, LLC and HNA, LLC dba Styles International
|
Personal and Laundry Services
|
Term Loan
|
Prime plus 2.75%
|
2/28/2039
|
|
211.0
|
|
208.3
|
|
192.3
|
|
0.12
|
%
|
||||||||||||
|
Choe Trade Group Inc. dba Rapid Printers of Monterey
|
Printing and Related Support Activities
|
Term Loan
|
Prime plus 2.75%
|
2/28/2024
|
|
159.3
|
|
150.3
|
|
143.1
|
|
0.09
|
%
|
||||||||||||
|
Pindar Associates, LLC, Pidar Vineyards, LLC, Duck Walk Vineyards Inc.
|
Beverage and Tobacco Product Manufacturing
|
Term Loan
|
Prime plus 2.75%
|
2/25/2024
|
|
712.3
|
|
672.0
|
|
659.9
|
|
0.40
|
%
|
||||||||||||
|
96 Mill Street, LLC, Central Pizza, LLC and Jason Bikakis George Bikaki
|
Food Services and Drinking Places
|
Term Loan
|
Prime plus 2.75%
|
2/12/2039
|
|
141.3
|
|
139.4
|
|
139.2
|
|
0.08
|
%
|
||||||||||||
|
JWB Industries, Inc. dba Carteret Die Casting
|
Primary Metal Manufacturing
|
Term Loan
|
Prime plus 2.75%
|
2/11/2024
|
|
280.0
|
|
264.1
|
|
217.5
|
|
0.13
|
%
|
||||||||||||
|
Sovereign Communications, LLC
|
Broadcasting (except Internet)
|
Term Loan
|
Prime plus 2.75%
|
2/7/2024
|
|
907.8
|
|
856.3
|
|
688.8
|
|
0.41
|
%
|
||||||||||||
|
986 Dixwell Avenue Holding Company, LLC(EPC) and Mughali Foods, LLC
|
Food Services and Drinking Places
|
Term Loan
|
Prime plus 2.75%
|
2/7/2039
|
|
99.1
|
|
98.2
|
|
93.5
|
|
0.06
|
%
|
||||||||||||
|
Awesome Pets II Inc. dba Mellisa's Pet Depot
|
Miscellaneous Store Retailers
|
Term Loan
|
Prime plus 2.75%
|
2/7/2024
|
|
83.2
|
|
79.5
|
|
66.1
|
|
0.04
|
%
|
||||||||||||
|
Robert Star Inc.
|
Specialty Trade Contractors
|
Term Loan
|
Prime plus 2.75%
|
2/5/2024
|
|
46.8
|
|
44.2
|
|
43.4
|
|
0.03
|
%
|
||||||||||||
|
Atlas Mountain Construction, LLC
|
Construction of Buildings
|
Term Loan
|
Prime plus 2.75%
|
1/28/2024
|
|
16.5
|
|
15.5
|
|
15.2
|
|
0.01
|
%
|
||||||||||||
|
Sarah Sibadan dba Sibadan Agency
|
Insurance Carriers and Related Activities
|
Term Loan
|
Prime plus 2.75%
|
1/27/2039
|
|
129.4
|
|
127.5
|
|
124.3
|
|
0.07
|
%
|
||||||||||||
|
3Fmanagement, LLC and ATC Fitness Cape Coral, LLC
|
Amusement, Gambling, and Recreation Industries
|
Term Loan
|
Prime plus 2.75%
|
1/24/2024
|
|
425.0
|
|
398.2
|
|
334.1
|
|
0.20
|
%
|
||||||||||||
|
JDR Industries Inc dba CST-The Composites Store
|
Merchant Wholesalers, Durable Goods
|
Term Loan
|
Prime plus 2.75%
|
1/21/2024
|
|
140.3
|
|
131.4
|
|
112.4
|
|
0.07
|
%
|
||||||||||||
|
Icore Enterprises Inc. dba Air Flow Filters Inc.
|
Miscellaneous Manufacturing
|
Term Loan
|
Prime plus 2.75%
|
1/15/2024
|
|
21.8
|
|
20.4
|
|
20.0
|
|
0.01
|
%
|
||||||||||||
F-21
|
Portfolio Company
|
Industry
|
Type of Investment
|
Interest Rate
(2)
|
Maturity
|
Principal
|
Cost
|
Fair Value
|
% of Net Assets
|
|||||||||||||||||
|
Nutmeg North Associates, LLC (OC) Steeltech Building Products Inc.
|
Construction of Buildings
|
Term Loan
|
Prime plus 2.75%
|
12/31/2038
|
|
897.8
|
|
883.5
|
|
814.7
|
|
0.49
|
%
|
||||||||||||
|
Carl R. Bieber, Inc. dba Bieber Tourways/Bieber Transportation
|
Transit and Ground Passenger Transportation
|
Term Loan
|
Prime plus 2.75%
|
9/30/2027
|
|
712.5
|
|
692.9
|
|
675.7
|
|
0.41
|
%
|
||||||||||||
|
S.Drake, LLC dba Express Employment Professionals of Ann Arbor, Michigan
|
Administrative and Support Services
|
Term Loan
|
Prime plus 2.75%
|
12/31/2023
|
|
18.8
|
|
17.8
|
|
14.2
|
|
0.01
|
%
|
||||||||||||
|
CLU Amboy, LLC (EPC) and Amboy Group, LLC (OC) dba Tommy Moloney's
|
Food Manufacturing
|
Term Loan
|
Prime plus 2.75%
|
12/27/2023
|
|
656.3
|
|
620.0
|
|
608.6
|
|
0.37
|
%
|
||||||||||||
|
Shane M. Howell and Buck Hardware and Garden Center, LLC
|
Building Material and Garden Equipment and Supplies Dealers
|
Term Loan
|
Prime plus 2.75%
|
12/27/2038
|
|
322.5
|
|
317.2
|
|
289.5
|
|
0.17
|
%
|
||||||||||||
|
Superior Disposal Service, Inc.
|
Waste Management and Remediation Services
|
Term Loan
|
Prime plus 2.75%
|
12/26/2023
|
|
240.5
|
|
223.8
|
|
206.3
|
|
0.12
|
%
|
||||||||||||
|
KK International Trading Corporation
|
Merchant Wholesalers, Nondurable Goods
|
Term Loan
|
Prime plus 2.75%
|
12/23/2028
|
|
190.0
|
|
182.6
|
|
169.9
|
|
0.10
|
%
|
||||||||||||
|
AIP Enterprises, LLC and Spider's Web Inc dba Black Widow Harley-Davidson
|
Motor Vehicle and Parts Dealers
|
Term Loan
|
Prime plus 2.75%
|
12/20/2038
|
|
962.5
|
|
946.7
|
|
936.7
|
|
0.56
|
%
|
||||||||||||
|
JackRabbit Sports Inc.
|
Clothing and Clothing Accessories Stores
|
Term Loan
|
Prime plus 2.75%
|
12/20/2023
|
|
581.3
|
|
535.9
|
|
526.0
|
|
0.32
|
%
|
||||||||||||
|
Mosley Auto Group, LLC dba America's Automotive
|
Repair and Maintenance
|
Term Loan
|
Prime plus 2.75%
|
12/20/2038
|
|
221.5
|
|
217.9
|
|
212.2
|
|
0.13
|
%
|
||||||||||||
|
Kurtis Sniezek dba Wolfe's Foreign Auto
|
Repair and Maintenance
|
Term Loan
|
Prime plus 2.75%
|
12/20/2038
|
|
88.9
|
|
87.4
|
|
87.3
|
|
0.05
|
%
|
||||||||||||
|
PLES Investements, LLC and John Redder, Pappy Sand & Gravel, Inc.
|
Specialty Trade Contractors
|
Term Loan
|
Prime plus 2.75%
|
12/19/2038
|
|
555.3
|
|
546.2
|
|
508.3
|
|
0.31
|
%
|
||||||||||||
|
Lefont Theaters Inc.
|
Performing Arts, Spectator Sports, and Related Industries
|
Term Loan
|
Prime plus 2.75%
|
12/19/2023
|
|
14.4
|
|
13.4
|
|
11.6
|
|
0.01
|
%
|
||||||||||||
|
TAK Properties, LLC and Kinderland Inc.
|
Social Assistance
|
Term Loan
|
Prime plus 2.75%
|
12/18/2038
|
|
405.0
|
|
398.4
|
|
373.6
|
|
0.22
|
%
|
||||||||||||
|
Any Garment Cleaner-East Brunswick, Inc.
|
Personal and Laundry Services
|
Term Loan
|
Prime plus 2.75%
|
12/18/2023
|
|
53.8
|
|
50.0
|
|
46.0
|
|
0.03
|
%
|
||||||||||||
|
TOL, LLC dba Wild Birds Unlimited
|
Sporting Goods, Hobby, Musical Instrument, and Book Stores
|
Term Loan
|
Prime plus 2.75%
|
12/13/2023
|
|
18.0
|
|
17.3
|
|
14.8
|
|
0.01
|
%
|
||||||||||||
|
8 Minute Oil Change of Springfield Corporation and John Nino
|
Repair and Maintenance
|
Term Loan
|
Prime plus 2.75%
|
12/12/2038
|
|
196.8
|
|
193.1
|
|
188.5
|
|
0.11
|
%
|
||||||||||||
|
920 CHR Realty, LLC (EPC) V. Garofalo Carting Inc (OC)
|
Waste Management and Remediation Services
|
Term Loan
|
Prime plus 2.75%
|
12/10/2038
|
|
418.1
|
|
411.3
|
|
410.6
|
|
0.25
|
%
|
||||||||||||
|
DKB Transport Corp.
|
Truck Transportation
|
Term Loan
|
Prime plus 2.75%
|
12/5/2038
|
|
138.8
|
|
136.5
|
|
136.3
|
|
0.08
|
%
|
||||||||||||
|
Firm Foundations Inc. David S Gaitan Jr and Christopher K Daigle
|
Specialty Trade Contractors
|
Term Loan
|
Prime plus 2.75%
|
12/3/2023
|
|
545.8
|
|
507.7
|
|
441.3
|
|
0.27
|
%
|
||||||||||||
F-22
|
Portfolio Company
|
Industry
|
Type of Investment
|
Interest Rate
(2)
|
Maturity
|
Principal
|
Cost
|
Fair Value
|
% of Net Assets
|
|||||||||||||||||
|
Firm Foundations Inc. David S Gaitan Jr and Christopher K Daigle
|
Specialty Trade Contractors
|
Term Loan
|
Prime plus 2.75%
|
12/3/2038
|
|
104.3
|
|
102.5
|
|
90.3
|
|
0.05
|
%
|
||||||||||||
|
Spectrum Development, LLC and Solvit Inc & Solvit North, Inc.
|
Specialty Trade Contractors
|
Term Loan
|
Prime plus 2.75%
|
12/2/2023
|
|
387.3
|
|
360.3
|
|
313.0
|
|
0.19
|
%
|
||||||||||||
|
BVIP Limousine Service, LTD
|
Transit and Ground Passenger Transportation
|
Term Loan
|
Prime plus 2.75%
|
11/27/2038
|
|
76.5
|
|
75.1
|
|
72.4
|
|
0.04
|
%
|
||||||||||||
|
Eco-Green Reprocessing, LLC and Denali Medical Concepts, LLC
|
Miscellaneous Manufacturing
|
Term Loan
|
Prime plus 2.75%
|
11/27/2023
|
|
67.2
|
|
62.1
|
|
50.6
|
|
0.03
|
%
|
||||||||||||
|
TNDV: Television, LLC
|
Broadcasting (except Internet)
|
Term Loan
|
Prime plus 2.75%
|
11/26/2038
|
|
253.8
|
|
249.2
|
|
234.9
|
|
0.14
|
%
|
||||||||||||
|
Veterinary Imaging Specialists of Alaska, LLC
|
Professional, Scientific, and Technical Services
|
Term Loan
|
Prime plus 2.75%
|
11/26/2023
|
|
162.6
|
|
155.0
|
|
144.4
|
|
0.09
|
%
|
||||||||||||
|
Wallace Holdings, LLC (EPC) GFA International Inc. (OC)
|
Professional, Scientific, and Technical Services
|
Term Loan
|
Prime plus 2.5%
|
11/25/2023
|
|
125.0
|
|
115.4
|
|
92.8
|
|
0.06
|
%
|
||||||||||||
|
AcuCall, LLC
|
Professional, Scientific, and Technical Services
|
Term Loan
|
Prime plus 2.75%
|
11/21/2023
|
|
15.8
|
|
14.7
|
|
11.6
|
|
0.01
|
%
|
||||||||||||
|
Seven Peaks Mining Inc. and Cornerstone Industrial Minerals Corporation
|
Mining (except Oil and Gas)
|
Term Loan
|
Prime plus 2.75%
|
11/18/2038
|
|
1,250.0
|
|
1,227.8
|
|
1,064.3
|
|
0.64
|
%
|
||||||||||||
|
Kids in Motion of Springfield, LLC dba The Little Gym of Springfield, IL
|
Amusement, Gambling, and Recreation Industries
|
Term Loan
|
Prime plus 2.75%
|
11/18/2023
|
|
45.0
|
|
42.3
|
|
34.5
|
|
0.02
|
%
|
||||||||||||
|
Kup's Auto Spa Inc.
|
Repair and Maintenance
|
Term Loan
|
Prime plus 2.75%
|
11/15/2038
|
|
396.7
|
|
390.0
|
|
382.7
|
|
0.23
|
%
|
||||||||||||
|
Yousef Khatib dba Y&M Enterprises
|
Wholesale Electronic Markets and Agents and Brokers
|
Term Loan
|
Prime plus 2.75%
|
11/15/2023
|
|
75.0
|
|
69.3
|
|
56.7
|
|
0.03
|
%
|
||||||||||||
|
River Run Personnel, LLC dba Express Employment Professionals
|
Administrative and Support Services
|
Term Loan
|
Prime plus 2.75%
|
11/15/2023
|
|
20.0
|
|
1.2
|
|
1.2
|
|
—
|
%
|
||||||||||||
|
Howell Gun Works, LLC
|
Sporting Goods, Hobby, Musical Instrument, and Book Stores
|
Term Loan
|
Prime plus 2.75%
|
11/14/2023
|
|
8.3
|
|
7.7
|
|
6.1
|
|
—
|
%
|
||||||||||||
|
Armin and Kian Inc. dba The UPS Store 3714
|
Couriers and Messengers
|
Term Loan
|
Prime plus 2.75%
|
11/13/2023
|
|
56.5
|
|
52.2
|
|
41.0
|
|
0.02
|
%
|
||||||||||||
|
Polpo Realty, LLC (EPC) Polpo Restaurant, LLC (OC)
|
Food Services and Drinking Places
|
Term Loan
|
Prime plus 2.75%
|
11/6/2038
|
|
62.5
|
|
61.6
|
|
61.5
|
|
0.04
|
%
|
||||||||||||
|
Twinsburg Hospitality Group, LLC dba Comfort Suites
|
Accommodation
|
Term Loan
|
Prime plus 2.75%
|
10/31/2038
|
|
945.0
|
|
928.1
|
|
862.6
|
|
0.52
|
%
|
||||||||||||
|
Master CNC Inc. & Master Properties, LLC
|
Professional, Scientific, and Technical Services
|
Term Loan
|
Prime plus 2.75%
|
10/31/2038
|
|
596.6
|
|
585.0
|
|
524.2
|
|
0.31
|
%
|
||||||||||||
|
1 North Restaurant Corp. dba 1 North Steakhouse
|
Food Services and Drinking Places
|
Term Loan
|
Prime plus 2.75%
|
10/31/2038
|
|
212.5
|
|
208.4
|
|
202.4
|
|
0.12
|
%
|
||||||||||||
|
Mid-Land Sheet Metal Inc.
|
Specialty Trade Contractors
|
Term Loan
|
Prime plus 2.75%
|
10/31/2038
|
|
137.5
|
|
135.0
|
|
129.9
|
|
0.08
|
%
|
||||||||||||
F-23
|
Portfolio Company
|
Industry
|
Type of Investment
|
Interest Rate
(2)
|
Maturity
|
Principal
|
Cost
|
Fair Value
|
% of Net Assets
|
|||||||||||||||||
|
Logistics Business Solutions Inc. dba The UPS Store
|
Administrative and Support Services
|
Term Loan
|
Prime plus 2.75%
|
10/31/2023
|
|
50.0
|
|
46.5
|
|
41.8
|
|
0.03
|
%
|
||||||||||||
|
Janice B. McShan and The Metropolitan Day School, LLC
|
Social Assistance
|
Term Loan
|
Prime plus 2.75%
|
10/31/2023
|
|
42.8
|
|
40.4
|
|
38.5
|
|
0.02
|
%
|
||||||||||||
|
Meridian Hotels, LLC dba Best Western Jonesboro
|
Accommodation
|
Term Loan
|
Prime plus 2.75%
|
10/29/2038
|
|
664.5
|
|
650.4
|
|
644.4
|
|
0.39
|
%
|
||||||||||||
|
New Image Building Services Inc. dba New Image Repair Services
|
Repair and Maintenance
|
Term Loan
|
Prime plus 2.75%
|
10/29/2023
|
|
331.3
|
|
303.9
|
|
254.1
|
|
0.15
|
%
|
||||||||||||
|
A-1 Quality Services Corporation
|
Administrative and Support Services
|
Term Loan
|
Prime plus 2.75%
|
10/29/2023
|
|
8.9
|
|
8.1
|
|
6.4
|
|
—
|
%
|
||||||||||||
|
Clairvoyant Realty Corp. and Napoli Marble & Granite Design, Ltd
|
Specialty Trade Contractors
|
Term Loan
|
Prime plus 2.75%
|
10/24/2038
|
|
246.3
|
|
241.5
|
|
221.1
|
|
0.13
|
%
|
||||||||||||
|
Greenbrier Technical Services, Inc.
|
Repair and Maintenance
|
Term Loan
|
Prime plus 2.75%
|
10/24/2023
|
|
240.1
|
|
221.6
|
|
208.6
|
|
0.13
|
%
|
||||||||||||
|
Kelly Auto Care LLC dba Shoreline Quick Lube and Car Wash
|
Repair and Maintenance
|
Term Loan
|
Prime plus 2.75%
|
10/18/2023
|
|
87.5
|
|
80.3
|
|
67.2
|
|
0.04
|
%
|
||||||||||||
|
KenBro Enterprises LLC dba Hearing Aids by Zounds-Cherry Hill
|
Health and Personal Care Stores
|
Term Loan
|
Prime plus 2.75%
|
10/18/2023
|
|
25.8
|
|
23.6
|
|
21.3
|
|
0.01
|
%
|
||||||||||||
|
Shepher Distr's and Sales Corp and The Lederer Industries Inc.
|
Merchant Wholesalers, Durable Goods
|
Term Loan
|
Prime plus 2.75%
|
9/30/2023
|
|
1,050.0
|
|
956.4
|
|
938.7
|
|
0.56
|
%
|
||||||||||||
|
Fieldstone Quick Stop, LLC (OC) Barber Investments, LLC (EPC)
|
Gasoline Stations
|
Term Loan
|
Prime plus 2.75%
|
9/30/2038
|
|
676.3
|
|
667.1
|
|
598.7
|
|
0.36
|
%
|
||||||||||||
|
Cencon Properties, LLC and Central Connecticut Warehousing Company
|
Warehousing and Storage
|
Term Loan
|
Prime plus 2.75%
|
9/30/2038
|
|
344.5
|
|
337.8
|
|
333.3
|
|
0.20
|
%
|
||||||||||||
|
Lenoir Business Partners, LLC (EPC) LP Industries, Inc. dba Childforms
|
Plastics and Rubber Products Manufacturing
|
Term Loan
|
Prime plus 2.75%
|
9/30/2038
|
|
322.7
|
|
317.7
|
|
302.4
|
|
0.18
|
%
|
||||||||||||
|
Onofrios Enterprises, LLC (EPC) Onofrios Fresh Cut, Inc.
|
Food Manufacturing
|
Term Loan
|
Prime plus 2.75%
|
9/30/2038
|
|
312.5
|
|
306.8
|
|
294.3
|
|
0.18
|
%
|
||||||||||||
|
Discount Wheel and Tire
|
Motor Vehicle and Parts Dealers
|
Term Loan
|
Prime plus 2.75%
|
9/30/2038
|
|
223.8
|
|
219.0
|
|
204.2
|
|
0.12
|
%
|
||||||||||||
|
Top Properties, LLC and LP Industries, Inc dba Childforms
|
Plastics and Rubber Products Manufacturing
|
Term Loan
|
Prime plus 2.75%
|
9/30/2038
|
|
120.0
|
|
117.9
|
|
117.7
|
|
0.07
|
%
|
||||||||||||
|
AGS Talcott Partners, Inc.
|
Insurance Carriers and Related Activities
|
Term Loan
|
Prime plus 2.75%
|
9/30/2023
|
|
117.8
|
|
107.3
|
|
84.2
|
|
0.05
|
%
|
||||||||||||
|
First Steps Real Estate Company, LLC (EPC) and First Steps Preschool
|
Social Assistance
|
Term Loan
|
Prime plus 2.75%
|
9/30/2038
|
|
97.6
|
|
95.6
|
|
86.8
|
|
0.05
|
%
|
||||||||||||
|
Gabrielle Realty, LLC
|
Gasoline Stations
|
Term Loan
|
Prime plus 2.75%
|
9/27/2038
|
|
757.6
|
|
741.6
|
|
688.8
|
|
0.41
|
%
|
||||||||||||
|
Mitchellville Family Dentistry, Dr. Octavia Simkins-Wiseman, DDS, PC
|
Ambulatory Health Care Services
|
Term Loan
|
Prime plus 2.75%
|
9/27/2038
|
|
335.1
|
|
328.0
|
|
310.9
|
|
0.19
|
%
|
||||||||||||
|
Handy 6391, LLC dba The UPS Store #6391
|
Administrative and Support Services
|
Term Loan
|
Prime plus 2.75%
|
9/27/2023
|
|
62.5
|
|
58.3
|
|
57.3
|
|
0.03
|
%
|
||||||||||||
|
Eastside Soccer Dome, Inc.
|
Amusement, Gambling, and Recreation Industries
|
Term Loan
|
Prime plus 2.75%
|
9/26/2038
|
|
463.8
|
|
453.9
|
|
453.1
|
|
0.27
|
%
|
||||||||||||
F-24
|
Portfolio Company
|
Industry
|
Type of Investment
|
Interest Rate
(2)
|
Maturity
|
Principal
|
Cost
|
Fair Value
|
% of Net Assets
|
|||||||||||||||||
|
HJ & Edward Enterprises, LLC dba Sky Zone
|
Amusement, Gambling, and Recreation Industries
|
Term Loan
|
Prime plus 2.75%
|
9/26/2023
|
|
262.5
|
|
246.8
|
|
222.6
|
|
0.13
|
%
|
||||||||||||
|
Anthony C Dinoto and Susan S P Dinoto
|
Personal and Laundry Services
|
Term Loan
|
Prime plus 2.75%
|
9/26/2038
|
|
100.0
|
|
98.0
|
|
97.8
|
|
0.06
|
%
|
||||||||||||
|
Southeast Chicago Soccer Inc.
|
Amusement, Gambling, and Recreation Industries
|
Term Loan
|
Prime plus 2.75%
|
9/26/2038
|
|
51.3
|
|
50.2
|
|
50.1
|
|
0.03
|
%
|
||||||||||||
|
Kiddie Steps 4 You Inc.
|
Social Assistance
|
Term Loan
|
Prime plus 2.75%
|
9/25/2038
|
|
89.3
|
|
83.9
|
|
78.4
|
|
0.05
|
%
|
||||||||||||
|
Diamond Memorials Incorporated
|
Professional, Scientific, and Technical Services
|
Term Loan
|
Prime plus 2.75%
|
9/25/2023
|
|
14.3
|
|
12.8
|
|
10.0
|
|
0.01
|
%
|
||||||||||||
|
Faith Memorial Chapel, LLC
|
Personal and Laundry Services
|
Term Loan
|
Prime plus 2.75%
|
9/20/2038
|
|
268.4
|
|
262.7
|
|
249.0
|
|
0.15
|
%
|
||||||||||||
|
Serious-Fun in Alpharetta, LLC dba The Little Gym of Alpharetta
|
Educational Services
|
Term Loan
|
Prime plus 2.75%
|
9/20/2023
|
|
46.3
|
|
42.3
|
|
34.8
|
|
0.02
|
%
|
||||||||||||
|
Westville Seafood, LLC
|
Food Services and Drinking Places
|
Term Loan
|
Prime plus 2.75%
|
9/19/2038
|
|
112.3
|
|
109.9
|
|
102.7
|
|
0.06
|
%
|
||||||||||||
|
Maynard Enterprises Inc. dba Fastsigns of Texarkana
|
Miscellaneous Store Retailers
|
Term Loan
|
Prime plus 2.75%
|
9/18/2023
|
|
16.1
|
|
14.8
|
|
12.3
|
|
0.01
|
%
|
||||||||||||
|
Grafio Inc. dba Omega Learning Center-Acworth
|
Educational Services
|
Term Loan
|
Prime plus 2.75%
|
9/13/2023
|
|
156.3
|
|
142.3
|
|
118.8
|
|
0.07
|
%
|
||||||||||||
|
The Berlerro Group, LLC dba Sky Zone
|
Amusement, Gambling, and Recreation Industries
|
Term Loan
|
Prime plus 2.75%
|
9/12/2023
|
|
421.3
|
|
395.8
|
|
326.4
|
|
0.20
|
%
|
||||||||||||
|
Sound Manufacturing Inc.
|
Fabricated Metal Product Manufacturing
|
Term Loan
|
Prime plus 2.75%
|
9/12/2028
|
|
54.8
|
|
52.1
|
|
46.6
|
|
0.03
|
%
|
||||||||||||
|
Prospect Kids Academy Inc.
|
Educational Services
|
Term Loan
|
Prime plus 2.75%
|
9/11/2038
|
|
124.3
|
|
121.6
|
|
116.6
|
|
0.07
|
%
|
||||||||||||
|
Alma J. and William R. Walton (EPC) and Almas Child Day Care Center
|
Social Assistance
|
Term Loan
|
Prime plus 2.75%
|
9/11/2038
|
|
39.5
|
|
38.7
|
|
38.6
|
|
0.02
|
%
|
||||||||||||
|
B for Brunette, Inc.
|
Personal and Laundry Services
|
Term Loan
|
Prime plus 2.75%
|
9/10/2023
|
|
53.4
|
|
49.3
|
|
39.1
|
|
0.02
|
%
|
||||||||||||
|
Schmaltz Holdings, LLC (EPC) and Schmaltz Operations, LLC
|
Personal and Laundry Services
|
Term Loan
|
Prime plus 2.75%
|
9/4/2038
|
|
224.2
|
|
217.8
|
|
202.8
|
|
0.12
|
%
|
||||||||||||
|
ACI Northwest Inc.
|
Heavy and Civil Engineering Construction
|
Term Loan
|
Prime plus 2.75%
|
8/30/2023
|
|
906.3
|
|
680.0
|
|
613.9
|
|
0.37
|
%
|
||||||||||||
|
IlOKA Inc. dba Microtech Tel and NewCloud Networks
|
Professional, Scientific, and Technical Services
|
Term Loan
|
Prime plus 2.75%
|
8/30/2023
|
|
687.5
|
|
621.5
|
|
528.2
|
|
0.32
|
%
|
||||||||||||
|
Spectrum Radio Fairmont, LLC
|
Broadcasting (except Internet)
|
Term Loan
|
Prime plus 2.75%
|
8/30/2023
|
|
187.5
|
|
169.5
|
|
163.9
|
|
0.10
|
%
|
||||||||||||
|
Excel RP Inc.
|
Machinery Manufacturing
|
Term Loan
|
Prime plus 2.75%
|
8/30/2023
|
|
130.3
|
|
117.8
|
|
110.1
|
|
0.07
|
%
|
||||||||||||
|
Gulfport Academy Child Care and Learning Center, Inc.
|
Social Assistance
|
Term Loan
|
Prime plus 2.75%
|
8/30/2023
|
|
43.3
|
|
39.1
|
|
36.3
|
|
0.02
|
%
|
||||||||||||
F-25
|
Portfolio Company
|
Industry
|
Type of Investment
|
Interest Rate
(2)
|
Maturity
|
Principal
|
Cost
|
Fair Value
|
% of Net Assets
|
|||||||||||||||||
|
Mojo Brands Media, LLC
|
Broadcasting (except Internet)
|
Term Loan
|
Prime plus 2.75%
|
8/28/2023
|
|
784.0
|
|
750.1
|
|
603.7
|
|
0.36
|
%
|
||||||||||||
|
Ramard Inc and Advanced Health Sciences Inc.
|
Merchant Wholesalers, Nondurable Goods
|
Term Loan
|
Prime plus 2.75%
|
8/28/2023
|
|
187.5
|
|
169.5
|
|
133.0
|
|
0.08
|
%
|
||||||||||||
|
RM Hawkins, LLC dba Pure Water Tech West and Robert M Hawkins
|
Nonstore Retailers
|
Term Loan
|
Prime plus 2.75%
|
8/26/2023
|
|
85.8
|
|
73.6
|
|
72.3
|
|
0.04
|
%
|
||||||||||||
|
JSIL LLC dba Blackstones Hairdressing
|
Personal and Laundry Services
|
Term Loan
|
Prime plus 2.75%
|
8/16/2023
|
|
19.5
|
|
17.7
|
|
14.8
|
|
0.01
|
%
|
||||||||||||
|
Jatcoia, LLC dba Plato's Closet
|
Clothing and Clothing Accessories Stores
|
Term Loan
|
Prime plus 2.75%
|
8/15/2023
|
|
65.0
|
|
52.3
|
|
51.0
|
|
0.03
|
%
|
||||||||||||
|
Island Nautical Enterprises, Inc. (OC) and Ingwall Holdings, LLC (EPC)
|
Miscellaneous Manufacturing
|
Term Loan
|
Prime plus 2.75%
|
8/14/2038
|
|
445.0
|
|
343.0
|
|
312.3
|
|
0.19
|
%
|
||||||||||||
|
Caribbean Concepts, Inc. dba Quick Bleach
|
Ambulatory Health Care Services
|
Term Loan
|
Prime plus 2.75%
|
8/12/2023
|
|
22.5
|
|
20.5
|
|
16.7
|
|
0.01
|
%
|
||||||||||||
|
VesperGroup, LLC dba The Wine Cellar
|
Food Services and Drinking Places
|
Term Loan
|
Prime plus 2.75%
|
8/5/2023
|
|
45.0
|
|
40.7
|
|
33.9
|
|
0.02
|
%
|
||||||||||||
|
Blacknorange2, LLC dba Popeyes Louisiana Kitchen
|
Food Services and Drinking Places
|
Term Loan
|
Prime plus 2.75%
|
7/31/2023
|
|
175.0
|
|
159.1
|
|
128.9
|
|
0.08
|
%
|
||||||||||||
|
209 North 3rd Street, LLC (EPC) Yuster Insurance Group Inc. (OC)
|
Insurance Carriers and Related Activities
|
Term Loan
|
Prime plus 2.75%
|
7/29/2038
|
|
83.9
|
|
81.8
|
|
78.2
|
|
0.05
|
%
|
||||||||||||
|
Majestic Contracting Services, Inc. dba Majestic Electric
|
Specialty Trade Contractors
|
Term Loan
|
Prime plus 2.75%
|
7/26/2038
|
|
190.0
|
|
185.4
|
|
171.3
|
|
0.10
|
%
|
||||||||||||
|
Daniel W. and Erin H. Gordon and Silver Lining Stables CT, LLC
|
Amusement, Gambling, and Recreation Industries
|
Term Loan
|
Prime plus 2.75%
|
7/24/2023
|
|
11.3
|
|
10.1
|
|
9.9
|
|
0.01
|
%
|
||||||||||||
|
Angkor Restaurant Inc.
|
Food Services and Drinking Places
|
Term Loan
|
Prime plus 2.75%
|
7/19/2038
|
|
93.0
|
|
90.8
|
|
88.3
|
|
0.05
|
%
|
||||||||||||
|
Harbor Ventilation Inc. and Estes Investment, LLC
|
Specialty Trade Contractors
|
Term Loan
|
Prime plus 2.75%
|
7/19/2038
|
|
92.1
|
|
90.0
|
|
84.5
|
|
0.05
|
%
|
||||||||||||
|
Tri County Heating and Cooling Inc.
|
Specialty Trade Contractors
|
Term Loan
|
Prime plus 2.75%
|
7/19/2023
|
|
87.8
|
|
78.8
|
|
73.7
|
|
0.04
|
%
|
||||||||||||
|
Morning Star Trucking. LLC and Morning Star Equipment and Leasing, LLC
|
Truck Transportation
|
Term Loan
|
Prime plus 2.75%
|
7/17/2023
|
|
53.8
|
|
48.2
|
|
37.9
|
|
0.02
|
%
|
||||||||||||
|
Maxiflex, LLC
|
Miscellaneous Manufacturing
|
Term Loan
|
Prime plus 2.75%
|
6/28/2023
|
|
153.5
|
|
136.9
|
|
135.5
|
|
0.08
|
%
|
||||||||||||
|
JRA Holdings, LLC (EPC) Jasper County Cleaners Inc. dba Superior Cleaner
|
Personal and Laundry Services
|
Term Loan
|
Prime plus 2.75%
|
6/28/2038
|
|
121.0
|
|
117.9
|
|
118.9
|
|
0.07
|
%
|
||||||||||||
|
GIA Realty, LLC and VRAJ GIA, LLC dba Lakeview Laundromat
|
Personal and Laundry Services
|
Term Loan
|
Prime plus 2.75%
|
6/28/2038
|
|
97.5
|
|
95.0
|
|
95.8
|
|
0.06
|
%
|
||||||||||||
|
Emerald Ironworks Inc.
|
Specialty Trade Contractors
|
Term Loan
|
Prime plus 2.75%
|
6/27/2023
|
|
72.0
|
|
64.4
|
|
56.4
|
|
0.03
|
%
|
||||||||||||
|
Contract Packaging Services Inc. dba Superior Pack Group
|
Plastics and Rubber Products Manufacturing
|
Term Loan
|
Prime plus 2.75%
|
6/21/2023
|
|
851.8
|
|
764.3
|
|
690.4
|
|
0.41
|
%
|
||||||||||||
F-26
|
Portfolio Company
|
Industry
|
Type of Investment
|
Interest Rate
(2)
|
Maturity
|
Principal
|
Cost
|
Fair Value
|
% of Net Assets
|
|||||||||||||||||
|
2161 Highway 6 Trail, LLC (EPC)
|
Truck Transportation
|
Term Loan
|
Prime plus 2.75%
|
6/19/2026
|
|
1,250.0
|
|
912.6
|
|
903.4
|
|
0.54
|
%
|
||||||||||||
|
CBlakeslee Arpaia Chapman, Inc. dba Blakeslee Industrial Services
|
Heavy and Civil Engineering Construction
|
Term Loan
|
Prime plus 2.75%
|
6/18/2028
|
|
875.0
|
|
821.3
|
|
819.1
|
|
0.49
|
%
|
||||||||||||
|
KDP, LLC and KDP Investment Advisors, Inc. and KDP Asset Management, Inc.
|
Securities, Commodity Contracts, and Other Financial Investments and Related Activities
|
Term Loan
|
Prime plus 2.75%
|
6/14/2023
|
|
343.8
|
|
306.2
|
|
263.6
|
|
0.16
|
%
|
||||||||||||
|
Elite Structures Inc.
|
Fabricated Metal Product Manufacturing
|
Term Loan
|
Prime plus 2.75%
|
6/12/2038
|
|
932.8
|
|
901.3
|
|
901.2
|
|
0.54
|
%
|
||||||||||||
|
(EPC) Absolute Desire, LLC and Mark H. Szierer (OC) Sophisticated Smile
|
Ambulatory Health Care Services
|
Term Loan
|
Prime plus 2.75%
|
6/5/2038
|
|
188.3
|
|
183.7
|
|
172.4
|
|
0.10
|
%
|
||||||||||||
|
(EPC) Willowbrook Properties, LLC (OC) Grove Gardens Landscaping Inc.
|
Administrative and Support Services
|
Term Loan
|
Prime plus 2.75%
|
6/5/2038
|
|
186.3
|
|
181.5
|
|
177.9
|
|
0.11
|
%
|
||||||||||||
|
Maciver Corporation dba Indie Rentals and Division Camera
|
Rental and Leasing Services
|
Term Loan
|
Prime plus 2.75%
|
5/31/2023
|
|
440.8
|
|
390.3
|
|
363.0
|
|
0.22
|
%
|
||||||||||||
|
RKP Service dba Rainbow Carwash
|
Repair and Maintenance
|
Term Loan
|
Prime plus 2.75%
|
5/31/2023
|
|
300.0
|
|
268.2
|
|
232.8
|
|
0.14
|
%
|
||||||||||||
|
Europlast Ltd.
|
Plastics and Rubber Products Manufacturing
|
Term Loan
|
Prime plus 2.75%
|
5/31/2023
|
|
162.0
|
|
157.4
|
|
151.0
|
|
0.09
|
%
|
||||||||||||
|
RXSB, Inc. dba Medicine Shoppe
|
Health and Personal Care Stores
|
Term Loan
|
Prime plus 2.75%
|
5/30/2023
|
|
186.3
|
|
165.5
|
|
140.1
|
|
0.08
|
%
|
||||||||||||
|
Gregory P Jellenek OD and Associates PC dba Gregory P Jellenek OD
|
Ambulatory Health Care Services
|
Term Loan
|
Prime plus 2.75%
|
5/28/2023
|
|
63.5
|
|
56.2
|
|
51.2
|
|
0.03
|
%
|
||||||||||||
|
Ryan D. Thornton and Thornton & Associates, LLC
|
Insurance Carriers and Related Activities
|
Term Loan
|
Prime plus 2.75%
|
5/24/2023
|
|
68.8
|
|
58.7
|
|
49.7
|
|
0.03
|
%
|
||||||||||||
|
Insurance Problem Solvers, LLC
|
Insurance Carriers and Related Activities
|
Term Loan
|
Prime plus 2.75%
|
5/20/2023
|
|
17.1
|
|
15.1
|
|
12.8
|
|
0.01
|
%
|
||||||||||||
|
Hybrid Racing, LLC.
|
Transportation Equipment Manufacturing
|
Term Loan
|
Prime plus 2.75%
|
5/15/2023
|
|
116.3
|
|
103.4
|
|
92.8
|
|
0.06
|
%
|
||||||||||||
|
Atlas Mountain Construction, LLC
|
Construction of Buildings
|
Term Loan
|
Prime plus 2.75%
|
5/13/2038
|
|
127.3
|
|
123.8
|
|
124.8
|
|
0.07
|
%
|
||||||||||||
|
PowerWash Plus, Inc. and CJR, LLC
|
Repair and Maintenance
|
Term Loan
|
Prime plus 2.75%
|
4/30/2038
|
|
550.0
|
|
534.1
|
|
512.2
|
|
0.31
|
%
|
||||||||||||
|
Peanut Butter & Co., Inc.
|
Food Manufacturing
|
Term Loan
|
Prime plus 2.75%
|
4/30/2023
|
|
100.0
|
|
87.7
|
|
75.1
|
|
0.05
|
%
|
||||||||||||
|
Brothers International Desserts
|
Food Manufacturing
|
Term Loan
|
Prime plus 2.75%
|
4/26/2023
|
|
230.0
|
|
201.8
|
|
185.1
|
|
0.11
|
%
|
||||||||||||
|
Kidrose, LLC dba Kidville Riverdale
|
Educational Services
|
Term Loan
|
Prime plus 2.75%
|
4/22/2023
|
|
78.8
|
|
69.9
|
|
62.3
|
|
0.04
|
%
|
||||||||||||
|
SFAM Parsippany LLC dba Cups Frozen Yogurt
|
Food Services and Drinking Places
|
Term Loan
|
6%
|
4/19/2023
|
|
121.3
|
|
46.3
|
|
45.8
|
|
0.03
|
%
|
||||||||||||
|
Vernon & Stephanie Scott and Little Stars Day Care Center, Inc.
|
Educational Services
|
Term Loan
|
Prime plus 2.75%
|
4/18/2038
|
|
151.0
|
|
146.7
|
|
147.9
|
|
0.09
|
%
|
||||||||||||
F-27
|
Portfolio Company
|
Industry
|
Type of Investment
|
Interest Rate
(2)
|
Maturity
|
Principal
|
Cost
|
Fair Value
|
% of Net Assets
|
|||||||||||||||||
|
Capital Scrap Metal, LLC and Powerline Investment, LLC
|
Merchant Wholesalers, Durable Goods
|
Term Loan
|
Prime plus 2.75%
|
3/29/2038
|
|
500.0
|
|
463.9
|
|
467.5
|
|
0.28
|
%
|
||||||||||||
|
MRM Supermarkets Inc. dba Constantins Breads; Dallas Gourmet Breads
|
Food Manufacturing
|
Term Loan
|
Prime plus 2.75%
|
3/29/2038
|
|
336.0
|
|
325.8
|
|
303.2
|
|
0.18
|
%
|
||||||||||||
|
1258 Hartford TPKE, LLC (EPC) and Phelps and Sons, Inc. (OC)
|
Miscellaneous Store Retailers
|
Term Loan
|
Prime plus 2.75%
|
3/29/2038
|
|
124.6
|
|
120.8
|
|
114.3
|
|
0.07
|
%
|
||||||||||||
|
A & M Commerce, Inc. dba Cranberry Sunoco
|
Gasoline Stations
|
Term Loan
|
Prime plus 2.75%
|
3/27/2038
|
|
330.3
|
|
320.0
|
|
313.9
|
|
0.19
|
%
|
||||||||||||
|
Xela Pack, Inc. and Aliseo and Catherine Gentile
|
Paper Manufacturing
|
Term Loan
|
Prime plus 2.75%
|
3/27/2028
|
|
271.8
|
|
252.1
|
|
250.6
|
|
0.15
|
%
|
||||||||||||
|
Neyra Industries, Inc. and Edward Neyra
|
Nonmetallic Mineral Product Manufacturing
|
Term Loan
|
Prime plus 2.75%
|
3/27/2023
|
|
217.5
|
|
189.4
|
|
185.0
|
|
0.11
|
%
|
||||||||||||
|
Gator Communications Group, LLC dba Harvard Printing Group
|
Printing and Related Support Activities
|
Term Loan
|
Prime plus 2.75%
|
3/27/2023
|
|
17.3
|
|
15.5
|
|
14.2
|
|
0.01
|
%
|
||||||||||||
|
American Diagnostic Imaging, Inc. dba St. Joseph Imaging Center
|
Ambulatory Health Care Services
|
Term Loan
|
Prime plus 2.75%
|
3/25/2038
|
|
537.5
|
|
521.1
|
|
497.8
|
|
0.30
|
%
|
||||||||||||
|
Michael A. and Heather R. Welsch dba Art & Frame Etc.
|
Miscellaneous Store Retailers
|
Term Loan
|
Prime plus 2.75%
|
3/22/2038
|
|
67.5
|
|
65.4
|
|
63.9
|
|
0.04
|
%
|
||||||||||||
|
M & H Pine Straw Inc. and Harris L. Maloy
|
Merchant Wholesalers, Nondurable Goods
|
Term Loan
|
Prime plus 2.75%
|
3/21/2023
|
|
288.8
|
|
251.6
|
|
235.9
|
|
0.14
|
%
|
||||||||||||
|
Truth Technologies Inc. dba Truth Technologies Inc.
|
Professional, Scientific, and Technical Services
|
Term Loan
|
Prime plus 2.75%
|
3/21/2023
|
|
79.5
|
|
69.2
|
|
60.1
|
|
0.04
|
%
|
||||||||||||
|
J. Kinderman & Sons Inc., dba BriteStar Inc.
|
Electrical Equipment, Appliance, and Component Manufacturing
|
Term Loan
|
Prime plus 2.75%
|
3/20/2023
|
|
181.3
|
|
157.8
|
|
156.0
|
|
0.09
|
%
|
||||||||||||
|
Stellar Environmental, LLC
|
Waste Management and Remediation Services
|
Term Loan
|
Prime plus 2.75%
|
3/18/2023
|
|
56.3
|
|
49.0
|
|
46.7
|
|
0.03
|
%
|
||||||||||||
|
Sound Manufacturing, Inc. and Monster Power Equipment Inc.
|
Fabricated Metal Product Manufacturing
|
Term Loan
|
Prime plus 2.75%
|
3/15/2023
|
|
523.0
|
|
455.9
|
|
417.3
|
|
0.25
|
%
|
||||||||||||
|
N.S and Z, Inc. dba Panos Pastry and Bakery and Jovinar's Chocolates
|
Food Manufacturing
|
Term Loan
|
Prime plus 2.75%
|
3/15/2038
|
|
129.3
|
|
125.5
|
|
126.5
|
|
0.08
|
%
|
||||||||||||
|
Golden Gate Lodging, LLC (OC)
|
Accommodation
|
Term Loan
|
Prime plus 2.75%
|
3/12/2038
|
|
115.0
|
|
111.5
|
|
108.9
|
|
0.07
|
%
|
||||||||||||
|
Aldine Funeral Chapel, LLC dba Aldine Funeral Chapel
|
Personal and Laundry Services
|
Term Loan
|
Prime plus 2.75%
|
3/8/2038
|
|
73.8
|
|
35.5
|
|
35.8
|
|
0.02
|
%
|
||||||||||||
|
River Club Golf Course Inc. dba The River Club
|
Amusement, Gambling, and Recreation Industries
|
Term Loan
|
Prime plus 2.75%
|
2/28/2038
|
|
475.2
|
|
459.9
|
|
445.9
|
|
0.27
|
%
|
||||||||||||
|
Bakhtar Group, LLC dba Malmaison
|
Food Services and Drinking Places
|
Term Loan
|
Prime plus 2.75%
|
2/28/2023
|
|
103.8
|
|
90.4
|
|
76.6
|
|
0.05
|
%
|
||||||||||||
|
Osceola River Mill, LLC(EPC) Ironman Machine, Inc.(OC)
|
Machinery Manufacturing
|
Term Loan
|
Prime plus 2.75%
|
2/20/2038
|
|
86.3
|
|
83.5
|
|
81.5
|
|
0.05
|
%
|
||||||||||||
|
Grand Manor Realty, Inc. & Kevin LaRoe
|
Real Estate
|
Term Loan
|
Prime plus 2.75%
|
2/20/2023
|
|
21.8
|
|
19.0
|
|
16.1
|
|
0.01
|
%
|
||||||||||||
F-28
|
Portfolio Company
|
Industry
|
Type of Investment
|
Interest Rate
(2)
|
Maturity
|
Principal
|
Cost
|
Fair Value
|
% of Net Assets
|
|||||||||||||||||
|
Java Warung, LLC
|
Food Services and Drinking Places
|
Term Loan
|
Prime plus 2.75%
|
2/19/2038
|
|
51.0
|
|
49.5
|
|
48.5
|
|
0.03
|
%
|
||||||||||||
|
Pacheco Investments, LLC (EPC) Pacheco Brothers Gardening Inc. (OC)
|
Administrative and Support Services
|
Term Loan
|
Prime plus 2.75%
|
2/15/2038
|
|
425.0
|
|
410.0
|
|
403.5
|
|
0.24
|
%
|
||||||||||||
|
Nancy & Karl Schmidt (EPC) Moments to Remember USA, LLC
|
Printing and Related Support Activities
|
Term Loan
|
Prime plus 2.75%
|
2/15/2038
|
|
106.3
|
|
102.9
|
|
100.6
|
|
0.06
|
%
|
||||||||||||
|
Orient Express, Inc. dba Spracht, Celltek, ODI
|
Merchant Wholesalers, Durable Goods
|
Term Loan
|
Prime plus 2.75%
|
2/12/2023
|
|
84.9
|
|
72.4
|
|
61.3
|
|
0.04
|
%
|
||||||||||||
|
Knits R Us, Inc. dba NYC Sports/Mingle
|
Textile Mills
|
Term Loan
|
Prime plus 2.75%
|
2/11/2038
|
|
125.0
|
|
121.0
|
|
122.0
|
|
0.07
|
%
|
||||||||||||
|
North Country Transport, LLC
|
Transit and Ground Passenger Transportation
|
Term Loan
|
Prime plus 2.75%
|
2/6/2023
|
|
15.0
|
|
13.0
|
|
12.8
|
|
0.01
|
%
|
||||||||||||
|
MJD Investments, LLC dba The Community Day School
|
Social Assistance
|
Term Loan
|
Prime plus 2.75%
|
1/31/2038
|
|
258.3
|
|
249.6
|
|
239.6
|
|
0.14
|
%
|
||||||||||||
|
EZ Towing, Inc.
|
Support Activities for Transportation
|
Term Loan
|
Prime plus 2.75%
|
1/31/2023
|
|
145.0
|
|
124.5
|
|
110.3
|
|
0.07
|
%
|
||||||||||||
|
Sherill Universal City dba Golden Corral
|
Food Services and Drinking Places
|
Term Loan
|
Prime plus 2.75%
|
1/28/2038
|
|
440.5
|
|
427.4
|
|
411.7
|
|
0.25
|
%
|
||||||||||||
|
Macho LLC (EPC) Madelaine Chocolate Novelties Inc(OC) dba The Madelai
|
Food Manufacturing
|
Term Loan
|
Prime plus 2.75%
|
12/31/2037
|
|
500.0
|
|
484.6
|
|
488.3
|
|
0.29
|
%
|
||||||||||||
|
WI130, LLC (EPC) & Lakeland Group, Inc. (OC) dba Lakeland Electrical
|
Merchant Wholesalers, Durable Goods
|
Term Loan
|
Prime plus 2.75%
|
12/31/2028
|
|
271.5
|
|
250.9
|
|
226.0
|
|
0.14
|
%
|
||||||||||||
|
Elegant Fireplace Mantels, Inc. dba Elegant Fireplace Mantels
|
Specialty Trade Contractors
|
Term Loan
|
Prime plus 2.75%
|
12/31/2022
|
|
97.5
|
|
83.0
|
|
70.8
|
|
0.04
|
%
|
||||||||||||
|
John Duffy Fuel Co., Inc.
|
Merchant Wholesalers, Nondurable Goods
|
Term Loan
|
Prime plus 2.75%
|
12/28/2022
|
|
513.8
|
|
437.5
|
|
428.7
|
|
0.26
|
%
|
||||||||||||
|
Babie Bunnie Enterprises Inc. dba Triangle Mothercare
|
Ambulatory Health Care Services
|
Term Loan
|
Prime plus 2.75%
|
12/28/2022
|
|
46.3
|
|
39.3
|
|
33.3
|
|
0.02
|
%
|
||||||||||||
|
Polpo Realty LLC (EPC) & Polpo Restaurant LLC (OC)
|
Food Services and Drinking Places
|
Term Loan
|
Prime plus 2.75%
|
12/27/2037
|
|
517.5
|
|
500.9
|
|
504.8
|
|
0.30
|
%
|
||||||||||||
|
Trailer One, Inc. and Trailer One Storage, Inc.
|
Merchant Wholesalers, Durable Goods
|
Term Loan
|
Prime plus 2.75%
|
12/27/2022
|
|
166.8
|
|
142.0
|
|
140.3
|
|
0.08
|
%
|
||||||||||||
|
Martin L Hopp, MD PHD, A Medical Corp (OC)
|
Ambulatory Health Care Services
|
Term Loan
|
Prime plus 2.75%
|
12/21/2022
|
|
66.3
|
|
56.2
|
|
50.0
|
|
0.03
|
%
|
||||||||||||
|
Ezzo Properties, LLC and Great Lakes Cleaning, Inc.
|
Administrative and Support Services
|
Term Loan
|
Prime plus 2.75%
|
12/20/2027
|
|
389.6
|
|
357.0
|
|
317.0
|
|
0.19
|
%
|
||||||||||||
|
Pioneer Window Holdings, Inc. and Subsidiaries dba Pioneer Windows
|
Fabricated Metal Product Manufacturing
|
Term Loan
|
Prime plus 2.75%
|
12/20/2022
|
|
225.0
|
|
195.2
|
|
176.8
|
|
0.11
|
%
|
||||||||||||
|
The Amendments Group, LLC dba Brightstar
|
Ambulatory Health Care Services
|
Term Loan
|
Prime plus 2.75%
|
12/17/2022
|
|
22.5
|
|
19.1
|
|
18.9
|
|
0.01
|
%
|
||||||||||||
|
G.M. Pop's, Inc. & S.D. Food, Inc. dba Popeyes Louisiana Kitchen
|
Food Services and Drinking Places
|
Term Loan
|
Prime plus 2.75%
|
12/11/2022
|
|
127.1
|
|
108.2
|
|
94.4
|
|
0.06
|
%
|
||||||||||||
F-29
|
Portfolio Company
|
Industry
|
Type of Investment
|
Interest Rate
(2)
|
Maturity
|
Principal
|
Cost
|
Fair Value
|
% of Net Assets
|
|||||||||||||||||
|
Color By Number 123 Designs, Inc.
|
Professional, Scientific, and Technical Services
|
Term Loan
|
Prime plus 2.75%
|
12/11/2022
|
|
42.5
|
|
35.9
|
|
35.4
|
|
0.02
|
%
|
||||||||||||
|
Aegis Creative Communications, Inc.
|
Professional, Scientific, and Technical Services
|
Term Loan
|
Prime plus 2.75%
|
11/30/2022
|
|
387.5
|
|
302.5
|
|
256.0
|
|
0.15
|
%
|
||||||||||||
|
Cheryle A Baptiste and Cheryle Baptiste DDS PLLC
|
Ambulatory Health Care Services
|
Term Loan
|
Prime plus 2.75%
|
11/30/2037
|
|
286.5
|
|
277.1
|
|
272.1
|
|
0.16
|
%
|
||||||||||||
|
Summit Treatment Services, Inc. dba Summit Treatment Services
|
Social Assistance
|
Term Loan
|
Prime plus 2.75%
|
11/30/2037
|
|
136.5
|
|
131.9
|
|
118.7
|
|
0.07
|
%
|
||||||||||||
|
214 North Franklin, LLC and Winter Ventures, Inc.
|
Nonstore Retailers
|
Term Loan
|
Prime plus 2.75%
|
11/29/2037
|
|
153.9
|
|
148.2
|
|
140.7
|
|
0.08
|
%
|
||||||||||||
|
Daniel Gordon and Erin Gordon and Silver Lining Stables CT, LLC
|
Support Activities for Agriculture and Forestry
|
Term Loan
|
Prime plus 2.75%
|
11/28/2037
|
|
223.8
|
|
215.7
|
|
215.4
|
|
0.13
|
%
|
||||||||||||
|
Richmond Hill Mini Market, LLC
|
Food and Beverage Stores
|
Term Loan
|
Prime plus 2.75%
|
11/27/2037
|
|
185.3
|
|
178.6
|
|
174.8
|
|
0.11
|
%
|
||||||||||||
|
D&L Rescources, Inc. dba The UPS Store
|
Miscellaneous Store Retailers
|
Term Loan
|
Prime plus 2.75%
|
11/27/2022
|
|
9.8
|
|
8.2
|
|
7.0
|
|
—
|
%
|
||||||||||||
|
DRV Enterprise, Inc. dba Cici's Pizza # 339
|
Food Services and Drinking Places
|
Term Loan
|
Prime plus 2.75%
|
11/26/2022
|
|
65.0
|
|
53.6
|
|
53.0
|
|
0.03
|
%
|
||||||||||||
|
Pioneer Windows Manufacturing Corp, Pioneer Windows
|
Fabricated Metal Product Manufacturing
|
Term Loan
|
Prime plus 2.75%
|
11/21/2022
|
|
275.0
|
|
236.7
|
|
214.2
|
|
0.13
|
%
|
||||||||||||
|
U & A Food and Fuel, Inc. dba Express Gas & Food Mart
|
Gasoline Stations
|
Term Loan
|
Prime plus 2.75%
|
11/21/2037
|
|
96.3
|
|
92.7
|
|
93.4
|
|
0.06
|
%
|
||||||||||||
|
Clean Brothers Company Inc. dba ServPro of North Washington County
|
Repair and Maintenance
|
Term Loan
|
Prime plus 2.75%
|
11/21/2022
|
|
17.0
|
|
14.3
|
|
12.7
|
|
0.01
|
%
|
||||||||||||
|
R & J Petroleum, LLC (EPC) Manar USA, Inc. (OC)
|
Gasoline Stations
|
Term Loan
|
Prime plus 2.75%
|
11/20/2037
|
|
180.0
|
|
173.3
|
|
171.3
|
|
0.10
|
%
|
||||||||||||
|
PGH Groceries, LLC DBA The Great American Super
|
Food and Beverage Stores
|
Term Loan
|
Prime plus 2.75%
|
11/19/2037
|
|
68.8
|
|
66.3
|
|
64.9
|
|
0.04
|
%
|
||||||||||||
|
St Judes Physical Therapy P.C.
|
Ambulatory Health Care Services
|
Term Loan
|
Prime plus 2.75%
|
11/19/2022
|
|
21.0
|
|
17.7
|
|
17.5
|
|
0.01
|
%
|
||||||||||||
|
Hi-Def Imaging, Inc. dba SpeedPro Imaging
|
Printing and Related Support Activities
|
Term Loan
|
Prime plus 2.75%
|
11/9/2022
|
|
22.2
|
|
18.7
|
|
16.5
|
|
0.01
|
%
|
||||||||||||
|
Reidville Hydraulics & Mfg Inc. dba Summit Farms, LLC
|
Machinery Manufacturing
|
Term Loan
|
Prime plus 2.75%
|
11/2/2037
|
|
265.9
|
|
256.2
|
|
237.4
|
|
0.14
|
%
|
||||||||||||
|
Big Apple Entertainment Partners, LLC d/b/a Ripley's Believe It or Not
|
Amusement, Gambling, and Recreation Industries
|
Term Loan
|
Prime plus 2.75%
|
10/26/2022
|
|
180.0
|
|
154.2
|
|
130.5
|
|
0.08
|
%
|
||||||||||||
|
Chickamauga Properties, Inc. and MSW Enterprises, LLP
|
Amusement, Gambling, and Recreation Industries
|
Term Loan
|
Prime plus 2.75%
|
10/19/2022
|
|
59.8
|
|
50.0
|
|
49.4
|
|
0.03
|
%
|
||||||||||||
|
LA Diner Inc. dba Loukas L A Diner
|
Food Services and Drinking Places
|
Term Loan
|
Prime plus 2.75%
|
9/28/2037
|
|
677.5
|
|
652.1
|
|
657.0
|
|
0.39
|
%
|
||||||||||||
F-30
|
Portfolio Company
|
Industry
|
Type of Investment
|
Interest Rate
(2)
|
Maturity
|
Principal
|
Cost
|
Fair Value
|
% of Net Assets
|
|||||||||||||||||
|
Spire Investment Partners, LLC
|
Securities, Commodity Contracts, and Other Financial Investments and Related Activities
|
Term Loan
|
Prime plus 2.75%
|
9/28/2022
|
|
258.8
|
|
215.0
|
|
181.9
|
|
0.11
|
%
|
||||||||||||
|
ATC Fitness, LLC dba Around the Clock Fitness
|
Amusement, Gambling, and Recreation Industries
|
Term Loan
|
Prime plus 2.75%
|
9/28/2022
|
|
180.0
|
|
154.0
|
|
143.8
|
|
0.09
|
%
|
||||||||||||
|
University Park Retreat, LLC dba Massage Heights
|
Personal and Laundry Services
|
Term Loan
|
Prime plus 2.75%
|
9/27/2022
|
|
76.0
|
|
63.0
|
|
62.3
|
|
0.04
|
%
|
||||||||||||
|
Europlast Ltd.
|
Plastics and Rubber Products Manufacturing
|
Term Loan
|
Prime plus 2.75%
|
9/26/2022
|
|
743.9
|
|
680.4
|
|
655.1
|
|
0.39
|
%
|
||||||||||||
|
Forno Italiano Di Nonna Randazzo, LLC dba Nonna Randazzo's Bakery
|
Food and Beverage Stores
|
Term Loan
|
Prime plus 2.75%
|
9/26/2037
|
|
183.8
|
|
177.7
|
|
171.1
|
|
0.10
|
%
|
||||||||||||
|
LaSalle Market and Deli EOK Inc. and Rugen Realty, LLC dba LaSalle Mark
|
Food Services and Drinking Places
|
Term Loan
|
Prime plus 2.75%
|
9/21/2037
|
|
252.3
|
|
242.1
|
|
232.1
|
|
0.14
|
%
|
||||||||||||
|
O'Rourkes Diner, LLC dba O'Rourke's Diner
|
Food Services and Drinking Places
|
Term Loan
|
Prime plus 2.75%
|
9/19/2037
|
|
65.5
|
|
62.9
|
|
59.7
|
|
0.04
|
%
|
||||||||||||
|
AdLarge Media, LLC
|
Professional, Scientific, and Technical Services
|
Term Loan
|
Prime plus 2.75%
|
9/13/2022
|
|
250.0
|
|
207.7
|
|
175.7
|
|
0.11
|
%
|
||||||||||||
|
Vision Network Solutions, Inc.
|
Professional, Scientific, and Technical Services
|
Term Loan
|
Prime plus 2.75%
|
9/12/2022
|
|
19.5
|
|
16.2
|
|
13.7
|
|
0.01
|
%
|
||||||||||||
|
R2 Tape, Inc. dba Presto Tape
|
Merchant Wholesalers, Nondurable Goods
|
Term Loan
|
Prime plus 2.75%
|
8/31/2037
|
|
367.5
|
|
352.1
|
|
354.7
|
|
0.21
|
%
|
||||||||||||
|
R2 Tape Inc. dba Presto Tape
|
Merchant Wholesalers, Nondurable Goods
|
Term Loan
|
Prime plus 2.75%
|
8/31/2022
|
|
155.0
|
|
127.5
|
|
125.9
|
|
0.08
|
%
|
||||||||||||
|
AJK Enterprise, LLC dba AJK Enterprise, LLC
|
Truck Transportation
|
Term Loan
|
Prime plus 2.75%
|
8/27/2022
|
|
16.5
|
|
13.6
|
|
13.1
|
|
0.01
|
%
|
||||||||||||
|
New Image Building Services, Inc. dba New Image Repair Services
|
Repair and Maintenance
|
Term Loan
|
Prime plus 2.75%
|
8/23/2037
|
|
285.7
|
|
273.7
|
|
252.7
|
|
0.15
|
%
|
||||||||||||
|
Suncoast Aluminum Furniture, Inc.
|
Furniture and Related Product Manufacturing
|
Term Loan
|
Prime plus 2.75%
|
8/17/2037
|
|
360.0
|
|
344.9
|
|
345.7
|
|
0.21
|
%
|
||||||||||||
|
Matchless Transportation, LLC dba First Class Limo
|
Transit and Ground Passenger Transportation
|
Term Loan
|
Prime plus 2.75%
|
8/3/2022
|
|
185.0
|
|
153.1
|
|
139.8
|
|
0.08
|
%
|
||||||||||||
|
Hofgard & Co., Inc. dba HofgardBenefits
|
Insurance Carriers and Related Activities
|
Term Loan
|
Prime plus 2.75%
|
7/27/2022
|
|
107.3
|
|
87.4
|
|
81.8
|
|
0.05
|
%
|
||||||||||||
|
Georgia Safe Sidewalks, LLC
|
Specialty Trade Contractors
|
Term Loan
|
Prime plus 2.75%
|
7/27/2022
|
|
15.0
|
|
12.1
|
|
11.1
|
|
0.01
|
%
|
||||||||||||
|
Scoville Plumbing & Heating Inc. and Thomas P. Scoville
|
Specialty Trade Contractors
|
Term Loan
|
Prime plus 2.75%
|
7/25/2022
|
|
50.0
|
|
42.9
|
|
41.9
|
|
0.03
|
%
|
||||||||||||
|
Havana Central (NY) 5, LLC
|
Food Services and Drinking Places
|
Term Loan
|
Prime plus 2.75%
|
6/29/2022
|
|
1,166.8
|
|
984.7
|
|
956.2
|
|
0.57
|
%
|
||||||||||||
F-31
|
Portfolio Company
|
Industry
|
Type of Investment
|
Interest Rate
(2)
|
Maturity
|
Principal
|
Cost
|
Fair Value
|
% of Net Assets
|
|||||||||||||||||
|
Central Tire, Inc. dba Cooper Tire & Auto Services
|
Repair and Maintenance
|
Term Loan
|
Prime plus 2.75%
|
6/29/2037
|
|
288.5
|
|
275.2
|
|
272.9
|
|
0.16
|
%
|
||||||||||||
|
WPI, LLC
|
Transportation Equipment Manufacturing
|
Term Loan
|
Prime plus 2.75%
|
6/29/2024
|
|
129.5
|
|
110.1
|
|
104.7
|
|
0.06
|
%
|
||||||||||||
|
Karykion, Corporation dba Karykion Corporation
|
Professional, Scientific, and Technical Services
|
Term Loan
|
Prime plus 2.75%
|
6/28/2022
|
|
194.0
|
|
157.3
|
|
156.9
|
|
0.09
|
%
|
||||||||||||
|
Jenkins-Pavia Corporation dba Victory Lane Quick Oil Change
|
Repair and Maintenance
|
Term Loan
|
Prime plus 2.75%
|
6/27/2037
|
|
69.8
|
|
66.5
|
|
66.9
|
|
0.04
|
%
|
||||||||||||
|
KIND-ER-ZZ Inc. dba Kidville
|
Educational Services
|
Term Loan
|
Prime plus 2.75%
|
6/15/2022
|
|
50.0
|
|
40.1
|
|
36.6
|
|
0.02
|
%
|
||||||||||||
|
Graphish Studio, Inc. and Scott Fishoff
|
Professional, Scientific, and Technical Services
|
Term Loan
|
Prime plus 2.75%
|
6/14/2022
|
|
20.3
|
|
16.4
|
|
14.9
|
|
0.01
|
%
|
||||||||||||
|
TNDV: Television, LLC
|
Motion Picture and Sound Recording Industries
|
Term Loan
|
Prime plus 2.75%
|
6/13/2022
|
|
127.5
|
|
103.2
|
|
98.8
|
|
0.06
|
%
|
||||||||||||
|
Spectrumit, Inc, (OC) dba LANformation
|
Professional, Scientific, and Technical Services
|
Term Loan
|
Prime plus 2.75%
|
5/31/2030
|
|
154.9
|
|
141.7
|
|
140.0
|
|
0.08
|
%
|
||||||||||||
|
5091, LLC and TR/AL, LLC d/b/a Cafe Africana
|
Food Services and Drinking Places
|
Term Loan
|
Prime plus 2.75%
|
5/31/2037
|
|
121.3
|
|
115.8
|
|
116.4
|
|
0.07
|
%
|
||||||||||||
|
ALF, LLC (EPC) Mulit-Service Eagle Tires (OC)
|
Motor Vehicle and Parts Dealers
|
Term Loan
|
Prime plus 2.75%
|
5/31/2037
|
|
62.9
|
|
59.9
|
|
59.9
|
|
0.04
|
%
|
||||||||||||
|
Craig R Freehauf d/b/a Lincoln Theatre
|
Performing Arts, Spectator Sports, and Related Industries
|
Term Loan
|
Prime plus 2.75%
|
5/31/2022
|
|
47.9
|
|
31.8
|
|
31.7
|
|
0.02
|
%
|
||||||||||||
|
Lefont Theaters, Inc.
|
Motion Picture and Sound Recording Industries
|
Term Loan
|
Prime plus 2.75%
|
5/30/2022
|
|
137.0
|
|
109.9
|
|
104.7
|
|
0.06
|
%
|
||||||||||||
|
Christou Real Estate Holdings, LLC dba Tops American Grill
|
Food Services and Drinking Places
|
Term Loan
|
Prime plus 2.75%
|
5/17/2037
|
|
284.0
|
|
270.3
|
|
273.5
|
|
0.16
|
%
|
||||||||||||
|
Tracey Vita-Morris dba Tracey Vita's School of Dance
|
Performing Arts, Spectator Sports, and Related Industries
|
Term Loan
|
Prime plus 2.75%
|
5/10/2022
|
|
22.5
|
|
18.1
|
|
16.5
|
|
0.01
|
%
|
||||||||||||
|
STK Ventures Inc. dba JP Dock Service & Supply
|
Specialty Trade Contractors
|
Term Loan
|
Prime plus 2.75%
|
5/9/2037
|
|
131.8
|
|
126.1
|
|
125.3
|
|
0.08
|
%
|
||||||||||||
|
Bisson Transportation, Inc.
|
Truck Transportation
|
Term Loan
|
Prime plus 2.75%
|
5/7/2037
|
|
588.1
|
|
570.2
|
|
560.0
|
|
0.34
|
%
|
||||||||||||
|
Bisson Moving & Storage Company Bisson Transportation Inc.
|
Truck Transportation
|
Term Loan
|
Prime plus 2.75%
|
5/7/2022
|
|
528.8
|
|
440.8
|
|
426.5
|
|
0.26
|
%
|
||||||||||||
|
Fair Deal Food Mart Inc. dba Neighbors Market
|
Gasoline Stations
|
Term Loan
|
Prime plus 2.75%
|
5/3/2037
|
|
381.3
|
|
363.0
|
|
370.4
|
|
0.22
|
%
|
||||||||||||
|
Custom Software, Inc. a Colorado Corporation dba M-33 Access
|
Broadcasting (except Internet)
|
Term Loan
|
Prime plus 2.75%
|
4/30/2022
|
|
125.0
|
|
103.1
|
|
101.7
|
|
0.06
|
%
|
||||||||||||
|
Tanner Optical, Inc. dba Murphy Eye Care
|
Ambulatory Health Care Services
|
Term Loan
|
Prime plus 2.75%
|
4/27/2022
|
|
8.3
|
|
6.6
|
|
6.4
|
|
—
|
%
|
||||||||||||
F-32
|
Portfolio Company
|
Industry
|
Type of Investment
|
Interest Rate
(2)
|
Maturity
|
Principal
|
Cost
|
Fair Value
|
% of Net Assets
|
|||||||||||||||||
|
Gator Communications Group, LLC dba Harvard Printing Group
|
Printing and Related Support Activities
|
Term Loan
|
Prime plus 2.75%
|
4/25/2022
|
|
228.8
|
|
187.7
|
|
176.1
|
|
0.11
|
%
|
||||||||||||
|
Zane Filippone Co Inc. dba Culligan Water Conditioning
|
Nonstore Retailers
|
Term Loan
|
Prime plus 2.75%
|
4/12/2022
|
|
558.2
|
|
447.7
|
|
429.7
|
|
0.26
|
%
|
||||||||||||
|
Indoor Playgrounds Limited Liability Company dba Kidville
|
Educational Services
|
Term Loan
|
Prime plus 2.75%
|
4/5/2022
|
|
19.5
|
|
12.9
|
|
12.4
|
|
0.01
|
%
|
||||||||||||
|
Gator Communications Group, LLC dba Harvard Printing Group
|
Printing and Related Support Activities
|
Term Loan
|
Prime plus 2.75%
|
3/30/2022
|
|
466.3
|
|
378.5
|
|
355.0
|
|
0.21
|
%
|
||||||||||||
|
Brandywine Picnic Park, Inc. and B.Ross Capps & Linda Capps
|
Amusement, Gambling, and Recreation Industries
|
Term Loan
|
Prime plus 2.75%
|
3/30/2031
|
|
231.5
|
|
212.5
|
|
215.1
|
|
0.13
|
%
|
||||||||||||
|
Access Staffing, LLC
|
Administrative and Support Services
|
Term Loan
|
Prime plus 2.75%
|
3/30/2022
|
|
187.5
|
|
147.7
|
|
134.6
|
|
0.08
|
%
|
||||||||||||
|
Willow Springs Golf Course, Inc. & JC Lindsey Family Limited Partners
|
Amusement, Gambling, and Recreation Industries
|
Term Loan
|
Prime plus 2.75%
|
3/29/2037
|
|
755.4
|
|
721.9
|
|
736.3
|
|
0.44
|
%
|
||||||||||||
|
Manuel P. Barrera and Accura Electrical Contractor, Inc.
|
Specialty Trade Contractors
|
Term Loan
|
Prime plus 2.75%
|
3/23/2028
|
|
103.7
|
|
92.4
|
|
87.6
|
|
0.05
|
%
|
||||||||||||
|
Shweiki Media, Inc. dba Study Breaks Magazine
|
Publishing Industries (except Internet)
|
Term Loan
|
Prime plus 2.75%
|
3/22/2027
|
|
1,178.8
|
|
1,036.8
|
|
997.5
|
|
0.60
|
%
|
||||||||||||
|
BCD Holdings, LLC and H-MA, LLC d/b/a/ Hawaii Mainland Administrators
|
Insurance Carriers and Related Activities
|
Term Loan
|
Prime plus 2.75%
|
3/2/2022
|
|
451.3
|
|
343.7
|
|
315.9
|
|
0.19
|
%
|
||||||||||||
|
ATC Fitness, LLC d/b/a Around the C
|
Amusement, Gambling, and Recreation Industries
|
Term Loan
|
Prime plus 2.75%
|
2/28/2022
|
|
10.2
|
|
8.0
|
|
7.7
|
|
—
|
%
|
||||||||||||
|
ATI Jet, Inc.
|
Air Transportation
|
Term Loan
|
Prime plus 2.75%
|
12/28/2026
|
|
852.8
|
|
738.5
|
|
717.5
|
|
0.43
|
%
|
||||||||||||
|
J. Kinderman & Sons, Inc. dba Brite Star Manufacturing Company
|
Furniture and Home Furnishings Stores
|
Term Loan
|
Prime plus 2.75%
|
12/22/2036
|
|
495.0
|
|
469.1
|
|
478.4
|
|
0.29
|
%
|
||||||||||||
|
K's Salon 1, LLC d/b/a K's Salon
|
Personal and Laundry Services
|
Term Loan
|
Prime plus 2.75%
|
12/20/2021
|
|
73.6
|
|
56.4
|
|
51.4
|
|
0.03
|
%
|
||||||||||||
|
15 Frederick Place, LLC & Pioneer Windows Holdings Inc. & Subs
|
Fabricated Metal Product Manufacturing
|
Term Loan
|
Prime plus 2.75%
|
12/16/2021
|
|
250.0
|
|
194.1
|
|
193.3
|
|
0.12
|
%
|
||||||||||||
|
GP Enterprises, LLC and Gibson Performance Corporation
|
Fabricated Metal Product Manufacturing
|
Term Loan
|
Prime plus 2.75%
|
12/15/2036
|
|
727.5
|
|
686.5
|
|
700.0
|
|
0.42
|
%
|
||||||||||||
|
GP Enterprises, LLC and Gibson Performance Corporation
|
Fabricated Metal Product Manufacturing
|
Term Loan
|
Prime plus 2.75%
|
12/15/2036
|
|
522.5
|
|
493.1
|
|
502.8
|
|
0.30
|
%
|
||||||||||||
|
M & H Pinestraw, Inc. and Harris L. Maloy
|
Merchant Wholesalers, Nondurable Goods
|
Term Loan
|
Prime plus 2.75%
|
12/15/2021
|
|
238.3
|
|
183.0
|
|
172.7
|
|
0.10
|
%
|
||||||||||||
|
Maciver Corporation dba Indie Rentals & Division Camera
|
Rental and Leasing Services
|
Term Loan
|
Prime plus 2.75%
|
12/15/2021
|
|
130.8
|
|
99.9
|
|
97.5
|
|
0.06
|
%
|
||||||||||||
|
Taylor Transport, Inc.
|
Truck Transportation
|
Term Loan
|
Prime plus 2.75%
|
12/8/2021
|
|
515.5
|
|
387.6
|
|
375.2
|
|
0.23
|
%
|
||||||||||||
F-33
|
Portfolio Company
|
Industry
|
Type of Investment
|
Interest Rate
(2)
|
Maturity
|
Principal
|
Cost
|
Fair Value
|
% of Net Assets
|
|||||||||||||||||
|
City Sign Service, Incorporated
|
Electrical Equipment, Appliance, and Component Manufacturing
|
Term Loan
|
Prime plus 2.75%
|
11/30/2025
|
|
165.8
|
|
142.0
|
|
140.3
|
|
0.08
|
%
|
||||||||||||
|
Scent-Sation, Inc. d/b/a Scent-Sation, Inc.
|
Textile Product Mills
|
Term Loan
|
Prime plus 2.75%
|
11/21/2021
|
|
337.5
|
|
285.2
|
|
284.0
|
|
0.17
|
%
|
||||||||||||
|
Thomas P. Scoville dba Scoville Plumbing & Heating, Inc.
|
Specialty Trade Contractors
|
Term Loan
|
Prime plus 2.75%
|
11/16/2021
|
|
62.5
|
|
47.4
|
|
47.2
|
|
0.03
|
%
|
||||||||||||
|
MRM Supermarkets, Inc. dba Constantin's Breads
|
Food Manufacturing
|
Term Loan
|
Prime plus 2.75%
|
11/10/2021
|
|
137.5
|
|
104.4
|
|
96.1
|
|
0.06
|
%
|
||||||||||||
|
K9 Bytes, Inc & Epazz, Inc dba K9 Bytes, Inc.
|
Publishing Industries (except Internet)
|
Term Loan
|
Prime plus 2.75%
|
10/26/2021
|
|
58.8
|
|
44.2
|
|
40.7
|
|
0.02
|
%
|
||||||||||||
|
Keans Korner, LLC d/b/a MobiMart
|
Gasoline Stations
|
Term Loan
|
Prime plus 2.75%
|
10/25/2036
|
|
938.3
|
|
881.9
|
|
888.7
|
|
0.53
|
%
|
||||||||||||
|
28 Cornelia Street Properties, LLC and Zouk, Ltd.dba Palma
|
Food Services and Drinking Places
|
Term Loan
|
Prime plus 2.75%
|
10/25/2021
|
|
22.5
|
|
16.9
|
|
16.8
|
|
0.01
|
%
|
||||||||||||
|
C & G Engines Corp.
|
Transportation Equipment Manufacturing
|
Term Loan
|
Prime plus 2.75%
|
9/30/2021
|
|
1,041.5
|
|
773.8
|
|
726.5
|
|
0.44
|
%
|
||||||||||||
|
Robert E. Caves, Sr. and American Plank dba Caves Enterprises
|
Merchant Wholesalers, Durable Goods
|
Term Loan
|
Prime plus 2.75%
|
9/30/2021
|
|
302.5
|
|
224.8
|
|
221.6
|
|
0.13
|
%
|
||||||||||||
|
PTK, Incorporated dba Night N Day 24 HR Convenience Store
|
Food and Beverage Stores
|
Term Loan
|
Prime plus 2.75%
|
9/30/2036
|
|
137.5
|
|
129.0
|
|
130.2
|
|
0.08
|
%
|
||||||||||||
|
39581 Garfield, LLC and Tri County Neurological Associates, P.C.
|
Ambulatory Health Care Services
|
Term Loan
|
Prime plus 2.75%
|
9/30/2036
|
|
83.3
|
|
78.1
|
|
79.5
|
|
0.05
|
%
|
||||||||||||
|
39581 Garfield, LLC and Tricounty Neurological Associates, P.C.
|
Ambulatory Health Care Services
|
Term Loan
|
Prime plus 2.75%
|
9/30/2036
|
|
28.5
|
|
26.6
|
|
27.1
|
|
0.02
|
%
|
||||||||||||
|
Big Apple Entertainment Partners, LLC dba Ripley's Believe it or Not
|
Amusement, Gambling, and Recreation Industries
|
Term Loan
|
Prime plus 2.75%
|
9/28/2021
|
|
1,070.0
|
|
792.3
|
|
721.8
|
|
0.43
|
%
|
||||||||||||
|
Polymer Sciences, Inc. dba Polymer Sciences, Inc.
|
Plastics and Rubber Products Manufacturing
|
Term Loan
|
Prime plus 2.75%
|
9/28/2036
|
|
422.6
|
|
396.8
|
|
403.0
|
|
0.24
|
%
|
||||||||||||
|
Equity National Capital LLC & Chadbourne Road Capital, LLC
|
Securities, Commodity Contracts, and Other Financial Investments and Related Activities
|
Term Loan
|
Prime plus 2.75%
|
9/26/2021
|
|
62.5
|
|
46.5
|
|
43.4
|
|
0.03
|
%
|
||||||||||||
|
Bryan Bantry Inc.
|
Performing Arts, Spectator Sports, and Related Industries
|
Term Loan
|
Prime plus 2.75%
|
9/8/2021
|
|
400.0
|
|
203.3
|
|
185.3
|
|
0.11
|
%
|
||||||||||||
|
SBR Technologies d/b/a Color Graphics
|
Professional, Scientific, and Technical Services
|
Term Loan
|
Prime plus 2.75%
|
8/31/2021
|
|
806.2
|
|
586.2
|
|
572.0
|
|
0.34
|
%
|
||||||||||||
|
Gator Communications Group, LLC dba Harvard Printing Group
|
Printing and Related Support Activities
|
Term Loan
|
Prime plus 2.75%
|
8/31/2021
|
|
575.0
|
|
437.3
|
|
423.9
|
|
0.25
|
%
|
||||||||||||
|
Michael S. Decker & Janet Decker dba The Hen House Cafe
|
Food Services and Drinking Places
|
Term Loan
|
Prime plus 2.75%
|
8/30/2036
|
|
16.4
|
|
15.4
|
|
15.4
|
|
0.01
|
%
|
||||||||||||
|
Qycell Corporation
|
Plastics and Rubber Products Manufacturing
|
Term Loan
|
Prime plus 2.75%
|
8/19/2021
|
|
187.5
|
|
130.4
|
|
129.9
|
|
0.08
|
%
|
||||||||||||
F-34
|
Portfolio Company
|
Industry
|
Type of Investment
|
Interest Rate
(2)
|
Maturity
|
Principal
|
Cost
|
Fair Value
|
% of Net Assets
|
|||||||||||||||||
|
Trademark Equipment Company Inc. and David A. Daniel
|
Miscellaneous Store Retailers
|
Term Loan
|
Prime plus 2.75%
|
8/19/2036
|
|
133.6
|
|
125.1
|
|
125.1
|
|
0.08
|
%
|
||||||||||||
|
A & A Auto Care, LLC d/b/a A & A Auto Care, LLC
|
Repair and Maintenance
|
Term Loan
|
Prime plus 2.75%
|
8/12/2036
|
|
101.0
|
|
94.8
|
|
96.2
|
|
0.06
|
%
|
||||||||||||
|
Valiev Ballet Academy, Inc.
|
Performing Arts, Spectator Sports, and Related Industries
|
Term Loan
|
Prime plus 2.75%
|
8/12/2036
|
|
91.5
|
|
85.7
|
|
85.2
|
|
0.05
|
%
|
||||||||||||
|
LaHoBa, LLC d/b/a Papa John's
|
Food Services and Drinking Places
|
Term Loan
|
Prime plus 2.75%
|
8/3/2036
|
|
77.5
|
|
72.1
|
|
73.5
|
|
0.04
|
%
|
||||||||||||
|
Kelly Chon, LLC dba Shi-Golf
|
Merchant Wholesalers, Durable Goods
|
Term Loan
|
Prime plus 2.75%
|
7/29/2021
|
|
17.5
|
|
9.4
|
|
9.4
|
|
0.01
|
%
|
||||||||||||
|
MTV Bowl, Inc. dba Legend Lanes
|
Amusement, Gambling, and Recreation Industries
|
Term Loan
|
Prime plus 2.75%
|
6/30/2036
|
|
248.5
|
|
232.3
|
|
234.7
|
|
0.14
|
%
|
||||||||||||
|
Lisle Lincoln II Limited Partnership dba Lisle Lanes LP
|
Amusement, Gambling, and Recreation Industries
|
Term Loan
|
Prime plus 2.75%
|
6/29/2036
|
|
338.1
|
|
326.7
|
|
335.6
|
|
0.20
|
%
|
||||||||||||
|
Jenny's Wunderland, Inc.
|
Social Assistance
|
Term Loan
|
Prime plus 2.75%
|
6/29/2036
|
|
160.5
|
|
150.4
|
|
151.2
|
|
0.09
|
%
|
||||||||||||
|
Lavertue Properties, LLP dba Lavertue Properties
|
Securities, Commodity Contracts, and Other Financial Investments and Related Activities
|
Term Loan
|
Prime plus 2.75%
|
6/29/2036
|
|
44.8
|
|
42.0
|
|
43.1
|
|
0.03
|
%
|
||||||||||||
|
Spire Investment Partners, LLC
|
Securities, Commodity Contracts, and Other Financial Investments and Related Activities
|
Term Loan
|
Prime plus 2.75%
|
6/22/2021
|
|
250.0
|
|
180.6
|
|
172.4
|
|
0.10
|
%
|
||||||||||||
|
Custom Software, Inc. a Colorado Corporation dba M-33 Access
|
Professional, Scientific, and Technical Services
|
Term Loan
|
Prime plus 2.75%
|
6/17/2021
|
|
426.0
|
|
320.4
|
|
320.1
|
|
0.19
|
%
|
||||||||||||
|
Red Star Incorporated dba Pro Import Company
|
Merchant Wholesalers, Nondurable Goods
|
Term Loan
|
Prime plus 2.75%
|
6/15/2036
|
|
184.8
|
|
172.8
|
|
175.9
|
|
0.11
|
%
|
||||||||||||
|
Pierce Developments, Inc. dba Southside Granite
|
Merchant Wholesalers, Durable Goods
|
Term Loan
|
Prime plus 2.75%
|
6/13/2036
|
|
256.1
|
|
239.1
|
|
240.4
|
|
0.14
|
%
|
||||||||||||
|
Major Queens Body & Fender Corp.
|
Repair and Maintenance
|
Term Loan
|
Prime plus 2.75%
|
6/10/2021
|
|
28.6
|
|
20.9
|
|
20.9
|
|
0.01
|
%
|
||||||||||||
|
J&K Fitness, LLC dba Physiques Womens Fitness Center
|
Amusement, Gambling, and Recreation Industries
|
Term Loan
|
Prime plus 2.75%
|
6/8/2036
|
|
449.3
|
|
421.0
|
|
428.6
|
|
0.26
|
%
|
||||||||||||
|
Peanut Butter & Co., Inc. d/b/a Peanut Butter & Co.
|
Merchant Wholesalers, Nondurable Goods
|
Term Loan
|
Prime plus 2.75%
|
6/3/2021
|
|
65.5
|
|
45.8
|
|
43.8
|
|
0.03
|
%
|
||||||||||||
|
Fleming Marketing, LLC dba Instant Imprints of Longmont
|
Printing and Related Support Activities
|
Term Loan
|
Prime plus 2.75%
|
5/31/2021
|
|
7.5
|
|
5.4
|
|
5.3
|
|
—
|
%
|
||||||||||||
|
Demand Printing Solutions, Inc. and MLM Enterprises, LLC d/b/a Demand
|
Printing and Related Support Activities
|
Term Loan
|
Prime plus 2.75%
|
5/27/2021
|
|
16.5
|
|
11.8
|
|
11.9
|
|
0.01
|
%
|
||||||||||||
F-35
|
Portfolio Company
|
Industry
|
Type of Investment
|
Interest Rate
(2)
|
Maturity
|
Principal
|
Cost
|
Fair Value
|
% of Net Assets
|
|||||||||||||||||
|
Modern on the Mile, LLC dba Ligne Roset
|
Furniture and Home Furnishings Stores
|
Term Loan
|
Prime plus 2.75%
|
5/25/2021
|
|
212.5
|
|
151.2
|
|
148.2
|
|
0.09
|
%
|
||||||||||||
|
MSM Healthcare Solutions, Inc. d/b/a BrightStar Care of Tinley Park
|
Ambulatory Health Care Services
|
Term Loan
|
Prime plus 2.75%
|
4/26/2021
|
|
46.0
|
|
32.5
|
|
31.0
|
|
0.02
|
%
|
||||||||||||
|
Music Mountain Water Company, LLC
|
Beverage and Tobacco Product Manufacturing
|
Term Loan
|
Prime plus 2.75%
|
4/25/2036
|
|
138.1
|
|
128.2
|
|
131.7
|
|
0.08
|
%
|
||||||||||||
|
Profile Performance, Inc. and Eidak Real Estate, LLC
|
Repair and Maintenance
|
Term Loan
|
Prime plus 2.75%
|
4/20/2036
|
|
127.5
|
|
118.6
|
|
121.8
|
|
0.07
|
%
|
||||||||||||
|
Northwind Outdoor Recreation, Inc. dba Red Rock Wilderness Store
|
Nonstore Retailers
|
Term Loan
|
Prime plus 2.75%
|
4/18/2036
|
|
129.5
|
|
120.4
|
|
123.7
|
|
0.07
|
%
|
||||||||||||
|
3 A Realty, LLC dba Interior Climate Solutions, Inc.
|
Specialty Trade Contractors
|
Term Loan
|
Prime plus 2.75%
|
4/13/2036
|
|
170.0
|
|
157.6
|
|
158.6
|
|
0.10
|
%
|
||||||||||||
|
Maciver Corporation dba Indie Rentals
|
Rental and Leasing Services
|
Term Loan
|
Prime plus 2.75%
|
4/4/2021
|
|
625.0
|
|
440.3
|
|
437.5
|
|
0.26
|
%
|
||||||||||||
|
Danjam Enterprises, LLC dba Ariel Dental Care
|
Ambulatory Health Care Services
|
Term Loan
|
Prime plus 2.75%
|
3/30/2021
|
|
3.8
|
|
2.7
|
|
2.7
|
|
—
|
%
|
||||||||||||
|
Danjam Enterprises, LLC dba Ariel Dental Care
|
Ambulatory Health Care Services
|
Term Loan
|
Prime plus 2.75%
|
3/29/2023
|
|
93.0
|
|
71.0
|
|
70.6
|
|
0.04
|
%
|
||||||||||||
|
Michael S. Korfe dba North Valley Auto Repair
|
Repair and Maintenance
|
Term Loan
|
Prime plus 2.75%
|
3/24/2036
|
|
15.5
|
|
14.4
|
|
14.8
|
|
0.01
|
%
|
||||||||||||
|
Actknowledge, Inc. dba Actknowledge
|
Personal and Laundry Services
|
Term Loan
|
Prime plus 2.75%
|
3/21/2021
|
|
57.3
|
|
40.1
|
|
38.2
|
|
0.02
|
%
|
||||||||||||
|
Stamford Car Wash d/b/a Stamford Car Wash
|
Repair and Maintenance
|
Term Loan
|
Prime plus 2.75%
|
3/11/2036
|
|
19.7
|
|
18.3
|
|
18.8
|
|
0.01
|
%
|
||||||||||||
|
Food & Beverage Associates Of N.J. Inc.
|
Food Services and Drinking Places
|
Term Loan
|
Prime plus 2.75%
|
3/11/2021
|
|
10.0
|
|
6.8
|
|
6.8
|
|
—
|
%
|
||||||||||||
|
Key Products I&II, Inc. dba Dunkin' Donuts/Baskin-Robbins
|
Food and Beverage Stores
|
Term Loan
|
Prime plus 2.75%
|
3/10/2021
|
|
153.0
|
|
107.0
|
|
103.1
|
|
0.06
|
%
|
||||||||||||
|
Stephen Frank, Patricia Frank and Suds Express, LLC dba Frank Chiropra
|
Ambulatory Health Care Services
|
Term Loan
|
Prime plus 2.75%
|
2/25/2023
|
|
63.0
|
|
45.9
|
|
46.1
|
|
0.03
|
%
|
||||||||||||
|
SuzyQue’s, LLC dba Suzy Que’s
|
Food Services and Drinking Places
|
Term Loan
|
Prime plus 2.75%
|
2/11/2036
|
|
61.0
|
|
56.7
|
|
58.0
|
|
0.03
|
%
|
||||||||||||
|
Little People’s Village, LLC dba Little People’s Village
|
Social Assistance
|
Term Loan
|
Prime plus 2.75%
|
1/31/2036
|
|
31.1
|
|
28.7
|
|
29.5
|
|
0.02
|
%
|
||||||||||||
|
Seagate Group Holdings, Inc. dba Seagate Logistics, Inc.
|
Support Activities for Transportation
|
Term Loan
|
Prime plus 2.75%
|
1/28/2036
|
|
113.4
|
|
104.7
|
|
107.5
|
|
0.06
|
%
|
||||||||||||
|
Joseph the Worker, Inc. d/b/a BrightStar of Plymouth County
|
Ambulatory Health Care Services
|
Term Loan
|
Prime plus 2.75%
|
1/28/2021
|
|
12.5
|
|
8.6
|
|
8.2
|
|
—
|
%
|
||||||||||||
|
Nicholas Dugger dba TNDV: Television LLC.
|
Professional, Scientific, and Technical Services
|
Term Loan
|
Prime plus 2.75%
|
1/24/2021
|
|
100.8
|
|
70.5
|
|
67.3
|
|
0.04
|
%
|
||||||||||||
|
Metro Used Cars Inc. dba Metro Auto Center
|
Motor Vehicle and Parts Dealers
|
Term Loan
|
Prime plus 2.75%
|
1/14/2027
|
|
117.6
|
|
98.5
|
|
98.6
|
|
0.06
|
%
|
||||||||||||
|
Patrageous Enterprises, LLC dba Incredibly Edible Delites of Laurel
|
Food and Beverage Stores
|
Term Loan
|
Prime plus 2.75%
|
12/29/2020
|
|
7.6
|
|
5.1
|
|
4.8
|
|
—
|
%
|
||||||||||||
F-36
|
Portfolio Company
|
Industry
|
Type of Investment
|
Interest Rate
(2)
|
Maturity
|
Principal
|
Cost
|
Fair Value
|
% of Net Assets
|
|||||||||||||||||
|
Chickamauga Properties, Inc., MSW Enterprises, LLP
|
Amusement, Gambling, and Recreation Industries
|
Term Loan
|
Prime plus 2.75%
|
12/22/2035
|
|
189.5
|
|
174.9
|
|
179.6
|
|
0.11
|
%
|
||||||||||||
|
Chickamauga Properties, Inc., MSW Enterprises, LLP
|
Amusement, Gambling, and Recreation Industries
|
Term Loan
|
Prime plus 2.75%
|
12/22/2035
|
|
74.3
|
|
68.9
|
|
70.7
|
|
0.04
|
%
|
||||||||||||
|
Marine Container Services, Inc. & Management Consulting Brokerage, Inc
|
Truck Transportation
|
Term Loan
|
Prime plus 2.75%
|
12/21/2020
|
|
50.3
|
|
33.8
|
|
33.8
|
|
0.02
|
%
|
||||||||||||
|
Shree OM Lodging, LLC dba Royal Inn
|
Accommodation
|
Term Loan
|
Prime plus 2.75%
|
12/17/2035
|
|
27.7
|
|
25.5
|
|
26.0
|
|
0.02
|
%
|
||||||||||||
|
Svetavots Corporation dba Brightstar Healthcare of Montgomery County
|
Ambulatory Health Care Services
|
Term Loan
|
Prime plus 2.75%
|
12/13/2020
|
|
20.5
|
|
13.8
|
|
13.1
|
|
0.01
|
%
|
||||||||||||
|
Lodin Medical Imaging, LLC dba Watson Imaging Center
|
Ambulatory Health Care Services
|
Term Loan
|
Prime plus 2.75%
|
12/1/2020
|
|
66.4
|
|
43.5
|
|
43.4
|
|
0.03
|
%
|
||||||||||||
|
Robert F. Schuler and Lori A. Schuler dba Bob’s Service Center
|
Repair and Maintenance
|
Term Loan
|
Prime plus 2.75%
|
11/30/2035
|
|
34.0
|
|
31.3
|
|
32.1
|
|
0.02
|
%
|
||||||||||||
|
Justforfungames, Inc.
|
Sporting Goods, Hobby, Musical Instrument, and Book Stores
|
Term Loan
|
Prime plus 2.75%
|
11/19/2035
|
|
50.0
|
|
45.3
|
|
46.4
|
|
0.03
|
%
|
||||||||||||
|
Any Garment Cleaner-East Brunswick, Inc. dba Any Garment Cleaner
|
Personal and Laundry Services
|
Term Loan
|
Prime plus 2.75%
|
11/18/2020
|
|
42.5
|
|
23.7
|
|
23.7
|
|
0.01
|
%
|
||||||||||||
|
Lebenthal Holdings, LLC and Lebenthal & Co., LLC
|
Securities, Commodity Contracts, and Other Financial Investments and Related Activities
|
Term Loan
|
Prime plus 2.75%
|
11/16/2020
|
|
200.0
|
|
133.4
|
|
127.2
|
|
0.08
|
%
|
||||||||||||
|
West Cobb Enterprises, Inc. and Advanced Eye Associates, LLC
|
Ambulatory Health Care Services
|
Term Loan
|
Prime plus 2.75%
|
11/12/2035
|
|
148.7
|
|
136.9
|
|
138.2
|
|
0.08
|
%
|
||||||||||||
|
R2 Tape, Inc. dba Presto Tape
|
Merchant Wholesalers, Nondurable Goods
|
Term Loan
|
Prime plus 2.75%
|
10/20/2020
|
|
224.4
|
|
148.2
|
|
147.4
|
|
0.09
|
%
|
||||||||||||
|
Lincoln Park Physical Therapy
|
Ambulatory Health Care Services
|
Term Loan
|
Prime plus 2.75%
|
10/20/2020
|
|
43.5
|
|
28.6
|
|
28.6
|
|
0.02
|
%
|
||||||||||||
|
Jade Automotive d/b/a Sears Hometown Store
|
Furniture and Home Furnishings Stores
|
Term Loan
|
Prime plus 2.75%
|
10/6/2035
|
|
146.6
|
|
135.0
|
|
138.6
|
|
0.08
|
%
|
||||||||||||
|
Stamford Property Holdings, LLC & Stamford Car Wash, LLC
|
Personal and Laundry Services
|
Term Loan
|
Prime plus 2.75%
|
10/4/2035
|
|
122.5
|
|
113.2
|
|
116.2
|
|
0.07
|
%
|
||||||||||||
|
Wise Forklift Inc.
|
Motor Vehicle and Parts Dealers
|
Term Loan
|
Prime plus 2.75%
|
10/1/2020
|
|
296.9
|
|
190.2
|
|
190.2
|
|
0.11
|
%
|
||||||||||||
|
Elan Realty, LLC and Albert Basse Asociates, Inc.
|
Printing and Related Support Activities
|
Term Loan
|
Prime plus 2.75%
|
9/30/2035
|
|
228.2
|
|
209.1
|
|
214.5
|
|
0.13
|
%
|
||||||||||||
|
K9 Bytes, Inc. & Epazz, Inc. dba K9 Bytes, Inc.
|
Publishing Industries (except Internet)
|
Term Loan
|
Prime plus 2.75%
|
9/30/2020
|
|
18.5
|
|
12.0
|
|
11.5
|
|
0.01
|
%
|
||||||||||||
|
Success Express, Inc. dba Success Express
|
Couriers and Messengers
|
Term Loan
|
Prime plus 2.75%
|
9/29/2020
|
|
91.8
|
|
59.6
|
|
56.8
|
|
0.03
|
%
|
||||||||||||
|
Adams & Hancock, LLC dba Brightstar Overland Park & Jordon & Pippen, LLC
|
Ambulatory Health Care Services
|
Term Loan
|
Prime plus 2.75%
|
9/27/2020
|
|
19.8
|
|
8.0
|
|
8.0
|
|
—
|
%
|
||||||||||||
F-37
|
Portfolio Company
|
Industry
|
Type of Investment
|
Interest Rate
(2)
|
Maturity
|
Principal
|
Cost
|
Fair Value
|
% of Net Assets
|
|||||||||||||||||
|
Modern Manhattan, LLC
|
Furniture and Home Furnishings Stores
|
Term Loan
|
Prime plus 2.75%
|
9/20/2020
|
|
204.0
|
|
133.1
|
|
127.6
|
|
0.08
|
%
|
||||||||||||
|
Dirk's Trucking, LLC dba Dirk's Trucking
|
Truck Transportation
|
Term Loan
|
Prime plus 2.75%
|
9/17/2020
|
|
17.7
|
|
11.4
|
|
11.1
|
|
0.01
|
%
|
||||||||||||
|
Newsome Trucking Inc. and Kevin Newsome
|
Truck Transportation
|
Term Loan
|
Prime plus 2.75%
|
9/2/2035
|
|
423.1
|
|
387.7
|
|
397.9
|
|
0.24
|
%
|
||||||||||||
|
California College of Communications, Inc.
|
Educational Services
|
Term Loan
|
Prime plus 2.75%
|
11/2/2020
|
|
172.5
|
|
113.9
|
|
108.6
|
|
0.07
|
%
|
||||||||||||
|
Rudy & Louise Chavez dba Clyde's Auto and Furniture Upholstery
|
Repair and Maintenance
|
Term Loan
|
Prime plus 2.75%
|
9/2/2035
|
|
50.1
|
|
45.9
|
|
47.1
|
|
0.03
|
%
|
||||||||||||
|
DDLK Investments, LLC d/b/a Smoothie King
|
Food Services and Drinking Places
|
Term Loan
|
Prime plus 2.75%
|
8/30/2020
|
|
7.5
|
|
4.5
|
|
4.5
|
|
—
|
%
|
||||||||||||
|
Kino Oil of Texas, LLC dba Kino Oil
|
Merchant Wholesalers, Nondurable Goods
|
Term Loan
|
Prime plus 2.75%
|
8/27/2020
|
|
60.0
|
|
38.5
|
|
36.7
|
|
0.02
|
%
|
||||||||||||
|
Kino Oil of Texas, LLC dba Kino Company
|
Merchant Wholesalers, Nondurable Goods
|
Term Loan
|
Prime plus 2.75%
|
8/27/2035
|
|
12.0
|
|
10.8
|
|
11.1
|
|
0.01
|
%
|
||||||||||||
|
Planet Verte, LLC d/b/a Audio Unlimited
|
Professional, Scientific, and Technical Services
|
Term Loan
|
Prime plus 2.75%
|
9/20/2020
|
|
40.0
|
|
25.8
|
|
24.7
|
|
0.01
|
%
|
||||||||||||
|
Sunmar, Inc. dba Creative Cooking
|
Food Services and Drinking Places
|
Term Loan
|
Prime plus 2.75%
|
8/19/2035
|
|
51.7
|
|
47.4
|
|
48.6
|
|
0.03
|
%
|
||||||||||||
|
Members Only Software
|
Professional, Scientific, and Technical Services
|
Term Loan
|
Prime plus 2.75%
|
8/30/2020
|
|
40.3
|
|
25.7
|
|
25.1
|
|
0.02
|
%
|
||||||||||||
|
New Life Holdings, LLC and Certified Collision Services, Inc.
|
Repair and Maintenance
|
Term Loan
|
Prime plus 2.75%
|
7/29/2035
|
|
76.2
|
|
68.7
|
|
69.8
|
|
0.04
|
%
|
||||||||||||
|
Quest Logic Investments, LLC dba Dairy Queen
|
Food Services and Drinking Places
|
Term Loan
|
Prime plus 2.75%
|
6/30/2035
|
|
105.0
|
|
95.8
|
|
98.6
|
|
0.06
|
%
|
||||||||||||
|
ActKnowledge, Inc dba ActKnowledge
|
Personal and Laundry Services
|
Term Loan
|
Prime plus 2.75%
|
6/30/2020
|
|
50.0
|
|
31.4
|
|
31.5
|
|
0.02
|
%
|
||||||||||||
|
I-90 RV & Auto Supercenter
|
Motor Vehicle and Parts Dealers
|
Term Loan
|
Prime plus 2.75%
|
6/29/2035
|
|
74.9
|
|
68.2
|
|
70.3
|
|
0.04
|
%
|
||||||||||||
|
WeaverVentures, Inc. dba The UPS Store
|
Postal Service
|
Term Loan
|
Prime plus 2.75%
|
7/28/2020
|
|
23.8
|
|
15.1
|
|
14.7
|
|
0.01
|
%
|
||||||||||||
|
Zouk, Ltd. dba Palma
|
Food Services and Drinking Places
|
Term Loan
|
Prime plus 2.75%
|
8/25/2020
|
|
27.5
|
|
17.7
|
|
17.7
|
|
0.01
|
%
|
||||||||||||
|
CJ Park Inc. dba Kidville Midtown West
|
Educational Services
|
Term Loan
|
Prime plus 2.75%
|
6/25/2020
|
|
26.4
|
|
13.3
|
|
12.9
|
|
0.01
|
%
|
||||||||||||
|
Emotion in Motion Dance Center Limited Liability Company
|
Personal and Laundry Services
|
Term Loan
|
Prime plus 2.75%
|
7/25/2020
|
|
5.4
|
|
2.7
|
|
2.7
|
|
—
|
%
|
||||||||||||
|
H.H. Leonards Trust and Potomac Fund, LLC
|
Accommodation
|
Term Loan
|
Prime plus 2.75%
|
7/23/2020
|
|
62.0
|
|
24.0
|
|
24.0
|
|
0.01
|
%
|
||||||||||||
|
B&B Fitness and Barbell, Inc. dba Elevations Health Club
|
Amusement, Gambling, and Recreation Industries
|
Term Loan
|
Prime plus 2.75%
|
6/22/2035
|
|
242.1
|
|
221.5
|
|
226.4
|
|
0.14
|
%
|
||||||||||||
F-38
|
Portfolio Company
|
Industry
|
Type of Investment
|
Interest Rate
(2)
|
Maturity
|
Principal
|
Cost
|
Fair Value
|
% of Net Assets
|
|||||||||||||||||
|
Tanner Optical Inc. dba Murphy Eye Care
|
Ambulatory Health Care Services
|
Term Loan
|
Prime plus 2.75%
|
6/22/2035
|
|
94.6
|
|
86.6
|
|
88.0
|
|
0.05
|
%
|
||||||||||||
|
M & H Pine Straw, Inc. and Harris Maloy
|
Support Activities for Agriculture and Forestry
|
Term Loan
|
Prime plus 2.75%
|
7/10/2020
|
|
67.5
|
|
42.8
|
|
42.3
|
|
0.03
|
%
|
||||||||||||
|
Excel RP, Inc./Kevin and Joann Foley
|
Machinery Manufacturing
|
Term Loan
|
Prime plus 2.75%
|
7/8/2028
|
|
50.0
|
|
42.1
|
|
42.8
|
|
0.03
|
%
|
||||||||||||
|
ValleyStar, Inc. dba BrightStar Healthcare
|
Ambulatory Health Care Services
|
Term Loan
|
Prime plus 2.75%
|
6/28/2020
|
|
7.5
|
|
4.7
|
|
4.6
|
|
—
|
%
|
||||||||||||
|
ValleyStar, Inc. dba BrightStar HealthCare
|
Ambulatory Health Care Services
|
Term Loan
|
Prime plus 2.75%
|
6/28/2020
|
|
0.6
|
|
3.8
|
|
3.7
|
|
—
|
%
|
||||||||||||
|
Atlanta Vascular Research Organization, Inc. dba Atlanta Vascular Found
|
Professional, Scientific, and Technical Services
|
Term Loan
|
Prime plus 2.75%
|
8/6/2020
|
|
24.3
|
|
15.6
|
|
15.6
|
|
0.01
|
%
|
||||||||||||
|
Diag, LLC dba Kidville
|
Educational Services
|
Term Loan
|
Prime plus 2.75%
|
6/21/2020
|
|
37.5
|
|
23.1
|
|
22.5
|
|
0.01
|
%
|
||||||||||||
|
Danjam Enterprises, LLC dba Ariel Dental Care
|
Ambulatory Health Care Services
|
Term Loan
|
Prime plus 2.75%
|
3/31/2035
|
|
204.0
|
|
185.2
|
|
188.7
|
|
0.11
|
%
|
||||||||||||
|
M & H Pine Straw, Inc. and Harris L. Maloy
|
Support Activities for Agriculture and Forestry
|
Term Loan
|
6%
|
4/30/2020
|
|
183.3
|
|
111.8
|
|
110.5
|
|
0.07
|
%
|
||||||||||||
|
Clearbay Enterprises, Inc. dba First Class Kennels
|
Personal and Laundry Services
|
Term Loan
|
Prime plus 2.75%
|
4/30/2034
|
|
60.0
|
|
53.9
|
|
55.4
|
|
0.03
|
%
|
||||||||||||
|
New Economic Methods, LLC dba Rita's
|
Food Services and Drinking Places
|
Term Loan
|
Prime plus 2.75%
|
7/15/2020
|
|
24.8
|
|
1.1
|
|
1.1
|
|
—
|
%
|
||||||||||||
|
Cocoa Beach Parasail Corp. dba Cocoa Beach Parasail
|
Amusement, Gambling, and Recreation Industries
|
Term Loan
|
Prime plus 2.75%
|
4/26/2020
|
|
6.3
|
|
3.8
|
|
3.7
|
|
—
|
%
|
||||||||||||
|
Marine Container Services, Inc.
|
Truck Transportation
|
Term Loan
|
Prime plus 2.75%
|
4/25/2020
|
|
142.6
|
|
76.4
|
|
76.4
|
|
0.05
|
%
|
||||||||||||
|
JRJG, Inc. dba BrightStar HealthCare-Naperville/Oak Brook
|
Ambulatory Health Care Services
|
Term Loan
|
Prime plus 2.75%
|
4/23/2020
|
|
15.0
|
|
9.1
|
|
8.9
|
|
0.01
|
%
|
||||||||||||
|
Caring Hands Pediatrics, P.C. dba Caring Hands Pediatrics
|
Ambulatory Health Care Services
|
Term Loan
|
Prime plus 2.75%
|
4/9/2020
|
|
14.5
|
|
8.9
|
|
8.6
|
|
0.01
|
%
|
||||||||||||
|
Vortex Automotive, LLC
|
Repair and Maintenance
|
Term Loan
|
Prime plus 2.75%
|
3/5/2035
|
|
76.6
|
|
69.4
|
|
71.0
|
|
0.04
|
%
|
||||||||||||
|
Adams and Hancock, LLC dba BrightStar Overland Park
|
Ambulatory Health Care Services
|
Term Loan
|
Prime plus 2.75%
|
3/31/2020
|
|
43.6
|
|
21.6
|
|
21.1
|
|
0.01
|
%
|
||||||||||||
|
ATC Fitness, LLC dba Around the Clock Fitness
|
Amusement, Gambling, and Recreation Industries
|
Term Loan
|
Prime plus 2.75%
|
2/28/2019
|
|
15.0
|
|
8.0
|
|
8.0
|
|
—
|
%
|
||||||||||||
|
Lahoba, LLC dba Papa John's Pizza
|
Food Services and Drinking Places
|
Term Loan
|
Prime plus 2.75%
|
12/30/2034
|
|
42.5
|
|
38.4
|
|
39.2
|
|
0.02
|
%
|
||||||||||||
|
Music Mountain Water Company, LLC dba Music Mountain Water Co.
|
Beverage and Tobacco Product Manufacturing
|
Term Loan
|
Prime plus 2.75%
|
12/29/2019
|
|
185.4
|
|
107.6
|
|
107.7
|
|
0.06
|
%
|
||||||||||||
|
Animal Intrusion Prevention Systems Holding Company, LLC
|
Administrative and Support Services
|
Term Loan
|
Prime plus 2.75%
|
3/29/2024
|
|
126.5
|
|
94.9
|
|
94.4
|
|
0.06
|
%
|
||||||||||||
F-39
|
Portfolio Company
|
Industry
|
Type of Investment
|
Interest Rate
(2)
|
Maturity
|
Principal
|
Cost
|
Fair Value
|
% of Net Assets
|
|||||||||||||||||
|
Bonet Kidz Inc. dba Kidville
|
Educational Services
|
Term Loan
|
Prime plus 2.75%
|
3/16/2020
|
|
15.5
|
|
6.4
|
|
6.3
|
|
—
|
%
|
||||||||||||
|
CMA Consulting dba Construction Management Associates
|
Construction of Buildings
|
Term Loan
|
Prime plus 2.75%
|
12/11/2019
|
|
58.5
|
|
32.9
|
|
32.0
|
|
0.02
|
%
|
||||||||||||
|
David A. Nusblatt, D.M.D, P.C.
|
Ambulatory Health Care Services
|
Term Loan
|
Prime plus 2.75%
|
12/11/2019
|
|
9.0
|
|
5.2
|
|
5.2
|
|
—
|
%
|
||||||||||||
|
KMC RE, LLC & B&B Kennels
|
Personal and Laundry Services
|
Term Loan
|
Prime plus 2.75%
|
11/19/2034
|
|
58.3
|
|
52.4
|
|
53.5
|
|
0.03
|
%
|
||||||||||||
|
Demand Printing Solutions, Inc.
|
Printing and Related Support Activities
|
Term Loan
|
Prime plus 2.75%
|
12/12/2019
|
|
10.0
|
|
5.7
|
|
5.7
|
|
—
|
%
|
||||||||||||
|
Planet Verte, LLC dba Audio Unlimited of Oceanside
|
Administrative and Support Services
|
Term Loan
|
Prime plus 2.75%
|
11/28/2019
|
|
57.0
|
|
32.2
|
|
31.4
|
|
0.02
|
%
|
||||||||||||
|
Demand Printing Solutions, Inc.
|
Printing and Related Support Activities
|
Term Loan
|
Prime plus 2.75%
|
10/29/2034
|
|
147.5
|
|
132.4
|
|
136.1
|
|
0.08
|
%
|
||||||||||||
|
Lebenthal Holdings, LLC and Lebenthal & Co., LLC
|
Securities, Commodity Contracts, and Other Financial Investments and Related Activities
|
Term Loan
|
Prime plus 2.75%
|
6/29/2019
|
|
500.0
|
|
53.0
|
|
52.5
|
|
0.03
|
%
|
||||||||||||
|
Supreme Screw Products, Inc. and Misha Migdal
|
Fabricated Metal Product Manufacturing
|
Term Loan
|
Prime plus 2.75%
|
4/17/2019
|
|
308.2
|
|
152.5
|
|
152.5
|
|
0.09
|
%
|
||||||||||||
|
Gray Tree Service, Inc.
|
Administrative and Support Services
|
Term Loan
|
Prime plus 2.75%
|
12/18/2018
|
|
50.0
|
|
23.7
|
|
23.7
|
|
0.01
|
%
|
||||||||||||
|
Healthcare Interventions, Inc. dba Brightstar HealthCare
|
Ambulatory Health Care Services
|
Term Loan
|
Prime plus 2.75%
|
3/15/2016
|
|
8.3
|
|
1.4
|
|
1.4
|
|
—
|
%
|
||||||||||||
|
Envy Salon & Spa, LLC
|
Personal and Laundry Services
|
Term Loan
|
Prime plus 2.75%
|
12/4/2018
|
|
20.3
|
|
9.4
|
|
9.3
|
|
0.01
|
%
|
||||||||||||
|
Gourmet to You, Inc.
|
Food Services and Drinking Places
|
Term Loan
|
Prime plus 2.75%
|
2/28/2019
|
|
12.1
|
|
5.7
|
|
5.7
|
|
—
|
%
|
||||||||||||
|
Carnagron, LLC dba GearBling
|
Apparel Manufacturing
|
Term Loan
|
Prime plus 2.75%
|
11/1/2018
|
|
6.9
|
|
3.1
|
|
3.1
|
|
—
|
%
|
||||||||||||
|
Grapevine Professional Services, Inc.
|
Administrative and Support Services
|
Term Loan
|
Prime plus 2.75%
|
1/22/2019
|
|
8.2
|
|
3.8
|
|
3.7
|
|
—
|
%
|
||||||||||||
|
Inflate World Corporation
|
Amusement, Gambling, and Recreation Industries
|
Term Loan
|
Prime plus 2.75%
|
9/30/2018
|
|
7.5
|
|
2.6
|
|
2.6
|
|
—
|
%
|
||||||||||||
|
Cool Air Solutions, Inc. dba Graham Heating & Air Conditioning
|
Specialty Trade Contractors
|
Term Loan
|
Prime plus 2%
|
12/27/2018
|
|
411.5
|
|
190.3
|
|
187.0
|
|
0.11
|
%
|
||||||||||||
|
Peter Thomas Roth Labs, LLC
|
Merchant Wholesalers, Durable Goods
|
Term Loan
|
Prime plus 2.75%
|
9/26/2018
|
|
425.0
|
|
189.0
|
|
188.5
|
|
0.11
|
%
|
||||||||||||
|
Dream Envy, Ltd. d/b/a Massage Envy
|
Personal and Laundry Services
|
Term Loan
|
Prime plus 2.75%
|
11/9/2018
|
|
88.0
|
|
39.8
|
|
39.7
|
|
0.02
|
%
|
||||||||||||
|
K & D Family and Associates, Inc. dba Philly Pretzel Factory
|
Food and Beverage Stores
|
Term Loan
|
Prime plus 2.75%
|
8/5/2018
|
|
81.3
|
|
35.2
|
|
35.2
|
|
0.02
|
%
|
||||||||||||
|
Seven Stars Enterprises, Inc. dba Atlanta Bread Company
|
Food Services and Drinking Places
|
Term Loan
|
Prime plus 2.75%
|
6/30/2018
|
|
86.3
|
|
36.0
|
|
36.0
|
|
0.02
|
%
|
||||||||||||
F-40
|
Portfolio Company
|
Industry
|
Type of Investment
|
Interest Rate
(2)
|
Maturity
|
Principal
|
Cost
|
Fair Value
|
% of Net Assets
|
|||||||||||||||||
|
CBA D&A Pope, LLC dba Christian Brothers Automotive
|
Repair and Maintenance
|
Term Loan
|
Prime plus 2.75%
|
6/14/2018
|
|
144.9
|
|
61.5
|
|
61.3
|
|
0.04
|
%
|
||||||||||||
|
Gilbert Chiropractic Clinic, Inc.
|
Ambulatory Health Care Services
|
Term Loan
|
Prime plus 2.75%
|
6/7/2018
|
|
22.5
|
|
9.1
|
|
9.1
|
|
0.01
|
%
|
||||||||||||
|
Beer Table, LLC
|
Food Services and Drinking Places
|
Term Loan
|
Prime plus 2.75%
|
5/8/2018
|
|
10.5
|
|
3.7
|
|
3.7
|
|
—
|
%
|
||||||||||||
|
D & D's Divine Beauty School of Esther, LLC
|
Educational Services
|
Term Loan
|
6%
|
8/1/2031
|
|
57.7
|
|
53.9
|
|
55.4
|
|
0.03
|
%
|
||||||||||||
|
Daniel S. Fitzpatrick dba Danny's Mobile Appearance Reconditioning Service
|
Repair and Maintenance
|
Term Loan
|
Prime plus 2.75%
|
3/29/2018
|
|
9.4
|
|
3.7
|
|
3.7
|
|
—
|
%
|
||||||||||||
|
Burks & Sons Development, LLC dba Tropical Smoothie Café
|
Food Services and Drinking Places
|
Term Loan
|
Prime plus 2.75%
|
3/22/2018
|
|
49.8
|
|
19.6
|
|
19.7
|
|
0.01
|
%
|
||||||||||||
|
Shivsakti, LLC dba Knights Inn
|
Accommodation
|
Term Loan
|
Prime plus 2.75%
|
12/20/2032
|
|
92.5
|
|
78.9
|
|
81.2
|
|
0.05
|
%
|
||||||||||||
|
Bliss Coffee and Wine Bar, LLC
|
Food Services and Drinking Places
|
Term Loan
|
6%
|
3/19/2018
|
|
87.5
|
|
73.0
|
|
72.8
|
|
0.04
|
%
|
||||||||||||
|
Zog Inc.
|
Other Information Services
|
Term Loan
|
6%
|
3/17/2018
|
|
97.5
|
|
81.9
|
|
81.6
|
|
0.05
|
%
|
||||||||||||
|
Saan M.Saelee dba Saelee's Delivery Service
|
Truck Transportation
|
Term Loan
|
Prime plus 2.75%
|
3/12/2018
|
|
9.8
|
|
3.9
|
|
3.9
|
|
—
|
%
|
||||||||||||
|
A & A Acquisition, Inc. dba A & A International
|
Fabricated Metal Product Manufacturing
|
Term Loan
|
Prime plus 2.75%
|
2/15/2018
|
|
100.0
|
|
37.7
|
|
37.7
|
|
0.02
|
%
|
||||||||||||
|
Enewhere Custom Canvas, LLC
|
Textile Product Mills
|
Term Loan
|
Prime plus 2.75%
|
2/15/2018
|
|
12.0
|
|
4.7
|
|
4.7
|
|
—
|
%
|
||||||||||||
|
All American Printing
|
Printing and Related Support Activities
|
Term Loan
|
Prime plus 2.75%
|
10/26/2032
|
|
69.8
|
|
40.1
|
|
41.3
|
|
0.02
|
%
|
||||||||||||
|
Seo's Paradise Cleaners, Inc.
|
Personal and Laundry Services
|
Term Loan
|
Prime plus 2.75%
|
1/19/2018
|
|
9.8
|
|
3.2
|
|
3.2
|
|
—
|
%
|
||||||||||||
|
Signs of Fortune, LLC dba FastSigns
|
Miscellaneous Manufacturing
|
Term Loan
|
Prime plus 2.5%
|
4/3/2023
|
|
434.4
|
|
349.6
|
|
348.7
|
|
0.21
|
%
|
||||||||||||
|
Margab, Inc. dba Smoothie King
|
Food Services and Drinking Places
|
Term Loan
|
Prime plus 2.75%
|
12/28/2017
|
|
44.0
|
|
16.2
|
|
16.1
|
|
0.01
|
%
|
||||||||||||
|
Ameritocracy, Inc dba Ben and Jerry's
|
Food Services and Drinking Places
|
Term Loan
|
Prime plus 2.75%
|
12/18/2017
|
|
168.8
|
|
59.7
|
|
59.7
|
|
0.04
|
%
|
||||||||||||
|
RCB Enterprises, Inc.
|
Administrative and Support Services
|
Term Loan
|
Prime plus 2.75%
|
12/18/2017
|
|
21.2
|
|
9.6
|
|
9.5
|
|
0.01
|
%
|
||||||||||||
|
Timothy S. Strange dba Strange's Mobile Apperance Reconditioning Service
|
Repair and Maintenance
|
Term Loan
|
Prime plus 2.75%
|
12/17/2017
|
|
8.5
|
|
2.4
|
|
2.4
|
|
—
|
%
|
||||||||||||
|
Parties By Pat, Inc. and Jose M. Martinez Jr.
|
Food Services and Drinking Places
|
Term Loan
|
Prime plus 2.75%
|
12/11/2017
|
|
93.1
|
|
33.4
|
|
33.2
|
|
0.02
|
%
|
||||||||||||
|
Tammy's Bakery, Inc. dba Tammy's Bakery
|
Food Manufacturing
|
Term Loan
|
Prime plus 2.75%
|
12/10/2017
|
|
71.8
|
|
26.7
|
|
26.5
|
|
0.02
|
%
|
||||||||||||
|
Maria C. Sathre and David N. Sathre dba Black Forest Liquor Store
|
Food and Beverage Stores
|
Term Loan
|
Prime plus 2.75%
|
11/28/2017
|
|
18.6
|
|
6.6
|
|
6.6
|
|
—
|
%
|
||||||||||||
F-41
|
Portfolio Company
|
Industry
|
Type of Investment
|
Interest Rate
(2)
|
Maturity
|
Principal
|
Cost
|
Fair Value
|
% of Net Assets
|
|||||||||||||||||
|
The Design Shop, LLC
|
Textile Mills
|
Term Loan
|
Prime plus 2.75%
|
11/27/2027
|
|
247.5
|
|
191.9
|
|
196.0
|
|
0.12
|
%
|
||||||||||||
|
MJ Mortgage & Tax Services, Inc.
|
Credit Intermediation and Related Activities
|
Term Loan
|
Prime plus 2.75%
|
11/14/2017
|
|
6.9
|
|
2.3
|
|
2.3
|
|
—
|
%
|
||||||||||||
|
Kings Laundry, LLC
|
Personal and Laundry Services
|
Term Loan
|
Prime plus 2.75%
|
10/30/2017
|
|
64.5
|
|
23.0
|
|
23.0
|
|
0.01
|
%
|
||||||||||||
|
Quality Engraving Services Inc. and Ian M. Schnaitman
|
Miscellaneous Store Retailers
|
Term Loan
|
Prime plus 2.75%
|
10/17/2017
|
|
15.0
|
|
5.3
|
|
5.3
|
|
—
|
%
|
||||||||||||
|
Flourishing Fruits, LLC dba Edible Arrangements
|
Food Manufacturing
|
Term Loan
|
Prime plus 2.75%
|
12/29/2017
|
|
21.1
|
|
5.6
|
|
5.6
|
|
—
|
%
|
||||||||||||
|
Louis B. Smith dba LAQ Funeral Coach
|
Transit and Ground Passenger Transportation
|
Term Loan
|
Prime plus 2.75%
|
9/15/2017
|
|
12.6
|
|
4.3
|
|
4.3
|
|
—
|
%
|
||||||||||||
|
Flint Batteries, LLC dba Batteries Plus of Flint
|
General Merchandise Stores
|
Term Loan
|
Prime plus 2.75%
|
8/29/2017
|
|
9.0
|
|
2.6
|
|
2.6
|
|
—
|
%
|
||||||||||||
|
1911 East Main Street Holdings, Corp.
|
Repair and Maintenance
|
Term Loan
|
Prime plus 2.75%
|
5/18/2032
|
|
15.8
|
|
13.3
|
|
13.7
|
|
0.01
|
%
|
||||||||||||
|
Metano IBC Services, Inc. and Stone Brook Leasing, LLC
|
Rental and Leasing Services
|
Term Loan
|
Prime plus 2.75%
|
8/17/2017
|
|
315.0
|
|
87.2
|
|
87.3
|
|
0.05
|
%
|
||||||||||||
|
Mala Iyer, MD dba Child and Family Wellness Center
|
Ambulatory Health Care Services
|
Term Loan
|
Prime plus 2.75%
|
8/11/2017
|
|
50.0
|
|
16.8
|
|
16.8
|
|
0.01
|
%
|
||||||||||||
|
South Dade Restoration Corp. dba Servpro of Kendall/Pinecrest
|
Administrative and Support Services
|
Term Loan
|
Prime plus 2.75%
|
8/10/2016
|
|
61.8
|
|
11.5
|
|
11.5
|
|
0.01
|
%
|
||||||||||||
|
Twietmeyer Dentistry PA
|
Ambulatory Health Care Services
|
Term Loan
|
Prime plus 2.75%
|
6/30/2017
|
|
148.9
|
|
47.1
|
|
47.1
|
|
0.03
|
%
|
||||||||||||
|
Lynden Evans Clarke, Jr.
|
Food Services and Drinking Places
|
Term Loan
|
Prime plus 2.75%
|
3/16/2017
|
|
10.0
|
|
2.9
|
|
2.9
|
|
—
|
%
|
||||||||||||
|
Water Works Laundromat, LLC
|
Personal and Laundry Services
|
Term Loan
|
Prime plus 2.25%
|
9/7/2027
|
|
267.3
|
|
204.5
|
|
203.0
|
|
0.12
|
%
|
||||||||||||
|
L.C.N. Investments, L.L.C. dba Max Muscle Sports Nutrition
|
Clothing and Clothing Accessories Stores
|
Term Loan
|
Prime plus 2.75%
|
5/27/2017
|
|
12.8
|
|
3.3
|
|
3.3
|
|
—
|
%
|
||||||||||||
|
Dave Kris, and MDK Ram Corp.
|
Food and Beverage Stores
|
Term Loan
|
Prime plus 2.75%
|
2/5/2026
|
|
221.0
|
|
37.6
|
|
38.3
|
|
0.02
|
%
|
||||||||||||
|
Saul A. Ramirez and Norma L. Trujillo
|
Food Services and Drinking Places
|
Term Loan
|
Prime plus 2.75%
|
1/31/2017
|
|
6.0
|
|
1.6
|
|
1.6
|
|
—
|
%
|
||||||||||||
|
Eric R. Wise, D.C. dba Jamacha-Chase Chiropractic
|
Ambulatory Health Care Services
|
Term Loan
|
Prime plus 2.75%
|
4/30/2017
|
|
15.6
|
|
1.2
|
|
1.2
|
|
—
|
%
|
||||||||||||
|
No Thirst Software, LLC
|
Professional, Scientific, and Technical Services
|
Term Loan
|
Prime plus 2.75%
|
4/26/2017
|
|
6.8
|
|
1.5
|
|
1.5
|
|
—
|
%
|
||||||||||||
|
Zeroln Media, LLC
|
Data Processing, Hosting, and Related Services
|
Term Loan
|
Prime plus 2.75%
|
4/25/2017
|
|
7.5
|
|
2.2
|
|
2.2
|
|
—
|
%
|
||||||||||||
|
CCIPTA, LLC
|
Clothing and Clothing Accessories Stores
|
Term Loan
|
Prime plus 2.75%
|
1/17/2017
|
|
47.0
|
|
3.0
|
|
3.0
|
|
—
|
%
|
||||||||||||
F-42
|
Portfolio Company
|
Industry
|
Type of Investment
|
Interest Rate
(2)
|
Maturity
|
Principal
|
Cost
|
Fair Value
|
% of Net Assets
|
|||||||||||||||||
|
Gill Express Inc. dba American Eagle Truck Wash
|
Repair and Maintenance
|
Term Loan
|
Prime plus 2.75%
|
1/5/2027
|
|
286.9
|
|
213.1
|
|
217.6
|
|
0.13
|
%
|
||||||||||||
|
Kyoshi Enterprises, LLC
|
Educational Services
|
Term Loan
|
Prime plus 2.75%
|
12/29/2016
|
|
22.5
|
|
5.8
|
|
5.8
|
|
—
|
%
|
||||||||||||
|
Spain Street, LLC
|
Food Services and Drinking Places
|
Term Loan
|
Prime plus 2.75%
|
6/29/2017
|
|
63.0
|
|
4.5
|
|
4.5
|
|
—
|
%
|
||||||||||||
|
Aillaud Enterprises, LLC
|
Amusement, Gambling, and Recreation Industries
|
Term Loan
|
Prime plus 2.75%
|
3/29/2017
|
|
13.8
|
|
0.9
|
|
0.9
|
|
—
|
%
|
||||||||||||
|
Nora A. Palma and Julio O Villcas
|
Food Services and Drinking Places
|
Term Loan
|
Prime plus 2.75%
|
6/27/2017
|
|
56.3
|
|
3.1
|
|
3.1
|
|
—
|
%
|
||||||||||||
|
Jojan, Inc.
|
Professional, Scientific, and Technical Services
|
Term Loan
|
Prime plus 2.25%
|
12/18/2031
|
|
204.8
|
|
41.0
|
|
40.7
|
|
0.02
|
%
|
||||||||||||
|
Misri Liquors, Inc.
|
Food and Beverage Stores
|
Term Loan
|
Prime plus 2.75%
|
12/18/2016
|
|
67.5
|
|
16.7
|
|
16.7
|
|
0.01
|
%
|
||||||||||||
|
Contractors Pumping Service, Inc.
|
Specialty Trade Contractors
|
Term Loan
|
Prime plus 2.75%
|
11/3/2016
|
|
9.9
|
|
0.9
|
|
0.9
|
|
—
|
%
|
||||||||||||
|
Vincent Allen Fleece dba Living Well Accessories and Water Camel
|
Building Material and Garden Equipment and Supplies Dealers
|
Term Loan
|
Prime plus 2.75%
|
11/1/2016
|
|
3.8
|
|
0.8
|
|
0.8
|
|
—
|
%
|
||||||||||||
|
Houk Enterprises, Inc. d/b/a Max Muscle
|
Health and Personal Care Stores
|
Term Loan
|
Prime plus 2.75%
|
10/27/2019
|
|
46.3
|
|
8.1
|
|
8.2
|
|
—
|
%
|
||||||||||||
|
Smooth Grounds, Inc.
|
Food Services and Drinking Places
|
Term Loan
|
8%
|
10/11/2016
|
|
64.5
|
|
39.3
|
|
39.3
|
|
0.02
|
%
|
||||||||||||
|
Barr-None Coating Applicators, Inc.
|
Specialty Trade Contractors
|
Term Loan
|
Prime plus 2.75%
|
9/20/2016
|
|
113.8
|
|
5.3
|
|
5.3
|
|
—
|
%
|
||||||||||||
|
Nelson Financial Services, LLC
|
Scenic and Sightseeing Transportation
|
Term Loan
|
Prime plus 2.75%
|
9/2/2016
|
|
57.0
|
|
3.0
|
|
3.0
|
|
—
|
%
|
||||||||||||
|
A + Quality Home Health Care, Inc.
|
Ambulatory Health Care Services
|
Term Loan
|
Prime plus 2.75%
|
8/1/2016
|
|
22.5
|
|
1.7
|
|
1.7
|
|
—
|
%
|
||||||||||||
|
Flint Batteries, LLC
|
General Merchandise Stores
|
Term Loan
|
Prime plus 2.75%
|
7/21/2016
|
|
46.9
|
|
7.9
|
|
7.9
|
|
—
|
%
|
||||||||||||
|
Tesserah Tile Design, Inc.
|
Specialty Trade Contractors
|
Term Loan
|
Prime plus 2.75%
|
6/29/2016
|
|
7.1
|
|
1.1
|
|
1.1
|
|
—
|
%
|
||||||||||||
|
It's A Buffalo
|
Food Services and Drinking Places
|
Term Loan
|
Prime plus 2.75%
|
5/26/2016
|
|
219.8
|
|
39.6
|
|
39.6
|
|
0.02
|
%
|
||||||||||||
|
Pro Levin Yoga, Incorporated d.b.a. Bikram's Yoga College
|
Educational Services
|
Term Loan
|
Prime plus 2.75%
|
5/12/2016
|
|
16.4
|
|
3.1
|
|
3.1
|
|
—
|
%
|
||||||||||||
|
Cocoa Beach Parasail Corp.
|
Amusement, Gambling, and Recreation Industries
|
Term Loan
|
Prime plus 2.75%
|
5/5/2016
|
|
8.9
|
|
1.6
|
|
1.6
|
|
—
|
%
|
||||||||||||
|
Maynard Enterprises, Inc.
|
Miscellaneous Manufacturing
|
Term Loan
|
Prime plus 2.75%
|
3/22/2016
|
|
22.5
|
|
1.4
|
|
1.4
|
|
—
|
%
|
||||||||||||
|
Fran-Car Corporation dba Horizon Landscape Management
|
Administrative and Support Services
|
Term Loan
|
Prime plus 2.75%
|
3/3/2028
|
|
407.8
|
|
179.8
|
|
184.0
|
|
0.11
|
%
|
||||||||||||
F-43
|
Portfolio Company
|
Industry
|
Type of Investment
|
Interest Rate
(2)
|
Maturity
|
Principal
|
Cost
|
Fair Value
|
% of Net Assets
|
|||||||||||||||||
|
Head To Toe Personalized Pampering, Inc.
|
Personal and Laundry Services
|
Term Loan
|
Prime plus 2.75%
|
1/27/2031
|
|
52.0
|
|
9.8
|
|
10.0
|
|
0.01
|
%
|
||||||||||||
|
Olympia Fields Eyecare, Ltd.
|
Ambulatory Health Care Services
|
Term Loan
|
Prime plus 2.75%
|
1/12/2016
|
|
15.0
|
|
1.9
|
|
1.9
|
|
—
|
%
|
||||||||||||
|
Spencer Fitness, Inc.
|
Personal and Laundry Services
|
Term Loan
|
Prime plus 2.75%
|
1/11/2016
|
|
6.0
|
|
0.3
|
|
0.3
|
|
—
|
%
|
||||||||||||
|
Maxwell Place, LLC
|
Nursing and Residential Care Facilities
|
Term Loan
|
6%
|
12/1/2015
|
|
1,076.8
|
|
861.1
|
|
860.1
|
|
0.52
|
%
|
||||||||||||
|
Hillside Fence Company, LLC
|
Specialty Trade Contractors
|
Term Loan
|
Prime plus 2.25%
|
2/1/2020
|
|
206.5
|
|
61.5
|
|
61.2
|
|
0.04
|
%
|
||||||||||||
|
The K Dreyer Company
|
General Merchandise Stores
|
Term Loan
|
Prime plus 2.75%
|
12/20/2015
|
|
62.5
|
|
2.0
|
|
2.0
|
|
—
|
%
|
||||||||||||
|
Tuan D. Dang, OD, PA
|
Ambulatory Health Care Services
|
Term Loan
|
Prime plus 2.25%
|
12/7/2015
|
|
77.0
|
|
11.4
|
|
11.4
|
|
0.01
|
%
|
||||||||||||
|
Christopher F. Bohon & Pamela D. Bohon
|
Social Assistance
|
Term Loan
|
Prime plus 2.75%
|
10/28/2026
|
|
14.2
|
|
3.7
|
|
3.8
|
|
—
|
%
|
||||||||||||
|
Champion Pest Control Systems, Inc.
|
Administrative and Support Services
|
Term Loan
|
6%
|
10/20/2015
|
|
39.0
|
|
4.0
|
|
4.0
|
|
—
|
%
|
||||||||||||
|
JackRabbit Sports, Inc.
|
Sporting Goods, Hobby, Musical Instrument, and Book Stores
|
Term Loan
|
Prime plus 2.75%
|
10/13/2015
|
|
125.0
|
|
14.1
|
|
14.0
|
|
0.01
|
%
|
||||||||||||
|
Polaris Press, LLC
|
Printing and Related Support Activities
|
Term Loan
|
Prime plus 2.75%
|
9/29/2015
|
|
21.5
|
|
0.7
|
|
0.7
|
|
—
|
%
|
||||||||||||
|
Shree Om Lodging, LLC dba Royal Inn
|
Accommodation
|
Term Loan
|
Prime plus 2.75%
|
5/2/2030
|
|
333.3
|
|
67.1
|
|
68.9
|
|
0.04
|
%
|
||||||||||||
|
Jenchad, Inc and Chadjen, Inc.
|
Repair and Maintenance
|
Term Loan
|
Prime plus 2.125%
|
4/7/2025
|
|
462.5
|
|
55.9
|
|
55.2
|
|
0.03
|
%
|
||||||||||||
|
Pedzik's Pets, LLC
|
Support Activities for Agriculture and Forestry
|
Term Loan
|
Prime plus 2.75%
|
3/31/2030
|
|
53.5
|
|
9.9
|
|
10.1
|
|
0.01
|
%
|
||||||||||||
|
Nancy Carapelluci & A & M Seasonal Corner Inc.
|
Building Material and Garden Equipment and Supplies Dealers
|
Term Loan
|
Prime plus 2.75%
|
3/1/2025
|
|
106.9
|
|
17.1
|
|
17.4
|
|
0.01
|
%
|
||||||||||||
|
Saralar Corporated dba The UPS Store #5232
|
Miscellaneous Store Retailers
|
Term Loan
|
Prime plus 2.75%
|
1/21/2015
|
|
40.3
|
|
0.1
|
|
0.1
|
|
—
|
%
|
||||||||||||
|
Major Queens Body & Fender Corp.
|
Repair and Maintenance
|
Term Loan
|
Prime plus 3.75%
|
12/17/2014
|
|
71.1
|
|
0.1
|
|
—
|
|
—
|
%
|
||||||||||||
|
Moonlight Multi Media Production, Inc.
|
Other Information Services
|
Term Loan
|
5%
|
2/1/2025
|
|
19.7
|
|
4.5
|
|
4.6
|
|
—
|
%
|
||||||||||||
|
McCallister Venture Group, LLC and Maw's Vittles, Inc.
|
Food Services and Drinking Places
|
Term Loan
|
Prime plus 2.75%
|
7/30/2029
|
|
75.0
|
|
12.8
|
|
13.1
|
|
0.01
|
%
|
||||||||||||
|
Computer Renaissance dba Dante IT Services, Inc.
|
Electronics and Appliance Stores
|
Term Loan
|
Prime plus 3.75%
|
3/1/2018
|
|
100.0
|
|
3.8
|
|
3.9
|
|
—
|
%
|
||||||||||||
|
Prince Co., Inc.
|
Merchant Wholesalers, Durable Goods
|
Term Loan
|
Prime plus 1.5%
|
3/18/2029
|
|
187.5
|
|
31.7
|
|
30.0
|
|
0.02
|
%
|
||||||||||||
F-44
|
Portfolio Company
|
Industry
|
Type of Investment
|
Interest Rate
(2)
|
Maturity
|
Principal
|
Cost
|
Fair Value
|
% of Net Assets
|
|||||||||||||||||
|
Chong Hun Im dba Kim's Market
|
Food and Beverage Stores
|
Term Loan
|
Prime plus 2.5%
|
2/27/2024
|
|
80.0
|
|
11.4
|
|
11.5
|
|
0.01
|
%
|
||||||||||||
|
H & G Investments, L.C. dba Kwick Kar Josey Lane
|
Repair and Maintenance
|
Term Loan
|
5%
|
12/22/2028
|
|
317.5
|
|
92.1
|
|
88.7
|
|
0.05
|
%
|
||||||||||||
|
John B. Houston Funeral Home, Inc. dba George E. Cushnie Funeral Home
|
Personal and Laundry Services
|
Term Loan
|
Prime plus 2.75%
|
12/19/2028
|
|
78.8
|
|
13.7
|
|
14.0
|
|
0.01
|
%
|
||||||||||||
|
Center-Mark Car Wash, Ltd
|
Specialty Trade Contractors
|
Term Loan
|
Prime plus 2.75%
|
5/18/2024
|
|
221.3
|
|
33.5
|
|
34.0
|
|
0.02
|
%
|
||||||||||||
|
Shuttle Car Wash, Inc. dba Shuttle Car Wash
|
Repair and Maintenance
|
Term Loan
|
Prime plus 2.25%
|
11/10/2028
|
|
109.8
|
|
19.1
|
|
19.0
|
|
0.01
|
%
|
||||||||||||
|
Akshar Group, LLC
|
Accommodation
|
Term Loan
|
6%
|
11/5/2028
|
|
321.3
|
|
54.2
|
|
55.6
|
|
0.03
|
%
|
||||||||||||
|
Min Hui Lin
|
Food Services and Drinking Places
|
Term Loan
|
Prime plus 2.75%
|
1/30/2028
|
|
134.3
|
|
19.5
|
|
20.0
|
|
0.01
|
%
|
||||||||||||
|
Delta Partners, LLC dba Delta Carwash
|
Repair and Maintenance
|
Term Loan
|
Prime plus 2.5%
|
4/5/2029
|
|
280.9
|
|
47.1
|
|
47.5
|
|
0.03
|
%
|
||||||||||||
|
Oz B. Zamir dba Zamir Marble & Granite
|
Specialty Trade Contractors
|
Term Loan
|
Prime plus 2.5%
|
8/6/2028
|
|
54.0
|
|
9.2
|
|
9.3
|
|
0.01
|
%
|
||||||||||||
|
D & M Seafood, LLC d/b/a Rick's Seafood
|
Food Manufacturing
|
Term Loan
|
Prime plus 2.75%
|
10/10/2015
|
|
400.0
|
|
1.5
|
|
1.5
|
|
—
|
%
|
||||||||||||
|
Rama, Inc. dba Staybridge Suites
|
Accommodation
|
Term Loan
|
Prime plus 2%
|
4/18/2026
|
|
750.0
|
|
445.9
|
|
437.4
|
|
0.26
|
%
|
||||||||||||
|
B & J Manufacturing Corporation and Benson Realty Trust
|
Fabricated Metal Product Manufacturing
|
Term Loan
|
Prime plus 2%
|
3/30/2021
|
|
250.0
|
|
26.2
|
|
25.9
|
|
0.02
|
%
|
||||||||||||
|
RAB Services, Inc. & Professional Floor Installations
|
Specialty Trade Contractors
|
Term Loan
|
Prime plus 2.5%
|
1/31/2023
|
|
62.5
|
|
8.8
|
|
8.9
|
|
0.01
|
%
|
||||||||||||
|
Taste of Inverness, Inc. dba China Garden
|
Food Services and Drinking Places
|
Term Loan
|
Prime plus 2%
|
6/29/2025
|
|
73.8
|
|
10.4
|
|
10.2
|
|
0.01
|
%
|
||||||||||||
|
Ralph Werner dba Werner Transmissions
|
Gasoline Stations
|
Term Loan
|
Prime plus 2.75%
|
12/29/2021
|
|
26.6
|
|
3.1
|
|
3.1
|
|
—
|
%
|
||||||||||||
|
M. Krishna, Inc. dba Super 8 Motel
|
Accommodation
|
Term Loan
|
Prime plus 2%
|
3/20/2025
|
|
250.0
|
|
11.1
|
|
11.0
|
|
0.01
|
%
|
||||||||||||
|
OrthoQuest, P.C.
|
Ambulatory Health Care Services
|
Term Loan
|
Prime plus 2%
|
3/12/2022
|
|
56.8
|
|
6.0
|
|
5.9
|
|
—
|
%
|
||||||||||||
|
CPN Motel, LLC dba American Motor Lodge
|
Accommodation
|
Term Loan
|
Prime plus 2.25%
|
4/30/2024
|
|
379.0
|
|
37.1
|
|
36.9
|
|
0.02
|
%
|
||||||||||||
|
Track Side Collision & Tire, Inc.
|
Plastics and Rubber Products Manufacturing
|
Term Loan
|
Prime plus 2.75%
|
6/16/2025
|
|
44.8
|
|
5.7
|
|
5.8
|
|
—
|
%
|
||||||||||||
|
Duttakrupa, LLC dba Birmingham Motor Court
|
Accommodation
|
Term Loan
|
Prime plus 2.25%
|
9/8/2023
|
|
98.8
|
|
14.4
|
|
14.3
|
|
0.01
|
%
|
||||||||||||
|
Deesha Corporation, Inc. dba Best Inn & Suites
|
Accommodation
|
Term Loan
|
Prime plus 2.25%
|
2/14/2025
|
|
250.0
|
|
32.5
|
|
32.3
|
|
0.02
|
%
|
||||||||||||
|
Maruti, Inc.
|
Accommodation
|
Term Loan
|
Prime plus 2.25%
|
11/25/2024
|
|
220.0
|
|
30.3
|
|
30.1
|
|
0.02
|
%
|
||||||||||||
|
Willington Hills Equestrian Center, LLC
|
Animal Production and Aquaculture
|
Term Loan
|
Prime plus 2.75%
|
10/19/2022
|
|
85.0
|
|
13.7
|
|
13.8
|
|
0.01
|
%
|
||||||||||||
|
LABH, Inc. t/a Ramada Ltd.
|
Accommodation
|
Term Loan
|
Prime plus 2.25%
|
9/27/2024
|
|
555.0
|
|
48.8
|
|
48.5
|
|
0.03
|
%
|
||||||||||||
F-45
|
Portfolio Company
|
Industry
|
Type of Investment
|
Interest Rate
(2)
|
Maturity
|
Principal
|
Cost
|
Fair Value
|
% of Net Assets
|
|||||||||||||||||
|
Randall D. & Patricia D. Casaburi dba Pat's Pizzazz
|
Furniture and Home Furnishings Stores
|
Term Loan
|
Prime plus 2.75%
|
3/13/2023
|
|
68.8
|
|
8.7
|
|
8.9
|
|
0.01
|
%
|
||||||||||||
|
Gain Laxmi, Inc. dba Super 8 Motel
|
Accommodation
|
Term Loan
|
Prime plus 2.25%
|
5/31/2023
|
|
202.5
|
|
24.9
|
|
24.8
|
|
0.01
|
%
|
||||||||||||
|
Naseeb Corporation
|
Accommodation
|
Term Loan
|
Prime plus 2.25%
|
3/31/2024
|
|
402.5
|
|
36.2
|
|
36.0
|
|
0.02
|
%
|
||||||||||||
|
La Granja Live Poultry Corp.
|
Food Manufacturing
|
Term Loan
|
Prime plus 2.75%
|
8/26/2018
|
|
54.0
|
|
3.8
|
|
3.8
|
|
—
|
%
|
||||||||||||
|
Stillwell Ave Prep School
|
Social Assistance
|
Term Loan
|
Prime plus 2.75%
|
1/14/2023
|
|
72.0
|
|
8.0
|
|
8.1
|
|
—
|
%
|
||||||||||||
|
Karis, Inc.
|
Accommodation
|
Term Loan
|
Prime plus 2%
|
12/22/2023
|
|
148.8
|
|
16.6
|
|
16.3
|
|
0.01
|
%
|
||||||||||||
|
Five Corners, Ltd.
|
Gasoline Stations
|
Term Loan
|
Prime plus 2.75%
|
12/11/2019
|
|
85.0
|
|
7.4
|
|
7.5
|
|
—
|
%
|
||||||||||||
|
Mimoza LLC, dba Tally Ho Inn
|
Food Services and Drinking Places
|
Term Loan
|
Prime plus 2.25%
|
10/7/2023
|
|
105.0
|
|
13.4
|
|
13.3
|
|
0.01
|
%
|
||||||||||||
|
Alyssa Corp dba Knights Inn
|
Accommodation
|
Term Loan
|
Prime plus 2.25%
|
9/30/2023
|
|
350.0
|
|
46.1
|
|
45.8
|
|
0.03
|
%
|
||||||||||||
|
Bhailal Patel dba New Falls Motel
|
Accommodation
|
Term Loan
|
Prime plus 2.75%
|
3/27/2023
|
|
100.0
|
|
5.4
|
|
5.4
|
|
—
|
%
|
||||||||||||
|
Pegasus Automotive, Inc.
|
Gasoline Stations
|
Term Loan
|
Prime plus 2.75%
|
12/23/2022
|
|
112.5
|
|
13.8
|
|
14.0
|
|
0.01
|
%
|
||||||||||||
|
Delyannis Iron Works
|
Fabricated Metal Product Manufacturing
|
Term Loan
|
6%
|
12/8/2022
|
|
16.0
|
|
1.8
|
|
1.8
|
|
—
|
%
|
||||||||||||
|
P. Agrino, Inc. dba Andover Diner
|
Food Services and Drinking Places
|
Term Loan
|
Prime plus 2.75%
|
7/18/2021
|
|
150.0
|
|
14.6
|
|
14.8
|
|
0.01
|
%
|
||||||||||||
|
Golden Elevator Co., Inc.
|
Support Activities for Agriculture and Forestry
|
Term Loan
|
Prime plus 2.75%
|
1/31/2022
|
|
50.0
|
|
2.6
|
|
2.7
|
|
—
|
%
|
||||||||||||
|
Mohamed Live Poultry Inc.
|
Animal Production and Aquaculture
|
Term Loan
|
Prime plus 2.75%
|
12/6/2021
|
|
36.8
|
|
4.0
|
|
4.0
|
|
—
|
%
|
||||||||||||
|
RJS Service Corporation
|
Gasoline Stations
|
Term Loan
|
Prime plus 2.75%
|
8/20/2021
|
|
79.0
|
|
8.4
|
|
8.5
|
|
0.01
|
%
|
||||||||||||
|
Chez RuRene Bakery
|
Food Services and Drinking Places
|
Term Loan
|
Prime plus 2.75%
|
6/20/2017
|
|
150.0
|
|
49.4
|
|
51.0
|
|
0.03
|
%
|
||||||||||||
|
Total SBA Uunguaranteed Performing Investments
|
$
|
144,082.5
|
|
$
|
121,505.9
|
|
$
|
115,175.0
|
|
69.21
|
%
|
||||||||||||||
|
SBA Unguaranteed Non-Performing Investments
(3)
|
|||||||||||||||||||||||||
|
United Woodworking, Inc.
|
Wood Product Manufacturing
|
Term Loan
|
6%
|
12/20/2022
|
|
17.3
|
|
13.6
|
|
13.2
|
|
0.01
|
%
|
||||||||||||
|
Top Class, Inc.
|
Personal and Laundry Services
|
Term Loan
|
Prime plus 2.75%
|
12/29/2020
|
|
4.7
|
|
3.3
|
|
—
|
|
—
|
%
|
||||||||||||
|
Top Class, Inc.
|
Personal and Laundry Services
|
Term Loan
|
Prime plus 2.75%
|
6/28/2016
|
|
5.0
|
|
1.3
|
|
0.4
|
|
—
|
%
|
||||||||||||
F-46
|
Portfolio Company
|
Industry
|
Type of Investment
|
Interest Rate
(2)
|
Maturity
|
Principal
|
Cost
|
Fair Value
|
% of Net Assets
|
|||||||||||||||||
|
Tequila Beaches, LLC dba Fresco Restaurant
|
Food Services and Drinking Places
|
Term Loan
|
6%
|
9/16/2021
|
|
21.0
|
|
15.8
|
|
11.8
|
|
0.01
|
%
|
||||||||||||
|
* Stormwise South Florida dba Stormwise Shutters
|
Specialty Trade Contractors
|
Term Loan
|
6%
|
11/7/2036
|
|
427.5
|
|
412.0
|
|
347.8
|
|
0.21
|
%
|
||||||||||||
|
* Stormwise South Florida dba Stormwise Shutters
|
Specialty Trade Contractors
|
Term Loan
|
6%
|
11/7/2036
|
|
204.0
|
|
201.6
|
|
172.2
|
|
0.10
|
%
|
||||||||||||
|
Sheikh M Tariq dba Selbyville Foodrite
|
Gasoline Stations
|
Term Loan
|
Prime plus 2.75%
|
3/13/2023
|
|
63.1
|
|
48.4
|
|
36.3
|
|
0.02
|
%
|
||||||||||||
|
Shamrock Jewelers, Inc.
|
Clothing and Clothing Accessories Stores
|
Term Loan
|
6%
|
12/14/2016
|
|
90.5
|
|
23.6
|
|
22.8
|
|
0.01
|
%
|
||||||||||||
|
Pyramid Real Estate Holdings, LLC dba Hoteps
|
Food Services and Drinking Places
|
Term Loan
|
6%
|
10/7/2022
|
|
12.7
|
|
8.9
|
|
8.8
|
|
0.01
|
%
|
||||||||||||
|
Pure Water Innovations, LLC
|
Ambulatory Health Care Services
|
Term Loan
|
Prime plus 2.75%
|
9/6/2016
|
|
3.4
|
|
1.0
|
|
1.0
|
|
—
|
%
|
||||||||||||
|
Professional Systems, LLC and Professional Cleaning
|
Administrative and Support Services
|
Term Loan
|
6%
|
7/30/2020
|
|
159.4
|
|
132.1
|
|
58.4
|
|
0.04
|
%
|
||||||||||||
|
Parth Dev, Ltd dba Amerihost Inn Hotel-Kenton
|
Accommodation
|
Term Loan
|
5%
|
10/3/2028
|
|
54.9
|
|
38.3
|
|
18.7
|
|
0.01
|
%
|
||||||||||||
|
Our Two Daughters LLC dba Washington's Restaurant
|
Food Services and Drinking Places
|
Term Loan
|
6%
|
6/18/2026
|
|
225.0
|
|
170.3
|
|
13.8
|
|
0.01
|
%
|
||||||||||||
|
Morris Glass and Construction
|
Specialty Trade Contractors
|
Term Loan
|
6%
|
3/7/2021
|
|
49.8
|
|
44.8
|
|
0.8
|
|
—
|
%
|
||||||||||||
|
Momentum Medical Group, Inc.
|
Ambulatory Health Care Services
|
Term Loan
|
8%
|
9/30/2015
|
|
244.2
|
|
159.7
|
|
5.0
|
|
—
|
%
|
||||||||||||
|
Midway Plaza 6, LLC & Adventure World Family Fun Center, Inc.
|
Amusement, Gambling, and Recreation Industries
|
Term Loan
|
6%
|
12/19/2029
|
|
200.0
|
|
167.6
|
|
134.0
|
|
0.08
|
%
|
||||||||||||
|
Lucil Chhor dba Baja Fresh #159
|
Food Services and Drinking Places
|
Term Loan
|
Prime plus 2.75%
|
12/28/2022
|
|
49.1
|
|
30.0
|
|
15.4
|
|
0.01
|
%
|
||||||||||||
|
Las Torres Development, LLC dba Houston Event Centers
|
Real Estate
|
Term Loan
|
Prime plus 2.75%
|
8/27/2028
|
|
405.8
|
|
391.6
|
|
378.2
|
|
0.23
|
%
|
||||||||||||
|
Lamson and Goodnow Manufacturing Co. and Lamson and Goodnow, LLC
|
Fabricated Metal Product Manufacturing
|
Term Loan
|
Prime plus 2.75%
|
12/28/2037
|
|
197.1
|
|
187.0
|
|
116.1
|
|
0.07
|
%
|
||||||||||||
|
Krishna of Orangeburg, Inc.
|
Accommodation
|
Term Loan
|
6%
|
2/20/2032
|
|
41.8
|
|
10.3
|
|
10.0
|
|
0.01
|
%
|
||||||||||||
|
J Olson Enterprises LLC and Olson Trucking Direct, Inc.
|
Truck Transportation
|
Term Loan
|
Prime plus 2.75%
|
6/28/2025
|
|
737.6
|
|
704.5
|
|
692.4
|
|
0.42
|
%
|
||||||||||||
|
Hot Buckles, Inc.
|
Apparel Manufacturing
|
Term Loan
|
Prime plus 2.75%
|
6/27/2018
|
|
57.6
|
|
26.9
|
|
25.9
|
|
0.02
|
%
|
||||||||||||
|
Harrelson Materials Management, Inc.
|
Waste Management and Remediation Services
|
Term Loan
|
6%
|
6/24/2021
|
|
537.5
|
|
470.0
|
|
108.1
|
|
0.06
|
%
|
||||||||||||
|
Hampton's Restaurant Holding Company, LLC/Hampton's Restaurant #1, LLC
|
Food Services and Drinking Places
|
Term Loan
|
Prime plus 2.75%
|
5/29/2023
|
|
398.0
|
|
255.7
|
|
20.4
|
|
0.01
|
%
|
||||||||||||
|
Goetzke Chiropractic, Inc.
|
Ambulatory Health Care Services
|
Term Loan
|
6%
|
10/25/2017
|
|
7.3
|
|
3.1
|
|
0.6
|
|
—
|
%
|
||||||||||||
|
Franvest, Inc. dba Texas Hydro-Equipment Co.
|
Chemical Manufacturing
|
Term Loan
|
6%
|
8/23/2018
|
|
125.0
|
|
119.3
|
|
99.5
|
|
0.06
|
%
|
||||||||||||
|
Feinman Mechanical, LLC
|
Specialty Trade Contractors
|
Term Loan
|
6%
|
9/28/2028
|
|
323.0
|
|
305.2
|
|
70.6
|
|
0.04
|
%
|
||||||||||||
F-47
|
Portfolio Company
|
Industry
|
Type of Investment
|
Interest Rate
(2)
|
Maturity
|
Principal
|
Cost
|
Fair Value
|
% of Net Assets
|
|||||||||||||||||
|
E & I Holdings, LP & PA Farm Products, LLC
|
Food Manufacturing
|
Term Loan
|
6%
|
4/30/2030
|
|
1,248.8
|
|
1,238.0
|
|
481.4
|
|
0.29
|
%
|
||||||||||||
|
Dixie Transport, Inc. & Johnny D. Brown & Jimmy Brown & Maudain Brown
|
Support Activities for Transportation
|
Term Loan
|
5%
|
12/28/2035
|
|
145.9
|
|
144.6
|
|
53.1
|
|
0.03
|
%
|
||||||||||||
|
Dill Street Bar and Grill, Inc. and WO Entertainment, Inc.
|
Food Services and Drinking Places
|
Term Loan
|
Prime plus 2.75%
|
9/27/2027
|
|
122.9
|
|
112.3
|
|
41.7
|
|
0.03
|
%
|
||||||||||||
|
Design Video Communciations, Inc.
|
Professional, Scientific, and Technical Services
|
Term Loan
|
6%
|
2/18/2036
|
|
92.4
|
|
19.0
|
|
6.8
|
|
—
|
%
|
||||||||||||
|
D'Elia Auto Repair Inc. dba D'Elia Auto Body
|
Repair and Maintenance
|
Term Loan
|
Prime plus 2.75%
|
9/26/2023
|
|
15.0
|
|
13.9
|
|
2.2
|
|
—
|
%
|
||||||||||||
|
DC Realty, LLC dba FOGO Data Centers
|
Professional, Scientific, and Technical Services
|
Term Loan
|
6%
|
3/23/2037
|
|
778.0
|
|
757.0
|
|
718.6
|
|
0.43
|
%
|
||||||||||||
|
DC Realty, LLC dba FOGO Data Centers
|
Professional, Scientific, and Technical Services
|
Term Loan
|
Prime plus 2.75%
|
3/23/2022
|
|
376.0
|
|
258.5
|
|
245.4
|
|
0.15
|
%
|
||||||||||||
|
Crystal K. Bruens dba Howards Restaurant
|
Food Services and Drinking Places
|
Term Loan
|
Prime plus 2.75%
|
10/20/2020
|
|
6.2
|
|
2.8
|
|
2.8
|
|
—
|
%
|
||||||||||||
|
Bamboo Palace, Inc.
|
Food Services and Drinking Places
|
Term Loan
|
6%
|
11/20/2022
|
|
56.7
|
|
40.2
|
|
38.9
|
|
0.02
|
%
|
||||||||||||
|
Baker Sales, Inc. d/b/a Baker Sales, Inc.
|
Nonstore Retailers
|
Term Loan
|
6%
|
3/29/2036
|
|
490.0
|
|
467.0
|
|
406.5
|
|
0.24
|
%
|
||||||||||||
|
AWA Fabrication & Construction, LLC
|
Fabricated Metal Product Manufacturing
|
Term Loan
|
6%
|
4/30/2025
|
|
152.2
|
|
34.8
|
|
7.2
|
|
—
|
%
|
||||||||||||
|
AUM Estates, LLC and Sculpted Figures Plastic Surgery, Inc.
|
Ambulatory Health Care Services
|
Term Loan
|
Prime plus 2.75%
|
12/12/2023
|
|
87.5
|
|
83.7
|
|
—
|
|
—
|
%
|
||||||||||||
|
AUM Estates, LLC and Sculpted Figures Plastic Surgery Inc.
|
Ambulatory Health Care Services
|
Term Loan
|
Prime plus 2.75%
|
3/14/2038
|
|
618.7
|
|
603.9
|
|
355.2
|
|
0.21
|
%
|
||||||||||||
|
Dr. Francis E. Anders, DVM
|
Professional, Scientific, and Technical Services
|
Term Loan
|
6%
|
8/9/2015
|
|
4.6
|
|
1.6
|
|
1.6
|
|
—
|
%
|
||||||||||||
|
Elite Treats Enterprises, Inc. dba Rochelle Dairy Queen
|
Food Services and Drinking Places
|
Term Loan
|
Prime plus 2.75%
|
1/24/2032
|
|
141.3
|
|
131.5
|
|
122.7
|
|
0.07
|
%
|
||||||||||||
|
LRCSL, LLC dba Daybreak Fruit and Vegetable Company
|
Food and Beverage Stores
|
Term Loan
|
Prime plus 2.75%
|
2/28/2021
|
|
75.1
|
|
53.0
|
|
32.6
|
|
0.02
|
%
|
||||||||||||
|
Harry B Gould dba Lake Athens Marina and Bait Shop
|
Accommodation
|
Term Loan
|
Prime plus 2.75%
|
12/28/2025
|
|
132.9
|
|
116.2
|
|
112.3
|
|
0.07
|
%
|
||||||||||||
|
* The Alba Financial Group, Inc.
|
Securities, Commodity Contracts, and Other Financial Investments and Related Activities
|
Term Loan
|
Prime plus 2.75%
|
11/13/2015
|
|
16.2
|
|
8.0
|
|
7.7
|
|
—
|
%
|
||||||||||||
|
* Milliken and Milliken, Inc. dba Milliken Wholesale Distribution
|
Merchant Wholesalers, Durable Goods
|
Term Loan
|
6%
|
6/10/2036
|
|
191.0
|
|
157.1
|
|
135.3
|
|
0.08
|
%
|
||||||||||||
|
* Almeria Marketing 1, Inc.
|
Personal and Laundry Services
|
Term Loan
|
8%
|
10/15/2015
|
|
10.2
|
|
5.0
|
|
4.8
|
|
—
|
%
|
||||||||||||
|
* Whirlwind Car Wash, Inc.
|
Repair and Maintenance
|
Term Loan
|
Prime plus 2%
|
4/9/2029
|
|
31.5
|
|
24.0
|
|
20.0
|
|
0.01
|
%
|
||||||||||||
F-48
|
Portfolio Company
|
Industry
|
Type of Investment
|
Interest Rate
(2)
|
Maturity
|
Principal
|
Cost
|
Fair Value
|
% of Net Assets
|
|||||||||||||||||
|
* West Experience, Inc., West Mountain Equipment Rental, Inc., Ski West Lodge
|
Amusement, Gambling, and Recreation Industries
|
Term Loan
|
6%
|
6/5/2026
|
|
68.9
|
|
50.2
|
|
43.8
|
|
0.03
|
%
|
||||||||||||
|
* The Lucky Coyote, LLC
|
Miscellaneous Manufacturing
|
Term Loan
|
6%
|
5/8/2017
|
|
44.9
|
|
14.4
|
|
11.8
|
|
0.01
|
%
|
||||||||||||
|
* TechPlayZone, Inc.
|
Social Assistance
|
Term Loan
|
Prime plus 2.75%
|
1/27/2016
|
|
7.6
|
|
1.0
|
|
0.9
|
|
—
|
%
|
||||||||||||
|
* Stokes Floor Covering Company Inc. and Robert E. Rainey, Jr.
|
Furniture and Home Furnishings Stores
|
Term Loan
|
6%
|
12/29/2035
|
|
122.0
|
|
110.4
|
|
94.1
|
|
0.06
|
%
|
||||||||||||
|
* Robin C. & Charles E. Taylor & Brigantine Aquatic Center, LLC
|
Amusement, Gambling, and Recreation Industries
|
Term Loan
|
6%
|
9/14/2023
|
|
33.1
|
|
22.8
|
|
20.1
|
|
0.01
|
%
|
||||||||||||
|
* LJ Parker, LLC dba Kwik Kopy Business Center 120
|
Administrative and Support Services
|
Term Loan
|
7%
|
9/8/2014
|
|
61.8
|
|
33.2
|
|
26.6
|
|
0.02
|
%
|
||||||||||||
|
* Integrity Sports Group, LLC
|
Performing Arts, Spectator Sports, and Related Industries
|
Term Loan
|
6%
|
3/6/2018
|
|
62.1
|
|
17.3
|
|
13.4
|
|
0.01
|
%
|
||||||||||||
|
* Guzman Group, LLC
|
Rental and Leasing Services
|
Term Loan
|
6%
|
1/30/2016
|
|
251.7
|
|
211.7
|
|
195.1
|
|
0.12
|
%
|
||||||||||||
|
* Groundworks Unlimited, LLC
|
Specialty Trade Contractors
|
Term Loan
|
6%
|
12/17/2023
|
|
116.1
|
|
97.1
|
|
85.0
|
|
0.05
|
%
|
||||||||||||
|
* Gotta Dance Studio, Inc. dba Gotta Dance Studio Academy of Performing
|
Educational Services
|
Term Loan
|
Prime plus 2.75%
|
11/16/2016
|
|
10.3
|
|
4.0
|
|
3.5
|
|
—
|
%
|
||||||||||||
|
* Furniture Company, LLC
|
Furniture and Home Furnishings Stores
|
Term Loan
|
7%
|
10/30/2015
|
|
6.4
|
|
1.4
|
|
1.3
|
|
—
|
%
|
||||||||||||
|
* Event Mecca, LLC
|
Other Information Services
|
Term Loan
|
6%
|
4/10/2023
|
|
14.3
|
|
13.3
|
|
8.9
|
|
0.01
|
%
|
||||||||||||
|
* E.W. Ventures, Inc. dba Swift Cleaners & Laundry
|
Personal and Laundry Services
|
Term Loan
|
—%
|
4/18/2017
|
|
209.1
|
|
92.7
|
|
76.0
|
|
0.05
|
%
|
||||||||||||
|
* DUCO Energy Services, a Limited Liability Company
|
Professional, Scientific, and Technical Services
|
Term Loan
|
Prime plus 2.75%
|
6/20/2023
|
|
11.8
|
|
10.8
|
|
7.3
|
|
—
|
%
|
||||||||||||
|
* David M. Goens dba Superior Auto Paint & Body, Inc.
|
Repair and Maintenance
|
Term Loan
|
Prime plus 2.75%
|
8/26/2024
|
|
11.5
|
|
6.6
|
|
6.0
|
|
—
|
%
|
||||||||||||
|
* CCS, Services, Inc.
|
Administrative and Support Services
|
Term Loan
|
6%
|
2/28/2015
|
|
2.3
|
|
0.1
|
|
0.1
|
|
—
|
%
|
||||||||||||
|
* Camilles of Washington Inc.
|
Food Services and Drinking Places
|
Term Loan
|
6%
|
10/28/2015
|
|
16.4
|
|
1.5
|
|
1.5
|
|
—
|
%
|
||||||||||||
|
* Bwms Management, LLC
|
Food Services and Drinking Places
|
Term Loan
|
6%
|
7/7/2027
|
|
109.1
|
|
82.5
|
|
66.4
|
|
0.04
|
%
|
||||||||||||
|
* BCD Enterprises, LLC dba Progressive Tool and Nutmeg Tool
|
Fabricated Metal Product Manufacturing
|
Term Loan
|
Prime plus 2.75%
|
6/22/2026
|
|
506.9
|
|
418.3
|
|
333.1
|
|
0.20
|
%
|
||||||||||||
|
* Barnum Printing & Publishing, Co.
|
Printing and Related Support Activities
|
Term Loan
|
6%
|
7/29/2015
|
|
44.7
|
|
11.9
|
|
11.7
|
|
0.01
|
%
|
||||||||||||
|
* Auto Sales, Inc.
|
Motor Vehicle and Parts Dealers
|
Term Loan
|
6%
|
8/17/2023
|
|
13.9
|
|
6.7
|
|
6.2
|
|
—
|
%
|
||||||||||||
|
* Anmor Machining Company, LLC dba Anmor Machining Company
|
Fabricated Metal Product Manufacturing
|
Term Loan
|
6%
|
11/18/2026
|
|
192.5
|
|
146.5
|
|
110.5
|
|
0.07
|
%
|
||||||||||||
F-49
|
Portfolio Company
|
Industry
|
Type of Investment
|
Interest Rate
(2)
|
Maturity
|
Principal
|
Cost
|
Fair Value
|
% of Net Assets
|
|||||||||||||||||
|
KroBro Inc. d/b/a Village Coffee
|
Food Services and Drinking Places
|
Term Loan
|
6%
|
3/12/2020
|
|
200.0
|
|
10.0
|
|
—
|
|
—
|
%
|
||||||||||||
|
Konversashens Coffee LLC
|
Food Services and Drinking Places
|
Term Loan
|
6%
|
6/28/2016
|
|
64.4
|
|
4.9
|
|
—
|
|
—
|
%
|
||||||||||||
|
Total SBA Unguaranteed Non-Performing Investments
|
$
|
11,637.2
|
|
$
|
9,587.3
|
|
$
|
6,302.3
|
|
3.79
|
%
|
||||||||||||||
|
Total SBA Unguaranteed Investments
|
$
|
155,719.7
|
|
$
|
131,093.2
|
|
$
|
121,477.3
|
|
73.00
|
%
|
||||||||||||||
|
SBA Guaranteed Performing Loans Held for Sale
(4)
|
|||||||||||||||||||||||||
|
BS Ventures, LLC dba Dink's Market
|
Merchant Wholesalers, Nondurable Goods
|
Term Loan
|
Prime plus 2.75%
|
12/19/2039
|
|
161.3
|
|
161.3
|
|
182.9
|
|
0.11
|
%
|
||||||||||||
|
M & MM Management
|
Food Services and Drinking Places
|
Term Loan
|
Prime plus 2.75%
|
4/19/2025
|
|
138.8
|
|
138.8
|
|
155.0
|
|
0.09
|
%
|
||||||||||||
|
The Jeweler's Inc.
|
Clothing and Clothing Accessories Stores
|
Term Loan
|
Prime plus 2.75%
|
12/19/2024
|
|
3,750.0
|
|
3,750.0
|
|
4,157.8
|
|
2.50
|
%
|
||||||||||||
|
Will Zak Management, LLC
|
Food Services and Drinking Places
|
Term Loan
|
Prime plus 2.75%
|
12/19/2024
|
|
146.3
|
|
146.3
|
|
163.3
|
|
0.10
|
%
|
||||||||||||
|
Winter Ventures, Inc.
|
Nonstore Retailers
|
Term Loan
|
Prime plus 2.75%
|
12/23/2024
|
|
1,404.9
|
|
1,404.9
|
|
1,564.7
|
|
0.94
|
%
|
||||||||||||
|
Atlantis of Daytona, LLC
|
Clothing and Clothing Accessories Stores
|
Term Loan
|
Prime plus 2.75%
|
12/23/2039
|
|
720.0
|
|
720.0
|
|
816.3
|
|
0.49
|
%
|
||||||||||||
|
Thermoplastic Services, Inc.
|
Plastics and Rubber Products Manufacturing
|
Term Loan
|
Prime plus 2.75%
|
12/23/2039
|
|
4,500.0
|
|
4,500.0
|
|
5,060.5
|
|
3.04
|
%
|
||||||||||||
|
The Lodin Group, LLC and Lodin Health
|
Ambulatory Health Care Services
|
Term Loan
|
Prime plus 2.75%
|
12/23/2039
|
|
1,590.8
|
|
1,590.8
|
|
1,797.6
|
|
1.08
|
%
|
||||||||||||
|
Bowlerama Inc.
|
Amusement, Gambling, and Recreation Industries
|
Term Loan
|
Prime plus 2.75%
|
12/24/2039
|
|
3,607.5
|
|
3,607.5
|
|
4,058.4
|
|
2.44
|
%
|
||||||||||||
|
Beale Street Blues Company
|
Performing Arts, Spectator Sports, and Related Industries
|
Term Loan
|
Prime plus 2.75%
|
12/22/2024
|
|
562.5
|
|
562.5
|
|
628.2
|
|
0.38
|
%
|
||||||||||||
|
Bear Creek Entertainment, LLC dba The Woods at Bear Creek
|
Accommodation
|
Term Loan
|
Prime plus 2.75%
|
12/30/2024
|
|
318.8
|
|
318.8
|
|
361.6
|
|
0.22
|
%
|
||||||||||||
|
Evans & Paul, LLC
|
Merchant Wholesalers, Durable Goods
|
Term Loan
|
Prime plus 2.75%
|
12/30/2024
|
|
671.3
|
|
671.3
|
|
749.6
|
|
0.45
|
%
|
||||||||||||
|
B & W Towing, LLC & Boychuck's Fuel, LLC
|
Repair and Maintenance
|
Term Loan
|
Prime plus 2.75%
|
12/17/2039
|
|
493.5
|
|
493.5
|
|
559.9
|
|
0.34
|
%
|
||||||||||||
|
Grand Blanc Lanes, Inc.
|
Amusement, Gambling, and Recreation Industries
|
Term Loan
|
Prime plus 2.75%
|
12/31/2039
|
|
399.0
|
|
399.0
|
|
452.7
|
|
0.27
|
%
|
||||||||||||
|
Homegrown for Good, LLC
|
Apparel Manufacturing
|
Term Loan
|
Prime plus 2.75%
|
11/26/2024
|
|
2,070.0
|
|
2,070.0
|
|
2,297.1
|
|
1.38
|
%
|
||||||||||||
F-50
|
Portfolio Company
|
Industry
|
Type of Investment
|
Interest Rate
(2)
|
Maturity
|
Principal
|
Cost
|
Fair Value
|
% of Net Assets
|
|||||||||||||||||
|
Lake Area Autosound, LLC
|
Motor Vehicle and Parts Dealers
|
Term Loan
|
Prime plus 2.75%
|
7/28/2039
|
|
375.0
|
|
375.0
|
|
425.4
|
|
0.26
|
%
|
||||||||||||
|
FHJE Ventures, LLC and Eisenreich II, Inc. dba Breakneck Tavern
|
Food Services and Drinking Places
|
Term Loan
|
Prime plus 2.75%
|
6/27/2039
|
|
962.3
|
|
965.3
|
|
1,084.6
|
|
0.65
|
%
|
||||||||||||
|
Meridian Hotels, LLC
|
Accommodation
|
Term Loan
|
Prime plus 2.75%
|
11/25/2039
|
|
684.0
|
|
684.0
|
|
776.0
|
|
0.47
|
%
|
||||||||||||
|
Carolina Flicks dba The Howell Theatre
|
Motion Picture and Sound Recording Industries
|
Term Loan
|
Prime plus 2.75%
|
12/23/2032
|
|
489.8
|
|
489.8
|
|
538.7
|
|
0.32
|
%
|
||||||||||||
|
Kiddie Steps for You, Inc.
|
Social Assistance
|
Term Loan
|
Prime plus 2.75%
|
9/25/2038
|
|
267.8
|
|
254.8
|
|
286.7
|
|
0.17
|
%
|
||||||||||||
|
401 JJS Corp. and G Randazzo Trattoria Corp.
|
Food Services and Drinking Places
|
Term Loan
|
Prime plus 2.75%
|
12/23/2039
|
|
1,136.3
|
|
1,136.3
|
|
1,285.4
|
|
0.77
|
%
|
||||||||||||
|
FHJE Ventures, LLC and Eisenreich II, Inc. dba Breakneck Tavern
|
Food Services and Drinking Places
|
Term Loan
|
Prime plus 2.75%
|
12/31/2039
|
|
736.5
|
|
484.8
|
|
545.7
|
|
0.33
|
%
|
||||||||||||
|
Miss Cranston Diner II, LLC
|
Food Services and Drinking Places
|
Term Loan
|
Prime plus 2.75%
|
7/17/2039
|
|
273.8
|
|
273.8
|
|
308.8
|
|
0.19
|
%
|
||||||||||||
|
Wildwood Tavern dba Tavern Properties
|
Food Services and Drinking Places
|
Term Loan
|
Prime plus 2.75%
|
9/15/2039
|
|
1,275.0
|
|
936.0
|
|
1,058.9
|
|
0.64
|
%
|
||||||||||||
|
iFood, Inc.
|
Food Services and Drinking Places
|
Term Loan
|
Prime plus 2.75%
|
7/31/2024
|
|
1,137.3
|
|
871.6
|
|
973.4
|
|
0.58
|
%
|
||||||||||||
|
Alpha Prepatory Academy, LLC
|
Social Assistance
|
Term Loan
|
Prime plus 2.75%
|
8/15/2039
|
|
435.7
|
|
327.7
|
|
371.8
|
|
0.22
|
%
|
||||||||||||
|
GPG Real Estate Holdings, LLC
|
Specialty Trade Contractors
|
Term Loan
|
Prime plus 2.75%
|
7/3/2024
|
|
487.5
|
|
121.6
|
|
137.9
|
|
0.08
|
%
|
||||||||||||
|
First Prevention & Dialysis Center, LLC
|
Ambulatory Health Care Services
|
Term Loan
|
Prime plus 2.75%
|
12/30/2024
|
|
714.8
|
|
234.2
|
|
261.5
|
|
0.16
|
%
|
||||||||||||
|
The Red Pill Management, Inc.
|
Performing Arts, Spectator Sports, and Related Industries
|
Term Loan
|
Prime plus 2.75%
|
11/26/2024
|
|
162.8
|
|
86.1
|
|
96.2
|
|
0.06
|
%
|
||||||||||||
|
DC Real, LLC and DC Enterprises LTD
|
Building Material and Garden Equipment and Supplies Dealers
|
Term Loan
|
Prime plus 2.75%
|
11/20/2039
|
|
358.1
|
|
281.7
|
|
329.5
|
|
0.20
|
%
|
||||||||||||
|
Total SBA Guaranteed Performing Loans Held for Sale
|
$
|
30,031.4
|
|
$
|
28,057.4
|
|
$
|
31,486.1
|
|
18.92
|
%
|
||||||||||||||
|
Total SBA Unguaranteed and Guaranteed Investments
|
$
|
185,751.1
|
|
$
|
159,150.6
|
|
$
|
152,963.4
|
|
91.92
|
%
|
||||||||||||||
|
Portfolio Company
|
Industry
|
Type of Investment
|
Interest Rate
(2)
|
Maturity
|
Principal
|
Cost
|
Fair Value
|
% of Net Assets
|
|||||||||||||||||
|
Affiliate Investments
(5)
|
|||||||||||||||||||||||||
|
Advanced Cyber Security Systems, LLC
(6) (13)
|
Data processing, hosting and related services.
|
50% Membership Interest
|
—
|
%
|
—
|
|
—
|
|
—
|
|
—
|
|
—
|
%
|
|||||||||||
|
Term Loan
|
3
|
%
|
December 2014
|
—
|
|
—
|
|
—
|
|
—
|
%
|
||||||||||||||
|
* Automated Merchant Services, Inc.
(7) (13)
|
Data processing, hosting and related services.
|
100% Common Stock
|
—
|
%
|
—
|
|
—
|
|
—
|
|
—
|
|
—
|
%
|
|||||||||||
F-51
|
Portfolio Company
|
Industry
|
Type of Investment
|
Interest Rate
(2)
|
Maturity
|
Principal
|
Cost
|
Fair Value
|
% of Net Assets
|
|||||||||||||||||
|
* Business Connect, LLC
(8) (13)
|
Data processing, hosting and related services.
|
100% Membership Interest
|
—
|
%
|
—
|
|
—
|
|
—
|
|
—
|
|
—
|
%
|
|||||||||||
|
Term Loan
|
10
|
%
|
December 2015
|
—
|
|
—
|
|
—
|
|
—
|
%
|
||||||||||||||
|
* CCC Real Estate Holdings Co., LLC
|
Securities, Commodity Contracts, and Other Financial Investments and Related Activities
|
100% Membership Interest
|
—
|
%
|
—
|
|
—
|
|
—
|
|
—
|
|
—
|
%
|
|||||||||||
|
CDS Business Services, Inc.
(9) (13)
|
Securities, Commodity Contracts, and Other Financial Investments and Related Activities
|
100% Common Stock
|
—
|
%
|
—
|
|
—
|
|
—
|
|
496.0
|
|
0.30
|
%
|
|||||||||||
|
Term Loan
|
1
|
%
|
Various maturities through August 2016
|
—
|
|
—
|
|
1,483.0
|
|
0.89
|
%
|
||||||||||||||
|
Crystaltech Web Hosting, Inc.
|
Data processing, hosting and related services.
|
100% Common Stock
|
—
|
%
|
—
|
|
—
|
|
9,256.0
|
|
21,500.0
|
|
12.92
|
%
|
|||||||||||
|
* OnLAN, LLC
(15) (17)
|
Professional, Scientific, and Technical Services
|
49% Membership Interests
|
—
|
%
|
—
|
|
—
|
|
800.0
|
|
—
|
|
—
|
%
|
|||||||||||
|
* Exponential Business Development Co. Inc.
(13)
|
Securities, Commodity Contracts, and Other Financial Investments and Related Activities
|
100% Common Stock
|
—
|
%
|
—
|
|
—
|
|
—
|
|
—
|
|
—
|
%
|
|||||||||||
|
* Bankcard Alliance of Alabama, LLC
(10) (13)
|
Data processing, hosting and related services.
|
95% Membership Interests
|
—
|
%
|
—
|
|
—
|
|
—
|
|
—
|
|
—
|
%
|
|||||||||||
|
* Fortress Data Management, LLC
(13)
|
Data processing, hosting and related services.
|
100% Membership Interest
|
—
|
%
|
—
|
|
—
|
|
—
|
|
—
|
|
—
|
%
|
|||||||||||
|
Newtek Insurance Agency, LLC
(13)
|
Insurance Carriers and Related Activities
|
100% Membership Interests
|
—
|
%
|
—
|
|
—
|
|
—
|
|
2,300.0
|
|
1.38
|
%
|
|||||||||||
|
PMTWorks Payroll, LLC
(11) (13)
|
Data processing, hosting and related services.
|
80% Membership Interests
|
—
|
%
|
—
|
|
—
|
|
—
|
|
920.0
|
|
0.55
|
%
|
|||||||||||
|
Term Loan
|
12
|
%
|
August 2015
|
—
|
|
—
|
|
—
|
|
—
|
%
|
||||||||||||||
|
Secure CyberGateway Services, LLC
(12) (13)
|
Data processing, hosting and related services.
|
66.7% Membership Interests
|
—
|
%
|
—
|
|
—
|
|
—
|
|
—
|
|
—
|
%
|
|||||||||||
|
Term Loan
|
7
|
%
|
December 2016
|
2,400.0
|
|
2,400.0
|
|
2,400.0
|
|
1.44
|
%
|
||||||||||||||
|
Small Business Lending, Inc.
(13)
|
Securities, Commodity Contracts, and Other Financial Investments and Related Activities
|
100% Common Stock
|
—
|
%
|
—
|
|
—
|
|
—
|
|
2,900.0
|
|
1.74
|
%
|
|||||||||||
|
* Summit Systems and Designs, LLC
(8) (13)
|
Data processing, hosting and related services.
|
100% Membership Interest
|
—
|
%
|
—
|
|
—
|
|
—
|
|
—
|
|
—
|
%
|
|||||||||||
|
Term Loan
|
10
|
%
|
December 2007
|
—
|
|
—
|
|
—
|
|
—
|
%
|
||||||||||||||
F-52
|
Portfolio Company
|
Industry
|
Type of Investment
|
Interest Rate
(2)
|
Maturity
|
Principal
|
Cost
|
Fair Value
|
% of Net Assets
|
|||||||||||||||||
|
* Texas Whitestone Group, LLC
|
Securities, Commodity Contracts, and Other Financial Investments and Related Activities
|
100% Membership Interest
|
—
|
%
|
—
|
|
—
|
|
65.0
|
|
—
|
|
—
|
%
|
|||||||||||
|
Universal Processing Services of Wisconsin, LLC
(13)
|
Data processing, hosting and related services.
|
100% Membership Interest
|
—
|
%
|
—
|
|
—
|
|
—
|
|
45,500.0
|
|
27.34
|
%
|
|||||||||||
|
* Where Eagles Fly, LLC
(13) (14)
|
Theatrical productions
|
95% Membership Interest
|
—
|
%
|
—
|
|
—
|
|
—
|
|
—
|
|
—
|
%
|
|||||||||||
|
Total Affiliates Investments
|
$
|
2,400.0
|
|
$
|
12,521.0
|
|
$
|
77,499.0
|
|
46.57
|
%
|
||||||||||||||
|
Investment in UBS Money Market Fund
|
$
|
—
|
|
$
|
3,000.0
|
|
$
|
3,000.0
|
|
1.80
|
%
|
||||||||||||||
|
Total Investments
|
$
|
188,151.1
|
|
$
|
174,671.6
|
|
$
|
233,462.4
|
|
140.29
|
%
|
||||||||||||||
* denotes non income producing security.
(1) Newtek values each SBA 7(a) performing unguaranteed loan held for investment using a discounted cash flow analysis which projects future cash flows and incorporates projections for loan pre-payments, and loan defaults using historical portfolio data. The data predicts future prepayment and default probability on curves which are based on loan age. The recovery assumption for each loan is specific to the discounted valuation of the collateral supporting that loan. Each loans cash flow is discounted at a rate which approximates a market yield. The loans were originated under the SBA 7(a) program and conform to the underwriting guidelines in effect at their time of origination. Newtek has been awarded PLP status from the SBA. The loans are not guaranteed by the SBA. Individual loan participations can be sold to institutions which have been granted an SBA 750 license. Loans can also be sold as a pool of loans in a security form to qualified investors.
(2) Prime Rate is equal to 3.25% as of December 31, 2014.
(3) Newtek values SBA 7(a) non-performing loans held for investment using a discounted cash flow analysis of the underlying collateral which supports the loan. Net recovery of collateral, (fair value less cost to liquidate) is applied to the discounted cash flow analysis based upon a time to liquidate estimate. Modified loans are valued based upon current payment streams and are re-amortized at the end of the modification period.
(4) Newtek values SBA 7(a) performing loans held for sale using the secondary SBA 7(a) market as a reference point. Newtek routinely sells into this secondary market. Guaranteed portions, partially funded as of the valuation date are valued using level two inputs as disclosed in Note 3.
(5) Control Investments are disclosed above as equity investments (except as otherwise noted) in those companies that are “Control Investments” of the Company as defined in the Investment Company Act of 1940. A company is deemed to be a “Control Investment” of Newtek Business Services Corporation if Newtek Business Services Corp. owns more than 25% of the voting securities of such company.
(6) 100% wholly-owned by Exponential of New York, LLC.
(7) 95% owned by Wilshire Partners, LLC., 5% owned by non-affiliate.
(8) 100% owned by Wilshire Texas Partners I, LLC.
(9) 49.482% owned by Wilshire New York Partners IV, LLC, 24.611% owned by Exponential of New York, LLC and 25.907% owned by Newtek Business Services Corp.
(10) 95% owned by Wilshire Alabama Partners, LLC., 5% owned by non-affiliate.
(11) 80% owned by Wilshire New York Partners IV, LLC, 20% owned by non-affiliate.
(12) 66.7% owned by Wilshire Texas Partners I, LLC, 33.3% owned by non-affiliate.
(13) Zero cost basis is reflected, as the portfolio company was organized by the Company and incurred internal legal costs to organize the entity and immaterial external filing fees which were expensed when incurred.
(14) 95% owned by Wilshire DC Partners, LLC, 5% owned by non-affiliate.
(15) 49% owned by Wilshire Colorado Partners, LLC, 51% owned by non-affiliate
(16) All of the Company's investments are in entities which are organized under the laws of the United States and have a principal place of business in the United States.
(17) Denotes a non-controlled entity.
F-53
NEWTEK BUSINESS SERVICES CORP. AND SUBSIDIARIES (FORMERLY NEWTEK BUSINESS SERVICES, INC. AND SUBSIDIARIES)
NOTES TO CONSOLIDATED FINANCIAL STATEMENTS
On November 12, 2014, Newtek Business Services, Inc. merged with and into Newtek Business Services Corp., a newly-formed Maryland corporation, for the purpose of reincorporating in Maryland (the “Merger”), and thereafter filed an election to be regulated as a business development company (“BDC”) under the Investment Company Act of 1940, as amended. This transaction is referred to as the "Conversion" or "BDC Conversion". All subsidiaries and controlled portfolio companies became the property of Newtek Business Services Corp. as part of the Merger. Except as otherwise noted, the terms “we,” “us,” “our,” “Company” and “Newtek” refer to Newtek Business Services, Inc. prior to the Conversion and its successor, Newtek Business Services Corp. following the Conversion.
Description of Business and Basis of Presentation Prior to BDC Conversion
Prior to the Conversion, Newtek Business Services, Inc
.
was a holding company for several wholly- and majority-owned subsidiaries, including twelve certified capital companies which are referred to as Capcos, and several portfolio companies in which the Capcos own non-controlling or minority interests. The Company provides a “one-stop-shop” for business services to the small- and medium-sized business market and uses state of the art web-based proprietary technology to be a low cost acquirer and provider of products and services. The Company partners with companies, credit unions, and associations to offer its services.
The Company’s principal business segments are:
Electronic Payment Processing:
Marketing third party credit card processing and check approval services to the small- and medium-sized business market under the name of Newtek Merchant Solutions.
Managed Technology Solutions:
CrystalTech Web Hosting, Inc., d/b/a Newtek Technology Services (“NTS”), offers shared and dedicated web hosting, data storage and backup services, cloud computing plans and related services to the small- and medium-sized business market.
Small Business Finance:
The segment is comprised of Small Business Lending., ("SBL") a lender service provider for third-parties that primarily services government guaranteed U.S. Small Business Administration (“SBA”) loans and non-SBA loans; Newtek Small Business Finance, Inc. (“NSBF”), a nationally licensed, U.S. SBA lender that originates, sells and services loans to qualifying small businesses, which are partially guaranteed by the SBA and CDS Business Services, Inc. d/b/a Newtek Business Credit (“NBC”) which provides receivable financing and management services.
All Other:
Businesses formed from investments made through Capco programs and others which cannot be aggregated with other operating segments, including insurance and payroll processing.
Corporate Activities:
Corporate implements business strategy, directs marketing, provides technology oversight and guidance, coordinates and integrates activities of the segments, contracts with alliance partners, acquires customer opportunities, and owns our proprietary NewTracker
®
referral system. This segment includes revenue and expenses not allocated to other segments, including interest income, Capco management fee income and corporate operations expenses.
Capco:
Twelve certified capital companies which invest in small- and medium-sized businesses. They generate non-cash income from tax credits and non-cash interest expense and insurance expenses in addition to cash management fees.
The consolidated financial statements of Newtek Business Services, Inc., its Subsidiaries and consolidated entities have been prepared by the Company in accordance with accounting principles generally accepted in the United States of America and include all wholly- and majority-owned subsidiaries, and several portfolio companies in which the Capcos own non-controlling interest, or those variable interest entities of which Newtek is considered to be the primary beneficiary. All inter-company balances and transactions have been eliminated in consolidation. Non-controlling interests (previously shown as minority interests) are reported below net income (loss) under the heading “Net loss attributable to non-controlling interests” in the consolidated statements of income and shown as a component of equity in the consolidated balance sheets.
F-54
Non-controlling interests
Non-controlling interests in results of operations of consolidated variable interest entities and majority-owned subsidiaries represents the non-controlling members’ share of the earnings or loss of the consolidated variable interest entities and majority-owned subsidiaries. The non-controlling interest in the consolidated balance sheet reflects the original investment by these non-controlling members, along with their proportional share of earnings or losses. As a result of the BDC Conversion, non-controlling interest is no longer recorded. All investments are recorded at fair value subsequent to the BDC Conversion.
Description of Business and Basis of Presentation After BDC Conversion
Newtek Business Services Corp. is Maryland corporation formed in August 2013 and is an internally managed, closed end investment company. The Company's investment strategy is to maximize the investment portfolio's return by generating current income from the debt investments the Company makes and generate dividend income from equity investments in controlled portfolio companies.
The consolidated financial statements of the Company have been prepared in accordance with U.S. generally accepted accounting principles (“GAAP”) and pursuant to the requirements for reporting on Form 10-K and Article 6 or 10 of Regulation S-X. In the opinion of management, the consolidated financial statements reflect all adjustments and reclassifications that are necessary for the fair presentation of financial results as of and for the periods presented. All intercompany balances and transactions have been eliminated. Certain prior period amounts have been reclassified to conform to the current period presentation.
All financial information included in the tables in the following footnotes is stated in thousands, except per share data.
Election to become a Business Development Company
The results of operations for 2014 are divided into two periods. The period from January 1, 2014 through November 11, 2014, reflects the Company’s results prior to operating as a BDC under the 1940 Act. The period from November 12, 2014 through December 31, 2014, reflects the Company’s results as a BDC under the 1940 Act. Accounting principles used in the preparation of the consolidated financial statements beginning November 12, 2014 are different than those of prior periods and, therefore, the financial position and results of operations of these periods are not directly comparable. The primary differences in accounting principles relate to the carrying value of loan and equity investments. Additionally, some of the Company's previously consolidated subsidiaries are now equity investments, or controlled portfolio companies, on the consolidated balance sheet and carried at fair value.
Cumulative Effect of Business Development Company Election
|
Deconsolidation of subsidiaries
|
$
|
22,822
|
|
|
Effect of recording debt investments at fair value
|
(374
|
)
|
|
|
Effect of recording servicing assets at fair value
|
960
|
|
|
|
Effect of recording affiliate investments at fair value
|
36,118
|
|
|
|
Reversal of goodwill
|
(1,826
|
)
|
|
|
Other
|
(397
|
)
|
|
|
Total cumulative effect of BDC election
|
$
|
57,303
|
|
Valuation of Investments
Investments are recorded at fair value. Our Board of Directors ("Board") determines the fair value of our portfolio investments. We apply fair value to all of our investments in accordance with relevant GAAP, which establishes a framework used to measure fair value and requires disclosures for fair value measurements. We have categorized our investments carried at fair value, based on the priority of the valuation technique, into a three-level fair value hierarchy as mentioned previously above. Fair value is a market-based measure considered from the perspective of the market participant who holds the financial instrument rather than an entity specific measure. Therefore, when market assumptions are not readily available, our own
F-55
assumptions are set to reflect those that management believes market participants would use in pricing the financial instrument at the measurement date.
Our Board determines the fair value of investments in good faith, based on the input of management, the audit committee and independent valuation firms that have been engaged at the direction of our Board to assist in the valuation of certain portfolio investment without a readily available market quotation at least once during a trailing 12-month period under our valuation policy and a consistently applied valuation process.
Use of Estimates
The preparation of consolidated financial statements in conformity with accounting principles generally accepted in the United States of America requires management to make estimates and assumptions that affect the reported amounts of assets and liabilities and disclosures of contingent assets and liabilities at the date of the consolidated financial statements, and the reported amounts of revenue and expense during the reporting period. The level of uncertainty in estimates and assumptions increases with the length of time until the underlying transactions are complete. The most significant estimates are with respect to asset impairment valuation, allowance for loan losses, valuation of servicing assets, charge-back reserves, tax valuation allowances and the fair value measurements used to value certain financial assets and financial liabilities. Actual results could differ from those estimates.
Revenue Recognition
Interest on loan investments is accrued and included in income based on contractual rates applied to principal amounts outstanding. Interest income is determined using a method that results in a level rate of return on principal amounts outstanding. When a loan becomes 90 days or more past due, or if we otherwise do not expect to receive interest and principal repayments, the loan is placed on non-accrual status and the recognition of interest income is discontinued. Interest payments received on loans that are on non-accrual status are treated as reductions of principal until the principal is repaid.
We receive a variety of fees from borrowers in the ordinary course of conducting our business, including packaging and prepayment fees. All other income is recorded into income when earned.
Prior to the BDC Conversion, the Company operated in a number of different segments. Revenues are recognized as services are rendered and are summarized as follows:
Electronic payment processing revenue:
Electronic payment processing and fee income is derived from the electronic processing of credit and debit card transactions that are authorized and captured through third-party networks. Typically, merchants are charged for these processing services on a percentage of the dollar amount of each transaction plus a flat fee per transaction. Certain merchant customers are charged miscellaneous fees, including fees for handling charge-backs or returns, monthly minimum fees, statement fees and fees for other miscellaneous services. Revenues derived from the electronic processing of MasterCard
®
and Visa
®
sourced credit and debit card transactions are reported gross of amounts paid to sponsor banks.
Web hosting revenue:
Managed technology solutions revenue is primarily derived from monthly recurring service fees for the use of its web hosting, web design and software support services. Customer set-up fees are billed upon service initiation and are recognized as revenue over the estimated customer relationship period of
2.5 years
. Payment for web hosting and related services, excluding cloud plans, is generally received
one month
to
one year
in advance. Deferred revenues represent customer payments for web hosting and related services in advance of the reporting period date. Revenue for cloud related services is based on actual consumption used by a cloud customer.
Income from tax credits:
Following an application process, a state will notify a company that it has been certified as a Capco. The state or jurisdiction then allocates an aggregate dollar amount of tax credits to the Capco. However, such amount is neither recognized as income nor otherwise recorded in the financial statements since it has yet to be earned by the Capco. The Capco is entitled to earn tax credits upon satisfying defined investment percentage thresholds within specified time requirements. Newtek has Capcos operating in
five
states and the District of Columbia. Each statute requires that the Capco invest a threshold percentage of “certified capital” (the funds provided by the insurance company investors) in businesses defined as qualified within the time frames specified. As the Capco meets these requirements, it avoids grounds under the statute for its disqualification for continued participation in the Capco program. Such a disqualification, or “decertification” as a Capco results in a permanent recapture of all or a portion of the allocated tax credits. The proportion of the possible recapture is reduced over time as the Capco remains in general compliance with the program rules and meets the progressively increasing investment benchmarks. As the Capco progresses in its investments in Qualified Businesses and, accordingly, places an
F-56
increasing proportion of the tax credits beyond recapture, it earns an amount equal to the non-recapturable tax credits and records such amount as income, with a corresponding asset called “credits in lieu of cash” in the balance sheet.
The amount earned and recorded as income is determined by multiplying the total amount of tax credits allocated to the Capco by the percentage of tax credits immune from recapture (the earned income percentage) at that point. To the extent that the investment requirements are met ahead of schedule, and the percentage of non-recapturable tax credits is accelerated, the present value of the tax credit earned is recognized currently and the asset, credits in lieu of cash, is accreted up to the amount of tax credits deliverable to the certified investors. The obligation to deliver tax credits to the certified investors is recorded as notes payable in credits in lieu of cash. On the date the tax credits are utilizable by the certified investors, the Capco decreases credits in lieu of cash with a corresponding decrease to notes payable in credits in lieu of cash.
Sales and Servicing of SBA Loans:
NSBF originates loans to customers under the SBA 7(a) program that generally provides for SBA guarantees of
75%
to
90%
of each loan, subject to a maximum guarantee amount. This guaranteed portion is generally sold to a third party via an SBA regulated secondary market transaction utilizing SBA Form 1086 for a price equal to the guaranteed loan amount plus a premium. NSBF recognizes premium on loan sales as equal to the cash premium plus the fair value of the initial servicing assets. Revenue is recognized on the trade date of the guaranteed portion.
Upon recognition of each loan sale, the Company retains servicing responsibilities and receives servicing fees of a minimum of
1%
of the guaranteed loan portion sold. The Company is required to estimate its adequate servicing compensation in the calculation of its servicing assets. The purchasers of the loans sold have no recourse to the Company for failure of customers to pay amounts contractually due.
Subsequent measurements of each class of servicing assets and liabilities may use either the amortization method or the fair value measurement method. Prior to the BDC Conversion NSBF had chosen to apply the amortization method to its servicing assets, amortizing the asset in proportion to, and over the period of, the estimated future net servicing income on the underlying sold guaranteed portion of the loans and assessing the servicing assets for impairment based on fair value at each reporting date. In the event future prepayments are significant or impairments are incurred and future expected cash flows are inadequate to cover the unamortized servicing assets, accelerated amortization or impairment charges would be recognized. In evaluating and measuring impairment of servicing assets, NSBF stratifies its servicing assets based on year of loan and loan term which are the key risk characteristics of the underlying loan pools. The Company estimates the fair value of the servicing assets by calculating the present value of estimated future net servicing cash flows, using assumptions of prepayments, defaults, servicing costs and discount rates that NSBF believes market participants would use for similar assets. If NSBF determines that the impairment for a stratum is temporary, a valuation allowance is recognized through a charge to current earnings for the amount the amortized balance exceeds the current fair value. If the fair value of the stratum were to later increase, the valuation allowance may be reduced as a recovery. However, if NSBF determines that impairment for a stratum is other than temporary, the value of the servicing assets and any related valuation allowance is written-down. Subsequent to the BDC Conversion, servicing assets are valued using the fair value measurement method and marked to fair value each reporting period.
SBA Loan Interest and Fees:
Interest income on loans is recognized as earned. A loan is placed on non-accrual status if it exceeds
90 days
past due with respect to principal or interest and, in the opinion of management, interest or principal on the loan is not collectible, or at such earlier time as management determines that the collectability of such principal or interest is unlikely. Such loans are designated as impaired non-accrual loans. All other loans are defined as performing loans. When a loan is designated as impaired non-accrual, the accrual of interest is discontinued, and any accrued but uncollected interest income is reversed and charged against current operations. While a loan is classified as impaired non-accrual and the future collectability of the recorded loan balance is doubtful, collections of interest and principal are generally applied as a reduction to principal outstanding.
The Company passes certain expenditures it incurs to the borrower, such as force placed insurance, insufficient funds fees, or fees it assesses, such as late fees, with respect to managing the loan. These expenditures are recorded when incurred. Due to the uncertainty with respect to collection of these passed through expenditures or assessed fees, any funds received to reimburse the Company are recorded on a cash basis as other income.
Insurance commissions:
Revenues are comprised of commissions earned on premiums paid for insurance policies and are recognized at the time the commission is earned. At that date, the earnings process has been completed and the Company can estimate the impact of policy cancellations for refunds and establish reserves. The reserve for policy cancellations is based on historical cancellation experience adjusted by known circumstances.
Other income:
Other income represents revenues derived from operating units that cannot be aggregated with other business segments. In addition, other income represents one time recoveries or gains on investments. Revenue is recorded when there is
F-57
strong evidence of an agreement, the related fees are fixed, the service or product has been delivered, and the collection of the related receivable is assured.
|
•
|
Receivable fees:
Receivable fees are derived from the funding (purchase) of receivables from finance clients. NBC recognizes the revenue on the date the receivables are purchased at a percentage of face value as agreed to by the client. The Company also has arrangements with certain of its clients whereby it purchases the client’s receivables and charges a fee at a specified rate based on the amount of funds advanced against such receivables. The funds provided are collateralized and the income is recognized as earned.
|
|
•
|
Late fees:
Late fees are derived from receivables NBC has purchased that have gone over a certain period (usually over
30 days
) without payment. The client or the client’s customer is charged a late fee according to the agreement with the client and NBC records the fees as income in the month in which such receivable becomes past due.
|
|
•
|
Billing fees:
Billing fees are derived from billing-only (non-finance) clients. These fees are recorded when earned, which occurs when the service is rendered.
|
|
•
|
Other fees:
These fees include annual fees, due diligence fees, termination fees, under minimum fees, and other fees including finance charges, supplies sold to clients, NSF fees, wire fees and administration fees. These fees are charged upon funding, takeovers or liquidation of finance clients. The Company also receives commission revenue from various sources.
|
Investments and Related Investment Income:
Interest on loan investments is accrued and included in income based on contractual rates applied to principal amounts outstanding. Interest income is determined using a method that results in a level rate of return on principal amounts outstanding. When a loan becomes 90 days or more past due, or if we otherwise do not expect to receive interest and principal repayments, the loan is placed on non-accrual status and the recognition of interest income is discontinued. Interest payments received on loans that are on non-accrual status are treated as reductions of principal until the principal is repaid.
We receive a variety of fees from borrowers in the ordinary course of conducting our business, including packaging and prepayment fees. All other income is recorded into income when earned.
Investment transactions are accounted for on a trade-date basis. Realized gains or losses on investments are measured by the difference between the net proceeds from the disposition and the cost basis of investment, without regard to unrealized gains or losses previously recognized. The Company reports current period changes in fair value of investments that are measured at fair value as a component of the net change in unrealized appreciation (depreciation) investments in the consolidated statements of income.
Electronic Payment Processing Costs
Electronic payment processing costs consist principally of costs directly related to the processing of merchant sales volume, including interchange fees, VISA® and MasterCard® dues and assessments, bank processing fees and costs paid to third-party processing networks. Such costs are recognized at the time the merchant transactions are processed or when the services are performed. Two of the most significant components of electronic processing expenses include interchange and assessment costs, which are set by the credit card associations. Interchange costs are passed on to the entity issuing the credit card used in the transaction and assessment costs are retained by the credit card associations. Interchange and assessment fees are billed primarily as a percent of dollar volume processed and, to a lesser extent, as a per transaction fee. In addition to costs directly related to the processing of merchant sales volume, electronic payment processing costs also include residual expenses. Residual expenses represent fees paid to third-party sales referral sources. Residual expenses are paid under various formulae as contracted. These are generally linked to revenues derived from merchants successfully referred to the Company and that begin using the Company for merchant processing services. Such residual expenses are recognized in the Company’s consolidated statements of income.
Cash and Cash Equivalents
The Company considers all highly liquid investments with maturities of three months or less when purchased to be cash equivalents. Invested cash is held almost exclusively at financial institutions with ratings from S&P of A- or better. The Company invests cash not held in interest free checking accounts or bank money market accounts mainly in U.S. Treasury only money market instruments or funds and other investment-grade securities. As of
December 31, 2014
, cash deposits in excess of FDIC deposit insurance and Securities Investor Protection Corporation ("SIPC") insurance totaled approximately
$23,228,000
.
F-58
Restricted Cash
Restricted cash includes cash collateral relating to a letter of credit; monies due on SBA loan-related remittances and insurance premiums received by the Company and due to third parties; cash held by the Capcos restricted for use in managing and operating the Capco, making qualified investments and for the payment of income taxes; cash reserves associated with securitization transactions, cash held in blocked accounts used to pay down bank notes payable, cash held for our payroll clients waiting to be remitted to their employees or taxing authority and a cash account maintained as a reserve against electronic payment processing chargeback losses. Following is a summary of restricted cash by segment:
|
(In thousands):
|
2014
|
2013
|
|||||
|
Electronic payment processing
|
$
|
—
|
|
$
|
573
|
|
|
|
Small business finance (1)
|
13,906
|
|
12,829
|
|
|||
|
All other
|
—
|
|
2,475
|
|
|||
|
Corporate activities
|
1,483
|
|
989
|
|
|||
|
Capcos
|
—
|
|
11
|
|
|||
|
Totals
|
$
|
15,389
|
|
$
|
16,877
|
|
|
(1) Restricted cash at
December 31, 2014
is held at Newtek Small Business Finance, LLC, the consolidated lending subsidiary and Newtek Business Services Corp.
Broker Receivable
Broker receivable represents amounts due from third parties for loans which have been traded at period end but have not yet settled.
Purchased Receivables
For clients that are assessed fees based on a discount as well as for clients that are on a prime plus fee schedule, purchased receivables are recorded at the point in time when cash is released to the client. A majority of the receivables purchased with respect to prime plus arrangements are recourse and are sold back to the client if aged over
90 days
, depending on contractual agreements. Purchased receivables are included in accounts receivable on the consolidated balance sheets.
Allowance for Doubtful Accounts—Purchased Receivables
The allowance for doubtful accounts, related to purchased receivables, is established by management through provisions for bad debts charged against income. Amounts deemed to be uncollectible are charged against the allowance for doubtful accounts and subsequent recoveries, if any, are credited to income.
The amount of the allowance for doubtful accounts is inherently subjective, as it requires making material estimates which may vary from actual results. Management’s ongoing estimates of the allowance for doubtful accounts are particularly affected by the performance of the client in their ability to provide the Company with future receivables coupled with the collections of their current receivables.
The allowance consists of specific and general components. The specific component relates to clients’ aggregate net balance that is classified as doubtful. The general component covers non-classified balances and is based on historical loss experience.
A clients’ aggregate net balance is considered impaired when, based on current information and events, it is probable that the Company will be unable to collect the receivable payments or the Company has greatly reduced the amount of receivables to be purchased.
The Company’s charge-off policy is based on a client-by-client review for which the estimated uncollectible portion is charged off against the corresponding client’s net balance and the allowance for doubtful accounts.
SBA Loans Held for Investment/ SBA Unguaranteed Loans
Prior to the BDC Conversion, the Company's cost basis SBA loans held for investment were reported at their outstanding unpaid principal balances adjusted for charge-offs, net deferred loan origination costs and the allowance for loan losses. Loans
F-59
that completed funding on or after October 1, 2010, management elected to fair value SBA loans held for investment within the fair value hierarchy that prioritizes observable and unobservable inputs utilizing Level 3 unobservable inputs which reflect the Company’s own expectations about the assumptions that market participants would use in pricing the asset (including assumptions about risk). At December 31, 2013, the Company determined fair value based on its securitization pricing, as well as internal quantitative data on the portfolio with respect to historical default rates and future expected losses, and now uses a discounted cash flow methodology, which includes assumptions for cumulative default rates, prepayment speeds, recovery rates/duration, interest rates, servicing and liquidation costs and discount rates.
If a loan measured at fair value is subsequently impaired, then the fair value of the loan is measured based on the present value of expected future cash flows discounted at the market clearing yield. Expected future cash flows for impaired loans are derived from payment streams, if loan is income producing, or proceeds from the liquidation of collateral, if loan is non-income producing. The significant unobservable inputs used in the fair value measurement of the impaired loans involve management’s judgment in the use of market data and third party estimates regarding collateral values. Such estimates are further discounted to reflect the cost of liquidating the various assets under collateral. Any subsequent increases or decreases in any of the inputs would result in a corresponding decrease or increase in the fair value of SBA loans. Subsequent to the BDC Conversion, all SBA loans held for investment are measured at fair value each reporting period.
Allowance for SBA Loan Losses
Prior to the BDC conversion, impaired loans carried on a cost-basis had an allowance for loan losses established by management through provisions for loan losses charged against income. The amount of the allowance for loan losses was inherently subjective, as it required making material estimates which may have varied from actual results. Management’s estimates of the allowance for loan losses were particularly affected by the changing composition of the loan portfolio over the last few years as well as other portfolio characteristics, such as industry concentrations and loan collateral. The adequacy of the allowance for loan losses was reviewed by management on a monthly basis at a minimum, and as adjustments became necessary, were reflected in provision for loan losses during the periods in which they became known. Considerations in this evaluation include past and anticipated loss experience, risks inherent in the current portfolio and evaluation of real estate collateral as well as economic conditions. An allowance was established when the discounted cash flows or collateral value or observable market price of the impaired loan was lower than the carrying value of that loan.
In connection with the Company's conversion to a BDC, the allowance for loan losses associated with cost basis loans was released and recorded to the additional paid-in capital component of stockholders' equity as of the conversion date. Subsequent to the BDC Conversion, all SBA loans held for investment were measured at fair value.
A loan is considered impaired when, based on current information and events, it is probable that the Company will be unable to collect the scheduled payments of principal or interest when due according to the contractual terms of the loan agreement. Other factors considered by management in determining impairment include payment status and collateral value. Loans that experience insignificant payment delays and payment shortfalls generally are not classified as impaired. Management determines the significance of payment delays and payment shortfalls on a case-by-case basis, taking into consideration all of the circumstances surrounding the loan and the borrower, including the length of the delay, the reasons for the delay, the borrower’s prior payment record, and the amount of the shortfall in relation to the principal and interest owed.
The Company’s charge-off policy is based on a loan-by-loan review for which the estimated uncollectible portion of nonperforming loans is charged off against the corresponding loan receivable and the allowance for possible loan losses or against the reduction in fair value.
Troubled Debt Restructured Loans
Prior to the BDC conversion, a loan funded prior to October 1, 2010 was considered a TDR when a borrower was experiencing financial difficulties that lead to a restructuring that the Company would not have otherwise considered. Concessions per ASC Topic 310, Receivables, included rate reductions, principal forgiveness, extension of the maturity date and other actions which minimized potential losses. All TDRs are modified loans; however, not all modified loans are TDRs.
Prior to the BDC conversion, the Company reviewed its modified cost-basis loans for TDR Classification. When a borrower was granted extended time to pay and there were no other concessions as to rate reductions or principal, the loan remained an accrual loan. Certain time extensions based on the time value of money required reserves to be established despite no interruption on payments being made. In the case of a default, the loan became non-accrual and reviewed by committee for adequate specific reserves to that loan.
F-60
Subsequent to the BDC conversion, all loans are measured at fair value. As such, Post BDC Conversion, TDR Classification is no longer applicable as it relates to cost-basis loans.
SBA Loans Held For Sale/SBA Guaranteed Loans
For guaranteed portions funded, but not yet traded at each measurement date, management elected to fair value SBA loans held for sale within the fair value hierarchy that prioritizes observable and unobservable inputs used to measure fair value utilizing Level 2 assets. These inputs include debt securities with quoted prices that are traded less frequently than exchange-traded instruments or have values determined using a pricing model with inputs that are observable in the market. The secondary market for the guaranteed portions is extremely robust with broker dealers acting as primary dealers. NSBF sells regularly into the market and can quickly price its loans held for sale. The Company values the guaranteed portion based on observable market prices for similar assets.
Loans receivable held for sale are sold with the servicing rights retained by the Company. Premium on loan sales is equal to the cash premium plus the fair value of the servicing assets while reversing the fair value gain previously recorded.
Fixed Assets
Fixed assets, which are comprised of furniture and fixtures and computer office equipment, building and improvements, are stated at cost less accumulated depreciation and amortization. Depreciation of fixed assets is provided on a straight-line basis using estimated useful lives of the related assets. Amortization of leasehold improvements is provided on a straight-line basis using the lesser of the useful life of the asset or lease term. Useful lives of assets are: computer software, website development, and servers and storage (
three years
), computer and office equipment and furniture and fixtures (generally
three
to
five years
).
Software and Website Development Costs
The Company capitalizes its website development costs, online application system, referral system and other proprietary systems and computer software. Costs incurred during the preliminary project stage are expensed as incurred, while application stage projects are capitalized. The latter costs are typically employee and/or consulting services directly associated with the development of the internal use computer software. Software and website costs are included in fixed assets in the accompanying consolidated balance sheets. Amortization commences once the software is ready for its intended use and is amortized using the straight-line method over the estimated useful life, typically three years.
Deferred Financing Costs
Deferred financing costs are being amortized under the straight-line method over the terms of the related indebtedness, which approximates the effective interest method and is included in interest expense in the accompanying consolidated statements of income.
Impairment of Long-Lived Assets
Long-lived assets, including fixed assets and intangible assets, are reviewed for impairment whenever events or changes in circumstances indicate that the carrying value may not be recoverable. In reviewing for impairment, the carrying value of such assets is compared to the estimated undiscounted future cash flows expected from the use of the assets and their eventual disposition. If such cash flows are not sufficient to support the asset’s recorded value, an impairment charge is recognized to reduce the carrying value of the long-lived asset to its estimated fair value. The determination of future cash flows as well as the estimated fair value of long-lived assets involves significant estimates on the part of management. In order to estimate the fair value of a long-lived asset, the Company may engage a third party to assist with the valuation. If there is a material change in economic conditions or other circumstances influencing the estimate of future cash flows or fair value, the Company could be required to recognize impairment charges in the future.
Securitization Activities
NSBF engaged in securitization transactions involving the unguaranteed portions of its SBA 7(a) loans in 2010, 2011, 2013 and 2014. Because the transfer of these assets did not meet the criteria of a sale for accounting purposes, it was treated as a secured borrowing. NSBF continues to recognize the assets of the secured borrowing in Loans held for investment/SBA unguaranteed
F-61
investments and the associated financing in Notes payable/Note payable - securitization trust VIE on the consolidated balance sheets.
Goodwill and Other Intangible Assets
Goodwill and other intangible assets deemed to have an indefinite life are not amortized and are subject to impairment tests, at least annually. Other intangible assets with finite lives are amortized over their useful lives ranging from
18
to
66 months
, and evaluated as discussed in Note 10.
The Company considers the following to be some examples of indicators that may trigger an impairment review outside its annual impairment review: (i) significant under-performance or loss of key contracts acquired in an acquisition relative to expected historical or projected future operating results; (ii) significant changes in the manner or use of the acquired assets or in the Company’s overall strategy with respect to the manner or use of the acquired assets or changes in the Company’s overall business strategy; (iii) significant negative industry or economic trends; (iv) increased competitive pressures; (v) a significant decline in the Company’s stock price for a sustained period of time; and (vi) regulatory changes. In assessing the recoverability of the Company’s goodwill and intangibles, the Company must make assumptions regarding estimated future cash flows and other factors to determine the fair value of the respective assets. These include estimation of future cash flows, which is dependent on internal forecasts, estimation of the long-term rate of growth for the Company, the useful life over which cash flows will occur, and determination of the Company’s cost of capital. Changes in these estimates and assumptions could materially affect the determination of fair value and conclusions on goodwill impairment.
Reserve for Losses on Merchant Accounts
Disputes between a cardholder and a merchant periodically arise as a result of, among other things, cardholder dissatisfaction with merchandise quality or merchant services. Such disputes may not be resolved in the merchant’s favor. In these cases, the transaction is “charged back” to the merchant, which means the purchase price is refunded to the customer through the merchant’s acquiring bank and charged to the merchant. If the merchant has inadequate funds, the Company or, under limited circumstances, the Company and the acquiring bank, must bear the credit risk for the full amount of the transaction. The Company evaluates its risk for such transactions and estimates its potential loss for charge-backs based primarily on historical experience and other relevant factors.
The Company records reserves for charge-backs and contingent liabilities when such amounts are deemed to be probable and estimable. The required reserves may change in the future due to new developments, including, but not limited to, changes in litigation or increased charge-back exposure as the result of merchant insolvency, liquidation, or other reasons. The required reserves are reviewed periodically to determine if adjustments are required.
Share—Based Compensation
All share-based payments to employees are recognized in the financial statements based on their fair values using an option-pricing model at the date of grant. The Company recognizes compensation on a straight-line basis over the requisite service period for the entire award. The Company has elected to adopt the alternative transition method for calculating the tax effects of share-based compensation. The alternative transition method includes a simplified method to establish the beginning balance of the additional paid-in capital pool related to the tax effects of employee share-based compensation, which is available to absorb tax deficiencies.
Fair Value
Post BDC Conversion, the Company records all of its investments at fair value in accordance with relevant GAAP, which establishes a framework used to measure fair value and requires disclosures for fair value measurements. The Company has categorized its investments carried at fair value, based on the priority of the valuation technique, into a three-level fair value hierarchy as more fully described in Note 3. Fair value is a market-based measure considered from the perspective of the market participant who holds the financial instrument rather than an entity specific measure. Therefore, when market assumptions are not readily available, the Company’s own assumptions are set to reflect those that management believes market participants would use in pricing the financial instrument at the measurement date.
The availability of observable inputs can vary depending on the financial instrument and is affected by a wide variety of factors, including, for example, the type of product, whether the product is new, whether the product is traded on an active exchange or in the secondary market and the current market conditions. To the extent that the valuation is based on models or inputs that are less observable or unobservable in the market, the determination of fair value requires more judgment.
F-62
Accordingly, the degree of judgment exercised by the Company in determining fair value is greatest for financial instruments classified as Level 3.
Income Taxes
Deferred tax assets and liabilities are computed based upon the differences between the financial statement and income tax basis of assets and liabilities using the enacted tax rates in effect for the year in which those temporary differences are expected to be realized or settled. If available evidence suggests that it is more likely than not that some portion or all of the deferred tax assets will not be realized, a valuation allowance is required to reduce the deferred tax assets to the amount that is more likely than not to be realized.
The Company’s U.S. Federal and state income tax returns prior to fiscal year 2011 are closed, and management continually evaluates expiring statutes of limitations, audits, proposed settlements, changes in tax law and new authoritative rulings.
Accounting for Uncertainty in Income Taxes
The ultimate deductibility of positions taken or expected to be taken on tax returns is often uncertain. In order to recognize the benefits associated with a tax position taken (i.e., generally a deduction on a corporation’s tax return), the entity must conclude that the ultimate allowability of the deduction is more likely than not.
If the ultimate allowability of the tax position exceeds 50%
(i.e., it is more likely than not), the benefit associated with the position is recognized at the largest dollar amount that has more than a
50%
likelihood of being realized upon ultimate settlement. Differences between tax positions taken in a tax return and recognized will generally result in (1) an increase in income taxes currently payable or a reduction in an income tax refund receivable or (2) an increase in a deferred tax liability or a decrease in a deferred tax asset, or both (1) and (2).
Fair Value of Financial Instruments
As required by ASU Topic 825, Financial Instruments, the estimated fair values of financial instruments must be disclosed. Excluding fixed assets, intangible assets, goodwill, and prepaid expenses and other assets (excluding as noted below), substantially all of the Company’s assets and liabilities are considered financial instruments as defined under this standard. Fair value estimates are subjective in nature and are dependent on a number of significant assumptions associated with each instrument or group of similar instruments, including estimates of discount rates, risks associated with specific financial instruments, estimates of future cash flows and relevant available market information.
The carrying values of the following balance sheet items approximate their fair values primarily due to their liquidity and short-term or adjustable-yield nature:
|
•
|
Cash and cash equivalents
|
|
•
|
Restricted cash
|
|
•
|
Broker receivable
|
|
•
|
Accounts receivable
|
|
•
|
Notes payable
|
|
•
|
Accrued interest receivable (included in prepaid expenses and other assets)
|
|
•
|
Accrued interest payable (included in accounts payable and accrued expenses)
|
|
•
|
Accounts payable and accrued expenses
|
The carrying value of investments in Qualified Businesses (included in prepaid expenses and other assets), Credits in lieu of cash and Notes payable in credits in lieu of cash as well as SBA unguaranteed investments, and SBA guaranteed investments approximate fair value based on management’s estimates.
New Accounting Standards
F-63
In June 2013, the FASB issued ASU 2013-08, "Financial Services — Investment Companies (Topic 946): Amendments to the Scope, Measurement and Disclosure Requirements, containing new guidance on assessing whether an entity is an investment company, requiring non-controlling ownership interests in investment companies to be measured at fair value and requiring certain additional disclosures. This guidance is effective for annual and interim periods beginning on or after December 15, 2013. This ASU did not have a material impact on the Company's Consolidated Financial Statements or disclosures.
In July 2013, the FASB issued ASU No. 2013-11: Presentation of an Unrecognized Tax Benefit When a Net Operating Loss Carryforward, a Similar Tax Loss, or a Tax Credit Carryforward Exists (“ASU 2013-11”). The amendments in ASU 2013-11 are intended to end inconsistent practices regarding the presentation of unrecognized tax benefits on the balance sheet. An entity will be required to present an unrecognized tax benefit as a reduction of a deferred tax asset for a net operating loss (“NOL”) or tax credit carryforward whenever the NOL or tax credit carryforward would be available to reduce the additional taxable income or tax due if the tax position is disallowed. This standard became effective for annual reporting periods beginning after December 15, 2013, and did not have a material impact on the Company’s Consolidated Financial Statements or disclosures.
In January 2014, the FASB issued ASU 2014-04, “Receivables—Troubled Debt Restructurings by Creditors: Reclassification of Residential Real Estate Collateralized Consumer Mortgage Loans upon Foreclosure (a consensus of the FASB Emerging Issues Task Force).” The update clarifies that an in substance repossession or foreclosure occurs, and a creditor is considered to have received physical possession of residential real estate property collateralizing a consumer mortgage loan, upon either (1) the creditor obtaining legal title to the residential real estate property upon completion of a foreclosure or (2) the borrower conveying all interest in the residential real estate property to the creditor to satisfy that loan through completion of a deed in lieu of foreclosure or through a similar legal agreement. The ASU is effective for fiscal years and interim periods beginning after December 15, 2014. The adoption of this ASU is not expected to have a significant impact on the Company’s Consolidated Financial Statements or disclosures.
In May 2014, the FASB issued ASU No. 2014-09, “Revenue from Contracts with Customers.” ASU 2014-09 supersedes the revenue recognition requirements in “Accounting Standard Codification 605 – Revenue Recognition” and most industry-specific guidance. The standard requires that entities recognize revenue to depict the transfer of promised goods or services to customers in an amount that reflects the consideration to which a company expects to be entitled in exchange for those goods or services. This ASU is effective for fiscal years beginning after December 15, 2016. ASU 2014-09 permits the use of either the retrospective or cumulative effect transition method. The adoption of this ASU is not expected to have a material impact on the Company’s Consolidated Financial Statements or disclosures.
In June 2014, the FASB issued ASU 2014-11 “Repurchase-to-Maturity Transactions, Repurchase Financings, and Disclosures” which changes the accounting for repurchase-to-maturity transactions and linked repurchase financings to secured borrowing accounting, which is consistent with the accounting for other repurchase agreements. In addition, ASU 2014-11 requires disclosures about transfers accounted for as sales in transactions that are economically similar to repurchase agreements and about the types of collateral pledged in repurchase agreements and similar transactions accounted for as secured borrowings. The accounting changes in ASU 2014-11 and the disclosure for certain transactions accounted for as a sale are effective for public companies for the first interim or annual period beginning after December 15, 2014. For public companies, the disclosure for transactions accounted for as secured borrowings is required to be presented for annual periods beginning after December 15, 2014, and interim periods beginning after March 15, 2015. The adoption of this ASU is not expected to have a material impact on the Company’s Consolidated Financial Statements or disclosures.
In June 2014, the FASB issued ASU 2014-12 “Compensation – Stock Compensation (Topic 718): Accounting for Share-Based Payments When the Terms of an Award Provide That a Performance Target Could Be Achieved after the Requisite Service Period,” which requires that a performance target that affects vesting and that could be achieved after the requisite service period is treated as a performance condition and, as a result, should not be included in the estimation of the grant-date fair value of the award. ASU 2014-12 will be effective for annual periods beginning after December 15, 2015 and may be applied either prospectively to all awards granted or modified after the effective date or retrospectively, to all periods presented. The adoption of this ASU is not expected to have a material impact on the Company’s Consolidated Financial Statements or disclosures.
Segments
Subsequent to the BDC Conversion, the Company has determined that it has a single reporting segment and operating unit structure. The Company lends to and investments in portfolio companies in various industries. The Company separately evaluates the performance of each of its lending and investment relationships. However, because of each of these loan and
F-64
investment relationships has similar business and economic characteristics, they have been aggregated into a single lending and investment segment.
Reclassifications
Certain prior period amounts have been reclassified to conform to the current year presentation.
In accordance with GAAP, fair value is defined as the price that would be received to sell an asset or paid to transfer a liability (i.e., the “exit price”) in an orderly transaction between market participants at the measurement date. In determining fair value, Management uses various valuation approaches, all of which have been approved by the Board. In accordance with GAAP, a fair value hierarchy for inputs is used in measuring fair value that maximizes the use of observable inputs and minimizes the use of unobservable inputs by requiring that the most observable inputs be used when available.
The fair value hierarchy gives the highest priority (Level 1) to quoted prices in active markets for identical assets or liabilities and gives the lowest priority to unobservable inputs (Level 3). An asset or liability’s classification within the fair value hierarchy is based on the lowest level of significant input to its valuation. The levels of the fair value hierarchy are as follows:
|
Level 1
|
|
Quoted prices in active markets for identical assets or liabilities. Level 1 assets and liabilities include debt and equity securities and derivative contracts that are traded in an active exchange market, as well as certain U.S. Treasury, other U.S. Government and agency mortgage-backed debt securities that are highly liquid and are actively traded in over-the-counter markets.
|
|
Level 2
|
|
Observable inputs other than Level 1 prices, such as quoted prices for similar assets or liabilities; quoted prices in markets that are not active; or other inputs that are observable or can be corroborated by observable market data for substantially the full term of the assets or liabilities. Level 2 assets and liabilities include debt securities with quoted prices that are traded less frequently than exchange-traded instruments and derivative contracts whose value is determined using a pricing model with inputs that are observable in the market or can be derived principally from or corroborated by observable market data. This category generally includes certain U.S. Government and agency mortgage-backed debt securities, corporate debt securities, derivative contracts and residential mortgage loans held-for-sale.
|
|
Level 3
|
|
Unobservable inputs that are supported by little or no market activity and that are significant to the fair value of the assets or liabilities. Level 3 assets and liabilities include financial instruments whose value is determined using pricing models, discounted cash flow methodologies, or similar techniques, as well as instruments for which the determination of fair value requires significant management judgment or estimation. This category generally includes certain private equity investments, retained residual interests in securitizations, residential mortgage servicing rights, and highly structured or long-term derivative contracts.
|
The availability of valuation techniques and observable inputs can vary from investment to investment and is affected by a wide variety of factors including, the type and age of investment, and other characteristics particular to the transaction. To the extent that valuation is based on models or inputs that are less observable or unobservable in the market, the determination of fair value requires more judgment. Those estimated values do not necessarily represent the amounts that may be ultimately realized due to the occurrence of future circumstances that cannot be reasonably determined. Because of the inherent uncertainty of valuation, those estimated values may be materially higher or lower than the values that would have been used had a ready market for the securities existed. Accordingly, the degree of judgment exercised by Management and the Board in determining fair value is greatest for investments categorized in Level 3. In certain cases, the inputs used to measure fair value may fall into different levels of the fair value hierarchy. In such cases, for disclosure purposes, the level in the fair value hierarchy within which the fair value measurement in its entirety falls is determined based on the lowest level input that is significant to the fair value measurement.
Fair value is a market-based measure considered from the perspective of a market participant rather than an entity-specific measure. Therefore, even when market assumptions are not readily available, Management’s own assumptions are set to reflect those that market participants would use in pricing the asset or liability at the measurement date. Management uses prices and inputs that are current as of the measurement date, including periods of market dislocation, if applicable. In periods of market dislocation, the observability of prices and inputs may be reduced for many investments. This condition could cause an investment to be reclassified to a lower level within the fair value hierarchy.
F-65
The following table provides a summary of quantitative information about the Company’s Level 3 fair value measurements of our investments as of December 31, 2014. In addition to the techniques and inputs noted in the table below, according to our valuation policy we may also use other valuation techniques and methodologies when determining our fair value measurements. The table below is not intended to be all-inclusive, but rather provides information on the significant Level 3 inputs as they relate to the Company’s fair value measurements for the year ended December 31, 2014.
|
Range
|
|||||||||||||||||
|
Fair Value
|
Valuation Techniques
|
Unobservable Input
|
Weighted Average
|
Minimum
|
Maximum
|
||||||||||||
|
Assets:
|
|||||||||||||||||
|
Performing SBA Unguaranteed Investments
|
$
|
115,175
|
|
Discounted cash flow
|
Market yields
|
5.38
|
%
|
5.38
|
%
|
5.38
|
%
|
||||||
|
Non-Performing SBA Unguaranteed Investments
|
6,302
|
|
Discounted cash flow
|
Market yields
|
7.00
|
%
|
7.00
|
%
|
7.00
|
%
|
|||||||
|
Affiliate Investments (A)
|
77,499
|
|
Market comparable companies
|
EBITDA multiples
|
5.7x
|
|
3.00x
|
|
9.00x
|
|
|||||||
|
Market comparable companies
|
Revenue Multiples
|
0.95x
|
|
0.40x
|
|
3.00x
|
|
||||||||||
|
Discounted cash flow
|
Weighted Average Cost of Capital
|
17.80
|
%
|
10.70
|
%
|
20.00
|
%
|
||||||||||
(A) In determining the fair value of the Company's equity investments as of December 31, 2014, the proportion of the market comparable companies and discounted cash flow valuation techniques were 48.1% and 51.9%, respectively, on a weighted average basis
Assets and Liabilities Measured at Fair Value on a Recurring Basis (In thousands)
|
|
Fair Value Measurements at December 31, 2014 Using:
|
||||||||||||||||||
|
(In thousands):
|
Total
|
Level 1
|
Level 2
|
Level 3
|
Total Gains
and (Losses)
|
||||||||||||||
|
Assets
|
|||||||||||||||||||
|
Investments in money markets funds
|
$
|
3,000
|
|
$
|
3,000
|
|
$
|
—
|
|
$
|
—
|
|
$
|
—
|
|
||||
|
Credits in lieu of cash
|
2,229
|
|
—
|
|
2,229
|
|
—
|
|
(13
|
)
|
|||||||||
|
SBA unguaranteed loans
|
121,477
|
|
—
|
|
—
|
|
121,477
|
|
(9,605
|
)
|
|||||||||
|
SBA guaranteed loans
|
31,486
|
|
—
|
|
31,486
|
|
—
|
|
3,429
|
|
|||||||||
|
Affiliate investments
|
77,499
|
|
—
|
|
—
|
|
77,499
|
|
—
|
|
|||||||||
|
Servicing assets
|
9,483
|
|
—
|
|
—
|
|
9,483
|
|
(120
|
)
|
|||||||||
|
Total assets
|
$
|
235,691
|
|
$
|
3,000,000
|
|
$
|
33,715
|
|
$
|
208,459
|
|
$
|
(6,309
|
)
|
||||
|
Liabilities
|
|||||||||||||||||||
|
Notes payable in credits in lieu of cash
|
$
|
—
|
|
$
|
—
|
|
$
|
2,229
|
|
$
|
—
|
|
$
|
5
|
|
||||
|
Total liabilities
|
$
|
—
|
|
$
|
—
|
|
$
|
2,229
|
|
$
|
—
|
|
$
|
5
|
|
||||
Assets and Liabilities Measured at Fair Value on a Recurring Basis (In thousands):
F-66
|
|
Fair Value Measurements at December 31, 2013 Using:
|
||||||||||||||||||
|
(In thousands):
|
Total
|
Level 1
|
Level 2
|
Level 3
|
Total Gains
and (Losses)
|
||||||||||||||
|
Assets
|
|||||||||||||||||||
|
Credits in lieu of cash
|
$
|
3,641
|
|
$
|
—
|
|
$
|
3,641
|
|
$
|
—
|
|
$
|
—
|
|
||||
|
SBA loans held for investment
|
78,951
|
|
—
|
|
—
|
|
78,951
|
|
(1,629
|
)
|
|||||||||
|
SBA loans held for sale
|
4,734
|
|
—
|
|
4,734
|
|
—
|
|
403
|
|
|||||||||
|
Total assets
|
$
|
87,326
|
|
$
|
—
|
|
$
|
8,375
|
|
$
|
78,951
|
|
$
|
(1,226
|
)
|
||||
|
Liabilities
|
|||||||||||||||||||
|
Notes payable in credits in lieu of cash
|
$
|
3,641
|
|
$
|
—
|
|
$
|
3,641
|
|
$
|
—
|
|
$
|
21
|
|
||||
|
Warrants
|
|
|
|
|
|
|
|
|
|
|
|||||||||
|
Total liabilities
|
$
|
3,641
|
|
$
|
—
|
|
$
|
3,641
|
|
$
|
—
|
|
$
|
21
|
|
||||
The following table presents the changes in servicing assets measured at fair value using level 3 inputs:
|
November 12, 2014 through December 31, 2014
|
||||
|
Fair value, beginning of period
|
$
|
9,465
|
|
|
|
Additions
|
138
|
|
||
|
Unrealized loss
|
(120
|
)
|
||
|
Fair value, end of period
|
$
|
9,483
|
|
|
The following table presents the changes in affiliate investments measured at fair value using level 3 inputs:
|
November 12, 2014 through December 31, 2014
|
||||
|
Fair value, beginning of period
|
$
|
77,499
|
|
|
|
Unrealized gain/(loss)
|
—
|
|
||
|
Fair value, end of period
|
$
|
77,499
|
|
|
The following table shows the Company's portfolio investments by industry at
December 31, 2014
:
F-67
|
Fair Value
|
% of Total
|
|||||
|
Data processing, hosting and related services.
|
$
|
70,322
|
|
30.51
|
%
|
|
|
Food Services and Drinking Places
|
15,442
|
|
6.70
|
%
|
||
|
Amusement, Gambling, and Recreation Industries
|
13,621
|
|
5.91
|
%
|
||
|
Securities, Commodity Contracts, and Other Financial Investments and Related Activities
|
5,771
|
|
2.50
|
%
|
||
|
Plastics and Rubber Products Manufacturing
|
8,120
|
|
3.52
|
%
|
||
|
Accommodation
|
7,240
|
|
3.14
|
%
|
||
|
Repair and Maintenance
|
7,023
|
|
3.05
|
%
|
||
|
Clothing and Clothing Accessories Stores
|
6,958
|
|
3.02
|
%
|
||
|
Ambulatory Health Care Services
|
6,225
|
|
2.70
|
%
|
||
|
Truck Transportation
|
5,494
|
|
2.38
|
%
|
||
|
Specialty Trade Contractors
|
5,414
|
|
2.35
|
%
|
||
|
Fabricated Metal Product Manufacturing
|
5,258
|
|
2.28
|
%
|
||
|
Professional, Scientific, and Technical Services
|
4,939
|
|
2.14
|
%
|
||
|
Food Manufacturing
|
3,793
|
|
1.65
|
%
|
||
|
Motor Vehicle and Parts Dealers
|
3,755
|
|
1.63
|
%
|
||
|
Merchant Wholesalers, Durable Goods
|
3,729
|
|
1.62
|
%
|
||
|
Gasoline Stations
|
3,727
|
|
1.62
|
%
|
||
|
Insurance Carriers and Related Activities
|
3,622
|
|
1.57
|
%
|
||
|
Social Assistance
|
3,474
|
|
1.51
|
%
|
||
|
Nonstore Retailers
|
2,923
|
|
1.27
|
%
|
||
|
Personal and Laundry Services
|
2,609
|
|
1.13
|
%
|
||
|
Apparel Manufacturing
|
2,528
|
|
1.10
|
%
|
||
|
Merchant Wholesalers, Nondurable Goods
|
2,459
|
|
1.07
|
%
|
||
|
Administrative and Support Services
|
2,400
|
|
1.04
|
%
|
||
|
Other
|
33,616
|
|
14.59
|
%
|
||
|
Total
|
$
|
230,462
|
|
100.00
|
%
|
|
Credits in Lieu of Cash, Prepaid Insurance and Notes Payable in Credits in Lieu of Cash
The Company elected to account for both credits in lieu of cash and notes payable in credits in lieu of cash at fair value in order to reflect in its consolidated financial statements the assumptions that market participant’s use in evaluating these financial instruments.
Under the cost basis of accounting, the discount rates used to calculate the present value of the credits in lieu of cash and notes payable in credits in lieu of cash did not reflect the credit enhancements that the Company’s Capcos obtained from Chartis, Inc. (“Chartis”) (the renamed property and casualty holdings of American International Group, Inc., “AIG”), namely its AA+ rating at such time, for their debt issued to certified investors. Instead the cost paid for the credit enhancements was recorded as prepaid insurance and amortized on a straight-line basis over the term of the credit enhancements.
With the adoption of the fair value measurement of financial assets and financial liabilities and the election of the fair value option, credits in lieu of cash and notes payable in credits in lieu of cash are valued based on the yields at which financial instruments would change hands between a willing buyer and a willing seller when the former is not under any compulsion to buy and the latter is not under any compulsion to sell, both parties having reasonable knowledge of relevant facts. The accounting standards require the fair value of the assets or liabilities to be determined based on the assumptions that market participants use in pricing the financial instrument. In developing those assumptions, the Company identified characteristics that distinguish market participants generally, and considered factors specific to (a) the asset type, (b) the principal (or most advantageous) market for the asset group, and (c) market participants with whom the reporting entity would transact in that market.
Based on the aforementioned characteristics and in view of the Chartis credit enhancements, the Company believes that market participants purchasing or selling its Capcos’ debt and, therefore, its credits in lieu of cash and notes payable in credits in lieu of cash, view nonperformance risk to be equal to the risk of Chartis nonperformance risk and as such both the fair value of credits
F-68
in lieu of cash and notes payable in credits in lieu of cash should be priced to yield a rate equal to comparable U.S. Dollar denominated debt instruments issued by Chartis’ parent, AIG. Because the value of notes payable in credits in lieu of cash directly reflects the credit enhancement obtained from Chartis, the unamortized cost relating to the credit enhancement will cease to be separately carried as an asset on the Company’s consolidated balance sheets and is incorporated in notes payable in credits in lieu of cash.
Fair value measurements:
The Company’s Capcos’ debt, enhanced by Chartis insurance, effectively bears the nonperformance risk of Chartis. The closest trading comparators are the debt of Chartis’ parent, AIG. Therefore the Company calculates the fair value of both the credits in lieu of cash and notes payable in credits in lieu of cash using the yields of various AIG notes with similar maturities to each of the Company’s respective Capcos’ debt (the “Chartis Note Basket”). The Company elected to discontinue utilizing AIG’s
7.70%
Series A-5 Junior Subordinated Debentures because those long maturity notes began to trade with characteristics of a preferred stock after AIG received financing from the United States Government. The Company considers the Chartis Note Basket a Level 2 input under fair value accounting, since it is a quoted yield for a similar liability that is traded in an active exchange market. The Company selected the Chartis Note Basket as the most representative of the nonperformance risk associated with the Capco notes because they are Chartis issued notes, are actively traded and because maturities match credits in lieu of cash and notes payable in credits in lieu of cash.
After calculating the fair value of both the credits in lieu of cash and notes payable in credits in lieu of cash, the Company compares their values. This calculation is done on a quarterly basis. Calculation differences primarily due to tax credit receipt versus delivery timing may cause the value of the credits in lieu of cash to differ from that of the notes payable in credits in lieu of cash. Because the credits in lieu of cash asset has the single purpose of paying the notes payable in credits in lieu of cash and has no other value to the Company, Newtek determined that the credits in lieu of cash should equal the notes payable in credits in lieu of cash.
On
December 31, 2013
, the yield on the Chartis Note Basket was
1.49%
. As of
December 31, 2014
, the date the Company revalued the asset and liability, the yields on the Chartis notes averaged
1.39%
reflecting changes in interest rates in the marketplace. This decrease in yield increased both the fair value of the credits in lieu of cash and the fair value of the notes payable in credits in lieu of cash. The Company decreased the value of the credits in lieu of cash to equal the value of the notes payable in credits in lieu of cash because the credits in lieu of cash can only be used to satisfy the liability and must equal the value of the notes payable in credits in lieu of cash at all times. The net change in fair value reported in the Company’s consolidated statements of income for the year ended
December 31, 2014
was a gain of
$0
.
On
December 31, 2012
, the yield on the Chartis Note Basket was
1.72%
. As of
December 31, 2013
, the date the Company revalued the asset and liability, the yields on the Chartis notes averaged 1.49% reflecting changes in interest rates in the marketplace. This decrease in yield increased both the fair value of the credits in lieu of cash and the fair value of the notes payable in credits in lieu of cash. The Company decreased the value of the credits in lieu of cash to equal the value of the notes payable in credits in lieu of cash because the credits in lieu of cash can only be used to satisfy the liability and must equal the value of the notes payable in credits in lieu of cash at all times. The net change in fair value reported in the Company’s consolidated statements of income for the year ended
December 31, 2013
was a gain of
$21,000
.
Changes in the future yield of the Chartis issued debt selected for valuation purposes will result in changes to the fair values of the credits in lieu of cash and notes payable in credits in lieu of cash when calculated for future periods; these changes will be reported through the Company’s consolidated statements of income.
SBA 7(a) Loans
NSBF originates, funds, and services government guaranteed loans under section 7(a) of the Small Business Act. The SBA does not fully guarantee the SBA 7(a) Loans: An SBA 7(a) Loan is bifurcated into a guaranteed portion and an unguaranteed portion, each accruing interest on the principal balance of such portion at a per annum rate in effect from time to time. NSBF originates variable interest loans, usually set at a fixed index to the Prime rate that resets quarterly. Primarily, NSBF has made SBA 7(a) loans carrying guarantees of
75%
and
85%
; from 2009 through early 2011 under a special program, most of the loans NSBF originated carried a guarantee of
90%
. NSBF, both historically and as a matter of its business plan, sells the guaranteed portions via SBA Form 1086 into the secondary market when the guaranteed portion becomes available for sale upon the closing and fully funding of the SBA 7(a) loan and retains the unguaranteed portions. Management recognized that the economic value in the guaranteed portion did not inure to NSBF at the time of their sale but rather when the guaranty attached at origination; amortization accounting by its nature does not recognize this increase in value at the true time when it occurred. Under fair value, the value of the guarantee is recorded when it economically occurs at the point of the creation and funding of the loan,
F-69
and is not delayed until the sale occurs. Contemporaneously, the value of the unguaranteed portion will also be determined to reflect the full, fair value of the loan.
Although the fair value election is for the entire SBA 7(a) loan, the Company primarily sells the guaranteed portions at the completion of funding. The need to record the fair value for the guaranteed portion of the loan will primarily occur when a guaranteed portion is not traded at period end (“SBA loans held for sale”). The unguaranteed portion retained is recorded under “SBA loans held for investment.” Subsequent to the BDC Conversion, all SBA 7(a) loans are recorded at fair value.
SBA Loans Held for Investment/SBA Unguaranteed Investments
Prior to the BDC Conversion, loans that completed funding before October 1, 2010, are reported at their outstanding unpaid principal balances adjusted for charge-offs, net deferred loan origination costs and the allowance for loan losses. For loans that completed funding on or after October 1, 2010, management elected to fair value SBA loans held for investment within the fair value hierarchy that prioritizes observable and unobservable inputs utilizing Level 3 unobservable inputs which reflect the Company’s own expectations about the assumptions that market participants would use in pricing the asset (including assumptions about risk). Subsequent to the BDC Conversion, all SBA unguaranteed investments, regardless of origination date, are recorded at fair value.
In determining the net change in fair value of loans held for investment/SBA unguaranteed investments for the year ended
December 31, 2014
, the Company used a discounted cash flow model which incorporated a series of expected future cash flows for the performing SBA 7(a) loan portfolio, and discounts those cash flows at a market clearing yield of
5.38%
. The key assumptions used in the model are considered unobservable inputs and include anticipated prepayment speeds, cumulative default rates, expected recovery rates/duration, the cost of loan servicing and liquidating, and Prime rate expectations. The Company used an assumed prepayment speed of
19%
based on current market conditions and historical experience for the loan portfolio, against a prepayment curve developed from NSBF historical experience to calculate expected loan prepayments in a given year. Defaults are defined as any loan placed on non-accrual status at any point in time. The default rate, defined as the percent of loan balance that will enter final liquidation in a given year, was estimated to be
25%
, and was derived from NSBF historical experience. The mix of NSBF’s loan portfolio continues to shift from start-up businesses, to predominately originating to existing businesses. Our historical default and loss rates demonstrate that this particular segment (i.e. Existing Business) of our SBA loan portfolio continues to experience the lowest rate of defaults and ultimate losses over our nine year history of originating loans. When computing the cumulative default rate and prepayment sppeds to be applied to the performing portfolio loan balances, the Company excluded the last three years of originations as those loans have not seasoned yet. As of December 31, 2014, the discounted cash flows resulted in a price equivalent of
94.80%
of the par amount on our performing SBA unguaranteed investments.
If a loan measured at fair value is subsequently impaired, then the fair value of the loan is measured based on the present value of expected future cash flows discounted at a market clearing yield of 7.00%. The significant unobservable inputs used in the fair value measurement of the impaired loans involve management’s judgment in the use of market data and third party estimates regarding collateral values. Such estimates are further discounted to reflect the cost of liquidating the various assets under collateral. Any subsequent increases or decreases in any of the inputs would result in a corresponding decrease or increase in the fair value of SBA loans.
Below is a summary of the activity in SBA loans held for investment/SBA unguaranteed investments, at fair value (in thousands):
|
December 31, 2014
|
December 31, 2013
|
||||||
|
Balance, beginning of year
|
$
|
78,951
|
|
$
|
43,055
|
|
|
|
SBA unguaranteed investments, originated
|
48,189
|
|
42,773
|
|
|||
|
Loans transferred to other real estate owned
|
(174
|
)
|
(362
|
)
|
|||
|
Payments received
|
(10,411
|
)
|
(4,886
|
)
|
|||
|
Impact of BDC Conversion
|
8,780
|
|
—
|
|
|||
|
Fair value loss
|
(3,858
|
)
|
(1,629
|
)
|
|||
|
Balance, end of year
|
$
|
121,477
|
|
$
|
78,951
|
|
|
SBA Loans Held For Sale/SBA Guaranteed Investments
F-70
For guaranteed portions funded, but not yet traded at each measurement date, management elected to fair value SBA loans held for sale/SBA guaranteed loans within the fair value hierarchy that prioritizes observable and unobservable inputs used to measure fair value utilizing Level 2 assets. These inputs include debt securities with quoted prices that are traded less frequently than exchange-traded instruments or have values determined using a pricing model with inputs that are observable in the market. The secondary market for the guaranteed portions is extremely robust with broker dealers acting as primary dealers. NSBF sells regularly into the market and can quickly price its loans held for sale. The Company values the guaranteed portion based on market prices equal to the guaranteed loan amount plus a premium that includes both an upfront cash payment (utilizing independent quoted prices) and the value of a stream of payments representing servicing income received in excess of NSBF’s servicing cost (valued using a pricing model with inputs that are observable in the market).
Other Fair Value Measurements
Assets Measured at Fair Value on a Non-recurring Basis are as follows (In thousands):
|
|
Fair Value Measurements at December 31, 2013 Using:
|
|
|||||||||||||||||
|
|
Total
|
Level 1
|
Level 2
|
Level 3
|
Total Losses
|
||||||||||||||
|
Assets
|
|||||||||||||||||||
|
Impaired loans
|
$
|
3,441
|
|
$
|
—
|
|
$
|
—
|
|
$
|
3,441
|
|
$
|
(1,022
|
)
|
||||
|
Other real-estate owned
|
798
|
|
—
|
|
798
|
|
—
|
|
(182
|
)
|
|||||||||
|
Total assets
|
$
|
4,239
|
|
$
|
—
|
|
$
|
798
|
|
$
|
3,441
|
|
$
|
(1,204
|
)
|
||||
Impaired loans
Impairment of a loan is measured based on the present value of expected future cash flows discounted at the loan’s market a market clearing yield of 7.00%. Prior to the BDC conversion, impaired loans for which the carrying amount was based on fair value of the underlying collateral less estimated costs to sell, were included in assets and such fair value estimates were performed on a non-recurring basis. Subsequent to the BDC conversion, all loans are measured at fair value on a recurring basis. The significant unobservable inputs used in the fair value measurement of the impaired loans involve management’s judgment in the use of market data and third party estimates regarding collateral values. Such estimates are further discounted to reflect the cost of liquidating the various assets under collateral. Any subsequent increases or decreases in any of the inputs would result in a corresponding decrease or increase in the fair value of SBA loans. As a result of the BDC Conversion, all investments are measured at fair value, on a recurring basis at
December 31, 2014
.
Other real-estate owned (included in Prepaid expenses and other assets)
The estimated fair value of other real-estate owned is calculated using observable market information, including bids from prospective purchasers and pricing from similar market transactions where available. The value is generally discounted between
20
-
25%
based on market valuations as well as expenses associated with securing the Company’s interests. Where bid information is not available for a specific property, the valuation is principally based upon recent transaction prices for similar properties that have been sold. These comparable properties share comparable demographic characteristics. Other real estate owned is generally classified within Level 2 of the valuation hierarchy. There were no other real-estate owned assets on the at December 31, 2014.
Following is a summary of the credits in lieu of cash balance as of
December 31, 2014
and
2013
(in thousands):
|
2014
|
2013
|
||||||
|
Balance, beginning of year
|
$
|
3,641
|
|
$
|
8,703
|
|
|
|
Add: Income from tax credit accretion (at fair value)
|
62
|
|
113
|
|
|||
|
Less: Tax credits delivered
|
(1,460
|
)
|
(5,182
|
)
|
|||
|
Fair value adjustment
|
(14
|
)
|
7
|
|
|||
|
Balance, end of year
|
$
|
2,229
|
|
$
|
3,641
|
|
|
F-71
Prior to the BDC conversion, SBA loans held for investment, were bifurcated into two pools, SBA loans held for investment, net carried on a cost basis and SBA loans held for investment at fair value. As a result of the BDC Conversion, all loans are recorded at fair value as of
December 31, 2014
. The components of SBA loans held for investment, at fair value/SBA unguaranteed investments and SBA loans held for investment, net, as of
December 31, 2014
and
2013
are as follows (in thousands):
|
2014 Fair Value
|
2013 Fair Value
|
2013 Cost Basis
|
|||||||||
|
Gross loans receivable
|
$
|
131,089
|
|
$
|
83,988
|
|
$
|
13,341
|
|
||
|
Less: Allowance for loan losses
|
—
|
|
—
|
|
(1,811
|
)
|
|||||
|
Less: Deferred origination fees, net
|
—
|
|
—
|
|
(841
|
)
|
|||||
|
Less: Fair value adjustment
|
(9,612
|
)
|
(5,037
|
)
|
—
|
|
|||||
|
Total
|
$
|
121,477
|
|
$
|
78,951
|
|
$
|
10,689
|
|
||
As a result of the BDC Conversion, loans originated prior to October 1, 2010 must now be recorded at fair value each period. As a result, at December 31, 2014, all SBA loans are recorded at their fair value.
Below is a summary of the activity in the allowance for loan losses, cost basis, for the years ended
December 31, 2014
and
2013
(in thousands):
|
Allowance for loan losses, cost basis:
|
2014
|
2013
|
|||||
|
Balance, beginning of year
|
$
|
1,811
|
|
$
|
2,589
|
|
|
|
Provision for loan losses
|
(54
|
)
|
1,322
|
|
|||
|
Loans charged-off
|
(776
|
)
|
(2,144
|
)
|
|||
|
Recoveries
|
48
|
|
44
|
|
|||
|
Release of allowance for BDC conversion
|
(1,029
|
)
|
—
|
|
|||
|
Balance, end of year
|
$
|
—
|
|
$
|
1,811
|
|
|
|
Individually evaluated for impairment
|
$
|
—
|
|
$
|
1,609
|
|
|
|
Collectively evaluated for impairment
|
—
|
|
202
|
|
|||
|
Balance, end of year
|
$
|
—
|
|
$
|
1,811
|
|
|
|
Total loans, cost basis
|
|
|
|||||
|
Individually evaluated for impairment
|
$
|
—
|
|
$
|
3,466
|
|
|
|
Collectively evaluated for impairment
|
—
|
|
9,875
|
|
|||
|
Balance, end of year
|
$
|
—
|
|
$
|
13,341
|
|
|
The contractual maturities of SBA loans held for investment are as follows (in thousands):
|
2014 Fair Value
|
2013 Fair Value
|
2013 Cost Basis
|
|||||||||
|
Due in one year or less
|
$
|
1,117
|
|
$
|
—
|
|
$
|
319
|
|
||
|
Due between one and five years
|
2,348
|
|
—
|
|
4,509
|
|
|||||
|
Due after five years
|
127,624
|
|
83,988
|
|
8,513
|
|
|||||
|
Total loans receivable, gross
|
$
|
131,089
|
|
$
|
83,988
|
|
$
|
13,341
|
|
||
The payment status of gross SBA loans held for investment/SBA unguaranteed investments at
December 31, 2014
and
2013
are as follows:
F-72
|
|
(in thousands)
|
||||||
|
Days Past Due
|
2014
|
2013
|
|||||
|
Current
|
$
|
117,040
|
|
$
|
84,809
|
|
|
|
30 – 89
|
4,463
|
|
4,842
|
|
|||
|
> 90
|
—
|
|
—
|
|
|||
|
Non-accrual
|
9,586
|
|
7,678
|
|
|||
|
Balance (net)
|
$
|
131,089
|
|
$
|
97,329
|
|
|
The outstanding balances of loans past due over 90 days and still accruing interest as of
December 31, 2013
totaled
$1,128,000
; there were
no
performing loans past due over 90 days and still accruing interest as of
December 31, 2014
.
The Company evaluates the credit quality of its loan portfolio by employing a risk rating system that is similar to the Uniform Classification System which is the asset classification system adopted by the Federal Financial Institution Examinations Council. The Company’s risk rating system is granular with multiple risk ratings in both the Acceptable and Substandard categories. Assignment of the ratings are predicated upon numerous factors, including credit risk scores, collateral type, loan to value ratios, industry, financial health of the business, payment history, other internal metrics/analysis, and qualitative assessments.
Risk ratings are refreshed as appropriate based upon considerations such as market conditions, loan characteristics, and portfolio trends. The Company’s gross SBA loans held for investment/SBA unguaranteed investments by credit quality indicator at
December 31, 2014
and
2013
are as follows:
|
|
(in thousands)
|
||||||||||
|
Risk Rating
|
2014
|
2013 Fair Value
|
2013 Cost Basis
|
||||||||
|
Acceptable
|
$
|
106,241
|
|
$
|
66,439
|
|
$
|
7,420
|
|
||
|
Other assets special mention
|
13,054
|
|
12,278
|
|
2,234
|
|
|||||
|
Substandard
|
11,282
|
|
5,271
|
|
3,283
|
|
|||||
|
Doubtful
|
512
|
|
—
|
|
395
|
|
|||||
|
Loss
|
—
|
|
—
|
|
9
|
|
|||||
|
Balance
|
$
|
131,089
|
|
$
|
83,988
|
|
$
|
13,341
|
|
||
All loans are priced at the Prime interest rate plus approximately
2.75%
to
3.75%
. The only loans with a fixed interest rate are defaulted loans of which the guaranteed portion sold is repurchased from the secondary market by the SBA, while the unguaranteed portion of the loans still remains with the Company. As of
December 31, 2014
and
2013
, net SBA loans receivable held for investment with adjustable interest rates totaled
$123,489,000
and
$91,083,000
, respectively.
For the years ended
December 31, 2014
and
2013
, the Company funded
$202,269,000
and
$177,941,000
in total loans and sold approximately
$130,356,000
and
$131,733,000
of the guaranteed portion of the loans, respectively. Receivables from loans traded but not settled of $0 and
$13,606,000
as of
December 31, 2014
and
2013
, respectively, are presented as broker receivable in the accompanying consolidated balance sheets.
As of
December 31, 2014
, $31,913,000 of the guaranteed portion of SBA loans and $11,229,000 of the unguaranteed portion of SBA loans collateralized the current outstanding balance on the Company’s line of credit with Capital One and $120,990,000 of the unguaranteed portions of SBA loans transferred via our securitization transaction collateralized the notes issued by the Trust.
Loans by industry and geographic concentration that accounted for more than
5%
of the outstanding gross loans receivable held for investment balance as of
December 31, 2014
and
2013
were as follows (in thousands):
F-73
|
2014
|
2013
|
||||||
|
State
|
|||||||
|
New York
|
$
|
14,778
|
|
$
|
12,813
|
|
|
|
Florida
|
14,611
|
|
9,280
|
|
|||
|
Connecticut
|
10,092
|
|
7,275
|
|
|||
|
Texas
|
7,975
|
|
6,957
|
|
|||
|
Pennsylvania
|
8,336
|
|
6,470
|
|
|||
|
Georgia
|
7,696
|
|
6,450
|
|
|||
|
California
|
—
|
|
6,140
|
|
|||
|
New Jersey
|
8,420
|
|
5,488
|
|
|||
At
December 31, 2014
and
2013
, total impaired loans amounted to
$9,811,000
and
$7,678,000
, respectively, of which
$9,811,000
and
$4,212,000
were on a fair value basis at
December 31, 2014
and
2013
, respectively. For the years ended
December 31, 2014
and
2013
, the average balance of impaired loans was
$8,787,000
and
$6,887,000
, and approximately
$0
and
$1,609,000
in specific reserves are included in the allowance for loan losses and
$0
and
$163,000
of valuation allowances were allocated against such impaired loans, respectively.
Had interest on these impaired non-accrual loans been accrued, such interest would have totaled $480,000 and
$434,000
for
2014
and
2013
, respectively. Interest income, which is recognized on a cash basis, related to the impaired non-accrual loans for the years ended
December 31, 2014
and
2013
, was not material.
As a result of the BDC conversion, the Company had no loans renegotiated in troubled debt restructurings as of
December 31, 2014
. The Company had loans renegotiated in TDRs of
$3,409,000
as of
December 31, 2013
, of which
$1,332,000
was included in non-accrual loans and
$2,077,000
was on accrual status. An analysis of loans restructured in TDR for the years ended
December 31, 2014
and
2013
is as follows (in thousands):
|
Type of Concession
|
Loans Restructured - 2014
|
Loans Restructured - 2013
|
|||||||||||
|
|
Number
of Notes
|
Principal
Balance at
Restructure
Date
|
Number
of Notes
|
Principal
Balance at
Restructure
Date
|
|||||||||
|
Payment reduction / Interest-only period
|
—
|
|
$
|
—
|
|
4
|
|
$
|
425
|
|
|||
Prior to the BDC conversion, TDRs that returned to a non-performing status post-modification were considered redefaulted loans and were treated in the same manner as other non-performing loans in the portfolio. For the year ended
December 31, 2013
, there were
3
redefaulted loans with a corresponding principal balance of approximately
$11,000
; and resulted in approximately $
4,000
in corresponding charge-offs of redefaulted loans during
2013
.
An affiliated company is a company in which the Company has an ownership of 5% or more of its voting securities. A controlled affiliate is a company in which the Company owns more than 25% of its voting securities. Transactions related to our investments with controlled affiliates for the period November 12, 2014 through December 31, 2014 were as follows:
F-74
|
Portfolio Company
|
Fair Value at November 12, 2014
|
Purchases (cost)
|
Sales (cost)
|
Net realized gains/(losses)
|
Net unrealized gains/(losses)
|
Fair Value at December 31, 2014
|
Interest and other income
|
Dividend income
|
||||||||||||||||||||||||
|
Controlled Affiliates
|
||||||||||||||||||||||||||||||||
|
Small Business Lending, Inc.
|
$
|
2,900
|
|
$
|
—
|
|
$
|
—
|
|
$
|
—
|
|
$
|
—
|
|
$
|
2,900
|
|
$
|
—
|
|
$
|
37
|
|
||||||||
|
PMTWorks Payroll, LLC
|
920
|
|
—
|
|
—
|
|
—
|
|
—
|
|
920
|
|
13
|
|
—
|
|
||||||||||||||||
|
CDS Business Services, Inc.
|
1,979
|
|
—
|
|
—
|
|
—
|
|
—
|
|
1,979
|
|
5
|
|
—
|
|
||||||||||||||||
|
Advanced Cyber Security Systems, LLC
|
—
|
|
—
|
|
—
|
|
—
|
|
—
|
|
—
|
|
7
|
|
—
|
|
||||||||||||||||
|
Secure CyberGateway Services, LLC
|
2,400
|
|
—
|
|
—
|
|
—
|
|
—
|
|
2,400
|
|
4
|
|
—
|
|
||||||||||||||||
|
Business Connect, LLC
|
—
|
|
—
|
|
—
|
|
—
|
|
—
|
|
—
|
|
2
|
|
—
|
|
||||||||||||||||
|
Total Controlled Affiliates
|
$
|
8,199
|
|
$
|
—
|
|
$
|
—
|
|
$
|
—
|
|
$
|
—
|
|
$
|
8,199
|
|
$
|
31
|
|
$
|
37
|
|
||||||||
F-75
Accounts receivable consists of the following at
December 31, 2014
(post BDC Conversion) and
2013
(in thousands):
|
2014
|
2013
|
||||||
|
Purchased receivables
|
$
|
—
|
|
$
|
7,766
|
|
|
|
Electronic payment processing settlement receivables
|
—
|
|
2,123
|
|
|||
|
Customer receivables
|
114
|
|
1,983
|
|
|||
|
Other receivables
|
204
|
|
601
|
|
|||
|
318
|
|
12,473
|
|
||||
|
Allowance for doubtful accounts
|
(171
|
)
|
(871
|
)
|
|||
|
Total
|
$
|
147
|
|
$
|
11,602
|
|
|
For the year ended December 31, 2013, the Company reviewed capitalized servicing assets prior to the BDC Conversion. This review was performed based on risk strata, which were determined on a disaggregated basis given the predominant risk characteristics of the underlying loans. The predominant risk characteristics are loan terms and year of loan origination. At
December 31, 2014
servicing assets are measured at fair value and are not reviewed for impairment.
The following summarizes the activity pertaining to servicing assets for the years ended
December 31, 2014
and
2013
(in thousands):
|
2014
|
2013
|
||||||
|
Balance, beginning of year
|
$
|
6,776
|
|
$
|
4,682
|
|
|
|
Servicing assets capitalized
|
3,232
|
|
3,248
|
|
|||
|
Servicing assets amortized
|
(1,365
|
)
|
(1,154
|
)
|
|||
|
Fair value adjustment for BDC Conversion
|
960
|
|
—
|
|
|||
|
Unrealized loss
|
(120
|
)
|
—
|
|
|||
|
Balance, end of year
|
$
|
9,483
|
|
$
|
6,776
|
|
|
For the years ended
December 31, 2014
,
2013
and
2012
, servicing fees received on the Company’s SBA 7(a) originated portfolio totaled
$3,673,000
,
$2,769,000
and
$2,297,000
, respectively. Through November 11, 2014, the Company also performed servicing functions on loans originated by other lenders. The Company does not retain any risk on such portfolios and earns servicing fees based upon a mutually negotiated fee per loan. The total servicing fee income recognized for loans serviced for others For the period ended November 11, 2014, and the years ended December 31,
2013
and
2012
was
$6,142,000
,
$3,796,000
and
$4,564,000
, respectively. The carrying value of the capitalized servicing assets were
$6,776,000
at December 31,
2013
. The estimated fair value of capitalized servicing assets were
$9,483,000
and
$7,959,000
at
December 31, 2014
and
2013
, respectively. The estimated fair value of servicing assets at
December 31, 2014
was determined using a discount factor that is a blended approach of the weighted average cost of capital and the weighted average servicing spread of
11.58%
, prepayment speed of
19%
, and an average default rate of
25%
. The estimated fair value of servicing assets at
December 31, 2013
was determined using a discount rate of
11%
, weighted average prepayment speeds ranging from
0%
to
11%
, depending upon certain characteristics of the loan portfolio, weighted average life of
5.00 years
, and an average default rate of
3%
. At
December 31, 2014
, servicing assets are carried at fair value, at December 31, 2013, servicing assets were recorded using the amortization method.
The Company’s fixed assets are composed of the following at
December 31, 2014
and
2013
(in thousands):
F-76
|
2014
|
2013
|
||||||
|
Computer and office equipment
|
$
|
1,504
|
|
$
|
2,898
|
|
|
|
Furniture and fixtures
|
343
|
|
666
|
|
|||
|
Leasehold improvements
|
152
|
|
462
|
|
|||
|
Computer software and website
|
2,128
|
|
4,744
|
|
|||
|
Computer servers and storage
|
—
|
|
4,817
|
|
|||
|
Leased property
|
—
|
|
701
|
|
|||
|
4,127
|
|
14,288
|
|
||||
|
Accumulated depreciation and amortization
|
(3,798
|
)
|
(10,547
|
)
|
|||
|
Net fixed assets
|
$
|
329
|
|
$
|
3,741
|
|
|
Depreciation and amortization expense for fixed assets for the period ended
November 11, 2014
, and period November 12 to December 31, 2014 was $
1,562,000
and $
25,000
, respectively. Depreciation and amortization expense for fixed assets for the years ended December 31,
2013
and
2012
was
$1,768,000
and
$1,619,000
, respectively.
The net carrying value of goodwill as of
December 31, 2014
(Post BDC Conversion) and
2013
by segment is as follows (in thousands):
|
2014
|
2013
|
||||||
|
Electronic payment processing
|
$
|
—
|
|
$
|
3,004
|
|
|
|
Web hosting
|
—
|
|
7,203
|
|
|||
|
Corporate activities
|
—
|
|
179
|
|
|||
|
Small business finance
|
—
|
|
1,706
|
|
|||
|
Total goodwill
|
$
|
—
|
|
$
|
12,092
|
|
|
The changes in the carrying amount of goodwill for the years ended December 31, 2014 and 2013 are as follows (in thousands):
|
Total
|
||||
|
Balance as of December 31, 2012 and 2013
|
$
|
12,092
|
|
|
|
Goodwill impairment
|
(1,706
|
)
|
||
|
Conversion to BDC
|
(10,386
|
)
|
||
|
Balance as of December 31, 2014
|
$
|
—
|
|
|
In performing Step 1 of the impairment test the Company estimated the fair value of the reporting units based on a combination of an income approach using a discounted cash flow analysis and market based approach based on comparable public companies. Based on this analysis, it was determined that the carrying value of the NBC reporting unit, including goodwill exceeded its fair value requiring the Company to perform Step 2 of the goodwill impairment test to measure the amount of impairment loss, if any. In performing Step 2 of the goodwill impairment test, the Company compared the implied fair value of the NBC reporting unit's goodwill to the carrying value of goodwill. This test resulted in a non-cash, goodwill impairment charge of $1,706,000 and a write off of goodwill. This impairment has been reported in total expenses on the consolidated statement of income during the period ended November 11, 2014.
In conjunction with the conversion to a BDC, there is no goodwill on the consolidated balance sheet as of
December 31, 2014
. All goodwill (after impairment) has been recorded on the balance sheets of each respective deconsolidated subsidiary as of the Conversion date.
Other intangible assets as of
December 31, 2014
(Post BDC Conversion) and
2013
are comprised of the following (in thousands):
F-77
|
2014
|
2013
|
||||||
|
Customer merchant accounts
|
$
|
—
|
|
$
|
2,193
|
|
|
|
Customer insurance accounts
|
740
|
|
740
|
|
|||
|
Trade name (indefinite lived)
|
—
|
|
550
|
|
|||
|
740
|
|
3,483
|
|
||||
|
Accumulated amortization
|
(296
|
)
|
(2,243
|
)
|
|||
|
Net intangible assets
|
$
|
444
|
|
$
|
1,240
|
|
|
Customer merchant accounts are amortized over a
55
to
66
month period, and customer insurance accounts are being amortized over a period of
60 months
. Other intangibles (excluding the trade name which has an indefinite life and is subject to annual impairment review) are being amortized over a period ranging from
18
to
36 months
. As a result of the conversion to a BDC, all other intangibles with the exception of Customer insurance accounts are held by controlled portfolio companies and not included in the consolidated balance sheet at
December 31, 2014
. Total amortization expense included in the accompanying consolidated statements of income related to intangibles for the years ended
December 31, 2014
,
2013
and
2012
was
$231,000
,
$363,000
and
$629,000
, respectively.
Total expected amortization expense for the next three fiscal years is as follows (in thousands):
|
December 31,
|
Merchant
Accounts
|
Insurance
Accounts
|
|||||
|
2015
|
$
|
—
|
|
$
|
148
|
|
|
|
2016
|
—
|
|
148
|
|
|||
|
2017
|
—
|
|
148
|
|
|||
|
$
|
—
|
|
$
|
444
|
|
||
For the years ended
December 31, 2014
,
2013
and
2012
, there was
no
impairment related to its customer merchant and insurance accounts. The intangible trade name, CrystalTech Web Hosting, which as of December 31, 2014 is held by a controlled portfolio company has an indefinite life and is assessed annually for impairment.
The following table details the components of accounts payable, accrued expenses and other liabilities at
December 31, 2014
(Post BDC Conversion) and
2013
(in thousands):
|
2014
|
2013
|
||||||
|
Due to participants and SBA (a)
|
$
|
3,100
|
|
$
|
2,646
|
|
|
|
Due to clients
|
425
|
|
481
|
|
|||
|
Accrued payroll and related expenses
|
1,552
|
|
1,865
|
|
|||
|
Deferred rent
|
324
|
|
841
|
|
|||
|
Chargeback reserves
|
—
|
|
348
|
|
|||
|
Deposits and other reserves
|
—
|
|
1,939
|
|
|||
|
Residuals and commissions payable
|
190
|
|
1,142
|
|
|||
|
Current tax payable
|
—
|
|
1,533
|
|
|||
|
Other
|
2,092
|
|
3,893
|
|
|||
|
Total accounts payable, accrued expenses and other liabilities
|
$
|
7,683
|
|
$
|
14,688
|
|
|
|
(a)
|
Primarily represents loan related remittances received by NSBF, and due to third parties.
|
F-78
At
December 31, 2014
(Post BDC Conversion) and
2013
, the Company had long-term debt outstanding comprised of the following (in thousands):
|
2014
|
2013
|
||||||
|
Notes payable:
|
|||||||
|
Capital One lines of credit (NSBF)
|
|||||||
|
Guaranteed line
|
$
|
28,722
|
|
$
|
21,261
|
|
|
|
Unguaranteed line
|
5,134
|
|
4,691
|
|
|||
|
Capital One line of credit and term loan (NBS)
|
|||||||
|
Revolving line of credit
|
—
|
|
—
|
|
|||
|
Term loan
|
9,167
|
|
—
|
|
|||
|
Summit Partners Credit Advisors, L.P. (NBS)
|
—
|
|
8,650
|
|
|||
|
Sterling National bank line of credit (NBC)
|
—
|
|
6,026
|
|
|||
|
Capital One term loan (NTS)
|
—
|
|
590
|
|
|||
|
Total notes payable
|
43,023
|
|
41,218
|
|
|||
|
Note payable – Securitization trust VIE
|
79,520
|
|
60,140
|
|
|||
|
Total notes payable
|
$
|
122,543
|
|
$
|
101,358
|
|
|
|
Capital lease obligation
|
$
|
33
|
|
|
$
|
642
|
|
In June 2014, the Company entered into a four year $20,000,000 credit agreement with Capital One consisting of a $10,000,000 term loan and a revolving line of credit of up to $10,000,000. Principal and interest on the term loan are payable quarterly in arrears and the interest rate is Prime plus 2.5% . The term loan is being amortized over a four year period with a final payment due on the maturity date. The interest rate on the revolving line of credit is also Prime plus 2.5% and is payable monthly in arrears with the principal due at maturity. In addition, the revolving line accrues interest of 0.375% on the unused portion of the line which is payable quarterly in arrears.
The purpose of the new facilities was to refinance the Company's existing debt from Summit Partners Credit Advisors, L.P., payoff the current portion of the NTS loan, and for general working capital purposes. The Company incurred deferred financing costs of approximately $279,000 which are being amortized to interest expense over the term of the facilities. In addition, and in connection with the pay-off of the Summit Partners note payable, the Company expensed the remaining debt discount and deferred financing costs related to Summit, which resulted in a charge to operations for the period ended November 11, 2014 of $1,905,000. Interest expense on the facility for the year ended December 31, 2014 was approximately $409,000. Interest expense on the Summit debt, including $1,905,000 of remaining debt discount and deferred financing costs expensed at the time of the Capital One refinance, was $2,953,000 and $1,521,000 for the years ended December 31, 2014 and 2013, respectively.
The new Capital One facilities require the adherence to certain financial covenants including minimum EBITDA, fixed charge coverage ratios, funded debt to EBITDA ratios, as well as minimum cash balance requirements. As of December 31, 2014, the Company was in compliance with all financial covenants.
In July 2013 the SBA lender received an extension on the maturity of its warehouse lines of credit, totaling $27,000,000, with Capital One from September 30, 2013 to May 31, 2015, at which time the outstanding balance would be converted into a three-year term loan. The extension also enhanced the terms of the credit facilities by removing the $15,000,000 funding sublimit for the non-guaranteed portions of the SBA 7(a) loans NSBF originates, and increasing the advance rate to 55% from 50% for the non-guaranteed portions of the SBA 7(a) loans. In October 2014, the SBA lender closed an additional $23,000,000 in financing with Capital One, NA which increased the existing revolving credit facility from $27,000,000 to $50,000,000. The amendment also extended the term of the facility from May 31, 2015 to May 16, 2018.
As of December 31, 2014 and 2013, NSBF had $33,856,000 and $25,952,000 outstanding under the line of credit. The interest rate on the portion of the facility, collateralized by the government guaranteed portion of SBA 7(a) loans, is set at Prime plus 1.00%, and there is a quarterly facility fee equal to 25 basis points on the unused portion of the revolving credit calculated as of the end of each calendar quarter. The interest rate on the portion of the facility, collateralized by the non-guaranteed portion of SBA 7(a) loans, is set at Prime plus 1.875%, and there is a quarterly facility fee equal to 0.25% on the unused portion of the revolving credit calculated as of the end of each calendar quarter.
F-79
Total interest expense attributable to the NSBF Capital One facility for the years ended December 31, 2014, 2013 and 2012 was $1,070,000, $886,000 and $392,000, respectively.
Since 2010, NSBF has engaged in securitizations of the unguaranteed portions of its SBA 7(a) loans. In the securitization, it uses a special purpose entity (the “Trust”) which is considered a VIE. Applying the consolidation requirements for VIEs under the accounting rules in ASC Topic 860, Transfers and Servicing, and ASC Topic 810, Consolidation, which became effective January 1, 2010, the Company determined that as the primary beneficiary of the securitization vehicle, based on its power to direct activities through its role as servicer for the Trust and its obligation to absorb losses and right to receive benefits, it needed to consolidate the securitization into its financial statements. NSBF therefore consolidated the entity using the carrying amounts of the Trust’s assets and liabilities. NSBF continues to recognize the assets in loans held for investment and recognize the associated financing in Bank notes payable.
In March 2013, the Company completed a third securitization resulting in $20,909,000 of notes being issued in a private placement transaction. The SBA lender transferred the unguaranteed portions of SBA loans in the amount of $23,569,000 and an additional $5,900,000 for new loans to be funded subsequent to the transaction to a special purpose entity, Newtek Small Business Loan Trust 2013-1. The notes received an “A” rating by S&P, and the final maturity date of the notes is June 25, 2038. The proceeds of the transaction have been and will be used to repay debt and originate new loans.
In December 2013, NSBF completed an additional transaction whereby the unguaranteed portions of SBA loans of $23,947,000, and an additional $3,642,000 in loans issued subsequent to the transaction, was transferred to the Trust. The Trust in turn issued securitization notes for the par amount of $24,433,000 against the assets in a private placement. The notes received an “A” rating by S&P, and the final maturity date of the amended notes is April 25, 2039. The proceeds of the transaction have been and will be used to repay debt and originate new loans.
In December 2014, NSBF completed an additional transaction which resulted in the transfer of $36,000,000 of unguaranteed portions of SBA loans. The Trust in turn issued securitization notes for the par amount of $31,700,000 against the assets in a private placement. The notes received an “A” rating by S&P, and the final maturity date of the notes is April 2040. The proceeds of the transaction have been and will be used to repay debt and originate new loans.
Total interest expense attributable to the Trust for the years ended December 31, 2014, 2013 and 2012 was $3,081,000, $2,111,000 and $1,257,000, respectively.
Deferred financing costs associated with the securitization transactions totaled $3,776,000 and $2,921,000 at December 31, 2014 and 2013, respectively, of which $1,226,000 and $734,000 has been amortized. The net balance of $2,550,000 and $2,187,000 is included in prepaid expenses and other assets on the accompanying consolidated balance sheet. At December 31, 2014 and 2013, the assets (before reserve for loan losses and discount) and liabilities of the consolidated Trust totaled $73,412,000 and $60,140,000, respectively.
The Trust is only permitted to purchase the unguaranteed portion of SBA 7(a) loans, issue asset-backed securities, and make payments on the securities. The Trust only issued a single series of securities to pay for the unguaranteed portions it acquired from NSBF and will be dissolved when those securities have been paid in full. The primary source for repayment of the debt is the cash flows generated from the unguaranteed portion of SBA 7(a) loans owned by the Trust; principal on the debt will be paid by cash flow in excess of that needed to pay various fees related to the operation of the Trust and interest on the debt. The debt has an expected maturity of about six years based on the expected performance of the underlying collateral and structure of the debt and a legal maturity of 30 years from the date of issuance. The assets of the Trust are legally isolated and are not available to pay NSBF’s creditors. However, NSBF continues to retain rights to cash reserves and residual interests in the Trust and will receive servicing income. For bankruptcy analysis purposes, NSBF sold the unguaranteed portions to the Trust in a true sale and the Trust is a separate legal entity. The investors and the Trusts have no recourse to any of NSBF’s other assets for failure of debtors to pay when due; however, NSBF’s parent, Newtek, has provided a limited guaranty to the investors in the Trust in an amount not to exceed 10% of the original issuance amount (or $2,778,000), to be used after all of the assets of the Trust have been exhausted. The notes were issued with an AA rating from S&P based on the underlying collateral.
In February 2011, NBC closed a three year, $10,000,000 line of credit with Sterling National Bank (“Sterling”). The facility was used to pay off existing debt and for the purchase of receivables and other working capital purposes. In December 2012, an amendment was signed providing that upon the occurrence of certain events, the maximum amount of the line of credit under the Agreement can be increased from $10,000,000 to $15,000,000 at a later date upon NBC’s request. The Amendment also extended the maturity date from February 28, 2014 to February 28, 2016.
As of November 11, 2014 and December 31, 2013, NBC had $5,466,000 and $6,026,000 outstanding under the lines of credit. The Sterling interest rate is set at 5.00% or Prime plus 2.00%, whichever is higher, with interest on the line to be paid monthly in arrears. The line is and will be collateralized by the receivables purchased, as well as all other assets of NBC. The line is
F-80
guaranteed by the Company; in addition, the Company deposited $750,000 with Sterling to collateralize the guarantee. The agreement includes such financial covenants as minimum tangible net worth and maximum leverage ratio. The Company is subject to meeting a maximum leverage ratio test and a future net loss test. As of December 31, 2014, the Company was in compliance with the financial covenants set in this line.
Total interest expense for the period ended November 11, 2014 and for the years ended December 31, 2013 and 2012 was $272,000, $451,000 and $333,000, respectively. The weighted average effective interest rate for the period ended November 11, 2014 was 5.58%. Through November 11, 2014, NBC had capitalized $145,000 of deferred financing costs attributable to the Sterling line of which $110,000 has been amortized. Amortization for the period ended November 11, 2014 and for the years ended December 31, 2013 and 2012 was $20,000, $25,000 and $35,000, respectively.
In October 2007, NTS entered into a Loan and Security Agreement with Capital One which provided for a revolving credit facility of up to $10,000,000 available to both NTS and the Company, for a term of two years. The interest rate was LIBOR plus 2.5% and the agreement included a quarterly facility fee equal to 0.25% on the unused portion of the Revolving Credit calculated as of the end of each calendar quarter. The agreement included such financial covenants as a minimum fixed charge coverage ratio and a maximum funded debt to EBITDA. NTS capitalized $65,000 of deferred financing costs attributable to the Capital One line. In connection with the loan, on October 19, 2007 Newtek Business Services, Inc. entered into a Guaranty of Payment and Performance with Capital One and entered into a Pledge Agreement with Capital One pledging all NTS stock as collateral. In October 2009, the $2,500,000 borrowed under the line of credit converted to a three year term loan, and was subsequently extended to a five year term loan, at the greater of Prime plus 2.50% or 5.75% interest, and maturing on May 1, 2015. This loan was paid in full in June 2014 in connection with the NBS facility. Total interest expense for the period ended November 11, 2014 and for the years ended December 31, 2013 and 2012 was $13,000, $46,000 and $70,000, respectively.
Total expected principal repayments for the next five fiscal years and thereafter are as follows (in thousands):
|
December 31,
|
Notes Payable
|
Capital Lease
|
Total
|
||||||||
|
2015
|
$
|
30,388
|
|
$
|
16
|
|
$
|
30,404
|
|
||
|
2016
|
1,667
|
|
16
|
|
1,683
|
|
|||||
|
2017
|
1,667
|
|
1
|
|
1,668
|
|
|||||
|
2018
|
4,167
|
|
—
|
|
4,167
|
|
|||||
|
2019
|
—
|
|
—
|
|
—
|
|
|||||
|
Thereafter
|
84,654
|
|
—
|
|
84,654
|
|
|||||
|
$
|
122,543
|
|
$
|
33
|
|
$
|
122,576
|
|
|||
Each Capco has separate contractual arrangements with the Certified Investors obligating the Capco to make payments on the Notes.
F-81
At the time the Capcos obtained the proceeds from the issuance of the Notes, Capco warrants or Company common shares to the Certified Investors, the proceeds were deposited into escrow accounts which required that the insurance contracts be concurrently and simultaneously purchased from the insurer before the remaining proceeds could be released to and utilized by the Capco. The Capco Note agreements require, as a condition precedent to the funding of the Notes that insurance be purchased to cover the risks associated with the operation of the Capco. This insurance is purchased from Chartis Specialty Insurance Company and National Union Fire Insurance Company of Pittsburgh, both subsidiaries of Chartis, Inc. (Chartis), an international insurer. Chartis and these subsidiaries are “A+” credit rated by S&P. In order to comply with this condition precedent to the funding, the Notes closing is structured as follows: (1) the Certified Investors wire the proceeds from the Notes issuance directly into an escrow account; (2) the escrow agent, pursuant to the requirements under the Note and escrow agreement, automatically and simultaneously funds the purchase of the insurance contract from the proceeds received. The Notes offering cannot close without the purchase of the insurance, and the Capcos are not entitled to the use and benefit of the net proceeds received until the escrow agent has completed the payment for the insurance. Under the terms of this insurance, the insurer incurs the primary obligation to repay the Certified Investors a substantial portion of the debt as well as to make compensatory payments in the event of a loss of the availability of the related tax credits. The Coverage A portion of these contracts makes the insurer primarily obligated for a portion of the liability.
The Capcos, however, are secondarily, or contingently, liable for such payments. The Capco, as a secondary obligor, must assess whether it has a contingency to record on the date of issuance and at every reporting date thereafter until the insurer makes all their required payments. As of
December 31, 2014
, the insurer has made all of the scheduled cash payments under Coverage A, therefore the contingent liability of the Company has been extinguished.
The Coverage B portion of these contracts provides for the payment of cash in lieu of tax credits in the event the Capco becomes decertified. The Capcos remain primarily liable for the requirement to deliver tax credits (or make cash payments in lieu of tax credits not delivered).
Although Coverage B protects the Certified Investors as described above, the Company remains primarily liable for the portion of this obligation. This liability has been recorded as notes payable in credits in lieu of cash, representing the present value of the Capcos’ total liability it must pay to the Certified Investors. Such amount will be increased by an accretion of interest expense during the term of the Notes and will decrease as the Capcos pay interest by delivering the tax credits, or paying cash.
As discussed in Note 3, the Company adopted fair value option for financial assets and liabilities concurrent with its adoption fair value accounting effective January 1, 2008 for valuing Notes payable in lieu of cash with the exception of Wilshire Advisers, LLC. Following is a summary of activity of Notes payable in credits in lieu of cash balance for the years ended
December 31, 2014
and
2013
(in thousands):
|
2014
|
2013
|
||||||
|
Balance, beginning of year
|
$
|
3,641
|
|
$
|
8,703
|
|
|
|
Add: Accretion of interest expense
|
53
|
|
135
|
|
|||
|
Less: Tax credits delivered
|
(1,460
|
)
|
(5,182
|
)
|
|||
|
Fair value adjustment
|
(5
|
)
|
(15
|
)
|
|||
|
Balance, end of year
|
$
|
2,229
|
|
$
|
3,641
|
|
|
Under the Note agreements, no interest is paid by the Capcos in cash provided that the Certified Investors receive the uninterrupted use of the tax credits. The Certified Investors acknowledge, in the Note agreements, that the insurer is primarily responsible for making the scheduled cash payments as provided in the Notes.
The following is the aggregate percentage interest of the non-controlling interests as of
December 31, 2013
(in thousands):
|
Minority-Owned Entity
|
% Interest
|
2014
|
2013
|
|||||||
|
Wilshire Alabama Partners, LLC
|
0.6
|
%
|
$
|
—
|
|
$
|
3
|
|
||
|
Exponential of New York, LLC
|
61.0
|
%
|
—
|
|
2,088
|
|
||||
|
Other (*)
|
—
|
|
—
|
|
(426
|
)
|
||||
|
Total
|
$
|
—
|
|
$
|
1,665
|
|
||||
F-82
|
*
|
Other includes non-controlling interests in PMTWorks Payroll, LLC, and Secure Cyber Gateway Services, LLC (“OLS”). During
2014
, the Company completed a restructure of equity for OLS, formerly
50.1%
minority owned, which included the conversion of
$518,000
debt payable to Wilshire Texas Partners, LLC (“WT1”), a related party, in exchange for a new class of non-voting class B preferred stock and an additional
16.8%
share of the common interests of OLS.
|
At
December 31, 2014
, there were no non-controlling interests as a result of the conversion to a BDC.
Operating and Employment Commitments
The Company leases office space and other office equipment in several states under operating lease agreements which expire at various dates through 2019. Those office space leases which are for more than one year generally contain scheduled rent increases or escalation clauses.
The following summarizes the Company’s obligations and commitments, as of
December 31, 2014
(Post BDC Conversion), for future minimum cash payments required under operating lease and employment agreements (in thousands):
|
Year
|
Operating
Leases *
|
Employment
Agreements
|
Total
|
||||||||
|
2015
|
$
|
1,671
|
|
$
|
210
|
|
$
|
1,881
|
|
||
|
2016
|
637
|
|
—
|
|
637
|
|
|||||
|
2017
|
586
|
|
—
|
|
586
|
|
|||||
|
2018
|
602
|
|
—
|
|
602
|
|
|||||
|
2019
|
205
|
|
—
|
|
205
|
|
|||||
|
Thereafter
|
—
|
|
—
|
|
—
|
|
|||||
|
Total
|
$
|
3,701
|
|
$
|
210
|
|
$
|
3,911
|
|
||
|
*
|
Minimum payments have not been reduced by minimum sublease rentals of
$667,000
due in the future under non-cancelable subleases.
|
Rent expense for
2014
,
2013
and
2012
was approximately
$2,361,000
,
$2,406,000
, and
$2,459,000
, respectively.
Legal Matters
In the ordinary course of business and from time to time, we are named as a defendant in various legal proceedings. The Company evaluates such matters on a case by case basis and its policy is to contest vigorously any claims it believes are without compelling merit.
We recognize a liability for a contingency in accrued expenses and other liabilities when it is probable that a liability has been incurred and the amount of loss can be reasonably estimated. If the reasonable estimate of a probable loss is a range, we accrue the most likely amount of such loss, and if such amount is not determinable, then we accrue the minimum in the range as the loss accrual. The determination of the outcome and loss estimates requires significant judgment on the part of management.
The Company is currently involved in various contract claims and litigation matters. In addition, and as previously disclosed and as fully described in Item 3. Legal Proceedings, during the quarter ended June 30, 2013 the Federal Trade Commission amended an existing complaint in the matter Federal Trade Commission v. WV Universal Management, LLC et al. to include Universal Processing Services of Wisconsin, LLC (“UPS”), the Company’s merchant processing portfolio company, as an additional defendant on one count of providing substantial assistance in violation of the Telemarketing Sales Rule. On November 18, 2014, the Court issued an Order granting the FTC’s motion for summary judgment against UPS on the single count. Subsequently, the FTC filed motions for a permanent injunction and equitable monetary relief against UPS and the other remaining defendants. Prior to the Court hearing on the motions, UPS and the FTC reached a settlement on the FTC’s motion for a permanent injunction. On February 11, 2015, the Court granted the FTC’s motion for equitable relief against UPS and the other remaining defendants, ordering that the remaining defendants pay $1,735,000 in equitable monetary relief. While the
F-83
court has yet to issue a judgment setting forth the terms of the relief granted, UPS has recorded a reserve for the full amount of the potential loss as of December 31, 2014, which is reflected in the full year proforma results reported for the segment. The Company strongly disagrees with the court’s Orders on summary judgment and equitable monetary relief, and once a judgment is issued, the Company will decide what actions to take, including an appeal of such rulings.
January 21, 2014, NCMIC Finance Corporation (“NCMIC”) filed a complaint against Universal Processing Services of Wisconsin, LLC (“UPS”), the Company’s merchant processing subsidiary, in the United States District Court for the Southern District of Iowa. The Complaint asserts claims against UPS for breach of the UPS and NCMIC agreement for the processing of credit card transactions, and seeks monetary relief. The Company believes that the claims asserted in the complaint are wholly without merit and intends to vigorously defend the action.
Management has determined that, in the aggregate, all other pending legal actions should not have a material adverse effect on our consolidated results of operations, cash flows or financial condition. In addition, we believe that any amount that could be reasonably estimated of potential loss or range of potential loss is not material.
Shares of common stock repurchased by the Company are recorded at cost as treasury stock and result in a reduction of equity in our consolidated balance sheet. From time-to-time, treasury shares may be reissued as part of our stock-based compensation programs. When shares are reissued, we use the weighted average cost method for determining cost. The difference between the cost of the shares and the issuance price is added or deducted from additional paid-in capital.
In November 2011, the Newtek Board of Directors adopted a stock buy-back program authorizing management to enter the market to re-purchase up to
200,000
of the Company’s common shares. This
200,000
share authorization replaced the unexercised portions of
two
previous authorizations and terminated in
2014
. As of
December 31, 2014
, the Company purchased a total of
160,584
treasury shares under this authorization. The Company reissued
0
and
9,848
shares in
2014
and
2013
, respectively, in connection with the Company’s 401k match program, and during
2014
reissued
185,155
shares related to the exercise of non-qualified stock options, including warrants,
6,026
shares related to the exercise of incentive stock options, and
52,800
shares of restricted stock. In addition,
94,563
shares that were held by an affiliate were issued to the Company in 2008 as settlement of an outstanding liability and were being held as treasury shares at
December 31, 2013
. In November 2014, the Company retired 61,620 shares of its common stock.
At the Special Meeting of Shareholders held on October 22, 2014, the Company’s shareholders approved a reverse split of the Company’s shares. Following the Special Meeting, the Company’s Board of Directors approved the reverse split ratio of one new share for each five (1:5) of the Company’s current common shares. The reverse stock split was effective as of the close of business on October 22, 2014. All references in this Report to number of shares, price per share and weighted average number of shares outstanding of Common Stock prior to this reverse stock split have been adjusted to reflect the reverse stock split on a retroactive basis, unless otherwise noted.
Basic income per share is computed based on the weighted average number of common shares outstanding during the period. The dilutive effect of common share equivalents is included in the calculation of diluted income per share only when the effect of their inclusion would be dilutive (in thousands, except for per share data).
F-84
|
|
For the Period Ended November 11,
|
Year Ended December 31,
|
||||||||||
|
The calculations of Net Income Per Share were:
|
2014
|
2013
|
2012
|
|||||||||
|
Numerator:
|
||||||||||||
|
Numerator for basic and diluted EPS—net income available to common stockholders
|
$
|
3,293
|
|
$
|
7,528
|
|
$
|
5,643
|
|
|||
|
Denominator:
|
||||||||||||
|
Denominator for basic EPS—weighted average shares
|
7,315
|
|
7,059
|
|
7,105
|
|
||||||
|
Denominator for diluted EPS—weighted average shares
|
7,315
|
|
7,581
|
|
7,349
|
|
||||||
|
Net income per share: Basic
|
$
|
0.45
|
|
$
|
1.07
|
|
$
|
0.79
|
|
|||
|
Net income per share: Diluted
|
$
|
0.45
|
|
$
|
0.99
|
|
$
|
0.77
|
|
|||
The amount of anti-dilutive shares/units excluded from above is as follows (in thousands):
|
|
For the Period Ended November 11,
|
Year Ended December 31,
|
||||||
|
|
2014
|
2013
|
2012
|
|||||
|
Stock options
|
—
|
|
—
|
|
—
|
|
||
|
Warrants
|
—
|
|
—
|
|
10
|
|
||
|
Contingently issuable shares
|
17
|
|
17
|
|
17
|
|
||
The following table summarizes the calculations for the net increase in net assets resulting from operations per common share for the period November 12 to December 31, 2014.
|
|
For the Period Ended November 12 to December 31,
|
||||
|
2014
|
|||||
|
Net increase in net assets resulting from operations
|
$
|
681
|
|
||
|
Weighted average shares outstanding
|
7,620
|
|
|||
|
Net increase in net assets resulting from operations per common share
|
$
|
0.09
|
|
||
During the year ended December 31, 2014, Summit Partners Credit Advisors, L.P. completed a cashless exercise of their warrants. This exercise resulted in the issuance of
336,875
shares of the Company’s common shares.
181,778
of the shares were issued from the Company’s treasury stock.
Each Capco has a contractual arrangement with a particular state or jurisdiction that legally entitles the Capco to earn and deliver tax credits (ranging from
4%
to
11%
per year) from the state or jurisdiction upon satisfying certain criteria. In fiscal
2014
,
2013
and
2012
, the Company recognized income from tax credits resulting from the accretion of the discount attributable to tax credits earned in prior years. As the tax credits are delivered to the Certified Investors, the asset balance is offset against notes payable in credits in lieu of cash. As discussed in Note 3, the Company adopted fair value accounting concurrently with the adoption of fair value option for financial assets and financial liabilities on January 1, 2008 to value its credits in lieu of
F-85
cash balance. As a result, the income from tax credit accretion for the years ended
December 31, 2014
,
2013
and
2012
has been recorded at fair value. The total income from tax credits recognized in revenues in the consolidated statements of income was
$61,000
,
$113,000
, and
$522,000
for the years ended
December 31, 2014
,
2013
and
2012
, respectively.
The Company’s tax provision is based on the Company’s results for the full year on a consolidated tax basis. Although the company converted to a BDC on November 11, 2014, it will not be eligible to elect RIC status until the year ended December 31, 2015. The company’s deferred tax asset, currently reflected on the consolidated balance sheet, will be eliminated and closed out to additional paid-in capital on January 1, 2015.
Provision for income taxes for the years ended
December 31, 2014
,
2013
and
2012
is as follows (in thousands):
|
2014
|
2013
|
2012
|
|||||||||
|
Current:
|
|||||||||||
|
Federal
|
$
|
2,742
|
|
$
|
5,075
|
|
$
|
4,511
|
|
||
|
State and local
|
1,043
|
|
132
|
|
1,519
|
|
|||||
|
3,785
|
|
5,207
|
|
6,030
|
|
||||||
|
Deferred:
|
|||||||||||
|
Federal
|
296
|
|
(1,132
|
)
|
(1,731
|
)
|
|||||
|
State and local
|
48
|
|
(157
|
)
|
(417
|
)
|
|||||
|
344
|
|
(1,289
|
)
|
(2,148
|
)
|
||||||
|
Total provision for income taxes
|
$
|
4,129
|
|
$
|
3,918
|
|
$
|
3,882
|
|
||
Included in the
2013
current state provision is a receivable from state tax refunds in the amount of approximately $
1,115,000
, which favorably impacted the Company’s effective tax rate by approximately
8.6%
for the year ended
December 31, 2013
. This receivable resulted from the amendment of the 2010, 2011 and 2012 tax returns.
A reconciliation of income taxes computed at the U.S. federal statutory income tax rate to the provision for income taxes for the years ended
December 31, 2014
,
2013
and
2012
is as follows (in thousands):
|
2014 Provision
|
2013 Provision
|
2012 Provision
|
|||||||||
|
Provision (benefit) for income taxes at U.S. federal statutory rate of 35%
|
$
|
2,655
|
|
$
|
3,874
|
|
$
|
3,304
|
|
||
|
State and local taxes, net of federal benefit
|
709
|
|
399
|
|
720
|
|
|||||
|
Deferred adjustment true-ups
|
—
|
|
116
|
|
—
|
|
|||||
|
Permanent differences
|
(47
|
)
|
91
|
|
46
|
|
|||||
|
Goodwill impairment
|
597
|
|
—
|
|
—
|
|
|||||
|
Deferred tax asset valuation allowance increase (decrease)
|
200
|
|
178
|
|
(185
|
)
|
|||||
|
Change in NYC valuation allowance
|
—
|
|
(3,370
|
)
|
—
|
|
|||||
|
Deferred rate true up – NYC NOL
|
—
|
|
3,370
|
|
—
|
|
|||||
|
Other – refund from prior year amended state returns
|
—
|
|
(639
|
)
|
—
|
|
|||||
|
Other
|
15
|
|
(101
|
)
|
(3
|
)
|
|||||
|
Total provision (benefit) for income taxes
|
$
|
4,129
|
|
$
|
3,918
|
|
$
|
3,882
|
|
||
Deferred tax assets and liabilities consisted of the following at
December 31, 2014
and
2013
(in thousands):
F-86
|
2014
|
2013
|
||||||
|
Deferred tax assets:
|
|||||||
|
Net operating losses (“NOLs”) and capital losses (excluding New York City NOL)
|
$
|
2,193
|
|
$
|
3,199
|
|
|
|
New York City NOL
|
225
|
|
225
|
|
|||
|
Prepaid insurance
|
78
|
|
217
|
|
|||
|
Loan loss reserves and fair value discounts
|
2,466
|
|
2,366
|
|
|||
|
Flow through of deferred items from investments in qualified businesses
|
522
|
|
522
|
|
|||
|
Deferred compensation
|
—
|
|
880
|
|
|||
|
Loss on investments
|
—
|
|
—
|
|
|||
|
Interest payable in credits in lieu of cash
|
1,090
|
|
1,177
|
|
|||
|
Depreciation and amortization
|
44
|
|
897
|
|
|||
|
Accrued expenses
|
771
|
|
—
|
|
|||
|
Other
|
815
|
|
914
|
|
|||
|
Total deferred tax assets before valuation allowance
|
8,204
|
|
10,397
|
|
|||
|
Less: Valuation allowance
|
(2,663
|
)
|
(3,453
|
)
|
|||
|
Less: Valuation allowance – New York City NOL
|
(225
|
)
|
(225
|
)
|
|||
|
Total deferred tax assets
|
5,316
|
|
6,719
|
|
|||
|
Deferred tax liabilities:
|
|||||||
|
Credits in lieu of cash
|
(1,992
|
)
|
(2,550
|
)
|
|||
|
Deferred income
|
(451
|
)
|
(563
|
)
|
|||
|
Total deferred tax liabilities
|
(2,443
|
)
|
(3,113
|
)
|
|||
|
Net deferred tax asset
|
$
|
2,873
|
|
$
|
3,606
|
|
|
As of
December 31, 2014
, the Company had gross Federal NOLs of approximately
$4,783,000
and state and local NOLs of approximately
$7,447,000
which will begin to expire in
2020
, and
$332,000
of capital losses with a full valuation allowance which will expire in
2015
. The Federal NOLs are attributable to NSBF and NBC, of which the NOLs at NBC have a full valuation allowance and the NOLs at NSBF, subject to IRC Section 382 limitations, have a partial valuation allowance.
Realization of the deferred tax assets is dependent on generating sufficient taxable income in future years. The Company had total valuation allowances of approximately
$2,888,000
and
$3,678,000
as of
December 31, 2014
and
2013
, respectively. The change in the valuation allowance represents the charge off of capital losses that have expired unused.
The Company analyzed its tax positions taken on their Federal and state tax returns for the open tax years 2011,
2012
and
2013
, and used three levels of analysis in determining whether any uncertainties existed with respect to these positions. The first level consisted of an analysis of the technical merits of the position, past administrative practices and precedents, industry norms and historical audit outcome. The second level of analysis was used to determine if the threshold (more than
50%
) was met for the tax filing position. The third level of analysis consisted of determining the probable outcome once it was determined that the threshold was met for the tax filing position. Based on our analysis, the Company determined that there were no uncertain tax positions and that the Company should prevail upon examination by the taxing authorities.
The Company’s operations have been extended to other jurisdictions. This extension involves dealing with uncertainties and judgments in the application of tax regulations in these jurisdictions. The final resolution of any tax liabilities are dependent upon factors including negotiations with taxing authorities in these jurisdictions and resolution of disputes arising from federal, state and local tax audits. The Company recognizes potential liabilities associated with anticipated tax audit issues that may arise during an examination. Interest and penalties that are anticipated to be due upon examination are recognized as accrued interest and other liabilities with an offset to interest and other expense. The Company determined that there were no uncertainties with respect to the application of tax regulations in these jurisdictions.
Defined Contribution Plan
The Company’s employees participate in a defined contribution 401(k) plan (the “Plan”) adopted in 2004 which covers substantially all employees based on eligibility. The Plan is designed to encourage savings on the part of eligible employees and
F-87
qualifies under Section 401(k) of the Internal Revenue Code. Under the Plan, eligible employees may elect to have a portion of their pay, including overtime and bonuses, reduced each pay period, as pre-tax contributions up to the maximum allowed by law. The Company may elect to make a matching contribution equal to a specified percentage of the participant’s contribution, on their behalf as a pre-tax contribution. For the years ended
December 31, 2014
and
2013
, the Company matched
50%
of the first
2%
of employee contributions, resulting in
$130,000
and
$153,000
in expense recorded in
2014
and
2013
, respectively.
The financial highlights for the Company are as follows:
|
November 12, 2014 to December 31, 2014
|
||||
|
Per share data
(2)
|
||||
|
Net asset value at beginning of period
|
$
|
13.49
|
|
|
|
Issuance of common stock
|
2.73
|
|
||
|
Net investment loss
|
(0.33
|
)
|
||
|
Net realized gain on investments
|
0.08
|
|
||
|
Net unrealized appreciation on non-affiliate investments
|
0.36
|
|
||
|
Net unrealized loss on servicing assets
|
(0.02
|
)
|
||
|
Net unrealized depreciation on credits in lieu of cash and notes payable in credits in lieu of cash
|
—
|
|
||
|
Net asset value/stockholders' equity at end of period
|
$
|
16.31
|
|
|
|
Per share market value at end of period
|
$
|
14.76
|
|
|
|
Total return based on market value
|
13.10
|
%
|
||
|
Total return based on average net asset value/stockholders' equity
|
20.87
|
%
|
||
|
Share outstanding at end of period
|
10,206
|
|
||
|
Ratios/Supplemental Data:
|
||||
|
Ratio of expenses to average net assets/stockholders' equity
(3)
|
20.46
|
%
|
||
|
Ratio of net investment loss to average net assets
(3)
|
(11.99
|
)%
|
||
|
Net assets/stockholders' equity at end of period
|
$
|
166,418
|
|
|
|
Average debt outstanding
|
$
|
108,483
|
|
|
|
Average debt outstanding per share
|
$
|
10.63
|
|
|
|
Asset coverage ratio
|
223
|
%
|
||
|
Portfolio turnover
|
5.08
|
%
|
||
(1) Years prior to becoming a a business development company are not presented in the financial highlights as the information would not be meaningful.
(2) Based on actual number of shares outstanding at the end of the corresponding period or the weighted average shares outstanding for the period, unless otherwise noted, as appropriate.
(3) Annualized.
During the period ended November 11, 2014 and years ended December 31,
2013
, and
2012
, the Company provided merchant processing for a company controlled by the father-in-law of a major stockholder and former President of the Company, in the approximate amount of
$15,000
,
$15,000
and
$27,000
, respectively. In connection with these transactions, the Company recorded a receivable of
$0
and
$1,000
at
December 31, 2014
and
2013
, respectively.
The Company pays gross residuals to an independent sales organization (“ISO”) controlled by a major stockholder of the Company. The ISO earns gross residuals from Newtek, and in turn pays commissions to its sales representatives as well as other operating expenses. Gross residuals paid by the Company to the ISO for the period ended November 11, 2014 and years ended December 31,
2013
and
2012
were approximately
$3,241,000
,
$3,636,000
and
$3,155,000
, respectively.
As a result of the BDC Conversion, subsidiaries which were consolidated in prior years are reflected as investments in controlled portfolio companies, held at fair value. As a result, transactions and balances with these companies are no longer eliminated in consolidation. As of
December 31, 2014
, the Company has $
3,190,000
due from related parties and $
2,867,000
due to related parties. Related party transactions from November 12, 2014 through December 31, 2014 were not material.
As of
December 31, 2014
, the Company had
four
share-based compensation plans, which are described below. The compensation cost that has been charged against income for those plans was
$865,000
,
$784,000
and
$543,000
for the years ended
December 31, 2014
,
2013
and
2012
, respectively, and is included in salaries and benefits and other general and administrative costs in the accompanying consolidated statements of income for stock compensation related to employees and the board of directors, respectively.
The Newtek Business Services, Inc. 2000 Stock Incentive and Deferred Compensation Plan, as amended, (the “2000 Plan”) currently provides for the issuance of awards of restricted shares for up to a maximum of
850,000
common shares to employees and non-employees. The issuance of options under this Plan expired on
December 31, 2009
. All restricted shares or previously granted options are issued at the fair value on the date of grant. Options issued generally have a maximum term that ranges from
2
to
10 years
and vesting provisions that range from
0
to
3 years
. As of
December 31, 2014
, there are
459,822
shares available for future grant under this plan.
The Newtek Business Services, Inc. 2003 Stock Incentive Plan, as amended, (the “2003 Plan”) currently provides for the issuance of awards of restricted shares or options for up to a maximum of
200,000
common shares to employees and non-employees. All restricted shares or options are issued at the fair value on the date of grant. Options issued generally have a maximum term that ranges from
2
to
10 years
and vesting provisions that range from
0
to
3 years
. As of
December 31, 2014
, there were
108,092
shares available for future grant under this plan.
The Newtek Business Services, Inc. 2010 Stock Incentive Plan, (the “2010 Plan”) currently provides for the issuance of awards of restricted shares or options for up to a maximum of
330,000
common shares to employees and non-employees. All restricted shares or options are issued at the fair value on the date of grant. Options issued generally have a maximum term that ranges from
2
to
10 years
and vesting provisions that range from
0
to
4 years
. As of
December 31, 2014
, there were
46,300
shares available for future grant under this plan.
The Newtek Business Services Corp. 2014 Stock Incentive Plan, (the "2014 Plan") currently provides for the issuance of options up to a maximum of
600,000
common shares to employees and non-employees. All options are issued at fair value on the date of grant. Options issued generally have a maximum term that ranges from
2
to
10 years
and vesting provisions that range from
0
to
4 years
. As of
December 31, 2014
, there were
600,000
shares available for future grant under this plan.
A summary of stock option activity under the 2000, 2003, 2010 and 2014 Plans as of
December 31, 2014
and changes during the year then ended are presented below:
F-88
|
Stock Options
|
Shares
(In thousands)
|
Weighted Average Exercise Price
|
Weighted Average Remaining Term (In years)
|
Aggregate
Intrinsic Value
(In thousands)
|
|||||||||
|
Outstanding - December 31, 2013
|
118
|
|
$
|
7.24
|
|
3.25
|
|
$
|
1,002
|
|
|||
|
Granted
|
5
|
|
20.00
|
|
|
|
|
||||||
|
Exercised
|
(111
|
)
|
7.19
|
|
|
|
|||||||
|
Expired
|
(2
|
)
|
7.85
|
|
|
|
|
||||||
|
Cancelled
|
(10
|
)
|
13.61
|
|
|||||||||
|
Outstanding - December 31, 2014
|
—
|
|
$
|
—
|
|
—
|
|
$
|
—
|
|
|||
|
Exercisable - December 31, 2014
|
—
|
|
$
|
—
|
|
—
|
|
$
|
—
|
|
|||
As of
December 31, 2014
, there were
no
unrecognized compensation costs related to non-vested share-based compensation arrangements granted under the 2000, 2003, 2010 and 2014 Plans.
In March 2011, Newtek granted certain employees, executives and board of directors an aggregate of
228,400
shares of restricted stock valued at
$1,941,000
or
$8.50
per share. The fair value of these grants was determined using the fair value of the common shares at the grant date. The restricted shares are forfeitable upon early voluntary or involuntary termination of the employee. Upon vesting, the grantee will receive one common share for each restricted share vested. Under the terms of the plan, these share awards do not include voting rights until the shares vest. The grants are valued using the straight-line method and vested in
November 2014
. As a result, the Company charged
$202,000
,
$497,000
and
$465,000
to income in
2014
,
2013
and
2012
, respectively.
In the second quarter of 2012, Newtek granted certain employees and executives an aggregate of
24,600
restricted shares valued at
$184,000
. The grants were originally scheduled to vest on
July 1, 2014
. In June 2014, the Company's Board of Directors approved delayed vesting for 6,000 shares until February 1, 2015. The fair value of these grants was determined using the fair value of the common shares at the grant date. The restricted shares are forfeitable upon early voluntary or involuntary termination of the employee. Upon vesting, the grantee will receive one common share for each restricted share vested. Under the terms of the plan, these share awards do not include voting rights until the shares vest. All restricted shares vested in November 2014. The Company charged
$26,000
,
$53,000
and
$38,000
to share-based compensation expense during the years ended
December 31, 2014
,
2013
and
2012
, respectively.
During the first quarter of 2013, the Company granted certain employees, executives and directors an aggregate of
60,000
restricted shares of common stock valued at
$556,000
. The employee and executive grants have a vesting date of
March 1, 2016
while the directors’ vest
July 1, 2015
. The fair value of these grants was determined using the fair value of the common shares at the grant date. The restricted shares are forfeitable upon early voluntary or involuntary termination of the employee’s employment. Upon vesting, the grantee will receive
one
common share for each restricted share vested. Under the terms of the plan, these share awards do not include voting rights until the shares vest. All outstanding restricted shares vested in November 2014. The Company recorded
$374,000
and $
182,000
in share-based compensation for the years ended
December 31, 2014
and
2013
, respectively.
During the second quarter of 2013, the Company granted certain employees and executives an aggregate of
16,000
restricted shares of common stock valued at
$174,000
with a vesting date of
March 1, 2016
. The fair value of these grants was determined using the fair value of the common shares at the grant date. The restricted shares are forfeitable upon early voluntary or involuntary termination of the employee’s employment. Upon vesting, the grantee will receive
one
common share for each restricted share vested. Under the terms of the plan, these share awards do not include voting rights until the shares vest. All outstanding restricted shares vested in November 2014. The Company recorded $
77,000
and $
31,000
in share-based compensation for the years ended
December 31, 2014
and
2013
, respectively.
During the third quarter of 2013, the Company granted certain employees an aggregate of
14,000
restricted shares of common stock valued at
$176,000
with
2,000
vesting on
March 1, 2016
and
12,000
vesting on
July 31, 2016
. The fair value of these grants was determined using the fair value of the common shares at the grant date. The restricted shares are forfeitable upon early voluntary or involuntary termination of the employee’s employment. Upon vesting, the grantee will receive
one
common share for each restricted share vested. Under the terms of the plan, these share awards do not include voting rights until the shares vest. All outstanding restricted shares vested in November 2014. The Company recorded $
134
,000 and $
21,000
in share-based compensation for the years ended
December 31, 2014
and
2013
, respectively.
F-89
In April 2014, the Company granted a certain employee
2,000
restricted shares of common stock valued at $
28,600
which vested on April 30, 2014. The fair value of this grant was determined using the fair value of the common shares at the grant date. The restricted shares are forfeitable upon early voluntary or involuntary termination of the employee’s employment. Upon vesting, the grantee received one common share for each restricted share vested. The Company recorded $
28,600
to share-based compensation for the period ended November 11, 2014 in connection with the vesting period associated with this grant.
In July 2014, the Company granted certain employees and executives an aggregate of
5,400
options valued at $
26,000
. Option awards were granted with an exercise price of $20.00 which exceeded the market price of the Company’s stock at the date of grant. The options vest immediately and expire 5 years from the date of grant. The fair value of each option award is estimated on the date of grant using a Black-Scholes option valuation model that uses the following assumptions: 5 year expected life, risk-free interest rate of 1.66% and expected volatility of the Company’s stock of 54.6%. Expected volatilities are based on the Company’s stock. The risk-free rate for periods during the expected life of the option is based on the U.S. Treasury yield curve in effect at the time of grant. Expected term was determined using historical exercise patterns and the period of time that the awards are expected to be outstanding. The Company recorded $
26,000
to share-based compensation for the period ended November 11, 2014 related to these grants.
On November 11, 2014, all outstanding restricted stock and option awards granted to employees and executives under all plans vested as a result of the BDC Conversion. This resulted in the issuance of 42,000 and 138,000 shares to employees and executives related to option and restricted stock awards, respectively.
A summary of the status of Newtek’s non-vested restricted shares as of
December 31, 2014
and changes during the year then ended is presented below:
|
Non-vested Restricted Shares
|
Number of Shares (in thousands)
|
Weighted Average Grant Date Fair Value
|
||||
|
Non-vested - December 31, 2013
|
298
|
|
$
|
8.90
|
|
|
|
Granted
|
2
|
|
$
|
14.28
|
|
|
|
Vested and issued
|
(286
|
)
|
$
|
8.91
|
|
|
|
Forfeited
|
(14
|
)
|
$
|
9.67
|
|
|
|
Non-vested - December 31, 2014
|
—
|
|
$
|
—
|
|
|
Operating segments are organized internally primarily by the type of services provided. The Company has aggregated similar operating segments into
six
reportable segments: Electronic payment processing, Managed technology solutions, Small business finance, All other, Corporate and Capcos.
The Electronic payment processing segment is a processor of credit card transactions, as well as a marketer of credit card and check approval services to the small- and medium-sized business market. Expenses include direct costs (included in a separate line captioned electronic payment processing costs), professional fees, salaries and benefits, and other general and administrative costs, all of which are included in the respective caption on the consolidated statements of income.
The Small business finance segment consists of Small Business Lending, Inc., a lender service provider for third-parties that primarily services government guaranteed U.S. Small Business Administration (“SBA”) loans and non-SBA loans; Texas Whitestone Group which manages the Company’s Texas Capco; and NBC which provides accounts receivable financing, billing and accounts receivable maintenance services to businesses. NSBF generates revenues from sales of loans, servicing income for those loans retained and interest income earned on the loans themselves. The lender generates expenses for interest, professional fees, salaries and benefits, depreciation and amortization, and provision for loan losses, all of which are included in the respective caption on the consolidated statements of income. NSBF also has expenses such as loan recovery expenses, loan processing costs, and other expenses that are all included in the other general and administrative costs caption on the consolidated statements of income.
The Managed technology solutions segment consists of NTS, acquired in July 2004. NTS’s revenues are derived primarily from web hosting services and consist of web hosting and set up fees. NTS generates expenses such as professional fees, payroll and benefits, and depreciation and amortization, which are included in the respective caption on the accompanying consolidated
F-90
statements of income, as well as licenses and fees, rent, and general office expenses, all of which are included in other general and administrative costs in the respective caption on the consolidated statements of income.
The All other segment includes revenues and expenses primarily from qualified businesses that received investments made through the Company’s Capcos which cannot be aggregated with other operating segments. The three largest entities in the segment are Newtek Insurance Agency, LLC, an insurance sales operation, PMTWorks Payroll, LLC, a provider of payroll processing servics and Business Connect, LLC, a provider of sales and processing services.
Corporate activities represent revenue and expenses not allocated to our segments. Revenue includes interest income and management fees earned from Capcos (and included in expenses in the Capco segment). Expenses primarily include corporate operations related to broad-based sales and marketing, legal, finance, information technology, corporate development and additional costs associated with administering the Capcos.
The Capco segment, which consists of the
twelve
Capcos, generates non-cash income from tax credits, interest income and gains from investments in qualified businesses which are included in other income. Expenses primarily include non-cash interest and insurance expense, management fees paid to Newtek (and included in the Corporate activities revenues), legal, and auditing fees and losses from investments in qualified businesses.
Management has considered the following characteristics when making its determination of its operating and reportable segments:
|
•
|
the nature of the product and services;
|
|
•
|
the type or class of customer for their products and services;
|
|
•
|
the methods used to distribute their products or provide their services; and
|
|
•
|
the nature of the regulatory environment (for example, banking, insurance, or public utilities).
|
The accounting policies of the segments are the same as those described in the summary of significant accounting policies.
The Company no longer has
six
reportable segments after November 11, 2014 as a result of the conversion to a BDC. The segment information presented below represents results up until the date of conversion. For the period from November 12, 2014 through December 31, 2014 there is only one reportable segment.
The following table presents the Company’s segment information for the period ended November 11, 2014, and the years ended December 31,
2013
and
2012
and total assets as of December 31,
2013
(in thousands):
F-91
|
For the period ended November 11, 2014
|
For the year ended December 31, 2013
|
For the year ended December 31, 2012
|
|||||||||
|
Third Party Revenue
|
|||||||||||
|
Electronic payment processing
|
$
|
79,529
|
|
$
|
89,655
|
|
$
|
85,489
|
|
||
|
Small business finance
|
36,426
|
|
34,112
|
|
25,408
|
|
|||||
|
Managed technology solutions
|
13,997
|
|
17,576
|
|
18,211
|
|
|||||
|
All Other
|
2,277
|
|
2,568
|
|
1,860
|
|
|||||
|
Corporate activities
|
774
|
|
900
|
|
785
|
|
|||||
|
Capcos
|
364
|
|
213
|
|
683
|
|
|||||
|
Total reportable segments
|
133,367
|
|
145,024
|
|
132,436
|
|
|||||
|
Eliminations
|
(1,520
|
)
|
(1,431
|
)
|
(1,306
|
)
|
|||||
|
Consolidated Total
|
$
|
131,847
|
|
$
|
143,593
|
|
$
|
131,130
|
|
||
|
Inter Segment Revenue
|
|||||||||||
|
Electronic payment processing
|
$
|
3,708
|
|
$
|
3,265
|
|
$
|
2,250
|
|
||
|
Small business finance
|
454
|
|
520
|
|
670
|
|
|||||
|
Managed technology solutions
|
528
|
|
526
|
|
612
|
|
|||||
|
All Other
|
1,435
|
|
1,654
|
|
1,850
|
|
|||||
|
Corporate activities
|
3,406
|
|
4,753
|
|
3,684
|
|
|||||
|
Capco
|
692
|
|
805
|
|
817
|
|
|||||
|
Total reportable segments
|
10,223
|
|
11,523
|
|
9,883
|
|
|||||
|
Eliminations
|
(10,223
|
)
|
(11,523
|
)
|
(9,883
|
)
|
|||||
|
Consolidated Total
|
$
|
—
|
|
$
|
—
|
|
$
|
—
|
|
||
|
Income (loss) before income taxes
|
|||||||||||
|
Electronic payment processing
|
$
|
7,366
|
|
$
|
8,304
|
|
$
|
7,041
|
|
||
|
Small business finance
|
9,090
|
|
10,143
|
|
8,094
|
|
|||||
|
Managed technology solutions
|
2,818
|
|
3,564
|
|
4,254
|
|
|||||
|
All Other
|
(1,153
|
)
|
(1,606
|
)
|
(1,038
|
)
|
|||||
|
Corporate activities
|
(9,879
|
)
|
(8,002
|
)
|
(7,511
|
)
|
|||||
|
Capco
|
(778
|
)
|
(1,284
|
)
|
(1,401
|
)
|
|||||
|
Total reportable segments
|
7,464
|
|
11,119
|
|
9,439
|
|
|||||
|
Eliminations
|
(321
|
)
|
(50
|
)
|
—
|
|
|||||
|
Totals
|
$
|
7,143
|
|
$
|
11,069
|
|
$
|
9,439
|
|
||
|
Depreciation and Amortization
|
|||||||||||
|
Electronic payment processing
|
$
|
226
|
|
$
|
358
|
|
$
|
743
|
|
||
|
Small business finance
|
1,440
|
|
1,241
|
|
919
|
|
|||||
|
Managed technology solutions
|
1,165
|
|
1,316
|
|
1,214
|
|
|||||
|
All Other
|
180
|
|
203
|
|
36
|
|
|||||
|
Corporate activities
|
129
|
|
161
|
|
118
|
|
|||||
|
Capco
|
—
|
|
5
|
|
6
|
|
|||||
|
Totals
|
$
|
3,140
|
|
$
|
3,284
|
|
$
|
3,036
|
|
||
F-92
|
For the period ended November 11, 2014
|
For the year ended December 31, 2013
|
For the year ended December 31, 2012
|
|||||||||
|
Interest (Income) Expense, net
|
|||||||||||
|
Electronic payment processing
|
$
|
(1
|
)
|
$
|
(4
|
)
|
$
|
(6
|
)
|
||
|
Small business finance
|
(712
|
)
|
766
|
|
466
|
|
|||||
|
Managed technology solutions
|
41
|
|
94
|
|
80
|
|
|||||
|
All Other
|
—
|
|
(1
|
)
|
(2
|
)
|
|||||
|
Corporate activities
|
2,264
|
|
24
|
|
8
|
|
|||||
|
Capcos
|
(234
|
)
|
96
|
|
527
|
|
|||||
|
Total reportable segments
|
1,358
|
|
975
|
|
1,073
|
|
|||||
|
Eliminations
|
302
|
|
50
|
|
—
|
|
|||||
|
Consolidated Total
|
$
|
1,660
|
|
$
|
1,025
|
|
$
|
1,073
|
|
||
|
Identifiable Assets
|
|||||||||||
|
Electronic payment processing
|
$
|
—
|
|
$
|
9,060
|
|
|||||
|
Small business finance
|
—
|
|
156,444
|
|
|||||||
|
Managed technology solutions
|
—
|
|
12,027
|
|
|||||||
|
All Other
|
—
|
|
3,828
|
|
|||||||
|
Corporate activities
|
—
|
|
9,357
|
|
|||||||
|
Capco
|
—
|
|
7,896
|
|
|||||||
|
Consolidated Total
|
$
|
—
|
|
$
|
198,612
|
|
|||||
Summarized Financial Information of Our Unconsolidated Subsidiaries
The Company holds a controlling interest, as defined by the 1940 Act, as amended, in portfolio companies that are not consolidated in the Company's consolidated financial statements. Below is a brief description of a portfolio company that is required to have supplemental disclosure incorporated in our financial statements in accordance with Regulation S-X section 4-08(g), along with summarized financial information as of December 31, 2014.
Universal Processing Services of Wisconsin, LLC
Universal Processing Services of Wisconsin, LLC markets credit and debit card processing services, check approval services and ancillary processing equipment and software to merchants who accept credit cards, debit cards, checks and other non-cash forms of payment.
F-93
The summarized financial information of our unconsolidated subsidiary was as follows:
|
Balance Sheet - Universal Processing Services of Wisconsin, LLC
|
As of December 31, 2014
|
|||
|
Current assets
|
$
|
7,330
|
|
|
|
Noncurrent assets
|
2,636
|
|
||
|
Total assets
|
$
|
9,966
|
|
|
|
Current liabilities
|
5,424
|
|
||
|
Noncurrent liabilities
|
1,005
|
|
||
|
Total liabilities
|
$
|
6,429
|
|
|
|
Total equity
|
$
|
3,537
|
|
|
|
Statement of Income - Universal Processing Services of Wisconsin, LLC
|
Year Ended December 31, 2014
|
|||
|
Revenue
|
$
|
90,429
|
|
|
|
Expenses
|
84,878
|
|
||
|
Income from operations
|
$
|
5,551
|
|
|
|
Interest income
|
3,138
|
|
||
|
Net income
|
$
|
8,689
|
|
|
The following table sets forth certain unaudited consolidated quarterly statement of income data from the eight quarters ended
December 31, 2014
. This information is unaudited, but in the opinion of management, it has been prepared substantially on the same basis as the audited consolidated financial statements appearing elsewhere in this report, and all necessary adjustments, consisting only of normal recurring adjustments, have been included in the amounts stated below. The consolidated quarterly data should be read in conjunction with the current audited consolidated statements and notes thereto. The total of the quarterly EPS data may not equal to the full year results.
|
|
Three Months Ended (In Thousands, except Per Share Data)
|
(In Thousands, except Per Share Data)
Period from 1/1/14 through
|
(In Thousands, except Per Share Data)
Period from 11/12/14 through
|
||||||||||||||||
|
2014
|
3/31
|
6/30
|
9/30
|
11/11/14
|
12/31/14
|
||||||||||||||
|
Total Revenue
|
$
|
36,087
|
|
$
|
38,128
|
|
$
|
38,166
|
|
$
|
19,466
|
|
$
|
—
|
|
||||
|
Investment income
|
$
|
—
|
|
$
|
—
|
|
$
|
—
|
|
$
|
—
|
|
$
|
1,976
|
|
||||
|
Income before income taxes
|
$
|
2,216
|
|
$
|
2,289
|
|
$
|
4,523
|
|
$
|
(1,228
|
)
|
$
|
(2,329
|
)
|
||||
|
Net income available to common stockholders/net increase in net assets
|
$
|
1,391
|
|
$
|
1,394
|
|
$
|
2,644
|
|
$
|
(1,415
|
)
|
$
|
681
|
|
||||
|
Income/(loss) per share—Basic
|
$
|
0.20
|
|
$
|
0.20
|
|
$
|
0.35
|
|
$
|
(0.19
|
)
|
$
|
—
|
|
||||
|
Income/(loss) per share—Diluted
|
$
|
0.18
|
|
$
|
0.18
|
|
$
|
0.34
|
|
$
|
(0.19
|
)
|
$
|
—
|
|
||||
|
Net increase in net assets per share
|
$
|
—
|
|
$
|
—
|
|
$
|
—
|
|
$
|
—
|
|
$
|
0.09
|
|
||||
F-94
|
|
Three Months Ended (In Thousands, except Per Share Data)
|
||||||||||||||
|
2013
|
3/31
|
6/30
|
9/30
|
12/31
|
|||||||||||
|
Total Revenue
|
$
|
34,144
|
|
$
|
37,011
|
|
$
|
34,774
|
|
$
|
37,664
|
|
|||
|
Income before income taxes
|
$
|
2,202
|
|
$
|
2,881
|
|
$
|
1,953
|
|
$
|
4,033
|
|
|||
|
Net income available to common stockholders
|
$
|
1,452
|
|
$
|
1,842
|
|
$
|
1,820
|
|
$
|
2,414
|
|
|||
|
Income per share—Basic
|
$
|
0.20
|
|
$
|
0.25
|
|
$
|
0.25
|
|
$
|
0.35
|
|
|||
|
Income per share—Diluted
|
$
|
0.20
|
|
$
|
0.25
|
|
$
|
0.25
|
|
$
|
0.24
|
|
|||
F-95
TABLE OF CONTENTS
Part IItem 1. BusinessItem 1A. Risk FactorsItem 1B. Unresolved Staff CommentsItem 2. PropertiesItem 3. Legal ProceedingsItem 4. Mine Safety DisclosuresPart IIItem 5. Market For The Registrant S Common Equity and Related Shareholder Matters and Issuer Purchases Of Equity SecuritiesItem 6. Selected Financial DataItem 7. Management S Discussion and Analysis Of Financial Condition and Results Of OperationsItem 7A. Quantitative and Qualitative Disclosures About Market RiskItem 8. Financial Statements and Supplementary DataItem 9. Changes in and Disagreements with Accountants on Accounting and Financial DisclosureItem 9A. Controls and ProceduresItem 9B. Other InformationPart IIIItem 10. Directors, Executive Officers and Corporate GovernanceItem 11. Executive CompensationItem 12. Security Ownership Of Certain Beneficial Owners and Management and Related Stockholder MattersItem 13. Certain Relationships, Related Party Transactions and Director IndependenceItem 14. Principal Accounting Fees and ServicesPart IVItem 15. Exhibits and Financial Statement SchedulesNote 17, As To Which The Date Is March 31, 2015Note 1 Description Of Business and Basis Of Presentation:Note 2 Significant Accounting Policies:Note 3 Fair Value MeasurementsNote 4 Credits in Lieu Of Cash:Note 5 Sba Loans:Note 6 Transactions with Affiliated Companies:Note 7 Accounts Receivable:Note 8 Servicing Assets:Note 9 Fixed Assets:Note 10 Goodwill and Other Intangibles:Note 11 Accounts Payable, Accrued Expenses and Other Liabilities:Note 12 Notes Payable:Note 13 Notes Payable in Credits in Lieu Of Cash:Note 14 Non-controlling Interests:Note 15 Commitments and Contingencies:Note 16 Treasury Stock:Note 17 Reverse Stock Split:Note 18 Income Per Share:Note 19 Net Increase in Net Assets Per Share:Note 20 Warrant:Note 21 Income From Tax Credits:Note 22 Income Taxes:Note 23 Benefit Plans:Note 24 Financial Highlights:Note 25 Related Party Transactions:Note 26 Stock Options and Restricted Stock Granted To Employees:Note 27 Segment Reporting:Note 28 Supplemental Financial Data:Note 29 Quarterly Information (unaudited):