NORTHFIELD BANCORP, INC.
10-Ks and 10-Qs
|
|
|
|
|
|
|
|
|
|
|
|
|
|
|
|
|
|
|
|
|
|
|
|
|
|
|
|
|
|
|
|
|
|
|
|
|
|
|
|
|
|
|
|
|
|
|
UNITED STATES SECURITIES AND EXCHANGE COMMISSION
Washington, D.C. 20549
FORM 10-K
|
ý
|
Annual Report Pursuant to Section 13 or 15(d) of the Securities Exchange Act of 1934
|
|
|
For the Fiscal Year Ended December 31, 2017
|
OR
|
¨
|
Transition Report Pursuant to Section 13 or 15(d) of the Securities Exchange Act of 1934
|
|
|
For the transition period from _______________ to _________________
|
Commission File No. 001-35791
Northfield Bancorp, Inc.
(Exact name of registrant as specified in its charter)
|
Delaware
|
|
80-0882592
|
|
(State or other jurisdiction of
|
|
(I.R.S. Employer
|
|
incorporation or organization)
|
|
Identification No.)
|
|
581 Main Street, Suite 810 Woodbridge, New Jersey
|
|
07095
|
|
(Address of Principal Executive Offices)
|
|
Zip Code
|
(732) 499-7200
(Registrant’s telephone number, including area code)
Securities Registered Pursuant to Section 12(b) of the Act:
|
Title of Each Class
|
Name of Each Exchange on Which Registered
|
|
|
Common Stock, par value $0.01 per share
|
The NASDAQ Stock Market, LLC
|
|
Securities Registered Pursuant to Section 12(g) of the Act:
None
Indicate by check mark if the registrant is a well-known seasoned issuer, as defined in Rule 405 of the Securities Act. Yes
ý
No
¨
Indicate by check mark if the registrant is not required to file reports pursuant to Section 13 or Section 15(d) of the Act. Yes
¨
No
ý
Indicate by check mark whether the registrant (1) has filed all reports required to be filed by Section 13 or 15(d) of the Securities Exchange Act of 1934 during the preceding 12 months (or for such shorter period that the registrant was required to file such reports), and (2) has been subject to such filing requirements for the past 90 days. Yes
ý
No
¨
Indicate by check mark whether the registrant has submitted electronically and posted on its corporate Website, if any, every Interactive Data File required to be submitted and posted pursuant to Rule 405 of Regulation S-T (§232.405 of this chapter) during the preceding 12 months (or for such shorter period that the registrant was required to submit and post such files). Yes
ý
No
¨
Indicate by check mark if disclosure of delinquent filers pursuant to Item 405 of Regulation S-K (§229.405 of this chapter) is not contained herein, and will not be contained, to the best of registrant’s knowledge, in definitive proxy or information statements incorporated by reference in Part III of this Form 10-K or any amendment to this Form 10-K.
¨
Indicate by check mark whether the registrant is a large accelerated filer, an accelerated filer, a non-accelerated filer, smaller reporting company, or an emerging growth company. See the definitions of “large accelerated filer,” “accelerated filer,” “smaller reporting company,” and “emerging growth company” in Rule 12b-2 of the Exchange Act.
|
Large accelerated filer
|
ý
|
|
Accelerated filer
|
¨
|
|
Non-accelerated filer
|
¨
|
|
Smaller reporting company
|
¨
|
|
Emerging growth company
|
¨
|
|||
If an emerging growth company, indicate by check mark if the registrant has elected not to use the extended transition period for complying with any new or revised financial accounting standards provided pursuant to Section 13(a) of the Exchange Act.
¨
Indicate by check mark whether the registrant is a shell company (as defined in Rule 12b-2 of the Exchange Act). Yes
¨
No
ý
The aggregate market value of the voting and non-voting common equity held by non-affiliates of the registrant, computed by reference to price at which the common equity was last sold on June 30, 2017 was
$725,183,737
.
As of
February 20, 2018
, there were outstanding
49,059,067
shares of the registrant’s common stock.
DOCUMENTS INCORPORATED BY REFERENCE
Certain portions of the registrant’s Definitive Proxy Statement (the
2018
Proxy Statement) for the
2018
Annual Meeting of the Stockholders to be held May 23,
2018
, will be incorporated by reference in Part III. The
2018
Proxy Statement will be filed within 120 days of
December 31, 2017
.
NORTHFIELD BANCORP, INC.
ANNUAL REPORT ON FORM 10-K
TABLE OF CONTENTS
|
|
Page
|
|
|
|
|
|
|
Item 1.
|
||
|
Item 1A.
|
||
|
Item 1B.
|
||
|
Item 2.
|
||
|
Item 3.
|
||
|
Item 4.
|
||
|
|
|
|
|
|
|
|
|
|
|
|
|
Item 5.
|
||
|
Item 6.
|
||
|
Item 7.
|
||
|
Item 7A.
|
||
|
Item 8.
|
||
|
Item 9.
|
||
|
Item 9A.
|
||
|
Item 9B.
|
||
|
|
|
|
|
|
||
|
|
|
|
|
Item 10.
|
||
|
Item 11.
|
||
|
Item 12
|
||
|
Item 13
|
||
|
Item 14
|
||
|
|
|
|
|
|
|
|
|
|
|
|
|
Item 15
|
||
|
Item 16
|
||
|
|
||
ITEM 1.
BUSINESS
Forward-Looking Statements
This Annual Report contains certain “forward-looking statements,”
which can be identified by the use of such words as “estimate,” “project,” “believe,” “intend,” “anticipate,” “plan,” “seek,” “expect,” “annualized,” “could,” “may,” “should,” “will,” and words of similar meaning. These forward-looking statements include, but are not limited to:
|
•
|
statements of our goals, intentions, and expectations;
|
|
•
|
statements regarding our business plans, prospects, growth and operating strategies;
|
|
•
|
statements regarding the quality of our loan and investment portfolios; and
|
|
•
|
estimates of our risks and future costs and benefits.
|
These forward-looking statements are based on current beliefs and expectations of our management and are inherently subject to significant business, economic and competitive uncertainties, and contingencies, many of which are beyond our control. In addition, these forward-looking statements are subject to assumptions with respect to future business strategies and decisions that are subject to change.
The following factors, among others, could cause actual results to differ materially from the anticipated results or other expectations expressed in the forward-looking statements:
|
•
|
general economic conditions, either nationally or in our market areas, including employment prospects, real estate values and conditions, that are worse than expected;
|
|
•
|
competition among depository and other financial institutions;
|
|
•
|
inflation and changes in the interest rate environment that reduce our margins and yields or reduce the fair value of financial instruments;
|
|
•
|
adverse changes in the securities, credit markets or real estate values;
|
|
•
|
changes in laws, tax policies, or government regulations or policies affecting financial institutions, including changes in regulatory fees and capital requirements;
|
|
•
|
our ability to manage operations in the current economic conditions;
|
|
•
|
our ability to enter new markets successfully and capitalize on growth opportunities;
|
|
•
|
our ability to successfully integrate acquired entities;
|
|
•
|
changes in consumer demand, spending, borrowing and savings habits;
|
|
•
|
changes in accounting policies and practices, as may be adopted by the bank regulatory agencies, the Financial Accounting Standards Board, or the Securities and Exchange Commission, or the Public Company Accounting Oversight Board;
|
|
•
|
cyber attacks, computer viruses and other technological risks that may breach the security of our websites or other systems to obtain unauthorized access to confidential information and destroy data or disable our systems;
|
|
•
|
technological changes that may be more difficult or expensive than expected;
|
|
•
|
changes in our organization, compensation, and benefit plans;
|
|
•
|
changes in the level of government support for housing finance;
|
|
•
|
changes in monetary or fiscal policies of the U.S. Government, including policies of the U.S. Treasury and the Federal Reserve Board (“FRB”)
|
|
•
|
the ability of third-party providers to perform their obligations to us;
|
|
•
|
the ability of the U.S. Government to manage federal debt limits;
|
|
•
|
significant increases in our loan losses, including increases that may result from the new authoritative accounting guidance (known as the current expected credit loss (“CECL”) model which may increase the required level of our allowance for loan losses after adoption effective January 1, 2020;
|
|
•
|
changes in our income tax expense resulting from the impact of recently enacted federal corporate tax reform; and
|
|
•
|
changes in the financial condition, results of operations, or future prospects of issuers of securities that we own.
|
Because of these and other uncertainties, our actual future results may be materially different from the results indicated by these forward-looking statements. Accordingly, you should not place undue reliance on such statements. Except as required by law, we disclaim any intention or obligation to update or revise any forward-looking statements after the date of this Form 10-K, whether as a result of new information, future events or otherwise.
1
Northfield Bancorp, Inc.
Northfield Bancorp, Inc., a Delaware corporation (the “Company”), was organized in 2010 and is the holding company for Northfield Bank. Northfield Bancorp, Inc. uses the support staff and offices of Northfield Bank and reimburses Northfield Bank for these services. If Northfield Bancorp, Inc. expands or changes its business in the future, it may hire its own employees. In the future, we may pursue other business activities, including mergers and acquisitions, investment alternatives and diversification of operations.
Northfield Bancorp, Inc. is subject to comprehensive regulation and examination by the Board of Governors of the Federal Reserve System (the “FRB”).
Northfield Bancorp, Inc.’s main office is located at 581 Main Street, Suite 810, Woodbridge, New Jersey 07095, and its telephone number at this address is (732) 499-7200. The Company's electronic filings with the Securities and Exchange Commission, including copies of annual reports on Form 10-K, quarterly reports on Form 10-Q, current reports on Form 8-K, and amendments to these filings, if any, are available, free of charge, as soon as practicable after they are filed with the Securities and Exchange Commission under the Investor Relations section of the Company's website,
www.eNorthfield.com
. Information on this website is not and should not be considered to be a part of this annual report.
Northfield Bank
Northfield Bank was organized in 1887 and is a federally chartered savings bank. Northfield Bank conducts business from its home office located in Staten Island, New York, its operations center located in Woodbridge, New Jersey, its 38 additional branch offices located in New York and New Jersey, and a lending office located in Brooklyn, New York. The branch offices are located in Staten Island, Brooklyn, and the New Jersey counties of Hunterdon, Mercer, Middlesex, and Union.
On January 8, 2016, the Company completed its acquisition of Hopewell Valley Community Bank (“Hopewell Valley”), which, after purchase accounting adjustments, added $508.5 million to total assets, $342.6 million to loans, and $456.2 million to deposits, and nine branch offices in the Hunterdon and Mercer counties of New Jersey. Total consideration paid for Hopewell Valley was $55.4 million, consisting of $13.7 million in cash and 2,707,381 shares of common stock valued at $41.7 million based upon the $15.41 per share closing price of Northfield Bancorp, Inc.
’
s common stock on January 8, 2016.
Northfield Bank’s principal business consists of originating multifamily and other commercial real estate loans, purchasing investment securities, including mortgage-backed securities and corporate bonds, and, to a lesser extent, depositing funds in other financial institutions. Northfield Bank also offers construction and land loans, commercial and industrial loans, and home equity loans and lines of credit, and from time to time purchases loan participations and pools of loans. Northfield Bank offers a variety of deposit accounts, including certificates of deposit, passbook, statement, and money market savings accounts, transaction deposit accounts (negotiable orders of withdrawal (NOW) accounts and non-interest bearing demand accounts), individual retirement accounts, and, to a lesser extent, when it is deemed cost effective, brokered deposits. Deposits are Northfield Bank’s primary source of funds for its lending and investing activities. Northfield Bank also borrows funds, principally through Federal Home Loan Bank (“FHLB”) of New York advances and repurchase agreements with brokers. Northfield Bank owns 100% of NSB Services Corp., which, in turn, owns 100% of the voting common stock of a real estate investment trust, NSB Realty Trust, which holds primarily mortgage loans. In addition, Northfield Bank refers its customers to independent third parties that provide non-deposit investment products, merchant processing services, and one-to-four family residential mortgage products.
Northfield Bank is subject to comprehensive regulation and examination by the Office of the Comptroller of the Currency (“OCC”).
Northfield Bank’s main office is located at 1731 Victory Boulevard, Staten Island, New York 10314, and its telephone number at this address is (718) 448-1000. Its website address is
www.eNorthfield.com
. Information on this website is not and should not be considered to be a part of this annual report.
Market Area and Competition
Northfield Bank has been in business since 1887, offering a variety of financial products and services to meet the needs of the communities we serve. Our commercial and retail banking network consists of multiple delivery channels including full-service banking offices, automated teller machines, telephone, and internet banking capabilities, including mobile
2
banking and remote deposit capture. We consider our competitive products and pricing, branch network, customer service, and financial position, as our major strengths in attracting and retaining customers in our market areas.
We face intense competition in our market areas both in making loans and attracting deposits. Our market areas have a high concentration of financial institutions, including large money center and regional banks, non-traditional banks, community banks, and credit unions. We face additional competition for deposits from money market funds, brokerage firms, mutual funds, and insurance companies. Some of our competitors offer products and services that we do not offer, such as trust services and private banking. In addition, competition has further intensified as a result of recent changes in regulation, and advances in technology and product delivery systems, and we face strong competition for our borrowers, depositors, and other customers from Financial Technology (“Fintech”) companies that provide innovative web-based solutions to traditional retail banking services and products. Fintech companies tend to have stronger operating efficiencies and less regulatory burdens than traditional banks.
Our deposit sources are primarily concentrated in the communities surrounding our branch offices in the New York counties of Richmond (Staten Island) and Kings (Brooklyn), and Hunterdon, Mercer, Middlesex and Union counties in New Jersey. As of June 30, 2017 (the latest date for which information is publicly available), we ranked fifth in deposit market share for Federal Deposit Insurance Corporation (FDIC) Insured Institutions in Staten Island with a 10.52% market share. As of that date, we had a 0.63% deposit market share in Brooklyn, New York, and a combined deposit market share of 1.23% in the Hunterdon, Mercer, Middlesex and Union counties in New Jersey.
The following table sets forth the unemployment rates for the communities we serve and the national average for the last five years, as published by the Bureau of Labor Statistics:
|
|
Unemployment Rate At December 31,
|
|||||||||||||
|
|
2017
|
2016
|
2015
|
2014
|
2013
|
|||||||||
|
Hunterdon County, NJ
|
3.1
|
%
|
3.1
|
%
|
3.3
|
%
|
4.2
|
%
|
4.6
|
%
|
||||
|
Mercer County, NJ
|
3.6
|
|
3.5
|
|
3.8
|
|
5.1
|
|
5.7
|
|
||||
|
Union County, NJ
|
4.2
|
|
4.3
|
|
4.7
|
|
6.2
|
|
6.9
|
|
||||
|
Middlesex County, NJ
|
3.5
|
|
3.6
|
|
3.9
|
|
5.2
|
|
6.1
|
|
||||
|
Richmond County, NY
|
3.8
|
|
4.4
|
|
5.2
|
|
6.3
|
|
7.9
|
|
||||
|
Kings County, NY
|
4.0
|
|
4.5
|
|
5.3
|
|
6.4
|
|
8.3
|
|
||||
|
National Average
|
4.1
|
|
4.7
|
|
5.0
|
|
5.6
|
|
6.7
|
|
||||
The following table sets forth median household income at
December 31, 2017
and
2016
, for the communities we serve, as published by the U.S. Census Bureau:
|
|
Median Household Income
|
||||||
|
|
At December 31,
|
||||||
|
|
2017
|
2016
|
|||||
|
Hunterdon County, NJ
|
$
|
112,337
|
|
$
|
113,676
|
|
|
|
Mercer County, NJ
|
76,922
|
|
73,343
|
|
|||
|
Union County, NJ
|
72,505
|
|
67,257
|
|
|||
|
Middlesex County, NJ
|
84,008
|
|
79,140
|
|
|||
|
Richmond County, NY
|
73,481
|
|
71,706
|
|
|||
|
Kings County, NY
|
50,530
|
|
49,716
|
|
|||
Lending Activities
Our principal lending activity is the origination of multifamily real estate loans and, to a lesser extent, other commercial real estate loans (typically on office, retail, and industrial properties), in New York City, New Jersey, and eastern Pennsylvania. We also originate one-to-four family residential real estate loans (non-owner occupied investment properties), construction and land loans, commercial and industrial loans, and home equity loans and lines of credit.
Loan Originations, Purchases, Sales, Participations, and Servicing.
All loans we originate are underwritten pursuant to our policies and procedures or are properly approved as exceptions to our policies and procedures. Our ability to originate fixed- or adjustable-rate loans is dependent on the relative demand for such loans, which is affected by various factors including
3
current market interest rates as well as anticipated future market interest rates. Our loan origination activity may be adversely affected by changes in economic conditions that result in decreased loan demand. Our home equity loans and lines of credit typically are generated through direct mail advertisements, newspaper advertisements, online applications through our website, and referrals from branch personnel. A significant portion of our multifamily real estate loans and other commercial real estate loans are generated with the use of third-party loan brokers. Our commercial and industrial loans typically are generated through our loan and business development officers and, to a lesser extent, referrals from accountants and other professional contacts. We generally retain in our portfolio all loans we originate and have historically only sold non-performing loans.
Loans acquired in an assisted transaction with the FDIC in 2011, and in the mergers with Flatbush Federal Bancorp, Inc. (2012) and Hopewell Valley (2016), with deteriorated credit quality, herein referred to as purchased credit-impaired (“PCI”) loans, have a carrying value of
$22.7 million
at
December 31, 2017
. The accounting and reporting for these loans differs substantially from those loans originated and classified as held-for-investment. For purposes of reporting, discussion and analysis, management has classified its loan portfolio into three categories: (1) PCI loans, which are held-for-investment, and initially valued at estimated fair value on the date of acquisition, with no initial related allowance for loan losses, (2) originated loans held-for-investment, which are carried at amortized cost, less net charge-offs and the allowance for loan losses, and (3) acquired loans with no evidence of credit deterioration, which are held-for-investment, and initially valued at an estimated fair value on the date of acquisition, with no initial related allowance for loan losses. PCI and acquired loans are periodically evaluated for impairment after their initial valuation and, if determined to be impaired, could have an associated allowance for loan losses.
Loan Approval Procedures and Authority
. Our lending activities follow written, non-discriminatory, underwriting standards approved by our board of directors. The loan approval process is intended to assess the borrower’s ability to repay the loan and the value of the collateral that will secure the loan, if any. To assess the borrower’s ability to repay, we review the borrower’s income and credit history, and information on the historical and projected income and expenses of the borrower.
In underwriting a loan secured by real property, we require an appraisal of the property by an independent licensed or certified appraiser approved by our board of directors. The appraisals of multifamily and other commercial real estate properties are also reviewed by an independent third-party appraiser. We review and inspect properties before disbursement of funds during the term of a construction loan. Generally, management obtains updated appraisals when a loan is deemed impaired. These appraisals may be more limited than those prepared for the underwriting of a new loan. In addition, when we acquire other real estate owned, we generally obtain a current appraisal to substantiate the net carrying value of the asset.
The board of directors maintains a loan committee consisting of bank directors to: periodically review and recommend for approval our policies related to lending as prepared by management; approve or reject loan applicants meeting certain criteria; and monitor loan quality including concentrations and certain other aspects of our lending functions, as applicable. Certain Northfield Bank officers, at levels beginning with vice president, have individual lending authority that is approved by the board of directors.
Loan Portfolio Composition.
The following table sets forth the composition of our loan portfolio, by type of loan, at the dates indicated, excluding loans held for sale of
$471,000
, at December 31, 2013. There were no loans held for sale at December 31, 2017, 2016, 2015, and 2014.
4
|
|
At December 31,
|
|||||||||||||||||||||||||||||||||
|
|
2017
|
2016
|
2015
|
2014
|
2013
|
|||||||||||||||||||||||||||||
|
|
Amount
|
Percent
|
Amount
|
Percent
|
Amount
|
Percent
|
Amount
|
Percent
|
Amount
|
Percent
|
||||||||||||||||||||||||
|
|
(Dollars in thousands)
|
|||||||||||||||||||||||||||||||||
|
Loans originated:
|
||||||||||||||||||||||||||||||||||
|
Real estate loans:
|
|
|
|
|
|
|||||||||||||||||||||||||||||
|
Multifamily
|
$
|
1,735,712
|
|
55.38
|
%
|
$
|
1,506,335
|
|
50.86
|
%
|
$
|
1,318,461
|
|
55.66
|
%
|
$
|
1,072,193
|
|
55.31
|
%
|
$
|
870,951
|
|
58.61
|
%
|
|||||||||
|
Commercial
|
445,225
|
|
14.20
|
|
412,667
|
|
13.93
|
|
402,073
|
|
16.97
|
|
390,288
|
|
20.13
|
|
340,174
|
|
22.89
|
|
||||||||||||||
|
One-to-four family residential
|
100,942
|
|
3.22
|
|
105,968
|
|
3.58
|
|
98,332
|
|
4.15
|
|
74,401
|
|
3.84
|
|
64,753
|
|
4.36
|
|
||||||||||||||
|
Home equity and lines of credit
|
66,254
|
|
2.11
|
|
65,437
|
|
2.21
|
|
61,413
|
|
2.59
|
|
54,533
|
|
2.81
|
|
46,231
|
|
3.11
|
|
||||||||||||||
|
Construction and land
|
34,545
|
|
1.10
|
|
14,065
|
|
0.47
|
|
18,652
|
|
0.79
|
|
21,412
|
|
1.10
|
|
14,152
|
|
0.95
|
|
||||||||||||||
|
Commercial and industrial loans
|
34,828
|
|
1.11
|
|
31,906
|
|
1.08
|
|
25,554
|
|
1.08
|
|
12,945
|
|
0.67
|
|
10,162
|
|
0.68
|
|
||||||||||||||
|
Other loans
|
1,430
|
|
0.05
|
|
1,497
|
|
0.05
|
|
2,256
|
|
0.10
|
|
2,157
|
|
0.12
|
|
2,310
|
|
0.16
|
|
||||||||||||||
|
Total loans originated
|
2,418,936
|
|
77.17
|
|
2,137,875
|
|
72.18
|
|
1,926,741
|
|
81.34
|
|
1,627,929
|
|
83.98
|
|
1,348,733
|
|
90.76
|
|
||||||||||||||
|
PCI loans
|
22,741
|
|
0.73
|
|
30,498
|
|
1.03
|
|
33,115
|
|
1.40
|
|
44,816
|
|
2.31
|
|
59,468
|
|
4.00
|
|
||||||||||||||
|
Loans acquired:
|
|
|
||||||||||||||||||||||||||||||||
|
Real estate loans:
|
||||||||||||||||||||||||||||||||||
|
One-to-four family residential
|
275,053
|
|
8.78
|
|
317,639
|
|
10.73
|
|
330,672
|
|
13.96
|
|
234,478
|
|
12.10
|
|
60,262
|
|
4.06
|
|
||||||||||||||
|
Multifamily
|
199,149
|
|
6.35
|
|
215,389
|
|
7.27
|
|
64,779
|
|
2.73
|
|
18,844
|
|
0.97
|
|
3,930
|
|
0.26
|
|
||||||||||||||
|
Commercial
|
163,962
|
|
5.23
|
|
188,001
|
|
6.35
|
|
11,160
|
|
0.47
|
|
11,999
|
|
0.62
|
|
13,254
|
|
0.89
|
|
||||||||||||||
|
Home equity and lines of credit
|
20,455
|
|
0.65
|
|
25,522
|
|
0.86
|
|
2,404
|
|
0.10
|
|
—
|
|
—
|
|
—
|
|
—
|
|
||||||||||||||
|
Construction and land
|
17,201
|
|
0.55
|
|
20,887
|
|
0.71
|
|
—
|
|
—
|
|
364
|
|
0.02
|
|
371
|
|
0.03
|
|
||||||||||||||
|
Commercial and industrial loans
|
16,946
|
|
0.54
|
|
25,443
|
|
0.86
|
|
—
|
|
—
|
|
—
|
|
—
|
|
—
|
|
—
|
|
||||||||||||||
|
Other loans
|
37
|
|
—
|
|
359
|
|
0.01
|
|
—
|
|
—
|
|
—
|
|
—
|
|
—
|
|
—
|
|
||||||||||||||
|
Total loans acquired
|
692,803
|
|
22.10
|
|
793,240
|
|
26.79
|
|
409,015
|
|
17.26
|
|
265,685
|
|
13.71
|
|
77,817
|
|
5.24
|
|
||||||||||||||
|
Total loans
|
$
|
3,134,480
|
|
100.00
|
%
|
$
|
2,961,613
|
|
100.00
|
%
|
$
|
2,368,871
|
|
100.00
|
%
|
$
|
1,938,430
|
|
100.00
|
%
|
$
|
1,486,018
|
|
100.00
|
%
|
|||||||||
|
Other items:
|
|
|
|
|
|
|
|
|
|
|
||||||||||||||||||||||||
|
Deferred loan costs (fees), net
|
6,339
|
|
|
6,471
|
|
|
4,844
|
|
|
4,565
|
|
|
3,458
|
|
|
|||||||||||||||||||
|
Allowance for loan losses
|
(26,160
|
)
|
|
(24,595
|
)
|
|
(24,770
|
)
|
|
(26,292
|
)
|
|
(26,037
|
)
|
|
|||||||||||||||||||
|
Net loans held-for-investment
|
$
|
3,114,659
|
|
$
|
2,943,489
|
|
$
|
2,348,945
|
|
$
|
1,916,703
|
|
$
|
1,463,439
|
|
|||||||||||||||||||
At
December 31, 2017
, PCI loans consisted of approximately
27%
commercial real estate loans and
50%
commercial and industrial loans, with the remaining balance in residential and home equity loans. At
December 31, 2016
, these loans consisted of approximately 30% commercial real estate loans and 48% commercial and industrial loans, with the remaining balance in residential and home equity loans. At
December 31, 2015
, these loans consisted of approximately 28% commercial real estate loans and 52% commercial and industrial loans, with the remaining balance in residential and home equity loans. At December 31, 2014, these loans consisted of approximately 33% commercial real estate loans and 53% commercial and industrial loans, with the remaining balance in residential and home equity loans. At December 31, 2013, these loans consisted of approximately 37% commercial real estate loans and 47% commercial and industrial loans, with the remaining balance in residential and home equity loans.
Loan Portfolio Maturities.
The following table summarizes the scheduled repayments of our loan portfolio and weighted average contractual rate by loan type at
December 31, 2017
. Demand loans (loans having no stated repayment schedule or maturity) and overdraft loans are reported as being due in the year ending December 31, 2018. Maturities are based on the final contractual payment date and do not reflect the effect of prepayments, repricing and scheduled principal amortization.
5
|
Originated Loans
|
|||||||||||||||||||||||||||
|
|
Multifamily
|
Commercial Real Estate
|
One-to-Four Family Residential
|
Home Equity and Lines of Credit
|
|||||||||||||||||||||||
|
|
Amount
|
Weighted Average Rate
|
Amount
|
Weighted Average Rate
|
Amount
|
Weighted Average Rate
|
Amount
|
Weighted Average Rate
|
|||||||||||||||||||
|
|
(Dollars in thousands)
|
||||||||||||||||||||||||||
|
Due during the years ending December 31,
|
|
|
|
|
|
|
|
|
|||||||||||||||||||
|
2018
|
$
|
272
|
|
4.96
|
%
|
$
|
1,120
|
|
6.61
|
%
|
$
|
651
|
|
5.41
|
%
|
$
|
139
|
|
3.25
|
%
|
|||||||
|
2019
|
308
|
|
5.50
|
%
|
1,670
|
|
5.59
|
%
|
171
|
|
5.01
|
%
|
463
|
|
3.36
|
%
|
|||||||||||
|
2020
|
7
|
|
7.00
|
%
|
24,348
|
|
4.75
|
%
|
347
|
|
6.00
|
%
|
752
|
|
3.43
|
%
|
|||||||||||
|
2021 to 2022
|
1,318
|
|
4.96
|
%
|
18,227
|
|
4.46
|
%
|
170
|
|
4.12
|
%
|
2,335
|
|
3.51
|
%
|
|||||||||||
|
2023 to 2027
|
82,088
|
|
3.79
|
%
|
22,695
|
|
4.30
|
%
|
3,526
|
|
4.52
|
%
|
12,986
|
|
3.67
|
%
|
|||||||||||
|
2028 to 2032
|
70,270
|
|
4.28
|
%
|
73,306
|
|
4.64
|
%
|
8,481
|
|
4.19
|
%
|
15,139
|
|
3.95
|
%
|
|||||||||||
|
2033 and beyond
|
1,581,449
|
|
3.57
|
%
|
303,859
|
|
4.15
|
%
|
87,596
|
|
3.87
|
%
|
34,440
|
|
3.91
|
%
|
|||||||||||
|
Total
|
$
|
1,735,712
|
|
3.61
|
%
|
$
|
445,225
|
|
4.30
|
%
|
$
|
100,942
|
|
3.94
|
%
|
$
|
66,254
|
|
3.85
|
%
|
|||||||
|
|
Construction and Land
|
Commercial and Industrial
|
Other
|
||||||||||||||||||||||||
|
|
Amount
|
Weighted Average Rate
|
Amount
|
Weighted Average Rate
|
Amount
|
Weighted Average Rate
|
|||||||||||||||||||||
|
|
(Dollars in thousands)
|
||||||||||||||||||||||||||
|
Due during the years ending December 31,
|
|
|
|
|
|
|
|||||||||||||||||||||
|
2018
|
$
|
12,913
|
|
5.33
|
%
|
$
|
11,530
|
|
4.72
|
%
|
$
|
1,213
|
|
0.13
|
%
|
|
|||||||||||
|
2019
|
13,678
|
|
5.10
|
%
|
3,273
|
|
4.89
|
%
|
—
|
|
—
|
|
|
||||||||||||||
|
2020
|
2,191
|
|
5.50
|
%
|
53
|
|
8.37
|
%
|
18
|
|
16.37
|
%
|
|
||||||||||||||
|
2021 to 2022
|
—
|
|
—
|
|
11,123
|
|
4.23
|
%
|
11
|
|
12.00
|
%
|
|
||||||||||||||
|
2023 to 2027
|
109
|
|
5.00
|
%
|
8,249
|
|
4.70
|
%
|
91
|
|
6.00
|
%
|
|
||||||||||||||
|
2028 to 2032
|
—
|
|
—
|
|
527
|
|
4.72
|
%
|
—
|
|
—
|
|
|
||||||||||||||
|
2033 and beyond
|
5,654
|
|
3.73
|
%
|
73
|
|
5.68
|
%
|
97
|
|
4.26
|
%
|
|
||||||||||||||
|
Total
|
$
|
34,545
|
|
4.99
|
%
|
$
|
34,828
|
|
4.58
|
%
|
$
|
1,430
|
|
1.08
|
%
|
|
|||||||||||
|
Acquired Loans
|
|||||||||||||||||||||||||||
|
|
One-to-Four-Family Residential
|
Multifamily
|
Commercial Real Estate
|
Home Equity and Lines of Credit
|
|||||||||||||||||||||||
|
|
Amount
|
Weighted Average Rate
|
Amount
|
Weighted Average Rate
|
Amount
|
Weighted Average Rate
|
Amount
|
Weighted Average Rate
|
|||||||||||||||||||
|
|
(Dollars in thousands)
|
||||||||||||||||||||||||||
|
Due during the years ending December 31,
|
|
|
|
|
|
|
|
|
|||||||||||||||||||
|
2018
|
$
|
1,628
|
|
4.53
|
%
|
$
|
15
|
|
7.00
|
%
|
$
|
1,534
|
|
4.91
|
%
|
$
|
445
|
|
4.18
|
%
|
|||||||
|
2019
|
2,355
|
|
4.79
|
%
|
6,144
|
|
3.34
|
%
|
4,922
|
|
4.77
|
%
|
1,020
|
|
4.46
|
%
|
|||||||||||
|
2020
|
174
|
|
4.55
|
%
|
85
|
|
7.50
|
%
|
2,491
|
|
5.06
|
%
|
817
|
|
3.41
|
%
|
|||||||||||
|
2021 to 2022
|
483
|
|
6.23
|
%
|
159
|
|
4.00
|
%
|
7,740
|
|
4.94
|
%
|
777
|
|
4.99
|
%
|
|||||||||||
|
2023 to 2027
|
8,657
|
|
3.96
|
%
|
188,851
|
|
3.23
|
%
|
33,472
|
|
4.27
|
%
|
6,401
|
|
4.51
|
%
|
|||||||||||
|
2028 to 2032
|
5,148
|
|
4.68
|
%
|
—
|
|
—
|
|
20,259
|
|
4.63
|
%
|
8,034
|
|
4.55
|
%
|
|||||||||||
|
2033 and beyond
|
256,608
|
|
2.95
|
%
|
3,895
|
|
4.33
|
%
|
93,544
|
|
4.79
|
%
|
2,961
|
|
4.12
|
%
|
|||||||||||
|
Total
|
$
|
275,053
|
|
3.05
|
%
|
$
|
199,149
|
|
3.26
|
%
|
$
|
163,962
|
|
4.68
|
%
|
$
|
20,455
|
|
4.43
|
%
|
|||||||
6
|
Acquired Loans (continued)
|
|||||||||||||||||||||||||||
|
|
Commercial and Industrial
|
Construction and Land
|
Other
|
||||||||||||||||||||||||
|
|
Amount
|
Weighted Average Rate
|
Amount
|
Weighted Average Rate
|
Amount
|
Weighted Average Rate
|
|||||||||||||||||||||
|
|
(Dollars in thousands)
|
||||||||||||||||||||||||||
|
Due during the years ending December 31,
|
|
|
|
|
|
|
|||||||||||||||||||||
|
2018
|
$
|
3,183
|
|
5.19
|
%
|
$
|
7,561
|
|
5.86
|
%
|
$
|
6
|
|
7.70
|
%
|
||||||||||||
|
2019
|
2,746
|
|
4.93
|
%
|
181
|
|
5.50
|
%
|
29
|
|
12.35
|
%
|
|||||||||||||||
|
2020
|
924
|
|
4.92
|
%
|
—
|
|
—
|
|
2
|
|
18.00
|
%
|
|||||||||||||||
|
2021 to 2022
|
2,932
|
|
4.89
|
%
|
256
|
|
5.00
|
%
|
—
|
|
—
|
|
|||||||||||||||
|
2023 to 2027
|
3,494
|
|
4.99
|
%
|
4,112
|
|
4.75
|
%
|
—
|
|
—
|
|
|||||||||||||||
|
2028 to 2032
|
392
|
|
4.75
|
%
|
—
|
|
—
|
|
—
|
|
—
|
|
|||||||||||||||
|
2033 and beyond
|
3,275
|
|
4.38
|
%
|
5,091
|
|
4.67
|
%
|
—
|
|
—
|
|
|||||||||||||||
|
Total
|
$
|
16,946
|
|
4.87
|
%
|
$
|
17,201
|
|
5.23
|
%
|
$
|
37
|
|
11.90
|
%
|
||||||||||||
|
|
PCI loans
|
Total Loans
|
|||||||||||
|
|
Amount
|
Weighted Average Rate
(1)
|
Amount
|
Weighted Average Rate
|
|||||||||
|
|
(Dollars in thousands)
|
||||||||||||
|
Due during the years ending December 31,
|
|
|
|
|
|||||||||
|
2018
|
$
|
2,969
|
|
24.80
|
%
|
$
|
45,179
|
|
6.36
|
%
|
|||
|
2019
|
1,894
|
|
22.65
|
%
|
38,854
|
|
5.58
|
%
|
|||||
|
2020
|
699
|
|
19.11
|
%
|
32,908
|
|
5.10
|
%
|
|||||
|
2021 to 2022
|
2,071
|
|
18.45
|
%
|
47,602
|
|
5.12
|
%
|
|||||
|
2023 to 2027
|
2,194
|
|
21.80
|
%
|
376,925
|
|
3.75
|
%
|
|||||
|
2028 to 2032
|
3,753
|
|
18.15
|
%
|
205,309
|
|
4.69
|
%
|
|||||
|
2033 and beyond
|
9,161
|
|
15.37
|
%
|
2,387,703
|
|
3.69
|
%
|
|||||
|
Total
|
$
|
22,741
|
|
18.68
|
%
|
$
|
3,134,480
|
|
3.86
|
%
|
|||
__________________________________
(1) Represents estimated accretable yield.
The following table summarizes fixed- and adjustable-rate loans at
December 31, 2017
, that are contractually due after
December 31, 2018
:
|
|
Due After December 31, 2018
|
||||||||||
|
|
Fixed Rate
|
Adjustable Rate
|
Total
|
||||||||
|
|
(Dollars in thousands)
|
||||||||||
|
Real estate loans:
|
|
|
|
||||||||
|
Multifamily
|
$
|
111,338
|
|
$
|
1,624,102
|
|
$
|
1,735,440
|
|
||
|
Commercial
|
47,380
|
|
396,725
|
|
444,105
|
|
|||||
|
One-to-four family residential
|
23,188
|
|
77,103
|
|
100,291
|
|
|||||
|
Construction and land
|
35
|
|
21,597
|
|
21,632
|
|
|||||
|
Home equity and lines of credit
|
36,063
|
|
30,052
|
|
66,115
|
|
|||||
|
Commercial and industrial loans
|
14,956
|
|
8,342
|
|
23,298
|
|
|||||
|
Other loans
|
217
|
|
—
|
|
217
|
|
|||||
|
PCI loans
|
3,522
|
|
16,250
|
|
19,772
|
|
|||||
|
Acquired loans
|
228,415
|
|
450,016
|
|
678,431
|
|
|||||
|
Total loans
|
$
|
465,114
|
|
$
|
2,624,187
|
|
$
|
3,089,301
|
|
||
At
December 31, 2017
, the Company had a total of
$2.39 billion
in loans due to mature in 2033 and beyond, of which $53.8 million, or 2.25%, are fixed rate loans.
7
Multifamily Real Estate Loans
.
Originated loans secured by multifamily properties totaled approximately
$1.74 billion
, or
55.4%
of our total loan portfolio, at
December 31, 2017
. We include in this category properties having more than four residential units and a business or businesses where the majority of space is utilized for residential purposes, which we refer to as mixed-use. At
December 31, 2017
, we had 913 originated multifamily real estate loans, with an average loan balance of approximately $1.9 million, although there are a large number of loans with balances substantially greater than this average. At
December 31, 2017
, our largest multifamily real estate loan had a principal balance of $30.8 million, was secured by four apartment buildings located in Staten Island, New York, and was performing in accordance with its original contractual terms. Substantially all of our multifamily real estate loans are secured by properties located in our primary market areas and eastern Pennsylvania.
Our multifamily real estate loans typically amortize over 20 to 30 years with negotiated interest rates that adjust after an initial five-, seven-, or 10-year period, and every five years thereafter. Adjustable-rate loan originations are generally tied to a specifically identified market rate index. We also originate, to a lesser extent, 10- to 15-year fixed-rate, fully amortizing loans. In general, our multifamily real estate loans have interest rate floors equal to the interest rate on the date the loan is originated, and have prepayment penalties should the loan be prepaid in the initial five-, seven-, or 10-year term. In addition, our multi-family loans may contain an initial interest-only period which typically does not exceed two years; however, these loans are underwritten on a fully amortizing basis. Loans that we have purchased typically adjust to different market rate indexes.
In underwriting multifamily real estate loans, we consider a number of factors, including the ratio of the projected net cash flow to the loan’s debt service requirement (generally requiring a minimum ratio of 120%, computed after deduction for a vacancy factor and property expenses we deem appropriate), the age and condition of the collateral, the financial resources and income of the sponsor, and the sponsor’s experience in owning or managing similar properties. Multifamily real estate loans generally are originated in amounts up to the lessor of 75% of the appraised value or the purchase price of the property securing the loan. We require title insurance, fire and extended coverage casualty insurance, and, if appropriate, flood insurance up to the regulatory required maximum in order to protect our security interest in the underlying property. Although a significant portion of our multifamily real estate loans are referred to us by third-party loan brokers, we underwrite all multifamily real estate loans in accordance with our underwriting standards. Due to competitor considerations, as is customary in our marketplace, we typically do not obtain personal guarantees of the principals on multifamily real estate loans, except when warranted.
The repayment of loans secured by multifamily real estate properties typically depends on the successful operation of the property. If the cash flow from the property is reduced, or interest payments on the loan increase, the borrower’s ability to repay the loan may be impaired.
In a ruling that was contrary to a 1996 advisory opinion from the New York State Division of Housing and Community Renewal that owners of housing units who benefited from the receipt of “J-51” tax incentives under the Rent Stabilization Law are eligible to decontrol apartments, the New York State Court of Appeals ruled in 2009, that residential housing units located in two major housing complexes in New York City had been illegally decontrolled by the current and previous property owners. This ruling may subject other property owners that have previously or are currently benefiting from a J-51 tax incentive to litigation, possibly resulting in a significant reduction to property cash flows. Based on management’s assessment of our multifamily loan portfolio, we believe that six loans may be affected by the ruling regarding J-51. These loans had an aggregate principal balance of $57.5
million at
December 31, 2017
, and were all performing in accordance with their original contractual terms at that date.
The following table summarizes our variable-interest multifamily loan repricing (including originated and acquired loans, excluding PCI loans) at December 31, 2017 (dollars in thousands):
|
Amount
|
Weighted Average Rate
|
|||||
|
2018
|
$
|
42,662
|
|
3.74
|
%
|
|
|
2019
|
195,358
|
|
3.56
|
%
|
||
|
2020
|
192,397
|
|
3.48
|
%
|
||
|
2021 to 2022
|
667,488
|
|
3.56
|
%
|
||
|
2023 to 2027
|
642,475
|
|
3.59
|
%
|
||
|
2028 to 2032
|
20,409
|
|
4.02
|
%
|
||
|
$
|
1,760,789
|
|
3.57
|
%
|
||
Commercial Real Estate Loans.
Originated commercial real estate loans (other than multifamily real estate loans) totaled
$445.2 million
, or
14.2%
of our loan portfolio as of
December 31, 2017
. At
December 31, 2017
, our originated
8
commercial real estate loan portfolio consisted of 397 loans with an average loan balance of approximately $1.1 million, although there are a large number of loans with balances substantially greater than this average. At
December 31, 2017
, our largest commercial real estate loan had a principal balance of $20.5 million, was secured by a mall with two small retail buildings located in New Jersey, and was performing in accordance with its original contractual terms. Substantially all of our commercial real estate loans are secured by properties located in our primary market areas.
The following table sets forth the property types collateralizing our originated commercial real estate loans as of
December 31, 2017
:
|
|
At December 31, 2017
|
|||||
|
|
Amount
|
Percent
|
||||
|
|
(Dollars in thousands)
|
|||||
|
Mixed use (majority of space is non-residential)
|
$
|
123,408
|
|
27.7
|
%
|
|
|
Retail
|
114,432
|
|
25.7
|
|
||
|
Office buildings
|
85,886
|
|
19.3
|
|
||
|
Warehousing
|
17,905
|
|
4.0
|
|
||
|
Accommodations
|
21,230
|
|
4.8
|
|
||
|
Services
|
19,532
|
|
4.4
|
|
||
|
Healthcare facilities
|
34,005
|
|
7.6
|
|
||
|
Manufacturing
|
4,738
|
|
1.1
|
|
||
|
Restaurant
|
6,615
|
|
1.5
|
|
||
|
Schools/day care
|
5,424
|
|
1.2
|
|
||
|
Recreational
|
3,332
|
|
0.7
|
|
||
|
Other
|
8,718
|
|
2.0
|
|
||
|
|
$
|
445,225
|
|
100.0
|
%
|
|
Our commercial real estate loans typically amortize over 20 to 25 years with negotiated interest rates that adjust after an initial five-, seven-, or 10-year period, and every five years thereafter. Adjustable-rate loan originations are generally tied to a specifically identified market rate index. We also originate, to a lesser extent, 10- to 15-year fixed-rate, fully amortizing loans. In general, our commercial real estate loans have interest rate floors equal to the interest rate on the date the loan is originated, and generally have prepayment penalties if the loan is repaid in the initial five-, seven-, or 10-year term. Loans that we have purchased typically adjust to different market indexes.
In underwriting commercial real estate loans, we generally lend up to the lesser of 75% of either the property’s appraised value or purchase price. Our policies permit the origination of certain single-use property types but at lower loan-to-appraised value ratios. We base our decision to lend primarily on the economic viability of the property and the creditworthiness of the borrower. In evaluating a proposed commercial real estate loan, we emphasize the ratio of the property’s projected net cash flow to the loan’s debt service requirement (generally requiring a minimum ratio of 125%, computed after deduction for a vacancy factor and property expenses we deem appropriate). Personal guarantees of the principals are typically obtained. We require title insurance, fire and extended coverage casualty insurance, and, if appropriate, flood insurance up to the regulatory required maximum amount in order to protect our security interest in the underlying property. Although a significant portion of our commercial real estate loans were referred to us by third-party loan brokers, we underwrite all commercial real estate loans in accordance with our underwriting standards.
Commercial real estate loans generally carry higher interest rates than multifamily residential real estate loans. Commercial real estate loans also generally have greater credit risk compared to multifamily residential real estate loans, as they typically involve larger loan balances concentrated with single borrowers or groups of related borrowers. Changes in economic conditions that are not in the control of the borrower or lender may affect the value of the collateral for the loan or the future cash flow of the property. Additionally, any decline in real estate values may be more pronounced for commercial real estate than for multifamily residential properties.
Construction and Land Loans.
At
December 31, 2017
, originated construction and land loans totaled
$34.5 million
, or
1.1%
of total loans receivable, and the additional unadvanced portion of these construction loans totaled $21.7 million. At
December 31, 2017
, we had 37 originated construction and land loans with an average loan balance of approximately $936,000 and our largest construction and land loan had a principal balance of $5.2 million and is secured by a 108 unit town home development in New Jersey. At
December 31, 2017
, this loan was performing in accordance with its original contractual terms.
9
Our construction and land loans typically are interest-only loans with interest rates that are tied to the prime rate as published in
The Wall Street Journal
. Margins generally range from zero basis points to 200 basis points above the prime rate. We also originate, to a lesser extent, 10- to 15-year fixed-rate, fully amortizing land loans. In general, our construction and land loans have interest rate floors equal to the interest rate on the date the loan is originated, and we do not typically charge prepayment penalties.
We grant construction and land loans to experienced developers for the construction of single-family residences, including condominiums, and commercial properties. Construction and land loans also are made to individuals for the construction of their personal residences. Advances on construction loans are made in accordance with a schedule reflecting the cost of construction, but are generally limited to a loan-to-completed appraised value ratio of 70%. Repayment of construction loans on residential properties normally is expected from the sale of units to individual purchasers, or in the case of individuals building their own residences, with a permanent mortgage. In the case of income-producing property, repayment usually is expected from permanent financing upon completion of construction. We typically offer permanent mortgage financing on our construction loans only on income-producing properties.
Land loans also help finance the purchase of land intended for future development, including single-family housing, multifamily housing, and commercial property. In some cases, we may make an acquisition loan before the borrower has received municipal approvals to develop the land. In general, the maximum loan-to-value ratio for land acquisition loans is 50% of the appraised value of the property, and the maximum term of these loans is three years. Generally, if the maturity of the loan exceeds three years, the loan must be an amortizing loan.
Construction and land loans generally carry higher interest rates and have shorter terms than multifamily and commercial real estate loans. Construction and land loans have greater credit risk than long-term financing on improved, income-producing real estate. Risk of loss on a construction loan depends largely upon the accuracy of the initial estimate of the real estate value at completion of construction as compared to the estimated cost (including interest) of construction and other assumptions. If the estimate of construction costs is inaccurate, we may decide to advance additional funds beyond the amount originally committed in order to protect our security interest in the underlying property. However, if the estimated value of the completed project is inaccurate, the borrower may hold the real estate with a value that is insufficient to assure full repayment of the construction loan upon its sale. In the event we make a land acquisition loan on real estate that is not yet approved for the planned development, there is a risk that approvals will not be granted or will be delayed. Construction loans also expose us to a risk that improvements will not be completed on time in accordance with specifications and projected costs. In addition, the ultimate sale or rental of the real estate may not occur as anticipated and the market value of collateral, when completed, may be less than the outstanding loans and there may be no permanent financing available upon completion. Substantially all of our construction and land loans are secured by real estate located in our primary market areas.
Commercial and Industrial Loans
.
At
December 31, 2017
, originated commercial and industrial loans totaled
$34.8 million
or
1.1%
of the total loan portfolio and the additional unadvanced portion of these commercial and industrial loans totaled $22.0 million. As of
December 31, 2017
, we had 176 originated commercial and industrial loans with an average loan balance of approximately $198,000, although we originate these types of loans in amounts substantially greater than this average. At
December 31, 2017
, our largest commercial and industrial loan had a principal balance of $5.0 million and was performing in accordance with its original contractual terms.
Our commercial and industrial loans typically amortize over 10 years with interest rates that are indexed to the prime rate as published in
The Wall Street Journal
. Margins generally range from zero basis points to 300 basis points above the prime rate. We also originate, to a lesser extent, 10-year fixed-rate, fully amortizing loans. In general, our commercial and industrial loans have interest rate floors equal to the interest rate on the date the loan is originated and have prepayment penalties.
We make various types of secured and unsecured commercial and industrial loans for the purpose of working capital and other general business purposes. The terms of these loans generally range from less than one year to a maximum of 15 years. The loans either are negotiated on a fixed-rate basis or carry adjustable interest rates indexed to the prime rate as published in
The Wall Street Journal
.
Commercial credit decisions are based on our credit assessment of the applicant. We evaluate the applicant’s ability to repay in accordance with the proposed terms of the loan and assess the risks involved. Personal guarantees of the principals are typically obtained. In addition to evaluating the loan applicant’s financial statements, we consider the adequacy of the secondary sources of repayment for the loan, such as pledged collateral and the financial stability of the guarantors. Credit agency reports of each guarantor’s personal credit history supplement our analysis of the applicant’s creditworthiness. We also
10
attempt to confirm with other banks and conduct trade investigations as part of our credit assessment of the borrower. Collateral securing a loan also is analyzed to determine its marketability.
Commercial and industrial loans generally carry higher interest rates than multifamily and commercial real estate loans of like maturity because they have a higher risk of default since their repayment generally depends on the successful operation of the borrowers’ business.
One-to-Four Family Residential
Real Estate Loans.
At
December 31, 2017
, we had 251 originated one-to-four family residential real estate loans outstanding with an aggregate balance of
$100.9 million
, or
3.2%
of our total loan portfolio. As of
December 31, 2017
, the average balance of originated one-to-four family residential real estate loans was approximately $408,000, although we have originated this type of loan in amounts substantially greater than this average. At
December 31, 2017
, our largest loan of this type had a principal balance of $4.8 million, was collateralized by 48 two-bedroom individual condominiums, each with a separate assessment, and was performing in accordance with its original contractual terms. We no longer offer loans secured by owner-occupied, one-to-four family residential real estate loans.
We historically have not offered “interest-only” mortgage loans on one-to-four family residential real estate properties, where the borrower pays interest for an initial period, after which the loan converts to a fully amortizing loan. However, since 2014 we have purchased pools of one-to-four family residential real estate loans, a substantial amount of which are interest-only mortgage loans. For further details on these purchases, see the
“Acquired Loans”
discussion below. We also historically have not offered loans that provide for negative amortization of principal, such as “Option ARM” loans, where the borrower can pay less than the interest owed on the loan, resulting in an increased principal balance during the life of the loan.
Home Equity Loans and Lines of Credit.
At
December 31, 2017
, we had 1,226 originated home equity loans and lines of credit with an aggregate outstanding balance of
$66.3 million
, or
2.1%
of our total loan portfolio. Of this total, outstanding home equity lines of credit totaled $30.1 million, or 1.0%, of our total loan portfolio and home equity loans totaled $36.2 million, or 1.2%, of our total loan portfolio. At
December 31, 2017
, the average originated home equity loan and line of credit balance was approximately $55,000, although we originate these types of loans in amounts substantially greater than this average. At
December 31, 2017
, our largest outstanding home equity line of credit was $501,000 and was performing in accordance with its original contractual terms. At
December 31, 2017
, our largest outstanding home equity loan was $430,000 and was performing in accordance with its original contractual terms.
We offer home equity loans and home equity lines of credit that are secured by the borrower’s primary residence or second home. Home equity lines of credit are adjustable-rate loans tied to the prime rate as published in
The Wall Street Journal
adjusted for a margin, and have a maximum term of 20 years during which time the borrower is required to make principal payments based on a 20-year amortization. Home equity lines generally have interest rate floors and ceilings. The borrower is permitted to draw against the line during the entire term on originations occurring prior to June 15, 2011. For home equity loans originated beginning June 15, 2011, the borrower is only permitted to draw against the line for the initial 10 years. Our home equity loans typically are fully amortizing with fixed terms to 20 years. Home equity loans and lines of credit generally are underwritten with the same criteria we use to underwrite fixed-rate, one-to-four family residential real estate loans. Home equity loans and lines of credit may be underwritten with a loan-to-value ratio of 80% when combined with the principal balance of the existing mortgage loan. We appraise the property securing the loan at the time of the loan application to determine the value of the property. At the time we close a home equity loan or line of credit, we record a mortgage to perfect our security interest in the underlying collateral.
PCI Loans.
PCI loans are accounted for in accordance with Accounting Standards Codification (ASC) Subtopic 310-30, “Loans and Debt Securities Acquired with Deteriorated Credit Quality,” since all of these loans were acquired at a discount attributable, at least in part, to credit quality. PCI loans are initially recorded at fair value (as determined by the present value of expected future cash flows) with no valuation allowance (i.e., allowance for loan losses). Under ASC Subtopic 310-30, the PCI loans are aggregated and accounted for as pools of loans based on common risk characteristics. PCI loans had a carrying balance of approximately
$22.7 million
at
December 31, 2017
, or
0.7%
of our total loan portfolio. At
December 31, 2017
, PCI loans consisted of approximately
27%
commercial real estate loans and
50%
commercial and industrial loans, with the remaining balance in residential and home equity loans. At
December 31, 2017
, 10.8% of PCI loans were past due 30 to 89 days, and 17.1% were past due 90 days or more.
The difference between the undiscounted cash flows expected at acquisition and the investment in the PCI loans, or the “accretable yield,” is recognized as interest income utilizing the level-yield method over the life of the loans in each pool. Contractually required payments of interest and principal that exceed the undiscounted cash flows expected at acquisition, or the “non-accretable difference,” are not recognized as a yield adjustment or as a loss accrual or a valuation allowance. Increases in expected cash flows subsequent to the acquisition are recognized prospectively through an adjustment of the yield on the
11
pool over its remaining life, while decreases in expected cash flows are recognized as impairment through a loss provision and an increase in the allowance for loan losses.
Acquired Loans.
Loans acquired, with no evidence of credit deterioration, are held-for-investment and initially valued at estimated fair value on the date of acquisition, with no initial related allowance for loan losses. These loans are evaluated for impairment on a quarterly basis as part of our analysis of the allowance for loan losses. During 2017, the Company purchased loan pools consisting primarily of one-to-four family residential and multifamily loans, totaling $63.6 million.
The following table provides the details of the loans purchased during the year ended
December 31, 2017
(dollars in thousands):
|
Principal Amounts Purchased
|
Loan Type
|
Weighted Average Interest Rate
(1)
|
Weighted Average Loan-to-Value Ratio
(2)
|
Weighted Average Months to Next Rate Change or Maturity for Fixed Rate Loans
|
(F)ixed or (V)ariable
|
Amortization Term
|
||||||||
|
$
|
29,286
|
|
Residential
|
2.89%
|
57%
|
1
|
V
|
30 Years
|
||||||
|
4,812
|
|
Residential
|
3.46%
|
62%
|
286
|
F
|
15-30 Years
|
|||||||
|
18,774
|
|
Multifamily
|
3.35%
|
55%
|
53
|
V
|
30 Years
|
|||||||
|
3,399
|
|
Multifamily
|
3.40%
|
58%
|
46
|
F
|
30 Years
|
|||||||
|
7,280
|
|
Multifamily
|
3.35%
|
51%
|
58
|
V
|
30 Years
|
|||||||
|
$
|
63,551
|
|
3.15%
|
56%
|
||||||||||
(1) Net of servicing fee retained by the originating bank.
(2) At time of purchase.
The geographic locations of the properties securing the above loans are as follows: 55.3% in New York, 15.9% in New Jersey, 9.2% in California, and 19.6% in other states.
During 2016, the Company acquired $342.6 million of loans as part of the Hopewell Valley acquisition, and in addition, we also purchased loan pools, primarily multifamily loans, totaling $165.9 million. The following table provides the details of the loans purchased during the year ended December 31, 2016 (dollars in thousands):
|
Principal Amounts Purchased
|
Loan Type
|
Weighted Average Interest Rate
(1)
|
Weighted Average Loan-to-Value Ratio
(2)
|
Weighted Average Months to Next Rate Change or Maturity for Fixed Rate Loans
|
(F)ixed or (V)ariable
|
Amortization Term
|
||||||||
|
$
|
82,242
|
|
Multifamily
|
2.93%
|
49%
|
33
|
V
|
30 Years
|
||||||
|
43,562
|
|
Multifamily
|
2.91%
|
52%
|
42
|
V
|
30 Years
|
|||||||
|
27,415
|
|
Multifamily
|
3.98%
|
30%
|
120
|
F
|
||||||||
|
4,883
|
|
Residential
|
3.35%
|
65%
|
76
|
V
|
30 Years
|
|||||||
|
7,760
|
|
Commercial Real Estate
|
2.85%
|
66%
|
30
|
V
|
30 Years
|
|||||||
|
$
|
165,862
|
|
3.11%
|
45%
|
||||||||||
(1) Net of servicing fee retained by the originating bank.
(2) At time of purchase.
The properties securing the above loans are primarily located in New York State.
The following table provides the details of the one-to-four family residential loans purchased in 2015 (dollars in thousands):
|
Principal Amounts Purchased
|
Weighted Average Interest Rate
(1)
|
Weighted Average Loan-to-Value Ratio
|
Weighted Average Months to Next Rate Change
|
Amortization Term
|
Amortization Type
|
|||||||
|
$
|
49,345
|
|
2.49%
|
62%
|
44
|
30 Years
|
Fully amortizing
|
|||||
|
78,086
|
|
2.38%
|
59%
|
35
|
20 Years
(2)
|
Delayed amortizing
|
||||||
|
$
|
127,431
|
|
2.42%
|
60%
|
||||||||
(1) Net of servicing fee retained by the originating bank
(2) 20 years of amortization begins after an interest-only period for the first 10 years
12
Of the total loans purchased in the table above, $78.1 million, or 61%, are interest-only for the first 10 years and will re-price in less than five years at one-month LIBOR plus a weighted average margin of 1.6%; a floor rate also is included in the terms. The remainder of the loan pool is scheduled to make principal and interest payments and will re-price in less than five years at one-month LIBOR plus a weighted average margin of 1.9%, also with a floor rate included in the terms. The properties securing the loans (by state) are located as follows: 62.5% in New York, 22.2% in Massachusetts, and 15.3% in other states.
The multifamily loans purchased in 2015 had a weighted average interest rate of 3.37%, a weighted average loan-to-value ratio of 41.1%, with terms of 10 to 15 years and amortization ranging from 15 to 30 years at December 31, 2015. The properties securing these loans are located in New York State.
At
December 31, 2017
, acquired loans totaled
$692.8 million
and consisted of
39.7%
one-to-four family residential loans,
28.7%
multifamily loans, and
23.7%
commercial real estate loans, with the remaining balance in home equity, construction and land, and commercial and industrial loans. At December 31, 2016, acquired loans totaled $793.2 million and consisted of 40.0% one-to-four family residential loans, 27.2% multifamily loans, and 23.7% commercial real estate loans, with the remaining balance in home equity, construction and land, and commercial and industrial loans. At December 31, 2015, acquired loans totaled $409.0 million and consisted of 80.8% one-to-four family residential loans and 15.8% multifamily loans, with the remaining balance in commercial real estate and home equity loans.
Non-Performing and Problem Assets
When a loan is between 10 to 15 days delinquent, we generally send the borrower a late charge notice. When a loan is 30 days past due, we generally mail the borrower a letter reminding the borrower of the delinquency and, except for loans secured by one-to-four family residential real estate, we attempt personal contact with the borrower to determine the reason for the delinquency, to ensure the borrower correctly understands the terms of the loan, and to emphasize the importance of making payments on or before the due date. If necessary, additional late charges and delinquency notices are issued and the account will be monitored. After 90 days of delinquency, we generally send the borrower a final demand for payment and refer the loan to legal counsel to commence foreclosure and related legal proceedings. At times, we may shorten or lengthen these time frames.
Generally, loans (excluding PCI loans) are placed on non-accrual status when payment of principal or interest is 90 days or more delinquent unless the loan is considered well-secured and in the process of collection. Loans also are placed on non-accrual status at any time if the ultimate collection of principal or interest in full is in doubt. When loans are placed on non-accrual status, unpaid accrued interest is reversed, and further income is recognized only to the extent received, and only if the principal balance is deemed fully collectible. The loan may be returned to accrual status if both principal and interest payments are brought current and factors indicating doubtful collection no longer exist, including performance by the borrower under the loan terms for a six-month period. Our Chief Credit Officer reports monitored loans, including all loans rated watch, special mention, substandard, doubtful or loss, to the loan committee of the board of directors at least quarterly.
To minimize our losses on delinquent loans we work with borrowers experiencing financial difficulties and will consider modifying existing loan terms and conditions that we would not otherwise consider, commonly referred to as troubled debt restructurings (“TDR”). We record an impairment loss associated with TDRs, if any, based on the present value of expected future cash flows discounted at the original loan’s effective interest rate or the underlying collateral value, less cost to sell, if the loan is collateral dependent. Once an obligation has been restructured because of credit problems, it continues to be considered restructured until paid in full or, if the obligation yields a market rate (a rate equal to or greater than the rate we were willing to accept at the time of the restructuring for a new loan with comparable risk), until the year subsequent to the year in which the restructuring takes place, provided the borrower has performed under the modified terms for a consecutive six-month period.
PCI loans are subject to the same internal and external credit review process as non-PCI loans. If and when unexpected credit deterioration occurs at the loan pool level subsequent to the acquisition date, a provision for credit losses for PCI loans will be charged to earnings for the full amount of the decline in the discounted expected cash flows for the pool. Under the accounting guidance of ASC Subtopic 310-30, for acquired credit-impaired loans, the allowance for loan losses on PCI loans is measured at each financial reporting date based on future expected cash flows. This assessment and measurement is performed at the pool level and not at the individual loan level. Accordingly, decreases in expected cash flows resulting from further credit deterioration on a pool of acquired PCI loan pools as of such measurement date compared to those originally estimated are recognized by recording a provision and allowance for credit losses on PCI loans. Subsequent increases in the expected cash flows of the loans in that pool would first reduce any allowance for loan losses on PCI loans, and any excess will be accreted prospectively as a yield adjustment.
13
We consider our PCI loans to be performing due to the application of the yield accretion method under ASC Subtopic 310-30. ASC Subtopic 310-30 allows us to aggregate credit-impaired loans acquired in the same fiscal quarter into one or more pools, provided that the loans have common risk characteristics. A pool is then accounted for as a single asset with a single composite interest rate and an aggregate expectation of cash flows. Accordingly, loans that may have been classified as non-performing loans are no longer classified as non-performing because, at the respective dates of acquisition, we believed that we would fully collect the new carrying value of these loans. The new carrying value represents the contractual balance, reduced by the portion expected to be uncollectible (referred to as the non-accretable difference) and by an accretable yield (discount) that is recognized as interest income. Management’s judgment is required in reclassifying loans subject to ASC Subtopic 310-30 as performing loans, and is dependent on having a reasonable expectation about the timing and amount of the cash flows to be collected, even if a loan is contractually past due.
Non-Performing and Restructured Loans
(excluding PCI Loans).
The table below sets forth the amounts and categories of our non-performing assets at the dates indicated. At
December 31, 2017
,
2016
,
2015
,
2014
, and
2013
, we had TDRs of
$251,000
, $1.8 million, $4.4 million, $9.5 million, and $10.7 million, respectively, which are included in the appropriate categories within non-accrual loans. Additionally, we had
$18.0 million
, $20.6 million, $22.3 million, $24.2 million, and $26.2 million, of TDRs on accrual status at
December 31, 2017
,
2016
,
2015
,
2014
, and
2013
, respectively, which do not appear in the table below. Generally, the types of concessions that we make to troubled borrowers include reductions in interest rates and payment extensions and to a lesser extent interest and principal forgiveness. At
December 31, 2017
, 72.7% of TDRs were commercial real estate loans, 18.5% were one-to-four family residential loans, 7.9% were multifamily loans, 0.5% were commercial and industrial loans, and 0.4% were home equity loans. At
December 31, 2017
, all of the
$18.0 million
in accruing TDR loans were performing in accordance with their restructured terms. At
December 31, 2017
, one loan totaling $251,000, secured by real estate, accounted for 100% of the non-accruing TDRs not performing in accordance with restructured terms.
|
|
At December 31,
|
||||||||||||||||||
|
|
2017
|
2016
|
2015
|
2014
|
2013
|
||||||||||||||
|
|
(Dollars in thousands)
|
||||||||||||||||||
|
Non-accrual loans:
|
|
|
|
|
|||||||||||||||
|
Real estate loans:
|
|
|
|
|
|||||||||||||||
|
Commercial
|
$
|
4,087
|
|
$
|
5,513
|
|
$
|
5,232
|
|
$
|
11,164
|
|
$
|
12,450
|
|
||||
|
One-to-four family residential
|
774
|
|
1,629
|
|
2,574
|
|
2,205
|
|
2,989
|
|
|||||||||
|
Construction and land
|
—
|
|
—
|
|
113
|
|
—
|
|
108
|
|
|||||||||
|
Multifamily
|
417
|
|
43
|
|
559
|
|
—
|
|
544
|
|
|||||||||
|
Home equity and lines of credit
|
156
|
|
127
|
|
329
|
|
98
|
|
1,239
|
|
|||||||||
|
Commercial and industrial loans
|
74
|
|
9
|
|
—
|
|
408
|
|
441
|
|
|||||||||
|
Total non-accrual loans
|
5,508
|
|
7,321
|
|
8,807
|
|
13,875
|
|
17,771
|
|
|||||||||
|
Loans delinquent 90 days or more and still accruing:
|
|
|
|
|
|||||||||||||||
|
Real estate loans:
|
|
|
|
|
|||||||||||||||
|
One-to-four family residential
|
27
|
|
52
|
|
—
|
|
708
|
|
—
|
|
|||||||||
|
Home equity and lines of credit
|
—
|
|
8
|
|
—
|
|
—
|
|
—
|
|
|||||||||
|
Other
|
1
|
|
—
|
|
—
|
|
—
|
|
32
|
|
|||||||||
|
Commercial and industrial loans
|
—
|
|
—
|
|
15
|
|
—
|
|
—
|
|
|||||||||
|
Total loans delinquent 90 days or more and still accruing
|
28
|
|
60
|
|
15
|
|
708
|
|
32
|
|
|||||||||
|
Total non-performing loans
|
5,536
|
|
7,381
|
|
8,822
|
|
14,583
|
|
17,803
|
|
|||||||||
|
Other real estate owned
|
850
|
|
850
|
|
45
|
|
752
|
|
634
|
|
|||||||||
|
Total non-performing assets
|
$
|
6,386
|
|
$
|
8,231
|
|
$
|
8,867
|
|
$
|
15,335
|
|
$
|
18,437
|
|
||||
|
Ratios:
|
|
|
|
|
|||||||||||||||
|
Non-performing loans to total loans held-for-investment, net
|
0.18
|
%
|
0.25
|
%
|
0.37
|
%
|
0.75
|
%
|
1.20
|
%
|
|||||||||
|
Non-performing assets to total assets
|
0.16
|
%
|
0.21
|
%
|
0.28
|
%
|
0.51
|
%
|
0.68
|
%
|
|||||||||
|
Total assets
|
$
|
3,991,417
|
|
$
|
3,850,094
|
|
$
|
3,202,584
|
|
$
|
3,020,869
|
|
$
|
2,702,764
|
|
||||
|
Loans held-for-investment, net
|
$
|
3,140,819
|
|
$
|
2,968,084
|
|
$
|
2,373,715
|
|
$
|
1,942,995
|
|
$
|
1,489,476
|
|
||||
14
At
December 31, 2017
, 10.8% of PCI loans were past due 30 to 89 days, and 17.1% were past due 90 days or more. At
December 31, 2016
, 6.6% of PCI loans were past due 30 to 89 days, and 19.3% were past due 90 days or more. At December 31, 2015, 7.9% of PCI loans were past due 30 to 89 days, and 21.4% were past due 90 days or more. At December 31, 2014, 7.8% of PCI loans were past due 30 to 89 days, and 24.1% were past due 90 days or more. At December 31, 2013, 6.6% of PCI loans were past due 30 to 89 days, and 14.9% were past due 90 days or more.
The following table sets forth the property types collateralizing non-accrual commercial real estate loans at
December 31, 2017
:
|
|
At December 31, 2017
|
|||||
|
|
Amount
|
Percent
|
||||
|
|
(Dollars in thousands)
|
|||||
|
Industrial
|
$
|
2,253
|
|
55.1
|
%
|
|
|
Mixed use
|
1,088
|
|
26.6
|
|
||
|
Office buildings
|
543
|
|
13.3
|
|
||
|
Other
|
202
|
|
5.0
|
|
||
|
Total
|
$
|
4,086
|
|
100.0
|
%
|
|
Other Real Estate Owned
.
Real estate acquired by us as a result of foreclosure or by deed in lieu of foreclosure is classified as other real estate owned. On the date the property is acquired, it is recorded at the lower of cost or estimated fair value, establishing a new cost basis. Estimated fair value generally represents the sale price a buyer would be willing to pay on the basis of current market conditions, including normal terms from other financial institutions, less the estimated costs to sell the property. Holding costs and declines in estimated fair value result in charges to expense after acquisition. Other real estate owned consisted of one commercial real estate property with a carrying value of
$850,000
at
December 31, 2017
and
December 31, 2016
.
Potential Problem Loans and Classification of Assets.
Our loan officers and credit administration department monitor their loan portfolios, including evaluation of borrowers’ business operations, current financial condition, underlying values of any collateral, and assessment of their financial prospects in the current economic environment. Based on these evaluations, we determine an appropriate strategy for individual potential problem loans, with the objective of maximizing the recovery of the related loan balances.
Our policies, consistent with regulatory guidelines, provide for the classification of loans and other assets that are considered to be of lesser quality as substandard, doubtful, or loss assets. An asset is classified substandard if it is inadequately protected by the current net worth and paying capacity of the obligor or of the collateral pledged, if any. Substandard assets include those assets characterized by the distinct possibility that we will sustain some loss if the deficiencies are not corrected. Assets classified as doubtful have all of the weaknesses inherent in those classified substandard with the added characteristic that the weaknesses present make collection or liquidation in full, on the basis of currently existing facts, conditions and values, highly questionable and improbable. Assets (or portions of assets) classified as loss are those considered uncollectible and of such little value that their continuance as assets is not warranted. Assets that do not expose us to risk sufficient to warrant classification in one of the aforementioned categories, but which possess potential weaknesses that deserve our close attention, are designated as special mention. At
December 31, 2017
, classified assets, excluding loans on non-accrual status, consisted of substandard assets of $17.3 million and no doubtful or loss assets. At
December 31, 2017
, we also had $6.5 million of assets designated as special mention. At
December 31, 2016
, classified assets, excluding loans on non-accrual status, consisted of substandard assets of $26.1 million and no doubtful or loss assets. At
December 31, 2016
, we also had $11.5 million of assets designated as special mention.
Our determination as to the classification of our assets (and the amount of our loss allowances) is subject to review by our principal federal regulator, the OCC, which can require that we adjust our classification and related loss allowances. We regularly review our asset portfolio to determine whether any assets require classification in accordance with applicable regulations. We also engage the services of a third party to review, on a sample basis, our risk ratings on a semi-annual basis.
At
December 31, 2017
, the Company had
$12.0 million
of accruing loans that were 30 to 89 days delinquent, as compared to
$10.1 million
at
December 31, 2016
.
15
The following table sets forth the total amounts of delinquencies for accruing loans that were 30 to 89 days past due by type and by amount at the dates indicated:
|
|
December 31,
|
||||||
|
|
2017
|
2016
|
|||||
|
|
(Dollars in thousands)
|
||||||
|
Real estate loans:
|
|
|
|||||
|
Commercial
|
$
|
4,347
|
|
$
|
4,578
|
|
|
|
One-to-four family residential
|
4,162
|
|
3,621
|
|
|||
|
Construction and Land
|
6
|
|
—
|
|
|||
|
Multifamily
|
3,298
|
|
1,440
|
|
|||
|
Home equity and lines of credit
|
—
|
|
263
|
|
|||
|
Commercial and industrial loans
|
202
|
|
148
|
|
|||
|
Other loans
|
29
|
|
50
|
|
|||
|
Total
|
$
|
12,044
|
|
$
|
10,100
|
|
|
The increase in delinquent loans from 2016 to 2017 was primarily attributable to one multifamily real estate loan with a balance of $1.5 million that was 31 days delinquent at December 31, 2017, and became current subsequent to year end.
Allowance for Loan Losses
We provide for loan losses based on the consistent application of our documented allowance for loan loss methodology. Loan losses are charged to the allowance for loans losses and recoveries are credited to it. Additions to the allowance for loan losses are provided by charges against income based on various factors, which, in our judgment, deserve current recognition in estimating probable losses. Loan losses are charged-off in the period the loans, or portion thereof, are deemed uncollectible. Generally, the Company will record a loan charge-off (including a partial charge-off) to reduce a loan to the estimated fair value of the underlying collateral, less cost to sell, for collateral dependent loans. We regularly review the loan portfolio in order to maintain the allowance for loan losses in accordance with U.S. generally accepted accounting principles (U.S. GAAP). See
“Item 7. Management’s Discussion and Analysis of Financial Condition and Results of Operations - Critical Accounting Polices - Allowance for Loan Losses”
for a description of our allowance methodology
.
16
The following table sets forth activity in our allowance for loan losses for the years indicated:
|
|
At or For the Years Ended December 31,
|
||||||||||||||||||
|
|
2017
|
2016
|
2015
|
2014
|
2013
|
||||||||||||||
|
|
(Dollars in thousands)
|
||||||||||||||||||
|
Balance at beginning of year
|
$
|
24,595
|
|
$
|
24,770
|
|
$
|
26,292
|
|
$
|
26,037
|
|
$
|
26,424
|
|
||||
|
Charge-offs:
|
|
|
|
|
|
||||||||||||||
|
Commercial real estate
|
(4
|
)
|
(638
|
)
|
(1,431
|
)
|
(103
|
)
|
(1,208
|
)
|
|||||||||
|
One-to-four family residential
|
—
|
|
(20
|
)
|
(277
|
)
|
(58
|
)
|
(414
|
)
|
|||||||||
|
Multifamily
|
(184
|
)
|
(278
|
)
|
(120
|
)
|
(7
|
)
|
(657
|
)
|
|||||||||
|
Home equity and lines of credit
|
(104
|
)
|
—
|
|
(115
|
)
|
(489
|
)
|
(491
|
)
|
|||||||||
|
Commercial and industrial
|
(73
|
)
|
(66
|
)
|
(71
|
)
|
(135
|
)
|
(379
|
)
|
|||||||||
|
Other
|
—
|
|
(2
|
)
|
(1
|
)
|
—
|
|
(25
|
)
|
|||||||||
|
Acquired loans
|
(37
|
)
|
—
|
|
—
|
|
—
|
|
—
|
|
|||||||||
|
Total charge-offs
|
(402
|
)
|
(1,004
|
)
|
(2,015
|
)
|
(792
|
)
|
(3,174
|
)
|
|||||||||
|
Recoveries:
|
|
|
|
|
|
||||||||||||||
|
Commercial real estate
|
70
|
|
181
|
|
2
|
|
72
|
|
1
|
|
|||||||||
|
One-to-four family residential
|
—
|
|
2
|
|
20
|
|
—
|
|
18
|
|
|||||||||
|
Construction and land
|
—
|
|
—
|
|
—
|
|
246
|
|
567
|
|
|||||||||
|
Multifamily
|
277
|
|
—
|
|
25
|
|
35
|
|
—
|
|
|||||||||
|
Home equity and lines of credit
|
97
|
|
2
|
|
42
|
|
—
|
|
—
|
|
|||||||||
|
Commercial and industrial
|
79
|
|
4
|
|
34
|
|
8
|
|
201
|
|
|||||||||
|
Other
|
—
|
|
5
|
|
17
|
|
41
|
|
73
|
|
|||||||||
|
Acquired loans
|
33
|
|
—
|
|
—
|
|
—
|
|
—
|
|
|||||||||
|
Total recoveries
|
556
|
|
194
|
|
140
|
|
402
|
|
860
|
|
|||||||||
|
Net recoveries (charge-offs)
|
154
|
|
(810
|
)
|
(1,875
|
)
|
(390
|
)
|
(2,314
|
)
|
|||||||||
|
Provision for loan losses
|
1,411
|
|
635
|
|
353
|
|
645
|
|
1,927
|
|
|||||||||
|
Balance at end of year
|
$
|
26,160
|
|
$
|
24,595
|
|
$
|
24,770
|
|
$
|
26,292
|
|
$
|
26,037
|
|
||||
|
Ratios:
|
|
|
|
|
|
||||||||||||||
|
Net recoveries (charge-offs) to average loans outstanding
|
0.01
|
%
|
(0.03
|
)%
|
(0.09
|
)%
|
(0.02
|
)%
|
(0.17
|
)%
|
|||||||||
|
Allowance for loan losses to non-performing loans held-for-investment at end of year
(1)
|
472.63
|
|
333.23
|
|
280.78
|
|
180.29
|
|
150.23
|
|
|||||||||
|
Allowance for loan losses to originated loans held-for-investment, net at end of year
(2)
|
1.04
|
|
1.10
|
|
1.24
|
|
1.58
|
|
1.88
|
|
|||||||||
|
Allowance for loan losses to total loans held-for-investment at end of year
(3)
|
0.83
|
|
0.83
|
|
1.04
|
|
1.35
|
|
1.75
|
|
|||||||||
(1)
Excludes non-performing loans held-for-sale, carried at lower of cost or estimated fair value, less costs to sell.
(2)
Excludes PCI loans, acquired loans held-for-investment and loans held-for-sale (and related allowance for loan losses).
(3)
Includes PCI and acquired loans held-for-investment.
At
December 31, 2017
and
2016
, the allowance for loan losses related to PCI loans was $951,000 and $896,000, respectively. Loans held-for-sale are excluded from the allowance for loan losses coverage ratios in the table above.
Allocation of Allowance for Loan Losses.
The following tables set forth the allowance for loan losses allocated by loan category and the percent of loans in each category to total loans at the dates indicated. The allowance for loan losses allocated to each category is not necessarily indicative of future losses in any particular category and does not restrict the use of the allowance to absorb losses in other categories. Prior to December 31, 2016, we maintained an amount identified as the unallocated component within the allowance for loan losses related to indicators of loan losses not fully captured in other components of the allowance for loan losses methodology, as well as the inherent imprecision of the loss estimation process. During the fourth quarter of 2016, the Company enhanced the allowance for loan losses qualitative framework to more fully capture the risks related to certain loan loss factors. These enhancements are meant to increase the level of precision in the allowance for loan losses. As a result, the Company will no longer have an unallocated reserve in its allowance for loan losses, as the risks and uncertainties meant to be captured by the unallocated allowance have been included in the qualitative framework for the respective loan portfolios.
17
|
|
At December 31,
|
|||||||||||||||||||
|
|
2017
|
2016
|
2015
|
|||||||||||||||||
|
|
Allowance for Loan Losses
|
Percent of Loans in Each Category to Total Loans
|
Allowance for Loan Losses
|
Percent of Loans in Each Category to Total Loans
|
Allowance for Loan Losses
|
Percent of Loans in Each Category to Total Loans
|
||||||||||||||
|
|
(Dollars in thousands)
|
|||||||||||||||||||
|
Real estate loans:
|
|
|
|
|
|
|
||||||||||||||
|
Commercial
|
$
|
5,196
|
|
14.20
|
%
|
$
|
5,432
|
|
13.93
|
%
|
$
|
7,106
|
|
16.97
|
%
|
|||||
|
One-to-four family residential
|
503
|
|
3.22
|
|
664
|
|
3.58
|
|
787
|
|
4.15
|
|
||||||||
|
Construction and land
|
610
|
|
1.10
|
|
172
|
|
0.47
|
|
261
|
|
0.79
|
|
||||||||
|
Multifamily
|
17,374
|
|
55.38
|
|
14,952
|
|
50.86
|
|
12,387
|
|
55.66
|
|
||||||||
|
Home equity and lines of credit
|
122
|
|
2.11
|
|
588
|
|
2.21
|
|
795
|
|
2.59
|
|
||||||||
|
Commercial and industrial
|
1,273
|
|
1.11
|
|
1,720
|
|
1.08
|
|
1,288
|
|
1.08
|
|
||||||||
|
PCI loans
|
951
|
|
0.73
|
|
896
|
|
1.03
|
|
783
|
|
1.40
|
|
||||||||
|
Loans Acquired
|
37
|
|
22.10
|
|
75
|
|
26.79
|
|
115
|
|
17.26
|
|
||||||||
|
Other
|
94
|
|
0.05
|
|
96
|
|
0.05
|
|
155
|
|
0.10
|
|
||||||||
|
Total allocated allowance
|
26,160
|
|
100.00
|
%
|
24,595
|
|
100.00
|
%
|
23,677
|
|
100.00
|
%
|
||||||||
|
Unallocated
|
—
|
|
|
—
|
|
|
1,093
|
|
|
|||||||||||
|
Total
|
$
|
26,160
|
|
|
$
|
24,595
|
|
|
$
|
24,770
|
|
|
||||||||
|
|
At December 31,
|
|
|
|||||||||||||||||
|
|
2014
|
2013
|
|
|
||||||||||||||||
|
|
Allowance for Loan Losses
|
Percent of Loans in Each Category to Total Loans
|
Allowance for Loan Losses
|
Percent of Loans in Each Category to Total Loans
|
|
|
||||||||||||||
|
|
(Dollars in thousands)
|
|
|
|||||||||||||||||
|
Real estate loans:
|
|
|
|
|
|
|
||||||||||||||
|
Commercial
|
$
|
9,309
|
|
20.13
|
%
|
$
|
12,619
|
|
22.89
|
%
|
|
|
||||||||
|
One-to-four family residential
|
951
|
|
3.84
|
|
875
|
|
4.36
|
|
|
|
||||||||||
|
Construction and land
|
266
|
|
1.10
|
|
205
|
|
0.95
|
|
|
|
||||||||||
|
Multifamily
|
12,219
|
|
55.31
|
|
9,374
|
|
58.61
|
|
|
|
||||||||||
|
Home equity and lines of credit
|
901
|
|
2.81
|
|
860
|
|
3.11
|
|
|
|
||||||||||
|
Commercial and industrial
|
841
|
|
0.67
|
|
425
|
|
0.68
|
|
|
|
||||||||||
|
PCI loans
|
400
|
|
2.31
|
|
588
|
|
4.00
|
|
|
|
||||||||||
|
Loans Acquired
|
62
|
|
13.71
|
|
—
|
|
5.24
|
|
|
|
||||||||||
|
Other
|
134
|
|
0.12
|
|
67
|
|
0.16
|
|
|
|
||||||||||
|
Total allocated allowance
|
25,083
|
|
100.00
|
%
|
25,013
|
|
100.00
|
%
|
|
|
||||||||||
|
Unallocated
|
1,209
|
|
|
1,024
|
|
|
|
|||||||||||||
|
Total
|
$
|
26,292
|
|
|
$
|
26,037
|
|
|
|
|||||||||||
Investments
We conduct securities portfolio transactions in accordance with our board-approved investment policy. Northfield Bank's investment policy is reviewed at least annually by the Risk Committee of the Board of Directors. Any changes to the policy are subject to ratification by the full Board of Directors. This policy dictates that investment decisions give consideration to the safety of the investment, liquidity requirements, potential returns, the ability to provide collateral for pledging requirements, and consistency with our interest rate risk management strategy. Our Chief Investment Officer executes our securities portfolio transactions, within policy requirements, with the approval of either the Chief Executive Officer or the Chief Financial Officer. NSB Services Corp.’s and NSB Realty Trust’s investment officers execute security portfolio transactions in accordance with investment policies that substantially mirror Northfield Bank’s investment policy. All purchase and sale transactions are reviewed by the Risk Committee at least quarterly.
18
Our current investment policy permits investments in mortgage-backed securities, including pass-through securities and real estate mortgage investment conduits (“REMICs”). The investment policy also permits, with certain limitations, investments in debt securities issued by the U.S. Government, agencies of the U.S. Government or U.S. Government-sponsored enterprises (“GSEs”), asset-backed securities, municipal obligations (including bonds, tax anticipation notes and bond anticipation notes), money market mutual funds, federal funds, investment grade corporate bonds, reverse repurchase agreements, and certificates of deposit.
Northfield Bank’s investment policy does not permit investment in preferred and common stock of other entities including GSEs, other than our required investment in the common stock of the FHLB of New York or as permitted for community reinvestment purposes or to fund Northfield Bank’s deferred compensation plan. Northfield Bancorp, Inc. may invest in equity securities of other financial institutions up to certain limitations. As of
December 31, 2017
, we held no asset-backed securities other than mortgage-backed securities. Our Board of Directors may change these limitations in the future.
Our current investment policy does not permit hedging through the use of derivative instruments such as financial futures or interest rate options and swaps.
At the time of purchase, we designate a security as either held-to-maturity, available-for-sale, or trading, based upon our ability and intent to hold such securities. Trading securities and securities available-for-sale are reported at estimated fair value, and securities held-to-maturity are reported at amortized cost. A periodic review and evaluation of the available-for-sale and held-to-maturity securities portfolios is conducted to determine if the estimated fair value of any security has declined below its carrying value and whether such impairment is other-than-temporary. If such impairment is deemed to be other-than-temporary, the security is written down to a new cost basis and the resulting loss is charged against earnings. The estimated fair values of our securities are obtained from an independent nationally recognized pricing service (see “Item 7. Management’s Discussion and Analysis of Financial Condition and Results of Operations - Critical Accounting Policies - Securities Valuation and Impairment” for further discussion). At
December 31, 2017
, our investment portfolio consisted primarily of mortgage-backed securities guaranteed by GSEs and, to a lesser extent, corporate debt securities, municipal bonds, private label mortgage-backed securities, and mutual funds. The market for these securities primarily consists of other financial institutions, insurance companies, real estate investment trusts, and mutual funds.
We purchase mortgage-backed securities insured or guaranteed primarily by the Federal National Mortgage Association (“Fannie Mae”), the Federal Home Loan Mortgage Corporation (“Freddie Mac”), or the Government National Mortgage Association (“Ginnie Mae”), and to a lesser extent, securities issued by private companies (private label). We invest in mortgage-backed securities to achieve positive interest rate spreads with minimal administrative expense, and to lower our credit risk as a result of the guarantees provided by Fannie Mae, Freddie Mac, or Ginnie Mae as well as to provide us liquidity to fund loan originations and deposit outflows. In 2008, the Federal Housing Finance Agency placed Freddie Mac and Fannie Mae into conservatorship. The U.S. Treasury Department has established financing agreements to ensure that Freddie Mac and Fannie Mae meet their obligations to holders of mortgage-backed securities that they have issued or guaranteed.
Mortgage-backed securities are securities sold in the secondary market that are collateralized by pools of mortgages. Certain types of mortgage-backed securities are commonly referred to as “pass-through” certificates because the principal and interest of the underlying loans is “passed through” pro rata to investors, net of certain costs, including servicing and guarantee fees, in proportion to an investor’s ownership in the entire pool. The issuers of such securities pool mortgages and resell the participation interests in the form of securities to investors. The interest rate on the security is lower than the interest rates on the underlying loans to allow for payment of servicing and guaranty fees. Ginnie Mae, a U.S. Government agency, and GSEs, such as Fannie Mae and Freddie Mac, may guarantee the payments, or guarantee the timely payment of principal and interest to investors.
Mortgage-backed securities are more liquid than individual mortgage loans since there is a more active market for such securities. In addition, mortgage-backed securities may be used to collateralize our specific liabilities and obligations. Investments in mortgage-backed securities issued or guaranteed by GSEs involve a risk that actual payments will be greater or less than estimated at the time of purchase, which may require adjustments to the amortization of any premium or accretion of any discount relating to such interests, thereby affecting the net yield on our securities. We periodically review current prepayment speeds to determine whether prepayment estimates require modification that could cause adjustment of amortization or accretion.
REMICs are a type of mortgage-backed security issued by special-purpose entities that aggregate pools of mortgages and mortgage-backed securities and create different classes of securities with varying maturities and amortization schedules, as well as a residual interest, with each class possessing different risk characteristics. The cash flows from the underlying
19
collateral are generally divided into “tranches” or classes that have descending priorities with respect to the distribution of principal and interest cash flows.
The timely payment of principal and interest on these REMICs is generally supported (credit enhanced) in varying degrees by either insurance issued by a financial guarantee insurer, letters of credit, over collateralization, or subordination techniques. Privately issued REMICs and pass-throughs can be subject to certain credit-related risks normally not associated with U.S. Government agency and GSE mortgage-backed securities. The loss protection generally provided by the various forms of credit enhancements is limited, and losses in excess of certain levels are not protected. Furthermore, the credit enhancement itself is subject to the creditworthiness of the credit enhancer. Thus, in the event a credit enhancer does not fulfill its obligations, the holder could be subject to risk of loss similar to a purchaser of a whole loan pool. Management believes that the credit enhancements are adequate to protect us from material losses on our private label mortgage-backed securities investments.
At
December 31, 2017
, our corporate bond portfolio consisted of investment-grade securities, the majority of which had remaining maturities generally shorter than five years. Our investment policy provides that we may invest up to 15% of our tier-one risk-based capital in corporate bonds from individual issuers which, at the time of purchase, are within the investment-grade ratings from Standard & Poor’s, Moody’s or Fitch. The maturity of these bonds may not exceed 10 years, and there is no aggregate limit for this security type. Corporate bonds from individual issuers not rated investment grade at the time of purchase, are limited to the lesser of 1% of our total assets or 15% of our Tier 1 risk-based capital, and must have a maturity of less than one year. Aggregate holdings of this security type cannot exceed 5% of our total assets. Additionally, at the time of purchase, management performs due diligence to conclude that the security meets the regulatory standard for investment-grade. Bonds that subsequently experience a decline in credit rating below investment grade are monitored at least quarterly.
The following table sets forth the amortized cost and estimated fair value of our available-for-sale and held-to-maturity securities portfolios (excluding FHLB of New York common stock) at the dates indicated. As of
December 31, 2017
,
2016
, and
2015
, we also had a trading portfolio with a fair value of
$9.6 million
, $7.9 million and $6.7 million, respectively, consisting of mutual funds quoted in actively traded markets. These securities are utilized to fund non-qualified deferred compensation obligations.
|
|
At December 31,
|
||||||||||||||||||||||
|
|
2017
|
2016
|
2015
|
||||||||||||||||||||
|
|
Amortized Cost
|
Estimated Fair Value
|
Amortized Cost
|
Estimated Fair Value
|
Amortized Cost
|
Estimated Fair Value
|
|||||||||||||||||
|
|
(Dollars in thousands)
|
||||||||||||||||||||||
|
Securities available-for-sale:
|
|
|
|
|
|
|
|||||||||||||||||
|
Mortgage-backed securities:
|
|
|
|
|
|
|
|||||||||||||||||
|
Pass-through certificates:
|
|
|
|
|
|
|
|||||||||||||||||
|
GSEs
|
$
|
179,320
|
|
$
|
178,295
|
|
$
|
225,047
|
|
$
|
224,549
|
|
$
|
228,557
|
|
$
|
231,700
|
|
|||||
|
REMICs:
|
|||||||||||||||||||||||
|
GSEs
|
273,501
|
|
266,929
|
|
230,500
|
|
224,293
|
|
305,387
|
|
297,824
|
|
|||||||||||
|
Non-GSEs
|
80
|
|
79
|
|
280
|
|
270
|
|
597
|
|
579
|
|
|||||||||||
|
Debt securities
|
|||||||||||||||||||||||
|
Municipal bonds
|
343
|
|
349
|
|
2,151
|
|
2,158
|
|
—
|
|
—
|
|
|||||||||||
|
Corporate bonds
|
67,927
|
|
68,130
|
|
45,373
|
|
45,159
|
|
11,002
|
|
11,011
|
|
|||||||||||
|
Other securities
|
|||||||||||||||||||||||
|
Equity investments - mutual funds
|
323
|
|
323
|
|
1,233
|
|
1,218
|
|
481
|
|
481
|
|
|||||||||||
|
Other
|
1,016
|
|
1,016
|
|
1,250
|
|
1,250
|
|
—
|
|
—
|
|
|||||||||||
|
Total securities available-for-sale
|
$
|
522,510
|
|
$
|
515,121
|
|
$
|
505,834
|
|
$
|
498,897
|
|
$
|
546,024
|
|
$
|
541,595
|
|
|||||
20
|
|
At December 31,
|
||||||||||||||||||||||
|
|
2017
|
2016
|
2015
|
||||||||||||||||||||
|
|
Amortized Cost
|
Estimated Fair Value
|
Amortized Cost
|
Estimated Fair Value
|
Amortized Cost
|
Estimated Fair Value
|
|||||||||||||||||
|
|
(Dollars in thousands)
|
||||||||||||||||||||||
|
Securities held-to-maturity:
|
|
|
|
|
|
|
|||||||||||||||||
|
Mortgage-backed securities:
|
|
|
|
|
|
|
|||||||||||||||||
|
Pass-through certificates - GSEs
|
$
|
9,931
|
|
$
|
9,892
|
|
$
|
10,148
|
|
$
|
10,118
|
|
$
|
10,346
|
|
$
|
10,369
|
|
|||||
|
Total securities held-to-maturity
|
$
|
9,931
|
|
$
|
9,892
|
|
$
|
10,148
|
|
$
|
10,118
|
|
$
|
10,346
|
|
$
|
10,369
|
|
|||||
The following table sets forth the amortized cost and estimated fair value of securities as of
December 31, 2017
, for issuers that exceeded 10% of our stockholders’ equity as of that date:
|
|
At December 31, 2017
|
||||||
|
|
Amortized Cost
|
Estimated Fair Value
|
|||||
|
|
(Dollars in thousands)
|
||||||
|
Mortgage-backed securities:
|
|
|
|||||
|
Freddie Mac
|
$
|
219,995
|
|
$
|
217,159
|
|
|
|
Fannie Mae
|
$
|
227,023
|
|
$
|
222,362
|
|
|
Portfolio Maturities and Yields.
The composition and maturities of the investment securities portfolio at
December 31, 2017
, are summarized in the following table. Maturities are based on the final contractual payment dates, and do not reflect the effect of scheduled principal repayments, prepayments, or early redemptions that may occur. All of our securities at
December 31, 2017
, were taxable securities.
|
|
One Year or Less
|
More than One Year through Five Years
|
More than Five Years through Ten Years
|
More than Ten Years
|
Total
|
|||||||||||||||||||||||||||||||||
|
|
Amortized Cost
|
Weighted Average Yield
|
Amortized Cost
|
Weighted Average Yield
|
Amortized Cost
|
Weighted Average Yield
|
Amortized Cost
|
Weighted Average Yield
|
Amortized Cost
|
Fair Value
|
Weighted Average Yield
|
|||||||||||||||||||||||||||
|
|
(Dollars in thousands)
|
|||||||||||||||||||||||||||||||||||||
|
Securities available-for-sale:
|
|
|
|
|
|
|
|
|
|
|||||||||||||||||||||||||||||
|
Mortgage-backed securities:
|
|
|
|
|
|
|
|
|
|
|||||||||||||||||||||||||||||
|
Pass-through certificates:
|
|
|
|
|
|
|
|
|
|
|||||||||||||||||||||||||||||
|
GSEs
|
$
|
427
|
|
4.04
|
%
|
$
|
23,959
|
|
3.18
|
%
|
$
|
100,613
|
|
2.47
|
%
|
$
|
54,321
|
|
2.40
|
%
|
$
|
179,320
|
|
$
|
178,295
|
|
2.55
|
%
|
||||||||||
|
REMICs:
|
||||||||||||||||||||||||||||||||||||||
|
GSEs
|
—
|
|
—
|
%
|
14,340
|
|
2.04
|
%
|
38,039
|
|
1.76
|
%
|
221,122
|
|
2.19
|
%
|
273,501
|
|
266,929
|
|
2.13
|
%
|
||||||||||||||||
|
Non-GSEs
|
—
|
|
—
|
%
|
—
|
|
—
|
%
|
—
|
|
—
|
%
|
80
|
|
1.95
|
%
|
80
|
|
79
|
|
1.95
|
%
|
||||||||||||||||
|
Debt securities
|
||||||||||||||||||||||||||||||||||||||
|
Municipal bonds
|
—
|
|
—
|
%
|
230
|
|
3.35
|
%
|
113
|
|
3.53
|
%
|
—
|
|
—
|
%
|
343
|
|
349
|
|
3.41
|
%
|
||||||||||||||||
|
Corporate bonds
|
—
|
|
—
|
%
|
57,945
|
|
2.30
|
%
|
9,982
|
|
2.32
|
%
|
67,927
|
|
68,130
|
|
2.30
|
%
|
||||||||||||||||||||
|
Equity investments
|
323
|
|
0.45
|
%
|
—
|
|
—
|
%
|
—
|
|
—
|
%
|
—
|
|
—
|
%
|
323
|
|
323
|
|
0.45
|
%
|
||||||||||||||||
|
Other
|
1,016
|
|
2.25
|
%
|
—
|
|
—
|
%
|
—
|
|
—
|
%
|
—
|
|
—
|
%
|
1,016
|
|
1,016
|
|
2.25
|
%
|
||||||||||||||||
|
Total securities available-for-sale
|
$
|
1,766
|
|
2.35
|
%
|
$
|
96,474
|
|
2.48
|
%
|
$
|
148,747
|
|
2.28
|
%
|
$
|
275,523
|
|
—
|
%
|
$
|
522,510
|
|
$
|
515,121
|
|
2.30
|
%
|
||||||||||
|
Securities held-to-maturity:
|
||||||||||||||||||||||||||||||||||||||
|
Mortgage-backed securities:
|
||||||||||||||||||||||||||||||||||||||
|
Pass-through certificates:
|
||||||||||||||||||||||||||||||||||||||
|
GSEs
|
$
|
—
|
|
—
|
%
|
$
|
—
|
|
—
|
%
|
$
|
—
|
|
—
|
%
|
$
|
9,931
|
|
3.50
|
%
|
$
|
9,931
|
|
$
|
9,892
|
|
3.50
|
%
|
||||||||||
|
Total securities held-to-maturity
|
$
|
—
|
|
—
|
%
|
$
|
—
|
|
—
|
%
|
$
|
—
|
|
—
|
%
|
$
|
9,931
|
|
3.50
|
%
|
$
|
9,931
|
|
$
|
9,892
|
|
3.50
|
%
|
||||||||||
21
Sources of Funds
General.
Deposits traditionally have been our primary source of funds for our securities and lending activities. We also borrow from the FHLB of New York and other financial institutions to supplement cash flow needs, to manage the maturities of liabilities for interest rate and investment risk management purposes, and to manage our cost of funds. Our additional sources of funds are the proceeds of loan sales, scheduled loan and investment payments, maturing investments, loan prepayments, brokered deposits, and stockholders' equity, including retained earnings.
Deposits.
We accept deposits primarily from the areas in which our offices are located. We rely on our convenient locations, customer service, and competitive products and pricing to attract and retain deposits. We offer a variety of deposit accounts to businesses, consumers and municipalities with a range of interest rates and terms. Our deposit accounts consist of transaction accounts (NOW and non-interest bearing checking accounts), savings accounts (money market, passbook, and statement savings), and certificates of deposit, including individual retirement accounts. We accept brokered deposits when it is deemed cost effective. At
December 31, 2017
and
2016
, we had brokered deposits totaling
$150.6 million
and $98.8 million, respectively. In addition, municipal deposits which primarily consist of funds from local government entities domiciled in New Jersey, are a growing source of funds. At
December 31, 2017
, municipal deposits totaled $350.7 million, or 12.4% of our total deposits. At December 31, 2016, municipal deposits totaled $362.8 million, or 13.4% of our total deposits. Municipal deposits are primarily secured by mortgaged-backed securities.
Interest rates offered on deposit accounts generally are established weekly, while maturity terms, service fees, and withdrawal penalties are reviewed on a periodic basis. Deposit rates and terms are based primarily on current operating strategies, market interest rates, and liquidity requirements.
At
December 31, 2017
, we had
$738.9 million
in certificates of deposit, of which
$401.3 million
had remaining maturities of one year or less.
The following table sets forth the distribution of our average total deposit accounts, by account type, for the periods indicated:
|
|
For the Year Ended December 31,
|
||||||||||||||||||||||||||||
|
|
2017
|
2016
|
2015
|
||||||||||||||||||||||||||
|
|
Average Balance
|
Percent
|
Weighted Average Rate
|
Average Balance
|
Percent
|
Weighted Average Rate
|
Average Balance
|
Percent
|
Weighted Average Rate
|
||||||||||||||||||||
|
|
(Dollars in thousands)
|
||||||||||||||||||||||||||||
|
Non-interest bearing demand
|
$
|
385,891
|
|
14.16
|
%
|
—
|
%
|
$
|
372,946
|
|
14.50
|
%
|
—
|
%
|
$
|
262,318
|
|
13.68
|
%
|
—
|
%
|
||||||||
|
NOW
|
477,996
|
|
17.54
|
|
0.30
|
%
|
414,366
|
|
16.10
|
|
0.23
|
%
|
181,341
|
|
9.47
|
|
0.25
|
%
|
|||||||||||
|
Money market accounts
|
809,286
|
|
29.70
|
|
0.73
|
%
|
746,798
|
|
29.02
|
|
0.63
|
%
|
490,418
|
|
25.60
|
|
0.48
|
%
|
|||||||||||
|
Savings
|
426,581
|
|
15.66
|
|
0.21
|
%
|
458,086
|
|
17.80
|
|
0.46
|
%
|
468,749
|
|
24.47
|
|
0.46
|
%
|
|||||||||||
|
Certificates of deposit
|
625,067
|
|
22.94
|
|
1.30
|
%
|
580,973
|
|
22.58
|
|
1.12
|
%
|
512,977
|
|
26.78
|
|
1.07
|
%
|
|||||||||||
|
Total deposits
|
$
|
2,724,821
|
|
100.00
|
%
|
0.60
|
%
|
$
|
2,573,169
|
|
100.00
|
%
|
0.56
|
%
|
$
|
1,915,803
|
|
100.00
|
%
|
0.55
|
%
|
||||||||
As of
December 31, 2017
, the aggregate amount of our outstanding certificates of deposit in amounts greater than or equal to $100,000 was
$337.9 million
. The following table sets forth the maturity of these certificates at
December 31, 2017
:
|
|
December 31, 2017
|
||
|
|
(Dollars in thousands)
|
||
|
Three months or less
|
$
|
16,819
|
|
|
Over three months through six months
|
56,145
|
|
|
|
Over six months through one year
|
124,496
|
|
|
|
Over one year to three years
|
121,926
|
|
|
|
Over three years
|
18,480
|
|
|
|
Total
|
$
|
337,866
|
|
Borrowings.
Our borrowings consist primarily of advances from the FHLB of New York and securities sold under agreements to repurchase (repurchase agreements) with third-party financial institutions. As of
December 31, 2017
, our FHLB
22
advances totaled
$464.2 million
, or
13.8%
, of total liabilities, repurchase agreements totaled
$2.0 million
, or
0.1%
, of total liabilities, floating rate advances totaled
$5.0 million
, or
0.2%
, of total liabilities and capitalized lease obligations totaled
$299,000
, or
0.01%
, of total liabilities. At
December 31, 2017
, the Company had the ability to obtain additional funding from the FHLB of New York and Federal Reserve Bank discount window of approximately
$870.8 million
, utilizing unencumbered securities of
$72.6 million
and multifamily loans of
$885.3 million
. Repurchase agreements are primarily secured by mortgage-backed securities. Advances from the FHLB of New York are secured by our investment in the common stock of the FHLB of New York as well as by pledged mortgage-backed securities and loans.
The following table sets forth information concerning balances and interest rates on our borrowings at and for the years indicated:
|
|
At or For the Years Ended December 31,
|
||||||||||
|
|
2017
|
2016
|
2015
|
||||||||
|
|
(Dollars in thousands)
|
||||||||||
|
Balance at end of year
|
$
|
471,549
|
|
$
|
473,206
|
|
$
|
558,129
|
|
||
|
Average balance during year
|
$
|
494,361
|
|
$
|
491,802
|
|
$
|
594,926
|
|
||
|
Maximum outstanding at any month end
|
$
|
579,690
|
|
$
|
529,988
|
|
$
|
760,088
|
|
||
|
Weighted average interest rate at end of year
|
1.62
|
%
|
1.44
|
%
|
1.57
|
%
|
|||||
|
Weighted average interest rate during year
|
1.54
|
%
|
1.50
|
%
|
1.56
|
%
|
|||||
Employees
As of
December 31, 2017
, we had 323 full-time employees and 29 part-time employees. Our employees are not represented by any collective bargaining group. Management believes that we have a good working relationship with our employees.
Subsidiary Activities
Northfield-Bancorp, Inc. owns 100% of Northfield Investments, Inc., an inactive New Jersey investment company, and 100% of Northfield Bank. Northfield Bank owns 100% of NSB Services Corp., a Delaware corporation, which in turn owns 100% of the voting common stock of NSB Realty Trust. NSB Realty Trust is a Maryland real estate investment trust that holds mortgage loans, mortgage-backed securities and other investments. These entities enable us to segregate certain assets for management purposes, and promote our ability to raise capital in the future through the sale of preferred stock or other capital-enhancing securities or borrow against assets or stock of these entities for liquidity purposes. At
December 31, 2017
, Northfield Bank’s investment in NSB Services Corp. was $712.8 million, and NSB Services Corp. had assets of $724.6 million and liabilities of $11.9 million at that date. At
December 31, 2017
, NSB Services Corp.’s investment in NSB Realty Trust was $724.6 million, and NSB Realty Trust had $724.6 million in assets, and liabilities of $15,000 at that date.
Expense and Tax Allocation Agreements
Northfield Bank has an agreement with Northfield Bancorp, Inc. to provide it with certain administrative support services, whereby Northfield Bank will be compensated at not less than the fair market value of the services provided. In addition, Northfield Bank and Northfield Bancorp, Inc. have an agreement for allocating and reimbursing Northfield Bancorp, Inc. for Northfield Bank's portion of its consolidated tax liability.
23
SUPERVISION AND REGULATION
General
Northfield Bank is a federally chartered savings bank that is regulated, examined, and supervised by the OCC and the FDIC. This regulation and supervision establishes a comprehensive framework of activities in which an institution may engage and is intended primarily for the protection of the FDIC’s deposit insurance fund and depositors, and not for the protection of security holders. Under this system of federal regulation, financial institutions are periodically examined to ensure that they satisfy applicable standards with respect to their capital adequacy, assets, management, earnings, liquidity, and sensitivity to market interest rates. Northfield Bank also is regulated to a lesser extent by the FRB, governing reserves to be maintained against deposits and other matters, including payments of dividends and the repurchase of shares of common stock. The OCC examines Northfield Bank and prepares reports for the consideration of its Board of Directors on any operating deficiencies. Northfield Bank’s relationship with its depositors and borrowers also is regulated to a great extent by federal law and, to a much lesser extent, state law, especially in matters concerning the ownership of deposit accounts and the form and content of Northfield Bank’s loan documents. Northfield Bank is also a member of and owns stock in the FHLB of New York, which is one of the 11 regional banks in the Federal Home Loan Bank System.
As a savings and loan holding company, Northfield Bancorp, Inc. is required to comply with the rules and regulations of the FRB. It is required to file certain reports with and is subject to examination by and the enforcement authority of the FRB. Northfield Bancorp, Inc. is also subject to the rules and regulations of the Securities and Exchange Commission under the federal securities laws.
Any change in applicable laws or regulations, whether by the FDIC, the OCC, the FRB, or Congress, could have a material adverse effect on Northfield Bancorp, Inc. and Northfield Bank and their operations.
Set forth below is a brief description of material regulatory requirements that are or will be applicable to Northfield Bank and Northfield Bancorp, Inc. The description is limited to certain material aspects of the statutes and regulations addressed and is not intended to be a complete description of such statutes and regulations and their effects on Northfield Bank and Northfield Bancorp, Inc.
Business Activities
A federal savings bank derives its lending and investment powers from the Home Owners’ Loan Act, as amended, and the regulations of the OCC. Under these laws and regulations, Northfield Bank may originate mortgage loans secured by residential and commercial real estate, commercial business loans, and consumer loans, and it may invest in certain types of debt securities and certain other assets. Certain types of lending, such as commercial and consumer loans, are subject to aggregate limits calculated as a specified percentage of Northfield Bank’s capital or assets. Northfield Bank also may establish subsidiaries that may engage in a variety of activities, including some that are not otherwise permissible for Northfield Bank, including real estate investment and securities and insurance brokerage.
Loans-to-One-Borrower
We generally may not make a loan or extend credit to a single or related group of borrowers in excess of 15% of Northfield Bank’s unimpaired capital and unimpaired surplus. An additional amount may be loaned, equal to 10% of unimpaired capital and unimpaired surplus, if the loan is secured by readily marketable collateral, which is defined to include certain financial instruments and bullion, but generally does not include real estate. As of
December 31, 2017
, we were in compliance with our loans-to-one-borrower limitations.
Qualified Thrift Lender Test
As a federally chartered savings bank, Northfield Bank is required to satisfy a qualified thrift lender (QTL) test, under which we either must qualify as a “domestic building and loan” association as defined by the Internal Revenue Code or maintain at least 65% of our “portfolio assets” in “qualified thrift investments.” “Qualified thrift investments” consist primarily of residential mortgages and related investments, including mortgage-backed and related securities. “Portfolio assets” generally mean total assets less specified liquid assets up to 20% of total assets, goodwill, and other intangible assets and the value of property used to conduct business. A savings institution that fails the qualified thrift lender test must operate under specified restrictions. The Dodd-Frank Act made noncompliance with the QTL test also subject to agency enforcement action for a violation of law. As of
December 31, 2017
, we maintained 80.1% of our portfolio assets in qualified thrift investments and, therefore, we met the QTL test.
24
Standards for Safety and Soundness
Federal law requires each federal banking agency to prescribe for insured depository institutions under its jurisdiction standards relating to, among other things, internal controls, information systems and internal audit systems, loan documentation, credit underwriting, interest rate risk exposure, asset growth, employee compensation, and other operational and managerial standards as the agency deems appropriate. The federal banking agencies adopted Interagency Guidelines Prescribing Standards for Safety and Soundness to implement the safety and soundness standards required under federal law. The guidelines set forth the safety and soundness standards that the federal banking agencies use to identify and address problems at insured depository institutions before capital becomes impaired. If the appropriate federal banking agency determines that an institution fails to meet any standard prescribed by the guidelines, the agency may require the institution to submit to the agency an acceptable plan to achieve compliance with the standard. If an institution fails to submit or implement an acceptable plan, the appropriate federal banking agency may issue an enforceable order requiring correction of the deficiencies.
Capital Requirements
Federal regulations require federally insured depository institutions to meet several minimum capital standards: a common equity Tier 1 capital to risk-based assets ratio of 4.5%, a Tier 1 capital to risk-based assets ratio of 6.0%, a total capital to risk-based assets of 8.0%, and a 4.0% Tier 1 capital to total assets leverage ratio.
In determining the amount of risk-weighted assets for purposes of calculating risk-based capital ratios, all assets, including certain off-balance sheet assets (e.g., recourse obligations, direct credit substitutes, residual interests) are multiplied by a risk weight factor assigned by the regulations based on the risks believed inherent in the type of asset. Higher levels of capital are required for asset categories believed to present greater risk. Common equity Tier 1 capital generally is defined as common stockholders’ equity and retained earnings. Tier 1 capital generally is defined as common equity Tier 1 plus additional Tier 1 capital. Additional Tier 1 capital includes certain noncumulative perpetual preferred stock and related surplus and minority interests in equity accounts of consolidated subsidiaries. Total capital includes Tier 1 capital (common equity Tier 1 capital plus additional Tier 1 capital) and Tier 2 capital. Tier 2 capital is comprised of capital instruments and related surplus, meeting specified requirements, and may include cumulative preferred stock and long-term perpetual preferred stock, mandatory convertible securities, intermediate preferred stock and subordinated debt. Also included in Tier 2 capital is the allowance for loan and lease losses limited to a maximum of 1.25% of risk-weighted assets and certain other items. In assessing an institution’s capital adequacy, the OCC takes into consideration, not only these numeric factors, but qualitative factors as well, and has the authority to establish higher capital requirements for individual institutions when deemed necessary.
In addition to establishing the minimum regulatory capital requirements, the regulations limit capital distributions and certain discretionary bonus payments to management if the institution does not hold a “capital conservation buffer” consisting of 2.5% of common equity Tier 1 capital to risk-weighted asset above the amount necessary to meet its minimum risk-based capital requirements. The capital conservation buffer requirement was phased in beginning January 1, 2016, at 0.625% of risk-weighted assets and increases each year until fully implemented at 2.5% on January 1, 2019. For calendar year 2017, the capital conservation buffer was 1.25%. It increased to 1.875% on January 1, 2018.
As of
December 31, 2017
, Northfield Bancorp, Inc. and Northfield Bank exceeded all capital adequacy requirements to which they were subject. Further, the most recent OCC notification categorized the Bank as a well-capitalized institution under the prompt corrective action regulations. See Note 13 of the Notes to the Consolidated Financial Statements for further discussion about Regulatory Requirements.
Prompt Corrective Regulatory Action
Federal law requires, among other things, that federal bank regulators take “prompt corrective action” with respect to institutions that do not meet minimum capital requirements. For this purpose, the law establishes five capital categories: well capitalized, adequately capitalized, undercapitalized, significantly undercapitalized, and critically undercapitalized. OCC regulations were amended to incorporate the previously mentioned increased regulatory capital standards that were effective January 1, 2015. Under the amended regulations, an institution is deemed to be “well capitalized” if it has a total risk-based capital ratio of 10.0% or greater, a Tier 1 risk-based capital ratio of 8.0% or greater, a leverage ratio of 5.0% or greater and a common equity Tier 1 ratio of 6.5% or greater. An institution is “adequately capitalized” if it has a total risk-based capital ratio of 8.0% or greater, a Tier 1 risk-based capital ratio of 6.0% or greater, a leverage ratio of 4.0% or greater and a common equity Tier 1 ratio of 4.5% or greater. An institution is “undercapitalized” if it has a total risk-based capital ratio of less than 8.0%, a Tier 1 risk-based capital ratio of less than 6.0%, a leverage ratio of less than 4.0% or a common equity Tier 1 ratio of less than
25
4.5%. An institution is deemed to be “significantly undercapitalized” if it has a total risk-based capital ratio of less than 6.0%, a Tier 1 risk-based capital ratio of less than 4.0%, a leverage ratio of less than 3.0% or a common equity Tier 1 ratio of less than 3.0%. An institution is considered to be “critically undercapitalized” if it has a ratio of tangible equity (as defined in the regulations) to total assets that is equal to or less than 2.0%.
The regulations provide that a capital restoration plan must be filed with the OCC within 45 days of the date a savings institution receives notice that it is “undercapitalized,” “significantly undercapitalized” or “critically undercapitalized.” Any holding company for the savings institution required to submit a capital restoration plan must guarantee the lesser of an amount equal to 5.0% of the savings institution’s assets at the time it was notified or deemed to be undercapitalized by the OCC, or the amount necessary to restore the savings institution to adequately capitalized status. This guarantee remains in place until the OCC notifies the savings institution that it has maintained adequately capitalized status for each of four consecutive calendar quarters, and the OCC has the authority to require payment and collect payment under the guarantee. Various restrictions, including on growth and capital distributions, also apply to “undercapitalized” institutions. If an “undercapitalized” institution fails to submit an acceptable capital plan, it is treated as “significantly undercapitalized.” “Significantly undercapitalized” institutions must comply with one or more additional restrictions including, but not limited to, an order by the OCC to sell sufficient voting stock to become adequately capitalized, requirements to reduce total assets, cease receipt of deposits from correspondent banks or dismiss officers or directors and restrictions on interest rates paid on deposits, compensation of executive officers and capital distributions by the parent holding company. The OCC may also take any one of a number of discretionary supervisory actions against undercapitalized institutions, including the issuance of a capital directive and the replacement of senior executive officers and directors.
Capital Distributions
Federal regulations restrict “capital distributions” by savings institutions. For purposes of the regulations, capital distributions generally include cash dividends and other transactions charged to the capital account of a savings institution. A federal savings institution must file an application with the OCC for approval of the capital distribution if:
|
•
|
the total capital distributions for the applicable calendar year exceeds the sum of the institution’s net income for that year to date plus the institution’s retained net income for the preceding two years that is still available for dividend;
|
|
•
|
the institution would not be at least adequately capitalized following the distribution;
|
|
•
|
the distribution would violate any applicable statute, regulation, agreement or written regulatory condition; or
|
|
•
|
the institution is not eligible for expedited review of its filings (i.e., generally, institutions that do not have safety and soundness, compliance and Community Reinvestment Act ratings in the top two categories or fail a capital requirement).
|
A savings institution that is a subsidiary of a holding company, which is the case with Northfield Bank, must file a notice with the FRB at least 30 days before the Board of Directors declares a dividend or approves a capital distribution and receive FRB non-objection to the payment of the dividend.
Applications or notices may be denied if the institution will be undercapitalized after the proposed dividend, the proposed dividend raises safety and soundness concerns or the proposed dividend would violate a law, regulation enforcement order, or regulatory condition.
In the event that a savings institution’s capital falls below its regulatory requirements or it is notified by the regulatory agency that it is in need of more than normal supervision, its ability to make capital distributions would be restricted. In addition, any proposed capital distribution could be prohibited if the regulatory agency determines that the distribution would constitute an unsafe or unsound practice.
Transactions with Related Parties
A savings institution’s authority to engage in transactions with related parties or “affiliates” is limited by Sections 23A and 23B of the Federal Reserve Act and its implementing regulation, FRB Regulation W. The term “affiliate” generally means any company that controls or is under common control with an institution, including Northfield Bancorp, Inc. and its non-savings institution subsidiaries (although certain subsidiaries of the institution itself are not considered affiliates). Applicable law limits the aggregate amount of “covered” transactions with any individual affiliate, including loans to the affiliate, to 10% of the capital and surplus of the savings institution. The aggregate amount of covered transactions with all affiliates is limited to
26
20% of the savings institution’s capital and surplus. Certain covered transactions with affiliates, such as loans to or guarantees issued on behalf of affiliates, are required to be secured by specified amounts of collateral. Purchasing low quality assets from affiliates is generally prohibited. Regulation W also provides that transactions with affiliates, including covered transactions, must be on terms and under circumstances, including credit standards, that are substantially the same or at least as favorable to the institution as those prevailing at the time for comparable transactions with non-affiliated companies. In addition, savings institutions are prohibited by law from lending to any affiliate that is engaged in activities that are not permissible for bank holding companies and no savings institution may purchase the securities of any affiliate other than a subsidiary.
Authority to extend credit to executive officers, directors and 10% or greater shareholders (insiders), as well as entities controlled by insiders, is governed by Sections 22(g) and 22(h) of the Federal Reserve Act and its implementing regulation, FRB Regulation O. Among other things, loans to insiders must be made on terms substantially the same as those offered to unaffiliated individuals and not involve more than the normal risk of repayment. There is an exception for bank-wide lending programs that do not discriminate in favor of insiders. Regulation O also places individual and aggregate limits on the amount of loans that may be made to insiders based, in part, on the institution’s capital position, and requires that certain prior board approval procedures be followed. Extensions of credit to executive officers are subject to additional restrictions on the types and amounts of loans that may be made. At
December 31, 2017
, Northfield Bank was in compliance with these regulations.
Enforcement
The OCC has primary enforcement responsibility over federal savings institutions, including the authority to bring enforcement action against “institution-related parties,” including officers, directors, certain shareholders, and attorneys, appraisers and accountants who knowingly or recklessly participate in wrongful action likely to have an adverse effect on an insured institution. Formal enforcement action may range from the issuance of a capital directive or "cease and desist" order to removal of officers and/or directors of the institution, receivership, conservatorship or the termination of deposit insurance. Civil penalties cover a wide range of violations and actions, and range up to $25,000 per day, unless a finding of reckless disregard is made, in which case penalties may be as high as $1 million per day.
Deposit Insurance
Northfield Bank is a member of the Deposit Insurance Fund, which is administered by the FDIC. Deposit accounts in Northfield Bank are insured up to a maximum of $250,000 for each separately insured depositor by the FDIC.
The FDIC assesses insured depository institutions to maintain the Deposit Insurance Fund. Under the FDIC’s risk-based assessment system, institutions deemed less risky pay lower assessments. Assessments for institutions with less than $10 billion of assets are based on financial measures and supervisory ratings derived from statistical modeling estimating the probability of an institution’s failure within three years.
The FDIC bases its deposit insurance rate assessments upon each insured institution’s total assets less tangible equity. The assessment ranges from 2.5 to 45 basis points of total assets less tangible equity. In conjunction with the Deposit Insurance Fund’s reserve ratio achieving 1.15%, the assessment range (inclusive of possible adjustments) was reduced for insured institutions of less than $10 billion of total assets to 1.5 basis points to 30 basis points, effective July 1, 2016.
The Dodd-Frank Act increased the minimum target Deposit Insurance Fund ratio from 1.15% of estimated insured deposits to 1.35% of estimated insured deposits. The Federal Deposit Insurance Corporation must seek to achieve the 1.35% ratio by September 30, 2020. The Dodd-Frank Act requires insured institutions with assets of $10 billion or more to fund the increase from 1.15% to 1.35% and, effective July 1, 2016, such institutions are subject to a surcharge to achieve that goal. The Dodd-Frank Act eliminated the 1.5% maximum fund ratio, instead leaving it to the discretion of the Federal Deposit Insurance Corporation, and the Federal Deposit Insurance Corporation has exercised that discretion by establishing a long-range fund ratio of 2%.
The FDIC has authority to increase insurance assessments. Any significant increases would have an adverse effect on the operating expenses and results of operations of Northfield Bank. Future insurance assessments cannot be predicted.
Insurance of deposits may be terminated by the FDIC upon a finding that an institution has engaged in unsafe or unsound practices, is in an unsafe or unsound condition to continue operations, or has violated any applicable law, regulation, rule, order or condition imposed in writing. Management of Northfield Bank does not know of any practice, condition, or violation that may lead to termination of the Northfield Bank’s deposit insurance.
27
In addition to the FDIC assessments, the Financing Corporation is authorized to impose and collect, through the FDIC, assessments for anticipated payments, issuance costs and custodial fees on bonds issued by the Financing Corporation in the 1980s to recapitalize the former Federal Savings and Loan Insurance Corporation. The bonds issued by the Financing Corporation are due to mature in 2017 through 2019. For the quarter ended December 31, 2017, the annualized Financing Corporation assessment was equal to 0.54 basis points of total quarterly average assets less quarterly average tangible capital.
Federal Home Loan Bank System
Northfield Bank is a member of the FHLB of New York, and therefore is a member of the Federal Home Loan Bank System, which consists of 11 regional Federal Home Loan Banks. The Federal Home Loan Bank System provides a central credit facility primarily for member institutions. Members of the FHLB are required to acquire and hold a specified amount of shares of FHLB capital stock. Northfield Bank was in compliance with this requirement at
December 31, 2017
.
Community Reinvestment Act and Fair Lending Laws
Savings institutions have a responsibility under the Community Reinvestment Act and related regulations to help meet the credit needs of their communities, including low- and moderate-income neighborhoods. An institution’s failure to comply with the provisions of the Community Reinvestment Act could, at a minimum, result in regulatory restrictions on certain activities such as branching and acquisitions. In the most recent Community Reinvestment Act Public Disclosure issued by the OCC on December 5, 2016, Northfield Bank was rated “Satisfactory.”
Other Regulations
Interest and other charges collected or contracted for by Northfield Bank are subject to state usury laws and federal laws concerning interest rates. Northfield Bank’s operations are also subject to federal laws applicable to credit transactions, such as the:
|
•
|
Truth-In-Lending Act, governing disclosures of credit terms to consumer borrowers;
|
|
•
|
Real Estate Settlement Procedures Act, requiring that borrowers for mortgage loans for one-to-four family residential real estate receive various disclosures, including good faith estimates of settlement costs, lender servicing and escrow account practices, and prohibiting certain practices that increase the cost of settlement services;
|
|
•
|
Home Mortgage Disclosure Act, requiring financial institutions to provide information to enable the public and public officials to determine whether a financial institution is fulfilling its obligation to help meet the housing needs of the community it serves;
|
|
•
|
Equal Credit Opportunity Act and the Fair Housing Act, prohibiting discrimination on the basis of race, creed or other prohibited factors in extending credit;
|
|
•
|
Fair Credit Reporting Act, governing the use and provision of information to credit reporting agencies;
|
|
•
|
Fair Debt Collection Act, governing the manner in which consumer debts may be collected by collection agencies;
|
|
•
|
Flood Disaster Protection Act, requiring flood insurance of collateral properties located in designated flood zones;
|
|
•
|
Servicemembers' Civil Relief Act a program that
provides a wide range of protections in lending for individuals entering, called to active duty in the military, or deployed service members;
and
|
|
•
|
Rules and regulations of the various federal agencies charged with the responsibility of implementing such federal laws.
|
The operations of Northfield Bank also are subject to the:
|
•
|
Truth in Savings Act;
|
|
•
|
Right to Financial Privacy Act, which imposes a duty to maintain confidentiality of consumer financial records and prescribes procedures for complying with administrative subpoenas of financial records;
|
|
•
|
Electronic Funds Transfer Act, which governs automatic deposits to and withdrawals from deposit accounts and customers’ rights and liabilities arising from the use of automated teller machines and other electronic banking services;
|
28
|
•
|
Check Clearing for the 21st Century Act (also known as Check 21), which gives “substitute checks,” such as digital check images and copies made from that image, the same legal standing as the original paper check;
|
|
•
|
The USA PATRIOT Act, which requires banks and savings institutions to, among other things, establish broadened anti-money laundering compliance programs and due diligence policies and controls to ensure the detection and reporting of money laundering. Such required compliance programs are intended to supplement pre-existing compliance requirements that apply to financial institutions under the Bank Secrecy Act and the Office of Foreign Assets Control regulations; and
|
|
•
|
The Gramm-Leach-Bliley Act, which places limitations on the sharing of consumer financial information by financial institutions with unaffiliated third parties and requires all financial institutions offering products or services to retail customers to provide such customers with the financial institution’s privacy policy and allow such customers the opportunity to “opt out” of the sharing of certain personal financial information with unaffiliated third parties.
|
Holding Company Regulation
Northfield Bancorp, Inc. is a unitary savings and loan holding company subject to regulation and supervision by the FRB. The FRB has enforcement authority over Northfield Bancorp, Inc. and its non-savings institution subsidiaries. Among other things, that authority permits the FRB to restrict or prohibit activities that are determined to be a risk to Northfield Bank.
As a savings and loan holding company, Northfield Bancorp, Inc.'s activities are limited to those activities permissible by law for financial holding companies (if Northfield Bancorp elects financial holding company status and otherwise qualifies to be a financial holding company) or multiple savings and loan holding companies. A financial holding company may engage in activities that are financial in nature, incidental to financial activities or complementary to a financial activity. Such activities include lending and other activities permitted for bank holding companies under Section 4(c)(8) of the Bank Holding Company Act, insurance and underwriting equity securities. The Dodd-Frank Act added that any savings and loan holding company that engages in activities that are solely permissible for a financial holding company must meet the qualitative requirements for a bank holding company to be a financial holding company and conduct the activities in accordance with the requirements that would apply to a financial holding company’s conduct of the activity. Multiple savings and loan companies are authorized to engage in activities specified by FRB regulation, including activities permitted for bank holding companies under Section 4(c)(8) of the Bank Holding Company Act.
Federal law prohibits a savings and loan holding company, directly or indirectly, or through one or more subsidiaries, from acquiring more than 5% of another savings institution or savings and loan holding company without prior written approval of the FRB and from acquiring or retaining control of any depository not insured by the FDIC. In evaluating applications by holding companies to acquire savings institutions, the FRB must consider such things as the financial and managerial resources and future prospects of the company and institution involved, the effect of the acquisition on and the risk to the federal deposit insurance fund, the convenience and needs of the community and competitive factors. An acquisition by a savings and loan holding company of a savings institution in another state to be held as a separate subsidiary may not be approved unless it is a supervisory acquisition under Section 13(k) of the Federal Deposit Insurance Act or the law of the state in which the target is located authorizes such acquisitions by out-of-state companies.
Savings and loan holding companies such as Northfield Bancorp, Inc. are subject to consolidated regulatory capital requirements that are as stringent as those required for the insured depository subsidiaries such as Northfield Bank. Consolidated regulatory capital requirements identical to those applicable to the subsidiary depository institutions also apply to savings and loan holding companies. As is the case with institutions themselves, the capital conservation buffer is being phased in between 2016 and 2019. Northfield Bancorp, Inc. exceeded the FRB’s consolidated capital requirements as of
December 31, 2017
.
The Dodd-Frank Act extended the “source of strength” doctrine to savings and loan holding companies. The FRB has issued regulations implementing the “source of strength” policy that requires holding companies act as a source of strength to their subsidiary depository institutions by providing capital, liquidity, and other support in times of financial stress.
The FRB has issued a policy statement regarding the payment of dividends and the repurchase of shares of common stock by bank and savings and loan holding companies. In general, the policy provides that dividends should be paid only out of current earnings and only if the prospective rate of earnings retention by the holding company appears consistent with the organization’s capital requirements, asset quality and overall financial condition. Regulatory guidance provides for prior regulatory review of capital distributions in certain circumstances such as where the company’s net income for the past four quarters, net of dividends previously paid over that period, is insufficient to fully fund the dividend or the company’s overall rate of earnings retention is
29
inconsistent with the company’s capital needs and overall financial condition. The ability of a holding company to pay dividends may be restricted if a subsidiary bank becomes undercapitalized. The policy statement also specifies that a holding company should advise FRB supervisory staff prior to redeeming or repurchasing common or perpetual preferred stock when the holding company is experiencing financial weaknesses or redeeming or repurchasing common stock or perpetual preferred stock such that the repurchase or redemption would result in a net reduction as of the end of a quarter in the amount of such equity instruments outstanding compared with the beginning of the quarter in which the redemption or repurchase occurs. These regulatory policies could affect the ability of Northfield Bancorp, Inc. to pay dividends, repurchase common stock or otherwise engage in capital distributions.
Federal Securities Laws
Northfield Bancorp, Inc.’s common stock is registered with the Securities and Exchange Commission under the Securities Exchange Act of 1934, as amended. Northfield Bancorp, Inc. is subject to the information, proxy solicitation, insider trading restrictions, and other requirements under the Securities Exchange Act of 1934.
Sarbanes-Oxley Act of 2002
The Sarbanes-Oxley Act of 2002 addresses, among other issues, corporate governance, auditing and accounting, executive compensation, and enhanced and timely disclosure of corporate information. As directed by the Sarbanes-Oxley Act, our Chief Executive Officer and Chief Financial Officer are required to certify that our quarterly and annual reports do not contain any untrue statement of a material fact. The rules adopted by the Securities and Exchange Commission under the Sarbanes-Oxley Act have several requirements, including having these officers certify that: (i) they are responsible for establishing, maintaining and regularly evaluating the effectiveness of our disclosure controls and procedures and internal control over financial reporting; (ii) they have made certain disclosures to our auditors and the audit committee of the Board of Directors about our internal control over financial reporting; and (iii) they have included information in our quarterly and annual reports about the effectiveness of our disclosure controls and procedures and whether there have been any changes in our internal control over financial reporting or in other factors that could materially affect internal control over financial reporting.
Change in Control Regulations
Under the Change in Bank Control Act, no person may acquire control of a savings and loan holding company, such as Northfield Bancorp, Inc., unless the FRB has been given 60 days prior written notice and has not issued a notice disapproving the proposed acquisition, taking into consideration certain factors, including the financial and managerial resources of the acquirer and the competitive effects of the acquisition. Control, as defined under federal law, means ownership, control of or holding irrevocable proxies representing more than 25% of any class of voting stock, control in any manner of the election of a majority of the institution’s directors, or a determination by the regulator that the acquirer has the power to direct, or directly or indirectly to exercise a controlling influence over, the management or policies of the institution. Acquisition of more than 10% of any class of a savings and loan holding company’s voting stock constitutes a rebuttable determination of control under the regulations under certain circumstances including where, as is the case with Northfield Bancorp, Inc., the issuer has registered securities under Section 12 of the Securities Exchange Act of 1934.
TAXATION
Federal Taxation
General
.
Northfield Bank and Northfield Bancorp, Inc. are subject to federal income taxation in the same general manner as other corporations, with some exceptions discussed below. Northfield Bancorp, Inc.'s consolidated federal tax returns are not currently under audit.
On December 22, 2017, H.R.1, commonly known as the Tax Cuts and Jobs Act (the “Tax Act”), was signed into law. The Tax Act includes many provisions that will affect our income tax expense, including reducing our federal tax rate from 35% to 21%, effective January 1, 2018. As a result of this rate reduction, we are required to re-measure, through income tax expense in the period of enactment, our deferred tax assets and liabilities using the enacted rate at which we expect them to be recovered or settled. The re-measurement of our net deferred tax asset resulted in additional 2017 income tax expense of $10.5 million.
The following discussion of federal taxation is intended only to summarize certain pertinent federal income tax matters and is not a comprehensive description of the tax rules applicable to Northfield Bancorp, Inc. or Northfield Bank.
30
Method of Accounting
.
For federal income tax purposes, Northfield Bancorp, Inc. currently reports its income and expenses on the accrual method of accounting and uses a tax year ending December 31 for filing its federal and state income tax returns.
Taxable Distributions and Recapture
.
Prior to 1996, bad debt reserves created prior to 1988 were subject to recapture into taxable income if Northfield Bank failed to meet certain thrift asset and definitional tests or made certain distributions. Tax law changes in 1996 eliminated thrift-related recapture rules. However, under current law, pre-1988 tax bad debt reserves remain subject to recapture if Northfield Bank makes certain non-dividend distributions, repurchases any of its common stock, pays dividends in excess of earnings and profits, or fails to qualify as a “bank” for tax purposes. At
December 31, 2017
, the total federal pre-base year bad debt reserve of Northfield Bank was approximately $5.9 million.
Alternative Minimum Tax
.
Prior to December 31, 2017, the Internal Revenue Code of 1986, as amended, imposed an alternative minimum tax at a rate of 20% on a base of regular taxable income plus certain tax preferences, less any available exemption. The alternative minimum tax is imposed to the extent it exceeds the regular income tax. Net operating losses can offset no more than 90% of alternative taxable income. Certain payments of alternative minimum tax may be used as credits against regular tax liabilities in future years. Effective January 1, 2018, the corporate AMT is repealed. Northfield Bancorp, Inc.’s consolidated group has not been subject to the alternative minimum tax and has no such amounts available as credits for carryover.
Net Operating Loss Carryovers
.
A financial institution may carry back net operating losses to the preceding two taxable years and forward to the succeeding 20 taxable years. At
December 31, 2017
, Northfield Bancorp, Inc.’s consolidated group had no net operating loss carryforwards for federal income tax purposes.
Corporate Dividends-Received Deduction
.
Northfield Bancorp, Inc. may exclude from its federal taxable income 100% of dividends received from Northfield Bank as a wholly-owned subsidiary by filing consolidated tax returns. Through December 31, 2017, the corporate dividends-received deduction is 80% in the case of dividends received from a corporation in which a corporate recipient owns at least 20% of its stock, and corporations that own less than 20% of the stock of a corporation distributing a dividend may deduct only 70% of dividends received or accrued on their behalf. Effective January 1, 2018, the dividends received deduction decreases from 80% to 65% and 70% to 50% for corporate recipients owning at least 20% or less than 20%, respectively, of a corporation’s stock.
State Taxation
New York State Taxation.
In 2014, New York State enacted several reforms (the “Tax Reform Package”) to its tax structure, including changes to the franchise, sales, estate, and personal income taxes. These changes were effective on January 1, 2015. The Tax Reform Package is intended to simplify the existing corporate tax code for New York State businesses while remaining relatively neutral in relation to corporate tax receipts.
Under the Tax Reform Package, the New York State corporate income tax rate decreased, effective January 1, 2016, from 7.10% to 6.50%. Effective January 1, 2015, the Metropolitan Transportation Authority (“MTA”) Tax Surcharge rate allocable to business activities carried on in the Metropolitan Commuter Transportation District increased from 17.0% to 25.6%. The MTA surcharge rate for years beginning on or after January 1, 2017 was 28.3% and increases to 28.6% for years beginning after January 1, 2018, and before January 1, 2019. The rate will remain the same in succeeding years unless otherwise adjusted. Some of the most significant elements of the Tax Reform Package include the merger of the bank tax into the general corporate franchise tax, expanded application of economic nexus, adoption of water’s-edge unitary reporting, and apportionment of source income solely by reference to customer location.
New York City Taxation.
Northfield Bank reports income on a calendar year basis to New York City. In 2015, New York City enacted provisions to its tax law to conform its corporate and banking tax laws to those of New York State, retroactive to
31
January 1, 2015. For tax years beginning on or after January 1, 2015, the New York City income tax rate applied to the Company apportioned New York City taxable income is 8.85%.
Our New York State and New York City tax returns are currently under audit for tax years 2010 through 2014.
New Jersey State Taxation.
Northfield Bancorp, Inc. and Northfield Bank file New Jersey Corporation Business Tax returns on a calendar year basis. Generally, the income derived from New Jersey sources is subject to New Jersey tax. Northfield Bancorp, Inc. and Northfield Bank pay the greater of the corporate business tax at 9% of taxable income or the minimum tax of $1,200 per entity.
Delaware State Taxation.
As a Delaware business corporation, Northfield Bancorp, Inc. is required to file an annual report with and pay franchise taxes to the state of Delaware.
32
|
ITEM 1A.
|
RISK FACTORS
|
The material risks and uncertainties that management believes affect us are described below. You should carefully consider the risks and uncertainties described below, together with all of the other information included or incorporated by reference herein. The risks and uncertainties described below are not the only ones facing us. Additional risks and uncertainties that management is not aware of or focused on or that management currently deems immaterial may also impair our business operations. This report is qualified in its entirety by these risk factors. See also, “Forward-Looking Statements.”
The level of our commercial real estate loan portfolio subjects us to additional regulatory scrutiny.
The OCC and the other federal bank regulatory agencies have promulgated joint guidance on sound risk management practices for financial institutions with concentrations in commercial real estate lending. Under the guidance, a financial institution that, like us, is actively involved in commercial real estate lending should perform a risk assessment to identify concentrations. A financial institution may have a concentration in commercial real estate lending if, among other factors, (i) total reported loans for construction, land acquisition and development, and other land represent 100% or more of total capital, or (ii) total reported loans secured by multifamily and non-farm residential properties, loans for construction, land acquisition and development and other land, and loans otherwise sensitive to the general commercial real estate market, including loans to commercial real estate related entities, represent 300% or more of total capital.
Based on these factors we have a concentration in multifamily and commercial real estate lending, as such loans represent 413% of Northfield Bank's capital as of
December 31, 2017
. The particular focus of the guidance is on exposure to commercial real estate loans that are dependent on the cash flow from the real estate held as collateral and that are likely to be at greater risk to conditions in the commercial real estate market (as opposed to real estate collateral held as a secondary source of repayment or as an abundance of caution). The purpose of the guidance is to guide banks in developing risk management practices and capital levels commensurate with the level and nature of real estate concentrations. The guidance states that management should employ heightened risk management practices including board and management oversight and strategic planning, development of underwriting standards, risk assessment, and monitoring through market analysis and stress testing. While we believe we have implemented policies and procedures with respect to our commercial real estate loan portfolio consistent with this guidance, bank regulators could require us to implement additional policies and procedures consistent with their interpretation of the guidance that may result in additional costs to us or that may result in a curtailment of our multifamily and commercial real estate lending and/or the requirement that we maintain higher levels of regulatory capital, either of which would adversely affect our loan originations and profitability.
Our concentration in multifamily loans and commercial real estate loans could expose us to increased lending risks and related loan losses.
Our current business strategy is to continue to originate multifamily loans and to a lesser extent other commercial real estate loans. At
December 31, 2017
,
$2.54 billion
, or
81.0%
of our loan portfolio held-for-investment, net, consisted of multifamily and other commercial real estate loans.
These types of loans generally expose a lender to greater risk of non-payment and loss than one-to-four family residential mortgage loans because repayment of the loans often depends on the successful operation of the properties and the sale of such properties securing the loans. Such loans typically involve larger loan balances to single borrowers or groups of related borrowers compared to one-to-four family residential mortgage loans. Also, many of our borrowers have more than one of these types of loans outstanding. Consequently, an adverse development with respect to one loan or one credit relationship can expose us to a significantly greater risk of loss compared to an adverse development with respect to a one-to-four family residential real estate loan.
In addition, if loans that are collateralized by real estate become troubled and the value of the real estate has been significantly impaired, then we may not be able to recover the full contractual amount of principal and interest that we anticipated at the time we originated the loan, which could cause us to increase our provision for loan losses and adversely affect our operating results and financial condition.
33
Implementing our growth strategies could cause us to incur significant costs and expenses which may negatively affect our financial condition and results of operations
We expect to continue to grow our assets, the level of our deposits or borrowings, and the scale of our operations. Achieving our growth targets depends, in part, on our ability to attract customers that currently bank at other financial institutions in our market, thereby increasing our share of the market, implement new lines of business or offer new products and services within existing lines of business, identify favorable loan and investment opportunities, and acquire other banks and non-bank entities. Our ability to grow successfully will depend on a variety of factors, including our ability to attract and retain experienced bankers, the continued availability of desirable business opportunities, competitive responses from other financial institutions in our market areas and our ability to manage our growth. Growth opportunities may not be available or we may not be able to manage our growth successfully. If we do not manage our growth effectively, our financial condition and operating results could be negatively affected.
If our allowance for loan losses is not sufficient to cover actual loan losses, our earnings and capital could decrease.
We make various assumptions and judgments about the collectability of our loan portfolio, including the creditworthiness of our borrowers and the value of the real estate and other assets serving as collateral for the repayment of many of our loans. In determining the amount of the allowance for loan losses, we review our loans and our loss and delinquency experience, as well as the experience of other similarly situated institutions, and we evaluate other factors including, among other things, current economic conditions. If our assumptions are incorrect, or if delinquencies do not continue to improve or non-accrual and non-performing loans increase, our allowance for loan losses may not be sufficient to cover losses inherent in our loan portfolio, which would require additions to our allowance. Material additions to our allowance would materially decrease our net income.
The Financial Accounting Standards Board has adopted a new accounting standard that will be effective for us for the fiscal year beginning January 1, 2020. This standard, referred to as Current Expected Credit Loss, or CECL, will require financial institutions to determine periodic estimates of lifetime expected credit losses on loans, and recognize the expected credit losses as allowances for loan losses. This will change the current method of providing allowances for loan losses that are probable, which may require us to increase our allowance for loan losses, and to greatly increase the types of data we will need to collect and review to determine the appropriate level of the allowance for loan losses. We are currently evaluating the effect the CECL model will have on our consolidated financial statements, but the extent of the effect is indeterminable at this time as it will be dependent upon the nature and characteristics of the Company's loan portfolio at the adoption date, as well as economic conditions and forecasts at that date. Any requirement to increase our allowance for loan losses or expenses incurred to determine the appropriate level of the allowance for loan losses could have a material adverse effect on our financial condition and results of operations.
In addition, bank regulators periodically review our allowance for loan losses and, based on information available to them at the time of their review, may require us to increase our allowance for loan losses or recognize further loan charge-offs. An increase in our allowance for loan losses or loan charge-offs as required by these regulatory authorities may have a material adverse effect on our financial condition and results of operations.
A decline in economic conditions could reduce demand for our products and services and/or result in increases in our level of non-performing loans, which could have an adverse effect on our results of operations.
Unlike larger financial institutions that are more geographically diversified, our profitability depends primarily on the general economic conditions in New York, New Jersey and to a lesser extent eastern Pennsylvania. Local economic conditions have a significant impact on our commercial real estate, construction, and consumer loans, the ability of the borrowers to repay these loans and the value of the collateral securing these loans. Almost all of our loans are to borrowers located in or secured by collateral in the New York metropolitan area.
Deterioration in economic conditions could result in the following consequences, any of which could have a material adverse effect on our business, financial condition, liquidity and results of operations:
|
•
|
demand for our products and services may decline;
|
|
•
|
loan delinquencies, problem assets, and foreclosures may increase;
|
|
•
|
collateral for loans, especially real estate, may decline in value, in turn reducing customers’ future borrowing power, and reducing the value of assets and collateral associated with existing loans;
|
34
|
•
|
the value of our securities portfolio may decline; and
|
|
•
|
the net worth and liquidity of loan guarantors may decline, impairing their ability to honor commitments to us.
|
Moreover, a significant decline in general economic conditions, caused by inflation, recession, acts of terrorism, an outbreak of hostilities or other international or domestic events, tax reform, unemployment or other factors beyond our control could further affect these local economic conditions and could further negatively affect the financial results of our banking operations. In addition, deflationary pressures, while possibly lowering our operating costs, could have a significant negative effect on our borrowers, especially our business borrowers, and the values of underlying collateral securing loans, which could negatively affect our financial performance.
Strong traditional and non-traditional competition within our market areas may limit our growth and profitability.
We face intense competition in making loans and attracting deposits. Price competition from other financial institutions, credit unions, money market and mutual funds, insurance companies, and other non-traditional competitors such as financial technology companies for loans and deposits sometimes results in us charging lower interest rates on our loans and paying higher interest rates on our deposits and may reduce our net interest income. Competition also makes it more difficult and costly to attract and retain qualified employees. Many of the institutions with which we compete have substantially greater resources and lending limits than we have and may offer services that we do not provide. Our competitors also may price loan and deposit products aggressively when they enter into new lines of business or new market areas. We expect competition to increase in the future as a result of legislative, regulatory, and technological changes and the continuing trend of consolidation in the financial services industry. If we are not able to compete effectively in our market area, our profitability may be negatively affected. The greater resources and broader offering of deposit and loan products of some of our competitors may also limit our ability to increase our interest-earning assets.
The composition of our balance sheet continues to be more heavily weighted towards loans and therefore changes in market interest rates
in an increasing rate environment
could adversely affect our financial condition and results of operations.
Our financial condition and results of operations are significantly affected by changes in market interest rates. Our results of operations substantially depend on our net interest income, which is the difference between the interest income we earn on our interest-earning assets and the interest expense we pay on our interest-bearing liabilities. Our interest-bearing liabilities generally reprice or mature more quickly than our interest-earning assets. If rates increase rapidly, we would likely have to increase the rates we pay on our deposits and borrowed funds more quickly than interest rates earned on our loans and investments, resulting in a negative effect on interest spreads and net interest income. In addition, the effect of rising rates could be compounded if deposit customers move funds from transaction and savings accounts to higher rate money market or certificate of deposit accounts. Conversely, should market interest rates fall below current levels, our net interest margin could also be affected negatively if competitive pressures keep us from further reducing rates on our deposits, while the yields on our assets decrease more rapidly through loan prepayments and interest rate adjustments.
Increases in interest rates also may decrease loan demand and/or may make it more difficult for borrowers to repay adjustable rate loans. Additionally, increases in interest rates may increase capitalization rates utilized in valuing income-producing properties. This can result in lower appraised values, which can limit the ability of borrowers to refinance existing debt and may result in higher charge-offs of our non-performing collateral dependent loans.
Monetary policies and regulations of the FRB could adversely affect our business, financial condition and results of operations.
In addition to being affected by general economic conditions, our earnings and growth are affected by the policies of the FRB. An important function of the FRB is to regulate the money supply and credit environment. Among the instruments used by the FRB to implement these objectives are open market purchases and sales of U.S. government securities, adjustments of the discount rate and changes in banks’ reserve requirements against bank deposits. These instruments are used in varying combinations to influence overall economic growth and the distribution of credit, bank loans, investments and deposits. Their use also affects interest rates charged on loans or paid on deposits.
The monetary policies and regulations of the FRB have had a significant effect on the operating results of financial institutions in the past and are expected to continue to do so in the future. The effects of such policies upon our business, financial condition and results of operations cannot be predicted.
35
Our balance sheet composition is weighted towards investments in assets with longer durations.
We are subject to reinvestment risk associated with changes in interest rates. Changes in interest rates may affect the average life of loans and mortgage-related securities. Decreases in interest rates often result in increased prepayments of loans and mortgage-related securities, as borrowers refinance their loans to reduce borrowings costs. Under these circumstances, we are subject to reinvestment risk to the extent we are unable to reinvest the cash received from such prepayments in loans or other investments that have interest rates that are comparable to the interest rates on existing loans and securities. Increases in interest rates generally reduce prepayments. Additionally, increases in interest rates may decrease loan demand and/or make it more difficult for borrowers to repay adjustable-rate loans.
Changes in interest rates also affect the value of our interest earning assets and in particular the carrying value of our securities portfolio. Generally, the value of interest-earning assets fluctuates inversely with changes in interest rates. To the extent interest rates increase and the value of our available-for-sale portfolio decreases, our stockholders’ equity will be adversely affected.
At
December 31, 2017
, our simulation model indicated that our net portfolio value (the net present value of our interest-earning assets and interest-bearing liabilities) would decrease by
10.28%
if there was an instantaneous parallel 200 basis point increase in market interest rates. Although interest rate risk calculations provide an indication of our interest rate risk exposure at a particular point in time, such measurements are not intended to and do not provide a precise forecast of the effect of changes in market interest rates on our net portfolio value or net interest income and likely will differ from actual results.
Historically low interest rates may adversely affect our net interest income and profitability.
During the past several years it has been the policy of the FRB to maintain interest rates at historically low levels through its targeted federal funds rate and purchases of mortgage-backed securities. As a result, market rates on the loans we have originated and the yields on securities we have purchased have been at lower levels than as available prior to 2008.
As a general matter, our interest-bearing liabilities reprice or mature more quickly than our interest-earning assets. However, our ability to lower our interest expense is limited at these interest rate levels while the average yield on our interest-earning assets may continue to decrease. Accordingly, our net interest income (the difference between interest income earned on assets and interest expense paid on liabilities) may decrease, which may have an adverse effect on our future profitability.
Our funding sources may prove insufficient to replace deposits and support our future growth.
We must maintain sufficient funds to respond to the needs of depositors and borrowers. As a part of our liquidity management, we use a number of funding sources in addition to core deposit growth and repayments and maturities of loans and investments. These additional sources consist primarily of FHLB advances, proceeds from the sale of loans, federal funds purchased, and brokered certificates of deposit. As we continue to grow, we are likely to become more dependent on these sources. Adverse operating results or changes in industry conditions could lead to difficulty or an inability to access these additional funding sources. Our financial flexibility will be severely constrained if we are unable to maintain our access to funding or if adequate financing is not available to accommodate future growth at acceptable interest rates. If we are required to rely more heavily on more expensive funding sources to support future growth, our revenues may not increase proportionately to cover our costs. In this case, our operating margins and profitability would be adversely affected.
Our success depends on hiring and retaining certain key personnel.
Our performance largely depends on the talents and efforts of highly skilled individuals. We rely on key personnel to manage and operate our business, including major revenue generating functions such as loan and deposit generation. The loss of key staff may adversely affect our ability to maintain and manage these functions effectively, which could negatively affect our revenues. In addition, loss of key personnel could result in increased recruiting and hiring expenses, which could cause a decrease in our net income. Our continued ability to compete effectively depends on our ability to attract new employees and to retain and motivate our existing employees.
Risks associated with system failures, interruptions, or breaches of security could affect our earnings negatively.
Information technology systems are critical to our business. We use various technology systems to manage our customer relationships, general ledger, securities, deposits, and loans. We have established policies and procedures to prevent or limit the effect of system failures, interruptions, and security breaches, but such events may still occur or may not be adequately addressed if they do occur. In addition, any compromise of our systems could deter customers from using our
36
products and services. Although we rely on security systems to provide security and authentication necessary to effect the secure transmission of data, these precautions may not protect our systems from compromises or breaches of security.
In addition, we outsource a majority of our data processing to certain third-party providers. If these third-party providers encounter difficulties, or if we have difficulty communicating with them, our ability to adequately process and account for transactions could be affected, and our business operations could be adversely affected. Threats to information security also exist in the processing of customer information through various other vendors and their personnel.
The occurrence of any system failures, interruption, or breach of security could damage our reputation and result in a loss of customers and business thereby subjecting us to additional regulatory scrutiny, or could expose us to litigation and possible financial liability. Any of these events could have a material adverse effect on our financial condition and results of operations.
Cyber-attacks or other security breaches could adversely affect our operations, net income, or reputation.
We regularly collect, process, transmit and store significant amounts of confidential information regarding our customers, employees and others and concerning our own business, operations, plans and strategies. In some cases, this confidential or proprietary information is collected, compiled, processed, transmitted, or stored by third parties on our behalf.
Information security risks have generally increased in recent years because of the proliferation of new technologies, the use of the Internet and telecommunications technologies to conduct financial and other transactions, and the increased sophistication and activities of perpetrators of cyber-attacks and mobile phishing. Mobile phishing, a means for identity thieves to obtain sensitive personal information through fraudulent e-mail, text or voice mail, is an emerging threat targeting the customers of financial entities. A failure in or breach of our operational or information security systems, or those of our third-party service providers, as a result of cyber-attacks or information security breaches or due to employee error, malfeasance or other disruptions could adversely affect our business, result in the disclosure or misuse of confidential or proprietary information, damage our reputation, increase our costs and/or cause losses.
If this confidential or proprietary information were to be mishandled, misused, or lost, we could be exposed to significant regulatory consequences, reputational damage, civil litigation, and financial loss.
Although we employ a variety of physical, procedural, and technological safeguards to protect this confidential and proprietary information from mishandling, misuse, or loss, these safeguards do not provide absolute assurance that mishandling, misuse, or loss of the information will not occur, and that if mishandling, misuse, or loss of information does occur, those events will be promptly detected and addressed. Similarly, when confidential or proprietary information is collected, compiled, processed, transmitted or stored by third parties on our behalf, our policies and procedures require that the third party agree to maintain the confidentiality of the information, establish and maintain policies and procedures designed to preserve the confidentiality of the information, and permit us to confirm the third party’s compliance with the terms of the agreement. As information security risks and cyber threats continue to evolve, we may be required to expend additional resources to continue to enhance our information security measures and/or to investigate and remediate any information security vulnerabilities.
Changes in our accounting policies or in accounting standards could materially affect how we report our financial condition and results of operations.
Our accounting policies are essential to understanding our financial results and condition. Some of these policies require the use of estimates and assumptions that may affect the value of our assets or liabilities and financial results. Some of our accounting policies are critical because they require management to make difficult, subjective, and complex judgments about matters that are inherently uncertain and because it is likely that materially different amounts would be reported under different conditions or using different assumptions. If such estimates or assumptions underlying our financial statements are incorrect, we may experience material losses.
From time to time, the Financial Accounting Standards Board and the Securities and Exchange Commission change the financial accounting and reporting standards or the interpretation of those standards that govern the preparation of our financial statements. These changes are beyond our control, can be hard to predict and could materially affect how we report our results of operations and financial condition. We could also be required to apply a new or revised standard retroactively, resulting in our restating prior period financial statements in material amounts.
37
We hold certain intangible assets that could be classified as impaired in the future. If these assets are considered to be either partially or fully impaired in the future, our earnings and the book values of these assets would decrease.
We are required to test our goodwill for impairment on a periodic basis. The impairment testing process considers a variety of factors, including the current market price of our common shares, the estimated net present value of our assets and liabilities and information concerning the terminal valuation of similarly situated insured depository institutions. It is possible that future impairment testing could result in a partial or full impairment of the value of our goodwill. If an impairment determination is made in a future reporting period, our earnings and the book value of goodwill will be reduced by the amount of the impairment.
We are required to maintain a significant percentage of our total assets in residential mortgage loans and investments secured by residential mortgage loans, which restricts our ability to diversify our loan portfolio.
A federal savings bank differs from a commercial bank in that it is required to maintain at least 65% of its total assets in “qualified thrift investments,” which generally includes loans and investments for the purchase, refinance, construction, improvement, or repair of residential real estate, as well as home equity loans, education loans and small business loans. To maintain our federal savings bank charter we have to be a “qualified thrift lender” or “QTL” in nine out of each 12 immediately preceding months. The QTL requirement limits the extent to which we can grow our commercial loan portfolio, and failing the QTL test can result in an enforcement action. However, a loan that does not exceed $2 million (including a group of loans to one borrower) that is for commercial, corporate, business, or agricultural purposes is included in our qualified thrift investments. As of
December 31, 2017
, we maintained 80.1% of our portfolio assets in qualified thrift investments. Because of the QTL requirement, we may be limited in our ability to change our asset mix and increase the yield on our earning assets by growing our commercial loan portfolio.
In addition, if we continue to grow our commercial real estate loan portfolio and our residential mortgage loan portfolio decreases, it is possible that in order to maintain our QTL status, we could be forced to buy mortgage-backed securities or other qualifying assets at times when the terms of such investments may not be attractive. Alternatively, we may find it necessary to pursue different structures, including converting Northfield Bank’s savings bank charter to a commercial bank charter.
Because the nature of the financial services business involves a high volume of transactions, we face significant operational risks, including fraud.
We operate in diverse markets and rely on the ability of our employees and systems to process a high number of transactions over short periods of time. Operational risk is the risk of loss resulting from our operations, including but not limited to, the risk of fraud by employees or persons outside our company, the execution of unauthorized transactions by employees, errors relating to transaction processing and technology, breaches of the internal control system and compliance requirements, and business continuation and disaster recovery. Insurance coverage may not be available for such losses, or where available, such losses may exceed insurance limits. This risk of loss also includes the potential legal actions that could arise as a result of an operational deficiency or as a result of noncompliance with applicable regulatory standards, adverse business decisions or their implementation, and customer attrition due to potential negative publicity. In the event of a breakdown in the internal control system, improper operation of systems or improper employee actions, we could suffer financial loss, face regulatory action, and suffer damage to our reputation.
We are subject to extensive regulatory oversight.
We are subject to extensive supervision, regulation, and examination by the OCC, the FRB, and the FDIC. As a result, we are limited in the manner in which we conduct our business, undertake new investments and activities, and obtain financing. This regulatory structure is designed primarily for the protection of the Deposit Insurance Fund and our depositors, and not to benefit our stockholders. This regulatory structure also gives the regulatory authorities extensive discretion in connection with their supervisory and enforcement actions and examination policies, including policies with respect to capital levels, the timing and amount of dividend payments, the classification of assets, the establishment of adequate loan loss reserves for regulatory purposes and the timing and amounts of assessments and fees.
In addition, we must comply with significant anti-money laundering and anti-terrorism laws and regulations. Government agencies have the authority to impose monetary penalties and other sanctions on institutions that fail to comply with these laws and regulations, which could significantly affect our business activities, including our ability to acquire other financial institutions or expand our branch network.
38
We are subject to the Community Reinvestment Act and fair lending laws, and failure to comply with these laws could lead to material penalties.
The Community Reinvestment Act, the Equal Credit Opportunity Act, the Fair Housing Act and other fair lending laws and regulations impose nondiscriminatory lending requirements on financial institutions. A successful regulatory challenge to an institution’s performance under the Community Reinvestment Act or fair lending laws and regulations could result in a wide variety of sanctions, including the required payment of damages and civil money penalties, injunctive relief, imposition of restrictions on mergers and acquisitions activity and restrictions on expansion. Private parties may also have the ability to challenge an institution’s performance under fair lending laws in private class action litigation. Such actions could have a material adverse effect on our business, financial condition and results of operations.
The FRB may require us to commit capital resources to support Northfield Bank.
Federal law requires that a holding company act as a source of financial and managerial strength to its subsidiary bank and to commit resources to support such subsidiary bank. Under the “source of strength” doctrine, the FRB may require a holding company to make capital injections into a troubled subsidiary bank and may charge the holding company with engaging in unsafe and unsound practices for failure to commit resources to a subsidiary bank. A capital injection may be required at times when the holding company may not have the resources to provide it and therefore may be required to borrow the funds or raise capital. Any loans by a holding company to its subsidiary bank are subordinate in right of payment to deposits and to certain other indebtedness of such subsidiary bank. In the event of a holding company’s bankruptcy, the bankruptcy trustee will assume any commitment by the holding company to a federal bank regulatory agency to maintain the capital of a subsidiary bank. Moreover, bankruptcy law provides that claims based on any such commitment will be entitled to a priority of payment over the claims of the institution’s general unsecured creditors, including the holders of its note obligations. Thus, any borrowing that must be done by the Company to make a required capital injection becomes more difficult and expensive and could have an adverse effect on our business, financial condition and results of operations.
Legislative or regulatory responses to perceived financial and market problems could impair our rights against borrowers.
Federal, state and local laws and policies could reduce the amount distressed borrowers are otherwise contractually obligated to pay under their mortgage loans, and may limit the ability of lenders to foreclose on mortgage collateral. Restrictions on Northfield Bank’s rights as creditor could result in increased credit losses on our loans and mortgage-backed securities, or increased expense in pursuing our remedies as a creditor.
Non-compliance with the USA PATRIOT Act, Bank Secrecy Act, or other laws and regulations could result in fines or sanctions.
The USA PATRIOT and Bank Secrecy Acts require financial institutions to develop programs to prevent financial institutions from being used for money laundering and terrorist activities. If such activities are detected, financial institutions are obligated to file suspicious activity reports with the U.S. Treasury’s Office of Financial Crimes Enforcement Network. These rules require financial institutions to establish procedures for identifying and verifying the identity of customers seeking to open new financial accounts. Failure to comply with these regulations could result in fines or sanctions. Recently, several banking institutions have received large fines for non-compliance with these laws and regulations. While we have developed policies and procedures designed to assist in compliance with these laws and regulations, these policies and procedures may not be effective in preventing violations of these laws and regulations.
Final regulations could restrict our ability to originate and sell loans.
The Consumer Financial Protection Bureau has issued a rule designed to clarify for lenders how they can avoid legal liability under the Dodd-Frank Act, which would hold lenders accountable for ensuring a borrower’s ability to repay a mortgage. Loans that meet this “qualified mortgage” definition will be presumed to have complied with the new ability-to-repay standard. Under the Consumer Financial Protection Bureau’s rule, a “qualified mortgage” loan must not contain certain specified features, including:
|
•
|
excessive upfront points and fees (those exceeding 3% of the total loan amount, less “bona fide discount points” for prime loans);
|
|
•
|
interest-only payments;
|
|
•
|
negative-amortization; or
|
39
|
•
|
terms longer than 30 years.
|
Also, to qualify as a “qualified mortgage”, a loan must be made to a borrower whose total monthly debt-to-income ratio does not exceed 43%. Lenders must also verify and document the income and financial resources relied upon to qualify the borrower on the loan and underwrite the loan based on a fully amortizing payment schedule and maximum interest rate during the first five years, taking into account all applicable taxes, insurance, and assessments.
In addition, the Dodd-Frank Act requires the Consumer Financial Protection Bureau to adopt rules and publish forms that combine certain disclosures that consumers receive in connection with applying for and closing on certain mortgage loans under the Truth in Lending Act and the Real Estate Settlement Procedures Act. The Consumer Financial Protection Bureau has implemented a final rule to implement this requirement, and the final rule was effective in October 2015.
In addition, the Dodd-Frank Act requires the regulatory agencies to issue regulations that require securitizers of loans to retain “not less than 5% of the credit risk for any asset that is not a qualified residential mortgage.” The regulatory agencies have issued a final rule to implement this requirement. The final rule provides that the definition of “qualified residential mortgage” includes loans that meet the definition of a qualified mortgage issued by the Consumer Financial Protection Bureau for purposes of its regulations.
These rules could have a significant effect on the secondary market for loans and the types of loans we originate, and restrict our ability or desire to make certain types of loans or loans to certain borrowers, which could limit our growth or profitability.
Changes in the valuation of our securities portfolio could reduce net income and lower our capital levels.
Our securities portfolio may be affected by fluctuations in market value, potentially reducing accumulated other comprehensive income and/or earnings. Fluctuations in market value may be caused by changes in market interest rates, lower market prices for securities and limited investor demand. Management evaluates securities for other-than-temporary impairment on a quarterly basis, with more frequent evaluation for selected issues. In analyzing a debt issuer’s financial condition, management considers whether the securities are issued by the federal government or its agencies, whether downgrades by bond rating agencies have occurred, industry analysts’ reports and, to a lesser extent given the relatively insignificant levels of depreciation in our debt portfolio, spread differentials between the effective rates on instruments in the portfolio compared to risk-free rates. In analyzing an equity issuer’s financial condition, management considers industry analysts’ reports, financial performance, and projected target prices of investment analysts within a one-year time period. If this evaluation shows impairment to the actual or projected cash flows associated with one or more securities, a potential loss to earnings may occur. Changes in interest rates also can have an adverse effect on our financial condition, as our available-for-sale securities are reported at their estimated fair value, and therefore are impacted by fluctuations in interest rates. We increase or decrease our stockholders’ equity by the amount of change in the estimated fair value of the available-for-sale securities, net of taxes. The declines in market value could result in other-than-temporary impairments of these assets, which would lead to accounting charges that could have a material adverse effect on our net income and capital levels. Changes in interest rates can also have an adverse effect on our financial condition, as our available-for-sale securities are reported at their estimated fair value, and therefore are impacted by fluctuations in interest rates.
Federal banking regulations restrict insured depository institutions and their affiliated companies from engaging in short-term proprietary trading of certain securities, investing in funds with collateral comprised of less than 100% loans that are not registered with the Securities and Exchange Commission and from engaging in hedging activities that do not hedge a specific identified risk. We continue to analyze the impact of this regulation on our investment portfolio, and whether any changes are required to our investment strategies that could negatively affect our earnings.
40
We are subject to stringent capital requirements, which may adversely affect our return on equity, require us to raise additional capital, or constrain us from paying dividends or repurchasing shares.
“Basel III” regulatory capital reforms and changes required by the Dodd-Frank Act substantially amended the regulatory risk-based capital rules applicable to Northfield Bancorp, Inc. and Northfield Bank. The minimum capital requirements are: (i) a common equity Tier 1 capital ratio of 4.5%; (ii) a Tier 1 to risk-based assets capital ratio of 6%; (iii) a total capital ratio of 8% ; and (iv) a Tier 1 leverage ratio of 4%. The final rule also establishes a “capital conservation buffer” of 2.5%, and will result in the following minimum ratios: (i) a common equity Tier 1 capital ratio of 7.0%, (ii) a Tier 1 to risk-based assets capital ratio of 8.5%, and (iii) a total capital ratio of 10.5%. The capital conservation buffer requirement was phased in beginning January 1, 2016, at 0.625% of risk-weighted assets and increases each year until fully implemented at 2.5% on January 1, 2019. An institution will be subject to limitations on paying dividends, engaging in share repurchases, and paying discretionary bonuses if its capital level falls below the buffer amount. These limitations will establish a maximum percentage of eligible retained income that can be utilized for such actions.
The application of more stringent capital requirements, among other things, could result in lower returns on equity, require the raising of additional capital, and result in regulatory actions if we were to be unable to comply with such requirements. Furthermore, the imposition of liquidity requirements in connection with Basel III could result in our having to lengthen the term of our funding, restructure our business models, and/or increase our holdings of liquid assets. Implementation of changes to asset risk weightings for risk-based capital calculations, items included or deducted in calculating regulatory capital and/or additional capital conservation buffers could result in management modifying its business strategy, and could limit our ability to make distributions, including paying out dividends or buying back shares. Northfield Bancorp Inc.’s ability to pay dividends will be limited if it does not have the capital conservation buffer required by the new capital rules, which may limit our ability to pay dividends to stockholders. See “Item 1. Business - Supervision and Regulation.”
We may be adversely affected by recent changes in U.S. tax laws.
Changes in tax laws contained in the Tax Act, which was enacted in December 2017, include a number of provisions that could have an impact on the banking industry, borrowers and the market for residential real estate. Changes include (i) a lower limit on the deductibility of mortgage interest, (ii) the elimination of interest deductions for home equity loans, home equity lines of credit or second mortgages depending on the how the loans are used, (iii) a limitation on the deductibility of business interest expense and (iv) a limitation on the deductibility of property taxes and state and local income taxes.
The recent changes in the tax laws may have an adverse effect on the market for, and valuation of, residential properties, and on the demand for such loans in the future, and could make it harder for borrowers to make their loan payments. In addition, these recent changes may also have a disproportionate effect on taxpayers in states with high residential home prices and high state and local taxes, such as New York and New Jersey. If home ownership becomes less attractive, demand for mortgage loans could decrease. The value of the properties securing loans in our loan portfolio may be adversely impacted as a result of the changing economics of home ownership, which could require an increase in our provision for loan losses, which would reduce our profitability and could materially adversely affect our business, financial condition and results of operations.
Our risk management framework may not be effective in mitigating risk and reducing the potential for significant losses.
Our risk management framework is designed to minimize risk and loss to us. We seek to identify, measure, monitor, report, and control our exposure to the types of risk to which we are subject, including strategic, market, liquidity, compliance, and operational risks. While we employ a broad and diversified set of risk monitoring and mitigation techniques, those techniques are inherently limited because they cannot anticipate the existence or future development of currently unanticipated or unknown risks. Recent economic conditions, heightened legislative and regulatory scrutiny of the financial services industry, among other developments, have resulted in a heightened level of risk for us. Accordingly, we could suffer losses as a result of our failure to properly anticipate and manage these risks.
Our business may be adversely affected by an increasing prevalence of fraud and other financial crimes.
Our loans to businesses and individuals and our deposit relationships and related transactions are subject to exposure to the risk of loss due to fraud and other financial crimes. Nationally, reported incidents of fraud and other financial crimes have increased. We have also experienced losses due to apparent fraud and other financial crimes. While we have policies and procedures designed to prevent such losses, losses may still occur.
41
Acquisitions
may disrupt our business and dilute stockholder value.
We regularly evaluate merger and acquisition opportunities and conduct due diligence activities related to possible transactions with other financial institutions and financial services companies. As a result, negotiations may take place and future mergers or acquisitions involving cash, debt, or equity securities may occur at any time. We seek acquisition partners that offer us either significant market presence or the potential to expand our market footprint and improve profitability through economies of scale or expanded services.
Acquiring other banks, businesses, or branches may have an adverse effect on our financial results and may involve various other risks commonly associated with acquisitions. These include:
|
•
|
integrating personnel with diverse business backgrounds;
|
|
•
|
converting customers to new systems;
|
|
•
|
combining different corporate cultures; and
|
|
•
|
retaining key employees.
|
The success of an acquisition will depend, in part, on our ability to realize the anticipated benefits and cost savings. If we are unable to integrate an acquired company successfully, the anticipated benefits and cost savings may not be realized fully or may take longer to realize than expected. A significant decline in asset valuations or cash flows may also cause us not to realize expected benefits.
Various factors may make takeover attempts more difficult to achieve.
Our certificate of incorporation and bylaws, federal regulations, Northfield Bank’s charter, Delaware law, shares of restricted stock and stock options that we have granted or may grant to employees and directors, stock ownership by our management and directors and employment agreements that we have entered into with our executive officers, and various other factors may make it more difficult for companies or persons to acquire control of Northfield Bancorp, Inc. without the consent of our Board of Directors.
We may not pay dividends on our shares of common stock.
Although we currently pay dividends on a quarterly basis, stockholders are not entitled to receive dividends. Federal regulations also may restrict capital distributions, which include cash dividends, to ensure the institution maintains adequate capital requirements.
Legal and regulatory proceedings and related matters could adversely affect us or the financial services industry in general.
We, and other participants in the financial services industry upon whom we rely to operate, have been and may in the future become involved in legal and regulatory proceedings. Most of the proceedings we consider to be in the normal course of our business or typical for the industry; however, it is inherently difficult to assess the outcome of these matters, and other participants in the financial services industry or we may not prevail in any proceeding or litigation. Any adverse determination could negatively affect our business, brand or image, or our financial condition and results of our operations.
We are subject to environmental liability risk associated with lending activities.
A significant portion of our loan portfolio is secured by real estate, and we could become subject to environmental liabilities with respect to one or more of these properties. During the ordinary course of business, we may foreclose on and take title to properties securing defaulted loans. In doing so, there is a risk that hazardous or toxic substances could be found on these properties. If hazardous conditions or toxic substances are found on these properties, we may be liable for remediation costs, as well as for personal injury and property damage, civil fines and criminal penalties regardless of when the hazardous conditions or toxic substances first affected any particular property. Environmental laws may require us to incur substantial expenses to address unknown liabilities and may materially reduce the affected property’s value or limit our ability to use or sell the affected property. In addition, future laws or more stringent interpretations or enforcement policies with respect to existing laws may increase our exposure to environmental liability. Although we have policies and procedures to perform an environmental review before initiating any foreclosure action on nonresidential real property, these reviews may not be
42
sufficient to detect all potential environmental hazards. The remediation costs and any other financial liabilities associated with an environmental hazard could have a material adverse effect on us.
|
ITEM 1B.
|
UNRESOLVED STAFF COMMENTS
|
There are no unresolved staff comments.
|
ITEM 2.
|
PROPERTIES
|
The Company operates from the Bank’s home office in Staten Island, New York, our corporate offices located at 581 Main Street, Woodbridge, New Jersey, and our additional 38 branch offices located in New York and New Jersey, and its lending office located in Brooklyn, New York. Our branch offices are located in the New York counties of Richmond, and Kings and the New Jersey counties of Hunterdon, Mercer, Middlesex, and Union. The net book value of our premises, land, and equipment was
$25.7 million
at
December 31, 2017
.
|
ITEM 3.
|
LEGAL PROCEEDINGS
|
In the normal course of business, we may be party to various outstanding legal proceedings and claims. In the opinion of management, the consolidated financial statements are not likely to be materially affected by the outcome of such legal proceedings and claims as of
December 31, 2017
.
|
ITEM 4.
|
MINE SAFETY DISCLOSURES
|
Not applicable.
43
|
ITEM 5.
|
MARKET FOR REGISTRANT’S COMMON EQUITY, RELATED STOCKHOLDER MATTERS, AND ISSUER PURCHASES OF EQUITY SECURITIES
|
Our shares of common stock are traded on the NASDAQ Global Select Market under the symbol “NFBK.” The approximate number of holders of record of Northfield Bancorp, Inc.’s common stock as of
February 20, 2018
, was 4,303. Certain shares of Northfield Bancorp, Inc. are held in “nominee” or “street” name and accordingly, the number of beneficial owners of such shares is not known or included in the foregoing number. The following table presents quarterly market and dividend information for Northfield Bancorp, Inc. common stock for the years ended
December 31, 2017
and
2016
. The following market information was provided by the NASDAQ Global Stock Market:
|
|
High
|
Low
|
Dividends
|
||||||||
|
Quarter ended December 31, 2017
|
$
|
18.39
|
|
$
|
15.96
|
|
$
|
0.10
|
|
||
|
Quarter ended September 30, 2017
|
$
|
17.56
|
|
$
|
15.36
|
|
$
|
0.08
|
|
||
|
Quarter ended June 30, 2017
|
$
|
19.08
|
|
$
|
16.41
|
|
$
|
0.08
|
|
||
|
Quarter ended March 31, 2017
|
$
|
20.36
|
|
$
|
17.32
|
|
$
|
0.08
|
|
||
|
Quarter ended December 31, 2016
|
$
|
20.59
|
|
$
|
14.88
|
|
$
|
0.08
|
|
||
|
Quarter ended September 30, 2016
|
$
|
16.28
|
|
$
|
14.38
|
|
$
|
0.08
|
|
||
|
Quarter ended June 30, 2016
|
$
|
16.58
|
|
$
|
14.31
|
|
$
|
0.08
|
|
||
|
Quarter ended March 31, 2016
|
$
|
16.68
|
|
$
|
14.43
|
|
$
|
0.07
|
|
||
The Company is subject to state law limitations and federal banking regulatory policy on the payment of dividends. Delaware law generally limits dividends to our capital surplus or, if there is no capital surplus, our net profits for the fiscal year in which the dividend is declared and/or the preceding fiscal year. In addition, see “Item 1. Business - Supervision and Regulation - Holding Company Regulation.”
The sources of funds for the payment of a cash dividend are interest, and principal payments on Northfield Bancorp, Inc.’s investments, including its loan to Northfield Bank’s Employee Stock Ownership Plan, and dividends from Northfield Bank.
For a discussion of Northfield Bank’s ability to pay dividends, see “Item 1. Business - Supervision and Regulation.”
Stock Performance Graph
Set forth below is a stock performance graph comparing (a) the cumulative total return on the Northfield Bancorp, Inc.’s common stock for the period December 31, 2012, through
December 31, 2017
, (b) the cumulative total return of the stocks included in the NASDAQ Composite Index over such period, (c) the cumulative total return on stocks included in the NASDAQ Bank Index over such period, and, (d) the cumulative total return on stocks included in the SNL U.S. Thrift Index over such period. Cumulative return assumes the reinvestment of dividends, and is expressed in dollars based on an assumed investment of $100.
44
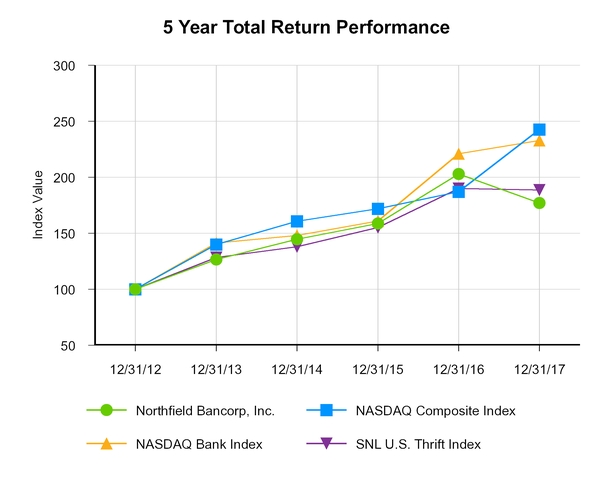
|
|
As of
|
|||||||||||||||||
|
Index
|
12/31/2012
|
12/31/2013
|
12/31/2014
|
12/31/2015
|
12/31/2016
|
12/31/2017
|
||||||||||||
|
Northfield Bancorp, Inc.
(1)
|
100.00
|
|
126.59
|
|
144.79
|
|
158.70
|
|
203.05
|
|
177.13
|
|
||||||
|
NASDAQ Composite Index
(1)
|
100.00
|
|
140.12
|
|
160.78
|
|
171.97
|
|
187.22
|
|
242.71
|
|
||||||
|
NASDAQ Bank Index
(2)
|
100.00
|
|
141.31
|
|
148.11
|
|
161.09
|
|
221.04
|
|
232.84
|
|
||||||
|
SNL U.S. Thrift Index
(1)
|
100.00
|
|
128.33
|
|
138.02
|
|
155.20
|
|
190.11
|
|
188.72
|
|
||||||
(1) Source: S&P Global Market Intelligence, a division of S&P Global Inc.
(2) Source: Bloomberg Inc.
Issuer Purchases of Equity Securities
The Company did not repurchase any of its common stock during the year ended December 31, 2017. The previously adopted repurchase program permitted $185.0 million shares to be repurchased in open market or private transactions, through block trades, and pursuant to any trading plan that may be adopted in accordance with Rule 10b5-1 of the Securities and Exchange Commission. There were no shares remaining to be purchased at December 31, 2017, or 2016.
45
|
ITEM 6.
|
SELECTED FINANCIAL DATA
|
The summary information presented below at the dates or for each of the years presented is derived in part from our consolidated financial statements. The following information is only a summary, and should be read in conjunction with our consolidated financial statements and notes included in this Annual Report:
|
|
At December 31,
|
||||||||||||||||||
|
|
2017
|
2016
|
2015
|
2014
|
2013
|
||||||||||||||
|
|
(Dollars in thousands, except share data)
|
||||||||||||||||||
|
Selected Financial Condition Data:
|
|
|
|
|
|
||||||||||||||
|
Total assets
|
$
|
3,991,417
|
|
$
|
3,850,094
|
|
$
|
3,202,584
|
|
$
|
3,020,869
|
|
$
|
2,702,764
|
|
||||
|
Cash and cash equivalents
|
57,839
|
|
96,085
|
|
51,853
|
|
76,709
|
|
61,239
|
|
|||||||||
|
Trading securities
|
9,597
|
|
7,857
|
|
6,713
|
|
6,422
|
|
5,998
|
|
|||||||||
|
Securities available-for-sale, at estimated market value
|
515,121
|
|
498,897
|
|
541,595
|
|
771,239
|
|
937,085
|
|
|||||||||
|
Securities held-to-maturity
|
9,931
|
|
10,148
|
|
10,346
|
|
3,609
|
|
—
|
|
|||||||||
|
Loans held-for-sale - non-performing
|
—
|
|
—
|
|
—
|
|
—
|
|
471
|
|
|||||||||
|
Loans held-for-investment:
|
|
|
|
|
|||||||||||||||
|
PCI loans
|
22,741
|
|
30,498
|
|
33,115
|
|
44,816
|
|
59,468
|
|
|||||||||
|
Loans acquired
|
692,803
|
|
793,240
|
|
409,015
|
|
265,685
|
|
77,817
|
|
|||||||||
|
Originated loans, net
|
2,425,275
|
|
2,144,346
|
|
1,931,585
|
|
1,632,494
|
|
1,352,191
|
|
|||||||||
|
Loans held-for-investment, net
|
3,140,819
|
|
2,968,084
|
|
2,373,715
|
|
1,942,995
|
|
1,489,476
|
|
|||||||||
|
Allowance for loan losses
|
(26,160
|
)
|
(24,595
|
)
|
(24,770
|
)
|
(26,292
|
)
|
(26,037
|
)
|
|||||||||
|
Net loans held-for-investment
|
3,114,659
|
|
2,943,489
|
|
2,348,945
|
|
1,916,703
|
|
1,463,439
|
|
|||||||||
|
Bank owned life insurance
|
150,604
|
|
148,047
|
|
132,782
|
|
129,015
|
|
125,113
|
|
|||||||||
|
FHLB of New York stock, at cost
|
25,046
|
|
25,123
|
|
25,803
|
|
29,219
|
|
17,516
|
|
|||||||||
|
Other real estate owned
|
850
|
|
850
|
|
45
|
|
752
|
|
634
|
|
|||||||||
|
Deposits
|
2,836,979
|
|
2,713,587
|
|
2,052,929
|
|
1,620,665
|
|
1,492,689
|
|
|||||||||
|
Borrowed funds
|
471,549
|
|
473,206
|
|
558,129
|
|
778,658
|
|
470,325
|
|
|||||||||
|
Total liabilities
|
3,352,540
|
|
3,228,898
|
|
2,642,805
|
|
2,426,941
|
|
1,986,656
|
|
|||||||||
|
Total stockholders’ equity
|
$
|
638,877
|
|
$
|
621,196
|
|
$
|
559,779
|
|
$
|
593,928
|
|
$
|
716,108
|
|
||||
|
|
Years Ended December 31,
|
||||||||||||||||||
|
|
2017
|
2016
|
2015
|
2014
|
2013
|
||||||||||||||
|
|
(Dollars in thousands)
|
||||||||||||||||||
|
Selected Operating Data:
|
|
|
|
|
|
||||||||||||||
|
Interest income
|
$
|
132,869
|
|
$
|
124,972
|
|
$
|
101,758
|
|
$
|
91,701
|
|
$
|
92,470
|
|
||||
|
Interest expense
|
23,976
|
|
21,668
|
|
19,688
|
|
15,352
|
|
16,948
|
|
|||||||||
|
Net interest income before provision for loan losses
|
108,893
|
|
103,304
|
|
82,070
|
|
76,349
|
|
75,522
|
|
|||||||||
|
Provision for loan losses
|
1,411
|
|
635
|
|
353
|
|
645
|
|
1,927
|
|
|||||||||
|
Net interest income after provision for loan losses
|
107,482
|
|
102,669
|
|
81,717
|
|
75,704
|
|
73,595
|
|
|||||||||
|
Non-interest income
|
11,642
|
|
10,072
|
|
7,898
|
|
8,460
|
|
10,161
|
|
|||||||||
|
Non-interest expense
|
67,378
|
|
72,946
|
|
58,109
|
|
52,042
|
|
53,873
|
|
|||||||||
|
Income before income taxes
|
51,746
|
|
39,795
|
|
31,506
|
|
32,122
|
|
29,883
|
|
|||||||||
|
Income tax expense
|
26,978
|
|
13,665
|
|
11,975
|
|
11,856
|
|
10,736
|
|
|||||||||
|
Net income
|
$
|
24,768
|
|
$
|
26,130
|
|
$
|
19,531
|
|
$
|
20,266
|
|
$
|
19,147
|
|
||||
|
Net income per common share - basic
|
$
|
0.55
|
|
$
|
0.59
|
|
$
|
0.46
|
|
$
|
0.41
|
|
$
|
0.35
|
|
||||
|
Net income per common share - diluted
|
$
|
0.53
|
|
$
|
0.57
|
|
$
|
0.45
|
|
$
|
0.41
|
|
$
|
0.34
|
|
||||
|
Weighted average basic shares outstanding
|
45,325,445
|
|
44,374,389
|
|
42,285,712
|
|
49,006,129
|
|
54,637,680
|
|
|||||||||
|
Weighted average diluted shares outstanding
|
46,875,730
|
|
45,717,887
|
|
43,478,481
|
|
50,032,259
|
|
55,560,309
|
|
|||||||||
|
Note: Weighted average basic and diluted shares have been restated to reflect the completion of our second-step conversion on January 24, 2013, at an exchange ratio of 1.4029-to-one.
|
|
46
|
|
At or For the Years Ended December 31,
|
|||||||||||||
|
|
2017
|
2016
|
2015
|
2014
|
2013
|
|||||||||
|
Selected Financial Ratios and Other Data:
|
|
|
|
|
|
|||||||||
|
Performance Ratios:
|
|
|
|
|
|
|||||||||
|
Return on assets (ratio of net income to average total assets)
(1) (2) (3) (4)
|
0.63
|
%
|
0.70
|
%
|
0.63
|
%
|
0.73
|
%
|
0.70
|
%
|
||||
|
Return on equity (ratio of net income to average equity)
(1) (2) (3) (4)
|
3.88
|
|
4.26
|
|
3.41
|
|
3.07
|
|
2.70
|
|
||||
|
Interest rate spread
(5)
|
2.79
|
|
2.80
|
|
2.63
|
|
2.74
|
|
2.68
|
|
||||
|
Net interest margin
(6)
|
2.99
|
|
2.98
|
|
2.83
|
|
2.97
|
|
2.97
|
|
||||
|
Dividend payout ratio
(7)
|
63.17
|
|
53.86
|
|
62.38
|
|
63.57
|
|
140.28
|
|
||||
|
Efficiency ratio
(8) (9)
|
55.90
|
|
64.34
|
|
64.59
|
|
61.36
|
|
62.87
|
|
||||
|
Non-interest expense to average total assets
|
1.72
|
|
1.95
|
|
1.86
|
|
1.88
|
|
1.97
|
|
||||
|
Average interest-earning assets to average interest-bearing liabilities
|
128.71
|
|
128.68
|
|
129.12
|
|
139.12
|
|
142.73
|
|
||||
|
Average equity to average total assets
|
16.31
|
|
16.44
|
|
18.32
|
|
23.75
|
|
25.90
|
|
||||
|
Asset Quality Ratios:
|
|
|
|
|
||||||||||
|
Non-performing assets to total assets
|
0.16
|
|
0.21
|
|
0.28
|
|
0.51
|
|
0.68
|
|
||||
|
Non-performing loans
(10)
to total loans
(11)
|
0.18
|
|
0.25
|
|
0.37
|
|
0.75
|
|
1.19
|
|
||||
|
Allowance for loan losses to non-performing loans held-for-investment
(12)
|
472.63
|
|
333.23
|
|
280.78
|
|
180.29
|
|
150.23
|
|
||||
|
Allowance for loan losses to total loans held-for-investment, net
(13)
|
0.83
|
|
0.83
|
|
1.04
|
|
1.35
|
|
1.75
|
|
||||
|
Allowance for loan losses to originated loans held-for-investment, net
(14)
|
1.04
|
|
1.10
|
|
1.24
|
|
1.58
|
|
1.88
|
|
||||
|
Capital Ratios
(15)
:
|
|
|
|
|
||||||||||
|
Common equity Tier 1 capital (to risk-weighted assets)
|
16.70
|
|
17.75
|
|
20.19
|
|
NA
|
|
NA
|
|
||||
|
Total capital (to risk-weighted assets)
|
17.49
|
|
18.56
|
|
21.21
|
|
22.95
|
|
28.94
|
|
||||
|
Tier 1 capital (to risk-weighted assets)
|
16.70
|
|
17.75
|
|
20.19
|
|
21.77
|
|
27.69
|
|
||||
|
Tier 1 capital (to adjusted assets)
|
14.15
|
|
14.55
|
|
15.72
|
|
16.46
|
|
19.88
|
|
||||
|
Other Data:
|
|
|
|
|
||||||||||
|
Number of full service offices
|
39
|
|
38
|
|
30
|
|
30
|
|
30
|
|
||||
|
Full time equivalent employees
|
338
|
|
348
|
|
290
|
|
302
|
|
306
|
|
||||
|
(1)
|
The year ended December 31, 2017 includes: (i) an estimated tax charge of $10.5 million as a result of the recently enacted Tax Act; (ii) a $2.3 million reduction in income tax expense from the adoption of ASU 2016-09 related to excess tax benefits from the exercise or vesting of equity awards which were previously recorded through equity as an adjustment to additional paid in capital; and (iii) $1.5 million of tax-exempt income from bank owned life insurance proceeds in excess of the cash surrender value of the policies.
|
|
|
(2)
|
The year ended December 31, 2016, includes merger-related charges of $2.4 million, net of tax, associated with the acquisition of Hopewell Valley.
|
|
|
(3)
|
The year ended December 31, 2015, includes merger-related charges of $574,000, net of tax, associated with the acquisition of Hopewell Valley and a $795,000 charge related to the write-down of deferred tax assets resulting from New York City tax reforms.
|
|
|
(4)
|
The year ended December 31, 2014, includes a gain of $560,000, net of tax, related to the settlement of the former Flatbush Federal Savings & Loan Association pension plan and a charge of $570,000 related to the write-down of deferred tax assets resulting from New York State tax reforms.
|
|
|
(5)
|
The interest rate spread represents the difference between the weighted-average yield on interest earning assets and the weighted-average costs of interest-bearing liabilities.
|
|
|
(6)
|
The net interest margin represents net interest income as a percent of average interest-earning assets for the period.
|
|
|
(7)
|
Dividend payout ratio is calculated as total dividends declared for the year divided by net income for the year. 2013 includes a special dividend of $0.25 per share.
|
|
|
(8)
|
The efficiency ratio represents non-interest expense divided by the sum of net interest income and non-interest income.
|
|
|
(9)
|
The year ended December 31, 2017, includes $1.5 million of tax-exempt income from bank owned life insurance proceeds in excess of the cash surrender value of the policies. The year ended December 31, 2016, includes merger-related pre-tax charges of $4.0 million associated with the acquisition of Hopewell Valley. The year ended December 31, 2015, includes merger-related pre-tax charges of $672,000 associated with the acquisition of Hopewell Valley. The year ended December 31, 2014, includes a pre-tax gain of $937,000, related to the settlement of the former Flatbush Federal Savings & Loan Association pension plan.
|
|
|
(10)
|
Non-performing loans consist of non-accruing loans and loans 90 days or more past due and still accruing (excluding PCI loans), and are included in total loans held-for-investment, net, and non-performing loans held-for-sale.
|
|
|
(11)
|
Includes originated loans held-for-investment, PCI loans, acquired loans and non-performing loans held-for-sale.
|
|
|
(12)
|
Excludes non-performing loans held-for-sale, carried at lower of cost or estimated fair value, less costs to sell.
|
|
|
(13)
|
Includes PCI and acquired loans held-for-investment.
|
|
|
(14)
|
Excludes PCI loans, acquired loans held-for-investment and loans held-for-sale (and related allowance for loan losses).
|
|
|
(15)
|
Capital ratios are presented for Northfield Bank only.
|
|
47
|
ITEM 7.
|
MANAGEMENT’S DISCUSSION AND ANALYSIS OF FINANCIAL CONDITION AND RESULTS OF OPERATIONS
|
The following discussion should be read in conjunction with the Consolidated Financial Statements of Northfield Bancorp, Inc. and the Notes thereto included elsewhere in this report (collectively, the “Financial Statements”).
Overview
Net income was
$24.8 million
, or
$0.53
per diluted common share, and
$26.1 million
, or
$0.57
per diluted common share, for the years ended
December 31, 2017
and
2016
, respectively. Net income for the year ended
December 31, 2017
, includes an estimated tax charge of $10.5 million, or $0.23 per diluted share, related to the enactment of the Tax Cuts and Jobs Act (the “Tax Act”) on December 22, 2017, which among other things, reduces the federal corporate income tax rate from 35% to 21%, effective January 1, 2018. As a result of the lower corporate tax rate, the Company recorded an adjustment of $10.5 million to reduce its net deferred tax assets, with a corresponding charge to income tax expense. Net income for the year ended December 31, 2017, also included a reduction in income tax expense of $2.3 million, or $0.05 per diluted share, related to the adoption of Accounting Standards Update No. 2016-09, Compensation - Stock Compensation (Topic 718) (“ASU 2016-09”), and $1.5 million, or $0.03 per diluted share, of tax-exempt income from bank owned life insurance proceeds in excess of the cash surrender value of the policies. Net income for the year ended December 31, 2016, included merger-related expenses of $4.0 million ($2.4 million, after tax) associated with our acquisition of Hopewell Valley Community Bank (“Hopewell Valley”).
Our assets
increase
d by
$141.3 million
, or
3.7%
, to
$3.99 billion
at
December 31, 2017
, from
$3.85 billion
at
December 31, 2016
. The
increase
was primarily attributable to increases in loans held-for-investment, net, of
$172.7 million
and securities available-for-sale of
$16.2 million
, partially offset by decreases in cash and cash equivalents of
$38.2 million
and other assets of
$11.7 million
. The increase in assets was funded by a
$123.4 million
increase in deposits to
$2.84 billion
at
December 31, 2017
from
$2.71 billion
at
December 31, 2016
.
Our stockholders’ equity
increase
d by
$17.7 million
, or
2.8%
, to
$638.9 million
at
December 31, 2017
, from
$621.2 million
at
December 31, 2016
. This
increase
was primarily attributable to net income of
$24.8 million
for year ended
December 31, 2017
, and an $8.8 million increase related to equity award activity, partially offset by dividend payments of $15.6 million.
Critical Accounting Policies
Critical accounting policies are defined as those that involve significant judgments and uncertainties, and could potentially result in materially different results under different assumptions and conditions. We believe that the most critical accounting policies upon which our financial condition and results of operation depend, and which involve the most complex subjective decisions or assessments, are the following:
Allowance for Loan Losses.
The allowance for loan losses is the estimated amount considered necessary to cover probable and reasonably estimable incurred losses inherent in the loan portfolio at the balance sheet date. The allowance is established through the provision for loan losses that is charged against income. In determining the allowance for loan losses, we make significant estimates and judgments. The determination of the allowance for loan losses is considered a critical accounting policy by management because of the high degree of judgment involved, the subjectivity of the assumptions used, and the potential for changes in the economic environment that could result in changes to the amount of the recorded allowance for loan losses.
The allowance for loan losses has been determined in accordance with U.S. GAAP. We are responsible for the timely and periodic determination of the amount of the allowance required. We believe that our allowance for loan losses is adequate to cover identifiable losses, as well as estimated losses inherent in our portfolio for which certain losses are probable but not specifically identifiable.
Management performs a formal quarterly evaluation of the adequacy of the allowance for loan losses. This quarterly process is performed by the accounting department, in conjunction with the credit administration department, and approved by the Director of Financial Reporting. The Chief Financial Officer performs a final review of the calculation. All supporting documentation with regard to the evaluation process is maintained by the accounting department. Each quarter a summary of the allowance for loan losses is presented by the Chief Financial Officer to the audit committee of the board of directors.
48
The analysis of the allowance for loan losses has a component for impaired loans held-for-investment and PCI loans, and a component for general loan losses. Prior to December 31, 2016, we maintained an amount identified as the unallocated component within the allowance for loan losses related to indicators of loan losses not fully captured in other components of the allowance for loan losses methodology, as well as the inherent imprecision of the loss estimation process. During the fourth quarter of 2016, the Company enhanced the allowance for loan losses qualitative framework to more fully capture the risks related to certain loan loss factors. These enhancements are meant to increase the level of precision in the allowance for loan losses. As a result, the Company no longer has an unallocated reserve in its allowance for loan losses, as the risks and uncertainties meant to be captured by the unallocated allowance have been included in the qualitative framework for the respective loan portfolios.
Management has defined an impaired loan (excluding PCI loans) to be a loan for which it is probable, based on current information, that we will not collect all amounts due in accordance with the contractual terms of the loan agreement. We have defined the population of impaired loans to be all non-accrual loans with an outstanding balance of $500,000 or greater, and all loans identified as a TDR. Impaired loans are individually assessed to determine that the loan’s carrying value is not in excess of the estimated fair value of the collateral (less cost to sell), if the loan is collateral dependent, or the present value of the expected future cash flows, if the loan is not collateral dependent. Management performs a detailed evaluation of each impaired loan and generally obtains updated appraisals as part of the evaluation. In addition, management adjusts estimated fair values down to appropriately consider recent market conditions, our willingness to accept, when appropriate, a lower sales price to effect a quick sale, and costs to dispose of any supporting collateral. Determining the estimated fair value of underlying collateral (and related costs to sell) can be difficult in illiquid real estate markets and is subject to significant assumptions and estimates. Management employs an independent third-party expert in appraisal preparation and review to ascertain the reasonableness of all appraisals. Projecting the expected cash flows under TDRs is inherently subjective and requires, among other things, an evaluation of the borrower’s current and projected financial condition. Actual results may be significantly different than our projections, and our established allowance for loan losses on these loans, and could have a material effect on our financial results.
The second component of the allowance for loan losses is the general loss allocation. This assessment excludes impaired, trouble-debt restructured, and PCI loans, with the remaining loans being placed into groups with similar risk characteristics, primarily loan type, loan-to-value (if collateral dependent) and internal credit risk rating. We apply an estimated loss rate to each loan group. The loss rates applied are based on our net loss experience (using appropriate look-back and loss emergence periods) as adjusted, if appropriate, for our qualitative assessment of factors which may not be fully captured in our historical quantitative net loss rates applied to:
|
•
|
changes in lending policies and procedures;
|
|
•
|
changes in local, regional, national, and international economic and business conditions and developments that affect the collectability of our portfolio, including the condition of various market segments;
|
|
•
|
changes in the nature and volume of our portfolio and in the terms of our loans;
|
|
•
|
changes in the experience, ability and depth of lending management and other relevant staff;
|
|
•
|
changes in the volume and severity of past due loans, the volume of non-accrual loans, and the volume and severity of adversely classified or graded loans;
|
|
•
|
changes in the quality of our loan review system;
|
|
•
|
changes in the value of underlying collateral for collateral-dependent loans;
|
|
•
|
the existence and effect of any concentrations of credit, and changes in the level of such concentrations; and
|
|
•
|
the effect of other external factors such as competition and legal and regulatory requirements on the level of estimated credit losses in our existing portfolio.
|
The loss emergence period is the estimated time from the date of the loss event to the actual recognition of the loss (typically the first charge-off), and is determined based upon a study of the Company's past loss experience by loan groups. This evaluation is inherently subjective, as it requires material estimates that may be susceptible to significant revisions based on changes in economic and real estate market conditions. Actual loan losses may be significantly different than the allowance for loan losses we have established, which could have a material effect on our financial results.
We have a concentration of loans secured by real property located in New York City, New Jersey, and, to a lesser extent, eastern Pennsylvania. As a substantial amount of our loan portfolio is collateralized by real estate, appraisals of the underlying value of property securing loans are critical in determining the amount of the allowance required for specific loans.
49
Assumptions for appraisal valuations are instrumental in determining the value of properties. Overly optimistic assumptions or negative changes to assumptions could significantly impact the valuation of a property securing a loan and the related allowance determined. The assumptions supporting such appraisals are reviewed by management and an independent third-party appraiser to determine that the resulting values reasonably reflect amounts realizable on the collateral. Based on the composition of our loan portfolio, we believe the primary risks are increases in interest rates, a decline in the economy generally, or a decline in real estate market values in New York, or New Jersey, or eastern Pennsylvania. Any one or a combination of these events may adversely affect our loan portfolio resulting in delinquencies, increased loan losses, and future loan loss provisions.
Although we believe we have established and maintained the allowance for loan losses at adequate levels, changes may be necessary if future economic or other conditions differ substantially from our estimation of the current operating environment. Although management uses the information available, the level of the allowance for loan losses remains an estimate that is subject to significant judgment and short-term change. In addition, the OCC, as an integral part of their examination process, will review our allowance for loan losses and may require us to recognize adjustments to the allowance based on their judgments about information available to them at the time of their examination.
Additionally, held-for-investment loans acquired with no evidence of credit deterioration are initially valued at an estimated fair value on the date of acquisition, with no initial related allowance for loan losses. These loans are collectively evaluated for impairment on a quarterly basis as part of our analysis of the allowance for loan losses.
We also maintain an allowance for estimated losses on off-balance sheet credit risks related to loan commitments and standby letters of credit. Management utilizes a methodology similar to its allowance for loan loss methodology to estimate losses on these items. The allowance for estimated credit losses on these items is included in other liabilities and any changes to the allowance are recorded as a component of other non-interest expense.
Purchased Credit-Impaired Loans.
PCI loans are subject to our internal credit review. If and when credit deterioration occurs at the loan pool level subsequent to the acquisition date, a provision for credit losses for PCI loans will be charged to earnings for the full amount of the decline in expected cash flows for the pool. Under the accounting guidance for acquired credit-impaired loans, the allowance for loan losses on PCI loans is measured at each financial reporting date based on future expected cash flows. This assessment and measurement is performed at the pool level and not at the individual loan level. Accordingly, decreases in expected cash flows resulting from further credit deterioration, on a pool basis, as of such measurement date compared to those originally estimated are recognized by recording a provision and allowance for credit losses on PCI loans. Subsequent increases in the expected cash flows of the loans in each pool would first reduce any allowance for loan losses on PCI loans; and any excess will be accreted prospectively as a yield adjustment. The analysis of expected cash flows for pools incorporates updated pool level expected prepayment rates, default rates, delinquency levels, and loan level loss severity given default assumptions. The expected cash flows are estimated based on factors which include loan grades established in Northfield Bank's ongoing credit review program, likelihood of default based on observations of specific loans during the credit review process as well as applicable industry data, loss severity based on updated evaluation of cash flows from available collateral, and the contractual terms of the underlying loan agreement. Actual cash flows could differ from those expected, and others provided with the same information could draw different reasonable conclusions and calculate different expected cash flows.
Goodwill
and Other Intangibles.
We record all assets and liabilities in acquisitions, including goodwill and other intangible assets, at fair value as of the acquisition date, and expense all acquisition related costs as incurred. Goodwill, totaling
$38.4 million
at
December 31, 2017
, is not amortized but is subject to annual tests for impairment or more often if events or circumstances indicate it may be impaired. Other intangible assets, such as core deposit intangibles, are amortized over their estimated useful lives and are subject to impairment tests if events or circumstances indicate a possible inability to realize the carrying amount. Such evaluation of other intangible assets is based on undiscounted cash flow projections. The initial recording of goodwill and other intangible assets requires subjective judgments concerning estimates of the fair value of the acquired assets and assumed liabilities.
The goodwill impairment analysis is generally a two-step test. However, under current accounting guidance, we may first assess qualitative factors to determine whether it is necessary to perform the two-step quantitative goodwill impairment test. We are not required to calculate the fair value of our reporting unit if, based on a qualitative assessment, we determine that it was more likely than not that the unit’s fair value was not less than its carrying amount. During
2017
, we elected to perform step one of the two-step goodwill impairment test for our reporting unit. The first step compares the fair value of the reporting unit with its carrying amount, including goodwill. If the fair value of the reporting unit exceeds its carrying amount, goodwill of the reporting unit is considered not impaired; however, if the carrying amount of the reporting unit exceeds its fair value, an additional step must be performed. At December 31, 2017, the Company's fair value of the reporting unit exceeded its carrying
50
amount, therefore, no additional step was performed. That additional step compares the implied fair value of the reporting unit’s goodwill with the carrying amount of that goodwill. The implied fair value of goodwill is determined in a manner similar to the amount of goodwill calculated in a business combination, i.e., by measuring the excess of the estimated fair value of the reporting unit, as determined in the first step above, over the aggregate estimated fair values of the individual assets, liabilities, and identifiable intangibles, as if the reporting unit was being acquired in a business combination at the impairment test date. An impairment loss is recorded to the extent that the carrying amount of goodwill exceeds its implied fair value. The loss establishes a new basis in the goodwill and subsequent reversal of goodwill impairment losses are not permitted.
Securities Valuation and Impairment.
Our securities portfolio is comprised of mortgage-backed securities and, to a lesser extent, corporate bonds, municipal bonds, mutual funds and loan funds. Our available-for-sale securities portfolio is carried at estimated fair value, with any unrealized gains or losses, net of taxes, reported as accumulated other comprehensive income or loss in stockholders’ equity. Our trading securities portfolio is reported at estimated fair value. Our held-to-maturity securities portfolio, consisting of debt securities for which we have a positive intent and ability to hold to maturity, is carried at amortized cost. We conduct a quarterly review and evaluation of the available-for-sale and held-to-maturity securities portfolios to determine if the estimated fair value of any security has declined below its amortized cost, and whether such decline is other-than-temporary. If such decline is deemed other-than-temporary, we adjust the cost basis of the security by writing down the security to estimated fair value through a charge to current period operations. The estimated fair values of our securities are primarily affected by changes in interest rates, credit quality, and market liquidity.
Management is responsible for determining the estimated fair value of the securities in our portfolio. In determining estimated fair values, each quarter management utilizes the services of an independent third-party service, recognized as a specialist in pricing securities. The independent pricing service utilizes market prices of same or similar securities whenever such prices are available. Prices involving distressed sellers are not utilized in determining fair value, if identifiable. Where necessary, the independent third-party pricing service estimates fair value using models employing techniques such as discounted cash flow analyses. The assumptions used in these models typically include assumptions for interest rates, credit losses, and prepayments, utilizing observable market data, where available. Where the market price of the same or similar securities is not available, the valuation becomes more subjective and involves a high degree of judgment. In addition, we compare securities prices to a second independent pricing service that is utilized as part of our asset liability risk management process and analyze significant anomalies in pricing including significant fluctuations, or lack thereof, in relation to other securities. At
December 31, 2017
, and for each quarter end in
2017
, all securities were priced by an independent third-party pricing service, and management made no adjustment to the prices received.
Determining that a decline in a security’s estimated fair value is other-than-temporary is inherently subjective, and becomes increasing difficult as it relates to mortgage-backed securities that are not guaranteed by the U.S. Government, or a U.S. Government Sponsored Enterprise (e.g., Fannie Mae and Freddie Mac). In performing our evaluation of securities in an unrealized loss position, we consider, among other things, the severity and duration of time that the security has been in an unrealized loss position and the credit quality of the issuer. As it relates to private label mortgage-backed securities not guaranteed by the U.S. Government, Fannie Mae, or Freddie Mac, we perform a review of the key underlying loan collateral risk characteristics including, among other things, origination dates, interest rate levels, composition of variable and fixed rates, reset dates (including related pricing indices), current loan to original collateral values, locations of collateral, delinquency status of loans, and current credit support. In addition, for securities experiencing declines in estimated fair values of over 10%, as compared to its amortized cost, management also reviews published historical and expected prepayment speeds, underlying loan collateral default rates, and related historical and expected losses on the disposal of the underlying collateral on defaulted loans. This evaluation is subjective as it requires estimates of future events, many of which are difficult to predict. Actual results could be significantly different than our estimates and could have a material effect on our financial results.
Deferred Income Taxes.
We use the asset and liability method of accounting for income taxes. Under this method, deferred tax assets and liabilities are recognized for the future tax consequences attributable to differences between the financial statement carrying amounts of existing assets and liabilities and their respective tax bases. Deferred tax assets and liabilities are measured using enacted tax rates expected to apply to taxable income in the years in which those temporary differences are expected to be recovered or settled. If it is determined that it is more likely than not that the deferred tax assets will not be realized, a valuation allowance is established. We consider the determination of this valuation allowance to be a critical accounting policy because of the need to exercise significant judgment in evaluating the amount and timing of recognition of deferred tax liabilities and assets, including projections of future taxable income. These judgments and estimates are reviewed quarterly as regulatory and business factors change. A valuation allowance for deferred tax assets may be required if the amounts of taxes recoverable through loss carry backs decline, or if we project lower levels of future taxable income. Such a valuation allowance would be established and any subsequent changes to such allowance would require an adjustment to income tax expense that could adversely affect our operating results.
51
Stock Based Compensation.
We recognize the cost of director and employee services received in exchange for awards of equity instruments based on the grant-date fair value.
We estimate the per share fair value of options on the date of grant using the Black-Scholes option pricing model using assumptions for the expected dividend yield, expected stock price volatility, risk-free interest rate and expected option term. These assumptions are based on our judgments regarding future option exercise experience and market conditions. These assumptions are subjective in nature, involve uncertainties, and, therefore, cannot be determined with precision. The Black-Scholes option pricing model also contains certain inherent limitations when applied to options that are not traded on public markets.
The per share fair value of options is highly sensitive to changes in assumptions. In general, the per share fair value of options will move in the same direction as changes in the expected stock price volatility, risk-free interest rate and expected option term, and in the opposite direction of changes in the expected dividend yield. The use of different assumptions or different option pricing models could result in materially different per share fair values of options.
Comparison of Financial Condition at
December 31, 2017
and
2016
Total assets
increase
d
$141.3 million
, or
3.7%
, to
$3.99 billion
at
December 31, 2017
, from
$3.85 billion
at
December 31, 2016
. The
increase
was primarily attributable to an increase in loans held-for-investment, net, of
$172.7 million
, and an increase in our securities-available-for-sale portfolio of
$16.2 million
, partially offset by decreases in cash and cash equivalents of
$38.2 million
and other assets of
$11.7 million
.
Total loans held-for-investment, net,
increase
d
$172.7 million
to
$3.14 billion
at
December 31, 2017
, as compared to
$2.97 billion
at
December 31, 2016
. The increase was primarily attributable to originated loan growth, partially offset by decreases in acquired loans and PCI loans.
Originated loans held-for-investment, net, totaled
$2.43 billion
at
December 31, 2017
, as compared to $2.14 billion at December 31, 2016. The
increase
was primarily due to an increase in multifamily real estate loans of
$229.4 million
, or
15.2%
, to
$1.74 billion
at
December 31, 2017
, from
$1.51 billion
at
December 31, 2016
, and to a lesser extent, increases of
$32.6 million
, or
7.9%
, in commercial real estate loans, and
$20.5 million
, or
145.6%
, in construction and land loans.
The following tables detail our multifamily real estate originations for the years ended
December 31, 2017
and
2016
(dollars in thousands):
|
Year ended December 31, 2017
|
||||||||||||
|
Multifamily Originations
|
Weighted Average Interest Rate
|
Weighted Average Loan-to-Value Ratio
|
(F)ixed or (V)ariable
|
Weighted Average Months to Next Rate Change or Maturity for Fixed Rate Loans
|
Amortization Term
|
|||||||
|
$
|
352,031
|
|
3.64%
|
61%
|
80
|
V
|
15-30 Years
|
|||||
|
750
|
|
5.07%
|
48%
|
1
|
V
|
25 Years
|
||||||
|
16,640
|
|
3.95%
|
44%
|
180
|
F
|
15 Years
|
||||||
|
$
|
369,421
|
|
3.65%
|
60%
|
||||||||
|
Year ended December 31, 2016
|
||||||||||||
|
Multifamily Originations
|
Weighted Average Interest Rate
|
Weighted Average Loan-to-Value Ratio
|
(F)ixed or (V)ariable
|
Weighted Average Months to Next Rate Change or Maturity for Fixed Rate Loans
|
Amortization Term
|
|||||||
|
$
|
312,716
|
|
3.41%
|
62%
|
V
|
80
|
30 Years
|
|||||
|
11,821
|
|
3.76%
|
40%
|
F
|
140
|
7 - 20 Years
|
||||||
|
$
|
324,537
|
|
3.42%
|
62%
|
|
|
|
|||||
Acquired loans decreased by
$100.4 million
to
$692.8 million
at
December 31, 2017
, from
$793.2 million
at
December 31, 2016
, primarily due to paydowns, partially offset by purchases of one-to-four family residential mortgage and multifamily real estate loan pools totaling $63.6 million during the year ended
December 31, 2017
.
The following table provides the details of the loans purchased during the year ended
December 31, 2017
(dollars in thousands):
52
|
Principal Amounts Purchased
|
Loan Type
|
Weighted Average Interest Rate
(1)
|
Weighted Average Loan-to-Value Ratio
(2)
|
Weighted Average Months to Next Rate Change or Maturity for Fixed Rate Loans
(2)
|
(F)ixed or (V)ariable
|
Amortization Term
|
||||||||
|
$
|
29,286
|
|
Residential
|
2.89%
|
57%
|
1
|
V
|
30 Years
|
||||||
|
4,812
|
|
Residential
|
3.46%
|
62%
|
286
|
F
|
15-30 Years
|
|||||||
|
18,774
|
|
Multifamily
|
3.35%
|
55%
|
53
|
V
|
30 Years
|
|||||||
|
3,399
|
|
Multifamily
|
3.40%
|
58%
|
46
|
F
|
30 Years
|
|||||||
|
7,280
|
|
Multifamily
|
3.35%
|
51%
|
58
|
V
|
30 Years
|
|||||||
|
$
|
63,551
|
|
3.15%
|
56%
|
||||||||||
(1) Net of servicing fee retained by the originating bank
(2) At time of purchase
The geographic locations of the properties securing the above loans are as follows: 55.3% in New York, 15.9% in New Jersey, 9.2% in California, and 19.6% in other states.
The following table provides the details of the loans purchased during the year ended
December 31, 2016
(dollars in thousands):
|
Principal Amounts Purchased
|
Loan Type
|
Weighted Average Interest Rate
(1)
|
Weighted Average Loan-to-Value Ratio
(2)
|
Weighted Average Months to Next Rate Change or Maturity for Fixed Rate Loans
(2)
|
(F)ixed or (V)ariable
|
Amortization Term
|
||||||||
|
$
|
82,242
|
|
Multifamily
|
2.93%
|
49%
|
33
|
V
|
30 Years
|
||||||
|
43,562
|
|
Multifamily
|
2.91%
|
52%
|
42
|
V
|
30 Years
|
|||||||
|
27,415
|
|
Multifamily
|
3.98%
|
30%
|
120
|
F
|
30 Years
|
|||||||
|
4,883
|
|
Residential
|
3.35%
|
65%
|
76
|
V
|
30 Years
|
|||||||
|
7,760
|
|
Commercial Real Estate
|
2.85%
|
66%
|
30
|
V
|
30 Years
|
|||||||
|
$
|
165,862
|
|
3.11%
|
45%
|
||||||||||
(1) Net of servicing fee retained by the originating bank
(2) At time of purchase
The properties securing the above loans are primarily located in New York.
PCI loans totaled
$22.7 million
at
December 31, 2017
, as compared to
$30.5 million
at
December 31, 2016
. The majority of the PCI loan balance consists of loans acquired as part of a FDIC-assisted transaction. The Company accreted interest income attributable to PCI loans of $5.5 million, $5.2 million, and $4.5 million for the years ended
December 31, 2017
, 2016, and 2015, respectively.
Cash and cash equivalents
decrease
d by
$38.2 million
, or
39.8%
, to
$57.8 million
at
December 31, 2017
, from
$96.1 million
at
December 31, 2016
. Balances fluctuate based on the timing of receipt of security and loan repayments and the redeployment of cash into higher-yielding assets such as loans and securities, or the funding of deposit or borrowing obligations.
The securities available-for-sale portfolio totaled
$515.1 million
at
December 31, 2017
, compared to $498.9 million at
December 31, 2016
. At
December 31, 2017
, $445.2 million of the portfolio consisted of residential mortgage-backed securities issued or guaranteed by Fannie Mae, Freddie Mac, or Ginnie Mae. In addition, the Company held $68.1 million in corporate bonds, all of which were considered investment grade, and other securities of $1.8 million (including $323,000 of equity investments in money market mutual funds). The effective duration of the securities portfolio at
December 31, 2017
was
3.3
years.
Bank owned life insurance increased
$2.6 million
, or
1.7%
, to
$150.6 million
at
December 31, 2017
, from
$148.0 million
at
December 31, 2016
. The increase resulted from income earned on bank owned life insurance for the year ended
December 31, 2017
, partially offset by the surrender of policies.
Other assets decreased by
$11.7 million
, or
26.2%
, to
$32.9 million
at
December 31, 2017
, from
$44.6 million
at
December 31, 2016
. The decrease in other assets was primarily attributable to a decrease in net deferred tax assets, resulting from the re-measurement of the Company's net deferred tax assets as a result of the recently enacted Tax Act.
53
Total liabilities
increase
d
$123.6 million
, or
3.8%
, to
$3.35 billion
at
December 31, 2017
, from
$3.23 billion
at
December 31, 2016
. The
increase
was primarily attributable to
increase
s in deposits of
$123.4 million
and other borrowings of
$4.3 million
, partially offset by a
decrease
in securities sold under agreements to repurchase of
$6.0 million
.
Deposits
increase
d
$123.4 million
, or
4.5%
, to
$2.84 billion
at
December 31, 2017
, from
$2.71 billion
at
December 31, 2016
. The
increase
was attributable to
increase
s of $202.9 million in certificate of deposit accounts ($51.8 million of which were brokered deposits), and
$14.5 million
in transaction accounts, partially offset by decreases of
$76.1 million
in savings accounts and
$17.8 million
in money market accounts.
Borrowings, consisting primarily of FHLB advances and repurchase agreements, decreased by
$1.7 million
, or
0.4%
, to
$471.5 million
at
December 31, 2017
, from
$473.2 million
at
December 31, 2016
. Management utilizes borrowings to mitigate interest rate risk, for short-term liquidity to fund loan growth, and to a lesser extent as part of leverage strategies. The growth in deposits enabled the Company to reduce its borrowings in 2017.
Total stockholders’ equity
increase
d by
$17.7 million
to
$638.9 million
at
December 31, 2017
, from
$621.2 million
at
December 31, 2016
. This
increase
was primarily attributable to net income of
$24.8 million
for year ended
December 31, 2017
, and an $8.8 million increase related to equity award activity, partially offset by dividend payments of $15.6 million.
Comparison of Operating Results for the Years Ended
December 31, 2017
and
2016
Net Income.
Net income was
$24.8 million
and
$26.1 million
for the years ended
December 31, 2017
and
2016
, respectively. Significant variances from the prior year are as follows: a
$5.6 million
increase
in net interest income, a
$776,000
increase
in the provision for loan losses, a
$1.6 million
increase
in non-interest income, a
$5.6 million
decrease
in non-interest expense, and a
$13.3 million
increase
in income tax expense. Net income for the year ended
December 31, 2017
includes an estimated tax charge of $10.5 million related to the recently enacted Tax Act, a $2.3 million reduction in income tax expense as a result of the adoption of ASU 2016-09 related to the accounting of stock compensation, and $1.5 million of tax-exempt income from bank owned life insurance proceeds in excess of the cash surrender value of the policies. Net income for the year ended December 31, 2016 included merger-related expenses of $4.0 million ($2.4 million, after tax) associated with the acquisition of Hopewell Valley.
Interest Income.
Interest income
increase
d by
$7.9 million
, or
6.3%
, to
$132.9 million
for the year ended
December 31, 2017
, as compared to
$125.0 million
for the year ended
December 31, 2016
, due to an increase in the average balance of interest-earning assets of
$182.5 million
, or
5.3%
, and a
three
basis point increase in the yields earned to
3.64%
from
3.61%
for the prior year. The increase in the average balance of interest-earning assets was primarily attributable to increases in average loans of
$271.1 million
and other securities of
$11.9 million
, partially offset by decreases in average mortgage-backed securities of
$91.2 million
and interest-earning deposits in financial institutions of
$10.0 million
. The Company accreted interest income related to its PCI loans of
$5.5 million
for the year ended
December 31, 2017
, as compared to
$5.2 million
for the year ended
December 31, 2016
. Interest income for the year ended
December 31, 2017
, included loan prepayment income of $1.4 million, compared to $1.9 million for the year ended
December 31, 2016
.
Interest Expense.
Interest expense
increase
d
$2.3 million
, or
10.7%
, to
$24.0 million
for the year ended
December 31, 2017
, from
$21.7 million
for the year ended
December 31, 2016
. The
increase
was due primarily to an increase of
$2.1 million
in interest expense on deposits. The increase in interest expense on deposits was attributable to an increase in the average balance of interest-bearing deposits of
$138.7 million
, or
6.3%
, to
$2.34 billion
for the year ended
December 31, 2017
, from
$2.20 billion
for the year ended
December 31, 2016
, and a
five
basis point increase in the cost of interest-bearing deposits to
0.70%
from
0.65%
.
Net Interest Income.
Net interest income for the year ended
December 31, 2017
,
increase
d
$5.6 million
, or
5.4%
, to
$108.9 million
, from
$103.3 million
for the prior year, primarily due to a
$182.5 million
, or
5.3%
, increase in our average interest-earning assets and a one basis point increase in our net interest margin to
2.99%
. Yields earned on interest-earning assets increased
three
basis points to
3.64%
for the year ended
December 31, 2017
, from
3.61%
for the year ended
December 31, 2016
. The cost of interest-bearing liabilities increased
five
basis points to
0.85%
for the year ended
December 31, 2017
, as compared to
0.80%
for the prior year.
Provision for Loan Losses.
The provision for loan losses
increase
d
$776,000
to
$1.4 million
for the year ended
December 31, 2017
, from
$635,000
for the year ended
December 31, 2016
, primarily due to growth in the loan portfolio, partially offset by declines in non-performing loans, and net recoveries during the year ended December 31, 2017. Net recoveries were
$154,000
for the year ended
December 31, 2017
, compared to net charge-offs of $810,000 for the year ended
December 31, 2016
.
54
Non-interest Income.
Non-interest income
increase
d
$1.6 million
, or
15.6%
, to
$11.6 million
for the year ended
December 31, 2017
, from
$10.1 million
for the year ended
December 31, 2016
, primarily due to an increase of $1.5 million in income on bank owned life insurance, attributable to insurance proceeds in excess of the related cash surrender value of the policies, and an increase of
$470,000
in gains on securities transactions, net. Partially offsetting these increases was a decrease in fees and service charges for customer services of
$232,000
. Securities gains, net, in 2017, included gains of $1.1 million related to the Company’s trading portfolio, compared to gains of $507,000 in the comparative prior year. The trading portfolio is utilized to fund the Company’s deferred compensation obligation to certain employees and directors of the Company's deferred compensation plan (the Plan). The participants of this Plan, at their election, defer a portion of their compensation. Gains and losses on trading securities have no effect on net income since participants benefit from, and bear the full risk of, changes in the trading securities market values. Therefore, the Company records an equal and offsetting amount in compensation expense, reflecting the change in the Company’s obligations under the Plan.
Non-interest Expense
.
Non-interest expense decreased
$5.6 million
, or
7.6%
, to
$67.4 million
for the year ended
December 31, 2017
, from
$72.9 million
for the year ended
December 31, 2016
. The decrease was primarily due to a $4.0 million reduction in merger-related expenses which were associated with the Hopewell Valley acquisition reflected in 2016. Compensation and employee benefits expense decreased
$1.5 million
, due primarily to a reduction in severance, retention, and change-in-control compensation associated with the Hopewell Valley acquisition in the prior year, partially offset by annual merit-related salary increases and an increase in expenses related to the Company’s deferred compensation plan, which is described above, and which has no effect on net income. Data processing fees decreased
$1.5 million
, primarily due to non-recurring conversion costs and contract termination costs associated with the Hopewell Valley acquisition incurred in the prior year. Professional fees decreased
$687,000
primarily due to non-recurring merger-related professional fees associated with the Hopewell Valley acquisition incurred in the prior year. FDIC insurance expense decreased by
$430,000
due to a reduction in the FDIC's assessment rates for depository institutions with less than $10.0 billion in assets, which became effective in the quarter ended September 30, 2016. Other expense decreased by $1.0 million, primarily due to lower directors' equity award expense, related to the retirement of three directors.
Income Tax Expense.
The Company recorded income tax expense of
$27.0 million
for the year ended
December 31, 2017
, compared to
$13.7 million
for the year ended
December 31, 2016
. The effective tax rate for the year ended
December 31, 2017
, was
52.1%
, compared to
34.3%
for the year ended
December 31, 2016
. The effective tax rate for the year ended
December 31, 2017
was affected by: (i) an estimated tax charge of $10.5 million resulting from the re-measurement of our net deferred tax assets related to the recently enacted Tax Act; (ii) the adoption of ASU 2016-09 related to stock compensation, which resulted in a $2.3 million reduction in income tax expense from the exercise or vesting of equity awards. Previously these tax benefits were recorded through equity as an adjustment to additional paid in capital; and (iii) $1.5 million of tax-exempt income from bank owned life insurance proceeds in excess of the cash surrender value of the policies. The effective tax rate for the year ended December 31, 2016, was affected by $211,000 of non-deductible merger related expenses. The Company has approximately 1.3 million options outstanding from its 2009 grants which expire on January 30, 2019, at a weighted average price of $7.09 per share and a weighted average grant date fair value of $2.30 per share. To the extent options are exercised during 2018, this will result in additional tax benefits which will have a positive effect on our effective tax rate.
Comparison of Operating Results for the Years Ended
December 31, 2016
and
2015
Net Income.
Net income was $26.1 million and $19.5 million for the years ended December 31, 2016 and 2015, respectively. Net income for the year ended December 31, 2016, included merger-related expenses of $4.0 million ($2.4 million, after tax), associated with the acquisition of Hopewell Valley. Net income for the year ended December 31, 2015, included merger-related expenses of $672,000 ($574,000, after tax), associated with the acquisition of Hopewell Valley and a tax charge of $795,000 related to the write-down of deferred tax assets as a result of New York City tax reforms enacted in April 2015. Other significant variances from the prior year are as follows: a $21.2 million increase in net interest income, a $2.2 million increase in non-interest income, a $14.8 million increase in non-interest expense, and a $1.7 million increase in income tax expense.
Interest Income.
Interest income increased by $23.2 million, or 22.8%, to $125.0 million for the year ended December 31, 2016, as compared to $101.8 million for the year ended December 31, 2015, due to an increase in the average balance of interest-earning assets of $561.0 million, or 19.3%, and a 10 basis point increase in the yields earned to 3.61% from 3.51% for the prior year. The increase in the average balance of interest-earning assets was primarily attributable to an increase in average loans of $632.3 million, partially offset by a decrease in average mortgage-backed securities of $95.3 million. The increase in average loan balances was largely due to $342.6 million of loans added through the Hopewell Valley acquisition, $165.9 million in loan pool purchases of primarily multifamily loans, and, to a lesser extent, originated loan growth. The Company accreted interest income related to its PCI loans of $5.2 million for the year ended December 31, 2016,
55
as compared to $4.5 million for the year ended December 31, 2015. Interest income for the year ended December 31, 2016, included loan prepayment income of $1.9 million, compared to $2.1 million for the year ended December 31, 2015.
Interest Expense.
Interest expense increased $2.0 million, or 10.1%, to $21.7 million for the year ended December 31, 2016, from $19.7 million for the year ended December 31, 2015. The increase was due to an increase of $3.9 million in interest expense on deposits, partially offset by a decrease of $1.9 million in interest expense on borrowings. The increase in interest expense on deposits was attributable to an increase in the average balance of interest-bearing deposits of $546.7 million, or 33.1%, to $2.20 billion for the year ended December 31, 2016, from $1.65 billion for the year ended December 31, 2015, and a two basis point increase in the cost of interest-bearing deposits to 0.65% from 0.63%. The decrease in interest expense on borrowings was attributable to a decrease in the average balance of borrowings of $103.1 million and a six basis point decrease in borrowing costs from 1.56% at December 31, 2015, to 1.50% at December 31, 2016.
Net Interest Income.
Net interest income for the year ended December 31, 2016, increased $21.2 million, or 25.9%, to $103.3 million, from $82.1 million for the prior year, primarily due to a $561.0 million, or 19.3%, increase in our average interest-earning assets and a 15 basis point increase in our net interest margin to 2.98%. Yields earned on interest-earning assets increased 10 basis points to 3.61% for the year ended December 31, 2016, from 3.51% for the year ended December 31, 2015. The cost of interest-bearing liabilities decreased eight basis points to 0.80%for the year ended December 31, 2016, as compared to 0.88% for the prior year.
Provision for Loan Losses.
The provision for loan losses increased $282,000 to $635,000 for the year ended December 31, 2016, from $353,000 for the year ended December 31, 2015, primarily due to growth of the originated loan portfolio, partially offset by an improvement in asset quality indicators, including declines in non-performing and delinquent loans, and lower net charge-offs. Acquired loans, including those acquired from Hopewell Valley, are valued at estimated fair value on the date of acquisition, with no related allowance for loan losses. Net charge-offs were $810,000 for the year ended December 31, 2016, compared to net charge-offs of $1.9 million for the year ended December 31, 2015.
Non-interest Income.
Non-interest income increased $2.2 million, or 27.5%, to $10.1 million for the year ended December 31, 2016, from $7.9 million for the year ended December 31, 2015, primarily due to increases in fees and service charges for customer services of $989,000, income on bank owned life insurance of $231,000, and gains on securities transactions, net, of $1.2 million. These increases were partially offset by a decrease in other income of $198,000, primarily related to realized gains on sales of other real estate owned properties during 2015. Securities gains, net, in 2016 included gains of $507,000, net, related to the Company’s trading portfolio, while 2015 results included losses of $396,000 related to the Company’s trading portfolio. The trading portfolio is utilized to fund the Company’s deferred compensation obligation to certain employees and directors of the Company's deferred compensation plan (the “Plan”). The participants of this Plan, at their election, defer a portion of their compensation. Gains and losses on trading securities have no effect on net income since participants benefit from, and bear the full risk of, changes in the trading securities market values. Therefore, the Company records an equal and offsetting amount in compensation expense, reflecting the change in the Company’s obligations under the Plan.
Non-interest Expense
.
Non-interest expense increased $14.8 million, or 25.5%, to $72.9 million for the year ended December 31, 2016, from $58.1 million for the year ended December 31, 2015, primarily due to: (1) a $10.0 million increase in compensation and employee benefits largely driven by increased salary and benefit expense attributable to the addition of Hopewell Valley employees and general merit-related salary increases effective January 1, 2016, charges of $2.4 million related to severance, retention, and change-in-control compensation associated with the Hopewell Valley acquisition, and an increase in stock compensation expense related to the 2014 Equity Incentive Plan; (2) a $1.4 million increase in occupancy expense due to the addition of nine Hopewell Valley branches; (3) a $2.3 million increase in data processing costs, of which approximately $1.1 million was due to conversion costs associated with the Hopewell Valley acquisition; (4) an increase in professional fees of $424,000; and (5) an $832,000 increase in other expense, primarily due to increases in core deposit premium amortization, advertising costs, and general office expenses related to the Hopewell Valley acquisition.
Income Tax Expense.
The Company recorded income tax expense of $13.7 million for the year ended December 31, 2016, compared to $12.0 million for the year ended December 31, 2015. The effective tax rate for the year ended December 31, 2016, was 34.3% compared to 38.0%for the year ended December 31, 2015. Income tax expense for the year ended December 31, 2016, included $211,000 in non-deductible merger related expenses. Income tax expense for the year ended December 31, 2015, included a deferred tax asset write-down of $795,000 related to New York City tax reforms enacted in April 2015 and $574,000 in non-deductible merger related expenses.
56
Average Balances and Yields
The following tables set forth average balance sheets, average yields and costs, and certain other information for the years indicated. No tax-equivalent yield adjustments have been made, as we had no tax-free interest-earning assets during the years. All average balances are daily average balances based upon amortized costs. Non-accrual loans are included in the computation of average balances. The yields set forth below include the effect of deferred fees, discounts, and premiums that are amortized or accreted to interest income or interest expense.
|
|
For the Years Ended December 31,
|
|||||||||||||||||||||||||||||||
|
|
2017
|
2016
|
2015
|
|||||||||||||||||||||||||||||
|
|
Average Outstanding Balance
|
Interest
|
Average Yield/ Rate
|
Average Outstanding Balance
|
Interest
|
Average Yield/ Rate
|
Average Outstanding Balance
|
Interest
|
Average Yield/ Rate
|
|||||||||||||||||||||||
|
|
(Dollars in thousands)
|
|||||||||||||||||||||||||||||||
|
Interest-earning assets:
|
|
|
|
|
|
|
|
|
|
|||||||||||||||||||||||
|
Loans
(1)
|
$
|
3,052,410
|
|
$
|
120,340
|
|
3.94
|
%
|
$
|
2,781,336
|
|
$
|
111,776
|
|
4.02
|
%
|
$
|
2,149,011
|
|
$
|
87,179
|
|
4.06
|
%
|
||||||||
|
Mortgage-backed securities
(2)
|
434,166
|
|
9,174
|
|
2.11
|
%
|
525,355
|
|
10,832
|
|
2.06
|
%
|
620,653
|
|
12,982
|
|
2.09
|
%
|
||||||||||||||
|
Other securities
(2)
|
69,163
|
|
1,310
|
|
1.89
|
%
|
57,240
|
|
908
|
|
1.59
|
%
|
42,017
|
|
328
|
|
0.78
|
%
|
||||||||||||||
|
FHLB of New York stock
|
26,155
|
|
1,461
|
|
5.59
|
%
|
25,405
|
|
1,171
|
|
4.61
|
%
|
25,484
|
|
1,149
|
|
4.51
|
%
|
||||||||||||||
|
Interest-earning deposits
|
64,868
|
|
584
|
|
0.90
|
%
|
74,892
|
|
285
|
|
0.38
|
%
|
66,017
|
|
120
|
|
0.18
|
%
|
||||||||||||||
|
Total interest-earning assets
|
3,646,762
|
|
132,869
|
|
3.64
|
%
|
3,464,228
|
|
124,972
|
|
3.61
|
%
|
2,903,182
|
|
101,758
|
|
3.51
|
%
|
||||||||||||||
|
Non-interest-earning assets
|
270,161
|
|
|
|
268,154
|
|
|
|
219,566
|
|
|
|
||||||||||||||||||||
|
Total assets
|
$
|
3,916,923
|
|
|
|
$
|
3,732,382
|
|
|
|
$
|
3,122,748
|
|
|
|
|||||||||||||||||
|
Interest-bearing liabilities:
|
|
|
|
|
|
|
|
|
|
|||||||||||||||||||||||
|
Savings, NOW, and money market accounts
|
$
|
1,713,863
|
|
$
|
8,233
|
|
0.48
|
%
|
$
|
1,619,250
|
|
$
|
7,758
|
|
0.48
|
%
|
$
|
1,140,508
|
|
$
|
4,957
|
|
0.43
|
%
|
||||||||
|
Certificates of deposit
|
625,067
|
|
8,153
|
|
1.30
|
%
|
580,973
|
|
6,529
|
|
1.12
|
%
|
512,977
|
|
5,466
|
|
1.07
|
%
|
||||||||||||||
|
Total interest-bearing deposits
|
2,338,930
|
|
16,386
|
|
0.70
|
%
|
2,200,223
|
|
14,287
|
|
0.65
|
%
|
1,653,485
|
|
10,423
|
|
0.63
|
%
|
||||||||||||||
|
Borrowings
|
494,361
|
|
7,590
|
|
1.54
|
%
|
491,802
|
|
7,381
|
|
1.50
|
%
|
594,926
|
|
9,265
|
|
1.56
|
%
|
||||||||||||||
|
Total interest-bearing liabilities
|
2,833,291
|
|
23,976
|
|
0.85
|
%
|
2,692,025
|
|
21,668
|
|
0.80
|
%
|
2,248,411
|
|
19,688
|
|
0.88
|
%
|
||||||||||||||
|
Non-interest-bearing deposits
|
385,891
|
|
|
|
372,946
|
|
|
|
262,318
|
|
|
|
||||||||||||||||||||
|
Accrued expenses and other liabilities
|
59,034
|
|
|
|
53,808
|
|
|
|
39,936
|
|
|
|
||||||||||||||||||||
|
Total liabilities
|
3,278,216
|
|
|
|
3,118,779
|
|
|
|
2,550,665
|
|
|
|
||||||||||||||||||||
|
Stockholders’ equity
|
638,707
|
|
|
|
613,603
|
|
|
|
572,083
|
|
|
|
||||||||||||||||||||
|
Total liabilities and stockholders’ equity
|
$
|
3,916,923
|
|
|
|
$
|
3,732,382
|
|
|
|
$
|
3,122,748
|
|
|
|
|||||||||||||||||
|
Net interest income
|
|
$
|
108,893
|
|
|
|
$
|
103,304
|
|
|
|
$
|
82,070
|
|
|
|||||||||||||||||
|
Net interest rate spread
(3)
|
|
|
2.79
|
%
|
|
|
2.81
|
%
|
|
|
2.63
|
%
|
||||||||||||||||||||
|
Net interest-earning assets
(4)
|
$
|
813,471
|
|
|
|
$
|
772,203
|
|
|
|
$
|
654,771
|
|
|
|
|||||||||||||||||
|
Net interest margin
(5)
|
|
|
2.99
|
%
|
|
|
2.98
|
%
|
|
|
2.83
|
%
|
||||||||||||||||||||
|
Average interest-earning assets to interest-bearing liabilities
|
|
|
128.71
|
%
|
128.68
|
%
|
129.12
|
%
|
||||||||||||||||||||||||
|
(1)
|
Includes non-accruing loans.
|
|
|
(2)
|
Securities available-for-sale are reported at amortized cost.
|
|
|
(3)
|
Net interest rate spread represents the difference between the weighted average yield on interest-earning assets and the weighted average rate of interest-bearing liabilities.
|
|
|
(4)
|
Net interest-earning assets represent total interest-earning assets less total interest-bearing liabilities.
|
|
|
(5)
|
Net interest margin represents net interest income divided by average total interest-earning assets.
|
|
57
Rate/Volume Analysis
The following table presents the effects of changing rates and volumes on our net interest income for the years indicated. The rate column shows the effects attributable to changes in rate (changes in rate multiplied by prior volume). The volume column shows the effects attributable to changes in volume (changes in volume multiplied by prior rate). The total column represents the sum of the prior columns. For purposes of this table, changes attributable to both rate and volume, which cannot be segregated, have been allocated proportionately based on the changes due to rate and the changes due to volume.
|
|
Year Ended December 31,
|
Year Ended December 31,
|
|||||||||||||||||||||
|
|
2017 vs. 2016
|
2016 vs. 2015
|
|||||||||||||||||||||
|
|
|
|
Total
|
|
|
Total
|
|||||||||||||||||
|
|
Increase (Decrease) Due to
|
Increase
|
Increase (Decrease) Due to
|
Increase
|
|||||||||||||||||||
|
|
Volume
|
Rate
|
(Decrease)
|
Volume
|
Rate
|
(Decrease)
|
|||||||||||||||||
|
|
(Dollars in thousands)
|
||||||||||||||||||||||
|
Interest-earning assets:
|
|
|
|
|
|
|
|||||||||||||||||
|
Loans
|
$
|
10,637
|
|
$
|
(2,073
|
)
|
$
|
8,564
|
|
$
|
25,404
|
|
$
|
(807
|
)
|
$
|
24,597
|
|
|||||
|
Mortgage-backed securities
|
(1,935
|
)
|
277
|
|
(1,658
|
)
|
(1,967
|
)
|
(183
|
)
|
(2,150
|
)
|
|||||||||||
|
Other securities
|
208
|
|
194
|
|
402
|
|
151
|
|
429
|
|
580
|
|
|||||||||||
|
FHLB of New York stock
|
35
|
|
255
|
|
290
|
|
(4
|
)
|
26
|
|
22
|
|
|||||||||||
|
Interest-earning deposits
|
(32
|
)
|
331
|
|
299
|
|
18
|
|
147
|
|
165
|
|
|||||||||||
|
Total interest-earning assets
|
8,913
|
|
(1,016
|
)
|
7,897
|
|
23,602
|
|
(388
|
)
|
23,214
|
|
|||||||||||
|
Interest-bearing liabilities:
|
|
|
|
|
|
||||||||||||||||||
|
Savings, NOW and money market accounts
|
454
|
|
21
|
|
475
|
|
2,252
|
|
549
|
|
2,801
|
|
|||||||||||
|
Certificates of deposit
|
521
|
|
1,103
|
|
1,624
|
|
753
|
|
310
|
|
1,063
|
|
|||||||||||
|
Total deposits
|
975
|
|
1,124
|
|
2,099
|
|
3,005
|
|
859
|
|
3,864
|
|
|||||||||||
|
Borrowings
|
39
|
|
170
|
|
209
|
|
(1,558
|
)
|
(326
|
)
|
(1,884
|
)
|
|||||||||||
|
Total interest-bearing liabilities
|
1,014
|
|
1,294
|
|
2,308
|
|
1,447
|
|
533
|
|
1,980
|
|
|||||||||||
|
Change in net interest income
|
$
|
7,899
|
|
$
|
(2,310
|
)
|
$
|
5,589
|
|
$
|
22,155
|
|
$
|
(921
|
)
|
$
|
21,234
|
|
|||||
Asset Quality
Purchased Credit-Impaired Loans
PCI loans are recorded at estimated fair value using discounted expected future cash flows deemed to be collectible on the date acquired. Based on its detailed review of PCI loans and experience in loan workouts, management believes it has a reasonable expectation about the amount and timing of future cash flows and accordingly has classified PCI loans (
$22.7 million
at
December 31, 2017
) as accruing, even though they may be contractually past due. At
December 31, 2017
, 10.8% of PCI loans were past due 30 to 89 days, and 17.1% were past due 90 days or more, as compared to 6.6% and 19.3%, respectively, at
December 31, 2016
.
Originated and Acquired Loan
The discussion that follows includes originated and acquired loans, both held-for-investment and held-for-sale.
General.
Maintaining loan quality historically has been, and will continue to be, a key element of our business strategy. We employ conservative underwriting standards for new loan originations and maintain sound credit administration practices while the loans are outstanding. In addition, substantially all of our loans are secured, predominantly by real estate. At
December 31, 2017
, our non-performing loans totaled
$5.5 million
, or
0.18%
, of total loans held-for-investment. At the same time, net charge-offs have remained low at 0.03% of average loans outstanding for the year ended
December 31, 2016
, and 0.09% for the year ended
December 31, 2015
. The Company had net recoveries for the year ended
December 31, 2017
.
58
Non-performing Assets and Delinquent Loans.
The following table details non-performing assets at
December 31, 2017
and
2016
(in thousands):
|
|
December 31,
|
||||||
|
|
2017
|
2016
|
|||||
|
Non-accrual loans:
|
|
|
|||||
|
Held-for-investment
|
$
|
5,257
|
|
$
|
5,540
|
|
|
|
Non-accruing loans subject to restructuring agreements:
|
|
|
|||||
|
Held-for-investment
|
251
|
|
1,781
|
|
|||
|
Total non-accruing loans
|
5,508
|
|
7,321
|
|
|||
|
Loans 90 days or more past due and still accruing:
|
|
|
|||||
|
Held-for-investment
|
28
|
|
60
|
|
|||
|
Total non-performing loans
|
5,536
|
|
7,381
|
|
|||
|
Other real estate owned
|
850
|
|
850
|
|
|||
|
Total non-performing assets
|
$
|
6,386
|
|
$
|
8,231
|
|
|
|
Loans subject to restructuring agreements and still accruing
|
$
|
18,003
|
|
$
|
20,628
|
|
|
|
Accruing loans 30 to 89 days delinquent
|
$
|
12,044
|
|
$
|
10,100
|
|
|
The following table details non-performing loans by loan type at
December 31, 2017
and
2016
(in thousands):
|
|
December 31,
|
||||||
|
|
2017
|
2016
|
|||||
|
Real estate loans:
|
|
|
|||||
|
Commercial
|
$
|
4,087
|
|
$
|
5,513
|
|
|
|
One-to-four family residential
|
774
|
|
1,629
|
|
|||
|
Multifamily
|
417
|
|
43
|
|
|||
|
Home equity and lines of credit
|
156
|
|
127
|
|
|||
|
Commercial and industrial
|
74
|
|
9
|
|
|||
|
Total non-accrual loans:
|
5,508
|
|
7,321
|
|
|||
|
Loans delinquent 90 days or more and still accruing:
|
|
|
|||||
|
Real estate loans:
|
|
|
|||||
|
One-to-four family residential
|
27
|
|
52
|
|
|||
|
Home equity and lines of credit
|
—
|
|
8
|
|
|||
|
Commercial and industrial
|
1
|
|
—
|
|
|||
|
Total loans delinquent 90 days or more and still accruing
|
28
|
|
60
|
|
|||
|
Total non-performing loans
|
$
|
5,536
|
|
$
|
7,381
|
|
|
Generally, loans, excluding PCI loans, are placed on non-accruing status when they become 90 days or more delinquent, and remain on non-accrual status until they are brought current, have six consecutive months of performance under the loan terms, and factors indicating reasonable doubt about the timely collection of payments no longer exist. Therefore, loans may be current in accordance with their loan terms, or may be less than 90 days delinquent and still be on a non-accruing status.
The following table sets forth the total amounts of delinquencies for accruing loans that were 30 to 89 days past due by type and by amount at the dates indicated (in thousands):
59
|
|
December 31,
|
||||||
|
|
2017
|
2016
|
|||||
|
Real estate loans:
|
|
|
|||||
|
Commercial
|
$
|
4,347
|
|
$
|
4,578
|
|
|
|
One-to-four family residential
|
4,162
|
|
3,621
|
|
|||
|
Construction and land
|
6
|
|
—
|
|
|||
|
Multifamily
|
3,298
|
|
1,440
|
|
|||
|
Home equity and lines of credit
|
—
|
|
263
|
|
|||
|
Commercial and industrial loans
|
202
|
|
148
|
|
|||
|
Other loans
|
29
|
|
50
|
|
|||
|
$
|
12,044
|
|
$
|
10,100
|
|
||
The increase in delinquent loans was primarily attributable to one multifamily real estate loan with a balance of $1.5 million that was 31 days delinquent at December 31, 2017, and became current subsequent to year end.
Included in non-accruing loans are loans subject to restructuring agreements totaling $251,000 and $1.8 million at
December 31, 2017
, and
December 31, 2016
, respectively. At
December 31, 2017
, the one non-accruing TDR was not performing in accordance with its restructured terms and consisted of one one-to-four family residential loan which was over 90 days delinquent and collateralized by real estate with a recent appraised value of $629,000. At December 31, 2016, $1.4 million, or 76.4%, of the $1.8 million non-accruing TDRs were not performing in accordance with their restructured terms.
The Company also holds loans subject to restructuring agreements that are on accrual status, which totaled
$18.0 million
and
$20.6 million
at
December 31, 2017
, and
December 31, 2016
, respectively. At
December 31, 2017
, and December 31, 2016, all of the accruing TDR loans were performing in accordance with their restructured terms. Generally, the types of concessions that we make to troubled borrowers include both temporary and permanent reductions to interest rates, extensions of payment terms, and, to a lesser extent, forgiveness of principal and interest.
The table below sets forth the amounts and categories of the TDRs as of
December 31, 2017
, and
December 31, 2016
(in thousands):
|
|
At December 31,
|
||||||||||||||
|
|
2017
|
2016
|
|||||||||||||
|
|
Non-Accruing
|
Accruing
|
Non-Accruing
|
Accruing
|
|||||||||||
|
Real estate loans:
|
|
|
|
|
|||||||||||
|
Commercial
|
$
|
—
|
|
$
|
13,272
|
|
$
|
1,000
|
|
$
|
15,828
|
|
|||
|
One-to-four family residential
|
251
|
|
3,135
|
|
783
|
|
2,835
|
|
|||||||
|
Multifamily
|
—
|
|
1,440
|
|
—
|
|
1,527
|
|
|||||||
|
Home equity and lines of credit
|
—
|
|
69
|
|
—
|
|
336
|
|
|||||||
|
Commercial and industrial loans
|
—
|
|
87
|
|
—
|
|
102
|
|
|||||||
|
|
$
|
251
|
|
$
|
18,003
|
|
$
|
1,783
|
|
$
|
20,628
|
|
|||
Allowance for loan losses.
The allowance for loan losses to non-performing loans increased from
333.23%
at
December 31, 2016
to
472.63%
at
December 31, 2017
. This increase was primarily attributable to a decrease in non-performing loans of $
1.8 million
, from
$7.4 million
at
December 31, 2016
to
$5.5 million
at
December 31, 2017
. The Company utilizes external appraisals for its impairment analysis. Generally, non-performing loans are charged down to the appraised value of collateral less costs to sell, which reduces the ratio of the allowance for loan losses to non-performing loans. Downward adjustments to appraisal values, primarily to reflect “quick sale” discounts, are generally recorded as specific reserves within the allowance for loan losses.
The allowance for loan losses to originated loans held-for-investment, net, decreased to
1.04
% at
December 31, 2017
, from
1.10%
at
December 31, 2016
. The decline in the loan coverage ratio from December 31, 2016 resulted from an overall improvement in asset quality and a decline in non-performing loans. Net recoveries (of previous loan charge-offs) were $154,000 for the year ended
December 31, 2017
, compared to net charge-offs of $810,000 for the year ended
2016
. The provision for loan losses was $1.4 million and $635,000 for the years ended
December 31, 2017
and
2016
, respectively.
60
Specific reserves on impaired loans decreased $246,000, or 75.0%, from $328,000 at
December 31, 2016
, to $82,000 at
December 31, 2017
. The decrease was primarily due to fewer impaired loans at
December 31, 2017
. At
December 31, 2017
, the Company had 33 loans classified as impaired and recorded $82,000 of specific reserves on eight of the 33 impaired loans. At
December 31, 2016
, the Company had 36 loans classified as impaired and recorded $328,000 of specific reserves on 13 of the 36 impaired loans.
The following table
sets forth activity in our allowance for loan losses, by loan type,
at December 31,
for the years indicated (in thousands):
|
|
Real estate loans
|
|
|
|
|
|
|||||||||||||||||||||||||||||||||||||
|
|
Commercial
|
One-to-four Family Residential
|
Construction and Land
|
Multifamily
|
Home Equity and Lines of Credit
|
Commercial and Industrial
|
Other
|
PCI
|
Acquired
|
Unallocated
|
Total Allowance for Loan Losses
|
||||||||||||||||||||||||||||||||
|
2014
|
$
|
9,309
|
|
$
|
951
|
|
$
|
266
|
|
$
|
12,219
|
|
$
|
901
|
|
$
|
841
|
|
$
|
134
|
|
$
|
400
|
|
$
|
62
|
|
$
|
1,209
|
|
$
|
26,292
|
|
||||||||||
|
Provision for loan losses
|
(774
|
)
|
93
|
|
(5
|
)
|
263
|
|
(33
|
)
|
484
|
|
5
|
|
383
|
|
53
|
|
(116
|
)
|
353
|
|
|||||||||||||||||||||
|
Recoveries
|
2
|
|
20
|
|
—
|
|
25
|
|
42
|
|
34
|
|
17
|
|
—
|
|
—
|
|
—
|
|
140
|
|
|||||||||||||||||||||
|
Charge-offs
|
(1,431
|
)
|
(277
|
)
|
—
|
|
(120
|
)
|
(115
|
)
|
(71
|
)
|
(1
|
)
|
—
|
|
—
|
|
—
|
|
(2,015
|
)
|
|||||||||||||||||||||
|
2015
|
7,106
|
|
787
|
|
261
|
|
12,387
|
|
795
|
|
1,288
|
|
155
|
|
783
|
|
115
|
|
1,093
|
|
24,770
|
|
|||||||||||||||||||||
|
Provision for loan losses
|
(1,217
|
)
|
(105
|
)
|
(89
|
)
|
2,843
|
|
(209
|
)
|
494
|
|
(62
|
)
|
113
|
|
(40
|
)
|
(1,093
|
)
|
635
|
|
|||||||||||||||||||||
|
Recoveries
|
181
|
|
2
|
|
—
|
|
—
|
|
2
|
|
4
|
|
5
|
|
—
|
|
—
|
|
—
|
|
194
|
|
|||||||||||||||||||||
|
Charge-offs
|
(638
|
)
|
(20
|
)
|
—
|
|
(278
|
)
|
—
|
|
(66
|
)
|
(2
|
)
|
—
|
|
—
|
|
—
|
|
(1,004
|
)
|
|||||||||||||||||||||
|
2016
|
5,432
|
|
664
|
|
172
|
|
14,952
|
|
588
|
|
1,720
|
|
96
|
|
896
|
|
75
|
|
—
|
|
24,595
|
|
|||||||||||||||||||||
|
Provision for loan losses
|
(302
|
)
|
(161
|
)
|
438
|
|
2,329
|
|
(459
|
)
|
(453
|
)
|
(2
|
)
|
55
|
|
(34
|
)
|
—
|
|
1,411
|
|
|||||||||||||||||||||
|
Recoveries
|
70
|
|
—
|
|
—
|
|
277
|
|
97
|
|
79
|
|
—
|
|
—
|
|
33
|
|
—
|
|
556
|
|
|||||||||||||||||||||
|
Charge-offs
|
(4
|
)
|
—
|
|
—
|
|
(184
|
)
|
(104
|
)
|
(73
|
)
|
—
|
|
—
|
|
(37
|
)
|
—
|
|
(402
|
)
|
|||||||||||||||||||||
|
2017
|
$
|
5,196
|
|
$
|
503
|
|
$
|
610
|
|
$
|
17,374
|
|
$
|
122
|
|
$
|
1,273
|
|
$
|
94
|
|
$
|
951
|
|
$
|
37
|
|
$
|
—
|
|
$
|
26,160
|
|
||||||||||
During the year ended
December 31, 2017
, the Company recorded net recoveries of $154,000, as compared to net charge-offs of $810,000 for the year ended
December 31, 2016
. The decrease in net charge-offs was primarily attributable to a $523,000 decrease in net charge-offs related to commercial real estate loans and a $371,000 decrease in net charge-offs related to multifamily real estate loans. The allowance for loan losses related to multifamily real estate loans and construction and land loans increased from 2016 to 2017 due to growth in the portfolios. In general, as a result of continued improvement in asset quality, including declines in non-performing loans and lower net charge-offs, the allowance for loan losses in all of the other loan categories other than PCI decreased in 2017 as compared to 2016. The increase in the allowance for PCI loans was attributable to the annual recasting of PCI cash flows.
Prior to December 31, 2016, we maintained an amount identified as the unallocated component within the allowance for loan losses related to indicators of loan losses not fully captured in other components of the allowance for loan losses methodology, as well as the inherent imprecision of the loss estimation process. During the fourth quarter of 2016, the Company enhanced the allowance for loan losses qualitative framework to more fully capture the risks related to certain loan loss factors. These enhancements are meant to increase the level of precision in the allowance for loan losses. As a result, the Company will no longer have an unallocated reserve in its allowance for loan losses, as the risks and uncertainties meant to be captured by the unallocated allowance have been included in the qualitative framework for the respective loan portfolios.
61
Management of Market Risk
General
. A majority of our assets and liabilities are monetary in nature. Consequently, our most significant form of market risk is interest rate risk. Our assets, consisting primarily of mortgage-related securities and loans, generally have longer maturities than our liabilities, which consist primarily of deposits and wholesale borrowings. As a result, a principal part of our business strategy involves managing interest rate risk and limiting the exposure of our net interest income to changes in market interest rates. Accordingly, our board of directors has established a Management Asset-Liability Committee (MALCO), comprised of our SVP & Chief Investment Officer and Treasurer, who chairs this Committee, our President and Chief Executive Officer, our EVP & Chief Administration Officer, EVP & Chief Financial Officer, EVP & Chief Lending Officer, EVP Operations, EVP & Director of Business Development and VP & Director of Marketing, and other officers and staff as necessary or appropriate to manage interest rate risk. This committee is responsible for, among other things, evaluating the interest rate risk inherent in our assets and liabilities, for recommending to the risk management committee of our board of directors the level of risk that is appropriate given our business strategy, operating environment, capital, liquidity and performance objectives, and for managing this risk consistent with the guidelines approved by the board of directors.
We seek to manage our interest rate risk in order to minimize the exposure of our earnings and capital to changes in interest rates. As part of our ongoing asset-liability management, we currently use the following strategies to manage our interest rate risk:
|
•
|
originating multifamily loans and commercial real estate loans that generally have shorter maturities than one-to-four family residential real estate loans and have higher interest rates that generally reset from five to ten years;
|
|
•
|
investing in shorter-term investment grade corporate securities and mortgage-backed securities; and
|
|
•
|
obtaining general financing through lower-cost core deposits and longer-term FHLB advances and repurchase agreements.
|
Shortening the average term of our interest-earning assets by increasing our investments in shorter-term assets, as well as originating loans with variable interest rates, helps to match the maturities and interest rates of our assets and liabilities better, thereby reducing the exposure of our net interest income to changes in market interest rates.
Net Portfolio Value Analysis
.
We compute amounts by which the net present value of our assets and liabilities (net portfolio value or “NPV”) would change in the event market interest rates changed over an assumed range of rates. Our simulation model uses a discounted cash flow analysis to measure the interest rate sensitivity of NPV. Depending on current market interest rates, we estimate the economic value of these assets and liabilities under the assumption that interest rates experience an instantaneous and sustained increase of 100, 200, 300, or 400 basis points, or a decrease of 100 and 200 basis points. A basis point equals one-hundredth of one percent, and 100 basis points equals one percent. An increase in interest rates from 3% to 4% would mean, for example, a 100 basis point increase in the “Change in Interest Rates” column below.
Net Interest Income Analysis.
In addition to NPV calculations, we analyze our sensitivity to changes in interest rates through our net interest income model. Net interest income is the difference between the interest income we earn on our interest-earning assets, such as loans and securities, and the interest we pay on our interest-bearing liabilities, such as deposits and borrowings. In our model, we estimate what our net interest income would be for a twelve-month period. Depending on current market interest rates we then calculate what the net interest income would be for the same period under the assumption that interest rates experience an instantaneous and sustained increase or decrease of 100, 200, 300, or 400 basis points, or a decrease of 100 and 200 basis points.
The following table sets forth, as of
December 31, 2017
, our calculation of the estimated changes in our NPV, NPV ratio, and percent change in net interest income that would result from the designated instantaneous and sustained changes in interest rates (dollars in thousands). Computations of prospective effects of hypothetical interest rate changes are based on numerous assumptions, including relative levels of market interest rates, loan prepayments and deposit repricing characteristics including decay rates, and correlations to movements in interest rates, and should not be relied on as indicative of actual results.
62
|
|
NPV at December 31, 2017
|
|
||||||||||||||||||||||||||
|
Change in Interest Rates (basis points)
|
Estimated Present Value of Assets
|
Estimated Present Value of Liabilities
|
Estimated NPV
|
Estimated Change In NPV
|
Estimated Change in NPV %
|
Estimated NPV/Present Value of Assets Ratio
|
Next 12 Months Net Interest Income Percent Change
|
Months 13-24 Net Interest Income Percent Change
|
||||||||||||||||||||
|
400
|
$
|
3,637,558
|
|
$
|
2,979,633
|
|
$
|
657,925
|
|
$
|
(171,778
|
)
|
(20.70
|
)%
|
18.09
|
%
|
(10.35
|
)%
|
(0.70
|
)%
|
||||||||
|
300
|
3,730,853
|
|
3,032,696
|
|
698,157
|
|
(131,546
|
)
|
(15.85
|
)%
|
18.71
|
%
|
(7.59
|
)%
|
(0.37
|
)%
|
||||||||||||
|
200
|
3,832,498
|
|
3,088,081
|
|
744,417
|
|
(85,286
|
)
|
(10.28
|
)%
|
19.42
|
%
|
(4.67
|
)%
|
0.46
|
%
|
||||||||||||
|
100
|
3,933,263
|
|
3,145,932
|
|
787,331
|
|
(42,372
|
)
|
(5.11
|
)%
|
20.02
|
%
|
(2.20
|
)%
|
0.47
|
%
|
||||||||||||
|
—
|
4,036,107
|
|
3,206,404
|
|
829,703
|
|
—
|
|
—
|
%
|
20.56
|
%
|
—
|
%
|
—
|
%
|
||||||||||||
|
(100)
|
4,138,762
|
|
3,275,424
|
|
863,338
|
|
33,635
|
|
4.05
|
%
|
20.86
|
%
|
1.21
|
%
|
0.22
|
%
|
||||||||||||
|
(200)
|
4,244,864
|
|
3,347,146
|
|
897,718
|
|
68,015
|
|
8.20
|
%
|
21.15
|
%
|
0.21
|
%
|
(0.56
|
)%
|
||||||||||||
.
|
(1)
|
Assumes an instantaneous and sustained uniform change in interest rates at all maturities.
|
|||
|
(2)
|
NPV includes non-interest earning assets and liabilities.
|
|||
The table above indicates that at
December 31, 2017
, in the event of a 200 basis point decrease in interest rates, we would experience an
8.20%
increase in estimated net portfolio value and a
0.21%
increase in net interest income in year one and a
0.56%
decrease in net income in year two. In the event of a 400 basis point increase in interest rates, we would experience a
20.70%
decrease in net portfolio value and a
10.35%
decrease in net interest income in year one and a
0.70%
decrease in net income in year two. Our policies provide that, in the event of a 200 basis point decrease or less in interest rates, our net present value ratio should decrease by no more than 300 basis points and 10%, and in the event of a 400 basis point increase or less, our net present value should decrease by no more than 475 basis points and 35%. In the event of a 200 basis point decrease or less, our projected net interest income should decrease by no more than 10% in year one and 25% in year two, and in the event of a 400 basis point increase or less, our projected net interest income should decrease by no more than 30% in year one and 22% in year two. However, when the federal funds rate is low and negative rate shocks do not produce meaningful results, management may temporarily suspend use of guidelines for negative rate shocks. At
December 31, 2017
, we were in compliance with all board approved policies with respect to interest rate risk management.
At December 31, 2016, in the event of a 200 basis point decrease in interest rates, we would experience a 23.69% increase in estimated net portfolio value and a 1.89% decrease in net interest income in year one and a 6.83% decrease in net income in year two. In the event of a 400 basis point increase in interest rates, we would experience a 26.05% decrease in net portfolio value and a 15.85% decrease in net interest income in year one and a 7.48% decrease in net income in year two.
Certain shortcomings are inherent in the methodologies used in determining interest rate risk through changes in net portfolio value and net interest income. Our model requires us to make certain assumptions that may or may not reflect the manner in which actual yields and costs respond to changes in market interest rates. However, we also apply consistent parallel yield curve shifts (in both directions) to determine possible changes in net interest income if the theoretical yield curve shifts occurred gradually. Net interest income analysis also adjusts the asset and liability repricing analysis based on changes in prepayment rates resulting from the parallel yield curve shifts. In addition, the net portfolio value and net interest income information presented assume that the composition of our interest-sensitive assets and liabilities existing at the beginning of a period remains constant over the period being measured and assume that a particular change in interest rates is reflected uniformly across the yield curve regardless of the duration or repricing of specific assets and liabilities. Accordingly, although interest rate risk calculations provide an indication of our interest rate risk exposure at a particular point in time, such measurements are not intended to and do not provide a precise forecast of the effect of changes in market interest rates on our net portfolio value or net interest income and will differ from actual results.
Liquidity and Capital Resources
Liquidity is the ability to fund assets and meet obligations as they come due. Our primary sources of funds consist of deposit inflows, loan repayments, borrowings through repurchase agreements and advances from money center banks and the FHLB of New York, and repayments, maturities and sales of securities. While maturities and scheduled amortization of loans and securities are reasonably predictable sources of funds, deposit flows and mortgage prepayments are greatly influenced by general interest rates, economic conditions, and competition. Our board risk committee is responsible for establishing and monitoring our liquidity targets and strategies in order to ensure that sufficient liquidity exists for meeting the borrowing needs and withdrawals of deposits by our customers as well as unanticipated contingencies. We seek to maintain a ratio of liquid assets (not subject to pledge or encumbered) as a percentage of deposits and borrowings of 35% or greater. At
December 31,
63
2017
, this ratio was 46.88%. We believe that we had sufficient sources of liquidity to satisfy our short- and long-term liquidity needs at
December 31, 2017
.
We regularly adjust our investments in liquid assets based on our assessment of:
|
•
|
expected loan demand;
|
|
•
|
expected deposit flows;
|
|
•
|
yields available on interest-earning deposits and securities; and
|
|
•
|
the objectives of our asset/liability management program.
|
Our most liquid assets are cash and cash equivalents, corporate bonds, and unpledged mortgage-related securities issued or guaranteed by the U.S. Government, Fannie Mae, or Freddie Mac, that we can either borrow against or sell. We also have the ability to surrender bank-owned life insurance contracts. The surrender of these contracts would subject the Company to income taxes and penalties for increases in the cash surrender values over the original premium payments.
The Company had the following primary sources of liquidity at
December 31, 2017
(in thousands):
|
Cash and cash equivalents
|
$
|
57,839
|
|
|
Corporate bonds
|
$
|
68,130
|
|
|
Unpledged multifamily loans
|
$
|
885,300
|
|
|
Unpledged mortgage-backed securities (Issued or guaranteed by the U.S. Government, Fannie Mae, or Freddie Mac)
|
$
|
72,600
|
|
At
December 31, 2017
, we had
$43.6 million
in outstanding loan commitments. In addition, we had
$98.4 million
in unused lines of credit to borrowers. Certificates of deposit due within one year of
December 31, 2017
, totaled
$401.3 million
, or
14.1%
of total deposits.
If these deposits do not remain with us, we will be required to seek other sources of funds, including loan sales, securities sales, other deposit products, including replacement certificates of deposit, securities sold under agreements to repurchase (repurchase agreements), and advances from the FHLB of New York and other borrowing sources. Depending on market conditions, we may be required to pay higher rates on such deposits or other borrowings than we currently pay on the certificates of deposit due on
December 31, 2017
. Based on experience, we believe that a significant portion of such deposits will remain with us, and we have the ability to attract and retain deposits by adjusting the interest rates offered.
We have a detailed contingency funding plan that is reviewed and reported to the board risk committee at least quarterly. This plan
includes monitoring cash on a daily basis to determine the liquidity needs of
the Bank. Additionally,
management
performs a
stress test
on
the Bank’s retail deposits and wholesale funding sources in several scenarios on a quarterly basis.
The stress scenarios include deposit
attrition
of up to 50%,
and
selling
our securities available-for-sale portfolio at a discount of
20% to its current estimated fair value. The
Bank continues to maintain significant liquidity under all stress scenarios.
Northfield Bancorp, Inc. is a separate legal entity from Northfield Bank and must provide for its own liquidity to fund dividend payments, stock repurchases, and other corporate risk factors. The Company’s primary source of liquidity is the receipt of dividend payments from the Bank in accordance with applicable regulatory requirements. At
December 31, 2017
, Northfield Bancorp, Inc. (unconsolidated) had liquid assets of
$20.1 million
.
Northfield Bank is subject to various regulatory capital requirements, including a risk-based capital measure. The risk-based capital guidelines include both a definition of capital and a framework for calculating risk-weighted assets by assigning assets and off-balance sheet items to broad risk categories. At
December 31, 2017
, Northfield Bank exceeded all regulatory capital requirements and is considered “well capitalized” under regulatory guidelines. See “Item 1. Business - Supervision and Regulation” and Note 13 of the Notes to the Consolidated Financial Statements.
Off-Balance Sheet Arrangements and Aggregate Contractual Obligations
Commitments.
As a financial services provider, we routinely are a party to various financial instruments with off-balance-sheet risks, such as commitments to extend credit, and unused lines of credit. While these contractual obligations represent our potential future cash requirements, a significant portion of commitments to extend credit may expire without
64
being drawn upon. Such commitments are subject to the same credit policies and approval process applicable to loans we originate. In addition, we routinely enter into commitments to sell mortgage loans; such amounts are not significant to our operations. For additional information, see Note 12 of the Notes to the Consolidated Financial Statements.
Contractual Obligations.
In the ordinary course of our operations, we enter into certain contractual obligations. Such obligations include leases for premises and equipment, agreements with respect to borrowed funds and deposit liabilities, and agreements with respect to investments.
The following table summarizes our significant fixed and determinable contractual obligations and other funding needs by payment date at
December 31, 2017
(in thousands). The payment amounts represent those amounts due to the recipient and do not include any unamortized premiums or discounts or other similar carrying amount adjustments.
|
|
Payments Due by Period
|
|||||||||||||||||||
|
Contractual Obligations
|
Less Than One Year
|
One to Three Years
|
More Than Three to Five Years
|
More Than Five Years
|
Total
|
|||||||||||||||
|
Borrowings
(1)
|
$
|
163,459
|
|
$
|
213,502
|
|
$
|
90,000
|
|
$
|
—
|
|
$
|
466,961
|
|
|||||
|
Floating rate advances
|
5,033
|
|
—
|
|
—
|
|
—
|
|
5,033
|
|
||||||||||
|
Operating leases
|
4,867
|
|
10,501
|
|
9,089
|
|
35,748
|
|
60,205
|
|
||||||||||
|
Capitalized leases
|
262
|
|
44
|
|
—
|
|
—
|
|
306
|
|
||||||||||
|
Certificates of deposit
|
401,315
|
|
280,296
|
|
57,318
|
|
—
|
|
738,929
|
|
||||||||||
|
Total
|
$
|
574,936
|
|
$
|
504,343
|
|
$
|
156,407
|
|
$
|
35,748
|
|
$
|
1,271,434
|
|
|||||
|
Commitments to extend credit
(2)
|
$
|
142,044
|
|
$
|
—
|
|
$
|
—
|
|
$
|
—
|
|
$
|
142,044
|
|
|||||
|
(1)
|
Includes repurchase agreements, FHLB of New York advances, and accrued interest payable at December 31, 2017.
|
||
|
(2)
|
Includes unused lines of credit which are assumed to be funded within the year.
|
||
Recent Accounting Standards and Interpretations
See Note 1(r) of the Notes to the Consolidated Financial Statements.
Impact of Inflation and Changing Prices
Our consolidated financial statements and related notes have been prepared in accordance with U.S. GAAP. U.S. GAAP generally requires the measurement of financial position and operating results in terms of historical dollars without consideration for changes in the relative purchasing power of money over time due to inflation. The effect of inflation is reflected in the increased cost of our operations. Unlike industrial companies, our assets and liabilities are primarily monetary in nature. As a result, changes in market interest rates have a greater effect on our performance than inflation.
|
ITEM 7A.
|
QUANTITATIVE AND QUALITATIVE DISCLOSURE ABOUT MARKET RISK
|
For information regarding market risk see “Item 7. Management’s Discussion and Analysis of Financial Conditions and Results of Operations - Management of Market Risk.”
|
ITEM 8.
|
FINANCIAL STATEMENTS AND SUPPLEMENTARY DATA
|
65
Report of Independent Registered Public Accounting Firm
To the Stockholders and Board of Directors
Northfield Bancorp, Inc.:
Opinion on the Consolidated
Financial Statements
We have audited the accompanying consolidated balance sheets of Northfield Bancorp, Inc., and subsidiaries (the “Company”) as of
December 31, 2017
and
2016
, the related consolidated statements of comprehensive income, changes in stockholders’ equity, and cash flows for each of the years in the three-year period ended
December 31, 2017
, and the related notes (collectively, the “consolidated financial statements”). In our opinion, the consolidated financial statements present fairly, in all material respects, the financial position of the Company as of
December 31, 2017
and
2016
, and the results of its operations and its cash flows for each of the years in the three‑year period ended
December 31, 2017
, in conformity with U.S. generally accepted accounting principles.
We also have audited, in accordance with the standards of the Public Company Accounting Oversight Board (United States) (“PCAOB”), the Company’s internal control over financial reporting as of December 31, 2017, based on criteria established in Internal Control - Integrated Framework (2013) issued by the Committee of Sponsoring Organizations of the Treadway Commission, and our report dated
March 1, 2018
expressed an unqualified opinion on the effectiveness of the Company’s internal control over financial reporting.
Basis for Opinion
These consolidated financial statements are the responsibility of the Company’s management. Our responsibility is to express an opinion on these consolidated financial statements based on our audits. We are a public accounting firm registered with the PCAOB and are required to be independent with respect to the Company in accordance with the U.S. federal securities laws and the applicable rules and regulations of the Securities and Exchange Commission and the PCAOB.
We conducted our audits in accordance with the standards of the PCAOB. Those standards require that we plan and perform the audit to obtain reasonable assurance about whether the consolidated financial statements are free of material misstatement, whether due to error or fraud. Our audits included performing procedures to assess the risks of material misstatement of the consolidated financial statements, whether due to error or fraud, and performing procedures that respond to those risks. Such procedures included examining, on a test basis, evidence regarding the amounts and disclosures in the consolidated financial statements. Our audits also included evaluating the accounting principles used and significant estimates made by management, as well as evaluating the overall presentation of the consolidated financial statements. We believe that our audits provide a reasonable basis for our opinion.
/s/ KPMG LLP
We have not been able to determine the specific year that we began serving as the Company’s auditor, however we are aware that we have served as the Company’s auditor since at least 1967.
Short Hills, New Jersey
March 1, 2018
66
Report of Independent Registered Public Accounting Firm
To the Stockholders and Board of Directors
Northfield Bancorp, Inc.:
Opinion on Internal Control Over Financial Reporting
We have audited Northfield Bancorp, Inc. and subsidiaries' (the “Company”) internal control over financial reporting as of
December 31, 2017
, based on criteria established in
Internal Control - Integrated Framework (2013) issued by the Committee of Sponsoring Organizations of the Treadway Commission. In our opinion, the Company maintained, in all material respects, effective internal control over financial reporting as of
December 31, 2017
, based on criteria established in Internal Control - Integrated Framework (2013) issued by the Committee of Sponsoring Organizations of the Treadway Commission.
We also have audited, in accordance with the standards of the Public Company Accounting Oversight Board (United States) (“PCAOB”), the consolidated balance sheets of Northfield Bancorp, Inc. and subsidiaries as of
December 31, 2017
and
2016
, the related consolidated statements of comprehensive income, changes in stockholders’ equity, and cash flows for each of the years in the three-year period ended
December 31, 2017
, and the related notes (collectively, the consolidated financial statements), and our report dated
March 1, 2018
expressed an unqualified opinion on those consolidated financial statements.
Basis for Opinion
The Company’s management is responsible for maintaining effective internal control over financial reporting and for its assessment of the effectiveness of internal control over financial reporting, included in the accompanying Management Report on Internal Control over Financial Reporting. Our responsibility is to express an opinion on the Company’s internal control over financial reporting based on our audit. We are a public accounting firm registered with the PCAOB and are required to be independent with respect to the Company in accordance with the U.S. federal securities laws and the applicable rules and regulations of the Securities and Exchange Commission and the PCAOB.
We conducted our audit in accordance with the standards of the PCAOB. Those standards require that we plan and perform the audit to obtain reasonable assurance about whether effective internal control over financial reporting was maintained in all material respects. Our audit of internal control over financial reporting included obtaining an understanding of internal control over financial reporting, assessing the risk that a material weakness exists, and testing and evaluating the design and operating effectiveness of internal control based on the assessed risk. Our audit also included performing such other procedures as we considered necessary in the circumstances. We believe that our audit provides a reasonable basis for our opinion.
Definition and Limitations of Internal Control Over Financial Reporting
A company’s internal control over financial reporting is a process designed to provide reasonable assurance regarding the reliability of financial reporting and the preparation of financial statements for external purposes in accordance with generally accepted accounting principles. A company’s internal control over financial reporting includes those policies and procedures that (1) pertain to the maintenance of records that, in reasonable detail, accurately and fairly reflect the transactions and dispositions of the assets of the company; (2) provide reasonable assurance that transactions are recorded as necessary to permit preparation of financial statements in accordance with generally accepted accounting principles, and that receipts and expenditures of the company are being made only in accordance with authorizations of management and directors of the company; and (3) provide reasonable assurance regarding prevention or timely detection of unauthorized acquisition, use, or disposition of the company’s assets that could have a material effect on the financial statements.
Because of its inherent limitations, internal control over financial reporting may not prevent or detect misstatements. Also, projections of any evaluation of effectiveness to future periods are subject to the risk that controls may become inadequate because of changes in conditions, or that the degree of compliance with the policies or procedures may deteriorate.
/s/ KPMG LLP
Short Hills, New Jersey
March 1, 2018
67
NORTHFIELD BANCORP, INC. AND SUBSIDIARIES
|
|
At December 31,
|
||||||
|
|
2017
|
2016
|
|||||
|
|
(Dollars in thousands, except share data)
|
||||||
|
ASSETS:
|
|
|
|||||
|
Cash and due from banks
|
$
|
17,446
|
|
$
|
18,412
|
|
|
|
Interest-bearing deposits in other financial institutions
|
40,393
|
|
77,673
|
|
|||
|
Total cash and cash equivalents
|
57,839
|
|
96,085
|
|
|||
|
Trading securities
|
9,597
|
|
7,857
|
|
|||
|
Securities available-for-sale, at estimated fair value (encumbered $4,628 at December 31, 2017, and $11,786 at December 31, 2016)
|
515,121
|
|
498,897
|
|
|||
|
Securities held-to-maturity, (estimated fair value of $9,892 at December 31, 2017, and $10,118 at December 31, 2016) (encumbered $0 at December 31, 2017, and $2,108 at December 31, 2016)
|
9,931
|
|
10,148
|
|
|||
|
Originated loans held-for-investment, net
|
2,425,275
|
|
2,144,346
|
|
|||
|
Loans acquired
|
692,803
|
|
793,240
|
|
|||
|
Purchased credit-impaired (PCI) loans held-for-investment
|
22,741
|
|
30,498
|
|
|||
|
Loans held-for-investment, net
|
3,140,819
|
|
2,968,084
|
|
|||
|
Allowance for loan losses
|
(26,160
|
)
|
(24,595
|
)
|
|||
|
Net loans held-for-investment
|
3,114,659
|
|
2,943,489
|
|
|||
|
Accrued interest receivable
|
10,713
|
|
9,714
|
|
|||
|
Bank owned life insurance
|
150,604
|
|
148,047
|
|
|||
|
Federal Home Loan Bank (FHLB) of New York stock, at cost
|
25,046
|
|
25,123
|
|
|||
|
Premises and equipment, net
|
25,746
|
|
26,910
|
|
|||
|
Goodwill
|
38,411
|
|
38,411
|
|
|||
|
Other real estate owned
|
850
|
|
850
|
|
|||
|
Other assets
|
32,900
|
|
44,563
|
|
|||
|
Total assets
|
$
|
3,991,417
|
|
$
|
3,850,094
|
|
|
|
LIABILITIES AND STOCKHOLDERS’ EQUITY:
|
|
|
|||||
|
LIABILITIES:
|
|
|
|
|
|||
|
Deposits
|
$
|
2,836,979
|
|
$
|
2,713,587
|
|
|
|
Securities sold under agreements to repurchase
|
2,000
|
|
8,000
|
|
|||
|
Other borrowings
|
469,549
|
|
465,206
|
|
|||
|
Advance payments by borrowers for taxes and insurance
|
14,798
|
|
12,331
|
|
|||
|
Accrued expenses and other liabilities
|
29,214
|
|
29,774
|
|
|||
|
Total liabilities
|
3,352,540
|
|
3,228,898
|
|
|||
|
STOCKHOLDERS’ EQUITY:
|
|
|
|
|
|||
|
Preferred stock, $0.01 par value; 25,000,000 shares authorized, none issued or outstanding
|
—
|
|
—
|
|
|||
|
Common stock, $0.01 par value: 150,000,000 shares authorized, 60,933,707 shares issued at December 31, 2017 and 2016, 48,803,885 and 48,526,658 outstanding at December 31, 2017 and 2016, respectively
|
609
|
|
609
|
|
|||
|
Additional paid-in-capital
|
548,864
|
|
547,910
|
|
|||
|
Unallocated common stock held by employee stock ownership plan
|
(22,244
|
)
|
(23,466
|
)
|
|||
|
Retained earnings
|
281,138
|
|
268,226
|
|
|||
|
Accumulated other comprehensive loss
|
(5,451
|
)
|
(4,332
|
)
|
|||
|
Treasury stock at cost; 12,129,822 and 12,407,049 shares at December 31, 2017 and 2016, respectively
|
(164,039
|
)
|
(167,751
|
)
|
|||
|
Total stockholders’ equity
|
638,877
|
|
621,196
|
|
|||
|
Total liabilities and stockholders’ equity
|
$
|
3,991,417
|
|
$
|
3,850,094
|
|
|
|
See accompanying notes to consolidated financial statements.
|
|||||||
68
NORTHFIELD BANCORP, INC. AND SUBSIDIARIES
|
|
Years ended December 31,
|
||||||||||
|
|
2017
|
2016
|
2015
|
||||||||
|
|
(Dollars in thousands, except share and per share data)
|
||||||||||
|
Interest income:
|
|
|
|
||||||||
|
Loans
|
$
|
120,340
|
|
$
|
111,776
|
|
$
|
87,179
|
|
||
|
Mortgage-backed securities
|
9,174
|
|
10,832
|
|
12,982
|
|
|||||
|
Other securities
|
1,310
|
|
908
|
|
328
|
|
|||||
|
FHLB of New York dividends
|
1,461
|
|
1,171
|
|
1,149
|
|
|||||
|
Deposits in other financial institutions
|
584
|
|
285
|
|
120
|
|
|||||
|
Total interest income
|
132,869
|
|
124,972
|
|
101,758
|
|
|||||
|
Interest expense:
|
|
|
|
|
|||||||
|
Deposits
|
16,386
|
|
14,287
|
|
10,423
|
|
|||||
|
Borrowings
|
7,590
|
|
7,381
|
|
9,265
|
|
|||||
|
Total interest expense
|
23,976
|
|
21,668
|
|
19,688
|
|
|||||
|
Net interest income
|
108,893
|
|
103,304
|
|
82,070
|
|
|||||
|
Provision for loan losses
|
1,411
|
|
635
|
|
353
|
|
|||||
|
Net interest income after provision for loan losses
|
107,482
|
|
102,669
|
|
81,717
|
|
|||||
|
Non-interest income:
|
|
|
|
|
|
|
|||||
|
Fees and service charges for customer services
|
4,702
|
|
4,934
|
|
3,945
|
|
|||||
|
Income on bank owned life insurance
|
5,386
|
|
3,998
|
|
3,767
|
|
|||||
|
Gains/(losses) on securities transactions, net
|
1,283
|
|
813
|
|
(339
|
)
|
|||||
|
Other
|
271
|
|
327
|
|
525
|
|
|||||
|
Total non-interest income
|
11,642
|
|
10,072
|
|
7,898
|
|
|||||
|
Non-interest expense:
|
|
|
|
|
|
|
|||||
|
Compensation and employee benefits
|
38,237
|
|
39,780
|
|
29,760
|
|
|||||
|
Occupancy
|
11,270
|
|
11,411
|
|
10,039
|
|
|||||
|
Furniture and equipment
|
1,141
|
|
1,421
|
|
1,428
|
|
|||||
|
Data processing
|
4,585
|
|
6,054
|
|
3,802
|
|
|||||
|
Professional fees
|
2,774
|
|
3,461
|
|
3,037
|
|
|||||
|
Federal Deposit Insurance Corporation (FDIC) insurance
|
1,064
|
|
1,494
|
|
1,550
|
|
|||||
|
Other
|
8,307
|
|
9,325
|
|
8,493
|
|
|||||
|
Total non-interest expense
|
67,378
|
|
72,946
|
|
58,109
|
|
|||||
|
Income before income tax expense
|
51,746
|
|
39,795
|
|
31,506
|
|
|||||
|
Income tax expense
|
26,978
|
|
13,665
|
|
11,975
|
|
|||||
|
Net income
|
$
|
24,768
|
|
$
|
26,130
|
|
$
|
19,531
|
|
||
|
Net income per common share:
|
|
|
|
||||||||
|
Basic
|
$
|
0.55
|
|
$
|
0.59
|
|
$
|
0.46
|
|
||
|
Diluted
|
$
|
0.53
|
|
$
|
0.57
|
|
$
|
0.45
|
|
||
|
Basic weighted average shares outstanding
|
45,325,445
|
|
44,374,389
|
|
42,285,712
|
|
|||||
|
Diluted weighted average shares outstanding
|
46,875,730
|
|
45,717,887
|
|
43,478,481
|
|
|||||
|
See accompanying notes to consolidated financial statements.
|
|||||||||||
69
|
NORTHFIELD BANCORP, INC. AND SUBSIDIARIES
Consolidated Statements of Comprehensive Income - (Continued)
|
|||||||||||
|
|
Years ended December 31,
|
||||||||||
|
|
2017
|
2016
|
2015
|
||||||||
|
|
(Dollars in thousands)
|
||||||||||
|
Net income
|
$
|
24,768
|
|
$
|
26,130
|
|
$
|
19,531
|
|
||
|
Other comprehensive (loss) income:
|
|
|
|
|
|
|
|||||
|
Unrealized losses on securities:
|
|
|
|
||||||||
|
Net unrealized holding losses on securities
|
(283
|
)
|
(2,202
|
)
|
(3,676
|
)
|
|||||
|
Less: reclassification adjustment for net gains included in net income (included in gains on securities transactions, net)
|
(169
|
)
|
(306
|
)
|
(57
|
)
|
|||||
|
Net unrealized losses
|
(452
|
)
|
(2,508
|
)
|
(3,733
|
)
|
|||||
|
Post-retirement benefits adjustment
|
74
|
|
244
|
|
21
|
|
|||||
|
Other comprehensive loss, before tax
|
(378
|
)
|
(2,264
|
)
|
(3,712
|
)
|
|||||
|
Income tax benefit related to net unrealized holding losses on securities
|
113
|
|
894
|
|
1,476
|
|
|||||
|
Income tax expense related to reclassification adjustment for gains included in net income
|
68
|
|
122
|
|
23
|
|
|||||
|
Income tax expense related to post-retirement benefits adjustment
|
(30
|
)
|
(98
|
)
|
(8
|
)
|
|||||
|
Other comprehensive loss, net of tax
|
(227
|
)
|
(1,346
|
)
|
(2,221
|
)
|
|||||
|
Comprehensive income
|
$
|
24,541
|
|
$
|
24,784
|
|
$
|
17,310
|
|
||
See accompanying notes to consolidated financial statements.
70
NORTHFIELD BANCORP, INC. AND SUBSIDIARIES
Consolidated Statements of Changes in Stockholders’ Equity
|
|
For the years ended December 31, 2017, 2016 and 2015
|
|||||||||||||||||||||||||||||
|
|
Common Stock
|
|
|
|||||||||||||||||||||||||||
|
|
Shares Outstanding
|
Par Value
|
Additional Paid-in Capital
|
Unallocated Common Stock Held by the Employee Stock Ownership Plan
|
Retained Earnings
|
Accumulated Other Comprehensive Income (loss) Net of tax
|
Treasury Stock
|
Total Stockholders' Equity
|
||||||||||||||||||||||
|
|
(Dollars in thousands, except share and per share data)
|
|||||||||||||||||||||||||||||
|
Balance at December 31, 2014
|
48,402,083
|
|
$
|
582
|
|
$
|
499,606
|
|
$
|
(25,782
|
)
|
$
|
248,908
|
|
$
|
(765
|
)
|
$
|
(128,621
|
)
|
$
|
593,928
|
|
|||||||
|
Net income
|
|
|
|
|
|
|
|
|
19,531
|
|
|
|
|
|
19,531
|
|
||||||||||||||
|
Other comprehensive loss, net of tax
|
|
|
|
|
|
|
|
|
|
|
(2,221
|
)
|
|
|
(2,221
|
)
|
||||||||||||||
|
Employee Stock Ownership Plan (ESOP) shares allocated or committed to be released
|
|
|
|
|
1,010
|
|
1,118
|
|
|
|
|
|
|
|
2,128
|
|
||||||||||||||
|
Stock compensation expense
|
|
|
|
|
6,763
|
|
|
|
|
|
|
|
|
|
6,763
|
|
||||||||||||||
|
Additional tax benefit on equity awards
|
|
|
|
|
122
|
|
|
|
|
|
|
|
|
|
122
|
|
||||||||||||||
|
Net issuance of restricted stock
|
387,280
|
|
(5,190
|
)
|
5,190
|
|
—
|
|
||||||||||||||||||||||
|
Exercise of stock options, net
|
81,789
|
|
|
|
(771
|
)
|
|
|
(85
|
)
|
|
|
1,014
|
|
158
|
|
||||||||||||||
|
Cash dividends declared ($0.28 per common share)
|
|
|
|
|
|
|
|
|
(12,184
|
)
|
|
|
|
|
(12,184
|
)
|
||||||||||||||
|
Treasury stock (average cost of $14.66 per share)
|
(3,305,612
|
)
|
|
|
|
|
|
|
|
|
|
|
(48,446
|
)
|
(48,446
|
)
|
||||||||||||||
|
Balance at December 31, 2015
|
45,565,540
|
|
582
|
|
501,540
|
|
(24,664
|
)
|
256,170
|
|
(2,986
|
)
|
(170,863
|
)
|
559,779
|
|
||||||||||||||
|
Net income
|
26,130
|
|
26,130
|
|
||||||||||||||||||||||||||
|
Other comprehensive loss, net of tax
|
(1,346
|
)
|
(1,346
|
)
|
||||||||||||||||||||||||||
|
Acquisition of Hopewell Valley Community Bank
|
2,707,381
|
|
27
|
|
41,694
|
|
41,721
|
|
||||||||||||||||||||||
|
ESOP shares allocated or committed to be released
|
1,093
|
|
1,198
|
|
2,291
|
|
||||||||||||||||||||||||
|
Stock compensation expense
|
7,264
|
|
7,264
|
|
||||||||||||||||||||||||||
|
Additional tax benefit on equity awards
|
1,512
|
|
1,512
|
|
||||||||||||||||||||||||||
|
Net issuance of restricted stock
|
7,720
|
|
(198
|
)
|
198
|
|
—
|
|
||||||||||||||||||||||
|
Exercise of stock options, net
|
383,233
|
|
(4,995
|
)
|
—
|
|
5,115
|
|
120
|
|
||||||||||||||||||||
|
Cash dividends declared ($0.31 per common share)
|
(14,074
|
)
|
(14,074
|
)
|
||||||||||||||||||||||||||
|
Treasury stock (average cost of $16.04 per share)
|
(137,216
|
)
|
(2,201
|
)
|
(2,201
|
)
|
||||||||||||||||||||||||
|
Balance at December 31, 2016
|
48,526,658
|
|
609
|
|
547,910
|
|
(23,466
|
)
|
268,226
|
|
(4,332
|
)
|
(167,751
|
)
|
621,196
|
|
||||||||||||||
|
Net income
|
24,768
|
|
24,768
|
|
||||||||||||||||||||||||||
|
Other comprehensive loss, net of tax
|
(227
|
)
|
(227
|
)
|
||||||||||||||||||||||||||
|
Cumulative effect of change in accounting principle - Adoption of ASU No. 2016-09
|
(2,898
|
)
|
2,898
|
|
—
|
|
||||||||||||||||||||||||
|
Reclassification of tax effects resulting from the adoption of ASU No. 2018-02
|
892
|
|
(892
|
)
|
—
|
|
||||||||||||||||||||||||
|
ESOP shares allocated or committed to be released
|
1,267
|
|
1,222
|
|
2,489
|
|
||||||||||||||||||||||||
|
Stock compensation expense
|
6,197
|
|
6,197
|
|
||||||||||||||||||||||||||
|
Net forfeitures of restricted stock
|
(58,447
|
)
|
828
|
|
(828
|
)
|
—
|
|
||||||||||||||||||||||
|
Exercise of stock options, net
|
335,674
|
|
(4,440
|
)
|
|
|
4,540
|
|
100
|
|
||||||||||||||||||||
|
Cash dividends declared ($0.34 per common share)
|
(15,646
|
)
|
(15,646
|
)
|
||||||||||||||||||||||||||
|
Balance at December 31, 2017
|
48,803,885
|
|
$
|
609
|
|
$
|
548,864
|
|
$
|
(22,244
|
)
|
$
|
281,138
|
|
$
|
(5,451
|
)
|
$
|
(164,039
|
)
|
$
|
638,877
|
|
|||||||
|
See accompanying notes to consolidated financial statements.
|
||||||||||||||||||||||||||||||
71
NORTHFIELD BANCORP, INC. AND SUBSIDIARIES
|
|
Years Ended December 31,
|
||||||||||
|
|
2017
|
2016
|
2015
|
||||||||
|
|
(Dollars in thousands)
|
||||||||||
|
Cash flows from operating activities:
|
|
|
|
||||||||
|
Net income
|
$
|
24,768
|
|
$
|
26,130
|
|
$
|
19,531
|
|
||
|
Adjustments to reconcile net income to net cash provided by operating activities:
|
|
|
|
||||||||
|
Provision for loan losses
|
1,411
|
|
635
|
|
353
|
|
|||||
|
ESOP and stock compensation expense
|
8,686
|
|
9,555
|
|
8,891
|
|
|||||
|
Depreciation
|
3,229
|
|
3,591
|
|
3,385
|
|
|||||
|
Amortization of premiums, and deferred loan costs, net of (accretion) of discounts, and deferred loan fees
|
2,000
|
|
2,226
|
|
1,800
|
|
|||||
|
Amortization of intangible assets
|
386
|
|
447
|
|
210
|
|
|||||
|
Income on bank owned life insurance
|
(5,386
|
)
|
(3,998
|
)
|
(3,767
|
)
|
|||||
|
Gain on sale of premises and equipment and other real estate owned, net
|
—
|
|
—
|
|
(282
|
)
|
|||||
|
Net gain on sale of loans held-for-sale
|
—
|
|
—
|
|
(4
|
)
|
|||||
|
Proceeds from sale of loans held-for-sale
|
494
|
|
—
|
|
2,392
|
|
|||||
|
Origination of loans held-for-sale
|
—
|
|
—
|
|
(2,388
|
)
|
|||||
|
(Gains) losses on securities transactions, net
|
(1,283
|
)
|
(813
|
)
|
339
|
|
|||||
|
Net purchases of trading securities
|
(626
|
)
|
(637
|
)
|
(687
|
)
|
|||||
|
(Increase) decrease in accrued interest receivable
|
(999
|
)
|
1
|
|
(248
|
)
|
|||||
|
(Increase) decrease in other assets
|
(3,689
|
)
|
3,052
|
|
3,359
|
|
|||||
|
Deferred taxes
|
15,193
|
|
(3,059
|
)
|
(1,632
|
)
|
|||||
|
(Decrease) increase in accrued expenses and other liabilities
|
(560
|
)
|
571
|
|
1,059
|
|
|||||
|
Net cash provided by operating activities
|
43,624
|
|
37,701
|
|
32,311
|
|
|||||
|
Cash flows from investing activities:
|
|
|
|
||||||||
|
Net increase in loans receivable
|
(110,177
|
)
|
(87,514
|
)
|
(246,562
|
)
|
|||||
|
Purchase of loans
|
(64,116
|
)
|
(167,345
|
)
|
(186,876
|
)
|
|||||
|
Purchase of FHLB of New York stock
|
(18,890
|
)
|
(9,497
|
)
|
(11,001
|
)
|
|||||
|
Redemption of FHLB of New York stock
|
18,967
|
|
10,653
|
|
14,417
|
|
|||||
|
Purchases of securities available-for-sale
|
(137,631
|
)
|
(105,860
|
)
|
—
|
|
|||||
|
Principal payments and maturities on securities available-for-sale
|
114,416
|
|
162,594
|
|
173,923
|
|
|||||
|
Principal payments and maturities on securities held-to-maturity
|
200
|
|
181
|
|
870
|
|
|||||
|
Purchases of securities held-to-maturity
|
—
|
|
—
|
|
(7,657
|
)
|
|||||
|
Proceeds from sale of securities available-for-sale
|
5,941
|
|
44,582
|
|
51,148
|
|
|||||
|
Proceeds from bank owned life insurance
|
2,829
|
|
—
|
|
—
|
|
|||||
|
Proceeds from sale of premises and equipment and other real estate owned
|
—
|
|
45
|
|
918
|
|
|||||
|
Purchases and improvements of premises and equipment
|
(2,065
|
)
|
(932
|
)
|
(802
|
)
|
|||||
|
Net cash acquired in business combinations
|
—
|
|
55,479
|
|
—
|
|
|||||
|
Net cash used in investing activities
|
(190,526
|
)
|
(97,614
|
)
|
(211,622
|
)
|
|||||
|
Cash flows from financing activities:
|
|
|
|
||||||||
|
Net increase in deposits
|
123,392
|
|
204,455
|
|
432,264
|
|
|||||
|
Dividends paid
|
(15,646
|
)
|
(14,074
|
)
|
(12,184
|
)
|
|||||
|
Exercise of stock options
|
100
|
|
120
|
|
158
|
|
|||||
|
Purchase of treasury stock
|
—
|
|
(2,201
|
)
|
(48,446
|
)
|
|||||
|
Additional tax benefit on equity awards
|
—
|
|
1,512
|
|
122
|
|
|||||
|
Increase in advance payments by borrowers for taxes and insurance
|
2,467
|
|
1,469
|
|
3,070
|
|
|||||
|
Repayments under capital lease obligations
|
(224
|
)
|
(204
|
)
|
(179
|
)
|
|||||
|
Proceeds from securities sold under agreements to repurchase and other borrowings
|
441,570
|
|
228,978
|
|
250,314
|
|
|||||
|
Repayments related to securities sold under agreements to repurchase and other borrowings
|
(443,003
|
)
|
(315,910
|
)
|
(470,664
|
)
|
|||||
|
Net cash provided by financing activities
|
108,656
|
|
104,145
|
|
154,455
|
|
|||||
|
Net (decrease) increase in cash and cash equivalents
|
(38,246
|
)
|
44,232
|
|
(24,856
|
)
|
|||||
|
Cash and cash equivalents at beginning of period
|
96,085
|
|
51,853
|
|
76,709
|
|
|||||
|
Cash and cash equivalents at end of period
|
$
|
57,839
|
|
$
|
96,085
|
|
$
|
51,853
|
|
||
See accompanying notes to consolidated financial statements.
72
NORTHFIELD BANCORP, INC. AND SUBSIDIARIES
Consolidated Statements of Cash Flows
- (Continued)
|
|
Years Ended December 31,
|
||||||||||
|
|
2017
|
2016
|
2015
|
||||||||
|
|
(Dollars in thousands)
|
||||||||||
|
Supplemental cash flow information:
|
|
|
|
||||||||
|
Cash paid during the period for:
|
|
|
|
||||||||
|
Interest
|
$
|
23,765
|
|
$
|
22,037
|
|
$
|
19,738
|
|
||
|
Income taxes
|
12,875
|
|
14,415
|
|
10,800
|
|
|||||
|
Non-cash transactions:
|
|
|
|
||||||||
|
Loans (recoveries) / charged-off, net
|
(154
|
)
|
810
|
|
1,875
|
|
|||||
|
Transfers of loans to other real estate owned
|
—
|
|
850
|
|
—
|
|
|||||
|
Other real estate owned write-downs
|
—
|
|
—
|
|
71
|
|
|||||
|
Transfers of originated loans held-for-investment to held-for-sale, at fair value
|
494
|
|
—
|
|
—
|
|
|||||
|
Acquisition:
|
|
|
|
||||||||
|
Non-cash assets acquired, at fair value:
|
|
|
|
||||||||
|
Securities available-for-sale
|
—
|
|
61,633
|
|
—
|
|
|||||
|
Loans
|
—
|
|
342,566
|
|
—
|
|
|||||
|
Accrued interest receivable
|
—
|
|
1,452
|
|
—
|
|
|||||
|
Bank owned life insurance
|
—
|
|
11,269
|
|
—
|
|
|||||
|
Premises and equipment
|
—
|
|
5,926
|
|
—
|
|
|||||
|
Federal Home Loan Bank of New York stock
|
—
|
|
476
|
|
—
|
|
|||||
|
Goodwill and other intangible assets
|
—
|
|
24,265
|
|
|||||||
|
Other assets
|
—
|
|
5,389
|
|
—
|
|
|||||
|
Total non-cash assets acquired
|
—
|
|
452,976
|
|
—
|
|
|||||
|
Non-cash liabilities assumed, at fair value:
|
|
|
|
||||||||
|
Deposits
|
—
|
|
456,203
|
|
—
|
|
|||||
|
Borrowings
|
—
|
|
2,213
|
|
—
|
|
|||||
|
Other liabilities
|
—
|
|
8,318
|
|
—
|
|
|||||
|
Total non-cash liabilities assumed
|
—
|
|
466,734
|
|
—
|
|
|||||
|
Net non-cash assets acquired
|
—
|
|
(13,758
|
)
|
—
|
|
|||||
|
Net cash and cash equivalents acquired
|
—
|
|
55,479
|
|
—
|
|
|||||
|
Common stock issued in acquisition
|
$
|
—
|
|
$
|
41,721
|
|
$
|
—
|
|
||
See accompanying notes to consolidated financial statements.
73
NORTHFIELD BANCORP, INC. AND SUBSIDIARIES
Notes to Consolidated Financial Statements
|
(1)
|
Summary of
Significant
Accounting Policies
|
The following significant accounting and reporting policies of Northfield Bancorp, Inc. and subsidiaries (collectively, the “Company”), conform to U.S. generally accepted accounting principles (“U.S. GAAP”), and are used in preparing and presenting these consolidated financial statements.
(a) Basis of Presentation
The consolidated financial statements are comprised of the accounts of Northfield Bancorp, Inc. and its wholly owned subsidiaries, Northfield Investment, Inc. and Northfield Bank (the “Bank”), and the Bank’s wholly-owned significant subsidiaries, NSB Services Corp. and NSB Realty Trust. All significant intercompany accounts and transactions have been eliminated in consolidation.
In preparing the consolidated financial statements, management is required to make estimates and assumptions that affect the reported amounts of assets and liabilities as of the date of the balance sheets and revenues and expenses during the reporting periods. Actual results may differ significantly from those estimates and assumptions. A material estimate that is particularly susceptible to significant change in the near term is the allowance for loan losses. In connection with the determination of this allowance, management generally obtains independent appraisals for significant properties. In addition, judgments related to the amount and timing of expected cash flows from purchased credit-impaired (“PCI”) loans, goodwill, securities valuation and impairment, and deferred income taxes, involve a higher degree of complexity and subjectivity and require estimates and assumptions about uncertain matters. Actual results may differ from the estimates and assumptions.
Certain prior year amounts have been reclassified to conform to the current year presentation.
(b) Business
The Company, through its principal subsidiary, the Bank, provides a full range of banking services primarily to individuals and corporate customers in Richmond and Kings counties in New York, and Hunterdon, Mercer, Union and Middlesex counties in New Jersey. The Company is subject to competition from other financial institutions and to the regulations of certain federal and state agencies, and undergoes periodic examinations by those regulatory authorities.
(c) Cash Equivalents
Cash equivalents consist of cash on hand, due from banks, and interest-bearing deposits in other financial institutions with an original term of three months or less.
(d) Securities
Securities are classified at the time of purchase, based on management’s intention, as securities held-to-maturity, securities available-for-sale, or trading account securities. Securities held-to-maturity are those that management has the positive intent and ability to hold until maturity. Securities held-to-maturity are carried at amortized cost, adjusted for amortization of premiums and accretion of discounts using the level-yield method over the contractual term of the securities, adjusted for actual prepayments. Securities available-for-sale represents all securities not classified as either held-to-maturity or trading. Securities available-for-sale are carried at estimated fair value with unrealized holding gains and losses (net of related tax effects) on such securities excluded from earnings, but included as a separate component of stockholders’ equity, titled “Accumulated other comprehensive income (loss).” The cost of securities sold is determined using the specific-identification method. Security transactions are recorded on a trade-date basis. Trading securities are securities that are bought and may be held for the purpose of selling them in the near term. Trading securities are reported at estimated fair value, with unrealized holding gains and losses reported as a component of gain (loss) on securities transactions, net in non-interest income.
Our evaluation of other-than-temporary impairment considers our assessments of the reason for the decline in value, the duration and severity of the impairment, our intent and ability to hold the securities (as well as the likelihood of a near-term recovery), and our intent to sell the securities and whether it is more likely than not that we will be required to sell the securities before the recovery of their amortized cost basis. If a determination is made that a debt security is other-than-temporarily impaired, the Company will estimate the amount of the unrealized loss that is attributable to credit and all other non-credit
74
NORTHFIELD BANCORP, INC. AND SUBSIDIARIES
Notes to Consolidated Financial Statements - (Continued)
related factors. If we intend to hold securities in an unrealized loss position until the loss is recovered, which may be at maturity, the credit related component will be recognized as an other-than-temporary impairment charge in non-interest income. The non-credit related component will be recorded as an adjustment to accumulated other comprehensive income (loss), net of tax. The estimated fair value of debt securities, including mortgage-backed securities and corporate debt obligations is furnished by an independent third-party pricing service. The third-party pricing service primarily utilizes pricing models and methodologies that incorporate observable market inputs, including among other things, benchmark yields, reported trades, and projected prepayment and default rates. Management reviews the data and assumptions used in pricing the securities by its third-party provider for reasonableness.
(e) Loans
The accounting and reporting for PCI loans and loans classified as held-for-sale differs substantially from those loans originated and classified by the Company as held-for-investment. For purposes of reporting, discussion and analysis, management has classified its loan portfolio into four categories: (1) loans originated by the Company and held-for-sale, which are carried at the lower of aggregate cost or estimated fair value, less costs to sell, and therefore have no associated allowance for loan losses, (2) PCI loans, which are held-for-investment, and initially valued at estimated fair value on the date of acquisition, with no initial related allowance for loan losses, (3) originated loans held-for-investment, which are carried at amortized cost, less net charge-offs and the allowance for loan losses, and (4) acquired loans with no evidence of credit deterioration, which are held-for-investment, and initially valued at an estimated fair value on the date of acquisition, with no initial related allowance for loan losses.
Originated and acquired net loans held-for-investment are stated at unpaid principal balance, adjusted by unamortized premiums and unearned discounts, deferred origination fees and certain direct origination costs, and the allowance for loan losses. Interest income on loans is accrued and credited to income as earned. Net loan origination fees/costs are deferred and accreted/amortized to interest income over the loan’s contractual life using the level-yield method, adjusted for actual prepayments. Generally, loans held-for-sale are designated at time of origination and generally consist of newly originated fixed rate residential loans and are recorded at the lower of aggregate cost or estimated fair value in the aggregate. Transfers of loans from held-for-investment to held-for-sale are infrequent and occur at fair value less costs to sell, with any charge-off to allowance for loan losses. Gains are recognized on a settlement-date basis and are determined by the difference between the net sales proceeds and the carrying value of the loans, including any net deferred fees or costs.
Originated and acquired net loans held-for-investment are deemed impaired when it is probable, based on current information, that the Company will not collect all amounts due in accordance with the contractual terms of the loan agreement. The Company has defined the population of originated and acquired impaired loans to be all originated and acquired non-accrual loans held-for-investment with an outstanding balance of
$500,000
or greater and all loans restructured in troubled debt restructurings (TDRs). Originated and acquired impaired loans held-for-investment are individually assessed to determine that the loan’s carrying value is not in excess of the expected future cash flows, discounted at the loan's original effective interest rate, or the fair value of the underlying collateral (less estimated costs to sell) if the loan is collateral dependent. Impairments, if any, are recognized through a charge to the allowance for loan losses for the amount that the loan’s carrying value exceeds the discounted cash flow analysis or estimated fair value of collateral (less estimated costs to sell) if the loan is collateral dependent. Such amounts are charged-off when considered appropriate.
The allowance for loan losses is increased by the provision for loan losses charged against income and is decreased by charge-offs, net of recoveries. Loan losses are charged-off in the period the loans, or portion thereof, are deemed uncollectible. Generally, the Company will record a loan charge-off (including a partial charge-off) to reduce a loan to the estimated fair value of the underlying collateral, less cost to sell, if it is determined that it is probable that recovery will come primarily from the sale or operation of such collateral. Specific reserves on impaired loans that are not considered collateral dependent are charged-off when such amounts are not considered to be collectible. The provision for loan losses is based on management’s evaluation of the adequacy of the allowance that considers, among other things, impaired loans held-for-investment, deterioration in PCI loans subsequent to acquisition, past loan loss experience, known and inherent risks in the portfolio, and existing adverse situations that may affect borrowers’ ability to repay. Additionally, management evaluates changes, if any, in underwriting standards, collection, charge-off and recovery practices, the nature or volume of the portfolio, lending staff, concentration of loans, as well as current economic conditions, and other relevant factors. Management believes the allowance for loan losses is adequate to provide for probable and reasonably estimable incurred losses at the date of the consolidated balance sheets. The Company also maintains an allowance for estimated losses on off-balance sheet credit risks related to loan commitments and standby letters of credit. Management utilizes a methodology similar to its allowance for loan loss adequacy methodology to estimate losses on these commitments. The allowance for estimated credit losses on off-balance
75
NORTHFIELD BANCORP, INC. AND SUBSIDIARIES
Notes to Consolidated Financial Statements - (Continued)
sheet commitments is included in other liabilities and any changes to the allowance are recorded as a component of other non-interest expense.
While management uses available information to estimate probable and reasonably estimable incurred losses on loans, future additions may be necessary based on changes in conditions, including changes in economic conditions, particularly in Richmond and Kings counties in New York, and Hunterdon, Mercer, Union and Middlesex counties in New Jersey and to a lesser extent eastern Pennsylvania. Accordingly, as with most financial institutions in the market area, the ultimate collectability of a substantial portion of the Company’s loan portfolio is susceptible to changes in conditions in the Company’s marketplace. In addition, future changes in laws and regulations could make it more difficult for the Company to collect all contractual amounts due on its loans and mortgage-backed securities.
In addition, various regulatory agencies, as an integral part of their examination process, periodically review the Company’s allowance for loan losses. Such agencies may require the Company to recognize additions to the allowance based on their judgments about information available to them at the time of their examination.
TDRs are loans where terms have been modified because of deterioration in the financial condition of the borrower. Modifications could include extension of the repayment terms of the loan, reduced interest rates, or forgiveness of accrued interest and/or principal. Once an obligation has been restructured because of such credit problems, it continues to be considered restructured until paid in full or, if the obligation yields a market rate (a rate equal to the rate the Company was willing to accept at the time of the restructuring for a new loan with comparable risk), until the year subsequent to the year in which the restructuring takes place, provided the borrower has performed under the modified terms for a six-month period. The Company records an impairment charge equal to the difference between the present value of estimated future cash flows under the restructured terms discounted at the original loan’s effective interest rate, or the underlying collateral value less costs to sell, if the loan is collateral dependent. Changes in present values attributable to the passage of time are recorded as a component of the provision for loan losses.
A loan is considered past due when it is not paid in accordance with its contractual terms. The accrual of income on loans, including impaired loans held-for-investment, and other loans in the process of foreclosure, is generally discontinued when a loan becomes
90
days or more delinquent, or sooner when certain factors indicate that the ultimate collection of principal and interest is in doubt. Loans on which the accrual of income has been discontinued are designated as non-accrual loans. All previously accrued interest is reversed against interest income, and income is recognized subsequently only in the period that cash is received, provided no principal payments are due and the remaining principal balance outstanding is deemed collectible. A non-accrual loan is not returned to accrual status until both principal and interest payments are brought current and factors indicating doubtful collection no longer exist, including performance by the borrower under the loan terms for a consecutive six-month period.
The Company accounts for the PCI loans based on expected cash flows. In accordance with current accounting guidance, the Company will maintain the integrity of a pool of multiple loans accounted for as a single asset and evaluate the pools for impairment, and accrual status, based on variances from the expected cash flows.
(f) Federal Home Loan Bank Stock
The Bank, as a member of the Federal Home Loan Bank (FHLB) of New York, is required to hold shares of capital stock in the FHLB as a condition to both becoming a member and engaging in certain transactions with the FHLB. The minimum investment requirement is determined by a “membership” investment component and an “activity-based” investment component. The membership investment component is the greater of
0.125%
of the Bank’s mortgage-related assets, as defined by the FHLB, or
$1,000
. The activity-based investment component is equal to
4.5%
of the Bank’s outstanding advances with the FHLB. The activity-based investment component also considers other transactions, including assets originated for or sold to the FHLB, and delivery commitments issued by the FHLB. The Company currently does not enter into these other types of transactions with the FHLB.
On a quarterly basis, we perform our other-than-temporary impairment analysis of FHLB stock, we evaluate, among other things, (i) its earnings performance, including the significance of any decline in net assets of the FHLB as compared to the regulatory capital amount of the FHLB, (ii) the commitment by the FHLB to continue dividend payments, and (iii) the liquidity position of the FHLB. We did not consider our investment in FHLB stock to be other-than-temporarily impaired at
December 31, 2017
and
2016
.
76
NORTHFIELD BANCORP, INC. AND SUBSIDIARIES
Notes to Consolidated Financial Statements - (Continued)
(g) Premises and Equipment, Net
Premises and equipment, including leasehold improvements, are carried at cost, less accumulated depreciation and amortization. Depreciation and amortization of premises and equipment, including capital leases, are computed on a straight-line basis over the estimated useful lives of the related assets. The estimated useful lives of significant classes of assets are generally as follows: buildings -
forty
years; furniture and equipment -
five
to
seven
years; and purchased computer software -
three
years. Leasehold improvements are amortized over the shorter of the term of the related lease or the estimated useful lives of the improvements. Major improvements are capitalized, while repairs and maintenance costs are charged to operations as incurred. Upon retirement or sale, any gain or loss is credited or charged to operations.
(h) Bank Owned Life Insurance
The Company has purchased bank owned life insurance contracts to help fund its obligations for certain employee benefit costs. The Company’s investment in such insurance contracts has been reported in the consolidated balance sheets at their cash surrender values. Changes in cash surrender values and death benefit proceeds received in excess of the related cash surrender values are recorded as non-interest income.
(i) Goodwill
Intangible assets resulting from acquisitions under the purchase method of accounting consist of goodwill and other intangible assets. Goodwill is not amortized and is subject to an annual assessment for impairment. The goodwill impairment analysis is generally a two-step test. However, under current accounting guidance, first we may assess qualitative factors to determine whether it is necessary to perform the two-step quantitative goodwill impairment test. Under current accounting guidance, we are not required to calculate the fair value of a reporting unit if, based on a qualitative assessment, we determine that it was more likely than not that the unit’s fair value was not less than its carrying amount. For the year ended
December 31, 2017
, we elected to perform step one of the two-step goodwill impairment test for our reporting unit.
Goodwill is allocated to Northfield’s reporting unit at the date goodwill is actually recorded. If the carrying value of a reporting unit exceeds its estimated fair value, a second step in the analysis is performed to determine the amount of impairment, if any. The second step compares the implied fair value of the reporting unit’s goodwill with the carrying amount of that goodwill. If the carrying value of a reporting unit exceeds the implied fair value of the goodwill, an impairment charge is recorded equal to the excess amount in the current period earnings.
As of
December 31, 2017
, the carrying value of goodwill totaled
$38.4 million
. The Company performed its annual goodwill impairment test, as of
December 31, 2017
, and determined that the fair value of the Company’s single reporting unit to be in excess of its carrying value. The Company will test goodwill for impairment between annual test dates if an event occurs or circumstances change that would indicate the fair value of the reporting unit is below its carrying amount. No events have occurred and no circumstances have changed since the annual impairment test date that would indicate the fair value of the reporting unit is below its carrying amount.
(j) Income Taxes
Income taxes are accounted for under the asset and liability method. Deferred tax assets and liabilities are recognized for the estimated future tax consequences attributable to temporary differences between the financial statement carrying amounts of existing assets and liabilities and their respective tax bases. Deferred tax assets and liabilities are measured using enacted tax rates expected to apply in the year in which those temporary differences are expected to be recovered or settled. When applicable, deferred tax assets are reduced by a valuation allowance for any portions determined not likely to be realized. The effect on deferred tax assets and liabilities of a change in tax rates is recognized in income in the period that includes the enactment date.
Income tax benefits are recognized and measured based upon a two-step model: 1) a tax position must be more-likely-than-not to be sustained based solely on its technical merits in order to be recognized, and 2) the benefit is measured as the largest dollar amount of that position that is more-likely-than-not to be sustained upon settlement. The difference between the benefit recognized and the tax benefit claimed on a tax return is referred to as an unrecognized tax benefit. The Company records income tax-related interest and penalties, if applicable, within income tax expense.
77
NORTHFIELD BANCORP, INC. AND SUBSIDIARIES
Notes to Consolidated Financial Statements - (Continued)
(k) Impairment of Long-Lived Assets
Long-lived assets are reviewed for impairment whenever events or changes in circumstances indicate that the carrying amount of the asset may not be recoverable. Recoverability of assets to be held and used is measured by a comparison of the carrying amount of an asset to future undiscounted (and without interest) net cash flows expected to be generated by the asset. If such assets are considered to be impaired, the impairment to be recognized is measured by the amount by which the carrying amount of the assets exceeds the fair value of the assets. Assets to be disposed of are reported at the lower of the carrying amount or fair value less costs to sell.
(l) Securities Sold Under Agreements to Repurchase and Other Borrowings
The Company enters into sales of securities under agreements to repurchase (Repurchase Agreements) and collateral pledge agreements (Pledge Agreements) with selected dealers and banks. Such agreements are accounted for as secured financing transactions since the Company maintains effective control over the transferred or pledged securities and the transfer meets the other accounting and recognition criteria as required by the transfer and servicing topic of the Financial Accounting Standards Board (FASB) Accounting Standards. Obligations under these agreements are reflected as a liability in the consolidated balance sheets. Securities underlying the agreements are maintained at selected dealers and banks as collateral for each transaction executed and may be sold or pledged by the counterparty. Collateral underlying Repurchase Agreements that permit the counterparty to sell or pledge the underlying collateral is disclosed on the consolidated balance sheets as “encumbered.” The Company retains the right under all Repurchase Agreements and Pledge Agreements to substitute acceptable collateral throughout the terms of the agreement.
(m) Comprehensive Income (Loss)
Comprehensive income (loss) includes net income and the change in unrealized holding gains and losses on securities available-for-sale, change in actuarial gains and losses on other post-retirement benefits, and change in service cost on other postretirement benefits, net of taxes. Comprehensive income (loss) and its components is presented in the Consolidated Statements of Comprehensive Income.
(n) Benefits
The Company sponsors a defined postretirement benefit plan that provides for medical and life insurance coverage to a limited number of retirees, as well as life insurance to all qualifying employees of the Company. The estimated cost of postretirement benefits earned is accrued during an individual’s estimated service period to the Company. The Company recognizes in its balance sheet the over-funded or under-funded status of a defined benefit postretirement plan measured as the difference between the fair value of plan assets and the benefit obligation at the end of our calendar year. The actuarial gains and losses and the prior service costs and credits that arise during the period are recognized as a component of other comprehensive income (loss), net of tax.
Funds borrowed by the Employee Stock Ownership Plan (the “ESOP”) from the Company to purchase the Company’s common stock are being repaid from the Bank’s contributions over a period of up to
30
years. The Company’s common stock not yet allocated to participants is recorded as a reduction of stockholders’ equity at cost. The Company records compensation expense related to the ESOP at an amount equal to the shares committed to be released by the ESOP multiplied by the average fair value of our common stock during the reporting period.
The Company recognizes the grant-date fair value of stock based awards issued to participants' as compensation cost in the consolidated statements of comprehensive income (loss). The fair value of common stock awards is based on the closing price of our common stock as reported on the NASDAQ Stock Market on the grant date. The expense related to stock options is based on the estimated fair value of the options at the date of the grant using the Black-Scholes pricing model. The awards are fixed in nature and compensation cost related to stock based awards is recognized on a straight-line basis over the requisite service periods.
The Bank has a 401(k) plan covering substantially all employees. Contributions to the plan are expensed as incurred.
(o) Segment Reporting
As a community-focused financial institution, substantially all of the Company’s operations involve the delivery of loan and deposit products to customers. Management makes operating decisions and assesses performance based on an ongoing
78
NORTHFIELD BANCORP, INC. AND SUBSIDIARIES
Notes to Consolidated Financial Statements - (Continued)
review of these community banking operations, which constitute the Company’s only operating segment for financial reporting purposes.
(p) Net Income per Common Share
Net income per common share-basic is computed by dividing the net income available to common stockholders by the weighted average number of common shares outstanding, excluding unallocated ESOP shares and unearned common stock award shares. The weighted average common shares outstanding includes the average number of shares of common stock outstanding, including shares allocated or committed to be released ESOP shares.
Net income per common share-diluted is computed using the same method as basic earnings per share, but reflects the potential dilution that could occur if stock options and unvested shares of restricted stock were exercised and converted into common stock. These potentially dilutive shares are included in the weighted average number of shares outstanding for the period using the treasury stock method. In March 2016, the FASB issued Accounting Standards Update (“ASU”) No. 2016-09, Compensation—Stock Compensation (Topic 718): Improvements to Employee Share-Based Payment Accounting, a new standard that simplifies certain aspects of accounting for share-based payments. The Company adopted ASU No. 2016-09 effective January 1, 2017. The update amended the diluted earnings per share calculation in that excess tax benefits are no longer included in assumed proceeds when determining average diluted shares outstanding under the treasury stock method. This guidance is required to be applied prospectively upon adoption. For further discussion, see - Recent Accounting Developments.
When applying the treasury stock method for the year ended December 31, 2017, we added the assumed proceeds from option exercises and the average unamortized compensation costs related to unvested shares of restricted stock and stock options. We then divided this sum by our average stock price for the period to calculate assumed shares repurchased. The excess of the number of shares issuable over the number of shares assumed to be repurchased is added to basic weighted average common shares to calculate diluted earnings per share. For the years ended December 31, 2016, and 2015, we added (1) the assumed proceeds from option exercises; (2) the tax benefit, that would have been credited to additional paid-in capital assuming exercise of non-qualified stock options and vesting of shares of restricted stock; and (3) the average unamortized compensation costs related to unvested shares of restricted stock and stock options. We then divided this sum by our average stock price for the period to calculate assumed shares repurchased. The excess of the number of shares issuable over the number of shares assumed to be repurchased is added to basic weighted average common shares to calculate diluted earnings per share.
At
December 31, 2017
,
2016
, and
2015
, there were
1,550,285
,
1,343,498
, and
1,192,769
dilutive shares outstanding, respectively.
(q) Other Real Estate Owned
Assets acquired through loan foreclosure, or deed-in-lieu of, are held for sale and are initially recorded at estimated fair value less estimated selling costs when acquired, thus establishing a new cost basis. Costs after acquisition are generally expensed. If the estimated fair value of the asset subsequently declines, a write-down is recorded through other non-interest expense.
(r) Recent Accounting Developments
Accounting Pronouncements Adopted in 2017
In February 2018, the FASB issued ASU No. 2018-02,
Income Statement - Reporting Comprehensive Income (Topic 220): Reclassification of Certain Tax Effects from Accumulated Other Comprehensive Income,
which allows an entity to elect a reclassification from accumulated other comprehensive income (AOCI) to retained earnings for stranded tax effects resulting from the Tax Cuts and Jobs Act. The amendment states that if an entity elects to reclassify the income tax effects, the amount of that reclassification should include the effect of the change in the tax rate on the gross deferred tax amounts and related valuation allowances, in addition to other income tax effects on items remaining in AOCI. The ASU is effective for fiscal years beginning after December 15, 2018 and interim periods within those fiscal years with early adoption permitted in a period for which financial statements have not yet been issued. The Company early adopted ASU 2018-02 retrospectively to December 31, 2017, which resulted in the reclassification from AOCI to retained earnings of
$892,000
, reflected in the Consolidated Statements of Changes in Stockholders' Equity.
In March 2016, the FASB issued ASU No. 2016-09,
Compensation—Stock Compensation (Topic 718): Improvements to Employee Share-Based Payment Accounting
, a new standard that simplifies certain aspects of accounting for share-based payments. The amendments include the following:
79
NORTHFIELD BANCORP, INC. AND SUBSIDIARIES
Notes to Consolidated Financial Statements - (Continued)
|
•
|
Excess tax benefits and deficiencies resulting from exercise or vesting of stock awards are recorded as income tax expense or benefit on the income statement. Previously, excess tax benefits and certain tax deficiencies were recorded as equity in additional paid-in capital. This update is required to be applied prospectively upon adoption.
|
|
•
|
For diluted earnings per share calculations, excess tax benefits are no longer included in assumed proceeds when determining average diluted shares outstanding under the treasury stock method, resulting in changes to average diluted shares outstanding. This update is required to be applied prospectively upon adoption.
|
|
•
|
Excess tax benefits or deficiencies are included as income tax expense as discrete items in the period in which they occur, which impact the effective tax rate in each reporting period; however, these discrete items are not included in the projected annual effective tax rate calculation. This update is required to be applied prospectively upon adoption.
|
|
•
|
Excess tax benefits are presented as cash flows from operating activities. Previously, excess tax benefits were included as a cash inflow from financing activities. This update may be applied either prospectively or retrospectively upon adoption. The Company applied this update prospectively upon adoption and prior periods have not been adjusted.
|
|
•
|
Cash paid by an employer to taxing authorities when withholding shares for tax withholding purposes is presented as cash outflows from financing activities, which is consistent with the manner in which we have presented such employee withholding taxes in the past. Accordingly, no reclassification for prior periods is required.
|
|
•
|
An accounting policy election, using a modified retrospective transition method, to account for forfeitures as they occur or estimate the number of awards expected to be forfeited. The Company elected to account for forfeitures as they occur.
|
The Company adopted ASU No. 2016-09 effective January 1, 2017, and upon adoption recorded a cumulative effect adjustment of
$2.9 million
to the opening balances of retained earnings and additional paid-in-capital. Adoption of ASU No. 2016-09 also resulted in the recognition of a
$2.3 million
benefit within income tax expense for the year ended December 31, 2017, which resulted in a corresponding increase to net income and earnings per share. In addition, the guidance increases average diluted shares, since the Company no longer includes such excess tax benefits in the calculation of diluted shares. Adoption of this update did not affect the Company's or the Bank's total equity, book value per share, or regulatory capital ratios.
Accounting Pronouncements Not Yet Adopted
In January 2017, the FASB issued ASU No. 2017-04,
Intangibles—Goodwill and Other (Topic 350): Simplifying
the Test for Goodwill Impairment.
The ASU simplifies the subsequent measurement of goodwill impairment by eliminating the requirement to calculate the implied fair value of goodwill (i.e., the current Step 2 of the goodwill impairment test) to measure a goodwill impairment charge. As amended, the goodwill impairment test will consist of one step comparing the fair value of a reporting unit with its carrying amount. A goodwill impairment charge should be recognized for the amount by which the carrying amount exceeds the reporting unit’s fair value. The ASU is effective for annual or any interim goodwill impairment tests in fiscal years beginning after December 15, 2019. Early adoption is permitted for interim and annual goodwill impairment testing dates after January 1, 2017. The adoption of this pronouncement is not expected to have an effect on the Company's consolidated financial statements.
In November 2016, the FASB issued ASU No. 2016-18,
Statement of Cash Flows (Topic 230): Restricted Cash
, which requires that entities include restricted cash and restricted cash equivalents with cash and cash equivalents in the beginning-of-period and end-of-period total amounts shown on the Statement of Cash Flows. Prior to this pronouncement there was no guidance on how to present restricted cash and cash equivalents in the Statement of Cash Flows. ASU No. 2016-18 is effective for annual reporting periods beginning after December 15, 2017, including interim periods within that reporting period, and is required to be applied retrospectively to all periods presented beginning in the year of adoption. The adoption of this pronouncement is not expected to have a material effect on the Company's consolidated financial statements.
In August 2016, the FASB issued ASU No. 2016-15,
Statement of Cash Flows (Topic 230): Classification of Certain Cash Receipts and Cash Payments
, which provides guidance on the classification of certain cash receipts and payments within the statement of cash flows. ASU No. 2016-15 is effective for annual reporting periods beginning after December 15, 2017, including interim periods within that reporting period, and is required to be applied retrospectively to all periods presented beginning in the year of adoption. Since the ASU only impacts classification on the statements of cash flows, adoption will not affect the Company's consolidated financial position, results of operations or its cash and cash equivalents.
In June 2016, the FASB issued No. ASU No. 2016-13,
Financial Instruments - Credit Losses (Topic 326): Measurement of Credit Losses on Financial Instruments
, which requires credit losses on most financial assets measured at amortized cost and certain other instruments to be measured using an expected credit loss model (referred to as the current expected credit loss (CECL) model). Under this model, entities will estimate credit losses over the entire contractual term of the instrument from the date of initial recognition of that instrument. Current US GAAP is based on an incurred loss model that
80
NORTHFIELD BANCORP, INC. AND SUBSIDIARIES
Notes to Consolidated Financial Statements - (Continued)
delays recognition of credit losses until it is probable the loss has been incurred. Accordingly, it is anticipated that credit losses will be recognized earlier under the CECL model than under the incurred loss model. ASU No. 2016-13 is effective for interim and annual reporting periods beginning after December 15, 2019. The Company has begun evaluating the potential effect of adoption of this pronouncement on its consolidated financial statements by identifying key interpretive issues, assessing its processes, portfolio segmentation, model development, and identifying the data and system requirements against the new guidance to determine what modifications may be required. The Company is also evaluating third-party vendor solutions to assist in the application of the ASU 2016-13. The adoption of ASU 2016-13 may result in an increase in the allowance for loan losses as a result of changing from an incurred loss model, which encompasses allowances for current known and inherent losses within the portfolio, to an expected losses model, which encompasses allowances for losses expected to be incurred over the life of the portfolio. The extent of the effect is indeterminable at this time as it will depend upon the nature and characteristics of the Company's loan portfolio at the adoption date, as well as economic conditions and forecasts at that date.
In February 2016, the FASB issued ASU No. 2016-02,
Leases (Topic 842)
, which is intended to increase transparency and comparability of accounting for lease transactions. The ASU will require all leases to be recognized on the balance sheet as lease assets and lease liabilities and will require both quantitative and qualitative disclosures regarding key information about leasing arrangements. Lessor accounting is largely unchanged. The guidance is effective for fiscal years beginning after December 15, 2018, including interim periods within that reporting period. The Company is currently evaluating the potential effect of adoption of this pronouncement on its consolidated financial statements by reviewing its existing lease contracts and service contracts that may include embedded leases. The Company expects a gross-up of its consolidated balance sheet as a result of recognizing lease liabilities and right of use assets; the extent of such gross-up is under evaluation. The Company does not expect adoption of this pronouncement to have a material impact on its results of operations.
In January 2016, the FASB issued ASU No. 2016-01,
Financial Instruments - Overall (Subtopic 825-10): Recognition and Measurement of Financial Assets and Financial Liabilities
, which addresses certain aspects of recognition, measurement, presentation, and disclosure of financial instruments. The guidance primarily affects the accounting for equity investments, financial liabilities under the fair value option, and the presentation and disclosure requirements for financial instruments. In addition, the FASB clarified guidance related to the valuation allowance assessment when recognizing deferred tax assets resulting from unrealized losses on available-for-sale debt securities. The accounting for other financial instruments, such as loans, investments in debt securities, and financial liabilities is largely unchanged. ASU No. 2016-01 is effective for annual reporting periods beginning after December 15, 2017, including interim periods within that reporting period. The Company will adopt the guidance in the first quarter of 2018. Since the Company has minimal equity investments and no financial liabilities valued under the fair value option, adoption will not have a material effect on the Company's consolidated financial statements.
In May 2014, the FASB issued ASU No. 2014-09,
Revenue from Contracts with Customers (Topic 606)
, which requires an entity to recognize the amount of revenue to which it expects to be entitled for the transfer of promised goods or services to customers using a five-step model that requires entities to exercise judgment when considering the terms of the contracts. ASU No. 2014-09 and subsequent related updates, also require new qualitative and quantitative disclosures, including disaggregation of revenues and descriptions of performance obligations. The Company will adopt the guidance in the first quarter of 2018 using the modified retrospective method. Because the guidance does not apply to revenue associated with financial instruments, including loans and securities that are accounted for under other U.S. GAAP, the new revenue recognition standard will not have a material impact on the company's consolidated financial statements. The Company's implementation efforts include the identification of revenue streams within the scope of the guidance, as well as the evaluation of revenue contracts. Based on these efforts, adoption of this guidance will not result in a material change in the timing or amount of revenue recognized from contracts with customers. The guidance includes expanded disclosures to revenue which we are currently in the process of drafting.
|
(2)
|
Business Combination
|
On
January 8, 2016
, the Company completed its acquisition of Hopewell Valley Community Bank (“Hopewell Valley”), which, after purchase accounting adjustments, added
$508.5 million
to total assets,
$342.6 million
to loans, and
$456.2
million to deposits, and
nine
branch offices in the Hunterdon and Mercer counties of New Jersey. Total consideration paid for Hopewell Valley was
$55.4 million
, consisting of
$13.7 million
in cash and
2,707,381
shares of common stock valued at
$41.7
million based upon the
$15.41
per share closing price of Northfield Bancorp, Inc.'s common stock on
January 8, 2016
.
The transaction was accounted for under the acquisition method of accounting. Under this method of accounting, the purchase price has been allocated to the respective assets acquired and liabilities assumed based upon their estimated fair values, net of tax. The excess of consideration paid over the fair value of the net assets acquired has been recorded as goodwill.
81
NORTHFIELD BANCORP, INC. AND SUBSIDIARIES
Notes to Consolidated Financial Statements - (Continued)
The following table summarizes the estimated fair values of the assets acquired and the liabilities assumed at the date of acquisition for Hopewell Valley (in thousands):
|
ASSETS ACQUIRED:
|
January 8, 2016
|
||
|
Cash and cash equivalents, net
|
$
|
55,479
|
|
|
Securities available for sale
|
61,633
|
|
|
|
Loans
|
342,566
|
|
|
|
Accrued interest receivable
|
1,452
|
|
|
|
Bank-owned life insurance
|
11,269
|
|
|
|
Premises and equipment
|
5,926
|
|
|
|
Federal Home Loan Bank of New York stock, at cost
|
476
|
|
|
|
Goodwill
|
22,252
|
|
|
|
Other intangible assets
|
2,013
|
|
|
|
Other assets
|
5,389
|
|
|
|
Total assets acquired
|
$
|
508,455
|
|
|
LIABILITIES ASSUMED:
|
|||
|
Deposits
|
$
|
456,203
|
|
|
Other borrowings
|
2,213
|
|
|
|
Other liabilities
|
8,318
|
|
|
|
Total liabilities assumed
|
$
|
466,734
|
|
|
Net assets acquired
|
$
|
41,721
|
|
Fair Value Measurement of Assets Assumed and Liabilities Assumed
The methods used to determine the fair value of the assets acquired and liabilities assumed in the Hopewell Valley acquisition were as follows:
Cash and Cash Equivalents
The estimated fair values of cash and cash equivalents approximate their stated face amounts, as these financial instruments are either due on demand or have short-term maturities.
Securities Available-for-Sale
The estimated fair values of the investment securities classified as available-for-sale were calculated utilizing Level 1 and Level 2 inputs. Management reviewed the data and assumptions used by its third party provider in pricing the securities to ensure the highest level of significant inputs is derived from observable market data. These prices were validated against other pricing sources and broker-dealer indications.
Loans
The acquired loan portfolio was valued based on current guidance which defines fair value as the price that would be received to sell an asset or transfer a liability in an orderly transaction between market participants at the measurement date. Level 3 inputs were utilized to value the portfolio and included the use of present value techniques employing cash flow estimates and the incorporated assumptions that marketplace participants would use in estimating fair values. In instances where reliable market information was not available, the Company used its own assumptions in an effort to determine reasonable fair value. Specifically, management utilized three separate fair value analyses which a market participant would employ in estimating the total fair value adjustment. The three separate fair valuation methodologies used were: 1) interest rate loan fair value analysis; 2) general credit fair value adjustment; and 3) specific credit fair value adjustment.
To prepare the interest rate fair value analysis, loans were grouped by characteristics such as loan type, term, collateral and rate. Market rates for similar loans were obtained from various external data sources and reviewed by Company management for reasonableness. The average of these rates was used as the fair value interest rate a market participant would utilize. A present value approach was utilized to calculate the interest rate fair value adjustment.
82
NORTHFIELD BANCORP, INC. AND SUBSIDIARIES
Notes to Consolidated Financial Statements - (Continued)
The general credit fair value adjustment was calculated using a two part general credit fair value analysis: 1) expected lifetime losses; and 2) estimated fair value adjustment for qualitative factors. The expected lifetime losses were calculated using an average of historical losses of the Company, the acquired bank and peer banks. The adjustment related to qualitative factors was impacted by general economic conditions and the risk related to lack of familiarity with the originator's underwriting process.
To calculate the specific credit fair value adjustment, management reviewed the acquired loan portfolio for loans meeting the definition of an impaired loan with deteriorated credit quality. Loans meeting this definition were reviewed by comparing the contractual cash flows to expected collectible cash flows. The aggregate expected cash flows less the acquisition date fair value resulted in an accretable yield amount. The accretable yield amount will be recognized over the life of the loans on a level yield basis as an adjustment to yield.
Other Intangible Assets
Other intangible assets consisting of core deposit premium represents the value assigned to demand, interest checking, money market and savings accounts acquired as part of an acquisition. The core deposit premium value represents the future economic benefit, including the present value of future tax benefits, of the potential cost savings from acquiring core deposits as part of an acquisition compared to the cost of alternative funding sources. The core deposit premium is being amortized over an estimated useful life of
10 years
to approximate the existing deposit relationships acquired.
Deposits
The fair values of deposit liabilities with no stated maturity (i.e., non-interest bearing demand accounts, interest-bearing negotiable orders of withdrawal (NOW), savings and money market accounts) are equal to the carrying amounts payable on demand. The fair values of certificates of deposit represent contractual cash flows, discounted to present value using interest rates currently offered on deposits with similar characteristics and remaining maturities.
Other Borrowings
Other borrowings consist of securities sold under agreements to repurchase. The carrying amounts approximate their fair values because they frequently re-price to a market rate.
|
(3)
|
Securities Available-for-Sale
|
The following is a comparative summary of mortgage-backed securities, debt securities and other securities available-for-sale at
December 31, 2017
and
2016
(in thousands):
83
NORTHFIELD BANCORP, INC. AND SUBSIDIARIES
Notes to Consolidated Financial Statements - (Continued)
|
|
2017
|
||||||||||||||
|
|
|
Gross
|
Gross
|
Estimated
|
|||||||||||
|
|
Amortized
|
unrealized
|
unrealized
|
fair
|
|||||||||||
|
|
cost
|
gains
|
losses
|
value
|
|||||||||||
|
Mortgage-backed securities:
|
|
|
|
|
|
|
|
|
|||||||
|
Pass-through certificates:
|
|
|
|
|
|
|
|
|
|||||||
|
Government sponsored enterprises (GSE)
|
$
|
179,320
|
|
$
|
1,429
|
|
$
|
2,454
|
|
$
|
178,295
|
|
|||
|
Real estate mortgage investment conduits (REMICs):
|
|
|
|
|
|
|
|
|
|||||||
|
GSE
|
273,501
|
|
287
|
|
6,859
|
|
266,929
|
|
|||||||
|
Non-GSE
|
80
|
|
—
|
|
1
|
|
79
|
|
|||||||
|
|
452,901
|
|
1,716
|
|
9,314
|
|
445,303
|
|
|||||||
|
Debt securities:
|
|
|
|
|
|||||||||||
|
Municipal bonds
|
343
|
|
6
|
|
—
|
|
349
|
|
|||||||
|
Corporate bonds
|
67,927
|
|
401
|
|
198
|
|
68,130
|
|
|||||||
|
|
68,270
|
|
407
|
|
198
|
|
68,479
|
|
|||||||
|
Other securities
|
|||||||||||||||
|
Equity investments - mutual funds
|
323
|
|
—
|
|
—
|
|
323
|
|
|||||||
|
Other
|
1,016
|
|
—
|
|
—
|
|
1,016
|
|
|||||||
|
1,339
|
|
—
|
|
—
|
|
1,339
|
|
||||||||
|
Total securities available-for-sale
|
$
|
522,510
|
|
$
|
2,123
|
|
$
|
9,512
|
|
$
|
515,121
|
|
|||
|
|
2016
|
||||||||||||||
|
|
|
Gross
|
Gross
|
Estimated
|
|||||||||||
|
|
Amortized
|
unrealized
|
unrealized
|
fair
|
|||||||||||
|
|
cost
|
gains
|
losses
|
value
|
|||||||||||
|
Mortgage-backed securities:
|
|
|
|
|
|
|
|
|
|||||||
|
Pass-through certificates:
|
|
|
|
|
|
|
|
|
|||||||
|
GSE
|
$
|
225,047
|
|
$
|
2,800
|
|
$
|
3,298
|
|
$
|
224,549
|
|
|||
|
REMICs:
|
|
|
|
|
|
|
|
|
|||||||
|
GSE
|
230,500
|
|
259
|
|
6,466
|
|
224,293
|
|
|||||||
|
Non-GSE
|
280
|
|
—
|
|
10
|
|
270
|
|
|||||||
|
|
455,827
|
|
3,059
|
|
9,774
|
|
449,112
|
|
|||||||
|
Debt securities:
|
|
|
|
|
|||||||||||
|
Municipal bonds
|
2,151
|
|
13
|
|
6
|
|
2,158
|
|
|||||||
|
Corporate bonds
|
45,373
|
|
150
|
|
364
|
|
45,159
|
|
|||||||
|
47,524
|
|
163
|
|
370
|
|
47,317
|
|
||||||||
|
Other securities:
|
|||||||||||||||
|
Equity investments-mutual funds
|
1,233
|
|
—
|
|
15
|
|
1,218
|
|
|||||||
|
Other
|
1,250
|
|
$
|
—
|
|
$
|
—
|
|
1,250
|
|
|||||
|
2,483
|
|
—
|
|
15
|
|
2,468
|
|
||||||||
|
Total securities available-for-sale
|
$
|
505,834
|
|
$
|
3,222
|
|
$
|
10,159
|
|
$
|
498,897
|
|
|||
The following is a summary of the expected maturity distribution of debt securities available-for-sale other than mortgage-backed securities at
December 31, 2017
(in thousands):
|
Available-for-sale
|
Amortized cost
|
Estimated fair value
|
||||||
|
Due in one year or less
|
$
|
—
|
|
$
|
—
|
|
||
|
Due after one year through five years
|
58,174
|
|
58,285
|
|
||||
|
Due after five years through ten years
|
10,096
|
|
10,194
|
|
||||
|
|
$
|
68,270
|
|
$
|
68,479
|
|
||
84
NORTHFIELD BANCORP, INC. AND SUBSIDIARIES
Notes to Consolidated Financial Statements - (Continued)
Expected maturities on mortgage-backed securities will differ from contractual maturities as borrowers may have the right to call or prepay obligations with or without penalties.
Certain securities available-for-sale are pledged or encumbered to secure borrowings under Pledge Agreements and Repurchase Agreements and for other purposes required by law. At
December 31, 2017
, and
December 31, 2016
, securities available-for-sale with a carrying value of
$150.5 million
and
$108.8 million
, respectively, were pledged to secure repurchase agreements and deposits. See Note 8 for further discussion regarding securities pledged or encumbered for borrowings.
For the year ended
December 31, 2017
, the Company had gross proceeds of
$5.9 million
on sales of securities available-for-sale with gross realized gains of
$173,000
and gross realized losses of
$4,000
. For the year ended
December 31, 2016
, the Company had gross proceeds of
$44.6 million
on sales of securities available-for-sale with gross realized gains of
$493,000
and gross realized losses of
$187,000
. For the year ended
December 31, 2015
, the Company had gross proceeds of
$51.1 million
on sales of securities available-for-sale with gross realized gains of
$60,000
and gross realized losses of
$3,000
. The Company recognized net gains of
$1.1 million
and
$507,000
, on its trading securities portfolio during the years ended
December 31, 2017
, and
December 31, 2016
, respectively, and net losses of
$396,000
, for the year ended
December 31, 2015
. The Company routinely sells securities when market pricing presents, in management’s assessment, an economic benefit that outweighs holding such security, and when smaller balance securities become cost prohibitive to carry.
The Company did not recognize any other-than-temporary impairment charges in earnings during the years ended
December 31, 2017
,
2016
and
2015
.
Gross unrealized losses on mortgage-backed securities, debt securities and other securities available-for-sale, and the estimated fair value of the related securities, aggregated by security category and length of time that individual securities have been in a continuous unrealized loss position, at
December 31, 2017
and
2016
, were as follows (in thousands):
|
|
December 31, 2017
|
||||||||||||||||||||||
|
|
Less than 12 months
|
12 months or more
|
Total
|
||||||||||||||||||||
|
|
Unrealized
|
Estimated
|
Unrealized
|
Estimated
|
Unrealized
|
Estimated
|
|||||||||||||||||
|
|
losses
|
fair value
|
losses
|
fair value
|
losses
|
fair value
|
|||||||||||||||||
|
Mortgage-backed securities:
|
|
|
|
|
|
|
|||||||||||||||||
|
Pass-through certificates:
|
|
|
|
|
|
|
|||||||||||||||||
|
GSE
|
$
|
439
|
|
$
|
48,931
|
|
$
|
2,015
|
|
$
|
76,113
|
|
$
|
2,454
|
|
$
|
125,044
|
|
|||||
|
REMICs:
|
|
|
|
|
|
|
|||||||||||||||||
|
GSE
|
933
|
|
103,644
|
|
5,926
|
|
139,830
|
|
6,859
|
|
243,474
|
|
|||||||||||
|
Non-GSE
|
—
|
|
—
|
|
1
|
|
79
|
|
1
|
|
79
|
|
|||||||||||
|
Debt securities:
|
|
|
|
|
|
|
|||||||||||||||||
|
Corporate bonds
|
61
|
|
11,006
|
|
137
|
|
15,084
|
|
198
|
|
26,090
|
|
|||||||||||
|
Total
|
$
|
1,433
|
|
$
|
163,581
|
|
$
|
8,079
|
|
$
|
231,106
|
|
$
|
9,512
|
|
$
|
394,687
|
|
|||||
|
|
December 31, 2016
|
||||||||||||||||||||||
|
|
Less than 12 months
|
12 months or more
|
Total
|
||||||||||||||||||||
|
|
Unrealized
|
Estimated
|
Unrealized
|
Estimated
|
Unrealized
|
Estimated
|
|||||||||||||||||
|
|
losses
|
fair value
|
losses
|
fair value
|
losses
|
fair value
|
|||||||||||||||||
|
Mortgage-backed securities:
|
|
|
|
|
|
|
|||||||||||||||||
|
Pass-through certificates:
|
|
|
|
|
|
|
|||||||||||||||||
|
GSE
|
$
|
2,703
|
|
$
|
121,878
|
|
$
|
595
|
|
$
|
8,402
|
|
$
|
3,298
|
|
$
|
130,280
|
|
|||||
|
REMICs:
|
|
|
|
|
|
|
|||||||||||||||||
|
GSE
|
1,622
|
|
75,586
|
|
4,844
|
|
97,726
|
|
6,466
|
|
173,312
|
|
|||||||||||
|
Non-GSE
|
—
|
|
—
|
|
10
|
|
270
|
|
10
|
|
270
|
|
|||||||||||
|
Debt securities:
|
|
|
|
|
|
|
|
|
|
|
|
|
|||||||||||
|
Municipal bonds
|
6
|
|
1,679
|
|
—
|
|
—
|
|
6
|
|
1,679
|
|
|||||||||||
|
Corporate bonds
|
364
|
|
26,022
|
|
—
|
|
—
|
|
364
|
|
26,022
|
|
|||||||||||
|
Other securities
|
15
|
|
947
|
|
—
|
|
—
|
|
15
|
|
947
|
|
|||||||||||
|
Total
|
$
|
4,710
|
|
$
|
226,112
|
|
$
|
5,449
|
|
$
|
106,398
|
|
$
|
10,159
|
|
$
|
332,510
|
|
|||||
85
NORTHFIELD BANCORP, INC. AND SUBSIDIARIES
Notes to Consolidated Financial Statements - (Continued)
The Company held
33
pass-through mortgage-backed securities issued or guaranteed by GSEs,
19
REMIC mortgage-backed securities issued or guaranteed by GSEs,
one
REMIC mortgage-backed security not issued or guaranteed by GSEs, and
three
corporate bonds that were in a continuous unrealized loss position of greater than twelve months at
December 31, 2017
. There were
20
pass-through mortgage-backed securities issued or guaranteed by GSEs,
33
REMIC mortgage-backed securities issued or guaranteed by GSEs, and
two
corporate bonds that were in an unrealized loss position of less than twelve months. All securities referred to above, other than the one REMIC mortgage-backed security not issued or guaranteed by a GSE, were rated investment grade at
December 31, 2017
. The declines in value relate to the general interest rate environment and are considered temporary. The securities cannot be prepaid in a manner that would result in the Company not receiving all of its amortized cost. The Company neither has an intent to sell, nor is it more likely than not that the Company will be required to sell, the securities before the recovery of their amortized cost basis or, if necessary, maturity.
The fair values of our investment securities could decline in the future if the underlying performance of the collateral for the collateralized mortgage obligations or other securities deteriorates and our credit enhancement levels do not provide sufficient protections to our contractual principal and interest. As a result, there is a risk that significant other-than-temporary impairments may occur in the future given the current economic environment.
|
(4)
|
Securities Held-to-Maturity
|
The following is a summary of mortgage-backed securities held-to-maturity at
December 31, 2017
and
2016
(in thousands):
|
|
2017
|
||||||||||||||
|
|
Amortized Cost
|
Gross Unrealized Gains
|
Gross Unrealized Losses
|
Estimated Fair Value
|
|||||||||||
|
Mortgage-backed securities:
|
|
|
|
|
|
|
|
|
|||||||
|
Pass-through certificates:
|
|
|
|
|
|
|
|
|
|||||||
|
GSEs
|
$
|
9,931
|
|
$
|
17
|
|
$
|
56
|
|
$
|
9,892
|
|
|||
|
Total securities held-to-maturity
|
$
|
9,931
|
|
$
|
17
|
|
$
|
56
|
|
$
|
9,892
|
|
|||
|
|
2016
|
||||||||||||||
|
|
Amortized Cost
|
Gross Unrealized Gains
|
Gross Unrealized Losses
|
Estimated Fair Value
|
|||||||||||
|
Mortgage-backed securities:
|
|
|
|
|
|
|
|
|
|||||||
|
Pass-through certificates:
|
|||||||||||||||
|
GSEs
|
$
|
10,148
|
|
$
|
29
|
|
$
|
59
|
|
$
|
10,118
|
|
|||
|
Total securities held-to-maturity
|
$
|
10,148
|
|
$
|
29
|
|
$
|
59
|
|
$
|
10,118
|
|
|||
Contractual maturities for mortgage-backed securities are not presented, as expected maturities on mortgage-backed securities will differ from contractual maturities as borrowers may have the right to call or prepay obligations with or without penalties. There were
no
sales of held-to-maturity securities for the years ended
December 31, 2017
,
2016
and
2015
. The Company did
no
t recognize any other-than-temporary impairment charges in earnings on securities held-to-maturity during the years ended
December 31, 2017
,
2016
and
2015
. At
December 31, 2017
, and
December 31, 2016
, securities held-to-maturity with a carrying value of
$2.8 million
and
$5.0 million
, respectively, were pledged to secure repurchase agreements and deposits.
Gross unrealized losses on mortgage-backed securities held-to-maturity, and the estimated fair value of the related securities, aggregated by security category and length of time that individual securities have been in a continuous unrealized loss position, at
December 31, 2017
and
2016
, were as follows (in thousands):
86
NORTHFIELD BANCORP, INC. AND SUBSIDIARIES
Notes to Consolidated Financial Statements - (Continued)
|
|
December 31, 2017
|
||||||||||||||||||||||
|
|
Less than 12 months
|
12 months or more
|
Total
|
||||||||||||||||||||
|
|
Unrealized
|
Estimated
|
Unrealized
|
Estimated
|
Unrealized
|
Estimated
|
|||||||||||||||||
|
|
losses
|
fair value
|
losses
|
fair value
|
losses
|
fair value
|
|||||||||||||||||
|
Mortgage-backed securities:
|
|
|
|
|
|
|
|||||||||||||||||
|
Pass-through certificates:
|
|
|
|
|
|
|
|||||||||||||||||
|
GSEs
|
$
|
7
|
|
$
|
3,922
|
|
$
|
49
|
|
$
|
3,735
|
|
$
|
56
|
|
$
|
7,657
|
|
|||||
|
Total
|
$
|
7
|
|
$
|
3,922
|
|
$
|
49
|
|
$
|
3,735
|
|
$
|
56
|
|
$
|
7,657
|
|
|||||
|
|
December 31, 2016
|
||||||
|
|
Less than 12 months
|
||||||
|
|
Unrealized Losses
|
Estimated Fair Value
|
|||||
|
Mortgage-backed securities:
|
|
|
|||||
|
Pass-through certificates:
|
|
|
|||||
|
GSEs
|
$
|
59
|
|
$
|
7,466
|
|
|
|
Total securities held-to-maturity
|
$
|
59
|
|
$
|
7,466
|
|
|
The Company held
two
pass-through mortgage-backed securities held-to-maturity, issued or guaranteed by GSEs, that were in a continuous unrealized loss position of greater than twelve months, and
three
pass-through mortgage-backed securities held-to-maturity, issued or guaranteed by GSEs, that were in a continuous unrealized loss position of less than twelve months at December 31, 2017. Management evaluated these securities and concluded that the declines in value relate to the general interest rate environment and are considered temporary. The securities cannot be prepaid in a manner that would result in the Company not receiving all of its amortized cost. The Company neither has an intent to sell, nor is it more likely than not that the Company will be required to sell, the securities before the recovery of their amortized cost basis or, if necessary, maturity.
The fair values of our investment securities could decline in the future if the underlying performance of the collateral for the collateralized mortgage obligations or other securities deteriorates and our credit enhancement levels do not provide sufficient protections to our contractual principal and interest. As a result, there is a risk that significant other-than-temporary impairments may occur in the future given the current economic environment.
87
NORTHFIELD BANCORP, INC. AND SUBSIDIARIES
Notes to Consolidated Financial Statements - (Continued)
|
(5)
|
Loans
|
Loans held-for-investment, net, consists of the following (in thousands):
|
|
December 31,
|
||||||
|
|
2017
|
2016
|
|||||
|
Originated loans:
|
|||||||
|
Real estate loans:
|
|
||||||
|
Multifamily
|
$
|
1,735,712
|
|
$
|
1,506,335
|
|
|
|
Commercial mortgage
|
445,225
|
|
412,667
|
|
|||
|
One-to-four family residential mortgage
|
100,942
|
|
105,968
|
|
|||
|
Home equity and lines of credit
|
66,254
|
|
65,437
|
|
|||
|
Construction and land
|
34,545
|
|
14,065
|
|
|||
|
Total real estate loans
|
2,382,678
|
|
2,104,472
|
|
|||
|
Commercial and industrial loans
|
34,828
|
|
31,906
|
|
|||
|
Other loans
|
1,430
|
|
1,497
|
|
|||
|
Deferred loan cost, net
|
6,339
|
|
6,471
|
|
|||
|
Originated loans held-for-investment, net
|
2,425,275
|
|
2,144,346
|
|
|||
|
PCI Loans
|
22,741
|
|
30,498
|
|
|||
|
Loans acquired:
|
|
|
|||||
|
One-to-four family residential mortgage
|
275,053
|
|
317,639
|
|
|||
|
Multifamily
|
199,149
|
|
215,389
|
|
|||
|
Commercial mortgage
|
163,962
|
|
188,001
|
|
|||
|
Home equity and lines of credit
|
20,455
|
|
25,522
|
|
|||
|
Construction and land
|
17,201
|
|
20,887
|
|
|||
|
Total acquired real estate loans
|
675,820
|
|
767,438
|
|
|||
|
Commercial and industrial loans
|
16,946
|
|
25,443
|
|
|||
|
Other loans
|
37
|
|
359
|
|
|||
|
Total loans acquired
|
692,803
|
|
793,240
|
|
|||
|
Loans held for investment, net
|
3,140,819
|
|
2,968,084
|
|
|||
|
Allowance for loan losses
|
(26,160
|
)
|
(24,595
|
)
|
|||
|
Net loans held-for-investment
|
$
|
3,114,659
|
|
$
|
2,943,489
|
|
|
The Company had
no
loans held-for-sale at
December 31, 2017
, or
December 31, 2016
.
PCI loans totaled
$22.7 million
at
December 31, 2017
, as compared to $
30.5
million at
December 31, 2016
. The majority of the PCI loan balance is attributable to those loans acquired as part of an FDIC-assisted transaction. The Company accounts for PCI loans utilizing U.S. GAAP applicable to loans acquired with deteriorated credit quality. At
December 31, 2017
, PCI loans consisted of approximately
27%
commercial real estate loans and
50%
commercial and industrial loans, with the remaining balance in residential and home equity loans. At
December 31, 2016
, PCI loans consisted of approximately
30%
commercial real estate loans and
48%
commercial and industrial loans, with the remaining balance in residential and home equity loans.
The following table sets forth information regarding the estimates of the contractually required payments, the cash flows expected to be collected, and the estimated fair value of the PCI loans acquired from Hopewell Valley at January 8, 2016 (in thousands):
|
|
January 8, 2016
|
|||
|
Contractually required principal and interest at acquisition
|
$
|
16,580
|
|
|
|
Contractual cash flows not expected to be collected (non-accretable discount)
|
(9,929
|
)
|
||
|
Expected cash flows to be collected at acquisition
|
6,651
|
|
||
|
Interest component of expected cash flows (accretable discount)
|
(845
|
)
|
||
|
Fair value of acquired loans
|
$
|
5,806
|
|
|
88
NORTHFIELD BANCORP, INC. AND SUBSIDIARIES
Notes to Consolidated Financial Statements - (Continued)
The following details the accretable yield (in thousands):
|
|
For The Year Ended December 31,
|
||||||
|
|
2017
|
2016
|
|||||
|
Balance at the beginning of year
|
$
|
24,215
|
|
$
|
22,853
|
|
|
|
Acquisition
|
—
|
|
845
|
|
|||
|
Accretion into interest income
|
(5,477
|
)
|
(5,225
|
)
|
|||
|
Net reclassification from non-accretable difference
(1)
|
5,764
|
|
5,742
|
|
|||
|
Balance at end of year
|
$
|
24,502
|
|
$
|
24,215
|
|
|
_______________________
(1) Reclassifications of the non-accretable difference to the accretable yield may occur subsequent to the loan acquisition dates due to increases in expected cash flows of the loans.
The Company does not have any lending programs commonly referred to as subprime lending. Subprime lending generally targets borrowers with weakened credit histories typically characterized by payment delinquencies, previous charge-offs, judgments, bankruptcies, or borrowers with questionable repayment capacity as evidenced by low credit scores or high debt-burden ratios.
We provide for loan losses based on the consistent application of our documented allowance for loan loss methodology. Loan losses are charged to the allowance for loans losses and recoveries are credited to it. Additions to the allowance for loan losses are provided by charges against income based on various factors which, in our judgment, deserve current recognition in estimating incurred losses. Loan losses are charged-off in the period the loans, or portion thereof, are deemed uncollectible. Generally, the Company will record a loan charge-off (including a partial charge-off) to reduce a loan to the estimated fair value of the underlying collateral, less cost to sell, for collateral dependent loans. We regularly review the loan portfolio in order to maintain the allowance for loan losses in accordance with U.S. GAAP. At
December 31, 2017
and
2016
, the allowance for loan losses related to loans held-for-investment (excluding PCI loans) consisted primarily of the following two components:
|
(1)
|
Specific allowances are established for impaired loans (generally defined by the Company as non-accrual loans with an outstanding balance of $
500,000
or greater and all loans restructured in troubled debt restructurings). The amount of impairment, if any, provided for as a specific reserve determined by the deficiency, if any, between the present value of expected future cash flows discounted at the original loan’s effective interest rate or the underlying collateral value (less estimated costs to sell and discounts for quick sales,) if the loan is collateral dependent, and the carrying value of the loan. Impaired loans that have no impairment losses are not considered for general allowances described below. Generally, the Company charges down a loan to the estimated fair value of the underlying collateral, less costs to sell for collateral dependent loans and, if necessary, maintains a specific reserve in the allowance for loan losses related to cash flow dependent impaired loans where the present value of the expected future cash flows, discounted at the loan’s original contractual interest rate, is less than the carrying value of the loan unless management determines that such shortfall should be charged off.
|
|
(2)
|
General allowances are established for loan losses on a portfolio basis for loans that do not meet the definition of impaired. The portfolio is grouped into similar risk characteristics, primarily loan type, loan-to-value, if collateral dependent, and internal credit risk ratings. We apply an estimated loss rate to each loan group. The loss rates applied are based on our net loss experience (using appropriate look-back and loss emergence periods) as adjusted, if appropriate, for our qualitative assessment of factors which may not be fully captured in our historical quantitative net loss rates related to:
|
|
•
|
changes in lending policies and procedures;
|
|
•
|
changes in local, regional, national, and international economic and business conditions and developments that affect the collectability of our portfolio, including the condition of various market segments;
|
|
•
|
changes in the nature and volume of our portfolio and in the terms of our loans;
|
|
•
|
changes in the experience, ability and depth of lending management and other relevant staff;
|
|
•
|
changes in the volume and severity of past due loans, the volume of non-accrual loans, and the volume and severity of adversely classified or graded loans;
|
89
NORTHFIELD BANCORP, INC. AND SUBSIDIARIES
Notes to Consolidated Financial Statements - (Continued)
|
•
|
changes in the quality of our loan review system;
|
|
•
|
changes in the value of underlying collateral for collateral-dependent loans;
|
|
•
|
the existence and effect of any concentrations of credit, and changes in the level of such concentrations; and
|
|
•
|
the effect of other external factors such as competition and legal and regulatory requirements on the level of estimated credit losses in our existing portfolio.
|
The loss emergence period is the estimated time from the date of the loss event to the actual recognition of the loss (typically the first charge-off), and is determined based upon a study of the Company's past loss experience by loan groups. This evaluation is inherently subjective, as it requires material estimates that may be susceptible to significant revisions based upon changes in economic and real estate market conditions. Actual loan losses may be significantly more than the allowance for loan losses we have established, which could have a material negative effect on our financial results. Prior to December 31, 2016, we maintained an amount identified as the unallocated component within the allowance for loan losses related to indicators of loan losses not fully captured in other components of the allowance for loan losses methodology, as well as the inherent imprecision of the loss estimation process. During the fourth quarter of 2016, the Company enhanced the allowance for loan losses qualitative framework to more fully capture the risks related to certain loan loss factors. These enhancements are meant to increase the level of precision in the allowance for loan losses. As a result, the Company no longer has an unallocated reserve in its allowance for loan losses, as the risks and uncertainties meant to be captured by the unallocated allowance have been included in the qualitative framework for the respective loan portfolios.
Held-for-investment loans acquired with no evidence of credit deterioration are initially valued at an estimated fair value on the date of acquisition, with no initial related allowance for loan losses. These loans are evaluated for impairment on a quarterly basis as part of our analysis of the allowance for loan losses.
In underwriting a loan secured by real property, we require an appraisal (or an automated valuation model) of the property by an independent licensed appraiser approved by the Company’s board of directors. The appraisal is subject to review by an independent third-party hired by the Company. We review and inspect properties before disbursement of funds during the term of a construction loan. Generally, management obtains updated appraisals when a loan is deemed impaired, or sooner if management deems it appropriate. These appraisals may be more limited than those prepared for the underwriting of a new loan. In addition, when the Company acquires other real estate owned, it generally obtains a current appraisal to substantiate the net carrying value of the asset.
We evaluate the allowance for loan losses based on the combined total of the impaired and general components for loans. Generally when the loan portfolio increases, absent other factors, our allowance for loan loss methodology results in a higher dollar amount of estimated incurred losses. Conversely, when the loan portfolio decreases, absent other factors, our allowance for loan loss methodology results in a lower dollar amount of estimated incurred losses.
Each quarter we evaluate the allowance for loan losses and adjust the allowance as appropriate through a provision for loan losses. While we use the best information available to make evaluations, future adjustments to the allowance may be necessary if conditions differ substantially from the information used in making the evaluations. In addition, as an integral part of their examination process, the Office of the Comptroller of the Currency (OCC) will periodically review the allowance for loan losses. The OCC may require us to adjust the allowance based on their analysis of information available to them at the time of their examination.
A summary of changes in the allowance for loan losses for the years ended
December 31, 2017
,
2016
, and
2015
follows (in thousands):
|
|
December 31,
|
||||||||||
|
|
2017
|
2016
|
2015
|
||||||||
|
Balance at beginning of year
|
$
|
24,595
|
|
$
|
24,770
|
|
$
|
26,292
|
|
||
|
Provision for loan losses
|
1,411
|
|
635
|
|
353
|
|
|||||
|
Recoveries
|
556
|
|
194
|
|
140
|
|
|||||
|
Charge-offs
|
(402
|
)
|
(1,004
|
)
|
(2,015
|
)
|
|||||
|
Balance at end of year
|
$
|
26,160
|
|
$
|
24,595
|
|
$
|
24,770
|
|
||
90
NORTHFIELD BANCORP, INC. AND SUBSIDIARIES
Notes to Consolidated Financial Statements - (Continued)
The following table sets forth activity in our allowance for loan losses, by loan type, for the years ended
December 31, 2017
and
2016
. The following table also details the amount of loans receivable held-for-investment, net of deferred loan fees and costs, that are evaluated individually, and collectively, for impairment, and the related portion of allowance for loan losses that is allocated to each loan portfolio segment (in thousands):
|
|
December 31, 2017
|
||||||||||||||||||||||||||||||||||||||||||||||
|
|
Real Estate
|
|
|
|
|
|
|
||||||||||||||||||||||||||||||||||||||||
|
|
Commercial
|
One-to-Four Family
|
Construction and Land
|
Multifamily
|
Home Equity and Lines of Credit
|
Commercial and Industrial
|
Other
|
Unallocated
|
Originated Loans Total
|
PCI
|
Acquired Loans
|
Total
|
|||||||||||||||||||||||||||||||||||
|
Allowance for loan losses:
|
|
|
|
|
|
|
|
|
|
|
|
||||||||||||||||||||||||||||||||||||
|
Beginning Balance
|
$
|
5,432
|
|
$
|
664
|
|
$
|
172
|
|
$
|
14,952
|
|
$
|
588
|
|
$
|
1,720
|
|
$
|
96
|
|
$
|
—
|
|
$
|
23,624
|
|
$
|
896
|
|
$
|
75
|
|
$
|
24,595
|
|
|||||||||||
|
Charge-offs
|
(4
|
)
|
—
|
|
—
|
|
(184
|
)
|
(104
|
)
|
(73
|
)
|
—
|
|
—
|
|
(365
|
)
|
—
|
|
(37
|
)
|
(402
|
)
|
|||||||||||||||||||||||
|
Recoveries
|
70
|
|
—
|
|
—
|
|
277
|
|
97
|
|
79
|
|
—
|
|
—
|
|
523
|
|
—
|
|
33
|
|
556
|
|
|||||||||||||||||||||||
|
Provisions (credit)
|
(302
|
)
|
(161
|
)
|
438
|
|
2,329
|
|
(459
|
)
|
(453
|
)
|
(2
|
)
|
—
|
|
1,390
|
|
55
|
|
(34
|
)
|
1,411
|
|
|||||||||||||||||||||||
|
Ending Balance
|
$
|
5,196
|
|
$
|
503
|
|
$
|
610
|
|
$
|
17,374
|
|
$
|
122
|
|
$
|
1,273
|
|
$
|
94
|
|
$
|
—
|
|
$
|
25,172
|
|
$
|
951
|
|
$
|
37
|
|
$
|
26,160
|
|
|||||||||||
|
Ending balance: individually evaluated for impairment
|
$
|
—
|
|
$
|
38
|
|
$
|
—
|
|
$
|
—
|
|
$
|
4
|
|
$
|
3
|
|
$
|
—
|
|
$
|
—
|
|
$
|
45
|
|
$
|
—
|
|
$
|
37
|
|
$
|
82
|
|
|||||||||||
|
Ending balance: collectively evaluated for impairment
|
$
|
5,196
|
|
$
|
465
|
|
$
|
610
|
|
$
|
17,374
|
|
$
|
118
|
|
$
|
1,270
|
|
$
|
94
|
|
$
|
—
|
|
$
|
25,127
|
|
$
|
951
|
|
$
|
—
|
|
$
|
26,078
|
|
|||||||||||
|
Loans, net:
|
|
|
|
|
|
|
|
|
|
|
|
||||||||||||||||||||||||||||||||||||
|
Ending Balance
|
$
|
445,781
|
|
$
|
101,650
|
|
$
|
34,620
|
|
$
|
1,739,220
|
|
$
|
67,679
|
|
$
|
34,893
|
|
$
|
1,432
|
|
$
|
—
|
|
$
|
2,425,275
|
|
$
|
22,741
|
|
$
|
692,803
|
|
$
|
3,140,819
|
|
|||||||||||
|
Ending balance: individually evaluated for impairment
|
$
|
16,008
|
|
$
|
1,996
|
|
$
|
—
|
|
$
|
1,310
|
|
$
|
69
|
|
$
|
159
|
|
$
|
—
|
|
$
|
—
|
|
$
|
19,542
|
|
$
|
—
|
|
$
|
1,543
|
|
$
|
21,085
|
|
|||||||||||
|
Ending balance: collectively evaluated for impairment
|
$
|
429,773
|
|
$
|
99,654
|
|
$
|
34,620
|
|
$
|
1,737,910
|
|
$
|
67,610
|
|
$
|
34,734
|
|
$
|
1,432
|
|
$
|
—
|
|
$
|
2,405,733
|
|
$
|
22,741
|
|
$
|
691,260
|
|
$
|
3,119,734
|
|
|||||||||||
|
December 31, 2016
|
|||||||||||||||||||||||||||||||||||||||||||||||
|
|
Real Estate
|
|
|
|
|
|
|
||||||||||||||||||||||||||||||||||||||||
|
|
Commercial
|
One-to-Four Family
|
Construction and Land
|
Multifamily
|
Home Equity and Lines of Credit
|
Commercial and Industrial
|
Other
|
Unallocated
|
Originated Loans Total
|
PCI
|
Acquired Loans
|
Total
|
|||||||||||||||||||||||||||||||||||
|
Allowance for loan losses:
|
|
|
|
|
|
|
|
|
|
|
|
||||||||||||||||||||||||||||||||||||
|
Beginning Balance
|
$
|
7,106
|
|
$
|
787
|
|
$
|
261
|
|
$
|
12,387
|
|
$
|
795
|
|
$
|
1,288
|
|
$
|
155
|
|
$
|
1,093
|
|
$
|
23,872
|
|
$
|
783
|
|
$
|
115
|
|
$
|
24,770
|
|
|||||||||||
|
Charge-offs
|
(638
|
)
|
(20
|
)
|
—
|
|
(278
|
)
|
—
|
|
(66
|
)
|
(2
|
)
|
—
|
|
(1,004
|
)
|
—
|
|
—
|
|
(1,004
|
)
|
|||||||||||||||||||||||
|
Recoveries
|
181
|
|
2
|
|
—
|
|
—
|
|
2
|
|
4
|
|
5
|
|
—
|
|
194
|
|
—
|
|
—
|
|
194
|
|
|||||||||||||||||||||||
|
Provisions (credit)
|
(1,217
|
)
|
(105
|
)
|
(89
|
)
|
2,843
|
|
(209
|
)
|
494
|
|
(62
|
)
|
(1,093
|
)
|
562
|
|
113
|
|
(40
|
)
|
635
|
|
|||||||||||||||||||||||
|
Ending Balance
|
$
|
5,432
|
|
$
|
664
|
|
$
|
172
|
|
$
|
14,952
|
|
$
|
588
|
|
$
|
1,720
|
|
$
|
96
|
|
$
|
—
|
|
$
|
23,624
|
|
$
|
896
|
|
$
|
75
|
|
$
|
24,595
|
|
|||||||||||
|
Ending balance: individually evaluated for impairment
|
$
|
64
|
|
$
|
66
|
|
$
|
—
|
|
$
|
95
|
|
$
|
23
|
|
$
|
5
|
|
$
|
—
|
|
$
|
—
|
|
$
|
253
|
|
$
|
—
|
|
$
|
75
|
|
$
|
328
|
|
|||||||||||
|
Ending balance: collectively evaluated for impairment
|
$
|
5,368
|
|
$
|
598
|
|
$
|
172
|
|
$
|
14,857
|
|
$
|
565
|
|
$
|
1,715
|
|
$
|
96
|
|
$
|
—
|
|
$
|
23,371
|
|
$
|
896
|
|
$
|
—
|
|
$
|
24,267
|
|
|||||||||||
|
Loans, net:
|
|
|
|
|
|
|
|
|
|
|
|
||||||||||||||||||||||||||||||||||||
|
Ending Balance
|
$
|
413,352
|
|
$
|
106,524
|
|
$
|
14,092
|
|
$
|
1,510,100
|
|
$
|
66,767
|
|
$
|
32,013
|
|
$
|
1,498
|
|
$
|
—
|
|
$
|
2,144,346
|
|
$
|
30,498
|
|
$
|
793,240
|
|
$
|
2,968,084
|
|
|||||||||||
|
Ending balance: individually evaluated for impairment
|
$
|
20,710
|
|
$
|
2,180
|
|
$
|
—
|
|
$
|
1,372
|
|
$
|
336
|
|
$
|
101
|
|
$
|
—
|
|
$
|
—
|
|
$
|
24,699
|
|
$
|
—
|
|
$
|
1,591
|
|
$
|
26,290
|
|
|||||||||||
|
Ending balance: collectively evaluated for impairment
|
$
|
392,642
|
|
$
|
104,344
|
|
$
|
14,092
|
|
$
|
1,508,728
|
|
$
|
66,431
|
|
$
|
31,912
|
|
$
|
1,498
|
|
$
|
—
|
|
$
|
2,119,647
|
|
$
|
30,498
|
|
$
|
791,649
|
|
$
|
2,941,794
|
|
|||||||||||
91
NORTHFIELD BANCORP, INC. AND SUBSIDIARIES
Notes to Consolidated Financial Statements - (Continued)
The Company monitors the credit quality of its loan portfolio on a regular basis. Credit quality is monitored by reviewing certain credit quality indicators. Management has determined that loan-to-value ratios (at period end) and internally assigned credit risk ratings by loan type are the key credit quality indicators that best measure the credit quality of the Company’s loan receivables. Loan-to-value (“LTV”) ratios used by management in monitoring credit quality are based on current period loan balances and original appraised values at time of origination (unless a current appraisal has been obtained as a result of the loan being deemed impaired). In calculating the provision for loan losses, based on past loan loss experience, management has determined that commercial real estate loans and multifamily loans having loan-to-value ratios, as described above, of less than
35%
, and one-to-four family loans having loan-to-value ratios, as described above, of less than
60%
, require less of a loss factor than those with higher loan to value ratios.
The Company maintains a credit risk rating system as part of the risk assessment of its loan portfolio. The Company’s lending officers are required to assign a credit risk rating to each loan in their portfolio at origination. This risk rating is reviewed periodically and adjusted if necessary. Monthly, management presents monitored assets to the loan committee. In addition, the Company engages a third-party independent loan reviewer that performs semi-annual reviews of a sample of loans, validating the credit risk ratings assigned to such loans. The credit risk ratings play an important role in the establishment of the loan loss provision and the allowance for loan losses for originated loans held-for-investment. After determining the general reserve loss factor for each originated portfolio segment held-for-investment, the originated portfolio segment held-for-investment balance collectively evaluated for impairment is multiplied by the general reserve loss factor for the respective portfolio segment in order to determine the general reserve.
When assigning a risk rating to a loan, management utilizes the Bank’s internal nine-point credit risk rating system.
|
1.
|
Strong
|
|
2.
|
Good
|
|
3.
|
Acceptable
|
|
4.
|
Adequate
|
|
5.
|
Watch
|
|
6.
|
Special Mention
|
|
7.
|
Substandard
|
|
8.
|
Doubtful
|
|
9.
|
Loss
|
Loans rated 1 to 5 are considered pass ratings. An asset is classified substandard if it is inadequately protected by the current net worth and paying capacity of the obligor or of the collateral pledged, if any. Substandard assets have well defined weaknesses based on objective evidence, and are characterized by the distinct possibility that the Company will sustain some loss if the deficiencies are not corrected. Assets classified as doubtful have all of the weaknesses inherent in those classified substandard with the added characteristic that the weaknesses present make collection or liquidation in full highly questionable and improbable based on current circumstances. Assets classified as loss are those considered uncollectible and of such little value that their continuance as assets is not warranted. Assets which do not currently expose the Company to sufficient risk to warrant classification in one of the aforementioned categories, but possess weaknesses, are required to be designated special mention.
92
NORTHFIELD BANCORP, INC. AND SUBSIDIARIES
Notes to Consolidated Financial Statements - (Continued)
The following table details the recorded investment of originated loans receivable held-for-investment, net of deferred fees and costs, by loan type and credit quality indicator at
December 31, 2017
and
2016
(in thousands):
|
|
At December 31, 2017
|
||||||||||||||||||||||||||||||||||||||||||
|
|
Real Estate
|
|
|
|
|||||||||||||||||||||||||||||||||||||||
|
|
Multifamily
|
Commercial
|
One-to-Four Family
|
Construction and Land
|
Home Equity and Lines of Credit
|
Commercial and Industrial
|
Other
|
Total
|
|||||||||||||||||||||||||||||||||||
|
|
< 35% LTV
|
=> 35% LTV
|
< 35% LTV
|
=> 35% LTV
|
< 60% LTV
|
=> 60% LTV
|
|
|
|
|
|
||||||||||||||||||||||||||||||||
|
Internal Risk Rating
|
|
|
|
|
|
|
|
|
|
|
|
||||||||||||||||||||||||||||||||
|
Pass
|
$
|
131,792
|
|
$
|
1,603,947
|
|
$
|
84,620
|
|
$
|
346,857
|
|
$
|
60,400
|
|
$
|
38,504
|
|
$
|
34,620
|
|
$
|
67,426
|
|
$
|
34,141
|
|
$
|
1,432
|
|
$
|
2,403,739
|
|
||||||||||
|
Special Mention
|
—
|
|
1,897
|
|
410
|
|
2,170
|
|
683
|
|
—
|
|
—
|
|
28
|
|
571
|
|
—
|
|
5,759
|
|
|||||||||||||||||||||
|
Substandard
|
—
|
|
1,584
|
|
—
|
|
11,724
|
|
1,470
|
|
593
|
|
—
|
|
225
|
|
181
|
|
—
|
|
15,777
|
|
|||||||||||||||||||||
|
Originated loans held-for-investment, net
|
$
|
131,792
|
|
$
|
1,607,428
|
|
$
|
85,030
|
|
$
|
360,751
|
|
$
|
62,553
|
|
$
|
39,097
|
|
$
|
34,620
|
|
$
|
67,679
|
|
$
|
34,893
|
|
$
|
1,432
|
|
$
|
2,425,275
|
|
||||||||||
|
|
At December 31, 2016
|
||||||||||||||||||||||||||||||||||||||||||
|
|
Real Estate
|
|
|
|
|||||||||||||||||||||||||||||||||||||||
|
|
Multifamily
|
Commercial
|
One-to-Four Family
|
Construction and Land
|
Home Equity and Lines of Credit
|
Commercial and Industrial
|
Other
|
Total
|
|||||||||||||||||||||||||||||||||||
|
|
< 35% LTV
|
=> 35% LTV
|
< 35% LTV
|
=> 35% LTV
|
< 60% LTV
|
=> 60% LTV
|
|
|
|
|
|
||||||||||||||||||||||||||||||||
|
Internal Risk Rating
|
|
|
|
|
|
|
|
|
|
|
|
||||||||||||||||||||||||||||||||
|
Pass
|
$
|
122,525
|
|
$
|
1,381,231
|
|
$
|
65,612
|
|
$
|
323,842
|
|
$
|
59,214
|
|
$
|
43,316
|
|
$
|
14,092
|
|
$
|
66,489
|
|
$
|
31,173
|
|
$
|
1,498
|
|
$
|
2,108,992
|
|
||||||||||
|
Special Mention
|
25
|
|
4,636
|
|
—
|
|
3,852
|
|
705
|
|
—
|
|
—
|
|
29
|
|
696
|
|
—
|
|
9,943
|
|
|||||||||||||||||||||
|
Substandard
|
40
|
|
1,643
|
|
1,179
|
|
18,867
|
|
1,807
|
|
1,482
|
|
—
|
|
249
|
|
144
|
|
—
|
|
25,411
|
|
|||||||||||||||||||||
|
Originated loans held-for-investment, net
|
$
|
122,590
|
|
$
|
1,387,510
|
|
$
|
66,791
|
|
$
|
346,561
|
|
$
|
61,726
|
|
$
|
44,798
|
|
$
|
14,092
|
|
$
|
66,767
|
|
$
|
32,013
|
|
$
|
1,498
|
|
$
|
2,144,346
|
|
||||||||||
93
NORTHFIELD BANCORP, INC. AND SUBSIDIARIES
Notes to Consolidated Financial Statements - (Continued)
Included in loans receivable are loans for which the accrual of interest income has been discontinued due to deterioration in the financial condition of the borrowers. The recorded investment of these nonaccrual loans was
$5.5 million
and
$7.3 million
at
December 31, 2017
, and
December 31, 2016
, respectively. Generally, originated loans are placed on non-accruing status when they become
90
days or more delinquent, or sooner if considered appropriate by management, and remain on non-accrual status until they are brought current, have six consecutive months of performance under the loan terms, and factors indicating reasonable doubt about the timely collection of payments no longer exist. Therefore, loans may be current in accordance with their loan terms, or may be less than
90
days delinquent and still be on a non-accruing status.
Non-accrual amounts include loans deemed to be impaired of
$3.1 million
and
$5.7 million
at
December 31, 2017
, and
December 31, 2016
, respectively. Loans on non-accrual status with principal balances less than
$500,000
, and therefore not meeting the Company’s definition of an impaired loan, amounted to
$2.4 million
at
December 31, 2017
, and
$1.7 million
at
December 31, 2016
. There was
no
loans held-for-sale at
December 31, 2017
, or
December 31, 2016
. Loans past due 90 days or more and still accruing interest were
$28,000
and
$60,000
at
December 31, 2017
, and
December 31, 2016
, respectively, and consisted of loans that are well secured and in the process of collection.
94
NORTHFIELD BANCORP, INC. AND SUBSIDIARIES
Notes to Consolidated Financial Statements - (Continued)
The following table sets forth the detail, and delinquency status, of originated and acquired non-performing loans (non-accrual loans and loans past due ninety days or more and still accruing), net of deferred fees and costs, at
December 31, 2017
and
2016
(in thousands), excluding PCI loans which have been segregated into pools. For PCI loans, each loan pool is accounted for as a single asset with a single composite interest rate and an aggregate expectation of cash flows.
|
|
At December 31, 2017
|
||||||||||||||||||||||
|
|
Total Non-Performing Loans
|
||||||||||||||||||||||
|
|
Non-Accruing Loans
|
|
|
||||||||||||||||||||
|
|
0-29 Days Past Due
|
30-89 Days Past Due
|
90 Days or More Past Due
|
Total
|
90 Days or More Past Due and Accruing
|
Total Non-Performing Loans
|
|||||||||||||||||
|
Loans held-for-investment:
|
|
|
|
|
|
|
|||||||||||||||||
|
Real estate loans:
|
|
|
|
|
|
|
|||||||||||||||||
|
Commercial
|
|
|
|
|
|
|
|
|
|
|
|
|
|||||||||||
|
LTV => 35%
|
|
|
|
|
|
|
|
|
|
|
|
|
|||||||||||
|
Substandard
|
$
|
432
|
|
$
|
314
|
|
$
|
2,305
|
|
$
|
3,051
|
|
$
|
—
|
|
$
|
3,051
|
|
|||||
|
Total commercial
|
432
|
|
314
|
|
2,305
|
|
3,051
|
|
—
|
|
3,051
|
|
|||||||||||
|
One-to-four family residential
|
|
|
|
|
|
|
|
|
|
|
|
|
|||||||||||
|
LTV < 60%
|
|
|
|
|
|
|
|
|
|
|
|
|
|||||||||||
|
Substandard
|
—
|
|
206
|
|
328
|
|
534
|
|
—
|
|
534
|
|
|||||||||||
|
LTV => 60%
|
|
|
|
|
|
|
|
|
|
|
|
|
|||||||||||
|
Substandard
|
—
|
|
—
|
|
39
|
|
39
|
|
—
|
|
39
|
|
|||||||||||
|
Total one-to-four family residential
|
—
|
|
206
|
|
367
|
|
573
|
|
—
|
|
573
|
|
|||||||||||
|
Home equity and lines of credit
|
|
|
|
|
|
|
|
|
|
|
|
|
|||||||||||
|
Substandard
|
79
|
|
—
|
|
—
|
|
79
|
|
—
|
|
79
|
|
|||||||||||
|
Total home equity and lines of credit
|
79
|
|
—
|
|
—
|
|
79
|
|
—
|
|
79
|
|
|||||||||||
|
Commercial and industrial loans
|
|
|
|
|
|
|
|
|
|
|
|
|
|||||||||||
|
Substandard
|
—
|
|
—
|
|
72
|
|
72
|
|
—
|
|
72
|
|
|||||||||||
|
Total commercial and industrial loans
|
—
|
|
—
|
|
72
|
|
72
|
|
—
|
|
72
|
|
|||||||||||
|
Total non-performing loans held-for-investment
|
511
|
|
520
|
|
2,744
|
|
3,775
|
|
—
|
|
3,775
|
|
|||||||||||
|
Loans acquired:
|
|||||||||||||||||||||||
|
Real Estate Loans:
|
|||||||||||||||||||||||
|
Commercial
|
|||||||||||||||||||||||
|
LTV < 35%
|
|||||||||||||||||||||||
|
Substandard
|
—
|
|
—
|
|
205
|
|
205
|
|
—
|
|
205
|
|
|||||||||||
|
LTV => 35%
|
|||||||||||||||||||||||
|
Substandard
|
—
|
|
773
|
|
58
|
|
831
|
|
—
|
|
831
|
|
|||||||||||
|
Total Commercial
|
—
|
|
773
|
|
263
|
|
1,036
|
|
—
|
|
1,036
|
|
|||||||||||
|
One-to-four family residential
|
|||||||||||||||||||||||
|
LTV < 60%
|
|||||||||||||||||||||||
|
Substandard
|
—
|
|
201
|
|
—
|
|
201
|
|
27
|
|
228
|
|
|||||||||||
|
Total one-to-four family residential
|
—
|
|
201
|
|
—
|
|
201
|
|
27
|
|
228
|
|
|||||||||||
|
Multifamily
|
|||||||||||||||||||||||
|
LTV => 35%
|
|||||||||||||||||||||||
|
Substandard
|
—
|
|
417
|
|
—
|
|
417
|
|
—
|
|
417
|
|
|||||||||||
|
Total Multifamily
|
—
|
|
417
|
|
—
|
|
417
|
|
—
|
|
417
|
|
|||||||||||
|
Home equity and lines of credit
|
|||||||||||||||||||||||
|
Substandard
|
—
|
|
28
|
|
49
|
|
77
|
|
—
|
|
77
|
|
|||||||||||
|
Total home equity and lines of credit
|
—
|
|
28
|
|
49
|
|
77
|
|
—
|
|
77
|
|
|||||||||||
|
Commercial and industrial
|
—
|
|
—
|
|
2
|
|
2
|
|
—
|
|
2
|
|
|||||||||||
|
Substandard
|
|||||||||||||||||||||||
|
Total commercial and industrial loans
|
—
|
|
—
|
|
2
|
|
2
|
|
—
|
|
2
|
|
|||||||||||
|
Other loans
|
|||||||||||||||||||||||
|
Pass
|
—
|
|
—
|
|
—
|
|
—
|
|
1
|
|
1
|
|
|||||||||||
|
Total other
|
—
|
|
—
|
|
—
|
|
—
|
|
1
|
|
1
|
|
|||||||||||
|
Total non-performing loans acquired
|
—
|
|
1,419
|
|
314
|
|
1,733
|
|
28
|
|
1,761
|
|
|||||||||||
|
Total non-performing loans
|
$
|
511
|
|
$
|
1,939
|
|
$
|
3,058
|
|
$
|
5,508
|
|
$
|
28
|
|
$
|
5,536
|
|
|||||
95
NORTHFIELD BANCORP, INC. AND SUBSIDIARIES
Notes to Consolidated Financial Statements - (Continued)
|
|
At December 31, 2016
|
||||||||||||||||||||||
|
|
Total Non-Performing Loans
|
||||||||||||||||||||||
|
|
Non-Accruing Loans
|
||||||||||||||||||||||
|
|
0-29 Days Past Due
|
30-89 Days Past Due
|
90 Days or More Past Due
|
Total
|
90 Days or More Past Due and Accruing
|
Total Non-Performing Loans
|
|||||||||||||||||
|
Loans held-for-investment:
|
|
|
|
|
|
|
|||||||||||||||||
|
Real estate loans:
|
|
|
|
|
|
|
|||||||||||||||||
|
Commercial
|
|
|
|
|
|
|
|
|
|
|
|
|
|||||||||||
|
LTV => 35%
|
|
|
|
|
|
|
|
|
|
|
|
|
|||||||||||
|
Substandard
|
$
|
341
|
|
$
|
—
|
|
$
|
4,882
|
|
$
|
5,223
|
|
$
|
—
|
|
$
|
5,223
|
|
|||||
|
Total commercial
|
341
|
|
—
|
|
4,882
|
|
5,223
|
|
—
|
|
5,223
|
|
|||||||||||
|
One-to-four family residential
|
|
|
|
|
|
|
|
|
|
|
|
|
|||||||||||
|
LTV < 60%
|
|
|
|
|
|
|
|
|
|
|
|
|
|||||||||||
|
Special Mention
|
—
|
|
—
|
|
—
|
|
—
|
|
|
|
—
|
|
|||||||||||
|
Substandard
|
384
|
|
383
|
|
442
|
|
1,209
|
|
9
|
|
1,218
|
|
|||||||||||
|
Total
|
384
|
|
383
|
|
442
|
|
1,209
|
|
9
|
|
1,218
|
|
|||||||||||
|
LTV => 60%
|
|
|
|
|
|
|
|
|
|
|
|
|
|||||||||||
|
Substandard
|
—
|
|
—
|
|
—
|
|
—
|
|
43
|
|
43
|
|
|||||||||||
|
Total
|
—
|
|
—
|
|
—
|
|
—
|
|
43
|
|
43
|
|
|||||||||||
|
Total one-to-four family residential
|
384
|
|
383
|
|
442
|
|
1,209
|
|
52
|
|
1,261
|
|
|||||||||||
|
Multifamily
|
|
|
|
|
|
|
|
|
|
|
|
|
|||||||||||
|
LTV < 35%
|
|
|
|
|
|
|
|
|
|
|
|
|
|||||||||||
|
Substandard
|
40
|
|
—
|
|
—
|
|
40
|
|
—
|
|
40
|
|
|||||||||||
|
LTV => 35%
|
|||||||||||||||||||||||
|
Substandard
|
—
|
|
—
|
|
3
|
|
3
|
|
—
|
|
3
|
|
|||||||||||
|
Total multifamily
|
40
|
|
—
|
|
3
|
|
43
|
|
—
|
|
43
|
|
|||||||||||
|
Home equity and lines of credit
|
|
|
|
|
|
|
|
|
|
|
|
|
|||||||||||
|
Substandard
|
—
|
|
96
|
|
—
|
|
96
|
|
—
|
|
96
|
|
|||||||||||
|
Total home equity and lines of credit
|
—
|
|
96
|
|
—
|
|
96
|
|
—
|
|
96
|
|
|||||||||||
|
Total non-performing loans held-for-investment
|
765
|
|
479
|
|
5,327
|
|
6,571
|
|
52
|
|
6,623
|
|
|||||||||||
|
Loans acquired:
|
|
|
|
|
|
|
|
|
|
|
|
|
|||||||||||
|
Real estate loans:
|
|||||||||||||||||||||||
|
Commercial
|
|||||||||||||||||||||||
|
LTV < 35%
|
|||||||||||||||||||||||
|
Substandard
|
—
|
|
—
|
|
231
|
|
231
|
|
—
|
|
231
|
|
|||||||||||
|
LTV => 35%
|
|||||||||||||||||||||||
|
Substandard
|
—
|
|
—
|
|
59
|
|
59
|
|
—
|
|
59
|
|
|||||||||||
|
Total commercial
|
—
|
|
—
|
|
290
|
|
290
|
|
—
|
|
290
|
|
|||||||||||
|
One-to-four family residential
|
|
|
|
|
|
|
|
|
|
|
|
|
|||||||||||
|
LTV < 60%
|
|
|
|
|
|
|
|
|
|
|
|
|
|||||||||||
|
Substandard
|
420
|
|
—
|
|
—
|
|
420
|
|
—
|
|
420
|
|
|||||||||||
|
Total one-to-four family residential
|
420
|
|
—
|
|
—
|
|
420
|
|
—
|
|
420
|
|
|||||||||||
|
Home equity and lines of credit
|
|||||||||||||||||||||||
|
Substandard
|
—
|
|
—
|
|
31
|
|
31
|
|
8
|
|
39
|
|
|||||||||||
|
Total home equity and lines of credit
|
—
|
|
—
|
|
|
31
|
|
31
|
|
8
|
|
39
|
|
||||||||||
|
Commercial and industrial
|
|||||||||||||||||||||||
|
Substandard
|
—
|
|
—
|
|
9
|
|
9
|
|
—
|
|
9
|
|
|||||||||||
|
Total commercial and industrial loans
|
—
|
|
—
|
|
9
|
|
9
|
|
—
|
|
9
|
|
|||||||||||
|
Total non-performing loans acquired
|
420
|
|
—
|
|
330
|
|
750
|
|
8
|
|
758
|
|
|||||||||||
|
Total non-performing loans
|
$
|
1,185
|
|
$
|
479
|
|
$
|
5,657
|
|
$
|
7,321
|
|
$
|
60
|
|
$
|
7,381
|
|
|||||
96
NORTHFIELD BANCORP, INC. AND SUBSIDIARIES
Notes to Consolidated Financial Statements - (Continued)
The following table sets forth the detail and delinquency status of originated and acquired loans, net of deferred fees and costs, by performing and non-performing loans at
December 31, 2017
and
2016
(in thousands):
|
|
December 31, 2017
|
||||||||||||||||||
|
|
Performing (Accruing) Loans
|
|
|
||||||||||||||||
|
|
0-29 Days Past Due
|
30-89 Days Past Due
|
Total
|
Non-Performing Loans
|
Total Loans Receivable, net
|
||||||||||||||
|
Loans held-for-investment:
|
|
|
|
|
|
||||||||||||||
|
Real estate loans:
|
|
|
|
|
|
||||||||||||||
|
Commercial
|
|
|
|
|
|
|
|
|
|||||||||||
|
LTV < 35%
|
|
|
|
|
|
|
|
|
|||||||||||
|
Pass
|
$
|
84,620
|
|
$
|
—
|
|
$
|
84,620
|
|
$
|
—
|
|
$
|
84,620
|
|
||||
|
Special Mention
|
—
|
|
410
|
|
410
|
|
—
|
|
410
|
|
|||||||||
|
Total
|
84,620
|
|
410
|
|
85,030
|
|
—
|
|
85,030
|
|
|||||||||
|
LTV => 35%
|
|
|
|
|
|
|
|
|
|
|
|||||||||
|
Pass
|
346,229
|
|
628
|
|
346,857
|
|
—
|
|
346,857
|
|
|||||||||
|
Special Mention
|
832
|
|
1,338
|
|
2,170
|
|
—
|
|
2,170
|
|
|||||||||
|
Substandard
|
7,675
|
|
998
|
|
8,673
|
|
3,051
|
|
11,724
|
|
|||||||||
|
Total
|
354,736
|
|
2,964
|
|
357,700
|
|
3,051
|
|
360,751
|
|
|||||||||
|
Total commercial
|
439,356
|
|
3,374
|
|
442,730
|
|
3,051
|
|
445,781
|
|
|||||||||
|
One-to-four family residential
|
|
|
|
|
|
|
|
|
|
|
|||||||||
|
LTV < 60%
|
|
|
|
|
|
|
|
|
|
|
|||||||||
|
Pass
|
57,907
|
|
2,493
|
|
60,400
|
|
—
|
|
60,400
|
|
|||||||||
|
Special Mention
|
—
|
|
683
|
|
683
|
|
—
|
|
683
|
|
|||||||||
|
Substandard
|
322
|
|
614
|
|
936
|
|
534
|
|
1,470
|
|
|||||||||
|
Total
|
58,229
|
|
3,790
|
|
62,019
|
|
534
|
|
62,553
|
|
|||||||||
|
LTV => 60%
|
|
|
|
|
|
|
|
|
|
|
|||||||||
|
Pass
|
38,504
|
|
—
|
|
38,504
|
|
—
|
|
38,504
|
|
|||||||||
|
Substandard
|
554
|
|
—
|
|
554
|
|
39
|
|
593
|
|
|||||||||
|
Total
|
39,058
|
|
—
|
|
39,058
|
|
39
|
|
39,097
|
|
|||||||||
|
Total one-to-four family residential
|
97,287
|
|
3,790
|
|
101,077
|
|
573
|
|
101,650
|
|
|||||||||
|
Construction and land
|
|
|
|
|
|
|
|
|
|
|
|||||||||
|
Pass
|
34,614
|
|
6
|
|
34,620
|
|
—
|
|
34,620
|
|
|||||||||
|
Total construction and land
|
34,614
|
|
6
|
|
34,620
|
|
—
|
|
34,620
|
|
|||||||||
|
Multifamily
|
|
|
|
|
|
|
|
|
|
|
|||||||||
|
LTV < 35%
|
|
|
|
|
|
|
|
|
|
|
|||||||||
|
Pass
|
131,488
|
|
304
|
|
131,792
|
|
—
|
|
131,792
|
|
|||||||||
|
Total
|
131,488
|
|
304
|
|
131,792
|
|
—
|
|
131,792
|
|
|||||||||
|
LTV= > 35%
|
|
|
|
|
|
|
|
|
|
|
|||||||||
|
Pass
|
1,603,714
|
|
233
|
|
1,603,947
|
|
—
|
|
1,603,947
|
|
|||||||||
|
Special Mention
|
638
|
|
1,259
|
|
1,897
|
|
—
|
|
1,897
|
|
|||||||||
|
Substandard
|
83
|
|
1,501
|
|
1,584
|
|
—
|
|
1,584
|
|
|||||||||
|
Total
|
1,604,435
|
|
2,993
|
|
1,607,428
|
|
—
|
|
1,607,428
|
|
|||||||||
|
Total multifamily
|
1,735,923
|
|
3,297
|
|
1,739,220
|
|
—
|
|
1,739,220
|
|
|||||||||
|
Home equity and lines of credit
|
|
|
|
|
|
|
|
|
|
|
|||||||||
|
Pass
|
67,426
|
|
—
|
|
67,426
|
|
—
|
|
67,426
|
|
|||||||||
|
Special Mention
|
28
|
|
—
|
|
28
|
|
—
|
|
28
|
|
|||||||||
|
Substandard
|
146
|
|
—
|
|
146
|
|
79
|
|
225
|
|
|||||||||
|
Total home equity and lines of credit
|
67,600
|
|
—
|
|
67,600
|
|
79
|
|
67,679
|
|
|||||||||
|
Commercial and industrial loans
|
|
|
|
|
|
|
|
|
|
|
|||||||||
|
Pass
|
34,003
|
|
138
|
|
34,141
|
|
—
|
|
34,141
|
|
|||||||||
|
Special Mention
|
547
|
|
24
|
|
571
|
|
—
|
|
571
|
|
|||||||||
|
Substandard
|
109
|
|
—
|
|
109
|
|
72
|
|
181
|
|
|||||||||
|
Total commercial and industrial loans
|
34,659
|
|
162
|
|
34,821
|
|
72
|
|
34,893
|
|
|||||||||
|
Other loans
|
|
|
|
|
|
|
|
|
|
|
|||||||||
|
Pass
|
1,403
|
|
29
|
|
1,432
|
|
—
|
|
1,432
|
|
|||||||||
|
Total other loans
|
1,403
|
|
29
|
|
1,432
|
|
—
|
|
1,432
|
|
|||||||||
97
NORTHFIELD BANCORP, INC. AND SUBSIDIARIES
Notes to Consolidated Financial Statements - (Continued)
|
|
December 31, 2017
|
||||||||||||||||||
|
|
Performing (Accruing) Loans
|
|
|
||||||||||||||||
|
|
0-29 Days Past Due
|
30-89 Days Past Due
|
Total
|
Non-Performing Loans
|
Total Loans Receivable, net
|
||||||||||||||
|
Total originated loans held-for-investment
|
2,410,842
|
|
10,658
|
|
2,421,500
|
|
3,775
|
|
2,425,275
|
|
|||||||||
|
Acquired loans:
|
|||||||||||||||||||
|
One-to-four family residential
|
|||||||||||||||||||
|
LTV < 60%
|
|||||||||||||||||||
|
Pass
|
250,149
|
|
224
|
|
250,373
|
|
—
|
|
250,373
|
|
|||||||||
|
Special Mention
|
455
|
|
—
|
|
455
|
|
—
|
|
455
|
|
|||||||||
|
Substandard
|
417
|
|
150
|
|
567
|
|
228
|
|
795
|
|
|||||||||
|
Total
|
251,021
|
|
374
|
|
251,395
|
|
228
|
|
251,623
|
|
|||||||||
|
LTV => 60%
|
|
|
|
|
|
|
|
|
|
|
|||||||||
|
Pass
|
23,295
|
|
—
|
|
23,295
|
|
—
|
|
23,295
|
|
|||||||||
|
Substandard
|
135
|
|
—
|
|
135
|
|
—
|
|
135
|
|
|||||||||
|
Total
|
23,430
|
|
—
|
|
23,430
|
|
—
|
|
23,430
|
|
|||||||||
|
Total one-to-four family residential
|
274,451
|
|
374
|
|
274,825
|
|
228
|
|
275,053
|
|
|||||||||
|
Commercial
|
|
|
|
|
|
|
|
|
|||||||||||
|
LTV < 35%
|
|
|
|
|
|
|
|
|
|||||||||||
|
Pass
|
50,035
|
|
70
|
|
50,105
|
|
—
|
|
50,105
|
|
|||||||||
|
Special Mention
|
91
|
|
—
|
|
91
|
|
—
|
|
91
|
|
|||||||||
|
Substandard
|
—
|
|
181
|
|
181
|
|
205
|
|
386
|
|
|||||||||
|
Total
|
50,126
|
|
251
|
|
50,377
|
|
205
|
|
50,582
|
|
|||||||||
|
LTV => 35%
|
|
|
|
|
|
|
|
|
|
|
|||||||||
|
Pass
|
108,125
|
|
158
|
|
108,283
|
|
—
|
|
108,283
|
|
|||||||||
|
Special Mention
|
—
|
|
133
|
|
133
|
|
—
|
|
133
|
|
|||||||||
|
Substandard
|
3,703
|
|
430
|
|
4,133
|
|
831
|
|
4,964
|
|
|||||||||
|
Total
|
111,828
|
|
721
|
|
112,549
|
|
831
|
|
113,380
|
|
|||||||||
|
Total commercial
|
161,954
|
|
972
|
|
162,926
|
|
1,036
|
|
163,962
|
|
|||||||||
|
Construction and land
|
|
|
|
|
|
|
|
|
|
|
|||||||||
|
Pass
|
17,201
|
|
—
|
|
17,201
|
|
—
|
|
17,201
|
|
|||||||||
|
Total construction and land
|
17,201
|
|
—
|
|
17,201
|
|
—
|
|
17,201
|
|
|||||||||
|
Multifamily
|
|
|
|
|
|
|
|
|
|
|
|||||||||
|
LTV < 35%
|
|
|
|
|
|
|
|
|
|||||||||||
|
Pass
|
189,551
|
|
—
|
|
189,551
|
|
—
|
|
189,551
|
|
|||||||||
|
Special Mention
|
78
|
|
—
|
|
78
|
|
—
|
|
78
|
|
|||||||||
|
Substandard
|
153
|
|
—
|
|
153
|
|
—
|
|
153
|
|
|||||||||
|
Total
|
189,782
|
|
—
|
|
189,782
|
|
—
|
|
189,782
|
|
|||||||||
|
LTV => 35%
|
|
|
|
|
|
|
|
|
|
|
|||||||||
|
Pass
|
8,950
|
|
—
|
|
8,950
|
|
—
|
|
8,950
|
|
|||||||||
|
Substandard
|
—
|
|
—
|
|
—
|
|
417
|
|
417
|
|
|||||||||
|
Total
|
8,950
|
|
—
|
|
8,950
|
|
417
|
|
9,367
|
|
|||||||||
|
Total multifamily
|
198,732
|
|
—
|
|
198,732
|
|
417
|
|
199,149
|
|
|||||||||
|
Home equity and lines of credit
|
|||||||||||||||||||
|
Pass
|
20,291
|
|
—
|
|
20,291
|
|
—
|
|
20,291
|
|
|||||||||
|
Substandard
|
87
|
|
—
|
|
87
|
|
77
|
|
164
|
|
|||||||||
|
Total home equity and lines of credit
|
20,378
|
|
—
|
|
20,378
|
|
77
|
|
20,455
|
|
|||||||||
|
Commercial and industrial
|
|||||||||||||||||||
|
Pass
|
16,904
|
|
40
|
|
16,944
|
|
—
|
|
16,944
|
|
|||||||||
|
Substandard
|
—
|
|
—
|
|
—
|
|
2
|
|
2
|
|
|||||||||
|
Total commercial and industrial
|
16,904
|
|
40
|
|
16,944
|
|
2
|
|
16,946
|
|
|||||||||
|
Other
|
36
|
|
—
|
|
36
|
|
1
|
|
37
|
|
|||||||||
|
Total loans acquired
|
689,656
|
|
1,386
|
|
691,042
|
|
1,761
|
|
692,803
|
|
|||||||||
|
$
|
3,100,498
|
|
$
|
12,044
|
|
$
|
3,112,542
|
|
$
|
5,536
|
|
$
|
3,118,078
|
|
|||||
98
NORTHFIELD BANCORP, INC. AND SUBSIDIARIES
Notes to Consolidated Financial Statements - (Continued)
|
|
December 31, 2016
|
||||||||||||||||||
|
|
Performing (Accruing) Loans
|
|
|
||||||||||||||||
|
|
0-29 Days Past Due
|
30-89 Days Past Due
|
Total
|
Non-Performing Loans
|
Total Loans Receivable, net
|
||||||||||||||
|
Loans held-for-investment:
|
|
|
|
|
|
||||||||||||||
|
Real estate loans:
|
|
|
|
|
|
||||||||||||||
|
Commercial
|
|
|
|
|
|
|
|
|
|||||||||||
|
LTV < 35%
|
|
|
|
|
|
|
|
|
|||||||||||
|
Pass
|
$
|
65,189
|
|
$
|
423
|
|
$
|
65,612
|
|
$
|
—
|
|
$
|
65,612
|
|
||||
|
Substandard
|
1,179
|
|
—
|
|
1,179
|
|
—
|
|
1,179
|
|
|||||||||
|
Total
|
66,368
|
|
423
|
|
66,791
|
|
—
|
|
66,791
|
|
|||||||||
|
LTV => 35%
|
|
|
|
|
|
|
|
|
|
|
|||||||||
|
Pass
|
322,307
|
|
1,535
|
|
323,842
|
|
—
|
|
323,842
|
|
|||||||||
|
Special Mention
|
3,852
|
|
—
|
|
3,852
|
|
—
|
|
3,852
|
|
|||||||||
|
Substandard
|
12,600
|
|
1,044
|
|
13,644
|
|
5,223
|
|
18,867
|
|
|||||||||
|
Total
|
338,759
|
|
2,579
|
|
341,338
|
|
5,223
|
|
346,561
|
|
|||||||||
|
Total commercial
|
405,127
|
|
3,002
|
|
408,129
|
|
5,223
|
|
413,352
|
|
|||||||||
|
One-to-four family residential
|
|
|
|
|
|
|
|
|
|
|
|||||||||
|
LTV < 60%
|
|
|
|
|
|
|
|
|
|
|
|||||||||
|
Pass
|
56,787
|
|
2,427
|
|
59,214
|
|
—
|
|
59,214
|
|
|||||||||
|
Special Mention
|
—
|
|
705
|
|
705
|
|
—
|
|
705
|
|
|||||||||
|
Substandard
|
589
|
|
—
|
|
589
|
|
1,218
|
|
1,807
|
|
|||||||||
|
Total
|
57,376
|
|
3,132
|
|
60,508
|
|
1,218
|
|
61,726
|
|
|||||||||
|
LTV => 60%
|
|
|
|
|
|
|
|
|
|
|
|||||||||
|
Pass
|
43,316
|
|
—
|
|
43,316
|
|
—
|
|
43,316
|
|
|||||||||
|
Substandard
|
1,439
|
|
—
|
|
1,439
|
|
43
|
|
1,482
|
|
|||||||||
|
Total
|
44,755
|
|
—
|
|
44,755
|
|
43
|
|
44,798
|
|
|||||||||
|
Total one-to-four family residential
|
102,131
|
|
3,132
|
|
105,263
|
|
1,261
|
|
106,524
|
|
|||||||||
|
Construction and land
|
|
|
|
|
|
|
|
|
|
|
|||||||||
|
Pass
|
14,092
|
|
—
|
|
14,092
|
|
—
|
|
14,092
|
|
|||||||||
|
Total construction and land
|
14,092
|
|
—
|
|
14,092
|
|
—
|
|
14,092
|
|
|||||||||
|
Multifamily
|
|
|
|
|
|
|
|
|
|
|
|||||||||
|
LTV < 35%
|
|
|
|
|
|
|
|
|
|
|
|||||||||
|
Pass
|
122,525
|
|
—
|
|
122,525
|
|
—
|
|
122,525
|
|
|||||||||
|
Special Mention
|
25
|
|
—
|
|
25
|
|
—
|
|
25
|
|
|||||||||
|
Substandard
|
—
|
|
—
|
|
—
|
|
40
|
|
40
|
|
|||||||||
|
Total
|
122,550
|
|
—
|
|
122,550
|
|
40
|
|
122,590
|
|
|||||||||
|
LTV => 35%
|
|
|
|
|
|
|
|
|
|
|
|||||||||
|
Pass
|
1,380,331
|
|
900
|
|
1,381,231
|
|
—
|
|
1,381,231
|
|
|||||||||
|
Special Mention
|
4,636
|
|
—
|
|
4,636
|
|
—
|
|
4,636
|
|
|||||||||
|
Substandard
|
1,640
|
|
—
|
|
1,640
|
|
3
|
|
1,643
|
|
|||||||||
|
Total
|
1,386,607
|
|
900
|
|
1,387,507
|
|
3
|
|
1,387,510
|
|
|||||||||
|
Total multifamily
|
1,509,157
|
|
900
|
|
1,510,057
|
|
43
|
|
1,510,100
|
|
|||||||||
|
Home equity and lines of credit
|
|
|
|
|
|
|
|
|
|
|
|||||||||
|
Pass
|
66,369
|
|
120
|
|
66,489
|
|
—
|
|
66,489
|
|
|||||||||
|
Special Mention
|
29
|
|
—
|
|
29
|
|
—
|
|
29
|
|
|||||||||
|
Substandard
|
153
|
|
—
|
|
153
|
|
96
|
|
249
|
|
|||||||||
|
Total home equity and lines of credit
|
66,551
|
|
120
|
|
66,671
|
|
96
|
|
66,767
|
|
|||||||||
|
Commercial and industrial loans
|
|
|
|
|
|
|
|
|
|
|
|||||||||
|
Pass
|
31,040
|
|
133
|
|
31,173
|
|
—
|
|
31,173
|
|
|||||||||
|
Special Mention
|
696
|
|
—
|
|
696
|
|
—
|
|
696
|
|
|||||||||
|
Substandard
|
144
|
|
—
|
|
144
|
|
—
|
|
144
|
|
|||||||||
|
Total Commercial and industrial loans
|
31,880
|
|
133
|
|
32,013
|
|
—
|
|
32,013
|
|
|||||||||
|
Other loans
|
|
|
|
|
|
|
|
|
|
|
|||||||||
|
Pass
|
1,452
|
|
46
|
|
1,498
|
|
—
|
|
1,498
|
|
|||||||||
|
Total other loans
|
1,452
|
|
46
|
|
1,498
|
|
—
|
|
1,498
|
|
|||||||||
|
Total originated loans held-for-investment
|
2,130,390
|
|
7,333
|
|
2,137,723
|
|
6,623
|
|
2,144,346
|
|
|||||||||
99
NORTHFIELD BANCORP, INC. AND SUBSIDIARIES
Notes to Consolidated Financial Statements - (Continued)
|
|
December 31, 2016
|
||||||||||||||||||
|
|
Performing (Accruing) Loans
|
|
|
||||||||||||||||
|
|
0-29 Days Past Due
|
30-89 Days Past Due
|
Total
|
Non-Performing Loans
|
Total Loans Receivable, net
|
||||||||||||||
|
Loans acquired:
|
|||||||||||||||||||
|
One-to-four family residential
|
|||||||||||||||||||
|
LTV < 60%
|
|
|
|
|
|
|
|
|
|
|
|||||||||
|
Pass
|
285,116
|
|
21
|
|
285,137
|
|
—
|
|
285,137
|
|
|||||||||
|
Special Mention
|
502
|
|
—
|
|
502
|
|
—
|
|
502
|
|
|||||||||
|
Substandard
|
654
|
|
261
|
|
915
|
|
420
|
|
1,335
|
|
|||||||||
|
Total
|
286,272
|
|
282
|
|
286,554
|
|
420
|
|
286,974
|
|
|||||||||
|
LTV => 60%
|
|
|
|
|
|
|
|
|
|
|
|||||||||
|
Pass
|
30,199
|
|
—
|
|
30,199
|
|
—
|
|
30,199
|
|
|||||||||
|
Substandard
|
259
|
|
207
|
|
466
|
|
—
|
|
466
|
|
|||||||||
|
Total
|
30,458
|
|
207
|
|
30,665
|
|
—
|
|
30,665
|
|
|||||||||
|
Total one-to-four family residential
|
316,730
|
|
489
|
|
317,219
|
|
420
|
|
317,639
|
|
|||||||||
|
Commercial
|
|
|
|
|
|
|
|
|
|||||||||||
|
LTV < 35%
|
|
|
|
|
|
|
|
|
|||||||||||
|
Pass
|
61,646
|
|
7
|
|
61,653
|
|
—
|
|
61,653
|
|
|||||||||
|
Special Mention
|
286
|
|
—
|
|
286
|
|
—
|
|
286
|
|
|||||||||
|
Substandard
|
406
|
|
1,040
|
|
1,446
|
|
231
|
|
1,677
|
|
|||||||||
|
Total
|
62,338
|
|
1,047
|
|
63,385
|
|
231
|
|
63,616
|
|
|||||||||
|
LTV => 35%
|
|
|
|
|
|
|
|
|
|
|
|||||||||
|
Pass
|
119,932
|
|
132
|
|
120,064
|
|
—
|
|
120,064
|
|
|||||||||
|
Special Mention
|
446
|
|
138
|
|
584
|
|
—
|
|
584
|
|
|||||||||
|
Substandard
|
3,419
|
|
259
|
|
3,678
|
|
59
|
|
3,737
|
|
|||||||||
|
Total
|
123,797
|
|
529
|
|
124,326
|
|
59
|
|
124,385
|
|
|||||||||
|
Total commercial
|
186,135
|
|
1,576
|
|
187,711
|
|
290
|
|
188,001
|
|
|||||||||
|
Construction and land
|
|
|
|
|
|
|
|
|
|
|
|||||||||
|
Substandard
|
20,887
|
|
—
|
|
20,887
|
|
—
|
|
20,887
|
|
|||||||||
|
Total construction and land
|
20,887
|
|
—
|
|
20,887
|
|
—
|
|
20,887
|
|
|||||||||
|
Multifamily
|
|
|
|
|
|
|
|
|
|
|
|||||||||
|
LTV < 35%
|
|
|
|
|
|
|
|
|
|||||||||||
|
Pass
|
205,025
|
|
—
|
|
205,025
|
|
—
|
|
205,025
|
|
|||||||||
|
Special Mention
|
99
|
|
111
|
|
210
|
|
—
|
|
210
|
|
|||||||||
|
Substandard
|
156
|
|
—
|
|
156
|
|
—
|
|
156
|
|
|||||||||
|
Total
|
205,280
|
|
111
|
|
205,391
|
|
—
|
|
205,391
|
|
|||||||||
|
LTV => 35%
|
|
|
|
|
|
|
|
|
|
|
|||||||||
|
Pass
|
9,569
|
|
—
|
|
9,569
|
|
—
|
|
9,569
|
|
|||||||||
|
Special Mention
|
—
|
|
429
|
|
429
|
|
—
|
|
429
|
|
|||||||||
|
Total
|
9,569
|
|
429
|
|
9,998
|
|
—
|
|
9,998
|
|
|||||||||
|
Total multifamily
|
214,849
|
|
540
|
|
215,389
|
|
—
|
|
215,389
|
|
|||||||||
|
Home equity and lines of credit
|
|||||||||||||||||||
|
Pass
|
25,340
|
|
45
|
|
25,385
|
|
—
|
|
25,385
|
|
|||||||||
|
Substandard
|
—
|
|
98
|
|
98
|
|
39
|
|
137
|
|
|||||||||
|
Total home equity and lines of credit
|
25,340
|
|
143
|
|
25,483
|
|
39
|
|
25,522
|
|
|||||||||
|
Commercial and industrial loans
|
|||||||||||||||||||
|
Pass
|
25,419
|
|
—
|
|
25,419
|
|
—
|
|
25,419
|
|
|||||||||
|
Substandard
|
—
|
|
15
|
|
15
|
|
9
|
|
24
|
|
|||||||||
|
Total Commercial and industrial loans
|
25,419
|
|
15
|
|
25,434
|
|
9
|
|
25,443
|
|
|||||||||
|
Other loans
|
|||||||||||||||||||
|
Pass
|
355
|
|
4
|
|
359
|
|
—
|
|
359
|
|
|||||||||
|
Total loans acquired
|
789,715
|
|
2,767
|
|
792,482
|
|
758
|
|
793,240
|
|
|||||||||
|
$
|
2,920,105
|
|
$
|
10,100
|
|
$
|
2,930,205
|
|
$
|
7,381
|
|
$
|
2,937,586
|
|
|||||
100
NORTHFIELD BANCORP, INC. AND SUBSIDIARIES
Notes to Consolidated Financial Statements - (Continued)
The following table summarizes originated and acquired (subsequent to acquisition) impaired loans as of
December 31, 2017
and
2016
(in thousands):
|
|
At December 31, 2017
|
December 31, 2016
|
|||||||||||||||||||||
|
|
Recorded Investment
|
Unpaid Principal Balance
|
Related Allowance
|
Recorded Investment
|
Unpaid Principal Balance
|
Related Allowance
|
|||||||||||||||||
|
With No Allowance Recorded:
|
|
|
|
||||||||||||||||||||
|
Real estate loans:
|
|
|
|
|
|
|
|||||||||||||||||
|
Commercial
|
|
|
|
|
|
|
|||||||||||||||||
|
LTV < 35%
|
|
|
|
|
|
|
|||||||||||||||||
|
Substandard
|
$
|
—
|
|
$
|
139
|
|
$
|
—
|
|
$
|
—
|
|
$
|
139
|
|
$
|
—
|
|
|||||
|
LTV => 35%
|
|
|
|
|
|
|
|||||||||||||||||
|
Pass
|
6,263
|
|
7,150
|
|
—
|
|
3,911
|
|
4,047
|
|
—
|
|
|||||||||||
|
Substandard
|
9,745
|
|
10,560
|
|
—
|
|
14,780
|
|
16,868
|
|
—
|
|
|||||||||||
|
One-to-four family residential
|
|
|
|
|
|
|
|||||||||||||||||
|
LTV < 60%
|
|
|
|
|
|
|
|||||||||||||||||
|
Pass
|
1,189
|
|
1,254
|
|
—
|
|
633
|
|
633
|
|
—
|
|
|||||||||||
|
Substandard
|
251
|
|
251
|
|
—
|
|
184
|
|
184
|
|
—
|
|
|||||||||||
|
LTV => 60%
|
|
|
|
|
|
|
|||||||||||||||||
|
Pass
|
136
|
|
161
|
|
—
|
|
—
|
|
—
|
|
—
|
|
|||||||||||
|
Substandard
|
135
|
|
286
|
|
—
|
|
620
|
|
848
|
|
—
|
|
|||||||||||
|
Multifamily
|
|
|
|
|
|
|
|||||||||||||||||
|
LTV < 35%
|
|||||||||||||||||||||||
|
Substandard
|
153
|
|
153
|
|
—
|
|
156
|
|
156
|
|
—
|
|
|||||||||||
|
LTV => 35%
|
|
|
|
|
|
|
|||||||||||||||||
|
Pass
|
1,309
|
|
1,780
|
|
—
|
|
63
|
|
534
|
|
—
|
|
|||||||||||
|
Home Equity
|
|||||||||||||||||||||||
|
Pass
|
33
|
|
33
|
|
—
|
|
39
|
|
39
|
|
—
|
|
|||||||||||
|
Commercial and industrial loans
|
|
|
|
|
|
|
|
|
|
|
|
|
|||||||||||
|
Substandard
|
135
|
|
135
|
|
—
|
|
75
|
|
75
|
|
—
|
|
|||||||||||
|
With a Related Allowance Recorded:
|
|
|
|
|
|
|
|||||||||||||||||
|
Real estate loans:
|
|
|
|
|
|
|
|||||||||||||||||
|
Commercial
|
|
|
|
|
|
|
|||||||||||||||||
|
LTV => 35%
|
|
|
|
|
|
|
|||||||||||||||||
|
Substandard
|
—
|
|
—
|
|
—
|
|
2,019
|
|
2,019
|
|
(64
|
)
|
|||||||||||
|
One-to-four family residential
|
|
|
|
|
|
|
|||||||||||||||||
|
LTV < 60%
|
|||||||||||||||||||||||
|
Pass
|
411
|
|
411
|
|
(7
|
)
|
—
|
|
—
|
|
—
|
|
|||||||||||
|
Special Mention
|
—
|
|
—
|
|
—
|
|
—
|
|
—
|
|
—
|
|
|||||||||||
|
Substandard
|
997
|
|
997
|
|
(49
|
)
|
1,522
|
|
1,522
|
|
(97
|
)
|
|||||||||||
|
LTV => 60%
|
|
|
|
|
|
|
|||||||||||||||||
|
Pass
|
268
|
|
268
|
|
(19
|
)
|
275
|
|
275
|
|
(3
|
)
|
|||||||||||
|
Substandard
|
—
|
|
—
|
|
—
|
|
381
|
|
381
|
|
(41
|
)
|
|||||||||||
|
Multifamily
|
|
|
|
|
|
|
|||||||||||||||||
|
LTV => 35%
|
|
|
|
|
|||||||||||||||||||
|
Pass
|
—
|
|
—
|
|
—
|
|
1,309
|
|
1,309
|
|
(95
|
)
|
|||||||||||
|
Home equity and lines of credit
|
|
|
|
|
|
|
|||||||||||||||||
|
Pass
|
—
|
|
—
|
|
—
|
|
258
|
|
258
|
|
(5
|
)
|
|||||||||||
|
Substandard
|
36
|
|
36
|
|
(4
|
)
|
39
|
|
39
|
|
(18
|
)
|
|||||||||||
|
Commercial and industrial loans
|
|
|
|
|
|
|
|||||||||||||||||
|
Special Mention
|
24
|
|
24
|
|
(3
|
)
|
26
|
|
26
|
|
(5
|
)
|
|||||||||||
|
Total:
|
|
|
|
|
|
|
|||||||||||||||||
|
Real estate loans:
|
|
|
|
|
|
|
|||||||||||||||||
|
Commercial
|
16,008
|
|
17,849
|
|
—
|
|
20,710
|
|
23,073
|
|
(64
|
)
|
|||||||||||
|
One-to-four family residential
|
3,387
|
|
3,628
|
|
(75
|
)
|
3,615
|
|
3,843
|
|
(141
|
)
|
|||||||||||
|
Construction and land
|
—
|
|
—
|
|
—
|
|
—
|
|
—
|
|
—
|
|
|||||||||||
|
Multifamily
|
1,462
|
|
1,933
|
|
—
|
|
1,528
|
|
1,999
|
|
(95
|
)
|
|||||||||||
|
Home equity and lines of credit
|
69
|
|
69
|
|
(4
|
)
|
336
|
|
336
|
|
(23
|
)
|
|||||||||||
|
Commercial and industrial loans
|
159
|
|
$
|
159
|
|
(3
|
)
|
101
|
|
101
|
|
(5
|
)
|
||||||||||
|
|
$
|
21,085
|
|
$
|
23,638
|
|
$
|
(82
|
)
|
$
|
26,290
|
|
$
|
29,352
|
|
$
|
(328
|
)
|
|||||
101
NORTHFIELD BANCORP, INC. AND SUBSIDIARIES
Notes to Consolidated Financial Statements - (Continued)
Included in the table above at
December 31, 2017
, are impaired loans with carrying balances of
$14.5 million
that were not written down by charge-offs or for which there are no specific reserves in our allowance for loan losses. Included in the impaired loans at
December 31, 2016
, are loans with carrying balances of
$11.5 million
that were not written down by charge-offs or for which there are no specific reserves in our allowance for loan losses. Loans not written down by charge-offs or specific reserves at
December 31, 2017
and
2016
, have sufficient collateral values, less costs to sell (including any discounts to facilitate a sale), or sufficient future cash flows to support the carrying balances of the loans.
The following table summarizes the average recorded investment in originated and acquired impaired loans (excluding PCI loans) and interest recognized on impaired loans as of, and for, the years ended
December 31, 2017
, and
December 31, 2016
(in thousands):
|
|
December 31, 2017
|
December 31, 2016
|
|||||||||||||
|
|
Average Recorded Investment
|
Interest Income
|
Average Recorded Investment
|
Interest Income
|
|||||||||||
|
With No Allowance Recorded:
|
|
|
|||||||||||||
|
Real estate loans:
|
|
|
|
|
|||||||||||
|
Commercial
|
|
|
|
|
|||||||||||
|
LTV < 35%
|
|
|
|
|
|||||||||||
|
Substandard
|
$
|
—
|
|
$
|
45
|
|
$
|
—
|
|
$
|
39
|
|
|||
|
LTV => 35%
|
|||||||||||||||
|
Pass
|
5,516
|
|
334
|
|
3,980
|
|
192
|
|
|||||||
|
Special Mention
|
—
|
|
—
|
|
—
|
|
—
|
|
|||||||
|
Substandard
|
12,402
|
|
431
|
|
13,853
|
|
450
|
|
|||||||
|
One-to-four family residential
|
|||||||||||||||
|
LTV < 60%
|
|||||||||||||||
|
Pass
|
854
|
|
56
|
|
559
|
|
31
|
|
|||||||
|
Substandard
|
372
|
|
14
|
|
213
|
|
21
|
|
|||||||
|
One-to-four family residential
|
|||||||||||||||
|
LTV => 60%
|
|||||||||||||||
|
Pass
|
55
|
|
4
|
|
—
|
|
—
|
|
|||||||
|
Substandard
|
289
|
|
13
|
|
339
|
|
26
|
|
|||||||
|
Multifamily
|
|||||||||||||||
|
LTV < 35%
|
|||||||||||||||
|
Substandard
|
154
|
|
6
|
|
62
|
|
6
|
|
|||||||
|
LTV => 35%
|
|||||||||||||||
|
Pass
|
563
|
|
56
|
|
69
|
|
17
|
|
|||||||
|
Substandard
|
—
|
|
—
|
|
582
|
|
—
|
|
|||||||
|
Home equity and lines of credit
|
|||||||||||||||
|
Pass
|
36
|
|
2
|
|
8
|
|
3
|
|
|||||||
|
Commercial and industrial loans
|
|||||||||||||||
|
Substandard
|
127
|
|
—
|
|
81
|
|
—
|
|
|||||||
|
With a Related Allowance Recorded:
|
|||||||||||||||
|
Real estate loans:
|
|||||||||||||||
|
Commercial
|
|||||||||||||||
|
LTV => 35%
|
|||||||||||||||
|
Substandard
|
404
|
|
—
|
|
5,800
|
|
62
|
|
|||||||
|
One-to-four family residential
|
|||||||||||||||
|
LTV < 60%
|
|||||||||||||||
|
Pass
|
165
|
|
7
|
|
137
|
|
—
|
|
|||||||
|
Special Mention
|
—
|
|
—
|
|
—
|
|
—
|
|
|||||||
|
Substandard
|
1,264
|
|
20
|
|
1,575
|
|
26
|
|
|||||||
|
LTV => 60%
|
|||||||||||||||
|
Pass
|
271
|
|
19
|
|
110
|
|
6
|
|
|||||||
|
Special Mention
|
—
|
|
—
|
|
—
|
|
—
|
|
|||||||
|
Substandard
|
152
|
|
—
|
|
796
|
|
4
|
|
|||||||
|
Multifamily
|
|||||||||||||||
|
LTV => 35%
|
|||||||||||||||
|
Pass
|
778
|
|
—
|
|
794
|
|
50
|
|
|||||||
|
Substandard
|
180
|
|
—
|
|
546
|
|
—
|
|
|||||||
|
Home equity and lines of credit
|
|||||||||||||||
102
NORTHFIELD BANCORP, INC. AND SUBSIDIARIES
Notes to Consolidated Financial Statements - (Continued)
|
|
December 31, 2017
|
December 31, 2016
|
|||||||||||||
|
|
Average Recorded Investment
|
Interest Income
|
Average Recorded Investment
|
Interest Income
|
|||||||||||
|
Pass
|
153
|
|
—
|
|
264
|
|
8
|
|
|||||||
|
Special Mention
|
—
|
|
—
|
|
34
|
|
—
|
|
|||||||
|
Substandard
|
37
|
|
1
|
|
40
|
|
1
|
|
|||||||
|
Commercial and industrial loans
|
|||||||||||||||
|
Special Mention
|
25
|
|
1
|
|
27
|
|
1
|
|
|||||||
|
Total:
|
|||||||||||||||
|
Real estate loans:
|
|||||||||||||||
|
Commercial
|
18,322
|
|
810
|
|
23,633
|
|
743
|
|
|||||||
|
One-to-four family residential
|
3,422
|
|
133
|
|
3,729
|
|
114
|
|
|||||||
|
Multifamily
|
1,675
|
|
62
|
|
2,053
|
|
73
|
|
|||||||
|
Home equity and lines of credit
|
226
|
|
3
|
|
346
|
|
12
|
|
|||||||
|
Commercial and industrial loans
|
152
|
|
1
|
|
108
|
|
1
|
|
|||||||
|
|
$
|
23,797
|
|
$
|
1,009
|
|
$
|
29,869
|
|
$
|
943
|
|
|||
There was
one
one-to-four family residential loan modified as a troubled debt restructuring (“TDR”) during the year ended
December 31, 2017
. This loan had a pre- and post-modification balance of
$256,000
as of the date of modification, and was restructured to receive a reduced interest rate. Since modification, the loan subsequently defaulted. There were
no
loans modified as TDRs during the year ended
December 31, 2016
.
At
December 31, 2017
and
2016
, we had TDRs of $
18.3
million and
$22.4 million
, respectively.
Management classifies all troubled debt restructurings as impaired loans. Impaired loans are individually assessed to determine that the loan’s carrying value is not in excess of the estimated fair value of the collateral (less cost to sell), if the loan is collateral dependent, or the present value of the expected future cash flows, if the loan is not collateral dependent. Management performs a detailed evaluation of each impaired loan and generally obtains updated appraisals as part of the evaluation. In addition, management adjusts estimated fair values down to appropriately consider recent market conditions, our willingness to accept a lower sales price to effect a quick sale, and costs to dispose of any supporting collateral. Determining the estimated fair value of underlying collateral (and related costs to sell) can be difficult in illiquid real estate markets and is subject to significant assumptions and estimates. Management employs an independent third-party expert in appraisal preparation and review to ascertain the reasonableness of updated appraisals. Projecting the expected cash flows under troubled debt restructurings which are not collateral dependent is inherently subjective and requires, among other things, an evaluation of the borrower’s current and projected financial condition. Actual results may be significantly different than our projections and our established allowance for loan losses on these loans, which could have a material effect on our financial results.
|
(6)
|
Premises and Equipment, Net
|
At
December 31, 2017
and
2016
, premises and equipment, less accumulated depreciation and amortization, consists of the following (in thousands):
|
|
December 31,
|
||||||
|
|
2017
|
2016
|
|||||
|
At cost:
|
|
||||||
|
Land
|
$
|
4,018
|
|
$
|
4,018
|
|
|
|
Buildings and improvements
|
8,883
|
|
8,856
|
|
|||
|
Capital leases
|
2,600
|
|
2,600
|
|
|||
|
Furniture, fixtures, and equipment
|
22,677
|
|
21,962
|
|
|||
|
Leasehold improvements
|
28,721
|
|
27,398
|
|
|||
|
|
66,899
|
|
64,834
|
|
|||
|
Accumulated depreciation and amortization
|
(41,153
|
)
|
(37,924
|
)
|
|||
|
Premises and equipment, net
|
$
|
25,746
|
|
$
|
26,910
|
|
|
Depreciation expense for the years ended
December 31, 2017
,
2016
, and
2015
, was
$3.2 million
,
$3.6 million
, and
$3.4 million
, respectively.
103
NORTHFIELD BANCORP, INC. AND SUBSIDIARIES
Notes to Consolidated Financial Statements - (Continued)
There were
no
sales of premises and equipment in
2017
,
2016
, or
2015
.
|
(7)
|
Deposits
|
Deposit account balances are summarized as follows (dollars in thousands):
|
|
As of December 31,
|
||||||||||||
|
|
2017
|
2016
|
|||||||||||
|
|
Amount
|
Weighted Average Rate
|
Amount
|
Weighted Average Rate
|
|||||||||
|
Transaction:
|
|
|
|
|
|||||||||
|
Negotiable orders of withdrawal
|
$
|
465,140
|
|
0.39
|
%
|
$
|
467,440
|
|
0.34
|
%
|
|||
|
Non-interest bearing checking
|
407,267
|
|
—
|
%
|
390,484
|
|
—
|
%
|
|||||
|
Total transaction
|
872,407
|
|
0.21
|
%
|
857,924
|
|
0.19
|
%
|
|||||
|
Savings:
|
|
|
|
|
|||||||||
|
Money market
|
800,854
|
|
0.72
|
%
|
818,660
|
|
0.67
|
%
|
|||||
|
Savings
|
424,789
|
|
0.18
|
%
|
500,926
|
|
0.24
|
%
|
|||||
|
Total savings
|
1,225,643
|
|
0.53
|
%
|
1,319,586
|
|
0.51
|
%
|
|||||
|
Certificates of deposit:
|
|
|
|
|
|||||||||
|
Under $100,000
|
401,063
|
|
1.42
|
%
|
484,480
|
|
1.22
|
%
|
|||||
|
$100,000 or more
|
337,866
|
|
1.51
|
%
|
51,597
|
|
1.48
|
%
|
|||||
|
Total certificates of deposit
|
738,929
|
|
1.46
|
%
|
536,077
|
|
1.24
|
%
|
|||||
|
Total deposits
|
$
|
2,836,979
|
|
0.67
|
%
|
$
|
2,713,587
|
|
0.55
|
%
|
|||
The Company had brokered deposits (included in certificates of deposit in the above table) of
$150.6 million
and
$98.8 million
at
December 31, 2017
and
2016
, respectively.
Scheduled maturities of certificates of deposit are summarized as follows (in thousands):
|
|
December 31, 2017
|
||
|
2018
|
$
|
401,315
|
|
|
2019
|
157,397
|
|
|
|
2020
|
122,899
|
|
|
|
2021
|
23,511
|
|
|
|
2022
|
33,807
|
|
|
|
Thereafter
|
—
|
|
|
|
Total
|
$
|
738,929
|
|
Interest expense on deposits is summarized as follows (in thousands):
|
|
December 31,
|
||||||||||
|
|
2017
|
2016
|
2015
|
||||||||
|
Negotiable order of withdrawal and money market
|
$
|
7,336
|
|
$
|
5,634
|
|
$
|
2,816
|
|
||
|
Savings-passbook and statement
|
897
|
|
2,124
|
|
2,141
|
|
|||||
|
Certificates of deposit
|
8,153
|
|
6,529
|
|
5,466
|
|
|||||
|
|
$
|
16,386
|
|
$
|
14,287
|
|
$
|
10,423
|
|
||
104
NORTHFIELD BANCORP, INC. AND SUBSIDIARIES
Notes to Consolidated Financial Statements - (Continued)
|
(8)
|
Borrowings
|
Borrowings consisted of securities sold under agreements to repurchase (repurchase agreements), FHLB advances, floating rate advances, and obligations under capital leases and are summarized as follows (in thousands):
|
|
December 31,
|
||||||
|
|
2017
|
2016
|
|||||
|
Repurchase agreements
|
$
|
2,000
|
|
$
|
8,000
|
|
|
|
Other borrowings:
|
|
|
|
|
|||
|
FHLB advances
|
464,217
|
|
453,220
|
|
|||
|
Floating rate advances
|
5,033
|
|
11,463
|
|
|||
|
Obligations under capital leases
|
299
|
|
523
|
|
|||
|
|
$
|
471,549
|
|
$
|
473,206
|
|
|
FHLB advances are secured by a blanket lien on unencumbered securities and the Company’s FHLB capital stock.
Repurchase agreements and FHLB advances have contractual maturities as follows (in thousands):
|
|
December 31, 2017
|
||||||
|
|
FHLB
|
Repurchase
|
|||||
|
|
Advances
|
Agreements
|
|||||
|
2018
|
$
|
160,715
|
|
$
|
2,000
|
|
|
|
2019
|
123,502
|
|
—
|
|
|||
|
2020
|
90,000
|
|
—
|
|
|||
|
2021
|
70,000
|
|
—
|
|
|||
|
2022
|
20,000
|
|
—
|
|
|||
|
|
$
|
464,217
|
|
$
|
2,000
|
|
|
At
December 31, 2017
, repurchase agreements have a weighted average rate of
3.39%
, with
$2.0 million
maturing in the first quarter of 2018. The repurchase agreements are secured primarily by mortgage-backed securities with an amortized cost of
$4.7 million
, and a fair value of
$4.6 million
, at
December 31, 2017
. At
December 31, 2016
, repurchase agreements had a weighted average rate of
3.19%
, with
$4.0 million
maturing in the first quarter of 2017 and
$4.0 million
maturing in more than
90
days. The repurchase agreements were secured primarily by mortgage-backed securities with an amortized cost of
$13.7 million
, and a fair value of
$13.9 million
, at
December 31, 2016
.
The Company has the ability to obtain additional funding from the FHLB and Federal Reserve Bank discount window of approximately
$870.8 million
, utilizing unencumbered and unpledged securities of
$72.6 million
and multifamily loans of
$885.3 million
at
December 31, 2017
. The Company expects to have sufficient funds available to meet current commitments in the normal course of business.
Interest expense on borrowings is summarized as follows (in thousands):
|
|
December 31,
|
||||||||||
|
|
2017
|
2016
|
2015
|
||||||||
|
Repurchase agreements
|
$
|
137
|
|
$
|
569
|
|
$
|
2,446
|
|
||
|
FHLB advances
|
7,390
|
|
6,743
|
|
6,742
|
|
|||||
|
Floating rate advances
|
33
|
|
27
|
|
17
|
|
|||||
|
Obligations under capital leases
|
30
|
|
42
|
|
60
|
|
|||||
|
|
$
|
7,590
|
|
$
|
7,381
|
|
$
|
9,265
|
|
||
105
NORTHFIELD BANCORP, INC. AND SUBSIDIARIES
Notes to Consolidated Financial Statements - (Continued)
|
(9)
|
Income Taxes
|
Income tax expense (benefit) consists of the following (in thousands):
|
|
December 31,
|
||||||||||
|
|
2017
|
2016
|
2015
|
||||||||
|
Federal tax expense (benefit):
|
|
|
|
||||||||
|
Current
|
$
|
10,113
|
|
$
|
14,218
|
|
$
|
11,796
|
|
||
|
Deferred
|
14,290
|
|
(1,260
|
)
|
(2,305
|
)
|
|||||
|
|
24,403
|
|
12,958
|
|
9,491
|
|
|||||
|
State and local tax expense (benefit):
|
|
|
|
||||||||
|
Current
|
1,672
|
|
2,506
|
|
1,811
|
|
|||||
|
Deferred
|
903
|
|
(1,799
|
)
|
673
|
|
|||||
|
|
2,575
|
|
707
|
|
2,484
|
|
|||||
|
Total income tax expense
|
$
|
26,978
|
|
$
|
13,665
|
|
$
|
11,975
|
|
||
Reconciliation between the amount of reported total income tax expense and the amount computed by multiplying the applicable statutory income tax rate for the years ended
December 31, 2017
,
2016
, and
2015
, is as follows (dollars in thousands):
|
|
December 31,
|
||||||||||
|
|
2017
|
2016
|
2015
|
||||||||
|
Tax expense at statutory rate of 35%
|
$
|
18,111
|
|
$
|
13,928
|
|
$
|
11,027
|
|
||
|
Increase (decrease) in taxes resulting from:
|
|
|
|
||||||||
|
State tax, net of federal income tax
|
1,674
|
|
460
|
|
1,615
|
|
|||||
|
Impact of 2017 federal tax reform
|
10,453
|
|
—
|
|
—
|
|
|||||
|
Bank owned life insurance
|
(1,885
|
)
|
(1,399
|
)
|
(1,319
|
)
|
|||||
|
ESOP fair market value adjustment
|
404
|
|
352
|
|
—
|
|
|||||
|
Incentive stock options
|
247
|
|
299
|
|
210
|
|
|||||
|
Uncertain tax position
|
132
|
|
178
|
|
51
|
|
|||||
|
Merger related costs
|
—
|
|
74
|
|
201
|
|
|||||
|
Excess tax benefits from employee share based payments
|
(2,309
|
)
|
—
|
|
—
|
|
|||||
|
Other, net
|
151
|
|
(227
|
)
|
190
|
|
|||||
|
Income tax expense
|
$
|
26,978
|
|
$
|
13,665
|
|
$
|
11,975
|
|
||
Federal Tax Reform
On December 22, 2017, H.R.1, commonly known as the Tax Cuts and Jobs Act (the “Tax Act”), was signed into law. The Tax Act includes many provisions that will affect our income tax expense, including reducing our federal tax rate from 35% to 21%, effective January 1, 2018. As a result of this rate reduction, we were required to re-measure, through income tax expense in the period of enactment, our deferred tax assets and liabilities using the enacted rate at which we expect them to be recovered or settled. The re-measurement of our net deferred tax asset resulted in additional 2017 income tax expense of
$10.5 million
.
Also on December 22, 2017, the Securities and Exchange Commission released Staff Accounting Bulletin No. 118 (“SAB 118”) to address any uncertainty or diversity of views in practice in accounting for the income tax effects of the Tax Act in situations where a registrant does not have the necessary information available, prepared, or analyzed in reasonable detail to complete this accounting in the reporting period that includes the enactment date. SAB 118 describes three scenarios associated with a company’s status of accounting for the TaxAct: (1) a company reflects the income tax effects of the Tax Act in which the accounting under ASC 740 is complete, (2) a company is able to determine a reasonable estimate for certain effects of tax reform and records that estimate as a provisional amount, or (3) a company is not able to determine a reasonable estimate and therefore continues to apply ASC 740,
Income Taxes
, based on the provisions of the tax laws in effect immediately prior to tax reform being enacted. SAB 118 allows for a measurement period, not to extend beyond one year from the Tax Act’s enactment date, to complete the necessary accounting. There were no items for which the Company was unable to make reasonable estimates for the effects of the Tax Act changes.
106
NORTHFIELD BANCORP, INC. AND SUBSIDIARIES
Notes to Consolidated Financial Statements - (Continued)
The tax effects of temporary differences that give rise to significant portions of the deferred tax assets and deferred tax liabilities at
December 31, 2017
and
2016
, are as follows (in thousands):
|
|
December 31,
|
||||||
|
|
2017
|
2016
|
|||||
|
Deferred tax assets:
|
|
|
|||||
|
Allowance for loan losses
|
$
|
6,836
|
|
$
|
9,470
|
|
|
|
Capitalized leases
|
84
|
|
213
|
|
|||
|
Deferred compensation
|
3,474
|
|
5,686
|
|
|||
|
Accrued salaries
|
2
|
|
1,128
|
|
|||
|
Postretirement benefits
|
381
|
|
576
|
|
|||
|
Equity awards
|
3,582
|
|
5,005
|
|
|||
|
Unrealized actuarial losses on post-retirement benefits
|
93
|
|
124
|
|
|||
|
Straight-line leases adjustment
|
892
|
|
1,219
|
|
|||
|
Asset retirement obligation
|
65
|
|
89
|
|
|||
|
Reserve for accrued interest receivable
|
712
|
|
1,116
|
|
|||
|
Reserve for loan commitments
|
124
|
|
193
|
|
|||
|
Employee Stock Ownership Plan
|
497
|
|
642
|
|
|||
|
Other
|
236
|
|
366
|
|
|||
|
Depreciation
|
2,116
|
|
2,509
|
|
|||
|
Fair value adjustments of acquired loans
|
4,868
|
|
10,168
|
|
|||
|
Fair value adjustments of pension benefit obligations
|
154
|
|
250
|
|
|||
|
Unrealized losses on securities
|
2,070
|
|
2,775
|
|
|||
|
Total gross deferred tax assets
|
26,186
|
|
41,529
|
|
|||
|
Deferred tax liabilities:
|
|
|
|||||
|
Fair value adjustments of acquired securities
|
35
|
|
82
|
|
|||
|
Fair value adjustments of deposit liabilities
|
358
|
|
547
|
|
|||
|
Deferred loan fees
|
1,815
|
|
1,910
|
|
|||
|
Undistributed earnings related to NSB Realty Trust
|
939
|
|
—
|
|
|||
|
Other
|
37
|
|
59
|
|
|||
|
Total gross deferred tax liabilities
|
3,184
|
|
2,598
|
|
|||
|
Net deferred tax asset
|
$
|
23,002
|
|
$
|
38,931
|
|
|
Net deferred tax assets are included in other assets on the consolidated balance sheets. In 2016, the Company recorded net deferred tax assets of approximately
$3.9 million
as a result of the Hopewell Valley acquisition.
The Company has determined that it is not required to establish a valuation reserve for the net deferred tax asset account since it is “more likely than not” that the net deferred tax assets will be realized through future reversals of existing taxable temporary differences, future taxable income and tax planning strategies. The conclusion that it is “more likely than not” that the net deferred tax assets will be realized is based on the history of earnings and the prospects for continued profitability. Management will continue to review the tax criteria related to the recognition of deferred tax assets.
As a savings institution, the Bank is subject to a special federal tax provision regarding its frozen tax bad debt reserve. At
December 31, 2017
and
December 31, 2016
, the Bank’s federal tax bad debt base-year reserve was
$5.9 million
, with a related net deferred tax liability of
$2.8 million
, which has not been recognized since the Bank does not expect that this reserve will become taxable in the foreseeable future. Events that would result in taxation of this reserve include redemptions of the Bank’s stock or certain excess distributions by the Bank to the Company.
107
NORTHFIELD BANCORP, INC. AND SUBSIDIARIES
Notes to Consolidated Financial Statements - (Continued)
A reconciliation of the Company’s uncertain tax positions are as follows (in thousands):
|
|
December 31,
|
||||||||||
|
|
2017
|
2016
|
2015
|
||||||||
|
Beginning balance
|
$
|
459
|
|
$
|
281
|
|
$
|
230
|
|
||
|
Settlements based on tax positions related to prior years
|
(109
|
)
|
—
|
|
—
|
|
|||||
|
Additions based on tax positions related to prior years
|
132
|
|
178
|
|
51
|
|
|||||
|
Ending balance
|
$
|
482
|
|
$
|
459
|
|
$
|
281
|
|
||
The Company recognizes interest and penalties on income taxes in income tax expense.
The following years are open for examination or under examination:
|
•
|
Federal tax filings for 2014 through present.
|
|
•
|
New York State tax filings 2014 through present. The 2013 through 2014 filings are currently under examination.
|
|
•
|
New York City tax filings 2014 through present. The 2010 through 2012 filings are currently under examination.
|
|
•
|
State of New Jersey 2014 through present.
|
|
(10)
|
Retirement Benefits
|
The Company has a 401(k) plan for its employees, which grants eligible employees (those salaried employees with at least
three months
of service) the opportunity to invest from
2%
to
15%
of their base compensation in certain investment alternatives. The Company contributes an amount equal to
25%
of employee contributions on the first
6%
of base compensation contributed by eligible employees for the first
three
years of participation. Subsequent years of participation in excess of
three years
will increase the Company matching contribution from
25%
to
50%
of an employee’s contributions, on the first
6%
of base compensation contributed by eligible employees. A member becomes fully vested in the Company’s contributions upon (a) completion of
five years
of service, or (b) normal retirement, early retirement, permanent disability, or death. The Company’s contribution to this plan amounted to approximately
$387,000
,
$384,000
, and
$321,000
for the years ended
December 31, 2017
,
2016
, and
2015
, respectively.
The Company also maintains a profit-sharing plan in which the Company can contribute to the participant’s 401(k) account, at its discretion, up to the legal limit of the Internal Revenue Code. The Company did not contribute to the profit sharing plan during
2017
,
2016
, and
2015
.
The Company maintains the Northfield Bank ESOP. The ESOP is a tax-qualified plan designed to invest primarily in the Company’s common stock. The ESOP provides employees with the opportunity to receive a funded retirement benefit from the Bank, based primarily on the value of the Company’s common stock. The ESOP purchased
2,463,884
shares of the Company’s common stock in the Company’s initial public offering at a price of
$7.13
per share. This purchase was funded with a loan from Northfield Bancorp, Inc. to the ESOP. The outstanding balance at
December 31, 2017
and
2016
was
$11.5 million
and
$12.1 million
, respectively. The shares of the Company’s common stock purchased in the initial public offering are pledged as collateral for the loan. Shares are released for allocation to participants as loan payments are made. A total of
99,670
and
97,836
shares were released and allocated to participants of the ESOP for the years ended
December 31, 2017
and
2016
, respectively. Cash dividends on unallocated shares are utilized to satisfy required debt payments. Dividends on allocated shares are utilized to prepay debt which releases additional shares to participants.
Upon completion of the Company’s second-step conversion, a second ESOP was established for employees in 2013, which purchased
1,422,357
shares of the Company’s common stock at a price of
$10.00
per share. The purchase was funded with a loan from Northfield Bancorp, Inc. to the second ESOP. The outstanding balance at
December 31, 2017
and
2016
was
$12.6 million
and
$12.9 million
, respectively. The shares of the Company’s common stock purchased in the second-step conversion are pledged as collateral for the loan. Shares are released for allocation to participants as loan payments are made. A total of
51,189
and
50,086
shares were released and allocated to participants of the second ESOP for the years ended
December 31, 2017
and
2016
, respectively. Cash dividends on unallocated shares are utilized to satisfy required debt payments. Dividends on allocated shares are utilized to prepay debt which releases additional shares to participants.
108
NORTHFIELD BANCORP, INC. AND SUBSIDIARIES
Notes to Consolidated Financial Statements - (Continued)
ESOP compensation expense for both plans for the years ended
December 31, 2017
,
2016
, and
2015
was
$2.2 million
,
$2.0 million
, and
$1.9 million
, respectively.
The Company maintains a Supplemental Employee Stock Ownership Plan (the "SESOP"), a non-qualified plan, that provides supplemental benefits to certain executives who are prevented from receiving the full benefits contemplated by the ESOP’s benefit formula due to tax law limits for tax-qualified plans. The supplemental payments for the SESOP consist of cash payments representing the value of Company shares that cannot be allocated to participants under the ESOPs due to legal limitations imposed on tax-qualified plans. The Company's required contributions to the SESOP plan were
$84,000
,
$82,000
, and
$82,000
for the years ended
December 31, 2017
,
2016
, and
2015
, respectively.
The Company provides post-retirement medical and life insurance to a limited number of retired individuals. The Company also provides retiree life insurance benefits to all qualified employees, up to certain limits. The following tables set forth the funded status and components of postretirement benefit costs at December 31 measurement dates (in thousands):
|
|
2017
|
2016
|
2015
|
||||||||
|
Accumulated postretirement benefit obligation beginning of year
|
$
|
1,697
|
|
$
|
1,950
|
|
$
|
1,846
|
|
||
|
Service cost
|
11
|
|
8
|
|
9
|
|
|||||
|
Interest cost
|
57
|
|
71
|
|
62
|
|
|||||
|
Actuarial (gain) loss
|
(8
|
)
|
(214
|
)
|
149
|
|
|||||
|
Benefits paid
|
(112
|
)
|
(118
|
)
|
(116
|
)
|
|||||
|
Accumulated postretirement benefit obligation end of year
|
1,645
|
|
1,697
|
|
1,950
|
|
|||||
|
Accrued liability (included in accrued expenses and other liabilities)
|
$
|
1,645
|
|
$
|
1,697
|
|
$
|
1,950
|
|
||
The following table sets forth the amounts recognized in accumulated other comprehensive income (loss) (in thousands):
|
|
December 31,
|
||||||
|
|
2017
|
2016
|
|||||
|
Net loss
|
$
|
274
|
|
$
|
310
|
|
|
|
Transition obligation
|
—
|
|
—
|
|
|||
|
Prior service cost
|
—
|
|
—
|
|
|||
|
Loss recognized in accumulated other comprehensive income (loss)
|
$
|
274
|
|
$
|
310
|
|
|
The estimated net loss, prior service cost, and transition obligation, that will be amortized from accumulated other comprehensive income (loss) into net periodic cost in 2018, are
$25,000
,
$0
, and
$0
respectively.
The following table sets forth the components of net periodic postretirement benefit costs for the years ended
December 31, 2017
,
2016
, and
2015
(in thousands):
|
|
December 31,
|
||||||||||
|
|
2017
|
2016
|
2015
|
||||||||
|
Service cost
|
$
|
11
|
|
$
|
8
|
|
$
|
9
|
|
||
|
Interest cost
|
57
|
|
71
|
|
62
|
|
|||||
|
Amortization of transition obligation
|
—
|
|
—
|
|
17
|
|
|||||
|
Amortization of prior service costs
|
—
|
|
12
|
|
38
|
|
|||||
|
Amortization of unrecognized loss
|
28
|
|
54
|
|
44
|
|
|||||
|
Net postretirement benefit cost included in compensation and employee benefits
|
$
|
96
|
|
$
|
145
|
|
$
|
170
|
|
||
109
NORTHFIELD BANCORP, INC. AND SUBSIDIARIES
Notes to Consolidated Financial Statements - (Continued)
The assumed discount rate related to plan obligations reflects the weighted average of published market rates for high-quality corporate bonds with terms similar to those of the plans expected benefit payments, rounded to the nearest quarter percentage point. The Company’s discount rate and rate of compensation increase used in accounting for the plan are as follows:
|
|
2017
|
2016
|
2015
|
|||||
|
Assumptions used to determine benefit obligation at period end:
|
|
|
|
|||||
|
Discount rate
|
3.25
|
%
|
3.50
|
%
|
3.75
|
%
|
||
|
Rate of increase in compensation
|
4.00
|
%
|
4.00
|
%
|
4.00
|
%
|
||
|
Assumptions used to determine net periodic benefit cost for the year:
|
|
|
|
|||||
|
Discount rate
|
3.50
|
%
|
3.75
|
%
|
3.50
|
%
|
||
|
Rate of increase in compensation
|
4.00
|
%
|
4.00
|
%
|
4.00
|
%
|
||
At
December 31, 2017
, a medical cost trend rate of
8.75%
decreasing
0.50%
per year thereafter until an ultimate rate of
4.75%
is reached, was used in the plan’s valuation. The Company’s healthcare cost trend rates are based, among other things, on the Company’s own experience and third-party analysis of recent and projected healthcare cost trends.
A one percentage-point change in assumed heath care cost trends would have the following effects (in thousands):
|
|
One Percentage Point Increase
|
One Percentage Point Decrease
|
|||||||||||||
|
|
2017
|
2016
|
2017
|
2016
|
|||||||||||
|
Effect on benefits earned and interest cost
|
$
|
4
|
|
$
|
6
|
|
$
|
(4
|
)
|
$
|
(5
|
)
|
|||
|
Effect on accumulated postretirement benefit obligation
|
111
|
|
121
|
|
(100
|
)
|
(108
|
)
|
|||||||
A one percentage-point change in assumed heath care cost trends would have the following effects (in thousands):
|
|
One Percentage Point Increase
|
One Percentage Point Decrease
|
|||||||||||||||||||||
|
|
2017
|
2016
|
2015
|
2017
|
2016
|
2015
|
|||||||||||||||||
|
Aggregate of service and interest
components of net periodic cost (benefit)
|
$
|
4
|
|
$
|
6
|
|
$
|
6
|
|
$
|
(4
|
)
|
$
|
(5
|
)
|
$
|
(4
|
)
|
|||||
Benefit payments of approximately
$112,000
,
$118,000
, and
$116,000
were made in
2017
,
2016
, and
2015
, respectively. The benefits expected to be paid under the postretirement health benefits plan for the next
five years
are as follows:
$121,000
in
2018
;
$124,000
in
2019
;
$126,000
in
2020
;
$127,000
in
2021
; and
$127,000
in
2022
. The benefit payments expected to be paid in the aggregate for the years 2023 through 2027 are
$594,000
. The expected benefits are based on the same assumptions used to measure the Company’s benefit obligation at
December 31, 2017
, and include estimated future employee service.
The Company maintains a nonqualified plan to provide for the elective deferral of all or a portion of director fees by members of the board of directors, deferral of all or a portion of the compensation and/or annual incentive compensation payable to eligible employees of the Company, and to provide to certain officers of the Company benefits in excess of those permitted to be paid by the Company’s savings plan, ESOP, and profit-sharing plan under the applicable Internal Revenue Code. The plan obligation was approximately
$13.7 million
and
$14.1 million
at
December 31, 2017
and
2016
, respectively, and is included in accrued expenses and other liabilities on the consolidated balance sheets. Income under this plan was
$1.1 million
,
$503,000
, and
$392,000
for the years ended
December 31, 2017
,
2016
, and
2015
, respectively. The Company invests to fund this future obligation, in various mutual funds designated as trading securities. The securities are marked-to-market through current period earnings as a component of non-interest income. Accrued obligations under this plan are credited or charged with the return on the trading securities portfolio as a component of compensation and benefits expense.
110
NORTHFIELD BANCORP, INC. AND SUBSIDIARIES
Notes to Consolidated Financial Statements - (Continued)
|
(11)
|
Equity Incentive Plan
|
The Company maintains the Northfield Bancorp, Inc. 2008 Equity Incentive Plan (the
“
2008 EIP
”
) which allows the Company to grant common stock or options to purchase common stock at specific prices to directors and employees of the Company. The 2008 EIP provides for the issuance or delivery of up to
4,311,796
shares (
1,231,941
restricted shares and
3,079,855
stock options) of Northfield Bancorp, Inc. common stock subject to certain plan limitations. As of
December 31, 2017
,
3,378
restricted shares and
17,299
stock options remain available for issuance under the 2008 EIP. The stock options and restricted stock granted in 2017 vest in varying installments over a period ranging from
10
to
34
months, the first vesting beginning on May 27, 2018. Prior to 2017, all stock options and restricted stock granted vest in equal installments over a
five
year period beginning
one
year from the date of grant. The vesting of options and restricted stock awards may accelerate in accordance with the terms of the 2008 EIP. During 2017, the Company granted to certain directors and employees in aggregate
34,500
restricted shares and
98,244
stock options to purchase Company stock. In 2016, the Company granted to an employee
20,000
restricted shares and
40,000
stock options to purchase Company stock. Stock options were granted at an exercise price equal to the fair value of the Company’s common stock on the grant date based on quoted market prices and all have an expiration period of
ten
years. The Company is expensing the grant date fair value of all employee and director share-based compensation over the requisite service periods on a straight-line basis.
The fair value of stock options granted was estimated utilizing the Black-Scholes option pricing model using the following assumptions:
|
Year Ended December 31,
|
|||||||||||
|
|
2017
|
2016
|
|||||||||
|
Grant Date
|
November 1, 2017
|
September 19, 2017
|
August 1, 2017
|
November 16, 2016
|
|||||||
|
Stock options granted
|
40,000
|
|
12,500
|
|
45,744
|
|
40,000
|
|
|||
|
Risk-free rate of return
|
2.06
|
%
|
1.89
|
%
|
1.86
|
%
|
1.8
|
%
|
|||
|
Volatility
|
29.22
|
%
|
30.06
|
%
|
29.46
|
%
|
30.07
|
%
|
|||
|
Dividend yield
|
2.37
|
%
|
1.98
|
%
|
1.91
|
%
|
1.74
|
%
|
|||
|
Expected life
|
5.75
|
|
5.75
|
|
5.75
|
|
6.5
|
|
|||
The Company also maintains the Northfield Bancorp, Inc. 2014 Equity Incentive Plan (the
“
2014 EIP
”
) which allows the Company to grant common stock or options to purchase common stock at specific prices to directors and employees of the Company. The 2014 EIP provides for the issuance or delivery of up to
4,978,249
shares (
1,422,357
restricted shares and
3,555,892
stock options) of Northfield Bancorp, Inc. common stock subject to certain plan limitations. As of
December 31, 2017
,
148,816
restricted shares and
330,273
stock options remain available for issuance under the 2014 EIP. All stock options and restricted stock granted to date vest in equal installments over a
five
year period beginning
one
year from the date of grant. The vesting of options and restricted stock awards may accelerate in accordance with terms of the 2014 EIP. Stock options were granted at an exercise price equal to the fair value of the Company’s common stock on the grant date based on quoted market prices and all have an expiration period of
ten
years. In May 2015, the Company granted to certain directors and employees
419,000
restricted shares, and
1,090,000
stock options to purchase Company stock. The vesting of options and restricted stock awards may accelerate in accordance with terms of the 2014 EIP. Stock options were granted at an exercise price equal to the fair value of the Company’s common stock on the grant date based on quoted market prices and all have an expiration period of
ten
years. The fair value of stock options granted on May 27, 2015, was estimated utilizing the Black-Scholes option pricing model using the following assumptions: an expected life of
6.5
years, risk-free rate of return of
1.67%
, volatility of
32.06%
and a dividend yield of
1.90%
.
During the years ended
December 31, 2017
,
2016
, and
2015
, the Company recorded,
$6.2 million
,
$7.3 million
, and
$6.8 million
of stock-based compensation.
111
NORTHFIELD BANCORP, INC. AND SUBSIDIARIES
Notes to Consolidated Financial Statements - (Continued)
The following table is a summary of the Company’s non-vested stock options as of
December 31, 2017
, and changes therein during the year then ended:
|
|
Number of Stock Options
|
Weighted Average Grant Date Fair Value
|
Weighted Average Exercise Price
|
Weighted Average Contractual Life (years)
|
|||||||||
|
Outstanding- December 31, 2015
|
6,011,861
|
|
$
|
3.30
|
|
$
|
10.93
|
|
6.41
|
|
|||
|
Granted
|
40,000
|
|
4.94
|
|
18.44
|
|
9.88
|
|
|||||
|
Forfeited
|
(32,520
|
)
|
4.00
|
|
13.78
|
|
—
|
|
|||||
|
Exercised
|
(690,671
|
)
|
2.52
|
|
7.84
|
|
—
|
|
|||||
|
Outstanding- December 31, 2016
|
5,328,670
|
|
3.41
|
|
11.36
|
|
5.78
|
|
|||||
|
Granted
|
98,244
|
|
4.04
|
|
16.73
|
|
9.71
|
|
|||||
|
Forfeited
|
(247,484
|
)
|
3.93
|
|
13.68
|
|
—
|
|
|||||
|
Exercised
|
(558,743
|
)
|
2.41
|
|
7.52
|
|
—
|
|
|||||
|
Outstanding - December 31, 2017
|
4,620,687
|
|
3.51
|
|
11.82
|
|
5.17
|
|
|||||
|
Exercisable - December 31, 2017
|
3,118,615
|
|
$
|
3.25
|
|
$
|
10.75
|
|
4.26
|
|
|||
Expected future stock option expense related to the non-vested options outstanding as of
December 31, 2017
, is
$3.9 million
over an average period of
1.9
years.
The following is a summary of the status of the Company’s restricted shares as of
December 31, 2017
, and changes therein during the year then ended:
|
|
Number of Shares Awarded
|
Weighted Average Grant Date Fair Value
|
||||
|
Non-vested at December 31, 2015
|
1,193,862
|
|
$
|
13.70
|
|
|
|
Granted
|
20,000
|
|
18.44
|
|
||
|
Vested
|
(277,580
|
)
|
13.61
|
|
||
|
Forfeited
|
(12,280
|
)
|
13.87
|
|
||
|
Non-vested at December 31, 2016
|
924,002
|
|
13.82
|
|
||
|
Granted
|
34,500
|
|
16.70
|
|
||
|
Vested
|
(279,660
|
)
|
13.68
|
|
||
|
Forfeited
|
(92,947
|
)
|
13.92
|
|
||
|
Non-vested at December 31, 2017
|
585,895
|
|
$
|
14.05
|
|
|
Expected future stock award expense related to the non-vested restricted awards as of
December 31, 2017
, is
$5.4 million
over an average period of
1.9
years.
Upon the exercise of stock options, management expects to utilize treasury stock as the source of issuance for these shares.
|
(12)
|
Commitments and Contingencies
|
The Company, in the normal course of business, is party to commitments that involve, to varying degrees, elements of risk in excess of the amounts recognized in the consolidated financial statements. These commitments include unused lines of credit and commitments to extend credit.
At
December 31, 2017
and
2016
, the following commitment and contingent liabilities existed that are not reflected in the accompanying consolidated financial statements (in thousands):
112
NORTHFIELD BANCORP, INC. AND SUBSIDIARIES
Notes to Consolidated Financial Statements - (Continued)
|
|
December 31,
|
||||||
|
|
2017
|
2016
|
|||||
|
Commitments to extend credit
|
$
|
43,611
|
|
$
|
46,069
|
|
|
|
Unused lines of credit
|
98,433
|
|
78,825
|
|
|||
|
Standby letters of credit
|
7,000
|
|
7,463
|
|
|||
The Company’s maximum exposure to credit losses in the event of nonperformance by the other party to these commitments is represented by the contractual amount. The Company uses the same credit policies in granting commitments and conditional obligations as it does for amounts recorded in the consolidated balance sheets. These commitments and obligations do not necessarily represent future cash flow requirements. The Company evaluates each customer’s creditworthiness on a case-by-case basis. The amount of collateral obtained, if deemed necessary, is based on management’s assessment of risk. Standby letters of credit are conditional commitments issued by the Company to guarantee the performance of a customer to a third-party. The guarantees generally extend for a term of up to
one
year and are fully collateralized. For each guarantee issued, if the customer defaults on a payment to the third-party, the Company would have to perform under the guarantee. The unamortized fee on standby letters of credit approximates their fair value; such fees were insignificant at
December 31, 2017
, and at
December 31, 2016
. The Company maintains an allowance for estimated losses on commitments to extend credit in other liabilities. At
December 31, 2017
and
2016
, the allowance was
$442,000
and
$475,000
, respectively, and changes to the allowance are recorded as a component of other non-interest expense.
At
December 31, 2017
, the Company was obligated under non-cancelable operating leases and capitalized leases on property used for banking purposes. Most leases contain escalation clauses and renewal options which provide for increased rentals as well as for increases in certain property costs including real estate taxes, common area maintenance, and insurance.
In July 2017, the Company entered into an amendment to the lease contract for its main office premises in Woodbridge, New Jersey, to lease an additional
6,919
square feet of office space in the same building and extend the lease term by 10 years and eight months from July 1, 2018 through February 28, 2029 which will increase the Company's future minimum lease commitments by approximately
$9.4 million
. In October 2017, the Company entered into a new lease agreement for
3,600
square feet of office space at a branch facility in Staten Island, New York, for a term of
15
years through September 2032 which will increase our future minimum lease commitments by approximately
$2.5 million
.
The projected minimum annual rental payments and receipts under the capitalized leases and operating leases are as follows (in thousands):
|
|
Rental Payments Capitalized Leases
|
Rental Payments Operating Leases
|
|||||
|
Year ending December 31:
|
|
|
|||||
|
2018
|
$
|
262
|
|
$
|
4,867
|
|
|
|
2019
|
44
|
|
5,167
|
|
|||
|
2020
|
—
|
|
5,334
|
|
|||
|
2021
|
—
|
|
4,885
|
|
|||
|
2022
|
—
|
|
4,204
|
|
|||
|
Thereafter
|
—
|
|
35,748
|
|
|||
|
Total minimum lease payments
|
$
|
306
|
|
$
|
60,205
|
|
|
Net rental expense included in occupancy expense was approximately
$5.3 million
,
$5.2 million
, and
$4.6 million
for the years ended
December 31, 2017
,
2016
, and
2015
, respectively.
In the normal course of business, the Company may be a party to various outstanding legal proceedings and claims. In the opinion of management, the consolidated financial statements will not be materially affected by the outcome of such legal proceedings and claims.
The Bank has entered into employment and change in control agreements with its President and Chief Executive Officer and the other executive officers of the Company to ensure the continuity of executive leadership, to clarify the roles and responsibilities of executives, and to make explicit the terms and conditions of executive employment. These agreements are for a term of
three
years subject to review and annual renewal, and provide for certain levels of base annual salary and in the event
113
NORTHFIELD BANCORP, INC. AND SUBSIDIARIES
Notes to Consolidated Financial Statements - (Continued)
of a change in control, as defined, or in the event of termination, as defined, certain levels of base salary, bonus payments, and benefits for a period of up to
three
years.
|
(13)
|
Regulatory Requirements
|
Federal regulations require federally insured depository institutions to meet several minimum capital standards: a common equity Tier 1 capital to risk-based assets ratio of
4.5%
, a Tier 1 capital to risk-based assets ratio of
6.0%
, a total capital to risk-based assets of
8.0%
, and a
4.0%
Tier 1 capital to total assets leverage ratio. These capital requirements were effective January 1, 2015, and are the result of a final rule implementing recommendations of the Basel Committee on Banking Supervision and certain requirements of the Dodd-Frank Act.
Under prompt corrective action regulations, the OCC is required to take certain supervisory actions (and may take additional discretionary actions) with respect to an undercapitalized institution. Such actions could have a direct material effect on the institution’s financial statements. The regulations establish a framework for the classification of savings institutions into five categories: well capitalized, adequately capitalized, undercapitalized, significantly undercapitalized, and critically undercapitalized. Generally, an institution is considered well capitalized if it has a leverage (Tier 1) ratio of
5.0%
or greater, a common equity Tier 1 ratio of
6.5%
or greater, a Tier 1 risk-based capital ratio of
8.0%
or greater, and a total risk-based capital ratio of
10.0%
or greater.
The foregoing capital ratios are based in part on specific quantitative measures of assets, liabilities, and certain off-balance-sheet items as calculated under regulatory accounting practices. Capital amounts and classifications also are subject to qualitative judgments by the regulators about capital components, risk weighting, and other factors.
On January 1, 2015, a final rule issued by the federal bank regulatory agencies became effective which revised their leverage and risk-based capital requirements and the method for calculating risk-weighted assets to make them consistent with agreements that were reached by the Basel Committee on Banking Supervision and certain provisions of the Dodd-Frank Act. Among other things, the new rule establishes a new common equity Tier 1 minimum capital requirement (
4.5%
of risk-weighted assets), increases the minimum Tier 1 capital to risk-based assets requirement (from
4%
to
6%
of risk-weighted assets) and assigns a higher risk weight (
150%
) to exposures that are more than 90 days past due or are on non-accrual status, and to certain commercial real estate facilities that finance the acquisition, development, or construction of real property. The final rule also requires unrealized gains and losses on certain “available-for-sale” securities holdings to be included for purposes of calculating regulatory capital requirements unless a one-time opt-in or opt-out election is exercised. The rule limits a banking organization's capital distributions and certain discretionary bonus payments if the banking organization does not hold a “capital conservation buffer” consisting of
2.5%
of common equity Tier 1 capital to risk-weighted assets in addition to the amount necessary to meet its minimum risk-based capital requirements. The capital conservation buffer requirement was phased in beginning January 1, 2016 at
0.625%
of risk-weighted assets and increases each year until fully phased by January 1, 2019 at
2.5%
. For calendar year 2017, the capital conservation buffer was
1.25%
. It increased to
1.875%
on January 1, 2018. The final rule also implemented consolidated capital requirements for savings and loan holding companies, such as the Company, effective January 1, 2015.
Prompt Corrective
Management believes that as of
December 31, 2017
, and
December 31, 2016
, the Bank exceeded all capital adequacy requirements to which it is subject. Further, the most recent OCC notification categorized the Bank as a well-capitalized institution under the prompt corrective action regulations. There have been no conditions or events since that notification that management believes have changed the Bank's classification.
The following is a summary of Northfield Bank’s regulatory capital amounts and ratios compared to the regulatory requirements as of
December 31, 2017
and
2016
, for classification as a well-capitalized institution and minimum capital
114
NORTHFIELD BANCORP, INC. AND SUBSIDIARIES
Notes to Consolidated Financial Statements - (Continued)
(dollars in thousands):
|
|
|
|
|
|
For Well
|
|||||||||||||||
|
|
|
|
For Capital
|
Capitalized
|
||||||||||||||||
|
|
|
|
Adequacy
|
Under Prompt Corrective
|
||||||||||||||||
|
|
Actual
|
Purposes
|
Action Provisions
|
|||||||||||||||||
|
|
Amount
|
Ratio
|
Amount
|
Ratio
|
Amount
|
Ratio
|
||||||||||||||
|
As of December 31, 2017:
|
|
|
|
|
|
|
||||||||||||||
|
Common Equity Tier 1 Capital (to risk-weighted assets)
|
$
|
559,717
|
|
16.70
|
%
|
$
|
150,862
|
|
4.50
|
%
|
$
|
217,912
|
|
6.50
|
%
|
|||||
|
Tier 1 Leverage
|
559,717
|
|
14.15
|
|
158,220
|
|
4.00
|
|
197,775
|
|
5.00
|
|
||||||||
|
Tier I capital (to risk-weighted assets)
|
559,717
|
|
16.70
|
|
201,150
|
|
6.00
|
|
268,200
|
|
8.00
|
|
||||||||
|
Total capital (to risk-weighted assets)
|
586,361
|
|
17.49
|
|
268,200
|
|
8.00
|
|
335,250
|
|
10.00
|
|
||||||||
|
As of December 31, 2016:
|
|
|
|
|
|
|
||||||||||||||
|
Common Equity Tier 1 Capital (to risk-weighted assets)
|
$
|
553,715
|
|
17.75
|
%
|
$
|
140,371
|
|
4.50
|
%
|
$
|
202,758
|
|
6.50
|
%
|
|||||
|
Tier 1 Leverage
|
553,715
|
|
14.55
|
|
152,213
|
|
4.00
|
|
190,267
|
|
5.00
|
|
||||||||
|
Tier I capital (to risk-weighted assets)
|
553,715
|
|
17.75
|
|
187,161
|
|
6.00
|
|
249,548
|
|
8.00
|
|
||||||||
|
Total capital (to risk-weighted assets)
|
578,828
|
|
18.56
|
|
249,548
|
|
8.00
|
|
311,935
|
|
10.00
|
|
||||||||
The following is a summary of the Company's regulatory capital amounts and ratios compared to the regulatory requirements as of
December 31, 2017
and
2016
, for classification as a well-capitalized institution and minimum capital (dollars in thousands).
|
|
|
|
|
|
For Well
|
|||||||||||||||
|
|
|
|
For Capital
|
Capitalized
|
||||||||||||||||
|
|
|
|
Adequacy
|
Under Prompt Corrective
|
||||||||||||||||
|
|
Actual
|
Purposes
|
Action Provisions
|
|||||||||||||||||
|
|
Amount
|
Ratio
|
Amount
|
Ratio
|
Amount
|
Ratio
|
||||||||||||||
|
As of December 31, 2017:
|
|
|
|
|
|
|
||||||||||||||
|
Common Equity Tier 1 Capital (to risk-weighted assets)
|
$
|
604,208
|
|
18.02
|
%
|
$
|
150,917
|
|
4.50
|
%
|
$
|
217,991
|
|
6.50
|
%
|
|||||
|
Tier 1 Leverage
|
604,208
|
|
15.27
|
|
158,254
|
|
4.00
|
|
197,818
|
|
5.00
|
|
||||||||
|
Tier I capital (to risk-weighted assets)
|
604,208
|
|
18.02
|
|
201,222
|
|
6.00
|
|
268,296
|
|
8.00
|
|
||||||||
|
Total capital (to risk-weighted assets)
|
630,853
|
|
18.81
|
|
268,296
|
|
8.00
|
|
335,370
|
|
10.00
|
|
||||||||
|
As of December 31, 2016:
|
|
|
|
|
|
|
||||||||||||||
|
Common Equity Tier 1 Capital (to risk-weighted assets)
|
$
|
586,055
|
|
18.79
|
%
|
$
|
140,329
|
|
4.50
|
%
|
$
|
202,698
|
|
6.50
|
%
|
|||||
|
Tier 1 Leverage
|
586,055
|
|
15.40
|
|
152,213
|
|
4.00
|
|
190,267
|
|
5.00
|
|
||||||||
|
Tier I capital (to risk-weighted assets)
|
586,055
|
|
18.79
|
|
187,106
|
|
6.00
|
|
249,474
|
|
8.00
|
|
||||||||
|
Total capital (to risk-weighted assets)
|
611,168
|
|
19.60
|
|
249,474
|
|
8.00
|
|
380,533
|
|
10.00
|
|
||||||||
|
(14)
|
Fair Value of Measurement
|
The following table presents the assets reported on the consolidated balance sheet at their estimated fair value as of
December 31, 2017
and
2016
, by level within the Fair Value Measurements and Disclosures Topic of the FASB Accounting Standards Codification. Financial assets and liabilities are classified in their entirety based on the level of input that is significant to the fair value measurement. The fair value hierarchy is as follows:
|
•
|
Level 1 Inputs – Unadjusted quoted prices in active markets for identical assets or liabilities that the reporting entity has the ability to access at the measurement date.
|
|
•
|
Level 2 Inputs – Inputs other than quoted prices included in Level 1 that are observable for the asset or liability, either directly or indirectly. These include quoted prices for similar assets or liabilities in active markets, quoted prices for identical or similar assets or liabilities in markets that are not active, inputs other than quoted prices that are observable for the asset or liability (for example, interest rates, volatilities, prepayment speeds, loss severities,
|
115
NORTHFIELD BANCORP, INC. AND SUBSIDIARIES
Notes to Consolidated Financial Statements - (Continued)
credit risks and default rates) or inputs that are derived principally from or corroborated by observable market data by correlations or other means.
|
•
|
Level 3 Inputs – Significant unobservable inputs that reflect the Company’s own assumptions that market participants would use in pricing the assets or liabilities.
|
The following tables summarize financial assets and financial liabilities measured at fair value as of
December 31, 2017
and
2016
, segregated by the level of the valuation inputs within the fair value hierarchy utilized to measure fair value (in thousands):
|
|
Fair Value Measurements at December 31, 2017 Using:
|
||||||||||||||
|
|
Carrying Value
|
Quoted Prices in Active Markets for Identical Assets (Level 1)
|
Significant Other Observable
Inputs (Level 2)
|
Significant Unobservable
Inputs
(Level 3)
|
|||||||||||
|
|
(in thousands)
|
||||||||||||||
|
Measured on a recurring basis:
|
|
||||||||||||||
|
Assets:
|
|
|
|
|
|||||||||||
|
Investment securities:
|
|
|
|
|
|||||||||||
|
Available-for-sale:
|
|
|
|
|
|||||||||||
|
Mortgage-backed securities
|
|
|
|
|
|||||||||||
|
GSE
|
$
|
445,224
|
|
$
|
—
|
|
$
|
445,224
|
|
$
|
—
|
|
|||
|
Non-GSE
|
79
|
|
—
|
|
79
|
|
—
|
|
|||||||
|
Debt securities
|
|
|
|
|
|||||||||||
|
Municipal bonds
|
349
|
|
—
|
|
349
|
|
|||||||||
|
Corporate bonds
|
68,130
|
|
—
|
|
68,130
|
|
—
|
|
|||||||
|
Other securities
|
|||||||||||||||
|
Equity investments - mutual funds
|
323
|
|
323
|
|
—
|
|
—
|
|
|||||||
|
Other
|
1,016
|
|
—
|
|
1,016
|
|
—
|
|
|||||||
|
Total available-for-sale
|
515,121
|
|
323
|
|
514,798
|
|
—
|
|
|||||||
|
Trading securities
|
9,597
|
|
9,597
|
|
—
|
|
—
|
|
|||||||
|
Total
|
$
|
524,718
|
|
$
|
9,920
|
|
$
|
514,798
|
|
$
|
—
|
|
|||
|
Measured on a non-recurring basis:
|
|
|
|
|
|||||||||||
|
Assets:
|
|
|
|
|
|||||||||||
|
Impaired loans:
|
|
|
|
|
|||||||||||
|
Real estate loans:
|
|
|
|
|
|||||||||||
|
Commercial real estate
|
$
|
4,645
|
|
$
|
—
|
|
$
|
—
|
|
$
|
4,645
|
|
|||
|
One-to-four family residential mortgage
|
1,735
|
|
—
|
|
—
|
|
1,735
|
|
|||||||
|
Multifamily
|
51
|
|
—
|
|
—
|
|
51
|
|
|||||||
|
Home equity and lines of credit
|
31
|
|
—
|
|
—
|
|
31
|
|
|||||||
|
Total impaired real estate loans
|
6,462
|
|
—
|
|
—
|
|
6,462
|
|
|||||||
|
Commercial and industrial loans
|
21
|
|
—
|
|
—
|
|
21
|
|
|||||||
|
Other real estate owned
|
850
|
|
—
|
|
—
|
|
850
|
|
|||||||
|
Total
|
$
|
7,333
|
|
$
|
—
|
|
$
|
—
|
|
$
|
7,333
|
|
|||
116
NORTHFIELD BANCORP, INC. AND SUBSIDIARIES
Notes to Consolidated Financial Statements - (Continued)
|
|
Fair Value Measurements at December 31, 2016 Using:
|
||||||||||||||
|
|
Carrying Value
|
Quoted Prices in Active Markets for Identical Assets (Level 1)
|
Significant Other Observable
Inputs (Level 2)
|
Significant Unobservable
Inputs
(Level 3)
|
|||||||||||
|
|
(in thousands)
|
||||||||||||||
|
Measured on a recurring basis:
|
|
||||||||||||||
|
Assets:
|
|
|
|
|
|||||||||||
|
Investment securities:
|
|
|
|
|
|||||||||||
|
Available-for-sale:
|
|
|
|
|
|||||||||||
|
Mortgage-backed securities
|
|
|
|
|
|||||||||||
|
GSE
|
$
|
448,842
|
|
$
|
—
|
|
$
|
448,842
|
|
$
|
—
|
|
|||
|
Non-GSE
|
270
|
|
—
|
|
270
|
|
—
|
|
|||||||
|
Debt securities
|
|||||||||||||||
|
Municipal Bonds
|
2,158
|
|
2,158
|
|
—
|
|
|||||||||
|
Corporate bonds
|
45,159
|
|
45,159
|
|
—
|
|
|||||||||
|
Other securities
|
|||||||||||||||
|
Equity investments - mutual funds
|
1,218
|
|
271
|
|
947
|
|
—
|
|
|||||||
|
Other
|
1,250
|
|
1,250
|
|
—
|
|
|||||||||
|
Total available-for-sale
|
498,897
|
|
271
|
|
498,626
|
|
—
|
|
|||||||
|
Trading securities
|
7,857
|
|
7,857
|
|
—
|
|
—
|
|
|||||||
|
Total
|
$
|
506,754
|
|
$
|
8,128
|
|
$
|
498,626
|
|
$
|
—
|
|
|||
|
Measured on a non-recurring basis:
|
|
|
|
|
|||||||||||
|
Assets:
|
|
|
|
|
|||||||||||
|
Impaired loans:
|
|
|
|
|
|||||||||||
|
Real estate loans:
|
|
|
|
|
|||||||||||
|
Commercial real estate
|
$
|
10,730
|
|
$
|
—
|
|
$
|
—
|
|
$
|
10,730
|
|
|||
|
One-to-four family residential mortgage
|
2,177
|
|
—
|
|
—
|
|
2,177
|
|
|||||||
|
Multifamily
|
1,276
|
|
—
|
|
—
|
|
1,276
|
|
|||||||
|
Home equity and lines of credit
|
274
|
|
—
|
|
—
|
|
274
|
|
|||||||
|
Total impaired real estate loans
|
14,457
|
|
—
|
|
—
|
|
14,457
|
|
|||||||
|
Commercial and industrial loans
|
21
|
|
—
|
|
—
|
|
21
|
|
|||||||
|
Other real estate owned
|
850
|
|
—
|
|
—
|
|
850
|
|
|||||||
|
Total
|
$
|
15,328
|
|
$
|
—
|
|
$
|
—
|
|
$
|
15,328
|
|
|||
The following table presents qualitative information for Level 3 assets measured at fair value on a non-recurring basis at
December 31, 2017
:
|
|
Fair Value
|
Valuation Methodology
|
Unobservable Inputs
|
Range of Inputs
|
|||||
|
|
(in thousands)
|
|
|
|
|||||
|
Impaired loans
|
$
|
6,483
|
|
Appraisals
|
Discount for costs to sell
|
7.0%
|
|||
|
|
|
|
Discount for quick sale
|
10.0%
|
|||||
|
|
|
Discounted cash flows
|
Interest rates
|
3.13% - 6.5%
|
|||||
|
Other real estate owned
|
$
|
850
|
|
Appraisals
|
Discount for costs to sell
|
7.0%
|
|||
The following table presents qualitative information for Level 3 assets measured at fair value on a non-recurring basis at
December 31, 2016
:
117
NORTHFIELD BANCORP, INC. AND SUBSIDIARIES
Notes to Consolidated Financial Statements - (Continued)
|
|
Fair Value
|
Valuation Methodology
|
Unobservable Inputs
|
Range of Inputs
|
|||||
|
|
(in thousands)
|
|
|
|
|||||
|
Impaired loans
|
$
|
14,478
|
|
Appraisals
|
Discount for costs to sell
|
7.0%
|
|||
|
|
|
|
Discount for quick sale
|
10.0%
|
|||||
|
|
|
Discounted cash flows
|
Interest rates
|
4.75% - 7.5%
|
|||||
|
Other real estate owned
|
$
|
850
|
|
Appraisals
|
Discount for costs to sell
|
7.0%
|
|||
Available-for-Sale Securities:
The estimated fair values for mortgage-backed
securities, GSE bonds,
and corporate securities are obtained from a nationally recognized third-party pricing service. The estimated fair values are derived primarily from cash flow models, which include assumptions for interest rates, credit losses, and prepayment speeds. Broker/dealer quotes are utilized as well when such quotes are available and deemed representative of the market. The significant inputs utilized in the cash flow models are based on market data obtained from sources independent of the Company (observable inputs,) and are therefore classified as Level 2 within the fair value hierarchy. The estimated fair value of equity securities classified as Level 1, are derived from quoted market prices in active markets. Equity securities consist primarily of money market mutual funds. There were
no
transfers of securities between Level 1 and Level 2 during the year ended
December 31, 2017
.
Trading Securities:
Fair values are derived from quoted market prices in active markets. The assets consist of publicly traded mutual funds.
Impaired Loans:
At
December 31, 2017
,
and
December 31, 2016
, the Company had
originated
impaired loans
held-for-investment
with outstanding principal balances of
$8.8 million
and
$17.7 million
that were recorded at their estimated fair value of
$6.5 million
and
$14.5 million
, respectively. The Company recorded a net decrease in the specific reserve for impaired loans of
$246,000
and
$562,000
for the
years ended
December 31, 2017
and
2016
, respectively, and
net
recoveries of
$154,000
and
net
charge-offs
of
$810,000
for the
years ended
December 31, 2017
and
2016
,
respectively, utilizing Level 3 inputs. For purposes of estimating fair value of impaired loans, management utilizes independent appraisals, if the loan is collateral dependent, adjusted downward by management, as necessary, for changes in relevant valuation factors subsequent to the appraisal date, or the present value of expected future cash flows for non-collateral dependent loans and troubled debt restructurings.
Other Real Estate Owned:
At
December 31, 2017
and
2016
, the Company had assets acquired through foreclosure of
$850,000
, recorded at estimated fair value, less estimated selling costs when acquired, thus establishing a new cost basis. Estimated fair value is generally based on independent appraisals. These appraisals include adjustments to comparable assets based on the appraisers’ market knowledge and experience, and are considered Level 3 inputs. When an asset is acquired, the excess of the loan balance over fair value, less estimated selling costs, is charged to the allowance for loan losses. If the estimated fair value of the asset declines, a write-down is recorded through non-interest expense. The valuation of foreclosed assets is subjective in nature and may be adjusted in the future because of changes in the economic conditions.
In addition,
the Company may be required, from time to time, to measure the fair value of certain other financial assets on a nonrecurring basis in accordance with U.S. GAAP. The adjustments to fair value usually result from the application of lower-of-cost-or-market accounting or write downs of individual assets.
Fair Value of Financial Instruments
The FASB Accounting Standards Topic for
Financial Instruments
requires disclosure of the fair value
of financial assets and financial liabilities, including those financial assets and financial liabilities that are not measured and reported at fair value on a recurring or non-recurring basis. The methodologies for estimating the fair value of financial assets and financial liabilities that are measured at fair value on a recurring or non-recurring basis are discussed above. The following methods and assumptions were used to estimate the fair value of other financial assets and financial liabilities not already discussed above:
|
(a)
|
Cash, Cash Equivalents
|
Cash and cash equivalents are short-term in nature with original maturities of
three months or less
; the carrying amount approximates fair value.
118
NORTHFIELD BANCORP, INC. AND SUBSIDIARIES
Notes to Consolidated Financial Statements - (Continued)
|
(b)
|
Securities (Held-to-Maturity)
|
The estimated fair values for substantially all of our securities are obtained from an independent nationally recognized pricing service. The independent pricing service utilizes market prices of same or similar securities whenever such prices are available. Prices involving distressed sellers are not utilized in determining fair value. Where necessary, the independent third-party pricing service estimates fair value using models employing techniques such as discounted cash flow analyses. The assumptions used in these models typically include assumptions for interest rates, credit losses, and prepayments, utilizing market observable data where available.
|
(c)
|
Federal Home Loan Bank of New York Stock
|
The fair value for FHLB of New York stock is its carrying value, since this is the amount for which it could be redeemed and there is no active market for this stock.
|
(d)
|
Loans (Held-for-Investment)
|
Fair values are estimated for portfolios of loans with similar financial characteristics. Loans are segregated by type such as originated and purchased, and further segregated by residential mortgage, construction, land, multifamily, commercial and consumer. Each loan category is further segmented into amortizing and non-amortizing and fixed and adjustable rate interest terms and by performing and non-performing categories. The fair value of loans is estimated by discounting the future cash flows using current prepayment assumptions and current rates at which similar loans would be made to borrowers with similar credit ratings and for the same remaining maturities. This method of estimating fair value does not incorporate the exit price concept of fair value prescribed by the FASB ASC Topic for Fair Value Measurements and Disclosures, which would also consider adjustments for other factors such as liquidity and credit quality. The fair value would be affected significantly by these other factors.
|
(e)
|
Loans (Held-for-Sale)
|
Held-for-sale loans are carried at the lower of aggregate cost or estimated fair value, less costs to sell, and therefore fair value is equal to carrying value.
|
(f)
|
Deposits
|
The fair value of deposits with no stated maturity, such as non-interest-bearing demand deposits, savings, NOW and money market accounts, is equal to the amount payable on demand. The fair value of certificates of deposit is based on the discounted value of contractual cash flows. The discount rate is estimated using the rates currently offered for deposits of similar remaining maturities.
|
(g)
|
Commitments to Extend Credit and Standby Letters of Credit
|
The fair value of commitments to extend credit and standby letters of credit are estimated using the fees currently charged to enter into similar agreements, taking into account the remaining terms of the agreements and the present creditworthiness of the counterparties. For fixed-rate loan commitments, fair value also considers the difference between current levels of interest rates and the committed rates. The fair value of off-balance-sheet commitments is insignificant and therefore not included in the following table.
|
(h)
|
Borrowings
|
The fair value of borrowings is estimated by discounting future cash flows based on rates currently available for debt with similar terms and remaining maturity.
|
(i)
|
Advance Payments by Borrowers for Taxes and Insurance
|
Advance payments by borrowers for taxes and insurance have no stated maturity; the fair value is equal to the amount currently payable.
119
NORTHFIELD BANCORP, INC. AND SUBSIDIARIES
Notes to Consolidated Financial Statements - (Continued)
The estimated fair values of the Company’s significant financial instruments at
December 31, 2017
and
2016
, are presented in the following table (in thousands):
|
|
December 31, 2017
|
||||||||||||||||||
|
|
|
Estimated Fair Value
|
|||||||||||||||||
|
|
Carrying Value
|
Level 1
|
Level 2
|
Level 3
|
Total
|
||||||||||||||
|
Financial assets:
|
|
|
|
|
|
||||||||||||||
|
Cash and cash equivalents
|
$
|
57,839
|
|
$
|
57,839
|
|
$
|
—
|
|
$
|
—
|
|
$
|
57,839
|
|
||||
|
Trading securities
|
9,597
|
|
9,597
|
|
—
|
|
—
|
|
9,597
|
|
|||||||||
|
Securities available-for-sale
|
515,121
|
|
323
|
|
514,798
|
|
—
|
|
515,121
|
|
|||||||||
|
Securities held-to-maturity
|
9,931
|
|
—
|
|
9,892
|
|
—
|
|
9,892
|
|
|||||||||
|
FHLB of New York stock, at cost
|
25,046
|
|
—
|
|
25,046
|
|
—
|
|
25,046
|
|
|||||||||
|
Net loans held-for-investment
|
3,114,659
|
|
—
|
|
—
|
|
3,157,829
|
|
3,157,829
|
|
|||||||||
|
Financial liabilities:
|
|
|
|
|
|||||||||||||||
|
Deposits
|
$
|
2,836,979
|
|
$
|
—
|
|
$
|
2,839,666
|
|
$
|
—
|
|
$
|
2,839,666
|
|
||||
|
Repurchase agreements and other borrowings
|
471,549
|
|
—
|
|
466,625
|
|
—
|
|
466,625
|
|
|||||||||
|
Advance payments by borrowers
|
14,798
|
|
—
|
|
14,798
|
|
—
|
|
14,798
|
|
|||||||||
|
|
December 31, 2016
|
||||||||||||||||||
|
|
|
Estimated Fair Value
|
|||||||||||||||||
|
|
Carrying Value
|
Level 1
|
Level 2
|
Level 3
|
Total
|
||||||||||||||
|
Financial assets:
|
|
|
|
|
|
||||||||||||||
|
Cash and cash equivalents
|
$
|
96,085
|
|
$
|
96,085
|
|
$
|
—
|
|
$
|
—
|
|
$
|
96,085
|
|
||||
|
Trading securities
|
7,857
|
|
7,857
|
|
—
|
|
—
|
|
7,857
|
|
|||||||||
|
Securities available-for-sale
|
498,897
|
|
271
|
|
498,626
|
|
—
|
|
498,897
|
|
|||||||||
|
Securities held-to-maturity
|
10,148
|
|
—
|
|
10,118
|
|
—
|
|
10,118
|
|
|||||||||
|
FHLB of New York stock, at cost
|
25,123
|
|
—
|
|
25,123
|
|
—
|
|
25,123
|
|
|||||||||
|
Net loans held-for-investment
|
2,943,489
|
|
—
|
|
—
|
|
2,970,438
|
|
2,970,438
|
|
|||||||||
|
Financial liabilities:
|
|
|
|
|
|
||||||||||||||
|
Deposits
|
$
|
2,713,587
|
|
$
|
—
|
|
$
|
2,720,176
|
|
$
|
—
|
|
$
|
2,720,176
|
|
||||
|
Repurchase agreements and other borrowings
|
473,206
|
|
—
|
|
472,387
|
|
—
|
|
472,387
|
|
|||||||||
|
Advance payments by borrowers
|
12,331
|
|
—
|
|
12,331
|
|
—
|
|
12,331
|
|
|||||||||
Limitations
Fair value estimates are made at a specific point in time, based on relevant market information and information about the financial instrument. These estimates do not reflect any premium or discount that could result from offering for sale at one time the Company’s entire holdings of a particular financial instrument. Because no market exists for a significant portion of the Company’s financial instruments, fair value estimates are based on judgments regarding future expected loss experience, current economic conditions, risk characteristics of various financial instruments, and other factors. These estimates are subjective in nature and involve uncertainties and matters of significant judgment and, therefore, cannot be determined with a high degree of precision. Changes in assumptions could significantly affect the estimates.
Fair value estimates are based on existing on- and off-balance sheet financial instruments without attempting to estimate the value of anticipated future business and the value of assets and liabilities that are not considered financial instruments.
In addition, the tax ramifications related to the realization of the unrealized gains and losses can have a significant effect on fair value estimates and have not been considered in the estimates.
120
|
(15)
|
Earnings Per Share
|
The following is a summary of the Company’s earnings per share calculations and reconciliation of basic to diluted earnings per share for the periods indicated (in thousands, except share data):
|
|
December 31,
|
||||||||||
|
|
2017
|
2016
|
2015
|
||||||||
|
Net income available to common stockholders
|
$
|
24,768
|
|
$
|
26,130
|
|
$
|
19,531
|
|
||
|
Weighted average shares outstanding-basic
|
45,325,445
|
|
44,374,389
|
|
42,285,712
|
|
|||||
|
Effect of non-vested restricted stock and stock options outstanding
|
1,550,285
|
|
1,343,498
|
|
1,192,769
|
|
|||||
|
Weighted average shares outstanding-diluted
|
46,875,730
|
|
45,717,887
|
|
43,478,481
|
|
|||||
|
Earnings per share-basic
|
$
|
0.55
|
|
$
|
0.59
|
|
$
|
0.46
|
|
||
|
Earnings per share-diluted
|
$
|
0.53
|
|
$
|
0.57
|
|
$
|
0.45
|
|
||
|
Anti-dilutive shares
|
334,927
|
|
777,733
|
|
2,679,507
|
|
|||||
Diluted earnings per share is computed using the same method as basic earnings per share, but reflects the potential dilution that could occur if stock options and unvested shares of restricted stock were exercised and converted into common stock. These potentially dilutive shares would then be included in the weighted average number of shares outstanding for the period using the treasury stock method. The Company adopted ASU No. 2016-09 effective January 1, 2017. The most significant impact of the amended guidance resulted in recognition of excess tax benefits within income tax expense, which resulted in an increase to net income and earnings per share. In addition, the guidance increases average diluted shares, since the Company no longer includes such excess tax benefits in the calculation of diluted shares. For further discussion, see Note 1 - “Summary of Significant Accounting Policies - Net Income per Common Share”.
121
NORTHFIELD BANCORP, INC. AND SUBSIDIARIES
Notes to Consolidated Financial Statements - (Continued)
|
(16)
|
Parent-only Financial Information
|
The following condensed parent company only financial information reflects Northfield Bancorp, Inc.’s investment in its wholly-owned consolidated subsidiary, Northfield Bank, using the equity method of accounting.
Northfield Bancorp, Inc.
Condensed Balance Sheets
|
|
December 31,
|
||||||
|
|
2017
|
2016
|
|||||
|
|
(in thousands)
|
||||||
|
Assets
|
|
|
|||||
|
Cash in Northfield Bank
|
$
|
20,080
|
|
$
|
8,953
|
|
|
|
Interest-earning deposits in other financial institutions
|
21
|
|
21
|
|
|||
|
Investment in Northfield Bank
|
594,385
|
|
588,856
|
|
|||
|
ESOP loan receivable
|
24,021
|
|
25,043
|
|
|||
|
Other assets
|
1,185
|
|
118
|
|
|||
|
Total assets
|
$
|
639,692
|
|
$
|
622,991
|
|
|
|
Liabilities and Stockholders' Equity
|
|
|
|||||
|
Total liabilities
|
$
|
815
|
|
$
|
1,795
|
|
|
|
Total stockholders' equity
|
638,877
|
|
621,196
|
|
|||
|
Total liabilities and stockholders' equity
|
$
|
639,692
|
|
$
|
622,991
|
|
|
Northfield Bancorp, Inc.
Condensed Statements of Comprehensive Income (Loss)
|
|
Years Ended
|
||||||||||
|
|
December 31,
|
||||||||||
|
2017
|
2016
|
2015
|
|||||||||
|
|
(in thousands)
|
||||||||||
|
Interest on ESOP loan
|
$
|
939
|
|
$
|
913
|
|
$
|
875
|
|
||
|
Interest income on deposit in Northfield Bank
|
31
|
|
31
|
|
51
|
|
|||||
|
Gains (losses) on securities transactions, net
|
5
|
|
4
|
|
(4
|
)
|
|||||
|
Undistributed earnings of Northfield Bank
|
24,887
|
|
26,303
|
|
19,718
|
|
|||||
|
Total income
|
25,862
|
|
27,251
|
|
20,640
|
|
|||||
|
Other expenses
|
872
|
|
936
|
|
891
|
|
|||||
|
Income tax expense
|
222
|
|
185
|
|
218
|
|
|||||
|
Total expense
|
1,094
|
|
1,121
|
|
1,109
|
|
|||||
|
Net income
|
$
|
24,768
|
|
$
|
26,130
|
|
$
|
19,531
|
|
||
|
Comprehensive income:
|
|
|
|
||||||||
|
Net income
|
$
|
24,768
|
|
$
|
26,130
|
|
$
|
19,531
|
|
||
|
Other comprehensive loss, net of tax
|
(227
|
)
|
(1,346
|
)
|
(2,221
|
)
|
|||||
|
Comprehensive income
|
$
|
24,541
|
|
$
|
24,784
|
|
$
|
17,310
|
|
||
122
NORTHFIELD BANCORP, INC. AND SUBSIDIARIES
Notes to Consolidated Financial Statements - (Continued)
Northfield Bancorp, Inc.
Condensed Statements of Cash Flows
|
|
December 31,
|
||||||||||
|
|
2017
|
2016
|
2015
|
||||||||
|
|
(in thousands)
|
||||||||||
|
Cash flows from operating activities
|
|
|
|
|
|||||||
|
Net income
|
$
|
24,768
|
|
$
|
26,130
|
|
|
$
|
19,531
|
|
|
|
Adjustments to reconcile net income to net cash provided by operating activities:
|
|
|
|
|
|||||||
|
Increase in other assets
|
(2,008
|
)
|
(1,994
|
)
|
|
(457
|
)
|
||||
|
(Gains) losses on securities transactions, net
|
(5
|
)
|
(4
|
)
|
|
4
|
|
||||
|
(Decrease) increase in other liabilities
|
(980
|
)
|
1,238
|
|
|
377
|
|
||||
|
Undistributed earnings of Northfield Bank
|
(24,887
|
)
|
(26,303
|
)
|
|
(19,718
|
)
|
||||
|
Net cash used in operating activities
|
(3,112
|
)
|
(933
|
)
|
|
(263
|
)
|
||||
|
Cash flows from investing activities
|
|
|
|
|
|
|
|
||||
|
Cash consideration paid for business acquisition
|
—
|
|
(13,644
|
)
|
—
|
|
|||||
|
Dividends from Northfield Bank
|
28,763
|
|
14,700
|
|
25,900
|
|
|||||
|
Net cash provided by investing activities
|
28,763
|
|
1,056
|
|
25,900
|
|
|||||
|
Cash flows from financing activities
|
|
|
|
|
|
|
|
||||
|
Principal payments on ESOP loan receivable
|
1,022
|
|
969
|
|
|
922
|
|
||||
|
Purchase of treasury stock
|
—
|
|
(2,201
|
)
|
|
(48,446
|
)
|
||||
|
Dividends paid
|
(15,646
|
)
|
(14,074
|
)
|
|
(12,184
|
)
|
||||
|
Exercise of stock options
|
100
|
|
120
|
|
|
158
|
|
||||
|
Additional tax benefit on stock awards
|
—
|
|
1,512
|
|
|
122
|
|
||||
|
Net cash used in financing activities
|
(14,524
|
)
|
(13,674
|
)
|
(59,428
|
)
|
|||||
|
Net increase (decrease) in cash and cash equivalents
|
11,127
|
|
(13,551
|
)
|
|
(33,791
|
)
|
||||
|
Cash and cash equivalents at beginning of year
|
8,974
|
|
22,525
|
|
|
56,316
|
|
||||
|
Cash and cash equivalents at end of year
|
$
|
20,101
|
|
$
|
8,974
|
|
|
$
|
22,525
|
|
|
123
NORTHFIELD BANCORP, INC. AND SUBSIDIARIES
Notes to Consolidated Financial Statements - (Continued)
(17) Selected Quarterly Financial Data (Unaudited)
The following tables are a summary of certain quarterly financial data for the years ended
December 31, 2017
and
2016
:
|
|
2017 Quarter Ended
|
||||||||||||||
|
|
March 31
|
June 30
|
September 30
|
December 31
|
|||||||||||
|
|
(Dollars in thousands, except per share data)
|
||||||||||||||
|
Selected Operating Data:
|
|
|
|
|
|||||||||||
|
Interest income
|
$
|
32,069
|
|
$
|
32,660
|
|
$
|
33,525
|
|
$
|
34,615
|
|
|||
|
Interest expense
|
5,392
|
|
5,751
|
|
6,173
|
|
6,660
|
|
|||||||
|
Net interest income
|
26,677
|
|
26,909
|
|
27,352
|
|
27,955
|
|
|||||||
|
Provision for loan losses
|
372
|
|
511
|
|
488
|
|
40
|
|
|||||||
|
Net interest income after provision for loan losses
|
26,305
|
|
26,398
|
|
26,864
|
|
27,915
|
|
|||||||
|
Other income
|
4,147
|
|
2,437
|
|
2,615
|
|
2,443
|
|
|||||||
|
Other expenses
|
17,544
|
|
16,618
|
|
16,828
|
|
16,388
|
|
|||||||
|
Income before income tax expense
|
12,908
|
|
12,217
|
|
12,651
|
|
13,970
|
|
|||||||
|
Income tax expense
|
2,960
|
|
3,807
|
|
4,525
|
|
15,686
|
|
|||||||
|
Net income (loss)
|
$
|
9,948
|
|
$
|
8,410
|
|
$
|
8,126
|
|
$
|
(1,716
|
)
|
|||
|
Net income per basic common share
|
$
|
0.22
|
|
$
|
0.19
|
|
$
|
0.18
|
|
$
|
(0.04
|
)
|
|||
|
Net income per diluted common share
|
$
|
0.21
|
|
$
|
0.18
|
|
$
|
0.17
|
|
$
|
(0.04
|
)
|
|||
|
|
2016 Quarter Ended
|
||||||||||||||
|
|
March 31
|
June 30
|
September 30
|
December 31
|
|||||||||||
|
|
(Dollars in thousands, except per share data)
|
||||||||||||||
|
Selected Operating Data:
|
|
|
|
|
|||||||||||
|
Interest income
|
$
|
30,169
|
|
$
|
31,168
|
|
$
|
31,525
|
|
$
|
32,110
|
|
|||
|
Interest expense
|
5,441
|
|
5,527
|
|
5,274
|
|
5,426
|
|
|||||||
|
Net interest income
|
24,728
|
|
25,641
|
|
26,251
|
|
26,684
|
|
|||||||
|
Provision (recoveries) for loan losses
|
(131
|
)
|
14
|
|
472
|
|
280
|
|
|||||||
|
Net interest income after provision for loan losses
|
24,859
|
|
25,627
|
|
25,779
|
|
26,404
|
|
|||||||
|
Other income
|
2,229
|
|
2,533
|
|
2,667
|
|
2,643
|
|
|||||||
|
Other expenses
|
21,499
|
|
17,494
|
|
17,377
|
|
16,576
|
|
|||||||
|
Income before income tax expense
|
5,589
|
|
10,666
|
|
11,069
|
|
12,471
|
|
|||||||
|
Income tax expense
|
1,929
|
|
3,681
|
|
3,782
|
|
4,273
|
|
|||||||
|
Net income
|
$
|
3,660
|
|
$
|
6,985
|
|
$
|
7,287
|
|
$
|
8,198
|
|
|||
|
Net income per basic common share
|
$
|
0.08
|
|
$
|
0.16
|
|
$
|
0.16
|
|
$
|
0.18
|
|
|||
|
Net income per diluted common share
|
$
|
0.08
|
|
$
|
0.15
|
|
$
|
0.16
|
|
$
|
0.18
|
|
|||
124
|
ITEM 9.
|
CHANGES IN AND DISAGREEMENTS WITH ACCOUNTANTS ON ACCOUNTING
AND FINANCIAL DISCLOSURE
|
None
|
ITEM 9A.
|
CONTROLS AND PROCEDURES
|
Evaluation of Disclosure Controls and Procedures
Steven M. Klein, our President and Chief Executive Officer, and William R. Jacobs, our Chief Financial Officer, conducted an evaluation of the effectiveness of our disclosure controls and procedures (as defined in Rule 13a-15(e) and 15d-15(e) under the Securities Exchange Act of 1934, as amended) or (the Exchange Act) as of
December 31, 2017
. Based upon their evaluation, they each found that our disclosure controls and procedures were effective.
Changes in Internal Control Over Financial Reporting
There were no changes in our internal control over financial reporting that occurred during the fourth quarter of
2017
that have materially affected, or are reasonably likely to materially affect, our internal control over financial reporting and we identified no material weaknesses requiring corrective action with respect to those controls.
Management Report on Internal Control Over Financial Reporting
Management of the Company is responsible for establishing and maintaining effective internal control over financial reporting as such term is defined in Rule 13a-15(f) of the Exchange Act. The Company’s internal control system is a process designed to provide reasonable assurance to the Company’s management and board of directors regarding the preparation and fair presentation of published financial statements.
Our internal control over financial reporting includes policies and procedures that pertain to the maintenance of records that, in reasonable detail, accurately and fairly reflect transactions and dispositions of assets; provide reasonable assurances that transactions are recorded as necessary to permit preparation of financial statements in accordance with U.S. generally accepted accounting principles, and that receipts and expenditures are being made only in accordance with authorizations of management and the directors of the Company; and provide reasonable assurance regarding prevention or timely detection of unauthorized acquisition, use or disposition of the Company’s assets that could have a material effect on our financial statements.
All internal control systems, no matter how well designed, have inherent limitations. Therefore, even those systems determined to be effective can provide only reasonable assurance with respect to financial statement preparation and presentation. Also, projections of any evaluation of effectiveness to future periods are subject to the risk that controls may become inadequate because of changes in conditions, or that the degree of compliance with the policies or procedures may deteriorate.
The Company’s management assessed the effectiveness of the Company’s internal control over financial reporting as of
December 31, 2017
. In making this assessment, we used the criteria set forth by the Committee of Sponsoring Organizations of the Treadway Commission in
Internal Control-Integrated Framework
(2013). Based on our assessment we believe that, as of
December 31, 2017
, the Company’s internal control over financial reporting is effective based on those criteria.
The Company’s independent registered public accounting firm that audited the consolidated financial statements has issued an audit report on the effectiveness of the Company’s internal control over financial reporting as of
December 31, 2017
, and it is included in Item 8, under Part II of this Annual Report on Form 10-K. This report appears on page 67 of this document.
|
ITEM 9B.
|
OTHER INFORMATION
|
None
125
|
ITEM 10.
|
DIRECTORS, EXECUTIVE OFFICERS AND CORPORATE GOVERNANCE
|
The sections of the Company’s definitive proxy statement for the Company’s
2018
Annual Meeting of the Stockholders (the “
2018
Proxy Statement”) entitled “Proposal I-Election of Directors,” “Corporate Governance and Board Matters-Director and Director Nominee Evaluation Process,” “Executive Officers who are not Directors” “Other Information-Section 16(a) Beneficial Ownership Reporting Compliance,” “Corporate Governance and Board Matters - Codes of Conduct and Ethics,” “Stockholder Communications,” and “Board of Directors, Leadership Structure, Role in Risk Oversight, Meetings and Standing Committees-Audit Committee” are incorporated herein by reference.
A copy of the Code of Conduct and Ethics for Employees, Officers, and Directors and the Code of Conduct and Ethics for Senior Financial Officers is available to shareholders under the investor relations tab on the Company's website at www.eNorthfield.com.
|
ITEM 11.
|
EXECUTIVE COMPENSATION
|
The sections of the Company’s
2018
Proxy Statement entitled “Corporate Governance and Board Matters-Director Compensation” and “Executive Compensation” are incorporated herein by reference.
|
ITEM 12.
|
SECURITY OWNERSHIP OF CERTAIN BENEFICIAL OWNERS AND MANAGEMENT AND RELATED STOCKHOLDER MATTERS
|
The section of the Company’s
2018
Proxy Statement entitled “Voting Securities and Principal Holders Thereof” is incorporated herein by reference.
Set forth below is information as of
December 31, 2017
, with respect to compensation plans (other than our employee stock ownership plan) under which equity securities of the Company are authorized for issuance:
|
|
Equity Compensation Plan Information
|
||||||||
|
|
Number of Securities to be Issued Upon Exercise of Outstanding Options, Warrants and Rights
|
Weighted-Average Exercise Price of Outstanding Options, Warrants and Rights
(1)
|
Number of Securities Remaining Available for Future Issuance Under Stock-Based Compensation Plans (Excluding Securities Reflected in First Column)
|
||||||
|
Equity compensation plans approved by security holders
|
4,620,687
|
|
$
|
11.82
|
|
499,766
|
|
||
|
Equity compensation plans not approved by security holders
|
N/A
|
|
N/A
|
|
N/A
|
|
|||
|
Total
|
4,620,687
|
|
$
|
11.82
|
|
499,766
|
|
||
(1)
Represents the weighted average exercise price of outstanding options at
December 31, 2017
.
|
ITEM 13.
|
CERTAIN RELATIONSHIPS AND RELATED TRANSACTIONS, AND DIRECTOR INDEPENDENCE
|
The sections of the Company’s
2018
Proxy Statement entitled “Corporate Governance and Board Matters-Transactions with Certain Related Persons” and “Board of Directors, Leadership Structure, Role in Oversight, Meetings and Standing Committees - Board of Directors
” are
incorporated herein by reference.
|
ITEM 14.
|
PRINCIPAL ACCOUNTING FEES AND SERVICES
|
The sections of the Company’s
2018
Proxy Statement entitled “Audit-Related Matters-Policy for Approval of Audit and Permitted Non-audit Services” and “Auditor Fees and Services” are incorporated herein by reference.
126
|
ITEM 15.
|
EXHIBITS AND FINANCIAL STATEMENT SCHEDULES
|
(a)(1)
Financial Statements
The following documents are filed as part of this Form 10-K.
(A) Reports of Independent Registered Public Accounting Firm
(B) Consolidated Balance Sheets - at
December 31, 2017
, and
2016
(C) Consolidated Statements of Comprehensive Income - Years ended
December 31, 2017
,
2016
, and
2015
(D) Consolidated Statements of Changes in Stockholders’ Equity - Years ended
December 31, 2017
,
2016
, and
2015
(E) Consolidated Statements of Cash Flows - Years ended
December 31, 2017
,
2016
, and
2015
(F) Notes to Consolidated Financial Statements.
|
(a)(2)
|
Exhibits
|
|
Certificate of Incorporation of Northfield Bancorp, Inc. (4)
|
|
|
Bylaws of Northfield Bancorp, Inc. (4)
|
|
|
Form of Common Stock Certificate of Northfield Bancorp, Inc.(4)
|
|
|
Short Term Disability and Long Term Disability for Senior Management (1) †
|
|
|
Northfield Bank Non-Qualified Deferred Compensation Plan (3) †
|
|
|
Northfield Bank Non-Qualified Supplemental Employee Stock Ownership Plan (3) †
|
|
|
Amendment to Northfield Bank Non-Qualified Deferred Compensation Plan (6) †
|
|
|
Amendment to Northfield Bank Non-Qualified Supplemental Employee Stock Ownership Plan (6) †
|
|
|
Northfield Bancorp, Inc. 2008 Equity Incentive Plan (5) †
|
|
|
Form of Director Non-Statutory Stock Option Award Agreement under the 2008 Equity Incentive Plan (6) †
|
|
|
Form of Director Restricted Stock Award Agreement under the 2008 Equity Incentive Plan (6) †
|
|
|
Form of Employee Non-Statutory Stock Option Award Agreement under the 2008 Equity Incentive Plan (6) †
|
|
|
Form of Employee Incentive Stock Option Award Agreement under the 2008 Equity Incentive Plan (6) †
|
|
|
Form of Employee Restricted Stock Award Agreement under the 2008 Equity Incentive Plan (6) †
|
|
|
Group Term Replacement Plan (7) †
|
|
|
Northfield Bancorp, Inc. 2014 Equity Incentive Plan (8) †
|
|
|
Form of Employee Stock Option Award Agreement under the 2014 Equity Incentive Plan with the Exception of John W. Alexander and Steven M. Klein (9) †
|
|
|
Form of Employee Restricted Stock Award Agreement under the 2014 Equity Incentive Plan with John W. Alexander and Steven M. Klein (9) †
|
|
|
Form of Director Restricted Stock Award Agreement under the 2014 Equity Incentive Plan (9) †
|
|
|
Form of amendment to restricted stock award and stock option agreements to participants of the 2014 Equity Incentive Plan (2) †
|
|
|
Form of Employee Stock Option Award Agreement under the 2014 Equity Incentive Plan with the Exception of John W. Alexander and Steven M. Klein (10) †
|
|
|
Form of Employee Stock Option Award Agreement under the 2014 Equity Incentive Plan with John W. Alexander and Steven M. Klein (10) †
|
|
|
Form of Director Non-Statutory Stock Option Award Agreement under the 2014 Equity Incentive Plan (10) †
|
|
|
Form of Employee Restricted Stock Award Agreement under the 2014 Equity Incentive Plan with the exception of John W. Alexander and Steven M. Klein (10) †
|
|
|
Form of Employee Restricted Stock Award Agreement under the 2014 Equity Incentive Plan with John W. Alexander and Steven M. Klein (10) †
|
|
|
Form of Director Restricted Stock Award Agreement under the 2014 Equity Incentive Plan (10) †
|
|
|
Northfield Bancorp, Inc. 2016 Management Cash Incentive Plan, Amended January 27, 2016 (11) †
|
|
|
Northfield Bancorp, Inc. 2017 Management Cash Incentive Plan, Amended January 25, 2017 (12) †
|
|
|
Transition Consulting Agreement between Northfield Bank and John W. Alexander (13) †
|
|
127
|
Form of Amended and Restated Employment Agreement effective November 1, 2017, with Steven M. Klein (14) †
|
|
|
10.28
|
Form of Amended and Restated Employment Agreement effective January 1, 2018, with
Kenneth J. Doherty
,
William R. Jacobs
, and
Michael J. Widmer
(15) †
|
|
Northfield Bancorp, Inc. 2018 Management Cash Incentive Plan, Amended January 24, 2018 (16) †
|
|
|
Subsidiaries of Registrant (1)
|
|
|
Consent of KPMG LLP *
|
|
|
Certification of Chief Executive Officer pursuant to Section 302 of the Sarbanes-Oxley Act of 2002 *
|
|
|
Certification of Chief Financial Officer pursuant to Section 302 of the Sarbanes-Oxley Act of 2002 *
|
|
|
Certification of Chief Executive Officer and Chief Financial Officer pursuant to Section 906 of the Sarbanes-Oxley Act of 2002*
|
|
|
101
|
The following materials from the Company’s Annual Report on Form 10-K for the year ended December 31, 2017, formatted in XBRL (Extensible Business Reporting Language): (i) the Consolidated Statements of Financial Condition, (ii) the Consolidated Statements of Comprehensive Income, (iii) the Consolidated Statements of Changes in Stockholders’ Equity, (iv) the Consolidated Statements of Cash Flows and (v) the Notes to Consolidated Financial Statements.
|
† Management contract or compensation plan or arrangement.
* Filed herewith.
|
(1)
|
Incorporated by reference to the Registration Statement on Form S-1 of Northfield Bancorp, Inc. (File No. 333-143643), originally filed with the Securities and Exchange Commission on June 11, 2007.
|
|
(2)
|
Incorporated by reference to Northfield Bancorp Inc.’s Current Report on Form 8-K, dated December 17, 2014, filed with the Securities and Exchange Commission on December 23, 2014 (File Number 001-35791).
|
|
(3)
|
Incorporated by reference to Northfield Bancorp Inc.’s Annual Report on Form 10-K, dated December 31, 2007, filed with the Securities and Exchange Commission on March 31, 2008 (File Number 001-33732).
|
|
(4)
|
Incorporated by reference to the Registration Statement on Form S-1 of Northfield Bancorp, Inc. (File No. 333-181995), originally filed with the Securities and Exchange Commission on June 8, 2012.
|
|
(5)
|
Incorporated by reference to Northfield Bancorp Inc.’s Proxy Statement Pursuant to Section 14(a) filed with the Securities and Exchange Commission on November 12, 2008 (File Number 001-33732).
|
|
(6)
|
Incorporated by reference to Northfield Bancorp Inc.’s Annual Report on Form 10-K, dated December 31, 2008, filed with the Securities and Exchange Commission on March 16, 2009 (File Number 001-33732).
|
|
(7)
|
Incorporated by reference to Northfield Bancorp Inc.’s Current Report on Form 8-K, dated April 28, 2010, filed with the Securities and Exchange Commission on April 29, 2010 (File Number 001-33732).
|
(8) Incorporated by reference to Appendix A of Northfield Bancorp Inc.’s Definitive Proxy Statement for the 2014 Annual Meeting of Stockholders (File No. 001-35791) as filed with the Securities and Exchange Commission on April 25, 2014.
|
(9)
|
Incorporated by reference to Northfield Bancorp Inc.’s Quarterly Report on Form 10-Q, dated June 30, 2014, filed with the Securities and Exchange Commission on August 11, 2014 (File Number 001-35791).
|
|
(10)
|
Incorporated by reference to Northfield Bancorp Inc.’s Quarterly Report on Form 10-Q, dated June 30, 2015, filed with the Securities and Exchange Commission on August 10, 2015 (File Number 001-35791).
|
|
(11)
|
Incorporated by reference to Northfield Bancorp Inc.’s Annual Report on Form 10-K dated December 31, 2015, filed with the Securities and Exchange Commission on March 15, 2016 (File Number 001-35791).
|
|
(12)
|
Incorporated by reference to Northfield Bancorp Inc.’s Current Report on Form 8-K dated January 25, 2017, filed with the Securities and Exchange Commission on January 30, 2017 (File Number 001-35791).
|
128
|
(13)
|
Incorporated by reference to Northfield Bancorp Inc.’s Current Report on Form 8-K dated October 6, 2017, filed with the Securities and Exchange Commission on October 10, 2017 (File Number 001-35791).
|
|
(14)
|
Incorporated by reference to Northfield Bancorp Inc.’s Current Report on Form 8-K dated October 25, 2017, filed with the Securities and Exchange Commission on October 30, 2017 (File Number 001-35791).
|
|
(15)
|
Incorporated by reference to Northfield Bancorp Inc.’s Current Report on Form 8-K dated December 13, 2017, filed with the Securities and Exchange Commission on December 19, 2017 (File Number 001-35791).
|
|
(16)
|
Incorporated by reference to Northfield Bancorp Inc.’s Current Report on Form 8-K dated January 24, 2018, filed with the Securities and Exchange Commission on January 29, 2018 (File Number 001-35791).
|
|
ITEM 16.
|
FOR 10-K SUMMARY
|
Not Applicable
129
SIGNATURES
Pursuant to the requirements of Section 13 or 15(d) of the Securities Exchange Act of 1934, the Registrant has duly caused this report to be signed on its behalf by the undersigned, thereunto duly authorized.
NORTHFIELD BANCORP, INC.
|
Date:
|
March 1, 2018
|
By:
|
/s/ Steven M. Klein
|
|
|
|
|
Steven M. Klein
|
||
|
|
|
President and Chief Executive Officer
|
||
|
|
|
(Duly Authorized Representative)
|
||
Pursuant to the requirements of the Securities Exchange of 1934, this report has been signed below by the following persons on behalf of the Registrant and in the capacities and on the dates indicated.
|
Signatures
|
Title
|
Date
|
||
|
/s/ Steven M. Klein
|
President and Chief Executive Officer (Principal Executive Officer)
|
March 1, 2018
|
||
|
Steven M. Klein
|
||||
|
/s/ William R. Jacobs
|
Executive Vice President and Chief Financial Officer
(Principal Financial and Accounting Officer)
|
March 1, 2018
|
||
|
William R. Jacobs
|
||||
|
|
|
|
||
|
/s/ John W. Alexander
|
Director
|
March 1, 2018
|
||
|
John W. Alexander
|
||||
|
|
|
|
||
|
/s/ Annette Catino
|
Director
|
March 1, 2018
|
||
|
Annette Catino
|
||||
|
|
|
|
||
|
/s/ Gil Chapman
|
Director
|
March 1, 2018
|
||
|
Gil Chapman
|
||||
|
|
||||
|
/s/ John P. Connors, Jr
|
Director
|
March 1, 2018
|
||
|
John P. Connors, Jr.
|
||||
|
/s/ Timothy C. Harrison
|
Director
|
March 1, 2018
|
||
|
Timothy C. Harrison
|
||||
|
/s/ Karen J. Kessler
|
Director
|
March 1, 2018
|
||
|
Karen J. Kessler
|
||||
|
/s/ Patrick L. Ryan
|
Director
|
March 1, 2018
|
||
|
Patrick Ryan
|
||||
|
/s/ Frank P. Patafio
|
Director
|
March 1, 2018
|
||
|
Frank P. Patafio
|
||||
|
/s/ Patrick E. Scura, Jr.
|
Director
|
March 1, 2018
|
||
|
Patrick E. Scura, Jr.
|
||||
130
TABLE OF CONTENTS
Part IItem 1. BusinessItem 1A. Risk FactorsItem 1B. Unresolved Staff CommentsItem 2. PropertiesItem 3. Legal ProceedingsItem 4. Mine Safety DisclosuresPart IIItem 5. Market For Registrant S Common Equity, Related Stockholder Matters, and Issuer Purchases Of Equity SecuritiesItem 6. Selected Financial DataItem 7. Management S Discussion and Analysis Of Financial Condition and Results Of OperationsItem 7A. Quantitative and Qualitative Disclosure About Market RiskItem 8. Financial Statements and Supplementary DataItem 9. Changes in and Disagreements with Accountants on Accounting and Financial DisclosureItem 9A. Controls and ProceduresItem 9B. Other InformationPart IIIItem 10. Directors, Executive Officers and Corporate GovernanceItem 11. Executive CompensationItem 12. Security Ownership Of Certain Beneficial Owners and Management and Related Stockholder MattersItem 13. Certain Relationships and Related Transactions, and Director IndependenceItem 14. Principal Accounting Fees and ServicesPart IVItem 15. Exhibits and Financial Statement SchedulesItem 16. For 10-k Summary