NETFLIX INC
10-Ks and 10-Qs
|
|
|
|
|
|
|
|
|
|
|
|
|
|
|
|
|
|
|
|
|
|
|
|
|
|
|
|
|
|
|
|
|
|
|
|
|
|
|
|
|
|
|
|
|
|
|
|
|
|
|
|
|
|
|
|
Washington, D.C. 20549
_____________________________________________________________________
FORM 10-K
_____________________________________________________________________
(Mark One)
|
x
|
ANNUAL REPORT PURSUANT TO SECTION 13 OR 15(d) OF THE SECURITIES EXCHANGE ACT OF 1934
|
For the fiscal year ended
December 31, 2017
OR
|
o
|
TRANSITION REPORT PURSUANT TO SECTION 13 OR 15(d) OF THE SECURITIES EXCHANGE ACT OF 1934
|
For the transition period from to
Commission File Number: 001-35727
_____________________________________________________________________
Netflix, Inc.
(Exact name of Registrant as specified in its charter)
_____________________________________________________________________
|
Delaware
|
|
77-0467272
|
|
(State or other jurisdiction of incorporation or organization)
|
|
(I.R.S. Employer Identification Number)
|
100 Winchester Circle Los Gatos, California 95032
(Address and zip code of principal executive offices)
(408) 540-3700
(Registrant’s telephone number, including area code)
_____________________________________________________________________
Securities registered pursuant to Section 12(b) of the Act:
|
Title of each class
|
|
Name of Exchange on which registered
|
|
Common stock, $0.001 par value
|
|
NASDAQ Stock Market LLC
|
|
(NASDAQ Global Select Market)
|
||
Securities registered pursuant to Section 12(g) of the Act: None
_____________________________________________________________________
Indicate by check mark if the registrant is a well-known seasoned issuer, as defined in Rule 405 of the Securities Act. Yes
x
No
o
Indicate by check mark if the registrant is not required to file reports pursuant to Section 13 or Section 15(d) of the Act. Yes
o
No
x
Indicate by check mark whether the registrant: (1) has filed all reports required to be filed by Section 13 or 15(d) of the Securities Exchange Act of 1934 during the preceding 12 months (or for such shorter period that the registrant was required to file such reports), and (2) has been subject to such filing requirements for the past 90 days. Yes
x
No
o
Indicate by check mark whether the registrant has submitted electronically and posted on its corporate Web site, if any, every Interactive Data File required to be submitted and posted pursuant to Rule 405 of Regulation S-T (§232.405 of this chapter) during the preceding 12 months (or for such shorter period that the registrant was required to submit and post such files). Yes
x
No
o
Indicate by check mark if disclosure of delinquent filers pursuant to Item 405 of Regulation S-K is not contained herein, and will not be contained, to the best of registrant’s knowledge, in definitive proxy or information statements incorporated by reference in Part III of this Form 10-K or any amendment to this Form 10-K.
x
Indicate by check mark whether the registrant is a large accelerated filer, an accelerated filer, a non-accelerated filer, a smaller reporting company, or an emerging growth company. See definition of “large accelerated filer,” “accelerated filer,” “smaller reporting company,” and “emerging growth company” in Rule 12b-2 of the Exchange Act.
|
Large accelerated filer
|
x
|
Accelerated filer
|
o
|
|
|
Non-accelerated filer
|
o
|
(Do not check if a smaller reporting company)
|
Smaller reporting company
|
o
|
|
Emerging growth company
|
o
|
|||
If an emerging growth company, indicate by check mark if the registrant has elected not to use the extended transition period for complying with any new or revised financial accounting standards provided pursuant to Section 13(a) of the Exchange Act.
o
Indicate by check mark whether the registrant is a shell company (as defined in Rule 12b-2 of the Act). Yes
o
No
x
As of
June 30, 2017
, the aggregate market value of voting stock held by non-affiliates of the registrant, based upon the closing sales price for the registrant’s common stock, as reported in the NASDAQ Global Select Market System, was
$54,917,149,461
. Shares of common stock beneficially owned by each executive officer and director of the Registrant and by each person known by the Registrant to beneficially own 10% or more of the outstanding common stock have been excluded in that such persons may be deemed to be affiliates. This determination of affiliate status is not necessarily a conclusive determination for any other purpose.
As of
January 25, 2018
, there were
433,948,461
shares of the registrant’s common stock, par value $0.001, outstanding.
DOCUMENTS INCORPORATED BY REFERENCE
Parts of the registrant’s Proxy Statement for Registrant’s 2018 Annual Meeting of Stockholders are incorporated by reference into Part III of this Annual Report on Form 10-K.
NETFLIX, INC.
TABLE OF CONTENTS
|
|
|
Page
|
|
PART I
|
||
|
Item 1.
|
||
|
Item 1A.
|
||
|
Item 1B.
|
||
|
Item 2.
|
||
|
Item 3.
|
||
|
Item 4.
|
||
|
PART II
|
||
|
Item 5.
|
||
|
Item 6.
|
||
|
Item 7.
|
||
|
Item 7A.
|
||
|
Item 8.
|
||
|
Item 9.
|
||
|
Item 9A.
|
||
|
Item 9B.
|
||
|
PART III
|
||
|
Item 10.
|
||
|
Item 11.
|
||
|
Item 12.
|
||
|
Item 13.
|
||
|
Item 14.
|
||
|
PART IV
|
||
|
Item 15.
|
||
Forward-Looking Statements
This Annual Report on Form 10-K contains forward-looking statements within the meaning of the federal securities laws. These forward-looking statements include, but are not limited to, statements regarding: our core strategy; operating income and margin; the decline in our DVD memberships and the resources allocated to our DVD segment; seasonality; contribution margins; contribution profits (losses); liquidity, including cash flows from operations, available funds and access to financing sources; free cash flows; revenues; net income; profitability; stock price volatility; pricing changes; the impact of, and the company's response to new accounting standards; action by competitors; membership growth; partnerships; nature of our content agreements; member viewing patterns; payment of future dividends; obtaining additional capital, including use of the debt market; future obligations; our content and marketing investments, including investments in original programming; amortization; significance and timing of contractual obligations; tax expense; impact of the Tax Cuts and Jobs Act of 2017, including impact on deferred tax assets and the one-time transition tax on unremitted foreign earnings; recognition of unrecognized tax benefits; and realization of deferred tax assets. These forward-looking statements are subject to risks and uncertainties that could cause actual results and events to differ. A detailed discussion of these and other risks and uncertainties that could cause actual results and events to differ materially from such forward-looking statements is included throughout this filing and particularly in Item 1A: "Risk Factors" section set forth in this Annual Report on Form 10-K. All forward-looking statements included in this document are based on information available to us on the date hereof, and we assume no obligation to revise or publicly release any revision to any such forward-looking statement, except as may otherwise be required by law.
|
Item 1.
|
Business
|
ABOUT US
Netflix, Inc. (“Netflix”, “the Company”, “we”, or “us”) is the world’s leading internet television network with over
117
million streaming memberships in over
190
countries enjoying more than
140
million hours of TV shows and movies per day, including original series, documentaries and feature films. Our members can watch as much as they want, anytime, anywhere, on nearly any internet-connected screen. Members can play, pause and resume watching, all without commercials or commitments. Additionally, in the United States ("U.S."), our members can receive DVDs delivered quickly to their homes.
We are a pioneer in the internet delivery of TV shows and movies, launching our streaming service in 2007. Since this launch, we have developed an ecosystem for internet-connected screens and have added increasing amounts of content that enable consumers to enjoy TV shows and movies directly on their internet-connected screens. As a result of these efforts, we have experienced growing consumer acceptance of, and interest in, the delivery of TV shows and movies directly over the internet.
Our core strategy is to grow our streaming membership business globally within the parameters of our profit margin targets. We are continuously improving our members' experience by expanding our streaming content with a focus on a programming mix of content that delights our members. In addition, we are continuously enhancing our user interface and extending our streaming service to more internet-connected screens. Our members can download a selection of titles for offline viewing.
We continue to grow our streaming service both domestically and internationally. We began our international expansion with Canada in 2010 and have since launched our service globally, with the exception of The People's Republic of China and territories where U.S. companies are not allowed to operate. We have also expanded our streaming content offering to include more exclusive and original programming, including several Emmy, Golden Globe and Academy Award winning original series and documentaries. Our original programming increasingly includes content that we produce.
BUSINESS SEGMENTS
The Company has three reportable segments: Domestic streaming, International streaming and Domestic DVD. The Domestic streaming segment derives revenues from monthly membership fees for services consisting solely of streaming content to our members in the United States. The International streaming segment derives revenues from monthly membership fees for services consisting solely of streaming content to our members outside the United States. The Domestic DVD segment derives revenues from monthly membership fees for services consisting solely of DVD-by-mail. For additional information regarding our segments, including information about our financial results by geography, see
Note 11
Segment Information
in the accompanying notes to our consolidated financial statements included in Part II, Item 8, "Financial Statements and Supplementary Data" of this Annual Report on Form 10-K.
1
COMPETITION
The market for entertainment video is intensely competitive and subject to rapid change. We compete against other entertainment video providers, such as multichannel video programming distributors ("MVPDs"), internet-based content providers (including those that provide pirated content), video gaming providers and DVD retailers and more broadly against other sources of entertainment that our members could choose in their moments of free time. We also compete against entertainment video providers and content producers in obtaining content for our service, both for licensed streaming content and for original content projects.
While consumers may maintain simultaneous relationships with multiple entertainment sources, we strive for consumers to choose us in their moments of free time. We have often referred to this choice as our objective of "winning moments of truth." In attempting to win these moments of truth with our members, we are continually improving our service, including both our technology and our content, which is increasingly exclusive and curated, and includes our own original programming.
SEASONALITY
Our membership growth exhibits a seasonal pattern that reflects variations when consumers buy internet-connected screens and when they tend to increase their viewing. Historically, the first and fourth quarters (October through March) represent our greatest membership growth across our Domestic and International streaming segments. Increasingly, our membership growth is impacted by the release of certain high-profile original content. Internationally, we expect each market to demonstrate more predictable seasonal patterns as our service offering in each market becomes more established and we have a longer history to assess such patterns.
INTELLECTUAL PROPERTY
We regard our trademarks, service marks, copyrights, patents, domain names, trade dress, trade secrets, proprietary technologies and similar intellectual property as important to our success. We use a combination of patent, trademark, copyright and trade secret laws and confidentiality agreements to protect our proprietary intellectual property. Our ability to protect and enforce our intellectual property rights is subject to certain risks and from time to time we encounter disputes over rights and obligations concerning intellectual property. We cannot provide assurance that we will prevail in any intellectual property disputes.
EMPLOYEES
As of
December 31, 2017
, we had approximately
5,500
total employees. Of these employees, approximately
5,400
were full-time, including approximately
600
categorized as temporary.
OTHER INFORMATION
We were incorporated in Delaware in August 1997 and completed our initial public offering in May 2002. Our principal executive offices are located at 100 Winchester Circle, Los Gatos, California 95032, and our telephone number is (408) 540-3700.
We maintain a Web site at
www.netflix.com.
The contents of our Web site are not incorporated in, or otherwise to be regarded as part of, this Annual Report on Form 10-K. In this Annual Report on Form 10-K, “Netflix,” the “Company,” “we,” “us,” “our” and the “registrant” refer to Netflix, Inc. We make available, free of charge on our Web site, access to our Annual Report on Form 10-K, our Quarterly Reports on Form 10-Q, our Current Reports on Form 8-K and amendments to those reports filed or furnished pursuant to Section 13(a) or 15(d) of the Securities Exchange Act of 1934, as amended (the "Exchange Act"), as soon as reasonably practicable after we file or furnish them electronically with the Securities and Exchange Commission ("SEC").
Investors and others should note that we announce material financial information to our investors using our investor relations Web site (
http://ir.netflix.com
), SEC filings, press releases, public conference calls and webcasts. We use these channels as well as social media to communicate with our members and the public about our company, our services and other issues. It is possible that the information we post on social media could be deemed to be material information. Therefore, we encourage investors, the media, and others interested in our company to review the information we post on the social media channels listed on our investor relations Web site.
2
|
Item 1A.
|
Risk Factors
|
If any of the following risks actually occur, our business, financial condition and results of operations could be harmed. In that case, the trading price of our common stock could decline, and you could lose all or part of your investment.
Risks Related to Our Business
If our efforts to attract and retain members are not successful, our business will be adversely affected.
We have experienced significant membership growth over the past several years. Our ability to continue to attract members will depend in part on our ability to consistently provide our members with compelling content choices, as well as a quality experience for selecting and viewing TV shows and movies. Furthermore, the relative service levels, content offerings, pricing and related features of competitors to our service may adversely impact our ability to attract and retain memberships. Competitors include other entertainment video providers, such as MVPDs, internet-based movie and TV content providers (including those that provide pirated content) and DVD retailers. If consumers do not perceive our service offering to be of value, including if we introduce new or adjust existing features, adjust pricing or service offerings, or change the mix of content in a manner that is not favorably received by them, we may not be able to attract and retain members. In addition, many of our members rejoin our service or originate from word-of-mouth advertising from existing members. If our efforts to satisfy our existing members are not successful, we may not be able to attract members, and as a result, our ability to maintain and/or grow our business will be adversely affected. Members cancel our service for many reasons, including a perception that they do not use the service sufficiently, the need to cut household expenses, availability of content is unsatisfactory, competitive services provide a better value or experience and customer service issues are not satisfactorily resolved. We must continually add new memberships both to replace canceled memberships and to grow our business beyond our current membership base. If we do not grow as expected, given, in particular that our content costs are largely fixed in nature and contracted over several years, we may not be able to adjust our expenditures or increase our (per membership) revenues commensurate with the lowered growth rate such that our margins, liquidity and results of operation may be adversely impacted. If we are unable to successfully compete with current and new competitors in both retaining our existing memberships and attracting new memberships, our business will be adversely affected. Further, if excessive numbers of members cancel our service, we may be required to incur significantly higher marketing expenditures than we currently anticipate to replace these members with new members.
Changes in competitive offerings for entertainment video, including the potential rapid adoption of piracy-based video offerings, could adversely impact our business.
The market for entertainment video is intensely competitive and subject to rapid change. Through new and existing distribution channels, consumers have increasing options to access entertainment video. The various economic models underlying these channels include subscription, transactional, ad-supported and piracy-based models. All of these have the potential to capture meaningful segments of the entertainment video market. Piracy, in particular, threatens to damage our business, as its fundamental proposition to consumers is so compelling and difficult to compete against: virtually all content for free. Furthermore, in light of the compelling consumer proposition, piracy services are subject to rapid global growth. Traditional providers of entertainment video, including broadcasters and cable network operators, as well as internet based e-commerce or entertainment video providers are increasing their internet-based video offerings. Several of these competitors have long operating histories, large customer bases, strong brand recognition and significant financial, marketing and other resources. They may secure better terms from suppliers, adopt more aggressive pricing and devote more resources to product development, technology, infrastructure, content acquisitions and marketing. New entrants may enter the market or existing providers may adjust their services with unique offerings or approaches to providing entertainment video. Companies also may enter into business combinations or alliances that strengthen their competitive positions. If we are unable to successfully or profitably compete with current and new competitors, our business will be adversely affected, and we may not be able to increase or maintain market share, revenues or profitability.
The long-term and fixed cost nature of our content commitments may limit our operating flexibility and could adversely affect our liquidity and results of operations.
In connection with licensing streaming content, we typically enter into multi-year commitments with studios and other content providers. We also enter into multi-year commitments for content that we produce, either directly or through third parties, including elements associated with these production such as non-cancelable commitments under talent agreements. The payment terms of these agreements are not tied to member usage or the size of our membership base (“fixed cost”) but may be determined by costs of production or tied to such factors as titles licensed and/or theatrical exhibition receipts. Such commitments, to the extent estimable under accounting standards, are included in the Contractual Obligations section of Part II,
3
We face risks, such as unforeseen costs and potential liability in connection with content we acquire, produce, license and/or distribute through our service.
As a producer and distributor of content, we face potential liability for negligence, copyright and trademark infringement, or other claims based on the nature and content of materials that we acquire, produce, license and/or distribute. We also may face potential liability for content used in promoting our service, including marketing materials. We are devoting more resources toward the development, production, marketing and distribution of original programming, including TV series and movies. We believe that original programming can help differentiate our service from other offerings, enhance our brand and otherwise attract and retain members. To the extent our original programming does not meet our expectations, in particular, in terms of costs, viewing and popularity, our business, including our brand and results of operations may be adversely impacted. As we expand our original programming, we have become responsible for production costs and other expenses, such as ongoing guild payments. We also take on risks associated with production, such as completion and key talent risk. Negotiations or renewals related to entertainment industry collective bargaining agreements could negatively impact timing and costs associated with our productions. To the extent we create and sell physical or digital merchandise relating to our original programming, and/or license such rights to third parties, we could become subject to product liability, intellectual property or other claims related to such merchandise. We may decide to remove content from our service, not to place licensed or produced content on our service or discontinue or alter production of original content if we believe such content might not be well received by our members or could be damaging to our brand.
To the extent we do not accurately anticipate costs or mitigate risks, including for content that we obtain but ultimately does not appear on or is removed from our service, or if we become liable for content we acquire, produce, license and/or distribute, our business may suffer. Litigation to defend these claims could be costly and the expenses and damages arising from any liability or unforeseen production risks could harm our results of operations. We may not be indemnified against claims or costs of these types and we may not have insurance coverage for these types of claims.
If studios, content providers or other rights holders refuse to license streaming content or other rights upon terms acceptable to us, our business could be adversely affected.
Our ability to provide our members with content they can watch depends on studios, content providers and other rights holders licensing rights to distribute such content and certain related elements thereof, such as the public performance of music contained within the content we distribute. The license periods and the terms and conditions of such licenses vary. If the studios, content providers and other rights holders are not or are no longer willing or able to license us content upon terms acceptable to us, our ability to stream content to our members will be adversely affected and/or our costs could increase. Certain licenses for content provide for the studios or other content providers to withdraw content from our service relatively quickly. Because of these provisions as well as other actions we may take, content available through our service can be withdrawn on short notice. As competition increases, we may see the cost of programming increase. As we seek to differentiate our service, we are increasingly focused on securing certain exclusive rights when obtaining content, including original content. We are also focused on programming an overall mix of content that delights our members in a cost efficient manner. Within this context, we are selective about the titles we add and renew to our service. If we do not maintain a compelling mix of content, our membership acquisition and retention may be adversely affected.
Music and certain authors' performances contained within content we distribute may require us to obtain licenses for such distribution. In this regard, we engage in negotiations with collection management organizations (“CMOs”) that hold certain rights to music and/or other interests in connection with streaming content into various territories. If we are unable to reach
4
mutually acceptable terms with these organizations, we could become involved in litigation and/or could be enjoined from distributing certain content, which could adversely impact our business. Additionally, pending and ongoing litigation as well as negotiations between certain CMOs and other third parties in various territories could adversely impact our negotiations with CMOs, or result in music publishers represented by certain CMOs unilaterally withdrawing rights, and thereby adversely impact our ability to reach licensing agreements reasonably acceptable to us. Failure to reach such licensing agreements could expose us to potential liability for copyright infringement or otherwise increase our costs.
If we are not able to manage change and growth, our business could be adversely affected.
We are expanding our operations internationally, scaling our streaming service to effectively and reliably handle anticipated growth in both members and features related to our service, ramping up our ability to produce original content, as well as continuing to operate our DVD service within the U.S. As our international offering evolves, we are managing and adjusting our business to address varied content offerings, consumer customs and practices, in particular those dealing with e-commerce and internet video, as well as differing legal and regulatory environments. As we scale our streaming service, we are developing technology and utilizing third-party “cloud” computing services. As we ramp up our original content production, we are building out expertise in a number of disciplines, including creative, marketing, legal, finance, licensing, merchandising and other resources related to the development and physical production of content. If we are not able to manage the growing complexity of our business, including improving, refining or revising our systems and operational practices related to our streaming operations and original content, our business may be adversely affected.
We could be subject to economic, political, regulatory and other risks arising from our international operations.
Operating in international markets requires significant resources and management attention and will subject us to regulatory, economic and political risks that may be different from or incremental to those in the U.S. In addition to the risks that we face in the U.S., our international operations involve risks that could adversely affect our business, including:
|
•
|
the need to adapt our content and user interfaces for specific cultural and language differences, including licensing a certain portion of our content assets before we have developed a full appreciation for its performance within a given territory;
|
|
•
|
difficulties and costs associated with staffing and managing foreign operations;
|
|
•
|
management distraction;
|
|
•
|
political or social unrest and economic instability;
|
|
•
|
compliance with U.S. laws such as the Foreign Corrupt Practices Act, export controls and economic sanctions, and local laws prohibiting corrupt payments to government officials;
|
|
•
|
difficulties in understanding and complying with local laws, regulations and customs in foreign jurisdictions;
|
|
•
|
regulatory requirements or government action against our service, whether in response to enforcement of actual or purported legal and regulatory requirements or otherwise, that results in disruption or non-availability of our service or particular content in the applicable jurisdiction;
|
|
•
|
less favorable foreign intellectual property laws;
|
|
•
|
adverse tax consequences such as those related to changes in tax laws or tax rates or their interpretations, and the related application of judgment in determining our global provision for income taxes, deferred tax assets or liabilities or other tax liabilities given the ultimate tax determination is uncertain;
|
|
•
|
fluctuations in currency exchange rates, which we do not use foreign exchange contracts or derivatives to hedge against and which could impact revenues and expenses of our international operations and expose us to foreign currency exchange rate risk;
|
|
•
|
profit repatriation and other restrictions on the transfer of funds;
|
|
•
|
differing payment processing systems as well as consumer use and acceptance of electronic payment methods, such as payment cards;
|
|
•
|
new and different sources of competition;
|
|
•
|
censorship requirements that cause us to remove or edit popular content, leading to consumer disappointment or dissatisfaction with our service;
|
|
•
|
low usage and/or penetration of internet-connected consumer electronic devices;
|
5
|
•
|
different and more stringent user protection, data protection, privacy and other laws, including data localization requirements;
|
|
•
|
availability of reliable broadband connectivity and wide area networks in targeted areas for expansion;
|
|
•
|
integration and operational challenges as well as potential unknown liabilities in connection with companies we may acquire or control; and
|
|
•
|
differing, and often more lenient, laws and consumer understanding/attitudes regarding the illegality of piracy.
|
Our failure to manage any of these risks successfully could harm our international operations and our overall business, and results of our operations.
We are subject to taxation related risks in multiple jurisdictions.
We are a U.S.-based multinational company subject to tax in multiple U.S. and foreign tax jurisdictions. Significant judgment is required in determining our global provision for income taxes, deferred tax assets or liabilities and in evaluating our tax positions on a worldwide basis. While we believe our tax positions are consistent with the tax laws in the jurisdictions in which we conduct our business, it is possible that these positions may be overturned by jurisdictional tax authorities, which may have a significant impact on our global provision for income taxes.
Tax laws are dynamic and subject to change as new laws are passed and new interpretations of the law are issued or applied. The U.S. recently enacted significant tax reform, and certain provisions of the new law may adversely affect us. In addition, governmental tax authorities are increasingly scrutinizing the tax positions of companies. Many countries in the European Union, as well as a number of other countries and organizations such as the Organization for Economic Cooperation and Development, are actively considering changes to existing tax laws that, if enacted, could increase our tax obligations in countries where we do business. If U.S. or other foreign tax authorities change applicable tax laws, our overall taxes could increase, and our business, financial condition or results of operations may be adversely impacted.
If we fail to maintain or, in newer markets establish, a positive reputation with consumers concerning our service, including the content we offer, we may not be able to attract or retain members, and our operating results may be adversely affected.
We believe that a positive reputation with consumers concerning our service is important in attracting and retaining members who have a number of choices from which to obtain entertainment video. To the extent our content, in particular, our original programming, is perceived as low quality, offensive or otherwise not compelling to consumers, our ability to establish and maintain a positive reputation may be adversely impacted. To the extent our content is deemed controversial or offensive by government regulators, we may face direct or indirect retaliatory action or behavior, including being required to remove such content from our service, our entire service could be banned and/or become subject to heightened regulatory scrutiny across our business and operations. Furthermore, to the extent our marketing, customer service and public relations efforts are not effective or result in negative consumer reaction, our ability to establish and maintain a positive reputation may likewise be adversely impacted. With newer markets, we also need to establish our reputation with consumers and to the extent we are not successful in creating positive impressions, our business in these newer markets may be adversely impacted.
Changes in how we market our service could adversely affect our marketing expenses and membership levels may be adversely affected.
We utilize a broad mix of marketing and public relations programs, including social media sites, to promote our service to potential new members. We may limit or discontinue use or support of certain marketing sources or activities if advertising rates increase or if we become concerned that members or potential members deem certain marketing practices intrusive or damaging to our brand. If the available marketing channels are curtailed, our ability to attract new members may be adversely affected.
Companies that promote our service may decide that we negatively impact their business or may make business decisions that in turn negatively impact us. For example, if they decide that they want to compete more directly with us, enter a similar business or exclusively support our competitors, we may no longer have access to their marketing channels. We also acquire a number of members who rejoin our service having previously cancelled their membership. If we are unable to maintain or replace our sources of members with similarly effective sources, or if the cost of our existing sources increases, our member levels and marketing expenses may be adversely affected.
6
We utilize marketing to promote our content and drive viewing by our members. To the extent we promote our content inefficiently or ineffectively, we may not obtain the expected acquisition and retention benefits and our business may be adversely affected.
We rely upon a number of partners to make our service available on their devices.
We currently offer members the ability to receive streaming content through a host of internet-connected screens, including TVs, digital video players, television set-top boxes and mobile devices. We have agreements with various cable, satellite and telecommunications operators to make our service available through the television set-top boxes of these service providers. In many instances, our agreements also including provisions by which the partner bills consumers directly for the Netflix service or otherwise offers services or products in connection with offering our service. We intend to continue to broaden our relationships with existing partners and to increase our capability to stream TV shows and movies to other platforms and partners over time. If we are not successful in maintaining existing and creating new relationships, or if we encounter technological, content licensing, regulatory, business or other impediments to delivering our streaming content to our members via these devices, our ability to retain members and grow our business could be adversely impacted.
Our agreements with our partners are typically between one and three years in duration and our business could be adversely affected if, upon expiration, a number of our partners do not continue to provide access to our service or are unwilling to do so on terms acceptable to us, which terms may include the degree of accessibility and prominence of our service. Furthermore, devices are manufactured and sold by entities other than Netflix and while these entities should be responsible for the devices' performance, the connection between these devices and Netflix may nonetheless result in consumer dissatisfaction toward Netflix and such dissatisfaction could result in claims against us or otherwise adversely impact our business. In addition, technology changes to our streaming functionality may require that partners update their devices. If partners do not update or otherwise modify their devices, our service and our members' use and enjoyment could be negatively impacted.
Any significant disruption in or unauthorized access to our computer systems or those of third parties that we utilize in our operations, including those relating to cybersecurity or arising from cyber-attacks, could result in a loss or degradation of service, unauthorized disclosure of data, including member and corporate information, or theft of intellectual property, including digital content assets, which could adversely impact our business.
Our reputation and ability to attract, retain and serve our members is dependent upon the reliable performance and security of our computer systems and those of third parties that we utilize in our operations. These systems may be subject to damage or interruption from earthquakes, adverse weather conditions, other natural disasters, terrorist attacks, power loss, telecommunications failures, and cybersecurity risks. Interruptions in these systems, or with the internet in general, could make our service unavailable or degraded or otherwise hinder our ability to deliver streaming content or fulfill DVD selections. Service interruptions, errors in our software or the unavailability of computer systems used in our operations could diminish the overall attractiveness of our membership service to existing and potential members.
Our computer systems and those of third parties we use in our operations are vulnerable to cybersecurity risks, including cyber-attacks, both from state-sponsored and individual activity, such as computer viruses, denial of service attacks, physical or electronic break-ins and similar disruptions. These systems periodically experience directed attacks intended to lead to interruptions and delays in our service and operations as well as loss, misuse or theft of data or intellectual property. Any attempt by hackers to obtain our data (including member and corporate information) or intellectual property (including digital content assets), disrupt our service, or otherwise access our systems, or those of third parties we use, if successful, could harm our business, be expensive to remedy and damage our reputation. We have implemented certain systems and processes to thwart hackers and protect our data and systems. From time to time, we have experienced an unauthorized release of certain digital content assets, however, to date these unauthorized releases have not had a material impact on our service or systems. There is no assurance that hackers may not have a material impact on our service or systems in the future. Our insurance does not cover expenses related to such disruptions or unauthorized access. Efforts to prevent hackers from disrupting our service or otherwise accessing our systems are expensive to implement and may limit the functionality of or otherwise negatively impact our service offering and systems. Any significant disruption to our service or access to our systems could result in a loss of memberships and adversely affect our business and results of operation.
We utilize our own communications and computer hardware systems located either in our facilities or in that of a third-party Web hosting provider. In addition, we utilize third-party “cloud” computing services in connection with our business operations. We also utilize our own and third-party content delivery networks to help us stream TV shows and movies in high volume to Netflix members over the internet. Problems faced by us or our third-party Web hosting, “cloud” computing, or other network providers, including technological or business-related disruptions, as well as cybersecurity threats, could adversely impact the experience of our members.
7
We rely upon Amazon Web Services to operate certain aspects of our service and any disruption of or interference with our use of the Amazon Web Services operation would impact our operations and our business would be adversely impacted.
Amazon Web Services (“AWS”) provides a distributed computing infrastructure platform for business operations, or what is commonly referred to as a "cloud" computing service. We have architected our software and computer systems so as to utilize data processing, storage capabilities and other services provided by AWS. Currently, we run the vast majority of our computing on AWS. Given this, along with the fact that we cannot easily switch our AWS operations to another cloud provider, any disruption of or interference with our use of AWS would impact our operations and our business would be adversely impacted. While the retail side of Amazon competes with us, we do not believe that Amazon will use the AWS operation in such a manner as to gain competitive advantage against our service.
If the technology we use in operating our business fails, is unavailable, or does not operate to expectations, our business and results of operation could be adversely impacted.
We utilize a combination of proprietary and third party technology to operate our business. This includes the technology that we have developed to recommend and merchandise content to our consumers as well as enable fast and efficient delivery of content to our members and their various consumer electronic devices. For example, we have built and deployed our own content-delivery network (“CDN”). To the extent Internet Service Providers (“ISPs”) do not interconnect with our CDN, or if we experience difficulties in its operation, our ability to efficiently and effectively deliver our streaming content to our members could be adversely impacted and our business and results of operation could be adversely affected. Likewise, if our recommendation and merchandising technology does not enable us to predict and recommend titles that our members will enjoy, our ability to attract and retain members may be adversely affected. We also utilize third party technology to help market our service, process payments, and otherwise manage the daily operations of our business. If our technology or that of third parties we utilize in our operations fails or otherwise operates improperly, including as a result of “bugs” in our development and deployment of software, our ability to operate our service, retain existing members and add new members may be impaired. Any harm to our members' personal computers or other devices caused by software used in our operations could have an adverse effect on our business, results of operations and financial condition.
If government regulations relating to the internet or other areas of our business change, we may need to alter the manner in which we conduct our business, or incur greater operating expenses.
The adoption or modification of laws or regulations relating to the internet or other areas of our business could limit or otherwise adversely affect the manner in which we currently conduct our business. As our service and others like us gain traction in international markets, governments are increasingly looking to introduce new or extend legacy regulations to these services, in particular those related to broadcast media and tax. In addition, the continued growth and development of the market for online commerce may lead to more stringent consumer protection laws, which may impose additional burdens on us. If we are required to comply with new regulations or legislation or new interpretations of existing regulations or legislation, this compliance could cause us to incur additional expenses or alter our business model.
Changes in laws or regulations that adversely affect the growth, popularity or use of the internet, including laws impacting net neutrality, could decrease the demand for our service and increase our cost of doing business. Certain laws intended to prevent network operators from discriminating against the legal traffic that traverse their networks have been implemented in many countries, including across the European Union. In others, the laws may be nascent or non-existent. Furthermore, favorable laws may change, including for example, in the United States where net neutrality regulations were recently repealed. Given uncertainty around these rules, including changing interpretations, amendments or repeal, coupled with potentially significant political and economic power of local network operators, we could experience discriminatory or anti-competitive practices that could impede our growth, cause us to incur additional expense or otherwise negatively affect our business.
Changes in how network operators handle and charge for access to data that travel across their networks could adversely impact our business.
We rely upon the ability of consumers to access our service through the internet. If network operators block, restrict or otherwise impair access to our service over their networks, our service and business could be negatively affected. To the extent that network operators implement usage based pricing, including meaningful bandwidth caps, or otherwise try to monetize access to their networks by data providers, we could incur greater operating expenses and our membership acquisition and retention could be negatively impacted. Furthermore, to the extent network operators create tiers of internet access service and either charge us for or prohibit us from being available through these tiers, our business could be negatively impacted.
8
Most network operators that provide consumers with access to the internet also provide these consumers with multichannel video programming. As such, many network operators have an incentive to use their network infrastructure in a manner adverse to our continued growth and success. While we believe that consumer demand, regulatory oversight and competition will help check these incentives, to the extent that network operators are able to provide preferential treatment to their data as opposed to ours or otherwise implement discriminatory network management practices, our business could be negatively impacted. The extent to which these incentives limit operator behavior differ across markets.
Privacy concerns could limit our ability to collect and leverage our membership data and disclosure of membership data could adversely impact our business and reputation.
In the ordinary course of business and in particular in connection with content acquisition and merchandising our service to our members, we collect and utilize data supplied by our members. We currently face certain legal obligations regarding the manner in which we treat such information. Other businesses have been criticized by privacy groups and governmental bodies for attempts to link personal identities and other information to data collected on the internet regarding users' browsing and other habits. Increased regulation of data utilization practices, including self-regulation or findings under existing laws that limit our ability to collect, transfer and use data, could have an adverse effect on our business. In addition, if we were to disclose data about our members in a manner that was objectionable to them, our business reputation could be adversely affected, and we could face potential legal claims that could impact our operating results. Internationally, we may become subject to additional and/or more stringent legal obligations concerning our treatment of customer and other personal information, such as laws regarding data localization and/or restrictions on data export. Failure to comply with these obligations could subject us to liability, and to the extent that we need to alter our business model or practices to adapt to these obligations, we could incur additional expenses.
Our reputation and relationships with members would be harmed if our membership data, particularly billing data, were to be accessed by unauthorized persons.
We maintain personal data regarding our members, including names and billing data. This data is maintained on our own systems as well as that of third parties we use in our operations. With respect to billing data, such as credit card numbers, we rely on encryption and authentication technology to secure such information. We take measures to protect against unauthorized intrusion into our members' data. Despite these measures we, our payment processing services or other third party services we use such as AWS, could experience an unauthorized intrusion into our members' data. In the event of such a breach, current and potential members may become unwilling to provide the information to us necessary for them to become members. Additionally, we could face legal claims or regulatory fines or penalties for such a breach. The costs relating to any data breach could be material, and we currently do not carry insurance against the risk of a data breach. We also maintain employment and personal information concerning our employees, including those on our own productions. Should an unauthorized intrusion into our members' or employees' data occur, our business could be adversely affected and our larger reputation with respect to data protection could be negatively impacted.
We are subject to payment processing risk.
Our members pay for our service using a variety of different payment methods, including credit and debit cards, gift cards, direct debit and online wallets. We rely on internal systems as well as those of third parties to process payment. Acceptance and processing of these payment methods are subject to certain rules and regulations and require payment of interchange and other fees. To the extent there are disruptions in our payment processing systems, increases in payment processing fees, material changes in the payment ecosystem, such as large re-issuances of payment cards, delays in receiving payments from payment processors and/or changes to rules or regulations concerning payment processing, our revenue, operating expenses and results of operation could be adversely impacted. In certain instances, we leverage third parties such as our cable and other partners to bill subscribers on our behalf. If these third parties become unwilling or unable to continue processing payments on our behalf, we would have to find alternative methods of collecting payments, which could adversely impact member acquisition and retention. In addition, from time to time, we encounter fraudulent use of payment methods, which could impact our results of operation and if not adequately controlled and managed could create negative consumer perceptions of our service.
9
If our trademarks and other proprietary rights are not adequately protected to prevent use or appropriation by our competitors, the value of our brand and other intangible assets may be diminished, and our business may be adversely affected.
We rely and expect to continue to rely on a combination of confidentiality and license agreements with our employees, consultants and third parties with whom we have relationships, as well as trademark, copyright, patent and trade secret protection laws, to protect our proprietary rights. We may also seek to enforce our proprietary rights through court proceedings or other legal actions. We have filed and we expect to file from time to time for trademark and patent applications. Nevertheless, these applications may not be approved, third parties may challenge any copyrights, patents or trademarks issued to or held by us, third parties may knowingly or unknowingly infringe our intellectual property rights, and we may not be able to prevent infringement or misappropriation without substantial expense to us. If the protection of our intellectual property rights is inadequate to prevent use or misappropriation by third parties, the value of our brand and other intangible assets may be diminished, competitors may be able to more effectively mimic our service and methods of operations, the perception of our business and service to members and potential members may become confused in the marketplace, and our ability to attract members may be adversely affected.
We currently hold various domain names relating to our brand, including Netflix.com. Failure to protect our domain names could adversely affect our reputation and brand and make it more difficult for users to find our Web site and our service. We may be unable, without significant cost or at all, to prevent third parties from acquiring domain names that are similar to, infringe upon or otherwise decrease the value of our trademarks and other proprietary rights.
Intellectual property claims against us could be costly and result in the loss of significant rights related to, among other things, our Web site, streaming technology, our recommendation and merchandising technology, title selection processes and marketing activities.
Trademark, copyright, patent and other intellectual property rights are important to us and other companies. Our intellectual property rights extend to our technology, business processes and the content we produce and distribute through our our Web site. We use the intellectual property of third parties in creating some of our content, merchandising our products and marketing our service through contractual and other rights. From time to time, third parties allege that we have violated their intellectual property rights. If we are unable to obtain sufficient rights, successfully defend our use, or develop non-infringing technology or otherwise alter our business practices on a timely basis in response to claims against us for infringement, misappropriation, misuse or other violation of third-party intellectual property rights, our business and competitive position may be adversely affected. Many companies are devoting significant resources to developing patents that could potentially affect many aspects of our business. There are numerous patents that broadly claim means and methods of conducting business on the internet. We have not searched patents relative to our technology. Defending ourselves against intellectual property claims, whether they are with or without merit or are determined in our favor, results in costly litigation and diversion of technical and management personnel. It also may result in our inability to use our current Web site, streaming technology, our recommendation and merchandising technology or inability to market our service or merchandise our products. We may also have to remove content from our service. As a result of a dispute, we may have to develop non-infringing technology, enter into royalty or licensing agreements, adjust our content, merchandising or marketing activities or take other actions to resolve the claims. These actions, if required, may be costly or unavailable on terms acceptable to us.
We are engaged in legal proceedings that could cause us to incur unforeseen expenses and could occupy a significant amount of our management's time and attention.
From time to time, we are subject to litigation or claims that could negatively affect our business operations and financial position. As we have grown, we have seen a rise in the number of litigation matters against us. These matters have included copyright and other claims related to our content, patent infringements as well as consumer and securities class actions, each of which are typically expensive to defend. Litigation disputes could cause us to incur unforeseen expenses, result in content unavailability, service disruptions and otherwise occupy a significant amount of our management's time and attention, any of which could negatively affect our business operations and financial position.
We may seek additional capital that may result in stockholder dilution or that may have rights senior to those of our common stockholders.
From time to time, we may seek to obtain additional capital, either through equity, equity-linked or debt securities. Our cash flows provided by our operating activities have been negative in each of the last three years, primarily as a result of our decision to increase the amount of original streaming content available on our service. To the extent our cash flows from
10
operations continue to be negative, we anticipate seeking additional capital. The decision to obtain additional capital will depend on, among other things, our business plans, operating performance and condition of the capital markets. If we raise additional funds through the issuance of equity, equity-linked or debt securities, those securities may have rights, preferences or privileges senior to the rights of our common stock, and our stockholders may experience dilution. Any large equity or equity-linked offering could also negatively impact our stock price.
We have a substantial amount of indebtedness and other obligations, including streaming content obligations, which could adversely affect our financial position.
We have a substantial amount of indebtedness and other obligations, including streaming content obligations. Moreover, we expect to incur substantial additional indebtedness in the future and to incur other obligations, including additional streaming content obligations. As of
December 31, 2017
, we had
$6.5 billion
aggregate principal amount of senior notes outstanding (“Notes”). In addition, we have entered into a revolving credit agreement that provides for a
$500.0 million
unsecured revolving credit facility. As of
December 31, 2017
, we have not borrowed any amount under this revolving credit facility. As of
December 31, 2017
, we had approximately
$7.5 billion
of total content liabilities as reflected on our consolidated balance sheet. Such amount does not include streaming content commitments that do not meet the criteria for liability recognition, the amounts of which are significant. For more information on our streaming content obligations, including those not on our consolidated balance sheet, see Note 5,
Commitments and Contingencies
in the accompanying notes to our consolidated financial statements included in Part II, Item 8, "Financial Statements and Supplementary Data" of this Annual Report on Form 10-K. Our substantial indebtedness and other obligations, including streaming content obligations, may:
|
•
|
make it difficult for us to satisfy our financial obligations, including making scheduled principal and interest payments on our Notes and our other obligations;
|
|
•
|
limit our ability to borrow additional funds for working capital, capital expenditures, acquisitions or other general business purposes;
|
|
•
|
limit our ability to use our cash flow or obtain additional financing for future working capital, capital expenditures, acquisitions or other general business purposes;
|
|
•
|
require us to use a substantial portion of our cash flow from operations to make debt service payments and pay our other obligations when due;
|
|
•
|
limit our flexibility to plan for, or react to, changes in our business and industry;
|
|
•
|
place us at a competitive disadvantage compared to our less leveraged competitors; and
|
|
•
|
increase our vulnerability to the impact of adverse economic and industry conditions.
|
Our streaming obligations include large multi-year commitments. As a result, we may be unable to react to any downturn in the economy or reduction in our cash flows from operations by reducing our streaming content obligations in the near-term. This could result in our needing to access the capital markets at an unfavorable time, which may negatively impact our stock price
We may not be able to generate sufficient cash to service our debt and other obligations.
Our ability to make payments on our debt, including our Notes, and our other obligations will depend on our financial and operating performance, which is subject to prevailing economic and competitive conditions and to certain financial, business and other factors beyond our control. In each of the last three years, our cash flows from operating activities have been negative. We may be unable to attain a level of cash flows from operating activities sufficient to permit us to pay the principal, premium, if any, and interest on our debt, including the Notes, and other obligations, including amounts due under our streaming content obligations.
If we are unable to service our debt and other obligations from cash flows, we may need to refinance or restructure all or a portion of such obligations prior to maturity. Our ability to refinance or restructure our debt and other obligations will depend upon the condition of the capital markets and our financial condition at such time. Any refinancing or restructuring could be at higher interest rates and may require us to comply with more onerous covenants, which could further restrict our business operations. If our cash flows are insufficient to service our debt and other obligations, we may not be able to refinance or restructure any of these obligations on commercially reasonable terms or at all and any refinancing or restructuring could have a material adverse effect on our business, results of operations, or financial condition.
If our cash flows are insufficient to fund our debt and other obligations and we are unable to refinance or restructure these obligations, we could face substantial liquidity problems and may be forced to reduce or delay investments and capital expenditures, or to sell material assets or operations to meet our debt and other obligations. We cannot assure you that we would be able to implement any of these alternative measures on satisfactory terms or at all or that the proceeds from such
11
alternatives would be adequate to meet any debt or other obligations then due. If it becomes necessary to implement any of these alternative measures, our business, results of operations, or financial condition could be materially and adversely affected.
We may lose key employees or may be unable to hire qualified employees.
We rely on the continued service of our senior management, including our Chief Executive Officer and co-founder Reed Hastings, members of our executive team and other key employees and the hiring of new qualified employees. In our industry, there is substantial and continuous competition for highly-skilled business, product development, technical and other personnel. We may not be successful in recruiting new personnel and in retaining and motivating existing personnel, which may be disruptive to our operations.
If our Domestic DVD segment declines faster than anticipated, our business could be adversely affected.
The number of memberships to our DVD-by-mail offering is declining, and we anticipate that this decline will continue. We believe, however, that the domestic DVD business will continue to generate significant contribution profit for our business. The contribution profit generated by our domestic DVD business will help provide capital resources to fund growth or our streaming service. To the extent that the rate of decline in our DVD-by-mail business is greater than we anticipate, our business could be adversely affected. We do not anticipate increasing resources to our DVD operations and the technology used in its operations will not be meaningfully improved. To the extent that we experience service interruptions or other degradations in our DVD-by-mail service, members' satisfaction could be negatively impacted and we could experience an increase in DVD-by-mail member cancellations, which could adversely impact our business.
If the U.S. Postal Service were to increase postal delivery rates or implement other changes to improve its financial position, such as closing mail processing facilities or service reductions, such changes could lead to a decrease in customer satisfaction and our Domestic DVD segment's contribution profit could be adversely affected.
Risks Related to Our Stock Ownership
Provisions in our charter documents and under Delaware law could discourage a takeover that stockholders may consider favorable.
Our charter documents may discourage, delay or prevent a merger or acquisition that a stockholder may consider favorable because they:
|
•
|
authorize our board of directors, without stockholder approval, to issue up to 10,000,000 shares of undesignated preferred stock;
|
|
•
|
provide for a classified board of directors;
|
|
•
|
prohibit our stockholders from acting by written consent;
|
|
•
|
establish advance notice requirements for proposing matters to be approved by stockholders at stockholder meetings; and
|
|
•
|
prohibit stockholders from calling a special meeting of stockholders.
|
As a Delaware corporation, we are also subject to certain Delaware anti-takeover provisions. Under Delaware law, a corporation may not engage in a business combination with any holder of 15% or more of its capital stock unless the holder has held the stock for three years or, among other things, the board of directors has approved the transaction. Our board of directors could rely on Delaware law to prevent or delay an acquisition of us.
In addition, a merger or acquisition may trigger retention payments to certain executive employees under the terms of our Amended and Restated Executive Severance and Retention Incentive Plan, thereby increasing the cost of such a transaction.
Our stock price is volatile.
The price at which our common stock has traded has fluctuated significantly. The price may continue to be volatile due to a number of factors including the following, some of which are beyond our control:
|
•
|
variations in our operating results, including our membership acquisition and retention, revenues, contribution profits, net income and free cash flow;
|
|
•
|
variations between our actual operating results and the expectations of securities analysts, investors and the financial community;
|
|
•
|
announcements of developments affecting our business, systems or expansion plans by us or others;
|
12
|
•
|
competition, including the introduction of new competitors, their pricing strategies and services;
|
|
•
|
market volatility in general;
|
|
•
|
the level of demand for our stock, including the amount of short interest in our stock; and
|
|
•
|
the operating results of our competitors.
|
As a result of these and other factors, investors in our common stock may not be able to resell their shares at or above their original purchase price.
Following certain periods of volatility in the market price of our securities, we became the subject of securities litigation. We may experience more such litigation following future periods of volatility. This type of litigation may result in substantial costs and a diversion of management’s attention and resources.
Preparing and forecasting our financial results requires us to make judgments and estimates which may differ materially from actual results.
Given the dynamic nature of our business, and the inherent limitations in predicting the future, forecasts of our revenues, operating margins, net income and number of total and paid membership additions and other financial and operating data may differ materially from actual results. Such discrepancies could cause a decline in the trading price of our common stock. In addition, the preparation of consolidated financial statements in conformity with accounting principles generally accepted in the United States of America also requires management to make estimates and assumptions that affect the reported amounts of assets and liabilities, disclosures of contingent assets and liabilities at the date of the financial statements, and the reported amounts of revenues and expenses during the reported periods. We base such estimates on historical experience and on various other assumptions that we believe to be reasonable under the circumstances, but actual results may differ from these estimates. For example, we estimate the period of use, beginning with the month of first availability, of any particular licensed or produced television series or movie based upon factors including historical and estimated viewing patterns in order to amortize these content assets. If we revise such estimates it could reduce the amortization period or result in impairment charges for the relevant content assets resulting in greater in-period expenses, which could cause us to miss our earnings guidance or negatively impact the results we report which could negatively impact our stock price.
|
Item 1B.
|
Unresolved Staff Comments
|
None.
13
|
Item 2.
|
Properties
|
Our corporate headquarters are located in Los Gatos, California and consist of leased space aggregating approximately
600,000
square feet.
In the United States, we lease other offices in various locations, including approximately
400,000
square feet in Los Angeles, California for content acquisition, marketing and general and administrative operations and Fremont, California for our DVD operations. We also lease office space in other countries to support international streaming operations.
We believe that our existing facilities are adequate to meet current requirements, and that suitable additional or substitute space will be available as needed to accommodate any further physical expansion of operations and for any additional offices.
|
Item 3.
|
Legal Proceedings
|
Information with respect to this item may be found in
Note 5
Commitments and Contingencies
in the accompanying notes to our consolidated financial statements included in Part II, Item 8, "Financial Statements and Supplementary Data" of this Annual Report on Form 10-K, under the caption "Legal Proceedings" which information is incorporated herein by reference.
|
Item 4.
|
Mine Safety Disclosures
|
Not applicable.
14
|
Item 5.
|
Market for Registrant’s Common Equity, Related Stockholder Matters and Issuer Purchases of Equity Securities
|
Market Information
Our common stock is traded on the NASDAQ Global Select Market under the symbol “NFLX”. The following table sets forth the intraday high and low sales prices per share of our common stock for the periods indicated, as reported by the NASDAQ Global Select Market.
|
|
2017
|
2016
|
||||||||||||||
|
|
High
|
Low
|
High
|
Low
|
||||||||||||
|
First quarter
|
$
|
148.29
|
|
$
|
124.31
|
|
$
|
122.18
|
|
$
|
79.95
|
|
||||
|
Second quarter
|
166.87
|
|
138.66
|
|
111.85
|
|
84.81
|
|
||||||||
|
Third quarter
|
191.50
|
|
144.25
|
|
101.27
|
|
84.50
|
|
||||||||
|
Fourth quarter
|
204.38
|
|
176.58
|
|
129.29
|
|
97.63
|
|
||||||||
Holders
As of
January 25, 2018
, there were approximately
327
stockholders of record of our common stock, although there is a significantly larger number of beneficial owners of our common stock.
Dividends
We have not declared or paid any cash dividends, and we have no present intention of paying any cash dividends in the foreseeable future.
15
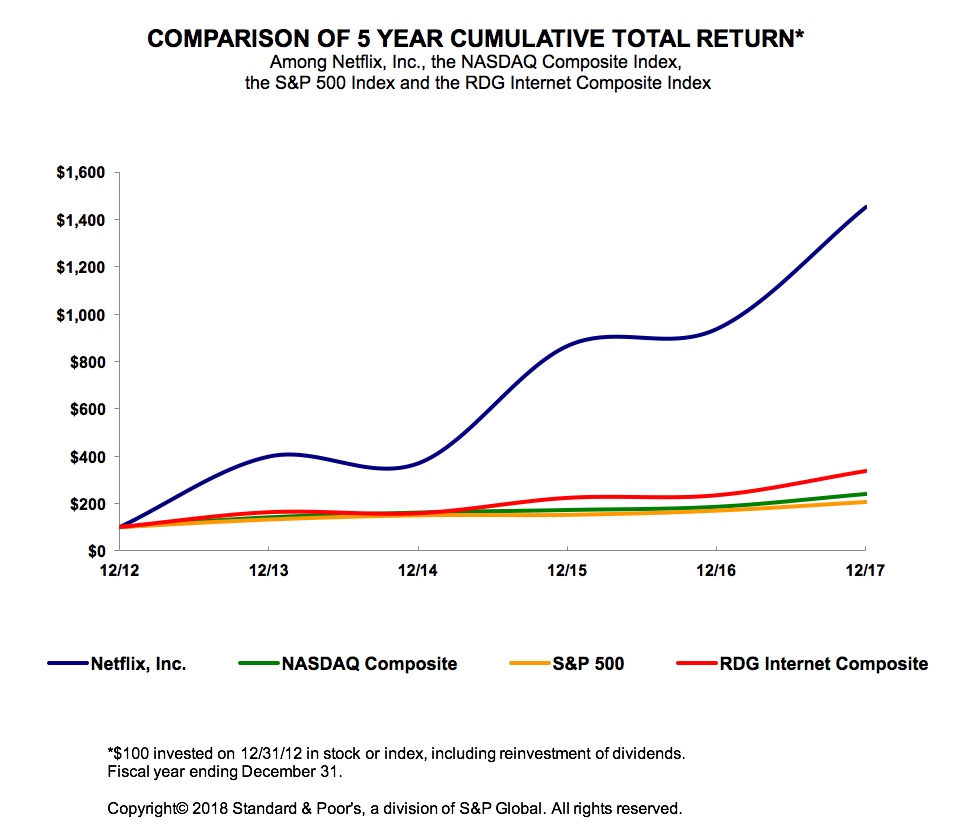
Stock Performance Graph
Notwithstanding any statement to the contrary in any of our previous or future filings with the Securities and Exchange Commission, the following information relating to the price performance of our common stock shall not be deemed “filed” with the Commission or “soliciting material” under the Securities Exchange Act of 1934 and shall not be incorporated by reference into any such filings.
The following graph compares, for the five year period ended
December 31, 2017
, the total cumulative stockholder return on the Company’s common stock, as adjusted for the seven-for-one stock split that occurred in July 2015, with the total cumulative return of the NASDAQ Composite Index, the S&P 500 Index and the RDG Internet Composite Index. Measurement points are the last trading day of each of the Company’s fiscal years ended
December 31, 2012
,
December 31, 2013
,
December 31, 2014
,
December 31, 2015
,
December 31, 2016
and
December 31, 2017
. Total cumulative stockholder return assumes $100 invested at the beginning of the period in the Company’s common stock, the stocks represented in the NASDAQ Composite Index, the stocks represented in the S&P 500 Index and the stocks represented in the RDG Internet Composite Index, respectively, and reinvestment of any dividends. Historical stock price performance should not be relied upon as an indication of future stock price performance. Further information on the stock split can be found in Note 7
Stockholder's Equity
in the accompanying notes to our consolidated financial statements included in Part II, Item 8, "Financial Statements and Supplementary Data" of this Annual Report on Form 10-K
.
16
|
Item 6.
|
Selected Financial Data
|
The following selected consolidated financial data is not necessarily indicative of results of future operations and should be read in conjunction with Item 7, "Management’s Discussion and Analysis of Financial Condition and Results of Operations" and Item 8, "Financial Statements and Supplementary Data." The following amounts related to earnings per share and shares outstanding have been adjusted for the Company's seven-for-one stock split that occurred in July 2015. See Note 7
Stockholder's Equity
in the accompanying notes to our consolidated financial statements included in Part II, Item 8, "Financial Statements and Supplementary Data" of this Annual Report on Form 10-K for further detail on the stock split.
|
|
Year ended December 31,
|
|||||||||||||||||||
|
|
2017
|
2016
|
2015
|
2014
|
2013
|
|||||||||||||||
|
|
(in thousands, except per share data)
|
|||||||||||||||||||
|
Revenues
|
$
|
11,692,713
|
|
$
|
8,830,669
|
|
$
|
6,779,511
|
|
$
|
5,504,656
|
|
$
|
4,374,562
|
|
|||||
|
Operating income
|
838,679
|
|
379,793
|
|
305,826
|
|
402,648
|
|
228,347
|
|
||||||||||
|
Net income
|
558,929
|
|
186,678
|
|
122,641
|
|
266,799
|
|
112,403
|
|
||||||||||
|
Earnings per share:
|
||||||||||||||||||||
|
Basic
|
$
|
1.29
|
|
$
|
0.44
|
|
$
|
0.29
|
|
$
|
0.63
|
|
$
|
0.28
|
|
|||||
|
Diluted
|
$
|
1.25
|
|
$
|
0.43
|
|
$
|
0.28
|
|
$
|
0.62
|
|
$
|
0.26
|
|
|||||
|
Weighted-average common shares outstanding:
|
||||||||||||||||||||
|
Basic
|
431,885
|
|
428,822
|
|
425,889
|
|
420,544
|
|
407,385
|
|
||||||||||
|
Diluted
|
446,814
|
|
438,652
|
|
436,456
|
|
431,894
|
|
425,327
|
|
||||||||||
|
|
Year Ended December 31,
|
|||||||||||||||||||
|
|
2017
|
2016
|
2015
|
2014
|
2013
|
|||||||||||||||
|
|
(in thousands)
|
|||||||||||||||||||
|
Net cash (used in) provided by operating activities
|
$
|
(1,785,948
|
)
|
$
|
(1,473,984
|
)
|
$
|
(749,439
|
)
|
$
|
16,483
|
|
$
|
97,831
|
|
|||||
|
Free cash flow (1)
|
(2,019,659
|
)
|
(1,659,755
|
)
|
(920,557
|
)
|
(126,699
|
)
|
(16,300
|
)
|
||||||||||
|
(1)
|
Free cash flow is defined as net cash (used in) provided by operating and investing activities, excluding the non-operational cash flows from purchases, maturities and sales of short-term investments. See Liquidity and Capital Resources for a reconciliation of "free cash flow" to "net cash (used in) provided by operating activities."
|
|
|
As of December 31,
|
|||||||||||||||||||
|
|
2017
|
2016
|
2015
|
2014
|
2013
|
|||||||||||||||
|
|
(in thousands)
|
|||||||||||||||||||
|
Cash, cash equivalents and short-term investments
|
$
|
2,822,795
|
|
$
|
1,733,782
|
|
$
|
2,310,715
|
|
$
|
1,608,496
|
|
$
|
1,200,405
|
|
|||||
|
Total content assets, net
|
14,681,989
|
|
11,000,808
|
|
7,218,815
|
|
4,939,460
|
|
3,838,364
|
|
||||||||||
|
Working capital
|
2,203,662
|
|
1,133,634
|
|
1,902,216
|
|
1,263,899
|
|
883,049
|
|
||||||||||
|
Total assets
|
19,012,742
|
|
13,586,610
|
|
10,202,871
|
|
7,042,500
|
|
5,404,025
|
|
||||||||||
|
Long-term debt
|
6,499,432
|
|
3,364,311
|
|
2,371,362
|
|
885,849
|
|
491,462
|
|
||||||||||
|
Non-current content liabilities
|
3,329,796
|
|
2,894,654
|
|
2,026,360
|
|
1,575,832
|
|
1,345,590
|
|
||||||||||
|
Total content liabilities
|
7,502,837
|
|
6,527,365
|
|
4,815,383
|
|
3,693,073
|
|
3,121,573
|
|
||||||||||
|
Total stockholders’ equity
|
3,581,956
|
|
2,679,800
|
|
2,223,426
|
|
1,857,708
|
|
1,333,561
|
|
||||||||||
17
Other Data:
|
|
As of / Year Ended December 31,
|
||||||||||||||
|
|
2017
|
2016
|
2015
|
2014
|
2013
|
||||||||||
|
|
(in thousands)
|
||||||||||||||
|
Net global streaming membership additions during period (1)
|
23,786
|
|
19,034
|
|
17,371
|
|
13,041
|
|
11,083
|
|
|||||
|
Global streaming memberships (1)
|
117,582
|
|
93,796
|
|
74,762
|
|
57,391
|
|
44,350
|
|
|||||
|
(1)
|
A membership (also referred to as a subscription) is defined as the right to receive Netflix service following sign-up and a method of payment being provided. Memberships are assigned to territories based on the geographic location used at time of sign-up as determined by our internal systems, which utilize industry standard geo-location technology. We offer free-trial memberships to certain new and rejoining members. Total members include those who are on a free-trial as long as a method of payment has been provided. A membership is canceled and ceases to be reflected in the above metrics as of the effective cancellation date. Voluntary cancellations become effective at the end of the prepaid membership period, while involuntary cancellation of the service, as a result of a failed method of payment, becomes effective immediately.
|
18
|
Item 7.
|
Management’s Discussion and Analysis of Financial Condition and Results of Operations
|
Overview and Results of Operations
The following represents our consolidated performance highlights:
|
As of/ Year Ended December 31,
|
Change
|
|||||||||||||||||
|
|
2017
|
2016
|
2015
|
2017 vs. 2016
|
2016 vs. 2015
|
|||||||||||||
|
|
(in thousands, except revenue per membership and percentages)
|
|||||||||||||||||
|
Global streaming memberships at end of period
|
117,582
|
|
93,796
|
|
74,762
|
|
25
|
%
|
25
|
%
|
||||||||
|
Global streaming average monthly revenue per paying membership
|
$
|
9.43
|
|
$
|
8.61
|
|
$
|
8.15
|
|
10
|
%
|
6
|
%
|
|||||
|
Revenues
|
$
|
11,692,713
|
|
$
|
8,830,669
|
|
$
|
6,779,511
|
|
32
|
%
|
30
|
%
|
|||||
|
Operating income
|
$
|
838,679
|
|
$
|
379,793
|
|
$
|
305,826
|
|
121
|
%
|
24
|
%
|
|||||
|
Operating margin
|
7
|
%
|
4
|
%
|
5
|
%
|
75
|
%
|
(20
|
)%
|
||||||||
|
Net income
|
$
|
558,929
|
|
$
|
186,678
|
|
$
|
122,641
|
|
199
|
%
|
52
|
%
|
|||||
Consolidated revenues for the year ended December 31,
2017
increased
32%
, including an increase of
21%
and
58%
in revenues in the Domestic streaming and International streaming segments, respectively, as compared to the year ended December 31,
2016
. International revenues as of the end of December 31, 2017 accounted for
44%
of consolidated revenue for the year ended December 31, 2017 as compared to
36%
of consolidated revenues for the year ended December 31, 2016. The increase in consolidated revenues was primarily driven by the growth in the average number of paid streaming memberships globally, the majority of which was growth in our international memberships. Average paid international streaming memberships accounted for
49%
of total average paid streaming memberships as of
December 31, 2017
, as compared to
43%
of total average paid streaming memberships as of
December 31, 2016
. The impact from membership growth was coupled with an increase in global streaming average monthly revenue per paying membership resulting from price changes and plan mix.
The increase in operating income is due primarily to increased revenues partially offset by increased content expenses as we continue to acquire, license and produce content, including more Netflix originals. This increase in content expenses includes a $39.1 million expense related to unreleased content that we have abandoned. Headcount costs to support continued improvements in our streaming service, our international expansion and increased content production activities also increased. The increase in net income was comprised of an increase in operating income and an increase in the tax benefit primarily due to the adoption of ASU 2016-09 in the first quarter of 2017, partially offset by an increase in interest expense primarily due to the higher principal of notes outstanding and an increase in foreign exchange losses primarily due to the remeasurement of our euro denominated senior notes.
We offer three types of streaming membership plans. Our "basic" plan includes access to standard definition quality streaming on a single screen at a time. Our "standard" plan is our most popular streaming plan and includes access to high definition quality streaming on two screens concurrently. Our "premium" plan includes access to high definition and ultra-high definition quality content on four screens concurrently. As of
December 31, 2017
, pricing on our plans ranged in the U.S. from $7.99 to $13.99 per month and internationally from the U.S. dollar equivalent of approximately
$4
to
$20
per month. We expect that from time to time the prices of our membership plans in each country may increase.
The following represents the key elements to our segment results of operations:
|
•
|
We define contribution profit (loss) as revenues less cost of revenues and marketing expenses incurred by the segment. We believe this is an important measure of our operating segment performance as it represents each segment's performance before global corporate costs. As markets within our International streaming segment become profitable, we increasingly focus on our global operating margin as a measure of profitability.
|
|
•
|
For the Domestic and International streaming segments, amortization of the streaming content assets makes up the vast majority of cost of revenues. Increasingly, we obtain multi-territory or global rights for our streaming content and allocate these rights between Domestic and International streaming segments based on estimated fair market value. Expenses associated with the acquisition, licensing and production of streaming content, streaming delivery costs and other operations costs make up the remainder of cost of revenues. We have built our own global content delivery network ("Open Connect") to help us efficiently stream a high volume of content to our members over the internet. Streaming delivery expenses, therefore, include equipment costs related to Open Connect and all third-party costs, such
|
19
as cloud computing costs, associated with delivering streaming content over the internet. Other operations costs include customer service and payment processing fees, including those we pay to our integrated payment partners, as well as other costs incurred in making our content available to members.
|
•
|
For the Domestic and International streaming segments, marketing expenses consist primarily of advertising expenses and certain payments made to our marketing partners, including consumer electronics manufacturers, MVPD's, mobile operators and ISP's. Advertising expenses include promotional activities such as digital and television advertising. Marketing expenses are incurred by our Domestic and International streaming segments given our focus on building consumer awareness of the streaming offerings, and in particular our original content.
|
Segment Results
Domestic Streaming Segment
|
As of/ Year Ended December 31,
|
Change
|
|||||||||||||||||||||||||
|
|
2017
|
2016
|
2015
|
2017 vs. 2016
|
2016 vs. 2015
|
|||||||||||||||||||||
|
|
(in thousands, except revenue per membership and percentages)
|
|||||||||||||||||||||||||
|
Memberships:
|
||||||||||||||||||||||||||
|
Net additions
|
5,319
|
|
4,693
|
|
5,624
|
|
626
|
|
13
|
%
|
(931
|
)
|
(17
|
)%
|
||||||||||||
|
Memberships at end of period
|
54,750
|
|
49,431
|
|
44,738
|
|
5,319
|
|
11
|
%
|
4,693
|
|
10
|
%
|
||||||||||||
|
Paid memberships at end of period
|
52,810
|
|
47,905
|
|
43,401
|
|
4,905
|
|
10
|
%
|
4,504
|
|
10
|
%
|
||||||||||||
|
Average monthly revenue per paying membership
|
$
|
10.18
|
|
$
|
9.21
|
|
$
|
8.50
|
|
$
|
0.97
|
|
11
|
%
|
$
|
0.71
|
|
8
|
%
|
|||||||
|
Contribution profit:
|
||||||||||||||||||||||||||
|
Revenues
|
$
|
6,153,025
|
|
$
|
5,077,307
|
|
$
|
4,180,339
|
|
$
|
1,075,718
|
|
21
|
%
|
$
|
896,968
|
|
21
|
%
|
|||||||
|
Cost of revenues
|
3,319,230
|
|
2,855,789
|
|
2,487,193
|
|
463,441
|
|
16
|
%
|
368,596
|
|
15
|
%
|
||||||||||||
|
Marketing
|
553,331
|
|
382,832
|
|
317,646
|
|
170,499
|
|
45
|
%
|
65,186
|
|
21
|
%
|
||||||||||||
|
Contribution profit
|
2,280,464
|
|
1,838,686
|
|
1,375,500
|
|
441,778
|
|
24
|
%
|
463,186
|
|
34
|
%
|
||||||||||||
|
Contribution margin
|
37
|
%
|
36
|
%
|
33
|
%
|
||||||||||||||||||||
Year ended December 31, 2017 as compared to the year ended December 31, 2016
In the Domestic streaming segment, we derive revenues from monthly membership fees for services consisting solely of streaming content to our members in the United States. The
increase
in our domestic streaming revenues was due to a
10%
growth in the average number of paid memberships and an
11%
increase in average monthly revenue per paying membership. The increase in average monthly revenue per paying membership resulted from our price changes and plan mix. Our standard plan continues to be the most popular plan choice for new memberships.
The
increase
in domestic streaming cost of revenues was primarily due to a $419.0 million increase in content amortization relating to our existing and new streaming content, including more exclusive and original programming. In addition, we had a
$44.4 million
increase in other costs, such as payment processing fees and customer service call centers, due to our growing member base.
Domestic marketing expenses increased primarily due to an increase in advertising and public relations spending as well as increased payments to our partners. In 2018, we expect marketing spending growth to outpace revenue growth.
Our Domestic streaming segment had a contribution margin of
37%
for the year ended
December 31, 2017
, which increased as compared to the contribution margin of
36%
for the year ended
December 31, 2016
due to growth in paid memberships and revenue, which continued to outpace content spending.
Year ended December 31, 2016 as compared to the year ended December 31, 2015
The
increase
in our domestic streaming revenues was due to a
12%
growth in the average number of paid memberships and a
8%
increase in average monthly revenue per paying membership resulting from our price changes and plan mix. The increase in average monthly revenue per paying membership resulted from our price changes and plan mix. In 2016, we phased out grandfathered pricing and cancellations by members whose grandfathered pricing expired were not material.
The
increase
in domestic streaming cost of revenues was primarily due to a
$335.4 million
increase in content expenses relating to our existing and new streaming content, including more exclusive and original programming. In addition, we had a
20
$33.2 million
increase in other costs, such as payment processing fees and customer service call centers, due to our growing member base.
Domestic marketing expenses increased primarily due to an increase in advertising and public relations spending as well as increased payments to our partners.
Our Domestic streaming segment had a contribution margin of
36%
for the year ended
December 31, 2016
, which increased as compared to the contribution margin of
33%
for the year ended
December 31, 2015
due to growth in paid memberships and revenue, which continued to outpace content and marketing spending.
International Streaming Segment
|
As of /Year Ended December 31,
|
Change
|
|||||||||||||||||||||||||
|
|
2017
|
2016
|
2015
|
2017 vs. 2016
|
2016 vs. 2015
|
|||||||||||||||||||||
|
|
(in thousands, except revenue per membership and percentages)
|
|||||||||||||||||||||||||
|
Memberships:
|
||||||||||||||||||||||||||
|
Net additions
|
18,467
|
|
14,341
|
|
11,747
|
|
4,126
|
|
29
|
%
|
2,594
|
|
22
|
%
|
||||||||||||
|
Memberships at end of period
|
62,832
|
|
44,365
|
|
30,024
|
|
18,467
|
|
42
|
%
|
14,341
|
|
48
|
%
|
||||||||||||
|
Paid memberships at end of period
|
57,834
|
|
41,185
|
|
27,438
|
|
16,649
|
|
40
|
%
|
13,747
|
|
50
|
%
|
||||||||||||
|
Average monthly revenue per paying membership
|
$
|
8.66
|
|
$
|
7.81
|
|
$
|
7.48
|
|
$
|
0.85
|
|
11
|
%
|
$
|
0.33
|
|
4
|
%
|
|||||||
|
Contribution profit (loss):
|
||||||||||||||||||||||||||
|
Revenues
|
$
|
5,089,191
|
|
$
|
3,211,095
|
|
$
|
1,953,435
|
|
$
|
1,878,096
|
|
58
|
%
|
$
|
1,257,660
|
|
64
|
%
|
|||||||
|
Cost of revenues
|
4,137,911
|
|
2,911,370
|
|
1,780,375
|
|
1,226,541
|
|
42
|
%
|
1,130,995
|
|
64
|
%
|
||||||||||||
|
Marketing
|
724,691
|
|
608,246
|
|
506,446
|
|
116,445
|
|
19
|
%
|
101,800
|
|
20
|
%
|
||||||||||||
|
Contribution profit (loss)
|
226,589
|
|
(308,521
|
)
|
(333,386
|
)
|
535,110
|
|
173
|
%
|
24,865
|
|
7
|
%
|
||||||||||||
|
Contribution margin
|
4
|
%
|
(10
|
)%
|
(17
|
)%
|
||||||||||||||||||||
Year ended December 31, 2017 as compared to the year ended December 31, 2016
In the International streaming segment, we derive revenues from monthly membership fees for services consisting solely of streaming content to our members outside the United States. We launched our streaming service in Canada in September 2010 and have expanded our services internationally as shown below.
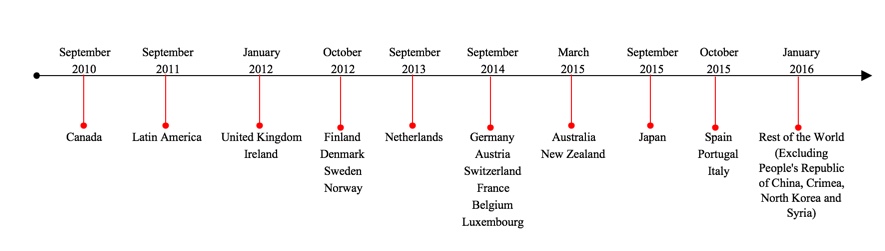
The
increase
in our international revenues was due to the
43%
growth in the average number of paid international memberships and an
11%
increase in average monthly revenue per paying membership. The increase in average monthly revenue per paying membership resulted from our price changes and plan mix, coupled with favorable fluctuations in foreign exchange rates. We estimate that international revenues would have been approximately
$21.9 million
lower in the year ended
December 31, 2017
if foreign exchange rates had remained consistent with those for the year ended
December 31, 2016
. If
21
foreign currency exchange rates fluctuate more than expected, revenues and average revenue per paying membership may differ from our expectations.
The
increase
in international cost of revenues was primarily due to a
$990.3 million
increase in content amortization relating to our existing and new streaming content, including more exclusive and original programming. Other costs increased
$236.2 million
primarily due to increases in our streaming delivery expenses, costs associated with our customer service call centers and payment processing fees, all driven by our growing member base, partially offset by decreases resulting from exchange rate fluctuations.
International marketing expenses
increased
mainly due to increased advertising and public relations as well as increased payments to our partners.
International contribution profit
increased
$535.1 million
year over year as profit growth in our more mature markets offset investments in newer markets.
Year ended December 31, 2016 as compared to the year ended December 31, 2015
The increase in our international revenues was due to the
57%
growth in the average number of paid international memberships and a
4%
increase in average monthly revenue per paying membership. The increase in average monthly revenue per paying membership resulted from our price changes and plan mix, offset partially by unfavorable fluctuations in foreign exchange rates. We estimate that international revenues would have been approximately
$174.0 million
higher in the year ended
December 31, 2016
if foreign exchange rates had remained consistent with those for the year ended
December 31, 2015
. If foreign currency exchange rates fluctuate more than expected, revenues and average revenue per paying membership may differ from our expectations.
The increase in international cost of revenues was primarily due to a
$998.5 million
increase in content expenses relating to our existing and new streaming content, including more exclusive and original programming. Other costs increased
$132.5 million
primarily due to increases in our streaming delivery expenses, costs associated with our customer service call centers and payment processing fees, all driven by our growing member base, partially offset by decreases resulting from exchange rate
fluctuations.
International marketing expenses increased mainly due to expenses for territories launched in the last eighteen months.
International contribution losses decreased
$24.9 million
year over year due to growth in paid memberships and revenue, which outpaced the growth in marketing spending.
Domestic DVD Segment
|
As of/ Year Ended December 31,
|
Change
|
|||||||||||||||||||||||||
|
|
2017
|
2016
|
2015
|
2017 vs. 2016
|
2016 vs. 2015
|
|||||||||||||||||||||
|
|
(in thousands, except revenue per membership and percentages)
|
|||||||||||||||||||||||||
|
Memberships:
|
||||||||||||||||||||||||||
|
Net losses
|
(731
|
)
|
(790
|
)
|
(863
|
)
|
(59
|
)
|
(7
|
)%
|
(73
|
)
|
(8
|
)%
|
||||||||||||
|
Memberships at end of period
|
3,383
|
|
4,114
|
|
4,904
|
|
(731
|
)
|
(18
|
)%
|
(790
|
)
|
(16
|
)%
|
||||||||||||
|
Paid memberships at end of period
|
3,330
|
|
4,029
|
|
4,787
|
|
(699
|
)
|
(17
|
)%
|
(758
|
)
|
(16
|
)%
|
||||||||||||
|
Average monthly revenue per paying membership
|
$10.17
|
$10.22
|
$10.30
|
$(0.05)
|
—
|
%
|
$(0.08)
|
(1
|
)%
|
|||||||||||||||||
|
Contribution profit:
|
||||||||||||||||||||||||||
|
Revenues
|
$
|
450,497
|
|
$
|
542,267
|
|
$
|
645,737
|
|
$
|
(91,770
|
)
|
(17
|
)%
|
$
|
(103,470
|
)
|
(16
|
)%
|
|||||||
|
Cost of revenues
|
202,525
|
|
262,742
|
|
323,908
|
|
(60,217
|
)
|
(23
|
)%
|
(61,166
|
)
|
(19
|
)%
|
||||||||||||
|
Contribution profit
|
247,972
|
|
279,525
|
|
321,829
|
|
(31,553
|
)
|
(11
|
)%
|
(42,304
|
)
|
(13
|
)%
|
||||||||||||
|
Contribution margin
|
55
|
%
|
52
|
%
|
50
|
%
|
||||||||||||||||||||
Year ended December 31, 2017 as compared to the year ended December 31, 2016
22
In the Domestic DVD segment, we derive revenues from our DVD-by-mail membership services. The price per plan for DVD-by-mail varies from
$4.99 to $14.99
per month according to the plan chosen by the member. DVD-by-mail plans differ by the number of DVDs that a member may have out at any given point. Members electing access to high definition Blu-ray discs, in addition to standard definition DVDs, pay a surcharge ranging from
$2 to $3
per month for our most popular plans. Cost of revenues in the Domestic DVD segment consist primarily of delivery expenses such as packaging and postage costs, content expenses, and other expenses associated with our DVD processing and customer service centers. The number of memberships to our DVD-by-mail offering is declining, and we anticipate that this decline will continue.
Our Domestic DVD segment had a contribution margin of
55%
for the year ended
December 31, 2017
, up from
52%
for the year ended
December 31, 2016
due to the decrease in DVD usage by paying members and decreased DVD content expenses.
Year ended December 31, 2016 as compared to the year ended December 31, 2015
Our Domestic DVD segment had a contribution margin of
52%
for the year ended
December 31, 2016
, up from
50%
for the year ended
December 31, 2015
due to the decrease in DVD usage by paying members and decreased DVD content expenses.
Consolidated Operating Expenses
Technology and Development
Technology and development expenses consist of payroll and related expenses for all technology personnel, as well as other costs incurred in making improvements to our service offerings, including testing, maintaining and modifying our user interface, our recommendation, merchandising and streaming delivery technology and infrastructure. Technology and development expenses also include costs associated with computer hardware and software.
|
|
Year Ended December 31,
|
Change
|
||||||||||||||||||||||||
|
|
2017
|
2016
|
2015
|
2017 vs. 2016
|
2016 vs. 2015
|
|||||||||||||||||||||
|
|
(in thousands, except percentages)
|
|||||||||||||||||||||||||
|
Technology and development
|
$
|
1,052,778
|
|
$
|
852,098
|
|
$
|
650,788
|
|
$
|
200,680
|
|
24
|
%
|
$
|
201,310
|
|
31
|
%
|
|||||||
|
As a percentage of revenues
|
9
|
%
|
10
|
%
|
10
|
%
|
||||||||||||||||||||
Year ended December 31, 2017 as compared to the year ended December 31, 2016
The increase in technology and development expenses was primarily due to a
$131.1 million
increase in personnel-related costs, including stock-based compensation expense, resulting from an increase in compensation for existing employees and a
3%
growth in average headcount supporting continued improvements in our streaming service and our international expansion. In addition, third-party expenses, including costs associated with cloud computing, increased
$39.1 million
and facilities-related costs increased
$30.1 million
, primarily driven by costs for our expanded Los Gatos, California headquarters.
Year ended December 31, 2016 as compared to the year ended December 31, 2015
The increase in technology and development expenses was primarily due to a
$162.3 million
increase in personnel-related costs, including stock-based compensation expense, resulting from an increase in compensation for existing employees and a
20%
growth in average headcount supporting continued improvements in our streaming service and our international expansion. In addition, third-party expenses, including costs associated with cloud computing, increased
$27.3 million
.
General and Administrative
General and administrative expenses consist of payroll and related expenses for corporate personnel, as well as for personnel that support global functions related to content, marketing, public relations and operations other than customer service. General and administrative expenses also includes professional fees and other general corporate expenses.
|
|
Year Ended December 31,
|
Change
|
||||||||||||||||||||||||
|
|
2017
|
2016
|
2015
|
2017 vs. 2016
|
2016 vs. 2015
|
|||||||||||||||||||||
|
|
(in thousands, except percentages)
|
|||||||||||||||||||||||||
|
General and administrative
|
$
|
863,568
|
|
$
|
577,799
|
|
$
|
407,329
|
|
$
|
285,769
|
|
49
|
%
|
$
|
170,470
|
|
42
|
%
|
|||||||
|
As a percentage of revenues
|
7
|
%
|
7
|
%
|
6
|
%
|
||||||||||||||||||||
23
Year ended December 31, 2017 as compared to the year ended December 31, 2016
General and administrative expenses increased primarily due to a
$184.7 million
increase in personnel-related costs, including stock-based compensation expense, resulting from a
56%
increase in average headcount primarily to support our international expansion and increased production of original content, and an increase in compensation for existing employees. In addition, facilities-related costs increased
$49.9 million
, primarily driven by costs for our expanded Los Gatos, California headquarters and new Los Angeles, California facility, both of which were placed into operation in the first quarter of 2017. In addition, third-party expenses, including costs for contractors and consultants, increased
$49.4 million
.
Year ended December 31, 2016 as compared to the year ended December 31, 2015
General and administrative expenses increased primarily due to a
$148.9 million
increase in personnel-related costs, including stock-based compensation expense, resulting from a
39%
increase in average headcount primarily to support our international expansion and increased production of original content, and an increase in compensation for existing employees. In addition, facilities-related costs increased
$16.2 million
due to the growth in average headcount.
Interest Expense
Interest expense consists primarily of the interest associated with our outstanding long-term debt obligations, including the amortization of debt issuance costs, as well as interest on our lease financing obligations. See Note 4
Long-term Debt
in the accompanying notes to our consolidated financial statements included in Part II, Item 8, "Financial Statements and Supplementary Data" of this Annual Report on Form 10-K for further detail of our long-term debt obligations.
|
|
Year Ended December 31,
|
Change
|
||||||||||||||||||||||||
|
|
2017
|
2016
|
2015
|
2017 vs. 2016
|
2016 vs. 2015
|
|||||||||||||||||||||
|
|
(in thousands, except percentages)
|
|||||||||||||||||||||||||
|
Interest expense
|
$
|
(238,204
|
)
|
$
|
(150,114
|
)
|
$
|
(132,716
|
)
|
$
|
88,090
|
|
59
|
%
|
$
|
17,398
|
|
13
|
%
|
|||||||
|
As a percentage of revenues
|
2
|
%
|
2
|
%
|
2
|
%
|
||||||||||||||||||||
Year ended December 31, 2017 as compared to the year ended December 31, 2016
Interest expense for the year ended
December 31, 2017
consists primarily of
$229.2 million
of interest on our notes. The increase in interest expense for the year ended
December 31, 2017
as compared to the year ended
December 31, 2016
is due to the increase of long-term debt.
Year ended December 31, 2016 as compared to the year ended December 31, 2015
Interest expense for the year ended
December 31, 2016
consists primarily of
$143.3 million
of interest on our notes. The increase in interest expense for the year ended
December 31, 2016
as compared to the year ended
December 31, 2015
is due to the increase of long-term debt.
Interest and Other Income (Expense)
Interest and other income (expense) consists primarily of foreign exchange gains and losses on foreign currency denominated balances and interest earned on cash, cash equivalents and short-term investments.
|
|
Year Ended December 31,
|
Change
|
||||||||||||||||||||||||
|
|
2017
|
2016
|
2015
|
2017 vs. 2016
|
2016 vs. 2015
|
|||||||||||||||||||||
|
|
(in thousands, except percentages)
|
|||||||||||||||||||||||||
|
Interest and other income (expense)
|
$
|
(115,154
|
)
|
$
|
30,828
|
|
$
|
(31,225
|
)
|
$
|
(145,982
|
)
|
(474
|
)%
|
$
|
62,053
|
|
199
|
%
|
|||||||
Year ended December 31, 2017 as compared to the year ended December 31, 2016
Interest and other income (expense) decreased primarily due to foreign exchange losses. In the year ended
December 31, 2017
, the foreign exchange loss of
$127.9 million
was primarily driven by the
$140.8 million
loss from remeasurement of our
€1,300 million
Senior Notes partially offset by the remeasurement of cash and content liability positions in currencies other than functional currencies of our European and U.S. entities.
24
Year ended December 31, 2016 as compared to the year ended December 31, 2015
Interest and other income (expense) increased primarily due to foreign exchange. In the year ended
December 31, 2016
, the foreign exchange gain of
$22.8 million
was primarily driven by the remeasurement of significant content liabilities denominated in currencies other than functional currencies.
Provision for Income Taxes
|
|
Year Ended December 31,
|
Change
|
|||||||||||||||||||||||
|
|
2017
|
2016
|
2015
|
2017 vs. 2016
|
2016 vs. 2015
|
||||||||||||||||||||
|
|
(in thousands, except percentages)
|
||||||||||||||||||||||||
|
Provision for (benefit from) income taxes
|
$
|
(73,608
|
)
|
$
|
73,829
|
|
$
|
19,244
|
|
$
|
(147,437
|
)
|
(200
|
)%
|
54,585
|
|
284
|
%
|
|||||||
|
Effective tax rate
|
(15
|
)%
|
28
|
%
|
14
|
%
|
|||||||||||||||||||
Year ended December 31, 2017 as compared to the year ended December 31, 2016
At the beginning of 2017, we underwent a corporate restructuring that better aligns our corporate structure with how our business operates. As a result of this restructuring and our increasing international income, there is now significantly more income being taxed at rates lower than the U.S. tax rate.
The decrease in our effective tax rate is mainly due to the recognition of excess tax benefits attributable to the adoption of ASU 2016-09 and an increase in foreign income taxed at rates lower than the U.S. statutory rate. In 2017, the difference between our
(15)%
effective tax rate and the Federal statutory rate of
35%
was
$(243.5) million
primarily due to the recognition of excess tax benefits as a component of the provision for income taxes, an increase in foreign income taxed at rates lower than the U.S. statutory rate and Federal and California research and development credits (“R&D”), partially offset by state taxes and non-deductible expenses as well as the provisional impact of changes to tax law.
On December 22, 2017, the Tax Cuts and Jobs Act of 2017 (the “Act”) was signed into law making significant changes to the Internal Revenue Code. Changes include, but are not limited to, a corporate tax rate decrease from
35%
to
21%
effective for tax years beginning after
December 31, 2017
, the transition of U.S international taxation from a worldwide tax system to a territorial system, and a one-time transition tax on the mandatory deemed repatriation of cumulative foreign earnings as of December 31, 2017. We have calculated our best estimate of the impact of the Act in our year end income tax provision in accordance with our understanding of the Act and guidance available as of the date of this filing and as a result have recorded
$79.1 million
as additional income tax expense in the fourth quarter of
2017
, the period in which the legislation was enacted. The provisional amount related to the remeasurement of certain deferred tax assets and liabilities, based on the rates at which they are expected to reverse in the future, was
$46.9 million
. The provisional amount related to the one-time transition tax on the mandatory deemed repatriation of foreign earnings was
$32.2 million
based on cumulative foreign earnings of
$484.9 million
. We also recorded a
$66.5 million
benefit related to foreign taxes expensed in prior years that may now be claimed as a Foreign Tax Credit. We have determined there is sufficient foreign source income projected to utilize these credits.
Year ended December 31, 2016 as compared to the year ended December 31, 2015
The increase in our effective tax rate is mainly due to a
$13.4 million
release of tax reserves in 2015 and an increase in foreign taxes. In 2016, the difference between our
28%
effective tax rate and the Federal statutory rate of
35
% was
$17.3 million
primarily due to the 2016 Federal and California R&D credits partially offset by state income taxes, foreign taxes, and nondeductible expenses.
25
Liquidity and Capital Resources
|
Year Ended December 31,
|
|||||||
|
2017
|
2016
|
||||||
|
(in thousands)
|
|||||||
|
Cash and cash equivalents and short-term investments
|
$
|
2,822,795
|
|
$
|
1,733,782
|
|
|
|
Long-term debt
|
6,499,432
|
|
3,364,311
|
|
|||
Cash, cash equivalents and short-term investments
increased
$1,089.0 million
in the year ended
December 31, 2017
primarily due to cash received from the issuance of debt partially offset by an increase in cash used in operations. As of
December 31, 2017
, cash and cash equivalents held by our foreign subsidiaries amounted to
$611.3 million
. The Tax Cut and Jobs Act of 2017 included a one-time transition tax on unremitted foreign earnings, and accordingly, we recorded tax expense of
$32.2 million
related to the transition tax on the one-time mandatory deemed repatriation of all our foreign earnings as of
December 31, 2017
. See Note 9
Income Taxes
in the accompanying notes to our consolidated financial statements included in Part II, Item 8, "Financial Statements and Supplementary Data" of this Annual Report on Form 10-K for additional information on income taxes.
Long-term debt, net of debt issuance costs, increased
$3,135.1 million
due to long-term note issuances of €1,300.0 million in May 2017 and $1,600.0 million in October 2017. The earliest maturity date for our outstanding long-term debt is February 2021. In July 2017, we entered into a $500.0 million unsecured revolving credit facility (“Revolving Credit Agreement”), with an uncommitted incremental facility to increase the amount of the revolving credit facility by up to an additional $250.0 million subject to certain terms and conditions. As of
December 31, 2017
, no amounts had been borrowed under the Revolving Credit Agreement. See Note 4
Long-term Debt
in the accompanying notes to our consolidated financial statements included in Part II, Item 8, "Financial Statements and Supplementary Data" of this Annual Report on Form 10-K for additional information about long-term debt. We anticipate financing our capital needs in the debt market, as we believe our after-tax cost of debt is lower than our cost of equity. Our ability to obtain any additional financing that we may choose to, or need to, obtain will depend on, among other things, our development efforts, business plans, operating performance and the condition of the capital markets at the time we seek financing. We may not be able to obtain such financing on terms acceptable to us or at all. If we raise additional funds through the issuance of equity or debt securities, those securities may have rights, preferences or privileges senior to the rights of our common stock, and our stockholders may experience dilution.
Our primary uses of cash include the acquisition, licensing and production of content, streaming delivery, marketing programs and personnel-related costs. For licensed content, cash payment terms have historically been in line with the amortization period. Investments in original content, and in particular content that we produce and own, require more cash upfront relative to licensed content. For example, production costs are paid as the content is created, well in advance of when the content is available on the service and amortized. We expect to significantly increase our investments in global streaming content, particularly in original content, which will impact our liquidity and result in future negative free cash flows for many years. We currently anticipate that cash flows from operations, available funds and access to financing sources, including our revolving credit facility, will continue to be sufficient to meet our cash needs for at least the next twelve months.
Free Cash Flow
We define free cash flow as cash provided by (used in) operating and investing activities excluding the non-operational cash flows from purchases, maturities and sales of short-term investments. We believe free cash flow is an important liquidity metric because it measures, during a given period, the amount of cash generated that is available to repay debt obligations, make investments and for certain other activities or the amount of cash used in operations, including investments in global streaming content. Free cash flow is considered a non-GAAP financial measure and should not be considered in isolation of, or as a substitute for, net income, operating income, cash flow used in operating activities, or any other measure of financial performance or liquidity presented in accordance with GAAP.
In assessing liquidity in relation to our results of operations, we compare free cash flow to net income, noting that the three major recurring differences are excess content payments over amortization, non-cash stock-based compensation expense and other working capital differences. Working capital differences include deferred revenue, taxes and semi-annual interest payments on our outstanding debt. Our receivables from members generally settle quickly and deferred revenue is a source of cash flow.
26
|
|
Year Ended December 31,
|
||||||||||
|
|
2017
|
2016
|
2015
|
||||||||
|
(in thousands)
|
|||||||||||
|
Net cash used in operating activities
|
$
|
(1,785,948
|
)
|
$
|
(1,473,984
|
)
|
$
|
(749,439
|
)
|
||
|
Net cash provided by (used in) investing activities
|
34,329
|
|
49,765
|
|
(179,192
|
)
|
|||||
|
Net cash provided by financing activities
|
3,076,990
|
|
1,091,630
|
|
1,640,277
|
|
|||||
|
Non-GAAP free cash flow reconciliation:
|
|||||||||||
|
Net cash used in operating activities
|
(1,785,948
|
)
|
(1,473,984
|
)
|
(749,439
|
)
|
|||||
|
Acquisition of DVD content assets
|
(53,720
|
)
|
(77,177
|
)
|
(77,958
|
)
|
|||||
|
Purchases of property and equipment
|
(173,302
|
)
|
(107,653
|
)
|
(91,248
|
)
|
|||||
|
Other assets
|
(6,689
|
)
|
(941
|
)
|
(1,912
|
)
|
|||||
|
Non-GAAP free cash flow
|
$
|
(2,019,659
|
)
|
$
|
(1,659,755
|
)
|
$
|
(920,557
|
)
|
||
Year ended December 31, 2017 as compared to the year ended December 31, 2016
Cash used in operating activities increased
$312.0 million
resulting in net cash used in operating activities of
$1,785.9 million
for the year ended
December 31, 2017
. The significant net cash used in operations is due primarily to the increase in investments in streaming content that require more upfront payments. The payments for streaming content assets increased
$2,025.1 million
, from
$6,880.6 million
to
$8,905.8 million
, or
29%
, as compared to an increase in the amortization of streaming content assets of
$1,409.3 million
, from
$4,788.5 million
to
$6,197.8 million
, or
29%
. In addition, we had increased payments associated with higher operating expenses, primarily related to increased headcount costs to support our continued improvements in our streaming service, our international expansion and increased content production activities. The increased use of cash was partially offset by a
$2,862.0 million
or
32%
increase in revenues.
Cash provided by investing activities decreased by
$15.4 million
, primarily due to a
$65.6 million
increase in the purchases of property and equipment, largely due to the expansion of our Los Gatos, California headquarters, as well as our new office space in Los Angeles, California. This increase in cash used was partially offset by an increase of
$32.5 million
in the proceeds from sales and maturities of short-term investments, net of purchases due to the sale of our short-term investments in July 2017 as well as a decline in DVD purchases of
$23.5 million
.
Cash provided by financing activities increased
$1,985.4 million
primarily due to the
$2,988.4 million
net proceeds from the issuance of the
3.625%
Notes and
4.875%
Notes in the year ended
December 31, 2017
as compared to the
$989.3 million
net proceeds from the issuance of the 4.375% Notes in the year ended
December 31, 2016
.
Free cash flow was
$2,578.6 million
lower than net income for the year ended
December 31, 2017
primarily due to
$2,707.9 million
of cash payments for streaming content assets over streaming amortization expense and
$52.9 million
of unfavorable other working capital differences partially offset by
$182.2 million
of non-cash stock-based compensation expense.
Year ended December 31, 2016 as compared to the year ended December 31, 2015
Cash used in operating activities increased
$724.5 million
resulting in net cash used in operating activities of
$1,474.0 million
for the year ended
December 31, 2016
. The significant net cash used in operations is due primarily to the increase in investments in streaming content that require more upfront payments. The payments for streaming content assets increased
$2,271.4 million
, from
$4,609.2 million
to
$6,880.6 million
, or
49%
. In addition, we had increased payments associated with higher operating expenses. The increased use of cash was partially offset by a
$2,051.2 million
or
30%
increase in revenues.
Cash provided by investing activities increased
$229.0 million
, primarily due to an increase of
$243.6 million
in the proceeds from sales and maturities of short-term investments, net of purchases, partially offset by a
$16.4 million
increase in the purchases of property and equipment, primarily driven by the expansion of our Los Gatos, California headquarters, as well as our new office space in Los Angeles, California.
Cash provided by financing activities decreased
$548.6 million
primarily due to the
$1,482.4 million
net proceeds from the issuance of the 5.50% Notes and the 5.875% Notes in the year ended
December 31, 2015
as compared to the
$989.3 million
net proceeds from the issuance of the 4.375% Notes in the year ended
December 31, 2016
.
27
Free cash flow was
$1,846.4 million
lower than net income for the year ended
December 31, 2016
primarily due to
$2,092.1 million
of cash payments for streaming content assets over streaming amortization expense partially offset by
$173.7 million
of non-cash stock-based compensation expense and
$72.0 million
of favorable other working capital differences.
Contractual Obligations
For the purpose of this table, contractual obligations for purchases of goods or services are defined as agreements that are enforceable and legally binding and that specify all significant terms, including: fixed or minimum quantities to be purchased; fixed, minimum or variable price provisions; and the approximate timing of the transaction. The expected timing of the payment of the obligations discussed below is estimated based on information available to us as of
December 31, 2017
. Timing of payments and actual amounts paid may be different depending on the time of receipt of goods or services or changes to agreed-upon amounts for some obligations. The following table summarizes our contractual obligations at
December 31, 2017
:
|
|
Payments due by Period
|
|||||||||||||||||||
|
Contractual obligations (in thousands):
|
Total
|
Less than
1 year
|
1-3 years
|
3-5 years
|
More than
5 years
|
|||||||||||||||
|
Streaming content obligations (1)
|
$
|
17,694,642
|
|
$
|
7,446,947
|
|
$
|
8,210,159
|
|
$
|
1,894,001
|
|
$
|
143,535
|
|
|||||
|
Debt (2)
|
9,048,828
|
|
311,339
|
|
627,444
|
|
1,761,465
|
|
6,348,580
|
|
||||||||||
|
Lease obligations (3)
|
737,378
|
|
101,987
|
|
193,815
|
|
162,606
|
|
278,970
|
|
||||||||||
|
Other purchase obligations (4)
|
544,933
|
|
253,443
|
|
220,181
|
|
46,590
|
|
24,719
|
|
||||||||||
|
Total
|
$
|
28,025,781
|
|
$
|
8,113,716
|
|
$
|
9,251,599
|
|
$
|
3,864,662
|
|
$
|
6,795,804
|
|
|||||
|
(1)
|
As of
December 31, 2017
, streaming content obligations were comprised of
$4.2 billion
included in "Current content liabilities" and
$3.3 billion
of "Non-current content liabilities" on the Consolidated Balance Sheets and
$10.2 billion
of obligations that are not reflected on the Consolidated Balance Sheets as they did not then meet the criteria for recognition.
|
Streaming content obligations increased
$3.2 billion
from
$14.5 billion
as of
December 31, 2016
to
$17.7 billion
as of
December 31, 2017
primarily due to multi-year commitments associated with the continued expansion of our exclusive and original programming.
Streaming content obligations include amounts related to the acquisition, licensing and production of streaming content. An obligation for the production of content includes non-cancelable commitments under creative talent and employment agreements. An obligation for the acquisition and licensing of content is incurred at the time we enter into an agreement to obtain future titles. Once a title becomes available, a content liability is recorded on the Consolidated Balance Sheets. Certain agreements include the obligation to license rights for unknown future titles, the ultimate quantity and/or fees for which are not yet determinable as of the reporting date. Traditional film output deals, or certain TV series license agreements where the number of seasons to be aired is unknown, are examples of these types of agreements. The contractual obligations table above does not include any estimated obligation for the unknown future titles, payment for which could range from less than one year to more than five years. However, these unknown obligations are expected to be significant and we believe could include approximately
$3 billion to $5 billion
over the next three years, with the payments for the vast majority of such amounts expected to occur after the next twelve months. The foregoing range is based on considerable management judgments and the actual amounts may differ. Once we know the title that we will receive and the license fees, we include the amount in the contractual obligations table above.
|
(2)
|
Long-term debt obligations include our Notes consisting of principal and interest payments. See
Note 4
Long-term Debt
in the accompanying notes to our consolidated financial statements included in Part II, Item 8, "Financial Statements and Supplementary Data" of this Annual Report on Form 10-K for further details.
|
|
(3)
|
Lease obligations include lease financing obligations of
$15.6 million
related to our current Los Gatos, California headquarters for which we are the deemed owner for accounting purposes, commitments of
$508.3 million
for our headquarters in Los Gatos, California, and our office space in Los Angeles, California and other commitments of
$213.5 million
and for facilities under non-cancelable operating leases. These leases have expiration dates varying through approximately
2027
.
|
28
|
(4)
|
Other purchase obligations include all other non-cancelable contractual obligations. These contracts are primarily related to streaming delivery and DVD content acquisition.
|
As of
December 31, 2017
, we had gross unrecognized tax benefits of
$42.9 million
which was classified in “Other non-current liabilities” and a reduction to deferred tax assets which was classified as "Other non-current assets" in the consolidated balance sheets. At this time, an estimate of the range of reasonably possible adjustments to the balance of unrecognized tax benefits cannot be made.
Off-Balance Sheet Arrangements
We do not have transactions with unconsolidated entities, such as entities often referred to as structured finance or special purpose entities, whereby we have financial guarantees, subordinated retained interests, derivative instruments, or other contingent arrangements that expose us to material continuing risks, contingent liabilities, or any other obligation under a variable interest in an unconsolidated entity that provides financing, liquidity, market risk, or credit risk support to us.
Indemnifications
The information set forth under
Note 6
Guarantees - Indemnification Obligations
in the accompanying notes to our consolidated financial statements included in Part II, Item 8, "Financial Statements and Supplementary Data" of this Annual Report on Form 10-K is incorporated herein by reference.
Critical Accounting Policies and Estimates
The preparation of consolidated financial statements in conformity with accounting principles generally accepted in the United States of America requires management to make estimates and assumptions that affect the reported amounts of assets and liabilities, disclosures of contingent assets and liabilities at the date of the financial statements, and the reported amounts of revenues and expenses during the reported periods. The Securities and Exchange Commission ("SEC") has defined a company’s critical accounting policies as the ones that are most important to the portrayal of a company’s financial condition and results of operations, and which require a company to make its most difficult and subjective judgments. Based on this definition, we have identified the critical accounting policies and judgments addressed below. We base our estimates on historical experience and on various other assumptions that we believe to be reasonable under the circumstances. Actual results may differ from these estimates.
Streaming Content
We acquire, license and produce content, including original programing, in order to offer our members unlimited viewing of TV shows and films. The content licenses are for a fixed fee and specific windows of availability. Payment terms for certain content licenses and the production of content require more upfront cash payments relative to the amortization expense. Payments for content, including additions to streaming assets and the changes in related liabilities, are classified within "Net cash used in operating activities" on the Consolidated Statements of Cash Flows.
For licenses, we capitalize the fee per title and record a corresponding liability at the gross amount of the liability when the license period begins, the cost of the title is known and the title is accepted and available for streaming. The portion available for streaming within one year is recognized as “Current content assets, net” and the remaining portion as “Non-current content assets, net” on the Consolidated Balance Sheets.
For productions, we capitalize costs associated with the production, including development cost, direct costs and production overhead. We include these amounts in "Non-current content assets, net" on the Consolidated Balance Sheets. Participations and residuals are expensed in line with the amortization of production costs.
Based on factors including historical and estimated viewing patterns, we amortize the content assets (licensed and produced) in “Cost of revenues” on the Consolidated Statements of Operations, over the shorter of each title's contractual window of availability or estimated period of use or ten years, beginning with the month of first availability. The amortization is on an accelerated basis as we typically expect more upfront viewing, for instance due to additional merchandising and marketing efforts. We review factors that impact the amortization of the content assets on a regular basis. Our estimates related to these factors require considerable management judgment.
Our business model is subscription based as opposed to a model generating revenues at a specific title level. Therefore, content assets, both licensed and produced, are reviewed in aggregate at the operating segment level when an event or change in circumstances indicates a change in the expected usefulness. To date, we have not identified any such event or changes in circumstances. If such changes are identified in the future, these aggregated content assets will be stated at the lower of unamortized cost, net realizable value or fair value. In addition, unamortized costs for assets that have been, or are expected to be, abandoned are written off.
29
Income Taxes
We record a provision for income taxes for the anticipated tax consequences of our reported results of operations using the asset and liability method. Deferred income taxes are recognized by applying enacted statutory tax rates applicable to future years to differences between the financial statement carrying amounts of existing assets and liabilities and their respective tax bases as well as net operating loss and tax credit carryforwards. The effect on deferred tax assets and liabilities of a change in tax rates is recognized in income in the period that includes the enactment date. The measurement of deferred tax assets is reduced, if necessary, by a valuation allowance for any tax benefits for which future realization is uncertain.
Although we believe our assumptions, judgments and estimates are reasonable, changes in tax laws or our interpretation of tax laws and the resolution of any tax audits could significantly impact the amounts provided for income taxes in our consolidated financial statements.
In evaluating our ability to recover our deferred tax assets, in full or in part, we consider all available positive and negative evidence, including our past operating results, and our forecast of future earnings, future taxable income and prudent and feasible tax planning strategies. The assumptions utilized in determining future taxable income require significant judgment and are consistent with the plans and estimates we are using to manage the underlying businesses. Actual operating results in future years could differ from our current assumptions, judgments and estimates. However, we believe that it is more likely than not that most of the deferred tax assets recorded on our Consolidated Balance Sheets will ultimately be realized. We record a valuation allowance to reduce our deferred tax assets to the net amount that we believe is more likely than not to be realized. At December 31, 2017 the valuation allowance of $49.4 million was related to foreign tax credits that we are not expected to realize.
We did not recognize certain tax benefits from uncertain tax positions within the provision for income taxes. We may recognize a tax benefit only if it is more likely than not the tax position will be sustained on examination by the taxing authorities, based on the technical merits of the position. The tax benefits recognized in the financial statements from such positions are then measured based on the largest benefit that has a greater than
50%
likelihood of being realized upon settlement. At
December 31, 2017
, our estimated gross unrecognized tax benefits were
$42.9 million
of which
$37.9 million
, if recognized, would favorably impact our future earnings. Due to uncertainties in any tax audit outcome, our estimates of the ultimate settlement of our unrecognized tax positions may change and the actual tax benefits may differ significantly from the estimates.
On
December 22, 2017
, the Tax Cuts and Jobs Act of 2017 (the “Act”) was signed into law making significant changes to the Internal Revenue Code. Changes include, but are not limited to, a federal corporate tax rate decrease from
35%
to
21%
for tax years beginning after
December 31, 2017
, the transition of U.S international taxation from a worldwide tax system to a territorial system, and a one-time transition tax on the mandatory deemed repatriation of foreign earnings. We have estimated our provision for income taxes in accordance with the Act and guidance available as of the date of this filing and as a result have recorded
$79.1 million
as additional income tax expense in the fourth quarter of
2017
, the period in which the legislation was enacted. The provisional amount related to the remeasurement of certain deferred tax assets and liabilities, based on the rates at which they are expected to reverse in the future, was
$46.9 million
. The provisional amount related to the one-time transition tax on the mandatory deemed repatriation of foreign earnings was $32.2 million based on cumulative foreign earnings of $484.9 million.
On December 22, 2017, Staff Accounting Bulletin No. 118 ("SAB 118") was issued to address the application of US GAAP in situations when a registrant does not have the necessary information available, prepared, or analyzed (including computations) in reasonable detail to complete the accounting for certain income tax effects of the Act. In accordance with SAB 118, we have determined that the $46.9 million of the deferred tax expense recorded in connection with the remeasurement of certain deferred tax assets and liabilities and the $32.2 million of current tax expense recorded in connection with the transition tax on the mandatory deemed repatriation of foreign earnings was a provisional amount and a reasonable estimate at December 31, 2017. Additional work is necessary for a more detailed analysis of our deferred tax assets and liabilities and our historical foreign earnings as well as potential correlative adjustments. Any subsequent adjustment to these amounts will be recorded to current tax expense in the quarter of 2018 when the analysis is complete.
See Note 9 to the consolidated financial statements for further information regarding income taxes.
Recent Accounting Pronouncements
The information set forth under Note 1 to the consolidated financial statements under the caption “Basis of Presentation and Summary of Significant Accounting Policies” is incorporated herein by reference.
30
|
Item 7A.
|
Quantitative and Qualitative Disclosures about Market Risk
|
We are exposed to market risks related to interest rate changes and the corresponding changes in the market values of our debt and foreign currency fluctuations. In July 2017, we sold all short-term investments.
Interest Rate Risk
At
December 31, 2017
, our cash equivalents were generally invested in money market funds, which are not subject to market risk because the interest paid on such funds fluctuates with the prevailing interest rate.
As of
December 31, 2017
, we had
$6.6 billion
of debt, consisting of fixed rate unsecured debt in seven tranches due between 2021 and 2028. Refer to Note 4 to the consolidated financial statements for details about all issuances. The fair value of our debt will fluctuate with movements of interest rates, increasing in periods of declining rates of interest and declining in periods of increasing rates of interest. The fair value of our debt will also fluctuate based on changes in foreign currency rates, as discussed below.
Foreign Currency Risk
International revenues and cost of revenues account for
44%
and
54%
, respectively, of consolidated amounts for the year ended
December 31, 2017
. The majority of international revenues and a smaller portion of expenses are denominated in currencies other than the U.S. dollar and we therefore have foreign currency risk related to these currencies, which are primarily the euro, the British pound, the Canadian dollar, the Australian dollar, the Japanese yen and the Brazilian real.
Accordingly, changes in exchange rates, and in particular a weakening of foreign currencies relative to the U.S. dollar may negatively affect our revenue and contribution profit (loss) of our International streaming segment as expressed in U.S. dollars. For the year ended
December 31, 2017
, we believe our international revenues would have been approximately
$21.9 million
lower had foreign currency exchange rates remained consistent with those for the year ended
December 31, 2016
.
We have also experienced and will continue to experience fluctuations in our net income as a result of gains (losses) on the settlement and the remeasurement of monetary assets and liabilities denominated in currencies that are not the functional currency. In the year ended
December 31, 2017
, we recognized a
$127.9 million
foreign exchange loss which resulted primarily from the remeasurement of our €1,300.0 million Senior Notes and was partially offset by the remeasurement of significant content liabilities denominated in currencies other than functional currencies of our European and U.S. entities.
In addition, the effect of exchange rate changes on cash and cash equivalents in the year ended
December 31, 2017
was an increase of
$29.8 million
.
We do not use foreign exchange contracts or derivatives to hedge any foreign currency exposures. The volatility of exchange rates depends on many factors that we cannot forecast with reliable accuracy. Our continued international expansion increases our exposure to exchange rate fluctuations and as a result such fluctuations could have a significant impact on our future results of operations.
|
Item 8.
|
Financial Statements and Supplementary Data
|
The consolidated financial statements and accompanying notes listed in Part IV, Item 15(a)(1) of this Annual Report on Form 10-K are included immediately following Part IV hereof and incorporated by reference herein.
|
Item 9.
|
Changes in and Disagreements with Accountants on Accounting and Financial Disclosure
|
None.
31
|
Item 9A.
|
Controls and Procedures
|
|
(a)
|
Evaluation of Disclosure Controls and Procedures
|
Our management, with the participation of our Chief Executive Officer and Chief Financial Officer, evaluated the effectiveness of our disclosure controls and procedures (as defined in Rules 13a-15(e) and 15d-15(e) under the Securities Exchange Act of 1934, as amended) as of the end of the period covered by this Annual Report on Form 10-K. Based on that evaluation, our Chief Executive Officer and Chief Financial Officer concluded that our disclosure controls and procedures as of the end of the period covered by this Annual Report on Form 10-K were effective in providing reasonable assurance that information required to be disclosed by us in reports that we file or submit under the Securities Exchange Act of 1934, as amended, is recorded, processed, summarized and reported within the time periods specified in the Securities and Exchange Commission’s rules and forms, and that such information is accumulated and communicated to our management, including our Chief Executive Officer and Chief Financial Officer, as appropriate, to allow timely decisions regarding required disclosures.
Our management, including our Chief Executive Officer and Chief Financial Officer, does not expect that our disclosure controls and procedures or our internal controls will prevent all error and all fraud. A control system, no matter how well conceived and operated, can provide only reasonable, not absolute, assurance that the objectives of the control system are met. Further, the design of a control system must reflect the fact that there are resource constraints, and the benefits of controls must be considered relative to their costs. Because of the inherent limitations in all control systems, no evaluation of controls can provide absolute assurance that all control issues and instances of fraud, if any, within Netflix have been detected.
|
(b)
|
Management’s Annual Report on Internal Control Over Financial Reporting
|
Our management is responsible for establishing and maintaining adequate internal control over financial reporting (as defined in Rule 13a-15(f) of the Securities Exchange Act of 1934 as amended (the Exchange Act)). Our management assessed the effectiveness of our internal control over financial reporting as of
December 31, 2017
. In making this assessment, our management used the criteria set forth by the Committee of Sponsoring Organizations of the Treadway Commission (“COSO”) in
Internal Control—Integrated Framework
(2013 framework). Based on our assessment under the framework in
Internal Control—Integrated Framework
(2013 framework), our management concluded that our internal control over financial reporting was effective as of
December 31, 2017
. The effectiveness of our internal control over financial reporting as of
December 31, 2017
has been audited by Ernst & Young LLP, an independent registered public accounting firm, as stated in their report that is included herein.
|
(c)
|
Changes in Internal Control Over Financial Reporting
|
There was no change in our internal control over financial reporting that occurred during the quarter ended
December 31, 2017
that has materially affected, or is reasonably likely to materially affect, our internal control over financial reporting.
32
Report of Independent Registered Public Accounting Firm
The Board of Directors and Stockholders of Netflix, Inc.
Opinion on Internal Control over Financial Reporting
We have audited Netflix, Inc.’s internal control over financial reporting as of
December 31, 2017
, based on criteria established in Internal Control - Integrated Framework issued by the Committee of Sponsoring Organizations of the Treadway Commission (2013 framework) (the COSO criteria). In our opinion, Netflix, Inc. (the Company) maintained, in all material respects, effective internal control over financial reporting as of
December 31, 2017
, based on the COSO criteria.
We also have audited, in accordance with the standards of the Public Company Accounting Oversight Board (United States) (PCAOB), the consolidated balance sheets of the Company as of
December 31, 2017
and
2016
, and the related consolidated statements of operations, comprehensive income, stockholders’ equity and cash flows for each of the three years in the period ended
December 31, 2017
of the Company and our report dated
January 29, 2018
expressed an unqualified opinion thereon.
Basis for Opinion
The Company's management is responsible for maintaining effective internal control over financial reporting, and for its assessment of the effectiveness of internal control over financial reporting included in the accompanying Management’s Annual Report on Internal Control over Financial Reporting. Our responsibility is to express an opinion on the Company’s internal control over financial reporting based on our audit. We are a public accounting firm registered with the PCAOB and are required to be independent with respect to the Company in accordance with the U.S. federal securities laws and the applicable rules and regulations of the Securities and Exchange Commission and the PCAOB.
We conducted our audit in accordance with the standards of the PCAOB. Those standards require that we plan and perform the audit to obtain reasonable assurance about whether effective internal control over financial reporting was maintained in all material respects. Our audit included obtaining an understanding of internal control over financial reporting, assessing the risk that a material weakness exists, testing and evaluating the design and operating effectiveness of internal control based on the assessed risk, and performing such other procedures as we considered necessary in the circumstances. We believe that our audit provides a reasonable basis for our opinion.
Definition and Limitations of Internal Control Over Financial Reporting
A company’s internal control over financial reporting is a process designed to provide reasonable assurance regarding the reliability of financial reporting and the preparation of financial statements for external purposes in accordance with generally accepted accounting principles. A company’s internal control over financial reporting includes those policies and procedures that (1) pertain to the maintenance of records that, in reasonable detail, accurately and fairly reflect the transactions and dispositions of the assets of the company; (2) provide reasonable assurance that transactions are recorded as necessary to permit preparation of financial statements in accordance with generally accepted accounting principles, and that receipts and expenditures of the company are being made only in accordance with authorizations of management and directors of the company; and (3) provide reasonable assurance regarding prevention or timely detection of unauthorized acquisition, use, or disposition of the company’s assets that could have a material effect on the financial statements.
Because of its inherent limitations, internal control over financial reporting may not prevent or detect misstatements. Also, projections of any evaluation of effectiveness to future periods are subject to the risk that controls may become inadequate because of changes in conditions, or that the degree of compliance with the policies or procedures may deteriorate.
|
/s/ Ernst & Young LLP
|
|
|
San Jose, California
|
|
|
January 29, 2018
|
|
33
|
Item 9B.
|
Other Information
|
None.
34
|
Item 10.
|
Directors, Executive Officers and Corporate Governance
|
Information regarding our directors and executive officers is incorporated by reference from the information contained under the sections “Proposal One: Election of Directors,” “Section 16(a) Beneficial Ownership Compliance” and “Code of Ethics” in our Proxy Statement for the Annual Meeting of Stockholders.
|
Item 11.
|
Executive Compensation
|
Information required by this item is incorporated by reference from information contained under the section “Compensation of Executive Officers and Other Matters” in our Proxy Statement for the Annual Meeting of Stockholders.
|
Item 12.
|
Security Ownership of Certain Beneficial Owners and Management and Related Stockholder Matters
|
Information required by this item is incorporated by reference from information contained under the sections “Security Ownership of Certain Beneficial Owners and Management” and “Equity Compensation Plan Information” in our Proxy Statement for the Annual Meeting of Stockholders.
|
Item 13.
|
Certain Relationships and Related Transactions, and Director Independence
|
Information required by this item is incorporated by reference from information contained under the section “Certain Relationships and Related Transactions” and “Director Independence” in our Proxy Statement for the Annual Meeting of Stockholders.
|
Item 14.
|
Principal Accounting Fees and Services
|
Information with respect to principal independent registered public accounting firm fees and services is incorporated by reference from the information under the caption “Proposal Two: Ratification of Appointment of Independent Registered Public Accounting Firm” in our Proxy Statement for the Annual Meeting of Stockholders.
35
|
Item 15.
|
Exhibits, Financial Statement Schedules
|
|
(a)
|
The following documents are filed as part of this Annual Report on Form 10-K:
|
|
(1)
|
Financial Statements:
|
The financial statements are filed as part of this Annual Report on Form 10-K under “Item 8. Financial Statements and Supplementary Data.”
|
(2)
|
Financial Statement Schedules:
|
The financial statement schedules are omitted as they are either not applicable or the information required is presented in the financial statements and notes thereto under “Item 8. Financial Statements and Supplementary Data.”
|
(3)
|
Exhibits:
|
See Exhibit Index immediately following the signature page of this Annual Report on Form 10-K.
36
|
Item 16.
|
Form 10-K Summary
|
None.
37
NETFLIX, INC.
INDEX TO FINANCIAL STATEMENTS
|
|
Page
|
38
REPORT OF INDEPENDENT REGISTERED PUBLIC ACCOUNTING FIRM
The Board of Directors and Stockholders of Netflix, Inc.
Opinion on the Financial Statements
We have audited the accompanying consolidated balance sheets of Netflix, Inc. (the Company) as of
December 31, 2017
and
2016
, and the related consolidated statements of operations, comprehensive income, stockholders’ equity and cash flows for each of the three years in the period ended
December 31, 2017
. In our opinion, the financial statements present fairly, in all material respects, the consolidated financial position of the Company at
December 31, 2017
and
2016
, and the consolidated results of its operations and its cash flows for each of the three years in the period ended
December 31, 2017
, in conformity with U.S. generally accepted accounting principles.
We also have audited, in accordance with the standards of the Public Company Accounting Oversight Board (United States) (PCAOB), the Company's internal control over financial reporting as of
December 31, 2017
, based on criteria established in Internal Control - Integrated Framework issued by the Committee of Sponsoring Organizations of the Treadway Commission (2013 Framework) and our report dated
January 29, 2018
expressed an unqualified opinion thereon.
Basis for Opinion
These financial statements are the responsibility of the Company’s management. Our responsibility is to express an opinion on these financial statements based on our audits. We are a public accounting firm registered with the PCAOB and are required to be independent with respect to the Company in accordance with the U.S. federal securities laws and the applicable rules and regulations of the Securities and Exchange Commission and the PCAOB.
We conducted our audits in accordance with the standards of the PCAOB. Those standards require that we plan and perform the audit to obtain reasonable assurance about whether the financial statements are free of material misstatement, whether due to error or fraud. Our audits included performing procedures to assess the risks of material misstatement of the financial statements, whether due to error or fraud, and performing procedures that respond to those risks. Such procedures included examining, on a test basis, evidence regarding the amounts and disclosures in the financial statements. Our audits also included evaluating the accounting principles used and significant estimates made by management, as well as evaluating the overall presentation of the financial statements. We believe that our audits provide a reasonable basis for our opinion.
|
/s/ Ernst & Young LLP
|
|
|
We have served as the Company's auditor since 2012.
|
|
|
San Jose, California
|
|
|
January 29, 2018
|
|
39
NETFLIX, INC.
CONSOLIDATED STATEMENTS OF OPERATIONS
(in thousands, except per share data)
|
|
Year ended December 31,
|
|||||||||||
|
|
2017
|
2016
|
2015
|
|||||||||
|
Revenues
|
$
|
11,692,713
|
|
$
|
8,830,669
|
|
$
|
6,779,511
|
|
|||
|
Cost of revenues
|
7,659,666
|
|
6,029,901
|
|
4,591,476
|
|
||||||
|
Marketing
|
1,278,022
|
|
991,078
|
|
824,092
|
|
||||||
|
Technology and development
|
1,052,778
|
|
852,098
|
|
650,788
|
|
||||||
|
General and administrative
|
863,568
|
|
577,799
|
|
407,329
|
|
||||||
|
Operating income
|
838,679
|
|
379,793
|
|
305,826
|
|
||||||
|
Other income (expense):
|
||||||||||||
|
Interest expense
|
(238,204
|
)
|
(150,114
|
)
|
(132,716
|
)
|
||||||
|
Interest and other income (expense)
|
(115,154
|
)
|
30,828
|
|
(31,225
|
)
|
||||||
|
Income before income taxes
|
485,321
|
|
260,507
|
|
141,885
|
|
||||||
|
Provision for (benefit from) income taxes
|
(73,608
|
)
|
73,829
|
|
19,244
|
|
||||||
|
Net income
|
$
|
558,929
|
|
$
|
186,678
|
|
$
|
122,641
|
|
|||
|
Earnings per share:
|
||||||||||||
|
Basic
|
$
|
1.29
|
|
$
|
0.44
|
|
$
|
0.29
|
|
|||
|
Diluted
|
$
|
1.25
|
|
$
|
0.43
|
|
$
|
0.28
|
|
|||
|
Weighted-average common shares outstanding:
|
||||||||||||
|
Basic
|
431,885
|
|
428,822
|
|
425,889
|
|
||||||
|
Diluted
|
446,814
|
|
438,652
|
|
436,456
|
|
||||||
See accompanying notes to consolidated financial statements.
40
NETFLIX, INC.
CONSOLIDATED STATEMENTS OF COMPREHENSIVE INCOME
(in thousands)
|
Year ended December 31,
|
|||||||||||
|
2017
|
2016
|
2015
|
|||||||||
|
Net income
|
$
|
558,929
|
|
$
|
186,678
|
|
$
|
122,641
|
|
||
|
Other comprehensive income (loss):
|
|
|
|
|
|
|
|||||
|
Foreign currency translation adjustments
|
27,409
|
|
(5,464
|
)
|
(37,887
|
)
|
|||||
|
Change in unrealized gains (losses) on available-for-sale securities, net of tax of $378, $126, and $(598), respectively
|
599
|
|
207
|
|
(975
|
)
|
|||||
|
Total other comprehensive income (loss)
|
28,008
|
|
(5,257
|
)
|
(38,862
|
)
|
|||||
|
Comprehensive income
|
$
|
586,937
|
|
$
|
181,421
|
|
$
|
83,779
|
|
||
See accompanying notes to consolidated financial statements.
41
NETFLIX, INC.
CONSOLIDATED STATEMENTS OF CASH FLOWS
(in thousands)
|
|
Year Ended December 31,
|
|||||||||||
|
|
2017
|
2016
|
2015
|
|||||||||
|
Cash flows from operating activities:
|
||||||||||||
|
Net income
|
$
|
558,929
|
|
$
|
186,678
|
|
$
|
122,641
|
|
|||
|
Adjustments to reconcile net income to net cash used in operating activities:
|
||||||||||||
|
Additions to streaming content assets
|
(9,805,763
|
)
|
(8,653,286
|
)
|
(5,771,652
|
)
|
||||||
|
Change in streaming content liabilities
|
900,006
|
|
1,772,650
|
|
1,162,413
|
|
||||||
|
Amortization of streaming content assets
|
6,197,817
|
|
4,788,498
|
|
3,405,382
|
|
||||||
|
Amortization of DVD content assets
|
60,657
|
|
78,952
|
|
79,380
|
|
||||||
|
Depreciation and amortization of property, equipment and intangibles
|
71,911
|
|
57,528
|
|
62,283
|
|
||||||
|
Stock-based compensation expense
|
182,209
|
|
173,675
|
|
124,725
|
|
||||||
|
Excess tax benefits from stock-based compensation
|
—
|
|
(65,121
|
)
|
(80,471
|
)
|
||||||
|
Other non-cash items
|
57,207
|
|
40,909
|
|
31,628
|
|
||||||
|
Foreign currency remeasurement loss on long-term debt
|
140,790
|
|
—
|
|
—
|
|
||||||
|
Deferred taxes
|
(208,688
|
)
|
(46,847
|
)
|
(58,655
|
)
|
||||||
|
Changes in operating assets and liabilities:
|
||||||||||||
|
Other current assets
|
(234,090
|
)
|
46,970
|
|
18,693
|
|
||||||
|
Accounts payable
|
74,559
|
|
32,247
|
|
51,615
|
|
||||||
|
Accrued expenses
|
114,337
|
|
68,706
|
|
48,810
|
|
||||||
|
Deferred revenue
|
177,974
|
|
96,751
|
|
72,135
|
|
||||||
|
Other non-current assets and liabilities
|
(73,803
|
)
|
(52,294
|
)
|
(18,366
|
)
|
||||||
|
Net cash used in operating activities
|
(1,785,948
|
)
|
(1,473,984
|
)
|
(749,439
|
)
|
||||||
|
Cash flows from investing activities:
|
||||||||||||
|
Acquisitions of DVD content assets
|
(53,720
|
)
|
(77,177
|
)
|
(77,958
|
)
|
||||||
|
Purchases of property and equipment
|
(173,302
|
)
|
(107,653
|
)
|
(91,248
|
)
|
||||||
|
Other assets
|
(6,689
|
)
|
(941
|
)
|
(1,912
|
)
|
||||||
|
Purchases of short-term investments
|
(74,819
|
)
|
(187,193
|
)
|
(371,915
|
)
|
||||||
|
Proceeds from sale of short-term investments
|
320,154
|
|
282,484
|
|
259,079
|
|
||||||
|
Proceeds from maturities of short-term investments
|
22,705
|
|
140,245
|
|
104,762
|
|
||||||
|
Net cash provided by (used in) investing activities
|
34,329
|
|
49,765
|
|
(179,192
|
)
|
||||||
|
Cash flows from financing activities:
|
||||||||||||
|
Proceeds from issuance of debt
|
3,020,510
|
|
1,000,000
|
|
1,500,000
|
|
||||||
|
Issuance costs
|
(32,153
|
)
|
(10,700
|
)
|
(17,629
|
)
|
||||||
|
Proceeds from issuance of common stock
|
88,378
|
|
36,979
|
|
77,980
|
|
||||||
|
Excess tax benefits from stock-based compensation
|
—
|
|
65,121
|
|
80,471
|
|
||||||
|
Other financing activities
|
255
|
|
230
|
|
(545
|
)
|
||||||
|
Net cash provided by financing activities
|
3,076,990
|
|
1,091,630
|
|
1,640,277
|
|
||||||
|
Effect of exchange rate changes on cash and cash equivalents
|
29,848
|
|
(9,165
|
)
|
(15,924
|
)
|
||||||
|
Net increase (decrease) in cash and cash equivalents
|
1,355,219
|
|
(341,754
|
)
|
695,722
|
|
||||||
|
Cash and cash equivalents, beginning of year
|
1,467,576
|
|
1,809,330
|
|
1,113,608
|
|
||||||
|
Cash and cash equivalents, end of year
|
$
|
2,822,795
|
|
$
|
1,467,576
|
|
$
|
1,809,330
|
|
|||
|
Supplemental disclosure:
|
||||||||||||
|
Income taxes paid
|
$
|
113,591
|
|
$
|
26,806
|
|
$
|
27,658
|
|
|||
|
Interest paid
|
213,313
|
|
138,566
|
|
111,761
|
|
||||||
|
Increase (decrease) in investing activities included in liabilities
|
(32,643
|
)
|
27,504
|
|
(4,978
|
)
|
||||||
See accompanying notes to consolidated financial statements.
42
NETFLIX, INC.
CONSOLIDATED BALANCE SHEETS
(in thousands, except share and per share data)
|
|
As of December 31,
|
|||||||
|
|
2017
|
2016
|
||||||
|
Assets
|
||||||||
|
Current assets:
|
||||||||
|
Cash and cash equivalents
|
$
|
2,822,795
|
|
$
|
1,467,576
|
|
||
|
Short-term investments
|
—
|
|
266,206
|
|
||||
|
Current content assets, net
|
4,310,934
|
|
3,726,307
|
|
||||
|
Other current assets
|
536,245
|
|
260,202
|
|
||||
|
Total current assets
|
7,669,974
|
|
5,720,291
|
|
||||
|
Non-current content assets, net
|
10,371,055
|
|
7,274,501
|
|
||||
|
Property and equipment, net
|
319,404
|
|
250,395
|
|
||||
|
Other non-current assets
|
652,309
|
|
341,423
|
|
||||
|
Total assets
|
$
|
19,012,742
|
|
$
|
13,586,610
|
|
||
|
Liabilities and Stockholders’ Equity
|
||||||||
|
Current liabilities:
|
||||||||
|
Current content liabilities
|
$
|
4,173,041
|
|
$
|
3,632,711
|
|
||
|
Accounts payable
|
359,555
|
|
312,842
|
|
||||
|
Accrued expenses
|
315,094
|
|
197,632
|
|
||||
|
Deferred revenue
|
618,622
|
|
443,472
|
|
||||
|
Total current liabilities
|
5,466,312
|
|
4,586,657
|
|
||||
|
Non-current content liabilities
|
3,329,796
|
|
2,894,654
|
|
||||
|
Long-term debt
|
6,499,432
|
|
3,364,311
|
|
||||
|
Other non-current liabilities
|
135,246
|
|
61,188
|
|
||||
|
Total liabilities
|
15,430,786
|
|
10,906,810
|
|
||||
|
Commitments and contingencies (Note 5)
|
|
|
|
|
||||
|
Stockholders’ equity:
|
||||||||
|
Preferred stock, $0.001 par value; 10,000,000 shares authorized at December 31, 2017 and 2016; no shares issued and outstanding at December 31, 2017 and 2016
|
—
|
|
—
|
|
||||
|
Common stock, $0.001 par value; 4,990,000,000 shares authorized at December 31, 2017 and December 31, 2016, respectively; 433,392,686 and 430,054,212 issued and outstanding at December 31, 2017 and December 31, 2016, respectively
|
1,871,396
|
|
1,599,762
|
|
||||
|
Accumulated other comprehensive loss
|
(20,557
|
)
|
(48,565
|
)
|
||||
|
Retained earnings
|
1,731,117
|
|
1,128,603
|
|
||||
|
Total stockholders’ equity
|
3,581,956
|
|
2,679,800
|
|
||||
|
Total liabilities and stockholders’ equity
|
$
|
19,012,742
|
|
$
|
13,586,610
|
|
||
See accompanying notes to consolidated financial statements.
43
NETFLIX, INC.
CONSOLIDATED STATEMENTS OF STOCKHOLDERS’ EQUITY
(in thousands, except share data)
|
|
Common Stock and Additional Paid-in Capital
|
Accumulated
Other Comprehensive Income (Loss) |
Retained
Earnings |
Total
Stockholders’ Equity |
||||||||||||||
|
|
Shares
|
Amount
|
|
|
||||||||||||||
|
Balances as of December 31, 2014
|
422,910,887
|
|
$
|
1,042,870
|
|
$
|
(4,446
|
)
|
$
|
819,284
|
|
$
|
1,857,708
|
|
||||
|
Net income
|
—
|
|
—
|
|
—
|
|
122,641
|
|
122,641
|
|
||||||||
|
Other comprehensive loss
|
—
|
|
—
|
|
(38,862
|
)
|
—
|
|
(38,862
|
)
|
||||||||
|
Issuance of common stock upon exercise of options
|
5,029,553
|
|
77,334
|
|
—
|
|
—
|
|
77,334
|
|
||||||||
|
Stock-based compensation expense
|
—
|
|
124,725
|
|
—
|
|
—
|
|
124,725
|
|
||||||||
|
Excess stock option income tax benefits
|
—
|
|
79,880
|
|
—
|
|
—
|
|
79,880
|
|
||||||||
|
Balances as of December 31, 2015
|
427,940,440
|
|
$
|
1,324,809
|
|
$
|
(43,308
|
)
|
$
|
941,925
|
|
$
|
2,223,426
|
|
||||
|
Net income
|
—
|
|
—
|
|
—
|
|
186,678
|
|
186,678
|
|
||||||||
|
Other comprehensive loss
|
—
|
|
—
|
|
(5,257
|
)
|
—
|
|
(5,257
|
)
|
||||||||
|
Issuance of common stock upon exercise of options
|
2,113,772
|
|
36,979
|
|
—
|
|
—
|
|
36,979
|
|
||||||||
|
Stock-based compensation expense
|
—
|
|
173,675
|
|
—
|
|
—
|
|
173,675
|
|
||||||||
|
Excess stock option income tax benefits
|
—
|
|
64,299
|
|
—
|
|
—
|
|
64,299
|
|
||||||||
|
Balances as of December 31, 2016
|
430,054,212
|
|
$
|
1,599,762
|
|
$
|
(48,565
|
)
|
$
|
1,128,603
|
|
$
|
2,679,800
|
|
||||
|
Net income
|
—
|
|
—
|
|
—
|
|
558,929
|
|
558,929
|
|
||||||||
|
Other comprehensive income
|
—
|
|
—
|
|
28,008
|
|
—
|
|
28,008
|
|
||||||||
|
Issuance of common stock upon exercise of options
|
3,338,474
|
|
89,425
|
|
—
|
|
—
|
|
89,425
|
|
||||||||
|
Stock-based compensation expense
|
—
|
|
182,209
|
|
—
|
|
—
|
|
182,209
|
|
||||||||
|
Cumulative Effect Adjustment of ASU 2016-09 (Note 1)
|
—
|
|
—
|
|
—
|
|
43,585
|
|
43,585
|
|
||||||||
|
Balances as of December 31, 2017
|
433,392,686
|
|
$
|
1,871,396
|
|
$
|
(20,557
|
)
|
$
|
1,731,117
|
|
$
|
3,581,956
|
|
||||
See accompanying notes to consolidated financial statements.
44
NETFLIX, INC.
NOTES TO CONSOLIDATED FINANCIAL STATEMENTS
|
1.
|
Organization and Summary of Significant Accounting Policies
|
Description of Business
Netflix, Inc. (the “Company”) was incorporated on August 29, 1997 and began operations on April 14, 1998. The Company is the world’s leading internet television network with over
117
million streaming memberships in over
190
countries enjoying more than
140
million hours of TV shows and movies per day, including original series, documentaries and feature films. Members can watch as much as they want, anytime, anywhere, on nearly any internet-connected screen. Members can play, pause and resume watching, all without commercials or commitments. Additionally, in the United States ("U.S."), members can receive DVDs.
The Company has
three
reportable segments: Domestic streaming, International streaming and Domestic DVD, all of which derive revenue from monthly membership fees. See Note 11 to the consolidated financial statements for further detail on the Company's segments.
Basis of Presentation
The consolidated financial statements include the accounts of the Company and its wholly-owned subsidiaries. Intercompany balances and transactions have been eliminated.
Use of Estimates
The preparation of consolidated financial statements in conformity with accounting principles generally accepted in the United States of America requires management to make estimates and assumptions that affect the reported amounts of assets and liabilities, disclosure of contingent assets and liabilities at the date of the financial statements, and the reported amounts of revenues and expenses during the reporting periods. Significant items subject to such estimates and assumptions include the streaming content asset amortization policy and the recognition and measurement of income tax assets and liabilities. The Company bases its estimates on historical experience and on various other assumptions that the Company believes to be reasonable under the circumstances. On an ongoing basis, the Company evaluates these assumptions, judgments and estimates. Actual results may differ from these estimates.
Recently adopted accounting pronouncements
In March 2016, the Financial Accounting Standards Board ("FASB") issued Accounting Standards Update ("ASU") 2016-09,
Improvements to Employee Share-Based Payment Accounting
, which amends Accounting Standards Codification ("ASC") Topic 718,
Compensation – Stock Compensation
. ASU 2016-09 simplifies several aspects of the accounting for share-based payment transactions, including the income tax consequences, classification of awards as either equity or liabilities, and classification on the statement of cash flows. Under the new standard, all excess tax benefits and tax deficiencies are recorded as a component of the provision for income taxes in the reporting period in which they occur. Additionally, ASU 2016-09 requires that the Company present excess tax benefits on the Statement of Cash Flows as an operating activity. ASU 2016-09 is effective for fiscal years beginning after December 15, 2016, and interim periods within those fiscal years. The Company adopted ASU 2016-09 in fiscal year 2017 and elected to apply this adoption prospectively. Prior periods have not been adjusted. See Note 9 to the consolidated financial statements for information regarding the impact on the Company’s financial statements.
In January 2017, the FASB issued ASU 2017-01,
Business Combinations (Topic 805): Clarifying the Definition of a Business
. The standard provides guidance to assist entities with evaluating whether transactions should be accounted for as acquisitions (or disposals) of assets or businesses. If substantially all of the fair value of the gross assets acquired (or disposed of) is concentrated in a single asset or a group of similar assets, the assets acquired (or disposed of) are not considered a business. ASU 2017-01 is effective for fiscal periods beginning after December 15, 2017 (including interim periods within those periods) with early adoption permitted. The Company early adopted the standard in the third quarter of 2017 on a prospective basis and the impact on its consolidated financial statements was not material.
Recently issued accounting pronouncements not yet adopted
In May 2014, the FASB issued ASU 2014-09,
Revenue from Contracts with Customers (Topic 606)
which amended the existing accounting standards for revenue recognition. ASU 2014-09 establishes principles for recognizing revenue upon the transfer of promised goods or services to customers, in an amount that reflects the expected consideration received in exchange for those goods or services. In July 2015, the FASB deferred the effective date for annual reporting periods beginning after December 15, 2017 (including interim reporting periods within those periods). The amendments may be applied
45
retrospectively to each prior period (full retrospective) or retrospectively with the cumulative effect recognized as of the date of initial application (modified retrospective). The Company will adopt ASU 2014-09 in the first quarter of 2018 and apply the modified retrospective approach. Because the Company's primary source of revenues is from monthly membership fees which are recognized ratably over each monthly membership period, the Company does not expect the impact on its consolidated financial statements to be material.
In February 2016, the FASB issued ASU 2016-02,
Leases (Topic 842)
in order to increase transparency and comparability among organizations by recognizing lease assets and lease liabilities on the balance sheet for those leases classified as operating leases under previous GAAP. ASU 2016-02 requires that a lessee should recognize a liability to make lease payments (the lease liability) and a right-of-use asset representing its right to use the underlying asset for the lease term on the balance sheet. ASU 2016-02 is effective for fiscal years beginning after December 15, 2018 (including interim periods within those periods) using a modified retrospective approach and early adoption is permitted. The Company will adopt ASU 2016-02 in the first quarter of 2019. Although the Company is in the process of evaluating the impact of adoption of the ASU on its consolidated financial statements, the Company currently believes the most significant changes will be related to the recognition of new right-of-use assets and lease liabilities on the Company's balance sheet for real estate operating leases.
In November 2016, the FASB issued ASU 2016-18,
Restricted Cash
, which requires amounts generally described as restricted cash and restricted cash equivalents be included with cash and cash equivalents when reconciling the total beginning and ending amounts for the periods shown on the statement of cash flows. ASU 2016-08 is effective for fiscal years beginning after December 15, 2017 (including interim periods within those periods) using a retrospective transition method to each period presented. The Company will adopt ASU 2016-18 in the first quarter of 2018 and does not expect the impact on its consolidated financial statements to be material.
In January 2018, the FASB released guidance on the accounting for tax on the global intangible low-taxed income ("GILTI") provisions of the Tax Cuts and Jobs Act (the "Act"). The GILTI provisions impose a tax on foreign income in excess of a deemed return on tangible assets of foreign corporations. The guidance indicates that either accounting for deferred taxes related to GILTI inclusions or to treat any taxes on GILTI inclusions as period cost are both acceptable methods subject to an accounting policy election. Effective the first quarter of 2018, the Company will elect to treat any potential GILTI inclusions as a period cost as we are not projecting any material impact from GILTI inclusions and any deferred taxes related to any inclusion would be immaterial.
Cash Equivalents and Short-term Investments
The Company considers investments in instruments purchased with an original maturity of
90
days or less to be cash equivalents. The Company also classifies amounts in transit from payment processors for customer credit card and debit card transactions as cash equivalents.
In July 2017, the Company sold all short-term investments. The Company classified short-term investments, which consisted of marketable securities with original maturities in excess of
90
days as available-for-sale. Short-term investments were reported at fair value with unrealized gains and losses included in “Accumulated other comprehensive loss” within Stockholders’ equity in the Consolidated Balance Sheets. The amortization of premiums and discounts on the investments, realized gains and losses, and declines in value judged to be other-than-temporary on available-for-sale securities are included in “Interest and other income (expense)” in the Consolidated Statements of Operations. The Company used the specific identification method to determine cost in calculating realized gains and losses upon the sale of short-term investments.
Short-term investments were reviewed periodically to identify possible other-than-temporary impairment. When evaluating the investments, the Company reviewed factors such as the length of time and extent to which fair value has been below cost basis, the financial condition of the issuer, the Company’s intent to sell, or whether it would be more likely than not that the Company would be required to sell the investments before the recovery of their amortized cost basis.
Streaming Content
The Company acquires, licenses and produces content, including original programming, in order to offer members unlimited viewing of TV shows and films. The content licenses are for a fixed fee and specific windows of availability. Payment terms for certain content licenses and the production of content require more upfront cash payments relative to the amortization expense. Payments for content, including additions to streaming assets and the changes in related liabilities, are classified within "Net cash used in operating activities" on the Consolidated Statements of Cash Flows.
For licenses, the Company capitalizes the fee per title and records a corresponding liability at the gross amount of the liability when the license period begins, the cost of the title is known and the title is accepted and available for streaming. The portion available for streaming within
one
year is recognized as “Current content assets, net” and the remaining portion as “Non-current content assets, net” on the Consolidated Balance Sheets.
46
For productions, the Company capitalizes costs associated with the production, including development costs, direct costs and production overhead. These amounts are included in "Non-current content assets, net" on the Consolidated Balance Sheets. Participations and residuals are expensed in line with the amortization of production costs.
Based on factors including historical and estimated viewing patterns, the Company amortizes the content assets (licensed and produced) in “Cost of revenues” on the Consolidated Statements of Operations over the shorter of each title's contractual window of availability or estimated period of use or
10
years, beginning with the month of first availability. The amortization is on an accelerated basis, as the Company typically expects more upfront viewing, for instance due to additional merchandising and marketing efforts. The Company reviews factors impacting the amortization of the content assets on an ongoing basis. The Company's estimates related to these factors require considerable management judgment.
The Company's business model is subscription based as opposed to a model generating revenues at a specific title level. Therefore, content assets, both licensed and produced, are reviewed in aggregate at the operating segment level when an event or change in circumstances indicates a change in the expected usefulness of the content or that the net realizable value or fair value may be less than amortized cost. To date, the Company has not identified any such event or changes in circumstances. If such changes are identified in the future, these aggregated content assets will be stated at the lower of unamortized cost, net realizable value or fair value. In addition, unamortized costs for assets that have been, or are expected to be, abandoned are written off.
Property and Equipment
Property and equipment are carried at cost less accumulated depreciation. Depreciation is calculated using the straight-line method over the shorter of the estimated useful lives of the respective assets, generally up to
30 years
, or the lease term for leasehold improvements, if applicable. Leased buildings are capitalized and included in property and equipment when the Company was involved in the construction funding and did not meet the “sale-leaseback” criteria.
Revenue Recognition
The Company's primary source of revenues are from monthly membership fees. Members are billed in advance of the start of their monthly membership and revenues are recognized ratably over each monthly membership period. Revenues are presented net of the taxes that are collected from members and remitted to governmental authorities. Deferred revenue consists of membership fees billed that have not been recognized and gift and other prepaid memberships that have not been redeemed.
Marketing
Marketing expenses consist primarily of advertising expenses and certain payments made to the Company’s partners, including consumer electronics (“CE”) manufacturers, multichannel video programming distributors (“MVPDs”), mobile operators and internet service providers (“ISPs”). Advertising expenses include promotional activities such as digital and television advertising. Advertising costs are expensed as incurred. Advertising expenses were
$1,091.1 million
,
$842.4 million
and
$714.3 million
for the years ended
December 31, 2017
,
2016
and
2015
, respectively.
Research and Development
Research and development expenses are included within "Technology and Development" on the Company's Consolidated Statements of Operations and primarily consist of payroll and related costs incurred in making improvements to our service offerings. Research and development expenses were
$981.3 million
,
$768.3 million
and
$570.0 million
for the years ended
December 31, 2017
,
2016
and
2015
, respectively.
Income Taxes
The Company records a provision for income taxes for the anticipated tax consequences of the reported results of operations using the asset and liability method. Deferred income taxes are recognized by applying enacted statutory tax rates applicable to future years to differences between the financial statement carrying amounts of existing assets and liabilities and their respective tax bases as well as net operating loss and tax credit carryforwards. The effect on deferred tax assets and liabilities of a change in tax rates is recognized in income in the period that includes the enactment date. The measurement of deferred tax assets is reduced, if necessary, by a valuation allowance for any tax benefits for which future realization is uncertain.
The Company did not recognize certain tax benefits from uncertain tax positions within the provision for income taxes. The Company may recognize a tax benefit only if it is more likely than not the tax position will be sustained on examination by the taxing authorities, based on the technical merits of the position. The tax benefits recognized in the financial statements from such positions are then measured based on the largest benefit that has a greater than
50%
likelihood of being realized upon
47
settlement. The Company recognizes interest and penalties related to uncertain tax positions in income tax expense. See
Note 9
to the consolidated financial statements for further information regarding income taxes.
Foreign Currency
The functional currency for the Company's subsidiaries is determined based on the primary economic environment in which the subsidiary operates. The Company translates the assets and liabilities of its non-U.S. dollar functional currency subsidiaries into U.S. dollars using exchange rates in effect at the end of each period. Revenues and expenses for these subsidiaries are translated using rates that approximate those in effect during the period. Gains and losses from these translations are recognized in cumulative translation adjustment included in "Accumulated other comprehensive loss" in Stockholders’ equity on the Consolidated Balance Sheets.
Prior to January 1, 2015, the functional currency of certain of the Company's European entities was the British pound. The Company changed the functional currency of these entities to the euro effective January 1, 2015 following the redomiciliation of the European headquarters and the launch of the Netflix service in several significant European countries. The change in functional currency was applied prospectively from January 1, 2015. Monetary assets and liabilities have been remeasured to the euro at current exchange rates. Non-monetary assets and liabilities have been remeasured to the euro using the exchange rate effective for the period in which the balance arose. As a result of this change of functional currency, the Company recorded a
$21.8 million
cumulative translation adjustment included in other comprehensive loss for year ended
December 31, 2015
.
The Company remeasures monetary assets and liabilities that are not denominated in the functional currency at exchange rates in effect at the end of each period. Gains and losses from these remeasurements are recognized in interest and other income (expense). Foreign currency transactions resulted in a loss of
$127.9 million
for the year ended
December 31, 2017
and a gain of
$22.8 million
and a loss of
$37.3 million
for the years ended December 31,
2016
and
2015
respectively.
Earnings Per Share
In June 2015, the Company's Board of Directors declared a
seven
-for-one stock split in the form of a stock dividend that was paid on July 14, 2015 to all shareholders of record as of July 2, 2015 ("Stock Split"). Outstanding share and per-share amounts disclosed for all periods provided have been retroactively adjusted to reflect the effects of the Stock Split.
Basic earnings per share is computed using the weighted-average number of outstanding shares of common stock during the period. Diluted earnings per share is computed using the weighted-average number of outstanding shares of common stock and, when dilutive, potential common shares outstanding during the period. Potential common shares consist of incremental shares issuable upon the assumed exercise of stock options. The computation of earnings per share is as follows:
|
|
Year ended December 31,
|
||||||||||
|
|
2017
|
2016
|
2015
|
||||||||
|
|
(in thousands, except per share data)
|
||||||||||
|
Basic earnings per share:
|
|||||||||||
|
Net income
|
$
|
558,929
|
|
$
|
186,678
|
|
$
|
122,641
|
|
||
|
Shares used in computation:
|
|||||||||||
|
Weighted-average common shares outstanding
|
431,885
|
|
428,822
|
|
425,889
|
|
|||||
|
Basic earnings per share
|
$
|
1.29
|
|
$
|
0.44
|
|
$
|
0.29
|
|
||
|
Diluted earnings per share:
|
|||||||||||
|
Net income
|
$
|
558,929
|
|
$
|
186,678
|
|
$
|
122,641
|
|
||
|
Shares used in computation:
|
|||||||||||
|
Weighted-average common shares outstanding
|
431,885
|
|
428,822
|
|
425,889
|
|
|||||
|
Employee stock options
|
14,929
|
|
9,830
|
|
10,567
|
|
|||||
|
Weighted-average number of shares
|
446,814
|
|
438,652
|
|
436,456
|
|
|||||
|
Diluted earnings per share
|
$
|
1.25
|
|
$
|
0.43
|
|
$
|
0.28
|
|
||
Employee stock options with exercise prices greater than the average market price of the common stock were excluded from the diluted calculation as their inclusion would have been anti-dilutive. The following table summarizes the potential common shares excluded from the diluted calculation:
48
|
|
Year ended December 31,
|
|||||||
|
|
2017
|
2016
|
2015
|
|||||
|
|
(in thousands)
|
|||||||
|
Employee stock options
|
189
|
|
1,545
|
|
517
|
|
||
Stock-Based Compensation
The Company grants fully vested non-qualified stock options to its employees on a monthly basis. As a result of immediate vesting, stock-based compensation expense is fully recognized on the grant date, and no estimate is required for post-vesting option forfeitures. See
Note 7
to the consolidated financial statements for further information regarding stock-based compensation.
|
2.
|
Short-term Investments
|
In July 2017, the Company sold all short-term investments. As of
December 31, 2017
,
$449.7 million
and
$1.3 million
of money market funds, classified as Level 1 securities, were included in Cash and cash equivalents and Non-current assets, respectively, on the Company's Consolidated Balance Sheet. Foreign time deposits of
$300.8 million
, classified as Level 2 securities, were included in Cash and cash equivalents on the Company's Consolidated Balance Sheet. Additionally,
$4.4 million
of restricted cash is included in Non-current assets on the Company's Consolidated Balance Sheet. Amounts included in Non-current assets are primarily related to workers compensation deposits and letter of credit agreements.
The following table summarizes, by major security type, the Company’s assets that were measured at fair value on a recurring basis and were categorized using the fair value hierarchy and where they are classified on the Consolidated Balance Sheets as of December 31, 2016.
|
|
Amortized
Cost
|
Gross
Unrealized
Gains
|
Gross
Unrealized
Losses
|
Estimated
Fair Value
|
Cash and cash equivalents
|
Short-term investments
|
Non-current assets (1)
|
||||||||||||||||||||
|
|
(in thousands)
|
||||||||||||||||||||||||||
|
Cash
|
$
|
1,267,523
|
|
$
|
—
|
|
$
|
—
|
|
$
|
1,267,523
|
|
$
|
1,264,126
|
|
$
|
—
|
|
$
|
3,397
|
|
||||||
|
Level 1 securities:
|
|||||||||||||||||||||||||||
|
Money market funds
|
204,967
|
|
—
|
|
—
|
|
204,967
|
|
203,450
|
|
—
|
|
1,517
|
|
|||||||||||||
|
Level 2 securities:
|
|||||||||||||||||||||||||||
|
Corporate debt securities
|
199,843
|
|
110
|
|
(731
|
)
|
199,222
|
|
—
|
|
199,222
|
|
—
|
|
|||||||||||||
|
Government securities
|
35,944
|
|
—
|
|
(128
|
)
|
35,816
|
|
—
|
|
35,816
|
|
—
|
|
|||||||||||||
|
Certificate of deposit
|
9,833
|
|
—
|
|
—
|
|
9,833
|
|
—
|
|
9,833
|
|
—
|
|
|||||||||||||
|
Agency securities
|
21,563
|
|
—
|
|
(228
|
)
|
21,335
|
|
—
|
|
21,335
|
|
—
|
|
|||||||||||||
|
Total
|
$
|
1,739,673
|
|
$
|
110
|
|
$
|
(1,087
|
)
|
$
|
1,738,696
|
|
$
|
1,467,576
|
|
$
|
266,206
|
|
$
|
4,914
|
|
||||||
(1) Primarily restricted cash that is related to workers compensation deposits and letter of credit agreements.
Fair value is a market-based measurement that should be determined based on the assumptions that market participants would use in pricing an asset or liability. The hierarchy level assigned to each security in the Company’s available-for-sale portfolio and cash equivalents is based on its assessment of the transparency and reliability of the inputs used in the valuation of such instrument at the measurement date. The fair value of available-for-sale securities and cash equivalents included in the Level 1 category is based on quoted prices that are readily and regularly available in an active market. The fair value of available-for-sale securities included in the Level 2 category is based on observable inputs, such as quoted prices for similar assets at the measurement date; quoted prices in markets that are not active; or other inputs that are observable, either directly or indirectly. These values were obtained from an independent pricing service and were evaluated using pricing models that vary by asset class and may incorporate available trade, bid and other market information and price quotes from well-established independent pricing vendors and broker-dealers. The Company’s procedures include controls to ensure that appropriate fair values are recorded, such as comparing prices obtained from multiple independent sources. See
Note 4
to the consolidated financial statements for further information regarding the fair value of the Company’s senior notes.
There were no material other-than-temporary impairments or credit losses related to available-for-sale securities in the years ended
December 31, 2017
,
2016
or
2015
.
49
There were no material gross realized gains or losses from the sale of available-for-sale investments in the years ended
December 31, 2017
,
2016
and
2015
. Realized gains and losses and interest income are included in "Interest and other income (expense)" on the Consolidated Statements of Operations.
|
3.
|
Balance Sheet Components
|
Content Assets
Content assets consisted of the following:
|
As of December 31,
|
|||||||
|
2017
|
2016
|
||||||
|
(in thousands)
|
|||||||
|
Licensed content, net
|
$
|
11,771,778
|
|
$
|
9,595,315
|
|
|
|
Produced content, net
|
|||||||
|
Released, less amortization
|
1,427,256
|
|
335,400
|
|
|||
|
In production
|
1,311,137
|
|
1,010,463
|
|
|||
|
In development and pre-production
|
158,517
|
|
34,215
|
|
|||
|
2,896,910
|
|
1,380,078
|
|
||||
|
DVD, net
|
13,301
|
|
25,415
|
|
|||
|
Total
|
$
|
14,681,989
|
|
$
|
11,000,808
|
|
|
|
Current content assets, net
|
$
|
4,310,934
|
|
$
|
3,726,307
|
|
|
|
Non-current content assets, net
|
$
|
10,371,055
|
|
$
|
7,274,501
|
|
|
On average, over
90%
of a licensed or produced streaming content asset is expected to be amortized within
four
years after its month of first availability.
As of December 31, 2017, over
30%
of the
$14.7 billion
unamortized cost is expected to be amortized within
one
year and
29%
,
78%
and over
80%
of the
$1.4 billion
unamortized cost of the produced content that has been released is expected to be amortized within
one
year,
three
years and
four
years, respectively.
As of December 31, 2017, the amount of accrued participations and residuals was not material.
Property and Equipment, Net
Property and equipment and accumulated depreciation consisted of the following:
|
As of December 31,
|
Estimated Useful Lives (in Years)
|
|||||||||
|
2017
|
2016
|
|||||||||
|
(in thousands)
|
||||||||||
|
Information technology assets
|
$
|
223,850
|
|
$
|
185,345
|
|
3 years
|
|||
|
Furniture and fixtures
|
49,217
|
|
32,185
|
|
3 years
|
|||||
|
Buildings
|
40,681
|
|
40,681
|
|
30 years
|
|||||
|
Leasehold improvements
|
229,848
|
|
107,945
|
|
Over life of lease
|
|||||
|
DVD operations equipment
|
59,316
|
|
70,152
|
|
5 years
|
|||||
|
Corporate aircraft
|
30,039
|
|
—
|
|
8 years
|
|||||
|
Capital work-in-progress
|
8,267
|
|
108,296
|
|
||||||
|
Property and equipment, gross
|
641,218
|
|
544,604
|
|
||||||
|
Less: Accumulated depreciation
|
(321,814
|
)
|
(294,209
|
)
|
||||||
|
Property and equipment, net
|
$
|
319,404
|
|
$
|
250,395
|
|
||||
The decrease in capital work-in-progress from
December 31, 2016
is primarily due to leasehold improvements for the Company's expanded Los Gatos, California headquarters and the Company's new Los Angeles, California facility, both of which were placed into operation in the first quarter of
2017
.
50
|
4.
|
|
As of
December 31, 2017
, the Company had aggregate outstanding long-term notes of
$6,499.4 million
, net of
$61.9 million
of issuance costs, with varying maturities (the "Notes"). Each of the Notes were issued at par and are senior unsecured obligations of the Company. Interest is payable semi-annually at fixed rates.
The following table provides a summary of the Company's outstanding long-term debt and the fair values based on quoted market prices in less active markets as of
December 31, 2017
and
December 31, 2016
:
|
Level 2 Fair Value as of
|
|||||||||||||||||
|
Principal Amount at Par
|
Issuance Date
|
Maturity
|
Interest Due Dates
|
December 31,
2017 |
December 31,
2016 |
||||||||||||
|
(in millions)
|
(in millions)
|
||||||||||||||||
|
4.875% Senior Notes
|
$
|
1,600
|
|
October 2017
|
April 2028
|
April 15 and October 15
|
$
|
1,571
|
|
$
|
—
|
|
|||||
|
3.625% Senior Notes (1)
|
1,561
|
|
May 2017
|
May 2027
|
May 15 and November 15
|
1,575
|
|
—
|
|
||||||||
|
4.375% Senior Notes
|
1,000
|
|
October 2016
|
November 2026
|
May 15 and November 15
|
983
|
|
975
|
|
||||||||
|
5.50% Senior Notes
|
700
|
|
February 2015
|
February 2022
|
April 15 and October 15
|
739
|
|
758
|
|
||||||||
|
5.875% Senior Notes
|
800
|
|
February 2015
|
February 2025
|
April 15 and October 15
|
856
|
|
868
|
|
||||||||
|
5.750% Senior Notes
|
400
|
|
February 2014
|
March 2024
|
March 1 and September 1
|
427
|
|
431
|
|
||||||||
|
5.375% Senior Notes
|
500
|
|
February 2013
|
February 2021
|
February 1 and August 1
|
530
|
|
539
|
|
||||||||
(1) Debt is denominated in euro with a
€1,300 million
aggregate principal amount and is remeasured into U.S. dollars at each balance sheet date. Total proceeds were
$1,420.5 million
and remeasurement loss on long-term debt was
$140.8 million
for the year ended
December 31, 2017
.
Each of the Notes are repayable in whole or in part upon the occurrence of a change of control, at the option of the holders, at a purchase price in cash equal to
101%
of the principal plus accrued interest. The Company may redeem the Notes prior to maturity in whole or in part at an amount equal to the principal amount thereof plus accrued and unpaid interest and an applicable premium. The Notes include, among other terms and conditions, limitations on the Company's ability to create, incur or allow certain liens; enter into sale and lease-back transactions; create, assume, incur or guarantee additional indebtedness of certain of the Company's subsidiaries; and consolidate or merge with, or convey, transfer or lease all or substantially all of the Company's and its subsidiaries assets, to another person. As of
December 31, 2017
and
December 31, 2016
, the Company was in compliance with all related covenants.
Revolving Credit Facility
In
July 2017
, the Company entered into a
$500.0 million
unsecured revolving credit facility (“Revolving Credit Agreement”), with an uncommitted incremental facility to increase the amount of the revolving credit facility by up to an additional
$250.0 million
, subject to certain terms and conditions. Revolving loans may be borrowed, repaid and reborrowed until July 27, 2022, at which time all amounts borrowed must be repaid. The Company may use the proceeds of future borrowings under the Revolving Credit Agreement for working capital and general corporate purposes. As of
December 31, 2017
, no amounts have been borrowed under the Revolving Credit Agreement.
The borrowings under the Revolving Credit Agreement bear interest, at the Company’s option, of either a floating rate equal to a base rate (the “Alternate Base Rate”) or (ii) a rate equal to an adjusted London interbank offered rate (the “Adjusted LIBO Rate”), plus a margin of
0.75%
. The Alternate Base Rate is defined as the greatest of (A) the rate of interest published by the Wall Street Journal, from time to time, as the prime rate, (B) the federal funds rate, plus
0.500%
and (C) the Adjusted LIBO Rate for a one-month interest period, plus
1.00%
. The Adjusted LIBO Rate is defined as the London interbank offered rate for deposits in U.S. dollars, for the relevant interest period, adjusted for statutory reserve requirements, but in no event shall the Adjusted LIBO Rate be less than
0.00%
per annum.
The Company is also obligated to pay a commitment fee on the undrawn amounts of the Revolving Credit Agreement at a rate of
0.10%
. The Revolving Credit Agreement requires the Company to comply with certain covenants, including covenants that limit or restrict the ability of the Company’s subsidiaries to incur debt and limit or restrict the ability of the Company and its subsidiaries to grant liens and enter into sale and leaseback transactions; and, in the case of the Company or a guarantor, merge, consolidate, liquidate, dissolve or sell, transfer, lease or otherwise dispose of all or substantially all of the assets of the
51
Company and its subsidiaries, taken as a whole. As of
December 31, 2017
, the Company was in compliance with all related covenants.
|
5.
|
Commitments and Contingencies
|
Streaming Content
At
December 31, 2017
, the Company had
$17.7 billion
of obligations comprised of
$4.2 billion
included in "Current content liabilities" and
$3.3 billion
of "Non-current content liabilities" on the Consolidated Balance Sheets and
$10.2 billion
of obligations that are not reflected on the Consolidated Balance Sheets as they did not yet meet the criteria for asset recognition.
At
December 31, 2016
, the Company had
$14.5 billion
of obligations comprised of
$3.6 billion
included in "Current content liabilities" and
$2.9 billion
of "Non-current content liabilities" on the Consolidated Balance Sheets and
$8.0 billion
of obligations that are not reflected on the Consolidated Balance Sheets as they did not yet meet the criteria for asset recognition.
The expected timing of payments for these streaming content obligations is as follows:
|
As of December 31,
|
|||||||
|
2017
|
2016
|
||||||
|
|
(in thousands)
|
||||||
|
Less than one year
|
$
|
7,446,947
|
|
$
|
6,200,611
|
|
|
|
Due after one year and through 3 years
|
8,210,159
|
|
6,731,336
|
|
|||
|
Due after 3 years and through 5 years
|
1,894,001
|
|
1,386,934
|
|
|||
|
Due after 5 years
|
143,535
|
|
160,606
|
|
|||
|
Total streaming content obligations
|
$
|
17,694,642
|
|
$
|
14,479,487
|
|
|
Streaming content obligations include amounts related to the acquisition, licensing and production of streaming content. Obligations that are in non-U.S. dollar currencies are translated to U.S. dollar at period end rates. An obligation for the production of content includes non-cancelable commitments under creative talent and employment agreements. An obligation for the acquisition and licensing of content is incurred at the time the Company enters into an agreement to obtain future titles. Once a title becomes available, a content liability is generally recorded on the Consolidated Balance Sheets. Certain agreements include the obligation to license rights for unknown future titles, the ultimate quantity and/or fees for which are not yet determinable as of the reporting date. Traditional film output deals, or certain TV series license agreements where the number of seasons to be aired is unknown, are examples of such license agreements. The Company does not include any estimated obligation for these future titles beyond the known minimum amount. However, the unknown obligations are expected to be significant.
Lease obligations
The Company leases facilities under non-cancelable operating leases with various expiration dates through
2027
. Several lease agreements contain rent escalation clauses or rent holidays. For purposes of recognizing minimum rental expenses on a straight-line basis over the terms of the leases, the Company uses the date of initial possession to begin amortization, which is generally when the Company enters the space and begins to make improvements in preparation for intended use. For scheduled rent escalation clauses during the lease terms or for rental payments commencing at a date other than the date of initial occupancy, the Company records minimum rental expenses on a straight-line basis over the terms of the leases in the Consolidated Statements of Operations. The Company has the option to extend or renew most of its leases which may increase the future minimum lease commitments.
Because the terms of the Company’s facilities lease agreements for its original Los Gatos, California headquarters site required the Company’s involvement in the construction funding of the buildings, the Company is the “deemed owner” (for accounting purposes only) of these buildings. Accordingly, the Company recorded an asset of
$40.7 million
, representing the total costs of the buildings and improvements, including the costs paid by the lessor (the legal owner of the buildings), with corresponding liabilities. Upon completion of construction of each building, the Company did not meet the sale-leaseback criteria for de-recognition of the building assets and liabilities. Therefore the leases are accounted for as financing obligations. At
December 31, 2017
, the lease financing obligation balance was
$29.5 million
, the majority of which is recorded in “Other non-current liabilities,” on the Consolidated Balance Sheets. The remaining future minimum payments under the lease financing obligation are
$15.6 million
. The lease financing obligation balance at the end of the lease term will be approximately
$21.8 million
which approximates the net book value of the buildings to be relinquished to the lessor.
52
In addition to the lease financing obligation, future minimum lease payments include
$508.3 million
as of
December 31, 2017
related to non-cancelable operating leases for the expanded headquarters in Los Gatos, California and the new office space in Los Angeles, California.
Future minimum payments under lease financing obligations and non-cancelable operating leases as of
December 31, 2017
are as follows:
|
Year Ending December 31,
|
Future
Minimum
Payments
|
||
|
|
(in thousands)
|
||
|
2018
|
$
|
101,987
|
|
|
2019
|
97,560
|
|
|
|
2020
|
96,255
|
|
|
|
2021
|
85,188
|
|
|
|
2022
|
77,418
|
|
|
|
Thereafter
|
278,970
|
|
|
|
Total minimum payments
|
$
|
737,378
|
|
Rent expense associated with the operating leases was
$75.3 million
,
$53.1 million
and
$34.7 million
for the years ended
December 31, 2017
,
2016
and
2015
, respectively.
Legal Proceedings
From time to time, in the normal course of its operations, the Company is subject to litigation matters and claims, including claims relating to employee relations, business practices and patent infringement. Litigation can be expensive and disruptive to normal business operations. Moreover, the results of complex legal proceedings are difficult to predict and the Company's view of these matters may change in the future as the litigation and events related thereto unfold. The Company expenses legal fees as incurred. The Company records a provision for contingent losses when it is both probable that a liability has been incurred and the amount of the loss can be reasonably estimated. An unfavorable outcome to any legal matter, if material, could have an adverse effect on the Company's operations or its financial position, liquidity or results of operations.
The Company is involved in litigation matters not listed herein but does not consider the matters to be material either individually or in the aggregate at this time. The Company's view of the matters not listed may change in the future as the litigation and events related thereto unfold.
|
6.
|
Guarantees—Indemnification Obligations
|
In the ordinary course of business, the Company has entered into contractual arrangements under which it has agreed to provide indemnification of varying scope and terms to business partners and other parties with respect to certain matters, including, but not limited to, losses arising out of the Company’s breach of such agreements and out of intellectual property infringement claims made by third parties. In these circumstances, payment may be conditional on the other party making a claim pursuant to the procedures specified in the particular contract.
The Company’s obligations under these agreements may be limited in terms of time or amount, and in some instances, the Company may have recourse against third parties for certain payments. In addition, the Company has entered into indemnification agreements with its directors and certain of its officers that will require it, among other things, to indemnify them against certain liabilities that may arise by reason of their status or service as directors or officers. The terms of such obligations vary.
It is not possible to make a reasonable estimate of the maximum potential amount of future payments under these or similar agreements due to the conditional nature of the Company’s obligations and the unique facts and circumstances involved in each particular agreement. No amount has been accrued in the accompanying financial statements with respect to these indemnification guarantees.
53
|
7.
|
Stockholders’ Equity
|
Stock Split
In March 2015, the Company's Board of Directors adopted an amendment to the Company's Certificate of Incorporation, to increase the number of shares of capital stock the Company is authorized to issue from
170,000,000
(
160,000,000
shares of common stock and
10,000,000
shares of preferred stock), par value
$0.001
to
5,000,000,000
(
4,990,000,000
shares of common stock and
10,000,000
shares of preferred stock), par value
$0.001
. This amendment to the Company's certificate of incorporation was approved by the Company's stockholders at the 2015 Annual Meeting held on June 9, 2015.
On June 23, 2015, the Company's Board of Directors declared a
seven
-for-one stock split in the form of a stock dividend that was paid on July 14, 2015 to all shareholders of record as of July 2, 2015. Outstanding share and per-share amounts disclosed for all periods presented have been retroactively adjusted to reflect the effects of the Stock Split.
Preferred Stock
The Company has authorized
10,000,000
shares of undesignated preferred stock with a par value of
$0.001
per share. None of the preferred shares were issued and outstanding at
December 31, 2017
and
2016
.
Voting Rights
The holders of each share of common stock shall be entitled to
one vote
per share on all matters to be voted upon by the Company’s stockholders.
Stock Option Plans
In June 2011, the Company adopted the 2011 Stock Plan. The 2011 Stock Plan provides for the grant of incentive stock options to employees and for the grant of non-statutory stock options, stock appreciation rights, restricted stock and restricted stock units to employees, directors and consultants. As of
December 31, 2017
,
10.7 million
shares were reserved for future grants under the 2011 Stock Plan.
A summary of the activities related to the Company’s stock option plans, as adjusted for the Stock Split, is as follows:
|
|
Shares Available
for Grant
|
Options Outstanding
|
Weighted- Average Remaining Contractual Term (in Years)
|
Aggregate
Intrinsic Value
(in Thousands)
|
|||||||||||
|
|
Number of
Shares
|
Weighted- Average Exercise Price
(per Share) |
|||||||||||||
|
Balances as of December 31, 2014
|
20,025,208
|
|
22,845,417
|
|
$
|
21.65
|
|
||||||||
|
Granted
|
(3,179,892
|
)
|
3,179,892
|
|
82.67
|
|
|||||||||
|
Exercised
|
—
|
|
(5,029,553
|
)
|
15.38
|
|
|||||||||
|
Balances as of December 31, 2015
|
16,845,316
|
|
20,995,756
|
|
$
|
32.39
|
|
||||||||
|
Granted
|
(3,555,363
|
)
|
3,555,363
|
|
102.03
|
|
|||||||||
|
Exercised
|
—
|
|
(2,113,772
|
)
|
17.48
|
|
|||||||||
|
Balances as of December 31, 2016
|
13,289,953
|
|
22,437,347
|
|
$
|
44.83
|
|
||||||||
|
Granted
|
(2,550,038
|
)
|
2,550,038
|
|
159.56
|
|
|||||||||
|
Exercised
|
—
|
|
(3,338,474
|
)
|
26.79
|
|
|||||||||
|
Expired
|
—
|
|
(1,561
|
)
|
3.25
|
|
|||||||||
|
Balances as of December 31, 2017
|
10,739,915
|
|
21,647,350
|
|
$
|
61.13
|
|
5.97
|
$
|
2,833,198
|
|
||||
|
Vested and exercisable at
December 31, 2017
|
21,647,350
|
|
$
|
61.13
|
|
5.97
|
$
|
2,833,198
|
|
||||||
The aggregate intrinsic value in the table above represents the total pretax intrinsic value (the difference between the Company’s closing stock price on the last trading day of
2017
and the exercise price, multiplied by the number of in-the-money options) that would have been received by the option holders had all option holders exercised their options on the last trading day of
2017
. This amount changes based on the fair market value of the Company’s common stock. Total intrinsic value of options exercised for the years ended
December 31, 2017
,
2016
and
2015
was
$464.0 million
,
$189.2 million
and
$368.4 million
, respectively.
54
Cash received from option exercises for the years ended
December 31, 2017
,
2016
and
2015
was
$88.4 million
,
$37.0 million
and
$78.0 million
, respectively.
Stock-Based Compensation
Stock options granted are exercisable for the full
ten
year contractual term regardless of employment status. The following table summarizes the assumptions used to value option grants using the lattice-binomial model and the valuation data:
|
|
Year Ended December 31,
|
|||||||||||
|
|
2017
|
2016
|
2015
|
|||||||||
|
Dividend yield
|
—
|
%
|
—
|
%
|
—
|
%
|
||||||
|
Expected volatility
|
34% - 37%
|
|
40% - 50%
|
|
36% - 53%
|
|
||||||
|
Risk-free interest rate
|
2.24% - 2.45%
|
|
1.57% - 2.04%
|
|
2.03% - 2.29%
|
|
||||||
|
Suboptimal exercise factor
|
2.48 - 2.63
|
|
2.48
|
|
2.47 - 2.48
|
|
||||||
|
Valuation data:
|
||||||||||||
|
Weighted-average fair value (per share)
|
$
|
71.45
|
|
$
|
48.85
|
|
$
|
39.22
|
|
|||
|
Total stock-based compensation expense (in thousands)
|
182,209
|
|
173,675
|
|
124,725
|
|
||||||
|
Total income tax impact on provision (in thousands)
|
61,842
|
|
65,173
|
|
47,125
|
|
||||||
The Company considers several factors in determining the suboptimal exercise factor, including the historical and estimated option exercise behavior.
The Company calculates expected volatility based solely on implied volatility. The Company believes that implied volatility of publicly traded options in its common stock is more reflective of market conditions, and given consistently high trade volumes of the options, can reasonably be expected to be a better indicator of expected volatility than historical volatility of its common stock.
In valuing shares issued under the Company’s employee stock option plans, the Company bases the risk-free interest rate on U.S. Treasury zero-coupon issues with terms similar to the contractual term of the options. The Company does not anticipate paying any cash dividends in the foreseeable future and therefore uses an expected dividend yield of
zero
in the option valuation model. The Company does not use a post-vesting termination rate as options are fully vested upon grant date.
|
8.
|
Accumulated Other Comprehensive Loss
|
The following table summarizes the changes in accumulated balances of other comprehensive loss, net of tax:
|
Foreign currency
|
Change in unrealized gains on available-for-sale securities
|
Total
|
|||||||||
|
(in thousands)
|
|||||||||||
|
Balances as of December 31, 2015
|
$
|
(42,502
|
)
|
$
|
(806
|
)
|
$
|
(43,308
|
)
|
||
|
Other comprehensive income (loss) before reclassifications
|
(5,464
|
)
|
310
|
|
(5,154
|
)
|
|||||
|
Amounts reclassified from accumulated other comprehensive (loss) income
|
—
|
|
(103
|
)
|
(103
|
)
|
|||||
|
Net (increase) decrease in other comprehensive loss
|
(5,464
|
)
|
207
|
|
(5,257
|
)
|
|||||
|
Balances as of December 31, 2016
|
$
|
(47,966
|
)
|
$
|
(599
|
)
|
$
|
(48,565
|
)
|
||
|
Other comprehensive income before reclassifications
|
27,409
|
|
728
|
|
28,137
|
|
|||||
|
Amounts reclassified from accumulated other comprehensive (loss) income
|
—
|
|
(129
|
)
|
(129
|
)
|
|||||
|
Net decrease in other comprehensive loss
|
27,409
|
|
599
|
|
28,008
|
|
|||||
|
Balances as of December 31, 2017
|
$
|
(20,557
|
)
|
$
|
—
|
|
$
|
(20,557
|
)
|
||
55
The amounts reclassified from accumulated other comprehensive loss were immaterial for the years ended December 31, 2017 and 2016.
|
9.
|
Income Taxes
|
Income before provision for income taxes was as follows:
|
|
Year Ended December 31,
|
||||||||||
|
|
2017
|
2016
|
2015
|
||||||||
|
|
(in thousands)
|
||||||||||
|
United States
|
$
|
144,100
|
|
$
|
188,078
|
|
$
|
95,644
|
|
||
|
Foreign
|
341,221
|
|
72,429
|
|
46,241
|
|
|||||
|
Income before income taxes
|
$
|
485,321
|
|
$
|
260,507
|
|
$
|
141,885
|
|
||
The components of provision for income taxes for all periods presented were as follows:
|
|
Year Ended December 31,
|
||||||||||
|
|
2017
|
2016
|
2015
|
||||||||
|
|
(in thousands)
|
||||||||||
|
Current tax provision:
|
|||||||||||
|
Federal
|
$
|
54,245
|
|
$
|
54,315
|
|
$
|
52,557
|
|
||
|
State
|
(7,601
|
)
|
5,790
|
|
(1,576
|
)
|
|||||
|
Foreign
|
88,436
|
|
60,571
|
|
26,918
|
|
|||||
|
Total current
|
135,080
|
|
120,676
|
|
77,899
|
|
|||||
|
Deferred tax provision:
|
|||||||||||
|
Federal
|
(153,963
|
)
|
(24,383
|
)
|
(37,669
|
)
|
|||||
|
State
|
(52,695
|
)
|
(14,080
|
)
|
(17,635
|
)
|
|||||
|
Foreign
|
(2,030
|
)
|
(8,384
|
)
|
(3,351
|
)
|
|||||
|
Total deferred
|
(208,688
|
)
|
(46,847
|
)
|
(58,655
|
)
|
|||||
|
Provision for income taxes
|
$
|
(73,608
|
)
|
$
|
73,829
|
|
$
|
19,244
|
|
||
At the beginning of 2017, the Company underwent a corporate restructuring that better aligns its corporate structure with how its business operates. As a result of this restructuring and the Company's increasing international income, there is now significantly more income being taxed at rates lower than the U.S. tax rate.
On December 22, 2017, the Tax Cuts and Jobs Act of 2017 (the “Act”) was signed into law making significant changes to the Internal Revenue Code. Changes include, but are not limited to, a corporate tax rate decrease from
35%
to
21%
effective for tax years beginning after December 31, 2017, the transition of U.S international taxation from a worldwide tax system to a territorial system, and a one-time transition tax on the mandatory deemed repatriation of cumulative foreign earnings as of December 31, 2017. The Company has calculated its best estimate of the impact of the Act in its year end income tax provision in accordance with its understanding of the Act and guidance available as of the date of this filing and as a result has recorded
$79.1 million
as an additional income tax expense in the fourth quarter of 2017, the period in which the legislation was enacted. The provisional amount related to the remeasurement of certain deferred tax assets and liabilities based on the rates at which they are expected to reverse in the future was
$46.9 million
. The provisional amount related to the one-time transition tax on the mandatory deemed repatriation of foreign earnings was
$32.2 million
based on cumulative foreign earnings of
$484.9 million
.
On December 22, 2017, Staff Accounting Bulletin No. 118 ("SAB 118") was issued to address the application of US GAAP in situations when a registrant does not have the necessary information available, prepared, or analyzed (including computations) in reasonable detail to complete the accounting for certain income tax effects of the Act. In accordance with SAB 118, the Company has determined that the
$46.9 million
of the deferred tax expense recorded in connection with the remeasurement of certain deferred tax assets and liabilities and the
$32.2 million
of current tax expense recorded in connection with the transition tax on the mandatory deemed repatriation of foreign earnings was a provisional amount and a reasonable estimate at December 31, 2017. Additional work is necessary to do a more detailed analysis of historical foreign earnings as
56
well as potential correlative adjustments. Any subsequent adjustment to these amounts will be recorded to current tax expense in the quarter of 2018 when the analysis is complete.
The Company recorded a
$66.5 million
benefit related to foreign taxes expensed in prior years that may now be claimed as a Foreign Tax Credit. The Company has determined there is sufficient foreign source income projected to utilize these credits.
Due to the adoption of ASU 2016-09 in 2017, all excess tax benefits and deficiencies are recognized as income tax expense in the Company’s Consolidated Statement of Operations. This will result in increased volatility in the Company’s effective tax rate.
A reconciliation of the provision for income taxes, with the amount computed by applying the statutory Federal income tax rate to income before income taxes is as follows:
|
|
Year Ended December 31,
|
||||||||||
|
|
2017
|
2016
|
2015
|
||||||||
|
|
(in thousands)
|
||||||||||
|
Expected tax expense at U.S. Federal statutory rate of 35%
|
$
|
169,860
|
|
$
|
91,179
|
|
$
|
49,658
|
|
||
|
State income taxes, net of Federal income tax effect
|
6,404
|
|
7,261
|
|
4,783
|
|
|||||
|
Foreign earnings at other than U.S. rates
|
(87,514
|
)
|
14,639
|
|
5,310
|
|
|||||
|
Federal and California R&D tax credits
|
(79,868
|
)
|
(41,144
|
)
|
(29,363
|
)
|
|||||
|
Excess tax benefits on stock-based compensation
|
(157,888
|
)
|
—
|
|
—
|
|
|||||
|
Tax Cuts and Jobs Act of 2017
|
79,077
|
|
—
|
|
—
|
|
|||||
|
Release of tax reserves on previously unrecognized tax benefits
|
—
|
|
—
|
|
(13,438
|
)
|
|||||
|
Other
|
(3,679
|
)
|
1,894
|
|
2,294
|
|
|||||
|
Provision for income taxes
|
$
|
(73,608
|
)
|
$
|
73,829
|
|
$
|
19,244
|
|
||
|
Effective Tax Rate
|
(15
|
)%
|
28
|
%
|
14
|
%
|
|||||
The components of deferred tax assets and liabilities were as follows:
|
|
As of December 31,
|
||||||
|
|
2017
|
2016
|
|||||
|
|
(in thousands)
|
||||||
|
Deferred tax assets:
|
|||||||
|
Stock-based compensation
|
$
|
149,367
|
|
$
|
188,458
|
|
|
|
Accruals and reserves
|
34,170
|
|
29,231
|
|
|||
|
Depreciation and amortization
|
(70,382
|
)
|
(93,760
|
)
|
|||
|
Federal and California tax R&D credits
|
260,686
|
|
107,283
|
|
|||
|
Federal foreign tax credits
|
102,242
|
|
—
|
|
|||
|
Other
|
51,614
|
|
(2,363
|
)
|
|||
|
Gross deferred tax assets
|
527,697
|
|
228,849
|
|
|||
|
Valuation allowance
|
(49,431
|
)
|
(1,601
|
)
|
|||
|
Net deferred tax assets
|
$
|
478,266
|
|
$
|
227,248
|
|
|
All deferred tax assets are classified as “Other non-current assets” on the Consolidated Balance Sheets as of
December 31, 2017
and
December 31, 2016
. In evaluating its ability to realize the net deferred tax assets, the Company considered all available positive and negative evidence, including its past operating results and the forecast of future market growth, forecasted earnings, future taxable income, and prudent and feasible tax planning strategies. As of December 31, 2017, the valuation allowance of
$49.4 million
related to certain foreign tax credits that are not likely to be realized. The Company remeasured these non-current assets and liabilities at the applicable tax rate of
21%
in accordance with the Tax Cuts and Jobs Act of 2017. The remeasurement resulted in a total decrease in these assets of
$46.9 million
.
57
As of
December 31, 2017
, the Company's Federal R&D tax credit and state tax credit carryforwards for tax return purposes were
$133.4 million
, and
$119.2 million
, respectively. The Federal R&D tax credit carryforwards expire through
2037
. State tax credit carryforwards can be carried forward indefinitely.
As of December 31, 2017, the Company's Federal foreign tax credit carryforwards for tax return purposes were
$102.2 million
. The Federal foreign tax credit carryovers expire through 2026.
As of
December 31, 2017
, the Company’s net operating loss carryforwards for state tax return purposes was
$80.9 million
which expire in
2035
. As a result of the adoption of ASU 2016-09 in fiscal 2017, the Company recorded a cumulative effect adjustment to increase retained earnings by
$43.6 million
with a corresponding increase to deferred tax assets from stock-based compensation which had not been previously recognized.
The unrecognized tax benefits that are not expected to result in payment or receipt of cash within one year are classified as “Other non-current liabilities” and a reduction of deferred tax assets which is classified as "Other non-current assets" in the Consolidated Balance Sheets. As of
December 31, 2017
, the total amount of gross unrecognized tax benefits was
$42.9 million
, of which
$37.9 million
, if recognized, would favorably impact the Company’s effective tax rate. As of
December 31, 2016
, the total amount of gross unrecognized tax benefits was
$19.7 million
, of which
$17.0 million
, if recognized, would favorably impact the Company’s effective tax rate. The aggregate changes in the Company’s total gross amount of unrecognized tax benefits are summarized as follows (in thousands):
|
Balances as of December 31, 2015
|
$
|
17,117
|
|
|
Increases related to tax positions taken during prior periods
|
1,047
|
|
|
|
Decreases related to tax positions taken during prior periods
|
(7,105
|
)
|
|
|
Increases related to tax positions taken during the current period
|
8,713
|
|
|
|
Decreases related to settlements with taxing authorities
|
(33
|
)
|
|
|
Balances as of December 31, 2016
|
19,739
|
|
|
|
Increases related to tax positions taken during prior periods
|
—
|
|
|
|
Decreases related to tax positions taken during prior periods
|
(3,226
|
)
|
|
|
Increases related to tax positions taken during the current period
|
26,389
|
|
|
|
Decreases related to expiration of statute of limitations
|
—
|
|
|
|
Balances as of December 31, 2017
|
$
|
42,902
|
|
The Company includes interest and penalties related to unrecognized tax benefits within the provision for income taxes and in “Other non-current liabilities” in the Consolidated Balance Sheets. Interest and penalties included in the Company's provision for income taxes were not material in all the periods presented.
The Company files U.S. Federal, state and foreign tax returns. The Company is currently under examination by the IRS and the state of California for the years 2014 and 2015. The 2016 Federal tax return remains subject to examination by the IRS. The years 2010 through 2013 and 2016 remain subject to examination by the state of California. The Company has no significant foreign jurisdiction audits underway. The years 2012 through 2016 remain subject to examination by foreign jurisdictions.
Given the potential outcome of the current examinations as well as the impact of the current examinations on the potential expiration of the statute of limitations, it is reasonably possible that the balance of unrecognized tax benefits could significantly change within the next twelve months. However, an estimate of the range of reasonably possible adjustments cannot be made.
|
10.
|
Employee Benefit Plan
|
The Company maintains a 401(k) savings plan covering substantially all of its employees. Eligible employees may contribute up to
60%
of their annual salary through payroll deductions, but not more than the statutory limits set by the Internal Revenue Service. The Company matches employee contributions at the discretion of the Board. During
2017
,
2016
and
2015
, the Company’s matching contributions totaled
$20.2 million
,
$15.7 million
and
$11.2 million
, respectively.
|
11.
|
Segment Information
|
The Company has
three
reportable segments: Domestic streaming, International streaming and Domestic DVD. Segment information is presented in the same manner that the Company’s chief operating decision maker (“CODM”) reviews the operating results in assessing performance and allocating resources. The Company’s CODM reviews revenue and contribution
58
profit (loss) for each of the reportable segments. Contribution profit (loss) is defined as revenues less cost of revenues and marketing expenses incurred by the segment. The Company has aggregated the results of the International operating segments into one reportable segment because these operating segments share similar long-term economic and other qualitative characteristics.
The Domestic streaming segment derives revenues from monthly membership fees for services consisting solely of streaming content to the members in the United States. The International streaming segment derives revenues from monthly membership fees for services consisting solely of streaming content to members outside of the United States. The Domestic DVD segment derives revenues from monthly membership fees for services consisting solely of DVD-by-mail. Revenues and the related payment card fees are attributed to the operating segment based on the nature of the underlying membership (streaming or DVD) and the geographic region from which the membership originates. There are no internal revenue transactions between the Company’s segments.
Amortization of streaming content assets makes up the vast majority of cost of revenues. The Company obtains multi-territory or global rights for its streaming content and allocates these rights between Domestic and International streaming segments based on estimated fair market value. Amortization of content assets and other expenses associated with the acquisition, licensing, and production of streaming content for each streaming segment thus includes both expenses directly incurred by the segment as well as an allocation of expenses incurred for global or multi-territory rights. Other costs of revenues such as delivery costs are primarily attributed to the operating segment based on amounts directly incurred by the segment. Marketing expenses consist primarily of advertising expenses and certain payments made to marketing partners, including CE manufacturers, MVPDs, mobile operators and ISPs, which are generally included in the segment in which the expenditures are directly incurred.
The Company's long-lived tangible assets were located as follows:
|
As of December 31,
|
|||||||
|
2017
|
2016
|
||||||
|
(in thousands)
|
|||||||
|
United States
|
$
|
289,875
|
|
$
|
236,977
|
|
|
|
International
|
29,529
|
|
13,418
|
|
|||
The following tables represent segment information for the year ended
December 31, 2017
:
|
|
As of/Year ended December 31, 2017
|
||||||||||||||
|
|
Domestic
Streaming
|
International
Streaming
|
Domestic
DVD
|
Consolidated
|
|||||||||||
|
|
(in thousands)
|
||||||||||||||
|
Total memberships at end of period (1)
|
54,750
|
|
62,832
|
|
3,383
|
|
|
|
|||||||
|
Revenues
|
$
|
6,153,025
|
|
$
|
5,089,191
|
|
$
|
450,497
|
|
$
|
11,692,713
|
|
|||
|
Cost of revenues
|
3,319,230
|
|
4,137,911
|
|
202,525
|
|
7,659,666
|
|
|||||||
|
Marketing
|
553,331
|
|
724,691
|
|
—
|
|
1,278,022
|
|
|||||||
|
Contribution profit
|
$
|
2,280,464
|
|
$
|
226,589
|
|
$
|
247,972
|
|
2,755,025
|
|
||||
|
Other operating expenses
|
1,916,346
|
|
|||||||||||||
|
Operating income
|
838,679
|
|
|||||||||||||
|
Other income (expense)
|
(353,358
|
)
|
|||||||||||||
|
Benefit from income taxes
|
(73,608
|
)
|
|||||||||||||
|
Net income
|
$
|
558,929
|
|
||||||||||||
|
|
Year ended December 31, 2017
|
||||||||||||||
|
|
Domestic
Streaming
|
International
Streaming
|
Domestic
DVD
|
Consolidated
|
|||||||||||
|
|
(in thousands)
|
||||||||||||||
|
Amortization of content assets
|
$
|
2,756,947
|
|
$
|
3,440,870
|
|
$
|
60,657
|
|
$
|
6,258,474
|
|
|||
59
The following tables represent segment information for the year ended
December 31, 2016
:
|
|
As of/Year ended December 31, 2016
|
||||||||||||||
|
|
Domestic
Streaming
|
International
Streaming
|
Domestic
DVD
|
Consolidated
|
|||||||||||
|
|
(in thousands)
|
||||||||||||||
|
Total memberships at end of period (1)
|
49,431
|
|
44,365
|
|
4,114
|
|
—
|
|
|||||||
|
Revenues
|
$
|
5,077,307
|
|
$
|
3,211,095
|
|
$
|
542,267
|
|
$
|
8,830,669
|
|
|||
|
Cost of revenues
|
2,855,789
|
|
2,911,370
|
|
262,742
|
|
6,029,901
|
|
|||||||
|
Marketing
|
382,832
|
|
608,246
|
|
—
|
|
991,078
|
|
|||||||
|
Contribution profit (loss)
|
$
|
1,838,686
|
|
$
|
(308,521
|
)
|
$
|
279,525
|
|
1,809,690
|
|
||||
|
Other operating expenses
|
1,429,897
|
|
|||||||||||||
|
Operating income
|
379,793
|
|
|||||||||||||
|
Other income (expense)
|
(119,286
|
)
|
|||||||||||||
|
Provision for income taxes
|
73,829
|
|
|||||||||||||
|
Net income
|
$
|
186,678
|
|
||||||||||||
|
|
Year ended December 31, 2016
|
||||||||||||||
|
|
Domestic
Streaming
|
International
Streaming
|
Domestic
DVD
|
Consolidated
|
|||||||||||
|
|
(in thousands)
|
||||||||||||||
|
Amortization of content assets
|
$
|
2,337,950
|
|
$
|
2,450,548
|
|
$
|
78,952
|
|
$
|
4,867,450
|
|
|||
The following tables represent segment information for the year ended
December 31, 2015
:
|
|
As of/Year ended December 31, 2015
|
||||||||||||||
|
|
Domestic
Streaming
|
International
Streaming
|
Domestic
DVD
|
Consolidated
|
|||||||||||
|
|
(in thousands)
|
||||||||||||||
|
Total memberships at end of period (1)
|
44,738
|
|
30,024
|
|
4,904
|
|
—
|
|
|||||||
|
Revenues
|
$
|
4,180,339
|
|
$
|
1,953,435
|
|
$
|
645,737
|
|
$
|
6,779,511
|
|
|||
|
Cost of revenues
|
2,487,193
|
|
1,780,375
|
|
323,908
|
|
4,591,476
|
|
|||||||
|
Marketing
|
317,646
|
|
506,446
|
|
—
|
|
824,092
|
|
|||||||
|
Contribution profit (loss)
|
$
|
1,375,500
|
|
$
|
(333,386
|
)
|
$
|
321,829
|
|
1,363,943
|
|
||||
|
Other operating expenses
|
1,058,117
|
|
|||||||||||||
|
Operating income
|
305,826
|
|
|||||||||||||
|
Other income (expense)
|
(163,941
|
)
|
|||||||||||||
|
Provision for income taxes
|
19,244
|
|
|||||||||||||
|
Net income
|
$
|
122,641
|
|
||||||||||||
|
|
Year ended December 31, 2015
|
||||||||||||||
|
|
Domestic
Streaming
|
International
Streaming
|
Domestic
DVD
|
Consolidated
|
|||||||||||
|
|
(in thousands)
|
||||||||||||||
|
Amortization of content assets
|
$
|
1,905,069
|
|
$
|
1,500,313
|
|
$
|
79,380
|
|
$
|
3,484,762
|
|
|||
60
|
(1)
|
A membership (also referred to as a subscription) is defined as the right to receive Netflix service following sign-up and a method of payment being provided. Memberships are assigned to territories based on the geographic location used at time of sign-up as determined by the Company's internal systems, which utilize industry standard geo-location technology. The Company offers free-trial memberships to certain new and rejoining members. Total members include those who are on a free-trial as long as a method of payment has been provided. A membership is canceled and ceases to be reflected in the above metrics as of the effective cancellation date. Voluntary cancellations become effective at the end of the prepaid membership period, while involuntary cancellation of the service, as a result of a failed method of payment, becomes effective immediately.
|
|
12.
|
Selected Quarterly Financial Data (Unaudited)
|
|
December 31
|
September 30
|
June 30
|
March 31
|
||||||||||||
|
|
(in thousands, except for per share data)
|
||||||||||||||
|
2017
|
|||||||||||||||
|
Total revenues
|
$
|
3,285,755
|
|
$
|
2,984,859
|
|
$
|
2,785,464
|
|
$
|
2,636,635
|
|
|||
|
Gross profit
|
1,178,401
|
|
991,879
|
|
883,156
|
|
979,611
|
|
|||||||
|
Net income
|
185,517
|
|
129,590
|
|
65,600
|
|
178,222
|
|
|||||||
|
Earnings per share:
|
|||||||||||||||
|
Basic
|
$
|
0.43
|
|
$
|
0.30
|
|
$
|
0.15
|
|
$
|
0.41
|
|
|||
|
Diluted
|
0.41
|
|
0.29
|
|
0.15
|
|
0.40
|
|
|||||||
|
2016
|
|||||||||||||||
|
Total revenues
|
$
|
2,477,541
|
|
$
|
2,290,188
|
|
$
|
2,105,204
|
|
$
|
1,957,736
|
|
|||
|
Gross profit
|
823,122
|
|
757,344
|
|
632,106
|
|
588,196
|
|
|||||||
|
Net income
|
66,748
|
|
51,517
|
|
40,755
|
|
27,658
|
|
|||||||
|
Earnings per share:
|
|||||||||||||||
|
Basic
|
$
|
0.16
|
|
$
|
0.12
|
|
$
|
0.10
|
|
$
|
0.06
|
|
|||
|
Diluted
|
0.15
|
|
0.12
|
|
0.09
|
|
0.06
|
|
|||||||
61
EXHIBIT INDEX
|
Exhibit
Number
|
Exhibit Description
|
Incorporated by Reference
|
Filed
Herewith
|
|||||||||
|
Form
|
File No.
|
Exhibit
|
Filing Date
|
|||||||||
|
10-Q
|
001-35727
|
3.1
|
July 17, 2015
|
|||||||||
|
8-K
|
000-49802
|
3.1
|
March 20, 2009
|
|||||||||
|
10-Q
|
000-49802
|
3.3
|
August 2, 2004
|
|||||||||
|
S-1/A
|
333-83878
|
4.1
|
April 16, 2002
|
|||||||||
|
8-K
|
001-35727
|
4.1
|
February 1, 2013
|
|||||||||
|
8-K
|
001-35727
|
4.1
|
February 19, 2014
|
|||||||||
|
8-K
|
001-35727
|
4.1
|
February 5, 2015
|
|||||||||
|
8-K
|
001-35727
|
4.2
|
February 5, 2015
|
|||||||||
|
8-K
|
001-35727
|
4.1
|
October 27, 2016
|
|||||||||
|
10-Q
|
001-35727
|
4.7
|
April 20, 2017
|
|||||||||
|
8-K
|
001-35727
|
4.1
|
May 3, 2017
|
|||||||||
|
8-K
|
001-35727
|
4.1
|
October 26, 2017
|
|||||||||
|
S-1/A
|
333-83878
|
10.1
|
March 20, 2002
|
|||||||||
|
Def 14A
|
000-49802
|
A
|
March 31, 2006
|
|||||||||
|
Def 14A
|
000-49802
|
A
|
April 20, 2011
|
|||||||||
|
8-K
|
001-35727
|
Item 5.02
|
January 24, 2018
|
|||||||||
|
10-K
|
000-49802
|
10.7
|
February 1, 2013
|
|||||||||
|
8-K
|
001-35727
|
10.1
|
February 19, 2014
|
|||||||||
|
Def 14A
|
001-35727
|
A
|
April 28, 2014
|
|||||||||
|
8-K
|
001-35727
|
10.1
|
February 5, 2015
|
|||||||||
62
|
Exhibit
Number
|
Exhibit Description
|
Incorporated by Reference
|
Filed
Herewith
|
|||||||||
|
Form
|
File No.
|
Exhibit
|
Filing Date
|
|||||||||
|
8-K
|
001-35727
|
10.2
|
February 5, 2015
|
|||||||||
|
8-K
|
001-35727
|
10.1
|
October 27, 2016
|
|||||||||
|
8-K
|
001-35727
|
10.2
|
October 27, 2016
|
|||||||||
|
8-K
|
001-35727
|
10.1
|
April 27, 2017
|
|||||||||
|
8-K
|
001-35727
|
10.1
|
May 3, 2017
|
|||||||||
|
10-Q
|
001-35727
|
10.14
|
July 19, 2017
|
|||||||||
|
10-Q
|
001-35727
|
10.15
|
October 18, 2017
|
|||||||||
|
8-K
|
001-35727
|
10.1
|
October 26, 2017
|
|||||||||
|
X
|
||||||||||||
|
X
|
||||||||||||
|
24
|
Power of Attorney (see signature page)
|
|||||||||||
|
X
|
||||||||||||
|
X
|
||||||||||||
|
X
|
||||||||||||
63
|
Exhibit
Number
|
Exhibit Description
|
Incorporated by Reference
|
Filed
Herewith
|
|||||||||
|
Form
|
File No.
|
Exhibit
|
Filing Date
|
|||||||||
|
101
|
The following financial information from Netflix, Inc.’s Annual Report on Form 10-K for the year ended December 31, 2017 filed with the SEC on January 29, 2018, formatted in XBRL includes: (i) Consolidated Statements of Operations for the Years Ended December 31, 2017, 2016 and 2015, (ii) Consolidated Statements of Comprehensive Income for the Years Ended December 31, 2017, 2016 and 2015, (iii) Consolidated Statements of Cash Flows for the Years Ended December 31, 2017, 2016 and 2015, (iv) Consolidated Balance Sheets as of December 31, 2017 and 2016, (v) Consolidated Statements of Stockholders' Equity for the Years Ended December 31, 2017, 2016 and 2015 and (vi) the Notes to Consolidated Financial Statements.
|
X
|
||||||||||
* These certifications are not deemed filed by the SEC and are not to be incorporated by reference in any filing we make under the Securities Act of 1933 or the Securities Exchange Act of 1934, irrespective of any general incorporation language in any filings.
† Indicates a management contract or compensatory plan
64
SIGNATURES
Pursuant to the requirements of Section 13 or 15(d) of the Securities Exchange Act of 1934, the registrant has duly caused this report to be signed on its behalf by the undersigned, thereunto duly authorized.
|
|
Netflix, Inc.
|
||||
|
Dated:
|
January 29, 2018
|
|
By:
|
|
/
S
/ R
EED
H
ASTINGS
|
|
|
|
Reed Hastings
Chief Executive Officer
(principal executive officer)
|
|||
|
Dated:
|
January 29, 2018
|
|
By:
|
|
/
S
/ D
AVID
W
ELLS
|
|
|
|
David Wells
Chief Financial Officer
(principal financial and accounting officer)
|
|||
65
POWER OF ATTORNEY
KNOWN ALL PERSONS BY THESE PRESENTS, that each person whose signature appears below constitutes and appoints Reed Hastings and David Wells, and each of them, as his true and lawful attorneys-in-fact and agents, with full power of substitution and resubstitution, for him and in his name, place, and stead, in any and all capacities, to sign any and all amendments to this Report, and to file the same, with all exhibits thereto, and other documents in connection therewith, with the Securities and Exchange Commission, granting unto said attorneys-in-fact and agents, and each of them, full power and authority to do and perform each and every act and thing requisite and necessary to be done in connection therewith, as fully to all intents and purposes as he might or could do in person, hereby ratifying and confirming that all said attorneys-in-fact and agents, or any of them or their or his substitute or substituted, may lawfully do or cause to be done by virtue thereof.
Pursuant to the requirements of the Securities and Exchange Act of 1934, this Annual Report on Form 10-K has been signed below by the following persons on behalf of the registrant and in the capacities and on the dates indicated.
|
Signature
|
Title
|
Date
|
||
|
/
S
/ R
EED
H
ASTINGS
|
President, Chief Executive Officer and Director (principal executive officer)
|
January 29, 2018
|
||
|
Reed Hastings
|
||||
|
/
S
/ D
AVID
W
ELLS
|
Chief Financial Officer (principal financial and accounting officer)
|
January 29, 2018
|
||
|
David Wells
|
||||
|
/
S
/ R
ICHARD
B
ARTON
|
Director
|
January 29, 2018
|
||
|
Richard Barton
|
||||
|
/
S
/ T
IMOTHY
M. H
ALEY
|
Director
|
January 29, 2018
|
||
|
Timothy M. Haley
|
||||
|
/
S
/ J
AY
C. H
OAG
|
Director
|
January 29, 2018
|
||
|
Jay C. Hoag
|
||||
|
/
S
/ A
NN
M
ATHER
|
Director
|
January 29, 2018
|
||
|
Ann Mather
|
||||
|
/
S
/ A. G
EORGE
B
ATTLE
|
Director
|
January 29, 2018
|
||
|
A. George Battle
|
||||
|
/
S
/ L
ESLIE
J. K
ILGORE
|
Director
|
January 29, 2018
|
||
|
Leslie J. Kilgore
|
||||
|
/
S
/ B
RAD
S
MITH
|
Director
|
January 29, 2018
|
||
|
Brad Smith
|
||||
|
/S/
A
NNE
S
WEENEY
|
Director
|
January 29, 2018
|
||
|
Anne Sweeney
|
||||
|
/S/
R
ODOLPHE
B
ELMER
|
Director
|
January 29, 2018
|
||
|
Rodolphe Belmer
|
||||
66
TABLE OF CONTENTS
Part IItem 1. BusinessItem 1A. Risk FactorsItem 7, "management's Discussion and Analysis Of Financial Condition and Results Of Operations" and Note 5,Item 1B. Unresolved Staff CommentsItem 2. PropertiesItem 3. Legal ProceedingsItem 4. Mine Safety DisclosuresPart IIItem 5. Market For Registrant S Common Equity, Related Stockholder Matters and Issuer Purchases Of Equity SecuritiesItem 6. Selected Financial DataItem 7. Management S Discussion and Analysis Of Financial Condition and Results Of OperationsItem 7A. Quantitative and Qualitative Disclosures About Market RiskItem 8. Financial Statements and Supplementary DataItem 9. Changes in and Disagreements with Accountants on Accounting and Financial DisclosureItem 9A. Controls and ProceduresItem 9B. Other InformationPart IIIItem 10. Directors, Executive Officers and Corporate GovernanceItem 11. Executive CompensationItem 12. Security Ownership Of Certain Beneficial Owners and Management and Related Stockholder MattersItem 13. Certain Relationships and Related Transactions, and Director IndependenceItem 14. Principal Accounting Fees and ServicesPart IVItem 15. Exhibits, Financial Statement SchedulesItem 16. Form 10-k Summary