NOVAGOLD RESOURCES INC
10-Ks and 10-Qs
|
|
|
|
|
|
|
|
|
|
|
|
|
|
|
|
|
|
|
|
|
|
|
|
|
|
|
|
|
|
|
|
|
|
|
|
|
|
|
|
|
|
|
|
|
|
|
UNITED STATES
SECURITIES AND EXCHANGE COMMISSION
Washington, D.C. 20549
Form 10-K
For the Fiscal Year Ended November 30, 2013
OR
For the Transition Period from to
Commission File Number:
001-31913
NOVAGOLD RESOURCES INC.
(Exact Name of Registrant as Specified in Its Charter)
|
British Columbia
|
N/A
|
||
|
(State or Other Jurisdiction of
Incorporation or Organization)
|
(I.R.S. Employer
Identification No.)
|
||
|
789 West Pender Street, Suite 720
Vancouver, British Columbia, Canada
|
V6C 1H2
|
||
|
(Address of Principal Executive Offices)
|
(Zip Code)
|
||
|
(604) 669-6227
(Registrant’s Telephone Number, Including Area Code)
|
|||
|
Securities registered pursuant to Section 12(b) of the Act:
|
|||
|
Title of Each Class
|
Name of Each Exchange on Which Registered
|
||
|
Common Shares, no par value
|
NYSE MKT
|
||
|
Securities registered pursuant to Section 12(g) of the Act:
None
|
|||
Indicate by check mark if the registrant is a well-known seasoned issuer, as defined in Rule 405 of the Securities Act. Yes
o
No
x
Indicate by check mark if the registrant is not required to file reports pursuant to Section 13 or Section 15(d) of the Act. Yes
o
No
x
Indicate by check mark whether the registrant (1) has filed all reports required to be filed by Section 13 or 15(d) of the Securities Exchange Act of 1934 during the preceding 12 months (or for such shorter period that the registrant was required to file such reports), and (2) has been subject to such filing requirements for the past 90 days. Yes
x
No
o
Indicate by check mark whether the registrant has submitted electronically and posted on its corporate Web site, if any, every Interactive Data File required to be submitted and posted pursuant to Rule 405 of Regulation S-T during the preceding 12 months (or for such shorter period that the registrant was required to submit and post such files). Yes
x
No
o
Indicate by check mark if disclosure of delinquent filers pursuant to Item 405 of Regulation S-K is not contained herein, and will not be contained, to the best of registrant’s knowledge, in definitive proxy or information statements incorporated by reference in Part III of this Form 10-K or any amendment to this Form 10-K.
o
Indicate by check mark whether the registrant is a large accelerated filer, an accelerated filer, a non-accelerated filer, or a smaller reporting company. See the definitions of “large accelerated filer,” “accelerated filer” and “smaller reporting company” in Rule 12b-2 of the Exchange Act. (Check one):
|
(Do not check if a smaller
reporting company)
|
|||
Based on the last sale price on the NYSE-MKT of the registrant's Common Shares on May 31, 2013 (the last business day of the registrant's most recently completed second fiscal quarter) of $2.52 per share, the aggregate market value of the voting Common Shares held by non-affiliates was approximately $494,525,075.
Indicate by check mark whether the registrant is a shell company (as defined in Rule 12b-2 of the Exchange Act). Yes
o
No
x
As of February 6, 2014, the registrant had 317,297,868 Common Shares, no par value, outstanding.
DOCUMENTS INCORPORATED BY REFERENCE
Certain portions of the registrant’s definitive proxy statement to be filed with the Securities and Exchange Commission pursuant to Regulation 14A not later than March 30, 2014, in connection with the registrant’s 2014 annual meeting of stockholders, are incorporated herein by reference into Part III of this Annual Report on Form 10-K.
NOVAGOLD RESOURCES INC.
TABLE OF CONTENTS
Page
|
PART I
|
13
|
|
| Item 1. Business |
13
|
|
| Item 1A. Risk Factors |
18
|
|
| Item 1B. Unresolved Staff Comments |
31
|
|
| Item 2. Properties |
32
|
|
| Item 3. Legal Proceedings |
56
|
|
| Item 4. Mine Safety Disclosures |
56
|
|
|
PART II
|
57
|
|
| Item 5. Market for Registrant’s Common Equity, Related Stockholder Matters and Issuer Purchases of Equity Securities |
57
|
|
| Item 6. Selected Financial Data |
59
|
|
| Item 7. Management’s Discussion and Analysis of Financial Condition and Results of Operations |
60
|
|
| Item 7A. Quantitative and Qualitative Disclosures about Market Risk |
67
|
|
| Item 8. Financial Statements and Supplementary Data |
68
|
|
| Item 9. Changes in and Disagreements with Accountants on Accounting and Financial Disclosure |
94
|
|
| Item 9A. Controls and Procedures |
94
|
|
| Item 9B. Other Information |
94
|
|
|
PART III
|
95
|
|
| Item 10. Directors, Executive Officers and Corporate Governance |
95
|
|
| Item 11. Executive Compensation |
95
|
|
| Item 12. Security Ownership of Certain Beneficial Owners and Management and Related Stockholder Matters |
95
|
|
| Item 13. Certain Relationships and Related Transactions, and Director Independence |
95
|
|
| Item 14. Principal Accountant Fees and Services |
96
|
|
|
PART IV
|
97
|
|
| Item 15. Exhibits and Financial Statement Schedules |
97
|
|
Unless the context otherwise requires, the words “we,” “us,” “our,” the “Company” and “NOVAGOLD” refer to NOVAGOLD RESOURCES INC., a British Columbia corporation, and its subsidiaries as of November 30, 2013.
CHANGE OF REPORTING STATUS
Effective December 1, 2013, we ceased to be a “foreign private issuer” as defined in Rule 3b-4 of the Securities Exchange Act of 1934, as amended (the “Exchange Act”), and became subject to the rules and regulations under the Exchange Act applicable to U.S. domestic issuers. As a result, we are filing an Annual Report on Form 10-K beginning with the fiscal year ended November 30, 2013. Our prior years’ annual reports were filed on Form 40-F.
CURRENCY
References in this report to $ refer to United States currency and C$ to Canadian currency.
CAUTIONARY NOTE TO U.S. INVESTORS REGARDING ESTIMATES OF MEASURED, INDICATED AND INFERRED RESOURCES AND PROVEN AND PROBABLE RESERVES
We are a mineral exploration company engaged in the exploration and development of mineral properties. As used in this Annual Report on Form 10-K, the terms “mineral reserve”, “proven mineral reserve” and “probable mineral reserve” are Canadian mining terms as defined in accordance with Canadian National Instrument 43-101—Standards of Disclosure for Mineral Projects (“NI 43-101”) and the Canadian Institute of Mining, Metallurgy and Petroleum (CIM)—CIM Definition Standards on Mineral Resources and Mineral Reserves, adopted by the CIM Council, as amended. These definitions differ from the definitions in the United States Securities and Exchange Commission (SEC) Industry Guide 7 (“SEC Industry Guide 7”) under the United States Securities Act of 1933, as amended (the “Securities Act”). Under SEC Industry Guide 7 standards, a “final” or “bankable” feasibility study is required to report reserves, the three-year historical average price is used in any reserve or cash flow analysis to designate reserves, and the primary environmental analysis or report must be filed with the appropriate governmental authority. The terms “mineral resource”, “measured mineral resource”, “indicated mineral resource” and “inferred mineral resource” are defined in, and required to be disclosed by, NI 43-101; however, these terms are not defined terms under SEC Industry Guide 7 and are normally not permitted to be used in reports and registration statements filed with the SEC. Investors are cautioned not to assume that all or any part of a mineral deposit in these categories will ever be converted into reserves.
“Inferred mineral resources” have a great amount of uncertainty as to their existence, and great uncertainty as to their economic and legal feasibility. It cannot be assumed that all, or any part, of an inferred mineral resource will ever be upgraded to a higher category. Under Canadian rules, estimates of inferred mineral resources may not form the basis of feasibility or pre-feasibility studies, except in rare cases. Investors are cautioned not to assume that all or any part of an inferred mineral resource exists or is economically or legally mineable.
Disclosure of “contained ounces” in a resource is permitted disclosure under Canadian regulations; however, the SEC normally only permits issuers to report mineralization that does not constitute “reserves” by SEC standards as in place tonnage and grade without reference to unit measures. Accordingly, information contained in this report and the documents incorporated by reference herein contain descriptions of our mineral deposits that may not be comparable to similar information made public by U.S. companies subject to the reporting and disclosure requirements under the United States federal securities laws and the rules and regulations thereunder.
The term “mineralized material” as used in this Annual Report on Form 10-K, although permissible under SEC Industry Guide 7, does not indicate “reserves” by SEC Industry Guide 7 standards. We cannot be certain that any part of the mineralized material will ever be confirmed or converted into SEC Industry Guide 7 compliant “reserves”. Investors are cautioned not to assume that all or any part of the mineralized material will ever be confirmed or converted into reserves or that mineralized material can be economically or legally extracted.
FORWARD-LOOKING STATEMENTS
This Annual Report on Form 10-K contains forward-looking statements or information within the meaning of Canadian securities laws and the United States Private Securities Litigation Reform Act of 1995 concerning anticipated results and developments in our operations in future periods, planned exploration activities, the adequacy of our financial resources and other events or conditions that may occur in the future. These forward-looking statements may include statements regarding perceived merit of properties, exploration results and budgets, mineral reserves and resource estimates, work programs, capital expenditures, operating costs, cash flow estimates, production estimates and similar statements relating to the economic viability of a project, timelines, strategic plans, including our plans and expectations relating to the Donlin Gold and Galore Creek projects, completion of transactions, market prices for precious and base metals, or other statements that are not statements of fact. These statements relate to analyses and other information that are based on forecasts of future results, estimates of amounts not yet determinable and assumptions of management. Statements concerning mineral resource estimates may also be deemed to constitute “forward-looking statements” to the extent that they involve estimates of the mineralization that will be encountered if the property is developed.
4
Any statements that express or involve discussions with respect to predictions, expectations, beliefs, plans, projections, objectives, assumptions or future events or performance (often, but not always, identified by words or phrases such as “expects”, “is expected”, “anticipates”, “believes”, “plans”, “projects”, “estimates”, “assumes”, “intends”, “strategy”, “goals”, “objectives”, “potential”, “possible” or variations thereof or stating that certain actions, events, conditions or results “may”, “could”, “would”, “should”, “might” or “will” be taken, occur or be achieved, or the negative of any of these terms and similar expressions) are not statements of historical fact and may be forward-looking statements.
Forward-looking statements are based on a number of material assumptions, including those listed below, which could prove to be significantly incorrect:
|
·
|
our ability to achieve production at any of our mineral exploration and development properties;
|
|
·
|
estimated capital costs, operating costs, production and economic returns;
|
|
·
|
estimated metal pricing, metallurgy, mineability, marketability and operating and capital costs, together with other assumptions underlying our resource and reserve estimates;
|
|
·
|
our expected ability to develop adequate infrastructure and that the cost of doing so will be reasonable;
|
|
·
|
assumptions that all necessary permits and governmental approvals will be obtained;
|
|
·
|
assumptions made in the interpretation of drill results, the geology, grade and continuity of our mineral deposits;
|
|
·
|
our expectations regarding demand for equipment, skilled labor and services needed for exploration and development of mineral properties; and
|
|
·
|
our activities will not be adversely disrupted or impeded by development, operating or regulatory risks.
|
Forward-looking statements are subject to a variety of known and unknown risks, uncertainties and other factors that could cause actual events or results to differ from those reflected in the forward-looking statements, including, without limitation:
|
·
|
uncertainty of whether there will ever be production at our mineral exploration and development properties;
|
|
·
|
uncertainty of estimates of capital costs, operating costs, production and economic returns;
|
|
·
|
uncertainties relating to the assumptions underlying our resource and reserve estimates, such as metal pricing, metallurgy, mineability, marketability and operating and capital costs;
|
|
·
|
risks related to our ability to commence production and generate material revenues or obtain adequate financing for our planned exploration and development activities;
|
|
·
|
risks related to our ability to finance the development of our mineral properties through external financing, strategic alliances, the sale of property interests or otherwise;
|
|
·
|
risks related to the third parties on which we depend for our exploration and development activities;
|
|
·
|
dependence on cooperation of joint venture partners in exploration and development of properties;
|
|
·
|
credit, liquidity, interest rate and currency risks;
|
|
·
|
risks related to market events and general economic conditions;
|
|
·
|
uncertainty related to inferred mineral resources;
|
|
·
|
risks and uncertainties relating to the interpretation of drill results, the geology, grade and continuity of our mineral deposits;
|
|
·
|
risks related to lack of infrastructure required to develop, construct, and operate our mineral properties;
|
|
·
|
mining and development risks, including risks related to infrastructure, accidents, equipment breakdowns, labor disputes or other unanticipated difficulties with, or interruptions in, development, construction or production;
|
|
·
|
the risk that permits and governmental approvals necessary to develop and operate mines on our properties will not be available on a timely basis, subject to reasonable conditions, or at all;
|
|
·
|
commodity price fluctuations;
|
|
·
|
risks related to governmental regulation and permits, including environmental regulation;
|
|
·
|
risks related to the need for reclamation activities on our properties and uncertainty of cost estimates related thereto;
|
|
·
|
uncertainty related to title to our mineral properties;
|
|
·
|
uncertainty related to unsettled aboriginal rights and title in British Columbia;
|
|
·
|
our history of losses and expectation of future losses;
|
|
·
|
uncertainty as to the outcome of potential litigation;
|
|
·
|
uncertainty inherent in litigation including the effects of discovery of new evidence or advancement of new legal theories, the difficulty of predicting decisions of judges and juries and the possibility that decisions may be reversed on appeal;
|
|
·
|
risks related to default under our unsecured convertible notes;
|
5
|
·
|
risks related to our majority shareholder;
|
|
·
|
risks related to increases in demand for equipment, skilled labor and services needed for exploration and development of mineral properties, and related cost increases;
|
|
·
|
increased competition in the mining industry;
|
|
·
|
our need to attract and retain qualified management and technical personnel;
|
|
·
|
risks related to our current practice of not using hedging arrangements;
|
|
·
|
uncertainty as to our ability to acquire additional commercially mineable mineral rights;
|
|
·
|
risks related to the integration of potential new acquisitions into our existing operations;
|
|
·
|
risks related to unknown liabilities in connection with acquisitions;
|
|
·
|
risks related to conflicts of interests of some of the directors of the Company;
|
|
·
|
risks related to global climate change;
|
|
·
|
risks related to opposition to our operations at our mineral exploration and development properties from non-governmental organizations or civil society;
|
|
·
|
uncertainty as to our ability to maintain the adequacy of internal control over financial reporting as per the requirements of the Sarbanes-Oxley Act; and
|
|
·
|
increased regulatory compliance costs relating to the Dodd-Frank Act.
|
This list is not exhaustive of the factors that may affect any of our forward-looking statements. Forward-looking statements are statements about the future and are inherently uncertain, and our actual achievements or other future events or conditions may differ materially from those reflected in the forward-looking statements due to a variety of risks, uncertainties and other factors, including, without limitation, those referred to in this Annual Report on Form 10-K under the heading “Risk Factors” and elsewhere.
Our forward-looking statements contained in this Annual Report on Form 10-K are based on the beliefs, expectations and opinions of management as of the date of this report. We do not assume any obligation to update forward-looking statements if circumstances or management’s beliefs, expectations or opinions should change, except as required by law. For the reasons set forth above, investors should not place undue reliance on forward-looking statements.
GLOSSARY OF TECHNICAL TERMS
The following technical terms defined in this section are used throughout this Annual Report on Form 10-K.
|
alluvial
|
A placer formed by the action of running water, as in a stream channel or alluvial fan; also said of the valuable mineral (e.g. gold or diamond) associated with an alluvial placer.
|
|
arsenopyrite
|
The common arsenic mineral and principal ore of arsenic; occurs in many sulfide ore deposits, particularly those containing lead, silver and gold.
|
|
alteration
|
Refers to the process of hydrothermal fluids (hot water) changing primary rock minerals (such as quartz, feldspar and hornblende) to secondary minerals (quartz, carbonate and clay minerals).
|
|
assay
|
A metallurgical analysis used to determine the quantity (or grade) of various metals in a sample.
|
|
bornite
|
A copper iron sulfide mineral (Cu5FeS4).
|
|
breccia
|
A rock in which angular fragments are surrounded by a mass of fine-grained minerals.
|
|
chalcopyrite
|
A copper iron sulfide mineral (CuFeS2).
|
|
concentrate
|
A clean product recovered in flotation, which has been upgraded sufficiently for downstream processing or sale.
|
|
cutoff grade
|
When determining economically viable mineral reserves, the lowest grade of mineralized material that can be mined and processed at a profit.
|
|
cyanidation
|
A metallurgical technique, using a dilute cyanide solution, for extracting gold from ore by dissolving the gold into solution.
|
|
dike
|
A tabular igneous intrusion that cuts across the bedding of the host rock.
|
6
|
doré
|
A semi-pure alloy of gold and silver.
|
|
electrowinning
|
The deposition of gold from solution to cathodes by passing electric current from anodes through gold-bearing solution.
|
|
extrusive
|
Said of igneous rock that has been erupted onto the surface of the Earth.
|
|
geotechnical
|
Said of tasks or analysis that provide representative data of the geological rock quality in a known volume.
|
|
flotation
|
A process used for the concentration of minerals, especially within base metal systems.
|
|
geohazard
|
A geologic state that may lead to widespread damage or risk, such as a landslide, debris flow, avalanche, etc.
|
|
grade
|
Quantity of metal or mineral per unit weight of host rock.
|
|
greywacke
|
A variety of sandstone generally characterized by its hardness, dark color, and poorly sorted angular grains of quartz, feldspar, and small rock fragments set in a compact, clay-fine matrix.
|
|
host rock
|
A body of rock serving as a host for other rocks or for mineral deposits.
|
|
hydrothermal
|
Pertaining to hot aqueous solutions of magmatic origin which may transport metals and minerals in solution.
|
|
intrusive
|
Said of igneous rock formed by the consolidation of magma intruded into other rocks.
|
|
lithology
|
The character of a rock described in terms of its structure, color, mineral composition, grain size, and arrangement of its component parts.
|
|
mafic
|
Igneous rocks composed mostly of dark, iron- and magnesium-rich minerals.
|
|
massive
|
Said of a mineral deposit, especially of sulfides, characterized by a great concentration of mineralization in one place, as opposed to a disseminated or veinlike deposit.
|
|
mineral
|
A naturally formed chemical element or compound having a definite chemical composition and, usually, a characteristic crystal form.
|
|
mineral deposit
|
A mineralized body which has been physically delineated by sufficient drilling, trenching, and/or underground work, and found to contain a sufficient average grade of metal or metals to warrant further exploration and/or development expenditures.
|
|
mineralization
|
A natural occurrence in rocks or soil of one or more yielding minerals or metals.
|
|
net present value
(NPV)
|
The sum of the value on a given date of a series of future cash payments and receipts, discounted to reflect the time value of money and other factors such as investment risk.
|
|
ore
|
Rock containing metallic or non-metallic materials that can be mined and processed at a profit.
|
|
placer
|
An alluvial deposit of sand and gravel, which may contain valuable metals.
|
|
porphyry
|
An igneous rock of any composition that contains conspicuous phenocrysts (large crystals or mineral grains) in a fine-grained groundmass.
|
|
pyrite
|
An iron sulfide mineral (FeS2), the most common naturally occurring sulfide mineral.
|
|
pyrrhotite
|
An unusual, generally weakly magnetic, iron sulfide mineral with varying iron content (Fe1-x S (x=0 to 0.2)).
|
7
|
RC (reverse circulation)
|
A type of drilling using dual-walled drill pipe in which the material drilled, water and mud are circulated up the center pipe while air is blown down the outside pipe.
|
|
realgar
|
An arsenic sulfide mineral (As4 S4).
|
|
reclamation
|
Restoration of mined land to original contour, use, or condition.
|
|
rhyodacite
|
A volcanic, high-silica rock composed of mostly quartz and feldspar.
|
|
sedimentary
|
Said of rock formed at the Earth’s surface from solid particles, whether mineral or organic, which have been moved from their position of origin and re-deposited, or chemically precipitated.
|
|
shale
|
A fine-grained detrital (transported by wind, water, or ice) sedimentary rock, formed by the consolidation of clay, silt, or mud.
|
|
sill
|
An intrusive sheet of igneous rock of roughly uniform thickness that has been forced between the bedding planes of existing rock.
|
|
stockwork
|
A three-dimensional network of closely spaced planar to irregular veinlets.
|
|
stibnite
|
An antimony sulfide mineral (Sb
2
S
3
).
|
|
strike
|
The direction, or bearing from true north, of a vein or rock formation measured on a horizontal surface.
|
|
sulfide
|
A compound of sulfur and some other metallic element.
|
|
syngenetic
|
Relating to or denoting a mineral deposit or formation produced at the same time as the host rock.
|
|
tailings
|
Uneconomic material produced by a mineral processing plant which is disposed of in a manner meeting government regulation and which may involve a permanent impoundment facility or which may involve the discharge of material to the environment in a manner regulated by the government authority.
|
|
vein
|
A thin, sheet-like crosscutting body of hydrothermal mineralization, principally quartz.
|
|
waste rock
|
Barren or submarginal rock that has been mined but is not of sufficient value to warrant treatment and is therefore removed ahead of the milling processes.
|
Canadian NI 43-101 Definitions:
Canadian standards of disclosure for mineral projects.
|
Mineral Reserve
|
The economically mineable part of a Measured or Indicated Mineral Resource demonstrated by at least a Preliminary Feasibility Study. This Study must include adequate information on mining, processing, metallurgical, economic and other relevant factors that demonstrate, at the time of reporting, that economic extraction can be justified. A Mineral Reserve includes diluting materials and allowances for losses that may occur when the material is mined.
|
|
Mineral reserves are those parts of mineral resources which, after the application of all mining factors, result in an estimated tonnage and grade which, in the opinion of the Qualified Person(s) (as defined in NI 43-101) making the estimates, is the basis of an economically viable project after taking account of all relevant processing, metallurgical, economic, marketing, legal, environment, socio-economic and governmental factors. Mineral reserves are inclusive of diluting material that will be mined in conjunction with the mineral reserves and delivered to the treatment plant or equivalent facility. The term “mineral reserve” need not necessarily signify that extraction facilities are in place or operative or that all governmental approvals have been received. It does signify that there are reasonable expectations of such approvals.
|
8
|
Mineral reserves are subdivided in order of increasing confidence into probable mineral reserves and proven mineral reserves. A probable mineral reserve has a lower level of confidence than a proven mineral reserve.
|
|
|
Proven Mineral Reserve
|
The economically mineable part of a Measured Mineral Resource demonstrated by at least a Preliminary Feasibility Study. This Study must include adequate information on mining, processing, metallurgical, economic, and other relevant factors that demonstrate, at the time of reporting, that economic extraction is justified.
|
|
Application of the Proven Mineral Reserve category implies that the Qualified Person has the highest degree of confidence in the estimate with the consequent expectation in the minds of the readers of the report. The term should be restricted to that part of the deposit where production planning is taking place and for which any variation in the estimate would not significantly affect potential economic viability.
|
|
|
Probable Mineral Reserve
|
The economically mineable part of an Indicated and, in some circumstances, a Measured Mineral Resource demonstrated by at least a Preliminary Feasibility Study. This Study must include adequate information on mining, processing, metallurgical, economic, and other relevant factors that demonstrate, at the time of reporting, that economic extraction can be justified.
|
|
Mineral Resource
|
A concentration or occurrence of diamonds, natural solid inorganic material, or natural solid fossilized organic material including base and precious metals, coal, and industrial minerals in or on the Earth’s crust in such form and quantity and of such a grade or quality that it has reasonable prospects for economic extraction. The location, quantity, grade, geological characteristics and continuity of a Mineral Resource are known, estimated or interpreted from specific geological evidence and knowledge.
|
|
The term Mineral Resource covers mineralization and natural material of intrinsic economic interest which has been identified and estimated through exploration and sampling and within which Mineral Reserves may subsequently be defined by the consideration and application of technical, economic, legal, environmental, socio-economic and governmental factors. The phrase ‘reasonable prospects for economic extraction’ implies a judgment by the Qualified Person in respect of the technical and economic factors likely to influence the prospect of economic extraction. A Mineral Resource is an inventory of mineralization that under realistically assumed and justifiable technical and economic conditions might become economically extractable. These assumptions must be presented explicitly in both public and technical reports.
|
|
|
Mineral Resources are sub-divided, in order of increasing geological confidence, into Inferred, Indicated and Measured categories. An Inferred Mineral Resource has a lower level of confidence than that applied to an Indicated Mineral Resource. An Indicated Mineral Resource has a higher level of confidence than an Inferred Mineral Resource but has a lower level of confidence than a Measured Mineral Resource.
|
|
|
Measured Mineral Resource
|
That part of a Mineral Resource for which quantity, grade or quality, densities, shape, and physical characteristics are so well established that they can be estimated with confidence sufficient to allow the appropriate application of technical and economic parameters, to support production planning and evaluation of the economic viability of the deposit. The estimate is based on detailed and reliable exploration, sampling and testing information gathered through appropriate techniques from locations such as outcrops, trenches, pits, workings and drill holes that are spaced closely enough to confirm both geological and grade continuity.
|
|
Mineralization or other natural material of economic interest may be classified as a Measured Mineral Resource by the Qualified Person when the nature, quality, quantity and distribution of data are such that the tonnage and grade of the mineralization can be estimated to within close limits and that variation from the estimate would not significantly affect potential economic viability. This category requires a high level of confidence in, and understanding of, the geology and controls of the mineral deposit.
|
|
|
Indicated Mineral Resource
|
That part of a Mineral Resource for which quantity, grade or quality, densities, shape and physical characteristics, can be estimated with a level of confidence sufficient to allow the appropriate application of technical and economic parameters, to support mine planning and evaluation of the economic viability of the deposit. The estimate is based on detailed and reliable exploration and testing information gathered through appropriate techniques from locations such as outcrops, trenches, pits, workings and drill holes that are spaced closely enough for geological and grade continuity to be reasonably assumed.
|
9
|
Mineralization may be classified as an Indicated Mineral Resource by the Qualified Person when the nature, quality, quantity and distribution of data are such as to allow confident interpretation of the geological framework and to reasonably assume the continuity of mineralization. The Qualified Person must recognize the importance of the Indicated Mineral Resource category to the advancement of the feasibility of the project. An Indicated Mineral Resource estimate is of sufficient quality to support a Preliminary Feasibility Study which can serve as the basis for major development decisions.
|
|
|
Inferred Mineral Resource
|
That part of a Mineral Resource for which quantity and grade or quality can be estimated on the basis of geological evidence and limited sampling and reasonably assumed, but not verified, geological and grade continuity. The estimate is based on limited information and sampling gathered through appropriate techniques from locations such as outcrops, trenches, pits, workings and drill holes.
|
|
Due to the uncertainty that may be attached to Inferred Mineral Resources, it cannot be assumed that all or any part of an Inferred Mineral Resource will be upgraded to an Indicated or Measured Mineral Resource as a result of continued exploration. Confidence in the estimate is insufficient to allow the meaningful application of technical and economic parameters or to enable an evaluation of economic viability worthy of public disclosure. Inferred Mineral Resources must be excluded from estimates forming the basis of feasibility or other economic studies.
|
|
|
Advanced Property
|
A property that has mineral reserves or mineral resources, the potential economic viability of which is supported by a preliminary economic assessment, a pre-feasibility study, or a feasibility study.
|
|
Early Stage
Exploration Property
|
A property for which the technical report being filed has no current mineral resources or mineral reserves defined and no drilling or trenching proposed.
|
|
Mineral Project
|
Any exploration, development or production activity, including a royalty or similar interest in these activities, in respect of diamonds, natural solid inorganic material, or natural solid fossilized organic material including base and precious metals, coal, and industrial minerals.
|
|
Qualified Person
|
An individual who is an engineer or geoscientist with at least five years of experience in mineral exploration, mine development or operation or mineral project assessment, or any combination of these; has experience relevant to the subject matter of the mineral project and the technical report; and is a member or licensee in good standing of a professional association.
|
|
The Qualified Person(s) should be clearly satisfied that they could face their peers and demonstrate competence and relevant experience in the commodity, type of deposit and situation under consideration. If doubt exists, the person must either seek or obtain opinions from other colleagues or demonstrate that he or she has obtained assistance from experts in areas where he or she lacked the necessary expertise.
|
|
|
Determination of what constitutes relevant experience can be a difficult area and common sense has to be exercised. For example, in estimating Mineral Resources for vein gold mineralization, experience in a high-nugget, vein-type mineralization such as tin, uranium etc. should be relevant whereas experience in massive base metal deposits may not be. As a second example, for a person to qualify as a Qualified Person in the estimation of Mineral Reserves for alluvial gold deposits, he or she would need to have relevant experience in the evaluation and extraction of such deposits. Experience with placer deposits containing minerals other than gold, may not necessarily provide appropriate relevant experience for gold.
|
|
| In addition to experience in the style of mineralization, a Qualified Person preparing or taking responsibility for Mineral Resource estimates must have sufficient experience in the sampling, assaying, or other property testing techniques that are relevant to the deposit under consideration in order to be aware of problems that could affect the reliability of the data. Some appreciation of extraction and processing techniques applicable to that deposit type might also be important. | |
|
Estimation of Mineral Resources is often a team effort, for example, involving one person or team collecting the data and another person or team preparing the Mineral Resource estimate. Within this team, geologists usually occupy the pivotal role. Estimation of Mineral Reserves is almost always a team effort involving a number of technical disciplines, and within this team mining engineers have an important role. Documentation for a Mineral Resource and Mineral Reserve estimate must be compiled by, or under the supervision of, a Qualified Person(s), whether a geologist, mining engineer or member of another discipline. It is recommended that, where there is a clear division of responsibilities within a team, each Qualified Person should accept responsibility for his or her particular contribution. For example, one Qualified Person could accept responsibility for the collection of Mineral Resource data, another for the Mineral Reserve estimation process, another for the mining study, and the project leader could accept responsibility for the overall document. It is important that the Qualified Person accepting overall responsibility for a Mineral Resource and/or Mineral Reserve estimate and supporting documentation, which has been prepared in whole or in part by others, is satisfied that the other contributors are Qualified Persons with respect to the work for which they are taking responsibility and that such persons are provided adequate documentation.
|
10
|
Professional Association
|
A self-regulatory organization of engineers, geoscientists, or both engineers and geoscientists that is given authority or recognition by statute in a jurisdiction of Canada or a foreign (non-Canadian) association that is generally accepted within the international mining community as a reputable professional association; admits individuals on the basis of their academic qualifications, experience, and ethical fitness; requires compliance with the professional standards of competence and ethics established by the organization; requires or encourages continuing professional development; and has and applies disciplinary powers, including the power to suspend or expel a member regardless of where the member practices or resides.
|
|
Feasibility Study
|
A comprehensive technical and economic study of the selected development option for a mineral project that includes appropriately detailed assessments of realistically assumed mining, processing, metallurgical, economic, marketing, legal, environmental, social and governmental considerations together with any other relevant operational factors and detailed financial analysis, that are necessary to demonstrate at the time of reporting that extraction is reasonably justified (economically mineable). The results of the study may reasonably serve as the basis for a final decision by a proponent or financial institution to proceed with, or finance, the development of the project. The confidence level of the study will be higher than that of a Pre-Feasibility Study.
|
|
Pre-Feasibility Study
|
A comprehensive study of a range of options for the technical and economic viability of a mineral project that has advanced to a stage where a preferred mining method, in the case of underground mining, or the pit configuration, in the case of an open pit, is established and an effective method of mineral processing is determined. It includes a financial analysis based on reasonable assumptions on mining, processing, metallurgical, economic, marketing, legal, environmental, social and governmental considerations and the evaluation of any other relevant factors which are sufficient for a Qualified Person, acting reasonably, to determine if all or part of the Mineral Resource may be classified as a Mineral Reserve.
|
|
Preliminary
Economic Assessment
|
A study, other than a pre-feasibility or feasibility study, that includes an economic analysis of the potential viability of mineral resources. |
|
Exploration Information
|
Geological, geophysical, geochemical, sampling, drilling, trenching, analytical testing, assaying, mineralogical, metallurgical and other similar information concerning a particular property that is derived from activities undertaken to locate, investigate, define or delineate a mineral prospect or mineral deposit.
|
|
It is recognized that in the review and compilation of data on a project or property, previous or historical estimates of tonnage and grade, not meeting the minimum requirement for classification as Mineral Resource, may be encountered. If a Qualified Person reports Exploration Information in the form of tonnage and grade, it must be clearly stated that these estimates are conceptual or order of magnitude and that they do not meet the criteria of a Mineral Resource
.
|
SEC Industry Guide 7 Definitions:
U.S. reporting guidelines that applies to registrants engaged or to be engaged in significant mining operations.
|
Exploration stage
|
Prospect is one which is not in either the development or production stage.
|
11
|
Development stage
|
Project is one which is undergoing preparation of an established commercially mineable deposit for its extraction but which is not yet in production. This stage occurs after completion of a feasibility study.
|
|
Production stage
|
Project is actively engaged in the process of extraction and beneficiation of mineral reserves to produce a marketable metal or mineral product.
|
|
Mineralized material
|
Refers to material that is not included in the reserve as it does not meet all of the criteria for adequate demonstration for economic or legal extraction.
|
|
Probable reserve
|
Refers to reserves for which quantity and grade and/or quality are computed from information similar to that used for proven (measured) reserves, but the sites for inspection, sampling, and measurement are farther apart or are otherwise less adequately spaced. The degree of assurance, although lower than that for proven reserves, is high enough to assume continuity between points of observation.
|
|
Proven reserve
|
Refers to reserves for which (a) quantity is computed from dimensions revealed in outcrops, trenches, workings or drill holes; grade and/or quality are computed from the results of detailed sampling and (b) the sites for inspection, sampling and measurement are spaced so closely and the geologic character is so well defined that size, shape, depth and mineral content of reserves are well-established.
|
|
Reserve
|
Refers to that part of a mineral deposit which could be economically and legally extracted or produced at the time of the reserve determination. Reserves must be supported by a feasibility study done to bankable standards that demonstrates the economic extraction. (“Bankable standards” implies that the confidence attached to the costs and achievements developed in the study is sufficient for the project to be eligible for external debt financing.) A reserve includes adjustments to the in-situ tonnes and grade to include diluting materials and allowances for losses that might occur when the material is mined.
|
Overview
We operate in the gold mining industry, primarily focused on advancing permitting on the Donlin Gold project in Alaska. The Donlin Gold project is held by Donlin Gold LLC (“Donlin Gold”), a limited liability company owned equally by wholly-owned subsidiaries of NOVAGOLD and Barrick Gold Corporation (“Barrick”). We are also committed to maximizing the value of our interest in the Galore Creek copper-gold-silver project in British Columbia, Canada. The Galore Creek project is held by a partnership owned equally by wholly-owned subsidiaries of NOVAGOLD and Teck Resources Limited (“Teck”). We are currently exploring opportunities to sell, in whole or in part, our interest in the Galore Creek project.
We do not produce gold or any other minerals, and do not currently generate operating earnings. Through 2013, funding to explore our gold properties and to operate the Company was acquired primarily through equity financings consisting of public offerings of our common shares and warrants and through debt financing consisting of convertible notes. We expect to continue to raise capital through additional equity and/or debt financings, through the exercise of stock options, and otherwise.
We were incorporated by memorandum of association on December 5, 1984, under the Companies Act (Nova Scotia) as 1562756 Nova Scotia Limited. On January 14, 1985, we changed our name to NovaCan Mining Resources (l985) Limited and on March 20, 1987, we changed our name to NOVAGOLD RESOURCES INC. On May 29, 2013, our shareholders approved the continuance of the corporation into British Columbia. Subsequently, we filed the necessary documents in Nova Scotia and British Columbia and effective as of June 10, 2013 we continued under the Business Corporations Act (British Columbia). The current addresses, telephone and facsimile numbers of our offices are:
|
Executive office
|
Registered and records office
|
|
201 South Main Street, Suite 400
|
789 West Pender Street, Suite 720
|
|
Salt Lake City, Utah, USA 84111
|
Vancouver, BC, V6C 1H2
|
|
Telephone (801) 639-0511
|
Facsimile (604) 669-6272
|
|
Facsimile (801) 649-0509
|
Toll free 1(866) 669-6227
|
13
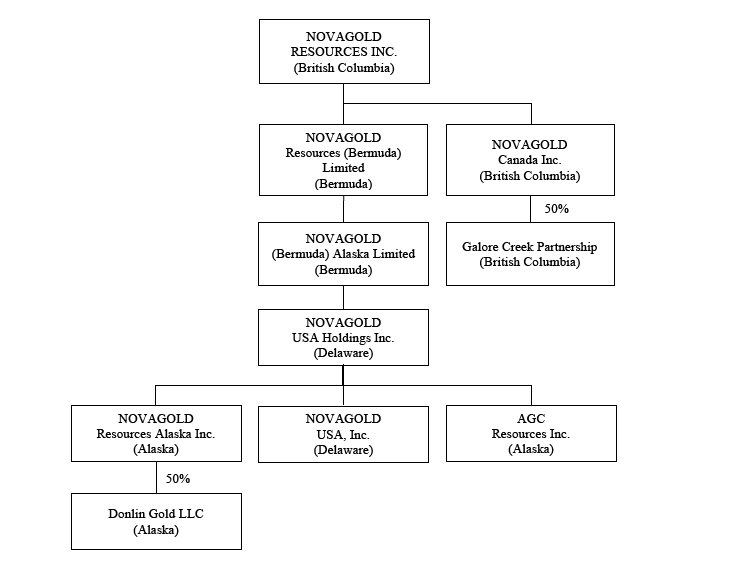
Corporate Structure
As of November 30, 2013, we had the following material, direct and indirect, wholly-owned subsidiaries: NOVAGOLD Resources Alaska, Inc., NOVAGOLD USA Holdings Inc., NOVAGOLD USA, Inc., NOVAGOLD (Bermuda) Alaska Limited, NOVAGOLD Resources (Bermuda) Limited and NOVAGOLD Canada Inc.
The following chart depicts the corporate structure of the Company together with the jurisdiction of incorporation of each of our material subsidiaries and related holding companies. All ownership is 100% unless otherwise indicated.
14
Employees
As of November 30, 2013, we had 14 full-time employees. We also use consultants with specific skills to assist with various aspects of project evaluation, engineering and corporate governance.
Segment and Geographical Information
We operate in a single reportable operating segment, being the exploration and development of mineral properties. Our long-lived assets are geographically distributed as shown in the following table. We did not have revenue from continuing operations in any of the periods shown below.
Long-lived assets
|
At November 30,
|
||||||||||||
|
($ thousands)
|
2013
|
2012
|
2011
|
|||||||||
|
Canada
|
$ | 367,712 | $ | 407,037 | $ | 410,923 | ||||||
|
United States
|
4,435 | 7,451 | 34,794 | |||||||||
|
Other
|
— | 513 | 500 | |||||||||
| $ | 372,147 | $ | 415,001 | $ | 446,217 | |||||||
Recent Developments
Donlin Gold Project
During the year ended November 30, 2013, Donlin Gold continued to advance permitting of the Donlin Gold project. The Donlin Gold Board of Directors approved Donlin Gold project’s Second Updated Feasibility Study (“Donlin Gold FS”) in August 2012 and Donlin Gold subsequently submitted a Plan of Operations and Wetlands Permit Application under Section 404 of the U.S. Clean Water Act to the U.S. Army Corps of Engineers (the “Corps”), formally initiating the permitting process. This permit application triggered the process of preparing an Environmental Impact Statement (EIS) under the National Environmental Policy Act (NEPA). The Corps, which is the lead agency for the NEPA process, selected URS Alaska Inc. (URS), an independent contractor to prepare the EIS.
On December 14, 2012, the Notice of Intent for the EIS was published in the Federal Register by the Corps, which initiated the public scoping process. In the first quarter of 2013, public scoping meetings were held in villages and communities in Western Alaska and Anchorage to help identify the questions and concerns of the villages and communities in the region which will be addressed in the EIS. On March 29, 2013, the public scoping period ended and in May 2013, URS issued a draft scoping summary document for review by the Corps and other entities participating as cooperating agencies in the EIS process (the “Cooperating Agencies”). During the second quarter of 2013, Donlin Gold delivered to the Corps a comprehensive Environmental Evaluation Document (EED) that provides detailed information on the baseline studies and analyses that have been completed for the proposed project. The EED also describes the detailed project options that Donlin Gold considered in the development of the proposed project design. The EED is being used by URS and the Cooperating Agencies to support ongoing alternatives development for the EIS. In March 2013, URS issued a preliminary review of the available baseline data identifying additional environmental, social, and cultural resource data that must be compiled for the EIS. During the remainder of 2013, Donlin Gold worked to address the remaining data needs for the EIS. Throughout 2013, Donlin Gold also continued to provide application materials and maintained ongoing dialogue with the agencies that will issue the key permits and authorizations needed for the Donlin Gold project, including the air quality, water discharge, dam safety, wetlands, water use, fish habitat, and pipeline permits. Donlin Gold completed all required field work as planned.
The Corps and URS are working towards planned issuance of the Preliminary Draft Environmental Impact Statement (PDEIS) for Cooperating Agency review in late 2014 issuance of the draft EIS for public comment in 2015, and issuance of the final EIS and associated record of decision in 2016. A schedule of the Corps’ time table for the EIS process at the Donlin Gold project can be found on their website at
www.donlingoldeis.com
.
An extensive list of additional federal and state government permits and approvals must be obtained before the Donlin Gold project can commence construction. Preparation of the applications for many of these permits and approvals requires additional, more detailed engineering that were not part of the Donlin Gold FS. Completion of this engineering will require a significant investment of funds, time, and other resources by Donlin Gold and its contractors. Also, the Donlin Gold board must approve a construction program and budget before construction of the Donlin Gold project can begin. The timing of the required engineering work, of the Donlin Gold board’s approval of a construction program and budget, as well as the receipt of all required governmental permits and approvals will determine whether and when construction of the Donlin Gold project will begin. Project delays also could occur as a result of public opposition, limitations in regulatory staff resources during regulatory review, or project changes made by Donlin Gold.
15
Our share of funding for Donlin Gold in 2013 was $12.2 million for permitting, community engagement and development efforts. Donlin Gold has approved a 2014 work program of approximately $24 million, of which our 50% share is approximately $12 million. The 2014 work program and budget includes funds to advance the permitting process through completion of the PDEIS in late 2014, and receipt of comments from the Federal and State agencies on the PDEIS in preparation for issuance of the draft EIS in 2015. In addition, Donlin Gold will continue to maintain its engagement with communities in the Yukon-Kuskokwim region.
For further information, see section Item 2, Properties – Donlin Gold Project, below.
Galore Creek Project
On February 25, 2013, we announced the results of a 27,873-meter resource in-fill and geotechnical drilling program conducted during 2012 at Galore Creek. The 2012 in-fill drilling campaign confirmed previously reported drill results and demonstrated the potential for a substantial extension of the mineralized area beyond the limits of the current Pre-Feasibility Study (PFS) pit. Additionally, Galore Creek Mining Corporation (GCMC) made a new discovery called the Legacy zone, a 700-meter long mineralized zone, as defined by the 2012 drill program, located adjacent to the Central Pit.
An 11,600 meter drilling program was completed by GCMC in the third quarter of 2013 to further define the extent of the Legacy zone mineralization. The 2013 in-fill drill program confirmed significant mineralization at the Legacy zone and provided sufficient data to proceed with additional technical studies in support of mine planning. Our share of funding for Galore Creek in 2013 was $6.6 million, which primarily funded exploration drilling, administrative expenses, environmental monitoring, and site care and maintenance costs. GCMC has approved a 2014 work program and budget of approximately $5 million, of which our 50% share is approximately $2.5 million. The 2014 work program and budget includes funds to advance the project toward next-level mine planning and design based on the data generated by the 2012 and 2013 drilling programs.
Based on the results of the 2014 work program, NOVAGOLD and Teck will evaluate the opportunities to further advance development of the Galore Creek project, including the potential timeline for completing a full feasibility study for the project. In the meantime, we will continue to evaluate opportunities to monetize the value of the asset.
For further information, see Item 2, Properties – Galore Creek Project, below.
Other Developments
On December 31, 2012, Electrum Strategic Resources L.P. (“Electrum”) exercised its remaining 31,337,278 common share purchase warrants at C$1.479 per share for proceeds of C$46.4 million. As a result of the exercise of these warrants, Electrum and GRAT Holdings LLC, an Electrum affiliate, now hold 84,569,479 common shares, representing approximately 27.2% of our outstanding common shares. In January 2013, all remaining 5,192,308 common share purchase warrants outstanding were exercised at $1.50 per share for proceeds of $7.8 million.
On May 2, 2013, we purchased $72.8 million of the principal amount of our $95.0 million outstanding 5.5% convertible notes due May 1, 2015 (the “Notes”) pursuant to the terms of the indenture governing the Notes, which provided holders of the Notes the opportunity to require us to purchase for cash all or a portion of their Notes on May 1, 2013. In September 2013, we accepted the offer from a number of holders of the Notes to repurchase an additional $6.4 million of the Notes. Following our purchase of the Notes, $15.8 million principal amount of the Notes remain outstanding and due on May 1, 2015. As a result of our purchases of the Notes, our interest payments for the remaining term of the Notes decreased from $7.4 million to $1.2 million. The terms and other provisions of the indenture governing the Notes remain unchanged.
For further information, see Item 7, Management’s Discussion and Analysis of Financial Condition and Results of Operations – Financial Position, Liquidity and Capital Resources, below.
Reclamation
We will generally be required to mitigate long-term environmental impacts by stabilizing, contouring, re-sloping and re-vegetating various portions of a site after mining and mineral processing operations are completed. These reclamation efforts will be conducted in accordance with detailed plans, which must be reviewed and approved by the appropriate regulatory agencies. In addition, financial assurance acceptable to the regulatory authority with jurisdiction over reclamation must be provided in an amount that the authority determines to be sufficient to allow the authority to implement the reclamation plan in the event that we fail to complete the work as provided in the plan.
16
Government and Environmental Regulations
Our exploration and development activities are subject to various national, state, provincial and local laws and regulations in the United States and Canada, which govern prospecting, development, mining, production, exports, taxes, labor standards, occupational health, waste disposal, protection of the environment, mine safety, hazardous substances and other matters. We have obtained or have pending applications for those licenses, permits or other authorizations currently required to conduct our exploration and development programs. We believe that we are in compliance in all material respects with applicable mining, health, safety and environmental statutes and regulations in the United States and Canada. There are no current orders or directions relating to us with respect to the foregoing laws and regulations. For a more detailed discussion of the various government laws and regulations applicable to our operations and potential negative effects of these laws and regulations, see Item 1A, Risk Factors, below.
Competition
We compete with other mineral resource exploration and development companies for financing, technical expertise and the acquisition of mineral properties. Many of the companies with whom we compete have greater financial and technical resources. Accordingly, these competitors may be able to spend greater amounts on the acquisition, exploration and development of mineral properties. This competition could adversely impact our ability to finance further exploration and to obtain the financing necessary for us to develop our mineral properties.
Availability of Raw Materials and Skilled Employees
Most aspects of our business require specialized skills and knowledge. Such skills and knowledge include the areas of geology, drilling, metallurgy, mine planning, logistical planning, preparation of feasibility studies, permitting, construction and operation of a mine, financing and accounting. Historically, we have found that we can locate and retain appropriate employees and consultants and we believe we will continue to be able to do so.
All of the raw materials we require to carry on our business are readily available through normal supply or business contracting channels in the United States and Canada. Historically, we have been able to secure the appropriate equipment and supplies required to conduct our contemplated programs. As a result, we do not believe that we will experience any shortages of required equipment or supplies in the foreseeable future.
Seasonality
Our business is seasonal as mineral exploration and development activities take place in southwestern Alaska and northern British Columbia. Due to the northern climate, work on the Donlin Gold and Galore Creek projects can be limited due to excessive snow cover and cold temperatures. In general, surface work often is limited to late spring through early fall, although work in some locations, which may more efficiently be accessed while frozen, occurs in the winter.
Gold Price History
The price of gold is volatile and is affected by numerous factors all of which are beyond our control, such as the sale or purchase of gold by various central banks and financial institutions, inflation, recession, fluctuation in the relative values of the U.S. dollar and foreign currencies, changes in global and regional gold demand in addition to international and national political and economic conditions.
The following table presents the high, low and average afternoon fixed prices in U.S. dollars for an ounce of gold on the London Bullion Market over the past five calendar years:
|
Year
|
High
|
Low
|
Average
|
|||||||||
|
2009
|
$ | 1,213 | $ | 810 | $ | 972 | ||||||
|
2010
|
$ | 1,421 | $ | 1,058 | $ | 1,225 | ||||||
|
2011
|
$ | 1,895 | $ | 1,319 | $ | 1,571 | ||||||
|
2012
|
$ | 1,792 | $ | 1,540 | $ | 1,669 | ||||||
|
2013
|
$ | 1,694 | $ | 1,192 | $ | 1,411 | ||||||
|
2014 (to January 31)
|
$ | 1,267 | $ | 1,221 | $ | 1,245 | ||||||
Data Source:
www.kitco.com
17
Available Information
We make available, free of charge, on or through our website, at
www.novagold.com
our Annual Report on Form 10-K, our quarterly reports on Form 10-Q and our current reports on Form 8-K and amendments to those reports filed or furnished pursuant to Section 13(a) or 15(d) of the U.S. Securities Exchange Act of 1934. Our website and the information contained therein or connected thereto are not intended to be, and are not incorporated into this Annual Report on Form 10-K.
You should carefully consider the following risk factors in addition to the other information included in this Annual Report on Form 10-K. Each of these risk factors could adversely affect our business, operating results and financial condition, as well as adversely affect the value of an investment in our common shares. The risks described below are not the only ones facing the Company. Additional risks that we are not presently aware of, or that we currently believe are immaterial, may also adversely affect our business, operating results and financial condition. We cannot assure you that we will successfully address these risks or that other unknown risks exist or may arise that may affect our business.
An investment in our securities is speculative and involves a high degree of risk due to the nature of our business and the present stage of exploration and development of our mineral properties. The following risk factors, as well as risks not currently known to us, could materially adversely affect our future business, operations and financial condition and could cause them to differ materially from the estimates described in the forward-looking statements relating to us.
Risks Related to Our Business
We have no history of commercially producing precious or base metals from our mineral exploration properties and there can be no assurance that we will successfully establish mining operations or profitably produce precious or base metals.
None of our mineral properties are in production, we have no history of commercially producing precious or base metals from our current portfolio of mineral properties, and we have no ongoing mining operations or revenue from mining operations. Mineral exploration and development involves a high degree of risk and few properties that are explored are ultimately developed into producing mines. None of our mineral properties are currently under construction. The future development of any mineral properties found to be economically feasible will require obtaining permits and financing and the construction and operation of mines, processing plants and related infrastructure. As a result, we are subject to all of the risks associated with establishing new mining operations and business enterprises, including:
|
·
|
the timing and cost, which can be considerable, of the construction of mining and processing facilities and related infrastructure;
|
|
·
|
the availability and cost of skilled labor and mining equipment;
|
|
·
|
the availability and cost of appropriate smelting and/or refining arrangements;
|
|
·
|
the need to obtain necessary environmental and other governmental approvals and permits, and the timing and conditions of those approvals and permits;
|
|
·
|
the availability and cost of funds to finance construction and development activities;
|
|
·
|
potential opposition from non-governmental organizations, environmental groups or local groups which may delay or prevent development activities; and
|
|
·
|
potential increases in construction and operating costs due to changes in the cost of labor, fuel, power, materials and supplies, services, and foreign exchange rates.
|
The costs, timing and complexities of mine construction and development are increased by the remote location of our mineral properties, with additional challenges related thereto, including access, water and power supply, and other support infrastructure. Cost estimates may increase significantly as more detailed engineering work and studies are completed on a project. New mining operations commonly experience unexpected costs, problems and delays during development, construction, and mine start-up. In addition, delays in the commencement of mineral production often occur. Accordingly, there are no assurances that our activities will result in profitable mining operations, or that we will successfully establish mining operations, or profitably produce precious or base metals at any of our mineral properties.
In addition, there is no assurance that our mineral exploration activities will result in any discoveries of new bodies of ore. If further mineralization is discovered there is also no assurance that the mineralized material would be economical for commercial production. Discovery of mineral deposits is dependent upon a number of factors and significantly influenced by the technical skill of the exploration personnel involved. The commercial viability of a mineral deposit is also dependent upon a number of factors which are beyond our control, including the attributes of the deposit, commodity prices, government policies and regulation, and environmental protection requirements.
18
We have a history of net losses and expect losses to continue for the foreseeable future.
We have a history of net losses and, although we achieved a net profit of $64.8 million for the fiscal year ended November 30, 2011, primarily as a result of our deconsolidation of the Galore Creek Partnership, we expect to incur net losses for the foreseeable future. As of November 30, 2013, our historical net losses totaled approximately $1.6 billion. None of our mineral properties have advanced to the commercial production stage and we have no history of earnings or cash flow from operations. We expect to continue to incur net losses unless and until such time as one or more of our projects enters into commercial production and generate sufficient revenues to fund continuing operations or until such time as we are able to offset our expenses against the sale of one or more of our mineral properties, if applicable. The development of our mineral properties to achieve production will require the commitment of substantial financial resources. The amount and timing of expenditures will depend on a number of factors, including the progress of ongoing exploration and development, the results of consultants’ analyses and recommendations, the rate at which operating losses are incurred, the process of obtaining required government permits and approvals, the availability and cost of financing, the participation of our partners, and the execution of any sale or joint venture agreements with strategic partners. These factors, and others, are beyond our control. There is no assurance that we will be profitable in the future.
Our ability to continue the exploration, permitting, development, and construction of the Donlin Gold and Galore Creek projects, and to continue as a going concern, will depend in part on our ability to obtain suitable financing.
We have limited financial resources. We will need external financing to develop and construct the Donlin Gold project and, if applicable, the Galore Creek project. On December 5, 2011, we announced the total capital cost estimate for the Donlin Gold project was approximately $6.7 billion including costs related to the natural gas pipeline (100% basis). Our failure to obtain sufficient financing could result in the delay or indefinite postponement of exploration, development, construction, or production at the Donlin Gold project or any or all of our other mineral properties. The cost and terms of such financing may significantly reduce the expected benefits from new developments and/or render such developments uneconomic. There can be no assurance that additional capital or other types of financing will be available when needed or that, if available, the terms of such financing will be favorable. Our failure to obtain financing could have a material adverse effect on our growth strategy and results of operations and financial condition. In addition, we may have to sell one or more of our mineral properties.
We intend to fund our plan of operations from working capital, the proceeds of financings, and the potential sale of our interest in the Galore Creek project. In the future, our ability to continue our exploration, permitting, development, and construction activities, if any, will depend in part on our ability to obtain suitable financing. If we raise additional funding by issuing additional equity securities or other securities that are convertible into equity securities, such financings may substantially dilute the interest of existing or future shareholders. Sales or issuances of a substantial number of securities, or the perception that such sales could occur, may adversely affect the prevailing market price for our common shares. With any additional sale or issuance of equity securities, investors will suffer dilution of their voting power and may experience dilution in our earnings per share.
There can be no assurance that we will commence production at any of our mineral properties or generate sufficient revenues to meet our obligations as they become due or obtain necessary financing on acceptable terms, if at all. Our failure to meet our ongoing obligations on a timely basis could result in the loss or substantial dilution of our interests (as existing or as proposed to be acquired) in our mineral properties. In addition, should we incur significant losses in future periods, we may be unable to continue as a going concern, and realization of assets and settlement of liabilities in other than the normal course of business may be at amounts materially different than our estimates.
Actual capital costs, operating costs, production and economic returns may differ significantly from those we have anticipated and there are no assurances that any future development activities will result in profitable mining operations.
The capital costs to take our projects into production may be significantly higher than anticipated. Escalation of costs was a significant factor in the decision to suspend construction at the Galore Creek project in 2007. On December 5, 2011, we announced the total capital cost estimate for the Donlin Gold project of approximately $6.7 billion including costs related to the natural gas pipeline (100% basis). The previous capital cost estimate for the project released in April 2009 was $4.5 billion which did not include the cost of a natural gas pipeline.
None of our mineral properties have an operating history upon which we can base estimates of future operating costs. Decisions about the development of these and other mineral properties will ultimately be based upon feasibility studies. Feasibility studies derive estimates of cash operating costs based upon, among other things:
|
·
|
anticipated tonnage, grades and metallurgical characteristics of the ore to be mined and processed;
|
19
|
·
|
anticipated recovery rates of gold, copper and other metals from the ore;
|
|
·
|
cash operating costs of comparable facilities and equipment; and
|
|
·
|
anticipated climatic conditions.
|
Capital costs, operating costs, production and economic returns, and other estimates contained in studies or estimates prepared by or for us may differ significantly from those anticipated by our current studies and estimates, and there can be no assurance that our actual operating costs will not be higher than currently anticipated.
Changes in the market price of gold, copper and other metals, which in the past have fluctuated widely, affect our financial condition.
Our profitability and long-term viability depend, in large part, upon the market price of gold, copper and other metals and minerals produced from our mineral properties. The market price of gold and other metals is volatile and is impacted by numerous factors beyond our control, including:
|
·
|
global or regional consumption patterns;
|
|
·
|
expectations with respect to the rate of inflation;
|
|
·
|
the relative strength of the U.S. dollar and certain other currencies;
|
|
·
|
interest rates;
|
|
·
|
global or regional political or economic conditions, including interest rates and currency values;
|
|
·
|
supply and demand for jewelry and industrial products containing metals; and
|
|
·
|
sales by central banks and other holders, speculators and producers of metals in response to any of the above factors.
|
We cannot predict the effect of these factors on metal prices. A decrease in the market price of gold, copper and other metals could affect our ability to finance the development of the Donlin Gold and Galore Creek projects, and the exploration and development of other mineral properties held by us, which would have a material adverse effect on our financial condition and results of operations. There can be no assurance that the market price of gold, copper and other metals will remain at current levels or that such prices will improve. In particular, an increase in worldwide supply, and consequent downward pressure on prices, may result over the longer term from increased production from the development of new or expansion of existing mines. There is no assurance that if commercial quantities of gold, copper and other metals are discovered, that a profitable market may exist or continue to exist for a production decision to be made or for the ultimate sale of the metals.
General economic conditions may adversely affect our growth, future profitability and ability to finance.
The unprecedented events in global financial markets in the past several years have had a profound impact on the global economy. Many industries, including the mining industry, are impacted by these market conditions. Some of the key impacts of the recent financial market turmoil include contraction in credit markets resulting in a widening of credit risk, devaluations, high volatility in global equity, commodity, foreign exchange and precious metal markets and a lack of market liquidity. During 2013, the price of gold declined by 28%, the largest annual decline since 1981, ending a 12-year period of annual price increases. The price of gold mining company equities also experienced significant declines.
Continued lower or a worsening of gold prices or slowdown in the financial markets or other economic conditions, including but not limited to, consumer spending, employment rates, business conditions, inflation, fuel and energy costs, consumer debt levels, lack of available credit, the state of the financial markets, interest rates and tax rates, may adversely affect our growth and ability to finance. Specifically:
|
·
|
the global economic recovery could make other investment sectors more attractive, thereby affecting the cost and availability of financing to us and our ability to achieve our business plan;
|
|
·
|
the volatility of metal prices would impact the economic viability of our mineral properties and any future revenues, profits, losses and cash flow;
|
|
·
|
negative economic pressures could adversely impact demand for future production from our mineral properties;
|
|
·
|
construction related costs could increase and adversely affect the economics of any of our projects;
|
|
·
|
volatile energy, commodity and consumables prices and currency exchange rates would impact our future production costs; and
|
|
·
|
the devaluation and volatility of global stock markets would impact the valuation of our equity and other securities.
|
20
We have a limited property portfolio
At present, our only material mineral properties are the interests that we hold in the Donlin Gold and Galore Creek projects. Unless we acquire or develop additional mineral properties, we will be solely dependent upon these properties. If no additional mineral properties are acquired by us, any adverse development affecting our operations and further development at either or both of the Donlin Gold and Galore Creek projects may have a material adverse effect on our financial condition and results of operations.
We are dependent on third parties that participate in or are responsible for exploration and development of our properties.
Our success depends on the efforts and expertise of third parties with whom we have contracted. With respect to each of the Donlin Gold and Galore Creek projects, we hold a 50% interest and the remaining 50% interest is held by a third party that is not under our control or direction. We are dependent on such third parties for accurate information relating to our mineral properties and related assets and the progress and development of such properties and assets. Third parties may also have different priorities which could impact the timing and cost of development of either or both of the Donlin Gold and Galore Creek projects. A third party may also be in default of its agreement with us, without our knowledge, which may put the mineral property and related assets at risk. The existence or occurrence of one or more of the following circumstances and events could have a material adverse impact on our ability to achieve our business plan, profitability, or the viability of our interests held with third parties, which could have a material adverse impact on our business, future cash flows, earnings, results of operations and financial condition: (i) disagreement with our business partners on how to develop and operate the mineral properties efficiently; (ii) inability to exert influence over certain strategic decisions made in respect of jointly held mineral properties; (iii) inability of our business partners to meet their obligations to the joint business or third parties; and (iv) litigation with our business partners regarding joint business matters.
We require various permits to conduct our current and anticipated future operations, and delays or a failure to obtain such permits, or a failure to comply with the terms of any such permits that we have obtained, could have a material adverse impact on us.
Our current and anticipated future operations, including further exploration and development activities and commencement of production on our mineral properties, require permits from various United States and Canadian federal, state, provincial, territorial and local governmental authorities. There can be no assurance that all permits that we require for the construction of mining facilities and to conduct mining operations will be obtainable on reasonable terms, or at all. Delays or a failure to obtain such permits, or a failure to comply with the terms of any such permits that we have obtained, could have a material adverse impact on us.
The duration and success of efforts to obtain and renew permits are contingent upon many variables not within our control. Shortage of qualified and experienced personnel in the various levels of government could result in delays or inefficiencies. Backlog within the permitting agencies could affect the permitting timeline of the various projects. Other factors that could affect the permitting timeline include (i) the number of other large-scale projects currently in a more advanced stage of development which could slow down the review process and (ii) significant public response regarding a specific project. As well, it can be difficult to assess what specific permitting requirements will ultimately apply to each of the projects.
The figures for our mineral resources and mineral reserves are estimates based on interpretation and assumptions and may yield less mineral production under actual conditions than is currently estimated.
Unless otherwise indicated, mineralization figures presented in this Annual Report on Form 10-K and in our other filings with securities regulatory authorities, press releases and other public statements that may be made from time to time are based upon estimates made by our personnel and independent geologists. These estimates use mining terms as defined in accordance with Canadian NI 43-101 and CIM Definition Standards on Mineral Resources and Mineral Reserves, adopted by the CIM Council, as amended. These definitions differ from the definitions in the SEC Industry Guide 7. For further information, see Cautionary Note to U.S. Investors Regarding Estimates of Measured, Indicated and Inferred Resources and Proven and Probable Reserves, above. In addition, these estimates are imprecise and depend upon geologic interpretation and statistical inferences drawn from drilling and sampling analysis, which may prove to be unreliable. There can be no assurance that:
|
·
|
these estimates will be accurate;
|
|
·
|
mineral reserve, mineral resource or other mineralization figures will be accurate; or
|
|
·
|
this mineralization could be mined or processed profitably.
|
Because we have not commenced commercial production at any of our mineral properties, mineralization estimates for our properties may require adjustments or downward revisions based upon further exploration or development work, actual production experience, or changes in the price of gold, copper or other metals. In addition, the grade of ore ultimately mined, if any, may differ from that indicated by drilling results. There can be no assurance that percentage of minerals recovered in small-scale tests will be duplicated in large-scale tests under on-site conditions or at production scale.
21
The SEC does not permit mining companies in their filings with the SEC to disclose estimates other than mineral reserves. However, because we are a Canadian company, we also prepare and file reports in accordance with Canadian disclosure requirements. These disclosures contain resource estimates, which are required by Canada’s NI 43-101.
Mineral resource estimates for mineral properties that have not commenced production are based, in many instances, on limited and widely spaced drill hole information, which is not necessarily indicative of the conditions between and around drill holes. Accordingly, such mineral resource estimates may require revision as more drilling information becomes available or as actual production experience is gained. No assurance can be given that any part or all of our mineral resources constitute or will be converted into reserves.
The estimating of mineral reserves and mineral resources is a subjective process that relies on the judgment of the persons preparing the estimates. The process relies on the quantity and quality of available data and is based on knowledge, mining experience, analysis of drilling results and industry practices. Valid estimates made at a given time may significantly change when new information becomes available. By their nature, mineral resource and reserve estimates are imprecise and depend, to a certain extent, upon analysis of drilling results and statistical inferences that may ultimately prove to be inaccurate. There can be no assurances that actual results will meet the estimates contained in studies.
Estimated mineral reserves or mineral resources may have to be recalculated based on changes in metal prices, further exploration or development activity, or actual production experience. In addition, if production costs increase, recovery rates decrease, if applicable laws and regulations are adversely changed, there is no assurance that the anticipated level of recovery will be realized or that mineral reserves or mineral resources as currently reported can be mined or processed profitably. This could materially and adversely affect estimates of the volume or grade of mineralization, estimated recovery rates or other important factors that influence mineral reserve or mineral resource estimates. The extent to which mineral resources may ultimately be reclassified as mineral reserves is dependent upon the demonstration of their profitable recovery. Any material changes in mineral resource estimates and grades of mineralization will affect the economic viability of placing a mineral property into production and a mineral property’s return on capital. We cannot provide assurance that mineralization identified at our mineral properties can or will be mined or processed profitably.
The resource and reserve estimates contained in this Annual Report on Form 10-K have been determined and valued based on assumed future prices, cut-off grades and operating costs that may prove to be inaccurate. Extended declines in market prices for gold, silver and copper may render portions of our mineralization uneconomic and result in reduced reported mineralization. Any material reductions in estimates of mineralization, or of our ability to extract this mineralization, could have a material adverse effect on our ability to implement our growth strategy, the results of operations or our financial condition.
We have established the presence of proven and probable reserves at our Donlin Gold and Galore Creek projects. There can be no assurance that any resource estimates for our mineral projects will ultimately be reclassified as mineral reserves. There can be no assurance that subsequent testing or future studies will establish proven and probable mineral reserves at our other mineral properties, if any. The failure to establish proven and probable mineral reserves could restrict our ability to successfully implement our strategies for long-term growth and could impact future cash flows, earnings, results of operation and financial condition.
Significant uncertainty exists related to inferred mineral resources.
There is a risk that inferred mineral resources referred to in this Annual Report on Form 10-K cannot be converted into measured or indicated mineral resources. Due to the uncertainty relating to inferred mineral resources, there is no assurance that inferred mineral resources will be upgraded to resources with sufficient geological and grade continuity to constitute measured and indicated resources as a result of continued exploration.
The proposed sale of Galore Creek may not occur.
Part of our current business strategy is to sell our 50% interest in the Galore Creek Partnership. Our management expects to continue to evaluate disposition opportunities on a regular basis and intends to pursue opportunities that management believes are in our long-term best interests. Competition in the mining business for limited sources of capital could adversely impact our ability to dispose of our interest in the Galore Creek Partnership and as a result we may not be successful in identifying a purchaser or in obtaining an offer at an acceptable price and on acceptable terms and conditions. As a result, there is no assurance that we will be able to dispose of our interest in the Galore Creek Partnership; in which case we expect to continue with the joint development of the Galore Creek project through the Galore Creek Partnership, which would result in increased capital requirements for us to fund our portion of project development.
22
Lack of infrastructure could delay or prevent us from developing advanced projects.
Completion of the development of the Donlin Gold and Galore Creek projects is subject to various requirements, including the availability and timing of acceptable arrangements for power, water, transportation, access and facilities. The lack of availability on acceptable terms or the delay in the availability of any one or more of these items could prevent or delay development of these projects. There can be no assurance that adequate infrastructure, including access and power supply, will be built, that it will be built in a timely manner or that the cost of such infrastructure will be reasonable or that it will be sufficient to satisfy the requirements of the projects. If adequate infrastructure is not available in a timely manner, there can be no assurance that:
|
·
|
the development of our mineral properties will be commenced or completed on a timely basis, if at all;
|
|
·
|
the resulting operations will achieve the anticipated production volume; or
|
|
·
|
the construction costs and ongoing operating costs associated with the development of our mineral properties will not be higher than anticipated.
|
Access to the Donlin Gold and Galore Creek projects is limited and there is no infrastructure in the respective areas. At the Donlin Gold project, an approximately 500-kilometer long natural gas pipeline is needed to supply fuel to the generating plant proposed to provide power for the project. The proposed pipeline would traverse generally undeveloped areas in Alaska that are difficult to access. Terrain, geologic conditions, ground conditions, steep slopes, weather, and other natural conditions that are beyond our control, along the pipeline route present design, permitting, construction, and operational challenges for the project. Cost and schedule estimates may increase significantly as more detailed engineering work, geotechnical and geological studies are completed.
Title and other rights to our mineral properties are subject to agreements with other parties.
The subsurface mineral and surface rights at the Donlin Gold project are owned by Calista Corporation and The Kuskokwim Corporation, respectively, two Native Alaska corporations. Donlin Gold operates on these lands pursuant to a Mining Lease with Calista Corporation and a Surface Use Agreement with The Kuskokwim Corporation. The ability of Donlin Gold to continue to explore and develop the Donlin Gold project depends upon its continued compliance with the terms and conditions of the Mining Lease and Surface Use Agreement. Furthermore, our ability to continue to explore and develop other mineral properties may be subject to agreements with other third parties, including agreements with native corporations and first nations, for instance.
Mining is inherently dangerous and subject to conditions or events beyond our control, which could have a material adverse effect on our business.
Mining involves various types of risks and hazards, including:
|
·
|
environmental hazards;
|
|
·
|
industrial accidents;
|
|
·
|
metallurgical and other processing problems;
|
|
·
|
unusual or unexpected geologic formations and conditions;
|
|
·
|
structural cave-ins or slides;
|
|
·
|
flooding;
|
|
·
|
fires;
|
|
·
|
power outages;
|
|
·
|
labor disruptions;
|
|
·
|
explosions;
|
|
·
|
landslides and avalanches;
|
|
·
|
mechanical equipment and facility performance problems;
|
|
·
|
availability of materials and equipment;
|
|
·
|
metals losses; and
|
|
·
|
periodic interruptions due to inclement or hazardous weather conditions.
|
These risks could result in damage to, or destruction of, mineral properties, production facilities or other properties; personal injury or death, including to employees; environmental damage; delays in construction or mining operations; increased production costs; asset write downs; monetary losses; and possible legal liability. We may not be able to obtain insurance to cover these risks at economically feasible premiums or at all. Insurance against certain environmental risks, including potential liability for pollution or other hazards as a result of the disposal of waste products occurring from mineral production, is not generally available to us or to other companies within the mining industry. We may suffer a material adverse impact on our business if we incur losses related to any significant events that are not covered by our insurance policies.
23
Exploration, construction and production activities may be limited or delayed by inclement weather and shortened exploration, construction, development and operating seasons. For example, Donlin Gold proposes to transport the bulk of the supplies required to operate the Donlin Gold project to the site from ports in the United States and Canada. This would require the supplies to be transported by barge on the Kuskokwim River which is free of ice and open for barge traffic for a limited period each year. Delays in the ice breakup or early freeze-up, low flow levels and water depths, or other conditions affecting the Kuskokwim River could delay or prevent Donlin Gold from transporting supplies to the site. Any such interference with the delivery of needed supplies to the Donlin Gold project could adversely affect the construction or operation of the project or the cost of constructing or operating the project which, in turn, would adversely affect our business.
We are subject to significant governmental regulation.
Our operations and exploration and development activities in Canada and the United States are subject to extensive federal, state, provincial, territorial and local laws and regulations governing various matters, including:
|
·
|
environmental protection;
|
|
·
|
management and use of toxic substances and explosives;
|
|
·
|
management of tailings and other wastes generated by our operations;
|
|
·
|
management of natural resources;
|
|
·
|
exploration and development of mines, production and post-closure reclamation;
|
|
·
|
exports;
|
|
·
|
price controls;
|
|
·
|
taxation and mining royalties;
|
|
·
|
regulations concerning business dealings with native groups;
|
|
·
|
availability and use of water resources;
|
|
·
|
labor standards and occupational health and safety, including mine safety; and
|
|
·
|
preservation of historic and cultural resources.
|
Failure to comply with applicable laws and regulations may result in civil or criminal fines or penalties or enforcement actions, including orders issued by regulatory or judicial authorities enjoining, curtailing or closing operations or requiring corrective measures, installation of additional equipment or remedial actions, any of which could result in us incurring significant expenditures. We may also be required to compensate private parties suffering loss or damage by reason of a breach of such laws, regulations or permitting requirements. It is also possible that future laws and regulations, or a more stringent enforcement of current laws and regulations by governmental authorities, could cause additional expense, capital expenditures, restrictions on or suspensions of our operations and delays in the exploration and development of our mineral properties.
Our activities are subject to environmental laws and regulations that may increase our costs of doing business and restrict our operations.
All of our exploration, potential development and production activities in Canada and the United States are subject to regulation by governmental agencies under various environmental laws. To the extent that we conduct exploration activities or undertake new mining activities in other foreign countries, we will also be subject to environmental laws and regulations in those jurisdictions. These laws address emissions into the air, discharges into water, management of waste, management of hazardous substances, use of water, protection of natural resources, antiquities and endangered species, and reclamation of lands disturbed by mining operations. Environmental legislation continues to evolve and the trend has been toward stricter standards and enforcement, increased fines and penalties for non-compliance, more stringent environmental assessments of proposed projects and increasing responsibility for companies and their officers, directors and employees. Compliance with environmental laws and regulations may require significant capital outlays on our behalf and may cause material changes or delays in our intended activities. There can be no assurance that future changes in environmental regulations will not adversely affect our business, and it is possible that future changes in these laws or regulations could have a significant adverse impact on some portion of our business, causing us to re-evaluate those activities at that time.
Environmental hazards may exist on our mineral properties that are unknown to us at the present time, and that have been caused by previous owners or operators or that may have occurred naturally. We may be liable for remediating such damage.
Failure to comply with applicable environmental laws, regulations and permitting requirements may result in enforcement actions thereunder, including orders issued by regulatory or judicial authorities, causing operations to cease or to be curtailed, and may include corrective measures requiring capital expenditures, installation of additional equipment or remedial actions.
24
Our majority shareholder has significant influence on us and may also affect the market price and liquidity of our Securities.
Electrum Strategic Resources L.P. and its affiliate GRAT Holdings LLC hold in the aggregate 27.2% of our issued and outstanding common shares. On December 31, 2013 Electrum exercised the entirety of its remaining share purchase warrants. Accordingly, Electrum and its affiliates will have significant influence in determining the outcome of any corporate transaction or other matter submitted to the shareholders for approval, including mergers, consolidations and the sale of all or substantially all of our assets and other significant corporate actions. Unless full participation of all shareholders takes place in such shareholder meetings, Electrum and its affiliates may be able to approve such matters itself. The concentration of ownership of the common shares by Electrum and its affiliates may: (i) delay or deter a change of control of the Company; (ii) deprive shareholders of an opportunity to receive a premium for their common shares as part of a sale of the Company; and (iii) affect the market price and liquidity of the common shares. In conjunction with the January 22, 2009 financing, we provided Electrum with the right to designate an observer at all meetings of the Board of Directors and any committee thereof so long as Electrum and its affiliates hold not less than 15% of our common shares. Electrum designated Igor Levental as its observer at our Board of Directors meetings. In July 2010, Igor Levental was appointed to our Board of Directors. In November 2011, Dr. Thomas S. Kaplan, was appointed Chairman of our Board. Dr. Kaplan is also the Chairman and Chief Executive Officer of The Electrum Group LLC, an investment advisor that manages Electrum’s investments. As long as Electrum and its affiliates maintain its shareholdings in the Company, Electrum will have significant influence in determining the members of the Board of Directors. Without the consent of Electrum, we could be prevented from entering into transactions that are otherwise beneficial to us. The interests of Electrum and its affiliates may differ from or be adverse to the interests of our other shareholders. The effect of these rights and Electrum’s influence may impact the price that investors are willing to pay for our shares. If Electrum or its affiliates sell a substantial number of our common shares in the public market, the market price of the common shares could fall. The perception among the public that these sales will occur could also contribute to a decline in the market price of our common shares.
Some of the directors have conflicts of interest as a result of their involvement with other natural resource companies.
Certain of our directors also serve as directors, or have significant shareholdings in, other companies involved in natural resource exploration and development or mining-related activities. To the extent that such other companies may participate in ventures in which we may participate in, or in ventures which we may seek to participate in, the directors may have a conflict of interest. In all cases where the directors have an interest in other companies, such other companies may also compete with us for the acquisition of mineral property investments. Such conflicts of the directors may result in a material and adverse effect on our profitability, results of operation and financial condition. As a result of these conflicts of interest, we may miss the opportunity to participate in certain transactions, which may have a material adverse effect on our financial position or future business prospects.
There is uncertainty related to unsettled aboriginal rights and title in British Columbia and this may adversely impact our operations and profit.
Native land claims in British Columbia remain the subject of active debate and litigation. The Galore Creek project lies within the traditional territory of the Tahltan Nation and the Tahltan, like the majority of British Columbia’s First Nations, have not concluded a comprehensive treaty or land claims settlement regarding their traditional territories. There can be no guarantee that the unsettled nature of land claims in British Columbia will not create delays in project approval or unexpected interruptions in project progress, or result in additional costs to advance the project.
Opposition to our operations from local stakeholders or non-governmental organizations could have a material adverse effect on us.
There is an increasing level of public concern relating to the effect of mining production on its surroundings, communities and environment. Local communities and non-governmental organizations (NGOs), some of which oppose resource development, are often vocal critics of the mining industry. While we seek to operate in a socially responsible manner, opposition to extractive industries or our operations specifically or adverse publicity generated by local communities or NGOs related to extractive industries, or our operations specifically, could have an adverse effect on our reputation and financial condition or our relationships with the communities in which we operate. As a result of such opposition or adverse publicity, we may be unable to obtain permits necessary for our operations or to continue our operations as planned or at all.
We have ongoing reclamation on some of our mineral properties and may be required to fund additional work that could have a material adverse effect on our financial position.
Land reclamation requirements are generally imposed on mineral exploration companies (as well as companies with mining operations) in order to minimize long term effects of land disturbance. Reclamation may include requirements to:
|
·
|
treat ground and surface water to drinking water standards;
|
25
|
·
|
control dispersion of potentially deleterious effluents;
|
|
·
|
reasonably re-establish pre-disturbance land forms and vegetation; and
|
|
·
|
provide adequate financial assurance to ensure required reclamation of land affected by our activities.
|
We have been carrying out certain remediation of land disturbed by previous exploration activities at the Donlin Gold and Galore Creek projects. Exploration and other activities at the Donlin Gold and Galore Creek projects have created disturbance that must be reclaimed. The initial access road construction at the Galore Creek project also would need to be reclaimed, if the Galore Creek project is not developed. Financial resources spent on reclamation might otherwise be spent on further exploration and development programs. In addition, regulatory changes could increase our obligations to perform reclamation and mine closure activities. There can be no assurance that we will not be required to fund additional reclamation work at these sites that could have a material adverse effect on our financial position.
An event of default under the Notes may significantly reduce our liquidity and adversely affect our business.
Under the base indenture and supplemental indenture governing the Notes, we made various covenants to the trustee on behalf of the holders of the Notes, including to make payments of interest and principal when due and, upon undergoing a fundamental change, to offer to purchase all of the outstanding Notes. The indenture is available for review on SEDAR at www.sedar.com and on EDGAR at www.sec.gov.
If there is an event of default under the Notes, the principal amount of the Notes, plus accrued and unpaid interest, if any, may be declared immediately due and payable. If such an event occurs, we could be negatively impacted financially. At November 30, 2013, the principal amount remaining on the Notes was $15.8 million which is due May 1, 2015.
We are exposed to credit, liquidity, interest rate and currency risk.
Credit risk is the risk of an unexpected loss if a customer or third party to a financial instrument fails to meet its contractual obligations. Our cash equivalents and term deposit investments are held through large Canadian financial institutions with high investment-grade ratings. These investments mature at various dates over the current operating period. The carrying amount of financial assets recorded in the financial statements, net of any allowances for losses, represents our maximum exposure to credit risk.
Liquidity risk is the risk that we will not be able to meet our financial obligations as they come due. We manage liquidity risk through the management of our capital structure and financial leverage. Accounts payable, accrued liabilities and coupon interest on the convertible notes are due within one year from the balance sheet date.
Interest rate risk is the risk that the fair value or future cash flows of a financial instrument will fluctuate because of changes in market interest rates. The risk that we will realize a loss as a result of a decline in the fair value of the term deposit investments is limited because these investments have an original term of less than one year and are generally held to maturity. In respect of financial liabilities, the Notes are not subject to interest rate risk because they are at fixed rates. The promissory note owed to Barrick is variable with the U.S. prime rate. Based on the amount owing on the promissory note as of November 30, 2013, and assuming that all other variables remain constant, a 1% change in the U.S. prime rate would result in an increase/decrease of $0.7 million in the interest accrued by us per annum. For more detail with respect to the promissory note, see Item 2, Donlin Gold Project, Alaska, below.
We are exposed to the financial risk related to the fluctuation of foreign exchange rates. We operate in Canada and the United States and a portion of our expenses are incurred in Canadian dollars. A significant change in the currency exchange rate between the Canadian dollar relative to the U.S. dollar could have an effect on our results of operations, financial position or cash flows. We have not hedged our exposure to currency fluctuations. Based on our net exposures as of November 30, 2013, and assuming that all other variables remain constant, a 5% depreciation or appreciation of the Canadian dollar against the U.S. dollar would result in an increase/decrease of $3.5 million in our consolidated comprehensive income (loss).
Our insurance will not cover all of the potential risks associated with mining operations.
Our business is subject to a number of risks and hazards generally including adverse environmental conditions, industrial accidents, labor disputes, unusual or unexpected geological conditions, ground or slope failures, cave-ins, changes in the regulatory environment and natural phenomena, such as inclement weather conditions, floods, hurricanes and earthquakes. Such occurrences could result in damage to mineral properties or production facilities, personal injury or death, environmental damage to our properties or the property of others, delays in construction or mining, monetary losses and possible legal liability.
Although we maintain insurance to protect against certain risks in such amounts as we consider reasonable, our insurance will not cover all the potential risks associated with a mining company’s operations. We may also be unable to maintain insurance to cover these risks at economically feasible premiums. Insurance coverage may not continue to be available or may not be adequate to cover any resulting liability. Moreover, insurance against risks such as loss of title to mineral property, environmental pollution, or other hazards as a result of exploration and production is not generally available to us or to other companies in the mining industry on acceptable terms. We might also become subject to liability for pollution or other hazards which may not be insured against or which we may elect not to insure against because of premium costs or other reasons. Losses from these events may cause us to incur significant costs that could have a material adverse effect on our financial performance and results of operations.
26
Title and other rights to our mineral properties cannot be guaranteed and may be subject to prior unregistered agreements, transfers or claims and other defects.
We cannot guarantee that title to our mineral properties will not be challenged. We may not have, or may not be able to obtain, all necessary surface rights to develop a mineral property. Title insurance is generally not available for mineral properties and our ability to ensure that we have obtained secure claim to individual mineral properties or mining concessions may be severely constrained. Our mineral properties may be subject to prior unregistered agreements, transfers or claims, and title may be affected by, among other things, undetected defects. We have not conducted surveys of all of the mineral properties in which we hold direct or indirect interests. A successful challenge to the precise area and location of these mineral properties could result in us being unable to operate on our mineral properties as permitted or being unable to enforce our rights with respect to our mineral properties. This could result in us not being compensated for our prior investment relating to the mineral property.
Rising metal prices encourages mining exploration, development and construction activity, which in the past has increased demand for and cost of contract mining services and equipment.
Increases in metal prices tend to encourage increases in mining exploration, development and construction activities. During past expansions, demand for and the cost of contract exploration, development and construction services and equipment have increased as well. Increased demand for and cost of services and equipment could cause project costs to increase materially, resulting in delays if services or equipment cannot be obtained in a timely manner due to inadequate availability, and increased potential for scheduling difficulties and cost increases due to the need to coordinate the availability of services or equipment, any of which could materially increase project exploration, development or construction costs, result in project delays, or both. Increased costs were a significant factor in the decision to suspend construction at the Galore Creek project in 2007 and there can be no assurance that increased costs may not adversely affect our development of our mineral properties in the future.
Increased competition could adversely affect our ability to attract necessary capital funding or acquire suitable producing properties or prospects for mineral exploration in the future.
The mining industry is intensely competitive. Significant competition exists for the acquisition of mineral properties producing or capable of producing metals. We may be at a competitive disadvantage in acquiring additional mineral properties because we must compete with other individuals and companies, many of which have greater financial resources, operational experience and technical capabilities than us or are further advanced in their development or are significantly larger and have access to greater mineral reserves, for the acquisition of mineral claims, leases and other mineral interests. We may also encounter increasing competition from other mining companies in our efforts to hire experienced mining professionals. Increased competition could adversely affect our ability to attract necessary capital funding or acquire suitable producing properties or prospects for mineral exploration in the future. If we are unsuccessful in acquiring additional mineral properties or qualified personnel, we will not be able to grow at the rate we desire, or at all.
We may experience difficulty attracting and retaining qualified management and technical personnel to meet the needs of our anticipated growth, and the failure to manage our growth effectively could have a material adverse effect on our business and financial condition.
We are dependent on the services of key executives including our President and Chief Executive Officer and other highly skilled and experienced executives and personnel focused on managing our interests and the advancement of the Donlin Gold and Galore Creek projects, in addition to the identification of new opportunities for growth and funding. Due to our relatively small size, the loss of these persons or our inability to attract and retain additional highly skilled employees required for the development of our activities may have a material adverse effect on our business or future operations.
We do not currently intend to use forward sales arrangements to protect against low commodity prices; therefore, our operating results are exposed to the impact of any significant drop in commodity prices.
We do not currently intend to enter into forward sales arrangements to reduce the risk of exposure to volatility in commodity prices. Accordingly, our future operations are exposed to the impact of any significant decrease in commodity prices. If such prices decrease significantly at a time when we are producing, we would realize reduced revenues. While it is not our current intention to enter into forward sales arrangements, we are not restricted from entering into forward sales arrangements at a future date.
27
There can be no assurance that we will successfully acquire additional mineral rights.
Most exploration projects do not result in the discovery of commercially mineable ore deposits and no assurance can be given that any particular level of recovery of ore reserves will be realized or that any identified mineral deposit will ever qualify as a commercially mineable (or viable) ore body which can be legally and economically exploited. Estimates of reserves, mineral deposits and production costs can also be affected by such factors as environmental permitting regulations and requirements, weather, environmental factors, unforeseen technical difficulties, unusual or unexpected geological formations and work interruptions. If current exploration programs do not result in the discovery of commercial ore, we may need to write-off part or all of our investment in existing exploration stage properties, and may need to acquire additional mineral properties. Material changes in ore reserves, grades, stripping ratios or recovery rates may affect the economic viability of any project.
Our future growth and productivity will depend, in part, on our ability to identify and acquire additional mineral rights, and on the costs and results of continued exploration and development programs. Mineral exploration is highly speculative in nature and is frequently non-productive. Substantial expenditures are required to:
|
·
|
establish ore reserves through drilling and metallurgical and other testing techniques;
|
|
·
|
determine metal content and metallurgical recovery processes to extract metal from the ore; and
|
|
·
|
permit, construct, renovate or expand mining and processing facilities.
|
In addition, if we discover a mineral deposit, it would take several years from the initial phases of exploration until production is possible. During this time, the economic feasibility of production may change. As a result of these uncertainties, there can be no assurance that we will successfully acquire additional mineral rights.
We may experience problems integrating new acquisitions into existing operations, which could have a material adverse effect on us.
We may make selected acquisitions in the future, with a focus on late-stage development projects. Our success at completing any acquisitions will depend on a number of factors, including, but not limited to:
|
·
|
identifying acquisitions that fit our business strategy;
|
|
·
|
accurately assessing the value, strengths, weaknesses, contingent and other liabilities and potential profitability of acquisition candidates;
|
|
·
|
negotiating acceptable terms with the seller of the business or mineral property to be acquired; and
|
|
·
|
obtaining approval from regulatory authorities in the jurisdictions of the business or mineral property to be acquired.
|
If we do make further acquisitions, any positive effect on our results will depend on a variety of factors, including, but not limited to:
|
·
|
assimilating the operations of an acquired business or mineral property in a timely and efficient manner;
|
|
·
|
maintaining our financial and strategic focus while integrating the acquired business or mineral property;
|
|
·
|
achieving identified and anticipated operating and financial synergies;
|
|
·
|
unanticipated costs;
|
|
·
|
diversion of management attention from existing business;
|
|
·
|
potential loss of key employees or key employees of any business acquired;
|
|
·
|
unanticipated changes in business, industry or general economic conditions that affect the assumptions underlying the acquisition;
|
|
·
|
decline in the value of acquired mineral properties, companies or securities;
|
|
·
|
implementing uniform standards, controls, procedures and policies at the acquired business, as appropriate; and
|
|
·
|
to the extent that we make an acquisition outside of markets in which it has previously operated, conducting and managing operations in a new operating environment.
|
Acquiring additional businesses or mineral properties could place increased pressure on our cash flow if such acquisitions involve a cash consideration. The integration of our existing operations with any acquired business will require significant expenditures of time, attention and funds. Achievement of the benefits expected from consolidation would require us to incur significant costs in connection with, among other things, implementing financial and planning systems. We may not be able to integrate the operations of a recently acquired business or restructure our previously existing business operations without encountering difficulties and delays. In addition, this integration may require significant attention from our management team, which may detract attention from our day-to-day operations. Over the short-term, difficulties associated with integration could have a material adverse effect on our business, operating results, financial condition and the price of our common shares. In addition, the acquisition of mineral properties may subject us to unforeseen liabilities, including environmental liabilities, which could have a material adverse effect on us. There can be no assurance that any future acquisitions will be successfully integrated into our existing operations and such acquisition may result in a material adverse effect on our financial condition.
28
In addition, we anticipate that as we bring our mineral properties into production and as we acquire additional mineral rights, we will experience significant growth in our operations. We expect this growth to create new positions and responsibilities for management and technical personnel and to increase demands on our operating and financial systems. There can be no assurance that we will successfully meet these demands and effectively attract and retain additional qualified personnel to manage our anticipated growth. The failure to attract such qualified personnel to manage growth effectively could have a material adverse effect on our business, financial condition and results of operations.
We may have unknown liabilities in connection with acquisitions.
As part of our acquisitions, we have assumed liabilities and risks. While we conducted due diligence, there may be liabilities or risks that we failed, or were unable, to discover in the course of performing the due diligence investigations or for which we were not indemnified. Any such liabilities, individually or in the aggregate, could have a material adverse effect on our financial position and results of operations.
We may be subject to legal proceedings.
Due to the nature of our business, we may be subject to a variety of regulatory investigations, claims, lawsuits and other proceedings in the ordinary course of our business. The results of these legal proceedings cannot be predicted with certainty due to the uncertainty inherent in litigation, including the effects of discovery of new evidence or advancement of new legal theories, the difficulty of predicting decisions of judges and juries and the possibility that decisions may be reversed on appeal. There can be no assurances that these matters will not have a material adverse effect on our business.
Global climate change is an international concern, and could impact our ability to conduct future operations.
Global climate change is an international issue and receives an enormous amount of publicity. We would expect that the imposition of international treaties or U.S. or Canadian federal, state, provincial or local laws or regulations pertaining to mandatory reductions in energy consumption or emissions of greenhouse gasses could affect the feasibility of mining projects and increase operating costs.
Our projects are not directly threatened by current predictions of sea level rise because all of them are located inland at elevations from 100 meters to 4,000 meters above sea level. However, changes in sea levels could affect ocean transportation and shipping facilities, which would be used to transport supplies, equipment and personnel to our projects and products from those projects to world markets.
Extreme weather events (such as increased frequency or intensity of hurricanes, increased snow pack, prolonged drought) have the potential to disrupt operations at our projects. Where appropriate, our projects have developed emergency plans for managing extreme weather conditions; however, extended disruptions to supply lines due to extreme weather could result in interruption of activities at the project sites, delay or increase the cost of construction of the projects, or otherwise adversely affect our business.
We may fail to achieve and maintain the adequacy of internal control over financial reporting as per the requirements of the Sarbanes-Oxley Act.
We have documented and tested our internal control procedures in order to satisfy the requirements of Section 404 of the Sarbanes-Oxley Act (SOX). SOX requires an annual assessment by management of the effectiveness of our internal control over financial reporting and an attestation report by our independent auditors addressing this assessment. At November 30, 2013, management concluded that our internal control over financial reporting was effective. We may in the future fail to achieve and maintain the adequacy of our internal control over financial reporting, as such standards are modified, supplemented or amended from time to time, and we may not be able to ensure that we can conclude on an ongoing basis that we have effective internal controls over financial reporting in accordance with Section 404 of SOX. Our failure to satisfy the requirements of Section 404 of SOX on an ongoing, timely basis could result in the loss of investor confidence in the reliability of our financial statements, which in turn could harm our business and negatively impact the trading price of our shares. In addition, any failure to implement required new or improved controls, or difficulties encountered in their implementation, could harm our operating results or cause us to fail to meet our reporting obligations. Future acquisitions of companies may provide us with challenges in implementing the required processes, procedures and controls in our acquired operations. Acquired companies may not have disclosure control and procedures or internal control over financial reporting that are as thorough or effective as those required by securities laws currently applicable to us.
29
No evaluation can provide complete assurance that our internal control over financial reporting will detect or uncover all failures of persons within the Company to disclose material information otherwise required to be reported. The effectiveness of our internal controls and procedures could also be limited by simple errors or faulty judgments. In addition, should we expand in the future, the challenges involved in implementing appropriate internal controls over financial reporting will increase and will require that we continue to improve our internal controls over financial reporting. Although we intend to devote substantial time and incur substantial costs, as necessary, to ensure compliance, we cannot be certain that we will be successful in complying with Section 404 of SOX on an ongoing basis.
We are subject to increased regulatory compliance costs relating to the Dodd-Frank Act.
In July 2010, the “Dodd-Frank Wall Street Reform and Consumer Protection Act” (“Dodd-Frank Act”) was enacted, representing an overhaul of the framework for regulation of U.S. financial markets. The Dodd-Frank Act calls for various regulatory agencies, including the SEC and the Commodities Futures Trading Commission, to establish regulations for implementation of many of the provisions of the Dodd-Frank Act, and we anticipate that these new regulations will provide additional clarity regarding the extent of the impact of this legislation on us. If our efforts to comply with new laws, regulations and standards differ from the activities intended by regulatory or governing bodies due to ambiguities related to practice, regulatory authorities may initiate legal proceedings against us and our business may be harmed. Dodd-Frank also requires companies in the mining industry to disclose substantial additional information in their periodic reports filed with the SEC about safety issues relating to their mining operations and will require us to disclose on an annual basis, once a final rule becomes effective, certain payments made by us, our subsidiaries or entities we control, to the U.S. government and foreign governments, including sub-national governments. This heightened scrutiny could generate negative publicity for the mining industry, increase the cost of compliance with mining regulations or result in the passage of new laws and regulations, any of which could negatively affect our business results. We may also need to incur additional costs and invest additional resources, including management’s time, in order to comply with the new regulations and anticipated additional reporting and disclosure obligations. While we are not able to assess the full impact of the Dodd-Frank Act until all the implementing regulations have been adopted, based on the information available to us at this time, we do not believe provisions of the regulations implementing the Dodd-Frank Act will have a material adverse effect on our financial position, results of operations or cash flows.
Acquiring, holding or disposing of our securities may have tax consequences under the laws of Canada and the United States that are not disclosed in this Annual Report on Form 10-K and, in particular, potential investors should be aware that we believe we are likely a “passive foreign investment company” under the U.S. Internal Revenue Code, which may have adverse tax consequences for investors in the United States.
Acquiring, holding or disposing of our securities may have tax consequences under the laws of Canada and the United States that are not disclosed in this Annual Report on Form 10-K. In particular, potential investors that are U.S. taxpayers should be aware that we may be considered a “passive foreign investment company” under Section 1297(a) of the U.S. Internal Revenue Code (a PFIC). We believe that we were likely a PFIC for our tax year ended November 30, 2013 and may be a PFIC for our current and future tax years. PFIC classification is fundamentally factual in nature, generally cannot be determined until the close of the tax year in question, and is determined annually. Additionally, the analysis depends, in part, on the application of complex U.S. federal income tax rules, which are subject to differing interpretations. In any tax year in which we are a PFIC, a U.S. taxpayer will be required to file an annual report with the Internal Revenue Service containing such information as Treasury Regulations or other tax rules may require.
Any gain recognized on the sale of common shares of a PFIC and any excess distributions paid on the common shares of a PFIC must be ratably allocated to each day in a U.S. taxpayer’s holding period for the common shares. The amount of any such gain or excess distribution allocated to prior years of such U.S. taxpayer’s holding period for the common shares generally will be subject to U.S. federal income tax at the highest tax applicable to ordinary income in each such prior year, and the U.S. taxpayer will be required to pay interest on the resulting tax liability for each such prior year, calculated as if such tax liability had been due in each such prior year.
Alternatively, a U.S. taxpayer that makes a timely “QEF election” generally will be subject to U.S. federal income tax on such U.S. taxpayer’s pro rata share of our “net capital gain” and “ordinary earnings” (calculated under U.S. federal income tax rules), regardless of whether such amounts are actually distributed by us. U.S. taxpayers should be aware that there can be no assurance that we will satisfy record-keeping requirements or that we will supply U.S. taxpayers with required information under the QEF rules, in event that we are a PFIC and a U.S. taxpayer wishes to make a QEF election. As a second alternative, a U.S. taxpayer may make a “mark-to-market election” if we are a PFIC and the common shares are marketable stock. A U.S. taxpayer that makes a mark-to-market election generally will include in gross income, for each taxable year in which we are a PFIC, an amount equal to the excess, if any, of (a) the fair market value of the common shares as of the close of such taxable year over (b) such U.S. taxpayer’s tax basis in such common shares.
Investors should consult their tax advisors as to the tax consequences of an investment in our securities.
30
We are a Canadian company and U.S. investors may have difficulty bringing actions and enforcing judgments under U.S. securities laws.
Investors in the United States or in other jurisdictions outside of Canada may have difficulty bringing actions and enforcing judgments against us, our directors, our executive officers and some of the experts named in this Annual Report on Form 10-K based on civil liabilities provisions of the federal securities laws or other laws of the United States or any state thereof or the equivalent laws of other jurisdictions of residence.
None.
31
The following descriptions summarize selected information about our 50% interest in the Donlin Gold project located in Alaska, USA and our 50% interest in the Galore Creek project located in British Columbia, Canada. Both of these mineral projects are without known reserves, as defined under SEC Industry Guide 7. The disclosure in this Annual Report on Form 10-K of a scientific or technical nature for our mineral properties is based on the following technical reports prepared in accordance with NI 43-101:
|
(i)
|
“Donlin Creek Gold Project Alaska, USA, NI 43-101 Technical Report on Second Updated Feasibility Study” (“Donlin Gold FS”) for the Donlin Gold project in southwestern Alaska, USA, effective date November 18, 2011 and amended and filed on January 20, 2012. The independent technical report was prepared for NOVAGOLD by Kirk Hanson, P.E., Gordon Seibel, R.M. SME., and Tony Lipiec, P.Eng., all of whom are Qualified Persons as defined in NI 43-101. The Donlin Gold FS has been filed with the securities regulatory authorities in each province of Canada and with the SEC. Portions of the following information are based on assumptions, qualifications and procedures that are not fully described herein. References should be made to the full text of the Donlin Gold FS which is available for review on EDGAR at
www.sec.gov
and on SEDAR at
www.sedar.com
.
|
|
(ii)
|
“Galore Creek Copper-Gold Project NI 43-101 Technical Report on Pre-Feasibility Study, British Columbia – Canada” (the PFS) for the Galore Creek project in northwestern British Columbia, Canada, effective date July 27, 2011 and filed on September 12, 2011. The independent technical report was prepared for GCMC, NOVAGOLD and Teck Resources Inc. (“Teck”) by Robert Gill, P.Eng., Jay Melnyk, P.Eng., Greg Wortman, P.Eng., Greg Kulla, P.Geo., and Dana Rogers, P.E., all of whom are Qualified Persons as defined in NI 43-101. The PFS has been filed with the securities regulatory authorities in each province of Canada and with the SEC. Portions of the following information are based on assumptions, qualifications and procedures which are not fully described herein. References should be made to the full text of the PFS which is available for review on EDGAR at
www.sec.gov
and on SEDAR at
www.sedar.com
.
Heather White, B.Sc., P.Eng., who is a consultant to the Company and a "qualified person" under the NI 43-101, has approved the scientific and technical information included in this Annual Report on Form 10-K related to: (1) Donlin Gold since the issuance of the technical report filed on January 23, 2012, and (2) Galore Creek since the issuance of the technical report filed on September 12, 2011.
|
Cautionary Note to U.S. Investors:
This section and other sections of this Annual Report on Form 10-K contain the terms “measured mineral resources,” “indicated mineral resources,” “inferred mineral resources,” “proven mineral reserves,” and “probable mineral reserves” as defined in accordance with NI 43-101. Please note the following regarding these terms:
“Proven mineral reserves” and “probable mineral reserves”
– The definitions of proven and probable mineral reserves used in NI 43-101 differ from the definitions for “proven reserves” and “probable reserves” as found in SEC Industry Guide 7. Accordingly, our disclosures of mineral reserves herein may not be comparable to information from U.S. companies subject to reporting and disclosure requirements of the SEC.
“Measured mineral resources” and “indicated mineral resources”
– we advise U.S. investors that although these terms are recognized and required by Canadian regulations, these terms are not defined in SEC Industry Guide 7 and the SEC does not normally permit such terms to be used in reports and registration statements filed with the SEC. U.S. investors are cautioned not to assume that any part or all of the mineral deposits in these categories will ever be converted into reserves.
“Inferred mineral resources”
– we advise U.S. investors that although this term is recognized by Canadian regulations, the SEC does not recognize it. “Inferred mineral resources” have a great amount of uncertainty as to their existence, and great uncertainty as to their economic and legal feasibility. It cannot be assumed that all or any part of an inferred mineral resource will ever be upgraded to a higher category. Under Canadian rules, estimates of inferred mineral resources may not form the basis of a feasibility study or prefeasibility study, except in rare cases. The SEC normally only permits an issuer to report mineralization that does not constitute “reserves” as in-place tonnage and grade without reference to unit measures. U.S. investors are cautioned not to assume that any part or all of an inferred mineral resource exists or is economically or legally minable.
32
Donlin Gold Project, Alaska
The Donlin Gold project is an advanced-stage gold project held by Donlin Gold, a limited liability company that is owned 50% by our wholly-owned subsidiary, NOVAGOLD Resources Alaska, Inc. and 50% by Barrick’s wholly-owned subsidiary, Barrick Gold U.S. Inc. The Donlin Gold project is located in southwestern Alaska on private, Alaska Native-owned mineral and surface land and Alaska state mining claims. The 81,361 acre (32,926 hectare) property hosts a gold deposit currently estimated at 33.8 million ounces of proven and probable reserves averaging 2.09 grams per tonne. We believe that significant exploration potential remains in the Donlin Gold district, with prospects to increase mine life and/or justify future production expansions.
We entered into a limited liability company agreement with Barrick (“LLC Agreement”) dated December 1, 2007 that provided for the creation of Donlin Gold, which is jointly owned by us and Barrick on a 50/50 basis. Pursuant to the LLC Agreement, we agreed to reimburse Barrick out of future mine production cash flow for a portion of Barrick’s prior expenditures in the Donlin Gold project. As of November 30, 2013, the promissory note, including accrued interest, amounted to approximately $71.7 million. Funding is currently shared by both parties on a 50/50 basis.
Except for the information contained under the heading “Item 1, Recent Developments – Donlin Gold” or as otherwise stated, the scientific and technical information regarding the Donlin Gold project in this Annual Report on Form 10-K is based on the Donlin Gold FS.
Property Description and Location
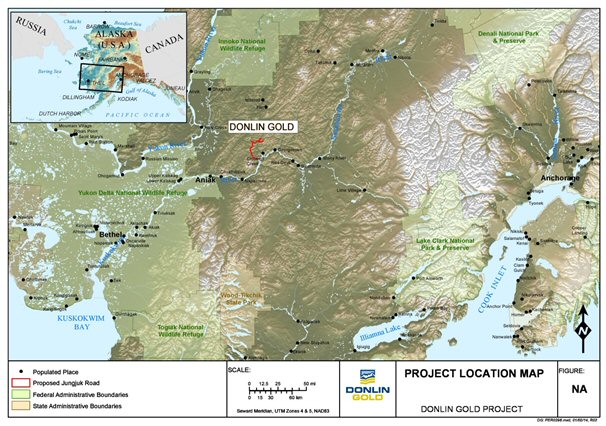
The Donlin Gold property is located in the Kuskokwim region of southwestern Alaska. The property is under lease (the “Mining Lease”) for subsurface rights from Calista Corporation (“Calista”) and surface rights (the “Surface Use Agreement”) from The Kuskokwim Corporation (TKC), two Alaska Native corporations. Calista is one of 13 regional Alaska Native corporations established as part of the Alaska Native Claims Settlement Act of 1971 (ANCSA) and under ANCSA has title to the subsurface estate in the region. TKC was formed in 1977 when the ANCSA village corporations of Lower Kalskag, Upper Kalskag, Aniak, Chuathbaluk, Napaimute, Crooked Creek, Red Devil, Georgetown, Sleetmute and Stony River, which are located along the middle region of the Kuskokwim River, merged. Under ANCSA, TKC has title to extensive surface estate in the region, including most of the project lands.
33
Other lands required for offsite infrastructure, such as the Jungjuk port site, the road to the port site and gas pipeline are categorized as Native, State of Alaska conveyed, or Bureau of Land Management (BLM) lands. Rights-of-way will be required from other Alaska Native corporations, the state of Alaska and BLM for the road and pipeline alignments that cross Native corporation, state and federal lands.
Permits
Donlin Gold has maintained all of the necessary permits for exploration, camp facilities, and related activities. These permits are active with the Alaska Department of Natural Resources (hard rock exploration, temporary water use), the U.S. Army Corps of Engineers (individual 404 and nationwide 26), U.S. Bureau of Land Management (rights-of-way), Alaska State Department of Conservation (wastewater, drinking water, food handling), the Alaska Department of Fish and Game (title 16 – fish), Federal Aviation Administration (airport), and other State, Federal and private entities. Current permits have allowed exploration and associated feasibility study supporting test work to be conducted under appropriate state and federal laws.
On August 7, 2012, we announced that Donlin Gold commenced permitting of the project by submitting a draft Plan of Operations and Section 404 of the U.S. Clean Water Act draft permit application to federal and state regulators. The Section 404 permit application initiated the environmental review process under NEPA which involves preparation of an EIS. The Corps selected URS, an independent contractor to prepare the EIS. The Notice of Intent for the EIS was published in the Federal Register on December 14, 2012 and the NEPA public scoping process was completed March 29, 2013. During the remainder of 2013, Donlin Gold worked to address the remaining data needs for the EIS. Throughout 2013, Donlin Gold also continued to provide application materials and maintained ongoing dialogue with the agencies that will issue the key permits and authorizations needed for the Donlin Gold project, including the air quality, water discharge, dam safety, wetlands, water use, fish habitat, and pipeline permits. The Corps and the NEPA contractor are working towards planned issuance of a preliminary draft EIS for agency review in late 2014.
An extensive list of additional federal and state government permits and approvals must be obtained before the Donlin Gold project can commence construction. Preparation of the applications for many of these permits and approvals requires additional, more detailed engineering that was not part of the Donlin Gold FS. Completion of this engineering will require a significant investment of funds, time, and other resources by Donlin Gold and its contractors. Also, the Donlin Gold board must approve a construction program and budget before construction of the Donlin Gold project can begin. The timing of the required engineering work, of the Donlin Gold board’s approval of a construction program and budget, as well as the receipt of all required governmental permits and approvals will determine whether and when construction of the Donlin Gold project will begin. Project delays also could occur as a result of public opposition, limitations in regulatory staff resources during regulatory review, or project changes made by Donlin Gold.
Mineral Tenure
The Mining Lease currently includes mineral rights leased from Calista, which holds the subsurface (mineral) estate for Native-owned lands in the region. The leased land is believed to contain 20,101 hectares (49,671 acres). Calista also owns the surface estate on a portion of these lands. The Surface Use Agreement with TKC, which owns the surface estate of the remaining lands, grants non-exclusive surface use rights to Donlin Gold for mining activities. All of the lands subject to the Mining Lease and Surface Use Agreement have been conveyed to Calista and TKC by the Federal Government. Donlin Gold is engaged in negotiations with TKC regarding amendments to the Surface Use Agreement.
In addition to the leased land, Donlin Gold holds 242 State of Alaska mineral claims comprising 12,853 hectares (31,760 acres) in the Kuskokwim and Mt. McKinley recording districts primarily surrounding the lands subject to the Mining Lease and Surface Use Agreement. Of the Alaska mineral claims, 3 claims are on state selected lands; 158 claims are tentatively approved for conveyance from the Federal to State government subject to official surveying. These claims have not been legally surveyed. All claims are either 16.2 hectares (40 acres) or 64.8 hectares (160 acres) in size.
Accessibility and Climate
The Donlin Gold property is located in southwestern Alaska, approximately 20 kilometers north of the village of Crooked Creek on the Kuskokwim River. The Kuskokwim River is a regional transportation route and is serviced by commercial barge lines. A 25 kilometer long winter road, designated as an Alaska State Highway route and transportation corridor, accesses the property from the barge landing at the village of Crooked Creek. The Donlin Gold project currently has an all-season, soft-sided camp with facilities to house up to 150 people. An adjacent 1,500 meter long airstrip is capable of handling aircraft as large as C-130 Hercules (42,000 pounds or 19,050 kilograms), allowing efficient shipment of personnel, some heavy equipment, and supplies. The Donlin Gold project can be reached directly by charter air facilities out of both Anchorage, 450 kilometers to the east and Aniak, 80 kilometers to the west.
34
The project area is one of low topographic relief on the western flank of the Kuskokwim Mountains. Elevations range from 150 meters to 640 meters. Ridges are well rounded and easily accessible by all-terrain vehicle. Hillsides are forested with black spruce, tamarack, alder, birch and larch. Soft muskeg and discontinuous permafrost are common in poorly drained areas at lower elevations. The area has a relatively dry interior continental climate with typically less than 50 cm (20 inches) total annual precipitation. Summer temperatures are relatively warm and may reach nearly 30°C (83°F). Minimum temperatures may fall to well below -42°C (-45°F) during the cold winter months.
The Donlin Gold project is currently isolated from power and other public infrastructure. Sufficient space is available to house the various facilities, including personnel housing, stockpiles and processing plants. Ample water supply is available from surface and subsurface sources. Power is produced by on-site generators.
Exploration History
|
Year
|
Company
|
Work Performed
|
Results
|
|
|
1909 to 1956
|
Various prospectors and placer miners
|
Gold discovered in 1909. Placer mining by hand, underground, and hydraulic methods.
|
Total placer gold production of approximately 30,000 ounces.
|
|
|
1970s to present
|
Robert Lyman and heirs
|
Resumed sluice mining in Donlin Gold area and placer mined Snow Gulch.
|
First year of mining Snow Gulch produced best results, with 800 ounces of gold recovered. Donlin Gold has obtained an agreement with the Lyman family to consolidate the land package around the proposed mine.
|
|
|
1974, 1975
|
Resource Associates of Alaska (RAA)
|
Regional mineral potential evaluation for Calista. Soil grid and three bulldozer trenches dug in Snow Gulch area.
|
Soil, rock, and vein samples have anomalous gold values. Trench rock sample results range from 2 to 20 grams per tonne gold.
|
|
|
1984 to 1987
|
Calista Corporation
|
Minor work. Geologists from various mining companies, including Cominco and Kennecott, visit the property.
|
||
|
1986
|
Lyman Resources
|
Auger drilling for placer evaluation finds abundant gray, sulfide rich clay near Quartz Gulch.
|
Assays of cuttings average over 7 grams per tonne gold. Initial discovery of Far Side (“Carolyn”) prospect.
|
|
|
1987
|
Calista Corporation
|
Rock sampling of ridge tops and auger drill sampling of Far Side prospect.
|
Anomalous gold values from auger holes: best result = 9.7 grams per tonne gold.
|
|
|
1988 to 1989
|
Western Gold Exploration and Mining Co. (WestGold)
|
Airborne geophysics, geological mapping, and soil sampling over most of the project area. Total of 13,525 meters of D9 Cat trenching at all prospects. Over 15,000 soil, rock chip, and auger samples collected. Drilling included 3,106 feet of AX core drilling, 404 meters in 239 auger holes, and 10,423 meters of RC drilling (125 holes). First metallurgical tests and petrographic work.
|
Initial work identified eight prospects with encouraging geology (Snow, Dome, Quartz, Carolyn, Queen, Upper Lewis, Lower Lewis, and Rochelieu). Drilling at most of these prospects led to identification of the Lewis areas as having the best bulk-mineable potential. Mineral resource estimate completed.
|
|
|
1993
|
Teck Exploration Ltd.
|
D-9 Cat trenching (1,400 meters) and two 500 meter soil lines in Lewis area. Petrographic, fluid inclusion, and metallurgical work.
|
Identified new mineralized areas, updated Mineral resource estimate.
|
|
|
1995 to 2000
|
Placer Dome
|
87,383 meters of core, 11,909 meters of RC drilling and 8,493 meters of trenching. Environmental monitoring and assessment.
|
Drilled the American Creek magnetic anomaly (ACMA), discovered the ACMA deposit. Numerous mineral resource estimation iterations.
|
|
|
2001 to 2002
|
NOVAGOLD
|
46,495 meters of core, 38,022 meters of RC drilling, 89.5 meters of geotechnical drilling, and 268 meters of water monitoring holes.
|
Filed a preliminary assessment report on the project. Updated resource estimate.
|
35
| Year | Company | Worked Performed | Results | |
|
2003 to 2005
|
Donlin Gold Joint Venture
|
25,448 meters of core and 5,979 meters of RC drilling. Calcium carbonate exploration drilling; IP lines for facility condemnation studies.
|
Infill drilled throughout the resource area. Discovered a calcium carbonate resource. Poor quality IP data.
|
|
|
2006
|
Donlin Gold Joint Venture
|
92,804 meters of core drilling to support mineral resource classification conversion, slope stability, metallurgy, waste rock, carbonate exploration, facilities and port road studies.
|
Geological model and mineral resource update.
|
|
|
2007
|
Donlin Gold Joint Venture
|
Core drilling totaled 75,257 meters and included resource delineation, geotechnical and engineering, and carbonate exploration. 13 RC holes for monitor wells and pit pump tests totaled 1,043 meters.
|
Improved pit slope parameters, positive hydrogeological results. Carbonate exploration was negative. Updated mineral resource estimate. Completed feasibility study with positive results.
|
|
|
2008
|
Donlin Gold LLC
|
108 core holes totaling 33,425 meters for exploration and facility related geotechnical and condemnation studies. Updated resource models. Metallurgical test work: flotation variability and CN leach. 54 test pits and 37 auger holes were also completed for overburden characterization.
|
Resource expansion indicated for East ACMA. CN leach resource potential indicated for the main resource area, Snow, and Dome prospects. Facility sites successfully condemned. Updated resource estimates utilizing applicable data through 2007.
|
|
|
2009
|
Donlin Gold LLC
|
19 geotechnical core holes totaling 950 meters in facility sites and to address hydrology.
|
||
|
2010
|
Donlin Gold LLC
|
Six geotechnical core holes totaling 2,090 meters to evaluate slope stability of expanded pit. Also drilled 90 auger holes totaling 585 meters and dug 59 test pits to further evaluate overburden conditions and gravel supplies within tailings storage facility (TSF) area.
|
Pit slope stability of new pit design remained acceptable. Construction suitability of surficial materials in TSF is evaluated.
|
|
Geology
Regional Geology
The Kuskokwim region of southwestern Alaska is predominately underlain by rocks of the Upper Cretaceous Kuskokwim Group that filled a subsided northeast-trending strike-slip basin between a series of amalgamated terranes. Intermediate composition volcano-plutonic complexes intrude and overlie Kuskokwim Group rocks throughout the region.
Local Geology
The Donlin Gold deposits lie between two regional, northeast-trending, right lateral fault systems: the Denali-Farewell fault system to the south and the Iditarod-Nixon Fork fault system to the north. Undivided Kuskokwim Group sedimentary rocks and granite porphyry complexes are the main rock units.
Property Geology
Greywacke is dominant in the northern part of the area (“northern resource area” comprising Lewis, Queen, Rochelieu, and Akivik), while shale-rich units are common in the southern part of the area (“southern resource area” comprising South Lewis and ACMA).
Gold deposits are associated with an extensive Late Cretaceous–Early Tertiary gold–arsenic–antimony–mercury hydrothermal system. Gold-bearing zones exhibit strong structural and host rock control along north–northeast-trending fracture zones and are best developed where those zones intersect relatively competent host rocks. Mineralized material is most abundant in intrusive dikes and sills, but sedimentary rocks are also mineralized within strong fracture zones.
36
Geotechnical and Hydrology
A number of geotechnical and hydrological studies have been completed in support of feasibility and environmental reports for Donlin Gold.
Rowland Engineering Consultants performed the geotechnical assessments for the engineering to support design of the port site, airstrip, plant site and interconnecting roads. BGC, Inc. performed geotechnical analyses for the design of the pit, waste rock facility, and tailings storage facility (TSF).
The site-wide hydrological model developed by BGC, is based on extensive drill data and climatic information for the area. BGC, Inc. and CEMI provided hydrologic studies, design criteria and associated test work for the water treatment plant requirements during construction, operations, and closure. Lorax Environmental performed water quality modeling for the post closure pit lake.
Exploration Potential
The mineral resource defined in the Donlin Gold FS is confined to a small portion of the property. We believe there is considerable potential to increase the mineral resources at the Donlin Gold project. Numerous other targets have been identified along the 8 kilometer mineralized gold trend, and are defined by surface sampling and various historical drill holes containing significant gold values.
Exploration potential in the vicinity of the open pit design in the Donlin Gold FS includes extensions along strike to the East ACMA, Lewis, and Crooked Creek areas. Mineralization remains open at depth under the current pit limits. Mineralization also remains open to the north of the planned pit and has been tested by shallow trenching and soil sampling, with limited drilling undertaken to date.
Exploration potential at the Donlin Gold project also exists outside the areas that have been the subject of the mine design in the Donlin Gold FS. Gold mineralization is associated with an overall north–northeasterly-trending high level dike/sill complex that has been outlined in the regional aero-magnetics as a magnetic low. The zone, approximately 8 kilometers long, and 4 kilometers wide, consists of a northern, dike-dominated area, and a southern, more sill-dominated area.
Mineralization
Southeast-dipping north-northeast-oriented fracture zones are the primary control on gold bearing vein distribution within the north-northeast mineralized corridors. Composite vein zones or mineralized corridors range up to 30 meters in width and extend for hundreds of meters along strike. Intrusive rocks and to a lesser extent competent massive greywacke are the most favored host rocks, and act as a secondary control on the mineralization. Gold distribution in the deposit closely mimics the intrusive rocks, which contain about 74% of the mineral resource identified in the Donlin Gold FS. Structural zones in competent sedimentary units account for the remaining 26%.
Gold-bearing sulfides occur in both veins and disseminated zones in mafic igneous bodies, rhyodacite dikes and sills, and sedimentary rocks. Quartz-carbonate-sulfide (pyrite, stibnite, and arsenopyrite) veins are the primary mineralized features, but gold also occurs in thin, discontinuous sulfide fracture fillings.
Minor Elements and Deleterious Materials
The most abundant minor elements associated with gold-bearing material are iron, arsenic, antimony, and sulfur. They are contained primarily in the mineral suite associated with hydrothermal deposition of gold, including pyrite, arsenopyrite, realgar, native arsenic, and stibnite. Minor hydrothermal pyrrhotite, marcasite and syngenetic or sedimentary pyrite, also account for some of the iron and sulfur.
Three elements that have particular processing significance are mercury, chlorine, and fluorine. Graphitic carbon and carbonate minerals also would negatively affect the metallurgical process.
Metallurgy
Sufficient metallurgical testwork was completed under the direction of Barrick personnel to support the Donlin Gold FS. Gold is mainly carried by arsenopyrite. Variation is observed in processing behavior between intrusive rocks and sedimentary rocks, but less so between the geographical sources.
37
Process testing generated development of the following conceptual flowsheet:
|
·
|
concentration by flotation;
|
|
·
|
high pressure oxidation in an autoclave;
|
|
·
|
carbon-in-leach (“CIL”) cyanidation of the oxidized concentrate;
|
|
·
|
carbon strip and regeneration circuits;
|
|
·
|
gold electrowinning; and
|
|
·
|
refining and production of doré bars.
|
This processing concept incorporates proven commercial unit operations.
Reserve and Resource Estimate
The mineral reserves for the Donlin Gold project were classified using criteria appropriate under the CIM Definition Standards with an effective date of July 11, 2011. The mineral reserves are summarized in the table below.
Proven and Probable Mineral Reserve Estimate
|
Reserve Category
|
Tonnes
(thousands)
|
Gold Grade
(grams/tonne)
|
Contained Gold
(thousands of ounces)
|
|||||||||
|
Proven
|
7,683 | 2.32 | 573 | |||||||||
|
Probable
|
497,128 | 2.08 | 33,276 | |||||||||
|
Proven and probable
|
504,811 | 2.09 | 33,849 | |||||||||
Notes:
|
(1)
|
Mineral reserves are contained within Measured and Indicated pit designs, and supported by a mine plan, featuring variable throughput rates, stockpiling and cut-off optimization. The pit designs and mine plan were optimized on diluted grades using the following economic and technical parameters: Metal price for gold of $975 per ounce; reference mining cost of $1.67 per tonne incremented $0.0031 per tonne per meter with depth from the 220 meter elevation (equates to an average mining cost of $2.14 per tonne), variable processing cost based on the formula 2.1874 x (S%) + 10.65 for each $ per tonne processed; general and administrative cost of $2.27 per tonne processed; stockpile rehandle costs of $0.19 per tonne processed assuming that 45% of mill feed is rehandled; variable recoveries by rock type, ranging from 86.66% in shale to 94.17% in intrusive rocks in the Akivik domain; refining and freight charges of $1.78 per ounce gold; royalty considerations of 4.5%; and variable pit slope angles, ranging from 23º to 43º. The Mineral Reserves are reported in accordance with NI 43-101, which differs from Industry Guide 7. The project is without known reserves under SEC Industry Guide 7. See Cautionary Note to U.S. Investors Regarding Estimates of Measured, Indicated and Inferred Resources and Proven and Probable Reserves, above.
|
|
(2)
|
Mineral reserves are reported using an optimized net sales return value based on the following equation: net sales return = Gold grade * Recovery * ($975 – (1.78 + ($975 – 1.78) * 0.045)) – (10.65 + 2.1874 * (S%) + 2.27 + 0.19) and reported in $ per tonne.
|
|
(3)
|
The life of mine strip ratio is 5.48. The assumed life-of-mine throughput rate is 53,500 tonnes per day.
|
|
(4)
|
Rounding as required by reporting guidelines may result in apparent summation differences between tonnes, grade and contained metal content.
|
|
(5)
|
Mineral reserves are reported on a 100% basis. NOVAGOLD and Barrick each own 50% of the Donlin Gold project. Tonnage and grade measurements are in metric units. Contained gold ounces are reported as troy ounces.
|
Mineral reserves have been estimated using a long-term gold price assumption of $975 per ounce. Mineral resources are based on a Whittle™ pit optimized for all measured, indicated, and inferred blocks assuming a gold selling price of $1,200 per ounce and are inclusive of reserves.
Mineral resources were classified using criteria appropriate under the CIM Definition Standards by application of the NSR-based cut-off grade that incorporated mining and recovery parameters, and constraint of the mineral resources to a pit shell based on commodity prices. The mineral resources have an effective date of July 11, 2011. The mineral resources are summarized in the table below.
38
Measured and Indicated Resources Estimate (inclusive of reserves)
|
Resource Category
|
Tonnes
(thousands)
|
Gold Grade
(grams/tonne)
|
Contained Gold
(thousands of ounces)
|
|||||||||
|
Measured
|
7,731 | 2.52 | 626 | |||||||||
|
Indicated
|
533,607 | 2.24 | 38,380 | |||||||||
|
Measured and indicated
|
541,337 | 2.24 | 39,007 | |||||||||
Notes:
|
(1)
|
Mineral resources that are not mineral reserves do not have demonstrated economic viability. See Cautionary Note to U.S. Investors Regarding Estimates of Measured, Indicated and Inferred Resources and Proven and Probable Reserves, above.
|
|
(2)
|
Mineral resources are inclusive of mineral reserves. Mineral resources that are not mineral reserves do not have demonstrated economic viability. See Cautionary Note to U.S. Investors Regarding Estimates of Measured, Indicated and Inferred Resources and Proven and Probable Reserves, above.
|
|
(3)
|
Mineral resources are contained within a conceptual measured, indicated and inferred optimized pit shell using the following assumptions: gold price of $1,200 per ounce; variable process cost based on 2.1874 * (sulfur grade) + 10.65; administration cost of $2.29 per tonne; refining, freight & marketing (selling costs) of $1.85 per ounce recovered; stockpile re-handle costs of $0.20 per tonne processed assuming that 45% of mill feed is re-handled; variable royalty rate, based on royalty of 4.5% * (Gold price – selling cost).
|
|
(4)
|
Mineral resources have been estimated using a constant net sales return cut-off of $0.001 per tonne milled. The net sales return cut-off was calculated using the formula: NSR = Gold grade * Recovery * ($1,200 – (1.85 + ($1,200 – 1.85) * 0.045)) – (10.65 + 2.1874 * (S%) + 2.29 + 0.20) and reported in $ per tonne.
|
|
(5)
|
Rounding as required by reporting guidelines may result in apparent summation differences between tonnes, grade and contained metal content.
|
|
(6)
|
Tonnage and grade measurements are in metric units. Contained gold ounces are reported as troy ounces. See Cautionary Note to U.S. Investors Regarding Estimates of Measured, Indicated and Inferred Resources and Proven and Probable Reserves, above.
|
Inferred Mineral Resource Estimate
|
Resource Category
|
Tonnes
(thousands)
|
Gold Grade
(grams/tonne)
|
Contained Gold
(thousands of ounces)
|
|||||||||
|
Inferred
|
92,216 | 2.02 | 5,993 | |||||||||
Notes:
|
(1)
|
Inferred resources are in addition to measured and indicated resources. Inferred resources have a great amount of uncertainty as to their existence and whether they can be mined legally or economically. It cannot be assumed that all or any part of the inferred resources will ever be upgraded to a higher category. See Cautionary Note to U.S. Investors Regarding Estimates of Measured, Indicated and Inferred Resources and Proven and Probable Reserves, above.
|
|
(2)
|
Tonnage and grade measurements are in metric units. Contained gold ounces are reported as troy ounces. See Cautionary Note to U.S. Investors Regarding Estimates of Measured, Indicated and Inferred Resources and Proven and Probable Reserves, above.
|
Feasibility Study and Updates
On December 5, 2011, we announced the results of the Donlin Gold FS which revised the previous 2009 feasibility study with updated mineral reserves and resources, capital costs and operating cost estimates. The Donlin Gold FS also utilizes natural gas as the primary power generation fuel source for the project rather than the original diesel option. Based on the Donlin Gold FS, the project is expected to be a conventional truck-and-shovel open-pit operation. The mine life is estimated to be 27 years based on a nominal processing rate of 59,000 tons (53,500 tonnes) per day. During the first five years of full operation, expected production averages 1.46 million ounces of gold annually and an average of 1.13 million ounces of gold per year over its projected 27 year mine life. The total capital cost estimate for the Donlin Gold project is approximately $6.7 billion including costs related to the natural gas pipeline and a contingency of $984 million. The project’s estimated after-tax net present value at a 5% discount rate (“NPV5%”) is $547 million using the base case gold price of $1,200 per ounce. The internal rate of return (IRR) at the same gold price is 6.0%.
39
Base Case Project Sensitivity to Gold Price
|
Gold
($ per ounce)
|
LOM Cash Flow
($ million)
|
Jan 2014 NPV
5%
($ million)
|
Jan 2014 IRR
(%)
|
|||||||||||
| $ | 700 | $ | (5,690 | ) | $ | (4,917 | ) | — | ||||||
| $ | 800 | $ | (2,838 | ) | $ | (3,637 | ) | — | ||||||
| $ | 900 | $ | (45 | ) | $ | (2,374 | ) | — | ||||||
| $ | 1,000 | $ | 2,143 | $ | (1,342 | ) | 2.3 | |||||||
| $ | 1,100 | $ | 4,191 | $ | (385 | ) | 4.3 | |||||||
| $ | 1,200 | $ | 6,197 | $ | 547 | 6.0 | ||||||||
| $ | 1,300 | $ | 8,187 | $ | 1,465 | 7.5 | ||||||||
| $ | 1,400 | $ | 10,166 | $ | 2,375 | 8.9 | ||||||||
| $ | 1,500 | $ | 11,631 | $ | 3,147 | 10.2 | ||||||||
| $ | 1,600 | $ | 13,092 | $ | 3,862 | 11.2 | ||||||||
| $ | 1,700 | $ | 14,616 | $ | 4,581 | 12.3 | ||||||||
| $ | 1,800 | $ | 16,156 | $ | 5,296 | 13.2 | ||||||||
| $ | 1,900 | $ | 17.699 | $ | 6,010 | 14.2 | ||||||||
| $ | 2,000 | $ | 19,248 | $ | 6,722 | 15.1 | ||||||||
Summary of Key Evaluation Metrics (Base Case at $1,200 per ounce gold)
|
Total tonnes mined (million)
|
3,270 | |||
|
Ore tonnes treated (million)
|
505 | |||
|
Strip ratio (waste tonnes per ore tonne)
|
5.48 | |||
|
Gold ounces recovered (million)
|
30.4 | |||
|
Gold recovery (%)
|
89.8 | % | ||
|
($ million)
|
||||
|
Gold, net revenue
|
$ | 36,445 | ||
|
Less:
|
||||
|
Mining
|
(8,200 | ) | ||
|
Processing
|
(7,808 | ) | ||
|
G&A, community, refining & land
|
(3,241 | ) | ||
|
Costs applicable to sales(1)
|
(19,249 | ) | ||
|
Initial capital
|
(6,679 | ) | ||
|
Sustaining capital
|
(1,505 | ) | ||
|
Total capital
|
(8,184 | ) | ||
|
Income taxes
|
(2,748 | ) | ||
|
Reclamation trust fund
|
(274 | ) | ||
|
Total costs
|
(30,455 | ) | ||
|
Total cash flow(2)
|
$ | 6,197 | ||
|
Payback period (years)
|
9.2 | |||
|
Operation life (years)
|
27 | |||
|
Jan 2014 NPV5%(3) ($ million)
|
$ | 547 | ||
|
Jan 2014 IRR
|
6.0 | % | ||
Notes:
|
(1)
|
Costs applicable to sales (US GAAP), excluding Depreciation and Reclamation costs.
|
|
(2)
|
Cash flow after-tax excludes sunk costs.
|
|
(3)
|
Reference dates for discounted cash flow metrics are January 1, 2014 and exclude funds expended before that date.
|
40
Operating Cost Estimates
|
$ per ounce
|
$ per tonne
milled
|
|||||||
|
Mining cost
|
$ | 270 | $ | 16.24 | ||||
|
Process cost
|
257 | 15.47 | ||||||
|
G&A, community, refining & land
|
107 | 6.42 | ||||||
| $ | 634 | $ | 38.13 | |||||
Capital Cost Estimates
|
($ million)
|
||||
|
Mining
|
$ | 345 | ||
|
Site preparation /roads
|
236 | |||
|
Process facilities
|
1,326 | |||
|
Tailings
|
120 | |||
|
Utilities (including natural gas pipeline)
|
1,302 | |||
|
Ancillary buildings
|
304 | |||
|
Off-site facilities
|
243 | |||
|
Total direct costs
|
3,876 | |||
|
Owners’ costs
|
414 | |||
|
Indirect costs
|
1,405 | |||
|
Contingency
|
984 | |||
|
Total indirect and contingency
|
2,803 | |||
|
Total project cost
|
$ | 6,679 | ||
Sustaining capital requirements are estimated at $1,505 million over the life of the mine.
Planned Mining Operations
The Donlin Gold project will be mined by a conventional truck-and-shovel operation. Initial pioneering and pit development will be undertaken to remove overburden, develop mine access roads suitable for large mining equipment, and “face-up” the initial pit into productive set-ups for the large shovel and mining equipment.
Large hydraulic shovels mining the full 12 meter benches will be the primary loading equipment in zones of waste and steeply dipping ore. The same primary shovels will be used on the 6 meter split benches, thereby avoiding the need for a mixed fleet of hydraulic shovels. Large 360 tonne capacity haul trucks will be used for transporting both ore and waste out of the pit.
Blast hole drilling in predominantly waste areas will be performed with nominal 251 millimeters diameter production drills. Ore zones will be drilled on a single 12 meter bench with 200 millimeter diameter holes or a single 6 meter bench with 140 millimeter diameter holes, depending on the size and continuity of the ore blocks outlined by grade control drilling.
Support equipment will be used for road, bench, and dump maintenance and miscellaneous projects.
Planned Process Operations
The Donlin Gold project ore will be processed by crushing and grinding, sulfide flotation concentration, autoclave pressure oxidation (POX), carbon-in-leach (CIL) cyanide leaching, electrowinning, and refining to produce doré bars on site.
Due to gold being associated with sulfide mineralization, primarily arsenopyrite and pyrite, the ore is considered refractory and requires POX pre-treatment to liberate the gold prior to CIL leaching. Sulfide flotation concentration is required prior to POX to concentrate the sulfide content to a level sufficient to fuel the POX operation.
Concentrate is recovered from the primary rougher flotation followed by regrinding of the tailings prior to secondary rougher flotation. The secondary rougher concentrate is processed through a cleaner-cleaner scavenger circuit producing a concentrate which is combined with the primary rougher concentrate for treatment by POX. The final tailings from the secondary rougher-flotation tailings is thickened, and due to their neutralizing potential, is then utilized to modify the pH of the POX discharge solution prior to being transported to the TSF.
The oxidized concentrate from the POX operation would then be cyanide leached in a conventional CIL circuit to produce a pregnant (gold-bearing) solution. Gold from the solution is adsorbed onto activated carbon, which is later stripped (gold desorbed from carbon) in an elution circuit. The pregnant solution after elution is fed through electrowinning (EW) cells, where cathodes are plated with gold-bearing materials, which are periodically removed, dried in retort, and melted in an induction furnace to produce doré bars.
41
Tailings from the CIL circuit would be treated in a cyanide detoxification process using SO2/air technology prior to being transported to the TSF.
Mercury naturally occurs in the Donlin Gold project ores and mercury abatement controls will be installed in six areas of the process facilities including POX, hot cure, EW, retort, refinery furnace, and carbon regeneration kiln. In these control systems, mercury will be collected for off-site shipment and management. Chemicals will be added to tailings to limit the potential for mercury releases from the TSF.
Proposed Production Plan and Schedule
Based on the Donlin Gold FS, the operating mine life is estimated to be 27 years with the nominal processing rate of 53,500 tonnes per day. Mine start-up was proposed to begin in 2020 based on a timeline of 3-4 years for project permitting and concurrent engineering and 3.5 to 4 years for construction. The Donlin Gold FS also assumed that project engineering would proceed in parallel with project permitting. In addition, the Donlin Gold board must approve a construction program and budget before construction of the Donlin Gold project can begin. The timing of the initiation of the required engineering work, of the Donlin Gold board’s approval of a construction program and budget, and receipt of all required governmental permits and approvals will determine whether and when construction of the Donlin Gold Project will begin.
Preproduction covers the first 15 months of the mine plan, when mining activities will focus on providing sufficient ore exposure for plant start-up. Ore mined during preproduction will be stockpiled and rehandled to the mill during operations. Average mine production increases progressively in the initial years from 350,000 to 417,000 tonnes per day. The peak rate of 437,000 tonnes per day is reached in Year 6.
Waste Rock Facility
Waste rock from open pit mining will be placed in an ex-pit waste rock facility in the American Creek Valley, east of the pit area, or in a backfill dump in the ACMA pit. The ultimate footprint of the facility covers an area of approximately 9 square kilometers. Approximately 2,232 million tonnes of waste rock and overburden will be placed in the facility, and 423 million tonnes will be placed in the ACMA pit backfill dump. Approximately 103 million tonnes of waste rock will be used for construction purposes, and 17 million tonnes of overburden will be stockpiled and used later for reclamation purposes.
The potential magnitude of flow in the American Creek drainage, as well as discharge from springs in the valley floors, warrants the construction of an engineered rock drain system below the waste rock facility, including connecting secondary rock (finger) drains in the smaller contributing drainages.
Waste rock will be characterized by its potential for acid generation and assigned reactivity categories. Non-acid-generating (NAG) rock will be placed directly in the waste rock facility, along with less reactive potentially acid-generating (PAG) rock, PAG5. Some of the more reactive PAG rock, PAG6, will be encapsulated in cells in the waste rock facility to prevent water infiltration through them. The most reactive PAG rock, PAG7, will be placed in the ACMA backfill dump beneath the ultimate pit lake water level.
Concurrent reclamation of the waste rock facility will be undertaken during operations.
Proposed Tailings Storage
The TSF in the Anaconda Creek basin will be a fully lined impoundment with cross valley dams at both the upstream (“upper dam” comprising upper north and upper south) and downstream (“main dam”) ends.
All tailings dams will be constructed of compacted rock fill using the downstream method with a composite liner on the upstream face. The tailings impoundment footprint will be lined with a linear low density polyethylene liner over a layer of broadly graded silty sand and gravel acting as low permeability bedding material and providing secondary containment. Material for construction will be sourced from the plant site and fuel farm during initial construction and from the open pit for the later raises during operations.
42
Other Dams
Water dams are required during the construction period and initial years of operation to protect the lined upstream faces of the upper north and south tailings starter dams from a significant flood event, to provide a reliable source of fresh water during operation of the process plant, and to minimize runoff to the TSF.
Current and Planned Infrastructure
Current site infrastructure comprises an all-season, soft-sided camp with facilities to house up to 150 people consisting of kitchen, living quarters, equipment shop, drill shack and other buildings required for support of year-round exploration activities.
There is sufficient area within the project area to host an open-pit mining operation, including the proposed open pit, waste rock facility, TSF and process facilities. Other planned site infrastructure comprises: access roads, airstrip, accommodation camp, plant site and fuel tank farm, primary and pebble crushers, coarse ore conveyor and coarse ore stockpile, concentrator, water treatment plants, dual-fired power plant, oxygen plant, boiler house, utility corridors and access walkways, waste and tailings storage facilities, truck shop, truck wash, workshops and vehicle repair facilities, assay laboratory, administration facilities and change rooms. Donlin Gold has secured the majority of the surface rights for the areas that may host these facilities.
In the nearby villages, Crooked Creek has approximately 140 residents and Aniak has a population of approximately 570. The workforce for the project would be sourced from the local area, from Alaskan regional centers and from other sources as required.
The project is a greenfield site. The on-site infrastructure for the project includes three main development sites in remote locations: the mine and plant site area (including the power plant), the permanent camp, and the airstrip. The plant site, power plant and fuel tank farm will be on a ridge above the proposed TSF. The layout of the plant site was designed to take maximum advantage of the natural topography. The layout also provides for efficient movement of equipment and material products around the site.
Planned Off-site Infrastructure
The off-site infrastructure for the project includes three main development sites in remote locations: the Jungjuk Port site and mine access road; the natural gas pipeline; and the Bethel port facilities. The Jungjuk Port site is situated on the Kuskokwim River near the mouth of Jungjuk Creek. A port-to-mine access road (Jungjuk Road) , approximately 44 kilometers long, will traverse varied terrain from the Jungjuk Port site to the mine site. A 4.8 kilometer long spur road will serve the project airstrip. The primary purpose of the road is to transport freight from the Jungjuk Port site to the mine mostly by conventional highway tractors and trailers. The natural gas pipeline is described under the Power heading below. The Bethel Port will be situated near the town of Bethel, a community of approximately 6,400 residents, that is the main port on the Kuskokwim River and is an administrative and transportation hub for the 56 villages in the Yukon-Kuskokwim Delta. The Port of Bethel is the northernmost medium-draft port in the United States and is served by ocean-going barges. The proposed port would serve as a trans-shipment point from ocean barges to river barges to supply the project during the summer.
Power
Natural gas will be delivered to site by an approximately 500-kilometer long 14-inch (356 millimeter) diameter pipeline to supply an on-site power generation facility. The Donlin Gold FS contemplates that the electric power for the site will be generated from a dual-fuelled, (natural gas and diesel) reciprocating engine power plant with a steam turbine utilizing waste heat recovery from the engines. The power plant consists of two equal halves, each consisting of six reciprocating engines, and a separate steam turbine. The total generation facility is nominally rated at 182 MW initially. This will increase to 215 MW after four years with the addition of two more gensets (one in each half) to allow for N+2 redundancy, thus permitting planned maintenance and predicted outages without cutting back production. Project optimization studies and detailed engineering may result in selection of a different power plant design based on capital and operating costs and operating efficiency considerations.
The natural gas pipeline is a lower-cost alternative to the previously considered barging of diesel fuel to site to generate electricity. The Donlin Gold FS operating costs are based on importing liquefied natural gas (LNG) by ship to Anchorage and total delivery costs to site which includes ship based regasification of the LNG and delivery from Anchorage to the Donlin Gold project via the pipeline.
The pipeline would commence at the west end of the Beluga Gas Field, approximately 48 kilometers northwest of Anchorage at a tie-in near Beluga located in the Matanuska-Susitna Borough and would run to the mine site. The pipeline would receive booster compression supplied by one compressor station located at approximately mile post 5. No additional compression along the pipeline route would be required. The pipeline would have capacity to transport approximately 2 million cubic meters per day of natural gas.
43
Water
Water requirements for the proposed project have been summarized in a draft Water Resources Management Plan, which is subject to review by State and Federal agencies. Water primarily will be sourced from the two drainages (American and Anaconda Creeks) within the mine footprint and pit dewatering. In some years, the water supply from these sources may not be able to meet the makeup water requirements for the plant. In these circumstances, additional water will be obtained primarily from a reservoir in Snow Gulch.
The source of water supply for the construction camp and, later, the plant site potable water systems is an array of eight deep wells south of Omega Gulch, near Crooked Creek. Water supply will be pumped to freshwater storage tanks, and will be treated prior to consumption.
Markets
The marketing plan is for the owners of Donlin Gold to take in kind their respective shares of the gold production, which they can then sell for their own benefit. Under the LLC Agreement, the manager shall give the members prompt notice in advance of the delivery date upon which their respective shares of gold production will be available.
Since there are a large number of available gold purchasers, the members should not be dependent upon the sale of gold to any one customer. Gold can be sold to various gold bullion dealers or smelters on a competitive basis at spot prices.
It is expected that selling contracts for our share of the gold production will be typical of, and consistent with, standard industry practice, and be similar to contracts for the supply of doré elsewhere in the world.
Taxation
Taxes that may be levied on the project can be summarized as follows:
|
·
|
Federal Income Tax – the greater of the U.S. Regular Tax of 35% or Alternative Minimum Tax of 20%.
|
|
·
|
Alaska State Income Tax – 9.4% of net income or Alternative Minimum Tax of 18% of Federal Alternative Minimum Tax.
|
|
·
|
Alaska State Mining License Tax – 7% of taxable mining income, less depletion. There is a 3.5-year tax holiday on the mining license tax.
|
Income tax becomes payable after deductions for capital allowances.
Financial Analysis
The total capital cost estimate for the Donlin Gold project is $6.7 billion including costs related to the natural gas pipeline and a contingency of $984 million. The project’s estimated after-tax net present value (NPV5%) is $547 million using the base case gold price of $1,200 per ounce, $4.58 billion using a gold price of $1,700 per ounce and $6.72 billion using a gold price of $2,000 per ounce. The corresponding IRR after-tax were estimated at 6.0%, 12.3% and 15.1%, respectively. The break-even gold price is $902 per ounce. In the Donlin Gold FS, the overall economic viability of the project was evaluated by both discounted and undiscounted cash flow analyses, based on the engineering studies and cost estimates discussed in this study. Assumptions in the model comprised:
|
·
|
For discounted cash flow (or NPV) purposes, the model is based from January 1, 2014. Estimates were prepared for all the individual elements of cash revenue and cash expenditures for ongoing operations.
|
|
·
|
Estimated cash flows from revenue are based on a gold price of $1,200 per ounce as provided by Donlin Gold. The pit has been optimized at a gold price of $975 per ounce, which was the guidance in effect at the time the pit optimization work was completed. At the effective date of the Donlin Gold FS, gold was trading at around $1,650 per ounce.
|
|
·
|
Gold recovery is estimated to average 89.8% over the LOM based on work and testing performed for feasibility study and feasibility study update purposes.
|
|
·
|
Doré refining and shipping charges were estimated at $1.02 per ounce based on actual refining charges for Barrick’s Goldstrike operations and a quotation for transportation and insurance costs from the Donlin Gold project site to a U.S.-based refinery. An additional 0.1% of gold produced from the mine is included in refining costs. This amount represents the refiner’s estimate of the loss of gold that will occur during the refining process.
|
|
·
|
The current hydrometallurgical process selection renders any contained silver into a greater refractory state, which provides less than 10% silver recovery through standard metal leaching. As a consequence, no silver credit was applied to the project.
|
|
·
|
Assets will be sold over the course of the mine life, when they are no longer required for project-based work, as well as at the end of the mine life. Total recovered value from these sales is estimated at approximately $23.0 million.
|
44
|
·
|
Reclamation and closure costs were estimated at $273.7 million to be funded over the construction and operating period to fund closure and post-closure activities.
|
|
·
|
Inventory is included in the financial model as cash outflows in the year before start-up of operations.
|
Current Activities
On December 14, 2012, the Notice of Intent for the EIS was published in the Federal Register by the Corps, which initiated the public scoping process. In the first quarter of 2013, public scoping meetings were held in villages and communities in Western Alaska and Anchorage to help identify the questions and concerns that should be addressed in the EIS. On March 29, 2013, the public scoping period ended and in May 2013, URS issued a draft scoping summary document for Cooperating Agency review. During the second quarter of 2013, Donlin Gold delivered the EED to the Corps that provides detailed information on the baseline studies and analyses that have been completed for the proposed project. The EED also describes the detailed project options that Donlin Gold considered in the development of the proposed project design. This is being used by URS and the Cooperating Agencies to support ongoing alternatives development for the EIS. In March 2013, URS issued a preliminary review of the available baseline data identifying the additional environmental, social, and cultural resource data to be compiled for the EIS. During the remainder of 2013, Donlin Gold worked to address the remaining data needs for the EIS. Throughout 2013, Donlin Gold also continued to provide application materials and maintained ongoing dialogue with the agencies that will issue the key permits and authorizations needed for the Donlin Gold project, including the air quality, water discharge, dam safety, wetlands, water use, fish habitat, and pipeline permits. Donlin Gold completed all required field work as planned.
Our share of funding for Donlin Gold in 2013 was $12.2 million for permitting, community engagement and development efforts. Donlin Gold has approved a 2014 work program of approximately $24 million, of which our 50% share is approximately $12 million. The 2014 work program and budget includes funds to continue to advance the permitting process through completion of the PDEIS in late 2014, and receipt of comments from the Federal and State agencies on the PDEIS in preparation for issuance of the draft EIS in 2015. In addition, Donlin Gold will continue to maintain its engagement with communities in the Yukon-Kuskokwim region.
An extensive list of additional federal and state government permits and approvals must be obtained before the Donlin Gold project can commence construction. Preparation of the applications for many of these permits and approvals requires additional, more detailed engineering that were not part of the Donlin Gold FS. Completion of this engineering will require a significant investment of funds, time, and other resources by Donlin Gold and its contractors. Also, the Donlin Gold board must approve a construction program and budget before construction of the Donlin Gold project can begin. The timing of the required engineering work, of the Donlin Gold board’s approval of a construction program and budget, as well as the receipt of all required governmental permits and approvals will determine whether and when construction of the Donlin Gold project will begin. Project delays also could occur as a result of public opposition, limitations in regulatory staff resources during regulatory review, or project changes made by Donlin Gold.
Galore Creek Project, British Columbia
Galore Creek Partnership
The Galore Creek project is a large copper-gold-silver project located in northwestern British Columbia, held by a partnership in which our wholly-owned subsidiary, NOVAGOLD Canada Inc., and Teck Metals Ltd. each own a 50% interest and is managed by GCMC. The Galore Creek property, as per the PFS, comprises 293,837 acres (118,912 hectares) and hosts a large, porphyry-related copper-gold-silver deposit. Funding is currently shared by both parties on a 50/50 basis.
On November 16, 2011, we announced that it we were evaluating opportunities to sell all or part of our 50% interest in the Galore Creek project. As of November 30, 2013, we had not received an offer for our 50% interest in the Galore Creek project.
Partnership History
On August 1, 2007, we entered into the Galore Creek Partnership Agreement with Teck (as amended on November 25, 2007 and on July 28, 2008, the “Partnership Agreement”) which formed the Galore Creek Partnership giving each of us a 50% interest in the Galore Creek project. The activities of the Galore Creek Partnership are being conducted by GCMC, an independent entity controlled equally by us and Teck, pursuant to the terms of the Partnership Agreement.
Under the Partnership Agreement, we contributed our assets in the Galore Creek project to the Galore Creek Partnership and Teck agreed to fund an initial contribution after which both partners would be equally responsible to fund the project going forward. In addition, under the terms of the Partnership Agreement, we would receive up to $50 million of preferential distributions once Galore Creek was fully operational, if partnership revenues exceeded certain established targets in the first year of commercial production.
45
On November 26, 2007, we announced that NOVAGOLD and Teck had reached the decision to suspend construction activities at the Galore Creek project. In light of these developments, we agreed with Teck to amend the terms of Teck’s earn-in obligations in connection with the Galore Creek project. Under the amended arrangements, Teck’s total earn-in was approximately C$403 million and we were to receive up to $25 million of preferential distributions once Galore Creek became fully operational, if Partnership revenues exceeded certain established targets in the first year of commercial production. Teck’s sole funding of project costs incurred after August 1, 2007 was to total C$264 million, and Teck agreed to invest an additional C$72 million in the Galore Creek Partnership to be used over the next five years, principally to reassess the project and evaluate alternative development strategies. NOVAGOLD and Teck were to fund the next C$100 million of project costs one-third and two-thirds respectively, and would fund costs proportionately thereafter.
On February 11, 2009, we agreed with Teck to further amend certain provisions of the Partnership Agreement relating to the Galore Creek project. The amendment confirmed that NOVAGOLD and Teck each continue to hold a 50% interest in the Galore Creek Partnership. Under the amended agreement, Teck agreed to fund 100% of Galore Creek project costs until the total amount contributed by Teck after November 1, 2008, together with approximately C$16 million previously contributed by Teck on optimization studies, equaled C$60 million. Teck would have a casting vote on the Galore Creek Partnership’s Management Committee with respect to the timing and nature of expenses to be solely funded by it. Following Teck’s C$60 million contribution, all further costs at the Galore Creek project would be funded by Teck and us in accordance with our respective Galore Creek Partnership interests and there would no longer be any casting vote for either party. The new funding arrangements replaced the funding arrangements agreed to by Teck and us in November 2007. Teck was the sole funding partner until June 22, 2011 when it completed its C$373 million earn-in obligation. Since that date, we have funded and will continue to fund Galore Creek project expenditures equally.
Except for the information under the headings “Galore Creek – Current Activities”, “Galore Creek – Project History, Drilling and Exploration, 2012 Program and 2013 Program” and “Galore Creek – Mineral Tenure”, or for information related to Copper Canyon or as otherwise stated or implied, the scientific and technical information regarding the Galore Creek project in this Annual Report on Form 10-K is based on the PFS.
Property Description and Location
The Galore Creek property is a large copper-gold-silver project located in northwestern British Columbia. The main Galore Creek property, which consists of the Southwest, Central, Junction and West Fork deposits, contains most of the project’s known resources. Under an option agreement originally with subsidiaries of Rio Tinto plc and Anglo American plc, the then shareholders of Stikine Copper Limited, the owner of the core mineral claims at the Galore Creek project, we could acquire 100% of such company. On June 1, 2007, we completed the exercise of our option pursuant to the Galore Creek Option Agreement to purchase 100% of Stikine Copper Limited by paying the final C$12.5 million of a C$20.3 million purchase price. Our financial earn-in requirements under the Galore Creek Option Agreement were satisfied and all of Stikine Copper’s assets were purchased by us and have been transferred to the Galore Creek Partnership.
The Partnership has a royalty agreement entitling the counterparty to a maximum annual net smelter royalty of 0.5% to 1.0%. The royalty is subject to positive future operating mine cash flow and is contingent upon reaching certain agreed financial targets.
46
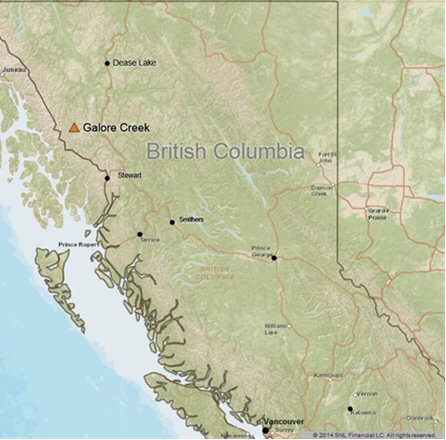
Mineral Tenure
On May 23, 2007, we announced with Teck a 50/50 partnership to develop the Galore Creek project. On August 1, 2007 the Galore Creek Partnership was established to develop the Galore Creek project and GCMC, a jointly controlled operating company, was created. In October 2007, all Galore Creek claims held by our wholly-owned subsidiary, NOVAGOLD Canada Inc., were transferred to GCMC. GCMC currently holds 151,953 hectares (375,476 acres) of British Columbia provincial mineral claims in 344 tenures (the acquisition of additional acres since the issuance of the PFS has no material impact on reserves or resources stated in the PFS). Included in this total are the five Grace claims that were acquired by GCMC from Pioneer Metals Corporation on December 3, 2007. To date, BCLS legal surveys have been recorded on five Galore Creek mineral claims (516158, 516165, 516459, 516177, 516335) and on four Bob Quinn area claims (514548, 514551, 545723, 566898). The adjoining Copper Canyon property is owned by the Copper Canyon Partnership which is owned by two wholly-owned subsidiaries of NOVAGOLD, and is comprised of 12 claims totaling 11,344 hectares (28,032 acres).
Accessibility and Climate
The Galore Creek project is located approximately 70 kilometers west of the Bob Quinn airstrip on Highway 37 and 150 kilometers northeast of the port of Stewart, and 370 kilometers northwest of the town of Smithers, British Columbia, Canada. The town of Smithers is the nearest major supply center and has an airport with regularly scheduled flights to and from Vancouver, British Columbia. The project is located in the Stikine area. The nearest point on the Stikine River to the project is the mouth of the Anuk River, about 16 kilometers west of the camp. Most personnel, supplies, and equipment are staged from the Bob Quinn airstrip, on the Stewart-Cassiar Highway (Highway 37) and transported via helicopter to the Galore Creek camp. The Bob Quinn airstrip is serviced by contract flights from Smithers and Terrace, each of which has daily flights from Vancouver. Flight time from Vancouver to Smithers/Terrace is about 90 minutes, then an additional 45 minutes to Bob Quinn. The helicopter flight from Bob Quinn to the Galore Creek camp is about 30 minutes.
The Galore Creek project is located in the humid continental climate zone of coastal British Columbia and is characterized by cold winters and short, cool, summers. Within the Galore Creek valley, mean monthly temperatures range from 8.2ºC during the winter to 12.4ºC during the summer, with January and July typically being the coolest and warmest months, respectively. In the Upper West More Valley area, monthly average temperatures range from -8.9ºC in the winter to 7.9ºC in the summer. Precipitation begins to fall as snow in early October and continues until the end of May. The average precipitation for the whole Galore Creek valley watershed was estimated to be in the order of 3,000 millimeters. June and July tend to receive the least amount of precipitation on an annual basis (typically 40 to 60 millimeters of rain per month).
47
The project lies within a regional structure known as the Stikine Arch. Medium to steep slopes characterize the local terrain in the central and northern parts of the Galore Creek property. The surrounding topography is mountainous. The elevation of the tree line is variable, but alpine vegetation predominates above 1,100 meters. The forests below that elevation consist of Balsam fir, Sitka spruce and cedar. Alpine tundra is present at higher elevations.
The Galore Creek project is currently isolated from power and other public infrastructure and is currently not accessible by road. Because of glaciers covering the surrounding mountain passes, a large cross-section tunnel is needed to provide long-term vehicular access into the Galore Creek valley and for mobilization of individual component pieces of large mining equipment needed for mining the ore body using open pit methods. The time and cost for driving a tunnel in new and unexplored underground terrain is subject to many unknowns which could change the outcome significantly. The same surface constraints that preclude building a road into the site (i.e. severe topography, snowpack, glaciers and weather) also limit the amount of borehole information, geologic mapping and other site specific data that can be obtained so that subsurface conditions can be better understood before tunneling begins. Construction of the tunnel will most likely fall on the critical path for development of the mine and thus represents a significant cost and schedule risk for development of the Galore Creek project.
Within the land controlled by GCMC, there is sufficient area to allow for the construction of all project infrastructures as contemplated in the PFS. Except for the access corridor which is covered by the special use permit, all other infrastructure, including the processing plant and tailings area in West More and the Filter Plant Area near Kilometer 8 are located within GCMC’s mineral claims. GCMC intends to file for mining leases to secure the surface rights for these areas, which are held by the Crown. GCMC considers it a reasonable expectation that surface use rights will be granted to the project. Ample water supply is available from surface and subsurface sources.
Geological Setting
The main Galore Creek deposits lie in Stikinia, an accreted terrain composed of tectonically juxtaposed Mesozoic volcano-stratigraphic successions. The eastern boundary of the Coast Plutonic Complex lies about 7 kilometers west of the claim block. A suite of multiphase syenite intrusions cuts a section of flysch-basin sedimentary strata and alkaline volcanic rocks of the middle to upper Triassic Stuhini Group. The intrusive suite, centered in the West Fork area, forms a north-northeast-trending belt 5 kilometers long and 2 kilometers wide and contains stocks, dikes and extensive sills. The presence of numerous sub-volcanic syenite sills indicates that the intrusions formed at a structurally high level. The spatial and temporal association of the chemically similar intrusive and extrusive igneous rocks indicates that the Galore Creek area is probably an eroded volcanic center. The Galore Creek intrusions commonly follow two orientations, one northwest and the other northeast. Post-intrusion and post-ore faulting follows these same orientations. Regionally, the Stuhini section shows broad open folding. The mineralized section is less deformed, so it is unclear whether the deformation occurred prior to, during, or subsequent to mineralization.
Copper Canyon, a satellite copper-gold resource located 6 kilometers east of the Central Zone, shares a number of geological and geochemical similarities with the main deposits, including the occurrence of identical dike-rock types, a similar sulfide suite and occurrence within the same host volcano-stratigraphic succession. Regional stratigraphic relationships suggest that Copper Canyon represents a different volcanic edifice that is of the same age or date of origin as the Galore Creek deposits.
Mineralization
Mineralization at the Galore Creek project occurs primarily in altered Triassic alkalic lavas, volcano-sedimentary strata and, to a lesser degree, in alkalic intrusions. Twelve copper-gold-silver mineralized zones have been identified on the property. Alteration mineral assemblages at the Galore Creek project are somewhat unique due to the near total lack of quartz in the volcanic and intrusive host rocks. In general, the center of the district shows potassic alteration, including potassium-feldspar, biotite and magnetite, with local concentrations of garnet. Copper-sulfides are most closely associated with secondary biotite and magnetite. A propylitic assemblage, including epidote, chlorite and pyrite occurs outboard of the potassic assemblage.
Most of the mineralized zones contain evenly disseminated copper-sulfide with little apparent control by stockwork or larger scale veining. The sulfide assemblage generally includes chalcopyrite, bornite and pyrite. Uncertainty exists whether the pyrite is auriferous, but strong magnetite commonly occurs within gold-enriched zones. Higher gold values occur at the northern and southern ends of the Central deposit. These higher gold values generally occur along with elevated concentrations of bornite. Locally, as in the West Fork area, massive magnetite-bornite-chalcopyrite mineralization contains bonanza grades (>20% copper with significant precious metal values).
Mineralization at Copper Canyon occurs primarily in a sub-volcanic syenite intrusive complex. This host lithology defines the primary difference from the main Galore Creek deposits. Chalcopyrite forms the primary sulfide mineralogy; bornite is rare. As at the Galore Creek project, mineralization is evenly disseminated and shows no apparent association with veining. The periphery of known mineralization contains elevated gold/copper ratios along with relatively higher concentrations of pyrite. Copper mineralization appears to occur as an annular zone around a barren fluorine-rich diatreme breccia.
48
Metallurgy
The sulfide minerals at the Galore Creek project are predominately gold- and silver-bearing chalcopyrite, bornite and pyrite. A primary grind of 80% passing 200 microns provides sufficient rougher flotation liberation to separate the copper minerals from the pyrite and gangue. At this grind, the majority of the gold is either free or associated with the copper sulfides. The proposed treatment process uses conventional flotation to produce a precious-metal-bearing copper concentrate.
Project History, Drilling and Exploration
Drilling History
Since initial discovery of the Galore Creek property in 1960 through 2013, approximately 311,181 meters were drilled in 1,212 core holes on the property. Most of this work has focused on the Central zone, with lesser amounts of work on eleven other target areas. Some zones have received only reconnaissance drilling. During the 1970s, drilling was principally confined to the Central zone but nine holes were also drilled on the North Junction zone. Average core recovery in the Central zone was between 75 and 85% with the poorest recovery at depths between 60 and 90 meters where abundant open sheet fractures were encountered. At depths below 90 meters core recovery approached 100%. In the North Junction zone recovery averaged around 60% due to shattered and sheared sections encountered both near surface and at intervals throughout the holes. In 1989–1990, Mingold, an Anglo American subsidiary, drilled holes on the Southwest zone (eight holes, 1,026 meters), the North Rim showing (six holes, 546 meters), the Saddle zone (two holes, 226 meters) and two reconnaissance holes. The 1991 drill program was mainly directed at areas peripheral to the Central zone as well as exploration holes located in the Southwest, Butte, North Rim and Dry Creek zones. Only six holes were drilled within the Central zone itself.
The first drill program directed by us began in September 2003, and consisted of eight core holes targeting four broad areas of the deposit: the North Gold zone, South Gold zone, Central Replacement zone and Southwest zone. Drilling was focused on understanding the zonation and gold variability of the deposit. This program was responsible for the discovery of new mineralization, known as the Bountiful zone, found at depth below the South Gold Lens.
2006 Program
The 2006 drill program focused primarily on further definition of the deep Bountiful mineralization discovered in 2003, further resource definition along the western margin of the Central deposit and completion of condemnation drilling on the Grace claims in the planned tailings disposal site. The program drilled in excess of 36,200 meters in 67 drill holes and encountered significant new mineralization in Bountiful, in the high-wall of the Central deposit and down dip in the West Fork deposit. Additional geotechnical drilling in support of mine development was also completed.
Wide-spaced drilling in Bountiful defined a sub-horizontal zone occurring at roughly 300 meters depth and extending nearly 1,000 meters in the north-south direction and 700 meters in the east-west direction. Drilling indicates that typical widths in Bountiful are greater than 200 meters on average and up to 500 meters in a few exceptional intervals. Drilling at depth in the high-wall of the Central zone extended mineralization from the North Gold lens approximately 250 meters to the west. Additional drilling in the Dendritic Creek area about 750 meters south of the North Gold lens shows limited mineralization to the west and likely the limited loss of some previously inferred mineralization. Drilling down dip along the north-dipping West Fork deposit continued to expand mineralization to depth and toward the Bountiful and Southwest deposits.
2007 Program
The 2007 drilling program at the Galore Creek project completed 15,000 meters of follow-up and exploration drilling. Targets concentrated on optimization of the mine schedule by targeting shallow moderate-grade resources that could displace low-grade stockpile material in years seven to nine of operations. Additional exploration focused on scoping potentially high-grade underground scenarios that could increase the value of the project.
Drilling was carried out at three primary locations: Copper Canyon, the Grace Claims and the Lower Butte zone. Drilling at the Lower Butte zone suggests potential for resource additions. At the Copper Canyon deposit, drilling focused on testing up-slope historical soil anomalies, testing higher-grade targets discovered in 2006 and expanding on depth and lateral extensions of the current resource. As a result of the drilling at Copper Canyon, NOVAGOLD earned a 60% interest in the neighbouring project. Significant additional drilling was completed to test the geotechnical characteristics of planned pit slopes, waste and tailings storage and water diversion facilities.
49
2008 Program
The 2008 diamond drilling program at the Galore Creek project was carried out between June 25, 2008 and September 17, 2008. The program consisted of nine diamond drill holes totaling 2,050 meters. The main objectives of the program were to obtain important acid base accounting (ABA) data in the Central, Southwest, North Junction and Junction pits, to confirm legacy grades in the Junction pit, and to collect metallurgical data in the Central pit for engineering design. Seven drill holes totaling 1,297 meters targeted gaps in the ABA model, specifically along the pit boundaries of the Central (South Gold Lens), Southwest and North Junction pits and within the core of the Junction pit. Two drill holes totaling 752 meters were drilled for the purpose of collecting metallurgical data in the chalcopyrite-rich Central Replacement zone and the chalcopyrite-bornite-rich North Gold Lens.
2009 Program
There was no exploration program during 2009.
2010 Program
There were 9 drill holes, totaling 2,803 meters drilled into the Central zone during 2010 for resource infill and metallurgical testing purposes.
2011 Program
The 2011 drilling program included 10,000 meters of resource infill drilling to confirm previous results as well as to test the potential for upgrading and possible extensions of mineralization within the South Gold Lens and Bountiful areas of the Central pit.
2012 Program
The 2012 drilling program totaled 27,900 meters of resource infill and exploration drilling. The objective of the infill drilling was to increase resources and upgrade material in all categories. The exploration drilling resulted in the discovery of the Legacy zone adjacent to the Central reserve pit.
2013 Program
The 2013 drilling program totalled 11,649 meters of resource in-fill and exploration drilling, 9,157-meters of which targeted the Legacy zone. An additional 2,492 meters of exploration drilling was conducted to better understand geological features that could influence the mineralization in Legacy, identify mineralization trends, and explore possible extensions of known mineralized zones adjacent to Legacy. Sufficient drilling was carried out in 2012 and 2013 to support preparation of a new resource estimate. The 2013 program also demonstrated that the copper mineralization may extend beyond the initial Legacy discovery in the direction of the Bountiful mineralization. The mineralization remains open to the south, west, and at depth.
The Galore Creek project is host to seven under-explored copper-gold-silver prospects, five defined mineral resource areas, and numerous showings and conceptual target areas.
Sampling and Assaying
Historically from 1963 to 1991, drill core in mineralized zones was generally sampled in 3-meter intervals. The samples were tagged then split in half using a mechanical splitter. One half of the core was returned to the core box and the other half shipped to an outside laboratory for analysis. The core returned to the boxes remains on site as a record of the hole. Much of the core from the Central Zone was re-assayed as part of the 1991 exploration program. No site-specific standards, blanks or field duplicate samples were used in any of the previous exploration programs.
Sampling and assaying procedures used by us have been overseen by qualified professional geologists. All drill core from the 2003 through 2010 programs, except intervals of overburden and till material, were sampled. Drill core sampling occurred within a minimum of 1-meter and a maximum of 3-meter intervals. The core was cut in half using a diamond saw. Half of the core was taken as a sample and submitted to ALS Chemex Labs in Vancouver, British Columbia. The core that was returned to the box remains on site as a record of the hole. In addition to the core, control samples were inserted into the shipments at the approximate rate of one standard, one blank and one duplicate per 20 core samples. The placement of all control samples was essentially random within the 20-sample batch.
Assay analysis for the 2003 through 2007 programs was carried out by ALS Chemex Labs of Vancouver, British Columbia. Samples were logged into a tracking system on arrival at ALS Chemex, and weighed. Samples were then crushed, dried, and a 250 g split pulverized to greater than 85% passing 75 microns. Gold assays were determined using fire analysis followed by an AAS finish. The lower detection limit was 0.005 ppm Au; the upper limit was 1,000 ppm Au. An additional 34-element suite was assayed by ICP_AES methodology, following nitric acid aqua regia digestion. The copper analyses were completed by atomic absorption, following a triple acid digest. Sampling and assaying during the drilling from 2007 through 2013 used the same protocols as described above.
50
Construction
On June 5, 2007, we announced that we had received the necessary federal and provincial authorizations and permits to allow our Directors to approve the start of construction at the Galore Creek project. The Directors’ approval for construction activities was contingent on receiving full provincial and federal authorization for the project. Federal authorization was posted to the Canadian Environmental Assessment Registry on June 4, 2007.
On July 31, 2007, the provincial government announced the issuance of a Mines Act permit for the Galore Creek project for construction of the access tunnel. An interim permit issued on July 4, 2007 authorized limited blasting to prepare and stabilize the rock face of the tunnel, as well as preparatory work for the sediment ponds. Receipt of the new permit authorized completion of the access road and tunnel and authorized the start of earthworks in the Galore Creek valley.
Construction Suspension
On November 26, 2007, we announced that NOVAGOLD and Teck had reached the decision to suspend construction activities at the Galore Creek project. A review and completion of the first season of construction indicated substantially higher capital costs and a longer construction schedule for the project. This, combined with reduced operating margins as a result of the stronger Canadian dollar, would make the project, as conceived and permitted, uneconomic at what was considered then to be industry consensus long-term metal prices. NOVAGOLD and Teck continue to view the Galore Creek project as a substantial resource and are working to identify an alternative development strategy that may allow for the resumption of construction.
Prior to the suspension of construction, substantial work was completed at the Galore Creek project, including clearing 80% of the 135-kilometer road right-of-way, completing 66 kilometers of pioneer road, installing a number of key bridges and initiating work on the road access tunnel into the Galore Creek valley. During the construction suspension and optimization period, the partners have maintained and intend to continue to maintain the existing infrastructure.
While permits granted for the original project design remain in place, any alternative project design will require new or additional permits before construction can resume.
Pre-Feasibility Study
During 2010, GCMC had reviewed a number of optimization scenarios for the Galore Creek project with the objective of expanding throughput, relocating the project facilities to allow for easier construction and future expansion, and reducing the risks associated with construction and operations. Based on these studies, GCMC identified a preferred project design and commenced work on the PFS.
Primary changes to the project included:
|
·
|
Relocation of the tailings facility allowing for construction of a conventional tailings dam;
|
|
·
|
Relocation of the processing facilities allowing for future expansion;
|
|
·
|
Realignment of the tunnel and access road; and
|
|
·
|
Increase of daily throughput to approximately 90,000 tonnes per day.
|
Project plans envision the ore being crushed in the Galore Creek valley and then conveyed through the tunnel and along the access road to the processing plant. From there, concentrate would be piped along the remainder of the access road to Hwy 37. A trade off study will identify the best alternative for transport of concentrate to market. The project would primarily use electric power, with a power line built along the access road to tie into the 287-kV transmission line, that the British Columbia and Canadian governments have announced their intention to build. Some components of the revised Galore Creek mine plan, such as the mill and tailings location, would require new permits or amendments to existing permits. The majority of permits required for road construction remain in good standing. GCMC could continue with road and bridge work as the project moves through the feasibility stage, with the objective of shortening the construction timeline and reducing the need for helicopter support.
On July 27, 2011, we announced the results of the PFS for the Galore Creek project. The PFS estimates the Galore Creek project has proven and probable mineral reserves of 528 million tonnes grading 0.59% copper, 0.32 grams per tonne gold and 6.02 grams per tonne silver for estimated contained metal of 6.8 billion pounds of copper, 5.45 million ounces of gold and 102.1 million ounces of silver. In addition, the Galore Creek project has estimated measured and indicated mineral resources (exclusive of mineral reserves) of 286.7 million tonnes grading 0.33% copper, 0.27 grams per tonne gold and 3.64 grams/tonne silver for estimated contained metal of 2.07 billion pounds of copper, 2.53 million ounces of gold and 33.54 million ounces of silver, and estimated inferred mineral resources of 346.6 million tonnes grading 0.42% copper, 0.24 grams per tonne gold and 4.28 grams per tonne silver for estimated contained metal of 3.23 billion pounds of copper, 2.70 million ounces of gold and 47.73 million ounces of silver. Mineral resources that are not mineral reserves do not have demonstrated economic viability. The PFS total capital cost estimate for the Galore Creek project was C$5.2 billion dollars. Capital costs are estimated with an accuracy range of +25% / -20% (including contingency). The project’s estimated net present value (NPV7%), using the PFS base case metal price assumptions set forth below, was assessed at C$837 million and C$137 million on a pre-tax and post-tax basis, respectively. The corresponding post-tax IRR of the project was estimated at 7.4%. Base case metal prices used in the PFS were $2.65 per pound copper, $1,100 per ounce gold and $18.50 per ounce silver with a foreign exchange rate of $0.91 = C$1.00.
51
Mining of the Galore Creek deposit is planned as a conventional truck-shovel open-pit mining operation with a nominal 95,000 tonne-per-day throughput. Life of mine throughput average is approximately 84,000 tonnes per day due to the milling circuit constraining throughput as harder rock is encountered deeper in the open pits. The current 528 million tonne mineral reserve estimate is expected to support a mine life of approximately 18 years. Using a conventional grinding and flotation circuit, the project would produce a high-quality copper concentrate with significant gold and silver credits.
Reserve and Resource Estimate
The proven and probable mineral reserve estimate for the Galore Creek project totals 528.0 million tonnes grading 0.59% copper, 0.32 grams per tonne gold and 6.02 grams per tonne silver for a total estimated metal content of 6.8 billion pounds of copper, 5.45 million ounces of gold and 102.1 million ounces of silver at an NSR cut-off grade of $10.08 per tonne.
Proven and Probable Mineral Reserve Estimate
|
Tonnes
|
Diluted Grade
|
Contained
Cu
|
Contained
Au
|
Contained
Ag
|
|||
|
(million tonnes)
|
Cu
(%)
|
Au
(g/t)
|
Ag
(g/t)
|
(billion pounds)
|
(million ounces)
|
(million ounces)
|
|
|
Proven
|
69.0
|
0.61
|
0.52
|
4.94
|
0.9
|
1.15
|
11.0
|
|
Probable
|
459.1
|
0.58
|
0.29
|
6.18
|
5.9
|
4.30
|
91.2
|
|
Proven and probable
|
528.0
|
0.59
|
0.32
|
6.02
|
6.8
|
5.45
|
102.1
|
Effective Date July 11, 2011, Jay Melnyk, P.Eng.
Notes:
|
(1)
|
Mineral reserves are contained within measured and indicated pit designs, and supported by a mine plan, featuring variable throughput rates, stockpiling and cut-off optimization. The pit designs and mine plan were optimized on diluted grades using the following economic and technical parameters: Metal prices for copper, gold and silver of $2.50per pound, $1,050 per ounce, and $16.85 per ounce, respectively. Mining and ore based costs (process, G&A and mine general) of C$1.60 per tonne mined and C$10.08 per tonne milled respectively; an exchange rate of $0.91 to C$1.00; variable recovery versus head grade relationships for both oxidized and non-oxidized material; appropriate smelting, refining and transportation costs; and inter ramp pit slope angles varying from 42º to 55º. The mineral reserves are reported in accordance with NI 43-101, which differs from SEC Industry Guide 7. The project is without known reserves as defined under SEC Industry Guide 7. See Cautionary Note to U.S. Investors Regarding Estimates of Measured, Indicated and Inferred Resources and Proven and Probable Reserves, above.
|
|
(2)
|
Mineral reserves are reported using a ‘cash flow grade’ ($NSR/SAG mill hour) cut-off which was varied from year to year in the scheduling process to optimize NPV. The cash flow grade is a function of the NSR ($ per tonne) and SAG mill throughput (tonnes per hour). The net smelter return (NSR) was calculated as follows: NSR = Recoverable Revenue – TCRC (on a per tonne basis), where: NSR = Net Smelter Return; TCRC = Transportation and Refining Costs; Recoverable Revenue = Revenue in Canadian dollars for recoverable copper, recoverable gold, and recoverable silver using the economic and technical parameters mentioned above. SAG throughputs were modeled by correlation with alteration types.
|
|
(3)
|
The life of mine strip ratio is 2.16.
|
52
|
(4)
|
Rounding as required by reporting guidelines may result in apparent summation differences between tonnes, grade and contained metal content.
|
|
(5)
|
Tonnage and grade measurements are in metric units. Contained gold and silver ounces are reported as troy ounces, contained copper pounds as imperial pounds. See Cautionary Note to U.S. Investors Regarding Estimates of Measured, Indicated and Inferred Resources and Proven and Probable Reserves, above.
|
Resource Estimate
The measured and indicated mineral resource for the Galore Creek project (exclusive of mineral reserves) is estimated to total 286.7 million tonnes grading 0.33% copper, 0.27 grams per tonne gold and 3.64 grams per tonne silver for a total estimated metal content of 2,070 million pounds of copper, 2.53 million ounces of gold and 33.54 million ounces of silver at an NSR cut-off grade of C$10.08 per tonne.
The updated inferred mineral resource, excluding our 40% interest in the Copper Canyon project, is estimated to total 346.6 million tonnes grading 0.42% copper, 0.24 grams per tonne gold and 4.28 grams per tonne silver for a total estimated metal content of 3,230 million pounds of copper, 2.7 million ounces of gold and 47.7 million ounces of silver at an NSR cut-off grade of C$10.08 per tonne.
Measured and Indicated Resources Estimate (exclusive of reserves)
|
Tonnes
(million tonnes)
|
Cu Grade
(%)
|
Au Grade
(g/t)
|
Ag Grade
(g/t)
|
Contained Cu
(billion pounds)
|
Contained Au
(million ounces)
|
Contained Ag
(million ounces)
|
|
|
Measured
|
39.5
|
0.25
|
0.39
|
2.58
|
0.22
|
0.50
|
3.27
|
|
Indicated
|
247.2
|
0.34
|
0.26
|
3.81
|
1.85
|
2.04
|
30.26
|
|
Measured and indicated
|
286.7
|
0.33
|
0.27
|
3.64
|
2.07
|
2.53
|
33.54
|
Effective Date July 11, 2011, G. Kulla, P.Geo.
Notes:
|
(1)
|
Mineral resources are exclusive of Mineral reserves. Mineral resources that are not Mineral reserves do not have demonstrated economic viability. See Cautionary Note to U.S. Investors Regarding Estimates of Measured, Indicated and Inferred Resources and Proven and Probable Reserves, above.
|
|
(2)
|
Mineral resources are contained within a conceptual measured, indicated and inferred optimized pit shell using the same economic and technical parameters as used for Mineral reserves. Tonnages are assigned based on proportion of the block below topography. The overburden/bedrock boundary has been assigned on a whole block basis. Commodity prices used to constrain the Mineral Resources are $2.50 per pound copper, $1,050 per ounce gold, and $16.85 per ounce silver.
|
|
(3)
|
Mineral resources have been estimated using a constant NSR cut-off of $10.08 per tonne milled. The Net Smelter Return (NSR) was calculated as follows: NSR = Recoverable Revenue – TCRC (on a per tonne basis), where: NSR = Diluted Net Smelter Return; TCRC = Transportation and Refining Costs; Recoverable Revenue = Revenue in Canadian dollars for recoverable copper, recoverable gold, and recoverable silver using silver using the economic and technical parameters used for mineral reserves.
|
|
(4)
|
Rounding as required by reporting guidelines may result in apparent summation differences between tonnes, grade and contained metal content.
|
|
(5)
|
Tonnage and grade measurements are in metric units. Contained gold and silver ounces are reported as troy ounces, contained copper pounds as imperial pounds.
|
53
Inferred Mineral Resource Estimate
|
Tonnes
(million tonnes)
|
Cu Grade
(%)
|
Au Grade
(g/t)
|
Ag Grade
(g/t)
|
Contained Cu
(billion pounds)
|
Contained Au
(million ounces)
|
Contained Ag
(million ounces)
|
|
|
Inferred
|
346.6
|
0.42
|
0.24
|
4.28
|
3.23
|
2.70
|
47.73
|
|
(1)
|
Inferred resources are in addition to measured and indicated resources. Inferred resources have a great amount of uncertainty as to their existence and whether they can be mined legally or economically. It cannot be assumed that all or any part of the inferred resources will ever be upgraded to a higher category. See Cautionary Note to U.S. Investors Regarding Estimates of Measured, Indicated and Inferred Resources and Proven and Probable Reserves, above.
|
|
(2)
|
Tonnage and grade measurements are in metric units. Contained gold and silver ounces are reported as troy ounces, contained copper pounds as imperial pounds.
|
A rigorous quality control and quality assurance protocol has been used on the project, including blank and reference samples with each batch of assays. All our drill samples were analyzed by fire assay and ICP at ALS Chemex Labs in Vancouver, British Columbia, Canada.
Environmental Assessment and Permitting
The Galore Creek environmental assessment process was initiated in February 2004. As part of the environmental assessment process, a series of public meetings was held in various communities in the Galore Creek region, with the public and regulator comment periods running from July 10, 2006 to September 8, 2006 and September 22, 2006, respectively. The Tahltan Central Council, which was actively engaged in the entire assessment process, submitted their comments to the British Columbia Environmental Assessment Office (BCEAO) on October 18, 2006, including a letter of support from the Chair of the Tahltan Central Council. The permitting process for the Galore Creek project progressed as expected resulting in the receipt of the Provincial Environmental Assessment Certificate in February 2007. Federal authorizations were received during the second quarter of 2007.
Although construction at the Galore Creek project was suspended in late 2007, the Canadian Federal and Provincial authorizations to proceed remain in good standing as do a majority of the key permits required to continue construction. Specifically, since the Province has determined substantial construction of the project was initiated, the previous environmental assessment certificate remains valid without a time limit.
The PFS project design and configuration is different from the design that was permitted under the original environmental assessment certificate and that received Federal approval. Some of the most significant changes are:
|
·
|
Better understanding of geochemistry, resulting in a different approach to waste rock and tailings management;
|
|
·
|
Simplified waste and water management strategy in the Galore Creek valley plant site and tailings relocated outside of the Galore Creek valley, in a new previously unaffected watershed (West More);
|
|
·
|
Deletion of a 30 kilometer section of access road down the Sphaler Valley to Porcupine and the Scott Simpson Valley, significantly reducing potential environmental impacts and geohazards;
|
|
·
|
Deletion of the airstrip that was to be constructed in the Porcupine Valley; and
|
|
·
|
Addition of new load-out facilities at the Port of Stewart.
|
While the PFS configuration is considered an improvement, with reduced overall environmental impacts, it is anticipated that a new environmental assessment process will be requested by the regulators to approve the changes. This will involve parallel and harmonized reviews by both the BCEAO and the Canadian Environmental Assessment Agency (CEAA). A comprehensive study report will be required through CEAA. It is anticipated that the entire environmental assessment review process would require approximately two years from submission of a project description to issuance of a new Environmental Assessment Certificate (by the provincial government) and a decision by the federal Minister of Environment.
The existing Special Use Permit (SUP) for construction of the access road remains valid as long as there are no proposed changes to the SUP, thereby permitting GCMC to resume construction of the access road without further permitting. Changes to the current SUP will ultimately be required around the tailings storage facility, plus a branch to the south portal of the tunnel to the Galore Creek valley. An amendment to make these changes will be applied for once the environmental assessment process has been completed.
54
Existing permits associated with the existing construction camps, including water use and waste discharge, will continue to be maintained. All other project permits will have to be applied for following completion of the environmental assessment process, although the time-critical permits, such as those needed for starting the tunneling can be prepared concurrent with the environmental assessment such that there should be little lag time following new environmental assessment certification before tunneling could begin.
Current Activities
The 2011 resource infill drilling program confirmed previous drill results produced by GCMC as well as the potential for substantial extension of mineralization beyond the limits of the reserve pits provided for in the PFS. Activities in 2012 included 27,000 meters of resource infill and exploration drilling as well as geotechnical, hydrogeological and overburden drilling to support future mine planning and engineering. The objective of the infill drilling was to increase resources and upgrade material in all categories. The exploration drilling resulted in the discovery of the Legacy zone adjacent to the Central reserve pit. Activities in 2013 included 11,600 meters of resource infill and exploration drilling. The 2013 program increased the drill density to a level required to support an inferred resource classification of the Legacy zone.
Our share of funding for the Galore Creek project in 2013 was $6.6 million, primarily for exploration drilling, environmental monitoring, administrative expenses and site care and maintenance costs. We jointly approved with Teck a 2014 work program of approximately $5 million, of which our 50% share is approximately $2.5 million. We agreed with Teck to incorporate the 2012 and 2013 results into a capital efficient work plan in 2014 that will advance the Galore Creek project toward a next-level mine planning and design. As such, the 2014 work plan includes technical studies in the areas of environmental and water management, as well as site layout. Although the Legacy zone is still open to the south, west and at depth, no drill program is planned for 2014. We will continue to evaluate opportunities to monetize the value of the asset.
Copper Canyon Acquisition
On May 20, 2011, we completed the acquisition of Copper Canyon Resources Ltd. (“Copper Canyon”) a junior exploration company whose principal asset was its 40% joint venture interest in the Copper Canyon copper-gold-silver property that is adjacent to the Galore Creek project. A wholly-owned subsidiary of NOVAGOLD held the remaining 60% joint venture interest in the Copper Canyon property which it agreed to transfer to the Galore Creek Partnership. Under the acquisition arrangement, we acquired all of the issued and outstanding common shares of Copper Canyon which we did not already hold. As a result, Copper Canyon became a wholly-owned subsidiary of us. We issued a total of 4,171,303 common shares under the arrangement, representing approximately 1.7% of the number of our common shares then outstanding and paid cash of C$2.6 million.
The Copper Canyon property is subject to a 2% NSR royalty which may be reduced to 0.5% by the payment of C$2.0 million to the royalty holder.
55
Periodically, we are a party to or otherwise involved in legal proceedings arising in the normal course of business. Management does not believe that there is any pending or threatened proceeding against the Company which, if determined adversely, would have a material adverse effect on our financial position, liquidity or results of operations. There are no material proceedings pursuant to which any of our directors, officers or affiliates or any owner of record or beneficial owner of more than 5% of our securities or any associate of any such director, officer or security holder is a party adverse to us or has a material interest adverse to us.
Pursuant to Section 1503(a) of the Dodd-Frank Act, issuers that are operators, or that have a subsidiary that is an operator, of a coal or other mine in the United States are required to disclose specified information about mine health and safety in their periodic reports. These reporting requirements are based on the safety and health requirements applicable to mines under the Federal Mine Safety and Health Act of 1977 (the “Mine Act”) which is administered by the U.S. Department of Labor’s Mine Safety and Health Administration (MSHA). During the fiscal year ended November 30, 2013, the Company and its subsidiaries were not subject to regulation by MSHA under the Mine Act and thus no disclosure is required under Section 1503(a) of the Dodd-Frank Act. Donlin Gold is the operator of the Donlin Gold project and GCMC is the operator of the Galore Creek project. Neither Donlin Gold nor GCMC is a “subsidiary” of the Company for purposes of Section 1503(a) of the Dodd-Frank Act because the Company does not control either of Donlin Gold or GCMC.
56
Market Information
Our common shares trade on the NYSE-MKT and on the Toronto Stock Exchange (TSX) under the symbol “NG.” On February 6, 2014, there were 686 holders of record of our shares, which does not include shareholders for which shares are held in nominee or street name. We believe that more than half of our common shares are beneficially owned by investors in the United States. The following table sets out the market price range and trading volumes of our common shares on the NYSE-MKT and TSX for the periods indicated.
|
NYSE-MKT
|
TSX
|
||||||||||||||
|
Year
|
Quarter
|
High
|
Low
|
High
|
Low
|
||||||||||
|
2013
|
First
|
$ | 5.03 | $ | 3.92 | $ | C4.95 | $ | C4.02 | ||||||
|
Second
|
4.14 | 2.12 | $ | 4.24 | $ | 2.18 | |||||||||
|
Third
|
3.46 | 1.90 | $ | 3.63 | $ | 1.99 | |||||||||
|
Fourth
|
2.85 | 2.04 | $ | 3.00 | $ | 2.12 | |||||||||
|
2012
|
First
|
11.57 | 7.77 | $ | 11.72 | $ | 7.96 | ||||||||
|
Second
|
8.43 | 4.98 | $ | 8.30 | $ | 5.00 | |||||||||
|
Third
|
6.72 | 3.61 | $ | 6.98 | $ | 3.66 | |||||||||
|
Fourth
|
6.30 | 3.98 | $ | 6.14 | $ | 4.00 | |||||||||
Dividends
We have never declared or paid dividends on our common shares and our current business plan requires that, for the foreseeable future, any future earnings be reinvested to finance growth and development of our business. We will pay dividends on our common shares only if and when declared by our board of directors. In determining whether to declare dividends, the board will consider our financial condition, results of operations, working capital requirements, future prospects, and other factors it considers relevant.
Certain Canadian Federal Income Tax Considerations for U.S. Residents
The following summarizes certain Canadian federal income tax consequences generally applicable under the Income Tax Act (Canada) and the regulations enacted thereunder (collectively, the “Canadian Tax Act”) and the Canada-United States Income Tax Convention (1980) (the “Convention”) to the holding and disposition of common shares.
This comment is restricted to holders of common shares each of whom, at all material times for the purposes of the Canadian Tax Act and the Convention, (i) is resident solely in the United States, (ii) is entitled to the benefits of the Convention, (iii) holds all common shares as capital property, (iii) holds no common shares that are “taxable Canadian property” (as defined in the Canadian Tax Act) of the holder, (iv) deals at arm’s length with and is not affiliated with NOVAGOLD, (v) does not and is not deemed to use or hold any common shares in a business carried on in Canada, and (vi) is not an insurer that carries on business in Canada and elsewhere (each such holder, a “U.S. Resident Holder”).
Certain U.S.-resident entities that are fiscally transparent for United States federal income tax purposes (including limited liability companies) may not in all circumstances be regarded by the Canada Revenue Agency (CRA) as entitled to the benefits of the Convention. Members of or holders of an interest in such an entity that holds common shares should consult their own tax advisers regarding the extent, if any, to which the CRA will extend the benefits of the Convention to the entity in respect of its common shares.
Generally, a U.S. Resident Holder’s common shares will be considered to be capital property of a U.S. Resident Holder provided that the U.S. Resident Holder acquired the common shares as a long-term investment; is not a trader or dealer in securities; did not acquire, hold or dispose of the common shares in one or more transactions considered to be an adventure or concern in the nature of trade (i.e. speculation); and does not hold the common shares as inventory in the course of carrying on a business.
Disposition of common shares
This summary is based on the current provisions of the Canadian Tax Act and the Convention in effect on the date hereof, all specific proposals to amend the Canadian Tax Act and Convention publicly announced by or on behalf of the Minister of Finance (Canada) on or before the date hereof, and the current published administrative and assessing policies of the CRA. It is assumed that all such amendments will be enacted as currently proposed, and that there will be no other material change to any applicable law or administrative or assessing practice, whether by judicial, legislative, governmental or administrative decision or action, although no assurance can be given in these respects. Except as otherwise expressly provided, this summary does not take into account any provincial, territorial or foreign tax considerations, which may differ materially from those set out herein.
57
Generally, a U.S. Resident Holder’s common shares will not constitute “taxable Canadian property” of the U.S. Resident Holder at a particular time at which the common shares are listed on a “designated stock exchange” (which currently includes the TSX and NYSE-MKT) unless both of the following conditions are true:
|
(i)
|
the U.S. Resident Holder, any one or more persons with whom the U.S. Resident Holder does not deal at arm’s length owned, or partnership in which the holder or persons with whom the taxpayer did not deal at arm’s length holds a membership interest directly or indirectly through one or more partnerships, alone or in any combination, 25% or more of the issued shares of any class of the capital stock of NOVAGOLD at any time in the 60 months preceding the particular time; and
|
|
(ii)
|
more than 50% of the fair market value of the common shares was derived directly or indirectly from, or from any combination of, real or immovable property situated in Canada, “Canadian resource properties” (as defined in the Canadian Tax Act), “timber resource properties” (as so defined), or options or interests therein, at any time in the 60 months preceding the particular time.
|
Dividends on common shares
Under the Canadian Tax Act, dividends on shares paid or credited to a non-resident of Canada will be subject to Canadian withholding tax at the rate of 25% of the gross amount of the dividends. Under the Convention, a U.S. resident will generally be subject to Canadian withholding tax at the rate of 15% of the gross amount of such dividends.
Certain United States Federal Income Tax Considerations for U.S. Residents
There may be material tax consequences to U.S. Residents in relation to an acquisition or disposition of common shares or other securities of the Company. U.S. Residents should consult their own legal, accounting and tax advisors regarding such tax consequences under United States, state, local or foreign tax law regarding the acquisition or disposition of our common shares or other securities, in particular, the tax consequences of the Company being a “passive foreign investment company” (commonly known as a “PFIC”) within the meaning of Section 1297 of the United States Internal Revenue Code. For further information, see section Item 1A, Risk Factors - Acquiring, holding or disposing of NOVAGOLD’s securities may have tax consequences under the laws of Canada and the United States that are not disclosed in this Annual Report on Form 10-K and, in particular, potential investors should be aware that NOVAGOLD may be a “passive foreign investment company” under the U.S. Internal Revenue Code and if it is or becomes a passive foreign investment company, there may be tax consequences for investors in the United States.
Unregistered Sales of Equity Securities
None.
Repurchase of Securities
None.
58
The selected financial data set forth in the table below should be read in conjunction with our audited consolidated financial statements and the notes thereto. The consolidated financial statements have been prepared in accordance with U.S. generally accepted accounting principles (US GAAP). Prior to 2013, our consolidated financial statements were prepared in accordance with International Financial Reporting Standards (IFRS) or Canadian generally accepted accounting principles (“Canadian GAAP”) and presented in Canadian dollars. All prior periods presented below have been restated from IFRS and Canadian GAAP to US GAAP and presented in U.S. dollars.
|
Years ended November 30,
|
||||||||||||||||||||
|
(
dollars in thousands, except per share
)
|
2013
|
2012
|
2011
|
2010
|
2009
|
|||||||||||||||
|
Loss from operations
|
$ | (55,776 | ) | $ | (79,942 | ) | $ | (115,996 | ) | $ | (22,773 | ) | $ | (46,412 | ) | |||||
|
Net income (loss) from continuing operations
|
$ | (62,760 | ) | $ | (7,586 | ) | $ | 78,235 | $ | (500,875 | ) | $ | (29,116 | ) | ||||||
|
Net income (loss) from discontinued operations
|
$ | — | $ | (4,243 | ) | $ | (33,094 | ) | $ | (133,521 | ) | $ | (20,269 | ) | ||||||
|
Net income (loss) attributable to shareholders
|
$ | (62,760 | ) | $ | (11,829 | ) | $ | 64,767 | $ | (634,396 | ) | $ | (49,385 | ) | ||||||
|
Income (loss) per common share:
|
||||||||||||||||||||
|
Basic:
|
||||||||||||||||||||
|
Continuing operations
|
$ | (0.20 | ) | $ | (0.03 | ) | $ | 0.33 | $ | (2.34 | ) | $ | (0.17 | ) | ||||||
|
Discontinued operations
|
— | (0.02 | ) | (0.14 | ) | (0.66 | ) | (0.18 | ) | |||||||||||
| $ | (0.20 | ) | $ | (0.05 | ) | $ | 0.19 | $ | (3.01 | ) | $ | (0.35 | ) | |||||||
|
Diluted:
|
||||||||||||||||||||
|
Continuing operations
|
$ | (0.20 | ) | $ | (0.03 | ) | $ | 0.21 | $ | (2.34 | ) | $ | (0.17 | ) | ||||||
|
Discontinued operations
|
— | (0.02 | ) | (0.14 | ) | (0.66 | ) | (0.18 | ) | |||||||||||
| $ | (0.20 | ) | $ | (0.05 | ) | $ | 0.07 | $ | (3.01 | ) | $ | (0.35 | ) | |||||||
|
As of November 30,
|
||||||||||||||||||||
| 2013 | 2012 | 2011 | 2010 | 2009 | ||||||||||||||||
|
Total assets
|
$ | 578,686 | $ | 685,242 | $ | 518,208 | $ | 751,657 | $ | 667,837 | ||||||||||
|
Long-term liabilities
|
$ | 108,684 | $ | 94,907 | $ | 265,059 | $ | 880,010 | $ | 174,253 | ||||||||||
|
Shareholders’ equity
|
$ | 465,649 | $ | 476,811 | $ | 212,594 | $ | (157,290 | ) | $ | 479,661 | |||||||||
59
The following discussion and analysis of our financial condition and results of operations constitutes management’s review of the factors that affected our financial and operating performance for the years ended November 30, 2013, 2012 and 2011. This discussion should be read in conjunction with the consolidated financial statements and notes thereto contained elsewhere in this report.
Overview
Our operations primarily relate to the delivery of project milestones, including the achievement of various technical, environmental, sustainable development, economic and legal objectives, obtaining necessary permits, completion of feasibility studies, preparation of engineering designs and the financing to fund these objectives.
In 2013, we successfully delivered on the key goals established at the beginning of the year. Highlights of our accomplishments include:
Advancement of the Donlin Gold project
Permitting of the Donlin Gold project continued to advance:
|
·
|
The Notice of Intent to prepare an EIS was published by the Corps in the Federal Register in December 2012, commencing the public scoping process.
|
|
·
|
Public scoping meetings were held in 13 villages and communities in Western Alaska and in Anchorage to provide information and insight about the project.
|
|
·
|
A data gap analysis to address questions and concerns that arose from the scoping meetings was prepared.
|
|
·
|
EIS Scoping Summary report completed and made available to the public (
www.donlingoldeis.com
).
|
|
·
|
Strong working relationships were maintained with the agencies and we continue to provide input throughout the permitting process.
|
|
·
|
Ongoing baseline data review was conducted including:
|
|
°
|
follow-up technical workshops highlighting core components of baseline environmental and social studies; and
|
|
°
|
completion of 2013 supplemental field studies.
|
|
·
|
EIS Alternatives Development occurred, including:
|
|
°
|
reasonable range of alternatives that are feasible, practicable and permittable to address key issues (i.e.: power – gas pipeline vs. diesel) has been defined; and
|
|
°
|
the initial screening of potential alternatives has been completed.
|
|
·
|
Preliminary Draft EIS preparation was commenced, initial draft chapters are in review by the Cooperating Agencies.
|
|
·
|
A strong safety record was maintained.
|
|
·
|
Several villages were engaged in work force development planning.
|
|
·
|
Donlin Gold was named “Employer of the Year” by the National Association of State Workforce Agencies.
|
Galore Creek project
The 2013 drilling program was completed under budget and exceeded program objectives with 11,600 meters drilled:
|
·
|
Significant intercepts encountered on follow-up drilling from the Legacy zone discovery in 2012, a 700-meter long mineralized zone, adjacent to the Central Pit.
|
|
·
|
Extensions of the Legacy zone mineralization were identified to the south, west and at depth and provided information that will be useful to assess its impact on future mine design.
|
60
|
·
|
Results from the 2012 and 2013 drilling programs will be incorporated into a capital efficient work plan for 2014 that will advance the project.
|
Strengthened our financial position
|
·
|
Reduced cash flow used in continuing operations to $19.5 million in 2013 from $28.6 million in 2012.
|
|
·
|
Our cash used in operations and funding of the Donlin Gold and Galore Creek projects totaled $38.3 million, $2.7 million lower than our budget of $41 million.
|
|
·
|
Received proceeds of $54.4 million upon exercise of the remainder of our outstanding warrants.
|
|
·
|
Completed a tender offer for our Notes and subsequently purchased additional Notes
|
|
°
|
Reduced the principal obligation of the Notes from $95.0 million to $15.8 million.
|
|
°
|
Reduced associated interest expense.
|
|
·
|
We have sufficient cash available to repay the remaining $15.8 million of the outstanding Notes due in May 2015 and to advance the Donlin Gold project through the remaining expected permitting process.
|
Outlook
Our goals for 2014 include:
|
·
|
Advance permitting of the Donlin Gold project.
|
|
·
|
Maintain a healthy balance sheet.
|
|
·
|
Undertake Galore Creek technical studies to build on successful 2012 and 2013 drill results.
|
|
·
|
Evaluate opportunities to monetize the value of Galore Creek.
|
|
·
|
Maintain an effective corporate social responsibility program.
|
We do not currently generate operating cash flows. At November 30, 2013, we had cash and cash equivalents of $81.3 million and term deposits of $110.0 million. At present, we believe that these balances are sufficient to cover the anticipated funding at the Donlin Gold and Galore Creek projects in addition to general and administrative costs through completion of permitting at the Donlin Gold project. Additional capital will be necessary if permits are received at the Donlin Gold project and a decision to commence construction is reached. Future financings to fund construction are anticipated through debt financing, equity financing, project specific debt, or other means. Our continued operations are dependent on our ability to obtain additional financing or to generate future cash flows. However, there can be no assurance that we will be successful in our efforts to raise additional capital. For further information, see section Item 1A, Risk Factors - Our ability to continue the exploration, permitting, development, and construction of the Donlin Gold and Galore Creek projects, and to continue as a going concern, will depend in part on our ability to obtain suitable financing, above. In 2014, we expect to spend approximately $15 million to fund our share of expenditures at the Donlin Gold and Galore Creek projects and $15 million for general and administrative costs, interest, working capital and other corporate purposes.
Summary of Consolidated Financial Performance
|
Years ended November 30,
|
||||||||||||
|
($ thousands, except per share)
|
2013
|
2012
|
2011
|
|||||||||
|
Loss from operations
|
$ | (55,776 | ) | $ | (79,942 | ) | $ | (115,996 | ) | |||
|
Income (loss) from continuing operations
|
$ | (62,760 | ) | $ | (7,586 | ) | $ | 78,235 | ||||
|
Net income (loss) attributable to shareholders
|
$ | (62,760 | ) | $ | (11,829 | ) | $ | 64,767 | ||||
|
Net income (loss) per common share
|
||||||||||||
|
Basic
|
$ | (0.20 | ) | $ | (0.05 | ) | $ | 0.19 | ||||
|
Diluted
|
$ | (0.20 | ) | $ | (0.05 | ) | $ | 0.07 | ||||
61
Results of Operations
2013 compared to 2012
Loss from operations decreased 30% from $79.9 million in 2012 to $55.8 million in 2013. The decrease resulted from lower general and administrative expenses and a lower share of losses from equity investments in the Donlin Gold and Galore Creek projects. General and administrative expenses decreased 30% due to the corporate reorganization costs that were incurred in 2012 for severance and recruiting. Our share of losses at the Donlin Gold project decreased by $2.3 million, as 2013 activities were focused primarily on permitting. At the Galore Creek project, our share of losses decreased by $10.0 million due to a smaller drilling program that focused on the 2012 Legacy zone discovery.
Net loss attributable to shareholders increased from $11.8 million ($0.05 per share – basic) in 2012 to $62.7 million ($0.20 per share – basic) in 2013. In 2012, the fair value of U.S. dollar denominated warrants and the Notes decreased and we recorded a gain of $76.2 million compared to a gain of $1.4 million in 2013, partially offset by the $24.1 million reduction in the loss from operations in 2013 compared to 2012. We also had a $3.9 million tax expense in 2013 compared to a $7.7 million income tax recovery and a $4.2 million net loss from discontinued operations in 2012.
2012 compared to 2011
In 2011, the results of operations and presentation in the financial statements were impacted by the deconsolidation of the Galore Creek project. Teck earned its 50% interest in the Galore Creek project upon completion of its funding commitment of C$373.3 million in June 2011 (the “Reconsideration Event”). The Reconsideration Event resulted in a loss of our primary beneficiary status upon Teck completing its earn-in obligations under the Partnership Agreement. Prior to the completion of its earn-in, if Teck had failed to meet their obligations, we would have had the power to exercise control over the Partnership. Following the Reconsideration Event, we share joint control of the Galore Creek Partnership with Teck, costs are funded equally between the partners and we equity account for our investment.
We determined the fair value of the Partnership at the reconsideration date, deconsolidated the Galore Creek Partnership and subsequently equity accounted for our share of the investment. We determined that the fair value of the Galore Creek project was $354.4 million at May 31, 2011 using estimated discounted future cash flows. As a result, we recognized a gain of $154.2 million for the excess value over the book value of $200.2 million. The determination of the estimated fair value of the equity investment in the Galore Creek Partnership required management to make estimates and assumptions of future events. These estimates and assumptions affect the reported amount of the investment and the reported amount of the gain recognized upon fair valuing the equity investment in the Galore Creek Partnership. Significant assumptions included gold, copper and silver prices of $1,100 per ounce, $2.66 per pound, and $18.50 per ounce, respectively, and a 7% discount rate. Other estimates included future foreign exchange rates, various operational assumptions and metal recovery rates. Actual results could differ materially from those reported.
Loss from operations decreased 31% from $116.0 million in 2011 to $79.9 million in 2012. The decrease was primarily due to $39.6 million in write-downs related to power transmission rights and mobile equipment at the Galore Creek project. General and administrative costs increased by $12.9 million in 2012 as a result of the corporate reorganization which included severance and recruiting costs. Our share of losses at the Donlin Gold project decreased by $4.7 million as permitting activities commenced. At the Galore Creek project, our share of losses increased by $6.0 million due to an expanded drilling program which resulted in the Legacy zone discovery.
Net loss from discontinued operations in 2012 and 2011, includes the financial results associated with NovaCopper Inc. and the Ambler assets, and the former operations of Alaska Gold Company LLC (AGC) and the Rock Creek project. On April 30, 2012, we completed a plan of arrangement under the Companies Act (Nova Scotia) pursuant to which we spun-out NovaCopper Inc., a wholly-owned subsidiary of the Company which held the Ambler assets in Alaska, to our shareholders. On November 1, 2012, we completed the sale of our wholly owned subsidiary, AGC, which owns the Rock Creek project and other assets in and around Nome, Alaska to Bering Straits Native Corporation. The loss decreased from $33.1 million in 2011 to $4.2 million in 2012, primarily due to a partial year of expenses at Ambler due to the spin-out of NovaCopper Inc. and a write-down of inventory and reclamation expense at Rock Creek in 2011.
Net income attributable to shareholders decreased from $64.8 million ($0.19 per share – basic) in 2011 to a loss of $11.8 million ($0.05 per share – basic) in 2012. The decrease was due to the gain recognized in 2011 on deconsolidation of the Galore Creek Partnership, partially offset by the decrease in Loss from operations, the decrease in Net loss from discontinued operations and a $7.7 million deferred income tax recovery in 2012 compared to an expense of $15.4 million in 2011.
62
Liquidity, Capital Resources and Capital Requirements
|
Years ended November 30,
|
||||||||||||
|
($ thousands)
|
2013
|
2012
|
2011
|
|||||||||
|
Cash used in continuing operations
|
$ | (19,491 | ) | $ | (28,570 | ) | $ | (27,731 | ) | |||
|
Cash used in investing activities of continuing operations
|
$ | (128,846 | ) | $ | (34,842 | ) | $ | (41,279 | ) | |||
|
Cash provided from (used in) financing activities of continuing operations
|
$ | (24,812 | ) | $ | 323,585 | $ | 21,565 | |||||
|
As of November 30,
|
||||||||
|
($ thousands)
|
2013
|
2012
|
||||||
|
Cash and cash equivalents
|
$ | 81,262 | $ | 254,667 | ||||
|
Term deposits
|
$ | 110,000 | $ | — | ||||
Cash and cash equivalents decreased by $173.4 million to $81.3 million at November 30, 2013 compared to $254.7 million at November 30, 2012. The decrease in cash is primarily related to the investment of $110.0 million in term deposits, $19.5 million used in operating activities, $18.8 million to fund Donlin Gold and Galore Creek and $79.2 million to repurchase Notes, partially offset by proceeds of $54.4 million from warrants exercised. We have sufficient working capital available to repay the remaining $15.8 million of outstanding Notes due in May 2015 and to advance the Donlin Gold project through the expected remaining permitting process.
2013 compared to 2012
Cash used in continuing operations decreased from $28.6 million in 2012, to $19.5 million in 2013. The decrease resulted from the successful reorganization of the Company in 2012 encompassing the spin-out of NovaCopper Inc., the sale of AGC, which included Rock Creek, as well as a reduction in corporate overhead and administrative costs. Interest payments were lower due to the $79.2 million repurchase of Notes in 2013. Cash used in discontinued operations in 2012 included $25.5 million in 2012 to fund the operations of NovaCopper Inc. and the Rock Creek project.
Cash used in investing activities of continuing operations in 2013 included an investment of $110.0 million in term deposits with original terms of six to nine months to earn a higher return while maintaining adequate liquidity. The U.S. dollar denominated term deposits are held at two major Canadian financial institutions. Cash funding of investments in affiliates decreased by $14.1 million due to lower project activity during permitting at the Donlin Gold project and a reduced exploration program at the Galore Creek project.
Cash used in financing activities of continuing operations in 2013 included the repurchase of $79.2 million of our Notes, partially offset by the receipt of $54.4 million in net proceeds from the exercise of all outstanding warrants. In 2012, we received net proceeds of $318.0 million from the completion of an equity financing of 35 million common shares at $9.50 per share and $5.6 million from the exercise of warrants. Cash used in financing activities of discontinued operations in 2012 included $40 million to fund the spin-out of NovaCopper Inc.
2012 compared to 2011
Cash used in continuing operations increased from $27.7 million in 2011, to $28.6 million in 2012. The increase resulted from reorganization costs including severance in 2012, partially offset by the inclusion of 100% of spending at the Galore Creek project in the first half of 2011, prior to deconsolidation. Cash used in discontinued operations increased from $22.0 million in 2011 to $25.5 million in 2012 to fund the operations of NovaCopper Inc. and the remediation of the Rock Creek project.
Cash used in investing activities of continuing operations in 2011 included $4.1 million for the acquisition of Copper Canyon. Cash funding of investments in affiliates increased by $1.7 million due to the expanded drilling program at the Galore Creek project that resulted in the discovery of the Legacy zone, partially offset by lower spending at the Donlin Gold project as permitting commenced in 2012. Cash provided from investing activities of discontinued operations resulted primarily from the sale of equipment at the Rock Creek project.
Cash used in financing activities of continuing operations in 2012 included net proceeds of $318.0 million from the completion of an equity financing and $5.6 million from the exercise of warrants and stock options. In 2011, we received proceeds of $14.2 million from the exercise of warrants and stock options and $7.4 million from Teck to fund the Galore Creek project prior to the completion of Teck’s earn-in on the project. Cash used in financing of discontinued operations included $40 million to fund the spin-out of NovaCopper Inc. in 2012 and $24.0 million to repay the Ambler note in 2011.
63
Contractual Obligations
Our contractual obligations as of November 30, 2013 were as follows:
| ($ thousands) |
Total
|
Less than 1 year
|
1-3 years
|
3-5 years
|
More than 5 years
|
|||||||||||||||
|
Reclamation and remediation
|
$ | 861 | $ | 861 | $ | — | $ | — | $ | — | ||||||||||
|
Office and equipment leases
|
1,622 | 440 | 846 | 336 | — | |||||||||||||||
|
Convertible notes - principal
|
15,829 | — | 15,829 | — | — | |||||||||||||||
|
Convertible notes - interest
|
1,306 | 871 | 435 | — | — | |||||||||||||||
|
Promissory note
|
71,728 | — | — | — | 71,728 | |||||||||||||||
Off-Balance Sheet Arrangements
The Company does not have any material off-balance sheet arrangements required to be disclosed in this Annual Report on Form 10-K.
Outstanding share data
As of February 6, 2014, we had 317,297,868 common shares issued and outstanding. As of February 6, 2014, we had 13,950,134 stock options with a weighted-average exercise price of $5.71, 2,281,692 restricted share units and 134,090 deferred share units outstanding. Following the Company’s purchases of the Notes, $15,829 of the principal amount of the Notes remain outstanding and due on May 1, 2015 and 1,639,370 common shares remain issuable upon conversion.
Related party transactions
The Company provided exploration and management services to Donlin Gold for $258 in 2013, $236 in 2012 and $600 in 2011; office rental and services to Galore Creek for $423 in 2013, $796 in 2012 and $886 in 2011; and management and office administration services to NovaCopper Inc. for $168 in 2013 and $83 in 2012.
As of November 30, 2013, the Company has accounts receivable from Donlin Gold of $1,750 (2012: $nil) and from Galore Creek Galore Creek of $1,690 (2012: $138) included in other current assets and a receivable of $4,132 (2012: $4,417) from Galore Creek included in other long-term assets.
Fourth quarter results
During the fourth quarter of 2013, we incurred a net loss of $20.0 million compared to $30.2 milllion for the comparable period in 2012. The decrease in net loss in 2013 compared to 2012 was primarily due to a loss on derivative liabilities in 2012. We also incurred lower general and administrative expenses and interest expense in 2013, offset by increased defered income tax expense.
Accounting Developments
For a discussion of Recently Issued Accounting Pronouncements, see Note 2 to the Consolidated Financial Statements.
Critical Accounting Policies
We believe the following accounting policies are critical to our financial statements due to the degree of uncertainty regarding the estimates or assumptions involved and the magnitude of the asset, liability, revenue or expense being reported.
Investment in affiliates
Our investments in the Donlin Gold project and the Galore Creek project are accounted for using the equity method. The equity method is a basis of accounting for investments whereby the investment is initially recorded at cost and the carrying value is adjusted thereafter to include the investor’s pro rata share of post-acquisition earnings or losses of the investee, as computed by the consolidation method. Cash funding increases the carrying value of the investment. Profit distributions received or receivable from an investee reduce the carrying value of the investment.
These investments are non-publicly traded equity investees in advanced exploration projects. Therefore, we assess whether there has been a potential impairment triggering event for other-than-temporary impairment by testing the underlying assets of the equity investee for recoverability and assessing whether there has been a change in the development plan or strategy for the project. If we determine underlying assets are recoverable and no other potential impairment conditions are identified, then our investment in the equity investee is carried at cost. If the other underlying assets are not recoverable, we record an impairment charge equal to the difference between the carrying amount of the investee and its fair value. We determined fair value based on the present value of future cash flows expected to be generated by the project. If reliable cash flow information is not available, we determine fair value using a market comparable approach.
64
Mineral properties and exploration and evaluation expenditures
Mineral property acquisition costs, including directly related costs, are capitalized when incurred, and mineral property exploration and evaluation costs are expensed as incurred. Mine development costs include engineering and metallurgical studies, drilling and other related costs to delineate an ore body and the removal of overburden to initially expose an ore body at open pit surface mines. Capitalization of mine development project costs, that meet the definition of an asset, begins once mineralization is classified as proven and probable reserves as defined by SEC Industry Guide 7. Capitalized costs will be amortized using the units-of-production method over the estimated life of the proven and probable reserves. If mineral properties are subsequently abandoned or impaired, any unamortized costs will be charged to loss in that period.
The recoverability of the carrying values of our mineral properties is dependent upon economic reserves being discovered or developed on the properties, permitting, financing, start-up, and commercial production from, or the sale/lease of, or other strategic transactions related to these properties.
Income taxes
We account for income taxes under the asset and liability method. Deferred tax assets and liabilities are recognized for the future tax consequences attributable to differences between the financial statement carrying amounts of existing assets and liabilities and their respective tax bases. Deferred tax assets and liabilities are measured using enacted tax rates expected to apply to taxable income in the years in which those temporary differences are expected to be recovered or settled. Under the asset and liability method, the effect on deferred tax assets and liabilities of a change in tax rates is recognized in income in the period that includes the enactment date. A valuation allowance is recognized if it is more likely than not that some portion or the entire deferred tax asset will not be recognized.
Share-based compensation
We operate a stock option plan and a performance share unit plan, under which the entity receives services from employees as consideration for equity instruments (options or shares) of the Company. The fair value for the options and share units are recognized in earnings over the related service period. The total amount to be expensed related to options is determined by reference to the fair value of the options granted including any market performance conditions and the impact of any non-vesting conditions; and excluding the impact of any service and non-market performance vesting conditions.
The fair value of stock options is estimated at the time of grant using the Black
‐
Scholes option pricing model, and the fair value of the PSUs is measured at the grant date using a Monte Carlo simulation, which takes into account, as of the grant date, the fair market value of the shares, expected volatility, expected dividend yield and the risk
‐
free interest rate over the life of the PSU, to generate potential outcomes for stock prices which are used to estimate the probability of the PSUs vesting at the end of the performance measurement period.
We grant our board members deferred share units (DSUs), whereby each DSU entitles the directors to receive one common share of the Company when they retire from service with the Company. The fair value of the DSUs is measured at the date of the grant in amounts ranging from 50% to 100% of directors’ annual retainers at the election of the directors. The fair value is recognized in consolidated statement of income (loss) over the related service period.
Derivative Instruments
All financial instruments that meet the definition of a derivative are recorded on the balance sheet at fair value. Changes in the fair value of derivatives are recorded in the consolidated statements of income. Management applies judgment in estimating the fair value of instruments that are highly sensitive to assumptions regarding market volatilities, foreign currency exchange rates and interest rates. Variations in these factors could materially affect amounts credited or charged to earnings to reflect the changes in fair value of derivatives.
65
Net income (loss) per common share
Basic and diluted income (loss) per share is presented for Net income (loss) and for Income (loss) from continuing operations. Basic income (loss) per share is computed by dividing Net income (loss) or Income (loss) from continuing operations by the weighted-average number of outstanding common shares for the period, including the warrants and the convertible notes. Diluted income per share reflects the potential dilution that could occur if securities or other contracts that may require the issuance of common shares in the future were converted. Diluted income per share is computed by increasing the weighted-average number of outstanding common shares to include the additional common shares that would be outstanding after conversion and adjusting net income for changes that would result from the conversion. Only those securities or other contracts that result in a reduction in earnings per share are included in the calculation.
66
Our financial instruments are exposed to certain financial risks, including currency, credit and interest rate risks.
Currency risk
We are exposed to financial risk related to the fluctuation of foreign exchange rates. We operate in Canada and the United States and a portion of our expenses are incurred in Canadian dollars. A significant change in the currency exchange rate between the Canadian dollar relative to the U.S. dollar could have an effect on our results of operations, financial position or cash flows.
We have not hedged our exposure to currency fluctuations. At November 30, 2013, we are exposed to currency risk through our investment in the Galore Creek project, mineral properties, deferred income taxes and cash balances held in Canadian dollars.
Based on the above net exposures as at November 30, 2013, and assuming that all other variables remain constant, a 1% depreciation or appreciation of the Canadian dollar against the U.S. dollar would result in an increase/decrease of $3.5 million in our consolidated comprehensive income (loss).
Credit risk
Concentration of credit risk exists with respect to our cash and cash equivalents and term deposit investments. All deposits are held through two large Canadian financial institutions with high investment-grade ratings and have maturities of less than one year.
Interest rate risk
The Notes are not subject to interest rate risk because they are at fixed rates. The interest rate on the promissory note owed to Barrick is variable with the U.S. prime rate. Based on the amount owing on the promissory note as at November 30, 2013, and assuming that all other variables remain constant, a 1% change in the U.S. prime rate would result in an increase/decrease of $0.7 million in the interest accrued by us per annum.
67
Supplementary Data
For the required supplementary data, please see “Item 7. Management’s Discussion and Analysis of Financial Condition and Results of Operations – Summary of Quarterly Results” above.
Management’s Report on Internal Control Over Financial Reporting
Our management is responsible for establishing and maintaining adequate internal control over financial reporting for the Company. Internal control over financial reporting is a process to provide reasonable assurance regarding the reliability of our financial reporting and the preparation of financial statements for external purposes in accordance with accounting principles generally accepted in the United States of America. Internal control over financial reporting includes maintaining records that in reasonable detail accurately and fairly reflect our transactions; providing reasonable assurance that transactions are recorded as necessary for preparation of our financial statements; providing reasonable assurance that receipts and expenditures of our assets are made in accordance with management’s authorization; and providing reasonable assurance that unauthorized acquisition, use or disposition of our assets that could have a material effect on the financial statements would be prevented or detected on a timely basis. Because of its inherent limitations, internal control over financial reporting is not intended to provide absolute assurance that a misstatement of our financial statements would be prevented or detected.
Management conducted its evaluation of the effectiveness of our internal controls over financial reporting based on the framework in Internal Control — Integrated Framework (2013) issued by the Committee of Sponsoring Organizations of the Treadway Commission. Based on this evaluation, management concluded that our internal control over financial reporting was effective as of November 30, 2013.
The effectiveness of our assessment of internal control over financial reporting as of November 30, 2013 has been audited by PricewaterhouseCoopers LLP, an independent registered public accounting firm, as stated in their report which appears herein.
| /s/ Gregory A. Lang | /s/ David Ottewell |
| Gregory A. Lang | David Ottewell |
| President and Chief Executive Officer | Vice President and Chief Financial Officer |
| February 12, 2014 |
68
Report of Independent Registered Public Accounting Firm
To the Shareholders of NOVAGOLD RESOURCES INC.
We have audited the accompanying consolidated balance sheets and the related consolidated statements
of income, comprehensive income, cash flows and statements of equity present fairly, in all material
respects, the financial position of NOVAGOLD RESOURCES INC. and its subsidiaries (“NOVAGOLD”) at
November 30, 2013 and November 30, 2012, the results of their operations and their cash flows for each of
the three years in the period ended November 30, 2013. We also have audited NOVAGOLD’s internal
control over financial reporting as of November 30, 2013, based on criteria established in Internal Control
- Integrated Framework (2013) issued by the Committee of Sponsoring Organizations of the Treadway
Commission (COSO). Management is responsible for these consolidated financial statements, for
maintaining effective internal control over financial reporting, and for its assessment of the effectiveness
of internal control over financial reporting, included in the accompanying Management’s Report on
Internal Control over Financial Reporting. Our responsibility is to express an opinion on these consolidated financial statements
and an opinion on the company’s internal control over financial reporting based on our integrated audits.
We conducted our audits in accordance with the standards of the Public Company Accounting Oversight
Board (United States). Those standards require that we plan and perform the audit to obtain reasonable
assurance about whether the consolidated financial statements are free of material misstatement and
whether effective internal control over financial reporting was maintained in all material respects. Our
audits of the consolidated financial statements included examining, on a test basis, evidence supporting
the amounts and disclosures in the consolidated financial statements, assessing the accounting principles
used and significant estimates made by management, and evaluating the overall consolidated financial
statement presentation. Our audit of internal control over financial reporting included obtaining an
understanding of internal control over financial reporting, assessing the risk that a material weakness
exists, and testing and evaluating the design and operating effectiveness of internal control based on the
assessed risk. Our audits also included performing such other procedures as we considered necessary in
the circumstances. We believe that our audits provide a reasonable basis for our opinions.
A company’s internal control over financial reporting is a process designed to provide reasonable
assurance regarding the reliability of financial reporting and the preparation of financial statements for
external purposes in accordance with generally accepted accounting principles. A company’s internal
control over financial reporting includes those policies and procedures that:
| i. | pertain to the maintenance of records that, in reasonable detail, accurately and fairly reflect the transactions and dispositions of the assets of the company; | |
| ii. | provide reasonable assurance that transactions are recorded as necessary to permit preparation of financial statements in accordance with generally accepted accounting principles, and that receipts and expenditures of the company are being made only in accordance with authorizations of management and directors of the company; and | |
| iii. | provide reasonable assurance regarding prevention or timely detection of unauthorized acquisition, use, or disposition of the company’s assets that could have a material effect on the financial statements. Because of its inherent limitations, internal control over financial reporting may not prevent or detect misstatements. Also, projections of any evaluation of effectiveness to future periods are subject to the risk that controls may become inadequate because of changes in conditions, or that the degree of compliance with the policies or procedures may deteriorate. |
In our opinion, the consolidated financial statements referred to above present fairly, in all material
respects, the financial position of NOVAGOLD as of November 30, 2013 and 2012 and the results of their
operations and their cash flows for each of the years in the three-year period ended November 30, 2013 in
conformity with accounting principles generally accepted in the United States of America. Also, in our
opinion, NOVAGOLD maintained, in all material respects, effective internal control over financial
reporting as of November 30, 2013, based on criteria established in Internal Control - Integrated
Framework issued by COSO.
signed “PricewaterhouseCoopers LLP”
Chartered Accountants
Vancouver, BC
Canada
February 12, 2014
69
(US dollars in thousands)
|
At November 30,
|
||||||||
|
2013
|
2012
|
|||||||
|
ASSETS
|
||||||||
|
Cash and cash equivalents
|
$ | 81,262 | $ | 254,667 | ||||
|
Investments (note 4)
|
110,000 | — | ||||||
|
Other assets
|
5,549 | 4,203 | ||||||
|
Current assets
|
196,811 | 258,870 | ||||||
|
Investments (note 4)
|
1,280 | 2,900 | ||||||
|
Investment in affiliates (note 5)
|
307,455 | 339,271 | ||||||
|
Mineral properties (note 6)
|
54,813 | 59,100 | ||||||
|
Deferred income taxes (note 10)
|
9,728 | 15,679 | ||||||
|
Other assets
|
8,599 | 9,422 | ||||||
|
Total assets
|
$ | 578,686 | $ | 685,242 | ||||
|
LIABILITIES
|
||||||||
|
Accounts payable and accrued liabilities
|
$ | 3,492 | $ | 5,708 | ||||
|
Debt (note 7)
|
— | 73,606 | ||||||
|
Derivative liabilities (note 8)
|
— | 33,210 | ||||||
|
Other liabilities
|
861 | 1,000 | ||||||
|
Current liabilities
|
4,353 | 113,524 | ||||||
|
Debt (note 7)
|
85,298 | 68,106 | ||||||
|
Derivative liabilities (note 8)
|
83 | — | ||||||
|
Deferred income taxes (note 10)
|
23,303 | 26,546 | ||||||
|
Other liabilities
|
— | 255 | ||||||
|
Total liabilities
|
113,037 | 208,431 | ||||||
|
Commitments and contingencies (note 20)
|
||||||||
|
EQUITY
|
||||||||
|
Common shares
|
||||||||
|
Authorized - 1,000,000,000 shares, no par value
|
||||||||
|
Issued and outstanding - 316,661,000 and 279,927,000 shares
|
||||||||
|
issued less 9,000 and 9,000 treasury shares, respectively
|
1,933,953 | 1,462,102 | ||||||
|
Contributed surplus
|
66,811 | 454,260 | ||||||
|
Accumulated deficit during exploration stage
|
(1,599,619 | ) | (1,536,859 | ) | ||||
|
Accumulated other comprehensive income
|
64,504 | 97,308 | ||||||
|
Total equity
|
465,649 | 476,811 | ||||||
|
Total liabilities and equity
|
$ | 578,686 | $ | 685,242 | ||||
The accompanying notes are an integral part of these consolidated financial statements.
Approved by the Board of Directors
| /s/ Gregory A. Lang | /s/ Anthony P. Walsh |
70
(US dollars in thousands, except per share amounts)
|
Years ended November 30,
|
From
|
|||||||||||||||
|
2013
|
2012
|
2011
|
Inception
|
|||||||||||||
|
Operating expenses:
|
||||||||||||||||
|
Exploration and evaluation
|
$ | — | $ | 363 | $ | 7,404 | $ | 237,145 | ||||||||
|
General and administrative (note 11)
|
26,991 | 39,145 | 26,218 | 271,117 | ||||||||||||
|
Equity loss of affiliates (note 5)
|
27,972 | 40,330 | 39,100 | 163,832 | ||||||||||||
|
Care and maintenance
|
— | — | 2,525 | 34,735 | ||||||||||||
|
Reclamation and remediation
|
— | — | — | 1,150 | ||||||||||||
|
Depreciation
|
37 | 104 | 1,106 | 3,905 | ||||||||||||
|
Write-down of assets (note 12)
|
776 | — | 39,643 | 40,419 | ||||||||||||
| 55,776 | 79,942 | 115,996 | 752,303 | |||||||||||||
|
Loss from operations
|
(55,776 | ) | (79,942 | ) | (115,996 | ) | (752,303 | ) | ||||||||
|
Other income (expense):
|
||||||||||||||||
|
Interest income
|
942 | 572 | 383 | 17,775 | ||||||||||||
|
Interest expense
|
(12,607 | ) | (15,305 | ) | (14,143 | ) | (75,153 | ) | ||||||||
|
Foreign exchange gain (loss)
|
10,448 | 2,987 | 7,490 | (17,434 | ) | |||||||||||
|
Gain (loss) on derivative liabilities (note 8)
|
1,356 | 76,246 | 61,684 | (564,970 | ) | |||||||||||
|
Gain on deconsolidation of Galore Creek (note 5)
|
— | — | 154,173 | 154,173 | ||||||||||||
|
Gain on disposition of assets
|
— | — | — | 47,467 | ||||||||||||
|
Write-down of marketable securities
|
(3,227 | ) | — | — | (3,227 | ) | ||||||||||
|
Other
|
— | 108 | — | 108 | ||||||||||||
|
|
(3,088 | ) | 64,608 | 209,587 | (441,261 | ) | ||||||||||
|
Income (loss) before income taxes
|
(58,864 | ) | (15,334 | ) | 93,591 | (1,193,564 | ) | |||||||||
|
Income tax recovery (expense) (note 10)
|
(3,896 | ) | 7,748 | (15,356 | ) | 6,724 | ||||||||||
|
Net income (loss) from continuing operations
|
(62,760 | ) | (7,586 | ) | 78,235 | (1,186,840 | ) | |||||||||
|
Net loss from discontinued operations (note 14)
|
— | (4,243 | ) | (33,094 | ) | (491,063 | ) | |||||||||
|
Net income (loss)
|
(62,760 | ) | (11,829 | ) | 45,141 | (1,677,903 | ) | |||||||||
|
Net loss attributable to non-controlling interest
|
— | — | (19,626 | ) | (78,284 | ) | ||||||||||
|
Net income (loss) attributable to shareholders
|
$ | (62,760 | ) | $ | (11,829 | ) | $ | 64,767 | $ | (1,599,619 | ) | |||||
|
Net income (loss) attributable to shareholders:
|
||||||||||||||||
|
Continuing operations
|
$ | (62,760 | ) | $ | (7,586 | ) | $ | 97,861 | $ | (1,108,556 | ) | |||||
|
Discontinued operations
|
— | (4,243 | ) | (33,094 | ) | (491,063 | ) | |||||||||
| $ | (62,760 | ) | $ | (11,829 | ) | $ | 64,767 | $ | (1,599,619 | ) | ||||||
|
Income (loss) per common share (note 16)
|
||||||||||||||||
|
Basic:
|
||||||||||||||||
|
Continuing operations
|
$ | (0.20 | ) | $ | (0.03 | ) | $ | 0.33 | ||||||||
|
Discontinued operations
|
— | (0.02 | ) | (0.14 | ) | |||||||||||
| $ | (0.20 | ) | $ | (0.05 | ) | $ | 0.19 | |||||||||
|
Diluted:
|
||||||||||||||||
|
Continuing operations
|
$ | (0.20 | ) | $ | (0.03 | ) | $ | 0.21 | ||||||||
|
Discontinued operations
|
— | (0.02 | ) | (0.14 | ) | |||||||||||
| $ | (0.20 | ) | $ | (0.05 | ) | $ | 0.07 | |||||||||
The accompanying notes are an integral part of these consolidated financial statements.
71
CONSOLIDATED STATEMENTS OF COMPREHENSIVE INCOME
(US dollars in thousands)
|
Years ended November 30,
|
From
|
|||||||||||||||
|
2013
|
2012
|
2011
|
Inception
|
|||||||||||||
|
Net income (loss)
|
$ | (62,760 | ) | $ | (11,829 | ) | $ | 45,141 | $ | (1,677,903 | ) | |||||
|
Other comprehensive loss:
|
||||||||||||||||
|
Change in fair value of marketable securities, net of $32, $59, $64 and $(184) tax recovery (expense), respectively
|
||||||||||||||||
|
Net change from periodic revaluations
|
(855 | ) | (1,474 | ) | (1,635 | ) | (2,196 | ) | ||||||||
|
Net amount reclassified to income
|
2,738 | — | — | 2,409 | ||||||||||||
|
Net unrecognized gain (loss)
|
1,883 | (1,474 | ) | (1,635 | ) | 213 | ||||||||||
|
Foreign currency translation adjustments
|
(34,687 | ) | 7,235 | (29,825 | ) | 64,291 | ||||||||||
| (32,804 | ) | 5,761 | (31,460 | ) | 64,504 | |||||||||||
|
Comprehensive income (loss)
|
$ | (95,564 | ) | $ | (6,068 | ) | $ | 13,681 | $ | (1,613,399 | ) | |||||
|
Comprehensive income (loss) attributable to:
|
||||||||||||||||
|
Shareholders
|
(95,564 | ) | $ | (6,068 | ) | 33,307 | $ | (1,535,115 | ) | |||||||
|
Non-controlling interest
|
— | — | (19,626 | ) | (78,284 | ) | ||||||||||
| $ | (95,564 | ) | $ | (6,068 | ) | $ | 13,681 | $ | (1,613,399 | ) | ||||||
The accompanying notes are an integral part of these consolidated financial statements.
72
(US dollars in thousands)
|
Years ended November 30,
|
From
|
|||||||||||||||
|
2013
|
2012
|
2011
|
Inception
|
|||||||||||||
|
Operating activities:
|
||||||||||||||||
|
Net income (loss)
|
$ | (62,760 | ) | $ | (11,829 | ) | $ | 45,141 | $ | (1,677,903 | ) | |||||
|
Adjustments to reconcile net income to net cash used in operating activities:
|
||||||||||||||||
|
Depreciation
|
37 | 104 | 1,106 | 3,905 | ||||||||||||
|
Deferred income taxes
|
3,606 | (7,748 | ) | 15,356 | (7,014 | ) | ||||||||||
|
Foreign exchange (gain) loss
|
(10,448 | ) | (2,987 | ) | (7,490 | ) | 29,664 | |||||||||
|
Loss from discontinued operations
|
— | 4,243 | 33,094 | 491,063 | ||||||||||||
|
Share-based compensation
|
12,304 | 19,862 | 8,987 | 69,403 | ||||||||||||
|
Equity losses of affiliates
|
27,972 | 40,330 | 39,100 | 163,832 | ||||||||||||
|
Gain on deconsolidation of Galore Creek
|
— | — | (154,173 | ) | (154,173 | ) | ||||||||||
|
Loss (gain) on derivative liabilities
|
(1,356 | ) | (76,246 | ) | (61,684 | ) | 564,970 | |||||||||
|
Write-down of assets
|
4,003 | — | 39,643 | 43,646 | ||||||||||||
|
Other
|
9,358 | 9,062 | 9,103 | 18,079 | ||||||||||||
|
Withholding tax on share based compensation
|
(619 | ) | (2,960 | ) | — | (5,897 | ) | |||||||||
|
Net change in operating assets and liabilities (note 13)
|
(1,588 | ) | (401 | ) | 4,086 | 3,603 | ||||||||||
|
Net cash used in continuing operations
|
(19,491 | ) | (28,570 | ) | (27,731 | ) | (456,822 | ) | ||||||||
|
Net cash used in discontinued operations (note 14)
|
— | (25,488 | ) | (22,015 | ) | (219,010 | ) | |||||||||
|
Investing activities:
|
||||||||||||||||
|
Additions to property and equipment
|
(78 | ) | (100 | ) | — | (218,301 | ) | |||||||||
|
Purchases of marketable securities
|
(110,000 | ) | — | (273 | ) | (110,273 | ) | |||||||||
|
Funding of affiliates
|
(18,793 | ) | (34,742 | ) | (36,467 | ) | (160,531 | ) | ||||||||
|
Acquisitions, net
|
— | — | (4,139 | ) | (4,645 | ) | ||||||||||
|
Proceeds from sale of assets
|
25 | — | — | 26,445 | ||||||||||||
|
Other
|
— | — | (400 | ) | (4,780 | ) | ||||||||||
|
Net cash used in investing activities of continuing operations
|
(128,846 | ) | (34,842 | ) | (41,279 | ) | (472,085 | ) | ||||||||
|
Net cash provided from (used in) investing activities of discontinued operations (note 14)
|
— | 483 | 4,306 | (328,507 | ) | |||||||||||
|
Financing activities:
|
||||||||||||||||
|
Proceeds from share issuance, net
|
54,359 | 323,585 | 14,182 | 1,217,437 | ||||||||||||
|
Proceeds from debt issuance, net
|
— | — | — | 92,200 | ||||||||||||
|
Repayment of debt
|
(79,171 | ) | — | — | (82,706 | ) | ||||||||||
|
Proceeds from non-controlling interest
|
— | — | 7,383 | 343,073 | ||||||||||||
|
Net cash provided from (used in) financing activities of continuing operations
|
(24,812 | ) | 323,585 | 21,565 | 1,570,004 | |||||||||||
|
Net cash provided from (used in) financing activities of discontinued operations (note 14)
|
— | (40,000 | ) | (24,000 | ) | (12,923 | ) | |||||||||
|
Effect of exchange rate changes on cash
|
(256 | ) | 132 | 729 | 605 | |||||||||||
|
Increase (decrease) in cash and cash equivalents
|
(173,405 | ) | 195,300 | (88,425 | ) | 81,262 | ||||||||||
|
Cash and cash equivalents at beginning of period
|
254,667 | 59,367 | 147,792 | — | ||||||||||||
|
Cash and cash equivalents at end of period
|
$ | 81,262 | $ | 254,667 | $ | 59,367 | $ | 81,262 | ||||||||
See note 21 for supplemental cash flow information.
The accompanying notes are an integral part of these consolidated financial statements.
73
CONSOLIDATED STATEMENTS OF EQUITY
(US dollars in thousands)
|
Common shares
|
Contributed surplus | Accumulated deficit during exploration stage | Accumulated other comprehensive income | Non-controlling Interest | Total equity | |||||||||||||||||||||||
|
Shares
|
Amount
|
|||||||||||||||||||||||||||
|
From inception December 5, 1984
|
— | $ | — | $ | — | $ | — | $ | — | $ | — | $ | — | |||||||||||||||
|
Net loss from inception to November 30, 2010
|
— | — | — | (1,589,797 | ) | — | (58,658 | ) | (1,648,455 | ) | ||||||||||||||||||
|
Other comprehensive income
|
— | — | — | — | 123,007 | — | 123,007 | |||||||||||||||||||||
|
Acquisition of non-controlling interest
|
— | — | — | — | — | 348,248 | 348,248 | |||||||||||||||||||||
|
Common share issuance
|
151,844 | 766,271 | 7,935 | — | — | — | 774,206 | |||||||||||||||||||||
|
Warrants issued/exercised
|
29,682 | 82,275 | — | — | — | — | 82,275 | |||||||||||||||||||||
|
Convertible debt issuance
|
18,551 | 19,771 | — | — | — | — | 19,771 | |||||||||||||||||||||
|
Share-based compensation and related share issuances
|
10,774 | 27,367 | 27,007 | — | — | — | 54,374 | |||||||||||||||||||||
|
Acquisitions
|
15,150 | 89,285 | — | — | — | — | 89,285 | |||||||||||||||||||||
|
November 30, 2010
|
226,001 | $ | 984,969 | $ | 34,942 | $ | (1,589,797 | ) | $ | 123,007 | $ | 289,590 | $ | (157,289 | ) | |||||||||||||
|
Net income (loss)
|
— | — | — | 64,767 | — | (19,626 | ) | 45,141 | ||||||||||||||||||||
|
Other comprehensive loss
|
— | — | — | — | (31,460 | ) | — | (31,460 | ) | |||||||||||||||||||
|
Disposition of non-controlling interest
|
— | — | — | — | — | (269,964 | ) | (269,964 | ) | |||||||||||||||||||
|
Warrants exercised
|
8,925 | 127,258 | (24,103 | ) | — | — | — | 103,155 | ||||||||||||||||||||
|
Conversion of foreign currency warrants
|
— | — | 469,694 | — | — | — | 469,694 | |||||||||||||||||||||
|
Share-based compensation and related share issuances
|
888 | 3,032 | 6,773 | — | — | — | 9,805 | |||||||||||||||||||||
|
Acquisition
|
4,171 | 43,512 | — | — | — | — | 43,512 | |||||||||||||||||||||
|
November 30, 2011
|
239,985 | $ | 1,158,771 | $ | 487,306 | $ | (1,525,030 | ) | $ | 91,547 | $ | — | $ | 212,594 | ||||||||||||||
|
Net loss
|
— | — | — | (11,829 | ) | — | — | (11,829 | ) | |||||||||||||||||||
|
Other comprehensive income
|
— | — | — | — | 5,761 | — | 5,761 | |||||||||||||||||||||
|
Common share issuance
|
35,000 | 317,841 | — | — | — | — | 317,841 | |||||||||||||||||||||
|
Warrants exercised
|
3,891 | 54,282 | (48,539 | ) | — | — | — | 5,743 | ||||||||||||||||||||
|
Share-based compensation and related share issuances
|
1,051 | 4,095 | 16,186 | — | — | — | 20,281 | |||||||||||||||||||||
|
Return of capital - NovaCopper Inc.
|
— | (72,887 | ) | (693 | ) | — | — | — | (73,580 | ) | ||||||||||||||||||
|
November 30, 2012
|
279,927 | $ | 1,462,102 | $ | 454,260 | $ | (1,536,859 | ) | $ | 97,308 | $ | — | $ | 476,811 | ||||||||||||||
|
Net loss
|
— | — | — | (62,760 | ) | — | — | (62,760 | ) | |||||||||||||||||||
|
Other comprehensive loss
|
— | — | — | — | (32,804 | ) | — | (32,804 | ) | |||||||||||||||||||
|
Warrants exercised
|
36,529 | 469,150 | (397,052 | ) | — | — | — | 72,098 | ||||||||||||||||||||
|
Share-based compensation and related share issuances
|
205 | 2,701 | 9,603 | — | — | — | 12,304 | |||||||||||||||||||||
|
November 30, 2013
|
316,661 | $ | 1,933,953 | $ | 66,811 | $ | (1,599,619 | ) | $ | 64,504 | $ | — | $ | 465,649 | ||||||||||||||
The accompanying notes are an integral part of these consolidated financial statements.
74
NOTES TO CONSOLIDATED FINANCIAL STATEMENTS
(US dollars in thousands, except per share amounts)
NOVAGOLD RESOURCES INC. and its affiliates and subsidiaries (collectively, “NOVAGOLD” or the “Company”) operates in the mining industry, focused on the exploration for and development of gold and copper mineral properties. The Company has no operations or realized revenues from its planned principal business purpose, and in accordance with Financial Accounting Standards Board (FASB) Accounting Standards Codification (ASC) 915 “Development Stage Entities” and Securities and Exchange Commission (SEC) Industry Guide 7, presents its financial information as an Exploration Stage Company.
The Company’s principal assets include a 50% interest in the Donlin Gold project in Alaska, U.S.A. and a 50% interest in the Galore Creek Project in British Columbia, Canada.
The Company’s primary focus is on the Donlin Gold project, which advanced to the permitting phase in 2012. The Donlin Gold project is owned and operated by Donlin Gold LLC, a limited liability company that is owned equally by wholly-owned subsidiaries of NOVAGOLD and Barrick Gold Corporation (“Barrick”).
The Company is currently exploring opportunities to sell, in whole or in part its interest in the Galore Creek Partnership. The Galore Creek project is owned by the Galore Creek Partnership (“Partnership”) a partnership in which wholly-owned subsidiaries of NOVAGOLD and Teck Resources Limited (“Teck”) each own a 50% interest. Galore Creek Mining Corporation (GCMC) is owned by the Partnership and manages Galore Creek operations.
NOTE 2 – SUMMARY OF SIGNIFICANT ACCOUNTING POLICIES
Presentation
These consolidated financial statements are presented in United States dollars and have been prepared in accordance with accounting principles generally accepted in the United States (US GAAP). Previously, the Company prepared its financial statements under International Financial Reporting Standards (IFRS) for reporting as permitted by security regulators in Canada, as well as in the United States under the status of a foreign private issuer as defined by the United States Securities and Exchange Commission (SEC). At the end of the second quarter of 2013, the Company determined that it no longer qualified as a foreign private issuer under the SEC rules. As a result, beginning December 1, 2013 the Company is required to report with the SEC on domestic forms and comply with domestic company rules in the United States. The transition to US GAAP was made retrospectively for all periods from the Company’s inception.
References in these Consolidated Financial Statements and Notes to $ refer to United States currency and C$ to Canadian currency. Dollar amounts are in thousands, except for per share amounts.
Use of estimates
The preparation of the Company’s Consolidated Financial Statements in accordance with US GAAP requires the Company to make estimates and assumptions that affect the reported amounts of assets and liabilities and the related disclosure of contingent assets and liabilities at the date of the Consolidated Financial Statements and the reported amounts of revenues and expenses during the reporting period. The more significant areas requiring the use of management estimates and assumptions related to: estimates of gold and copper production that are the basis for future cash flow estimates utilized in impairment calculations; environmental, reclamation and closure obligations; estimates of fair value for asset impairments (including impairments of mineral properties and investments); valuation allowances for deferred tax assets; reserves for contingencies and litigation; and the fair value and accounting treatment of financial instruments including marketable securities and derivative instruments. The Company bases its estimates on historical experience and on various other assumptions that are believed to be reasonable under the circumstances. Accordingly, actual results will differ from these amounts estimated in these financial statements.
Principles of consolidation
The Company’s Consolidated Financial Statements include NOVAGOLD RESOURCES INC. and its wholly owned subsidiaries. The Company’s wholly-owned subsidiaries include NOVAGOLD Canada Inc., Copper Canyon Resources Inc., NOVAGOLD US Holdings Inc., NOVAGOLD Resources Alaska Inc., NOVAGOLD USA Inc., and AGC Resources Inc. All inter-company transactions and balances are eliminated on consolidation. The Company also consolidates variable interest entities when the Company is the primary beneficiary.
75
The functional currency for the Company’s Canadian operations is the Canadian dollar (“C$”) and the functional currency for the Company’s U.S. operations is the U.S. dollar. Therefore, gains and losses on US dollar denominated transactions and balances of Canadian operations are recorded on the Consolidated Statements of Income.
Cash and cash equivalents
All highly liquid investments with original maturities of three months or less are considered to be cash equivalents. The Company’s cash equivalent instruments are valued based on quoted market prices in active markets classified within Level 2 of the fair value hierarchy established by FASB guidance for Fair Value Measurements. Restricted cash is excluded from cash and cash equivalents and is included in other long-term assets.
Mineral properties
Mineral property expenditures are expensed as incurred except for expenditures associated with the acquisition of mineral property assets through a business combination or asset acquisition.
Investment in affiliates
Investments in unconsolidated ventures that we have the ability to exercise significant influence over, but not control, are accounted for under the equity method and include the Company’s investments in the Donlin Gold project and the Galore Creek project. The Company identified Donlin Gold LLC and the Galore Creek Partnership as Variable Interest Entities (VIEs) as these entities are dependent on funding from their owners. All funding, ownership, voting rights and power to exercise control is shared equally on a 50/50 basis between the owners of each VIE. Therefore, the Company has determined that it is not the primary beneficiary of either VIE. The Company’s maximum exposure to loss is its investment in Donlin Gold LLC and Galore Creek Partnership.
The equity method is a basis of accounting for investments whereby the investment is initially recorded at cost and the carrying value is adjusted thereafter to include the investor’s pro rata share of post-acquisition earnings or losses of the investee, as computed by the consolidation method. Cash funding increases the carrying value of the investment. Profit distributions received or receivable from an investee reduce the carrying value of the investment.
Donlin Gold LLC and the Partnership are non-publicly traded equity investees in exploration and development projects. Therefore, the Company assesses whether there has been a potential impairment triggering event for other-than-temporary impairment by testing the underlying assets of the equity investee for recoverability and assessing whether there has been a change in the development plan or strategy for the project. If we determine underlying assets are recoverable and no other potential impairment conditions are identified, then our investment in the equity investee is carried at cost. If the other underlying assets are not recoverable, we record an impairment charge equal to the difference between the carrying amount of the investee and its fair value. We determine fair value based on the present value of future cash flows expected to be generated by the project. If reliable cash flow information is not available, we determine fair value using a market comparable approach.
Share-based payments
The Company operates a stock option plan and a performance share unit plan, under which the Company receives services from employees as consideration for equity instruments (options or shares) of the Company. The fair value for the options and share units are recognized in earnings over the related service period. The total amount to be expensed related to options is determined by reference to the fair value of the options granted including any market performance conditions and the impact of any non-vesting conditions; and excluding the impact of any service and non-market performance vesting conditions.
Non-market vesting conditions are included in assumptions about the number of options that are expected to vest. At the end of each reporting period, the Company revises its estimates of the number of options that are expected to vest based on the non-market vesting conditions. It recognizes the impact of the revision to original estimates, if any, in profit and loss, with a corresponding adjustment to equity. The fair value of stock options is estimated at the time of grant using the Black
‐
Scholes option pricing model, and the fair value of the PSUs is measured at the grant date using a Monte Carlo simulation, which takes into account, as of the grant date, the fair market value of the common shares, expected volatility, expected dividend yield and the risk
‐
free interest rate over the life of the PSU, to generate potential outcomes for share prices which are used to estimate the probability of the PSUs vesting at the end of the performance measurement period.
The cash subscribed for the common shares issued when the options are exercised is credited to share capital, net of any directly attributable transaction costs.
76
The Company grants its directors deferred share units (DSUs), whereby each DSU entitles the directors to receive one common share of the Company when they retire from the Company. The fair value of the DSUs is measured at the date of the grant in amounts ranging from 50% to 100% of directors’ annual retainers at the election of the directors. The fair value is recognized in consolidated statement of income (loss) over the related service period.
Net income (loss) per common share
Basic and diluted income (loss) per share are presented for Net income (loss) and for Income (loss) from continuing operations. Basic income (loss) per share is computed by dividing Net income (loss) or Income (loss) from continuing operations by the weighted-average number of outstanding common shares for the period. Diluted income per share reflects the potential dilution that could occur if securities or other contracts that may require the issuance of common shares in the future were converted. Diluted income per share is computed by increasing the weighted-average number of outstanding common shares to include the additional common shares that would be outstanding after conversion and adjusting net income for changes that would result from the conversion. Only those securities or other contracts that result in a reduction in earnings per share are included in the calculation.
Recently issued accounting pronouncements
Presentation of an Unrecognized Tax Benefit When a Net Operating Loss Carryforward, a Similar Tax Loss, or a Tax Credit Carryforward Exists
In July 2013, the FASB issued guidance related to the financial statement presentation of an unrecognized tax benefit, a similar tax loss, or a tax credit carryforward. The new standard requires that an unrecognized tax benefit, or a portion of an unrecognized tax benefit, be presented in the financial statements as a reduction to a deferred tax asset for a net operating loss carryforward, a similar tax loss, or a tax credit carryforward unless certain circumstances exist. The standard is effective for the Company as of December 1, 2014, with early adoption permitted. The adoption of this guidance is not expected to have a significant impact on the Company’s consolidated financial position, results of operations or cash flows.
Foreign Currency Matters
In March 2013, ASC guidance was issued related to Foreign Currency Matters to clarify the treatment of cumulative translation adjustments when a parent sells a part or all of its investment in a foreign entity or no longer holds a controlling financial interest in a subsidiary or group of assets that is a business within a foreign entity. The updated guidance also resolves the diversity in practice for the treatment of business combinations achieved in stages in a foreign entity. The update is effective prospectively for the Company’s fiscal year beginning December 1, 2015. The Company does not expect the updated guidance to have an impact on the consolidated financial position, results of operations or cash flows.
Reporting of Amounts Reclassified out of Accumulated Other Comprehensive Income
In February 2013, the FASB issued guidance related to items reclassified from accumulated other comprehensive income. The new standard requires either in a single note or parenthetically on the face of the financial statements: (i) the effect of significant amounts reclassified from each component of accumulated other comprehensive income based on its sources; and (ii) the income statement line items affected by the reclassification. The standard will be effective for the Company as of December 1, 2013. The adoption of this guidance is not expected to have a significant impact on the Company’s consolidated financial position, results of operations or cash flows.
Disclosures about Offsetting Assets and Liabilities
In November 2011, ASC guidance was issued related to disclosures about offsetting assets and liabilities. The new standard requires disclosures to allow investors to better compare financial statements prepared under US GAAP with financial statements prepared under IFRS. In January 2013, an update was issued to further clarify that the disclosure requirements are limited to derivatives, repurchase agreements, and securities lending transactions to the extent that they are (i) offset in the financial statements or (ii) subject to an enforceable master netting arrangement or similar agreement. The update is effective prospectively for the Company’s fiscal year beginning December 1, 2015. The Company does not expect the updated guidance to have an impact on the consolidated financial position, results of operations or cash flows.
77
Operating segments are reported in a manner consistent with the internal reporting provided to the chief operating decision-maker. The chief operating decision-maker, who is responsible for allocating resources and assessing performance of the operating segments, has been identified as the Chief Executive Officer that makes strategic decisions. The Company has one operating segment in exploration and development of mineral properties. The Chief Executive Officer considers the business from a geographic perspective considering the performance of our investments in affiliates. Segment information is provided on each of the material projects individually in Note 5.
| At November, 2013 | ||||||||||||||||
|
Cost
|
Unrealized
|
Fair Value
|
||||||||||||||
|
Basis
|
Gain
|
Loss
|
Basis
|
|||||||||||||
|
Current:
|
||||||||||||||||
| $ | 110,000 | $ | — | $ | — | $ | 110,000 | |||||||||
|
Long-term:
|
||||||||||||||||
|
Marketable equity securities
|
$ | 1,067 | $ | 213 | $ | — | $ | 1,280 | ||||||||
| At November 30, 2012 | ||||||||||||||||
|
Cost
|
Unrealized
|
Fair Value
|
||||||||||||||
|
Basis
|
Gain
|
Loss
|
Basis
|
|||||||||||||
|
Long-term:
|
||||||||||||||||
|
Marketable equity securities
|
$ | 4,067 | $ | 552 | $ | (2,222 | ) | $ | 2,397 | |||||||
|
Other investments, at cost
|
503 | — | — | 503 | ||||||||||||
| $ | 4,570 | $ | 552 | $ | (2,222 | ) | $ | 2,900 | ||||||||
Marketable debt securities include term deposits held at two large Canadian financial institutions with original maturities of less than 12 months.
Marketable equity securities include available-for-sale investments in mineral exploration companies. During 2013, the Company recognized impairments for other-than-temporary declines in value of $2,738 for marketable equity securities and to write-off $489 of other investments, at cost. At November 30, 2013 all unrealized losses were in a continuous loss position for less than 12 months.
|
At November 30,
|
||||||||
|
2013
|
2012
|
|||||||
|
Donlin Gold LLC, Alaska, USA
|
$ | 1,720 | $ | 4,185 | ||||
|
Galore Creek Partnership, British Columbia, Canada
|
305,735 | 335,086 | ||||||
| $ | 307,455 | $ | 339,271 | |||||
In July 2012, the Board of Directors approved the commencement of permitting of the Donlin Gold project as contemplated in the NI 43-101 compliant technical report entitled “Donlin Creek Gold Project, Alaska, USA, NI 43-101 Technical Report on Second Updated Feasibility Study” dated effective November 18, 2011. The Company has not realized any revenue from operations. The Company will be primarily engaged in development of the Donlin Gold project and exploration and evaluation of the Galore Creek project until the Company commences the production stage at the Donlin Gold project.
Donlin Gold LLC
On December 1, 2007, together with Barrick Gold US Inc., the Company formed Donlin Gold LLC to advance the Donlin Gold project in Alaska. Donlin Gold LLC has a board of four directors, with two nominees selected by each company. All significant decisions related to Donlin Gold LLC require the approval of both companies. The Company has a 50% interest in Donlin Gold LLC.
Changes in the Company’s investment in Donlin Gold LLC are summarized as follows:
|
Years ended November 30,
|
||||||||||||
|
2013
|
2012
|
2011
|
||||||||||
|
Balance – beginning of period
|
$ | 4,185 | $ | 2,675 | $ | 1,970 | ||||||
|
Funding
|
12,155 | 18,439 | 22,382 | |||||||||
|
Share of losses
|
(14,620 | ) | (16,929 | ) | (21,677 | ) | ||||||
|
Balance – end of period
|
$ | 1,720 | $ | 4,185 | $ | 2,675 | ||||||
78
The following amounts represent the Company’s 50% share of the assets and liabilities of Donlin Gold LLC. Donlin Gold LLC capitalized the initial contribution of the Donlin Creek property with a carrying value of $64,000. The 50% share of Donlin Gold LLC’s assets and liabilities is shown on this basis below. Therefore, the Company’s investment in the Donlin Gold project does not equal 50% of the net assets recorded by Donlin Gold LLC:
|
At November 30,
|
||||||||
|
2013
|
2012
|
|||||||
|
Current assets: Cash, prepaid expenses and other receivables
|
$ | 3,390 | $ | 4,836 | ||||
|
Non-current assets: Property and equipment
|
541 | 732 | ||||||
|
Non-current assets: Mineral property
|
32,692 | 32,692 | ||||||
|
Current liabilities: Accounts payable and accrued liabilities
|
(2,211 | ) | (1,383 | ) | ||||
|
Non-current liabilities: Reclamation
|
(692 | ) | (692 | ) | ||||
|
Net assets
|
$ | 33,720 | $ | 36,185 | ||||
Galore Creek Partnership
The Galore Creek Partnership was formed in May 2007. Teck earned its 50% interest in the Galore Creek project upon completion of its funding commitment of C$373,300 in June 2011 (“reconsideration event”). Commencing June 2011, the partners funded the project costs on a 50/50 basis.
Under ASC guidance, upon a reconsideration event, an entity is required to reassess whether an entity is a Variable Interest Entity (VIE) when the holders of the entity lose power to direct the activities that most significantly impact the entity’s economic performance and whether a variable interest holder is a primary beneficiary. The reconsideration event resulted in a loss of the Company’s primary beneficiary status upon Teck completing their earn-in obligations under the partnership agreement. Prior to the completion of the earn-in, if Teck had failed to the meet their obligations, the Company would have had the power to exercise control. Following the reconsideration event, the Company and Teck share joint control of the Partnership. All future costs are funded equally between the partners. The Company determined the fair value of the Partnership at the date of the reconsideration event, deconsolidated the Partnership and commenced equity accounting for its share of the investment. The fair value represented the net present value at May 31, 2011 of the discounted projected future cash flow of the Galore Creek project assuming gold, copper and silver prices of $1,100 per ounce, $2.66 per pound, and $18.50 per ounce, respectively and a discount rate of 7%. As a result, the Company recognized a gain of $154,173 on deconsolidation of its investment in the Partnership.
|
At June 1, 2011
|
||||
|
Company’s fair value for 50% of Galore Creek Partnership
|
$ | 354,429 | ||
|
Company’s book value for 50% of Galore Creek Partnership
|
200,256 | |||
|
Gain on deconsolidation
|
$ | 154,173 | ||
The determination of the estimated fair value of the equity investment in the Partnership required management to make estimates and assumptions of future events. These estimates and assumptions affect the reported amount of the investment and the reported amount of the gain recognized upon fair valuing the equity investment in the Partnership. Significant estimates include future commodity prices, future foreign exchange rates, various operational assumptions, and recovery rates. Actual results could differ materially from those reported.
Changes in the Company’s investment in the Partnership are summarized as follows:
|
Years ended November 30,
|
||||||||||||
|
2013
|
2012
|
2011
|
||||||||||
|
Balance – beginning of period
|
$ | 335,086 | $ | 333,380 | $ | — | ||||||
|
Fair value of 50% interest on deconsolidation
|
— | — | 354,429 | |||||||||
|
Funding
|
6,638 | 16,303 | 14,149 | |||||||||
|
Share of losses
|
(13,352 | ) | (23,401 | ) | (17,423 | ) | ||||||
|
Foreign currency translation
|
(22,637 | ) | 8,804 | (17,775 | ) | |||||||
|
Balance – end of period
|
$ | 305,735 | $ | 335,086 | $ | 333,380 | ||||||
The following amounts represent the Company’s 50% share of the assets and liabilities of the Partnership. As a result of the gain on deconsolidation, the carrying value of the Company’s 50% interest in the Partnership was higher than 50% of the book value of the Partnership. Therefore, the Company’s investment in the Partnership does not equal 50% of the net assets recorded by the Partnership:
79
|
At November 30,
|
||||||||
|
2013
|
2012
|
|||||||
|
Current assets: Cash, prepaid expenses and other receivables
|
$ | 377 | $ | 1,516 | ||||
|
Non-current assets: Property and equipment
|
263,797 | 281,073 | ||||||
|
Current liabilities: Accounts payable and accrued liabilities
|
(483 | ) | (1,245 | ) | ||||
|
Non-current liabilities: payables and decommissioning liabilities
|
(8,533 | ) | (9,087 | ) | ||||
|
Net assets
|
$ | 255,158 | $ | 272,257 | ||||
Equity loss of affiliates:
|
Years ended November 30,
|
||||||||||||
|
2013
|
2012
|
2011
|
||||||||||
|
Donlin Gold LLC:
|
||||||||||||
|
Mineral property expenditures
|
$ | 14,412 | $ | 16,753 | $ | 21,563 | ||||||
|
Depreciation
|
208 | 176 | 114 | |||||||||
| 14,620 | 16,929 | 21,677 | ||||||||||
|
Galore Creek Partnership:
|
||||||||||||
|
Mineral property expenditures
|
4,580 | 11,984 | 11,526 | |||||||||
|
Care and maintenance expense
|
2,444 | 4,952 | 1,167 | |||||||||
|
Depreciation
|
6,328 | 6,465 | 4,730 | |||||||||
| 13,352 | 23,401 | 17,423 | ||||||||||
| $ | 27,972 | $ | 40,330 | $ | 39,100 | |||||||
|
At November 30,
|
||||||||
|
2013
|
2012
|
|||||||
|
Copper Canyon, B.C., Canada
|
$ | 54,813 | $ | 58,587 | ||||
|
San Roque, Argentina
|
— | 513 | ||||||
| $ | 54,813 | $ | 59,100 | |||||
Copper Canyon
On May 20, 2011, under a plan of arrangement the Company acquired all of the issued and outstanding common shares of Copper Canyon Resources Inc. (“Copper Canyon”). Copper Canyon owns 40% of the Copper Canyon property in B.C., Canada adjacent to the Galore Creek project. The remaining 60% of the Copper Canyon property is owned by the Partnership. Consideration for the purchase included 0.0735 of a NOVAGOLD common share and $0.001 in cash for each common share of Copper Canyon. The Company issued 4,171,303 common shares to Copper Canyon shareholders valued at a price of C$10.15 per share, the closing price of the Company’s shares on the TSX on the closing date of the transaction, and paid the shareholders of Copper Canyon $58.
The excess of consideration over book value acquired attributed to mineral properties allocated as follows:
|
At May 20, 2011
|
||||
|
Issuance of 4,171,303 NOVAGOLD common shares
|
$ | 43,512 | ||
|
Cost of subscription of shares in Copper Canyon
|
2,382 | |||
|
Cash consideration
|
58 | |||
|
Total consideration
|
45,952 | |||
|
Less: net working capital acquired
|
(493 | ) | ||
|
Add: deferred income tax liability
|
14,813 | |||
| $ | 60,272 | |||
San Roque
The Company recorded a write-down of $514 related to its San Roque, Argentina mineral property in the third quarter of 2013.
80
|
At November 30,
|
||||||||
|
2013
|
2012
|
|||||||
|
Convertible notes
|
$ | 13,570 | $ | 73,606 | ||||
|
Promissory note
|
71,728 | 68,106 | ||||||
| 85,298 | 141,712 | |||||||
|
Less: current portion
|
— | (73,606 | ) | |||||
| $ | 85,298 | $ | 68,106 | |||||
Scheduled minimum debt repayments are $nil in 2014, $15,829 in 2015, $nil in 2016 through 2018, and $85,298 thereafter. The carrying value of the debt approximates fair value.
Convertible notes
On March 26, 2008, the Company issued $95,000 in 5.5% unsecured senior convertible notes (“Notes”) maturing on May 1, 2015, and incurred a 3.0% underwriter’s fee and other expenses aggregating $2,800, for net proceeds of $92,200. Interest is payable semi-annually in arrears on May 1 and November 1 of each year, beginning November 1, 2008. The conversion rate and accordingly the number of shares issuable were adjusted as a result of the NovaCopper Inc. ("NovaCopper") spin-out which reduced the conversion rate from $10.61 to $9.656 per common share. On conversion, at the Company’s election, holders of the Notes will receive cash, if applicable, or a combination of cash and shares.
On May 2, 2013, the Company purchased $72,821 of the principal amount of its Notes, pursuant to the terms and indenture governing the Notes which provided Holders the opportunity to require the Company to purchase for cash all or a portion of their Notes (the "Put Option") on May 1, 2013. On September 16, 2013, the Company accepted Holders’ offers to purchase another $6,350 of the principal amount of the Notes. Following the Company’s purchases of the Notes, $15,829 of the principal amount of the Notes remain outstanding and due on May 1, 2015 and 1,639,370 common shares remain issuable upon conversion. Additional common shares may become issuable following the occurrence of certain corporate acts or events. The terms and other provisions of the indenture governing the Notes remain unchanged.
As the conversion price of the Notes is denominated in U.S. dollars, a currency different from the functional currency of the Company, an embedded derivative is recognized as a liability. The embedded derivative is recorded at fair value and re-measured each period with the movement being recorded as a gain or loss in net income (loss). The Notes are classified as a liability, less the portion relating to the embedded derivative feature. As a result, the recorded liability to repay the Notes is lower than its face value. Using the effective interest rate method and the 17.3% rate implicit in the calculation, the remaining difference of $3,700, characterized as the Note discount, is being charged to interest expense and accreted to the liability over the term of the Notes.
The Notes included two embedded derivatives which have been recorded on the balance sheets at fair value. Prior to May 1, 2013, the embedded derivative was measured with regard to both the Put option and the conversion feature. Subsequent to this date, the measurement of the embedded derivative is based solely on the conversion feature.
Changes in the carrying values of the Notes are summarized as follows:
|
Years ended November 30,
|
||||||||||||
|
2013
|
2012
|
2011
|
||||||||||
|
Balance – beginning of period
|
$ | 73,606 | $ | 66,966 | $ | 61,342 | ||||||
|
Repurchases of Notes
|
(65,137 | ) | — | — | ||||||||
|
Accretion expense
|
5,101 | 6,640 | 5,624 | |||||||||
|
Balance – end of period
|
$ | 13,570 | $ | 73,606 | $ | 66,966 | ||||||
The following table provides the net amounts recognized in the Consolidated Balance Sheets related to the Notes:
|
At November 30,
|
||||||||
|
2013
|
2012
|
|||||||
|
Principal amount
|
$ | 15,829 | $ | 95,000 | ||||
|
Unamortized debt discount
|
(2,259 | ) | (21,394 | ) | ||||
| 13,570 | 73,606 | |||||||
|
Embedded derivative
|
83 | 17,934 | ||||||
|
Net carrying amount
|
$ | 13,653 | $ | 91,540 | ||||
81
Promissory note
As part of the Donlin Gold LLC agreement, the Company agreed to reimburse Barrick over time approximately $64,300, representing 50% of Barrick’s expenditures of $128,600 on the Donlin Gold Project from April 1, 2006 to November 30, 2007. The Company reimbursed Barrick for $12,700 of project development costs during 2008. A promissory note for the remaining $51,600 plus interest at a rate of US prime plus 2% will be paid out of NOVAGOLD’s share of future mine production cash flow. The Company has recorded $20,128 in accrued interest since the inception of the promissory note. At November 30, 2013, the promissory note had a carrying value of $71,728. Interest of $3,622 (2012: $3,400) for the year ended November 30, 2013 was expensed. Both parties are currently sharing development costs on a 50/50 basis.
|
At November 30,
|
||||||||
|
2013
|
2012
|
|||||||
|
Convertible notes – Embedded derivative
|
$ | 83 | $ | 17,934 | ||||
|
Warrants – Derivative
|
— | 15,276 | ||||||
| 83 | 33,210 | |||||||
|
Less: current portion
|
— | (33,210 | ) | |||||
| $ | 83 | $ | — | |||||
Convertible notes – Embedded derivative
The conversion price of the Notes is denominated in U.S. dollars, a currency different from the functional currency of the Company. Therefore, an embedded derivative liability is recorded at fair value and re-measured each period with the movement being recorded as a gain or loss in Net income (loss). The fair value of the embedded derivative is composed of the conversion feature of the Note and the put option. The Company had assessed the embedded derivative within the Note to be the difference between the fair value of the Note and the discounted value of the cash flows resulting from the potential exercise of the Put Option. The derivative was accounted for in this manner until the May 1, 2013 put option expired as described above. Subsequent to this date, the measurement of the embedded derivative is based solely on the conversion feature.
|
Years ended November 30,
|
||||||||||||
|
2013
|
2012
|
2011
|
||||||||||
|
Balance – beginning of period
|
$ | 17,934 | $ | 57,493 | $ | 88,138 | ||||||
|
Gain on embedded derivative liability for the period
|
(3,817 | ) | (39,559 | ) | (30,645 | ) | ||||||
|
Repurchases of Notes
|
(14,034 | ) | — | — | ||||||||
|
Balance – end of period
|
$ | 83 | $ | 17,934 | $ | 57,493 | ||||||
Warrants – Derivative
The Company’s functional currency is the Canadian dollar and it had issued and outstanding warrants with an exercise price denominated in U.S. dollars. The Company determined that such warrants with an exercise price denominated in a currency that is different from the entity’s functional currency were classified as a derivative liability based on the evaluation of the warrant’s settlement provisions, and carried at their fair value. Any changes in the fair value from period to period have been recorded as a gain or loss in net income (loss).
In January 2011, an agreement was entered into between the Company and the holder of 37.1 million warrants to amend the currency that the exercise price was denominated in from U.S. dollars to Canadian dollars. The exercise price was amended from $1.50 to C$1.479 at the prevailing spot rate on the date of the agreement. The expiry date remained unchanged at January 21, 2013. The conversion of the exercise price of these warrants to U.S. dollars permanently crystallized the fair value of these warrants, for purposes of determining future transfers to share capital upon exercise of these warrants. The terms of the remaining 5.1 million warrants were unchanged.
In the first quarter of 2013, all of NOVAGOLD’s remaining warrants were exercised and the Company realized a loss on derivative liability of $2,461 for the year ended November 30, 2013.
82
|
Years ended November 30,
|
||||||||||||
|
2013
|
2012
|
2011
|
||||||||||
|
Balance – beginning of period
|
$ | 15,276 | $ | 51,963 | $ | 641,895 | ||||||
|
Loss (gain) on derivative liability
|
2,461 | (36,687 | ) | (31,039 | ) | |||||||
|
Foreign exchange revaluation
|
— | — | (469,694 | ) | ||||||||
|
Conversion of warrants to equity
|
(17,737 | ) | — | (89,199 | ) | |||||||
|
Balance – end of period
|
$ | — | $ | 15,276 | $ | 51,963 | ||||||
Financial instruments measured at fair value are classified into one of three levels in the fair value hierarchy according to the significance of the inputs used in making the measurement. The three levels of the fair value hierarchy are as follows:
|
|
Level 1
— Unadjusted quoted prices in active markets that are accessible at the measurement date for identical, unrestricted assets or liabilities;
|
|
|
Level 2
—
Quoted prices in markets that are not active, or inputs that are observable, either directly or indirectly, for substantially the full term of the asset or liability; and
|
|
|
Level 3
— Prices or valuation techniques that require inputs that are both significant to the fair value measurement and unobservable (supported by little or no market activity).
|
|
Fair value at November 30, 2013
|
||||||||||||||||
|
Total
|
Level 1
|
Level 2
|
Level 3
|
|||||||||||||
|
Assets:
|
||||||||||||||||
|
Cash equivalents
|
$ | 81,262 | $ | — | $ | 81,262 | $ | — | ||||||||
|
Marketable debt securities
|
110,000 | — | 110,000 | — | ||||||||||||
|
Marketable equity securities
|
1,280 | 1,280 | — | — | ||||||||||||
|
Liabilities:
|
||||||||||||||||
|
Embedded derivative liabilities
|
83 | — | — | 83 | ||||||||||||
|
Fair value at November 30, 2012
|
||||||||||||||||
|
Total
|
Level 1
|
Level 2
|
Level 3
|
|||||||||||||
|
Assets:
|
||||||||||||||||
|
Cash equivalents
|
$ | 254,667 | $ | — | $ | 254,667 | $ | — | ||||||||
|
Marketable equity securities
|
2,900 | 2,900 | — | — | ||||||||||||
|
Liabilities:
|
||||||||||||||||
|
Derivative liabilities
|
15,276 | — | — | 15,276 | ||||||||||||
|
Embedded derivative liabilities
|
17,934 | — | — | 17,934 | ||||||||||||
The Company’s cash equivalents and marketable debt securities are held with two large Canadian chartered banks with an S&P rating of AA- and are classified as Level 2 of the fair value hierarchy as they are owed to the Company by the Canadian banks and are not traded in an active market.
The Company’s marketable equity securities are valued using quoted market prices in active markets and as such are classified within Level 1 of the fair value hierarchy. The fair value of the marketable equity securities is calculated as the quoted market price of the marketable equity security multiplied by the quantity of shares held by the Company.
The derivative and embedded derivative had been valued using the Black-Scholes pricing model and are considered Level 3 financial instruments in the fair value hierarchy because the value models have significant unobservable inputs (note 8).
83
The Company’s
Income tax expense (recovery)
consisted of:
|
Years ended November 30,
|
||||||||||||
|
2013
|
2012
|
2011
|
||||||||||
|
Current:
|
||||||||||||
|
Canada
|
$ | – | $ | – | $ | – | ||||||
|
Foreign
|
290 | – | – | |||||||||
| $ | 290 | $ | – | $ | – | |||||||
|
Deferred:
|
||||||||||||
|
Canada
|
3,606 | (7,748 | ) | 15,356 | ||||||||
|
Foreign
|
– | – | – | |||||||||
| 3,606 | (7,748 | ) | 15,356 | |||||||||
|
Income tax expense (recovery)
|
$ | 3,896 | $ | (7,748 | ) | $ | 15,356 | |||||
The Company’s
Income (loss) before income tax
consisted of:
|
Years ended November 30,
|
||||||||||||
|
2013
|
2012
|
2011
|
||||||||||
|
Canada
|
$ | (42,077 | ) | $ | 6,528 | $ | 118,285 | |||||
|
Foreign
|
(16,787 | ) | (21,862 | ) | (24,694 | ) | ||||||
| $ | (58,864 | ) | $ | (15,334 | ) | $ | 93,591 | |||||
Effective January 1, 2011, the Canadian Federal corporate tax rate decreased from 18% to 16.5% and the British Columbia provincial tax decreased from 10.5% to 10%. Effective January 1, 2012 the Canadian federal corporate tax rate decreased from 16.5% to 15%. Effective April 1, 2013 the British Columbia provincial corporate tax rate increased from 10% to 11%.
The Company’s
Income tax expense (recovery)
differed from the amounts computed by applying the Canadian statutory corporate income tax rates for the following reasons:
|
|
Years ended November 30,
|
|||||||||||
|
2013
|
2012
|
2011
|
||||||||||
|
Income (loss) before income taxes
|
$ | (58,864 | ) | $ | (15,334 | ) | $ | 93,591 | ||||
|
Combined federal and provincial statutory tax rate
|
25.67 | % | 25.13 | % | 26.67 | % | ||||||
|
Income tax expense (recovery) based on statutory income tax rates
|
(15,110 | ) | (3,853 | ) | 24,961 | |||||||
|
Increase (decrease) attributable to:
|
||||||||||||
|
(Non-deductible) taxable expenditures
|
2,913 | (3,717 | ) | 9,334 | ||||||||
|
Non-taxable unrealized gain (loss) on derivative financial instruments
|
615 | (9,253 | ) | (7,673 | ) | |||||||
|
Effect of different statutory tax rates on earnings of subsidiaries
|
(2,773 | ) | (3,471 | ) | 5,696 | |||||||
|
Effect of statutory rate change
|
(1,916 | ) | 54 | (3,040 | ) | |||||||
|
Change in valuation allowance
|
20,248 | 13,271 | (6,302 | ) | ||||||||
|
Non-controlling interest
|
– | – | 4,906 | |||||||||
|
Tax benefit generated on tax planning
|
– | – | (15,026 | ) | ||||||||
|
Other
|
(81 | ) | (779 | ) | 2,500 | |||||||
|
Income tax expense (recovery )
|
$ | 3,896 | $ | (7,748 | ) | $ | 15,356 | |||||
84
Components of the Company’s deferred income tax assets (liabilities) are as follows:
|
At November 30,
|
||||||||
|
2013
|
2012
|
|||||||
|
Deferred tax income assets:
|
||||||||
|
Asset retirement obligation
|
$ | 3,257 | $ | 1,886 | ||||
|
Net operating loss carry forwards
|
215,346 | 203,176 | ||||||
|
Capital loss carry forwards
|
40,180 | 41,774 | ||||||
|
Mineral properties
|
20,278 | 19,447 | ||||||
|
Property and equipment
|
381 | 4,226 | ||||||
|
Investment in affiliates
|
40,200 | 34,887 | ||||||
|
Share issuance costs
|
2,168 | 3,109 | ||||||
|
Unpaid interest expense
|
3,044 | 3,043 | ||||||
|
Investment tax credit
|
3,553 | 3,201 | ||||||
|
Other
|
2,322 | 1,496 | ||||||
|
|
330,729 | 316,245 | ||||||
|
Valuation allowances
|
(276,630 | ) | (260,492 | ) | ||||
| 54,099 | 55,753 | |||||||
|
Deferred income tax liabilities:
|
||||||||
|
Convertible debt
|
(197 | ) | (516 | ) | ||||
|
Investment in affiliates
|
(51,601 | ) | (50,349 | ) | ||||
|
Mineral properties
|
(14,224 | ) | (14,733 | ) | ||||
|
Capitalized assets & other
|
(719 | ) | (166 | ) | ||||
|
Unrealized gain on investments
|
(19 | ) | (55 | ) | ||||
|
Investment tax credit
|
(914 | ) | (801 | ) | ||||
| (67,674 | ) | (66,620 | ) | |||||
|
Net deferred income tax liabilities
|
$ | (13,575 | ) | $ | (10,867 | ) | ||
|
Net deferred income tax asset, as presented in the
balance sheet
|
$ | 9,728 | $ | 15,679 | ||||
|
Net deferred income tax liability, as presented in the
balance sheet
|
$ | (23,303 | ) | $ | (26,546 | ) | ||
Net operating losses available to offset future taxable income are as follows:
|
Year of Expiry
|
U.S.
|
Canada (C$)
|
||||||
|
2014
|
$ | – | $ | 5,661 | ||||
|
2015
|
– | 17,704 | ||||||
|
2024
|
1,032 | – | ||||||
|
2025
|
1,246 | – | ||||||
|
2026
|
13,382 | 30,803 | ||||||
|
2027
|
18,493 | 4,948 | ||||||
|
2028
|
85 | 653 | ||||||
|
2029
|
11,223 | 15,387 | ||||||
|
2030
|
10,916 | 22,138 | ||||||
|
2031
|
16,212 | 20,770 | ||||||
|
2032
|
306,661 | 36,388 | ||||||
|
2033
|
11,646 | 55,454 | ||||||
| $ | 390,896 | $ | 209,906 | |||||
Future use of U.S. loss carry-forwards is subject to certain limitations under provisions of the Internal Revenue Code including limitations subject to Section 382, which relates to a 50% change in control over a three-year period, and are further dependent upon the Company attaining profitable operations. Ownership changes occurred on January 22, 2009 and on December 31, 2012 and the U.S. tax losses related to NOVAGOLD Resources Alaska Inc. and its investment in Donlin Creek LLC for the prior three year periods prior to the change in control may be subject to limitation under Section 382. Accordingly, the Company's ability to use these losses may be limited or may expire un-utilized. Losses incurred to date may be further limited if a subsequent change in control occurs.
85
Uncertain Tax Position
There were no unrecognized tax benefits at November 30, 2013, 2012 and 2011. The Company recognizes any interest and penalties related to uncertain tax positions, if any, as interest expense. At November 30, 2013, 2012 and 2011, there were no interest and penalties related to uncertain tax positions. The Company is subject to income taxes in Canada and the United States. The Company is currently under audit by the Canada Revenue Agency regarding transactions undertaken by one of the Company’s Canadian entities. The Company is currently not under audit by any other taxing jurisdiction. With few exceptions, the tax years that remain subject to examination as of November 30, 2013 are 2008 to 2013 in Canada and 1998 to 2013 in the United States.
The Company has recognized $9,728 (2012: $15,679, 2011: $14,550) of deferred tax assets that are dependent on the reversal of existing taxable temporary differences. In addition, the Company has suffered a loss in the current and prior period in the tax jurisdictions to which the deferred tax assets relate. The Company has undertaken a tax planning strategy in the current and prior period to merge their Canadian entities when required to access the deferred tax assets to offset future increases in taxable income of their Canadian entities.
Management assesses the available positive and negative evidence to estimate if sufficient future taxable income will be generated to use the existing deferred tax asset. Significant pieces of objective negative evidence evaluated included the cumulative loss incurred as at December 31, 2013 and the decline in metal prices. Such objective evidence limits the ability to consider other subjective evidence such as managements' projections for future growth. On the basis of this evaluation, as of December 31, 2013, a valuation allowance of $276,630 (2012: $260,492, 2011: $225,127) inclusive of valuation allowance for investment tax credits has been recorded in order to measure only the portion of the deferred tax asset that more likely than not will be realized. The amount of the deferred tax asset considered realizable; however, could be adjusted if estimates of future taxable income during the carry forward period are reduced or if objective negative evidence in the form of cumulative losses is no longer present and additional weight may be given to subjective evidence such as Management's projections for growth.
|
Years ended November 30,
|
||||||||||||
|
2013
|
2012
|
2011
|
||||||||||
|
Salaries
|
$ | 6,067 | $ | 9,658 | $ | 9,295 | ||||||
|
Share-based compensation (note 15)
|
12,304 | 19,862 | 8,987 | |||||||||
|
Office expense
|
4,462 | 4,891 | 2,834 | |||||||||
|
Professional fees
|
2,889 | 3,871 | 4,613 | |||||||||
|
Corporate development
|
1,269 | 863 | 489 | |||||||||
| $ | 26,991 | $ | 39,145 | $ | 26,218 | |||||||
In 2013, the Company recorded write-downs of $514 related to its mineral property and $262 for other assets at its San Roque Project in Argentina. In 2011, prior to the deconsolidation of Galore Creek, the Company recorded a write-down of $39,643 related to power transmission rights at the Galore Creek Project due to the approval of a federal and provincial government plan to build a high-capacity transmission line.in northwestern British Columbia.
86
|
Years ended November 30,
|
||||||||||||
|
2013
|
2012
|
2011
|
||||||||||
|
Decrease (increase) in receivables and other assets
|
$ | (89 | ) | $ | (12,339 | ) | $ | 5,505 | ||||
|
Increase (decrease) in accounts payable and accrued liabilities
|
(1,231 | ) | 11,938 | (1,419 | ) | |||||||
|
Decrease in reclamation and remediation liabilities
|
(268 | ) | — | — | ||||||||
| $ | (1,588 | ) | $ | (401 | ) | $ | 4,086 | |||||
On April 30, 2012, the Company completed a plan of arrangement under the Nova Scotia Companies Act pursuant to which it spun-out NovaCopper, a wholly-owned subsidiary of the Company which held the Ambler assets in Alaska, to the Company’s shareholders (the “Arrangement”). Under the Arrangement, each shareholder of the Company received one share of NovaCopper for every six common shares held of the Company. The Company did not realize any gain or loss on the transfer of the Ambler assets including $40,200 of working capital and the Upper Kobuk Mineral Project.
On November 1, 2012, the Company completed the sale of its wholly owned subsidiary, Alaska Gold Company (AGC), which owned the Rock Creek Project and other assets in and around Nome, Alaska to Bering Straits Native Corporation (BSNC) for $5,965. The Company received $1,000 cash and a $4,965 (face value) note receivable bearing 3% interest payable over five years. The Company also transferred the remaining Rock Creek closure reclamation deposit of $13,400 to BSNC, which assumed full responsibility and liability for the remainder of the Rock Creek reclamation activities as requested by the State of Alaska.
The Company has accounted for the financial results associated with the spin-out of NovaCopper and the Ambler assets and the former operations of AGC and the Rock Creek Project as discontinued operations in these consolidated financial statements and has reclassified the related amounts for prior years.
The following tables illustrate the results related to discontinued operations.
|
Years ended November 30,
|
||||||||||||
|
2013
|
2012
|
2011
|
||||||||||
|
Revenues
|
$ | — | $ | 1,914 | $ | 913 | ||||||
|
Operating expenses:
|
||||||||||||
|
Cost of sales
|
— | 194 | 219 | |||||||||
|
Depreciation
|
— | 228 | 306 | |||||||||
|
Exploration and evaluation
|
— | 1,425 | 7,925 | |||||||||
|
General and administrative
|
— | 3,647 | 4,832 | |||||||||
|
Care and maintenance
|
— | 5,498 | 12,622 | |||||||||
|
Write-down of inventory
|
— | — | 7,022 | |||||||||
|
Reclamation and remediation
|
— | 1,456 | 20,788 | |||||||||
| — | 12,448 | 53,714 | ||||||||||
|
Loss from operations
|
— | (10,534 | ) | (52,801 | ) | |||||||
|
Gain on sale of assets
|
— | 5,351 | 19,109 | |||||||||
|
Other income
|
— | 940 | 598 | |||||||||
|
Loss from discontinued operations
|
$ | — | $ | (4,243 | ) | $ | (33,094 | ) | ||||
87
|
Years ended November 30,
|
||||||||||||
|
2013
|
2012
|
2011
|
||||||||||
|
Net cash used in discontinued operations:
|
||||||||||||
|
Loss from discontinued operations
|
$ | — | $ | (4,243 | ) | $ | (33,094 | ) | ||||
|
Items not affecting cash:
|
||||||||||||
|
Depreciation
|
— | 228 | 306 | |||||||||
|
Reclamation and remediation
|
— | 1,456 | 20,788 | |||||||||
|
Write-down of inventory
|
— | — | 7,022 | |||||||||
|
Gain on sale of assets
|
— | (5,351 | ) | (19,109 | ) | |||||||
|
Net change in operating assets and liabilities
|
— | (10,742 | ) | (2,072 | ) | |||||||
|
Increase in reclamation bond
|
— | (6,836 | ) | — | ||||||||
| $ | — | $ | (25,488 | ) | $ | (22,015 | ) | |||||
|
Net cash provided from (used in) investing activities of discontinued operations:
|
||||||||||||
|
Proceeds from sale of assets
|
$ | — | $ | 1,045 | $ | 11,879 | ||||||
|
Additions to property, plant and equipment
|
— | (561 | ) | (3,573 | ) | |||||||
|
Acquisition of mineral property
|
— | — | (4,000 | ) | ||||||||
| $ | — | $ | 483 | $ | 4,306 | |||||||
|
Net cash used in financing activities of discontinued operations:
|
||||||||||||
|
Funding of NovaCopper spin-out
|
$ | — | $ | (40,000 | ) | $ | (24,000 | ) | ||||
Share incentive awards include a stock option plan for directors, executives and eligible employees, a Performance Share Unit (PSU) plan for executives and eligible employees and a Deferred Stock Unit (DSU) plan for directors of the Company. Options granted to purchase common shares have exercise prices not less than fair market value of the underlying share at the date of grant. At November 30, 2013, 17.7 million common shares were available for future share incentive plan awards.
The Company recognized share-based compensation as follows:
|
Years ended November 30,
|
||||||||||||
|
2013
|
2012
|
2011
|
||||||||||
|
Stock options
|
$ | 8,135 | $ | 14,240 | $ | 6,773 | ||||||
|
Performance share unit plan
|
3,935 | 2,660 | 2,080 | |||||||||
|
Deferred share unit plan
|
234 | 193 | 134 | |||||||||
|
Incentive shares
|
— | 2,769 | — | |||||||||
| $ | 12,304 | $ | 19,862 | $ | 8,987 | |||||||
At November 30, 2013, the non-vested stock option and PSU expense not recognized was $2,854 (2012: $6,692) to be recognized over the next two years.
88
Stock Options
Stock options granted under the Company’s share-based incentive plans vest over periods of two years are exercisable over a period of time not to exceed five years from the grant date. The value of each option award is estimated at the grant date using the Black-Scholes option pricing model. The Black-Scholes option pricing model requires the input of subjective assumptions, including the expected term of the option award and share price volatility. The expected term of options granted is derived from historical data on employee exercise and post-vesting employment termination experience. Expected volatility is based on the historical volatility of the Company’s shares at the grant date. These estimates involve inherent uncertainties and the application of management’s judgment. In addition, we are required to estimate the expected forfeiture rate and only recognize expense for those options expected to vest. As a result, if other assumptions had been used, our recorded share-based compensation expense would have been different from that reported. The Black-Scholes option pricing model used the following weighted-average assumptions:
|
Years ended November 30,
|
|||||
|
2013
|
2012
|
2011
|
|||
|
Weighted average share price
|
C$4.40
|
C$8.68
|
C$13.91
|
||
|
Average risk-free interest rate
|
1.07%
|
0.99% - 1.53%
|
1.05% - 2.11%
|
||
|
Exercise price
|
C$4.40
|
C$8.68
|
C$13.91
|
||
|
Expected life (years)
|
3
|
2.5 – 3.5
|
2.5 – 3.5
|
||
|
Expected volatility
|
56%
|
55% - 66%
|
70% - 81%
|
||
|
Expected dividends
|
Nil
|
Nil
|
Nil
|
||
The following table summarizes annual activity for all stock options for each of the three years ended November 30:
|
2013
|
2012
|
2011
|
|||||||||
|
Number of shares
|
Weighted average exercise price
|
Number of shares
|
Weighted average exercise price
|
Number of shares
|
Weighted average exercise price
|
||||||
|
Outstanding at beginning of year
|
13,903
|
C$7.08
|
10,849
|
C$7.06
|
11,338
|
C$6.09
|
|||||
|
Granted
|
3,218
|
C$4.40
|
4,613
|
C$8.68
|
1,280
|
C$13.91
|
|||||
|
Exercised
|
(121)
|
C$2.23
|
(1,027)
|
C$3.13
|
(1,475)
|
C$4.61
|
|||||
|
Forfeited and expired
|
(1,777)
|
C$7.22
|
(532)
|
C$10.86
|
(294)
|
C$11.69
|
|||||
|
Outstanding at end of year
|
15,223
|
C$6.54
|
13,903
|
C$7.08
|
10,849
|
C$7.06
|
|||||
The weighted-average fair value per share of options granted during the year was C$4.40 in 2013, C$8.68 in 2012 and C$13.91 in 2011.
At November 30, 2013, there were 2,507,193 (2012: 2,964,920) non-vested options outstanding with a weighted average exercise price of C$5.92 (2012: C$7.08). During the year ended November 30, 2013, 3,385,320 (2012: 2,166,160) options vested.
The following table summarizes information about stock options outstanding and exercisable at November 30, 2013:
|
Stock options - issued and outstanding
|
Stock options - exercisable
|
|||||||||
|
Range of price
|
Number of outstanding options
|
Weighted average years to expiry
|
Weighted average exercise price
|
Number of exercisable options
|
Weighted average exercise price
|
|||||
|
C$ 2.23 to $ 3.99
|
1,272,480
|
0.10
|
C$2.23
|
1,272,480
|
C$2.23
|
|||||
|
C$ 4.00 to $ 5.99
|
7,642,052
|
2.57
|
C$4.78
|
6,039,914
|
C$4.83
|
|||||
|
C$ 6.00 to $ 7.99
|
2,110,300
|
2.74
|
C$6.56
|
1,554,966
|
C$6.38
|
|||||
|
C$ 8.00 to $ 9.99
|
560,000
|
1.13
|
C$8.07
|
560,000
|
C$8.07
|
|||||
|
C$10.00 to $11.99
|
2,092,382
|
2.97
|
C$10.22
|
1,742,661
|
C$10.23
|
|||||
|
C$12.00 to $13.99
|
1,395,400
|
2.11
|
C$13.08
|
1,395,400
|
C$13.08
|
|||||
|
C$14.00 to $15.04
|
150,000
|
3.54
|
C$14.89
|
150,000
|
C$14.89
|
|||||
|
15,222,614
|
2.36
|
C$6.54
|
12,715,421
|
C$6.66
|
||||||
89
Performance share units
The Company has a PSU plan that provides for the issuance of PSUs in amounts as approved by the Company’s Compensation Committee. Each PSU entitles the participant to receive a common share of the Company at the end of a specified period. The Compensation Committee may adjust the number of common shares for the achievement of certain performance and vesting criteria. The actual performance against each of these criteria generates a multiplier that varies from 0% to 150%. Thus, the common shares that may be issued vary between 0% and 150% of the number of PSUs granted, as reduced by the amounts for participants no longer with the Company on vesting date.
The following table summarizes annual information about the number of PSUs outstanding:
|
Years ended November 30,
|
||||||||||||
|
2013
|
2012
|
2011
|
||||||||||
|
Outstanding at beginning of year
|
805,300 | 347,350 | 135,700 | |||||||||
|
Granted
|
706,150 | 584,800 | 244,000 | |||||||||
|
Vested
|
(167,735 | ) | (154,746 | ) | — | |||||||
|
Performance adjustment
|
(72,765 | ) | 38,396 | — | ||||||||
|
Forfeited
|
(2,500 | ) | (10,500 | ) | (32,350 | ) | ||||||
|
Outstanding at end of year
|
1,268,450 | 805,300 | 347,350 | |||||||||
The PSUs outstanding at November 30, 2013 are scheduled to vest over the next two years.
For the year ended November 30, 2013, the Company recognized a share-based compensation charge against income of $3,935 (2012: $2,660; 2011: $2,080) for PSUs. Under the PSU plan, the Company issued 96,497 common shares in 2013 (2012: 86,949; 2011: nil). The difference between the PSUs vested and the common shares issued were settled in cash to cover employee withholding taxes. The Company also issued 197,076 common shares to the Company’s former CEO in January 2012 and 81,310 common shares to the Company’s former COO in December 2012 plan for severance.
Deferred share units
The Company has a DSU plan that provides for the issuance of DSUs in amounts where the Directors receive half of their annual retainer in
DSUs and have the option to elect to receive all or a portion of the other half
of their annual retainer in DSUs. Each DSU entitles the Directors to receive one common share when they retire from the Company.
For the year ended November 30, 2013, the Company recognized a share-based payment charge against income of $234 (2012: $193 and 2011: $134) for the DSUs granted to Directors during the year. Under the DSU plan, the Company issued 7,750 common shares in 2013 and 4,261 common shares in 2012 and nil common shares in 2011. The common shares were issued at the date of the
DSU
vesting and the valuation was deemed to be the opening TSX common share price of the vesting date.
Incentive shares
The Company
recognized share-based payment charge against income of $2,769 in 2012 for incentive shares issued to new employees. The Company issued 224,740 common shares in 2012 and paid $1,152 for employee withholding taxes. The common shares were issued at the date of the new executive officers’ employment agreements and the valuation was deemed to be the opening TSX common share price on the date of issuance.
90
Common shares
The Company has authorized 1,000,000,000 no par value common shares of which 316,661,000 were issued and outstanding as of November 30, 2013.
Preferred shares
Pursuant to the Company’s
Notice of Articles filed pursuant to the Business Corporations Act (British Columbia)
, the Company is authorized to issue 10,000,000 preferred shares. The authorized but unissued preferred shares may be issued in designated series from time to time by one or more resolutions adopted by the Directors. The Directors have the authority to determine the preferences, limitations and relative rights of each series of preferred shares. At November 30, 2013 and 2012, no preferred shares were issued or outstanding.
Net income (loss) per common share
Basic income (loss) per common share is computed by dividing income (loss) available to the Company’s common shareholders by the weighted average number of common shares outstanding for the period. Diluted income per common share is computed similarly to basic income per common share except that income from continuing operations is adjusted to exclude gains that would be eliminated if potentially dilutive common shares had been issued and the weighted average common shares outstanding is increased to include the number of additional common shares that would have been outstanding if the potentially dilutive common shares had been issued.
|
Years ended November 30,
|
||||||||||||
|
2013
|
2012
|
2011
|
||||||||||
|
Net income (loss):
|
||||||||||||
|
Continuing operations
|
$ | (62,760 | ) | $ | (7,586 | ) | $ | 78,235 | ||||
|
Discontinued operations
|
— | (4,243 | ) | (33,094 | ) | |||||||
| $ | (62,760 | ) | $ | (11,829 | ) | $ | 45,141 | |||||
|
Continuing operations
|
$ | (62,760 | ) | $ | (7,586 | ) | $ | 78,235 | ||||
|
Add: Interest on convertible debt
|
n/a | n/a | 10,849 | |||||||||
|
Less: Gain on derivative liability
|
n/a | n/a | (31,039 | ) | ||||||||
|
Diluted income from continuing operations
|
$ | (62,760 | ) | $ | (7,586 | ) | $ | 58,045 | ||||
|
Weighted average common shares (thousands):
|
||||||||||||
|
Basic
|
313,372 | 272,243 | 236,124 | |||||||||
|
Effect of employee share-based awards
|
n/a | n/a | 4,809 | |||||||||
|
Effect of convertible debt
|
n/a | n/a | 195 | |||||||||
|
Effect of warrants
|
n/a | n/a | 36,448 | |||||||||
|
Diluted
|
313,372 | 272,243 | 277,576 | |||||||||
|
Income per common share
|
||||||||||||
|
Basic:
|
||||||||||||
|
Continuing operations
|
$ | (0.20 | ) | $ | (0.03 | ) | $ | 0.33 | ||||
|
Discontinued operations
|
— | (0.02 | ) | (0.14 | ) | |||||||
| $ | (0.20 | ) | $ | (0.05 | ) | $ | 0.19 | |||||
|
Diluted:
|
||||||||||||
|
Continuing operations
|
$ | (0.20 | ) | $ | (0.03 | ) | $ | 0.21 | ||||
|
Discontinued operations
|
— | (0.02 | ) | (0.14 | ) | |||||||
| $ | (0.20 | ) | $ | (0.05 | ) | $ | 0.07 | |||||
91
|
Years ended November 30,
|
||||||||||||||||||||||||
|
2013
|
2012
|
2011
|
||||||||||||||||||||||
|
Number of warrants (thousands)
|
Weighted average exercise price
|
Number of warrants (thousands)
|
Weighted average exercise price
|
Number of warrants (thousands)
|
Weighted average exercise price
|
|||||||||||||||||||
|
Balance – beginning of year
|
36,529 | $ | 1.48 | 40,420 | $ | 1.49 | 49,345 | $ | 1.65 | |||||||||||||||
|
Exercised
|
(36,529 | ) | $ | 1.48 | (3,891 | ) | $ | 1.48 | (8,925 | ) | $ | 1.48 | ||||||||||||
|
Balance – end of year
|
— | — | 36,529 | $ | 1.48 | 40,420 | $ | 1.49 | ||||||||||||||||
Share purchase warrants were exercised for total proceeds of $54,359, $5,743 and $13,477 in 2013, 2012 and 2011, respectively.
At November 30, 2013 there were no share purchase warrants outstanding.
|
At November 30,
|
||||||||
|
2013
|
2012
|
|||||||
|
Unrealized loss on marketable securities, net of $29 and $61 tax expense, respectively
|
$ | 184 | $ | (1,731 | ) | |||
|
Foreign currency translation adjustments
|
64,320 | 99,039 | ||||||
| $ | 64,504 | $ | 97,308 | |||||
The Company provided exploration and management services to Donlin Gold LLC for $258 in 2013, $236 in 2012 and $600 in 2011; office rental and services to the Partnership for $423 in 2013, $796 in 2012 and $886 in 2011; and management and office administration services to NovaCopper for $168 in 2013 and $83 in 2012.
As of November 30, 2013, the Company has accounts receivable from Donlin Gold LLC of $1,750 (2012: $nil) and from the Partnership of $1,690 (2012: $138) included in other current assets and a receivable of $4,132 (2012: $4,417) from the Partnership included in other long-term assets.
General
The Company follows ASC guidance in determining its accruals and disclosures with respect to loss contingencies. Accordingly, estimated losses from loss contingencies are accrued by a charge to income when information available prior to issuance of the financial statements indicates that it is probable that a liability could be incurred and the amount of the loss can be reasonably estimated. Legal expenses associated with the contingency are expensed as incurred. If a loss contingency is not probable or reasonably estimable, disclosure of the loss contingency is made in the financial statements when it is at least reasonably possible that a material loss could be incurred.
Obligations under operating leases
The Company leases certain assets, such as office equipment and office facilities, under operating leases expiring at various dates through 2017. Future minimum annual lease payments are $440 in 2014, $445 in 2015, $401 in 2016, $336 in 2017, totaling $1,622. Rent expense for 2013, 2012 and 2011 was $740, $589 and $554, respectively.
92
|
Years ended November 30,
|
||||||||||||
|
2013
|
2012
|
2011
|
||||||||||
|
Interest received
|
$ | 630 | $ | 588 | $ | 580 | ||||||
|
Interest paid
|
3,164 | 5,180 | 5,361 | |||||||||
|
Non-cash investing activities
|
||||||||||||
|
Note receivable from BSNC from sale of AGC (note14)
|
— | 4,965 | — | |||||||||
|
Issuance of 4,171,303 common shares for the acquisition of Copper Canyon (note 6)
|
— | — | 43,512 | |||||||||
Quarterly data
The following is a summary of selected quarterly financial information (unaudited):
|
2013
|
|||||||||||||
|
Q1
|
Q2
|
Q3
|
Q4
|
||||||||||
|
Operating income (loss)
|
$
|
(14,509
|
)
|
$
|
(12,225
|
)
|
$
|
(15,871
|
)
|
$
|
(13,171
|
)
|
|
|
Income (loss) from continuing operations
|
$
|
(13,776
|
)
|
$
|
(9,833
|
)
|
$
|
(19,962
|
)
|
$
|
(19,189
|
)
|
|
|
Income (loss) from discontinued operations
|
$
|
—
|
$
|
—
|
$
|
—
|
$
|
—
|
|||||
|
Net income (loss)
|
$
|
(13,776
|
)
|
$
|
(9,833
|
)
|
$
|
(19,962
|
)
|
$
|
(19,189
|
)
|
|
|
Income (loss) per common share
|
|||||||||||||
|
Basic:
|
|||||||||||||
|
Continuing operations
|
$
|
(0.05
|
)
|
$
|
(0.03
|
)
|
$
|
(0.06
|
)
|
$
|
(0.06
|
)
|
|
|
Discontinued operations
|
—
|
—
|
—
|
—
|
|||||||||
|
$
|
(0.05
|
)
|
$
|
(0.03
|
)
|
$
|
(0.06
|
)
|
$
|
(0.06
|
)
|
||
|
Diluted:
|
|||||||||||||
|
Continuing operations
|
$
|
(0.05
|
)
|
$
|
(0.03
|
)
|
$
|
(0.06
|
)
|
$
|
(0.06
|
)
|
|
|
Discontinued operations
|
—
|
—
|
—
|
—
|
|||||||||
|
$
|
(0.05
|
)
|
$
|
(0.03
|
)
|
$
|
(0.06
|
)
|
$
|
(0.06
|
)
|
||
|
2012
|
|||||||||||||
|
Q1
|
Q2
|
Q3
|
Q4
|
||||||||||
|
Operating income (loss)
|
$
|
(22,415
|
)
|
$
|
(17,315
|
)
|
$
|
(23,851
|
)
|
$
|
(16,361
|
)
|
|
|
Income (loss) from continuing operations
|
$
|
21,292
|
$
|
20,979
|
$
|
(14,716
|
)
|
$
|
(35,141
|
)
|
|||
|
Income (loss) from discontinued operations
|
$
|
(5,514
|
)
|
$
|
(5,966
|
)
|
$
|
2,320
|
$
|
4,917
|
|||
|
Net income (loss)
|
$
|
15,778
|
$
|
15,013
|
$
|
(12,396
|
)
|
$
|
(30,224
|
)
|
|||
|
Income (loss) per common share
|
|||||||||||||
|
Basic:
|
|||||||||||||
|
Continuing operations
|
$
|
0.09
|
$
|
0.08
|
$
|
(0.05
|
)
|
$
|
(0.13
|
)
|
|||
|
Discontinued operations
|
(0.02
|
)
|
(0.02
|
)
|
0.01
|
0.02
|
|||||||
|
$
|
0.07
|
$
|
0.06
|
$
|
(0.04
|
)
|
$
|
(0.11
|
)
|
||||
|
Diluted:
|
|||||||||||||
|
Continuing operations
|
$
|
0.03
|
$
|
0.03
|
$
|
(0.06
|
)
|
$
|
(0.12
|
)
|
|||
|
Discontinued operations
|
(0.02
|
)
|
(0.02
|
)
|
0.01
|
0.02
|
|||||||
|
$
|
0.01
|
$
|
0.01
|
$
|
(0.05
|
) |
$
|
(0.10
|
)
|
||||
Significant after-tax items were as follows:
|
Fourth quarter 2013:
|
(i) Income tax expense $3,896 ($0.01 per share, basic and diluted).
|
|
Third quarter 2013:
|
(i) Write-down of marketable securities $2,645 ($0.01 per share, basic and diluted).
|
|
Second quarter 2013:
|
(i) Gain on derivative liabilities $3,667 ($0.01 per share, basic and diluted).
|
|
First quarter 2013:
|
(i) Loss on derivative liabilities $3,276 ($0.01 per share, basic and diluted); (ii) gain from discontinued operations $4,917 ($0.02 per share, basic and diluted).
|
|
Fourth quarter 2012:
|
(i) Loss on derivative liabilities $9,001 ($0.03 per share, basic and diluted).
|
|
Third quarter 2012:
|
(i) Gain on derivative liabilities $10,052 ($0.04 per share, basic and $0.03, diluted).
|
|
Second quarter 2012:
|
(i) Gain on derivative liabilities $31,156 ($0.11 per share, basic and $0.10 per share, diluted); (ii) loss from discontinued operations $5,966 ($0.02 per share, basic and diluted).
|
|
First quarter 2012:
|
(i) Gain on derivative liabilities $44,039 ($0.18 per share, basic and $0.15 per share, diluted); (ii) loss from discontinued operations $5,514 ($0.02 per share, basic and diluted).
|
93
Item 9.
Changes in and Disagreements with Accountants on Accounting and Financial Disclosure
None.
Item 9A.
Controls and Procedures
An evaluation was performed under the supervision and with the participation of our management, including our principal executive officer and principal financial officer, of the effectiveness of our disclosure controls and procedures (as defined in Rules 13a-15(e) and 15d-15(e) under the Securities Exchange Act of 1934) as of the end of the period covered by this Annual Report on Form 10-K. Based on the foregoing, our management concluded that our disclosure controls and procedures are effective to ensure that information required to be disclosed by us in reports that we file or submit under the Exchange Act is recorded, processed, summarized and reported within the time periods specified in the Securities and Exchange Commission rules and forms and such information is accumulated and communicated to our management, including our principal executive officer and principal financial officer, to allow timely decisions regarding required disclosure.
There was no change in our internal control over financial reporting that occurred during the quarter ended November 30, 2013 that has materially affected, or is reasonably likely to materially affect, our internal control over financial reporting.
REPORT OF MANAGEMENT ON INTERNAL CONTROL OVER FINANCIAL REPORTING
Our management is responsible for establishing and maintaining adequate internal control over financial reporting for the Company. Internal control over financial reporting is a process to provide reasonable assurance regarding the reliability of our financial reporting and the preparation of financial statements for external purposes in accordance with accounting principles generally accepted in the United States of America. Internal control over financial reporting includes maintaining records that in reasonable detail accurately and fairly reflect our transactions; providing reasonable assurance that transactions are recorded as necessary for preparation of our financial statements; providing reasonable assurance that receipts and expenditures of our assets are made in accordance with management’s authorization; and providing reasonable assurance that unauthorized acquisition, use or disposition of our assets that could have a material effect on the financial statements would be prevented or detected on a timely basis. Because of its inherent limitations, internal control over financial reporting is not intended to provide absolute assurance that a misstatement of our financial statements would be prevented or detected.
Management conducted its evaluation of the effectiveness of our internal controls over financial reporting based on the framework in Internal Control — Integrated Framework issued in 2013 by the Committee of Sponsoring Organizations of the Treadway Commission. Based on this evaluation, management concluded that our internal control over financial reporting was effective as of November 30, 2013.
The effectiveness of our assessment of internal control over financial reporting as of November 30, 2013 has been audited by PricewaterhouseCoopers LLP, an independent registered public accounting firm, as stated in their report which appears herein.
Item 9B.
Other Information
None.
94
Item 10.
Directors, Executive Officers and Corporate Governance
Information concerning this item is contained in our definitive Proxy Statement, filed pursuant to Regulation 14A promulgated under the Securities Exchange Act of 1934 for the 2014 Annual Meeting of Shareholders and is incorporated herein by reference.
We have adopted a Code of Ethics that applies to our Chief Executive Officer, Chief Financial Officer and Corporate Controller or persons performing similar functions. This Code of Ethics is posted on our website (www.novagold.com). We intend to satisfy the disclosure requirement under Item 5.05 of Form 8-K regarding an amendment to, or waiver from, a provision of the Code of Ethics that applies to our principal executive officer, principal financial officer, principal accounting officer or controller, or persons performing similar functions, by posting such information on the our website, at the address specified above.
Our Code of Business Conduct and Ethics, and charters for each Committee of our Board are also available on our website. The Code of Ethics, Code of Business Conduct and Ethics and charters are also available in print to any stockholder who submits a request to: Corporate Secretary, NOVAGOLD RESOURCES INC., 789 West Pender Street, Suite 720, Vancouver, British Columbia, Canada V6C 1H2.
Information on our website is not deemed to be incorporated by reference into this Annual Report on Form 10-K.
Item 11.
Executive Compensation
Information concerning this item is contained in our definitive Proxy Statement, filed pursuant to Regulation 14A promulgated under the Securities Exchange Act of 1934 for the 2014 Annual Meeting of Stockholders and is incorporated herein by reference.
Item 12.
Security Ownership of Certain Beneficial Owners and Management and Related Stockholder Matters
Information concerning this item is contained in our definitive Proxy Statement, filed pursuant to Regulation 14A promulgated under the Securities Exchange Act of 1934 for the 2014 Annual Meeting of Stockholders and is incorporated herein by reference.
The following table provides information as of November 30, 2013, regarding compensation plans under which equity securities of the Company are authorized for issuance.
|
Plan category
|
Number of securities to be issued upon exercise of outstanding options, warrants and rights
|
Weighted-average exercise price of outstanding options, warrants and rights
|
Number of securities remaining available for future issuance under equity compensation plans (excluding securities reflected in column (a))
|
|
(a)
|
(b)
|
(c)
|
|
|
Equity compensation plans approved by security holders
|
16,598,639
|
C$6.54
|
17,657,205
|
|
Equity compensation plans not approved by security holders
|
—
|
—
|
—
|
|
Total
|
16,598,639
|
C$6.54
|
17,657,205
|
Item 13.
Certain Relationships and Related Transactions, and Director Independence
Information concerning this item is contained in our definitive Proxy Statement, filed pursuant to Regulation 14A promulgated under the Securities Exchange Act of 1934 for the 2014 Annual Meeting of Stockholders and is incorporated herein by reference.
95
Item 14.
Principal Accountant Fees and Services
Information concerning this item is contained in our definitive Proxy Statement, filed pursuant to Regulation 14A promulgated under the Securities Exchange Act of 1934 for the 2014 Annual Meeting of Stockholders and is incorporated herein by reference.
96
Item 15.
Exhibits and Financial Statement Schedules
(a)(1) Financial Statements
|
Page
|
|
|
Reports of Independent Registered Public Accounting Firm
|
69
|
|
Consolidated Balance Sheets
|
70
|
|
Consolidated Statements of Income (Loss)
|
71
|
|
Consolidated Statements of Comprehensive Income (Loss)
|
72
|
|
Consolidated Statements of Cash Flows
|
73 |
|
Consolidated Statements of Stockholders’ Equity (Deficit)
|
74
|
|
Notes to Consolidated Financial Statements
|
75
|
Schedule A – The Financial Statements of Donlin Gold LLC as at November 30, 2013 and 2012 and for the years ended November 30, 2013, 2012 and 2011.
Schedule B – The Financial Statements of the Galore Creek Partnership as at December 31, 2013 and 2012 and for the years ended December 31, 2013, 2012 and 2011.
No other financial statement schedules are filed as part of this report because such schedules are not applicable or the required information is shown in the Consolidated Financial Statements or notes thereto. See “Item 8. Financial Statements and Supplementary Data”.
(a)(3) Executive Compensation Plans and Arrangements
Employment Agreement between the Registrant and Gregory A. Lang, dated January 9, 2012, identified in exhibit list below.
Employment Agreement between NOVAGOLD Resources Alaska, Inc. (a wholly-owned subsidiary of the Registrant) and Gregory A. Lang dated January 9, 2012, identified in exhibit list below.
Employment Agreement between the Registrant and David Deisley, dated September 4, 2012, identified in exhibit list below.
Employment Agreement between NOVAGOLD USA, INC. (a wholly-owned subsidiary of the Registrant) and David Deisley, dated September 4, 2012, identified in exhibit list below.
Employment Agreement between the Registrant and David Ottewell, dated September 10, 2012, identified in exhibit list below.
2004 Stock Award Plan of NOVAGOLD Resources Inc. (as amended) identified in exhibit list below.
NOVAGOLD Resources Inc. Employee Share Purchase Plan identified in exhibit list below.
NOVAGOLD Resources Inc. 2009 Performance Share Unit Plan identified in exhibit list below.
NOVAGOLD Resources Inc. 2009 Non-Employee Directors Deferred Share Unit Plan identified in exhibit list below.
(b) Exhibits
|
Exhibit
No.
|
Description
|
|
|
3.1
|
Certificate of Continuance (British Columbia) dated June 10, 2013 (incorporated by reference to Exhibit 99.1 to the Form 6-K dated June 19, 2013)
|
|
|
3.2
|
Certificate of Discontinuance (Nova Scotia) dated June 10, 2013(incorporated by reference to Exhibit 99.2 to the Form 6-K dated June 19, 2013)
|
|
|
3.3
|
Notice of Articles (British Columbia) dated June 10, 2013 (incorporated by reference to Exhibit 99.3 to the Form 6-K dated June 19, 2013)
|
|
|
3.4
|
Articles of NOVAGOLD RESOURCES INC. dated June 20, 2013 (incorporated by reference to Exhibit 99.4 to the Form 6-K dated June 19, 2013)
|
97
|
10.1
|
Underwriting Agreement dated February 2, 2012 between RBC Dominion Securities Inc. and J.P. Morgan Securities LLC (incorporated by reference to Exhibit 99.1 to the Form 6-K dated February 2, 2012)
|
|
|
Amendment dated January 13, 2010 to Limited Liability Company Agreement dated December 1, 2007 between Donlin Gold LLC, Barrick Gold U.S. Inc. and NOVAGOLD Resources Alaska, Inc.
|
||
|
10.3
|
Amendment dated February 11, 2009 to Galore Creek Partnership General Partnership Agreement dated August 1, 2007 (incorporated by reference to Exhibit 99.2 to the Form 6-K dated February 17, 2009)
|
|
|
10.4
|
Unit Purchase Agreement dated December 31, 2008 between Electrum and NOVAGOLD (incorporated by reference to Exhibit 99.1 to the Form 6-K dated February 13, 2009)
|
|
|
Amendment dated July 28, 2008 to Galore Creek Partnership General Partnership Agreement dated August 1, 2007 between NOVAGOLD Canada Inc., Teck Cominco Metals Ltd., Galore Creek Mining Corporation, NOVAGOLD Resources Inc. and Teck Cominco Limited
|
||
|
10.6
|
Indenture dated as of March 26, 2008 between NOVAGOLD and The Bank of New York (incorporated by reference to Exhibit 99.1 to the Registrant’s Report of Foreign Private Issuer on Form 6-K filed on March 26, 2008)
|
|
|
10.7
|
Supplemental Indenture No. 1 dated as of March 26, 2008 to the Indenture between NOVAGOLD and The Bank of New York providing for the issuance of the Notes (incorporated by reference to Exhibit 99.1 to the Form 6-K dated March 26, 2008)
|
|
|
Limited Liability Company Agreement dated December 1, 2007 between Donlin Gold LLC, Barrick Gold U.S. Inc. and NOVAGOLD Resources Alaska, Inc.
|
||
|
Amendment dated November 25, 2007 to Galore Creek Partnership General Partnership Agreement dated August 1, 2007 between NOVAGOLD Canada Inc., Teck Cominco Metals Ltd., Galore Creek Mining Corporation, NOVAGOLD Resources Inc. and Teck Cominco Limited
|
||
|
Galore Creek Partnership General Partnership Agreement dated August 1, 2007 between NOVAGOLD Canada Inc., Teck Cominco Metals Ltd., Galore Creek Mining Corporation, NOVAGOLD Resources Inc. and Teck Cominco Limited
|
||
|
10.11
|
2004 Stock Award Plan of NOVAGOLD Resources Inc. (as amended) (incorporated by reference to Appendix A of Exhibit 99.2 of the Registrant’s report on Form 6-K as filed on April 29, 2009)
|
|
|
NOVAGOLD Resources Inc. Employee Share Purchase Plan
|
||
|
10.13
|
NOVAGOLD Resources Inc. 2009 Performance Share Unit Plan (incorporated by reference to Appendix C of Exhibit 99.2 of the Registrant’s report on Form 6-K as filed on April 29, 2009)
|
|
|
NOVAGOLD Resources Inc. 2009 Non-Employee Directors Deferred Share Unit Plan
|
||
|
Employment Agreement between the Registrant and Gregory A. Lang, dated January 9, 2012.
|
||
|
Employment Agreement between the Registrant and David Deisley, dated September 4, 2012.
|
||
|
Employment Agreement between the Registrant’s wholly-owned subsidiary, NovaGold USA, Inc., and David Ottewell, dated September 10, 2012.
|
||
|
Amendment dated July 15, 2010 to Limited Liability Company Agreement dated December 1, 2007 between Donlin Gold LLC, Barrick Gold U.S. Inc. and NOVAGOLD Resources Alaska, Inc.
|
||
|
Amendment dated June 1, 2011 to Limited Liability Company Agreement dated December 1, 2007 between Donlin Gold LLC, Barrick Gold U.S. Inc. and NOVAGOLD Resources Alaska, Inc.
|
||
|
Employment Agreement between the Registrant’s wholly-owned subsidiary, NovaGold Resources Alaska, Inc., and Gregory A. Lang, dated January 9, 2012.
|
||
|
Employment Agreement between the Registrant’s wholly-owned subsidiary, NovaGold USA, Inc., and David Deisley, dated September 4, 2012.
|
||
|
Subsidiaries of the registrant
|
||
|
Consent of PricewaterhouseCoopers LLP
|
||
|
Consent of Robert Gill
|
||
|
Consent of Kirk Hanson
|
98
|
Consent of Greg Kulla
|
||
|
Consent of Tony Lipiec
|
||
|
Consent of Jay Melnyk
|
||
|
Consent of Dana Rogers
|
||
|
Consent of Gordon Seibel
|
||
|
Consent of Gregory Wortman
|
||
|
Consent of AMEC
|
||
| 23.11 | Consent of Heather White | |
|
Certification pursuant to Section 302 of the Sarbanes-Oxley Act of 2002
|
||
|
Certification pursuant to Section 302 of the Sarbanes-Oxley Act of 2002
|
||
|
Certification pursuant to Section 906 of the Sarbanes-Oxley Act of 2002
|
||
|
Certification pursuant to Section 906 of the Sarbanes-Oxley Act of 2002
|
99
SIGNATURES
Pursuant to the requirements of Section 13 or 15(d) of the Securities Exchange Act of 1934, the registrant has duly caused this report to be signed on its behalf by the undersigned, thereunto duly authorized.
| NOVAGOLD RESOURCES INC. | |
| By: /s/ Gregory A. Lang | |
| Name: Gregory A. Lang | |
| Title: President and Chief Executive Officer |
Date: February 12, 2014
Pursuant to the requirements of the Securities Exchange Act of 1934, this report has been signed below by the following persons on behalf of the registrant and in the capacities and on the dates indicated:
|
Signature
|
Title
|
Date
|
|
|
/s/ Gregory A. Lang
|
President, Chief Executive Officer and
Director (Principal Executive Officer)
|
February 12, 2014
|
|
|
/s/ David Ottewell
|
Vice President and Chief Financial Officer
(Principal Financial Officer and Principal
Accounting Officer)
|
February 12, 2014
|
|
|
/s/ Thomas S. Kaplan
|
Chairman
|
February 12, 2014
|
|
|
/s/ Sharon Dowdall
|
Director
|
February 12, 2014
|
|
|
/s/ Marc Faber
|
Director
|
February 12, 2014
|
|
|
/s/ Gillyeard J. Leathley
|
Director
|
February 12, 2014
|
|
|
/s/ Igor Levental
|
Director
|
February 12, 2014
|
|
|
/s/ Kalidas V. Madhavpeddi
|
Director
|
February 12, 2014
|
100
| Signature | Title | Date | |
|
/s/ Gerald J. McConnell
|
Director
|
February 12, 2014
|
|
|
/s/ Clynton R. Nauman
|
Director
|
February 12, 2014
|
|
|
/s/ Rick Van Nieuwenhuyse
|
Director
|
February 12, 2014
|
|
|
/s/ Anthony P. Walsh
|
Director
|
February 12, 2014
|
|
101

February 7, 2014
Report of Independent Registered Public Accounting Firm
To the Shareholders of Donlin Gold LLC
We have audited the accompanying balance sheets of Donlin Gold LLC as of November 30, 2013 and 2012
and the related results of operations, statements of equity, and cash flows for each of the years ended
2013, 2012 and 2011. Management is responsible for these financial statements. Our responsibility is to
express an opinion on these financial statements based on our audits.
We conducted our audits in accordance with the standards of the Public Company Accounting Oversight
Board (United States). Those standards require that we plan and perform the audit to obtain reasonable
assurance about whether the financial statements are free of material misstatement. Our audits of the
financial statements included examining, on a test basis, evidence supporting the amounts and disclosures
in the financial statements, assessing the accounting principles used and significant estimates made by
management, and evaluating the overall financial statement presentation. We were not engaged to
perform an audit of the company’s internal control over financial reporting. Our audits included
consideration of internal control over financial reporting as a basis for designing audit procedures that are
appropriate in the circumstances, but not for the purpose of expressing an opinion on the effectiveness of
the company’s internal control over financial reporting. Accordingly, we express no such opinion. Our
audits also included performing such other procedures as we considered necessary in the circumstances.
We believe that our audits provide a reasonable basis for our opinions.
In our opinion, the financial statements referred to above present fairly, in all material respects, the
financial position of Donlin Gold LLC as of November 30, 2013 and 2012 and the results of its operations
and its cash flows for each of the years in the three-year period ended November 30, 2013 in conformity
with accounting principles generally accepted in the United States of America.
signed “PricewaterhouseCoopers LLP”
Chartered Accountants
PricewaterhouseCoopers LLP
PricewaterhouseCoopers Place, 250 Howe Street, Suite 700, Vancouver, British Columbia, Canada V6C 3S7
T: +1 604 806 7000, F: +1 604 806 7806, www.pwc.com/ca
“PwC” refers to PricewaterhouseCoopers LLP, an Ontario limited liability partnership.
A-1

DONLIN GOLD LLC
(An Exploration Stage Company)
BALANCE SHEETS
|
At November 30,
|
||||||||
|
2013
|
2012
|
|||||||
|
(in thousands)
|
||||||||
|
ASSETS
|
||||||||
|
Cash
|
$ | 6,663 | $ | 9,381 | ||||
|
Prepaid expenses
|
118 | 290 | ||||||
|
Current assets
|
6,781 | 9,671 | ||||||
|
Property and equipment (note 3)
|
1,083 | 1,464 | ||||||
|
Mineral property
|
65,384 | 65,384 | ||||||
|
Total assets
|
$ | 73,248 | $ | 76,519 | ||||
|
LIABILITIES
|
||||||||
|
Accounts payable and accrued liabilities
|
$ | 2,427 | $ | 2,467 | ||||
|
Due to related parties (note 4)
|
1,995 | 299 | ||||||
|
Current liabilities
|
4,422 | 2,766 | ||||||
|
Reclamation and remediation (note 5)
|
1,384 | 1,384 | ||||||
|
Total liabilities
|
5,806 | 4,150 | ||||||
|
Commitments and contingencies (note 6)
|
||||||||
|
EQUITY
|
||||||||
|
Partner contributions
|
286,108 | 261,798 | ||||||
|
Accumulated deficit during exploration stage
|
(218,666 | ) | (189,429 | ) | ||||
|
Total equity
|
67,442 | 72,369 | ||||||
|
Total liabilities and equity
|
$ | 73,248 | $ | 76,519 | ||||
The accompanying notes are an integral part of these financial statements.
Approved by the Members, through its Board of Representatives, of Donlin Gold, LLC.
A-2
DONLIN GOLD LLC
(An Exploration Stage Company)
STATEMENTS OF LOSS AND COMPREHENSIVE LOSS
|
Years ended November 30,
|
From
|
|||||||||||||||
|
2013
|
2012
|
2011
|
Inception
|
|||||||||||||
|
(in thousands)
|
||||||||||||||||
|
Operating expenses:
|
||||||||||||||||
|
General and administrative
|
$ | 7,438 | $ | 8,510 | $ | 7,267 | $ | 40,299 | ||||||||
|
Camp operations and maintenance
|
2,121 | 4,924 | 4,976 | 37,837 | ||||||||||||
|
Community relations
|
2,128 | 2,555 | 2,468 | 10,218 | ||||||||||||
|
Permitting
|
7,816 | 5,479 | 2,557 | 19,186 | ||||||||||||
|
Environmental compliance
|
3,873 | 7,908 | 9,874 | 40,090 | ||||||||||||
|
Feasibility and engineering
|
3,982 | 906 | 14,049 | 51,579 | ||||||||||||
|
Land lease payments
|
1,421 | 2,708 | 1,223 | 7,245 | ||||||||||||
|
Exploration and evaluation
|
— | 521 | 664 | 11,022 | ||||||||||||
|
Depreciation
|
417 | 351 | 227 | 1,215 | ||||||||||||
| 29,196 | 33,862 | 43,305 | 218,691 | |||||||||||||
|
Loss from operations
|
(29,196 | ) | (33,862 | ) | (43,305 | ) | (218,691 | ) | ||||||||
|
Other income (expense):
|
||||||||||||||||
|
Foreign exchange gain (loss)
|
(41 | ) | 5 | (50 | ) | (60 | ) | |||||||||
|
Interest income
|
— | — | — | 85 | ||||||||||||
|
|
(41 | ) | 5 | (50 | ) | 25 | ||||||||||
|
Net loss and comprehensive loss
|
$ | (29,237 | ) | $ | (33,857 | ) | $ | (43,355 | ) | $ | (218,666 | ) | ||||
The accompanying notes are an integral part of these financial statements.
A-3
DONLIN GOLD LLC
(An Exploration Stage Company)
STATEMENTS OF CASH FLOWS
|
Years ended November 30,
|
From
|
|||||||||||||||
|
2013
|
2012
|
2011
|
Inception
|
|||||||||||||
|
(in thousands)
|
||||||||||||||||
|
Operating activities:
|
||||||||||||||||
|
Net loss
|
$ | (29,237 | ) | $ | (33,857 | ) | $ | (43,355 | ) | $ | (218,666 | ) | ||||
|
Adjustments to reconcile net income to net cash used in operating activities:
|
||||||||||||||||
|
Depreciation
|
417 | 351 | 227 | 1,215 | ||||||||||||
|
Foreign exchange (gain) loss
|
41 | (5 | ) | 50 | 60 | |||||||||||
|
Net change in operating assets and liabilities
|
||||||||||||||||
|
Accounts receivable and prepaid expenses
|
172 | (189 | ) | 1 | (118 | ) | ||||||||||
|
Accounts payable and accrued liabilities
|
1,656 | (216 | ) | 135 | 4,422 | |||||||||||
|
Net cash used in operations
|
(26,951 | ) | (33,916 | ) | (42,942 | ) | (213,087 | ) | ||||||||
|
Investing activities:
|
||||||||||||||||
|
Additions to property and equipment
|
(36 | ) | (430 | ) | (792 | ) | (2,298 | ) | ||||||||
|
Net cash used in investing activities
|
(36 | ) | (430 | ) | (792 | ) | (2,298 | ) | ||||||||
|
Financing activities:
|
||||||||||||||||
|
Partners’ contributions
|
24,310 | 36,876 | 44,764 | 222,108 | ||||||||||||
|
Net cash provided from financing activities
|
24,310 | 36,876 | 44,764 | 222,108 | ||||||||||||
|
Effect of exchange rate changes on cash
|
(41 | ) | 5 | (50 | ) | (60 | ) | |||||||||
|
Increase (decrease) in cash during the period
|
(2,718 | ) | 2,535 | 980 | 6,663 | |||||||||||
|
Cash at beginning of period
|
9,381 | 6,846 | 5,866 | — | ||||||||||||
|
Cash at end of period
|
$ | 6,663 | $ | 9,381 | $ | 6,846 | $ | 6,663 | ||||||||
|
Supplemental information:
|
||||||||||||||||
|
Interest received
|
$ | — | $ | — | $ | — | $ | 85 | ||||||||
|
Partners’ initial contribution (non-cash)
|
$ | — | $ | — | $ | — | $ | 64,000 | ||||||||
The accompanying notes are an integral part of these financial statements.
A-4
DONLIN GOLD LLC
(An Exploration Stage Company)
STATEMENTS OF EQUITY
|
Barrick Contributions
|
NOVAGOLD Contributions
|
Accumulated deficit
|
Total equity
|
|||||||||||||
| (in thousands) | ||||||||||||||||
|
At inception December 1, 2007
|
$ | 32,000 | $ | 32,000 | $ | — | $ | 64,000 | ||||||||
|
Partners’ cash contribution
|
58,079 | 58,079 | — | 116,158 | ||||||||||||
|
Net loss from inception to
November 30, 2010
|
— | — | (112,217 | ) | (112,217 | ) | ||||||||||
|
Balance at November 30, 2010
|
$ | 90,079 | $ | 90,079 | $ | (112,217 | ) | $ | 67,941 | |||||||
|
Partners’ cash contribution
|
22,382 | 22,382 | — | 44,764 | ||||||||||||
|
Net loss
|
— | — | (43,355 | ) | (43,355 | ) | ||||||||||
|
Balance at November 30, 2011
|
$ | 112,461 | $ | 112,461 | $ | (155,572 | ) | $ | 69,350 | |||||||
|
Partners’ cash contribution
|
18,438 | 18,438 | — | 36,876 | ||||||||||||
|
Net loss
|
— | — | (33,857 | ) | (33,857 | ) | ||||||||||
|
Balance at November 30, 2012
|
$ | 130,899 | $ | 130,899 | $ | (189,429 | ) | $ | 72,369 | |||||||
|
Partners’ cash contribution
|
12,155 | 12,155 | — | 24,310 | ||||||||||||
|
Net loss
|
— | — | (29,237 | ) | (29,237 | ) | ||||||||||
|
Balance at November 30, 2013
|
$ | 143,054 | $ | 143,054 | $ | (218,666 | ) | $ | 67,442 | |||||||
The accompanying notes are an integral part of these financial statements.
A-5
DONLIN GOLD LLC
(An Exploration Stage Company)
NOTES TO FINANCIAL STATEMENTS
(U.S. dollars in thousands)
Donlin Gold LLC (“Donlin” or the “Company”) operates in the mining industry focused on the exploration and development of the Donlin Gold Project. The Company has no operations or realized revenues from its planned principal business purpose, and in accordance with Financial Accounting Standards Board (FASB) Accounting Standards Codification (ASC) 915 “Development Stage Entities”, presents its financial information as an Exploration Stage Enterprise.
On December 1, 2007, Barrick Gold U.S. Inc. (“Barrick”) and NOVAGOLD Resources Alaska, Inc. (“NOVAGOLD”) formed Donlin as a Delaware limited liability corporation (“LLC”) to advance the Donlin Gold Project in Alaska. Donlin Gold LLC has a board of four directors, with two nominees selected by each company. All significant decisions related to Donlin Gold LLC require the approval of both shareholders. The Company currently depends on Barrick and NOVAGOLD for all of its funding and has received commitments from its shareholders that they will fund the Company for the next 12 months.
The Donlin Gold Project is located in southwestern Alaska on private, Alaska Native-owned mineral and surface land and Alaska state mining claims.
During the year ended November 30, 2013, Donlin Gold LLC continued to advance permitting of the Donlin Gold Project. The Donlin Gold LLC Board of Directors approved of the Project's Updated Feasibility Study in July 2012 and Donlin Gold LLC subsequently submitted a Plan of Operations and the Wetlands Permit Application under Section 404 of the U.S. Clean Water Act to the U.S. Army Corps of Engineers (the “Corps”), formally initiating the permitting process. This permit application triggered the start of the process of preparing an Environmental Impact Statement (“EIS”) under the National Environmental Policy Act (“NEPA”). The Corps, which is the lead agency for the NEPA process, selected URS Alaska Inc., an independent contractor to prepare the EIS. The Corps and URS continue to work towards planned issuance of the draft EIS for public review in late 2014 and issuance of the final EIS and associated permits record of decision in late 2015.
Presentation
These financial statements are presented in United States dollars and have been prepared in accordance with accounting principles generally accepted in the United States (“GAAP”).
Use of estimates
The preparation of the Company’s Financial Statements requires the Company to make estimates and assumptions that affect the reported amounts of assets and liabilities and the related disclosure of contingent assets and liabilities at the date of the financial statements and the reported amounts of revenues and expenses during the reporting period. The more significant areas requiring the use of management estimates and assumptions relate to future cash flow estimates utilized in impairment calculations and environmental, reclamation and closure obligations. The Company bases its estimates on historical experience and on various other assumptions that are believed to be reasonable under the circumstances. Accordingly, actual results will differ from amounts estimated in these financial statements.
Exploration and development stage activities
All direct costs related to the acquisition of mineral property interests are capitalized. Mineral property exploration expenditures are expensed when incurred. When it has been established that a mineral deposit is commercially mineable, an economic analysis has been completed in accordance with SEC Industry Guide 7 and
permits are obtained, the costs subsequently incurred to develop a mine on the property prior to the start of mining operations are capitalized. Capitalized costs will be amortized following commencement of commercial production using the unit of production method over the estimated life of proven and probable reserves.
A-6
DONLIN GOLD LLC
(An Exploration Stage Company)
NOTES TO FINANCIAL STATEMENTS
(U.S. dollars in thousands)
Property and equipment
On initial recognition, property and equipment are valued at cost. Property and equipment are subsequently measured at cost less accumulated depreciation. Depreciation is recorded over the estimated useful life of the assets at the following annual rates:
Computer equipment – 5 years straight line;
Computer software – 5 years straight line;
Furniture and equipment – 5 years straight line; and
Leasehold improvements – straight-line over the lease term.
Additions during the year are depreciated at one-half the annual rates. Depreciation methods, useful lives and residual values are reviewed at each financial year-end and adjusted if appropriate.
Mineral properties
The mineral property was jointly owned by Barrick and NOVAGOLD through an unincorporated joint venture prior to the formation of the LLC. Upon formation of the LLC, the mineral property contributed was recorded based on the predecessor accounting values of Barrick and NOVAGOLD. As such, mineral properties include the historic acquisition cost as the partners’ initial contribution to Donlin Gold LLC. Mineral property expenditures are expensed as incurred except for expenditures associated with the acquisition of mineral property assets through a business combination or asset acquisition.
Asset retirement obligations
The Company records a liability at the time environmental disturbance occurs based on the best estimate of costs for site closure and reclamation activities that the Company is legally or contractually required to remediate. The asset retirement obligation is estimated using expected cash flows based on engineering and environmental reports and accreted to full value over time through periodic charges to income. Adjustments to the reclamation obligation arising from changes in estimates are allocated to the mineral property.
Income taxes
The LLC is not a taxable entity for income tax purposes. Accordingly, no recognition is given to income taxes for financial reporting purposes. Tax on the net income (loss) of Donlin is borne by the owners through the allocation of taxable income (loss). Net income for financial statement purposes may differ significantly from taxable income for the owners as a result of differences between the tax basis and financial reporting basis of assets and liabilities and the taxable income allocation requirements under the shareholders agreement.
Impairment of long-lived assets
Management assesses the possibility of impairment in the carrying value of its long-lived assets whenever events or circumstances indicate that the carrying amounts of the asset or asset group may not be recoverable. Management calculates the estimated undiscounted future net cash flows relating to the asset or asset. When the carrying value of an asset exceeds the related undiscounted cash flows, the asset is written down to its estimated fair value, which is usually determined using discounted future cash flows. Management’s estimates of mineral prices, mineral resources, foreign exchange, production levels and operating capital and reclamation costs are subject to risk and uncertainties that may affect the determination of the recoverability of the long-lived asset. It is possible that material changes could occur that may adversely affect management’s estimates.
A-7
DONLIN GOLD LLC
(An Exploration Stage Company)
NOTES TO FINANCIAL STATEMENTS
(U.S. dollars in thousands)
Trade payables
The fair value of the Company’s financial liabilities, such as accounts payable and accrued liabilities approximates their carrying values at November 30, 2013 due to their short-term nature.
Due to Related Parties
The amounts due to Barrick and NOVAGOLD are non-interest bearing, unsecured and without specified terms of repayment.
|
At November 30,
|
||||||||
|
2013
|
2012
|
|||||||
|
Property and equipment
|
$ | 2,298 | $ | 2,262 | ||||
|
Accumulated depreciation
|
(1,215 | ) | (798 | ) | ||||
| 1,083 | $ | 1,464 | ||||||
Barrick and NOVAGOLD provided management and support services to Donlin Gold LLC as follows:
|
Year ended November 30,
|
||||||||||||
|
2013
|
2012
|
2011
|
||||||||||
|
Barrick
|
$ | 3,044 | $ | 3,263 | $ | 2,985 | ||||||
|
NOVAGOLD
|
258 | 236 | 551 | |||||||||
| $ | 3,302 | $ | 3,499 | $ | 3,536 | |||||||
Amounts payable to related parties were as follows:
|
At November 30,
|
||||||||
|
2013
|
2012
|
|||||||
|
Barrick
|
$ | 226 | $ | 254 | ||||
|
NOVAGOLD
|
1,769 | 45 | ||||||
| $ | 1,995 | $ | 299 | |||||
Although the ultimate amount of the reclamation costs to be incurred cannot be predicted with certainty, the total undiscounted amount of estimated cash flows required to settle the Company’s estimated obligations is $1,384. The amount has not been discounted due to the uncertainty of the timing of the reclamation activities due to the project’s current permitting activities. Significant reclamation and closure activities include rehabilitation and decommissioning of the camp and drill sites.
A-8
DONLIN GOLD LLC
(An Exploration Stage Company)
NOTES TO FINANCIAL STATEMENTS
(U.S. dollars in thousands)
General
The Company follows ASC guidance in determining its accruals and disclosures with respect to loss contingencies. Accordingly, estimated losses from loss contingencies are accrued by a charge to income when information available prior to issuance of the financial statements indicates that it is probable that a liability could be incurred and the amount of the loss can be reasonably estimated. Legal expenses associated with the contingency are expensed as incurred. If a loss contingency is not probable or reasonably estimable, disclosure of the loss contingency is made in the financial statements when it is at least reasonably possible that a material loss could be incurred.
Donlin has a royalty agreement entitling the counterparty to a net proceeds royalty of 8%, after deducting certain capital and operating expenses. The royalty is subject to positive future mine operating cash flows.
Obligations under operating leases
The Company leases certain assets, such as mineral property, land, office equipment and office facilities, under operating leases expiring at various dates through 2016. Future minimum annual lease payments are $1,446 in 2014, $1,740 in 2015 and $1,384 in 2016. Rent expense for 2013, 2012 and 2011 was $426, $470 and $502, respectively.
There were no events after the balance sheet date which would require adjustment to these financial statements (2012: none).
A-9
February 5, 2014
Independent Auditor’s Report
To the Partners of the Galore Creek Partnership
We have audited the accompanying Financial statements of the Galore Creek Partnership, which comprise the balance sheets as at December 31, 2013 and December 31, 2012 and the statements of operations and comprehensive loss, changes in Partners’ equity and cash flows for each of the three years in the period ended December 31, 2013, and the related notes, which comprise a summary of significant accounting policies and other explanatory information.
Management’s responsibility for the financial statements
Management is responsible for the preparation and fair presentation of these financial statements in accordance with International Financial Reporting Standards, as issued by the IASB, and for such internal control as management determines is necessary to enable the preparation of financial statements that are free from material misstatement, whether due to fraud or error.
Auditor’s responsibility
Our responsibility is to express an opinion on these financial statements based on our audits. We conducted our audits in accordance with Canadian generally accepted auditing standards and the standards of the Public Company Accounting Oversight Board (United States). Those standards require that we plan and perform the audit to obtain reasonable assurance about whether the financial statements are free from material misstatement. Canadian generally accepted auditing standards also require that we comply with ethical requirements.
An audit involves performing procedures to obtain audit evidence, on a test basis, about the amounts and disclosures in the financial statements.The procedures selected depend on the auditor’s judgment, including the assessment of the risks of material misstatement of the Financial statements, whether due to fraud or error. We were not engaged to perform an audit of the company’s internal control over financial reporting. Our audits included consideration of internal control over financial reporting as a basis for designing audit procedures that are appropriate in the circumstances, but not for the purpose of expressing an opinion on the effectiveness of the company’s internal control over financial reporting. Accordingly, we express no such opinion. An audit also includes evaluating the appropriateness of accounting principles and policies used and the reasonableness of accounting estimates made by management, as well as evaluating the overall presentation of the financial statements. We believe that the audit evidence we have obtained in our audits is sufficient and appropriate to provide a basis for our audit opinion on the financial statements.
Opinion
In our opinion, the financial statements present fairly, in all material respects, the financial position of Galore Creek Partnership as at December 31, 2013 and December 31, 2012 and its financial performance and its cash flows for each of the years in the three-year period ended December 31, 2013 in accordance with International Financial Reporting Standards, as issued by the IASB.
signed “PricewaterhouseCoopers LLP”
Chartered Accountants
PricewaterhouseCoopers LLP
PricewaterhouseCoopers Place, 250 Howe Street, Suite 700, Vancouver, British Columbia, Canada V6C 3S7
T: +1 604 806 7000, F: +1 604 806 7806, www.pwc.com/ca
“PwC” refers to PricewaterhouseCoopers LLP, an Ontario limited liability partnership.
B-1
Galore Creek Partnership
A Partnership between NovaGold Canada Inc. and Teck Metals Ltd.
Financial Statements
December 31, 2013
(Expressed in thousands of Canadian dollars)
B-2
Galore Creek Partnership
Balance Sheets
December 31,
|
(in thousands of Canadian dollars)
|
||||||||
|
2013
$
|
2012
$
|
|||||||
|
Assets
|
||||||||
|
Current assets
|
||||||||
|
Cash and cash equivalents
|
1,131 | 1,487 | ||||||
|
Deposits and prepaid expenses
|
16 | 48 | ||||||
|
GST recoverable
|
15 | 155 | ||||||
| 1,162 | 1,690 | |||||||
|
Mineral property, plant and equipment
(Note 6)
|
704,510 | 694,436 | ||||||
|
Reclamation bonds
(Note 8)
|
4,541 | 4,476 | ||||||
| 710,213 | 700,602 | |||||||
|
Liabilities
|
||||||||
|
Current liabilities
|
||||||||
|
Accounts payable and accrued liabilities
|
904 | 1,583 | ||||||
|
Due to Partners' (Note 11b)
|
630 | 456 | ||||||
| 1,534 | 2,039 | |||||||
|
Due to NovaGold Canada Inc
(Note 8)
|
4,453 | 4,388 | ||||||
|
Decommissioning and restoration provision
(Note 8)
|
14,466 | 13,670 | ||||||
| 20,453 | 20,097 | |||||||
|
Equity
|
||||||||
|
Partners' contributions
|
842,618 | 828,220 | ||||||
|
Partners' deficit
|
(152,858 | ) | (147,715 | ) | ||||
| 689,760 | 680,505 | |||||||
| 710,213 | 700,602 | |||||||
Nature of operations and economic dependence
(Note 1)
Commitments and contingencies
(Note 10)
Approved on Behalf of the Management Committee
(See accompanying notes to financial statements)
B-3
Galore Creek Partnership
Statements of Operations and Comprehensive Loss
For the Year Ended December 31, 2013
| (in thousands of Canadian dollars) | ||||||||||||
|
2013
|
2012
|
2011
|
||||||||||
| $ | $ | $ | ||||||||||
|
Other Income
|
||||||||||||
|
Interest income
|
7 | 20 | 21 | |||||||||
|
Expenses and other items
|
||||||||||||
|
General and administrative
|
3 | 10 | 44 | |||||||||
|
Professional fees
|
74 | 66 | 65 | |||||||||
|
Care and maintenance costs (Note 9)
|
5,073 | 9,583 | 8,694 | |||||||||
|
Write down of transmission line rights (Note 7)
|
- | - | 27,558 | |||||||||
| 5,150 | 9,659 | 36,361 | ||||||||||
|
(Loss and Comprehensive Loss) for the year
|
(5,143 | ) | (9,639 | ) | (36,340 | ) | ||||||
(See accompanying notes to financial statements)
B-4
Galore Creek Partnership
Statement of Changes in Partners' Equity
For the Year Ended December 31, 2013
| (in thousands of Canadian dollars) | ||||||||||||||||
|
NovaGold
Contributions
$
|
Teck
Contributions
$
|
Deficit
$
|
Total
$
|
|||||||||||||
|
Balance as at
|
||||||||||||||||
|
December 31, 2010
|
394,049 | 361,697 | (101,736 | ) | 654,010 | |||||||||||
|
Net loss for the year
|
- | - | (36,340 | ) | (36,340 | ) | ||||||||||
|
Contributions
|
14,310 | 25,982 | - | 40,292 | ||||||||||||
|
Balance as at
|
||||||||||||||||
|
December 31, 2011
|
408,359 | 387,679 | (138,076 | ) | 657,962 | |||||||||||
|
Net loss for the year
|
- | - | (9,639 | ) | (9,639 | ) | ||||||||||
|
Contributions
|
16,091 | 16,091 | - | 32,182 | ||||||||||||
|
Balance as at
|
||||||||||||||||
|
December 31, 2012
|
424,450 | 403,770 | (147,715 | ) | 680,505 | |||||||||||
|
Net loss for the year
|
- | - | (5,143 | ) | (5,143 | ) | ||||||||||
|
Contributions
|
7,199 | 7,199 | - | 14,398 | ||||||||||||
|
Balance as at
|
||||||||||||||||
|
December 31, 2013
|
431,649 | 410,969 | (152,858 | ) | 689,760 | |||||||||||
See accompanying notes to the Financial Statements.
B-5
Galore Creek Partnership
Statement of Cash Flows
For the Year Ended December 31, 2013
|
(in thousands of Canadian dollars)
|
||||||||||||
|
2013
$
|
2012
$
|
2011
$
|
||||||||||
|
Cash flows provided by operating activities
|
||||||||||||
|
Loss for the year
|
(5,143 | ) | (9,639 | ) | (36,340 | ) | ||||||
|
Items not affecting cash
|
||||||||||||
|
Write down of transmission line rights
|
- | - | 27,558 | |||||||||
|
Net change in non-cash working capital
|
||||||||||||
|
Decrease in GST recoverable
|
140 | 120 | 248 | |||||||||
|
Decrease in deposits and prepaid amounts
|
32 | 37 | 138 | |||||||||
|
Increase(decrease) in accounts payable and accrued liabilities
|
(1,008 | ) | (4,424 | ) | 1,293 | |||||||
| (5,979 | ) | (13,906 | ) | (7,103 | ) | |||||||
|
Cash flows provided by financing activities
|
||||||||||||
|
Contributions from Teck Metals Ltd.
|
7,199 | 16,091 | 25,982 | |||||||||
|
Contributions from NovaGold Canada Inc.
|
7,199 | 16,091 | 14,310 | |||||||||
|
Due to NovaGold Canada Inc - Long Term
|
65 | 268 | - | |||||||||
|
Finance lease payments
|
- | (309 | ) | (702 | ) | |||||||
| 14,463 | 32,141 | 39,590 | ||||||||||
|
Cash flows provided by investing activities
|
||||||||||||
|
Additions to mineral property, plant and equipment
|
(8,775 | ) | (21,978 | ) | (28,046 | ) | ||||||
|
Reclamation bonds
|
(65 | ) | (268 | ) | (66 | ) | ||||||
| (8,840 | ) | (22,246 | ) | (28,112 | ) | |||||||
|
Net cash increase (decrease) for the year
|
(356 | ) | (4,011 | ) | 4,375 | |||||||
|
Cash and cash equivalents at beginning of year
|
1,487 | 5,498 | 1,123 | |||||||||
|
Cash and cash equivalents at end of year
|
1,131 | 1,487 | 5,498 | |||||||||
(See accompanying notes to financial statements)
B-6
Galore Creek Partnership
Notes to Financial Statements
December 31, 2013
(in Canadian dollars)
|
1
|
Nature of Operations and Economic Dependence
|
|
|
The Galore Creek Partnership ("Partnership") is a general partnership formed under the laws of the Province of British Columbia on August 1, 2007 for the purposes of development and construction of the Galore Creek mine project. The Partnership is 50% owned by NovaGold Canada Inc.
("NovaGold"), a wholly owned subsidiary of NOVAGOLD RESOURCES INC. and 50% owned by Teck Metals Ltd. ("Teck") a wholly owned subsidiary of Teck Resources Limited. The Partnership owns 100% of Galore Creek Mining Corporation, which is the operator of the project.
|
|
|
The Partnership's registered office is at 595 Burrard Street, Vancouver, British Columbia, Canada.
|
|
|
Upon formation of the Partnership, NovaGold contributed the Galore Creek project and Teck committed to contribute cash. Teck completed its earn-in obligation in 2011. Both NovaGold and Teck ("Partners")are currently equally responsible to fund future Partnership costs.
|
|
|
These financial statements have been prepared on the basis of accounting principles applicable to a going concern, which assumes that the Partnership will be able to continue in operation for the foreseeable future and will be able to realize its assets and discharge its liabilities in the normal course of business.
|
|
|
Presently, the Partnership is economically dependent upon its Partners, NovaGold and Teck, for financial support and the Partnership has commitments from its Partners that it will receive support for the next 12 months. The future recoverability of the Partnership's mineral property, plant and equipment is dependent upon: the ability of the Partnership to obtain continued support from its Partners or to obtain financing necessary to complete the development of its property, the existence of economically recoverable reserves, the securing and maintaining title and beneficial interest in the properties, and the future profitable production or proceeds from disposition of the mineral properties.
|
|
2
|
Basis of Preparation
|
|
|
These annual financial statements have been prepared in accordance with International Financial Reporting Standards ("IFRS") as issued by the International Accounting Standards Board ("IASB").
|
|
|
These financial statements were prepared by management and approved by the Partnership Management Committee on February 5, 2014.
|
|
|
These annual financial statements include the results of the Partnership and its wholly owned subsidiary, Galore Creek Mining Corporation.
|
B-7
Galore Creek Partnership
Notes to Financial Statements
December 31, 2013
(in Canadian dollars)
|
3
|
New IFRS Pronouncements
|
|
|
New IFRS pronouncements that have been issued but are not yet effective are listed below. The Partnership plans to apply the new standard in the annual period for which it is first required.
|
|
|
Financial Instruments
|
|
|
IFRS 9 Financial Instruments is part of the IASB's wider project to replace IAS 39 Financial Instruments: Recognition and Measurement. IFRS 9 retains but simplifies the mixed financial instrument measurement model and establishes two primary measurement categories for financial assets: amortized cost and fair value. The basis of classification depends on the entity's business model and the contractual cash flow characteristics of the financial asset. The Partnership has yet to assess the full impact of IFRS 9.
|
|
|
In November 2013, the IASB amended IFRS 9 to remove the mandatory effective date of January 1, 2015 due to continued work being performed on the other phases of the IFRS 9 project relating to impairment. The IASB will be announcing a mandatory effective date for IFRS 9 in the future when IFRS 9 is closer to completion. Entities are still permitted to early adopt all or part of IFRS 9.
|
|
4
|
Summary of Significant Accounting Policies
|
|
|
The significant accounting policies used in the preparation of these financial statements are as follows:
|
|
|
Mineral property, plant and equipment
|
|
|
Plant and equipment is recorded at cost, being the purchase price and the directly attributable costs to bring the assets to the location and condition necessary for it to be capable of operating in the manner intended by management. Mobile road building equipment is depreciated over its estimated useful life of 3 years on a straight line basis.
|
|
|
Exploration and evaluation costs
|
|
|
Exploration and evaluation costs are considered to be tangible assets, as they relate to the Galore Creek property for which resources exist and it is expected that the expenditures can be recovered by future exploitation or sale. These assets are not depreciated, as they are not currently available for use. When development is approved, capitalized exploration and evaluation costs will be reclassified to development costs or capital work-in-progress within property, plant and equipment.
|
|
|
Repairs and maintenance
|
|
|
Repairs and maintenance costs are charged to expense as incurred, except when these repairs significantly extend the life of an asset or result in an operating improvement. In these instances the portion of these repairs relating to the betterment is capitalized as part of plant and equipment.
|
B-8
Galore Creek Partnership
Notes to Financial Statements
December 31, 2013
(in Canadian dollars)
|
4
|
Summary of Significant Accounting Policies (cont'd)
|
|
|
Impairment of tangible assets
|
|
|
The carrying amounts of non-current assets are reviewed for impairment whenever facts and circumstances suggest that the carrying amounts may not be recoverable. If there are indicators of impairment, the recoverable amount of the asset is estimated in order to determine the extent of any impairment. Where the asset does not generate cash flows that are independent from other assets, the recoverable amount of the cash generating unit ("CGU") to which the asset belongs is determined. The recoverable amount of an asset or CGU is determined as the higher of its fair value less cost to sell and its value in use. An impairment loss exists if the asset's or CGU's carrying amount exceeds the recoverable amount.
|
|
|
Value in use is determined as the present value of the future cash flows expected to be derived from an asset or CGU. The estimated future cash flows are discounted to their present value using a pre- tax discount rate that reflects current market assessments of the time value of money and the risks specific to the CGU for which estimates of future cash flows have not been adjusted. Fair value less cost to sell is the amount obtainable from the sale of an asset or CGU in an arm's length transaction between knowledgeable, willing parties, less the costs of disposal. For mining assets, fair value less cost to sell is often estimated using a discounted cash flow approach as a fair value from an active market or binding sale agreement is not readily available. Estimated future cash flows are calculated using estimated future prices, mineral reserves and resources, operating and capital costs. All assumptions used are those that an independent market participant would consider appropriate.
|
|
|
Leased assets
|
|
|
Leased assets in which the Partnership receives substantially all of the risks and rewards of ownership of the asset are capitalized as finance leases at the lower of the fair value of the asset or the estimated present value of the minimum lease payments. The corresponding lease obligation is recorded within debt on the balance sheet.
|
|
|
Assets under operating leases are not capitalized and rental payments are included in the statement of operations based on the terms of the lease.
|
|
|
Provisions
|
|
|
Decommissioning and restoration provisions
|
|
|
Future obligations to retire an asset, including dismantling, remediation and ongoing treatment and monitoring of the site related to normal operations are initially recognized and recorded as a provision based on estimated future cash flows discounted at a credit adjusted risk free rate. The decommissioning and restoration provision ("DRP") is adjusted at each reporting period for changes to factors including the expected amount of cash flows required to discharge the liability, the timing of such cash flows and the discount rate.
|
B-9
Galore Creek Partnership
Notes to Financial Statements
December 31, 2013
(in Canadian dollars)
|
4
|
Summary of Significant Accounting Policies (cont'd)
|
|
|
Decommissioning and restoration provisions (cont'd)
|
|
|
The DRP will be accreted to full value over time through periodic charges to earnings. This unwinding of the discount will be charged to financing expense in the statement of operations and comprehensive loss.
|
|
|
The amount of the DRP initially recognized is capitalized as part of the related asset's carrying value and amortized to earnings once production commences. The method of amortization follows that of the underlying asset. The costs related to a DRP are only capitalized to the extent that the amount meets the definition of an asset and can bring about future economic benefit. A revision in estimates or a new disturbance will result in an adjustment to the provision with an offsetting adjustment to the capitalized retirement cost.
|
|
|
Other provisions
|
|
|
Provisions are recognized when a present legal or constructive obligation exists, as a result of past events, and it is probable that an outflow of resources that can be reliably estimated will be required to settle the obligation. Where the effect is material, the provision is discounted using an appropriate current market-based pre-tax discount rate.
|
|
|
Financial Instruments
|
|
|
The Partnership recognizes financial assets and liabilities on the balance sheet when the Partnership becomes a party to the contractual provisions of the instrument.
|
|
|
Cash and cash equivalents
|
|
|
Cash and cash equivalents consist of cash on deposit with banks and highly liquid short-term interest-bearing investments with maturities of 90 days or less from the original date of acquisition.
|
|
|
Due from / (to) Partners'
|
|
|
The amounts due from / (to) Partners' are non-interest bearing, unsecured and without specified terms of repayment.
|
|
|
Trade receivables and payables
|
|
|
Loans and receivables are initially recorded at fair value with subsequent measurement at amortized cost.
|
|
|
The fair value of the Partnership's financial liabilities, such as accounts payable and accrued liabilities approximates their carrying values at December 31, 2013 due to their short-term nature.
|
B-10
Galore Creek Partnership
Notes to Financial Statements
December 31, 2013
(in Canadian dollars)
|
4
|
Summary of Significant Accounting Policies (cont'd)
|
|
|
Reclamation bonds
|
|
|
The Partnership's held-to-maturity reclamation deposits are carried at cost and bear fixed interest rates. The fair value of these deposits approximates their carrying values.
|
|
|
Due to NovaGold Canada Inc.
|
|
|
The amount due to NovaGold Canada Inc. is a non-interest bearing payable and is recorded at cost.
|
|
|
Income Taxes
|
|
|
The Partnership is not a taxable entity for federal and provincial income tax purposes. Accordingly, no recognition is given to income taxes for financial reporting purposes. Tax on the Partnership's net income (loss) is borne by the Partners' through the allocation of taxable income (loss). Net income for financial statement purposes may differ significantly from taxable income for the Partners' as a result of differences between the tax basis and financial reporting basis of assets and liabilities and the taxable income allocation requirements under the Galore Creek Partnership Agreement.
|
|
5
|
Critical Accounting Estimates and Judgments
|
|
|
In preparing these financial statements, the Partnership makes estimates and judgements that affect the amounts recorded. Actual results could differ from those estimates. The estimates and judgements are based on historical experience and other factors the Partnership considers to be reasonable, including expectations of future events. The estimates and assumptions that could result in a material impact to the carrying amounts of assets and liabilities are outlined below.
|
|
|
Decommissioning and Restoration Provisions
|
|
|
The DRP is based on current cost estimates using information available at the balance sheet date. The DRP requires other significant estimates and assumptions such as: requirements of the relevant legal and regulatory framework, and the timing, extent and costs of required decommissioning and restoration activities. To the extent the actual costs differ from these estimates, adjustments will be recorded and the statement of operations and comprehensive loss may be impacted.
|
B-11
Galore Creek Partnership
Notes to Financial Statements
December 31, 2013
(in Canadian dollars)
|
6
|
Mineral property, plant and equipment
|
| (in thousands of Canadian dollars) | |||
|
Exploration and
|
Mobile Construction
|
||
|
Evaluation
|
Equipment
|
Total
|
|
|
Cost
|
$
|
$
|
$
|
|
At December 31, 2011
|
647,004
|
38,982
|
685,986
|
|
Additions
|
35,553
|
-
|
35,553
|
|
At December 31, 2012
|
682,557
|
38,982
|
721,539
|
|
Additions
|
21,953
|
-
|
21,953
|
|
At December 31, 2013
|
704,510
|
38,982
|
743,492
|
|
Accumulated Depreciation
|
|||
|
At December 31, 2011
|
-
|
(14,144)
|
(14,144)
|
|
Depreciation
|
-
|
(12,959)
|
(12,959)
|
|
At December 31, 2012
|
-
|
(27,103)
|
(27,103)
|
|
Depreciation
|
-
|
(11,879)
|
(11,879)
|
|
At December 31, 2013
|
-
|
(38,982)
|
(38,982)
|
|
Net Book Value
|
|||
|
At December 31, 2011
|
647,004
|
24,838
|
671,842
|
|
At December 31, 2012
|
682,557
|
11,879
|
694,436
|
|
At December 31, 2013
|
704,510
|
-
|
704,510
|
Exploration and evaluation expenditures include property acquisition costs, engineering studies, drilling, survey work, capitalized construction costs relating to the advancement of the Galore Creek Project, mobile equipment depreciation and other costs related to the evaluation of the mineral resource. These costs will be transferred to work in progress once development is approved.
Mine development costs will be amortized on a unit-of production basis once the asset is in the location and condition necessary for it to be capable of operating in the manner intended by the Partnership. Mobile construction equipment is being amortized to exploration and evaluation costs over the estimated remaining useful life of the equipment. The amortization of the equipment was capitalized, as the equipment is required for continued development of the project.
|
6
|
Intangible Assets
|
| (in thousands of Canadian dollars) | ||||
|
2010
|
Impairment
|
(Amortization)
|
2011
|
|
|
$
|
$
|
$
|
$
|
|
|
Power transmission rights
|
27,615
|
(27,558)
|
(57)
|
-
|
|
27,615
|
(27,558)
|
(57)
|
-
|
|
10
B-12
Galore Creek Partnership
Notes to Financial Statements
December 31, 2013
(in Canadian dollars)
|
7
|
Intangible Assets (Cont'd)
|
|
|
During the year ended December 31, 2011, the Province of British Columbia's Minister of Environment and the Minister of Forests, Mines and Lands granted an environmental assessment certificate for BC Hydro's proposed Northwest Transmission Line Project ("NTL Project"). The NTL Project includes a new 287 kilovolt transmission line from the Skeena substation south of Terrace, to a new substation near Bob Quinn Lake. The Partnership determined that the granting of this certificate is a significant indication that the NTL Project will proceed. As a result, the Partnership's power transmission rights became redundant to the Galore Creek Project, and therefore the related $27.6M of associated costs were written off.
|
|
8
|
Decommissioning and Restoration Provision
|
|
a)
|
Reclamation provision
|
|
|
Although the ultimate amount of the reclamation costs to be incurred cannot be predicted with certainty, the total undiscounted amount of estimated cash flows required to settle the Partnership's estimated obligations is $14.5 million. The amount has not been discounted due to the uncertainty of the timing of the reclamation activities following the suspension of construction of the project. Significant reclamation and closure activities include land rehabilitation, decommissioning of roads, bridges, buildings and facilities.
The reclamation liabilities may be subject to change based on changes in management's estimates, changes in remediation technology or changes to the applicable laws and regulations.
|
| ( in thousands of Canadian dollars) | ||
|
2013
$
|
2012
$
|
|
|
Opening balance
|
13,670
|
13,670
|
|
Change in estimate
|
796
|
-
|
|
Accretion
|
-
|
-
|
|
Closing Reclamation Obligation
|
14,466
|
13,670
|
|
b)
|
Reclamation bonds
|
|
|
Each of the Partners' has provided collateral for their 50% share of reclamation bonds and letters of credit covering the required permits aggregating to $14.5 million.
|
|
|
At December 31, 2013 NovaGold funded $4.5 million of its share in respect of the BC Ministry of Forests and Range Special Use Permit ("Forestry Act Permit"), through the Partnership. The $4.5 million loan related to these reclamation bonds will be repaid to NovaGold once the Partnership's reclamation bond in respect of the Forestry Act Permit is released.
|
B-13
Galore Creek Partnership
Notes to Financial Statements
December 31, 2013
(in Canadian dollars)
|
9
|
Expenses by Nature
|
|
(in thousands of Canadian dollars)
|
|||
|
2013
|
2012
|
2011
|
|
|
$
|
$
|
$
|
|
|
Community and stakeholder engagement
|
321
|
327
|
355
|
|
Environmental consulting and field work
|
785
|
915
|
1,635
|
|
Fuel and energy
|
21
|
494
|
224
|
|
Insurance and property tax
|
134
|
168
|
224
|
|
Maintenance and repair supplies
|
37
|
3,256
|
1,863
|
|
Office rent and support
|
519
|
866
|
985
|
|
Other camp costs
|
9
|
496
|
277
|
|
Salaries and employee benefits
|
2,974
|
2,442
|
2,598
|
|
Transportation
|
273
|
619
|
533
|
|
Total care and maintenance costs
|
5,073
|
9,583
|
8,694
|
|
10
|
Commitments and contingencies
|
|
a)
|
Operating lease commitments
The Partnership is party to certain operating leases. These operating leases include the Partnership's leased office location and certain office equipment with commitments ranging from one to six years. The future minimum lease payments as at December 31, 2013 are as follows:
|
|
(in thousands of Canadian dollars)
|
|
|
$
|
|
|
2014
|
187
|
|
2015
|
150
|
|
2016
|
166
|
|
Thereafter
|
111
|
|
b)
|
The Partnership has a royalty agreement entitling the counterparty to a maximum annual net smelter royalty of between 0.5% to 1.0%. The royalty is subject to positive future operating mine cash flow and is contingent upon reaching certain agreed financial targets.
|
B-14
Galore Creek Partnership
Notes to Financial Statements
December 31, 2013
(in Canadian dollars)
|
11
|
Related party transactions
|
|
a)
|
Management services
|
|
|
During the period ended December 31, 2013, NovaGold and Teck provided the Partnership with management services totaling $469,732 (2012 - $798,149; 2011 - $880,655) and $748,506 (2012 - $1,132,296; 2011 - $1,990,452), respectively.
|
|
b)
|
Due to Partners'
|
|
|
As at December 31, 2013, the Partnership owed $36,323 (2012 - $32,962; 2011 - $159,858) to NovaGold and $594,232 (2012 - $422,674; 2011 - $696,537) to Teck for management services. The Partnership also owed $4.5 million (2012 - $4.4 million; 2011 - $4.1 million) to NovaGold in respect of reclamation bonds that NovaGold has funded in the Partnership's name.
|
|
12
|
Financial instruments
|
|
|
Financial assets are comprised of cash and short-term deposits and reclamation deposits. Cash and short-term deposits are held with large Canadian banks.
|
|
|
Financial liabilities are comprised of accounts payable and accrued liabilities and due to partners. All financial liabilities are due within 30 days, except the payable to NovaGold.
|
|
|
The Partnership is not subject to material market risk on any of its financial instruments. The carrying amount of all financial instruments approximates fair value.
|
|
13
|
Subsequent events
|
|
|
There were no events after the balance sheet date which would require adjustment to these financial statements (2012: none).
|
B-15
TABLE OF CONTENTS
Part IItem 1. BusinessItem 1A. Risk FactorsItem 1B. Unresolved Staff CommentsItem 2. PropertiesItem 3. Legal ProceedingsItem 4. Mine Safety DisclosuresPart IIItem 5. Market For Registrant S Common Equity, Related Stockholder Matters and Issuer Purchases Of Equity SecuritiesItem 6. Selected Financial DataItem 7. Management S Discussion and Analysis Of Financial Condition and Results Of OperationsItem 7A. Quantitative and Qualitative Disclosures About Market RiskItem 8. Financial Statements and Supplementary DataNote 1 The CompanyNote 2 Summary Of Significant Accounting PoliciesNote 3 Segmented InformationNote 4 InvestmentsNote 5 Investment in AffiliatesNote 6 Mineral PropertiesNote 7 DebtNote 8 Derivative LiabilitiesNote 9 Fair Value AccountingNote 10 Income TaxesNote 11 General and Administrative ExpensesNote 12 Write-down Of AssetsNote 13 Change in Operating Assets and LiabilitiesNote 14 Discontinued OperationsNote 15 Share-based CompensationNote 16 Share Capital and Income (loss) Per ShareNote 17 WarrantsNote 18 Accumulated Other Comprehensive Income (loss)Note 19 Related Party TransactionsNote 20 Commitments and ContingenciesNote 21 Supplemental Cash Flow InformationNote 22 Unaudited Supplementary DataItem 9. Changes in and Disagreements with Accountants on Accounting and Financial DisclosureItem 9A. Controls and ProceduresItem 9B. Other InformationPart IIIItem 10. Directors, Executive Officers and Corporate GovernanceItem 11. Executive CompensationItem 12. Security Ownership Of Certain Beneficial Owners and Management and Related Stockholder MattersItem 13. Certain Relationships and Related Transactions, and Director IndependenceItem 14. Principal Accountant Fees and ServicesPart IVItem 15. Exhibits and Financial Statement SchedulesNote 1 Nature Of Operations and Economic DependanceNote 3 Property and EquipmentNote 4 Related Party TransactionsNote 5 Reclamation and RemediationNote 6 Commitments and ContingenciesNote 7 Subsequent Events