INGEVITY CORP
UNITED STATES
SECURITIES AND EXCHANGE COMMISSION
Washington, D.C. 20549
_______________________________________________________________________
FORM
10-K
_______________________________________________________________________
|
x
|
ANNUAL REPORT PURSUANT TO SECTION 13 OR 15(d) OF THE SECURITIES EXCHANGE ACT OF 1934
|
For the fiscal year ended
December 31, 2018
OR
|
o
|
TRANSITION REPORT PURSUANT TO SECTION 13 OR 15(d) OF THE SECURITIES EXCHANGE ACT OF 1934
|
Commission File Number 001-37586
__________________________________________________________________________
INGEVITY CORPORATION
(Exact name of registrant as specified in its charter)
__________________________________________________________________________
|
Delaware
|
47-4027764
|
|
|
(State or other jurisdiction of incorporation or organization)
|
(I.R.S. Employer Identification No.)
|
|
|
5255 Virginia Avenue
|
||
|
North Charleston, South Carolina 29406
|
||
|
(Address of principal executive offices) (Zip code)
|
||
(Registrant’s telephone number)
Securities registered pursuant to Section 12(b) of the Act:
|
Title of Each Class:
|
Name of Each Exchange on Which Registered:
|
|
|
Common Stock ($0.01 par value)
|
New York Stock Exchange
|
|
Securities registered pursuant to Section 12(g) of the Act: None
|
Yes
|
No
|
|
|
Indicate by check mark if the registrant is a well-known seasoned issuer, as defined in Rule 405 of the Securities Act.
|
x
|
o
|
|
Indicate by check mark if the registrant is not required to file reports pursuant to Section 13 of Section 15(d) of the Act.
|
¨
|
x
|
|
Indicate by check mark whether the registrant (1) has filed all reports required to be filed by Section 13 or 15(d) of the Securities Exchange Act of 1934 during the preceding 12 months (or for such shorter period that the registrant was required to file such reports), and (2) has been subject to such filing requirements for the past 90 days.
|
x
|
¨
|
|
Indicate by check mark whether the registrant has submitted electronically every Interactive Data File required to be submitted pursuant to Rule 405 of Regulation S-T (§232.405 of this chapter) during the preceding 12 months (or for such shorter period that registrant was required to submit such files.)
|
x
|
¨
|
|
Indicate by check mark if disclosure of delinquent filers pursuant to Item 405 of Regulation S-K is not contained herein, and will not be contained, to the best of registrant's knowledge in definitive proxy or information statements incorporated by reference in Part III of this Form 10-K of any amendment to this Form 10-K.
|
x
|
|
|
Indicate by check mark whether the Registrant is a large accelerated filer, an accelerated filer, a non-accelerated filer, a smaller reporting company, or an emerging growth company. See definitions of “large accelerated filer,” “accelerated filer,” “smaller reporting company,” and "emerging growth company" in Rule 12b-2 of the Exchange Act. (Check one)
|
||
|
Large Accelerated Filer
x
|
Accelerated Filer
o
|
|
|
Non-Accelerated Filer
o
|
Smaller reporting company
o
|
|
|
Emerging growth company
o
|
||
If an emerging growth company, indicate by check mark if the registrant has elected not to use the extended transition period for complying with any new or revised financial accounting standards provided pursuant to Section 13(a) of the Exchange Act.
o
Indicate by check mark whether the Registrant is a shell company (as defined by Rule 12b-2 of the Exchange Act). Yes
o
No
x
At June 30,
2018
, the aggregate market value of common stock held by non-affiliates of the Registrant was
$3,395,178,951
. The market value held by non-affiliates excludes the value of those shares held by executive officers and directors of the Registrant.
The Registrant had
41,618,887
shares of common stock, $0.01 par value, outstanding at
February 19, 2019
.
|
Documents Incorporated by Reference
|
|||
|
Portions of the Company's definitive 2019 Annual Meeting Proxy Statement are incorporated by reference into Part III of this report.
|
|||
Ingevity Corporation
Form 10-K
INDEX
|
Page No.
|
||||
2
PART I
Item 1. Business
General
Ingevity’s business originated as part of the operations of its initial parent company, Westvaco Corporation, a paper and packaging company, using co-products of the kraft pulping process, primarily crude tall oil ("CTO"), and lignin, as well as hardwood sawdust from lumber manufacturing. Ingevity operated as a division of Westvaco Corporation and its corporate successors, including MeadWestvaco Corporation and WestRock Company, since 1964.
On May 15, 2016, we completed the separation of Ingevity from WestRock Company (“WestRock”) (herein referred to as the "Separation"). The Separation was completed by way of a distribution of all of the then outstanding shares of common stock of Ingevity through a dividend in kind of Ingevity's common stock (par value $0.01) to holders of record of WestRock common stock (par value $0.01) as of the close of business on May 4, 2016 (the "Record Date"). Ingevity's common stock began "regular-way" trading on the New York Stock Exchange ("NYSE") on May 16, 2016 under the symbol "NGVT."
Ingevity Corporation was incorporated in Delaware on March 27, 2015. The address of Ingevity’s principal executive offices is 5255 Virginia Avenue, North Charleston, South Carolina 29406. Ingevity maintains a website at www.ingevity.com. Ingevity’s website and the information contained in or connected to the website will not be deemed to be incorporated in this document.
Throughout this Annual Report on Form 10-K, except where otherwise stated or indicated by the context, "Ingevity", the "Company", "we", "us", or "our" means Ingevity Corporation and its consolidated subsidiaries and their predecessors. Copies of the annual, quarterly, and current reports we file with the Securities and Exchange Commission ("SEC"), and any amendments to those reports, are available on our website at www.ingevity.com as soon as practicable after we furnish such materials to the SEC. Apart from SEC filings, we also use our website to publish information, which may be important to investors, such as presentations to analysts. Reports filed with the SEC may be viewed at www.sec.gov.
Ingevity
Ingevity is a leading global manufacturer of specialty chemicals and high performance activated carbon materials. We provide innovative solutions to meet our customers’ unique and demanding requirements through proprietary formulated products.
We report in two business segments, Performance Materials and Performance Chemicals.
Our Performance Materials segment consists of our automotive technologies and process purifications product lines. Performance Materials manufactures products in the form of powder, granular, extruded pellets, extruded honeycombs, and activated carbon sheets. Automotive technologies products are sold into gasoline vapor emission control applications within the automotive industry, while process purification products are sold into the food, water, beverage, and chemical purification industries.
Our Performance Chemicals segment consists of our pavement technologies, oilfield technologies, industrial specialties, and engineered polymers product lines. Performance Chemicals manufactures products derived from CTO and lignin extracted from the kraft paper making process as well as caprolactone monomers and derivatives derived from cyclohexanone and hydrogen peroxide. Performance Chemicals products serve as critical inputs used in a variety of high performance applications, including pavement preservation, pavement adhesion promotion, and warm mix paving (pavement technologies product line), oil well service additives, oil production, and downstream application chemicals (oilfield technologies product line), printing inks, adhesives, agrochemicals, lubricants, and industrial intermediates (industrial specialties product line), coatings, resins, elastomers, adhesives, and bio-plastics (engineered polymers product line).
Our global engineering, technical, sales, and application support teams closely collaborate with our customers, and, importantly, with their customers. With our deep technical expertise and experience in our customers’ applications and end markets, we have the capacity and flexibility to anticipate and respond to changing market conditions and customer demands and to develop proactive solutions that provide our customers, and therefore us, with a distinct competitive advantage. Additionally, the quality and diversity of our product portfolio, and the flexibility of our manufacturing assets, gives us the capability to direct our resources towards their most profitable and attractive uses and geographies in response to changing market conditions.
The charts below illustrate our revenue by segment, product line and geography in 2018 for all product lines except
3
engineered polymers, which was acquired on February 13, 2019. For more information about the Caprolactone acquisition, see Note 17, and for more information on our U.S. and foreign operations, see Notes 5 and 20, to the Consolidated Financial Statements included within Part II. Item 8 of this Form 10-K.
|
Performance Materials
|
Performance Chemicals
|
||||
|
Product Lines
|
Carbon Technologies
|
Pavement Technologies
|
Oilfield Technologies
|
Industrial Specialties
|
Engineered Polymers
|
|
Primary End Uses
|
Automotive gasoline vapor emissions control
Process purification
|
Pavement preservation
Adhesion promotion
Warm mix asphalt technology
|
Well service additives
Production and downstream chemicals
|
Adhesives
Agrochemicals
Lubricants
Publication inks
Industrial intermediates
|
Coatings
Resins
Elastomers
Adhesives
Bio-plastics
|
|
Revenue
|
$400.4 million
|
$733.2 million
|
|||
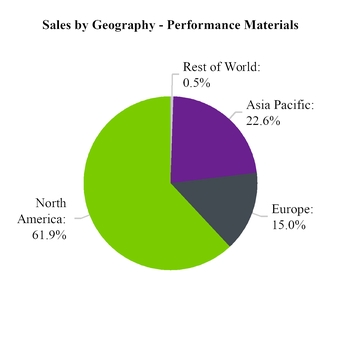
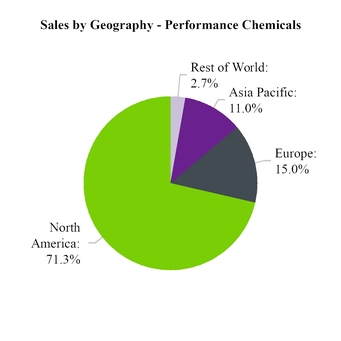
Sales are assigned to geographic areas based on location to which product was shipped to a third-party.
Our Core Strengths
Ingevity is committed to continued value creation by focusing on its core strengths:
Leading Global Market Positions
We are a leader in the global pine chemicals industry, further distinguished by our focus on target markets that offer the potential for profitable growth, supported by long-term secular growth trends such as infrastructure preservation and development, innovation in unconventional oil drilling and production, and increasing global food production demands. Our products serve as critical inputs used in a variety of high performance applications, including pavement preservation, pavement adhesion promotion, warm mix asphalt, oil well service additives, oil production, downstream applications chemicals, printing inks, adhesives, agrochemicals, and lubricants. The quality and diversity of our product portfolio, and the flexibility of our manufacturing assets, gives us the capability to direct our differentiated products towards their most profitable and attractive uses and geographies.
We are the global leader in caprolactone technologies, as shown by our invested capital base that represents approximately 60 percent of the global manufacturing capacity. Caprolactone is a critical input to many high-growth end-use applications such as thermoplastic additives for biodegradables and polyols in coatings, as well as other coatings, resins, elastomers, adhesives, and bioplastics. Our manufacturing footprint allows us to both produce caprolactone monomer as well as derivatize it into the more profitable and faster growing market segments and geographies.
4
We are the leading global manufacturer of activated carbon used in gasoline vapor emission control systems in cars, trucks, motorcycles, and boats. This business is expected to benefit from increasingly stringent vehicle emission standards worldwide that our products are designed and qualified to meet. The annual global sales of light duty vehicles (i.e., passenger and light commercial vehicles) that are powered with gasoline are forecasted to grow from approximately 76 million to approximately 92 million vehicles, an increase of 21 percent from 2017 to 2027. Most of this growth is expected to occur outside of the U.S., Canada, and China in countries and regions where gasoline vapor emission standards significantly lag the new modern, highly effective standards that are currently being implemented in the U.S., Canada, and China. This provides significant upside potential in addition to the already favorable macroeconomic growth trends of the global automotive industry.
Flexible Manufacturing Capabilities Optimize Asset Utilization
The quality and diversity of our product portfolio, and the flexibility of our manufacturing assets, gives us the capability to direct our resources to their most profitable uses and geographies. Our Performance Materials assets, which primarily produce automotive grade carbon, are also capable of producing a number of other activated carbon products for food, water, beverage, and chemical purification applications, maximizing the productivity of these assets.
Our Performance Chemical assets include multipurpose chemical reactors that are capable of manufacturing products of varying chemistries that can serve multiple markets. For example, in our South Carolina facility, the newest reactor that was commissioned in 2015 is capable of producing products for pavement, oilfield, and adhesives applications, while our Louisiana assets can be redirected with relative ease among various applications including printing inks, adhesives, oilfield, and asphalt. In our Warrington facility, we have reactors for thermoplastic and polyol applications. Both of those sets of reactors can produce products for a variety of applications: adhesives, bioplastics, and medical devices in thermoplastics and adhesives, coatings, and elastomers in polyols.
Deep Technical Expertise and Product Innovation Capability and Experience
We have deep technical expertise and market knowledge and insights, derived from customer relationships and research and development capabilities, that enable our ability to innovate. Innovation efforts are led and supported by our teams of technical experts and industry veterans, many of whom are considered the foremost experts in their fields, spread throughout our organization in key positions from product development to manufacturing to sales. Each of our business units has its own development and application laboratories that work in partnership with our customers to refine existing products and develop new innovative products that will drive value for Ingevity and our customers.
With our technical expertise and product innovation capability and experience, and by working closely with our customers, our technical experts offer application solutions that address our customers’ most difficult challenges. For example, when our road contractor customers vary the aggregate and/or asphalt to be used in a particular job mix, they call on our expertise to quickly reformulate the Ingevity additive chemistry needed for the revised mix, so that they can meet the original job specifications on time, regardless of the change. Our ability to swiftly understand and address our customers’ performance needs allows Ingevity to maintain and grow its partnerships with its customer base.
Unique Decades-Long Track Record of Automotive Carbon Products Meeting Emission Compliance Standards
Current U.S. Federal, California, and Canadian regulatory standards and the China 6 national standard, promulgated in December 2016, require that gasoline vapor control devices remain effective for the entire life of the vehicles on which they are installed. Ingevity has a substantial, decades-long track record of providing life-of-vehicle product performance in a properly designed gasoline vapor control system. Our capability to engineer very specific mesoporous carbons on a large commercial scale allows the system designers to minimize the system’s size based on our carbon’s ability to remain highly effective over a vehicle’s lifetime. Given the imperative for automotive manufacturers to produce vehicles capable of meeting these long-term requirements, or potentially face expensive recalls and unfavorable publicity, there is a potential risk to use the products of other producers who do not have a comparable, proven history and technical capability, particularly given the significant costs associated with non-compliance should a product fail to maintain its effectiveness over a vehicle's lifetime.
Global Manufacturing and Supply Chain Reach
We have a global reach that allows us to effectively service multinational customers through a combination of our manufacturing facilities located in the U.S., China, and the United Kingdom as well as local talent strategically placed around the globe. In addition, our technology centers located in the U.S., China, the United Kingdom, Europe, and India give us the ability to service our customers throughout these regions, and provide us with market insights that allow us to develop customized solutions for local and regional markets. Our global engineering, technical, sales, and application support teams serve customers in approximately 75 countries.
This capability also allows us to take advantage of future market trends. For example, our global reach allows us to pursue growth opportunities in oil and gas producing regions outside of the U.S., particularly in the Middle East.
5
Collaborative Customer and End User Relationships Drive Profitable Growth Opportunities
We take a partnership approach with our customers, investing resources to deeply understand their customers’ needs so that we can provide technologically advanced, tailored solutions that allow our customers to maintain a competitive advantage in the markets they serve. Our knowledge of our customers’ end markets provides us with insights that enable us to develop solutions that address opportunities or challenges and create value for our customers. For example, through our relationships with several automobile Original Equipment Manufacturers, or "OEMs" (often, our customers’ customer), we learned that certain vehicles were having trouble passing emissions certification tests based on a small amount of volatile organic compounds ("VOCs") migrating from the engine via the vehicles’ air intake systems. To address this issue, we developed several generations of activated carbon-based solutions, including activated carbon extruded honeycombs and engineered activated carbon sheets, that manage these emissions while minimizing pressure drop in the air intake system-a key performance advantage to the OEMs. This drove demand for our product by addressing the needs of our customers’ customer. We believe this approach-driving demand for our products by developing solutions for our customers’ end markets-has been, and will continue to be, a significant driver of profitable growth.
Education of Government and Regulatory Bodies on Scientifically Based Policies and Specifications
Many of our customers are subject to increasing regulatory standards and mandates. For example, more stringent air quality standards drive reductions in automotive emissions or the use of recycled materials in the case of pavement technologies. With our technical expertise and experience, our teams are a valued resource and work directly with government and regulatory bodies, in support of our customers, as experts in their field to educate regulators about existing and innovative technologies that support their objectives or solve specific challenges. As the trend continues in mature and emerging markets towards more advanced solutions, we believe the ability to leverage our expertise to educate, advocate and promote sensible regulatory solutions will benefit our customers while driving incremental value within those markets. For example, Ingevity has globally recognized expertise in the highly specialized field of automotive gasoline vapor emissions. While tailpipe emissions on vehicles are well recognized, understood and regulated, gasoline vapor emissions from vehicles have been lightly regulated in many countries outside the U.S., Canada, Brazil, and China. Our experts have educated authorities in other countries to help them understand and quantify the magnitude of these emissions and evaluate the highly effective solutions currently being adopted in the U.S., Canada, and China that can significantly reduce these gasoline vapor emissions at a relatively low cost per vehicle.
Our engagement with regulators allows us to then work with our customers in order to help them respond and adapt to evolving and varying regulatory standards. For example, because of the stringent and differing regulatory compliance standards applicable to the global oilfield industry, our oilfield customers often turn to us instead of smaller, less sophisticated suppliers in order to help them manage the complexities of compliance risk in chemical distribution and use throughout the world.
Highly Engaged, Performance and Safety-Driven Culture
We have assembled a highly talented, collaborative, committed, and creative team which drives the success of our business. Our collective ambition is keenly focused on creating value for today and tomorrow. Further, we are committed to protecting human health and the environment while using resources in a responsible and sustainable manner. As a long-standing member of the American Chemistry Council ("ACC"), we subscribe to the Guiding Principles of the Responsible Care program-a global chemical industry performance initiative that is implemented in the U.S. through the ACC. Our ISO 9001, IATF 16949 and Responsible Care Certifications are internationally recognized measures of consistent superior performance and responsibility to health, safety, security, and the environment.
Long-term Secured Raw Material Supply
Of relevance to our Performance Chemicals segment, a
t the time of the Separation, we entered into a long-term supply agreement with WestRock pursuant to which we purchase all of the CTO output from WestRock’s existing (at the time of separation) kraft mills, subject to certain exceptions. In 2018, we entered into a 20-year supply agreement with Georgia-Pacific LLC (“Georgia-Pacific”), pursuant to which we purchase the lesser of 125,000 tons of CTO and the aggregate output of CTO produced and originating at certain of Georgia-Pacific’s paper mills.
These relationships with WestRock and Georgia-Pacific are strategically important to our Performance Chemicals business due to the limited supply of CTO globally, of which we believe a significant portion is already under long-term supply agreements with other consumers of CTO. Under these agreements, we currently expect to source approximately
60 to 70 percent
of our CTO requirements through 2025 based on the maximum operating rates of our three Performance Chemicals' pine chemicals facilities.
We believe this supply from Georgia-Pacific, WestRock, and with our other contracted sources of CTO, will allow us to serve expected customer demand.
6
Our Plans for Additional Growth
We have a demonstrated history of profitable growth. Looking ahead, we believe we will continue to deliver profitable growth by taking the following steps:
Expand Sales to Existing Customers and into New Geographies
We believe we are well positioned to organically expand our sales through a combination of continued global market growth, leveraging our significant application knowledge to apply our existing products to new applications and capitalizing on the investments we have made in our global manufacturing, sales, technical centers, and distribution network. Our global reach allows us to effectively compete in new geographies, delivering proven innovative solutions where opportunities to apply our technologies exist. We continue to leverage our significant application knowledge and intimate customer relationships to target opportunities where we know our products perform and to create demand for our products by driving value for our customers.
We intend to continue to strengthen our position in emerging markets where there are significant opportunities for growth. Opportunities include the expansion of sales of our pavement products into areas increasingly in need of newly paved roads and increased sales of activated carbon solutions driven by anticipated regulatory changes in global automotive gasoline emissions control standards.
Increase Our Offering of Specialized, Higher Margin Products
We employ a world-class team of engineering, technical, sales, and application specialists, along with experienced industry professionals, which provide us with deep technical knowledge and the ability to be a leading provider of specialty products in the markets we serve. We have the experience and capability to further develop and expand upon the products we currently produce, further differentiating them into higher value, increasingly specialized products, or developing new applications and end uses.
We have a history of success in product development and differentiation. For example, our oilfield technologies business focuses on development and marketing of specialized tall oil based emulsifiers and corrosion inhibitors as well as marketing the base tall oil fatty acid ("TOFA") refinery products.
We believe that there is significant upside in further developing and expanding upon products produced from TOFA, displacing some of our lower margin business where we sell TOFA directly to certain customers. This will have the added benefit of improved insulation from the cyclical nature of the direct natural fats and oils market of which TOFA is a part. Our goal is to increase the portion of our sales of specialized, higher value products derived from TOFA, including addressing new markets or opportunities to upgrade TOFA into product categories where we might not participate today.
Additionally, we search to supply the right chemistry for the applications within our market segments regardless of the raw materials required. Applying our unique insights into the end use applications of our products, our team searches to find novel solutions, outside of our current CTO-based materials, to problems and our team also works to create the supply chain needed to provide those products to our customers. As an example, we have developed and now manufacture and sell product solutions in our pavement technologies business that are TOFA and hydrocarbon based.
We also believe that there is significant upside in further developing and expanding caprolactone-based products and derivatives. The end-markets in which we are expanding have favorable trends that we believe will support growth rates higher than global GDP. For example, caprolactone’s performance properties give it superior performance in biodegradable plastics, medical devices, and 3-D printing, among others.
Innovate to Enable Our Customers to Adapt to Increasingly Stringent Regulatory Standards
We are a valued resource to government and regulatory agencies around the world, from California to China, including national, regional, and local environmental regulatory bodies. We work directly with such bodies, in support of our customers, to help them develop sensible standards based on the availability of technological solutions that make such standards commercially achievable. As standards are adopted and become increasingly demanding, the products that can be used to achieve compliance with such standards become increasingly technologically complex to design and manufacture on a commercial level. Our ability to meet these complexities provides Ingevity with a distinctive commercial edge-as our customers in many applications depend on us to help them meet their compliance standards. We also work closely with automotive companies and their suppliers to ensure that they understand and can meet increasingly stringent vehicle emission standards.
Invest Organically and Selectively Pursue Acquisitions that Further Strengthen Our Product Portfolio
We plan to continue to invest capital organically in attractive cost reduction projects and in capacity expansions as necessary to meet demand growth. For example, in 2016, to meet the growing demand for our activated extruded honeycomb products that help meet the U.S. and Canadian Low Emission Vehicle, or LEV III, and Tier 3 regulations, we began a capital
7
expansion at our Waynesboro, Georgia honeycomb extrusion facility that effectively doubled the capacity output by the end of 2017. To support future demand for the China 6 regulation, we have invested in new activated carbon pellet extrusion capacity in Changshu, China which came online in late 2018. In 2018, we also commenced a brownfield expansion at our Covington, Virginia activated carbon facility in order to meet the growing activated carbon demand for the China 6 regulation. In 2019, we will be continuing growth expansion work at our Warrington, U.K. caprolactone facility that includes debottlenecking and replacement of monomer production equipment that is more modern and efficient. As demand for our products grows, we will continue to evaluate additional capacity expansion as needed.
In addition, we intend to pursue value-creating acquisitions, such as the acquisition (the "Pine Chemicals Acquisition") of Georgia-Pacific's Pine Chemicals business ("Pine Chemicals Business") and the acquisition of the remaining 30 percent ownership interest of our Purification Cellutions, LLC joint venture (now known as Ingevity Georgia, LLC), both of which represented attractive opportunities in our target markets as well as in high-value niche applications that complemented our product portfolio and capabilities. We continue to seek to add product lines and portfolios, such as the acquisition (the "Caprolactone Acquisition") of Perstorp Holding AB’s caprolactone division (the "Caprolactone Business"), which we believe serves end-markets with growth rates significantly greater than global GDP, as well as having the potential to be a platform for additional bolt on acquisitions. We will continue to seek to add product lines and portfolios, as well as marketing and manufacturing alliances, that will play an important role in strengthening our leadership positions. We are evaluating acquisitions both domestically and globally.
Segments
Performance Materials
We engineer, manufacture, and sell hardwood-based, chemically activated carbon products, produced through a highly technical and specialized process primarily for use in gasoline vapor emission control systems in cars, trucks, motorcycles, and boats. We are a global leader in this automotive application. We also produce a number of other activated carbon products for food, water, beverage, and chemical purification applications, to maximize the productivity of our manufacturing assets.
Our automotive carbon products capture gasoline vapor emissions that would otherwise be released into the atmosphere as VOCs, which contain hazardous air pollutants and can photochemically react to form ozone and secondary organic aerosols. These gasoline vapor emissions (which are distinct from tailpipe emissions) are released primarily (i) during refueling, (ii) when a vehicle is parked during the daytime, as a result of evaporation and expansion of vapors in the fuel tank in warmer daytime temperatures and (iii) as “running loss,” as a result of evaporation and expansion of vapors in the fuel tank from increased temperatures as a result of operation of the vehicle.
Our automotive carbon products are typically part of vehicle-based gasoline vapor emissions control systems which can range from systems equipped with an approximately one liter carbon canister that captures one day of diurnal parking emissions, to more sophisticated Onboard Refueling Vapor Recovery (“ORVR”), running loss and multi-day diurnal parking systems with a two to three-liter carbon canister that is over 98 percent efficient. The captured gasoline vapors are largely purged from the carbon and directed to the engine where they are used as supplemental power for the vehicle. In this way, our automotive carbon products are part of a system that provides for both environmental control and energy recovery. We estimate that in 2016 our products collectively prevented over 20,000 metric tons of VOC emissions each day from being lost to the atmosphere and returned the equivalent of 8 million gallons of gasoline each day to power vehicles.
Environmental standards drive the implementation of gasoline vapor emission control systems by automotive manufacturers. While tailpipe emissions on vehicles are well recognized, understood, and regulated, gasoline vapor emissions from vehicles have been lightly regulated in many countries outside the U.S., Canada, Brazil, and China. For those countries that have not significantly regulated gasoline vapor emissions, enacting more stringent regulations represents a low-cost, high-return opportunity to address their air quality issues. The annual global sales of light duty vehicles (i.e., passenger and light commercial vehicles) that are powered with gasoline are forecast to grow from approximately 76 million to approximately 92 million vehicles, an increase of 21percent from 2017 to 2027. Most of this growth is expected to occur outside of the U.S., Canada, and China in countries and regions where gasoline vapor emission standards significantly lag the new modern, highly effective standards that are currently being implemented in the U.S., Canada, and China. Adoption of modern gasoline vapor emission standards in these regions would have significant, positive environmental and energy efficiency impacts and provide significant upside growth potential for our automotive carbon business.
The U.S. and Canada have led the world in recognizing and addressing the harm to air quality caused by gasoline vapor emissions, and in early 2014 enacted regulatory standards that will further reduce these emissions to “near zero” levels by phasing in Tier 3 and LEV III evaporative emission standards through 2022, which will result in significant increases in the use of our “canister bleed emissions” system patent over that same period. The Tier 3 and LEV III phase in schedule requires compliance with the standard as follows: 40 percent of model year 2017’s vehicles, 60 percent of model year 2018’s vehicles, 80 percent of model year 2020’s vehicles and 100 percent of model year 2022’s vehicles. The most commonly applied embodiment of the patent
8
uses our activated carbon in the main part of the canister and our activated carbon extruded honeycomb(s) as a “scrubber” on the outlet side of the canister to reduce the canister’s emissions to “near zero.” One of our significant “canister bleed emissions” patents expires in March 2022. The extruded honeycombs are manufactured through an activated carbon ceramic extrusion process at our Waynesboro, Georgia extrusion facility. We have a 100 percent controlling ownership and operating responsibility at this facility, after having purchased the remaining 30 percent ownership interest in Purification Cellutions, LLC joint venture (now known as Ingevity Georgia, LLC) from our partner in August of 2018.
Most countries outside the U.S., Canada, China, and Brazil have significantly lagged in the adoption of regulatory standards that would reduce these gasoline vapor emissions, focusing instead on regulating the more “visible” tailpipe emissions. These countries are using a gasoline vapor emission standard that is functionally equivalent to a 1981 U.S. regulatory standard. As a result, in Europe, Asia, and Latin America, gasoline vapor emissions are the primary source of automotive VOC emissions. China has begun implementation of a new national standard, China 6, that is functionally equivalent to the 2009 alignment of U.S. Tier 2 with California LEV II. This new national standard, containing ORVR and multi-day diurnal parking emission controls, is scheduled to
be fully phased in by July 2020 with the announced early implementation in several large, provincial, and municipal regions beginning in 2019.
As recognized experts in the field of gasoline vapor emission control, Ingevity has been working with regulatory bodies and relevant third parties in Brazil, China, Japan, Mexico, and the European Union to help them understand and move towards more effective regulatory standards similar to those in place in the U.S. and Canada. Regulatory indications of adoption and implementation of more stringent vapor emissions standards outside of the U.S. and Canada include the following:
•
The European Commission has adopted more stringent gasoline vapor emission regulations with its Euro 6d standard, which requires full implementation by September 2019. This new standard is more stringent than the current standards and includes a 2-day diurnal parking emission test that will generally result in a 30 - 70
percent
increase in canister capacities and a shift in some volumes to pellets and higher activity carbon.
•
In its November 2007 session, the World Forum for Harmonization of Vehicles Regulations (WP 29) established an Informal Working Group (IWG) under the Working Party on Pollution and Energy (GRPE) to prepare a road map for Worldwide Harmonized Light Vehicle Test Procedures (WLTP), including those for evaporative emissions as part of Phase 2 of the effort. Global Technical Regulation (GTR) No. 19 established a 48-hour test procedure, based upon the European 48-hour procedure, that can be adopted by contracting parties (i.e. participating countries) across the globe.
•
On December 23, 2016, the China Ministry of Environmental Protection and the China State Administration of Quality Supervision, Inspection, and Quarantine released its China 6 National Standard on the Limits and Measurement Methods for Emissions from Light-Duty Vehicles (GB 18352 6-2016). In the new standard, diurnal control is increased to 48 hours, running loss conditions are simulated, and ORVR is added. Emissions limits are also reduced and will be similar to those in U.S. Tier 2. As a result, canister volumes are expected to increase by 2 to 3 times and the majority of the canisters are expected to shift to high activity carbons and pellets. This new standard implements nationally on July 1, 2020 but
a number of cities and provinces – including Beijing, Hainan, Hebei, Henan, Guangzhou, Shenzhen, Tianjin – have announced early implementation dates ranging from July 1, 2019 to January 1, 2020.
•
South Korea is currently phasing in some U.S. Tier 2 diurnal parking emission standards, which generally require activated carbon canister volumes greater than 1.3 liters and an increased use of pelletized carbon. In 2018, South Korea began phasing in portions of the U.S. Tier 3 “near zero” full vehicle diurnal parking emission standards that will favor the use of low emission and air induction system diurnal parking emission activated carbon technologies.
•
In November 2018, Brazil’s National Council for the Environment ("CONAMA") plenary finalized the Program for the Control of Air Pollution by Motor Vehicles ("PROCONVE") L7 regulations that included a hot-soak and 48-hour diurnal requirement - with an emission limit similar to US Tier 2 - that must be fully implemented by January 2022. An ORVR requirement was also passed that will be implemented in stages in 2023 (20 percent of new vehicles), 2024 (60 percent of new vehicles), and 2025 (100 percent of new vehicles).
See also “Risk Factors-Risks Related to Ingevity’s Business-Adverse conditions in the automotive market may adversely affect demand for our automotive carbon products” and “Risk Factors-Risks Related to Ingevity’s Business-If increasingly more stringent air quality standards worldwide are not adopted, our growth could be impacted.”
Current regulatory standards in the U.S. and Canada require that gasoline vapor control devices remain effective for the entire life of the vehicles on which installed. The end of lifetime requirements for most vehicles is 10 years or 120,000 miles, but will increase to 15 years or 150,000 miles for a large segment of these vehicles. China 6 standards also include a lifetime requirement of 12 years or 160,000 kilometers. Ingevity has a substantial, decades long track record of providing life-of-vehicle product
9
performance based on our unique capability to engineer a very specific mesoporous carbon on a large commercial scale. Given the imperative for automotive manufacturers to produce vehicles capable of meeting these long term requirements, or potentially face expensive recalls and unfavorable publicity, there is an increased risk to using other producers who do not have a comparable, proven history, particularly given the significant costs associated with non-compliance should an offering fail to maintain effectiveness over vehicle lifetimes. Additionally, because these gasoline vapor control systems are certified as “environmental devices” for models currently in production, it is time consuming and costly to replace our products within the vehicle’s control system with a competitive product during the vehicle’s model platform production life due to the high cost of recertification.
As a result of decades of innovation and production, Ingevity is able to produce products that are effective in smaller amounts than competitors’ offerings, meaning less product is required-which results in savings through the use of a smaller and less costly canister in the overall emissions control system. Continued innovation and manufacturing know-how may allow this advantage to continue even as competitors improve their product offerings.
Ingevity is further uniquely positioned to capitalize on the opportunity afforded by the adoption of these modern vapor emission regulatory standards, which will, as a practical matter (given current technology), require manufacturers of light duty vehicles in countries adopting these standards to incrementally install advanced gasoline vapor control technology with carbon capable of meeting the new regulatory standards. Based on the regulatory trends and expected growth in vehicles, Ingevity management estimates that the revenue for its automotive emissions products could double within five to seven years from 2015. Ingevity, through its proprietary technology, trade secrets and confidential manufacturing know-how, has unparalleled capability and expertise to manufacture the high performance activated carbon products required to meet these regulatory standards, as well as more stringent standards likely to be imposed in the years to come. These same capabilities and expertise will help Ingevity to maintain its position in the U.S. and Canada automotive markets as they implement the adoption of “near zero” gasoline vapor emission levels.
Additionally, as automotive engine technology continues to evolve and engines become more efficient, the amount of engine airflow available to purge the gasoline vapors from the activated carbon products is expected to decline (“low-purge”). We believe that the pore structure characteristics of our activated carbon products additionally advantages us versus competitors’ offerings in low purge conditions. Ingevity is actively investing in product and process development, and has received patents designed to deal with low-purge engines.
We also produce a number of other activated carbon products for food, water, beverage, and chemical purification applications to maximize the productivity of our manufacturing assets.
Raw Materials and Production
The primary raw material (by volume) used in the manufacture of our activated carbon is hardwood sawdust. Sawdust is readily available, and is sourced through multiple suppliers to protect against supply disruptions and to maintain competitive pricing.
We also consume phosphoric acid, which is used to chemically activate the hardwood sawdust. This phosphoric acid is sourced through multiple suppliers to protect against supply disruptions and to maintain competitive pricing. The market price of phosphoric acid is affected by the global agriculture market as the majority of global phosphate rock production is used for fertilizer production and only a portion of that production is used to manufacture purified phosphoric acid. In the recent past, there have been price run-ups in phosphoric acid due to increased phosphate rock demands in global agriculture, which have in turn negatively affected our business.
Activated carbon is an amorphous form of carbon characterized by a high volume of nanoscale pores. “Activation” refers to the process of developing these pores. The size, shape, and volume of the pore structure and the surface chemistry of the pore are critical for driving performance in various applications.
Activated carbons are typically produced from either a thermal or chemical process utilizing a wide variety of carbonaceous raw materials. The thermal process, the most widely used activation process, uses rotary kilns or multi-hearth furnaces to carbonize and activate the raw material. This process operates at a much higher temperature and at a lower yield than the chemical activation process. Typical raw materials include bituminous coal, lignite, and coconut husks. Thermally activated carbons are usually used for “catch and dispose” applications, whereby the carbon is used to capture certain compounds and the carbon product is then disposed of or thermally regenerated.
Ingevity employs a more specialized activation process, whereby chemical catalyst - phosphoric acid - and various heating methods are used to facilitate the development of porosity. This process operates at a lower temperature and typically has higher yields than a thermal process. Carbons produced by this method typically have larger pores than thermally activated carbons and can be used in both “catch and dispose” applications and “catch and release” applications, whereby the carbon is used to capture and temporarily hold on to certain compounds which are then released in a controlled manner under specific operating conditions.
10
We use hardwood sawdust to produce chemically activated carbon, which, because of its larger pore volume, pore structure and high surface area, is well-matched for a variety of applications and ideally suited for the “catch and release” automotive application of capturing and reusing gasoline vapor emissions.
We further process activated carbon after it is activated into different forms using a variety of extrusion processes. One of our extrusion processes is to use activated carbon and various binders to make a formed pellet. Pelleted carbon is typically used in gasoline emission control canister applications where a low pressure drop system is required such as ORVR.
Another extrusion process we employ is with our honeycomb “scrubber.” We utilize an activated carbon infused ceramic extrusion process. These extruded honeycomb “scrubbers” are a component of the our patented system to reduce the canister’s emissions to “near zero” and are manufactured at our extrusion facility in Waynesboro, Georgia.
Customers
We sell our automotive products to over 60 customers around the globe. In 2018, our ten largest customers accounted for 80 percent of the segment's sales. We are the trusted source of these products for many of the world’s largest automotive parts manufacturers, including Aisan Industry, Delphi Technologies, MAHLE, and many other large and small component manufacturers throughout the global automotive supply chain. Our relationship with many of our customers and their customers-the vehicle manufacturers themselves-have been in place for most of our history in this application. Ingevity also produces activated carbon products for food, water, beverage and chemical purification applications, which are sold to approximately 80 customers throughout the world.
We operate primarily through a direct sales force in North America and our other major markets and also have a smaller, focused network of agents and distributors that have established a strong direct sales and marketing presence.
Competition
In automotive carbon, Ingevity has a unique decades-long track record of providing life-of-vehicle performance. Given the imperative for automotive manufacturers to produce vehicles for the U.S., Canadian, and Chinese markets capable of meeting life-of-vehicle emission standards, or potentially face expensive recalls and unfavorable publicity, our automotive carbon products provide our customers the low-risk choice in this high performance application. Our competitors in automotive carbon include Cabot Corp., Kuraray, and several Chinese manufacturers. Our process purification business competes mainly in the U.S. in the food, beverage, chemical, and water purification applications. Competitors in our process purification product line include Cabot Corp., Kuraray, Jacobi Carbons, and several domestic U.S. manufacturers and distributors of imported products. Refer to Item 1A - "Risk Factors-
We face competition from producers of substitute products and new technologies, and new or emerging competitors."
and "Risk Factors-We face competition from infringing intellectual property activity.”
Performance Chemicals
Ingevity’s Performance Chemicals segment, which is comprised of four application areas (pavement technologies, oilfield technologies, industrial specialties, and engineered polymers), develops, manufactures, and sells a wide range of specialty chemicals primarily derived from co-products of the kraft pulping process and caprolactone. Pine chemicals-based products are utilized in pavement preservation, pavement adhesion promotion, warm mix asphalt, oil well service additives, oil production, and downstream, printing inks, adhesives, agrochemical dispersants, lubricants, coatings, resins, elastomers, bioplastics, and other diverse industrial uses. Our application expertise is often called upon to provide unique solutions to our customers that maximize resource efficiency. We have a broad and diverse customer base in this segment. In 2018, our top ten customers accounted for approximately 33 percent of our segment revenue; the next 100 customers made up approximately 45 percent of our segment revenue.
Raw Materials and Production
Our Performance Chemicals business serves customers globally from three manufacturing locations in the U.S. and one in the United Kingdom. Most of our pavement technologies, oilfield technologies, and industrial specialties products are derived from CTO, a co-product of the kraft pulping process, where pine is used as the source of the pulp. CTO is produced by acidulating black liquor soap skimmings ("BLSS"), which are recovered during the kraft pulping process. Consumers of CTO can purchase BLSS from pulping mills that do not have acidulation capacity (in which case the BLSS will need to be acidulated into CTO), and purchase CTO from pulping mills that do have acidulation capacity. The CTO is further separated by distillation into tall oil rosin ("TOR"), TOFA and other biofractions. As such products are further refined or chemically modified, higher value derivative products are created, making their way into a wide variety of industrial and consumer goods. We also produce performance chemicals derived from lignin, extracted from black liquor, a co-product of the kraft pulping process. TOR, TOFA and caprolactone are sold directly to customers in some instances, or, along with lignin, further refined or chemically modified into higher value derivative products. Our differentiated performance chemicals are engineered to meet specific industry standards and customer
11
requirements. Our engineered polymers are caprolactone based, which is derived from cyclohexanone, a benzene derivative, and hydrogen peroxide, both of which are readily available in the market.
The availability of CTO is directly linked to the production output of kraft mills using pine as their source of pulp, which is the predominant fiber source for packaging grades of paper as well as fluff pulp for personal care products. As a result, there is a finite global supply of CTO, with global demand for softwood kraft pulp driving the global supply of CTO, rather than demand for CTO itself. Most of the CTO made available for sale by its producers is covered by long-term supply agreements, further constraining availability.
At the time of the Separation, we entered into a long-term supply agreement with WestRock pursuant to which we purchase all of the CTO output from WestRock’s existing (at the time of separation) kraft mills, subject to certain exceptions. Beginning in 2025, either party may provide a notice to the other party terminating the agreement five years from the date of such notice. Beginning one year after such notice, the quantity of products provided by WestRock under the agreement will be gradually reduced over a four-year period based on the schedule set forth in the agreement. In addition, from 2022 until 2025, either party may provide one-year notice to remove a kraft mill as a supply source. The two largest kraft mills under the agreement currently are expected to supply approximately 19 to 20 percent and 17 to 18 percent, respectively, of the total amount of products expected to be supplied under our agreement with WestRock. In the event that WestRock exercises its right to terminate our supply agreement with them or remove a kraft mill as a supply source, we may be able to obtain substitute supplies of CTO from other suppliers, spot purchases or a new contract with WestRock. The agreement with WestRock includes pricing terms based on market prices. Under this agreement, based on WestRock’s current output, we currently expect to source approximately 30 to 40 percent of our CTO requirements through 2025 based on the maximum operating rates of our three Performance Chemicals' facilities.
In 2018, we entered into a 20-year supply agreement with Georgia-Pacific pursuant to which we will purchase the lesser of 125,000 tons or 100 percent of the CTO production from select Georgia-Pacific kraft mills during each contract year, subject to certain exceptions. The agreement with Georgia-Pacific includes a market pricing formula which is subject to quarterly adjustments. Under this agreement, we currently expect to source approximately 30 percent of our CTO requirements through 2025 based on the maximum operating rates of our three Performance Chemicals' facilities.
We have agreements with other suppliers to satisfy substantially all of the balance of our expected requirements of CTO through 2019.
We believe that we are well positioned to have sufficient CTO required for our operations. However, if any of our suppliers (including WestRock or Georgia-Pacific) fail to meet their respective obligations under our supply agreements or we are otherwise unable to procure an adequate supply of CTO, we would be unable to maintain our current levels of production. In addition, if WestRock exercises its rights to terminate the agreement or remove a kraft mill as a supply source, and we are unable to arrange a substitute supply of CTO, we would be unable to maintain our current levels of production. Additionally, there are other pressures on the availability of CTO. Some kraft pulp mills may choose to consume their production of CTO to meet their energy needs rather than sell the CTO to third parties. Furthermore, weather conditions have in the past and may in the future affect the availability and quality of pine trees used in the kraft pulping process and therefore the availability of CTO meeting our quality standards. See “Risk Factors-Risks Related to Ingevity’s Business-Our Performance Chemicals segment is highly dependent on CTO which is limited in supply; lack of access to sufficient CTO would impact our ability to produce CTO-based products.”
Also, regulatory mandates in Europe for the use of biofuel have placed additional pressure on CTO availability. See “Risk Factors-Risks Related to Ingevity’s Business-
The European Union’s Directive 2009/28 on the promotion of the use of energy from renewable resources (“Renewable Energy Directive” or “RED”) and similar legislation in the U.S. and elsewhere may incentivize the use of CTO as a feedstock for production of alternative fuels."
Finally, CTO as a raw material may be subject to significant pricing pressures. See “Risk Factors- Risks Related to Ingevity’s Business-Pricing for CTO is subject to particular pricing pressures by reason of limited supply and competing demands for end use, and we may be limited in our ability to pass on increased costs to our customers” and “Risk Factors-Risks Related to Ingevity’s Business-The Company’s oilfield technologies business is significantly affected by trends in oil and natural gas prices that affect the level of exploration, development and production activity.”
The key raw materials in our Performance Chemicals caprolactone manufacturing are cyclohexanone and hydrogen peroxide. Cyclohexanone is derived from benzene and is widely available. We maintain multiple suppliers to protect against supply disruptions and to maintain competitive pricing. Hydrogen peroxide is also widely available and is currently supplied by a co-located supplier under a long-term supply agreement. However, Brexit may pose some risk to the supply chain for our Warrington, UK Performance Chemicals facility. See See “Risk Factors- General Business and Economic Risk- Our Engineered Polymers product line may be adversely affected by Brexit.”
The other key raw materials used in the Performance Chemicals business are nonylphenol, pentaerythritol, and ethylene amines. These are sourced where possible through multiple suppliers to protect against supply disruptions and to maintain competitive pricing.
12
Markets Served
Pavement Technologies
Our pavement technologies group supplies a broad line of innovative additives, systems and technologies for road construction, resurfacing, preservation, maintenance, and recycling globally. As a specialty asphalt additive supplier, we have a long history of work with transportation agencies, university research consortiums, paving contractors, and asphalt refiners around the world to design, develop, and implement innovative additives and novel paving systems that protect existing roadways and enhance the performance of new road construction.
Our pavement technologies team combines broad downstream technical, application, and construction experience with a strong direct sales and marketing presence. Our combined expertise in the disciplines of chemistry and civil engineering provides a comprehensive understanding of the relationship between molecular structure of our chemistries and their impact on the performance of pavement systems. This allows us to develop products customized to local markets and consistently deliver cost-effective solutions for our clients. We also introduce and commercialize new technologies globally through consulting relationships with ministries and departments of transportation to stimulate customer demand for our products.
Customers
We supply asphalt products and technologies to approximately 500 customers through the use of Ingevity sales representatives and distributors. In 2018, our ten largest customers accounted for 35 percent of the product line's sales. Technology centers located in the U.S., China, Europe, and India create market insights for product development customized to local and regional markets.
Competition
We compete on the basis of deep knowledge of our customers’ business and extensive insights into road building technologies and trends globally. We use these strengths to develop consulting relationships with government departments of transportation, facilitating new technology introduction into key markets around the world. Our combined expertise in the disciplines of chemistry and civil engineering provides a comprehensive understanding of the relationship between molecular structure of our chemistries and their impact on the performance of pavement systems. This allows us to develop products customized to local markets and to consistently deliver cost-effective solutions for our customers. Our primary competitors in pavement technologies are Nouryon, Arkema, and ArrMaz.
Oilfield Technologies
Our oilfield technologies group produces and sells a wide range of innovative specialty chemical products for the global oilfield industry, including well service additives and chemical solutions for production and downstream applications.
Well Service Additives
. Our well service additive products are formulated to increase emulsion stability and aid in fluid loss control for oil-based drilling fluids. Other additives include rheology modifiers, which are used to improve the viscosity properties of oil-based fluids, and are typically used in deep water applications and wetting agents, which provide improved wetting of solids and aid in the efficiency of the drilling process. This family of products aids in accessing difficult to reach oil and gas reserves, both on and offshore around the globe.
Production and Downstream
. Our production and downstream products serve as corrosion inhibitors or their components. Crude oil and natural gas production is characterized by variable production rates and unpredictable changes due to the nature of the produced fluids including but not limited to water and salt content. Our corrosion inhibitors maximize production rates by reducing equipment downtime from corrosion of key equipment and pipe.
Customers
We sell our oilfield technologies to approximately 70 customers around the globe through the use of Ingevity sales representatives and distributors. In 2018, our ten largest customers accounted for 81 percent of product line.
Competition
We compete on the basis of our ability to understand our customers’ applications and deliver solutions that aid in their improvement of the exploration and production of oil and gas for the end users. Additionally, this application expertise coupled with our strong understanding of CTO-based chemistry allows for rapid development of solutions to challenges in the field. Our scale and flexibility of manufacturing are the final piece that helps deliver the creativity, expedience, and confidence the customers in oilfield technologies require from their best suppliers. Our competitors in this field include Lamberti, Kraton, and several others.
Industrial Specialties
Our industrial specialties group manufactures specialty chemicals-including: adhesive tackifiers, agrochemical dispersants, lubricant additives, printing inks, and industrial intermediates. Our technical expertise and formulation capabilities
13
allow us to develop innovative products to meet our customers’ various needs.
Adhesives.
We are a leading global supplier of tackifier resins which provide superior adhesion to difficult-to-bond materials to the adhesives industry. Adhesive applications for our products include construction, product assembly, packaging, pressure sensitive labels and tapes, hygiene products, and road markings.
Agrochemicals.
We produce dispersants for crop protection products as well as other naturally derived products for agrochemicals. Crop protection formulations are highly engineered, specifically formulated and cover a range of different formulation types, from liquids to solids. We deliver a wide range of dispersants that are high performing and consistent. In addition, our crop protection products are approved for use as inert ingredients in agrochemicals by regulatory agencies throughout the world.
Lubricants.
We supply lubricant additives and corrosion inhibitors for the metalworking and fuel additives markets. Our lubricant products are multi-functional additives that contribute to lubricity, wetting, corrosion inhibition, emulsification, and general performance improvement. Our products are valued because of their ease in handling, robust performance, and improved formulation stability.
Printing Inks.
We are a leading supplier of ink resins from renewable resources to the global graphic arts industry for the preparation of printing inks. Our products improve gloss, drying speed, viscosity, adhesion, and rub resistance of the finished ink to the substrate. We produce a wide array of resins, typically specifically tailored to a customer’s use, which can vary by application, pigment type, end use, formulation and manufacturing, and printing process.
Industrial Intermediates.
Our functional chemistries are sold across a diverse range of industrial markets including, among others, paper chemicals, textile dyes, rubber, cleaners, mining, and nutraceuticals.
Customers
We sell our industrial specialty chemicals to over 500 customers around the globe through the use of Ingevity sales representatives and distributors. We have an over twenty-year relationship with many of our significant customers in this business. In 2018, our ten largest customers accounted for 45 percent of the product line's sales.
Competition
In industrial specialties, our customers select the product that provides the best balance of performance, consistency, and price. Reputation and commitment to our customer’s industry are also valued by our customers and allow us to win business when other factors are equal. In our adhesives business, our products compete against other tackifiers, including other TOR-based tackifiers as well as tackifiers produced from gum rosin and hydrocarbon starting materials. In addition, the choice of polymer used in an adhesive formulation drives the selection of tackifier. In agrochemicals, the selection of a dispersant is made early in the product development cycle and the formulator has a choice among Ingevity’s sulfonated lignin products, lower quality lignosulfonates and other surfactants such as naphthalene sulfonates. In lubricants, we compete against other producers of distilled tall oil and additives. In printing inks, our products compete against other resins that can be derived from TOR, gum rosin and, to a lesser extent, hydrocarbon sources. In our industrial intermediates business, our TOFA competes against widely available fats and oils derived from soy, rapeseed, palm, cotton, and tallow sources.
Competitors are different depending on the product, application, and region and include Kraton, Eastman Chemical, ExxonMobil, Borregaard, Lawter, Respol/Forchem, DRT, as well as several others.
Perstorp AB's Caprolactone Business
On December 10, 2018, we entered into an agreement for the Sale and Purchase of Perstorp UK Ltd. (the “Caprolactone Agreement”) with Perstorp Holding AB, a company registered in Sweden, that develops, manufactures, and sells specialty chemicals (the “Seller”). Pursuant to the Caprolactone Agreement, we agreed to purchase the shares held by the Seller in Perstorp UK Ltd., including the Seller’s entire caprolactone business, in exchange for €570.9 million, less assumed debt and other miscellaneous transaction costs, as further defined in the Caprolactone Agreement (the “Purchase Price”), plus interest accrued on the Purchase Price (herein referred to as the “Caprolactone Acquisition”).
On February 13, 2019, pursuant to the terms and conditions set forth in the Caprolactone Agreement, we completed the Caprolactone Acquisition for an aggregate preliminary purchase price of €578.9 million ($652.5 million) excluding net debt to be assumed of €100.4 million ($113.1 million). At closing, the assumed net debt was settled with an affiliate of the counterparty, Perstorp Holding AB. Beginning in the first quarter of 2019, the Caprolactone Acquisition will be integrated into our Performance Chemicals segment and included within our Engineered Polymers product line. Our revolving credit facility was utilized as the primary source of funds, along with available cash on hand, to close our Caprolactone Acquisition. Our available capacity under our revolving credit facility immediately following this drawdown was $113.1 million.
The Caprolactone Acquisition is considered a business under business combinations accounting guidance, and therefore we will apply acquisition accounting. Acquisition accounting requires, among other things, that assets and liabilities assumed be
14
recognized at their fair values as of the acquisition date. The net assets of the Caprolactone Acquisition will be recorded at the estimated fair values using primarily Level 2 and Level 3 inputs (see Note 17 for an explanation of Level 2 and 3 inputs).
We have performed a preliminary valuation of the fair value of the acquired assets and liabilities assumed. Based on this preliminary allocation of the purchase price, we believe the primary assets acquired and their estimated values are; goodwill of approximately $310 million and tangible and intangible assets of approximately $220 million. This preliminary assessment of fair value is based on draft reports from our valuation experts and is subject to change based on its preliminary nature. Once our detailed preliminary purchase price valuation is completed, we will include the required additional details in our future filings. We have not completed the detailed analysis to present the pro forma financial information for the combined companies. Thus, the pro forma financial information will be included in our future filings as well.
Engineered Polymers
Our engineered polymers group produces caprolactone and caprolactone based specialty chemicals for use in coatings, resins, elastomers, adhesives, and bioplastics. Our technical expertise and formulation capabilities allow us to develop innovative products to meet our customers’ various needs.
Coatings.
We supply coating products that are used in automobile refinishing, sports floors, and marine applications. Our products enhance end product performance by providing abrasion resistance, long durability, high quality finish, and enhanced performance in resin modification. Our products are often preferred when they provide a combination of traits which allow customers to displace several combinations of other products.
Resins.
We supply resin products that are used in acrylic resins, polyurethane, and inks. Our products enhance end product performance due to their protective properties, all weather performance and reduction or elimination of the need for solvents in formulations. Our products tend to be preferred where superior or particular performance levels are required by our customers.
Elastomers.
We supply products that are used in wheel seals, mining screens, and polyurethane films. Our products enhance end product performance due to their resistance to wear and tear, the ability to maintain form and function under pressure and temperature and provide excellent UV resistance. Our products are often used in highly demanding applications where competitive products do not reach required performance levels.
Adhesives.
We supply products that are used in hot-melts, fabric lamination, and miscellaneous footwear components. Our products enhance end product performance through their durability and substrate compatibility. Our products tend to be preferred because they are found to be easier to process and apply compared to competitive offerings.
Bioplastics.
We supply products that are used in films, paper coatings, disposable cups, utensils, and packaging. Our products enhance end product performance due to the combination of their biodegradability and stability, strength properties, and food friendliness (some products EU food contact approved). Our products tend to improve processing of existing bioplastic solutions.
Other.
We supply additives that are used in medical devices, 3-D printing, and miscellaneous footwear components. Our additives enhance end product performance due to their low melting point and ability to be thermoformed. Our products improve process conditions and improve the surface finish of the end product compared to competitive offerings.
Customers
We sell our engineered polymers chemicals to approximately 400 customers around the globe through the use of Ingevity sales representatives and distributors. We have a 40-year history in the business and have some customers with relationships greater than ten years.
Competition
In engineered polymers, we face competition from not only other producers of caprolactone, but other competing technologies. We compete on the basis of performance as compared to the other materials. In coatings, we compete against PTMEG, polycarbonates, and polyols. In resins, we also compete against hydroxy monomers, oxitanes, allyl ethers and hydroxy acrylates. In elastomers, we compete against PTMEG, HDO adipates, polycarbonates and polyesters. In adhesives, we compete against TPU, surlyn, polyesters, EVA, and polyamids. In bioplastics, we compete against PBAT, PBS, polylactide, and starch-based polymers.
The primary caprolactone competitors are Daicel and BASF.
Energy
Our manufacturing processes require a significant amount of energy. We are dependent on natural gas to fuel the processes in our chemical refineries and activated carbon plants. Although we believe that we currently have a stable natural gas supply and infrastructure for our operations, we are subject to volatility in the market price of natural gas. All of our manufacturing processes
15
also consume a significant amount of electricity. All of our facilities are located in regulated service areas that have stable rate structures with reliable electricity supply.
Environment
Our operations are subject to extensive regulation by federal, state, and local authorities, as well as regulatory authorities with jurisdiction over the foreign operations of Ingevity, including relating to the discharge of materials into the environment and the handling, disposal, and clean-up of waste materials, and otherwise relating to the protection of the environment. It is not possible to quantify with certainty the material effects that compliance with these regulations may have upon the capital expenditures, earnings or competitive position of Ingevity, but it is anticipated that such compliance will not have a material adverse effect on any of the foregoing. For a further discussion, see “Risk Factors-Risks Related to Ingevity’s Business-Our business involves hazards associated with chemical manufacturing, storage, transportation and disposal” and “Risk Factors-Risks Related to Ingevity’s Business-The Company’s operations are subject to a wide range of general and industry specific environmental laws and regulations.” Environmental regulation and legal proceedings have the potential for involving significant costs and liability for Ingevity.
Backlog
In general, we do not manufacture our products against a backlog of orders and do not consider backlog to be a significant indicator of the level of future sales activity. Production and inventory levels are based on the level of incoming orders as well as projections of future demand. Therefore, we believe that backlog information is not material to understanding our overall business and should not be considered a reliable indicator of our ability to achieve any particular level of revenue or financial performance.
I
ntellectual Property
Intellectual property, including patents, closely guarded trade secrets and highly proprietary manufacturing know-how, as well as other proprietary rights, is a critical part of maintaining our technology leadership and competitive edge. Our business strategy includes filing patent and trademark applications where appropriate for proprietary developments, as well as protecting our trade secrets. We actively create, protect, and enforce our intellectual property rights. The protection afforded by our patents and trademarks varies based on country, scope, and coverage, as well as the availability of legal remedies. Although our intellectual property taken as a whole is material to the business, other than our “canister bleed emissions” patent, which is part of our automotive business and expires in March 2022, there is no individual patent or trademark the loss of which could have a material adverse effect on the business. The most commonly applied embodiment of the “canister bleed emissions” patent uses our activated carbon in the main part of the canister and our activated carbon extruded honeycomb(s) as a “scrubber” on the outlet side of the canister to reduce the canister’s emissions to “near zero.” We are filing for and being granted patents for product and process developments for our Performance Materials business that we believe are both novel and consistent with trends in the technological development of engines. Our Evotherm Warm Mix Asphalt technology is supported by numerous global patents. Additionally, our Caprolactone Business and related technologies are supported by numerous global patents and trademarks, as well as proprietary manufacturing and technical know-how. See “Risk Factors-Risks Related to Ingevity’s Business-
From time to time we are called upon to protect our intellectual property rights and proprietary information though litigation and other means; if we are unable to successfully protect our rights we may be negatively impacted from a financial as well as competitive advantage standpoint
,” “Risk Factors-Risks Related to Ingevity’s Business-
As we rely on information technologies to conduct our business, security breaches and other disruptions could compromise our information and expose us to liability, which could cause our business and reputation to suffer.
”, and "Risk Factors-We face competition from infringing intellectual property activity."
Seasonality
There are a variety of seasonal dynamics, including global climate and weather conditions, that impact our businesses, though none materially affect financial results, except in the case of the pavement technologies business, where roughly 70 to 75 percent of its revenue is generated between April and September. From a supply perspective, this seasonality is effectively managed through pre-season inventory build then active inventory management throughout the year.
Employees
We currently employ approximately 1,750 employees, of whom approximately 80 percent are employed in the U.S. Approximately 20 percent are represented by domestic (i.e. U.S.) labor unions under various collective bargaining agreements. We engage in negotiations with labor unions for new collective bargaining agreements from time to time based upon expiration dates of agreements and statutory requirements. We consider our relationships with all salaried, union hourly and non-hourly employees to be positive and collaborative.
During 2018, Ingevity ratified new labor agreements with United Steel Workers ("USW") and International Association of Machinists and Aerospace Workers ("IAM") at our Charleston, South Carolina location. The International Brotherhood of Electrical Workers ("IBEW") at our Charleston, South Carolina location ratified our contract offer made December 17, 2018 in January 2019. No collective bargaining agreements are scheduled to expire in 2019.
16
See “Risk Factors-Risks Related to Ingevity’s Business-
Work stoppages and other labor relations matters may have an adverse effect on our financial condition and results of operations."
For further information on measures of profitability used by managers of the business and its segments, refer to “Management’s Discussion and Analysis of Financial Condition and Results of Operations.”
Item 1A. Risk Factors
Based on the information currently known to us, we believe that the following information identifies the most significant risk factors affecting our company. However, the risks and uncertainties our company faces are not limited to those set forth in the risk factors described below. Additional risks and uncertainties not presently known to us or that we currently believe to be immaterial may also adversely affect our business. In addition, past financial performance may not be a reliable indicator of future performance, and historical trends should not be used to anticipate results or trends in future periods.
If any of the following risks and uncertainties develops into actual events, these events could have a material adverse effect on our business, financial condition or results of operations. In such case, the trading price of our common stock could decline.
General Business and Economic Risks
We may be adversely affected by general global economic and financial conditions beyond our control.
Our businesses may be affected by a number of factors that are beyond our control such as general economic and business conditions, changes in tax laws or tax rates and conditions in the financial services markets including counterparty risk, insurance carrier risk, rising interest rates, inflation, deflation, fluctuations in the value of local currency versus the U.S. dollar or the impact of a stronger U.S. dollar which may negatively impact our ability to compete. Macro-economic challenges, including conditions in financial and capital markets and levels of unemployment, and the ability of the U.S. and other countries to deal with their rising debt levels may continue to put pressure on the economy or lead to changes in tax laws or tax rates. There can be no assurance that changes in tax laws or tax rates will not have a material impact on our future cash taxes, effective tax rate or deferred tax assets and liabilities. Adverse developments in global or regional economies could drive an increase or decrease in the demand for our products that could increase or decrease our revenues, increase or decrease our manufacturing costs and ultimately increase or decrease our results of operations, financial condition and cash flows. As a result of negative changes in the economy, customers, vendors or counterparties may experience significant cash flow problems or cause consumers of our products to postpone or refrain from spending in response to adverse economic events or conditions. If customers are not successful in generating sufficient revenue or cash flows or are precluded from securing financing, they may not be able to pay or may delay payment of accounts receivable that are owed to us or we may experience lower sales volumes. Our financial condition and results of operations could be materially and adversely affected by any of the foregoing.
We are exposed to the risks inherent in international sales and operations.
In 2018, export sales from the U.S. made up approximately one third of our total sales, and we sell our products to customers in approximately 75 countries. We have exposure to risks of operating in many foreign countries, including:
|
•
|
fluctuations in foreign currency exchange rates, including the euro, pound sterling, Japanese yen and Chinese renminbi;
|
|
•
|
restrictions on, or difficulties and costs associated with, the repatriation of cash from foreign countries to the U.S.;
|
|
•
|
difficulties and costs associated with complying with a wide variety of complex laws, treaties and regulations;
|
|
•
|
unexpected changes in political or regulatory environments;
|
|
•
|
earnings and cash flows that may be subject to tax withholding requirements or the imposition of tariffs, exchange controls or other restrictions;
|
|
•
|
political and economic instability;
|
|
•
|
import and export restrictions, tariffs, and other trade barriers or retaliatory actions;
|
|
•
|
difficulties in maintaining overseas subsidiaries and international operations;
|
|
•
|
difficulties in obtaining approval for significant transactions;
|
|
•
|
government limitations on foreign ownership;
|
|
•
|
government takeover or nationalization of business; and
|
|
•
|
government mandated price controls.
|
17
Any one or more of the above factors could adversely affect our international operations and could significantly affect our financial condition and results of operations. We have also expanded our participation in certain markets. As our international operations and activities expand, we inevitably have greater exposure to the risks of operating in many foreign countries.
Additionally, the U.S. has recently imposed tariffs on certain U.S. imports. China and other countries have responded with retaliatory tariffs on certain U.S. exports. If tariffs or other restrictions or retaliatory actions increase our operating costs in the future, and we are not able to recapture those costs from our customers, or if such tariffs or other restrictions make it more difficult for us to compete in overseas markets, our business, financial condition and results of operations could be adversely impacted.
Our reported results could be adversely affected by currency exchange rates and currency devaluation could impair our competitiveness.
Due to our international operations, we transact in many foreign currencies, including but not limited to the euro, pound sterling, Japanese yen and Chinese renminbi. As a result, we are subject to the effects of changes in foreign currency exchange rates. During times of a strengthening U.S. dollar, our reported net revenues and operating income will be reduced because the local currency will be translated into fewer U.S. dollars. During periods of local economic crisis, local currencies may be devalued significantly against the U.S. dollar, potentially reducing our margin. Ingevity may enter forward exchange contracts and other financial contracts in an attempt to mitigate the impact of currency rate fluctuations. However, there can be no assurance that such actions will eliminate any adverse impact from variation in currency rates. Also, actions to recover margins may result in lower volume and a weaker competitive position, which may have an adverse effect on our profitability.
Our operations outside the U.S. require us to comply with a number of U.S. and foreign regulations, violations of which could have a material adverse effect on our financial condition and results of operations.
Our operations outside the U.S. require us to comply with a number of U.S. and international regulations. For example, our operations in countries outside the U.S. are subject to the U.S. Foreign Corrupt Practices Act (“FCPA”), which prohibits U.S. companies and their agents and employees from providing anything of value to a foreign official for the purposes of influencing any act or decision of these individuals in their official capacity to help obtain or retain business, direct business to any person or corporate entity, or obtain any unfair advantage. Our activities may create the risk of unauthorized payments or offers of payments by our employees, agents or joint venture partners that could be in violation of anti-corruption laws, even though these parties are not subject to our control. We have internal control policies and procedures and training and compliance programs for our employees and agents with respect to the FCPA and other applicable anti-corruption laws. However, we cannot assure that our policies, procedures and programs always will protect us from reckless or criminal acts committed by our employees or agents. Allegations of violations of applicable anti-corruption laws may result in internal, independent or government investigations. Violations of anti-corruption laws may result in severe criminal or civil sanctions, and we may be subject to other liabilities, which could have a material adverse effect on our financial condition and results of operations.
In addition, the shipment of goods, services and technology across international borders subjects us to extensive trade laws and regulations. Our import activities are governed by the unique customs laws and regulations in each of the countries where we operate. Moreover, many countries, including the U.S., control the export and re-export of certain goods, services and technology and impose related export record-keeping and reporting obligations. Governments may also impose economic sanctions against certain countries, persons and entities that may restrict or prohibit transactions involving such countries, persons and entities, which may limit or prevent our conduct of business in certain jurisdictions. We are also required to comply with similar laws and regulations in other countries where we do business, with the same associated risks.
The laws and regulations concerning import activity, export record-keeping and reporting, export control and economic sanctions are complex and constantly changing. These laws and regulations can cause delays in shipments and unscheduled operational downtime. Moreover, any failure to comply with applicable legal and regulatory trading obligations could result in criminal and civil penalties and sanctions, such as fines, imprisonment, debarment from governmental contracts, seizure of shipments and loss of import and export privileges. In addition, investigations by governmental authorities as well as legal, social, economic and political issues in these countries could have a material adverse effect on our business, results of operations and financial condition. We are also subject to the risks that our employees, joint venture partners and agents outside of the U.S. may fail to comply with other applicable laws.
18
Our Engineered Polymers product line may be adversely affected by Brexit.
On June 23, 2016, voters in the United Kingdom (“UK”) approved an advisory referendum to withdraw from the European Union (“EU”), commonly referred to as “Brexit.” Thereafter, on March 29, 2017, the UK formally notified the EU of its intention to withdraw pursuant to Article 50 of the Lisbon Treaty. The withdrawal of the UK from the EU will take effect either on the effective date of the withdrawal agreement or, in the absence of agreement, March 29, 2019, although this period can be extended with the unanimous agreement of the European Council. The long-term nature of the UK’s relationship with the EU is unclear and there is considerable uncertainty if and when any withdrawal agreement will be agreed upon and implemented.
Brexit creates an uncertain political and economic environment in the UK and potentially across other EU member states for the foreseeable future, including during any period while the terms of Brexit are being negotiated and such uncertainties could impair or limit our ability to transact business in the UK and member EU states. The effects of Brexit will depend on any agreements the UK makes to retain access to EU markets either during a transitional period or more permanently. Brexit could adversely affect the UK, EU and worldwide economic or market conditions and could contribute to instability in global financial markets, and the value of the pound sterling or other currencies, including the Euro. Furthermore, Brexit could also have the effect of disrupting the free movement of goods, services, and people between the UK, the EU, and elsewhere.
Additionally, a significant portion of the regulatory regime that applies to us in the UK is derived from EU directives and regulations. For so long as the UK remains a member of the EU, these directives and regulations will (unless otherwise repealed or amended) remain in effect. However, Brexit could change the legal and regulatory framework within the UK and is likely to lead to legal uncertainty and potentially divergent national laws and regulations as the UK determines which EU laws to replace or replicate.
Depending on the Brexit outcome, it is possible that there may be adverse practical and/or operational implications on our business. Prior to the Caprolactone Acquisition we had no material suppliers located in the UK and during 2018 less than one percent of our sales were sold to customer locations within the UK. On February 13, 2019 we closed the Caprolactone Acquisition. The manufacturing operations of the Caprolactone Acquisition are located in Warrington, UK. The Warrington facility management team has been proactively planning for various Brexit contingencies since prior to the Caprolactone Acquisition. Such planning includes positioning additional raw materials in the UK, as well as storing addition inventories of products in the EU, in order to minimize the impact of any short term Brexit related supply chain disruptions. We do not have a significant number of UK or EU based employees that will need to change or clarify their immigration status as a result of Brexit. Additionally, we are planning for the impact of Brexit on REACH by working with our REACH only representative on a plan to ensure REACH registrations are in place in the UK and EU, for substances sold into the UK and EU as appropriate. While we believe we are taking appropriate steps to plan for Brexit, due to the uncertainties of how Brexit will be resolved and its accompanying impacts, there can be no assurance that Brexit will not adversely affect our business operations, results of operations and financial condition.
Risks Related to Ingevity’s Business
We are dependent on attracting and retaining key personnel.
The Company is dependent upon its senior management, as well as upon engineering, technical, sales and application specialists, together with experienced industry professionals. Our success depends, in part, on our ability to attract, retain and motivate these key performers. Our failure to attract and retain those making significant contributions could adversely affect our financial condition and results of operations.
If increasingly more stringent air quality standards worldwide are not adopted, our growth could be impacted.
Environmental standards drive the implementation of gasoline vapor emission control systems by automotive manufacturers. Given increasing societal concern over global warming and health hazards associated with poor air quality, there is growing pressure on regulators across the globe to take meaningful action. For those countries that have not significantly regulated gasoline vapor emissions, enacting more stringent regulations governing gasoline vapor emissions represents a significant upside to the Company’s automotive carbon business. However, regulators may react to a variety of considerations, including economic and political, that may mean that any such more stringent regulations are delayed or shelved entirely, in one or more countries or regions. As the adoption of more stringent regulations governing gasoline vapor emissions is expected to drive significant growth in our automotive carbon applications, the failure to enact such regulations will have a significant impact on the growth prospects for these products.
19
Adverse conditions in the automotive market may adversely affect demand for our automotive carbon products.
Sales of our automotive activated carbon products are tied to global automobile production levels. Automotive production in the markets we serve can be affected by macro-economic factors such as interest rates, fuel prices, shifts in vehicle mix (including shifts toward alternative energy vehicles), consumer confidence, employment trends, regulatory and legislative oversight requirements and trade agreements. For example, the global economic downturn in 2008/2009 led to a drastic reduction in vehicle sales and an even greater reduction in vehicle production as OEMs right-sized their inventories to meet the lower sales volumes. Regional disruptions such as those caused by the Japan earthquake and resulting tsunami in March 2011 and Hurricane Sandy in October 2012 can also significantly impact vehicle production and therefore demand for our automotive carbon.
The Company’s printing inks business serves customers in a market that is facing declining volumes and downward pricing.
In recent years, the use of inks in which our printing ink resins are used, such as those made for magazines and catalogues, has significantly decreased, as the printing industry has experienced a reduction in demand due to various factors including the global economic downturn of 2008 and 2009, which severely impacted volumes, and competition from alternative sources of communication, including email, the Web, electronic readers, interactive television and electronic retailing. The impacts of these changes have led to continued intense competition and downward pricing pressures on printing inks, and therefore, our ink products.
The Company’s pavement technologies business is heavily dependent on government infrastructure spending.
A significant portion of our customers’ revenues in our pavement technologies business is derived from contracts with various foreign and U.S. governmental agencies, and therefore, when government spending is reduced, our customers’ need for our products is similarly reduced. While we do not do business directly with governmental agencies, our customers provide paving services to, for example, the governments of various jurisdictions within North America, Europe, China, Brazil and India, and revenue either directly or indirectly attributable to such government spending continues to remain a significant portion of our revenues. Government business is, in general, subject to special risks and challenges, including: delays in funding and uncertainty regarding the allocation of funds to federal, state and local agencies, delays in the expenditures and delays or reductions in other state and local funding dedicated for transportation projects; other government budgetary constraints, cutbacks, delays or reallocation of government funding; long purchase cycles or approval processes; our customers’ competitive bidding and qualification requirements; changes in government policies and political agendas; and international conflicts or other military operations that could cause the temporary or permanent diversion of government funding from transportation or other infrastructure projects.
The Company’s oilfield technologies business is significantly affected by trends in oil and natural gas prices that affect the level of exploration, development and production activity.
Demand for our oilfield technologies services and products is particularly sensitive to the level of exploration, development and production activity of, and the corresponding capital spending by, oil and natural gas companies, including national oil companies. The level of exploration, development and production activity is directly affected by trends in oil and natural gas prices, which historically have been volatile. Crude oil prices have declined significantly since 2014, with West Texas Intermediate oil spot prices declining from a high of $108 per barrel in June 2014 to a low of $27 per barrel in February 2016, a level which had not been experienced since 2003. Pricing has climbed to a trading range of $43 to $64 per barrel in the November 2018 to January 2019 time frame. Pricing is not currently forecasted to change significantly from these levels during 2019. While these pricing levels are significantly above the February 2016 levels, they remain off their highs seen in the last decade.
Any prolonged low pricing environment for oil and natural gas is likely to result in reduced demand for our oilfield technology products, which may have a material adverse effect on our results of operations.
I
n order to compete successfully, we must develop new products and technologies meeting evolving market and customer needs; disruptive technologies could reduce the demand for the Company’s products.
Our industries and the end-use markets into which we sell our products experience periodic technological change and product improvement. Our future growth will depend on our ability to gauge the direction of commercial and technological progress in key end-use markets and on our ability to fund and successfully develop, manufacture and market products in such changing end-use markets. If we fail to keep pace with the evolving technological innovations in our end-use markets on a competitive basis, including with respect to innovation with regard to the development of alternative uses for, or application of, products developed that utilize such end-use products, our financial condition and results of operations could be adversely affected. Similarly, we face
20
competition in our applications. Disruptive technology involving new or superior solutions could reduce the demand for the Company’s products.
From time to time we are called upon to protect our intellectual property rights and proprietary information though litigation and other means; if we are unable to successfully protect our rights we may be negatively impacted from a financial as well as competitive advantage standpoint.
Intellectual property rights, including patents, trade secrets, confidential information, trademarks, trade names and trade dress, are important to our business. See "Intellectual Property" included within Part I. Item 1 of this Form 10-K for more information on our “canister bleed emissions” patent. We will endeavor to protect our intellectual property rights in key jurisdictions in which our products are produced or used, in jurisdictions into which our products are imported, and in jurisdictions where our competitors have significant manufacturing capabilities. Our success will depend to a significant degree upon our ability to protect and preserve our intellectual property rights. However, we may be unable to obtain or maintain protection for our intellectual property in key jurisdictions. Although we own and have applied for numerous patents and trademarks throughout the world, we may have to rely on judicial enforcement of our patents and other proprietary rights. Our patents and other intellectual property rights may be challenged, invalidated, circumvented and rendered unenforceable or otherwise compromised. A failure to protect, defend or enforce our intellectual property could have an adverse effect on our financial condition and results of operations. Similarly, third parties may assert claims against us and our customers and distributors alleging our products infringe upon third-party intellectual property rights.
We also rely materially upon unpatented proprietary technology, know-how and other trade secrets to maintain our competitive position. While we maintain policies to enter into confidentiality agreements with our employees and third parties to protect our proprietary expertise and other trade secrets, these agreements may not be enforceable or, even if legally enforceable, we may not have adequate remedies for breaches of such agreements. We also may not be able to readily detect breaches of such agreements. The failure of our patents or confidentiality agreements to protect our proprietary technology, know-how or trade secrets could result in significantly lower revenues, reduced profit margins or loss of market share.
We are currently involved in several legal actions relative to intellectual property associated with our "canister bleed emissions" patent. These and other legal actions to protect, defend or enforce our intellectual property rights could result in significant costs and diversion of our resources and our management’s attention, and we may not prevail in any such suits or proceedings. A failure to protect, defend or enforce our intellectual property rights, or the loss of patent rights due to adverse findings in any claims or proceedings could have an adverse effect on our financial condition and results of operations.
Our Performance Chemicals segment is highly dependent on CTO, which is limited in supply; lack of access to sufficient CTO would impact our ability to produce CTO-based products.
The availability of CTO is essential to the Company’s Performance Chemicals segment. Availability of CTO is directly linked to the production output of kraft mills using pine as their source of pulp, which is the predominant fiber source for packaging grades of paper as well as fluff pulp for personal care products. As a result, there is a finite global supply of CTO-with global demand for kraft board driving the global supply of CTO, rather than demand for CTO itself. Most of the CTO made available for sale by its producers in North America is covered by long-term supply agreements, further constraining availability.
At the time of the Separation, we entered into a long-term supply agreement with WestRock pursuant to which we purchase all of the CTO output from WestRock’s existing (at the time of separation) kraft mills, subject to certain exceptions. This agreement includes pricing terms based on market prices.
Pricing for the products in our agreement with WestRock is based on the prevailing market prices of products at the time of purchase. The pricing formulas are subject to certain pricing floors as set forth in the agreement with WestRock. Given the take-or-pay requirements of the agreement with WestRock, in adverse market conditions we could be required to purchase CTO from WestRock at prices where our results of operations could be materially and adversely affected.
In 2018,
we entered into a 20 year CTO supply agreement with
Georgia-Pacific
, pursuant to which we purchase the lesser of 125,000 tons of CTO and the aggregate output of CTO produced and originating at certain of Georgia-Pacific’s paper mills.
Pricing for the CTO in our agreement with Georgia-Pacific is a market-based price, subject to ongoing adjustments. Given the take-or-pay requirements of the agreement with Georgia-Pacific, in adverse market conditions we could be required to purchase CTO from Georgia-Pacific at prices where our results of operations could be materially and adversely affected.
21
If any of our suppliers (including WestRock or Georgia-Pacific) fail to meet their respective obligations under our supply agreements or we are otherwise unable to procure an adequate supply of CTO, we would be unable to maintain our current level of production and our results of operations would be materially and adversely affected.
Beginning in 2025, either party to the WestRock agreement may provide a notice to the other party terminating the WestRock agreement five years from the date of such notice. Beginning one year after such notice, the quantity of products provided by WestRock under the agreement will be gradually reduced over a four-year period based on the schedule set forth in the agreement. In addition, from 2022 until 2025, either party may provide a one-year notice to remove a kraft mill as a supply source. The two largest kraft mills under the WestRock agreement currently supply approximately 19 to 20
percent
and 17 to 18
percent
, respectively, of the total amount of products supplied under our agreement with WestRock. If WestRock exercises its rights to terminate the agreement or remove a kraft mill as a supply source, and we are unable to arrange for a substitute supply of CTO, we would be unable to continue to produce the same quantity of products and our results of operations could be materially and adversely affected.
There are other pressures on the availability of CTO. Some pulp or paper mills may choose to consume their production of CTO to meet their energy needs rather than sell the CTO to third parties. Also, as described below, there are regulatory pressures that may incentivize suppliers of CTO to sell CTO into alternative fuel markets rather than to historical end users such as Ingevity. Furthermore, weather conditions have in the past and may in the future affect the availability and quality of pine trees used in the kraft pulping process and therefore the availability of CTO meeting Ingevity’s quality standards. For example, the combined impact of Hurricane Katrina in August 2005 and Hurricane Rita in September 2005 caused significant damage to forests throughout the southern U.S.. This significantly affected the availability and quality of the supply of CTO during late 2005 and into 2006. In addition, Hurricanes Florence and Michael in 2018 disrupted vendor operations and reduced availability of CTO supply.
We may not realize the growth opportunities that are anticipated from the Caprolactone Acquisition.
The benefits that are expected to result from the Caprolactone Acquisition will depend, in part, on our ability to realize the anticipated growth opportunities. Our success in realizing these growth opportunities, and the timing of this realization, depends on the successful integration of the Caprolactone Business. There is a significant degree of difficulty and management distraction inherent in the process of integrating an acquisition as sizable as the Caprolactone Business. The process of integrating operations could cause an interruption of, or loss of momentum in, our and the Caprolactone Business’ activities. Members of our senior management may be required to devote considerable amounts of time to this integration process, which will decrease the time they will have to manage other aspects of our business, service existing customers, attract new customers and develop new products or strategies. If senior management is not able to effectively manage the integration process, or if any significant business activities are interrupted as a result of the integration process, our business could suffer. There can be no assurance that we will successfully or cost-effectively integrate the Caprolactone Business. The failure to do so could have a material adverse effect on our business, financial condition or results of operations.
Even if we are able to integrate the Caprolactone Business successfully, this integration may not result in the realization of the full benefits of the growth opportunities that we currently expect from this integration, and we cannot guarantee that this benefit will be achieved within anticipated time frames or at all. For example, the associated costs of the Caprolactone Acquisition may be greater than we expect. Any of these would offset the anticipated benefit from the Caprolactone Acquisition.
The Caprolactone Acquisition may expose us to unknown liabilities.
On February 13, 2019, we acquired all the shares of Perstorp UK Ltd. and, as a result, we will generally be subject to all of its liabilities, subject to a warranty and indemnity insurance policy and remedies in the Caprolactone Agreement. We may learn additional information about the Caprolactone Business that adversely affects us, such as unknown liabilities, including liabilities under environmental or tax laws, or issues that could affect our ability to comply with other applicable laws. If previously unknown liabilities or other obligations of the Caprolactone Business emerge in the future, and available remedies are not sufficient, our business could be materially affected.
22
The European Union’s Directive 2009/28 on the promotion of the use of energy from renewable resources (“Renewable Energy Directive” or “RED”) and similar legislation in the U.S. and elsewhere may incentivize the use of CTO as a feedstock for production of alternative fuels.
In December 2008, the European Union (“EU”) adopted the Renewable Energy Directive, which established a 20
percent
EU-wide target for energy consumed from renewable sources relative to the EU’s gross final consumption of energy, as well as a 10
percent
target for energy consumed from renewable sources in the transport section. In order to reach these targets, the RED established mandatory targets for each Member State and required each Member State to adopt a national renewable energy action plan setting forth measures to achieve its national targets. The RED also established sustainability criteria for biofuels, which must be satisfied in order for the consumption of a fuel to count toward a Member State’s national targets. CTO-based biofuel currently satisfies the RED’s biofuel sustainability criteria.
In spring 2015, the EU adopted amendments to the Renewable Energy Directive. RED now expressly lists CTO as a residue-type feedstock whose use in biofuel would make that biofuel eligible for double counting towards national targets of the Member States, and at least two Member States additionally have or plan fiscal incentives for the domestic marketing of CTO-based and other qualifying biofuels.
In 2018, the EU adopted RED II (effective 2021-2030) which increased the target for energy consumed from renewable sources in the transport section to 14
percent
and established minimum use levels for certain feedstocks that may promote the use of CTO for the production of alternative fuels.
In addition to these developments in the European Union, various pieces of legislation regarding the use of alternative fuels have been introduced in the U.S. Currently, none of the U.S. legislation mandates or provides incentives for the use of CTO as a transportation fuel. Some regional cap and trade programs may incentivize the use of CTO in stationary sources. Future legislation in the U.S. and elsewhere may promote the use of CTO as a feedstock for production of alternative fuels.
Because the supply of CTO is inherently constrained by the volume of kraft pulp processing, any diversion of CTO for production of alternative fuels would reduce the available supply of CTO as the principal raw material of the pine chemicals industry. As described above, the Company is highly dependent on CTO as an essential raw material, and if the Company is unable to procure an adequate supply of CTO due to competing new uses such as for biofuel production, the Company’s results of operations would be materially and adversely affected.
Pricing
for CTO is subject to particular pricing pressures by reason of limited supply and competing demands for end use, and we may be limited in our ability to pass on increased costs to our customers.
Pricing for CTO (which accounted for approximately
12
percent of all of our cost of sales and
34
percent of our raw materials purchases for 2018) is subject to particular pricing pressures by reason of the limited supply elasticity of the product and competing demands for its use, all of which drive pressure on price:
|
•
|
CTO is a product of the kraft pulping process, and the global supply of CTO is inherently constrained by the volume of kraft pulping processing;
|
|
•
|
CTO can be burned as alternative fuels, either in support of the originating pulp mill operations, by energy companies or biofuel companies; and
|
|
•
|
Regulations or other incentives mandate or encourage the consumption of biofuels as alternatives, including CTO.
|
We may not have the ability to pass through any increases in our cost of CTO to our customers in the form of price increases or other adjustments, with a resulting material adverse effect on our results of operations. Additionally, we may be placed at a competitive disadvantage relative to our competitors who rely on different primary raw materials or who have more favorable terms with their suppliers.
23
We are also dependent on other raw materials, and these are also subject to pricing pressures; lack of access to these raw materials and inability to pass on price increases could adversely affect our financial condition and results of operations.
The Company is dependent on other raw materials, including, but not limited to, hardwood sawdust, phosphoric acid, ethylene amines, lignin,
nonylphenol, hydrogen peroxide, cyclohexanone, and pentaerythritol
. Raw material costs are a significant operating expense of the Company. The cost of raw materials can be volatile and subject to increases as a result of, among other things, changing economic conditions, political or policy considerations, supply and demand levels, instability in energy producing nations, and natural events such as extreme weather events or even insect infestations. Any interruption in the supply of the raw materials on which we depend, and any increases in the cost of raw materials that we are not able to pass on to customers in the form of price increases or other adjustments, may materially impact our financial condition and results of operations.
A prolonged period of low energy prices may materially impact our results of operations.
The price of energy may directly or indirectly impact demand, pricing or the profitability for certain Ingevity products. As petroleum oil prices fall or change rapidly, Ingevity products may be disadvantaged due to the fact that CTO and BLSS are thinly traded commodities with pricing commonly established for periods ranging from one quarter to one year periods of time. Due to this, alternative technologies which compete with product offerings provided by Ingevity may be advantaged from time to time in the market place. Protracted periods of high volatility or sustained oversupply of petroleum oil may also translate into increased competition from petroleum-based alternatives which would otherwise be consumed in petroleum transportation fuel blends. In addition, pricing for competing naturally derived oils such as palm or soybean is likely to provide further pressure on pricing of the Company’s products during periods of depressed petroleum prices.
We face competition from producers of substitute products and new technologies, and new or emerging competitors.
In the Performance Materials segment, there is competition from various other activated carbon manufacturers. These competitors are actively trying to develop more advanced and alternative activated carbon products that would more effectively compete with our products in the automotive applications. There is also competition in the automotive applications from non-activated carbon competitors or product offerings. For example, at least one OEM is using sealed tanks in certain subsets of its vehicles to comply with the LEV III/Tier 3 regulations. While the sealed tank fuel systems generally require a similarly sized pelleted activated carbon canister to deal with refueling emissions, in most cases, they do not use a extruded honeycomb to meet current U.S. and California regulations. There is also emerging competition in the "honeycomb" space, which may impact sales of the Company's products. If a competitor were to succeed in developing products that are better suited for automotive evaporative emissions capture applications and/or a competitive technology, such as, but not limited to, sealed gas tanks, were to be implemented across a material number of vehicle platforms, our financial results could be negatively impacted.
In addition, growth in alternative vehicles, such as all-electric vehicles and hydrogen fuel cell vehicles, which do not use gasoline, may also adversely affect the demand for our products.
In the Performance Chemicals segment, hydrocarbon resins and gum rosin-based products compete with TOR-based resins in the adhesives and printing inks markets. The price of gum rosin has a significant impact on the market price for TOR and rosin derivatives and the price of gum rosin is driven by labor rates, land leasing costs and various other factors that are not within our control. Hydrocarbon resins, for example, C5 resins, are co-products from isoprene (synthetic rubber). Availability and pricing are determined by the supply and demand for synthetic rubber as well as crude oil prices as the feedstock for isoprene and various other factors that are not within our control. Animal and vegetable-based fatty acids compete with TOFA products in lubricant and industrial specialties. The market price for TOFA products is impacted by the prices of other fats and oils and the prices for other fats and oils is driven by actual and expected harvest rates, crude oil prices and the biofuel market. Other monomers, thermoplastics and polyols compete with our caprolactone based products. The price for our products is impacted by the prices of competitive substitutes which are influenced by petroleum prices as well as other supply and demand factors. Additionally, the Company faces competition from competitors that are actively developing new technologies and competing products across the segment. A significant investment by a competitor in a competitive technology or product line could negatively impact our financial results.
We face competition from infringing intellectual property activity.
The Company is currently involved in several legal actions relative to intellectual property associated with our “canister bleed emissions” patent. These infringing activities also represent a competitive threat. The Company is vigorously addressing infringing activity through legal actions and other available means. While the Company believes its legal action claims are meritorious, there can be no assurances that the Company will prevail in such actions.
24
Disruptions at any of our manufacturing facilities or within our supply chain could negatively impact our production, financial condition and results of operations.
An operational disruption in any of our facilities could negatively impact production and our financial results. The occurrence of a natural disaster, such as a hurricane, tropical storm, earthquake, tornado, severe weather, flood, fire or other unanticipated problems such as labor difficulties, equipment failure, capacity expansion difficulties or unscheduled maintenance could cause operational disruptions of varied duration. These types of disruptions could materially adversely affect our financial condition and results of operations to varying degrees dependent upon the facility, the duration of the disruption, our ability to shift business to another facility or find alternative sources of materials or energy. In certain cases, we have some products that are only made at one facility. For example, in the case of our Waynesboro, Georgia facility, while we have some redundancies within the facility, we only have one facility that makes our extruded honeycomb products. In the case of our Warrington, UK facility, while we have some redundancies within the facility, we only have one facility that makes our caprolactone products. As other examples, in our Charleston SC facility, we source black liquor from an adjacent papermill to isolate and subsequently modify lignin to serve our agriculture customers while we make the vast majority of our ink resin products in our DeRidder, Louisiana facility. While we have redundancies within these facilities, we have limited ability to make these products at other facilities. Any losses due to these events may not be covered by our existing insurance policies or may be subject to certain deductibles.
We could be similarly adversely affected by disruptions within our supply chain and transportation network. Our products are transported by truck, rail, barge or ship by third-party providers. The costs of transporting our products could be negatively affected by factors outside of our control, including rail service interruptions or rate increases, extreme weather events, tariffs, rising fuel costs and capacity constraints. Significant delays or increased costs affecting these transportation methods could materially affect our financial condition and results of operations. Disruptions at our suppliers could lead to short term or longer rises in raw material or energy costs and/or reduced availability of materials or energy, potentially affecting our financial condition and results of operations.
For example
Solvay Interox Limited (“Solvay”) is our primary provider of hydrogen peroxide to our Warrington, UK Performance Chemicals facility, which is co-located with the Solvay Warrington, UK chemical plant (“Solvay Plant”). Disruptions at the Solvay Plant impacting Solvay’s ability to supply hydrogen peroxide could adversely affect our financial condition and results of operations. See also "Our Engineered Polymers product line may be adversely affected by Brexit" risk factor.
We are dependent upon third parties for the provision of certain critical operating services at several of our facilities.
We are dependent upon third parties for the provision of certain critical operating services at our Covington, Virginia Performance Materials facility and at the following Performance Chemicals facilities: Crossett, Arkansas; North Charleston, South Carolina; and Warrington, UK.
We are dependent on: (i) the WestRock Covington, Virginia paper mill (“WestRock VA Paper Mill”) for the provision of electricity, water, compressed air, steam and wastewater treatment to our Covington Performance Materials facility; (ii) the WestRock North Charleston, South Carolina paper mill (“WestRock SC Paper Mill”) for the provision of water, compressed air, steam and wastewater treatment at our North Charleston Performance Chemicals facility; (iii) the Georgia-Pacific Crossett, Arkansas paper mill and chemicals plant (collectively, “Georgia-Pacific Mill”) for the provision of natural gas, water, compressed air and wastewater treatment to our Crossett Performance Chemicals facility; and (iv) Solvay Plant for the provision of water, compressed air, nitrogen, natural gas, electricity, steam, and wastewater treatment and waste management at our Warrington Performance Chemicals facility. We have existing long-term contractual arrangements covering these services for our Covington, Crossett, North Charleston and Warrington facilities. The provision of these services would be at risk if any of the counterparties were to idle or permanently shut down the associated mill, or if operations at the associated mill were disrupted due to natural or other disaster, or by reason of strikes or other labor disruptions, or if there were a significant contractual dispute between the parties.
In the event that WestRock VA Paper Mill, WestRock SC Paper Mill, Georgia-Pacific Mill or Solvay Plant were to fail to provide the contracted services, we would be required to obtain these services from other third parties at an increased cost or to expend capital to provide these services ourselves. The expenses associated with obtaining or providing these services, as well as any interruption in our operations as a result of the failure of the counterparty to provide these services, may be significant and may adversely affect our financial condition and results of operations.
Furthermore, in the event that WestRock VA Paper Mill wastewater treatment operations do not comply with permits or applicable law and the WestRock VA Paper Mill is unable to determine the cause of such compliance, then we will be responsible for between 10
percent
and 50
percent
of the costs and expenses of such noncompliance (increasing in 10
percent
increments per
25
violation during each twelve month period) despite representing less than 3
percent
of the total wastewater volume. These costs and expenses may be significant and may adversely affect our financial condition and results of operations.
Additionally, (i) our Covington Performance Materials facility is located on real property leased from WestRock pursuant to a long-term lease agreement, and is surrounded by the WestRock VA Paper Mill, (ii) a portion of our North Charleston Performance Chemicals facility is located on real property leased from WestRock and is adjacent to the WestRock SC Paper Mill; (iii) our Crossett Performance Chemicals facility is located on real property leased from Georgia-Pacific pursuant to a long-term lease agreement, and is surrounded by the Georgia-Pacific Paper Mill and (iv) our Warrington, UK Performance Chemicals facility is located on real property leased from Solvay pursuant to multiple long-term lease agreements, and is surrounded by the Solvay Plant. In the event we were to have a dispute with WestRock, Georgia-Pacific or Solvay regarding the terms of the relevant lease agreements, or we were otherwise unable to fully access or utilize the leased property, the associated business disruption may be significant and may adversely affect our financial condition and results of operations.
We are also dependent on third parties for the disposal of brine, which results from our own conversion of BLSS into CTO. If these service providers do not perform under their contracts, the costs of disposing of brine ourselves, including, for example, the transportation costs, could be significant.
Work stoppages and other labor relations matters may have an adverse effect on our financial condition and results of operations.
Many of our production employees are governed by collective bargaining agreements (“CBAs”). From time to time the Company engages in negotiations to renew CBAs as those contracts are scheduled to expire. At our North Charleston, SC facility, the Company ratified a new CBA with the USW and IAM in 2018 and with the IBEW in January 2019.
While the Company has generally positive relations with its labor unions, there is no guarantee the Company will be able to successfully negotiate new union contracts without work stoppages, labor difficulties or unfavorable terms. If we were to experience any extended interruption of operations at any of our facilities because of strikes or other work stoppages, our results of operations and financial condition could be materially and adversely affected. In addition, due to the co-location of our Covington, Crossett, North Charleston, and Warrington facilities within the WestRock VA Paper Mill, Georgia-Pacific Mill, WestRock SC Paper Mill and Solvay Plant facilities, a strike or work stoppage at any of these facilities could cause disruptions at our facilities, and our results of operations could be materially and adversely affected.
Our business involves hazards associated with chemical manufacturing, storage, transportation and disposal.
There are hazards associated with the chemicals we manufacture and the related storage and transportation of our raw materials, including common solvents, such as toluene and methanol, and reactive chemicals, such as acrylic acid, all of which fall under the OSHA Process Safety Management Code. These hazards could lead to an interruption or suspension of operations and have an adverse effect on the productivity and profitability of a particular manufacturing facility or on us as a whole. While we endeavor to provide adequate protection for the safe handling of these materials, issues could be created by various events, including natural disasters, severe weather events, acts of sabotage and performance by third parties, and as a result we could face the following potential hazards: piping and storage tank leaks and ruptures; mechanical failure; employee exposure to hazardous substances; and chemical spills and other discharges or releases of toxic or hazardous substances or gases.
These hazards may cause personal injury and loss of life, damage to property and contamination of the environment, which could lead to government fines, work stoppage injunctions, lawsuits by injured persons, damage to our public reputation and brand and diminished product acceptance. If such actions are determined adversely to us or there is an associated economic impact to our business, we may have inadequate insurance or cash flow to offset any associated costs. Such outcomes could adversely affect our financial condition and results of operations.
26
Regulation of exposure to certain process chemicals could require expenditures or changes to our product formulations.
Certain regulations applicable to our operations, including the Occupational Safety and Health Act and the Toxic Substances Control Act in the U.S. and the Registration, Evaluation and Authorization of Chemicals, or REACH, directive in Europe, prescribe limits restricting exposure to a number of chemicals used in our operations, including certain forms of formaldehyde, a raw material used in the manufacture of phenolic modified rosin-based ink resins and some lignin-based dispersants. Future studies on the health effects of chemicals used in our operations, including alkylphenols, such as bisphenol A, which are used in our TOR-based ink resins, may result in additional regulation or new requirements in the U.S., Europe and elsewhere, which might further restrict or prohibit the use of, and exposure to, these chemicals. Additional regulation of or requirements for these or other chemicals could require us to change our operations, and these changes could affect the quality or types of products we manufacture and/or materially increase our costs.
The Company’s operations are subject to a wide range of general and industry-specific environmental laws and regulations.
The Company’s operations are subject to a wide range of general and industry-specific environmental laws and regulations, including, for example, related to bisphenol A, formaldehyde and air emissions. Changes in environmental laws and regulations, or their application, could subject the Company to significant additional capital expenditures and operating expenses in future years. However, any such changes are uncertain and, therefore, it is not possible for the Company to predict with certainty the amount of additional capital expenditures or operating expenses that could be necessary for compliance with respect to any such changes.
As we rely on information technologies to conduct our business, security breaches and other disruptions could compromise our information and expose us to liability, which could cause our business and reputation to suffer.
We rely on information technologies, some of which are managed by third parties, to manage the day-to-day operations and activities of our business, operate elements of our manufacturing facilities, manage our customer and vendor transactions, and maintain our financial, accounting and business records. In addition, we collect and store certain data, including proprietary business information, and may have access to confidential or personal information that is subject to privacy and security laws and regulations.
The secure processing, maintenance and transmission of sensitive, confidential and personal data is critical to our operations and business strategy. We follow industry best practices and have instituted a system of security policies, procedures, capabilities, and internal controls designed to protect this information. Additionally, we engage third-party threat detection and monitoring services which includes a global cyber security incident response team. Despite our security design and controls, and those of our third-party providers, we may be vulnerable to cyber-attacks, computer viruses, security breaches, inadvertent or intentional employee actions, system failures and other risks that could potentially lead to the compromising of sensitive, confidential or personal data, improper use of our, or our third-party provider systems, solutions or networks, unauthorized access, use, disclosure, modification or destruction of information, and operational disruptions. In addition, the global regulatory environment pertaining to information security and privacy is increasingly demanding, with new and changing requirements, such as the European Union’s General Protection Regulation (“GDPR”) and the China Cybersecurity Law. GDPR, which applies to the collection, use, retention, security, processing, and transfer of personally identifiable information of residents of EU countries, mandates new compliance obligations, and imposes significant fines and sanctions for violations. Such breaches, cyber incidents and disruptions, or failure to comply with laws and regulations related to information security or privacy, could result in legal claims or proceedings against us by governmental entities or individuals, significant fines, penalties or judgements, disruption of our operations, remediation requirements, changes to our business practices, and damage to our reputation, which could adversely affect our business, financial condition or results of operations.
We are dependent on certain customers.
We have certain large customers in particular businesses, the loss of which could have a material adverse effect on the applicable segment’s sales and, depending on the significance of the loss, our results of operations, financial condition or cash flows. Sales to the Company’s ten largest customers (across both segments) accounted for 36
percent
of total sales for 2018. No customer accounted for more than 10
percent
of total sales for 2018. With some exceptions, our business with those large customers is based primarily upon individual purchase orders. As such, our customers could cease buying our products from us at any time, for any reason, with little or no recourse. If a major customer or multiple smaller customers elected not to purchase products from us, our financial condition and results of operations would be materially adversely affected.
27
Challenges in the commercial and credit environment may materially adversely affect Ingevity’s future access to capital.
Ingevity’s ability to issue debt or enter into other financing arrangements on acceptable terms could be materially adversely affected if there is a material decline in the demand for Ingevity’s products or in the solvency of its customers or suppliers or if other significantly unfavorable changes in economic conditions occur. Volatility in the world financial markets could increase borrowing costs or affect Ingevity’s ability to gain access to the capital markets, which could have a material adverse effect on Ingevity’s competitive position, business, financial condition, results of operations and cash flows.
Our curre
nt level of debt could adversely affect our financial health and prevent us from fulfilling our debt obligations.
Our debt requires significant interest and principal payments. Our ability to make scheduled payments on or to refinance our debt obligations and to fund working capital, planned capital expenditures and expansion efforts and any strategic alliances or acqu
isitions we may make in the future depends on our ability to generate cash in the future and our financial condition and operating performance, which are subject to prevailing economic and competitive conditions and to certain financial, business, regulatory and other factors beyond our control. There can be no assurance that we will maintain a level of cash flows from operating activities sufficient to permit us to pay the principal, premium, if any, and interest on our debt.
If our cash flows and capital resources are insufficient to fund our debt service obligations, we may be forced to reduce or delay investments and capital expenditures, or to sell assets, seek additional capital or restructure or refinance our debt, including the notes. These alternative measures may not be successful and may not permit us to meet our scheduled debt service obligations. If our operating results and available cash are insufficient to meet our debt service obligations, we could face substantial liquidity problems and might be required to dispose of material assets or operations to meet our debt service and other obligations. We may not be able to consummate those dispositions or to obtain the proceeds sought from them, and these proceeds may not be adequate to meet any debt service obligations then due. Further, we may need to refinance all or a portion of our debt on or before maturity, and there can be no assurances we will be able to refinance any of our debt on commercially reasonable terms or at all. Any inability to generate sufficient cash flow or refinance our indebtedness on favorable terms could have a material adverse effect on our business, results of operations, and financial condition.
The inability to make or effectively integrate future acquisitions may affect our results.
As part of our growth strategy, we may pursue acquisitions of complementary businesses and product lines or invest in joint ventures. The ability to grow through acquisitions or other investments depends upon our ability to identify, negotiate, complete and integrate suitable acquisitions or joint venture arrangements. If we fail to successfully integrate acquisitions into our existing business, our financial condition and results of operations could be adversely affected.
We are subject to continuing contingent tax-related liabilities of WestRock.
Under the U.S. Internal Revenue Code of 1986, as amended (the “Code”), each corporation that was a member of WestRock’s consolidated tax reporting group during any taxable period or portion of any taxable period ending on or before the effective time of the distribution is severally liable for the U.S. federal income tax liability of the entire consolidated tax reporting group for such taxable period. In connection with the Separation, we entered into the tax matters agreement with WestRock (the "Tax Matters Agreement") that allocates the responsibility for prior period taxes of WestRock’s consolidated tax reporting group between Ingevity and WestRock. If WestRock were unable to pay any prior period taxes for which it is responsible, however, we could be required to pay the entire amount of such taxes, and such amounts could be significant. The Tax Matters Agreement generally gives WestRock discretion to handle consolidated tax returns and audits for pre-distribution periods in a manner which may be unfavorable to us and which may result in additional tax costs to us.
Our tax rate is dependent upon a number of factors; a change in any of which could impact our future tax rates and net income.
Our future tax rates may be adversely affected by a number of factors, including: future changes in the jurisdictions in which our profits are determined to be earned and taxed; changes in estimated realization of our deferred tax assets; the repatriation of non-U.S. earnings for which we have not previously provided U.S. income and non-U.S. withholding taxes; adjustments to estimated taxes upon finalization of various tax returns; increases in expenses that are non-deductible for tax purposes; changes in available tax credits; the resolution of issues arising from tax audits with various tax authorities; and changes in tax laws or interpretation of such tax laws. Losses for which no tax benefits can be recorded could materially impact our tax rate and its volatility from one quarter to another.
28
Risks Relating to Ingevity’s Common Stock
The price of Ingevity’s common stock may fluctuate significantly.
The market price of Ingevity common stock may fluctuate significantly due to a number of factors, some of which may be beyond Ingevity’s control, including:
|
•
|
actual or anticipated fluctuations in Ingevity’s operating results;
|
|
•
|
changes in earnings estimated by securities analysts or Ingevity’s ability to meet those estimates;
|
|
•
|
the operating and stock price performance of comparable companies;
|
|
•
|
changes to the regulatory and legal environment under which Ingevity operates; and
|
|
•
|
domestic and worldwide economic conditions.
|
We cannot guarantee the timing, amount or payment of any dividends on our common stock in the future.
The payment and amount of any dividend is subject to the sole discretion of our board of directors and will depend upon many factors, including our financial condition and prospects, our capital requirements and access to capital markets, covenants associated with certain of our debt obligations, legal requirements and other factors that our board of directors may deem relevant, and there can be no assurances that we will pay a dividend.
Your percentage of ownership in Ingevity may be diluted in the future.
A stockholder's percentage ownership in Ingevity may be diluted because of equity issuances for acquisitions, capital market transactions or otherwise, including, without limitation, equity awards that we may be granting to our directors, officers and employees. Such awards will have a dilutive effect on Ingevity’s earnings per share, which could adversely affect the market price of Ingevity’s common stock. From time to time, Ingevity will issue additional options or other stock-based awards to certain employees under Ingevity’s employee benefits plans.
In addition, Ingevity’s amended and restated certificate of incorporation authorizes Ingevity to issue, without the approval of Ingevity’s stockholders, one or more classes or series of preferred stock having such designation, powers, preferences and relative, participating, optional and other special rights, including preferences over Ingevity’s common stock respecting dividends and distributions, as Ingevity’s board of directors generally may determine. The terms of one or more classes or series of preferred stock could dilute the voting power or reduce the value of Ingevity’s common stock. For example, Ingevity could grant the holders of preferred stock the right to elect some number of Ingevity’s directors in all events or on the happening of specified events or the right to veto specified transactions. Similarly, the repurchase or redemption rights or liquidation preferences Ingevity could assign to holders of preferred stock could affect the residual value of the common stock.
Certain provisions in Ingevity’s amended and restated certificate of incorporation and amended and restated bylaws, and of Delaware law, may prevent or delay an acquisition of Ingevity, which could depress the trading price of Ingevity’s common stock.
Ingevity’s amended and restated certificate of incorporation and amended and restated bylaws contain, and Delaware law contains, provisions that are intended to deter coercive takeover practices and inadequate takeover bids by making such practices or bids unacceptably expensive to the bidder and to encourage prospective acquirers to negotiate with Ingevity’s board of directors rather than to attempt a hostile takeover. These provisions include, among others:
|
•
|
the inability of Ingevity’s stockholders to act by written consent;
|
|
•
|
rules regarding how stockholders may present proposals or nominate directors for election at stockholder meetings;
|
|
•
|
the right of Ingevity’s board to issue preferred stock without stockholder approval;
|
|
•
|
the ability of Ingevity’s remaining directors to fill vacancies on Ingevity’s board of directors;
|
|
•
|
the inability of Ingevity’s stockholders to remove directors other than for cause while the board is classified; and
|
|
•
|
the requirement that the affirmative vote of holders of at least 75 percent of Ingevity’s outstanding voting stock is required to amend certain provisions of Ingevity’s amended and restated certificate of incorporation and amended and restated bylaws (Supermajority Amendment Provisions").
|
29
On November 1, 2018, the Board of Directors approved amendments to Ingevity’s amended and restated certificate of incorporation and amended and restated bylaws to remove the Supermajority Amendment Provisions and submitted the charter amendment for approval at the Company’s 2019 Annual Meeting of Stockholders. To pass, 75 percent of Ingevity's outstanding voting stock must vote in favor of the amendment.
In addition, because Ingevity has not chosen to be exempt from Section 203 of the Delaware General Corporation Law (the “DGCL”), this provision could also delay or prevent a change of control that you may favor. Section 203 provides that, subject to limited exceptions, persons that acquire, or are affiliated with persons that acquire, more than 15 percent of the outstanding voting stock of a Delaware corporation shall not engage in any business combination with that corporation, including by merger, consolidation or acquisitions of additional shares, for a three-year period following the date on which that person or its affiliates becomes the holder of more than 15 percent of the corporation’s outstanding voting stock.
Ingevity believes these provisions will protect its stockholders from coercive or otherwise unfair takeover tactics by requiring potential acquirers to negotiate with Ingevity’s board of directors and by providing Ingevity’s board of directors with more time to assess any acquisition proposal. These provisions are not intended to make Ingevity immune from takeovers. However, these provisions will apply even if the offer may be considered beneficial by some stockholders and could delay or prevent an acquisition that Ingevity’s board of directors determines is not in the best interests of Ingevity and Ingevity’s stockholders. These provisions may also prevent or discourage attempts to remove and replace incumbent directors.
There could be significant liability if the Separation were determined to be a taxable transaction.
In connection with the Separation, our former parent received an opinion from outside tax counsel to the effect that the requirements for tax-free treatment under Section 355 of the Code would be satisfied. The opinion relied on certain facts, assumptions, representations and undertakings from our former parent and us regarding the past and future conduct of the companies’ respective businesses and other matters. If any of these facts, assumptions, representations or undertakings were incorrect or not satisfied, we and our stockholders may not be able to rely on the opinion of tax counsel and could be subject to significant tax liabilities.
Notwithstanding the opinion of tax counsel, the IRS could determine upon audit that the Separation is taxable if it determines that any of these facts, assumptions, representations or undertakings were incorrect or violated or if it disagrees with the conclusions in the opinion, or for other reasons, including as a result of certain significant changes in the share ownership of our company or our former parent after the Separation. If the Separation were determined to be taxable for U.S. federal income tax purposes, our former parent and its stockholders that are subject to U.S. federal income tax could incur significant U.S. federal income tax liabilities, and we could incur significant liabilities.
Ingevity’s amended and restated bylaws designate the state courts within the State of Delaware as the sole and exclusive forum for certain types of actions and proceedings that may be initiated by Ingevity’s stockholders, which could discourage lawsuits against Ingevity and Ingevity’s directors and officers.
Ingevity’s amended and restated bylaws provide that unless the board of directors otherwise determines, a state court within the State of Delaware will be the sole and exclusive forum for any derivative action or proceeding brought on behalf of Ingevity, any action asserting a claim of breach of a fiduciary duty owed by any director of officer of Ingevity to Ingevity or Ingevity’s stockholders, creditors or other constituents, any action asserting a claim against Ingevity or any director or officer of Ingevity arising pursuant to any provision of the DGCL, or Ingevity’s amended and restated certificate of incorporation or bylaws, or any action asserting a claim against Ingevity or any director or officer of Ingevity governed by the internal affairs doctrine. However, if no state court located within the State of Delaware has jurisdiction, the action may be brought in the federal district court for the District of Delaware. Although Ingevity’s amended and restated bylaws include this exclusive forum provision, it is possible that a court could rule that this provision is inapplicable or unenforceable. This exclusive forum provision may limit the ability of Ingevity’s stockholders to bring a claim in a judicial forum that such stockholders find favorable for disputes with Ingevity or Ingevity’s directors or officers, which may discourage such lawsuits against Ingevity and Ingevity’s directors and officers. Alternatively, if a court were to find this exclusive forum provision inapplicable to, or unenforceable in respect of, one or more of the specified types of actions or proceedings described above, Ingevity may incur additional costs associated with resolving such matters in other jurisdictions, which could adversely affect Ingevity’s business, financial condition or results of operations.
ITEM 1B. UNRESOLVED STAFF COMMENTS
None.
30
ITEM 2. PROPERTIES
We are headquartered in North Charleston, South Carolina and operate manufacturing facilities in the U.S., United Kingdom, and People's Republic of China and warehouse and distribution facilities globally. The following locations represent the principal properties of Ingevity. We believe these facilities are adequate and suitable for our current operations, and that the production capacity of our facilities is sufficient to meet current demand. In the case of the properties identified as “Leased”, we nevertheless own the manufacturing assets themselves.
|
Own / Lease
|
Functional Use
|
||
|
North Charleston, South Carolina
|
Own / Lease
(1)
|
Corporate Headquarters;
Application Labs;
Performance Chemicals: Manufacturing
|
|
|
Covington, Virginia
|
Lease
|
Performance Materials: Manufacturing
|
|
|
Crossett, Arkansas
|
Lease
|
Performance Chemicals: Manufacturing
|
|
|
DeRidder, Louisiana
|
Own
|
Performance Chemicals: Manufacturing
|
|
|
Waynesboro, Georgia
|
Own
(2)
|
Performance Materials: Manufacturing
|
|
|
Wickliffe, Kentucky
|
Lease
|
Performance Materials: Manufacturing
|
|
|
Changshu, People’s Republic of China
|
Lease
|
Performance Materials: Manufacturing
|
|
|
Warrington, United Kingdom
(3)
|
Lease
|
Performance Chemicals: Manufacturing, Application Lab
|
|
|
Zhuhai, People’s Republic of China
|
Lease
|
Performance Materials: Manufacturing, Application Lab
|
|
________________________
|
(1)
|
Portions of the manufacturing operations are on leased land.
|
|
(2)
|
Certain manufacturing assets are subject to a capital lease with the Development Authority of Burke County (the county in which Waynesboro, Georgia is located).
|
|
(3)
|
Acquired on February 13, 2019 as part of the Caprolactone Acquisition.
|
ITEM 3. LEGAL PROCEEDINGS
We are from time to time, involved in routine litigation incidental to our operations. None of the litigation in which we are currently involved, individually or in the aggregate, is material to our combined financial condition or results of operations nor are we aware of any material pending or contemplated proceedings.
ITEM 4. MINE SAFETY DISCLOSURES
Not applicable.
31
EXECUTIVE OFFICERS OF THE REGISTRANT
The executive officers of Ingevity Corporation, the offices they currently hold, their business experience over the past five years and their ages are as follows:
|
Name
|
Age
(1)
|
Present Position and Business Experience
|
||
|
D. Michael Wilson
|
56
|
President, Chief Executive Officer and Director (2015-present); Executive Vice President & President of Performance Chemicals of Albemarle (2015); President of Albemarle's Catalyst Solutions business (2013-2014); President of FMC's Specialty Chemicals group (2011-2013)
|
||
|
John C. Fortson
|
51
|
Executive Vice President, Chief Financial Officer & Treasurer (2015-present); Vice President, Chief Financial Officer and Treasurer of AAR Corporation (2013-2015); Managing Director in the Investment Banking Department of Bank of America Merrill Lynch (2007-2013)
|
||
|
Katherine P. Burgeson
|
61
|
Executive Vice President, General Counsel & Secretary (2015-present); Associate General Counsel of WestRock (2015); Deputy General Counsel of MeadWestvaco (2006-2015)
|
||
|
Michael P. Smith
|
58
|
Executive Vice President & President of Performance Chemicals, Strategy and Business Development (2017-present); Senior Vice President Strategy and Business Development (2016-2017), Vice President of Health and Nutrition at FMC Corporation (2013-2015); Division General Manager of BioPolymer at FMC Corporation (2006-2013)
|
||
|
S. Edward Woodcock
|
53
|
Executive Vice President & President of Performance Materials (2015-present); Vice President of MeadWestvaco's Carbon Technologies business (2010-2015)
|
||
_______________
(1) As of
December 31, 2018
.
All officers are elected to hold office for one year or until their successors are elected and qualified. No family relationships exist among any of our executive officers or directors, and there are no arrangements or understandings between any of the above-listed officers and any other person pursuant to which they serve as an officer.
32
PART II
ITEM 5. MARKET FOR REGISTRANT'S COMMON EQUITY, RELATED STOCKHOLDERS MATTER AND ISSUER PURCHASES OF EQUITY SECURITIES
Market for Registrant's Common Equity and Related Stockholder Matters
Ingevity's common stock ($0.01 par value) is listed on the New York Stock Exchange, Inc. ("NYSE") under the symbol "NGVT." There were approximately 6,100
record holders of our common stock as of
February 19, 2019
.
Unregistered Sales of Equity Securities
Not Applicable.
Issuer Purchases of Equity Securities
The following table summarizes information with respect to the purchase of our common stock during the three months ended
December 31, 2018
.
|
Publicly Announced Program
(1)
|
|||||||||||||||||
|
Period
|
Total Number of Shares Purchased
|
Average Price Paid Per Share
|
Total Number of Shares Repurchased
|
Total Dollar Amount Purchased
|
Maximum Dollar Value of Shares that May Yet be Purchased
|
||||||||||||
|
October 1-31, 2018
|
34,500
|
|
$
|
91.65
|
|
34,500
|
|
$
|
3,162,065
|
|
$
|
72,153,679
|
|
||||
|
November 1-30, 2018
|
31,500
|
|
96.50
|
|
31,500
|
|
3,039,631
|
|
419,114,048
|
|
|||||||
|
December 1-31, 2018
|
284,000
|
|
81.46
|
|
284,000
|
|
23,133,354
|
|
395,980,693
|
|
|||||||
|
Total Q4 2018
|
350,000
|
|
$
|
83.81
|
|
350,000
|
|
$
|
29,335,050
|
|
$
|
395,980,693
|
|
||||
_______________
(1) On February 20, 2017, our Board of Directors authorized the repurchase of up to
$100 million
of our common stock. On November 1, 2018, our Board of Directors approved the authorization for the repurchase of up to an additional
$350 million
of Ingevity’s outstanding common stock. The approval of this
$350 million
is in addition to the
$100 million
share repurchase program approved in February 2017. The repurchase program does not include a specific timetable or price targets and may be suspended or terminated at any time. Shares may be purchased through open market or privately negotiated transactions at the discretion of management based on its evaluation of market prevailing conditions and other factors.
Stock Performance Graph
The following table and graph present the cumulative total stockholder return for Ingevity's common stock compared with the Standard & Poor's (S&P) SmallCap 600 Index and the Dow Jones (DJ) U.S. Specialty Chemicals Index since the Separation.
The graph assumes the investment of $100 in each of Ingevity's common stock, the S&P SmallCap 600 Index, and DJ U.S. Specialty Chemicals Index on May 16, 2016, the date that Ingevity's common stock began "regular-way" trading on NYSE, and that all dividends, if any, were reinvested.
|
December 31,
|
|||||||||||||||
|
May 16, 2016
|
2016
|
2017
|
2018
|
||||||||||||
|
Ingevity Corporation
|
$
|
100.00
|
|
$
|
204.24
|
|
$
|
262.36
|
|
$
|
311.58
|
|
|||
|
S&P SmallCap 600 Index
|
100.00
|
|
123.53
|
|
139.77
|
|
127.87
|
|
|||||||
|
Dow Jones US Specialty Chemicals Index
|
$
|
100.00
|
|
$
|
105.60
|
|
$
|
129.24
|
|
$
|
120.40
|
|
|||
33
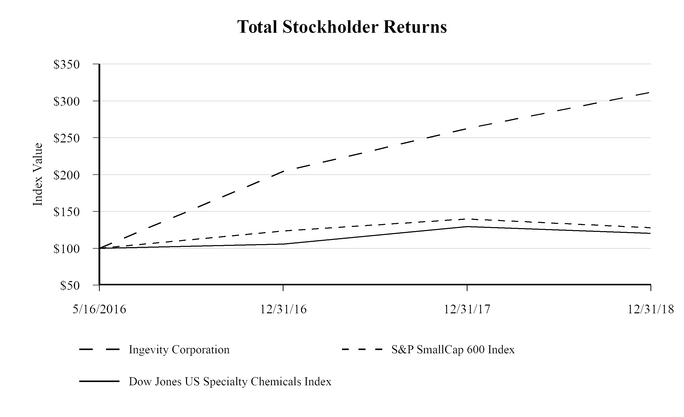
The graph and related information set forth above are not deemed to be "filed" with the SEC for purposes of Section 18 of the Exchange Act or incorporated by reference into any future filing made by us with the SEC, except to the extent that we specifically incorporate it by reference into any such filing. The stock price performance included in the graph above is not necessarily indicative of future stock performance.
34
ITEM 6. SELECTED FINANCIAL DATA
Ingevity did not operate as a separate, stand-alone entity for all five years listed below. Our consolidated balance sheets as of
December 31, 2018
, 2017, and 2016, respectively, and our consolidated statement of operations, comprehensive income (loss), and cash flows for the years ended
December 31, 2018
and 2017, respectively, consist of the consolidated balances of Ingevity as prepared on a stand-alone basis. Our consolidated balance sheets as of December 31, 2015 and 2014, respectively, our consolidated statements of operations, comprehensive income (loss), and cash flows for the years ended December 31, 2016, 2015 and 2014, respectively, have been prepared on a “carve out” basis for the periods and dates prior to the spin-off on May 15, 2016. The selected consolidated financial data should be read in conjunction with our Consolidated Financial Statements included within Part II. Item 8 of this Form 10-K.
|
Years Ended December 31,
|
|||||||||||||||||||
|
In millions, except per share and share data
|
2018
|
2017
|
2016
|
2015
|
2014
|
||||||||||||||
|
Statement of Operations Data:
|
|||||||||||||||||||
|
Net sales
|
$
|
1,133.6
|
|
$
|
972.4
|
|
$
|
908.3
|
|
$
|
958.3
|
|
$
|
1,035.5
|
|
||||
|
Gross profit
|
416.8
|
|
329.0
|
|
274.4
|
|
275.4
|
|
318.5
|
|
|||||||||
|
Income before income taxes
|
221.8
|
|
174.8
|
|
87.0
|
|
136.5
|
|
202.1
|
|
|||||||||
|
Net income (loss) attributable to Ingevity stockholders
|
169.1
|
|
126.5
|
|
35.2
|
|
79.7
|
|
129.0
|
|
|||||||||
|
Per Share Data attributable to Ingevity stockholders
(1)
|
|||||||||||||||||||
|
Basic earnings (loss) per share
|
$
|
4.02
|
|
$
|
3.00
|
|
$
|
0.83
|
|
$
|
1.89
|
|
$
|
3.06
|
|
||||
|
Diluted earnings (loss) per share
|
$
|
3.97
|
|
$
|
2.97
|
|
$
|
0.83
|
|
$
|
1.89
|
|
$
|
3.06
|
|
||||
|
Balance Sheet Data (at period end):
|
|||||||||||||||||||
|
Working capital
(2)
|
$
|
239.4
|
|
$
|
215.5
|
|
$
|
158.3
|
|
$
|
196.5
|
|
$
|
128.7
|
|
||||
|
Property, plant and equipment, net
|
523.8
|
|
438.5
|
|
422.8
|
|
437.5
|
|
410.1
|
|
|||||||||
|
Total assets
|
1,315.2
|
|
929.6
|
|
832.8
|
|
778.7
|
|
715.1
|
|
|||||||||
|
Long-term debt including capital lease obligations
|
741.2
|
|
444.0
|
|
481.3
|
|
80.0
|
|
85.8
|
|
|||||||||
|
Total equity
|
338.7
|
|
277.9
|
|
134.6
|
|
517.4
|
|
416.6
|
|
|||||||||
|
Other Data:
|
|||||||||||||||||||
|
Capital expenditures
|
$
|
93.9
|
|
$
|
52.6
|
|
$
|
56.7
|
|
$
|
100.9
|
|
$
|
101.8
|
|
||||
|
Depreciation and amortization expense
|
57.0
|
|
40.4
|
|
38.8
|
|
34.6
|
|
32.3
|
|
|||||||||
|
Weighted average common stock outstanding (in thousands)
(1)
:
|
|||||||||||||||||||
|
Basic shares
|
42,037
|
|
42,130
|
|
42,108
|
|
42,102
|
|
42,102
|
|
|||||||||
|
Diluted shares
|
42,601
|
|
42,529
|
|
42,271
|
|
42,102
|
|
42,102
|
|
|||||||||
_______________
|
(1)
|
On May 15, 2016, WestRock distributed 42.1 million shares of Ingevity's common stock to holders of its common stock. Basic and diluted earnings (loss) per share for the years ended December 31, 2015 and 2014 are calculated using the number of common shares distributed on May 15, 2016. Basic and diluted earnings (loss) per share for the year ended December 31, 2016 is calculated using the weighted average number of common shares outstanding for the period beginning after the distribution date.
|
|
(2)
|
Defined as current assets less current liabilities.
|
35
ITEM 7. MANAGEMENT’S DISCUSSION AND ANALYSIS OF FINANCIAL CONDITION AND
RESULTS OF OPERATIONS
RESULTS OF OPERATIONS
Introduction
Management’s discussion and analysis of Ingevity’s financial condition and results of operations (“MD&A”) is provided as a supplement to the Consolidated Financial Statements and related notes included elsewhere herein to help provide an understanding of our financial condition, changes in financial condition and results of our operations.
Cautionary Statements About Forward-Looking Statements
This section and other parts of this Annual Report on Form 10-K contain forward-looking statements, within the meaning of the Securities Exchange Act of 1934, as amended (the "Exchange Act") and the Private Securities Litigation Reform Act of 1995 that reflect our current expectations, beliefs, plans or forecasts with respect to, among other things, future events and financial performance. Forward-looking statements are often characterized by words or phrases such as “may,” “will,” “could,” “should,” “would,” “anticipate,” “estimate,” “expect,” “project,” “intend,” “plan,” “believe,” “target,” “prospects,” “potential” and “forecast,” and other words, terms and phrases of similar meaning. Forward-looking statements involve estimates, expectations, projections, goals, forecasts, assumptions, risks and uncertainties. We caution readers that a forward-looking statement is not a guarantee of future performance and that actual results could differ materially from those contained in the forward-looking statement. Such risks and uncertainties include, among others, those discussed in Item 1A under the heading "Risk Factors" as well as in our consolidated financial statements, related notes, and the other information appearing elsewhere in this report and our other filings with the SEC. We do not intend, and undertake no obligation, to update any of our forward-looking statements after the date of this report to reflect actual results or future events or circumstances. Given these risks and uncertainties, readers are cautioned not to place undue reliance on such forward-looking statements. In addition to any such risks, uncertainties and other factors discussed elsewhere herein, risks, uncertainties and other factors that could cause or contribute to actual results differing materially from those expressed or implied by the forward-looking statements include, but are not limited to the following:
|
•
|
we are exposed to risks that the expected benefits from the Pine Chemicals Acquisition and the Caprolactone Acquisition may not be realized or will not be realized within the expected time period, the risk of significant transaction costs and unknown or understated liabilities;
|
|
•
|
we may be adversely affected by general economic and financial conditions beyond our control;
|
|
•
|
we are exposed to risks related to our international sales and operations;
|
|
•
|
our reported results could be adversely affected by currency exchange rates and currency devaluation could impair our competitiveness;
|
|
•
|
our operations outside the U.S. require us to comply with a number of U.S. and foreign regulations, violations of which could have a material adverse effect on our financial condition and results of operations;
|
|
•
|
our engineered polymers product line may be adversely affected by Brexit;
|
|
•
|
we are dependent upon attracting and retaining key personnel;
|
|
•
|
adverse conditions in the global automotive market or adoption of alternative or new technologies may adversely affect demand for our automotive carbon products;
|
|
•
|
we face competition from producers of alternative products and new technologies, and new or emerging competitors;
|
|
•
|
we face competition from infringing intellectual property activity;
|
|
•
|
if increasingly more stringent air quality standards worldwide are not adopted, our growth could be impacted;
|
|
•
|
we may be adversely affected by a decrease in government infrastructure spending;
|
|
•
|
our printing inks business serves customers in a market that is facing declining volumes and downward pricing;
|
|
•
|
our Performance Chemicals segment is highly dependent on crude tall oil ("CTO") which is limited in supply;
|
|
•
|
lack of access to sufficient CTO would impact our ability to produce CTO-based products;
|
|
•
|
a prolonged period of low energy prices may materially impact our results of operations;
|
36
|
•
|
we are dependent upon third parties for the provision of certain critical operating services at several of our facilities;
|
|
•
|
the occurrence of a natural disaster, such as a hurricane, winter or tropical storm, earthquake, tornado, flood, fire or other matters such as labor difficulties (including work stoppages), equipment failure or unscheduled maintenance and repair, which could result in operational disruptions of varied duration;
|
|
•
|
from time to time we are called upon to protect our intellectual property rights and proprietary information though litigation and other means;
|
|
•
|
if we are unable to protect our intellectual property and other proprietary information we may lose significant competitive advantage;
|
|
•
|
information technology security breaches and other distruptions;
|
|
•
|
government policies and regulations, including, but not limited to, those affecting the environment, climate change, tax policies and the chemicals industry; and
|
|
•
|
losses due to lawsuits arising out of environmental damage or personal injuries associated with chemical or other manufacturing processes.
|
Overview
Ingevity is a leading global manufacturer of specialty chemicals and high performance activated carbon materials. We provide innovative solutions to meet our customers’ unique and demanding requirements through proprietary formulated products.
We report in two business segments, Performance Materials and Performance Chemicals.
Our Performance Materials segment consists of our automotive technologies and process purifications product lines. Performance Materials manufactures products in the form of powder, granular, extruded pellets, extruded honeycombs, and activated carbon sheets. Automotive technologies products are sold into gasoline vapor emission control applications within the automotive industry, while process purification products are sold into the food, water, beverage, and chemical purification industries.
Our Performance Chemicals segment consists of our pavement technologies, oilfield technologies, industrial specialties, and engineered polymers product lines. Performance Chemicals manufactures products derived from CTO and lignin extracted from the kraft paper making process as well as caprolactone monomers and derivatives derived from cyclohexanone and hydrogen peroxide. Performance Chemicals products serve as critical inputs used in a variety of high performance applications, including pavement preservation, pavement adhesion promotion, and warm mix paving (pavement technologies product line), oil well service additives, oil production, and downstream application chemicals (oilfield technologies product line), printing inks, adhesives, agrochemicals, lubricants, and industrial intermediates (industrial specialties product line), coatings, resins, elastomers, adhesives, and bio-plastics (engineered polymers product line).
Recent Developments
Perstorp AB's Caprolactone Business
On December 10, 2018, we entered into an agreement for the Sale and Purchase of Perstorp UK Ltd. (the “Caprolactone Agreement”) with Perstorp Holding AB, a company registered in Sweden, that develops, manufactures, and sells specialty chemicals (the “Seller”). Pursuant to the Caprolactone Agreement, we agreed to purchase the shares held by the Seller in Perstorp UK Ltd., including the Seller’s entire caprolactone business, in exchange for €570.9 million, less assumed debt and other miscellaneous transaction costs, as further defined in the Caprolactone Agreement (the “Purchase Price”), plus interest accrued on the Purchase Price (herein referred to as the “Caprolactone Acquisition”).
On February 13, 2019, pursuant to the terms and conditions set forth in the Caprolactone Agreement, we completed the Caprolactone Acquisition for an aggregate preliminary purchase price of €578.9 million ($652.5 million) excluding net debt to be assumed of €100.4 million ($113.1 million). At closing, the assumed net debt was settled with an affiliate of the counterparty, Perstorp Holding AB. Beginning in the first quarter of 2019, the Caprolactone Acquisition will be integrated into our Performance Chemicals segment and included within our Engineered Polymers product line. Our revolving credit facility was utilized as the
37
primary source of funds, along with available cash on hand, to close our Caprolactone Acquisition. Our available capacity under our revolving credit facility immediately following this drawdown was $113.1 million.
Caprolactone Acquisition is considered a business under business combinations accounting guidance, and therefore we will apply acquisition accounting. Acquisition accounting requires, among other things, that assets and liabilities assumed be recognized at their fair values as of the acquisition date. The net assets of the Caprolactone Acquisition will be recorded at the estimated fair values using primarily Level 2 and Level 3 inputs (see Note 6 to the Consolidated Financial Statements included within Part II. Item 8 of this Form 10-K for an explanation of Level 2 and 3 inputs).
We have performed a preliminary valuation of the fair value of the acquired assets and liabilities assumed. Based on this preliminary allocation of the purchase price, we believe the primary assets acquired and their estimated values are; goodwill of approximately $310 million and tangible and intangible assets of approximately $220 million. This preliminary assessment of fair value is based on draft reports from our valuation experts and is subject to change based on its preliminary nature. Once our detailed preliminary purchase price valuation is completed, we will include the required additional details in our future filings. We have not completed the detailed analysis to present the pro forma financial information for the combined companies. Thus, the pro forma financial information will be included in our future filings as well.
Revolving Credit and Term Loan Facility Amendment
On August 7, 2018, we entered into an Incremental Facility Agreement and Amendment No. 2 (the “Amendment”) to the Credit Agreement, dated as of March 7, 2016 (the “Existing Credit Agreement”, and as amended, supplemented or otherwise modified from time to time, including pursuant to the Incremental Facility Agreement and Amendment No. 1, dated as of August 21, 2017, and the Amendment, the “Amended Credit Agreement”). Among other things, the Amendment (i) increased the revolving commitments under the Existing Credit Agreement by
$200.0 million
(the “Incremental Revolving Commitments”) to
$750 million
and (ii) reduced the Applicable Rate (as defined in the Amended Credit Agreement). The Amendment also extended the maturity date for the loans and commitments under the Existing Credit Agreement to August 7, 2023.
The Incremental Revolving Commitments have terms identical to those of the Revolving Commitments under the Existing Credit Agreement and will be treated as a single class with such existing commitments under the Amended Credit Agreement.
Loans under the Amended Credit Agreement bear interest at either (a) an adjusted base rate or (b) an adjusted LIBOR rate, in each case, plus an applicable margin (the “Applicable Margin”), in the case of base rate loans, ranging between
zero
percent and
0.75
percent, and in the case of adjusted LIBOR rate loans, ranging between
1.00
percent and
1.75
percent. The Applicable Margin is based on a total leverage based pricing grid. Fees to revolving lenders under the Amended Credit Agreement, including fees in respect of the Incremental Revolving Commitments, include (i) commitment fees, based on a percentage of the daily unused portions of the facility, ranging from
0.15
percent to
0.30
percent and (ii) customary letter of credit fees.
As consideration for the Amendment, the Company paid to each lender under the Existing Credit Agreement a consent fee equal to
0.05
percent of the aggregate principal amount of the commitments and outstanding loans held by such lender immediately prior to the Closing Date. Fees of
$1.4 million
were incurred to secure the Amended Credit Agreement. These fees have been deferred and will be amortized over the term of the arrangement.
The credit facilities under the Amended Credit Agreement will mature on August 7, 2023. The Initial Term Loans and the Incremental Term A Loans (each, as defined in the Amended Credit Agreement) will amortize at a rate equal to
1.25
percent per quarter starting in September 2019, with the balance due at maturity.
Acquisition of Noncontrolling Interest
On August 1, 2018, we acquired the remaining 30 percent ownership interest in our joint venture Purification Cellutions, LLC, now known as Ingevity Georgia, LLC, for an aggregate purchase price of $80.0 million. Ingevity Georgia, LLC manufactures our extruded honeycomb products within our Performance Materials segment.
2018 Senior Notes
On January 24, 2018, we issued
$300.0 million
aggregate principal amount of
4.50 percent
senior unsecured notes due 2026 (the “Notes”). The Notes were issued pursuant to an indenture dated as of January 24, 2018 (the “Indenture”), by and among Ingevity, the subsidiary guarantors party thereto and U.S. Bank National Association, as trustee. The Notes were offered and sold only to persons reasonably believed to be qualified institutional buyers pursuant to Rule 144A and to certain non-U.S. persons
38
outside the U.S. pursuant to Regulation S under the Securities Act of 1933, as amended (the “Securities Act”). The Notes have not been registered under the Securities Act or any state securities laws and may not be offered or sold in the U.S. absent registration or an applicable exemption from the registration requirements of the Securities Act and applicable state laws.
The net proceeds from the sale of the Notes, after deducting deferred financing fees of
$5.7 million
, were
$294.3 million
. We used the net proceeds from the sale of the Notes to finance, in part, our purchase of substantially all the assets primarily used in the pine chemicals business of Georgia-Pacific Chemicals LLC and Georgia-Pacific LLC.
Interest payments on the Notes are due semiannually in arrears on February 1st and August 1st of each year, beginning on August 1, 2018, at a rate of
4.50 percent
per year. The Notes will mature on February 1, 2026.
The Indenture contains certain customary covenants (including covenants limiting Ingevity and our restricted subsidiaries’ ability to grant or permit liens on certain property securing debt, declare or pay dividends, make distributions on or repurchase or redeem capital stock, make investments in unrestricted subsidiaries, engage in sale and lease-back transactions, and engage in a consolidation or merger, or sell, transfer or otherwise dispose of all or substantially all of the assets of our and our restricted subsidiaries, taken as a whole) and events of default (subject in certain cases to customary exceptions, as well as grace and cure periods). The occurrence of an event of default under the Indenture could result in the acceleration of the Notes and could cause a cross-default that could result in the acceleration of other indebtedness of Ingevity and our subsidiaries.
Georgia-Pacific's Pine Chemical Business Acquisition
On August 22, 2017, we entered into an Asset Purchase Agreement (the "Pine Chemicals Purchase Agreement") with Georgia-Pacific Chemicals LLC, Georgia-Pacific LLC (together with Georgia-Pacific Chemicals LLC, "GP") and Ingevity Arkansas, LLC, a wholly-owned subsidiary of Ingevity, to purchase substantially all the assets primarily used in GP's pine chemical business (the "Pine Chemical Business"), including assets and facilities related to tall oil fractionation operations and the production or modification of tall oil fatty acids, tall oil rosins, rosin derivatives and formulated products (the "Pine Chemicals Acquisition").
On March 8, 2018 (the "Pine Chemicals Acquisition Date"), pursuant to the terms and conditions set forth in the Pine Chemicals Purchase Agreement, we completed the Pine Chemicals Acquisition. During the three months ended September 30, 2018, we finalized the purchase price which included a final adjustment for working capital resulting in an aggregate purchase price of $315.5 million. The Pine Chemicals Acquisition was primarily funded with the net proceeds from the Notes. In addition, on the Pine Chemicals Acquisition Date, the Company and GP entered into a 20-year, market-based CTO supply contract with certain of Georgia-Pacific’s paper mill operations.
We believe the Pine Chemicals Acquisition will provide a stronger platform from which we will accelerate the profitable growth of our Performance Chemicals segment. With the addition of broader technologies and product platforms, we will add scale and competitiveness to this segment, and create value for our shareholders.
Separation and Distribution
On May 15, 2016 (the "Distribution Date"), Ingevity separated from WestRock Company (“WestRock”) (herein referred to as the "Separation"). The Separation was completed pursuant to a Separation and Distribution Agreement and other agreements with WestRock related to the Separation, including an Employee Matters Agreement ("EMA"), a Tax Matters Agreement ("TMA"), a Transition Services Agreement and an Intellectual Property Agreement (collectively, the "Separation Agreements"). The Separation was completed by way of a distribution of all of the then outstanding shares of common stock of Ingevity through a dividend in kind of Ingevity's common stock (par value
$0.01
) to holders of record of WestRock common stock (par value
$0.01
) as of the close of business of May 4, 2016 (the "Record Date"). Ingevity's common stock began "regular-way" trading on the New York Stock Exchange ("NYSE") on May 16, 2016 under the symbol "NGVT".
39
Results of Operations
|
Years Ended December 31,
|
|||||||||||
|
In millions, except per share data
|
2018
|
2017
|
2016
|
||||||||
|
Net sales
|
$
|
1,133.6
|
|
$
|
972.4
|
|
$
|
908.3
|
|
||
|
Cost of sales
|
716.8
|
|
643.4
|
|
633.9
|
|
|||||
|
Gross profit
|
416.8
|
|
329.0
|
|
274.4
|
|
|||||
|
Selling, general and administrative expenses
|
132.4
|
|
106.4
|
|
96.4
|
|
|||||
|
Research and technical expenses
|
21.5
|
|
19.8
|
|
17.6
|
|
|||||
|
Separation costs
|
—
|
|
0.9
|
|
17.5
|
|
|||||
|
Restructuring and other (income) charges, net
|
(0.5
|
)
|
3.7
|
|
41.2
|
|
|||||
|
Acquisition and other related costs
|
10.8
|
|
7.1
|
|
—
|
|
|||||
|
Other (income) expense, net
|
1.0
|
|
0.5
|
|
(3.2
|
)
|
|||||
|
Interest expense
|
33.2
|
|
18.1
|
|
19.3
|
|
|||||
|
Interest income
|
(3.4
|
)
|
(2.3
|
)
|
(1.4
|
)
|
|||||
|
Income (loss) before income taxes
|
221.8
|
|
174.8
|
|
87.0
|
|
|||||
|
Provision (benefit) for income taxes
|
40.0
|
|
29.6
|
|
42.6
|
|
|||||
|
Net income (loss)
|
181.8
|
|
145.2
|
|
44.4
|
|
|||||
|
Less: Net income (loss) attributable to noncontrolling interests
|
12.7
|
|
18.7
|
|
9.2
|
|
|||||
|
Net income (loss) attributable to Ingevity stockholders
|
$
|
169.1
|
|
$
|
126.5
|
|
$
|
35.2
|
|
||
Net Sales Comparison of Years Ended
December 31, 2018
,
2017
and
2016
|
Percentage change vs. prior year
|
|||||||||||
|
In millions, except percentages
|
Net sales
|
Total change
|
Currency
effect |
Price/Mix
|
Volume
|
||||||
|
Year Ended December 31, 2018
|
$
|
1,133.6
|
|
17%
|
1%
|
1%
|
15%
|
||||
|
Year Ended December 31, 2017
|
972.4
|
|
7%
|
—%
|
(1)%
|
8%
|
|||||
Year Ended December 31,
2018
vs.
2017
Net sales were
$1,133.6 million
and
$972.4 million
for the years ended December 31,
2018
and
2017
, respectively. The sales increase in 2018 was driven by a volume increase of
$142.9 million
(
15 percent
). Performance Materials and Performance Chemicals contributed
$44.6 million
and
$98.3 million
, respectively, to the volume impacts during the year. Additionally, the favorable pricing and product mix of
$13.5 million
(
one percent
) across both segments, as well as favorable foreign exchange impacts of
$4.8 million
(
one percent
) resulted in the year over year Net sales increase.
Year Ended December 31,
2017
vs.
2016
Net sales were
$972.4 million
and
$908.3 million
for the years ended December 31,
2017
and
2016
, respectively. The sales increase in 2017 was driven by favorable volume of $72.7 million (eight percent of sales). Performance Materials and Performance Chemicals contributed $54.5 million and $18.2 million, respectively, to the volume impacts during the year. The sales increase was tempered by unfavorable pricing and product mix of $7.6 million (one percent of sales) across both segments, as well as unfavorable foreign exchange impacts of $1.0 million.
40
Cost of sales
Year Ended December 31,
2018
vs.
2017
Cost of sales were
$716.8 million
(
63 percent
of sales) and
$643.4 million
(
66 percent
of sales) for the years ended December 31,
2018
and
2017
, respectively. Increased cost of sales was driven by the sales volume increase resulting in a
$75.7 million
increase to cost of sales and depreciation and amortization of
$5.7 million
. These increases were partially offset by lower input costs related to petroleum-based raw materials, energy, and CTO and manufacturing related spending impacting cost of sales by
$5.2 million
, and reduced cost of sales in foreign locations stemming from the strength of the U.S. dollar of
$2.8 million
.
Year Ended December 31,
2017
vs.
2016
Cost of sales were
$643.4 million
(
66 percent
of sales) and
$633.9 million
(
70 percent
of sales) for the years ended December 31,
2017
and
2016
, respectively. Increased cost of sales was driven by the sales volume increase resulting in a $31.2 million increase to cost of sales and depreciation and amortization of $0.5 million. These increases were partially offset by lower input costs related to petroleum-based raw materials, energy, and CTO impacting cost of sales by $14.1 million, manufacturing-related spending of $8.0 million due to favorable productivity costs and reduced cost of sales in foreign locations stemming from the strength of the U.S. dollar of $0.1 million.
Selling, general and administrative expenses
Year Ended December 31,
2018
vs.
2017
Selling, general and administrative ("SG&A") expenses were
$132.4 million
(
12 percent
of sales) and
$106.4 million
(
11 percent
of sales) for the years ended December 31,
2018
and
2017
, respectively. The increase in SG&A is primarily due to amortization associated with the Pine Chemicals Acquisition, increase legal costs, partially due to litigation expenses in our Performance Materials segment, and growth related spending in both segments. SG&A expenses as a percentage of sales were relatively flat year over year.
Year Ended December 31,
2017
vs.
2016
SG&A expenses were
$106.4 million
(
11 percent
of sales) and
$96.4 million
(
11 percent
of sales) for the years ended December 31,
2017
and
2016
, respectively. The increase in SG&A is primarily due to higher incentive compensation costs driven by the improvements in gross profit as compared to the prior period. Increased gross profit translates into higher Adjusted EBITDA which is our primary metric for incentive-based compensation. Adjusted EBITDA is defined under the section entitled "Use of Non-GAAP Financial Measures" within this MD&A.
Separation costs
Year Ended December 31,
2018
,
2017
, and 2016
Separation costs of
zero
and
$0.9 million
for the years ended December 31,
2018
and
2017
, respectively, were expenses related to the Separation. Separation costs of
$0.9 million
and
$17.5 million
for the years ended December 31,
2017
and
2016
, respectively, were expenses related to the Separation. See Note 15 to the Consolidated Financial Statements included within Part II. Item 8 of this Form 10-K for more information.
Restructuring and other (income) charges, net
2018 activities
In February 2018, we sold assets from the Performance Chemicals derivatives operations in Duque De Caxias, Rio de Janeiro, Brazil. These assets were part of a facility that was closed as a result of a restructuring event in 2016 (see 2016 activities below). As a result of this sale, we recorded
$0.6 million
as a gain on sale of assets offset by other employee related costs of
$0.1 million
for the year ended December 31, 2018.
2017 activities
In January 2017, we initiated a reorganization to streamline our leadership team, flatten the organization and reduce costs. Because of this reorganization, we recorded
$1.3 million
in severance and other employee-related costs for the year ended December 31, 2017.
41
During the year ended December 31, 2017, we also recorded
$2.4 million
of additional miscellaneous exit costs primarily associated with the exit of our Performance Chemicals' manufacturing operations in Palmeira, Santa Catarina, Brazil which began in the fourth quarter of 2016 (see 2016 activities below).
2016 activities
As a result of continued deteriorating market conditions within the South America region, on October 31, 2016, our Board of Directors approved a plan to exit our Performance Chemicals' manufacturing operations in Palmeira, Santa Catarina, Brazil. As a result, we recorded a non-cash pre-tax impairment charge to property, plant and equipment in the amount of
$30.2 million
and recorded severance costs of
$1.8 million
. The severance costs began to be paid in the fourth quarter of 2016. Refinery production ceased before year end, and the facility was decommissioned in 2017. We recorded
$2.6 million
of additional miscellaneous exit costs during the year ended December 31, 2016.
During the first quarter of 2016, we announced the closure of the Performance Chemicals' derivatives operation in Duque de Caxias, Rio de Janeiro, Brazil. As a result of this closure, we recorded
$0.1 million
impairment charge on fixed assets,
$1.8 million
in severance and other employee-related costs and
$1.7 million
of additional miscellaneous exit costs during year ended December 31, 2016.
During the first quarter of 2016, we also announced a company-wide restructuring to better align our workforce in light of changing macroeconomic and market realities. The restructuring decision resulted in workforce reductions at several of our locations. As a result, during the year ended December 31, 2016, we recorded severance and other employee-related charges of
$2.7 million
(
$1.9 million
related to Performance Chemicals segment and
$0.8 million
related to Performance Materials segment). We also recorded an impairment charge on fixed assets of
$0.3 million
in the year ended December 31, 2016 (related to the Performance Chemicals segment).
Detail on the restructuring charges and asset disposal activities is provided below.
|
Years Ended December 31,
|
|||||||||||
|
In millions
|
2018
|
2017
|
2016
|
||||||||
|
Restructuring and other (income) charges, net
|
|||||||||||
|
Gain on sale of assets and businesses
|
$
|
(0.6
|
)
|
$
|
—
|
|
$
|
—
|
|
||
|
Severance and other employee-related costs
(1)
|
0.1
|
|
1.3
|
|
6.3
|
|
|||||
|
Asset write-downs
(2)
|
—
|
|
—
|
|
30.6
|
|
|||||
|
Other (income) charges, net
(3)
|
—
|
|
2.4
|
|
4.3
|
|
|||||
|
Total restructuring and other (income) charges, net
|
$
|
(0.5
|
)
|
$
|
3.7
|
|
$
|
41.2
|
|
||
_______________
|
(1)
|
Represents severance and employee benefit charges.
|
|
(2)
|
Primarily represents accelerated depreciation and impairment charges on long-lived assets, which were or are to be abandoned. To the extent incurred the acceleration effect of re-estimating settlement dates and revised cost estimates associated with asset retirement obligations due to facility shutdowns are also included within the asset write-downs.
|
|
(3)
|
Primarily represents costs associated with rental payments, contract terminations, and other miscellaneous exit costs. Other Income primarily represents favorable developments on previously recorded exit costs as recoveries associated with restructuring activities.
|
Acquisition and other related costs
Years Ended December 31,
2018
,
2017
, and
2016
Acquisition costs of
$10.8 million
,
$7.1 million
, and
zero
for the years ended December 31,
2018
,
2017
, and
2016
, respectively, were charges incurred in connection with the acquisitions of the Caprolactone Business and Pine Chemical Business. See Note 17 to the Consolidated Financial Statements included within Part II. Item 8 of this Form 10-K for more information.
42
Interest expense
Interest expense was as follows for the years ended December 31,
2018
,
2017
, and
2016
.
|
Years Ended December 31,
|
|||||||||||
|
In millions
|
2018
|
2017
|
2016
|
||||||||
|
Interest expense
|
|||||||||||
|
Allocated interest expense from WestRock
|
$
|
—
|
|
$
|
—
|
|
$
|
7.2
|
|
||
|
Interest expense on capital lease obligations
|
6.2
|
|
6.1
|
|
6.2
|
|
|||||
|
Interest expense on revolving credit and term loan facility
|
14.9
|
|
11.4
|
|
5.9
|
|
|||||
|
Interest expense on senior notes
|
13.0
|
|
—
|
|
—
|
|
|||||
|
Capitalized interest
|
(1.1
|
)
|
(0.3
|
)
|
(1.7
|
)
|
|||||
|
Other
|
0.2
|
|
0.9
|
|
1.7
|
|
|||||
|
Total interest expense, net
|
$
|
33.2
|
|
$
|
18.1
|
|
$
|
19.3
|
|
||
Interest income
Years Ended December 31 2017, 2016 and 2015
Interest income was
$3.4 million
,
$2.3 million
, and
$1.4 million
for the years ended December 31,
2018
,
2017
and
2016
, respectively. Interest income is primarily related to the interest earned on our restricted investment.
Provision (benefit) for income taxes
Additional detail explaining the change in the effective tax rate is presented in Note 18 to the Consolidated Financial Statements included within Part II. Item 8 of this Form 10-K.
Year Ended December 31,
2018
vs.
2017
Our effective tax rate was
18.0 percent
and
16.9 percent
for the years ended December 31,
2018
and
2017
, respectively. The increase in our effective tax rate from 2017 to 2018 is mainly due to the one time benefit of reducing our net deferred tax liability to the
21.0 percent
rate in 2017 and effects of certain provisions under U.S. Tax Reform. Our U.S. net deferred tax liabilities as of December 31, 2017 were remeasured from
35.0 percent
to
21.0 percent
, resulting in
$24.5 million
of provisional deferred income tax benefit and a reduction in our effective tax rate of
14.0 percent
in 2017. During the year ended December 31, 2018, we further adjusted our net deferred tax liabilities by
$1.9 million
due to further interpretations of U.S. Tax Reform. The remaining difference in our effective tax rate for the years ended December 31, 2018 and 2017, respectively, is due to the change in certain favorable tax deductions under U.S. Tax Reform, such as the elimination of the domestic manufacturing deduction and the addition of the foreign-derived intangible income deduction. In addition to the impact of U.S. Tax Reform, the change in the effective tax rate period over period was also driven by the acquisition of our noncontrolling interest.
Year Ended December 31,
2017
vs.
2016
The Company’s effective tax rate was
16.9 percent
and
49.0 percent
for the years ended December 31,
2017
and
2016
, respectively. The decrease in our effective tax rate from 2016 to 2017 is mainly due to the impact of U.S. Tax Reform. Our U.S. net deferred tax liabilities as of December 31, 2017 were remeasured from 35.0 percent to 21.0 percent, resulting in $24.5 million of provisional deferred income tax benefit and a reduction in our effective tax rate of 14.0 percent. The remaining difference in our effective tax rate for the years ended December 31, 2017 and 2016, respectively, is due to non-deductible transaction costs associated with the Separation in 2016, acquisition-related charges, restructuring and other (income charges) and the unfavorable results of legal entities with full valuation allowances. Excluding the impact of U.S. Tax Reform, acquisition-related charges, restructuring and other (income charges), separation costs and losses from legal entities with full valuation allowances the change in the effective tax rate period over period was primarily due to a shift in earnings mix as it relates to domestic versus foreign income earned. See Note 18 to the Consolidated Financial Statements included within Part II. Item 8 of this Form 10-K for more information.
43
Net income (loss) attributable to noncontrolling interests
Year Ended December 31,
2018
,
2017
, and
2016
Net income (loss) attributable to noncontrolling interests was
$12.7 million
,
$18.7 million
and
$9.2 million
for the years ended December 31,
2018
,
2017
, and
2016
, respectively. Our noncontrolling interest represents the 30 percent ownership interest held by a third-party U.S.-based company in our consolidated Purification Cellutions, LLC legal entity, prior to our purchase of this remaining interest on August 1, 2018.
On August 1, 2018, we completed the acquisition of the remaining
30 percent
noncontrolling interest in Purification Cellutions, LLC, which was treated as a partnership for tax purposes, for a purchase price of
$80.0 million
. The acquisition resulted in the elimination of Noncontrolling interest of
$11.4 million
and the recognition of a Deferred tax asset of
$14.3 million
, with the remainder being recorded against Additional paid in capital of
$54.3 million
in our Consolidated Financial Statements.
Purification Cellutions, LLC, now known as Ingevity Georgia, LLC, is the legal entity that manufactures our extruded honeycomb products within our Performance Materials segment. Refer to the Performance Materials’ operating profit discussion below within the Segment Operating Results section for further discussion of the segment’s performance for the years ended December 31,
2018
,
2017
, and
2016
.
Net income (loss) attributable to Ingevity stockholders
Year Ended December 31,
2018
vs.
2017
Net income (loss) attributable to Ingevity stockholders was
$169.1 million
and
$126.5 million
for the years ended December 31,
2018
and
2017
, respectively. Net income attributable to Ingevity stockholders in 2018 compared to 2017 was unfavorably impacted by the U.S. Tax Reform benefit recorded in 2017, resulting in a year over year impact of $22.6 million. Excluding this impact, Net income (loss) attributable to Ingevity stockholders in 2018 increased by $65.2 million. This increase was primarily driven by strong segment operating profits from both segments of
$36.0 million
in Performance Chemicals and
$25.2 million
in Performance Materials. Also contributing to the increase year over year was a reduction in non-controlling interest of $6.0 million and restructuring and other charges of $4.2 million. These favorable results were slightly offset by an increase in acquisition and other related costs of $5.1 million.
Year Ended December 31,
2017
vs.
2016
Net income (loss) attributable to Ingevity stockholders was
$126.5 million
and
$35.2 million
for the years ended December 31,
2017
and
2016
, respectively. The year over year impact was primarily driven by a reduction in separation and restructuring and other charges of $54.1 million, slightly offset by acquisition-related charges of $7.1 million. The favorable impact of U.S. Tax Reform for 2017, compared to 2016, was a tax benefit of $24.5 million. Excluding these changes, Net income (loss) attributable to Ingevity stockholders increased by $22.1 million. This increase was primarily driven by strong segment operating profits from both segments, including an increase of $23.6 million in Performance Chemicals and $15.1 million in Performance Materials, offset by an increase in non-controlling interest of $9.5 million.
44
Segment Operating Results
In addition to the information discussed above, the following sections discuss the results of operations for each of our segments. Our segments are (i) Performance Materials and (ii) Performance Chemicals. In general, the accounting policies of the segments are the same as those described in the Summary of Significant Accounting Policies in Note 3 to the Consolidated Financial Statements included within Part II. Item 8 of this Form 10-K.
Performance Materials
|
In millions
|
Years Ended December 31,
|
||||||||||
|
2018
|
2017
|
2016
|
|||||||||
|
Net sales
|
|||||||||||
|
Automotive Technologies product line
|
362.0
|
|
312.5
|
|
263.5
|
|
|||||
|
Process Purification product line
|
38.4
|
|
36.8
|
|
37.5
|
|
|||||
|
Total Performance Materials - Net sales
|
$
|
400.4
|
|
$
|
349.3
|
|
$
|
301.0
|
|
||
|
Segment operating profit
|
147.2
|
|
122.0
|
|
106.9
|
|
|||||
Net Sales Comparison of Years Ended December 31,
2018
,
2017
, and
2016
|
Percentage change vs. prior year
|
|||||||||||||||
|
In millions, except percentages
|
Net sales
|
Total change
|
Currency
effect |
Price/Mix
|
Volume
|
||||||||||
|
Year Ended December 31, 2018
|
$
|
400.4
|
|
15
|
%
|
—
|
%
|
2
|
%
|
13
|
%
|
||||
|
Year Ended December 31, 2017
|
$
|
349.3
|
|
16
|
%
|
(1
|
)%
|
(1
|
)%
|
18
|
%
|
||||
Year Ended December 31,
2018
vs.
2017
Segment net sales
for the Performance Materials segment were
$400.4 million
and
$349.3 million
for the years ended December 31,
2018
and
2017
, respectively. The sales increase in 2018 was driven by
$44.6 million
(
13 percent
) in volume improvements in the automotive carbon market due to strong growth in high content vehicle production for sale into the North American automotive market and increased vehicle content due to regulatory adoption. Additionally, we had improved price and product mix of
$5.2 million
(
two percent
) and favorable foreign currency exchange impacts of
$1.3 million
(
zero percent
).
Segment operating profit
for the Performance Materials segment was
$147.2 million
and
$122.0 million
for the years ended December 31,
2018
and
2017
, respectively. Segment operating profit increased
$25.2 million
primarily due to
$28.6 million
in favorable volumes and
$8.2 million
in favorable pricing and product mix. These gains were partially offset by higher SG&A expenses of
$9.2 million
, higher production, freight inflation, and operating costs associated with increased production of
$1.8 million
, and foreign currency exchange impacts of
$0.6 million
.
Year Ended December 31,
2017
vs.
2016
Segment net sales
for the Performance Materials segment were
$349.3 million
and
$301.0 million
for the years ended December 31,
2017
and
2016
, respectively. The sales increase in 2017 was driven by $54.5 million (18 percent) in volume improvements in the automotive carbon market due to strong growth in high content vehicle production for sale into the North American automotive market and increased vehicle content due to regulatory adoption. These gains were partially offset by $3.8 million (one percent) in pricing and product mix and unfavorable foreign currency exchange impacts of $2.4 million (one percent).
Segment operating profit
for the Performance Materials segment was
$122.0 million
and
$106.9 million
for the years ended December 31,
2017
and
2016
, respectively. Segment operating profit increased $15.1 million primarily due to $27.1 million in favorable volumes and $0.4 million in favorable pricing and product mix. These gains were partially offset by higher SG&A expenses of $8.5 million, higher production and operating costs associated with increased production of $3.2 million, and foreign currency exchange impacts of $0.7 million.
45
Performance Chemicals
|
Years Ended December 31,
|
|||||||||||
|
In millions
|
2018
|
2017
|
2016
|
||||||||
|
Net sales
|
|||||||||||
|
Pavement Technologies product line
|
$
|
178.5
|
|
$
|
163.0
|
|
$
|
148.8
|
|
||
|
Oilfield Technologies product line
|
114.2
|
|
77.8
|
|
58.5
|
|
|||||
|
Industrial Specialties product line
|
440.5
|
|
382.3
|
|
400.0
|
|
|||||
|
Total Performance Chemicals - Net sales
|
$
|
733.2
|
|
$
|
623.1
|
|
$
|
607.3
|
|
||
|
Segment operating profit
|
116.3
|
|
80.3
|
|
56.7
|
|
|||||
Net Sales Comparison of Years Ended December 31,
2018
,
2017
, and
2016
|
Percentage change vs. prior year
|
|||||||||||||||
|
In millions, except percentages
|
Net sales
|
Total change
|
Currency
effect |
Price/Mix
|
Volume
|
||||||||||
|
Year Ended December 31, 2018
|
$
|
733.2
|
|
18
|
%
|
1
|
%
|
1
|
%
|
16
|
%
|
||||
|
Year Ended December 31, 2017
|
$
|
623.1
|
|
3
|
%
|
—
|
%
|
—
|
%
|
3
|
%
|
||||
Pine Chemical Business Acquisition
The Pine Chemical Business has been integrated into our Performance Chemicals segment and has been included within our results of operations since the Pine Chemicals Acquisition Date. Although not yet complete, a substantial portion of the Pine Chemicals Business has been integrated into our existing Performance Chemicals operations. As a result, our ability to separate net sales and operating performance of the Pine Chemicals Acquisition from our existing Performance Chemicals operating results is no longer practical. The information presented below for the year ended December 31, 2018, includes the results of the Pine Chemicals Acquisition as compared to the historical results of the year ended ended December 31, 2017. For a pro forma comparative analysis of 2018 versus 2017 results, refer to the section below titled "Performance Chemical Pro Forma Financial Results with the Pine Chemical Business."
Year Ended December 31,
2018
vs.
2017
Segment net sales
for the Performance Chemicals segment were
$733.2 million
and
$623.1 million
for the years ended December 31,
2018
and
2017
, respectively. The sales increase was driven by favorable volume of
$98.3 million
(
16 percent
) driven by industrial specialties (
$52.3 million
), oilfield technologies (
$33.9 million
) and pavement technologies (
$12.1 million
). Additionally, favorable pricing and product mix of
$8.3 million
in certain industrial specialties (
$3.3 million
), oilfield technologies (
$2.3 million
), and and pavement technologies (
$2.7 million
) markets and favorable
$3.5 million
of foreign currency exchange contributed to results.
Segment operating profit
for the Performance Chemicals segment was
$116.3 million
and
$80.3 million
for the years ended December 31,
2018
and
2017
, respectively. Segment operating profit increased
$36.0 million
due to favorable volume of
$38.5 million
, favorable price and product mix of
$12.4 million
, favorable manufacturing and production costs, net of freight inflation, of
$1.1 million
, and favorable foreign currency exchange of
$2.6 million
. These gains were partially offset by unfavorable SG&A expenses of
$18.6 million
, which was partially due to amortization associated with the Pine Chemicals Acquisition.
Year Ended December 31,
2017
vs.
2016
Segment net sales
for the Performance Chemicals segment were
$623.1 million
and
$607.3 million
for the years ended December 31,
2017
and
2016
, respectively. The sales increase was driven by favorable volume of $18.2 million (three percent) driven by oilfield technologies ($24.6 million) and pavement technologies ($9.8 million), partially offset by unfavorable volume in industrial specialties ($16.2 million). The favorable volume was partially offset by unfavorable pricing and product mix of $3.8 million in certain industrial specialties ($2.5 million) and oilfield technologies ($5.5 million) markets, partially offset by favorable pricing and product mix in pavement technologies ($4.2 million). The sales increase was also driven by $1.4 million of favorable foreign currency exchange.
46
Segment operating profit
for the Performance Chemicals segment was
$80.3 million
and
$56.7 million
for the years ended December 31,
2017
and
2016
, respectively. Segment operating profit increased $23.6 million due to favorable manufacturing productivity of $27.3 million, as well as favorable volume of $7.5 million. These gains were offset by unfavorable foreign currency exchange impacts of $5.3 million, unfavorable SG&A expenses of $3.8 million, and unfavorable pricing and product mix of $2.1 million.
Performance Chemical Pro Forma Financial Results with the Pine Chemical Business
We believe that reviewing our operating results by combining actual and pro forma results for our Performance Chemicals segment is useful in identifying trends in, or reaching conclusions regarding, the overall operating performance. Our pro forma segment information includes adjustments as if the Pine Chemicals Acquisition had occurred on January 1, 2017. Our pro forma results are adjusted for the effects of acquisition accounting but do not include adjustments for costs related to integration activities, cost savings or synergies that might be achieved by the combined businesses. Pro forma amounts to be presented are not necessarily indicative of what our results would have been had we operated the Pine Chemical Business since January 1, 2017, nor will the pro forma amounts necessarily be indicative of our future results.
|
Performance Chemical Pro Forma Financial Results
|
|||||||
|
Year Ended December 31,
|
|||||||
|
In millions
|
2018
|
2017
|
|||||
|
Net sales
|
|||||||
|
Performance Chemicals, as reported
(1)
|
$
|
733.2
|
|
$
|
623.1
|
|
|
|
Pine Chemical Business, pro forma
(2)
|
20.2
|
|
100.6
|
|
|||
|
Pro Forma Combined Net Sales
(3)
|
$
|
753.4
|
|
$
|
723.7
|
|
|
|
Segment Operating Profit
|
|||||||
|
Performance Chemicals, as reported
(1)
|
$
|
116.3
|
|
$
|
80.3
|
|
|
|
Pine Chemical Business, pro forma
(2)
|
1.7
|
|
9.2
|
|
|||
|
Pro Forma Combined Segment Operating Profit
(3)
|
$
|
118.0
|
|
$
|
89.5
|
|
|
_______________
|
(1)
|
As reported amounts are the results of operations of Performance Chemicals, including the results of the Pine Chemical Business, post Pine Chemical Acquisition Date.
|
|
(2)
|
Pro forma amounts include historical results of the Pine Chemical Business, prior to the Pine Chemical Acquisition Date. These amounts also include adjustments as if the Pine Chemicals Acquisition had occurred on January 1, 2017, including the effects of purchase accounting. The pro forma amounts do not include adjustments for expenses related to integration activities, cost savings, or synergies that have been or may have been realized had we acquired the Pine Chemical Business on January 1, 2017.
|
|
(3)
|
The pro forma combined results are not necessarily indicative of what the results would have been had we acquired the Pine Chemical Business on January 1, 2017, nor indicative of future results.
|
Performance Chemical Pro Forma Combined Net Sales
|
Year Ended December 31,
|
|||||||
|
In millions
|
2018
|
2017
|
|||||
|
Oilfield Technologies product line
|
$
|
118.8
|
|
$
|
101.9
|
|
|
|
Pavement Technologies product line
|
178.7
|
|
164.2
|
|
|||
|
Industrial Specialties product line
|
455.9
|
|
457.6
|
|
|||
|
Pro Forma Combined Net Sales - Performance Chemicals
|
$
|
753.4
|
|
$
|
723.7
|
|
|
47
Pro Forma Comparison of Year Ended December 31, 2018 vs.
2017
|
Percentage change vs. prior year
|
|||||||||||||||
|
Performance Chemicals
(In millions, except percentages)
|
Pro Forma Combined Net sales
|
Total change
|
Currency
effect |
Price/Mix
|
Volume
|
||||||||||
|
Year Ended December 31, 2018
|
$
|
753.4
|
|
4
|
%
|
—
|
%
|
2
|
%
|
2
|
%
|
||||
Pro Forma Combined Results - Year Ended December 31, 2018 vs. 2017
Pro Forma Combined Net Sales
for the Performance Chemicals segment were
$753.4 million
and
$723.7 million
for the year ended December 31,
2018
and
2017
, respectively. The Pro Forma Combined Net Sales increase was driven by favorable volume of
$10.9 million
(
two percent
), which consisted of favorable volumes in pavement technologies products (
$9.3 million
), oilfield technologies (
$10.9 million
), offset by unfavorable volumes in industrial specialties (
$9.3 million
). Also driving the sales increase was pricing and product mix of
$15.3 million
(
two percent
) driven by favorable price and product mix in oilfield technologies (
$5.8 million
), pavement technologies products (
$4.5 million
), and industrial specialties (
$5.0 million
). In addition,
$3.5 million
of favorable foreign currency exchange (less than one percent) helped drive the sales increase.
Pro Forma Combined Segment Operating Profit
for the Performance Chemicals segment was
$118.0 million
and
$89.5 million
for the year ended December 31,
2018
and
2017
, respectively. Pro Forma Combined Segment Operating Profit increased by
$28.5 million
primarily due to increased volumes of
$6.1 million
,
$14.9 million
of favorable pricing and product mix,
$7.3 million
of favorable manufacturing productivity primarily driven by lower raw material pricing, specifically CTO, offset partially by freight inflation, and
$2.6 million
due to favorable foreign currency exchange. These favorable operating results were partially offset by
$2.4 million
of unfavorable SG&A costs, driven by growth-related spending.
Use of Non-GAAP Financial Measures
Ingevity has presented certain financial measures, defined below, which have not been prepared in accordance with U.S. generally accepted accounting principles (“GAAP”) and has provided a reconciliation to the most directly comparable financial measure calculated in accordance with GAAP. These financial measures are not meant to be considered in isolation or as a substitute for the most directly comparable financial measure calculated in accordance with GAAP. The company believes these non-GAAP measures provide investors, potential investors, securities analysts and others with useful information to evaluate the performance of the business, because such measures, when viewed together with our financial results computed in accordance with GAAP, provide a more complete understanding of the factors and trends affecting our historical financial performance and projected future results.
Ingevity uses the following non-GAAP measures:
Adjusted earnings (loss)
is defined as net income (loss) attributable to Ingevity stockholders plus restructuring and other (income) charges, separation costs, acquisition and other related costs, pension and postretirement settlement and curtailment (income) charges and the income tax expense (benefit) on those items, less the benefit from U.S. Tax Reform.
Diluted adjusted earnings (loss) per share
is defined as diluted earnings (loss) per common share attributable to Ingevity stockholders plus restructuring and other (income) charges, net per share, separation costs per share, acquisition and other related costs per share, pension and postretirement settlement and curtailment (income) charges per share and the income tax expense (benefit) per share on those items, less the per share tax benefit from U.S. Tax Reform.
Adjusted EBITDA
is defined as net income (loss) plus provision for income taxes, interest expense, net, depreciation and amortization, restructuring and other (income) charges, separation costs and acquisition and other related costs, pension and postretirement settlement and curtailment (income) charges.
Adjusted EBITDA Margin
is defined as Adjusted EBITDA divided by Net Sales.
Segment EBITDA
is defined as segment operating profit plus depreciation and amortization.
Segment EBITDA Margin
is defined as Segment EBITDA divided by Net Segment Sales.
48
We use the above financial measures as the primary measures of profitability used by managers of the business and its segments. In addition, we believe Adjusted EBITDA and Segment EBITDA are useful measures because they exclude the effects of financing and investment activities as well as non-operating activities. These non-GAAP financial measures are not intended to replace the presentation of financial results in accordance with GAAP and investors should consider the limitations associated with these non-GAAP measures, including the potential lack of comparability of these measures from one company to another. Reconciliations of these non-GAAP financial measures are set forth within this section.
|
Reconciliation of Net Income to Adjusted EBITDA
|
|||||||||||
|
Years Ended December 31,
|
|||||||||||
|
In millions
|
2018
|
2017
|
2016
|
||||||||
|
Net income (loss)
(GAAP)
|
$
|
181.8
|
|
$
|
145.2
|
|
$
|
44.4
|
|
||
|
Provision (benefit) for income taxes
|
40.0
|
|
29.6
|
|
42.6
|
|
|||||
|
Interest expense
|
33.2
|
|
18.1
|
|
19.3
|
|
|||||
|
Interest income
|
(3.4
|
)
|
(2.3
|
)
|
(1.4
|
)
|
|||||
|
Depreciation and amortization
|
57.0
|
|
40.4
|
|
38.8
|
|
|||||
|
Separation costs
|
—
|
|
0.9
|
|
17.5
|
|
|||||
|
Restructuring and other (income) charges, net
|
(0.5
|
)
|
3.7
|
|
41.2
|
|
|||||
|
Pension and postretirement settlement and curtailment income (charges)
|
0.2
|
|
—
|
|
—
|
|
|||||
|
Acquisition and other related costs
|
12.2
|
|
7.1
|
|
—
|
|
|||||
|
Adjusted EBITDA
(Non-GAAP)
|
$
|
320.5
|
|
$
|
242.7
|
|
$
|
202.4
|
|
||
Adjusted EBITDA
Year Ended December 31,
2018
vs.
2017
Adjusted EBITDA
was
$320.5 million
and
$242.7 million
for years ended December 31,
2018
and
2017
, respectively. The factors that impacted Adjusted EBITDA period to period are the same factors that affected earnings discussed in the sections entitled "Results of Operations" and "Segment Operating Results" within MD&A.
Year Ended December 31,
2017
vs.
2016
Adjusted EBITDA was
$242.7 million
and
$202.4 million
for years ended December 31,
2017
and
2016
, respectively. The factors that impacted Adjusted EBITDA period to period are the same factors that affected earnings discussed in the sections entitled "Results of Operations" and "Segment Operating Results" within MD&A.
49
|
Reconciliation of Segment Operating Profit to Segment EBITDA
|
|||||||||||
|
Performance Materials
|
Years Ended December 31,
|
||||||||||
|
In millions
|
2018
|
2017
|
2016
|
||||||||
|
Segment operating profit
(GAAP)
|
$
|
147.2
|
|
$
|
122.0
|
|
$
|
106.9
|
|
||
|
Depreciation and amortization
|
22.2
|
|
19.8
|
|
16.4
|
|
|||||
|
Segment EBITDA
(Non-GAAP)
|
$
|
169.4
|
|
$
|
141.8
|
|
$
|
123.3
|
|
||
|
Performance Chemicals
|
Years Ended December 31,
|
||||||||||
|
In millions
|
2018
|
2017
|
2016
|
||||||||
|
Segment operating profit
(GAAP)
|
$
|
116.3
|
|
$
|
80.3
|
|
$
|
56.7
|
|
||
|
Depreciation and amortization
|
34.8
|
|
20.6
|
|
22.4
|
|
|||||
|
Segment EBITDA
(Non-GAAP)
|
$
|
151.1
|
|
$
|
100.9
|
|
$
|
79.1
|
|
||
Performance Materials
Year Ended December 31,
2018
vs.
2017
Segment EBITDA
for the Performance Materials segment was
$169.4 million
and
$141.8 million
for the years ended December 31,
2018
and
2017
, respectively. The factors that impacted Segment EBITDA period to period are the same factors that affected segment operating profit discussed in the section entitled "Segment Operating Results" within the MD&A, excluding the depreciation and amortization expense.
Year Ended December 31,
2017
vs.
2016
Segment EBITDA
for the Performance Materials segment was
$141.8 million
and
$123.3 million
for the years ended December 31,
2017
and
2016
, respectively. The factors that impacted Segment EBITDA period to period are the same factors that affected segment operating profit discussed in the section entitled "Segment Operating Results" within the MD&A, excluding the depreciation and amortization expense.
Performance Chemicals
Year Ended December 31,
2018
vs.
2017
Segment EBITDA
for the Performance Chemicals segment was
$151.1 million
and
$100.9 million
for the years ended December 31,
2018
and
2017
, respectively. The factors that impacted Segment EBITDA period to period are the same factors that affected segment operating profit discussed in the section entitled "Segment Operating Results" within the MD&A, excluding the depreciation and amortization expense.
Year Ended December 31,
2017
vs.
2016
Segment EBITDA
for the Performance Chemicals segment was
$100.9 million
and
$79.1 million
for the years ended December 31,
2017
and
2016
, respectively. The factors that impacted Segment EBITDA period to period are the same factors that affected segment operating profit discussed in the section entitled "Segment Operating Results" within the MD&A, excluding the depreciation and amortization expense.
Total Company Outlook and 2019 Guidance
For revenue, favorable volume in Performance Materials driven by continued regulatory changes and favorable volume in Performance Chemicals pavement technologies driven by continued chemistry adoption and global growth are expected to be partially offset by lower volume in Performance Chemicals industrial specialties applications as we continue to focus on improving price and mix in those product lines. We expect flat volumes in Performance Chemicals oilfield technologies and are assuming that the price of oil remains stable in the mid $50’s per barrel for West Texas Intermediate during 2019. Adding in the Caprolactone
50
Acquisition as of February 13, 2019, we expect to deliver fiscal year 2019 Net Sales of $1.30 billion to $1.36 billion, up 17 percent at the midpoint versus 2018.
Adjusted EBITDA is expected to grow by 22 percent to 28 percent versus 2018. In the Performance Materials segment, growth will be driven by continued volume, price and mix improvements as the US and Canada continue adoption of the Tier 3/LEV III standard, China demand increases with early adoption of China 6 and European demand increases as they implement Euro 6d. This growth will be partially offset by marginally lower vehicle demand in the US & Europe, higher costs as we cycle through the higher cost inventory produced during the Zhuhai, China, facility ramp-up and increased legal costs to defend the company’s intellectual property. In the Performance Chemicals segment, the addition of the Caprolactone Acquisition will be complemented by continued profitable growth in pavement technologies and mix improvements in industrial specialties. We expect these benefits to be partially offset by somewhat lower volumes in industrial specialties, modest inflationary costs in freight, raw materials, and CTO, as well as higher outage costs at the Warrington facility due to planned outages and higher transition service agreement costs as we separate Warrington from Perstorp. Some risks to the 2019 outlook include lower than anticipated U.S., China, Canadian and European vehicle sales and production, higher non-CTO raw materials costs with higher oil prices, a shift towards smaller vehicles in the U.S. (versus the 2016 to 2018 shift towards light-trucks), lower oil prices and a reduction in oil drilling and production in oilfield technologies, Brexit and ongoing trade and tariff discussions between the U.S. and other countries. We expect to deliver fiscal year 2019 Adjusted EBITDA of $390 million to $410 million.
A reconciliation of net income to adjusted EBITDA as projected for 2019 is not provided. Ingevity does not forecast net income as it cannot, without unreasonable effort, estimate or predict with certainty various components of net income. These components, net of tax, include additional separation costs associated with the separation from WestRock; further restructuring and other income (charges), net; additional acquisition and other related costs in connection with the acquisition of Georgia-Pacific’s pine chemical business and Perstorp Holding AB’s Capa caprolactone business; additional pension and postretirement settlement and curtailment (income) charges; and revisions due to future guidance and assessment of U.S. tax reform. Additionally, discrete tax items could drive variability in our projected effective tax rate. All of these components could significantly impact such financial measures. Further, in the future, other items with similar characteristics to those currently included in adjusted EBITDA, that have a similar impact on comparability of periods, and which are not known at this time, may exist and impact adjusted EBITDA.
51
Liquidity and Capital Resources
The primary source of liquidity for Ingevity’s business is the cash flow provided by operating activities. We expect our cash flow provided by operations combined with cash on hand and available capacity under our revolving credit facility to be sufficient to meet our working capital needs. We believe these sources will be sufficient to fund our planned operations and meet our interest and other contractual obligations for at least the next twelve months. Over the next twelve months, we expect to make interest payments, capital expenditures, principal repayments, treasury share repurchases, income tax payments, close the pending Caprolactone Acquisition, and incur additional acquisition-related costs. As of
December 31, 2018
, our available capacity under our revolving credit facility was
$748.1 million
. On February 13, 2019, our revolving credit facility was utilized as the primary source of funds, along with available cash on hand, to close our Caprolactone Acquisition. Our available capacity under our revolving credit facility immediately following this drawdown was $113.1 million.
Cash and cash equivalents totaled
$77.5 million
at
December 31, 2018
. Management continuously monitors deposit concentrations and the credit quality of the financial institutions that hold Ingevity's cash and cash equivalents, as well as the credit quality of its insurance providers, customers and key suppliers.
Due to the global nature of our operations, a portion of our cash is held outside the U.S. The cash and cash equivalents balance at
December 31, 2018
included
$27.0 million
held by our foreign subsidiaries. Cash and earnings of our foreign subsidiaries are generally used to finance our foreign operations and capital expenditures. We believe that our foreign holdings of cash will not have a material adverse impact on our U.S. liquidity. Management does not currently expect to repatriate cash earnings from our foreign operations in order to fund U.S. operations. If these earnings were distributed, such amounts would be subject to U.S. federal income tax at the statutory rate less the available foreign tax credits, if any, and potentially subject to withholding taxes in the various jurisdictions. The potential tax implications of the repatriation of unremitted earnings are driven by facts at the time of distribution, therefore, it is not practicable to estimate the income tax liabilities that might be incurred if such cash and earnings were repatriated to the U.S.
Revolving Credit and Term Loan Facility Amendment
On August 7, 2018, we entered into an Incremental Facility Agreement and Amendment No. 2 (the “Amendment”) to the Credit Agreement, dated as of March 7, 2016 (the “Existing Credit Agreement”, and as amended, supplemented or otherwise modified from time to time, including pursuant to the Incremental Facility Agreement and Amendment No. 1, dated as of August 21, 2017, and the Amendment, the “Amended Credit Agreement”). Among other things, the Amendment (i) increased the revolving commitments under the Existing Credit Agreement by
$200.0 million
(the “Incremental Revolving Commitments”) to
$750 million
and (ii) reduced the Applicable Rate (as defined in the Amended Credit Agreement). The Amendment also extended the maturity date for the loans and commitments under the Existing Credit Agreement to August 7, 2023.
The Incremental Revolving Commitments have terms identical to those of the Revolving Commitments under the Existing Credit Agreement and will be treated as a single class with such existing commitments under the Amended Credit Agreement.
Loans under the Amended Credit Agreement bear interest at either (a) an adjusted base rate or (b) an adjusted LIBOR rate, in each case, plus an applicable margin (the “Applicable Margin”), in the case of base rate loans, ranging between
0.00
percent and
0.75
percent, and in the case of adjusted LIBOR rate loans, ranging between
1.00
percent and
1.75
percent. The Applicable Margin is based on a total leverage based pricing grid. Fees to revolving lenders under the Amended Credit Agreement, including fees in respect of the Incremental Revolving Commitments, include (i) commitment fees, based on a percentage of the daily unused portions of the facility, ranging from
0.15
percent to
0.30
percent and (ii) customary letter of credit fees.
As consideration for the Amendment, the Company paid to each lender under the Existing Credit Agreement a consent fee equal to
0.05
percent of the aggregate principal amount of the commitments and outstanding loans held by such lender immediately prior to the Closing Date. Fees of
$1.4 million
were incurred to secure the Amended Credit Agreement. These fees have been deferred and will be amortized over the term of the arrangement.
The credit facilities under the Amended Credit Agreement will mature on August 7, 2023. The Initial Term Loans and the Incremental Term A Loans (each, as defined in the Amended Credit Agreement) will amortize at a rate equal to
1.25
percent per quarter starting in September 2019, with the balance due at maturity.
52
2018 Senior Notes
On January 24, 2018, we issued
$300.0 million
aggregate principal amount of
4.50 percent
senior unsecured notes due 2026 (the “Notes”). The Notes were issued pursuant to an indenture dated as of January 24, 2018 (the “Indenture”), by and among Ingevity, the subsidiary guarantors party thereto and U.S. Bank National Association, as trustee. The Notes were offered and sold only to persons reasonably believed to be qualified institutional buyers pursuant to Rule 144A and to certain non-U.S. persons outside the U.S. pursuant to Regulation S under the Securities Act of 1933, as amended (the “Securities Act”). The Notes have not been registered under the Securities Act or any state securities laws and may not be offered or sold in the U.S. absent registration or an applicable exemption from the registration requirements of the Securities Act and applicable state laws.
The net proceeds from the sale of the Notes, after deducting deferred financing fees of
$5.7 million
were approximately
$294.3 million
. We used the net proceeds from the sale of the Notes to finance, in part, our purchase of substantially all the assets primarily used in the pine chemicals business of Georgia-Pacific Chemicals LLC and Georgia-Pacific LLC.
Interest payments on the Notes are due semiannually in arrears on February 1st and August 1st of each year, beginning on August 1, 2018, at a rate of
4.50 percent
per year. The Notes will mature on February 1, 2026.
The Indenture contains certain customary covenants (including covenants limiting Ingevity and our restricted subsidiaries’ ability to grant or permit liens on certain property securing debt, declare or pay dividends, make distributions on or repurchase or redeem capital stock, make investments in unrestricted subsidiaries, engage in sale and lease-back transactions, and engage in a consolidation or merger, or sell, transfer or otherwise dispose of all or substantially all of the assets of our and our restricted subsidiaries, taken as a whole) and events of default (subject in certain cases to customary exceptions, as well as grace and cure periods). The occurrence of an event of default under the Indenture could result in the acceleration of the Notes and could cause a cross-default that could result in the acceleration of other indebtedness of Ingevity and our subsidiaries.
Other Potential Liquidity Needs
Share Repurchases
On February 20, 2017, the Board of Directors authorized the repurchase of up to
$100.0 million
of our common stock. The repurchase program does not include a specific timetable or price targets and may be suspended or terminated at any time. In addition, on November 1, 2018, the Board of Directors approved the authorization for the repurchase of up to an additional
$350.0 million
of Ingevity’s outstanding common stock. The approval of this
$350.0 million
is in addition to the
$100.0 million
share repurchase program approved in February 2017. Shares may be purchased through open market or privately negotiated transactions at the discretion of management based on its evaluation of market prevailing conditions and other factors.
During the year ended
December 31, 2018
, we repurchased $47.4 million in common shares, representing
561,000
shares of our common stock at a weighted average cost per share of
$84.59
. At
December 31, 2018
,
$396.0 million
remained unused under our Board-authorized repurchase program. We record shares of common stock repurchased at cost as treasury stock, resulting in a reduction of stockholders’ equity in the consolidated balance sheets. When the treasury shares are contributed under our employee benefit plans or issued for option exercises, we use a first-in, first-out (“FIFO”) method for determining cost. The difference between the cost of the shares and the market price at the time of contribution to an employee benefit plan is added to or deducted from the related capital in excess of par value of common stock.
Capital Expenditures
Projected 2019 capital expenditures are expected to be $110 million to $120 million. We have no material commitments associated with these projected capital expenditures as of
December 31, 2018
.
Cash flow comparison of Years Ended December 31,
2018
,
2017
, and
2016
|
Years Ended December 31,
|
|||||||||||
|
In millions
|
2018
|
2017
|
2016
|
||||||||
|
Net cash provided by (used in) operating activities
|
$
|
252.0
|
|
$
|
174.3
|
|
$
|
127.9
|
|
||
|
Net cash provided by (used in) investing activities
|
(414.4
|
)
|
(58.6
|
)
|
(126.4
|
)
|
|||||
|
Net cash provided by (used in) financing activities
|
153.7
|
|
(57.8
|
)
|
(3.4
|
)
|
|||||
53
Cash flows provided by (used in) operating activities
During the year ended
December 31, 2018
, cash flow provided by operations increased primarily due to higher earnings, partially offset by working capital increases compared to 2017. Working capital increases in 2018 when compared to 2017 are further explained below.
Current Assets and Liabilities
|
December 31,
|
|||||||
|
In millions
|
2018
|
2017
|
|||||
|
Cash and cash equivalents
|
$
|
77.5
|
|
$
|
87.9
|
|
|
|
Accounts receivable, net
|
118.9
|
|
100.0
|
|
|||
|
Inventories, net
|
191.4
|
|
160.0
|
|
|||
|
Prepaid and other current assets
|
34.9
|
|
20.8
|
|
|||
|
Total current assets
|
$
|
422.7
|
|
$
|
368.7
|
|
|
Current assets as of
December 31, 2018
, increased
$54.0 million
compared to December 31,
2017
, primarily due to increases in inventories and accounts receivable. Inventories increased
$31.4 million
, as did Prepaid and other current assets by
$14.1 million
to support anticipated customer demand in Q1 2019 versus Q1 2018. Increased Accounts receivable, net of
$18.9 million
was a result of increased sales volume in 2018 as compared to December 31,
2017
. These increases were partially offset by a decrease in Cash and cash equivalents of $
10.4 million
.
|
December 31,
|
|||||||
|
In millions
|
2018
|
2017
|
|||||
|
Accounts payable
|
$
|
92.9
|
|
$
|
83.1
|
|
|
|
Accrued expenses
|
36.7
|
|
20.0
|
|
|||
|
Accrued payroll and employee benefits
|
42.0
|
|
39.2
|
|
|||
|
Current portion of long-term debt
|
11.2
|
|
9.4
|
|
|||
|
Income taxes payable
|
0.5
|
|
1.5
|
|
|||
|
Total current liabilities
|
$
|
183.3
|
|
$
|
153.2
|
|
|
Current liabilities as of
December 31, 2018
, increased by
$30.1 million
compared to December 31,
2017
, driven by increases in all of the categories displayed above, except for Income taxes payable. Increases in accounts payable and accrued expenses are consistent with the increases in inventory and prepaids noted above.
Cash flows provided by (used in) investing activities
The cash used in investing activities for the year ended
December 31, 2018
was primarily driven by the
$315.5 million
purchase of the Pine Chemical Business (see Note 17 to the Consolidated Financial Statements included within Part II. Item 8 of this Form 10-K for more information). The remaining cash used by investing activities was primarily driven by capital expenditures.
For the year ended
December 31, 2018
, capital spending included both growth and maintenance spending for expansion and specialized equipment at our Covington, Virginia, Waynesboro, Georgia, and Changshu, China facilities, as well as base maintenance spending to support ongoing operations across both segments. In addition, we expended funds for cost improvement related to CTO tanks at our DeRidder, Louisiana facility.
For the years ended December 31, 2017 and 2016, capital spending included base maintenance capital supporting ongoing operations and growth spending, primarily related to the construction of an activated carbon manufacturing facility in China and new Performance Chemicals derivative equipment in North Charleston, South Carolina supporting the adhesives, pavement and oilfield markets. For the year ended December 31, 2016, cash used in investing activities was primarily related to $69.7 million invested in a trust. In accordance with the Separation Agreements, we used a portion of the proceeds from our debt borrowing to be held in a restricted trust. The trust, presented as restricted investment on our consolidated balance sheet, was to secure the principal payment under our $80.0 million capital lease obligation which is payable upon maturity in 2027.
54
|
Capital expenditure categories
|
Years Ended December 31,
|
||||||||||
|
In millions
|
2018
|
2017
|
2016
|
||||||||
|
Maintenance
|
$
|
41.1
|
|
$
|
30.3
|
|
$
|
32.3
|
|
||
|
Safety, health and environment
|
9.6
|
|
8.2
|
|
7.4
|
|
|||||
|
Growth and cost improvement
|
43.2
|
|
14.1
|
|
17.0
|
|
|||||
|
Total capital expenditures
|
$
|
93.9
|
|
$
|
52.6
|
|
$
|
56.7
|
|
||
Cash flows provided by (used in) financing activities
Cash provided by financing activities for the year ended
December 31, 2018
was
$153.7 million
, and was driven by proceeds from long-term borrowings from the issuance of
$300.0 million
Senior Notes (refer to Note 10 to the Consolidated Financial Statements included within Part II. Item 8 of this Form 10-K for more information), offset by our purchase of the remaining portion of our joint venture with Purification Cellutions, LLC of
$80.0 million
(refer to Note 12 to the Consolidated Financial Statements included within Part II. Item 8 of this Form 10-K for more information),
$47.4 million
to repurchase shares according the publicly announced share repurchase program (also refer to Note 12 to the Consolidated Financial Statements included within Part II. Item 8 of this Form 10-K for more information), and noncontrolling interest distributions of
$15.3 million
.
Cash used by financing activities for the year ended December 31, 2017 was
$57.8 million
, and was driven by net repayments of
$111.9 million
(refer to Note 10 to the Consolidated Financial Statements included within Part II. Item 8 of this Form 10-K for more information on our Revolving Credit and Term Loan Facility Amendment), noncontrolling interest distributions of
$12.3 million
, and
$6.6 million
to repurchase shares according to the publicly announced share repurchase program.
Cash used by financing activities in the year ended December 31, 2016 was $3.4 million, and was driven by net borrowings of $402.5 million (refer to Note 9 in the Consolidated Financial Statements for more information) and an inflow from transactions with WestRock of $51.9 million offset by a distribution to WestRock at Separation of $448.5 million.
As WestRock managed the Company’s cash and financing arrangements before the Separation, all excess cash generated through earnings was remitted to WestRock and all sources of cash were funded by WestRock prior to May 15, 2016.
Off-Balance Sheet Arrangements
Ingevity is not a party to any off-balance sheet arrangements that have, or are reasonably likely to have, a current or future material effect on Ingevity's financial condition, results of operations or cash flows.
Contractual Obligations
We enter into various contractual obligations throughout the year. Presented below are the contractual obligations of Ingevity as of
December 31, 2018
, and the time period in which payments under the obligations are due. Included below are disclosures regarding the amounts due under purchase obligations. A purchase obligation is defined as an agreement to purchase goods or services that is enforceable and legally binding on Ingevity and that specifies all significant terms, including fixed or minimum quantities to be purchased; fixed, minimum or variable price provisions; and the approximate timing of the transaction. We have included in the below disclosure all normal and recurring purchase orders, take-or-pay contracts and supply arrangements as well as other purchase commitments that management believes meet the above definition of a purchase obligation. See Note 19 to the Consolidated Financial Statements included within Part II. Item 8 of this Form 10-K for more information.
55
|
Payments due in period
|
|||||||||||||||||||
|
In millions
|
Total at
December 31, 2018
|
2019
|
2020-2021
|
2022-2023
|
2024 and beyond
|
||||||||||||||
|
Contractual obligations
|
|||||||||||||||||||
|
Debt maturities
|
$
|
678.9
|
|
$
|
13.3
|
|
$
|
46.9
|
|
$
|
318.7
|
|
$
|
300.0
|
|
||||
|
Contractual interest
(1)
|
156.6
|
|
27.4
|
|
52.5
|
|
43.0
|
|
33.7
|
|
|||||||||
|
Capital lease obligations
(2)(3)
|
132.0
|
|
6.1
|
|
12.2
|
|
12.2
|
|
101.5
|
|
|||||||||
|
Operating lease obligations
(3)
|
74.0
|
|
21.9
|
|
30.5
|
|
15.7
|
|
5.9
|
|
|||||||||
|
Purchase obligations
|
166.4
|
|
166.1
|
|
0.3
|
|
—
|
|
—
|
|
|||||||||
|
Pending Acquisition
(4)
|
652.5
|
|
652.5
|
|
—
|
|
—
|
|
—
|
|
|||||||||
|
Total
|
$
|
1,860.4
|
|
$
|
887.3
|
|
$
|
142.4
|
|
$
|
389.6
|
|
$
|
441.1
|
|
||||
_______________
|
(1)
|
Contractual interest is the interest we are contracted to pay on our long-term debt obligations. We had
$375.0 million
of long-term debt subject to variable interest rates at December 31, 2018 and
$303.9 million
of debt subject to fixed interest rates. The rate assumed for the variable interest component of the contractual interest obligation was the rate in effect at December 31, 2018. Variable rates are determined by the market and will fluctuate over time.
|
|
(2)
|
Amounts include the interest payments under the capital lease as well as the principal payment due in 2027.
|
|
(3)
|
Capital and operating lease obligations are presented in accordance with ASC 840 "Leases". We adopted ASC 842 "Leases" effective January 1, 2019. See Note 4
to the Consolidated Financial Statements included within Part II. Item 8 of this Form 10-K for more information
on the adoption and the impact to our Consolidated Financial Statements.
|
|
(40
|
Amount includes the purchase price of the Caprolactone Acquisition, which closed on February 13, 2019. See Note 24
to the Consolidated Financial Statements included within Part II. Item 8 of this Form 10-K for more information
on the acquisition.
|
New Accounting Guidance
Refer to the Note 4 to the Consolidated Financial Statements included within Part II. Item 8 of this Form 10-K for a full description of recent accounting pronouncements including the respective expected dates of adoption and expected effects on our Consolidated Financial Statements.
Critical Accounting Policies
Our principal accounting policies are described in Note 3 to the Consolidated Financial Statements included within Part II. Item 8 of this Form 10-K. The preparation of financial statements in accordance with GAAP requires management to make estimates and assumptions that affect the reported amounts of some assets and liabilities and, in some instances, the reported amounts of revenues and expenses during the reporting period. Actual results could differ from these estimates. Management believes the accounting policies discussed below represent those accounting policies requiring the exercise of judgment where a different set of judgments could result in the greatest changes to reported results.
Revenue recognition
: Substantially all our revenue is recognized when products are shipped from our manufacturing and warehousing facilities, which represents the point at which control is transferred to the customer. For certain limited contracts, where we are producing goods with no alternative use and for which we have an enforceable right to payment for performance completed to date, we are recognizing revenue as goods are manufactured, rather than when they are shipped.
Sales net of returns and customer incentives are based on the sale of manufactured products. Net sales are recognized when obligations under the terms of a contract with our customer are satisfied; generally, this occurs with the transfer of control of our products. Since net sales are derived from product sales only, we have disaggregated our net sales by our product lines within each reportable segment. Net sales are measured as the amount of consideration we expect to receive in exchange for transferring goods. Sales, value add, and other taxes we collect concurrent with revenue-producing activities are excluded from revenue. Sales returns and allowances are not a normal practice in the industry and are not significant. Certain customers may receive cash-based incentives, including discounts and volume rebates, which are accounted for as variable consideration and included in Net sales. Shipping and handling fees billed to customers continue to be included with Net sales. If we pay for the freight and shipping, we recognize the cost when control of the product has transferred to the customer as an expense in Cost of sales on the consolidated statement of operations. Although very rare, from time to time we incur expenses to obtain a sales contract. In these cases, if these costs are for orders that are fulfilled in one year or less, we expense these costs as they are incurred. Because the period between when we
56
transfer a promised good to a customer and when the customer pays for that good will be one year or less, we elect not to adjust the promised amount of consideration for the effects of any financing component, as it is not significant.
Accounts receivable and allowance for doubtful accounts
: Accounts receivable, net on the consolidated balance sheets are comprised of trade receivable less allowances for doubtful accounts. Trade receivables consist of amounts owed to Ingevity from customer sales and are recorded at the invoiced amounts when revenue is recognized and generally do not bear interest. The allowance for doubtful accounts is our best estimate of the amount of probable loss in the existing accounts receivable. We determine the allowance based on historical write-off experience, current collection trends, and external business factors such as economic factors, including regional bankruptcy rates, and political factors. Past due balances over a specified amount are reviewed individually for collectability. Account balances are charged off against the allowance when it is probable that the receivable will not be recovered. Allowance for doubtful accounts at
December 31, 2018
and
2017
, were
$0.4 million
and
$0.4 million
, respectively.
Concentration of credit risk
: The financial instruments that potentially subject Ingevity to concentrations of credit risk are accounts receivable. We limit our credit risk by performing ongoing credit evaluations and, when necessary, requiring letters of credit, guarantees or collateral. We had accounts receivable from our largest customer of
$7.1 million
and
$16.4 million
as of
December 31, 2018
and
2017
, respectively. Sales to this customer, which are included in the Performance Chemicals segment, were
five percent
,
eight percent
, and
nine percent
of total net sales for the years ended
December 31, 2018
,
2017
and
2016
, respectively. No other customers individually accounted for greater than 10 percent of the Ingevity's consolidated net sales.
Impairment of long-lived assets
: We periodically evaluate whether current events or circumstances indicate that the carrying value of our long-lived assets, including intangible assets, to be held and used may not be recoverable. If such circumstances are determined to exist, an estimate of undiscounted future cash flows produced by the long-lived asset, or the appropriate grouping of assets, is compared to carrying value to determine whether impairment exists.
If an asset is determined to be impaired, the loss is measured based on quoted market prices in active markets, if available. If quoted market prices are not available, the estimate of fair value is based on various valuation techniques, including a discounted value of estimated future cash flows. We report an asset to be disposed of at the lower of its carrying value or its estimated net realizable value.
Income taxes
: The Company is subject to income taxes in the U.S. and numerous foreign jurisdictions, including China. The provision for income taxes includes income taxes paid, currently payable or receivable, and deferred taxes. We follow the liability method of accounting for income taxes in accordance with current accounting standards regarding the accounting for income taxes. Under this method, deferred income taxes are recorded based upon the differences between the financial reporting and tax bases of assets and liabilities and are measured using the enacted tax rates and laws in effect at the time the underlying assets or liabilities are recovered or settled. The ability to realize deferred tax assets is evaluated through the forecasting of taxable income, historical and projected future operating results, the reversal of existing temporary differences, and the availability of tax planning strategies. Valuation allowances are recognized to reduce deferred tax assets when it is more likely than not that a tax benefit will not be realized. We do not provide income taxes on undistributed earnings of consolidated foreign subsidiaries as it is our intention that such earnings will remain invested in those companies. Please see Note 18 to the Consolidated Financial Statements included within Part II. Item 8 of this Form 10-K for more information.
The Company recognizes income tax positions that are more likely than not to be realized and accrues interest related to unrecognized income tax positions, which is included as a component of the income tax provision on the Consolidated Statements of Operations.
ITEM 7A. QUANTITATIVE AND QUALITATIVE DISCLOSURES ABOUT MARKET RISK
Foreign currency
We have foreign-based operations, primarily in Europe, South America and Asia, which accounted for approximately
10 percent
of our net sales in
2018
. Ingevity's significant operations outside the U.S. have designated the local currency as their functional currency. The primary currencies for which we have exchange rate exposure are the U.S. dollar versus the euro, the Japanese yen and the Chinese renminbi. In addition, certain of our domestic operations have sales to foreign customers. In the conduct of our foreign operations, we also make inter-company sales. All of this exposes us to the effect of changes in foreign currency exchange rates. Our earnings are therefore subject to change due to fluctuations in foreign currency exchange rates when the earnings in foreign currencies are translated into U.S. dollars. During 2017, we began hedging this foreign currency exchange rate risk. Foreign exchange forward contracts are used to hedge firm and highly anticipated foreign currency cash flows. The U.S.
57
dollar versus the euro is our most significant foreign currency exposure. A hypothetical 10 percent change in the average euro to U.S. dollar exchange rate during the year ended
December 31, 2018
, would have changed our net sales and income before income taxes by approximately $8 million or one percent and $5 million or two percent, respectively.
Concentration of credit risk
Concentration of credit risk
: The financial instruments that potentially subject Ingevity to concentrations of credit risk are accounts receivable. We limit our credit risk by performing ongoing credit evaluations and, when necessary, requiring letters of credit, guarantees or collateral. We had accounts receivable from our largest customer of
$7.1 million
and
$16.4 million
as of
December 31, 2018
and
2017
, respectively. Sales to this customer, which are included in the Performance Chemicals segment, were
five percent
,
eight percent
, and
nine percent
of total net sales for the years ended
December 31, 2018
,
2017
and
2016
, respectively. No other customers individually accounted for greater than 10 percent of the Ingevity's consolidated net sales.
Commodity price risk
A portion of our manufacturing costs include purchased raw materials, which are commodities whose prices fluctuate as market supply and demand fundamentals change. Accordingly, product margins and the level of our profitability tend to fluctuate with the changes in these commodity prices. The cost of energy is a manufacturing cost that is exposed to commodity pricing. Our energy costs are diversified among electricity, steam and natural gas, with natural gas comprising our largest energy input.
Crude tall oil price risk
Our results of operations are directly affected by the cost of our raw materials, particularly CTO, which is approximately
12 percent
of all of our cost of sales and
34 percent
of our raw materials purchases for the year ended December 31,
2018
. Pricing for CTO is subject to particular pricing pressures by reasons of the limited supply elasticity of the product and competing demands for its use, both of which drive pressure on price. Our gross profit and margins could be adversely affected by changes in the cost of CTO if we are unable to pass the increases on to our customers. CTO is a thinly traded commodity with pricing commonly established for periods ranging from one quarter to one year periods of time. We try to protect against such pricing fluctuations through various business strategies. Based on average pricing during the year ended December 31,
2018
, a hypothetical unhedged, unfavorable 10 percent change in the market price for CTO would have resulted in additional costs of sales of approximately
$8 million
or
one percent
, which we may or may not have been able to pass on to our customers.
Natural gas price risk
Natural gas is our largest form of energy purchases constituting approximately two percent of our cost of goods sold for the year ended
December 31, 2018
. Increases in natural gas costs, unless passed on to our customers, would adversely affect our results of operations. If natural gas prices increase significantly, our business or results of operations may be adversely affected. In December 2017, we entered into certain derivative financial instruments in order to mitigate expected fluctuations in market prices and the volatility to earnings and cash flow resulting from changes to pricing of natural gas purchases. Refer to the Note 5 to the Consolidated Financial Statements included within Part II. Item 8 of this Form 10-K for more information on our natural gas price risk hedging program. For the year ended
December 31, 2018
, a hypothetical, unhedged 10 percent increase in natural gas pricing would have resulted in an increase to cost of sales of approximately
$1.7 million
. As of
December 31, 2018
, we had
1.8 million
and
1.4 million
mmBTUS (millions of British Thermal Units) in aggregate notional volume of outstanding natural gas commodity swap contracts and zero cost collar option contracts, respectively, designated as cash flow hedges. As of
December 31, 2018
, open commodity contracts hedge forecasted transactions until May 2020. The fair value of the outstanding designated natural gas commodity hedge contracts as of
December 31, 2018
was
$0.1 million
.
Interest Rate Risk
As of
December 31, 2018
, approximately
$375 million
of our borrowings include a variable interest rate component. As a result, we are subject to interest rate risk with respect to such floating-rate debt. A 100 basis point increase in the variable interest rate component of our borrowings would increase our annual interest expense by approximately
$4 million
or
11 percent
.
58
ITEM 8. FINANCIAL STATEMENTS AND SUPPLEMENTARY DATA
INDEX TO THE FINANCIAL STATEMENTS
|
Description
|
Page No.
|
||
59
Ingevity Corporation
Management's Report on Internal Control over Financial Reporting
Management is responsible for establishing and maintaining adequate internal control over financial reporting as defined in Rules 13a-15(f) and 15d-15(f) under the Securities Exchange Act of 1934. The Company's internal control over financial reporting is a process designed to provide reasonable assurance regarding the reliability of financial reporting and the preparation of financial statements for external purposes in accordance with GAAP. The Company's internal control over financial reporting includes those policies and procedures that:
|
i.
|
pertain to the maintenance of records that, in reasonable detail, accurately and fairly reflect the transactions and dispositions of the assets of the Company;
|
|
ii.
|
provide reasonable assurance that transactions are recorded as necessary to permit preparation of financial statements in accordance with generally accepted accounting principles and that receipts and expenditures of the Company are being made only in accordance with authorization of management and directors of the Company; and
|
|
iii.
|
provide reasonable assurance regarding prevention or timely detection of unauthorized acquisitions, use or disposition of the Company's assets that could have a material effect on the financial statements.
|
Because of its inherent limitations, internal control over financial reporting may not prevent or detect misstatements. Also, projections of any evaluation of effectiveness to future periods are subject to the risk that controls may become inadequate because of changes in conditions, or that the degree of compliance with the policies or procedures may deteriorate.
Management assessed the effectiveness of the Company's internal control over financial reporting as of
December 31, 2018
, based on criteria set forth by the Committee of Sponsoring Organizations of the Treadway Commission (COSO) in
Internal Control-Integrated Framework
(2013). Based on its assessment and those criteria, management concluded that the Company maintained effective internal control over financial reporting as of
December 31, 2018
. Our assessment of the effectiveness of internal control over financial reporting as of
December 31, 2018
did not include the internal controls at our Ingevity Arkansas, LLC legal entity, as permitted by Securities and Exchange Commission guidelines that allow companies to exclude certain acquisitions from their assessment of internal control over financial reporting during the first year following an acquisition. Ingevity Arkansas, LLC is the legal entity that owns the net assets acquired in the Pine Chemicals Acquisition. We acquired these assets on March 8, 2018 and they represented 22 percent and zero percent of Ingevity's consolidated total assets and consolidated revenues as of and for the year ended December 31, 2018.
PricewaterhouseCoopers LLP, an independent registered public accounting firm, has audited the effectiveness of the Company's internal control over financial reporting as of
December 31, 2018
, as stated in their report, which is presented on the following page.
|
Date:
|
February 20, 2019
|
||
|
By:
|
/S/ D. MICHAEL WILSON
|
/S/ JOHN C. FORTSON
|
|
|
D. Michael Wilson
|
John C. Fortson
|
||
|
President and Chief Executive Officer
|
Executive Vice President and Chief Financial Officer
|
||
60
Report of Independent Registered Public Accounting Firm
To the
Board of Directors and Stockholders of Ingevity Corporation
Opinions on the Financial Statements and Internal Control over Financial Reporting
We have audited the accompanying consolidated balance sheets of Ingevity Corporation and its subsidiaries (the “Company”) as of December 31, 2018 and December 31, 2017, and the related consolidated statements of operations, comprehensive income, stockholders’ equity and cash flows for each of the three years in the period ended
December 31, 2018, including the related notes and financial statement schedule listed in the index appearing under Item 15(a)2 (collectively referred to as the “consolidated financial statements”). We also have audited the Company's internal control over financial reporting as of December 31, 2018 based on criteria established in
Internal Control - Integrated Framework
(2013) issued by the Committee of Sponsoring Organizations of the Treadway Commission (COSO).
In our opinion, the consolidated financial statements referred to above present fairly, in all material respects, the financial position of the Company as of December 31, 2018 and December 31, 2017 and the results of its operations and its cash flows for each of the three years in the period ended December 31, 2018 in conformity with accounting principles generally accepted in the United States of America. Also in our opinion, the Company maintained, in all material respects, effective internal control over financial reporting as of December 31, 2018 based on criteria established in
Internal Control - Integrated Framework
(2013) issued by the COSO.
Change in Accounting Principle
As discussed in Note 4 and Note 5 to the consolidated financial statements, the Company changed the manner in which it accounts for revenues from contracts with customers in 2018.
Basis for Opinions
The Company's management is responsible for these consolidated financial statements, for maintaining effective internal control over financial reporting, and for its assessment of the effectiveness of internal control over financial reporting, included in the accompanying Management’s Report on Internal Control over Financial Reporting. Our responsibility is to express opinions on the Company’s consolidated
financial statements and on the Company's internal control over financial reporting based on our audits. We are a public accounting firm registered with the Public Company Accounting Oversight Board (United States) (“PCAOB”) and are required to be independent with respect to the Company in accordance with the U.S. federal securities laws and the applicable rules and regulations of the Securities and Exchange Commission and the PCAOB.
We conducted our audits in accordance with the standards of the PCAOB. Those standards require that we plan and perform the audits to obtain reasonable assurance about whether the consolidated financial statements are free of material misstatement, whether due to error or fraud, and whether effective internal control over financial reporting was maintained in all material respects.
Our audits of the consolidated
financial statements included performing procedures to assess the risks of material misstatement of the consolidated
financial statements, whether due to error or fraud, and performing procedures that respond to those risks. Such procedures included examining, on a test basis, evidence regarding the amounts and disclosures in the consolidated
financial statements. Our audits also included evaluating the accounting principles used and significant estimates made by management, as well as evaluating the overall presentation of the consolidated
financial statements. Our audit of internal control over financial reporting included obtaining an understanding of internal control over financial reporting, assessing the risk that a material weakness exists, and testing and evaluating the design and operating effectiveness of internal control based on the assessed risk. Our audits also included performing such other procedures as we considered necessary in the circumstances. We believe that our audits provide a reasonable basis for our opinions.
As described in Management’s Report on Internal Control over Financial Reporting, management has excluded the Georgia-Pacific pine chemicals business from its assessment of internal control over financial reporting as of December 31, 2018 because they were acquired by the Company in a purchase business combination during 2018. We have also excluded the Georgia-Pacific pine chemicals business from our audit of internal control over financial reporting. The Georgia-Pacific pine chemicals business (Ingevity Arkansas, LLC) is a wholly-owned subsidiary whose total assets and total revenues excluded from management’s assessment and our audit of internal control over financial reporting represent 22 percent and zero percent, respectively, of the related consolidated financial statement amounts as of and for the year ended December 31, 2018.
61
Definition and Limitations of Internal Control over Financial Reporting
A company’s internal control over financial reporting is a process designed to provide reasonable assurance regarding the reliability of financial reporting and the preparation of financial statements for external purposes in accordance with generally accepted accounting principles. A company’s internal control over financial reporting includes those policies and procedures that (i) pertain to the maintenance of records that, in reasonable detail, accurately and fairly reflect the transactions and dispositions of the assets of the company; (ii) provide reasonable assurance that transactions are recorded as necessary to permit preparation of financial statements in accordance with generally accepted accounting principles, and that receipts and expenditures of the company are being made only in accordance with authorizations of management and directors of the company; and (iii) provide reasonable assurance regarding prevention or timely detection of unauthorized acquisition, use, or disposition of the company’s assets that could have a material effect on the financial statements.
Because of its inherent limitations, internal control over financial reporting may not prevent or detect misstatements. Also, projections of any evaluation of effectiveness to future periods are subject to the risk that controls may become inadequate because of changes in conditions, or that the degree of compliance with the policies or procedures may deteriorate.
/s/ PricewaterhouseCoopers LLP
Charlotte, North Carolina
February 20, 2019
We have served as the Company’s auditor since 2015.
62
INGEVITY CORPORATION
Consolidated Statements of Operations
|
Years Ended December 31,
|
|||||||||||
|
In millions, except per share data
|
2018
|
2017
|
2016
|
||||||||
|
Net sales
|
$
|
1,133.6
|
|
$
|
972.4
|
|
$
|
908.3
|
|
||
|
Cost of sales
|
716.8
|
|
643.4
|
|
633.9
|
|
|||||
|
Gross profit
|
416.8
|
|
329.0
|
|
274.4
|
|
|||||
|
Selling, general and administrative expenses
|
132.4
|
|
106.4
|
|
96.4
|
|
|||||
|
Research and technical expenses
|
21.5
|
|
19.8
|
|
17.6
|
|
|||||
|
Separation costs
|
—
|
|
0.9
|
|
17.5
|
|
|||||
|
Restructuring and other (income) charges, net
|
(0.5
|
)
|
3.7
|
|
41.2
|
|
|||||
|
Acquisition-related costs
|
10.8
|
|
7.1
|
|
—
|
|
|||||
|
Other (income) expense, net
|
1.0
|
|
0.5
|
|
(3.2
|
)
|
|||||
|
Interest expense
|
33.2
|
|
18.1
|
|
19.3
|
|
|||||
|
Interest income
|
(3.4
|
)
|
(2.3
|
)
|
(1.4
|
)
|
|||||
|
Income (loss) before income taxes
|
221.8
|
|
174.8
|
|
87.0
|
|
|||||
|
Provision (benefit) for income taxes
|
40.0
|
|
29.6
|
|
42.6
|
|
|||||
|
Net income (loss)
|
181.8
|
|
145.2
|
|
44.4
|
|
|||||
|
Less: Net income (loss) attributable to noncontrolling interests
|
12.7
|
|
18.7
|
|
9.2
|
|
|||||
|
Net income (loss) attributable to Ingevity stockholders
|
$
|
169.1
|
|
$
|
126.5
|
|
$
|
35.2
|
|
||
|
Per share data
|
|||||||||||
|
Basic earnings (loss) per share attributable to Ingevity stockholders
|
$
|
4.02
|
|
$
|
3.00
|
|
$
|
0.83
|
|
||
|
Diluted earnings (loss) per share attributable to Ingevity stockholders
|
$
|
3.97
|
|
$
|
2.97
|
|
$
|
0.83
|
|
||
The accompanying notes are an integral part of these financial statements.
63
INGEVITY CORPORATION
Consolidated Statements of Comprehensive Income (Loss)
|
Years Ended December 31,
|
|||||||||||
|
In millions
|
2018
|
2017
|
2016
|
||||||||
|
Net income (loss)
|
$
|
181.8
|
|
$
|
145.2
|
|
$
|
44.4
|
|
||
|
Other comprehensive income (loss), net of tax:
|
|||||||||||
|
Foreign currency translation adjustment
|
(6.3
|
)
|
8.3
|
|
(2.9
|
)
|
|||||
|
Derivative instruments:
|
|||||||||||
|
Unrealized gain (loss), net of tax provision (benefit) of $0.4, zero, and zero
|
1.3
|
|
(0.1
|
)
|
—
|
|
|||||
|
Reclassifications of deferred derivative instruments (gain) loss, included in net income (loss), net of tax (provision) benefit of ($0.3), zero, and $0.6
|
(0.9
|
)
|
0.1
|
|
1.0
|
|
|||||
|
Total derivative instruments, net of tax provision (benefit) of $0.1, zero, and ($0.6)
|
0.4
|
|
—
|
|
1.0
|
|
|||||
|
Pension & other postretirement benefits
|
|||||||||||
|
Unrealized actuarial gains (losses) and prior service (costs) credits, net of tax provision (benefit) of $(0.1), $0.4, and $0.3
|
(0.3
|
)
|
(0.7
|
)
|
(0.6
|
)
|
|||||
|
Reclassification included in net income (loss):
|
|||||||||||
|
Reclassifications of net actuarial and other (gain) loss, amortization of prior service cost, and settlement and curtailment (income) charges, included in net income, net of tax (provision) benefit of ($0.1), zero, and zero
|
0.2
|
|
—
|
|
—
|
|
|||||
|
Total pension and other postretirement benefits, net of tax provision (benefit) of zero, $0.4, and $0.3
|
(0.1
|
)
|
(0.7
|
)
|
(0.6
|
)
|
|||||
|
Other comprehensive income (loss), net of tax provision (benefit) of $0.1, $0.4, and ($0.3)
|
(6.0
|
)
|
7.6
|
|
(2.5
|
)
|
|||||
|
Comprehensive income (loss)
|
175.8
|
|
152.8
|
|
41.9
|
|
|||||
|
Less: Comprehensive income (loss) attributable to noncontrolling interests
|
12.7
|
|
18.7
|
|
9.2
|
|
|||||
|
Comprehensive income (loss) attributable to the Ingevity stockholders
|
$
|
163.1
|
|
$
|
134.1
|
|
$
|
32.7
|
|
||
The accompanying notes are an integral part of these financial statements.
64
INGEVITY CORPORATION
Consolidated Balance Sheets
|
December 31,
|
|||||||
|
In millions, except share and par value data
|
2018
|
2017
|
|||||
|
Assets
|
|||||||
|
Cash and cash equivalents
|
$
|
77.5
|
|
$
|
87.9
|
|
|
|
Accounts receivable, net of allowance of $0.4 at 2018 and $0.4 at 2017
|
118.9
|
|
100.0
|
|
|||
|
Inventories, net
|
191.4
|
|
160.0
|
|
|||
|
Prepaid and other current assets
|
34.9
|
|
20.8
|
|
|||
|
Current assets
|
422.7
|
|
368.7
|
|
|||
|
Property, plant and equipment, net
|
523.8
|
|
438.5
|
|
|||
|
Goodwill
|
130.7
|
|
12.4
|
|
|||
|
Other intangibles, net
|
125.6
|
|
4.9
|
|
|||
|
Deferred income taxes
|
2.9
|
|
3.4
|
|
|||
|
Restricted investment
|
71.2
|
|
71.3
|
|
|||
|
Other assets
|
38.3
|
|
30.4
|
|
|||
|
Total Assets
|
$
|
1,315.2
|
|
$
|
929.6
|
|
|
|
Liabilities
|
|||||||
|
Accounts payable
|
$
|
92.9
|
|
$
|
83.1
|
|
|
|
Accrued expenses
|
36.7
|
|
20.0
|
|
|||
|
Accrued payroll and employee benefits
|
42.0
|
|
39.2
|
|
|||
|
Current maturities of long-term debt
|
11.2
|
|
9.4
|
|
|||
|
Income taxes payable
|
0.5
|
|
1.5
|
|
|||
|
Current liabilities
|
183.3
|
|
153.2
|
|
|||
|
Long-term debt including capital lease obligations
|
741.2
|
|
444.0
|
|
|||
|
Deferred income taxes
|
36.9
|
|
41.3
|
|
|||
|
Other liabilities
|
15.1
|
|
13.2
|
|
|||
|
Total Liabilities
|
976.5
|
|
651.7
|
|
|||
|
Commitments and contingencies
(Note 19)
|
|
|
|
|
|||
|
Equity
|
|||||||
|
Preferred stock
(par value $0.01 per share; 50,000,000 shares authorized;
zero issued and outstanding at 2018 and 2017) |
—
|
|
—
|
|
|||
|
Common stock
(par value $0.01 per share; 300,000,000 shares authorized;
42,331,913 and 42,208,973 issued and 41,693,261 and 42,089,103 outstanding at 2018 and 2017, respectively) |
0.4
|
|
0.4
|
|
|||
|
Additional paid-in capital
|
98.3
|
|
140.1
|
|
|||
|
Retained earnings
|
313.5
|
|
142.8
|
|
|||
|
Accumulated other comprehensive (income) loss
|
(17.7
|
)
|
(11.7
|
)
|
|||
|
Treasury stock, common stock, at cost
(638,652 and 119,870 shares at 2018 and 2017, respectively)
|
(55.8
|
)
|
(7.7
|
)
|
|||
|
Total Ingevity stockholders' equity
|
338.7
|
|
263.9
|
|
|||
|
Noncontrolling interests
|
—
|
|
14.0
|
|
|||
|
Total Equity
|
338.7
|
|
277.9
|
|
|||
|
Total Liabilities and Equity
|
$
|
1,315.2
|
|
$
|
929.6
|
|
|
The accompanying notes are an integral part of these financial statements.
65
INGEVITY CORPORATION
Consolidated Statements of Stockholders' Equity
|
Ingevity Stockholders'
|
||||||||||||||||||||||||||||||||||
|
Common Stock
|
||||||||||||||||||||||||||||||||||
|
In millions, shares in thousands
|
Shares
|
Amount
|
Net parent
investment
|
Additional paid-in capital
|
Retained earnings
|
Accumulated other comprehensive income (loss)
|
Treasury stock
|
Noncontrolling interests
|
Total Equity
|
|||||||||||||||||||||||||
|
Balance at December 31, 2015
|
—
|
|
$
|
—
|
|
$
|
530.1
|
|
$
|
—
|
|
$
|
—
|
|
$
|
(16.5
|
)
|
$
|
—
|
|
$
|
3.8
|
|
$
|
517.4
|
|
||||||||
|
Net income (loss)
|
—
|
|
—
|
|
19.2
|
|
—
|
|
16.0
|
|
—
|
|
—
|
|
9.2
|
|
44.4
|
|
||||||||||||||||
|
Other comprehensive income (loss)
|
—
|
|
—
|
|
—
|
|
—
|
|
—
|
|
(2.5
|
)
|
—
|
|
—
|
|
(2.5
|
)
|
||||||||||||||||
|
Issuance of common stock at separation
|
42,101.6
|
|
0.4
|
|
—
|
|
(0.4
|
)
|
—
|
|
—
|
|
—
|
|
—
|
|
—
|
|
||||||||||||||||
|
Common stock issued
|
14.8
|
|
—
|
|
—
|
|
—
|
|
—
|
|
—
|
|
—
|
|
—
|
|
—
|
|
||||||||||||||||
|
Tax payments related to vested restricted stock units
|
—
|
|
—
|
|
—
|
|
—
|
|
—
|
|
—
|
|
(0.3
|
)
|
—
|
|
(0.3
|
)
|
||||||||||||||||
|
Cash distributed to WestRock at separation
|
—
|
|
—
|
|
(448.5
|
)
|
—
|
|
—
|
|
—
|
|
—
|
|
—
|
|
(448.5
|
)
|
||||||||||||||||
|
Net transfers to parent
|
—
|
|
—
|
|
24.8
|
|
—
|
|
—
|
|
—
|
|
—
|
|
—
|
|
24.8
|
|
||||||||||||||||
|
Reclassifications from net parent investment to additional paid in capital
|
—
|
|
—
|
|
(125.6
|
)
|
125.6
|
|
—
|
|
—
|
|
—
|
|
—
|
|
—
|
|
||||||||||||||||
|
Noncontrolling interest distributions
|
—
|
|
—
|
|
—
|
|
—
|
|
—
|
|
—
|
|
—
|
|
(5.4
|
)
|
(5.4
|
)
|
||||||||||||||||
|
Share-based compensation plans
|
—
|
|
—
|
|
—
|
|
4.7
|
|
—
|
|
—
|
|
—
|
|
—
|
|
4.7
|
|
||||||||||||||||
|
Balance at December 31, 2016
|
42,116.4
|
|
$
|
0.4
|
|
$
|
—
|
|
$
|
129.9
|
|
$
|
16.0
|
|
$
|
(19.0
|
)
|
$
|
(0.3
|
)
|
$
|
7.6
|
|
$
|
134.6
|
|
||||||||
|
Net income (loss)
|
—
|
|
—
|
|
—
|
|
—
|
|
126.5
|
|
—
|
|
—
|
|
18.7
|
|
145.2
|
|
||||||||||||||||
|
Other comprehensive income (loss)
|
—
|
|
—
|
|
—
|
|
—
|
|
—
|
|
7.6
|
|
—
|
|
—
|
|
7.6
|
|
||||||||||||||||
|
Common stock issued
|
85.9
|
|
—
|
|
—
|
|
—
|
|
—
|
|
—
|
|
—
|
|
—
|
|
—
|
|
||||||||||||||||
|
Exercise of stock options, net
|
6.6
|
|
—
|
|
—
|
|
0.2
|
|
—
|
|
—
|
|
—
|
|
—
|
|
0.2
|
|
||||||||||||||||
|
Tax payments related to vested restricted stock units
|
—
|
|
—
|
|
—
|
|
—
|
|
—
|
|
—
|
|
(1.2
|
)
|
—
|
|
(1.2
|
)
|
||||||||||||||||
|
Share repurchase program
|
—
|
|
—
|
|
—
|
|
—
|
|
—
|
|
—
|
|
(6.6
|
)
|
—
|
|
(6.6
|
)
|
||||||||||||||||
|
Noncontrolling interest distributions
|
—
|
|
—
|
|
—
|
|
—
|
|
—
|
|
—
|
|
—
|
|
(12.3
|
)
|
(12.3
|
)
|
||||||||||||||||
|
Share-based compensation plans
|
—
|
|
—
|
|
—
|
|
10.0
|
|
—
|
|
—
|
|
0.4
|
|
—
|
|
10.4
|
|
||||||||||||||||
|
Reclassification of certain deferred tax effects
|
—
|
|
—
|
|
—
|
|
—
|
|
0.3
|
|
(0.3
|
)
|
—
|
|
—
|
|
—
|
|
||||||||||||||||
|
Balance at December 31, 2017
|
42,208.9
|
|
$
|
0.4
|
|
$
|
—
|
|
$
|
140.1
|
|
$
|
142.8
|
|
$
|
(11.7
|
)
|
$
|
(7.7
|
)
|
$
|
14.0
|
|
$
|
277.9
|
|
||||||||
|
Net income (loss)
|
—
|
|
—
|
|
—
|
|
—
|
|
169.1
|
|
—
|
|
—
|
|
12.7
|
|
181.8
|
|
||||||||||||||||
|
Other comprehensive income (loss)
|
—
|
|
—
|
|
—
|
|
—
|
|
—
|
|
(6.0
|
)
|
—
|
|
—
|
|
(6.0
|
)
|
||||||||||||||||
|
Common stock issued
|
116.7
|
|
—
|
|
—
|
|
—
|
|
—
|
|
—
|
|
—
|
|
—
|
|
—
|
|
||||||||||||||||
|
Exercise of stock options, net
|
6.3
|
|
—
|
|
—
|
|
0.2
|
|
—
|
|
—
|
|
—
|
|
—
|
|
0.2
|
|
||||||||||||||||
|
Tax payments related to vested restricted stock units
|
—
|
|
—
|
|
—
|
|
—
|
|
—
|
|
—
|
|
(2.5
|
)
|
—
|
|
(2.5
|
)
|
||||||||||||||||
|
Share repurchase program
|
—
|
|
—
|
|
—
|
|
—
|
|
—
|
|
—
|
|
(47.4
|
)
|
—
|
|
(47.4
|
)
|
||||||||||||||||
|
Noncontrolling interest distributions
|
—
|
|
—
|
|
—
|
|
—
|
|
—
|
|
—
|
|
—
|
|
(15.3
|
)
|
(15.3
|
)
|
||||||||||||||||
|
Share-based compensation plans
|
—
|
|
—
|
|
—
|
|
12.3
|
|
—
|
|
—
|
|
1.8
|
|
—
|
|
14.1
|
|
||||||||||||||||
|
Adoption of accounting standard
|
—
|
|
—
|
|
—
|
|
—
|
|
1.6
|
|
—
|
|
—
|
|
—
|
|
1.6
|
|
||||||||||||||||
|
Acquisition of noncontrolling interest
|
—
|
|
—
|
|
—
|
|
(54.3
|
)
|
—
|
|
—
|
|
—
|
|
(11.4
|
)
|
(65.7
|
)
|
||||||||||||||||
|
Balance at December 31, 2018
|
42,331.9
|
|
$
|
0.4
|
|
$
|
—
|
|
$
|
98.3
|
|
$
|
313.5
|
|
$
|
(17.7
|
)
|
$
|
(55.8
|
)
|
$
|
—
|
|
$
|
338.7
|
|
||||||||
The accompanying notes are an integral part of these financial statements.
66
INGEVITY CORPORATION
Consolidated Statements of Cash Flows
|
Years Ended December 31,
|
|||||||||||
|
In millions
|
2018
|
2017
|
2016
|
||||||||
|
Cash provided by (used in) operating activities:
|
|||||||||||
|
Net income (loss)
|
$
|
181.8
|
|
$
|
145.2
|
|
$
|
44.4
|
|
||
|
Adjustments to reconcile net income (loss) to cash provided by operating activities:
|
|||||||||||
|
Depreciation and amortization
|
57.0
|
|
40.4
|
|
38.8
|
|
|||||
|
Deferred income taxes
|
0.9
|
|
(25.7
|
)
|
(7.9
|
)
|
|||||
|
Disposal/impairment of assets
|
0.9
|
|
2.2
|
|
1.5
|
|
|||||
|
Restructuring and other (income) charges, net
|
(0.5
|
)
|
3.7
|
|
41.2
|
|
|||||
|
Share-based compensation
|
12.5
|
|
10.1
|
|
4.7
|
|
|||||
|
Pension and other postretirement benefit costs
|
2.0
|
|
1.3
|
|
0.7
|
|
|||||
|
Other non-cash items
|
15.9
|
|
7.3
|
|
4.8
|
|
|||||
|
Changes in operating assets and liabilities:
|
|||||||||||
|
Accounts receivable, net
|
(3.0
|
)
|
(9.5
|
)
|
5.7
|
|
|||||
|
Inventories, net
|
(26.9
|
)
|
(6.6
|
)
|
(2.2
|
)
|
|||||
|
Prepaid and other current assets
|
(6.8
|
)
|
6.5
|
|
(3.9
|
)
|
|||||
|
Planned major maintenance outage
|
(7.0
|
)
|
(6.1
|
)
|
(5.9
|
)
|
|||||
|
Accounts payable
|
5.7
|
|
1.7
|
|
(1.5
|
)
|
|||||
|
Accrued expenses
|
13.1
|
|
1.6
|
|
(1.9
|
)
|
|||||
|
Accrued payroll and employee benefit costs
|
3.0
|
|
13.4
|
|
15.0
|
|
|||||
|
Income taxes
|
5.0
|
|
(7.3
|
)
|
4.5
|
|
|||||
|
Pension contribution
|
(1.6
|
)
|
(1.4
|
)
|
(1.0
|
)
|
|||||
|
Restructuring and other spending
|
(0.2
|
)
|
(5.5
|
)
|
(8.3
|
)
|
|||||
|
Changes in all other operating assets and liabilities, net
|
0.2
|
|
3.0
|
|
(0.8
|
)
|
|||||
|
Net cash provided by (used in) operating activities
|
$
|
252.0
|
|
$
|
174.3
|
|
$
|
127.9
|
|
||
|
Cash provided by (used in) investing activities:
|
|||||||||||
|
Capital expenditures
|
(93.9
|
)
|
(52.6
|
)
|
(56.7
|
)
|
|||||
|
Payments for acquired businesses, net of cash acquired
|
(315.5
|
)
|
—
|
|
—
|
|
|||||
|
Proceeds from disposition of assets
|
0.6
|
|
—
|
|
—
|
|
|||||
|
Purchase of equity securities
|
—
|
|
(2.4
|
)
|
—
|
|
|||||
|
Sale of equity securities
|
1.1
|
|
1.0
|
|
—
|
|
|||||
|
Restricted investment
|
(2.0
|
)
|
(1.6
|
)
|
(69.7
|
)
|
|||||
|
Other investing activities, net
|
(4.7
|
)
|
(3.0
|
)
|
—
|
|
|||||
|
Net cash provided by (used in) investing activities
|
$
|
(414.4
|
)
|
$
|
(58.6
|
)
|
$
|
(126.4
|
)
|
||
The accompanying notes are an integral part of these financial statements.
67
INGEVITY CORPORATION
Consolidated Statements of Cash Flows (continued)
|
Years Ended December 31,
|
|||||||||||
|
In millions
|
2018
|
2017
|
2016
|
||||||||
|
Cash provided by (used in) financing activities:
|
|||||||||||
|
Net borrowings under our revolving credit facility
|
—
|
|
(111.9
|
)
|
111.9
|
|
|||||
|
Proceeds from long-term borrowings
|
300.0
|
|
75.0
|
|
300.0
|
|
|||||
|
Debt issuance costs
|
(7.1
|
)
|
(1.3
|
)
|
(3.6
|
)
|
|||||
|
Borrowings (repayments) of notes payable and other short-term borrowings, net
|
3.9
|
|
—
|
|
(9.4
|
)
|
|||||
|
Tax payments related to withholdings on vested restricted stock units
|
(2.5
|
)
|
(1.2
|
)
|
(0.3
|
)
|
|||||
|
Proceeds and withholdings from share-based compensation plans, net
|
2.1
|
|
0.5
|
|
—
|
|
|||||
|
Repurchases of common stock under publicly announced plan
|
(47.4
|
)
|
(6.6
|
)
|
—
|
|
|||||
|
Acquisition of noncontrolling interest
|
(80.0
|
)
|
—
|
|
—
|
|
|||||
|
Noncontrolling interest distributions
|
(15.3
|
)
|
(12.3
|
)
|
(5.4
|
)
|
|||||
|
Cash distributed to WestRock at separation
|
—
|
|
—
|
|
(448.5
|
)
|
|||||
|
Transactions with WestRock, net
|
—
|
|
—
|
|
51.9
|
|
|||||
|
Other financing activities, net
|
$
|
—
|
|
$
|
—
|
|
$
|
—
|
|
||
|
Net cash provided by (used in) financing activities
|
$
|
153.7
|
|
$
|
(57.8
|
)
|
$
|
(3.4
|
)
|
||
|
Increase (decrease) in cash, cash equivalents, and restricted cash
|
(8.7
|
)
|
57.9
|
|
(1.9
|
)
|
|||||
|
Effect of exchange rate changes on cash
|
(1.4
|
)
|
(0.5
|
)
|
0.4
|
|
|||||
|
Change in cash, cash equivalents, and restricted cash
|
(10.1
|
)
|
57.4
|
|
(1.5
|
)
|
|||||
|
Cash, cash equivalents, and restricted cash at beginning of period
(1)
|
87.9
|
|
30.5
|
|
32.0
|
|
|||||
|
Cash, cash equivalents, and restricted cash at end of period
(1)
|
$
|
77.8
|
|
$
|
87.9
|
|
$
|
30.5
|
|
||
|
_______________
|
|||||||||||
|
(1) Includes restricted cash of $0.3 million, zero, and zero and cash and cash equivalents of $77.5 million, $87.9 million, and $30.5 million for the periods ended December 31, 2018, 2017, and 2016, respectively. Restricted cash is included within "Prepaid and Other Current Assets" within the onsolidated balance sheets.
|
|||||||||||
|
Supplemental cash flow information:
|
|||||||||||
|
Cash paid for interest, net of capitalized interest
|
$
|
26.0
|
|
$
|
16.0
|
|
$
|
15.1
|
|
||
|
Cash paid for income taxes, net of refunds
|
$
|
34.8
|
|
$
|
61.9
|
|
$
|
22.4
|
|
||
|
Purchases of property, plant and equipment in accounts payable
|
$
|
8.9
|
|
$
|
5.1
|
|
$
|
3.7
|
|
||
The accompanying notes are an integral part of these financial statements.
68
Ingevity Corporation
Notes to the Consolidated Financial Statements
December 31, 2018
|
INDEX
|
|||
|
Note
|
Page No.
|
||
|
1
|
|||
|
2
|
|||
|
3
|
|||
|
4
|
|||
|
5
|
|||
|
6
|
|||
|
7
|
|||
|
8
|
|||
|
9
|
|||
|
10
|
|||
|
11
|
|||
|
12
|
|||
|
13
|
|||
|
14
|
|||
|
15
|
|||
|
16
|
|||
|
17
|
|||
|
18
|
|||
|
19
|
|||
|
20
|
|||
|
21
|
|||
|
22
|
|||
|
23
|
|||
|
24
|
|||
69
Note 1: Background
Ingevity Corporation ("Ingevity," "the company", "we," "us" or "our") is a leading global manufacturer of specialty chemicals and high performance activated carbon materials. We provide innovative solutions to meet our customers’ unique and demanding requirements through proprietary formulated products. We report in
two
business segments: Performance Materials and Performance Chemicals.
Our Performance Materials segment consists of our automotive technologies and process purifications product lines. Performance Materials manufactures products in the form of powder, granular, extruded pellets, extruded honeycombs, and activated carbon sheets. Automotive technologies products are sold into the gasoline vapor emission control applications within the automotive industry, while process purifications products are sold into the food, water, beverage, and chemical purification industries.
Our Performance Chemicals segment consists of our pavement technologies, oilfield technologies, industrial specialties, and engineered polymers (acquired in 2019; see Note 17 for more information) product lines. Performance Chemicals manufactures products derived from CTO and lignin extracted from the kraft paper making process as well as caprolactone monomers and derivatives derived from cyclohexanone and hydrogen peroxide. Performance Chemicals products serve as critical inputs used in a variety of high performance applications, including pavement preservation, pavement adhesion promotion and warm mix paving (pavement technologies product line), oil well service additives, oil production and downstream application chemicals (oilfield technologies product line), printing inks, adhesives, agrochemicals, lubricants and industrial intermediates (industrial specialties product line), coatings resins, elastomers, adhesives, and bio-plastics (engineered polymers product line).
Separation and Distribution
On May 15, 2016 (the "Distribution Date"), Ingevity separated from WestRock Company (“WestRock”) (herein referred to as the "Separation"). The Separation was completed pursuant to a Separation and Distribution Agreement and other agreements with WestRock related to the Separation, including an Employee Matters Agreement ("EMA"), a Tax Matters Agreement ("TMA"), a Transition Services Agreement and an Intellectual Property Agreement (collectively, the "Separation Agreements"). The Separation was completed by way of a distribution of all of the then outstanding shares of common stock of Ingevity through a dividend in kind of Ingevity's common stock (par value
$0.01
) to holders of record of WestRock common stock (par value
$0.01
) as of the close of business of May 4, 2016 (the "Record Date"). Ingevity's common stock began "regular-way" trading on the New York Stock Exchange ("NYSE") on May 16, 2016 under the symbol "NGVT".
Note 2: Basis of Consolidation and Presentation
The accompanying Consolidated Financial Statements of Ingevity were prepared in accordance with accounting principles generally accepted in the United States of America (“U.S. GAAP”). The significant accounting policies described in Note 3, together with the other notes that follow, are an integral part of the Consolidated Financial Statements.
Ingevity did not operate as a separate, stand-alone entity for the full period covered by these Consolidated Financial Statements. Our consolidated balance sheet as of
December 31, 2018
and
2017
, respectively, and our consolidated statement of operations, comprehensive income (loss), and cash flows for the years ended
December 31, 2018
and
2017
, consists of the consolidated balances of Ingevity as prepared on a stand-alone basis. Our consolidated statements of operations, comprehensive income (loss), and cash flows for the year ended December 31, 2016, have been prepared on a “carve out” basis for the period prior to the Separation.
70
Prior to the Separation, Ingevity's operations were included in WestRock's financial results and were comprised of certain WestRock wholly owned legal entities for which Ingevity was the sole business and components of legal entities in which Ingevity operated in conjunction with other WestRock businesses. For periods prior to May 15, 2016, the accompanying Consolidated Financial Statements were prepared from WestRock's historical accounting records and are presented on a stand-alone basis as if the business operations had been conducted independently from WestRock. Prior to May 15, 2016, WestRock's net investments in these operations is shown in lieu of Ingevity stockholder's equity in the Consolidated Financial Statements. The Consolidated Financial Statements include the historical operations, assets and liabilities of the legal entities that are considered to comprise the Ingevity business. In all periods presented within these Consolidated Financial Statements all intercompany accounts and transactions have been eliminated. The Consolidated Financial Statements include the accounts of Ingevity and subsidiaries in which a controlling interest is maintained. If Ingevity's ownership is less than 100 percent, the outside stockholders' interests are shown as noncontrolling interests. In all periods presented within the Consolidated Financial Statements, our noncontrolling interest represents the
30 percent
ownership interest held by a third-party U.S. based company in our consolidated Purification Cellutions, LLC legal entity. Purification Cellutions, LLC is the legal entity that owns technology associated with, and manufactures, our extruded honeycomb products within our Performance Materials segment. See Note 12 for information regarding our recent acquisition of the remaining
30 percent
interest in Purification Cellutions, LLC on August 1, 2018.
For purposes of these Consolidated Financial Statements, the term “WestRock” herein refers to the legacy operations of MeadWestvaco Corporation (“MWV”) and its subsidiaries prior to the July 1, 2015 merger of MWV and Rock-Tenn Company ("Rock-Tenn") (the "Merger") and the combined operations of Rock-Tenn and MWV subsequent to the Merger. References to Ingevity’s historical business and operations refer to the business and operations of the Specialty Chemicals Business of WestRock, or prior to the Merger, MWV, that were transferred to Ingevity in connection with the Separation.
All of the allocations and estimates in the Consolidated Financial Statements prior to May 15, 2016 are based on assumptions that management believes are reasonable. The December 31, 2016 Consolidated Financial Statements included herein may not be indicative of the financial position, results of operations and cash flows of Ingevity in the future or if Ingevity had been a separate, stand-alone entity during this period.
Note 3: Summary of Significant Accounting Policies
Estimates and assumptions:
We are required to make estimates and assumptions that affect the reported amounts of assets and liabilities and disclosures of contingent assets and liabilities at the date of the financial statements and the reported amounts of revenue and expenses during the reporting period. Actual results are likely to differ from those estimates, but we do not believe such differences will materially affect our financial position, results of operations or cash flows.
Cash equivalents:
Highly liquid securities with an original maturity of three months or less are considered to be cash equivalents.
Accounts receivable and allowance for doubtful accounts:
Accounts receivable, net on the consolidated balance sheets are comprised of trade receivable less allowances for doubtful accounts. Trade receivables consist of amounts owed to Ingevity from customer sales and are recorded at the invoiced amounts when revenue is recognized and generally do not bear interest. The allowance for doubtful accounts is our best estimate of the amount of probable loss in the existing accounts receivable. We determine the allowance based on historical write-off experience, current collection trends, and external business factors such as economic factors, including regional bankruptcy rates, and political factors. Past due balances over a specified amount are reviewed individually for collectability. Account balances are charged off against the allowance when it is probable that the receivable will not be recovered. Allowance for doubtful accounts at
December 31, 2018
and
2017
, were
$0.4 million
and
$0.4 million
, respectively.
Concentration of credit risk:
The financial instruments that potentially subject Ingevity to concentrations of credit risk are accounts receivable. We limit our credit risk by performing ongoing credit evaluations and, when necessary, requiring letters of credit, guarantees or collateral. We had accounts receivable from our largest customer of
$7.1 million
and
$16.4 million
as of December 31,
2018
and
2017
, respectively. Sales to this customer, which are included in the Performance Chemicals segment, were
five percent
,
eight percent
, and
nine percent
of total net sales for the years ended December 31,
2018
,
2017
, and
2016
, respectively. No other customers individually accounted for greater than 10 percent of Ingevity's consolidated net sales.
Inventories, net:
Inventories are valued at net realizable value. Cost is determined using the last-in, first-out method (“LIFO”) for substantially all raw materials, finished goods and production materials of U.S. manufacturing operations. Cost of all other inventories, including stores and supplies inventories and inventories of non-U.S. manufacturing operations, is determined by the first-in, first-out ("FIFO") or average cost methods. As of
December 31, 2018
, approximately
28
percent,
9
percent and
63
71
percent of our inventories were accounted for under the FIFO, average cost, and LIFO methods, respectively. Elements of cost in inventories include raw materials, direct labor, and manufacturing overhead.
Property, plant, and equipment:
Owned assets are recorded at cost. Also included in the cost of these assets is interest on funds borrowed during the construction period. When assets are sold, retired or disposed of, their cost and related accumulated depreciation are removed from the consolidated balance sheet and any resulting gain or loss is reflected in cost of sales. Repair and maintenance costs that materially add to the value of the asset or prolong its useful life are capitalized and depreciated based on the extension of the useful life; general costs of maintenance and repairs are charged to expense.
Repair and Maintenance Costs:
We expense routine repair and maintenance costs as we incur them. We defer expenses incurred during planned major maintenance activities and record these amounts to “Other assets” on our consolidated balance sheet. Deferred amounts are recognized as expense ratably, over the shorter of the estimated interval until the next major maintenance activity or the life of the deferred item. The cash outflows related to these costs are included in operating activities in the consolidated statement of cash flows. The timing of this maintenance can vary by manufacturing plant and has a significant impact on our results of operations in the period performed primarily due to lost production during the maintenance period.
Depreciation:
The cost of plant and equipment is depreciated, utilizing the straight-line method, over the estimated useful lives of the assets, the majority of which range from
20
to
40
years for buildings and leasehold improvements and
5
to
30
years for machinery and equipment. The following table provides the detail behind the useful lives and proportion of our machinery and equipment (“M&E”) in each useful life category.
|
Percent of
M&E Cost |
Depreciable Life in Years
|
Types of Assets
|
||
|
56
|
20
|
Production vessels and kilns, storage tanks, piping
|
||
|
11
|
15
|
Control systems, instrumentation, metering equipment
|
||
|
7
|
25 to 30
|
Blending equipment, storage tanks, piping, shipping equipment and platforms, safety equipment
|
||
|
19
|
5 to 10
|
Production control system equipment and hardware, laboratory testing equipment
|
||
|
3
|
40
|
Machinery & equipment support structures and foundations
|
||
|
4
|
Various
|
Various
|
||
Impairment of long-lived assets:
We periodically evaluate whether current events or circumstances indicate that the carrying value of our long-lived assets, including intangible assets, to be held and used may not be recoverable. If such circumstances are determined to exist, an estimate of undiscounted future cash flows produced by the long-lived asset, or the appropriate grouping of assets, is compared to carrying value to determine whether impairment exists.
If an asset is determined to be impaired, the loss is measured based on quoted market prices in active markets, if available. If quoted market prices are not available, the estimate of fair value is based on various valuation techniques, including a discounted value of estimated future cash flows. We report an asset to be disposed of at the lower of its carrying value or its estimated net realizable value.
Goodwill and other intangible assets:
Goodwill represents the excess of cost of an acquired business over the fair value of the identifiable tangible and intangible assets acquired and liabilities assumed in a business combination. We review the recorded value of goodwill at least annually at October 1, or sooner if events or changes in circumstances indicate that the fair value of a reporting unit is below its carrying value. A reporting unit is the level at which discrete financial information is available and reviewed by business management on a regular basis. An impairment exists when the carrying value of a reporting unit exceeds its fair value. Our reporting units are our operating segments, i.e. Performance Chemicals and Performance Materials. If an indication exists that the fair value of a reporting unit with goodwill is less than its carrying value, a quantitative goodwill impairment test is performed. The fair value of each reporting unit is estimated primarily using an income approach, specifically the discounted cash flow method. The following assumptions are key to the income approach: 1) cash flow and earnings projections; 2) growth rates; 3) discount rates; 4) income tax rates; and, 5) terminal value rates.
The factors we considered in developing our estimates and projections for cash flows and earnings include, but are not limited to, the following: (i) macroeconomic conditions; (ii) industry and market considerations; (iii) costs, such as increases in raw materials, labor, or other costs; (iv) our overall financial performance; and, (v) other relevant entity-specific events that impact
72
our reporting units. The discount rate we used represents the weighted average cost of capital for the reporting units, considering the risks and uncertainty inherent in the cash flows of the reporting units and in our internally-developed forecasts.
The determination of whether goodwill is impaired involves a significant level of judgment in the assumptions underlying the approach used to determine the estimated fair values of our reporting units. We believe that the assumptions and rates used in our impairment assessment are reasonable; however, these assumptions are judgmental and variations in any assumptions could result in materially different calculations of fair value. We will continue to evaluate goodwill on an annual basis as of October 1, and whenever events or changes in circumstances, such as significant adverse changes in operating results, market conditions, or changes in management’s business strategy indicate that there may be a probable indicator of impairment. It is possible that the assumptions used by management related to the evaluation may change or that actual results may vary significantly from management’s estimates.
Other intangible assets are comprised of finite-lived intangible assets consisting primarily of brands: representing trademarks, trade names and know-how, and customer contracts and relationships. Other intangible assets are amortized over their estimated useful lives which range from
5
to
20
years. See Note 9 for additional information.
Capitalized software:
Capitalized software for internal use is included in "Other assets" on the consolidated balance sheets. Amounts capitalized are presented in "Capital expenditures" on our consolidated statements of cash flow. Capitalized software is amortized using the straight-line over the estimated useful lives ranging from
1
to
10
years. Amortization is recorded to "Costs of sales" on our consolidated statements of operations for software directly used in the production of inventory and "Selling, general and administrative expenses" on our consolidated statements of operations for software used for non-production related activities.
Environmental and legal liabilities:
Environmental expenditures that increase useful lives of assets are capitalized, while other environmental expenditures are expensed. Liabilities are recorded when remedial efforts are probable and the costs can be reasonably estimated. We recognize a liability for other legal contingencies when a loss is probable and reasonably estimable. Liabilities recorded for claims are limited to pending cases based on Ingevity’s historical experience, consultation with outside counsel and consultation with an actuarial specialist concerning the feasibility of reasonably estimating liabilities associated with claims that may arise in the future. We recognized insurance recoveries when collection is reasonably assured. Third-party fees for legal services are expensed as incurred.
Revenue recognition:
In May 2014, the FASB issued ASU 2014-09 “Revenue from Contracts with Customers (Topic 606),” which supersedes both the revenue recognition requirement to ASC 605 “Revenue Recognition” and most industry-specific guidance. The core principle of the new standard (ASC 606) is that an entity should recognize revenue to depict the transfer of promised goods or services to customers in an amount that reflects the consideration to which the entity expects to be entitled in exchange for those goods or services. An entity must also disclose sufficient information to enable users of financial statements to understand the nature, amount, timing and uncertainty of revenue and cash flows arising from contracts with customers, including qualitative and quantitative information about contracts with customers, significant judgments and changes in judgments, and assets recognized from the costs to obtain or fulfill a contract. In 2016 and 2017, the FASB issued several ASUs that provided additional clarity on numerous topics as well as providing technical corrections to ASU 2014-09. We adopted this new standard on January 1, 2018, utilizing the modified retrospective method applied to those contracts, which were not completed as of that date. Results for reporting periods beginning after January 1, 2018, are presented under ASC 606, while prior period amounts are not adjusted and continue to be presented in accordance with our historic accounting under ASC 605.
Substantially all our revenue is recognized when products are shipped from our manufacturing and warehousing facilities, which represents the point at which control is transferred to the customer. For certain limited contracts, where we are producing goods with no alternative use and for which we have an enforceable right to payment for performance completed to date, we are recognizing revenue as goods are manufactured, rather than when they are shipped.
Sales net of returns and customer incentives are based on the sale of manufactured products. Net sales are recognized when obligations under the terms of a contract with our customer are satisfied; generally, this occurs with the transfer of control of our products. Since Net sales are derived from product sales only, we have disaggregated our net sales by our product lines within each reportable segment. Net sales are measured as the amount of consideration we expect to receive in exchange for transferring goods. Sales, value add, and other taxes we collect concurrent with revenue-producing activities are excluded from revenue. Sales returns and allowances are not a normal practice in the industry and are not significant. Certain customers may receive cash-based incentives, including discounts and volume rebates, which are accounted for as variable consideration and included in Net sales. Shipping and handling fees billed to customers continue to be included with Net sales. If we pay for the
73
freight and shipping, we recognize the cost when control of the product has transferred to the customer as an expense in Cost of sales in the consolidated statement of operations. Although very rare, from time to time we incur expenses to obtain a sales contract. In these cases, if these costs are for orders that are fulfilled in one year or less, we expense these costs as they are incurred. Because the period between when we transfer a promised good to a customer and when the customer pays for that good will be one year or less, we elect not to adjust the promised amount of consideration for the effects of any financing component, as it is not significant.
Cost of sales:
Costs primarily consists of the cost of inventory sold and other production related costs. These costs include raw materials, direct labor, manufacturing overhead, packaging costs and maintenance costs. Shipping and handling costs are also recorded to cost of sales.
Selling, general and administrative expenses:
Costs are expensed as incurred and primarily include employee compensation costs related to sales, and office personnel, office expenses, and other expenses not directly related to our manufacturing operations. Costs also include advertising and promotional costs.
Research and technical expenses:
Cost are expensed as incurred and primarily include employee compensation, technical equipment costs and material testing and innovation related expenses.
Royalty expense:
Our Performance Materials and Performance Chemicals segments have licensing agreements with third parties requiring us to pay royalties for certain technologies we use in the manufacturing of our products. Royalty expense is recognized as incurred and recorded to "Cost of sales" on our consolidated statements of operations.
Income taxes:
We are subject to income taxes in the U.S. and numerous foreign jurisdictions, including China. The provision (benefit) for income taxes includes income taxes paid, currently payable or receivable, and deferred taxes. We follow the liability method of accounting for income taxes in accordance with current accounting standards regarding the accounting for income taxes. Under this method, deferred income taxes are recorded based upon the differences between the financial reporting and tax bases of assets and liabilities and are measured using the enacted tax rates and laws in effect at the time the underlying assets or liabilities are recovered or settled. The ability to realize deferred tax assets is evaluated through the forecasting of taxable income, historical and projected future operating results, the reversal of existing temporary differences, and the availability of tax planning strategies. Valuation allowances are recognized to reduce deferred tax assets when it is more likely than not that a tax benefit will not be realized. We do not provide income taxes on undistributed earnings of consolidated foreign subsidiaries as it is our intention that such earnings will remain invested in those companies. See Note 18 for more information.
We recognize income tax positions that are more likely than not to be realized and accrue interest related to unrecognized income tax positions, which is included as a component of the provision (benefit) for income taxes on the consolidated statements of operations.
Prior to the Separation, activity of our U.S. operations were reported in WestRock’s U.S. consolidated income tax return and certain foreign activity was reported in WestRock tax paying entities in those jurisdictions. Under the TMA, WestRock is responsible for the income tax liabilities associated with all U.S. operations prior to Separation and for the historic operations of certain foreign legal entities retained by WestRock after the Separation. For periods prior to the Separation, the provision (benefit) for income taxes included in the Consolidated Financial Statements, related to domestic and certain foreign operations, was calculated on a separate return basis, as if Ingevity was a separate taxpayer and the resulting current tax receivable or liability, including any liabilities related to uncertain tax positions, was settled with WestRock through equity at Separation. In other foreign taxing jurisdictions, the operations of Ingevity were always conducted in discrete legal entities, each of which files separate tax returns, and all resulting income tax assets and liabilities, including any liabilities related to uncertain tax positions, are reflected in the consolidated balance sheets of Ingevity.
Pension and postretirement benefits:
Prior to the Separation, the employees of Ingevity were participants in various defined benefit pension and postretirement benefit plans (“the Plans”) sponsored by WestRock and the related assets and liabilities were combined with those related to other WestRock businesses. Expense allocated under the Plans was reported within Cost of sales and Selling, general and administrative expenses in the consolidated statements of operation. Prior to the Separation, the Plans were considered to be part of a multi-employer plan with the other businesses of WestRock.
In conjunction with the Separation, the employees of Ingevity stopped participating in WestRock pension and post-retirement benefit plans. We assumed certain domestic and international pension and other post retirement benefit obligations from WestRock on the date of Separation. We established new qualified and non-qualified benefit plans to continue the pension and postretirement benefits provided to its employees and retirees based on the obligations assumed from WestRock. The expense related to the current employees of Ingevity as well as the expense related to retirees of Ingevity are included in the Consolidated
74
Financial Statements. The costs (or benefits) and obligations related to these benefits reflect key assumptions related to general economic conditions, including interest (discount) rates, healthcare cost trend rates and expected return on plan assets. The costs (or benefits) and obligations for these benefit programs are also affected by other assumptions, such as average retirement age, mortality, employee turnover, and plan participation. To the extent our plans' actual experience, as influenced by changing economic and financial market conditions or by changes to our own plans' demographics, differs from these assumptions, the costs and obligations for providing these benefits, as well as the plans' funding requirements, could increase or decrease. When actual results differ from our assumptions, the difference is typically recognized over future periods. In addition, the unrealized gains and losses related to our pension and postretirement benefit obligations may also affect periodic benefit costs (or benefits) in future periods. See Note 14 for additional information.
Share-based compensation:
We recognize compensation expense in our Consolidated Financial Statements for all share-based compensation arrangements. Share-based compensation cost is measured at the date of grant, based on the fair value of the award and expense is recognized over the grantee's requisite service period; forfeitures are recognized as they occur. We calculate the fair value of our stock options using the Black-Scholes option pricing model. The fair value of restricted stock units ("RSU"s), non-employee director deferred stock units ("DSU"s) and performance-based restricted stock units ("PSU"s) is determined using our closing stock price on the day of the grant. Substantially all compensation expense related to share-based awards is recorded as a component of Selling, general and administrative expenses in the Consolidated Statements of Operations. See Note 11 for additional information.
Operating segments:
Ingevity’s operating segments are Performance Materials and Performance Chemicals. Our operating segments were determined based upon the nature of the products produced, the nature of the production process, the type of customer for the products, the similarity of economic characteristics, and the manner in which management reviews results. Ingevity’s chief operating decision maker evaluates the business at the segment level when making decisions about allocating resources and assessing performance of Ingevity as a whole. We evaluate sales in a format consistent with our reportable segments: (1) Performance Materials, which includes wood-based, chemically activated carbon products and (2) Performance Chemicals, which includes specialty pine-based chemical co-products derived from the kraft pulping process and caprolactone monomers and derivatives derived from cyclohexanone and hydrogen peroxide. Each segment operates as a portfolio of various end uses for the relevant raw material used in that segment. Business decisions are made and performance is generally measured based upon the total mix of end uses each raw material is being directed at in the segment. See Note 20 for additional information.
Derivative financial instruments:
We mitigate certain financial exposures, including currency risk and commodity price exposures, through a controlled program of risk management that includes the use of derivative financial instruments. We formally document all relationships between the derivative financial instrument and hedged item, as well as the risk management objective and strategy for undertaking various hedge transactions. This process includes relating derivative financial instruments that are designated as cash flow hedges to specific forecasted transactions. We do not hold or issue derivative financial instruments for speculative or trading purposes. We enter into derivative financial instruments which are governed by policies, procedures and internal processes set forth by our Board of Directors.
On the date the derivative financial instrument is entered into, we generally designate the derivative as a hedge of the variability of cash flows to be received or paid related to a forecasted transaction (cash flow hedge). Cash flow hedges are derivative financial instruments designated as and used to hedge the exposure to variability in expected future cash flows that are attributable to a particular risk. The derivative financial instruments that are designated and qualify as a cash flow hedge are recorded on the balance sheet at fair value and the changes in fair value of these hedging instruments are offset in part or in whole by corresponding changes in the anticipated cash flows of the underlying exposures being hedged. Where we have a legal right to offset derivative settlements under a master netting agreement with a counterparty, derivatives with that counterparty are presented on a net basis. The gains and losses arising from qualifying hedging instruments are reported as a component of accumulated other comprehensive income (loss) (“AOCI”) located in the consolidated balance sheets and reclassified into earnings in the same period or periods during which the hedged transaction affects earnings. The reclassification gain or losses of the hedge from AOCI are recorded in the same financial statement caption on the consolidated statements of operations as the hedged item. For example, designated cash flow hedges entered to minimize foreign currency exchange risk of forecasted revenue transactions are recorded to "Net sales" on the consolidated statement of operations when the forecasted transaction occurs. Designated commodity cash flow hedges gains or losses recorded in AOCI are recognized in "Cost of sales" on the consolidated statements of operations when the inventory is sold. See Note 6 for more information regarding our derivative financial instruments.
75
Noncontrolling interests:
When our ownership in a consolidated legal entity is less than 100 percent, the outside stockholders' interests are shown as noncontrolling interests. Our
noncontrolling interests for the years ended December 31,
2018
,
2017
and
2016
, represents the
30 percent
ownership interest held by a third-party U.S. based company in our consolidated Purification Cellutions, LLC legal entity. Purification Cellutions, LLC is the legal entity that owns technology associated with, and manufactures, our extruded honeycomb scrubber products within our Performance Materials segment. Net income (loss) attributable to noncontrolling interest, as presented on our consolidated statement of operations represents
30 percent
of the pre-tax earnings from Purification Cellutions, LLC owned by the third-party. Purification Cellutions, LLC is a limited liability company which is treated as a "pass-through" entity for tax purposes. Although we consolidated 100 percent of Purification Cellutions, LLC, only
70 percent
of Purification Cellutions, LLC's earnings are included in the calculation of Ingevity's provision for income taxes as presented on the consolidated statement of operations. See Note 12 for information regarding our recent acquisition of the remaining
30 percent
interest in Purification Cellutions, LLC on August 1, 2018.
Treasury Stock:
We record shares of common stock repurchased at cost as treasury stock, resulting in a reduction of stockholders’ equity in the consolidated balance sheets. When the treasury shares are contributed under our employee benefit plans or issued for option exercises, we use a first-in, first-out (“FIFO”) method for determining cost. The difference between the cost of the shares and the market price at the time of contribution to an employee benefit plan is added to or deducted from the related capital in excess of par value of common stock.
Translation of foreign currencies:
The local currency is the functional currency for all of Ingevity’s significant operations outside the U.S. The assets and liabilities of Ingevity's foreign subsidiaries are translated into U.S. dollars using period-end exchange rates, and adjustments resulting from these financial statement translations are included in accumulated other comprehensive income in the consolidated balance sheets. Revenues and expenses are translated at average rates prevailing during each period.
Business Combinations:
We account for business combinations in accordance with ASC 805 “Business Combinations” which requires, among other things, the acquiring entity in a business combination to recognize the fair value of the assets acquired and liabilities assumed; the recognition of acquisition-related costs in the consolidated results of operations; the recognition of restructuring costs in the consolidated results of operations for which the acquirer becomes obligated after the acquisition date; and contingent purchase consideration to be recognized at fair value on the acquisition date with subsequent adjustments recognized in the consolidated results of operations. We generally use third-party qualified consultants to assist management in determination of the fair value of assets acquired and liabilities assumed. This includes, when necessary, assistance with the determination of lives and valuation of property and identifiable intangibles, assisting management in determining the fair value of obligations associated with employee related liabilities and assisting management in assessing obligations associated with legal and environmental claims.
The fair values assigned to identifiable intangible assets acquired are determined primarily by using an income approach, which is based on assumptions and estimates made by management. Significant assumptions utilized in the income approach are the attrition rate, growth rates and discount rate. These assumptions are based on company specific information and projections, which are not observable in the market and are therefore considered Level 2 and Level 3 measurements. The excess of the purchase price over the fair value of the identified assets and liabilities is recorded as goodwill. Based on the acquired business’ end markets and products as well as how the chief operating decision maker will review the business results determines the most appropriate operating segment for which to integrate the acquired business. Goodwill acquired, if any, is allocated to the reporting unit within or at the operating segment for which the acquired business will be integrated. Operating results of the acquired entity are reflected in the consolidated financial statements from date of acquisition.
Relationship with WestRock:
Prior to the Separation, the December 31, 2016 Consolidated Financial Statements included allocated expenses associated with centralized WestRock support functions including legal, accounting, tax, treasury, internal audit, information technology, human resources, and other services. The costs associated with these functions generally include all payroll and benefit costs as well as related overhead costs. Prior to the Separation, the Consolidated Financial Statements also include allocated costs associated with WestRock’s office facilities, corporate insurance coverage and medical, pension, post-retirement and other health plan costs attributed to Ingevity’s employees participating in WestRock’s sponsored plans. Allocations are generally based on a number of utilization measures including employee count and proportionate effort. In situations in which determinations based on utilization are impracticable, WestRock and Ingevity used other methods and criteria such as net sales which are believed to result in reasonable estimates of costs attributable to Ingevity. Such allocated expenses are components of net income in the consolidated statement of operations and are therefore included as a component of net cash provided by (or used in) operating
76
activities in the consolidated statement of cash flows. All such amounts have been assumed to have been immediately settled by Ingevity to WestRock in the period in which the costs were recorded in the Consolidated Financial Statements.
We believe the related-party allocations included in the Consolidated Financial Statements for periods prior to the Separation have been made on a reasonable basis. However, these Consolidated Financial Statements may not necessarily be indicative of the results of operations that would have been obtained if Ingevity had operated as a separate entity during the periods presented prior to May 15, 2016. Actual costs that may have been incurred if Ingevity had been a stand-alone business would depend on a number of factors, including organizational structure and what functions were outsourced or performed by employees, as well as strategic decisions made in areas such as information technology and infrastructure. Consequently, Ingevity’s future earnings while operated as an independent business could include items of income and expense that are materially different from what is included in the consolidated statements of operations prior to the Separation. Accordingly, the Consolidated Financial Statements for the periods presented prior to the Separation are not necessarily indicative of Ingevity’s future results of operations, financial position and cash flows.
Reclassifications:
Certain prior year amounts have been reclassified to conform with current year's presentation.
Note 4: New Accounting Guidance
In November 2018, the FASB issued ASU 2018-18 "Collaborative Arrangements (Topic 808): Clarifying the Interaction between Topic 808 and Topic 606." This ASU provides guidance on whether certain transactions between collaborative arrangement participants should be accounted for with revenue under Topic 606. In addition, the amendments in this ASU provide more comparability in the presentation of revenue for certain transactions between collaborative arrangement participants. The new standard is effective for fiscal years beginning after December 15, 2019, including interim periods within those fiscal years. The amendments should be applied retrospectively to the date of initial application of Topic 606. Although we are still evaluating the impact of this new standard, we do not believe that the adoption will materially impact our Consolidated Financial Statements and related disclosures.
In October 2018, the FASB issued ASU 2018-16 "Derivatives and Hedging (Topic 815): Inclusion of Secured Overnight Financing Rate (SOFR) Overnight Index Swap (OIS) Rate as a Benchmark Interest Rate for Hedge Accounting Purposes." The amendments in this ASU permit use of the OIS rate based on SOFR as a U.S. benchmark interest rate for hedge accounting purposes under Topic 815 in addition to the UST, the LIBOR swap rate, the OIS rate based on the Fed Funds Effective Rate, and the SIFMA Municipal Swap Rate. For entities that have not already adopted Update 2017-12, the amendments in this ASU are required to be adopted concurrently with the amendments in ASU 2017-12. This new standard will be effective for Ingevity for fiscal years beginning after December 15, 2018, since we adopted ASU 2017-12 prior to this guidance. Although we are still evaluating the impact of this new standard, we do not believe that the adoption will materially impact our Consolidated Financial Statements and related disclosures.
In August 2018, the FASB issued ASU 2018-15 "Intangibles-Goodwill and Other-Internal-Use Software (Subtopic 350-40) Customer's Accounting for Implementation Costs Incurred in a Cloud Computing Arrangement that is a Service Contract." This ASU requires companies to defer specific implementation costs incurred in a Cloud Computing Arrangement ("CCA") that are often expensed as incurred under current GAAP, and recognize the expense over the noncancellable term of the CCA. The new standard is effective for fiscal years beginning after December 15, 2019, including interim periods within those fiscal years. Although we are still evaluating the impact of this new standard, we do not believe that the adoption will materially impact our Consolidated Financial Statements and related disclosures.
In August 2018, the FASB issued ASU 2018-14 "Compensation-Retirement Benefits-Defined Benefit Plans-General (Subtopic 715-20) Disclosure Framework-Changes to the Disclosure Requirements for the Defined Benefit Plans." This ASU modifies and clarifies the disclosure requirements for employers that sponsor defined benefit pension or other postretirement plans. The new standard is effective for fiscal years ending after December 15, 2020. An entity should apply the amendments in this ASU on a retrospective basis to all periods presented. Although we are still evaluating the impact of this new standard, we do not believe that the adoption will materially impact our Consolidated Financial Statements and related disclosures.
In August 2018, the FASB issued ASU 2018-13 "Fair Value Measurement (Topic 820) Disclosure Framework - Changes to the Disclosure Requirements for Fair Value Measurement." This ASU eliminates, amends, and adds disclosure requirements for fair value measurements. The new standard is effective for fiscal years beginning after December 15, 2019, including interim periods within those fiscal years. Although we are still evaluating the impact of this new standard, we do not believe that the adoption will materially impact our Consolidated Financial Statements and related disclosures.
77
In June 2018, the FASB issued ASU 2018-07 "Compensation-Stock Compensation (Topic 718) - Improvements to Nonemployee Share-Based Payment Accounting." This ASU provides for a single accounting model for all share-based payments, with the employee based guidance now applying to nonemployee share-based transactions. The new standard is effective for fiscal years beginning after December 15, 2018, including interim periods within those fiscal years. Although we are still evaluating the impact of this new standard, we do not believe that the adoption will materially impact our Consolidated Financial Statements and related disclosures.
In January 2017, the FASB issued ASU 2017-04 "Intangibles-Goodwill and Other (Topic 350): Simplifying the Test for Goodwill Impairment," which amends and simplifies the accounting standard for goodwill impairment. The new standard removes Step 2 of the goodwill impairment test, which requires a hypothetical purchase price allocation. A goodwill impairment will now be the amount a reporting unit’s carrying value exceeds its fair value, limited to the total amount of goodwill allocated to that reporting unit. The new standard is effective for annual and any interim impairment tests for periods beginning after December 15, 2019. The Company early adopted this standard on January 1, 2018. The impact of adoption did not have a material impact on our Consolidated Financial Statements and related disclosures.
In January 2017, the FASB issued ASU No. 2017-01 "Business Combinations (Topic 805): Clarifying the Definition of a Business." The new guidance narrows the existing definition of a business and provides a framework for evaluating whether a transaction should be accounted for as an acquisition (or disposal) of assets or a business. The guidance requires an entity to evaluate if substantially all of the fair value of the gross assets acquired is concentrated in a single identifiable asset or a group of similar identifiable assets; if so, the set of transferred assets and activities (collectively, the "set") is not a business. To be considered a business, the set would need to include an input and a substantive process that together significantly contribute to the ability to create outputs, as defined by the ASU. The guidance is effective for annual reporting periods beginning after December 15, 2017, including interim periods within those annual reporting periods, and should be applied prospectively. We adopted this standard on January 1, 2018.
In August 2016, the FASB issued final amendments to clarify how entities should classify certain cash receipts and cash payments in ASU 2016-15 "Statement of Cash Flows (Topic 230): Classification of Certain Cash Receipts and Cash Payments." The new guidance clarifies the classification on the statement of cash flows of certain cash receipts and disbursements such as distributions received from equity method investees, proceeds from settlement of insurance claims, and proceeds from the settlement of corporate-owned life insurance policies. The new standard is effective for fiscal years beginning after December 15, 2017, including interim periods within those years. The Company adopted this standard on January 1, 2018. The impact of adoption did not have a material impact on our Consolidated Financial Statements and related disclosures.
In February 2016, the FASB issued ASU 2016-02 "Leases (Topic 842)." Under the new guidance, lessees will be required to recognize for all leases (with the exception of short-term leases) a lease liability, which is a lessee's obligation to make lease payments arising from a lease, measured on a discounted basis and a right-of-use asset, which is an asset that represents the lessee’s right to use, or control the use of, a specified asset for the lease term. Since the issuance of ASU 2016-02, the FASB has issued several amendments which clarify certain points in Topic 842, including ASU 2018-20 ("Lease (Topic 842): Narrow-Scope Improvements for Lessors"), ASU 2018-01 ("Land Easement Practical Expedient"), ASU 2018-10 ("Codification Improvements"), and ASU 2018-11 ("Targeted Improvements"). We adopted all of these standards at the same time effective January 1, 2019 under the modified retrospective approach. We utilized the practical expedients upon transition that will retain lease classification and initial direct costs for any leases that existed prior to adoption of the standard; we adopted the practical expedient to apply hindsight in determining lease term; we have chosen to account for lease and nonlease components together as a single lease component; we have elected the practical expedient related to land easements allowing us to carryforward our current accounting treatment for land easements on existing agreements; and we have elected not to restate the comparative financial statements upon adoption. As a lessee, the majority of our leases under existing guidance are classified as operating leases, and therefore, are not recorded on the balance sheet but are recorded in the statement of earnings as expense as incurred. We have catalogued our existing lease contracts and implemented changes to our systems in order to perform the lease accounting and reporting under the new guidance going forward. The adoption of the standard will result in the recognition of additional net lease assets of approximately
$60 million
to
$70 million
, with the offset recorded to lease liabilities, as of January 1, 2019. The capital leases discussed in Note 8 to the Consolidated Financial Statements are expected to be accounted for as finance leases upon adoption of Topic 842. There will not be a significant impact in the timing of expense recognition based on the classification of leases as either operating or financing.
In May 2014, the FASB issued ASU 2014-09 which is codified in ASC 606 “Revenue from Contracts with Customers” and supersedes both the revenue recognition requirement to ASC 605 “Revenue Recognition” and most industry-specific guidance ("ASC 606"). The core principle of ASC 606 is that an entity should recognize revenue to depict the transfer of promised goods
78
or services to customers in an amount that reflects the consideration to which the entity expects to be entitled in exchange for those goods or services. An entity must also disclose sufficient information to enable users of financial statements to understand the nature, amount, timing and uncertainty of revenue and cash flows arising from contracts with customers, including qualitative and quantitative information about contracts with customers, significant judgments and changes in judgments, and assets recognized from the costs to obtain or fulfill a contract. In 2016 and 2017, the FASB issued several ASUs that provided additional clarity on numerous topics as well as providing technical corrections to the original ASU 2014-09. We adopted this new standard on January 1, 2018, utilizing the modified retrospective method applied to those contracts that were not completed as of January 1, 2018. See below for the effect of this adoption on our Consolidated Financial Statements.
|
In millions
|
Balance at December 31, 2017
|
Adjustments
|
Balance at January 1, 2018
|
||||||||
|
Assets
|
|||||||||||
|
Accounts receivable, net of allowance
|
$
|
100.0
|
|
$
|
0.3
|
|
$
|
100.3
|
|
||
|
Inventories, net
|
160.0
|
|
(2.4
|
)
|
157.6
|
|
|||||
|
Prepaid and other current assets
|
20.8
|
|
5.1
|
|
25.9
|
|
|||||
|
Liabilities
|
|||||||||||
|
Accrued expenses
|
20.0
|
|
0.9
|
|
20.9
|
|
|||||
|
Deferred income taxes
|
41.3
|
|
0.5
|
|
41.8
|
|
|||||
|
Equity
|
|||||||||||
|
Retained earnings
|
$
|
142.8
|
|
$
|
1.6
|
|
$
|
144.4
|
|
||
In accordance with ASC 606, the impact of adoption on our consolidated statement of operations and balance sheet were as follows:
|
Year Ended December 31, 2018
|
|||||||||||
|
In millions
|
As reported
|
Balances without Adoption of ASC 606
|
Effect of Change Higher/(Lower)
|
||||||||
|
Net sales
|
$
|
1,133.6
|
|
$
|
1,133.0
|
|
$
|
0.6
|
|
||
|
Cost of sales
|
716.8
|
|
717.1
|
|
(0.3
|
)
|
|||||
|
Provision (benefit) for income taxes
|
40.0
|
|
39.8
|
|
0.2
|
|
|||||
|
Net income (loss)
|
$
|
169.1
|
|
$
|
168.4
|
|
$
|
0.7
|
|
||
|
December 31, 2018
|
|||||||||||
|
In millions
|
As reported
|
Balances without Adoption of ASC 606
|
Effect of Change Higher/(Lower)
|
||||||||
|
Assets
|
|||||||||||
|
Accounts receivable, net of allowance
|
$
|
118.9
|
|
$
|
118.5
|
|
$
|
0.4
|
|
||
|
Inventories, net
|
191.4
|
|
193.6
|
|
(2.2
|
)
|
|||||
|
Prepaid and other current assets
|
34.9
|
|
29.2
|
|
5.7
|
|
|||||
|
Liabilities
|
—
|
|
|||||||||
|
Accrued expenses
|
36.7
|
|
35.7
|
|
1.0
|
|
|||||
|
Deferred income taxes
|
36.9
|
|
36.7
|
|
0.2
|
|
|||||
|
Equity
|
|||||||||||
|
Retained earnings
|
$
|
313.5
|
|
$
|
310.8
|
|
$
|
2.7
|
|
||
All other issued but not yet effective accounting pronouncements are not expected to have a material impact on our Consolidated Financial Statements.
79
Note 5: Revenues
On January 1, 2018, we adopted ASC 606 using the modified retrospective method applied to contracts not completed as of January 1, 2018. Results for reporting periods beginning after January 1, 2018 are presented under ASC 606, while prior period amounts are not adjusted and continue to be reported in accordance with our historic accounting under ASC 605. See Note 4 for more information on the adoption of ASC 606 and its impact on our Consolidated Financial Statements.
Ingevity's operating segments are (i) Performance Materials and (ii) Performance Chemicals. A description of both operating segments is included in Note 1.
Net sales in both of our reportable segments are based on the sale of manufactured products. Net sales are recognized when obligations under the terms of a contract with our customer are satisfied; generally, this occurs with the transfer of control of our products. Since net sales are derived from product sales only, we have disaggregated our net sales by our product lines within each reportable segment. Net sales are measured as the amount of consideration we expect to receive in exchange for transferring goods. Sales, value add, and other taxes we collect concurrent with revenue-producing activities are excluded from revenue. Sales returns and allowances are not a normal practice in the industry and are not significant. Shipping and handling fees billed to customers continue to be included with Net sales. Certain customers may receive cash-based incentives, including discounts and volume rebates, which are accounted for as variable consideration and included in Net sales. Incidental items immaterial in the context of the contract are recognized as expense. If we pay for the freight and shipping, we recognize the cost when control of the product has transferred to the customer as an expense in Cost of sales on the consolidated statement of operations. Although very rare, from time to time we incur expenses to obtain a sales contract. In these cases, if these costs are for orders that are fulfilled in one year or less, we expense these costs as they are incurred. Because the period between when we transfer a contracted good to a customer and when the customer pays for that good will be one year or less, we elect not to adjust the contracted amount of consideration for the effects of any significant financing component.
Disaggregation of Revenue
The following tables present our Net sales disaggregated by product line and geography.
|
Years Ended December 31,
|
|||||||||||
|
In millions
|
2018
|
2017
|
2016
|
||||||||
|
Automotive Technologies product line
|
$
|
362.0
|
|
$
|
312.5
|
|
$
|
263.5
|
|
||
|
Process Purification product line
|
38.4
|
|
36.8
|
|
37.5
|
|
|||||
|
Performance Materials segment
|
$
|
400.4
|
|
$
|
349.3
|
|
$
|
301.0
|
|
||
|
Pavement Technologies product line
|
178.5
|
|
163.0
|
|
148.8
|
|
|||||
|
Oilfield Technologies product line
|
114.2
|
|
77.8
|
|
58.5
|
|
|||||
|
Industrial Specialties product line
|
440.5
|
|
382.3
|
|
400.0
|
|
|||||
|
Performance Chemicals segment
|
$
|
733.2
|
|
$
|
623.1
|
|
$
|
607.3
|
|
||
|
Consolidated Net sales
|
$
|
1,133.6
|
|
$
|
972.4
|
|
$
|
908.3
|
|
||
The following table presents our Net sales disaggregated by geography, based on the delivery address of our customer.
80
|
Years Ended December 31,
|
|||||||||||
|
In millions
|
2018
|
2017
|
2016
|
||||||||
|
North America
|
$
|
770.4
|
|
$
|
662.9
|
|
$
|
597.8
|
|
||
|
Asia Pacific
|
171.4
|
|
142.5
|
|
138.8
|
|
|||||
|
Europe, Middle East and Africa
|
169.9
|
|
149.2
|
|
151.1
|
|
|||||
|
South America
|
21.9
|
|
17.8
|
|
20.6
|
|
|||||
|
Net sales
|
$
|
1,133.6
|
|
$
|
972.4
|
|
$
|
908.3
|
|
||
Contract Balances
The following table provides information about contract assets and contract liabilities from contracts with customers. The contract assets primarily relate to our rights to consideration for products produced but not billed at the reporting date on contracts with certain customers. The contract assets are recognized as accounts receivables when the rights become unconditional and the customer has been billed. Contract liabilities represent obligations to transfer goods to a customer for which we have received consideration from our customer. For all periods presented, we had
no
contract liabilities.
|
In millions
|
Contract Asset
|
||
|
Balance at January 1, 2018
|
$
|
4.4
|
|
|
Contract asset additions
|
26.6
|
|
|
|
Reclassification to accounts receivable, billed to customers
|
(25.9
|
)
|
|
|
Balance at December 31, 2018
(1)
|
$
|
5.1
|
|
|
_______________
|
|||
|
(1) Included within "Prepaid and other current assets" on the consolidated balance sheet.
|
|||
Note 6: Financial Instruments, Risk Management, and Fair Value Measurements
Financial Instruments and Risk Management
Ingevity’s operations are exposed to market risks, such as changes in foreign currency exchange rates and commodity prices due to transactions denominated in a variety of foreign currencies and purchases of certain commoditized raw materials and inputs. Changes in these rates and prices may have an impact on Ingevity’s future cash flow and earnings. To mitigate these market risks and their effects, we enter into derivative financial instruments which are governed by policies, procedures and internal processes set forth by our Board of Directors.
Our risk management program also addresses counterparty credit risk by selecting only major financial institutions with investment grade ratings. Once the derivative financial instrument is entered into, we continuously monitor the financial institutions’ credit ratings and our credit risk exposure held by the financial institution. When appropriate, we reallocate exposures across multiple financial institutions to limit credit risk. If a counterparty fails to fulfill its performance obligations under the derivative financial instrument, then Ingevity is exposed to credit risk equal to the fair value of the financial instrument. Derivative assets and liabilities are reported on a net basis by counterparty, to the extent governed by master netting agreements, in the consolidated balance sheets. Due to our proactive mitigation of these potential credit risks, we anticipate performance by our counterparties to these contracts and therefore no material loss is expected.
Foreign Currency Exchange Risk Management
We manufacture and sell our products in several countries throughout the world and, thus, we are exposed to changes in foreign currency exchange rates. To manage the volatility relating to these exposures, we net the exposures on a consolidated basis to take advantage of natural offsets. To manage the remaining exposure, from time to time, we utilize forward currency exchange contracts and zero cost collar option contracts to minimize the volatility to earnings and cash flows resulting from the effect of fluctuating foreign currency exchange rates on export sales denominated in foreign currencies (principally the euro). These contracts are generally designated as cash flow hedges. We began our foreign currency exchange risk hedging program in July 2017 and therefore prior to this date we had no derivative financial instruments designated to foreign currency exchange risk. As of
December 31, 2018
, open foreign currency derivative contracts hedge forecasted transactions until January 2019. These open
81
derivative contracts hedge the notional U.S. dollar equivalent value of approximately
$1.9 million
. The fair value of the foreign currency hedge was a
$0.2 million
asset and
zero
at
December 31, 2018
and
December 31, 2017
, respectively.
Commodity Price Risk Management
Certain energy sources used in our manufacturing operations are subject to price volatility caused by weather, supply and demand conditions, economic variables, and other unpredictable factors. This volatility is primarily related to the market pricing of natural gas. To mitigate expected fluctuations in market prices and the volatility to earnings and cash flow resulting from changes to pricing of natural gas purchases, from time to time, we will enter into swap contracts and zero cost collar option contracts and designate these contracts as cash flow hedges. We began our commodity price risk hedging program in December 2017 and therefore prior to this date we had no derivative financial instruments designated to hedge commodity price risk. As of
December 31, 2018
, we had
1.8 million
and
1.4 million
mmBTUS (millions of British Thermal Units) in aggregate notional volume of outstanding natural gas commodity swap contracts and zero cost collar option contracts, respectively, designated as cash flow hedges. As of
December 31, 2018
, open commodity contracts hedge forecasted transactions until May 2020. The fair value of the outstanding designated natural gas commodity hedge contracts was
zero
as of
December 31, 2018
and
December 31, 2017
, respectively.
Equity Securities
Our investments in equity securities with a readily determinable fair value totaled
$0.4 million
and
$1.8 million
at
December 31, 2018
and
December 31, 2017
, respectively. The net realized gain/(loss) recognized during the twelve months ended December 31, 2018 and 2017 was
zero
. The net unrealized gain/(loss) as of December 31, 2018 and 2017 was
$(0.3) million
and
$0.3 million
, respectively. The aggregate carrying value of investments in equity securities where fair value is not readily determinable totaled
$1.5 million
as of December 31, 2018 and
$3.0 million
as of December 31, 2017. During the twelve months ended December 31, 2018, we recorded an impairment charge of
$1.5 million
to an equity security, with an original value of
$3.0 million
, where fair value is not readily determinable held within our Performance Materials segment. The charge was based on recently updated expected future cash flow projections for the investment.
Fair-Value Measurements
We have categorized our assets and liabilities that are recorded at fair value, based on the priority of the inputs to the valuation technique, into a three-level fair-value hierarchy. The fair-value hierarchy gives the highest priority to quoted prices in active markets for identical assets or liabilities (Level 1) and the lowest priority to unobservable inputs (Level 3). If the inputs used to measure the assets and liabilities fall within different levels of the hierarchy, the categorization is based on the lowest level input that is significant to the fair-value measurement of the instrument.
The following information is presented for assets and liabilities that are recorded in the consolidated balance sheets at fair value measured on a recurring basis. There were
no
significant transfers of assets and liabilities that are recorded at fair value between Level 1 and Level 2 during the period reported.
|
In millions
|
Level 1
(1)
|
Level 2
(2)
|
Level 3
(3)
|
Total
|
|||||||||||
|
December 31, 2018
|
|||||||||||||||
|
Assets:
|
|||||||||||||||
|
Equity securities
(4)
|
$
|
0.4
|
|
$
|
—
|
|
$
|
—
|
|
$
|
0.4
|
|
|||
|
Foreign currency hedging
(4)
|
—
|
|
0.2
|
|
—
|
|
0.2
|
|
|||||||
|
Commodity hedging
(4)
|
—
|
|
0.1
|
|
—
|
|
0.1
|
|
|||||||
|
Deferred compensation plan investments
(5)
|
1.3
|
|
—
|
|
—
|
|
1.3
|
|
|||||||
|
Total assets
|
$
|
1.7
|
|
$
|
0.3
|
|
$
|
—
|
|
2.0
|
|
||||
|
Liabilities:
|
—
|
|
|||||||||||||
|
Deferred compensation arrangement
(5)
|
$
|
4.6
|
|
$
|
—
|
|
$
|
—
|
|
$
|
4.6
|
|
|||
|
Separation-related reimbursement awards
(6)(7)
|
0.1
|
|
—
|
|
—
|
|
0.1
|
|
|||||||
|
Foreign currency hedging
(6)
|
—
|
|
3.9
|
|
—
|
|
3.9
|
|
|||||||
|
Commodity hedging
(6)
|
—
|
|
0.1
|
|
—
|
|
0.1
|
|
|||||||
|
Total liabilities
|
$
|
4.7
|
|
$
|
4.0
|
|
$
|
—
|
|
$
|
8.7
|
|
|||
82
|
In millions
|
Level 1
(1)
|
Level 2
(2)
|
Level 3
(3)
|
Total
|
|||||||||||
|
December 31, 2017
|
|||||||||||||||
|
Assets:
|
|||||||||||||||
|
Equity securities
(4)
|
$
|
1.8
|
|
$
|
—
|
|
$
|
—
|
|
$
|
1.8
|
|
|||
|
Total assets
|
$
|
1.8
|
|
$
|
—
|
|
$
|
—
|
|
1.8
|
|
||||
|
Liabilities:
|
—
|
|
|||||||||||||
|
Deferred compensation arrangement
(5)(8)
|
$
|
2.0
|
|
$
|
—
|
|
$
|
—
|
|
$
|
2.0
|
|
|||
|
Separation-related reimbursement awards
(6)(7)
|
0.9
|
|
—
|
|
—
|
|
0.9
|
|
|||||||
|
Total liabilities
|
$
|
2.9
|
|
$
|
—
|
|
$
|
—
|
|
$
|
2.9
|
|
|||
__________
|
(1)
|
Quoted prices in active markets for identical assets.
|
|
(2)
|
Quoted prices for similar assets and liabilities in active markets.
|
|
(3)
|
Significant unobservable inputs.
|
|
(4)
|
Included within "Prepaid and other current assets" on the consolidated balance sheet.
|
|
(5)
|
Included within "Other liabilities" on the consolidated balance sheet.
|
|
(6)
|
Included within "Accrued expenses" on the consolidated balance sheet.
|
|
(7)
|
This amount represents an amount due to WestRock associated with WestRock equity awards held by Ingevity employees post Separation. In accordance with the EMA between Ingevity and WestRock entered into in connection with the Separation, we are required to reimburse WestRock the fair market value of awards on the day Ingevity employees exercise their awards. The income and expense, respectively, recognized during the years ended
December 31, 2018
,
2017
, and 2016 was
$0.1 million
,
$0.3 million
, and
$1.6 million
, respectively.
|
|
(8)
|
This amount represents a non-designated foreign currency hedge associated with the purchase price of our acquisition of Perstorp AB's caprolactone business. See Note 24 for more information. The expense recognized during the year ended
December 31, 2018
was
$3.9 million
.
|
At
December 31, 2018
and
2017
, the book value of capital lease obligations was
$80.0 million
and
$80.0 million
, respectively, and the fair value was
$90.4 million
and
$92.9 million
, respectively. The fair value of our capital lease obligations is based on the period-end quoted market prices for the obligations, using Level 1 inputs.
The carrying amount, excluding debt issuance fees, of our variable interest rate long-term debt, not including long-term debt due within one year, was
$366.2 million
and
$365.6 million
as of
December 31, 2018
and
2017
, respectively. The carrying value is a reasonable estimate of the fair value of our outstanding debt as our outstanding debt is variable interest rate debt.
At
December 31, 2018
, the book value of our fixed rate debt, the senior notes issued January 24, 2018, was
$300.0 million
, and the fair value was
$275.2 million
, based on Level 2 inputs.
At
December 31, 2018
and
2017
, the book value of our restricted investment was
$71.2 million
and
$71.3 million
, respectively, and the fair value was
$66.7 million
and
$69.6 million
, respectively, based on Level 1 inputs.
The carrying value of our financial instruments: cash and cash equivalents, other receivables, other payables and accrued liabilities approximate their fair values due to the short-term nature of these financial instruments.
Note 7: Inventories, net
|
December 31,
|
|||||||
|
In millions
|
2018
|
2017
|
|||||
|
Raw materials
|
$
|
36.5
|
|
$
|
40.1
|
|
|
|
Production materials, stores and supplies
|
17.5
|
|
13.4
|
|
|||
|
Finished and in-process goods
|
144.7
|
|
114.3
|
|
|||
|
Subtotal
|
198.7
|
|
167.8
|
|
|||
|
Less: excess of cost over LIFO cost
|
(7.3
|
)
|
(7.8
|
)
|
|||
|
Inventories, net
|
$
|
191.4
|
|
$
|
160.0
|
|
|
83
Approximately
63 percent
and
66 percent
of Inventories, net at
December 31, 2018
and
2017
, respectively, are valued using the LIFO method. During fiscal 2016, inventory quantities carried on a LIFO basis, primarily in our Performance Chemicals' domestic inventory, were reduced which led to liquidations of LIFO inventory quantities. These reductions resulted in a pre-tax decrease of
$3.6 million
, recorded to "Cost of sales" on our consolidated statement of operations. No such reductions occurred in fiscal 2018 or 2017.
Note 8: Property, Plant and Equipment, net
Property, plant and equipment, net consist of the following:
|
December 31,
|
|||||||
|
In millions
|
2018
|
2017
|
|||||
|
Machinery and equipment
|
$
|
857.2
|
|
$
|
792.5
|
|
|
|
Buildings and leasehold equipment
|
113.1
|
|
115.0
|
|
|||
|
Land and land improvements
|
19.6
|
|
18.0
|
|
|||
|
Construction in progress
|
71.2
|
|
35.8
|
|
|||
|
Total cost
|
1,061.1
|
|
961.3
|
|
|||
|
Less: accumulated depreciation
|
(537.3
|
)
|
(522.8
|
)
|
|||
|
Property, plant and equipment, net
(1)
|
$
|
523.8
|
|
$
|
438.5
|
|
|
_______________
|
(1)
|
This includes capital leases related to machinery and equipment at our Wickliffe, Kentucky facility of
$69.2 million
and
$70.0 million
, and net book value of
$6.7 million
and
$7.6 million
at
December 31, 2018
and
2017
, respectively. This also includes capital leases related to our Waynesboro, Georgia manufacturing facility for (a) machinery and equipment of
$6.5 million
and
$5.9 million
and net book value of
$6.0 million
and
$5.7 million
, (b) construction in progress of
$13.7 million
and
$2.1 million
and (c) buildings and leasehold improvements of
$0.1 million
and
zero
at
December 31, 2018
and
2017
, respectively. Amortization expense associated with these capital leases is included within depreciation expense. The payments remaining under these capital leases obligations are included within Note 19.
|
Depreciation expense was
$41.9 million
,
$35.5 million
, and
$33.2 million
for the years ended
December 31, 2018
,
2017
and
2016
, respectively.
Note 9: Goodwill and Other Intangible Assets, net
The changes in the carrying amount of goodwill by operating segment are as follows:
|
Operating Segments
|
|||||||||||
|
In millions
|
Performance Chemicals
|
Performance Materials
|
Total
|
||||||||
|
December 31, 2016
|
$
|
8.1
|
|
$
|
4.3
|
|
$
|
12.4
|
|
||
|
Foreign currency translation
|
—
|
|
—
|
|
—
|
|
|||||
|
December 31, 2017
|
$
|
8.1
|
|
$
|
4.3
|
|
$
|
12.4
|
|
||
|
Foreign currency translation
|
(0.4
|
)
|
—
|
|
(0.4
|
)
|
|||||
|
Goodwill acquired
(1)
|
118.7
|
|
—
|
|
118.7
|
|
|||||
|
December 31, 2018
|
$
|
126.4
|
|
$
|
4.3
|
|
$
|
130.7
|
|
||
_______________
(1) See Footnote 17 for more information about the Pine Chemicals Acquisition.
Our fiscal year
2018
annual goodwill impairment test was performed as of October 1,
2018
. We determined
no
goodwill impairment existed. There were no events or circumstances indicating that goodwill might be impaired as of
December 31, 2018
.
84
All of Ingevity's other intangible assets, net are related to the Performance Chemicals operating segment. The following table summarizes intangible assets:
|
December 31, 2018
|
December 31, 2017
|
||||||||||||||||||||||
|
In millions
|
Gross carrying amount
|
Accumulated amortization
|
Net
|
Gross carrying amount
|
Accumulated amortization
|
Net
|
|||||||||||||||||
|
Brands
(1)
|
$
|
11.4
|
|
$
|
9.8
|
|
$
|
1.6
|
|
$
|
13.9
|
|
$
|
11.8
|
|
$
|
2.1
|
|
|||||
|
Customer contracts and relationships
|
151.0
|
|
30.3
|
|
120.7
|
|
28.2
|
|
25.4
|
|
2.8
|
|
|||||||||||
|
Other
|
4.1
|
|
0.8
|
|
3.3
|
|
—
|
|
—
|
|
—
|
|
|||||||||||
|
Other intangibles, net
(2)
|
$
|
166.5
|
|
$
|
40.9
|
|
$
|
125.6
|
|
$
|
42.1
|
|
$
|
37.2
|
|
$
|
4.9
|
|
|||||
_______________
(1) Represents trademarks, trade names and know-how.
(2) See Footnote 17 for more information about the Pine Chemicals Acquisition and the related increase in Intangible assets.
The amortization expense related to our intangible assets in the table above for the years ended
December 31, 2018
,
2017
and
2016
is shown in the table below. Amortization expense is included within "Cost of sales" and "Selling, general and administrative expenses" on our consolidated statements of operations.
|
Years Ended December 31,
|
|||||||||||
|
In millions
|
2018
|
2017
|
2016
|
||||||||
|
Amortization expense
(1)
|
$
|
12.3
|
|
$
|
2.4
|
|
$
|
2.7
|
|
||
_______________
(1) See Footnote 17 for more information about the Pine Chemicals Acquisition and the related increase in Amortization expense.
Based on the current carrying values of intangible assets, estimated pre-tax amortization expense for the next five years is as follows: 2019 -
$14.3 million
, 2020 -
$13.2 million
, 2021 -
$12.3 million
, 2022 -
$12.2 million
and 2023 -
$12.2 million
. The estimated pre-tax amortization expense may fluctuate due to changes in foreign currency.
Note 10: Debt, including Capital Lease Obligations
Revolving Credit and Term Loan Facility Amendments
On August 7, 2018, we entered into an Incremental Facility Agreement and Amendment No. 2 (the “Amendment”) to the Credit Agreement, dated as of March 7, 2016 (the “Existing Credit Agreement”, and as amended, supplemented or otherwise modified from time to time, including pursuant to the Incremental Facility Agreement and Amendment No. 1, dated as of August 21, 2017, and the Amendment, the “Amended Credit Agreement”). Among other things, the Amendment (i) increased the revolving commitments under the Existing Credit Agreement by
$200.0 million
(the “Incremental Revolving Commitments”) to
$750 million
and (ii) reduced the Applicable Rate (as defined in the Amended Credit Agreement). The Amendment also extended the maturity date for the loans and commitments under the Existing Credit Agreement to August 7, 2023.
The Incremental Revolving Commitments have terms identical to those of the Revolving Commitments under the Existing Credit Agreement and will be treated as a single class with such existing commitments under the Amended Credit Agreement.
Loans under the Amended Credit Agreement bear interest at either (a) an adjusted base rate or (b) an adjusted LIBOR rate, in each case, plus an applicable margin (the “Applicable Margin”), in the case of base rate loans, ranging between
zero
percent and
0.75
percent, and in the case of adjusted LIBOR rate loans, ranging between
1.00
percent and
1.75
percent. The Applicable Margin is based on a total leverage based pricing grid. Fees to revolving lenders under the Amended Credit Agreement, including fees in respect of the Incremental Revolving Commitments, include (i) commitment fees, based on a percentage of the daily unused portions of the facility, ranging from
0.15
percent to
0.30
percent and (ii) customary letter of credit fees.
As consideration for the Amendment, the Company paid to each lender under the Existing Credit Agreement a consent fee equal to
0.05
percent of the aggregate principal amount of the commitments and outstanding loans held by such lender
85
immediately prior to the Closing Date. Fees of
$1.4 million
were incurred to secure the Amended Credit Agreement. These fees have been deferred and will be amortized over the term of the arrangement.
The credit facilities under the Amended Credit Agreement will mature on August 7, 2023. The Initial Term Loans and the Incremental Term A Loans (each, as defined in the Amended Credit Agreement) will amortize at a rate equal to
1.25
percent per quarter starting in September 2019, with the balance due at maturity.
2018 Senior Notes
On January 24, 2018, we issued
$300.0 million
aggregate principal amount of
4.50 percent
senior unsecured notes due 2026 (the “Notes”). The Notes were issued pursuant to an indenture dated as of January 24, 2018 (the “Indenture”), by and among Ingevity, the subsidiary guarantors party thereto and U.S. Bank National Association, as trustee. The Notes were offered and sold only to persons reasonably believed to be qualified institutional buyers pursuant to Rule 144A and to certain non-U.S. persons outside the U.S. pursuant to Regulation S under the Securities Act of 1933, as amended (the “Securities Act”). The Notes have not been registered under the Securities Act or any state securities laws and may not be offered or sold in the U.S. absent registration or an applicable exemption from the registration requirements of the Securities Act and applicable state laws.
The net proceeds from the sale of the Notes, after deducting deferred financing fees of
$5.7 million
were approximately
$294.3 million
. We used the net proceeds from the sale of the Notes to finance, in part, our purchase of substantially all the assets primarily used in the pine chemicals business of Georgia-Pacific Chemicals LLC and Georgia-Pacific LLC.
Interest payments on the Notes are due semiannually in arrears on February 1st and August 1st of each year, beginning on August 1, 2018, at a rate of
4.50 percent
per year. The Notes will mature on February 1, 2026.
Financial Covenants
The Indenture contains certain customary covenants (including covenants limiting Ingevity's and its restricted subsidiaries’ ability to grant or permit liens on certain property securing debt, declare or pay dividends, make distributions on or repurchase or redeem capital stock, make investments in unrestricted subsidiaries, engage in sale and lease-back transactions, and engage in a consolidation or merger, or sell, transfer or otherwise dispose of all or substantially all of the assets of our and our restricted subsidiaries, taken as a whole) and events of default (subject in certain cases to customary exceptions, as well as grace and cure periods). The occurrence of an event of default under the Indenture could result in the acceleration of the Notes and could cause a cross-default that could result in the acceleration of other indebtedness of Ingevity and its subsidiaries.
The revolving credit facility and term loan facility include financial covenants requiring Ingevity to maintain on a consolidated basis a maximum total leverage ratio of
4.00
to 1.00 (which may be increased to
4.50
to 1.00 under certain circumstances) and a minimum interest coverage ratio of
3.00
to 1.00. We were in compliance with all covenants at
December 31, 2018
.
As part of the Separation, WestRock required Ingevity to contribute
$68.9 million
in a trust managed in order to secure repayment of the capital lease obligation at maturity. The trust, presented as restricted investment on our consolidated balance sheet, purchased long term bonds that mature in 2025 and 2026. The principal received at maturity of the bonds along with interest income that is reinvested in the trust are expected to be equal to or more than the
$80.0 million
capital lease obligation that is due in 2027. Because the provisions of the trust provide us the ability, and it is our intent, to hold the investments to maturity, the investments held by the trust are accounted for as held to maturity; therefore, they are held at their amortized cost. The fair value of the investments within the trust was
$66.7 million
and
$69.6 million
as of
December 31, 2018
and
2017
, respectively (see Note 6 for more information). The investments held by the trust earn interest at the stated coupon rate of the invested bonds. Interest earned on the investments held by the trust is recognized as interest income and presented within Interest income on our consolidated statement of operations.
86
Current and long-term debt including capital lease obligations consisted of the following:
|
December 31, 2018
|
December 31,
|
||||||||||
|
In millions
|
Interest rate
|
Maturity date
|
2018
|
2017
|
|||||||
|
Revolving Credit Facility
(1)
|
3.77%
|
2023
|
$
|
—
|
|
$
|
—
|
|
|||
|
Term Loan Facility
|
3.77%
|
2023
|
375.0
|
|
375.0
|
|
|||||
|
Senior Notes
|
4.50%
|
2026
|
300.0
|
|
—
|
|
|||||
|
Capital lease obligations
|
7.67%
|
2027
|
80.0
|
|
80.0
|
|
|||||
|
Other notes payable
|
5.02%
|
2018-2019
|
3.9
|
|
—
|
|
|||||
|
Total debt including capital lease obligations
|
$
|
758.9
|
|
$
|
455.0
|
|
|||||
|
Less: debt issuance costs
|
6.5
|
|
1.6
|
|
|||||||
|
Total debt including capital lease obligations, net of debt issuance costs
|
$
|
752.4
|
|
$
|
453.4
|
|
|||||
|
Less: debt maturing within one year
(2)
|
11.2
|
|
9.4
|
|
|||||||
|
Long-term debt including capital lease obligations
|
$
|
741.2
|
|
$
|
444.0
|
|
|||||
_______________
|
(1)
|
Letters of credit outstanding under the revolving credit facility were
$1.9 million
and
$1.8 million
and available funds under the facility were
$748.1 million
and
$548.2 million
at
December 31, 2018
and
December 31, 2017
, respectively. On February 13, 2019, the revolving credit facility was utilized as the primary source of funds (along with available cash on hand) to close our Caprolactone Acquisition. Our available capacity under our revolving credit facility immediately following this drawdown was
$113.1 million
. See Note 24 for more information of the Caprolactone Acquisition.
|
|
(2)
|
Debt maturing within one year is included in "Current maturities of long-term debt" on the consolidated balance sheet.
|
Note 11: Share-based Compensation
Prior to the Separation, share-based compensation expense was allocated to Ingevity based on the portion of WestRock's incentive share-based compensation program in which Ingevity employees participated. Share-based compensation expense allocated by WestRock to Ingevity was
zero
,
zero
, and
$0.5 million
for the years ended
December 31, 2018
,
2017
and
2016
, respectively. This allocated share-based compensation expense is included in the overall allocations from WestRock discussed further in Note 13.
Equity Incentive Plan
Adopted at Separation, the Ingevity Corporation 2016 Omnibus Incentive Plan grants certain corporate officers, key employees and non-employee directors of Ingevity and subsidiaries different forms of benefits, including stock options, RSUs, DSUs and PSUs. The Ingevity Corporation 2016 Omnibus Incentive Plan has a maximum shares reserve of
4,000,000
for the grant of equity awards. As of
December 31, 2018
,
3,258,944
shares under the Ingevity Corporation 2016 Omnibus Incentive Plan are still available for grants, assuming that Ingevity performs at the target performance level in each year of the three-year performance period for PSU awards. Ingevity's Compensation Committee determines the long-term incentive mix, including stock options, RSUs and PSUs, and may authorize new grants annually.
Employee Stock Purchase Plan
On December 9, 2016, our Compensation Committee and Board of Directors approved the 2017 Ingevity Corporation Employee Stock Purchase Plan ("ESPP"), which was approved by Ingevity’ stockholders on April 27, 2017. The ESPP allows eligible employee participants to purchase no more than
5,000
shares of our common stock at a discount through payroll deductions up to
15 percent
of their compensation deducted during the purchase period. However, no participant shall be permitted to purchase common stock with a value greater than $25,000 in any calendar year. The ESPP is a tax-qualified plan under Section 423 of the Internal Revenue Code. The ESPP consists of a one month enrollment period preceding the three-month purchase period. Employees purchase shares in each purchase period at
85 percent
of the market value of our common stock at either the beginning of the offering period or the end of the purchase period, whichever price is lower.
Under the ESPP, a total of
250,000
shares of Ingevity's common stock are reserved and authorized for issuance to participating U.S. employees, as defined by the ESPP, which excludes certain officers of Ingevity. As of
December 31, 2018
,
87
206,255
shares under the ESPP are still available for issuance. The initial offering period under the ESPP began on July 1, 2017. During fiscal
2018
, there were
31,862
shares issued under the ESPP at an average price of
$57.81
.
Our share-based compensation expense recognized post Separation associated with Ingevity's incentive plan and the ESPP is included in the table below.
|
Years Ended December 31,
|
|||||||||||
|
In millions
|
2018
|
2017
|
2016
|
||||||||
|
Stock option expense
|
$
|
2.3
|
|
$
|
1.5
|
|
$
|
0.7
|
|
||
|
ESPP expense
|
0.5
|
|
0.2
|
|
—
|
|
|||||
|
RSU, DSU and PSU expense
|
9.7
|
|
8.4
|
|
4.0
|
|
|||||
|
Total share-based compensation expense
(1)
|
12.5
|
|
10.1
|
|
4.7
|
|
|||||
|
Income tax benefit
|
(2.9
|
)
|
(3.8
|
)
|
(1.9
|
)
|
|||||
|
Total share-based compensation expense, net of tax
|
$
|
9.6
|
|
$
|
6.3
|
|
$
|
2.8
|
|
||
_______________
|
(1)
|
Amounts reflected in "Selling, general and administrative expenses" on the Consolidated Statements of Operations.
|
Stock Options
All stock options vest in accordance with vesting conditions set by the compensation committee of Ingevity's Board of Directors. Stock options granted to date have vesting periods of
one
to
three
years from the date of grant. Incentive and non-qualified options granted under the Plan expire no later than
10
years from the grant date. Expense related to stock options granted from the Separation through December 31, 2018 was based on the assumptions shown in the table below:
|
Years Ended December 31,
|
|||||||||||
|
Weighted-average assumptions used to calculate expense for stock options
|
2018
|
2017
|
2016
|
||||||||
|
Risk-free interest rate
|
2.7%
|
2.1%
|
1.6%
|
||||||||
|
Average life of options (years)
|
6.5
|
6.5
|
6.5
|
||||||||
|
Volatility
|
27.5%
|
35.0%
|
35.0%
|
||||||||
|
Dividend yield
|
—
|
|
—
|
|
—
|
|
|||||
|
Fair value per stock option
|
$
|
25.51
|
|
$
|
20.71
|
|
$
|
10.61
|
|
||
88
The following table summarizes Ingevity's stock option activity for the period from the Separation through December 31, 2018, as there was no Ingevity stock option activity prior to Separation.
|
Number of Options
(in thousands)
|
Weighted-average exercise price (per share)
|
Weighted-average remaining contractual term (years)
|
Aggregate intrinsic value (in thousands)
|
|||||||||
|
Outstanding, May 16, 2016
|
—
|
|
$
|
—
|
|
|||||||
|
Granted
|
208
|
|
28.03
|
|
||||||||
|
Exercised
|
—
|
|
—
|
|
||||||||
|
Forfeited
|
—
|
|
—
|
|
||||||||
|
Canceled
|
—
|
|
—
|
|
||||||||
|
Outstanding, December 31, 2016
|
208
|
|
$
|
28.03
|
|
9.4
|
$
|
5,573
|
|
|||
|
Granted
|
109
|
|
53.11
|
|
||||||||
|
Exercised
|
(7
|
)
|
27.38
|
|
||||||||
|
Forfeited
|
(7
|
)
|
31.97
|
|
||||||||
|
Canceled
|
—
|
|
—
|
|
||||||||
|
Outstanding, December 31, 2017
|
303
|
|
$
|
36.72
|
|
8.7
|
$
|
10,022
|
|
|||
|
Granted
|
110
|
|
74.91
|
|
||||||||
|
Exercised
|
(6
|
)
|
32.37
|
|
||||||||
|
Forfeited
|
(4
|
)
|
51.66
|
|
||||||||
|
Canceled
|
—
|
|
—
|
|
||||||||
|
Outstanding, December 31, 2018
|
403
|
|
$
|
46.98
|
|
8.1
|
$
|
14,450
|
|
|||
|
Exercisable, December 31, 2018
|
9
|
|
$
|
46.14
|
|
8.0
|
$
|
352
|
|
|||
The aggregate intrinsic values in the table above represent the total pre-tax intrinsic value (the difference between Ingevity's closing stock price on the last trading day of the period and the exercise price, multiplied by the number of in-the-money options) that would have been received by the option holders had all option holders exercised their in-the-money options at each year end. The amount changes based on the fair market value of Ingevity's stock.
As of
December 31, 2018
,
$4.6 million
of total unrecognized compensation cost related to stock options is expected to be recognized over a weighted-average period of
1.0
year.
Restricted Stock Units, Deferred Stock Units and Performance-based Restricted Stock Units
All RSUs, DSUs and PSUs vest in accordance with vesting conditions set by the Compensation Committee of Ingevity’s Board of Directors. RSUs and DSUs granted to date have vesting periods ranging from less than
one year
to
three years
from the date of grant. PSUs granted to date have vesting periods of
three
years from the date of grant, including grants that have a cumulative
three
-year performance period, subject to satisfaction of the applicable performance goals established for the respective grant. We periodically assess the probability of achievement of the performance criteria and adjust the amount of compensation expense accordingly. Compensation expense is recognized over the vesting period and adjusted for the probability of achievement of the performance criteria.
89
The following table summarizes Ingevity's RSUs, DSUs and PSUs activity for the period from the Separation through
December 31, 2018
, as there was no Ingevity stock option activity prior to Separation.
|
RSUs and DSUs
|
PSUs
|
||||||||||||
|
Number of Units
(in thousands)
(1)
|
Weighted average grant date fair value (per share)
|
Number of Units
(in thousands)
(1)
|
Weighted average grant date fair value (per share)
|
||||||||||
|
Nonvested, May 15, 2016
|
—
|
|
$
|
—
|
|
—
|
|
$
|
—
|
|
|||
|
Granted
|
190
|
|
28.08
|
|
127
|
|
28.06
|
|
|||||
|
Vested
|
(23
|
)
|
27.90
|
|
—
|
|
—
|
|
|||||
|
Forfeited
|
—
|
|
—
|
|
—
|
|
—
|
|
|||||
|
Nonvested, December 31, 2016
|
167
|
|
$
|
28.08
|
|
127
|
|
$
|
28.06
|
|
|||
|
Granted
|
61
|
|
57.21
|
|
66
|
|
53.11
|
|
|||||
|
Vested
|
(75
|
)
|
28.47
|
|
—
|
|
—
|
|
|||||
|
Forfeited
|
(4
|
)
|
31.00
|
|
(9
|
)
|
27.90
|
|
|||||
|
Nonvested, December 31, 2017
(2)
|
149
|
|
$
|
39.67
|
|
184
|
|
$
|
37.01
|
|
|||
|
Granted
|
56
|
|
77.98
|
|
56
|
|
74.91
|
|
|||||
|
Vested
|
(89
|
)
|
60.94
|
|
—
|
|
—
|
|
|||||
|
Forfeited
|
(1
|
)
|
61.15
|
|
(1
|
)
|
52.18
|
|
|||||
|
Nonvested, December 31, 2018
(2)
|
115
|
|
$
|
60.94
|
|
239
|
|
$
|
45.88
|
|
|||
_______________
|
(1)
|
The number granted represents the number of shares issuable upon vesting of RSUs and DSUs. For PSUs the number granted represents the number of shares issuable upon vesting assuming that Ingevity performs at the target performance level in each year of the three-year performance period.
|
|
(2)
|
The nonvested RSU and DSU number of shares at
December 31, 2018
,
2017
, and 2016 includes
10 thousand
,
8 thousand
, and
zero
DSUs, respectively.
|
As of
December 31, 2018
and
December 31, 2017
, there was
$22.0 million
and
$12.6 million
, respectively, of unrecognized share-based compensation expense related to nonvested awards. Those costs are expected to be recognized over a weighted-average period of
one
year.
90
Note 12: Equity
Summarized below is the roll forward of accumulated other comprehensive income (loss), net of tax.
|
In millions
|
Foreign currency adjustments
|
Derivative Instruments
|
Pension and other postretirement benefits
|
Total
|
|||||||||||
|
Accumulated other comprehensive income (loss), net of tax at December 31, 2015
|
$
|
(15.5
|
)
|
$
|
(1.0
|
)
|
$
|
—
|
|
$
|
(16.5
|
)
|
|||
|
2016 Activity
|
|||||||||||||||
|
Other comprehensive income (loss) before reclassifications
|
(2.9
|
)
|
—
|
|
(0.6
|
)
|
(3.5
|
)
|
|||||||
|
Amounts reclassified from accumulated other comprehensive income (loss)
|
—
|
|
1.0
|
|
—
|
|
1.0
|
|
|||||||
|
Accumulated other comprehensive income (loss), net of tax at December 31, 2016
|
$
|
(18.4
|
)
|
$
|
—
|
|
$
|
(0.6
|
)
|
$
|
(19.0
|
)
|
|||
|
2017 Activity
|
|||||||||||||||
|
Other comprehensive income (loss) before reclassifications
|
8.3
|
|
(0.1
|
)
|
(0.7
|
)
|
7.5
|
|
|||||||
|
Amounts reclassified from accumulated other comprehensive income (loss)
(1)
|
—
|
|
0.1
|
|
—
|
|
0.1
|
|
|||||||
|
Reclassification of certain deferred tax effects
(3)
|
—
|
|
—
|
|
(0.3
|
)
|
(0.3
|
)
|
|||||||
|
Accumulated other comprehensive income (loss), net of tax at December 31, 2017
|
$
|
(10.1
|
)
|
$
|
—
|
|
$
|
(1.6
|
)
|
$
|
(11.7
|
)
|
|||
|
2018 Activity
|
|||||||||||||||
|
Other comprehensive income (loss) before reclassifications
|
(6.3
|
)
|
1.3
|
|
(0.3
|
)
|
(5.3
|
)
|
|||||||
|
Amounts reclassified from accumulated other comprehensive income (loss)
(1)
|
—
|
|
(0.9
|
)
|
0.2
|
|
(0.7
|
)
|
|||||||
|
Accumulated other comprehensive income (loss), net of tax at December 31, 2018
|
$
|
(16.4
|
)
|
$
|
0.4
|
|
$
|
(1.7
|
)
|
$
|
(17.7
|
)
|
|||
_______________
|
(1)
|
Amounts relate to derivative instruments entered to hedge foreign currency exchange risks on revenue transactions and price risk on natural gas purchases, and therefore were reclassified to "Net sales" and "Cost of sales", respectively. Amounts were reclassified when the hedged items are recognized in the consolidated statements of operations.
|
|
(2)
|
Amounts reclassified to retained earnings due to early adoption of ASU 2018-02.
|
Noncontrolling interest acquisition
On August 1, 2018, we completed the acquisition of the remaining
30 percent
noncontrolling interest in Purification Cellutions, LLC, now known as Ingevity Georgia, LLC, which was treated as a partnership for tax purposes, for a purchase price of
$80.0 million
. The acquisition resulted in the elimination of Noncontrolling interest of
$11.4 million
and the recognition of a Deferred tax asset of
$14.3 million
, with the remainder being recorded against Additional paid in capital of
$54.3 million
in our Consolidated Financial Statements.
Share repurchases
On February 20, 2017, the Board of Directors authorized the repurchase of up to
$100.0 million
of our common stock. In addition, on November 1, 2018, the Board of Directors approved the authorization for the repurchase of up to an additional
$350.0 million
of Ingevity’s outstanding common stock. The approval of this
$350.0 million
is in addition to the
$100.0 million
share repurchase program approved in February 2017. The repurchase program does not include a specific timetable or price targets and may be suspended or terminated at any time. Shares may be purchased through open market or privately negotiated transactions at the discretion of management based on its evaluation of market prevailing conditions and other factors.
91
During the year ended
December 31, 2018
, we repurchased
$47.4 million
in common shares, representing
561,000
shares of our common stock at a weighted average cost per share of
$84.59
. At
December 31, 2018
,
$396.0 million
remained unused under our Board-authorized repurchase program. We record shares of common stock repurchased at cost as treasury stock, resulting in a reduction of stockholders’ equity in the consolidated balance sheets. When the treasury shares are contributed under our employee benefit plans or issued for option exercises, we use a first-in, first-out (“FIFO”) method for determining cost. The difference between the cost of the shares and the market price at the time of contribution to an employee benefit plan is added to or deducted from the related capital in excess of par value of common stock.
Note 13: Transactions with WestRock and Related Parties
The consolidated statements of operations prior to May 15, 2016, include allocations from WestRock as summarized below:
|
Years Ended December 31,
|
|||||||||||
|
In millions
|
2018
|
2017
|
2016
|
||||||||
|
Cost of sales
|
$
|
—
|
|
$
|
—
|
|
$
|
5.7
|
|
||
|
Selling, general and administrative expenses
|
—
|
|
—
|
|
6.5
|
|
|||||
|
Interest expense, net
|
—
|
|
—
|
|
7.2
|
|
|||||
|
Total allocated cost
(1)
|
$
|
—
|
|
$
|
—
|
|
$
|
19.4
|
|
||
_______________
|
(1)
|
Allocated costs represent costs necessary to support Ingevity's operations which include governance and corporate functions such as information technology, accounting, human resources, accounts payable and other direct services including the interest on WestRock debt incurred to provide such services.
|
Prior to the Separation, we purchased certain raw materials from WestRock that were included in cost of sales. Purchases for the year ended December 31, 2016 were
$20.1 million
. At Separation, we entered into a long-term supply agreement with WestRock pursuant to which we purchase all of the CTO output from WestRock’s existing kraft mills at the time of separation, subject to certain exceptions. Beginning in 2025, either party may provide a notice to the other party terminating the agreement five years from the date of such notice. Beginning one year after such notice, the quantity of products provided by WestRock under the WestRock agreement will be gradually reduced over a four-year period based on the schedule set forth in the WestRock agreement. In addition, from 2022 until 2025, either party may provide one-year notice to remove a kraft mill as a supply source. The
two
largest kraft mills under the WestRock agreement currently are expected to supply approximately
19%
to
20%
and
17%
to
18%
, respectively, of the total amount of products expected to be supplied under our agreement with WestRock. In the event that WestRock exercises its right to terminate our supply agreement with them or remove a kraft mill as a supply source, we may be able to obtain substitute supplies of CTO from other suppliers, spot purchases or a new contract with WestRock. The agreement with WestRock includes pricing terms based on market prices. Under this agreement, based on WestRock’s current output, we currently expect to source approximately
30%
to
40%
of our CTO requirements through 2025 based on the maximum operating rates of our three Performance Chemicals' facilities. As further described in Note 1, the Separation Agreements govern the relationship among Ingevity and WestRock following the Separation and provide for the allocation of various assets, liabilities, rights and obligations and include arrangements for transition services to be provided by WestRock to Ingevity.
Note 14: Retirement Plans
Prior to the Separation, WestRock offered various long-term benefits to its employees, including Ingevity employees. In these cases, the participation of our employees in these plans is reflected in the Consolidated Financial Statements as though Ingevity participated in a multi-employer plan with the other businesses of WestRock. For periods prior to the Separation, assets and liabilities of such plans were retained by WestRock. Net periodic benefit costs allocated to Ingevity associated with these pension plans, for the year ended December 31, 2016 were
$3.2 million
. This allocated net periodic benefit cost is included in the overall allocations from WestRock, discussed further in Note 13.
92
Defined Contribution Plans
U.S. Ingevity employees ceased participating in the WestRock 401(k) plan on December 31, 2015 preceding the Separation. Effective January 1, 2016, the Ingevity Corporation Retirement Savings Plan ("Plan") was established. The Plan is a qualified salary-reduction plan under Section 401(k) of the U.S. Internal Revenue Code. Eligible U.S. employees may participate by contributing a portion of their compensation. For non-union eligible employees participating in the Plan Ingevity makes matching contributions up to
six
percent of the employee deferral. In addition to the matching contributions, Ingevity also makes a non-elective contribution of
three
percent of eligible compensation per payroll for non-union employees. For union eligible employees participating in the Plan Ingevity makes matching contributions up to
100
percent of the first
three
percent of the employee deferrals and
50
percent on the next
two
percent of deferrals.
U.S. salaried employees who were no longer eligible to participate in the WestRock defined benefit pension plan, as of the date of Separation, were provided an enhanced contribution into the Plan. The enhanced benefits consist of a transition contribution of
four
or
ten
percent of the employee’s eligible compensation for employees who were grandfathered in the WestRock cash balance and final average pay pension plan, respectively. The transition contributions will continue to December 31, 2020, unless the grandfathered employee terminates employment sooner.
Charges associated with employer contributions to the Plan were
$10.2 million
,
$9.3 million
, and
$7.7 million
for the years ended
December 31, 2018
,
2017
, and
2016
, respectively.
Defined Benefit Pension and Postretirement Plans
In conjunction with the Separation, Ingevity employees stopped participating in WestRock pension and post-retirement benefit plans. On May 16, 2016, Ingevity established new qualified and non-qualified benefit plans, similar in design to the WestRock plans, to continue the pension and post-retirement benefits provided to our employees and retirees based on the obligations assumed from WestRock. As further defined by the EMA, Ingevity assumed certain domestic and international pension and other post-retirement benefit obligations from WestRock on the date of Separation. The assumed retirement obligations consisted of accrued defined benefit obligations earned by Ingevity domestic hourly union employees, as of the day of Separation, net of contributed assets; accrued obligations from a frozen non-qualified defined benefit pension plan for certain salaried and former salaried employees of Ingevity; and other post-retirement medical and life insurance benefits.
We are required to recognize in our consolidated balance sheets the overfunded and underfunded status of our defined benefit postretirement plans. The overfunded and underfunded status is defined as the difference between the fair value of plan assets and the projected benefit obligation. We are also required to recognize, as a component of other comprehensive income, the actuarial gains and losses and the prior service costs and credits that arise during the period.
93
The following table summarizes the weighted average assumptions used and components of our defined benefit postretirement plans. The following tables also reflect a measurement date of December 31:
|
Pensions
|
Other Benefits
|
||||||||||||||
|
December 31,
|
|||||||||||||||
|
In millions, except percentages
|
2018
|
2017
|
2018
|
2017
|
|||||||||||
|
Following are the weighted average assumptions used to determine the benefit obligations at December 31:
|
|||||||||||||||
|
Discount rate - qualified benefit plans
|
4.20
|
%
|
3.55
|
%
|
—
|
%
|
—
|
%
|
|||||||
|
Discount rate - non-qualified benefit plans
|
4.15
|
%
|
3.55
|
%
|
4.10
|
%
|
3.45
|
%
|
|||||||
|
Rate of compensation increase
|
N/A
|
N/A
|
N/A
|
N/A
|
|||||||||||
|
Change in projected benefit obligation
|
|||||||||||||||
|
Project benefit obligation at January 1
|
$
|
28.8
|
|
$
|
24.4
|
|
$
|
0.8
|
|
$
|
0.7
|
|
|||
|
Service cost
|
1.6
|
|
1.2
|
|
—
|
|
—
|
|
|||||||
|
Interest cost
|
1.0
|
|
1.0
|
|
—
|
|
—
|
|
|||||||
|
Actuarial loss (gain)
|
(2.0
|
)
|
2.0
|
|
(0.1
|
)
|
0.1
|
|
|||||||
|
Plan amendments
|
0.5
|
|
0.6
|
|
—
|
|
—
|
|
|||||||
|
Benefit payments
|
(0.5
|
)
|
(0.4
|
)
|
—
|
|
—
|
|
|||||||
|
Projected benefit obligation at December 31
(1)
|
29.4
|
|
28.8
|
|
0.7
|
|
0.8
|
|
|||||||
|
Change in plan assets
|
|||||||||||||||
|
Fair value of plan asset at January 1
|
22.6
|
|
19.2
|
|
—
|
|
—
|
|
|||||||
|
Actual return on plan assets
|
(1.1
|
)
|
2.4
|
|
—
|
|
—
|
|
|||||||
|
Company contributions
|
1.6
|
|
1.4
|
|
—
|
|
—
|
|
|||||||
|
Benefit payments
|
(0.5
|
)
|
(0.4
|
)
|
—
|
|
—
|
|
|||||||
|
Fair value of plan assets at December 31
|
22.6
|
|
22.6
|
|
—
|
|
—
|
|
|||||||
|
Funded Status
|
|||||||||||||||
|
Net Funded Status of the Plan (Liability)
|
$
|
(6.8
|
)
|
$
|
(6.2
|
)
|
$
|
(0.7
|
)
|
$
|
(0.8
|
)
|
|||
|
Amount recognized in the consolidated balance sheets:
|
|||||||||||||||
|
Pension and other postretirement benefit asset
(2)
|
$
|
—
|
|
$
|
—
|
|
$
|
—
|
|
$
|
—
|
|
|||
|
Pension and other postretirement benefit (liability)
(2)
|
(6.8
|
)
|
(6.2
|
)
|
(0.7
|
)
|
(0.8
|
)
|
|||||||
|
Total Net Funded Status of the Plan (Liability)
|
$
|
(6.8
|
)
|
$
|
(6.2
|
)
|
$
|
(0.7
|
)
|
$
|
(0.8
|
)
|
|||
_______________
|
(1)
|
The accumulated benefit obligation for all years presented equals the projected benefit obligation, for each plan respectively.
|
|
(2)
|
Asset balance is included in "Other assets" and liability balances are included in "Other liabilities" on the consolidated balance sheet.
|
94
Amounts Recognized in Other Comprehensive Income (Loss)
Changes in plan assets and benefit obligations recognized in other comprehensive income (loss) are as follows:
|
Pensions
|
Other Benefits
|
||||||||||||||||||||||
|
Years Ended December 31,
|
|||||||||||||||||||||||
|
In millions
|
2018
|
2017
|
2016
|
2018
|
2017
|
2016
|
|||||||||||||||||
|
Current year net actuarial loss (gain)
|
$
|
—
|
|
$
|
1.1
|
|
$
|
0.9
|
|
$
|
(0.1
|
)
|
$
|
0.1
|
|
$
|
(0.1
|
)
|
|||||
|
Current year prior service cost (credit)
|
0.5
|
|
—
|
|
0.1
|
|
—
|
|
—
|
|
—
|
|
|||||||||||
|
Curtailments
|
(0.2
|
)
|
—
|
|
—
|
|
—
|
|
—
|
|
—
|
|
|||||||||||
|
Total recognized in other comprehensive (income) loss, before taxes
|
0.3
|
|
1.1
|
|
1.0
|
|
(0.1
|
)
|
0.1
|
|
(0.1
|
)
|
|||||||||||
|
Total recognized in other comprehensive (income) loss, after taxes
|
$
|
0.3
|
|
$
|
0.7
|
|
$
|
0.5
|
|
$
|
(0.1
|
)
|
$
|
—
|
|
$
|
0.1
|
|
|||||
Amounts Recognized in Accumulated Other Comprehensive Income (Loss)
The amounts in accumulated other comprehensive income (loss) that have not yet been recognized as components of net periodic benefit cost are as follows:
|
Pensions
|
Other Benefits
|
||||||||||||||
|
December 31,
|
|||||||||||||||
|
In millions
|
2018
|
2017
|
2018
|
2017
|
|||||||||||
|
Net actuarial (gain) loss
|
$
|
1.3
|
|
$
|
1.4
|
|
$
|
(0.1
|
)
|
$
|
(0.1
|
)
|
|||
|
Prior service cost (credit)
|
0.9
|
|
0.7
|
|
—
|
|
—
|
|
|||||||
|
Accumulated other comprehensive (income) loss, before taxes
|
2.2
|
|
2.1
|
|
(0.1
|
)
|
(0.1
|
)
|
|||||||
|
Accumulated other comprehensive (income) loss, after taxes
|
$
|
1.7
|
|
$
|
1.7
|
|
$
|
(0.1
|
)
|
$
|
(0.1
|
)
|
|||
The estimated net actuarial loss and prior service cost that will be amortized from accumulated other comprehensive income (loss) into our net annual benefit cost during
2019
are
zero
and less than
$0.1 million
, respectively.
95
Net Annual Benefit Costs Assumptions
The following table summarizes the weighted-average assumptions used for the components of net annual benefit cost:
|
Pensions
|
Other Benefits
|
||||||||||||||||||||||
|
Years Ended December 31,
|
|||||||||||||||||||||||
|
In millions, except percentages
|
2018
|
2017
|
2016
|
2018
|
2017
|
2016
|
|||||||||||||||||
|
Discount rate - qualified benefit plans
(1)
|
3.55
|
%
|
4.10
|
%
|
4.00
|
%
|
—
|
%
|
—
|
%
|
—
|
%
|
|||||||||||
|
Discount rate - non-qualified benefit plans
(1)
|
3.55
|
%
|
4.15
|
%
|
3.75
|
%
|
3.45
|
%
|
3.95
|
%
|
3.75
|
%
|
|||||||||||
|
Expected return on plan assets
|
4.00
|
%
|
4.50
|
%
|
4.50
|
%
|
N/A
|
N/A
|
N/A
|
||||||||||||||
|
Components of net annual benefit cost:
|
|||||||||||||||||||||||
|
Service cost
(2)
|
$
|
1.6
|
|
$
|
1.2
|
|
$
|
0.7
|
|
$
|
—
|
|
$
|
—
|
|
$
|
—
|
|
|||||
|
Interest cost
(3)
|
1.0
|
|
1.0
|
|
0.6
|
|
—
|
|
—
|
|
—
|
|
|||||||||||
|
Expected return on plan assets
(3)
|
(0.9
|
)
|
(0.9
|
)
|
(0.6
|
)
|
—
|
|
—
|
|
—
|
|
|||||||||||
|
Amortization of prior service cost
(3)
|
0.1
|
|
—
|
|
—
|
|
—
|
|
—
|
|
—
|
|
|||||||||||
|
Amortization of net actuarial and other (gain) loss
(3)
|
—
|
|
—
|
|
—
|
|
—
|
|
—
|
|
—
|
|
|||||||||||
|
Recognized (gain) loss due to curtailments
|
0.2
|
|
—
|
|
—
|
|
—
|
|
—
|
|
—
|
|
|||||||||||
|
Net annual benefit cost
|
$
|
2.0
|
|
$
|
1.3
|
|
$
|
0.7
|
|
$
|
—
|
|
$
|
—
|
|
$
|
—
|
|
|||||
_______________
|
(1)
|
The discount rate used to calculate pension and other post-retirement obligations was based on a review of available yields on high-quality corporate bonds. In selecting a discount rate, we placed particular emphasis on a discount rate yield-curve provided by our third-party actuary which takes into consideration the projected cash flows that represent the expected timing and amount of our plans' benefit payments.
|
|
(2)
|
Amounts are recorded to "Cost of sales" on our consolidated statements of operations consistent with the employee compensation costs that participate in the plan.
|
|
(3)
|
Amounts are recorded to "Other (income) expense, net" on our consolidated statements of operations.
|
Contributions
We made a voluntary cash contribution of
$1.5 million
and
$1.2 million
to our Union Hourly defined benefit pension plan in the years ended
December 31, 2018
and 2017, respectively. There are no required cash contributions to our Union Hourly defined benefit pension plan in fiscal 2019, and we currently have no plans to make any voluntary cash contributions in fiscal 2019.
96
Fair Value Hierarchy
The following table presents our fair value hierarchy for our major categories of pension plan assets by asset class. See Note 6 for the definition of fair value and the descriptions of Level 1, 2 and 3 in the fair value hierarchy.
|
In millions
|
December 31, 2018
|
Quoted Prices in Active Markets for Identical Assets (Level 1)
|
Significant Other Observable Inputs (Level 2)
|
Significant Unobservable Inputs
(Level 3) |
|||||||||||
|
Cash and short-term investments
|
$
|
0.1
|
|
$
|
0.1
|
|
$
|
—
|
|
$
|
—
|
|
|||
|
Equity funds and other investments
|
3.6
|
|
3.6
|
|
—
|
|
—
|
|
|||||||
|
Fixed income mutual funds
|
18.9
|
|
1.4
|
|
17.5
|
|
—
|
|
|||||||
|
Total assets
|
$
|
22.6
|
|
$
|
5.1
|
|
$
|
17.5
|
|
$
|
—
|
|
|||
|
In millions
|
December 31, 2017
|
Quoted Prices in Active Markets for Identical Assets (Level 1)
|
Significant Other Observable Inputs (Level 2)
|
Significant Unobservable Inputs
(Level 3) |
|||||||||||
|
Cash and short-term investments
|
$
|
0.5
|
|
$
|
0.5
|
|
$
|
—
|
|
$
|
—
|
|
|||
|
Equity funds and other investments
|
2.7
|
|
2.7
|
|
—
|
|
—
|
|
|||||||
|
Fixed income mutual funds
|
19.4
|
|
1.4
|
|
18.0
|
|
—
|
|
|||||||
|
Total assets
|
$
|
22.6
|
|
$
|
4.6
|
|
$
|
18.0
|
|
$
|
—
|
|
|||
Estimated Future Benefit Payments
The following table reflects the estimated future benefit payments for our pension and other postretirement benefit plans. These estimates take into consideration expected future service, as appropriate.
|
In millions
|
Pensions
|
Other Benefits
|
|||||
|
2019
|
$
|
0.5
|
|
$
|
—
|
|
|
|
2020
|
0.6
|
|
—
|
|
|||
|
2021
|
0.8
|
|
—
|
|
|||
|
2022
|
1.0
|
|
—
|
|
|||
|
2023
|
1.1
|
|
—
|
|
|||
|
2024-2028
|
$
|
7.7
|
|
$
|
0.2
|
|
|
Sensitivity Analysis
A one-half percent increase in the assumed discount rate would have decreased pension benefit obligations by
$2.0 million
at
December 31, 2018
and decreased pension benefit costs by
$0.1 million
for
2018
. A one-half percent decrease in the assumed discount rate would have increased pension obligations by
$2.3 million
at
December 31, 2018
and increased pension benefit cost by
$0.3 million
for
2018
.
A one-half percent increase in the assumed expected long-term rate of return on plan assets would have decreased pension costs by
$0.1 million
for
2018
. A one-half percent decrease in the assumed long-term rate of return on plan assets would have increased pension costs by
$0.1 million
for
2018
.
97
Note 15: Business Separation
In connection with the Separation as further described in Note 1 and Note 2, we have incurred pre-tax separation costs as shown in the table below. Prior to the Separation, these costs were primarily related to third-party professional fees associated with separation activities and one-time costs of new hires specifically required to separate and stand up Ingevity. Post-Separation, these costs represent legal, information technology and other advisory fees to transition from a division of WestRock to a stand-alone public company.
|
Years Ended December 31,
|
|||||||||||
|
In millions
|
2018
|
2017
|
2016
|
||||||||
|
Separation costs
|
$
|
—
|
|
$
|
0.9
|
|
$
|
17.5
|
|
||
Note 16: Restructuring and Other (Income) Charges, net
We continually perform strategic reviews and assess the return on our operations which sometimes results in a plan to restructure the business. The cost and benefit of these strategic restructuring initiatives are recorded as restructuring and other (income) charges, net recorded within Restructuring and other (income) charges, net on our consolidated statement of operations. These costs are excluded from our operating segment results.
We record an accrual for severance and other non-recurring costs under the provisions of the relevant accounting guidance. Additionally, in some restructuring plans write-downs of long-lived assets may occur. Two types of assets are impacted: assets to be disposed of by sale and assets to be abandoned. Assets to be disposed of by sale are measured at the lower of carrying amount or estimated net proceeds from the sale. Assets to be abandoned with no remaining future service potential are written down to amounts expected to be recovered. The useful lives of assets to be abandoned that have a remaining future service potential are adjusted and depreciation is recorded over the adjusted useful life. Below provides detail of the restructuring and other (income) charges, net incurred.
2018 activities
In February 2018, we sold assets from the Performance Chemicals derivatives operations in Duque De Caxias, Rio de
Janeiro, Brazil. These assets were part of a facility that was closed as a result of a restructuring event in 2016 (see 2016 activities below). As a result of this sale, we recorded
$0.6 million
as a gain on sale of assets offset by other employee related costs of
$0.1 million
for the year ended December 31, 2018.
2017 activities
In January 2017, we initiated a reorganization to streamline our leadership team, flatten the organization and reduce costs. Because of this reorganization, we recorded
$1.3 million
in severance and other employee-related costs for the year ended December 31, 2017.
During the year ended December 31, 2017 we also recorded
$2.4 million
of additional miscellaneous exit costs primarily associated with the exit of our Performance Chemicals' manufacturing operations in Palmeira, Santa Catarina, Brazil which began in the fourth quarter of 2016 (see 2016 activities below).
2016 activities
As a result of continued deteriorating market conditions within the South America region, on October 31, 2016, our Board of Directors approved a plan to exit our Performance Chemicals' manufacturing operations in Palmeira, Santa Catarina, Brazil. As a result, we recorded a non-cash pre-tax impairment charge to property, plant and equipment in the amount of
$30.2 million
and recorded severance costs of
$1.8 million
. The severance costs began to be paid in the fourth quarter of 2016. Refinery production ceased before year end, and the facility was decommissioned in 2017. We recorded
$2.6 million
of additional miscellaneous exit costs during the year ended December 31, 2016.
During the first quarter of 2016, we announced the closure of the Performance Chemicals' derivatives operation in Duque de Caxias, Rio de Janeiro, Brazil. As a result of this closure, we recorded
$0.1 million
impairment charge on fixed assets,
$1.8 million
in severance and other employee-related costs and
$1.7 million
of additional miscellaneous exit costs during year ended December 31, 2016.
98
During the first quarter of 2016, we also announced a company-wide restructuring to better align our workforce in light of changing macroeconomic and market realities. The restructuring decision resulted in workforce reductions at several of our locations. As a result, during the year ended December 31, 2016, we recorded severance and other employee-related charges of
$2.7 million
(
$1.9 million
related to Performance Chemicals segment and
$0.8 million
related to Performance Materials segment). We also recorded an impairment charge on fixed assets of
$0.3 million
in the year ended December 31, 2016 (related to the Performance Chemicals segment).
Detail on the restructuring charges and asset disposal activities is provided below.
|
Years Ended December 31,
|
|||||||||||
|
In millions
|
2018
|
2017
|
2016
|
||||||||
|
Restructuring and other (income) charges, net
|
|||||||||||
|
Gain on sale of assets and businesses
|
$
|
(0.6
|
)
|
$
|
—
|
|
$
|
—
|
|
||
|
Severance and other employee-related costs
(1)
|
0.1
|
|
1.3
|
|
6.3
|
|
|||||
|
Asset write-downs
(2)
|
—
|
|
—
|
|
30.6
|
|
|||||
|
Other (income) charges, net
(3)
|
—
|
|
2.4
|
|
4.3
|
|
|||||
|
Total restructuring and other (income) charges, net
|
$
|
(0.5
|
)
|
$
|
3.7
|
|
$
|
41.2
|
|
||
_______________
|
(1)
|
Represents severance and employee benefit charges.
|
|
(2)
|
Primarily represents accelerated depreciation and impairment charges on long-lived assets, which were or are to be abandoned. To the extent incurred the acceleration effect of re-estimating settlement dates and revised cost estimates associated with asset retirement obligations due to facility shutdowns are also included within the asset write-downs.
|
|
(3)
|
Primarily represents costs associated with rental payments, contract terminations, and other miscellaneous exit costs. Other Income primarily represents favorable developments on previously recorded exit costs as recoveries associated with restructuring activities.
|
Roll forward of Restructuring Reserves
The following table shows a roll forward of restructuring reserves that will result in cash spending.
|
Balance at
|
Change in
|
Cash
|
Balance at
|
Change in
|
Cash
|
Balance at
|
||||||||||||||||||||||
|
12/31/2016
(1)
|
Reserve
(2)
|
Payments
|
Other
(3)
|
12/31/2017
(1)
|
Reserve
(2)
|
Payments
|
Other
(3)
|
12/31/2018
(1)
|
||||||||||||||||||||
|
$
|
2.2
|
|
3.7
|
|
(5.5
|
)
|
(0.2
|
)
|
$
|
0.2
|
|
—
|
|
(0.2
|
)
|
—
|
|
$
|
—
|
|
||||||||
_______________
|
(1)
|
Included in "Accrued Expenses" on the consolidated balance sheet.
|
|
(2)
|
Includes severance and other employee-related costs, exited leases, contract terminations and other miscellaneous exit costs. Any asset write-downs including accelerated depreciation and impairment charges are not included in the above table.
|
|
(3)
|
Primarily non-cash charges and foreign currency translation adjustments.
|
99
Note 17: Acquisitions
Georgia-Pacific's Pine Chemical Business
On August 22, 2017, we entered into an Asset Purchase Agreement (the "Pine Chemicals Purchase Agreement") with Georgia-Pacific Chemicals LLC, Georgia-Pacific LLC (together with Georgia-Pacific Chemicals LLC, "GP") and Ingevity Arkansas, LLC, a wholly-owned subsidiary of Ingevity, to purchase substantially all the assets primarily used in GP's pine chemical business (the "Pine Chemical Business"), including assets and facilities related to tall oil fractionation operations and the production or modification of tall oil fatty acids, tall oil rosins, rosin derivatives and formulated products (the "Pine Chemicals Acquisition").
On March 8, 2018 (the "Pine Chemicals Acquisition Date"), pursuant to the terms and conditions set forth in the Purchase Agreement, we completed the Pine Chemicals Acquisition. During the third quarter of 2018, we finalized the purchase price which included a final adjustment for working capital resulting in an aggregate purchase price of
$315.5 million
. The Pine Chemicals Acquisition was primarily funded with the net proceeds from the
$300.0 million
senior notes issued on January 24, 2018. See Note 10 for more information on the senior notes. In addition, on the Pine Chemicals Acquisition, the Company and GP entered into a
20
-year, market-based crude tall oil ("CTO") supply contract with certain of Georgia-Pacific’s paper mill operations.
The Pine Chemicals Acquisition is being integrated into our Performance Chemicals segment and has been included within our results of operations since the Pine Chemicals Acquisition Date. Although not yet complete, a substantial portion of the Pine Chemical Business has been integrated into our existing Performance Chemicals operations. As a result, our ability to separate net sales and operating performance of the Pine Chemicals Acquisition from our existing Performance Chemicals' operating results is no longer practicable.
Purchase Price Allocation
The Pine Chemicals Acquisition has been accounted for under the business combinations accounting guidance, and as such we have applied acquisition accounting. Acquisition accounting requires, among other things, that assets acquired and liabilities assumed be recognized at their fair values as of the acquisition date. The aggregate purchase price noted above was allocated to the major categories of assets acquired and liabilities assumed based upon their estimated fair values at the Pine Chemicals Acquisition Date using primarily Level 2 and Level 3 inputs. These Level 2 and Level 3 valuation inputs include an estimate of future cash flows and discount rates. Additionally, estimated fair values are based, in part, upon outside appraisals for certain assets, including specifically-identified intangible assets.
The following table summarizes the consideration paid for the Pine Chemicals Acquisition and the amounts of the assets acquired and liabilities assumed as of the Pine Chemicals Acquisition Date.
100
|
Purchase Price Allocation
|
||||
|
In millions
|
Weighted Average Amortization Period
|
Fair Value
|
||
|
Accounts receivable
|
$
|
16.2
|
|
|
|
Inventories
(1)
|
9.4
|
|
||
|
Property, plant and equipment
|
39.3
|
|
||
|
Intangible assets
(2)
|
||||
|
Patents
|
12 years
|
1.9
|
|
|
|
Non-compete agreement
|
3 years
|
2.2
|
|
|
|
Customer relationships
|
11 years
|
129.0
|
|
|
|
Goodwill
(3)
|
118.7
|
|
||
|
Other assets
|
0.1
|
|
||
|
Total fair value of assets acquired
|
316.8
|
|
||
|
Accounts payable
|
0.8
|
|
||
|
Accrued expenses
|
0.5
|
|
||
|
Total fair value of liabilities assumed
|
$
|
1.3
|
|
|
|
Total cash paid
|
$
|
315.5
|
|
|
|
_______________
|
||||
|
(1) Fair value of finished good inventories acquired included a step-up in the value of approximately $1.4 million, of which $1.4 million was expensed in the year ended December 31, 2018. The expense is included in "Cost of sales" on the consolidated statement of operations.
|
||||
|
(2) The aggregate amortization expense was for the year ended December 31, 2018. Estimated amortization expense is as follows: 2019 - $12.7 million, 2020 - $12.7 million, 2021 - $12.0 million, 2022 - $11.8 million, and 2023 - $11.8 million.
|
||||
|
(3) Goodwill largely consists of expected cost synergies and economies of scale resulting from the business combination. We expect the full amount to be deductible for income tax purposes.
|
||||
Unaudited Pro Forma Financial Information
The following unaudited pro forma results of operations assume that the Pine Chemicals Acquisition occurred at the beginning of the periods presented. These unaudited pro forma results are presented for informational purposes only and are not necessarily indicative of what the actual results of operations would have been if the Pine Chemicals Acquisition had occurred at the beginning of the periods presented, nor are they indicative of future results of operations. The pro forma results presented below are adjusted for the removal of Acquisition and other related costs of
$6.0 million
and
$7.1 million
for the years ended
December 31, 2018
and
2017
, respectively.
|
Years Ended December 31,
|
|||||||
|
In millions
|
2018
|
2017
|
|||||
|
Net sales
|
$
|
1,153.8
|
|
$
|
1,073.0
|
|
|
|
Income (loss) before income taxes
|
229.3
|
|
176.9
|
|
|||
|
Diluted earnings (loss) per share attributable to Ingevity stockholders
|
$
|
4.12
|
|
$
|
3.01
|
|
|
Perstorp AB's Caprolactone Business
See Note 24 for more information on the acquisition of Perstorp AB's caprolactone business completed on February 13, 2019.
101
Acquisition-related costs
Costs incurred to complete and integrate the acquisitions described above into our Performance Chemicals segment are expensed as incurred and recorded to Acquisition-related costs on our consolidated statement of operations. During the years ended
December 31, 2018
,
2017
and
2016
we recognized
$10.8 million
,
$7.1 million
and
zero
, respectively. These costs represent transaction costs, legal fees, professional third-party service fees, and in 2018 include the unrealized loss of
$3.9 million
from the purchase price hedge associated with the Caprolactone Acquisition.
Note 18: Income Taxes
Domestic and foreign components of Income (loss) before income taxes are shown below:
|
Years Ended December 31,
|
|||||||||||
|
In millions
|
2018
|
2017
|
2016
|
||||||||
|
Domestic
|
$
|
213.3
|
|
$
|
180.1
|
|
$
|
118.3
|
|
||
|
Foreign
|
8.5
|
|
(5.3
|
)
|
(31.3
|
)
|
|||||
|
Total
|
$
|
221.8
|
|
$
|
174.8
|
|
$
|
87.0
|
|
||
The provision (benefit) for income taxes consisted of:
|
Years Ended December 31,
|
|||||||||||
|
In millions
|
2018
|
2017
|
2016
|
||||||||
|
Current
|
|||||||||||
|
Federal
|
$
|
32.5
|
|
$
|
51.6
|
|
$
|
37.4
|
|
||
|
State and local
|
6.0
|
|
3.7
|
|
5.0
|
|
|||||
|
Foreign
|
0.6
|
|
—
|
|
2.1
|
|
|||||
|
Total current
|
$
|
39.1
|
|
$
|
55.3
|
|
$
|
44.5
|
|
||
|
Deferred
|
|||||||||||
|
Federal
|
$
|
1.6
|
|
$
|
(25.3
|
)
|
$
|
(2.4
|
)
|
||
|
State and local
|
(1.1
|
)
|
(1.3
|
)
|
(0.5
|
)
|
|||||
|
Foreign
|
0.4
|
|
0.9
|
|
1.0
|
|
|||||
|
Total deferred
|
$
|
0.9
|
|
$
|
(25.7
|
)
|
$
|
(1.9
|
)
|
||
|
Provision (benefit) for income taxes
|
$
|
40.0
|
|
$
|
29.6
|
|
$
|
42.6
|
|
||
We recorded
$0.1 million
,
$0.4 million
and
$(0.3) million
of deferred tax provision (benefit) in components of other comprehensive income during the years ended
December 31, 2018
,
2017
and
2016
, respectively.
102
The following table summarizes the major differences between taxes computed at the U.S. federal statutory rate and the actual income tax provision attributable to operations:
|
Years Ended December 31,
|
|||||||||||
|
In millions, except percentage data
|
2018
|
2017
|
2016
|
||||||||
|
Federal statutory tax rate
|
$
|
46.6
|
|
$
|
61.2
|
|
$
|
30.5
|
|
||
|
State and local income taxes, net of federal benefit
|
4.4
|
|
2.4
|
|
2.8
|
|
|||||
|
Foreign income tax rate differential
|
1.0
|
|
0.5
|
|
0.8
|
|
|||||
|
Changes in valuation allowance
|
(2.2
|
)
|
1.7
|
|
13.2
|
|
|||||
|
Domestic manufacturing deduction
|
—
|
|
(5.1
|
)
|
(4.0
|
)
|
|||||
|
Noncontrolling interest in consolidated partnership
|
(2.7
|
)
|
(6.6
|
)
|
(3.1
|
)
|
|||||
|
Nondeductible separation costs
|
—
|
|
—
|
|
1.5
|
|
|||||
|
Nondeductible restructuring costs
|
—
|
|
—
|
|
2.2
|
|
|||||
|
Federal and state tax credits
|
(2.1
|
)
|
(0.7
|
)
|
(0.6
|
)
|
|||||
|
Deferred rate change
|
(0.1
|
)
|
(0.4
|
)
|
(0.6
|
)
|
|||||
|
U.S. Tax Reform
|
(1.9
|
)
|
(24.5
|
)
|
—
|
|
|||||
|
Foreign derived intangible income
|
(3.2
|
)
|
—
|
|
—
|
|
|||||
|
Other
|
0.2
|
|
1.1
|
|
(0.1
|
)
|
|||||
|
Provision (benefit) for income taxes
|
$
|
40.0
|
|
$
|
29.6
|
|
$
|
42.6
|
|
||
|
Effective tax rate
|
18.0
|
%
|
16.9
|
%
|
49.0
|
%
|
|||||
Our effective tax rate was
18.0 percent
,
16.9 percent
, and
49.0 percent
for the years ended
December 31, 2018
,
2017
, and
2016
, respectively. The increase in our effective tax rate from 2017 to 2018 is mainly due to the one time benefit of reducing our net deferred tax liability to the
21.0 percent
rate in 2017 and effects of certain provisions under U.S. Tax Reform. Our U.S. net deferred tax liabilities as of December 31, 2017 were remeasured from
35.0 percent
to
21.0 percent
, resulting in
$24.5 million
of provisional deferred income tax benefit and a reduction in our effective tax rate of
14.0 percent
in 2017. During the year ended December 31, 2018, we further adjusted our net deferred tax liabilities by
$1.9 million
due to further interpretations of U.S. Tax Reform. The remaining difference in our effective tax rate for the years ended December 31, 2018 and 2017, respectively, is due to the change in certain favorable tax deductions under U.S. Tax Reform, such as the elimination of the domestic manufacturing deduction and the addition of the foreign-derived intangible income deduction. In addition to the impact of U.S. Tax Reform, the change in the effective tax rate period over period was also driven by the acquisition of our noncontrolling interest.
The decrease in our effective tax rate from 2016 to 2017 is mainly due to the impact of U.S. Tax Reform. Our U.S. net deferred tax liabilities as of December 31, 2017 were remeasured from 35.0 percent to 21.0 percent, resulting in
$24.5 million
of provisional deferred income tax benefit and a reduction in our effective tax rate of 14.0 percent. The remaining difference in our effective tax rate for the years ended December 31, 2017 and 2016, respectively, is due to non-deductible transaction costs associated with the Separation in 2016, acquisition-related charges, restructuring and other (income charges) and the unfavorable results of legal entities with full valuation allowances. Excluding the impact of U.S. Tax Reform, acquisition-related charges, restructuring and other (income charges), separation costs and losses from legal entities with full valuation allowances the change in the effective tax rate period over period was primarily due to a shift in earnings mix as it relates to domestic versus foreign income earned.
103
The significant components of deferred tax assets and liabilities are as follows:
|
December 31,
|
|||||||
|
In millions
|
2018
|
2017
|
|||||
|
Deferred tax assets:
|
|||||||
|
Accrued restructuring
|
$
|
7.7
|
|
$
|
11.4
|
|
|
|
Employee benefits
|
14.9
|
|
8.0
|
|
|||
|
Intangibles
|
17.1
|
|
3.0
|
|
|||
|
Investment in partnership
|
—
|
|
1.8
|
|
|||
|
Net operating losses
|
8.1
|
|
9.0
|
|
|||
|
Start-up costs
|
0.8
|
|
0.8
|
|
|||
|
Inventory
|
—
|
|
1.2
|
|
|||
|
Other
|
7.4
|
|
5.0
|
|
|||
|
Total deferred tax assets
|
$
|
56.0
|
|
$
|
40.2
|
|
|
|
Valuation allowance
|
(15.5
|
)
|
(20.4
|
)
|
|||
|
Total deferred tax assets, net of valuation allowance
|
$
|
40.5
|
|
$
|
19.8
|
|
|
|
Deferred tax liabilities:
|
|||||||
|
Fixed assets
|
$
|
68.3
|
|
$
|
57.1
|
|
|
|
Inventory
|
4.8
|
|
—
|
|
|||
|
Other
|
1.4
|
|
0.6
|
|
|||
|
Total deferred tax liabilities
|
$
|
74.5
|
|
$
|
57.7
|
|
|
|
Net deferred tax asset (liability)
|
$
|
(34.0
|
)
|
$
|
(37.9
|
)
|
|
On December 22, 2017, U.S. Tax Reform was signed into law making significant changes to the U.S. Internal Revenue Code ("IRC"). Changes include, but are not limited to, a corporate tax rate decrease from 35.0 percent to 21.0 percent effective for tax years beginning after December 31, 2017, the transition of U.S. international taxation from a worldwide tax system to a territorial system, and implementation of tax on deemed repatriation of cumulative earnings of foreign subsidiaries. We recognized the tax effects of U.S. Tax Reform in the year ended December 31, 2017 and recorded a tax benefit of
$24.5 million
. This benefit pertains to the re-measurement of our deferred tax liabilities to the 21.0 percent tax rate.
Also on December 22, 2017, Staff Accounting Bulletin No. 118 ("SAB 118") was issued to address the application of U.S. GAAP in situations when a registrant does not have the necessary information available, prepared, or analyzed (including computations) in reasonable detail to complete the accounting for certain income tax effects of U.S. Tax Reform. We applied the guidance of SAB 118 when accounting for the enactment date effects of U.S. Tax Reform in 2017 and throughout 2018. At December 31, 2018, we have now completed our accounting for all of the enactment date income tax effects of U.S. Tax Reform. We further reduced our net deferred tax liability by an additional
$1.9 million
, primarily related to re-measurement of deferred taxes to the 21.0 percent rate.
U.S. Tax Reform subjects a U.S. shareholder to tax on Global Intangible Low Tax Income ("GILTI") earned by certain foreign subsidiaries. The FASB Staff Q&A Topic 740, No. 5 "Accounting for Global Intangible Low-Taxed Income," states that an entity can make an accounting policy election to either recognize deferred taxes for temporary basis differences expected to reverse as GILTI in future years or to provide for the tax expense related to GILTI in the year the tax is incurred as a period expense only. We have elected to account for GILTI as a current period expense when incurred.
We have deferred tax assets, including net operating loss carryforwards, which are available to offset future taxable income. A valuation allowance has been provided where management has determined that it is more likely than not that the deferred tax assets will not be realized.
At
December 31, 2018
, foreign net operating loss carryforwards totaled
$22.5 million
. Of this total,
$3.5 million
will expire in
3
to
10
years and
$19.0 million
has no expiration date.
104
Due to the global nature of our operations, a portion of our cash is held outside the U.S. The cash and cash equivalent balance at December 31, 2018 included
$27.0 million
held by our foreign subsidiaries. At December 31, 2018, 2017, and 2016, no deferred income taxes have been provided for our share of undistributed net earnings of foreign operations due to management’s intent to reinvest such amounts indefinitely. The determination of the amount of taxes that may be due if earnings are remitted is not practicable because such liability, if any, is dependent on circumstances that exist if and when remittance occurs. The circumstances that would affect the calculations include the source location and amount of the distribution, the underlying tax rate already paid on the earnings, foreign withholding taxes, the opportunity to use foreign tax credits, and the potential impact of U.S. Tax Reform. Positive undistributed earnings considered to be indefinitely reinvested totaled less than
$1.0 million
at
December 31, 2018
.
A reconciliation of the beginning and ending amounts of unrecognized tax benefits is as follows:
|
December 31,
|
|||||||||||
|
In millions
|
2018
|
2017
|
2016
|
||||||||
|
Balance at beginning of year
|
$
|
0.3
|
|
$
|
0.6
|
|
$
|
0.7
|
|
||
|
Additions for tax positions related to current year
|
0.2
|
|
—
|
|
—
|
|
|||||
|
Additions for tax positions related to prior years
|
—
|
|
0.1
|
|
0.1
|
|
|||||
|
Reductions for tax positions related to prior years
|
—
|
|
—
|
|
(0.2
|
)
|
|||||
|
Reduction from lapse of statute of limitation
|
(0.2
|
)
|
(0.4
|
)
|
—
|
|
|||||
|
Balance at end of year
|
$
|
0.3
|
|
$
|
0.3
|
|
$
|
0.6
|
|
||
As of
December 31, 2018
,
2017
, and
2016
,
$0.3 million
,
$0.5 million
, and
$1.0 million
, respectively, of unrecognized tax benefit, including penalties and interest, would, if recognized, impact our effective tax rate. We recognize interest accrued related to unrecognized tax benefits and penalties as income tax expense. We expect to release approximately
$0.2 million
in unrecognized tax benefit in the first quarter of 2019.
Note 19: Commitments and Contingencies
Lease commitments
Capital leases
The capital lease obligations consist of
$80.0 million
at
December 31, 2018
and
2017
, respectively, owed to the city of Wickliffe, Kentucky, associated with Performance Materials' Wickliffe, Kentucky site, which is due at maturity in 2027. The interest rate on the
$80.0 million
capital lease obligation is
7.67%
. Interest payments are payable semi-annually.
We have a capital lease obligation due in 2031, for certain assets located at our Performance Materials' Waynesboro, Georgia manufacturing facility. The lease is with the Development Authority of Burke County (“Authority”). The Authority established the sale-leaseback of these assets by issuing an industrial development revenue bond. The bond was purchased by Ingevity and the obligations under the capital lease remain with Ingevity. Accordingly, we offset the capital lease obligation and bond on our consolidated balance sheets. Our DeRidder, Louisiana facility also had certain assets subject to a capital lease under a similar arrangement at our Waynesboro, Georgia manufacturing facility. During the fourth quarter of 2017 the capital lease associated with the assets at our DeRidder, Louisiana facility subject to the lease was terminated. Thus, as of December 31, 2017, the assets are legally owned by Ingevity and no longer subject to a lease. The leased assets are presented within "Property, plant, and equipment, net" on the consolidated balance sheets, see Note 8 for more information.
Operating Leases
We lease a variety of assets for use in our operations that are classified as operating leases. Our operating leases principally relate to leases for administrative offices, manufacturing equipment and buildings, warehousing and storage facilities, vehicles and rail cars. Certain leases provide for escalation of the lease payments as maintenance costs and taxes increase. Rental expense is recognized on a straight-line basis over the minimum lease term. Rental expense pursuant to operating leases was
$18.4 million
,
$16.8 million
and
$17.4 million
for the years ended
December 31, 2018
,
2017
, and
2016
, respectively.
105
Minimum rental payments pursuant to agreements as of
December 31, 2018
, under operating leases that have non-cancelable lease terms in excess of 12 months and under capital leases are as follows:
|
In millions
|
Operating leases
(1)
|
Capital leases
(1)
|
|||||
|
2019
|
$
|
21.9
|
|
$
|
6.1
|
|
|
|
2020
|
17.2
|
|
6.1
|
|
|||
|
2021
|
13.3
|
|
6.1
|
|
|||
|
2022
|
9.7
|
|
6.1
|
|
|||
|
2023
|
6.0
|
|
6.1
|
|
|||
|
Later years
|
5.9
|
|
101.5
|
|
|||
|
Minimum lease payments
|
$
|
74.0
|
|
$
|
132.0
|
|
|
|
Less: amount representing interest
|
52.0
|
|
|||||
|
Capital lease obligations
|
$
|
80.0
|
|
||||
_______________
|
(1)
|
Capital and operating lease obligations are presented in accordance with ASC 840. Effective January 1, 2019, we will adopt ASC 842. See Note 4 for information on the adoption and the impact to our Consolidated Financial Statements.
|
Legal Proceedings
We are, from time to time, involved in routine litigation incidental to our operations. None of the litigation in which we are currently involved, individually or in the aggregate, is material to our consolidated financial condition, liquidity or results of operations nor are we aware of any material pending or contemplated proceedings.
106
Note 20: Segment Information
Ingevity’s operating segments are (i) Performance Materials and (ii) Performance Chemicals, a description of both operating segments is included in Note 1.
|
Years Ended December 31,
|
|||||||||||
|
In millions
|
2018
|
2017
|
2016
|
||||||||
|
Net sales
|
|||||||||||
|
Performance Materials
|
$
|
400.4
|
|
$
|
349.3
|
|
$
|
301.0
|
|
||
|
Performance Chemicals
|
733.2
|
|
623.1
|
|
607.3
|
|
|||||
|
Total net sales
(1)
|
1,133.6
|
|
972.4
|
|
908.3
|
|
|||||
|
Segment operating profit
(2)
|
|||||||||||
|
Performance Materials
|
147.2
|
|
122.0
|
|
106.9
|
|
|||||
|
Performance Chemicals
|
116.3
|
|
80.3
|
|
56.7
|
|
|||||
|
Total segment operating profit
(1)
|
263.5
|
|
202.3
|
|
163.6
|
|
|||||
|
Separation costs
(3)
|
—
|
|
(0.9
|
)
|
(17.5
|
)
|
|||||
|
Restructuring and other income (charges), net
(4)
|
0.5
|
|
(3.7
|
)
|
(41.2
|
)
|
|||||
|
Acquisition and other related costs
(5)
|
(12.2
|
)
|
(7.1
|
)
|
—
|
|
|||||
|
Pension and postretirement settlement and curtailment income (charges)
(6)
|
(0.2
|
)
|
—
|
|
—
|
|
|||||
|
Interest expense
|
(33.2
|
)
|
(18.1
|
)
|
(19.3
|
)
|
|||||
|
Interest income
|
3.4
|
|
2.3
|
|
1.4
|
|
|||||
|
(Provision) benefit for income taxes
|
(40.0
|
)
|
(29.6
|
)
|
(42.6
|
)
|
|||||
|
Net (income) loss attributable to noncontrolling interests
|
(12.7
|
)
|
(18.7
|
)
|
(9.2
|
)
|
|||||
|
Net income (loss) attributable to Ingevity stockholders
|
$
|
169.1
|
|
$
|
126.5
|
|
$
|
35.2
|
|
||
_______________
|
(1)
|
Relates to external customers only, all intersegment sales and related profit have been eliminated in consolidation.
|
|
(2)
|
Segment operating profit is defined as segment revenue less segment operating expenses (segment operating expenses consist of costs of sales, selling, general and administrative expenses and other (income) expense, net). We have excluded the following items from segment operating profit: interest expense, net associated with corporate debt facilities, income taxes, gains (or losses) on divestitures of businesses, restructuring and other (income) charges, separation costs, acquisition costs, pension and postretirement settlement and curtailment income (charges), and net income (loss) attributable to noncontrolling interest.
|
|
(3)
|
See Note 15 for more information on separation costs.
|
|
(4)
|
Information about how restructuring and other (income) charges relate to our businesses at the segment level is discussed in Note 16.
|
|
(5)
|
These charges are associated with the acquisition and integration of the Pine Chemical Business and the acquisition of the Caprolactone Business. See below for more detail on the charges incurred and Note 17 within these Consolidated Financial Statements for more information.
|
|
Years Ended December 31,
|
|||||||||||
|
In millions
|
2018
|
2017
|
2016
|
||||||||
|
Legal and professional service fees
(1)
|
$
|
6.9
|
|
$
|
7.1
|
|
$
|
—
|
|
||
|
Inventory fair value step-up amortization
(2)
|
1.4
|
|
—
|
|
—
|
|
|||||
|
Purchase price hedge adjustment
(1)
|
3.9
|
|
—
|
|
—
|
|
|||||
|
Acquisition and other related costs
|
$
|
12.2
|
|
$
|
7.1
|
|
$
|
—
|
|
||
|
_______________
|
|||||||||||
|
(1) Included within "Acquisition and other related costs" on the consolidated statement of operations.
|
|||||||||||
|
(2) Included within "Cost of sales" on the consolidated statement of operations.
|
|||||||||||
107
|
(6)
|
Our pension and postretirement settlement and curtailment (income) charges are related to the acceleration of prior service costs, as a result of a reduction in the number of participants within the Union Hourly defined benefit pension plan during 2018. These are excluded from our segment results because we consider these costs to be outside our operational performance. We continue to include the service cost, amortization of prior service cost, interest costs, expected return on plan assets, and amortized actual gains and losses in our segment operating profit.
|
Net sales to external customers for each of our product line is presented below.
|
Years Ended December 31,
|
|||||||||||
|
In millions
|
2018
|
2017
|
2016
|
||||||||
|
Performance Materials Net sales
|
|||||||||||
|
Automotive Technologies product line
|
$
|
362.0
|
|
$
|
312.5
|
|
$
|
263.5
|
|
||
|
Process Purification product line
|
38.4
|
|
36.8
|
|
37.5
|
|
|||||
|
Total Performance Materials Net sales
(1)
|
$
|
400.4
|
|
$
|
349.3
|
|
$
|
301.0
|
|
||
_______________
|
(1)
|
Sales are assigned to geographic areas based on location to which product was shipped to a third-party. Relates to external customers only, all intersegment sales and related profit have been eliminated in consolidation.
|
|
Years Ended December 31,
|
|||||||||||
|
In millions
|
2018
|
2017
|
2016
|
||||||||
|
Performance Chemicals Net sales
|
|||||||||||
|
Pavement Technologies product line
|
$
|
178.5
|
|
$
|
163.0
|
|
$
|
148.8
|
|
||
|
Oilfield Technologies product line
|
114.2
|
|
77.8
|
|
58.5
|
|
|||||
|
Industrial Specialties product line
|
440.5
|
|
382.3
|
|
400.0
|
|
|||||
|
Total Performance Chemicals Net sales
(1)
|
$
|
733.2
|
|
$
|
623.1
|
|
$
|
607.3
|
|
||
_______________
|
(1)
|
Sales are assigned to geographic areas based on location to which product was shipped to a third-party. Relates to external customers only, all intersegment sales and related profit have been eliminated in consolidation.
|
|
Depreciation and amortization
|
Capital expenditures
|
||||||||||||||||||||||
|
Years Ended December 31,
|
Years Ended December 31,
|
||||||||||||||||||||||
|
In millions
|
2018
|
2017
|
2016
|
2018
|
2017
|
2016
|
|||||||||||||||||
|
Performance Materials
|
$
|
22.2
|
|
$
|
19.8
|
|
$
|
16.4
|
|
$
|
65.4
|
|
$
|
36.9
|
|
$
|
39.6
|
|
|||||
|
Performance Chemicals
|
34.8
|
|
20.6
|
|
22.4
|
|
28.5
|
|
15.7
|
|
17.1
|
|
|||||||||||
|
Total
|
$
|
57.0
|
|
$
|
40.4
|
|
$
|
38.8
|
|
$
|
93.9
|
|
$
|
52.6
|
|
$
|
56.7
|
|
|||||
|
Property, plant, and equipment, net
|
December 31,
|
||||||
|
In millions
|
2018
|
2017
|
|||||
|
North America
|
$
|
444.4
|
|
$
|
358.4
|
|
|
|
Asia Pacific
|
78.7
|
|
79.3
|
|
|||
|
Europe, Middle East and Africa
|
0.6
|
|
0.7
|
|
|||
|
South America
|
0.1
|
|
0.1
|
|
|||
|
Property, plant, and equipment, net
|
$
|
523.8
|
|
$
|
438.5
|
|
|
108
|
Total assets
|
December 31,
|
||||||
|
In millions
|
2018
|
2017
|
|||||
|
Performance Materials
|
$
|
547.8
|
|
$
|
438.9
|
|
|
|
Performance Chemicals
|
755.7
|
|
479.8
|
|
|||
|
Total segment assets
(1)
|
$
|
1,303.5
|
|
$
|
918.7
|
|
|
|
Corporate and other
|
11.7
|
|
10.9
|
|
|||
|
Total assets
|
$
|
1,315.2
|
|
$
|
929.6
|
|
|
_______________
|
(1)
|
Segment assets exclude assets not specifically managed as part of one specific segment herein referred to as "Corporate and other."
|
Note 21: Earnings (Loss) per Share
Basic earnings (loss) per share is computed by dividing net income (loss) for the period by the weighted average number of common shares outstanding during the period. The weighted average number of common shares outstanding for basic and diluted earnings (loss) per share for the year ended December 31, 2016 was based on the weighted average number of common shares outstanding for the period beginning after the Distribution Date. On May 15, 2016, the Distribution Date, each holder of WestRock's common stock received one share of Ingevity's common stock for every six shares of WestRock's common stock held on the Record Date. Diluted earnings (loss) per share is computed by dividing net income (loss) for the period by the weighted average number of shares of common stock and potentially dilutive common stock outstanding for the period. The calculation of diluted net income per share excludes all anti-dilutive common shares.
109
|
Years Ended December 31,
|
|||||||||||
|
In millions (except share and per share data)
|
2018
|
2017
|
2016
|
||||||||
|
Net income (loss) attributable to Ingevity stockholders
|
$
|
169.1
|
|
$
|
126.5
|
|
$
|
35.2
|
|
||
|
Basic and Diluted earnings (loss) per share
(1)
|
|||||||||||
|
Basic earnings (loss) per share
|
$
|
4.02
|
|
$
|
3.00
|
|
$
|
0.83
|
|
||
|
Diluted earnings (loss) per share
|
$
|
3.97
|
|
$
|
2.97
|
|
$
|
0.83
|
|
||
|
Shares
(2)
|
|||||||||||
|
Weighted average number of shares of common stock outstanding - Basic
|
42,037
|
|
42,130
|
|
42,108
|
|
|||||
|
Weighted average additional shares assuming conversion of potential common shares
|
564
|
|
399
|
|
163
|
|
|||||
|
Shares - diluted basis
|
42,601
|
|
42,529
|
|
42,271
|
|
|||||
_______________
|
(1)
|
Diluted earnings (loss) per share is calculated using net income (loss) available to common stockholders divided by diluted weighted-average shares of common shares outstanding during each period, which includes the dilutive effect of outstanding equity awards. Basic and diluted earnings (loss) per share for the year ended December 31, 2016 is calculated using the weighted average number of common shares outstanding for the period beginning after the Distribution Date.
|
|
(2)
|
Shares are presented in thousands.
|
The following average number of potential common shares were antidilutive and, therefore, were not included in the diluted earnings per share calculation:
|
Years Ended December 31,
|
||||||||
|
In thousands
|
2018
|
2017
|
2016
|
|||||
|
Average number of potential common shares - antidilutive
|
84
|
|
79
|
|
4
|
|
||
110
Note 22: Supplemental Information
The following tables include details of prepaid and other current assets, other assets, accrued expenses and other liabilities as presented on the consolidated balance sheets, as well as other (income) expense, net on the consolidated statement of operations:
|
Prepaid and other current assets:
|
December 31,
|
||||||
|
In millions
|
2018
|
2017
|
|||||
|
Income and value added tax receivables
|
$
|
15.0
|
|
$
|
8.2
|
|
|
|
Prepaid freight and supply agreements
|
1.1
|
|
0.8
|
|
|||
|
Prepaid insurance
|
1.7
|
|
1.3
|
|
|||
|
Non-trade receivables
|
3.4
|
|
2.4
|
|
|||
|
Advances to suppliers
|
1.5
|
|
0.8
|
|
|||
|
Equity securities, foreign currency, commodity hedging
(Note 6)
|
0.7
|
|
1.8
|
|
|||
|
Contract asset
(Note 5)
|
5.1
|
|
—
|
|
|||
|
Other
|
6.4
|
|
5.5
|
|
|||
|
$
|
34.9
|
|
$
|
20.8
|
|
||
|
Other assets:
|
December 31,
|
||||||
|
In millions
|
2018
|
2017
|
|||||
|
Deferred financing charges
|
$
|
3.1
|
|
$
|
2.7
|
|
|
|
Capitalized software, net
(Note 3)
|
9.5
|
|
12.5
|
|
|||
|
Land-use rights
|
5.6
|
|
6.0
|
|
|||
|
Planned major maintenance activities
(Note 3)
|
3.2
|
|
2.1
|
|
|||
|
Deferred compensation plan assets
|
4.4
|
|
—
|
|
|||
|
Other
|
12.5
|
|
7.1
|
|
|||
|
$
|
38.3
|
|
$
|
30.4
|
|
||
|
Accrued expenses:
|
December 31,
|
||||||
|
In millions
|
2018
|
2017
|
|||||
|
Accrued interest
|
$
|
8.5
|
|
$
|
3.1
|
|
|
|
Accrued taxes
|
3.0
|
|
1.7
|
|
|||
|
Accrued freight
|
5.1
|
|
1.9
|
|
|||
|
Accrued rebates
|
6.4
|
|
4.9
|
|
|||
|
Restructuring reserves
(Note 16)
|
—
|
|
0.2
|
|
|||
|
Separation-related reimbursement awards
(Notes 6)
|
0.1
|
|
0.9
|
|
|||
|
Accrued royalties and commissions
|
1.8
|
|
1.7
|
|
|||
|
Foreign currency hedging
(Note 6)
|
3.9
|
|
—
|
|
|||
|
Other
|
7.9
|
|
5.6
|
|
|||
|
$
|
36.7
|
|
$
|
20.0
|
|
||
111
|
Other liabilities:
|
December 31,
|
||||||
|
In millions
|
2018
|
2017
|
|||||
|
Deferred compensation arrangements
(Note 6)
|
$
|
4.6
|
|
$
|
2.0
|
|
|
|
Pension & OPEB liabilities
(Note 14)
|
7.5
|
|
7.0
|
|
|||
|
Unrecognized tax benefits
(Note 18)
|
0.3
|
|
0.3
|
|
|||
|
Other
|
2.7
|
|
3.9
|
|
|||
|
$
|
15.1
|
|
$
|
13.2
|
|
||
|
Other (income) expense, net:
|
Years Ended December 31,
|
||||||||||
|
In millions
|
2018
|
2017
|
2016
|
||||||||
|
Foreign currency translation (gain)/loss
|
$
|
2.0
|
|
$
|
1.2
|
|
$
|
(2.9
|
)
|
||
|
Royalty (income)/expense
|
(0.8
|
)
|
(0.7
|
)
|
(1.0
|
)
|
|||||
|
Other (gain)/loss
|
(0.2
|
)
|
—
|
|
0.7
|
|
|||||
|
$
|
1.0
|
|
$
|
0.5
|
|
$
|
(3.2
|
)
|
|||
Note 23: Quarterly Financial Information (Unaudited)
The following is a summary of the quarterly results of operations for the years ended
December 31, 2018
, and
2017
.
|
2018
|
2017
|
||||||||||||||||||||||||||||||
|
In millions, except earnings per share amounts
|
1Q
|
2Q
|
3Q
|
4Q
|
1Q
|
2Q
|
3Q
|
4Q
|
|||||||||||||||||||||||
|
Net sales
|
$
|
235.2
|
|
$
|
308.6
|
|
$
|
311.2
|
|
$
|
278.6
|
|
$
|
218.5
|
|
$
|
260.3
|
|
$
|
264.1
|
|
$
|
229.5
|
|
|||||||
|
Gross profit
|
85.1
|
|
115.5
|
|
118.6
|
|
97.6
|
|
70.7
|
|
89.8
|
|
93.2
|
|
75.3
|
|
|||||||||||||||
|
Income (loss) before taxes
|
45.5
|
|
64.6
|
|
68.1
|
|
43.6
|
|
34.0
|
|
53.0
|
|
55.1
|
|
32.7
|
|
|||||||||||||||
|
Net income (loss)
|
35.8
|
|
52.2
|
|
51.7
|
|
42.1
|
|
23.0
|
|
35.8
|
|
38.4
|
|
48.0
|
|
|||||||||||||||
|
Less: Net income (loss) attributable to noncontrolling interests
|
5.0
|
|
5.5
|
|
2.2
|
|
—
|
|
4.0
|
|
3.7
|
|
4.6
|
|
6.4
|
|
|||||||||||||||
|
Net income (loss) attributable to Ingevity stockholders
|
$
|
30.8
|
|
$
|
46.7
|
|
$
|
49.5
|
|
$
|
42.1
|
|
$
|
19.0
|
|
$
|
32.1
|
|
$
|
33.8
|
|
$
|
41.6
|
|
|||||||
|
Basic earnings (loss) per common share attributable to Ingevity stockholders
|
$
|
0.73
|
|
$
|
1.11
|
|
$
|
1.18
|
|
$
|
1.01
|
|
$
|
0.45
|
|
$
|
0.76
|
|
$
|
0.80
|
|
$
|
0.98
|
|
|||||||
|
Diluted earnings (loss) per common share attributable to Ingevity stockholders
(1)
|
$
|
0.72
|
|
$
|
1.10
|
|
$
|
1.16
|
|
$
|
0.99
|
|
$
|
0.45
|
|
$
|
0.76
|
|
$
|
0.79
|
|
$
|
0.97
|
|
|||||||
|
Weighted average shares outstanding
|
|||||||||||||||||||||||||||||||
|
Basic
|
42.1
|
|
42.1
|
|
42.0
|
|
41.9
|
|
42.1
|
|
42.1
|
|
42.1
|
|
42.1
|
|
|||||||||||||||
|
Diluted
|
42.6
|
|
42.6
|
|
42.7
|
|
42.5
|
|
42.4
|
|
42.4
|
|
42.5
|
|
42.6
|
|
|||||||||||||||
_______________
|
(1)
|
Basic and diluted earnings (loss) per share are calculated using the weighted average number of common shares outstanding for the period. The sum of quarterly earnings per common share may differ from the full-year amount.
|
112
Note 24: Subsequent Event
Perstorp AB's Caprolactone Business
On December 10, 2018, we entered into an agreement for the Sale and Purchase of Perstorp UK Ltd. (the “Caprolactone Agreement”) with Perstorp Holding AB, a company registered in Sweden, that develops, manufactures, and sells specialty chemicals (the “Seller”). Pursuant to the Caprolactone Agreement, we agreed to purchase the shares held by the Seller in Perstorp UK Ltd., including the Seller’s entire caprolactone business, in exchange for
€570.9 million
, less assumed debt and other miscellaneous transaction costs, as further defined in the Caprolactone Agreement (the “Purchase Price”), plus interest accrued on the Purchase Price (herein referred to as the “Caprolactone Acquisition”).
On February 13, 2019, pursuant to the terms and conditions set forth in the Caprolactone Agreement, we completed the Caprolactone Acquisition for an aggregate preliminary purchase price of
€578.9 million
(
$652.5 million
) excluding net debt to be assumed of
€100.4 million
(
$113.1 million
). At closing, the assumed net debt was settled with an affiliate of the counterparty, Perstorp Holding AB. Beginning in the first quarter of 2019, the Caprolactone Acquisition will be integrated into our Performance Chemicals segment and included within our Engineered Polymers product line. Our revolving credit facility was utilized as the primary source of funds, along with available cash on hand, to close our Caprolactone Acquisition. Our available capacity under our revolving credit facility immediately following this drawdown was
$113.1 million
.
Caprolactone Acquisition is considered a business under business combinations accounting guidance, and therefore we will apply acquisition accounting. Acquisition accounting requires, among other things, that assets and liabilities assumed be recognized at their fair values as of the acquisition date. The net assets of the Caprolactone Acquisition will be recorded at the estimated fair values using primarily Level 2 and Level 3 inputs (see Note 17 for an explanation of Level 2 and 3 inputs).
We have performed a preliminary valuation of the fair value of the acquired assets and liabilities assumed. Based on this preliminary allocation of the purchase price, we believe the primary assets acquired and their estimated values are; goodwill of approximately
$310 million
and tangible and intangible assets of approximately
$220 million
. This preliminary assessment of fair value is based on draft reports from our valuation experts and is subject to change based on its preliminary nature. Once our detailed preliminary purchase price valuation is completed, we will include the required additional details in our future filings. We have not completed the detailed analysis to present the pro forma financial information for the combined companies. Thus, the pro forma financial information will be included in our future filings as well.
113
INGEVITY CORPORATION
SCHEDULE II - VALUATION AND QUALIFYING ACCOUNTS AND RESERVES
FOR YEARS ENDED DECEMBER 31, 2018, 2017, and 2016
|
Provision/ (Benefit)
|
||||||||||||||||
|
(in millions)
|
Balance, Beginning of Year
|
Charged to Costs and Expenses
|
Charged to Other Comprehensive Income
|
Write-offs
(1)
|
Balance, End of Year
|
|||||||||||
|
December 31, 2018
|
||||||||||||||||
|
Reserve for doubtful accounts
(2)
|
$
|
0.4
|
|
—
|
|
—
|
|
—
|
|
$
|
0.4
|
|
||||
|
Deferred tax valuation allowance
|
$
|
20.4
|
|
(2.6
|
)
|
(2.3
|
)
|
—
|
|
$
|
15.5
|
|
||||
|
December 31, 2017
|
||||||||||||||||
|
Reserve for doubtful accounts
(2)
|
$
|
0.3
|
|
0.1
|
|
—
|
|
—
|
|
$
|
0.4
|
|
||||
|
Deferred tax valuation allowance
|
$
|
18.8
|
|
1.7
|
|
(0.1
|
)
|
—
|
|
$
|
20.4
|
|
||||
|
December 31, 2016
|
||||||||||||||||
|
Reserve for doubtful accounts
(2)
|
$
|
0.1
|
|
0.2
|
|
—
|
|
—
|
|
$
|
0.3
|
|
||||
|
Deferred tax valuation allowance
|
$
|
6.6
|
|
13.2
|
|
(1.0
|
)
|
—
|
|
$
|
18.8
|
|
||||
_______________
|
(1)
|
Write-offs are net of recoveries.
|
|
(2)
|
Reserve for doubtful accounts is included within Accounts receivable, net on the consolidated balance sheet.
|
114
ITEM 9. CHANGES IN AND DISAGREEMENTS WITH ACCOUNTANTS ON ACCOUNTING AND FINANCIAL DISCLOSURE
None.
ITEM 9A. CONTROLS AND PROCEDURES
The Company maintains a system of disclosure controls and procedures designed to provide reasonable assurance that information required to be disclosed in the Company's reports filed or submitted under the Securities Exchange Act of 1934, as amended ("Exchange Act") is recorded, processed, summarized and reported within the time periods specified in the rules and forms of the SEC. These controls and procedures also provide reasonable assurance that information required to be disclosed in such reports is accumulated and communicated to management as appropriate to allow timely decisions regarding required disclosures.
As of
December 31, 2018
, the Company's Chief Executive Officer ("CEO") and Chief Financial Officer ("CFO"), together with management, conducted an evaluation of the effectiveness of the Company's disclosure controls and procedures pursuant to Rules 13a-15(b) and 15d-15(b) of the Exchange Act. Based on that evaluation, the CEO and CFO concluded that these disclosure controls and procedures are effective at the reasonable assurance level.
Changes in Internal Control over Financial Reporting
As a result of our acquisition of the Pine Chemical Business on March 8, 2018, Ingevity's internal control over financial reporting, subsequent to the date of acquisition, includes certain additional internal controls relating to Pine Chemicals Business. Except as described above, there have been no changes in the Company's internal control over financial reporting that occurred during the quarter ended
December 31, 2018
that have materially affected, or are reasonably likely to materially affect, the Company's internal control over financial reporting.
Management's Report on Internal Control of Financial Reporting
Refer to Management’s Report on Internal Control Over Financial Reporting, which is included within Part II. Item 8 of this Form 10-K and is incorporated by reference to this Item 9A.
Report of Independent Registered Public Accounting Firm
Refer to the Report of Independent Registered Public Accounting Firm, which is included within Part II. Item 8 of this Form 10-K and is incorporated by reference to this Item 9A.
ITEM 9B. OTHER INFORMATION
None.
115
PART III
ITEM 10. DIRECTORS, EXECUTIVE OFFICERS AND CORPORATE GOVERNANCE
Information concerning directors, appearing under the caption “Proposal No. 1 - Election of Directors” in our Proxy Statement to be filed with the SEC in connection with the Annual Meeting of Stockholders scheduled to be held on April 25, 2019 (the “Proxy Statement”), information concerning executive officers, appearing under the caption “Executive Officers of the Registrant” in Part I of this Form 10-K, information concerning the Audit Committee, appearing under the caption “Corporate Governance - Committees of our Board - Audit Committee” in the Proxy Statement, information concerning the Code of Ethics, appearing under the caption “Corporate Governance - Codes of Business Conduct and Ethics” in the Proxy Statement, and information about compliance with Section 16(a) of the Exchange Act appearing under the caption “Section 16(a) Beneficial Ownership Reporting Compliance” in the Proxy Statement, is incorporated herein by reference in response to this Item 10.
ITEM 11. EXECUTIVE COMPENSATION
The information contained in the Proxy Statement in the section titled “Compensation of Executive Officers” with respect to executive compensation, in the section titled “Director Compensation,” in the section titled "Compensation Committee Report" and in the section titled “Corporate Governance—Compensation Committee Interlocks and Insider Participation” is incorporated herein by reference in response to this Item 11.
ITEM 12. SECURITY OWNERSHIP OF CERTAIN BENEFICIAL OWNERS AND MANAGMENT AND RELATED STOCKHOLDER MATTERS
The information contained in the section titled “Common Stock Ownership of Executive Officers and Directors” in the Proxy Statement, with respect to security ownership of certain beneficial owners and management, is incorporated herein by reference in response to this Item 12.
Equity Compensation Plan Information
The table below sets forth information with respect to compensation plans under which equity securities of Ingevity are authorized for issuance as of
December 31, 2018
. All of the equity compensation plans pursuant to which we are currently granting equity awards have been approved by stockholders.
|
Plan Category
|
Number of Securities to
be issued upon exercise of
outstanding options and
restricted stock awards
(A)
(2)
|
Weighted-
average
exercise price of
outstanding
options and
restricted stock
awards
(B)
(3)
|
Number of Securities
remaining available for
future issuance under
equity compensation
plans (excluding securities
reflected in column (A))
(C)
(4)
|
||||||
|
Equity Compensation Plans approved by stockholders
(1)
|
757,681
|
|
$
|
46.98
|
|
3,258,944
|
|
||
|
(1)
|
Plans approved by WestRock as sole stockholder prior to the Separation while the Company was a wholly owned subsidiary.
|
|
(2)
|
Includes
403,193
stock options,
105,284
restricted stock units (RSUs) and
239,012
performance-based restricted stock units (PSUs) granted to employees and
10,192
RSUs held by directors. The number of shares to be issued for performance based stock unit awards has been calculated based on the assumption that the maximum performance level applicable to these awards will be achieved. The target payout of the performance based vesting restricted stock unit awards is
238,389
shares.
|
|
(3)
|
Represents the weighted-average exercise price of the outstanding stock options only. The outstanding RSUs and PSUs are not included in this calculation.
|
|
(4)
|
Includes
206,255
shares available for future issuance under the 2018 Ingevity Corporation Employee Stock Purchase Plan.
|
116
ITEM 13. CERTAIN RELATIONSHIPS AND RELATED TRANSACTIONS AND DIRECTOR INDEPENDENCE
The information contained in the Proxy Statement concerning our independent directors under the caption “Corporate Governance - Director Independence” and the information contained in the Proxy Statement concerning related party transactions and our review, approval or ratification thereof appearing under the caption “Related Party Transactions” is incorporated herein by reference in response to this Item 13.
ITEM 14. PRINCIPAL ACCOUNTING FEES AND SERVICES
The information contained in the Proxy Statement in the section titled “Proposal No. 3 - To Ratify Appointment of Independent Registered Public Accounting Firm” is incorporated herein by reference in response to this Item 14.
117
PART IV
ITEM 15. EXHIBITS
|
(a)
|
Documents filed with this Report
|
|
1.
|
Consolidated financial statements of Ingevity Corporation and its subsidiaries are incorporated under Item 8 of this Form 10-K.
|
|
2.
|
The following supplementary financial information is filed in this Form 10-K:
|
|
Page
|
|
|
Financial Statements Schedule II – Valuation and qualifying accounts and reserves for the years ended December 31, 2018, 2017, and 2016
|
|
The schedules not included herein are omitted because they are not applicable or the required information is presented in the financial statements or related notes.
|
3.
|
Exhibits: See attached Index of Exhibits
|
|
(b)
|
Exhibits
|
|
Exhibit No.
|
Exhibit Description
|
|
Separation and Distribution Agreement between Ingevity Corporation and WestRock Company (incorporated by reference to Exhibit 2.1 to the Company's Current Report on Form 8-K, as filed with the U.S. Securities and Exchange Commission on May 16, 2016).
|
|
|
Asset Purchase Agreement, by and among Georgia-Pacific Chemicals, LLC, Georgia-Pacific LLC, Ingevity Arkansas, LLC, and Ingevity Corporation, dated as of August 22, 2017 (incorporated by reference to Exhibit 2.1 to Form 8-K (File No. 001-37586) filed August 22, 2017).
|
|
|
First Amendment to Asset Purchase Agreement among Ingevity Corporation, Ingevity Arkansas, LLC, Georgia-Pacific Chemicals LLC and Georgia-Pacific LLC, dated as of March 8, 2018 (incorporated by reference to Exhibit 2.2 to the Company's Current Report on Form 8-K, as filed with the U.S. Securities and Exchange Commission on March 8, 2018).
|
|
|
Agreement for the Sale and Purchase of Perstorp UK Ltd., dated as of December 10, 2018, by and amount Perstorp AB and Ingevity Corporation (incorporated by reference to Exhibit 2.1 to the Company's Current Report on Form 8-K, as filed with the U.S. Securities and Exchange Commission on December 10, 2018).
|
|
|
Ingevity Corporation Amended and Restated Certificate of Incorporation (incorporated by reference to Exhibit 3.1 to the Company's Current Report on Form 8-K, as filed with the U.S. Securities and Exchange Commission on May 16, 2016).
|
|
|
Ingevity Corporation Amended and Restated Bylaws (incorporated by reference to Exhibit 3.2 to the Company's Current Report on Form 8-K, as filed with the U.S. Securities and Exchange Commission on May 16, 2016).
|
|
|
Indenture, dated as of January 24, 2018, among Ingevity Corporation, the Guarantors, and U.S. Bank National Association, a national banking association (incorporated by reference to Exhibit 4.1 to Form 8-K filed January 24, 2018).
|
|
|
Tax Matters Agreement between Ingevity Corporation and WestRock Company (incorporated by reference to Exhibit 10.1 to the Company's Current Report on Form 8-K, as filed with the U.S. Securities and Exchange Commission on May 16, 2016).
|
|
118
|
Exhibit No.
|
Exhibit Description
|
|
Transition Services Agreement between Ingevity Corporation and WestRock Company (incorporated by reference to Exhibit 10.2 to the Company's Current Report on Form 8-K, as filed with the U.S. Securities and Exchange Commission on May 16, 2016).
|
|
|
Employee Matters Agreement between Ingevity Corporation and WestRock Company (incorporated by reference to Exhibit 10.3 to the Company's Current Report on Form 8-K, as filed with the U.S. Securities and Exchange Commission on May 16, 2016).
|
|
|
Covington Plant Services Agreement between Ingevity Virginia Corporation and WestRock Virginia, LLC (incorporated by reference to Exhibit 10.2 to the Company's Current Report on Form 8-K, as filed with the U.S. Securities and Exchange Commission on May 11, 2016).
|
|
|
Covington Plant Ground Lease Agreement between Ingevity Virginia Corporation and WestRock Virginia, LLC (incorporated by reference to Exhibit 10.3 to the Company's Current Report on Form 8-K, as filed with the U.S. Securities and Exchange Commission on May 11, 2016).
|
|
|
Crude Tall Oil and Black Liquor Soap Skimmings Agreement by and between Ingevity Corporation, WestRock Shared Services, LLC and WestRock MWV, LLC (incorporated by reference to Exhibit 10.4 to the Company's Current Report on Form 8-K, as filed with the U.S. Securities and Exchange Commission on May 16, 2016).
|
|
|
Amendment No. 1 dated March 1, 2017, to Crude Tall Oil and Black Liquor Soap Skimming Agreement by and between WestRock Shared Services, LLC, WestRock MWV, LLC, on behalf of the affiliates of WestRock Company, and Ingevity Corporation. (incorporated by reference to Exhibit 10.7 to the Company’s Quarterly Report on Form 10-Q, as filed with the U.S. Securities and Exchange Commission on May 4, 2017).
|
|
|
Credit Agreement, dated as of March 7, 2016, among Ingevity Corporation, as U.S. borrower, the lenders from time to time party thereto and Wells Fargo Bank, N.A., as administrative agent (incorporated by reference to Exhibit 10.8 to the Company's Amendment No. 2 to Form 10, as filed with the U.S. Securities and Exchange Commission on March 7, 2016).
|
|
|
Incremental Facility Agreement and Amendment No. 1, by and among Ingevity Corporation, Ingevity Holdings SPRL, the other loan parties party thereto, the lenders party thereto and Wells Fargo Bank, N.A., as administrative agent, dated as of August 21, 2017 (incorporated by reference to Exhibit 10.1 to Form 8-K (File No. 001-37586) filed August 22, 2017).
|
|
|
Incremental Facility Agreement 2nd Amendment No. 2, by and among Ingevity Corporation, Ingevity Holdings SPRL, the other loan parties party thereto, the lenders party thereto and Wells Fargo Bank, N.A., as administrative agent, dated as of August 7, 2018 (incorporated by reference to Exhibit 10.1 to the Company's Current Report on Form 8-K, as filed with the U.S. Securities and Exchange Commission on August 9, 2018).
|
|
|
Intellectual Property Agreement by and between WestRock Company and Ingevity Corporation (incorporated by reference to Exhibit 10.5 to the Company's Current Report on Form 8-K, as filed with the U.S. Securities and Exchange Commission on May 16, 2016).
|
|
|
Employment Letter, dated September 18, 2015, between WestRock Company, Ingevity Corporation and John Fortson (incorporated by reference to Exhibit 10.10 to the Company's Amendment No. 3 to Form 10, as filed with the U.S. Securities and Exchange Commission on April 4, 2016).
|
|
|
Employment Letter, dated October 2, 2015, between WestRock Company, Ingevity Corporation and Katherine P. Burgeson (incorporated by reference to Exhibit 10.11 to the Company's Amendment No. 3 to Form 10, as filed with the U.S. Securities and Exchange Commission on April 4, 2016).
|
|
|
Employment Letter, dated July 24, 2015, between WestRock Company, Ingevity Corporation and Michael Wilson (incorporated by reference to Exhibit 10.12 to the Company's Amendment No. 3 to Form 10, as filed with the U.S. Securities and Exchange Commission on April 4, 2016).
|
|
119
|
Exhibit No.
|
Exhibit Description
|
|
Ingevity Corporation 2016 Omnibus Incentive Plan (incorporated by reference to Exhibit 10.6 to the Company's Current Report on Form 8-K, as filed with the U.S. Securities and Exchange Commission on May 16, 2016).
|
|
|
Trust Agreement, between Ingevity Corporation, The Bank of New York Mellon Trust Company, N.A. and WestRock Company (incorporated by reference to Exhibit 10.1 to the Company's Current Report on Form 8-K, as filed with the U.S. Securities and Exchange Commission on May 11, 2016).
|
|
|
Form of Option Award Term under the Ingevity Corporation 2016 Omnibus Incentive Plan (incorporated by reference to Exhibit 10.13a to the company’s Quarterly Report on Form 10-Q for the quarterly period ended June 30, 2016).
|
|
|
Form of Performance-based Restricted Stock Unit Terms under the Ingevity Corporation 2016 Omnibus Incentive Plan (incorporated by reference to Exhibit 10.13b to the company’s Quarterly Report on Form 10-Q for the quarterly period ended June 30, 2016).
|
|
|
Form of Replacement Cash Awards under the Ingevity Corporation 2016 Omnibus Incentive Plan (incorporated by reference to Exhibit 10.13c to the company’s Quarterly Report on Form 10-Q for the quarterly period ended June 30, 2016).
|
|
|
Form of Restricted Stock Unit Terms (three year vesting) under the Ingevity Corporation 2016 Omnibus Incentive Plan (incorporated by reference to Exhibit 10.13d to the company’s Quarterly Report on Form 10-Q for the quarterly period ended June 30, 2016).
|
|
|
Form of Restricted Stock Unit Terms (cliff vesting) under the Ingevity Corporation 2016 Omnibus Incentive Plan (incorporated by reference to Exhibit 10.13e to the company’s Quarterly Report on Form 10-Q for the quarterly period ended June 30, 2016).
|
|
|
Form of Restricted Stock Unit Terms (D. Michael Wilson) under the Ingevity Corporation 2016 Omnibus Incentive Plan (incorporated by reference to Exhibit 10.13f to the company’s Quarterly Report on Form 10-Q for the quarterly period ended June 30, 2016).
|
|
|
Non-Employee Director Terms and Conditions for Restricted Stock Units under the Ingevity Corporation 2016 Omnibus Incentive Plan (incorporated by reference to Exhibit 10.14g to the company’s Annual Report on Form 10-K for the year ended December 31, 2016).
|
|
|
Non-Employee Director Terms and Conditions for Deferred Stock Units in lieu of Restricted Stock Units under the Ingevity Corporation 2016 Omnibus Incentive Plan (incorporated by reference to Exhibit 10.14h to the company’s Annual Report on Form 10-K for the year ended December 31, 2016).
|
|
|
Non-Employee Director Terms and Conditions for Deferred Stock Units in lieu of Annual Cash Retainer under the Ingevity Corporation 2016 Omnibus Incentive Plan (incorporated by reference to Exhibit 10.14i to the company’s Annual Report on Form 10-K for the year ended December 31, 2016).
|
|
|
Ingevity Corporation Deferred Compensation Plan, effective January 1, 2016. (incorporated by reference to Exhibit 10.15 to the company’s Annual Report on Form 10-K for the year ended December 31, 2016).
|
|
|
Ingevity Corporation Non-Employee Director Deferred Compensation Plan (incorporated by reference to Exhibit 10.16 to the company’s Annual Report on Form 10-K for the year ended December 31, 2016).
|
|
|
Ingevity Corporation Non-Employee Director Compensation Policy (incorporated by reference to Exhibit 10.17 to the company’s Annual Report on Form 10-K for the year ended December 31, 2016).
|
|
120
|
Exhibit No.
|
Exhibit Description
|
|
Change in control and severance agreement between Ingevity Corporation and D. Michael Wilson dated March 1, 2017 (incorporated by reference to Exhibit 10.1 to the Company's Current Report on Form 8-K, as filed with the U.S. Securities and Exchange Commission on March 7, 2017).
|
|
|
Change in control and severance agreement between Ingevity Corporation and John C. Fortson dated March 1, 2017 (incorporated by reference to Exhibit 10.2 to the Company's Current Report on Form 8-K, as filed with the U.S. Securities and Exchange Commission on March 7, 2017).
|
|
|
Change in control and severance agreement between Ingevity Corporation and Katherine P. Burgeson dated March 1, 2017 (incorporated by reference to Exhibit 10.3 to the Company's Current Report on Form 8-K, as filed with the U.S. Securities and Exchange Commission on March 7, 2017).
|
|
|
Change in control and severance agreement between Ingevity Corporation and S. Edward Woodcock, Jr. dated March 1, 2017 (incorporated by reference to Exhibit 10.4 to the Company's Current Report on Form 8-K, as filed with the U.S. Securities and Exchange Commission on March 7, 2017).
|
|
|
2017 Ingevity Corporation Employee Stock Purchase Plan (incorporated by reference to Exhibit 4.1 to the Company's Form S-8, as filed with the U.S. Securities and Exchange Commission on May 23, 2017).
|
|
|
Crude Tall Oil Supply Agreement between Ingevity Corporation and Georgia-Pacific LLC, dated as of March 8, 2018 (incorporated by reference to Exhibit 10.1 to the Company's Current Report on Form 8-K, as filed with the U.S. Securities and Exchange Commission on March 8, 2018).
|
|
|
Ingevity Corporation List of Significant Subsidiaries
|
|
|
Consent of PricewaterhouseCoopers LLP
|
|
|
Rule 13a-14(a)/15d-14(a) Certification of the Company’s Principal Executive Officer.
|
|
|
Rule 13a-14(a)/15d-14(a) Certification of the Company’s Principal Financial Officer.
|
|
|
Section 1350 Certification of the company’s Principal Executive Officer. The information contained in this Exhibit shall not be deemed filed with the Securities and Exchange Commission nor incorporated by reference in any registration statement filed by the registrant under the Securities Act of 1933, as amended.
|
|
|
Section 1350 Certification of the company’s Principal Financial Officer. The information contained in this Exhibit shall not be deemed filed with the Securities and Exchange Commission nor incorporated by reference in any registration statement filed by the registrant under the Securities Act of 1933, as amended.
|
|
|
101
|
Interactive Data File
|
* Incorporated by reference
+ Management contract or compensatory plan or arrangement
ITEM 16. FORM 10-K SUMMARY
None.
121
SIGNATURES
Pursuant to the requirements of Section 13 or 15(d) of the Securities Exchange Act of 1934, the Registrant has duly caused this report to be signed on its behalf by the undersigned, thereunto duly authorized.
|
INGEVITY CORPORATION
|
|
|
(Registrant)
|
|
|
By:
|
/S/ JOHN C. FORTSON
|
|
John C. Fortson
|
|
|
Executive Vice President, Chief Financial Officer and Treasurer
|
|
|
(Principal Financial Officer and Duly Authorized Officer)
|
|
Date:
February 20, 2019
Pursuant to the requirements of the Securities and Exchange Act of 1934, this report has been signed below by the following persons on behalf of the registrant and in the capacities and on the dates indicated.
|
Signature
|
Title
|
Date
|
|
/s/ D. Michael Wilson
D. Michael Wilson
|
President,
Chief Executive Officer and Director
(Principal Executive Officer)
|
February 20, 2019
|
|
/s/ John C. Fortson
John C. Fortson
|
Executive Vice President,
Chief Financial Officer and Treasurer
(Principal Financial Officer)
|
February 20, 2019
|
|
/s/ Phillip J. Platt
Phillip J. Platt
|
Chief Accounting Officer and
Corporate Controller
(Principal Accounting Officer) |
February 20, 2019
|
|
/s/ Richard B. Kelson
Richard B. Kelson
|
Chairman of the Board
|
February 20, 2019
|
|
/s/ Jean S. Blackwell
Jean S. Blackwell
|
Director
|
February 20, 2019
|
|
/s/ Luis Fernandez-Moreno
Luis Fernandez-Moreno
|
Director
|
February 20, 2019
|
|
/s/ J. Michael Fitzpatrick
J. Michael Fitzpatrick
|
Director
|
February 20, 2019
|
|
/s/ Frederick J. Lynch
Frederick J. Lynch
|
Director
|
February 20, 2019
|
|
/s/ Daniel F. Sansone
Daniel F. Sansone
|
Director
|
February 20, 2019
|
122
TABLE OF CONTENTS
Part IItem 1. BusinessItem 1A. Risk FactorsItem 1B. Unresolved Staff CommentsItem 2. PropertiesItem 3. Legal ProceedingsItem 4. Mine Safety DisclosuresPart IIItem 5. Market For Registrant's Common Equity, Related Stockholders Matter and Issuer Purchases Of Equity SecuritiesItem 6. Selected Financial DataItem 7. Management S Discussion and Analysis Of Financial Condition and Results Of OperationsItem 7. Management S Discussion and Analysis Of Financial Condition andItem 7A. Quantitative and Qualitative Disclosures About Market RiskItem 8. Financial Statements and Supplementary DataNote 1: BackgroundNote 2: Basis Of Consolidation and PresentationNote 3: Summary Of Significant Accounting PoliciesNote 4: New Accounting GuidanceNote 5: RevenuesNote 6: Financial Instruments, Risk Management, and Fair Value MeasurementsNote 7: Inventories, NetNote 8: Property, Plant and Equipment, NetNote 9: Goodwill and Other Intangible Assets, NetNote 10: Debt, Including Capital Lease ObligationsNote 11: Share-based CompensationNote 12: EquityNote 13: Transactions with Westrock and Related PartiesNote 14: Retirement PlansNote 15: Business SeparationNote 16: Restructuring and Other (income) Charges, NetNote 17: AcquisitionsNote 18: Income TaxesNote 19: Commitments and ContingenciesNote 20: Segment InformationNote 21: Earnings (loss) Per ShareNote 22: Supplemental InformationNote 23: Quarterly Financial Information (unaudited)Note 24: Subsequent EventItem 9. Changes in and Disagreements with Accountants on Accounting and Financial DisclosureItem 9A. Controls and ProceduresItem 9B. Other InformationPart IIIItem 10. Directors, Executive Officers and Corporate GovernanceItem 11. Executive CompensationItem 12. Security Ownership Of Certain Beneficial Owners and Managment and Related Stockholder MattersItem 13. Certain Relationships and Related Transactions and Director IndependenceItem 14. Principal Accounting Fees and ServicesPart IVItem 15. ExhibitsItem 16. Form 10-k Summary