NMI HOLDINGS, INC.
10-Ks and 10-Qs
|
|
|
|
|
|
|
|
|
|
|
|
|
|
|
|
|
|
|
|
|
|
|
|
|
|
|
|
|
|
|
|
|
|
|
|
|
|
|
|
|
|
|
|
UNITED STATES
SECURITIES AND EXCHANGE COMMISSION
WASHINGTON, D.C. 20549
|
FORM 10-K
|
|
(Mark One)
|
|
|
x
|
ANNUAL REPORT PURSUANT TO SECTION 13 OR 15(d) OF THE SECURITIES EXCHANGE ACT OF 1934
For the fiscal year ended
December 31, 2013
|
OR
|
o
|
TRANSITION REPORT PURSUANT TO SECTION 13 OR 15(d) OF THE SECURITIES EXCHANGE ACT OF 1934
For the transition period from
to
|
|
Commission file number
001-36
174
|
|
NMI Holdings, Inc.
|
|
(Exact name of registrant as specified in its charter)
|
|
DELAWARE
|
|
45-4914248
|
|
(State or other jurisdiction of incorporation or organization)
|
(I.R.S. Employer Identification No.)
|
|
|
2100 Powell Street, Emeryville, CA
|
|
94608
|
|
(Address of principal executive offices)
|
(Zip Code)
|
|
(855) 530-6642
(Registrant's telephone number, including area code)
|
Securities registered pursuant to Section 12(b) of the Act:
|
||
|
Title of each class
|
Name of each exchange on which registered
|
|
|
Class A Common Stock, $.01 par value per share
|
NASDAQ Stock Market LLC
|
|
|
Securities registered pursuant to Section 12(b) of the Act:
|
||
|
None
|
||
Indicate by check mark if the registrant is a well-known seasoned issuer, as defined in Rule 405 of the Securities Act.
YES
o
NO
x
Indicate by check mark if the registrant is not required to file reports pursuant to Section 13 or 15(d) of the Act.
YES
o
NO
x
Indicate by check mark whether the registrant (1) has filed all reports required to be filed by Section 13 or 15(d) of the Securities Exchange Act of 1934 during the preceding 12 months (or for such shorter period that the registrant was required to file such reports), and (2) has been subject to such filing requirements for the past 90 days.
YES
x
NO
o
Indicate by check mark whether the registrant has submitted electronically and posted on its corporate Web site, if any, every Interactive Data File required to be submitted and posted pursuant to Rule 405 of Regulation S-T during the preceding 12 months (or for such shorter period that the registrant was required to submit and post such files).
YES
x
NO
o
Indicate by check mark if disclosure of delinquent filers pursuant to Item 405 of Regulation S-K (§229.405 of this chapter) is not contained herein, and will not be contained, to the best of registrant's knowledge, in definitive proxy or information statements incorporated by reference in Part III of this Form 10-K or any amendment to this Form 10-K.
o
Indicate by check mark whether the registrant is a large accelerated filer, an accelerated filer, a non-accelerated filer, or a smaller reporting company. See the definitions of “large accelerated filer”, “accelerated filer” and “smaller reporting company” in Rule 12b-2 of the Exchange Act. (Check one):
|
Large accelerated filer
o
|
Accelerated filer
o
|
Non-accelerated filer
x
|
Smaller reporting company
o
|
|
(Do not check if a smaller reporting company)
|
|||
Indicate by check mark whether the registrant is a shell company (as defined in Rule 12b-2 of the Exchange Act).
YES
o
NO
x
As of June 30, 2013, the last business day of the registrant’s most recently completed second fiscal quarter, there was no established public market for the registrant’s common stock and, therefore, the registrant cannot calculate the aggregate market value of its common stock held by non-affiliates as of such date.
The number of shares of common stock, $0.01 par value per share, of the registrant outstanding on
March 7, 2014
was
58,065,326
shares.
DOCUMENTS INCORPORATED BY REFERENCE
Portions of the registrant's Proxy Statement for the
2014
Annual Meeting of Stockholders are incorporated herein by reference in Part III of this Annual Report on Form 10-K to the extent stated herein. Such Proxy Statement will be filed with the Securities and Exchange Commission within 120 days of the registrant's fiscal year ended
December 31, 2013
.
TABLE OF CONTENTS
|
PART I
|
||
|
Item 1.
|
||
|
Item 1A.
|
||
|
Item 1B.
|
||
|
Item 2.
|
||
|
Item 3.
|
||
|
Item 4.
|
||
|
PART II
|
||
|
Item 5.
|
||
|
Item 6.
|
||
|
Item 7.
|
||
|
Item 7A.
|
||
|
Item 8.
|
||
|
Item 9.
|
||
|
Item 9A.
|
||
|
Item 9B.
|
||
|
PART III
|
||
|
Item 10.
|
||
|
Item 11.
|
||
|
Item 12.
|
||
|
Item 13.
|
||
|
Item 14.
|
||
|
PART IV
|
||
|
Item 15.
|
||
2
CAUTIONARY NOTE REGARDING FORWARD-LOOKING STATEMENTS
This report contains forward-looking statements. Any statements about our expectations, beliefs, plans, predictions, forecasts, objectives, assumptions or future events or performance are not historical facts and may be forward-looking. These statements are often, but not always, made through the use of words or phrases such as “anticipate,” “believes,” “can,” “could,” “may,” “predicts,” “potential,” “should,” “will,” “estimate,” “plans,” “projects,” “continuing,” “ongoing,” “expects,” “intends” and similar words or phrases. Accordingly, these statements are only predictions and involve estimates, known and unknown risks, assumptions and uncertainties that could cause actual results to differ materially from those expressed in them. Our actual results could differ materially from those anticipated in such forward-looking statements as a result of several factors more fully described in this report in Part I, Item 1A., “
Risk Factors
”, in Part II, Item 7, "
Management's Discussion and Analysis of Financial Condition and Results of Operations"
and elsewhere in this report, including the exhibits hereto.
Any or all of our forward-looking statements in this report may turn out to be inaccurate. The inclusion of this forward-looking information should not be regarded as a representation by us or any other person that the future plans, estimates or expectations contemplated by us will be achieved. We have based these forward-looking statements largely on our current expectations and projections about future events and financial trends that we believe may affect our financial condition, operating results, business strategy and financial needs. There are important factors that could cause our actual results, level of activity, performance or achievements to differ materially from the results, level of activity, performance or achievements expressed or implied by the forward-looking statements including, but not limited to, statements regarding:
|
•
|
our status as a recently organized corporation and lack of operating history;
|
|
•
|
receipt of a certificate of authority to act as a mortgage insurer in Wyoming;
|
|
•
|
retention of our existing certificates of authority in states where we have obtained them and our ability to remain a mortgage insurer in good standing in those states;
|
|
•
|
changes in the business practices of the GSEs, including modifications to their mortgage insurer eligibility requirements or decisions to decrease or discontinue the use of mortgage insurance;
|
|
•
|
our ability to remain a qualified mortgage insurer under the requirements imposed by the GSEs;
|
|
•
|
actions of existing competitors and potential market entry by new competitors;
|
|
•
|
changes to laws and regulations, including changes to the GSEs' role in the secondary mortgage market or other changes that could affect the residential mortgage industry generally or mortgage insurance in particular;
|
|
•
|
changes in general economic, market and political conditions and policies, interest rates, inflation and investment results or other conditions that affect the housing market or the markets for home mortgages or mortgage insurance;
|
|
•
|
changes in the regulatory environment;
|
|
•
|
our ability to implement our business strategy, including our ability to attract customers, implement successfully and on a timely basis, complex infrastructure, systems, procedures, and internal controls to support our business and regulatory and reporting requirements of the insurance industry;
|
|
•
|
failure of risk management or investment strategy;
|
|
•
|
claims exceeding our reserves or amounts we had expected to experience;
|
|
•
|
failure to develop, maintain and improve necessary information technology systems or the failure of technology providers to perform;
|
|
•
|
ability to recruit, train and retain key personnel; and
|
|
•
|
emergence of claim and coverage issues.
|
All forward-looking statements are necessarily only estimates of future results, and actual results may differ materially from expectations. You are, therefore, cautioned not to place undue reliance on such statements which should be read in conjunction with the other cautionary statements that are included elsewhere in this report. Further, any forward-looking statement speaks only as of the date on which it is made and we undertake no obligation to update or revise any forward-looking statement to reflect events or circumstances after the date on which the statement is made or to reflect the occurrence of unanticipated events. You should, however, review the risk factors we describe in the reports we will file from time to time with the Securities and Exchange Commission ("SEC") after the date of this report.
3
Unless expressly indicated or the context requires otherwise, the terms "we", "our", "us" and "Company" in this document refer to NMI Holdings, Inc., a Delaware corporation, and its wholly owned subsidiaries.
4
While we intend to operate our business as described in this report, we are a new company without a significant operating history. As a result of our experience, changes in market conditions and other factors, we may alter certain of our business methods, plans or strategies, such as the amount and types of mortgage insurance we underwrite.
General
NMI Holdings, Inc. ("NMIH" or the "Company") was formed in May 2011 and, through its subsidiaries, provides private mortgage guaranty insurance (which we refer to as "mortgage insurance" or "MI"). As used below, "we" and "our" refer to NMIH's consolidated operations. MI protects mortgage lenders from all or a portion of default-related losses on residential mortgage loans made to home buyers who generally make down payments of less than 20% of the home’s purchase price. By protecting lenders and investors from credit losses, we help facilitate the availability of mortgages to prospective, primarily first-time, U.S. home buyers, thus promoting homeownership and helping to revitalize our residential communities. MI also facilitates the sale of these mortgage loans in the secondary mortgage market, most of which are sold to Fannie Mae and Freddie Mac. Our business strategy is to become a leading national MI company with our principal focus on writing insurance on high quality, low down payment residential mortgages in the United States. Following our formation, we focused our efforts on organizational development, capital raising and other start-up related activities. In November 2011, we entered into a definitive agreement to acquire MAC Financial Holding Corporation and its Wisconsin licensed insurance subsidiaries, Mortgage Assurance Corporation, Mortgage Assurance Reinsurance Inc One and Mortgage Assurance Reinsurance Inc Two, each a Wisconsin corporation, which we renamed National Mortgage Insurance Corporation (“NMIC”), National Mortgage Reinsurance Inc One (“Re One”) and National Mortgage Reinsurance Inc Two (“Re Two”), respectively. We refer to this acquisition as the "MAC Acquisition". In April 2012, we raised net proceeds of approximately
$510 million
from a private placement of our common stock (the "Private Placement") and completed the acquisition of MAC Financial and its insurance subsidiaries. The proceeds from the Private Placement were and will be primarily used to capitalize our insurance subsidiaries and fund our operating expenses until our insurance subsidiaries generate positive cash flows. On September 30, 2013, we merged MAC Financial Holding Corporation into NMIH, with NMIH surviving the merger, and we merged Re Two into NMIC, with NMIC surviving the merger.
In January 2013, Fannie Mae and Freddie Mac (collectively the “GSEs”) approved NMIC as a qualified MI provider on loans purchased by the GSEs. With our GSE Approval, our customers who originate loans insured by NMIC may sell such loans to the GSEs (as of April 1, 2013 for Freddie Mac and as of June 1, 2013 for Fannie Mae). Our primary insurance subsidiary, NMIC, requires a certificate of authority, or insurance license, in each state or jurisdiction where we issue insurance policies. We applied for a certificate of authority in each of the 50 states and D.C. in June 2012. We are currently licensed in 49 states and D.C. On November 8, 2013, we filed a final prospectus announcing the sale of
2.1 million
shares of common stock through an initial public offering ("IPO"). The principal reason for conducting the IPO was to expedite an increase in the number of holders of our common stock to permit a listing of our common stock on the NASDAQ Global Market ("NASDAQ"). Obtaining a listing on the NASDAQ satisfied certain contractual obligations we had to our stockholders under a Registration Rights Agreement we entered into in connection with the Private Placement. On November 12, 2013, the underwriters exercised their option in full to purchase an additional
315,000
shares of common stock at a price of
$13.00
per share, before underwriting discounts. The offering closed on November 14, 2013. Gross proceeds to us were
$31.4 million
. Net proceeds from the offering were approximately
$28 million
, after an approximate
6%
underwriting fee and other offering expenses and reimbursements pursuant to the underwriting agreement.
Following our IPO, and to meet our obligations under the Registration Rights Agreement, we filed a final prospectus on December 9, 2013 registering 51,101,434 Class A common shares. These shares had previously been issued during our Private Placement.
Our principal office is located at 2100 Powell Street, 12th floor, Emeryville, CA 94608. Our main telephone number is (855) 530-NMIC (6642), and our website is www.nationalmi.com. Copies of our Annual Reports on Form 10-K, Quarterly Reports on Form 10-Q, Current Reports on Form 8-K and any amendments to those reports are available free of charge through our website as soon as reasonably practicable after they are electronically filed with, or furnished to, the SEC. In addition, a written copy of the Company's Business Conduct Policy, containing our code of ethics that is applicable to all of our directors, officers and employees, is also available on our website. Information contained or referenced on our website is not incorporated by reference into, and does not form a part of, this report.
5
Overview of the Private Mortgage Insurance Industry
The modern MI industry was established in the late 1950's to provide a private market alternative to federal government insurance programs, principally the Federal Housing Administration ("FHA"). MI covers losses of the insured institutions should homeowners default on their residential mortgage loans, up to pre-established coverage levels, reducing the loss to the insured institutions. MI enables consumers, especially first-time homebuyers, to finance homes with less than a 20% down payment, thereby expanding homeownership opportunities. Loans with less than 20% down payments are generally referred to as “low down payment” mortgages or loans.
The MI industry has from time to time experienced catastrophic losses similar to the losses recently experienced by the existing MI providers. In the past, such losses have followed (i) severe regional or national recessions and attendant declines in property values in the regions affected and (ii) the lenders' development of new mortgage products to defer the impact on home buyers of adjustable rate mortgages with a below market teaser rate. Prior to the 2005-2010 cycle of such losses, the last time that private mortgage insurers experienced substantial losses of this nature was in the mid-to-late 1980s. The mortgage crisis in recent years had a profound negative effect on the operating results and capital position of the MI industry and some companies were forced into receivership and ceased writing new business.
Financial Crisis and Recovery
The severe economic downturn and housing market decline experienced during the recent financial crisis had a profound impact on our industry. Legacy insurers experienced record high claims activity and sustained significant financial losses, resulting in depleted capital positions. Since 2007, three private mortgage insurers ceased writing new business and exited the market, and several other insurers were forced to raise capital to repair their balance sheets and remain in operation. Although certain remaining legacy insurers continue to deal with challenges, the ongoing improvement of housing market fundamentals and the high credit quality of post-crisis new business are expected to support improved growth and profitability in the private MI sector post-crisis.
Following the financial crisis, mortgage lenders have significantly tightened their underwriting standards, generally limiting the availability of loans to borrowers with higher credit scores and low debt to income ratios who can fully document their income and assets. From 2011 through 2013, the average borrower credit score on all mortgage loans originated in the United States and sold to the GSEs was 758, compared to 717 for the period from 2005 through 2007. Banks have largely stopped offering loans with certain characteristics that generated high levels of defaults and losses during the financial crisis, including interest only and negative amortization loans. We believe that prudent underwriting standards coupled with higher credit quality borrowers will result in lower mortgage default experience that will translate into fewer claims for the mortgage insurance industry on policies written in the post-crisis period.
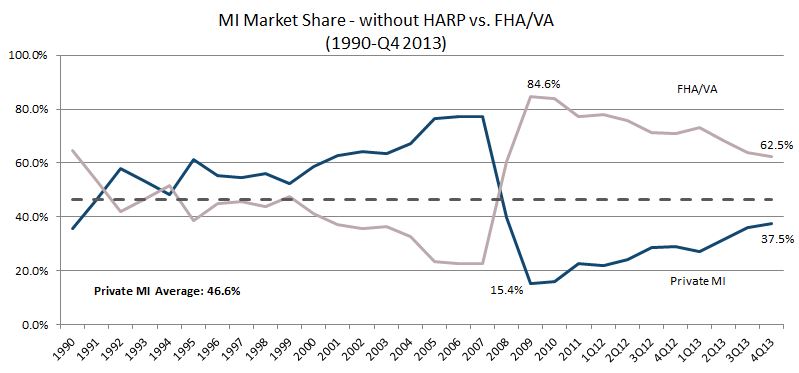
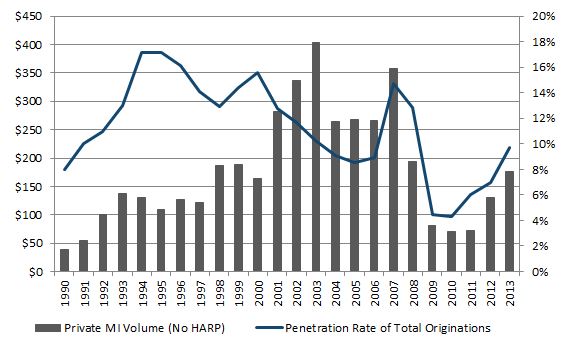
Prior to the recent financial crisis, private mortgage insurers accounted for the majority of the insured mortgage origination market. In 2007, private mortgage insurance represented approximately 77% of insured mortgages and covered approximately 16% of the total mortgage origination volume. To stabilize the disruption in the housing market resulting from the financial crisis, the Federal government, among other things, significantly expanded its role in the mortgage insurance market. Government agencies, including the Federal Housing Agency ("FHA") and the Veterans Administration ("VA"), began to insure an increasing percentage of the market as incumbent private insurers came under significant financial stress. By 2009, private mortgage insurance represented approximately 15% of insured mortgages and covered approximately 4% of the total mortgage origination volume.
The private mortgage insurance industry has begun to recover, capturing an increasing share of the total insured market and thereby leading to higher private mortgage insurance penetration of the total mortgage origination market. In the fourth quarter of 2013, according to Inside Mortgage Finance, private mortgage insurance increased to approximately 38% of insured mortgages and covered approximately 10% of the total mortgage origination volume. These gains have been driven in part by the improved financial position of legacy insurers, the influx of private capital into the sector to support new entrants like NMIC and the FHA's decision to increase its mortgage insurance premium rates and upfront fees multiple times since 2010. We expect that, as the U.S. housing market continues to recover, the demand for private capital to insure mortgage risk and to facilitate secondary market loan sales will grow. As a result of this trend, we believe that private mortgage insurance will continue to increase its share of the insured mortgage market in the coming years.
The two graphs below show the relative share of the insured mortgage market (excluding activity under the Federal Home Affordable Refinance Program ("HARP") covered by public and private participants, and private mortgage insurance penetration rates, which represent private mortgage insurance new insurance written ("NIW") to total U.S. residential mortgage origination volume.
6

Source:
Inside Mortgage Finance ©, February 21, 2014
www.insidemortgagefinance.com
Private MI NIW ($ in billions)
Source:
Inside Mortgage Finance ©, February 21, 2014
www.insidemortgagefinance.com
7
GSEs
The GSEs are the principal purchasers of the mortgages insured by MI companies, primarily as a result of their governmental mandate to provide liquidity in the secondary mortgage market. Freddie Mac's and Fannie Mae's federal charters prohibit the GSEs from purchasing a low down payment loan, unless the loan is insured by a qualified mortgage insurer, the mortgage seller retains at least a 10% participation in the loan or the seller agrees to repurchase or replace the loan in the event of a default. As a result, the nature of the private mortgage insurance industry in the United States is driven in large part by the requirements and practices of the GSEs, which include:
|
•
|
the minimum capital levels required to be maintained by MI companies;
|
|
•
|
the underwriting standards that determine what loans are eligible for purchase by the GSEs, which can affect the quality of the risk insured by the mortgage insurer and the availability of mortgage loans;
|
|
•
|
the terms that the GSEs require to be included in MI policies for loans that they purchase;
|
|
•
|
the level of MI coverage, subject to the requirements of the GSEs' charters as to when MI is used as the required credit enhancement on low down payment mortgages;
|
|
•
|
the amount of loan level delivery fees (which result in higher costs to borrowers) that the GSEs assess on loans that require MI; and
|
|
•
|
the availability of different loan purchase programs from the GSEs that allow different levels of MI coverage.
|
The FHFA, as the GSEs' conservator, has the authority to control and direct the GSEs' operations and the FHFA's policy objectives can result in changes to the GSEs' requirements and practices.
Each GSE maintains qualified mortgage insurer eligibility requirements, which they have been in the process of revising since mid-2010. The FHFA has announced its intent that the GSEs achieve uniformity in their respective requirements and that the requirements be finalized in the near term future. Although the GSEs and FHFA have not publicly commented on the final content of the revised mortgage insurer requirements, we believe they will include a new capital adequacy framework. The GSEs have announced to the MI industry that draft standards will be issued in 2014 and that there will be a public comment period prior to finalization of the standards. Under the terms of our GSE Approval, the GSEs have already imposed capitalization, operational and reporting conditions on NMIC and our holding company. It is difficult to predict whether any changes the GSEs might impose in their revised mortgage insurer eligibility requirements will have an effect on our business or the industry.
In addition, in connection with the FHFA's mandate that the GSEs align their mortgage insurer eligibility standards, the GSEs have imposed minimum standards for mortgage insurer master policies, including standards related to claim settlement and limitations on a mortgage insurer's rescission rights. During 2013, we agreed to terms of a new master policy with the GSEs and are in the process of seeking state insurance regulatory approvals of the policy form. We believe each of our competitors has also received GSE approval of its respective new policy and is likewise seeking state insurance regulatory approvals. The GSEs have announced preliminarily that, on and after July 1, 2014, in order to be eligible for purchase by the GSEs, low down payment loans requiring MI must be insured under a new master policy that they have approved through their policy alignment initiative.
In 2013, the FHFA's policy direction of the GSEs resulted in new business opportunities for MI companies. In its 2013 strategic plan for the GSEs, the FHFA included a target of $30 billion of unpaid principal balance in multiple types of risk-sharing transactions for both Fannie Mae and Freddie Mac, including the use of MI. The $30 billion of unpaid principal balance refers to the outstanding loan amount for all loans under consideration in these transactions. As discussed in this report, NMIC entered into a pool insurance agreement with Fannie Mae, pursuant to which NMIC initially insured approximately 22,000 residential mortgage loans with insurance-in-force (the aggregate unpaid principal balance) of $5.2 billion (as of September 1, 2013).
The placement of the GSEs into the conservatorship of the FHFA has also increased the likelihood that the U.S. Congress will act to address the role and purpose of the GSEs in the U.S. housing market and potentially legislate structural and other changes to the GSEs and the functioning of the secondary mortgage market. For additional discussion of GSE and housing finance reform, see below in
"- Regulation - Other U.S. Regulation - Housing Finance Reform"
.
8
Mortgage Insurance
The U.S. residential mortgage market is one of the largest in the world with over $9.9 trillion of debt outstanding as of December 31, 2013, and includes a range of private and government sponsored participants. Private industry participants include mortgage banks, mortgage brokers, commercial, regional and investment banks, savings institutions, credit unions, REITs, mortgage insurers and other financial institutions. Public participants include government agencies such as the FHA, VA and Ginnie Mae, and government-sponsored enterprises such as Fannie Mae and Freddie Mac. The overall U.S. residential mortgage market encompasses both primary and secondary markets. The primary market consists of lenders originating home loans to borrowers, and includes loans made to support home purchases, which are referred to as purchase originations, and loans made to refinance existing mortgages, which are referred to as refinancing originations. The secondary market includes institutions buying and selling mortgages in the form of whole loans or securitized assets, such as mortgage-backed securities.
Residential MI protects mortgage lenders and investors in the event of borrower default, by reducing and, in some instances, eliminating the resulting credit loss to the insured institution. By mitigating losses as a result of borrower default, mortgage insurance facilitates the origination of “low down payment” mortgages, which are mortgages to borrowers who make down payments of less than 20% of the value of the homes. Mortgage insurance also may reduce the capital that financial institutions are required to hold against insured loans and facilitates the sale of low down payment mortgage loans in the secondary mortgage market, primarily to the GSEs. NMIC’s residential mortgage insurance products will primarily provide first loss protection on loans originated by residential mortgage lenders and sold to the GSEs and, to a lesser extent, on low down payment loans held by portfolio lenders. NMIC offers the two principal types of MI, “primary” and “pool” which we discuss further below. We wrote our first primary insurance policy in April 2013 and we have entered into a pool coverage insurance transaction with Fannie Mae, which constitutes a significant percentage of our risk-in-force until our primary business writings reach a material level. We ultimately expect that most of the insurance that we write in the future will be primary insurance.
Primary Mortgage Insurance
Primary mortgage insurance provides mortgage default protection on individual loans at specified coverage percentages. Primary business is typically offered in one of two ways, either on a "flow" basis or in structured, bulk transactions. Mortgage insurers place flow mortgage insurance coverage as loan originations occur, one loan at a time. A structured, bulk transaction occurs when mortgage insurance coverage is placed on more than one loan, and typically after the loans have been originated. We currently offer primary mortgage insurance products on a flow basis to our customers. Our maximum obligation to an insured with respect to a claim is generally determined by multiplying the coverage percentage selected by the insured by the loss amount on the defaulted loan. The loss amount on an insured loan includes unpaid loan principal, delinquent interest and certain expenses associated with the default and subsequent foreclosure or sale of the property, all as specified in our master policy. At the time of a claim, we will typically pay the coverage percentage of the claim amount specified in the primary policy, but have the option to (i) pay 100% of the claim amount and acquire title to the property, or (ii) in the event the property is sold prior to settlement of the claim, pay the insured's actual loss up to the maximum level of coverage. We expect that most of our primary insurance will be written on first mortgage loans secured by owner occupied single-family homes, which are defined as one-to-four family homes and condominiums. To a lesser extent, we may also write primary insurance on first mortgages secured by non-owner occupied single-family homes, which are referred to in the home mortgage lending industry as investor loans, and on vacation or second homes.
Primary insurance-in-force (“IIF”) is the unpaid principal balance of insured loans. Primary risk-in-force (“RIF”) is the product of the coverage percentage multiplied by the unpaid principal balance. Lenders that purchase our mortgage insurance select specific coverage levels for insured loans, from the coverage percentages that we offer. For loans sold to Fannie Mae or Freddie Mac, the coverage percentage must comply with the requirements established by the particular GSE to which the loan is delivered. For other loans, the lender makes the determination. We expect our risk across all policies written to approximate 25% of the primary IIF but will vary between 6% and 35% coverage. We charge higher premium rates to account for the risk of higher coverage percentages, as higher coverage percentages generally result in higher amounts paid per claim.
Depending on the loan and the lender, the premium payments for flow primary mortgage insurance coverage are typically borne by the borrower and paid to the lender. Our industry refers to loans having this requirement as borrower paid mortgage insurance (“BPMI”). If the borrower is not required to pay the premium, then the premium is paid by the lender, who may recover the premium through an increase in the note rate on the mortgage or higher origination fees. Our industry refers to loans in which the premium is paid by the lender as lender paid mortgage insurance (“LPMI”). In either case, the payment of premium to us is the responsibility of the insured (i.e., the lender) and not the borrower. We currently expect that most of our primary insurance written will be BPMI, although this could change in the future.
Our premium rates are based on rates that we have filed with the various state insurance departments. To establish these rates, we use pricing models that assess risk across a spectrum of variables, including coverage percentages, loan-to-value ("LTV"),
9
loan and property attributes, and borrower risk characteristics. Premium rates cannot be changed after the issuance of coverage. Because we believe that over the long term, each region of the United States is subject to similar factors affecting risk of loss on insurance written, we generally utilize a nationally based, rather than a regional or local, premium rate policy for insurance written on a flow basis.
In general, premiums are calculated as basis points of the unpaid principal balance of an insured loan. We have four distinct types of premium plans:
|
•
|
single — the insured pays all premium upfront at the time coverage is placed;
|
|
•
|
annual — the insured pays premium at the time coverage is placed for the first 12 months of coverage. To maintain coverage, the insured subsequently pays renewal premiums for successive 12 month periods, with such renewals owed prior to the expiration of the then applicable 12 month period;
|
|
•
|
monthly — coverage begins and the insured pays premium for the first month of coverage on the loan close date. We subsequently bill the insured each month for the next month's coverage; and
|
|
•
|
monthly Advantage — coverage begins as of the loan close date, and when we receive notice of such close date, we subsequently bill the insured for the previous month of coverage and each month thereafter, the insured pays premium for the prior month of coverage.
|
In general, we may not terminate MI coverage except in the event there is non-payment of premiums or certain material violations of NMIC's mortgage insurance policies; although, as discussed below, the terms of our master policy restrict our rescission rights when certain criteria are met. Mortgage insurance coverage is renewable at the option of the insured lender, at the renewal rate fixed when the loan was initially insured. Lenders may cancel insurance written on a flow basis at any time at their option or because of mortgage repayment, which may be accelerated because of the refinancing of mortgages. In the case of a loan purchased by Freddie Mac or Fannie Mae, the GSEs' guidelines generally provide that a borrower meeting certain conditions may require the mortgage servicer to cancel insurance upon the borrower's request when the principal balance of the loan is 80% or less of the property's current value. The federal Homeowners Protection Act of 1998 (“HOPA”) also requires the automatic termination of BPMI on most loans when the LTV ratio (based upon the loan's amortization schedule) reaches 78%, and provides for cancellation of BPMI upon a borrower's request when the LTV ratio (based on the original value of the property) reaches 80%, upon satisfaction of the conditions set forth in the HOPA. In addition, some states impose their own notice and cancellation requirements on mortgage loan servicers.
National MI TrueGuide
SM
and SafeGuard
SM
Solutions
We believe our products and services provide our lender customers with a transparent and efficient method of placing primary mortgage insurance. Our underwriting guidelines, National MI TrueGuide
SM
, reflect what we believe are clear and straightforward eligibility requirements that are easy for our customers to follow. In addition, we believe the terms of our master policy offer a unique approach to rescission relief, as compared to historical standards, that sets us apart from other MI companies. Existing MI companies have rescinded or denied coverage on a significant number of mortgage insurance policies in recent years. We believe this has strained the relationship between a number of the mortgage originators and some existing mortgage insurers, providing an opportunity for a new entrant to more effectively compete with existing providers.
Through our National MI SafeGuard
SM
solution, as set forth in National MI’s current master policy, after a borrower has made his or her first 18 monthly payments in a timely manner on a loan we insure, we have agreed that we will not rescind or cancel coverage of that loan for material borrower misrepresentation or underwriting defects. In addition, if a borrower makes his first 18 payments in a timely manner, we have agreed to limitations on our ability to initiate an investigation of fraud or misrepresentation by our insureds or any other party involved in the origination of an insured loan, which we collectively refer to in our master policies as a "First Party." We refer to these provisions of our master policy as “rescission relief.” We believe the standard approach used by most MI companies is to provide rescission relief with respect to underwriting defects and investigation of First Party fraud or misrepresentation after 36 months of full and timely consecutive monthly payments.
On December 10, 2013, we announced that through a new version of our master policy and through an endorsement to our existing master policy, we will provide rescission relief after a borrower has timely made 12 consecutive monthly payments on a loan, rather than 18 months as provided in the current master policy. In January 2014, we filed an endorsement to our existing Master Policy to provide rescission relief after 12 months to loans insured under the existing policy on or after the effective date of the endorsement in each state in which the property securing the insured mortgage is located. We are also in the process of seeking state insurance regulatory approvals of the new policy form which contains the same 12 months rescission relief provisions that we offer in our existing endorsement. We believe the terms of our insurance coverage described in our master policy have been and will continue to be favorably received by our customers. We further believe that the new version of our master policy may result in us
10
gaining incrementally more market share, with no material increase in our underwriting expenses or losses incurred, than if we remained at an 18-month standard for rescission relief. Based on GSE requirements for the MI industry's implementation of new master policies, we expect that loans we insure will be covered by our new master policy, including the 12 months rescission relief provisions, on and after July 1, 2014. The new master policy is pending final approvals from state insurance regulators.
Pool Insurance
Pool insurance is generally used as an additional “credit enhancement” or "risk-sharing" strategy for certain secondary market mortgage transactions. Pool insurance generally covers the excess of loss on a defaulted mortgage loan that exceeds the claim payment under the primary MI coverage, if such loan has primary coverage, as well as the total loss on a defaulted mortgage loan that did not have primary coverage. Pool insurance may have a stated aggregate loss limit for a pool of loans and may also have a deductible under which no losses are paid by the mortgage insurer until the insured's losses on the pool of loans exceed the deductible.
As discussed above in "-
Overview of the Private Mortgage Insurance Industry - GSEs
", in 2013, the FHFA set goals for the GSEs to engage in $30 billion of risk sharing transactions in 2013. As described below in Part II, Item 7, "
Management's Discussion and Analysis of Financial Condition and Results of Operations - Factors Affecting Our Operating Results - Start-up Operations - New Business Writings"
, NMIC entered into an agreement with Fannie Mae, pursuant to which NMIC agreed to insure approximately 22,000 loans with insurance-in-force (the aggregate unpaid principal balance) of $5.2 billion (as of September 1, 2013). The effective date of the agreement and the coverage was September 1, 2013. Fannie Mae pays monthly insurance premiums in exchange for NMIC assuming net insurance risk of $93.1 million. We received our first premium payment in September 2013. This pool transaction is unlike a typical pool transaction in that the loans which make up this particular pool do not have primary MI on them, as the LTVs of those loans at origination were below what would have resulted in the lenders requiring MI to be placed. The risk on this pool transaction represents approximately two-thirds of our risk-in-force as of December 31, 2013. We expect this percentage to decrease as our primary flow business increases.
Customers
Our sales strategy is focused on attracting, as customers, mortgage originators in the United States that fall into two distinct categories, which we refer to as "National Accounts" and "Regional Accounts".
We define National Accounts as the
37
most significant residential mortgage originators as determined by volume of their own originations as well as volume of insured business they may acquire from other originators. These National Accounts generally originate loans through their retail channels as well as purchase loans originated by other entities, primarily mortgage originators who we would classify as Regional Accounts, as described below. National Account lenders may sell their loans to the GSEs or private label secondary markets or securitize the loans themselves. We plan to service these customers with a specialized team of National Account sales professionals who have experience supporting and developing business from this segment. To date, approximately
20
of the National Account customers have indicated that they intend to do business with us and we continue to work towards completing our customer boarding processes. While we believe we have favorable relationships with the National Accounts who have indicated they will purchase MI from NMIC, there is no obligation to use NMIC as an MI provider and, as of the date of this report, we have received a limited amount of business from four of these National Accounts. We continue to work with the other National Accounts to engage them as customers.
The Regional Accounts originate mortgage loans on a local or regional level throughout the country. Some of these Regional Accounts have origination platforms that span across multiple regions; however, their primary lending focus is local. They sell the majority of their originations to National Accounts, but Regional Accounts may also retain loans in their portfolios or sell portions of their production directly to the GSEs. Our nationwide and regional sales teams address the Regional Accounts segment of the market, and with the early efforts of these teams, we have been able to attract lenders in this segment who have agreed to purchase MI from NMIC. Our future efforts will be focused on growing this segment of our customer base. Our ability to make progress penetrating Regional Accounts is primarily dependent on the following three factors:
|
•
|
Obtaining approval from National Account lenders to be an authorized MI provider enables Regional Accounts to sell loans with insurance from NMIC to those National Accounts. Consequently, these approvals are critical to making inroads with Regional Accounts. As discussed above, approximately
20
of the
37
National Accounts have indicated that they intend to do business with us.
|
|
•
|
Achieving connectivity with the largest loan servicing systems. Many loan servicers, including large lenders and those in the industry who service loans originated by Regional Accounts, that do not maintain proprietary servicing systems rely primarily on the two most significant servicing systems, LPS MSP and Fiserv LoanServ
TM
, to service their loans.
|
11
In 2013, we completed integration with LPS MSP and Fiserv LoanServ
TM
. Attaining connectivity with these servicing systems is one of the important steps to enable both National and Regional Accounts to purchase MI from NMIC.
|
•
|
Achieving connectivity with leading third-party loan origination systems utilized by Regional Accounts, including Ellie Mae Encompass360®. The Regional Accounts who originate loans using these third-party loan origination systems will be able to automatically select NMIC as an MI provider within those systems. The progress we have made to date connecting with these loan origination systems is another significant achievement with respect to our readiness to engage with Regional Accounts.
|
The GSEs, as major purchasers of conventional mortgage loans in the United Sates, are the primary beneficiaries of our mortgage insurance coverage. Revenues from our customers are expected to be generated in the United States only.
Customers exceeding 10% of consolidated revenues
In
2013
, the premiums paid to NMIC by each of Fannie Mae (pool transaction) and Quicken Loans Inc. exceeded 10% of our consolidated revenues.
Sales and Marketing and Competition
Sales and Marketing
Our sales and marketing efforts are designed to help us establish and maintain in-depth, quality customer relationships. We organize our sales and marketing efforts based on our national and regional customer segmentation. We seek to support our national and regional sales force, and improve our effectiveness in acquiring new customers, by raising our brand awareness through advertising and marketing campaigns, website enhancements, electronic communication strategies and sponsorship of industry and educational events
.
NMIC's product development and marketing department has primary responsibility for creating and supporting our MI products. Our current sales resources are designed to optimize our opportunity in the market as well as balance our expenses effectively. In 2013, we built our sales force by hiring qualified mortgage professionals that generally have well-established relationships with industry leading lenders and significant experience in both MI and mortgage lending. Our sales force is located throughout the United States to directly sell our mortgage insurance products to lenders.
Competition
Our competition includes other private mortgage insurers, governmental agencies that sponsor government-backed mortgage insurance programs and alternatives to credit enhancement products, such as piggy-back loans or other risk sharing arrangements. The MI industry is highly competitive. We compete with other private mortgage insurers based on our financial strength, underwriting guidelines, product features, pricing, operational efficiencies, customer relationships, name recognition, reputation, the strength of management teams and field organizations, comprehensiveness of databases covering insured loans, the effective use of technology, innovation in the delivery and servicing of insurance products and our ability to execute. During 2011, two mortgage insurers stopped writing new business and, based on public disclosures, these insurers approximated more than 20% of the MI industry volume in the first half of 2011. We believe their new origination market share has since been redistributed among the other MI companies.
The U.S. MI industry currently consists of seven active private mortgage insurers, including NMIC, MGIC Investment Corporation (“MGIC”), Radian Guaranty Inc. (“Radian”), United Guaranty Corporation (“UGI”), a division of American International Group, Inc., Genworth Mortgage Insurance (“Genworth”), Essent Guaranty (“Essent”) and CMG Mortgage Insurance Company (“CMG”), the latter of which, up until the Arch Capital Group Ltd. ("Arch") acquisition, described below, had solely offered mortgage insurance to credit unions.
The perceived increase in credit quality of loans that are being insured today, the deterioration of the financial strength ratings of the legacy mortgage insurance companies and the possibility of a decrease in the FHA's share of the mortgage insurance market may encourage additional new entrants.
On January 30, 2014, Arch announced that it had completed the acquisition of CMG. Arch announced that CMG will be renamed Arch Mortgage Insurance Company and will enter the broader U.S. mortgage insurance marketplace, expanding CMG's sales operations beyond the credit union mortgage insurance market.
Old Republic International Corp. of Chicago (“Old Republic”), the parent company of Republic Mortgage Insurance Co. (“RMIC”), one of the two MI companies that ceased writing new business in 2011, announced in 2013 that it plans to raise new funds in the capital markets and contribute up to $50 million itself, and, subject to regulatory and GSE approval, recapitalize RMIC to support its existing policies, pay off deferred claim obligations and exit supervision under North Carolina insurance regulations. If this occurs, RMIC has stated that it then could resume writing new business in 2014. Old Republic further announced that at some
12
time following the recapitalization, it will likely consider a disposition of its equity stake in RMIC.
We and other private mortgage insurers also compete directly with federal and state governmental and quasi-governmental agencies that sponsor government-backed mortgage insurance programs, principally the FHA and, to a lesser degree, the VA. These agencies' market share during 2010, 2011, 2012 and 2013, was approximately 84%, 77%, 68% and 63%, respectively, of low down payment residential mortgages that were subject to governmental and private mortgage insurance. While declining from a high of approximately 85% in 2009, the market share of governmental agencies remains substantially above the low of approximately 23% in 2007, according to statistics reported by Inside Mortgage Finance. As noted above, the combined market share of the FHA and VA has decreased each year since 2010, a trend that we believe has been positive for the MI industry. In our view, this decrease may have been influenced by increases in the cost of FHA insurance in recent years, stricter FHA guidelines, the inability of the borrower to cancel FHA mortgage insurance and the FHA pulling back from the market given its failure to meet its congressionally mandated capital requirements.
In addition to competition from the FHA and the VA, we and other private mortgage insurers face competition from state-supported mortgage insurance funds in several states, including California and New York. From time to time, other state legislatures and agencies may consider expanding the authority of their state governments to insure residential mortgages.
Underwriting
To qualify to receive mortgage insurance from us, a lender would first enter into our master policy agreement. The master policy sets forth the general terms and conditions of our MI coverage. Our primary mortgage insurance policies are issued through our delegated and non-delegated programs. Through our underwriting solution, National MI TrueInsight
SM
, we intend to review every loan we insure through both our delegated and non-delegated channels. National MI TrueInsight
SM
solution confirms underwriting eligibility, either prior to loan closing in the non-delegated channel or through a post-closing underwriting review in the delegated channel, which we refer to as our "Delegated Assurance Review" or "DAR" process. DAR provides an underwriting review of each mortgage insurance decision made by our customers under their delegated authority. Our DAR process differentiates us from other MI companies, which typically underwrite a sampling of policies originated through their delegated underwriting channels. By underwriting each policy, we believe we can more effectively manage the risk characteristics in our portfolio and provide a high level of confidence to our lenders that valid claims will be paid. We also expect this process will allow us to provide our customers with timely, value-added feedback on the risk characteristics of their loan originations. We believe our customer feedback received to date has been positive.
Non-Delegated Program
Through our non-delegated channel, we underwrite the insurance application and provide a response to the lender, prior to the loan closing. To obtain mortgage insurance on a loan, a master policyholder submits an insurance application to us, along with the borrower's mortgage application, an appraisal report from an independent, licensed appraiser, borrower credit report, employment and income verification, tax returns from self-employed borrowers, verification of funds sufficient to cover the expected down payment for the loan closing and purchase contract and any other documentation to support loan qualification for mortgage insurance. We do not provide primary MI in instances where the lender has waived certain documentation requirements, such as written verification of employment and proof of source of funds for closing. Our underwriters review all materials submitted to us and render an insurance decision, typically within 24 to 48 hours, depending on the MI application volume.
In addition to our non-delegated underwriter employees located at our corporate headquarters and remotely across the country, we have entered into agreements with third-party underwriting service providers ("USP") under which they will underwrite the mortgage insurance decision on certain loans for NMIC, consistent with NMIC's underwriting guidelines and subject to the terms of the outsourcing agreements. We expect our USPs will share in the daily underwriting of mortgage insurance applications submitted to us, depending on the volume and with targeted assignments of particular loans to particular USPs, to ensure timely response-times to lenders. These USPs use AXIS, our insurance management system, and are trained to follow the same process outlined above that our own employees follow when they render an insurance decision. Any underwriting decisions requiring escalation or a second review will be referred back to NMIC's management for decision making.
We have processes in place to manage the risk associated with outsourcing a component of our underwriting functions. In collaboration with the USP's management team, an NMIC manager, on-site at the USP's premises, monitors the USP's day-to-day underwriting of mortgage insurance decisions. We also review the qualifications of the USP's underwriters and provide system and guideline training to ensure the USP's underwriting philosophy is consistent with ours. We perform regular quality control reviews of each USP's performance, and our agreements with the USPs require them to give us access to the results of their internal quality control reviews. Underwriters with unacceptable performance will be carefully monitored with specific action plans, and our agreements provide for their timely replacement with 30 days' notice.
13
Delegated Program
Through our delegated program, if deemed eligible by NMIC, certain loan originators may bind our mortgage insurance coverage following their own underwriting reviews. We permit delegated underwriting with lenders that have a track record of originating quality mortgage loans. The lenders are required to underwrite a mortgage insurance decision in accordance with NMIC's eligibility rules and approved underwriting guidelines. If the lender believes a loan is eligible for mortgage insurance coverage from NMIC, it may bind the insurance coverage in accordance with the delegated authority conferred under our delegated underwriting program, as set forth in the terms of our master policy and related endorsements. In order to bind coverage, the lender must provide a dataset to us to help demonstrate the loan meets our threshold eligibility rules. In addition, as part of our National MI TrueInsight
SM
solution, or DAR process, delegated lenders are required to submit a full loan file (which contains all information and documentation required by the traditional underwriting process) to us within 60 days of the coverage effective date, and we will perform a post-close underwriting review of the lender's underwriting decision for each insured loan. We created the DAR process to provide us with confidence that loans we insure comply with our eligibility criteria and meet our underwriting guidelines. This process also assists us with early identification of particular lender's underwriting defects that need attention and remediation going forward in order for those lenders to continue participating in our delegated program. We believe that our delegated program's full underwriting file review and quality control process differentiates our process from the delegated underwriting process historically practiced by the MI industry and provides what we believe is valuable clarity to our lenders within the first several months of coverage. If a loan is rated out of scope (uninsurable) during the DAR process, we cancel the insurance certificate and return any premiums we have received.
We utilize USPs with which we have outsourcing agreements to perform the majority of our post-close reviews of delegated decisions. If one of our USPs determines that a loan is ineligible for coverage, an NMIC underwriting manager will review the results to determine if we agree with our vendor before giving notice of cancellation of coverage to our insured. In addition to this review by an NMIC underwriting manager, NMIC's risk management departments will perform routine quality control reviews of a statistically relevant sample of each USP's post-close reviews to help ensure that we are receiving the quality of underwriting that we expect from these providers.
Underwriting and Risk Management Guidelines
Our underwriting and risk management guidelines are based on what we believe to be the major factors that impact mortgage credit risk. Such factors include but are not limited to the following:
|
•
|
the borrower's credit strength, including the borrower's credit history, debt-to-income ratios and cash reserves and the willingness of a borrower with sufficient resources to make mortgage payments when the mortgage balance exceeds the value of the home;
|
|
•
|
the loan product, which encompasses the LTV ratio, the type of loan instrument, including whether the instrument provides for fixed or variable payments and the amortization schedule, the type of property, the purpose of the loan and the interest rate;
|
|
•
|
origination practices of lenders;
|
|
•
|
the percentage coverage and size of insured loans; and
|
|
•
|
the condition of the economy, including housing values and employment, in the geographic area in which the property is located.
|
We believe that, excluding other factors, claim incidence increases:
|
•
|
for loans with higher LTV ratios compared to loans with lower LTV ratios;
|
|
•
|
for loans to borrowers with higher debt-to-income ratios and lower FICO credit scores compared to borrowers with lower debt-to-income ratios and higher FICO credit scores;
|
|
•
|
during periods of economic contraction and housing price depreciation, including when these conditions may not be nationwide, compared to periods of economic expansion and housing price appreciation;
|
|
•
|
for ARMs when the reset interest rate significantly exceeds the interest rate at loan origination;
|
|
•
|
for loans in which the original loan amount exceeds the GSEs' established conforming loan limit compared to loans below that limit; and
|
|
•
|
for cash out refinance loans compared to purchase or rate and term refinance loans.
|
14
There may be other types of loan characteristics relating to the individual loan or borrower that also affect the risk potential for a loan. In addition, the presence of multiple higher-risk characteristics in a loan materially increases the likelihood of a claim on such a loan unless there are other characteristics to lower the risk.
Exception Policies
Our underwriting guidelines contain exception approval procedures that permit our underwriters to escalate to a higher level of management approval of MI applications for a loan that diverges from our established credit policy guidelines. Any such exceptions must be made in accordance with our exception approval procedures. Approvals to exceptions to credit policy guidelines will usually result from one or more compensating factors, such as an excellent credit profile, significant income, employment stability, or strong reserves. In order to help ensure exceptions are limited to the criteria we set, we generate exception reports that track the number of exceptions by underwriter and rationale for each exception, which are reviewed by management in our risk management group.
Risk Management
In accordance with established policies and procedures, we identify, assess, monitor and manage the following enterprise risks in our MI business: credit risk, market risk and operations risk. Management of these risks is an interdepartmental endeavor including specific operational responsibilities and ongoing senior management oversight. In addition, our internal audit group which reports to the Audit Committee of our Board of Directors ("Board") provides independent ongoing assessments of our management of these enterprise risks.
Credit Risk
We protect financial institutions against credit losses resulting from homeowner defaults on low down payment residential mortgage loans. Low down payment lending carries high credit risk because borrowers who encounter financial difficulties may have little equity (net of transaction costs), if any, in their homes, and are therefore less likely to keep their mortgage payments current or have the ability to sell the property to avoid foreclosure. Our insured loan portfolio's credit risk profile is measured by credit score, LTV, debt-to-income ratio, property type (e.g. single family home, condo or co-op), loan purpose (e.g. purchase or refinance), occupancy (e.g., owner-occupied) and other factors. Management measures credit risk through reporting by segmentation of these key credit risk drivers. Segmentation will include balances, risk in force, revenue, delinquencies, losses (claims paid), persistency, reserves, and average claim size and severity. We will assess underwriting quality separately through quality assurance and quality control audits. We plan to assess the portfolio's risk/reward characteristics, considering both quantitative and qualitative factors.
We employ the following methods to manage and mitigate credit risk in our insured loan portfolio:
•
Credit Policy, Underwriting Guidelines and Pricing;
•
Lender Approval, Monitoring and Management;
•
Underwriting and Servicing Quality Control Process;
•
Management and Board Risk Committees
Credit Policy, Underwriting Guidelines and Pricing
We manage our insurance portfolio's credit risk by the use of several loan eligibility matrices which describe the maximum LTV, minimum borrower credit score, maximum loan size, property type and occupancy status of loans that we will insure. Our loan eligibility matrices as well as all of our detailed underwriting guidelines are contained in our Underwriting Guideline Manual that is publicly available on NMIC's website. Our eligibility criteria and underwriting guidelines are designed to mitigate the layered risk inherent in a single insurance policy. "Layered risk" refers to the accumulation of borrower, loan risk and property risk. For example, we have higher credit score and lower maximum allowed LTV requirements for riskier property types, such as investor properties, compared to owner-occupied properties.
Another tool we use to manage our credit risk is to underwrite every loan we insure, not only loans that come through our non-delegated channel. We also underwrite every loan coming through our delegated channel (the aforementioned “DAR” process). We believe that the prevailing standard of our competitors for many years has been to conduct partial quality assurance testing of loans that come through their delegated channels. We believe the industry's historical practice exacerbated the negative impact of the recent mortgage crisis on legacy mortgage insurers because their partial quality control reviews did not adequately prevent the issuance of mortgage insurance through their delegated channels on ineligible, poor quality loans. Our pricing policies also help mitigate credit risk in the form of higher premium rates for loan features or borrower characteristics associated with historically higher default rates.
15
Lender Approval, Monitoring and Management
We maintain prudent lender approval guidelines, including a requirement that a lender has experienced management, sound operations and underwriting controls, as well as appropriate escalation and exception policies and procedures. Additionally, if a lender originates wholesale loans, we review how that lender manages and controls its authorized brokers. We monitor our lender customers by analyzing trends of many factors, including, among others, early payment defaults or "EPDs", delinquency trends and geographic concentrations, primarily focusing on a lender's underwriting performance. If we detect a trend that needs to be addressed, we identify the root cause of the issue and work to develop an agreed upon action plan with the lender, particularly for a lender which has delegated underwriting authority. We will continually assess our lenders' trends, analyze their loan concentrations (e.g. LTVs, credit score, geography and loan purpose) and review their loan manufacturing processes in order to manage the underwriting quality of our lender customers.
Underwriting and Servicing Quality Control Process
We have an underwriting quality control group that operates separately from the new business underwriting group to perform quality control reviews. The underwriting quality control group assesses non-delegated underwriting completed by both our employee and third-party vendor underwriters, and post-close underwriting reviews of delegated business completed by our third-party vendors. We perform quality control audits of insured loans identified through random, high risk and targeted selection criteria. In addition, we intend to review loans that default within 12 months of their origination, which we refer to as EPDs. Our quality control review is primarily intended to assess the quality of the underwriting decision, including the accuracy and adequacy of the information and documentation used to reach that decision.
We have also established a servicing quality control function to audit our internal insurance servicing and loss mitigation processes. Selection criteria and reporting will be similar to that described above for underwriting quality control.
We will provide relevant reporting to operations management and to senior management. The findings from our quality control processes will inform and shape certain risk processes such as underwriter authority delegation, lender monitoring and guideline management.
Management and Board Risk Committees
We have a management risk committee, comprised of our Chief Executive Officer, Chief Risk Officer, Chief of Insurance Operations, Acting General Counsel and other officers as appropriate, to monitor our underwriting, pricing and risk management practices. This committee will also monitor insured portfolio concentrations and portfolio performance. We expect that this committee will continue to include a diverse mix of senior management to ensure that those responsible for execution are balanced with those responsible for oversight. New products, material changes to existing products or material changes to underwriting guidelines or pricing will have to be approved by the management risk committee prior to release.
We also have a Board Risk Committee consisting of three independent board members who perform the same type of monitoring and oversight of risk management practices and portfolio performance that the Management Risk Committee performs.
Market Risks
The risk profile of our business is also affected by the mortgage market and macroeconomic conditions. Key drivers include regulatory and/or tax changes affecting the economics of residential mortgage lending; regulatory changes impacting the relative attractiveness of MI to our customers; and consumer attitudes about the relative attractiveness of real estate as an investment; structural changes to the industry made to reduce the role of the federal government and to develop a long-term plan for the GSEs.
We believe that the three primary market risks that we face are:
|
•
|
Declines in home prices. A decline in home prices typically makes it more difficult for a borrower to sell or refinance his home, generally increasing the likelihood of a default followed by a claim if the borrower experiences a job loss or other life event which reduces his income or increases his expenses. In addition, a decline in home prices typically increases the severity of any claim we may pay.
|
|
•
|
Reductions in income or increases in borrower's expenses. Borrowers able to make only small down payments often have more difficulty weathering financial hardships caused by unemployment or income reductions, or life events involving illness or divorce, because they may not have large amounts of personal savings or available credit. Rising unemployment will increase the number of borrowers unable to remain current on their home mortgage and increase the number of new claims.
|
16
|
•
|
Higher interest rates. An increase in interest rates typically leads to higher monthly payments for borrowers with existing adjustable rate mortgages as well as for borrowers hoping to purchase a home, the latter of which may have the effect of reducing the pool of potential borrowers available to purchase homes. This can have the effect of increasing the likelihood of a claim on an insured loan in default for a borrower who experiences a job loss or other life event that reduces her income or increases her expenses.
|
We mitigate market risk in our insurance portfolio mainly by employing portfolio concentration limits. We plan to limit our exposure to product types that have experienced the most volatile performance in previous economic and housing market downturns. For example, we have portfolio limits for 97% LTV loans, investor loans, cash-out refinances as well as several other borrower or loan attributes and certain state concentration levels that we wish to control. If we see regional economic deterioration, in the form of rising unemployment, declining home prices or rising mortgage delinquency levels we would mitigate our risks in the affected areas by instituting distressed market policies. We have no such distressed market policies currently, but should they be necessary in the future they could take the form of either 1) lower LTV and higher credit score requirements in the market areas experiencing economic or housing market distress, or 2) the elimination of certain product offerings entirely in distressed areas.
Operational Risk
Operational risks are inherent in our daily business activities. Key operational risks include: damage to physical assets, reliance on outside vendors, reliance on a complex information technology system, and employee fraud or negligence. We manage operational risks through standard risk management practices such as hazard insurance policies, rigorous oversight of vendors, state of the art IT system redundancy and security practices, internal controls and segregation of duties. The key controls to mitigate operational risks are reviewed by management, the Board and our Internal Audit Department.
Servicing
Our Policy Servicing Department is responsible for various servicing activities related to master policy administration, premium billing and payment processing and certificate administration. The department has servicing specialists that are assigned to the majority of our accounts to assist with day-to-day transactions and to assist in monitoring the servicer's portfolio to help keep it current and accurate. The department has established policies and procedures that accommodate various methods for servicers to communicate loan and certificate information to us. We are currently integrated with the two largest servicing systems, LPS and FiServ. These servicing systems are used by the majority of our larger servicing accounts to exchange billing, payment, and certificate level information on a daily or monthly basis. We also have our own external facing servicing website which may be utilized by servicers to process the same servicing transactions that may be processed through LPS and FiServ.
Defaults and Claims; Loss Mitigation
Defaults and Claims
The claim cycle on MI begins with our receipt of a Notice of Default ("NOD") for an insured loan from the loan servicer. Default is defined in NMIC's mortgage insurance policies as the failure by a borrower to pay when due a non-accelerated amount equal to the scheduled mortgage payment due under the terms of a loan or the failure by a borrower to pay all amounts due under a loan after the exercise of the due on sale clause of such loan. Generally, the master policies require an insured to notify NMIC of a default no later than 10 days after the borrower becomes three payments in default, although most lenders notify us sooner. We do not consider a loan to be in default for the purposes of reporting defaults and default rates and setting reserves until we receive notice from the servicer that a borrower has failed to pay two regularly scheduled payments and is at least 60 days in default. The incidence of default is affected by a variety of factors, including borrower income, unemployment, divorce and illness. Defaults that are not cured result in a claim to us. Defaults may be cured by the borrower remitting all delinquent loan payments, paying off the loan in its entirety, loan modifications or by a sale of the property and satisfaction of all amounts due under the mortgage.
Claims result from uncured defaults, approved pre-foreclosure sales, and deeds-in-lieu of foreclosure. Whether a claim results from an uncured default depends, in large part, on the borrower's equity in the home at the time of default, the borrower's or the lender's ability to sell the home for an amount sufficient to satisfy all amounts due under the mortgage and the willingness and ability of the borrower and lender to enter into a loan modification that provides for a cure of the default. Various factors affect the frequency and amount of claims, including local housing prices, employment levels and interest rates. If a default is not cured and we receive a claim, any unearned premium collected from the time of default to the time of the claim payment is refunded to the insured along with the claim payment.
Under the terms of our master policy, the insured lender is required to file a claim for primary insurance with us within 60 days after it has acquired title to the property securing the insured loan (typically through foreclosure) or when there has been an approved sale to a third party prior to foreclosure. Across the industry, it has historically taken, on average, approximately 12 months
17
for a default that is not cured to develop into a paid claim. The rate at which claims are received and paid has slowed in recent years due to various state and lender foreclosure moratoriums and suspensions, servicing delays including as a result of attempts to modify loans, pursuit of mitigation opportunities and a lack of capacity in the court systems.
Within 60 days after a claim has been filed and all documents required to be submitted to us have been delivered, we have the option of either (i) paying the coverage percentage specified for that loan, with the insured retaining title to the underlying property and receiving all proceeds from the eventual sale of the property, or (ii) paying 100% of the insured's loss on the loan in exchange for the lender's conveyance of good and marketable title to the property to us. In the event we exercise the latter option, we will market and sell the property and retain all proceeds.
Claim activity is not evenly spread throughout the coverage period of a book of primary business. Typically, relatively few claims are received during the first two years following issuance of coverage on a loan. This is typically followed by a period of rising claim activity which, based on industry experience, has historically reached its highest level three to six years after loan origination. Thereafter, the number of claims for a book year has historically declined at a gradual rate, although the rate of decline can be affected by conditions in the economy, including slowing home price appreciation or housing price depreciation and rising unemployment. Persistency of our book, the condition of the economy, including unemployment, and other factors can affect the pattern of claim activity.
Another important factor affecting losses is the amount of the average claim paid, which affects the claim amount as a proportion of total RIF, commonly referred to as claim severity. The main determinants of claim severity are the amount of the mortgage loan, the coverage percentage on the loan and local market conditions.
Loss Mitigation
Before paying a claim, we plan to review the loan and servicing files to determine the appropriateness of the claim amount. Our master policy provides that we can reduce or deny a claim if the servicer did not comply with its obligations required by our policy, including the requirement to mitigate our loss by performing reasonable loss mitigation efforts or, for example, diligently pursuing a foreclosure or bankruptcy relief in a timely manner. We call such reduction of claims submitted to us “curtailments.” In addition, the claims submitted to us sometimes include costs and expenses not covered by our insurance policies, such as mortgage insurance premiums, hazard insurance premiums for periods after the claim date and losses resulting from property damage that has not been repaired. These other adjustments are expected to reduce claim amounts by less than the amount of curtailments.
Under our master policies, insureds, typically through their servicers, must obtain prior approval from NMIC before agreeing to execute a deed-in-lieu of foreclosure, third-party pre-foreclosure sale or loan modification. Our right to pre-approve these transactions gives NMIC the ability to mitigate actual or potential loss on an insured loan by ensuring that properties are being marketed and sold at reasonable values and that, in the appropriate case, borrowers are offered modified loan terms that are structured to help them sustain their loan payments. Proceeds from approved third-party sales occurring before we settle a claim may be factored into the claim settlement and can often mitigate the claim amount we may pay. In connection with our approval rights of a pre-foreclosure sale or deed-in-lieu of foreclosure transaction, our master policies also give NMIC the right to obtain a contribution from a borrower who has the appropriate financial capacity, either in the form of cash or a promissory note, to cover a portion of the loss.
NMIC has agreed with Fannie Mae that Fannie Mae and its approved servicers have the right to approve, consistent with the terms of the delegation agreement, pre-foreclosure sales, deeds-in-lieu of foreclosure and loan modifications for all Fannie Mae owned loans that we insure. Fannie Mae and its approved servicers will report all relevant information regarding these approvals to NMIC and proceeds from borrower contributions will be shared between Fannie Mae and us on a pro rata basis, as defined in our master policies.
Claim Reserves and Premium Deficiency Reserve
A significant period of time typically elapses between the time a borrower defaults on a mortgage payment, which is the event triggering our establishment of a claim reserve, and the eventual payment of the claim related to the uncured default. To recognize the liability for unpaid claims related to outstanding reported defaults, or default inventory, we establish claim reserves in accordance with industry practice, representing the estimated percentage of defaults which may ultimately result in a claim, which is known as the claim rate, and the estimated severity of the claims which may arise from the defaults included in the default inventory.
We will also establish reserves to provide for the estimated costs of settling claims, general expenses of administering the claims settlement process, legal fees and other fees (“claim adjustment expenses”), and for claims and claim adjustment expenses from defaults that we estimate have occurred, but which have not yet been reported to us. We refer to the latter as "IBNR" reserves. Consistent with industry accounting practices, NMIC does not establish claim reserves for estimated potential defaults that have not occurred but that may occur in the future. For further discussion of our claim reserving policy and process, see Part II, Item 7,
18
“
Management's Discussion and Analysis of Financial Condition and Results of Operations - Critical Accounting Estimates - Reserve for Claims and Claim Adjustment Expenses
.”
The processes described above to calculate loss reserves and IBNR reserves are applied only to loans that have been in default at least 60 days. At the end of each fiscal quarter, we also perform an analysis on our entire portfolio of insured loans, including performing loans, to determine if we are required to establish a premium deficiency reserve. We would establish a premium deficiency reserve, if necessary, when the net present value of expected future claims and expenses exceeds the net present value of expected future premiums and existing reserves. The evaluation of premium deficiency requires significant judgment by management and depends upon many assumptions, including assumptions regarding future macroeconomic conditions.
Reinsurance
Certain states limit the amount of risk a mortgage insurer may retain on a single loan to 25% of the borrower's indebtedness and as a result the portion of such insurance in excess of 25% must be reinsured. NMIC uses reinsurance provided by Re One solely for purposes of compliance with statutory coverage limits. Although we have no current plans to use reinsurance from unaffiliated third-party reinsurers, we may choose to purchase reinsurance coverage in the future to help manage certain risk exposures and as part of our capital management strategy. Under the terms of the GSE Approvals, if we choose to use third-party reinsurance during the first three years from the date of the GSE Approvals, we are required to obtain the GSEs' prior written consent, and subsequent to the three year period from GSE Approval, may enter into reinsurance arrangements as long as they meet the then applicable GSE Eligibility Requirements.
Information Technology Platform
We are currently underwriting and servicing loans within our proprietary insurance management platform. Additionally, we have invested in our infrastructure and technology through the acquisition, development and implementation of what we believe is an efficient, scalable platform that supports our current business activities and enables significant future growth.
We utilize and develop technology to support future growth while realizing current operating efficiencies throughout our enterprise. We adopted a technology strategy that utilizes major hardware, software and service providers with substantial industry experience and expertise. As part of that strategy, we outsource many of our major information technology functions, including;
|
•
|
the development and maintenance of our enterprise technology platform;
|
|
•
|
data center hosting, management, monitoring and support (SSAE 16 Type 1 compliant);
|
|
•
|
email and workforce collaboration; and
|
|
•
|
human resource systems.
|
This strategic approach enables our management and personnel resources to focus on customer-facing and forward looking enhancements rather than on system operations.
Our IT systems architecture strategy incorporates Cloud (systems connected via the Internet) and Software as a Service (“SaaS”) technology in a number of areas to provide scalability and flexibility. We believe this strategy facilitates access for our lender customers and enables our employees to work remotely in a secure manner.
We employ and support the Mortgage Industry Standards Maintenance Organization (“MISMO”) standard. This is the standard data format used by the MI industry for data consistency throughout the systems process. Our ongoing systems integrations with lenders and other business constituencies, such as servicers, are streamlined as a result of our application of the MISMO standard. As part of our underwriting process, we capture data from each mortgage insurance application, providing us with information for evaluating risk, back-testing expected performance and analyzing default patterns.
One of the most important components of our information technology platform is our insurance management system, which we refer to as AXIS. We will continue to invest resources, as necessary, to develop, enhance and maintain AXIS to support our MI operations. See Part II, Item 7, "
Management's Discussion and Analysis of Financial Condition and Results of Operations - Overview - Start-up Operations - Development of Our Insurance Management System ("AXIS") and Integration with Loan Origination Systems
" for a discussion of the development of AXIS.
19
Investment Portfolio
Our investment portfolio and cash and cash equivalents are split between us and our insurance subsidiaries. We contributed $220 million of cash to our insurance subsidiaries, primarily to NMIC, in June 2012. We plan to retain the balance of our cash and investments at the holding company until needed to further capitalize our insurance subsidiaries. We expect to diversify our portfolio across corporate, government and taxable municipal securities of various durations
to attempt to minimize the risk of loss resulting from over concentration of assets in specific sectors or securities. Diversification strategies are periodically reviewed. While our portfolio is managed day-to-day by a third-party investment management company, we maintain overall control over investment decisions based on our investment policies. Our third-party investment management company is Wells Capital Management, Inc.
Our investment policies and guidelines conform to the Wisconsin Administrative Code 6.20(5), which imposes investment restrictions on NMIC for the first five years from issuance of its certificate of authority, which occurred in 2009. Additionally, all securities in the portfolio must be U.S. dollar-denominated and have the National Association of Insurance Commissioners ("NAIC") '1' or '2' designation or investment grade rating by Moody's, Standard & Poor's or Fitch at time of purchase. Our investment policies and strategies are subject to change depending upon regulatory, economic and market conditions and our existing or anticipated financial condition and operating requirements, including our tax position.
Consistent with Wisconsin law, our investment policies emphasize preservation of capital, as well as total return. Based on our guidelines, our current investment portfolio is comprised entirely of cash and cash equivalents and fixed-income securities, all of which are investment grade and rated “A-” or higher. Our policy guidelines contain limits on the amount of credit exposure to any one issue, issuer and type of instrument. We expect to preserve the liquidity of our portfolio through diversification and investment in publicly traded securities. We plan to maintain a level of liquidity commensurate with our perceived business outlook and the expected timing, direction and degree of changes in interest rates.
20
REGULATION
U.S. Mortgage Insurance Laws
GSE Qualified Mortgage Insurer Requirements
Pursuant to their charters, Fannie Mae and Freddie Mac purchase residential mortgage loans insured by entities that they determine to be qualified MI companies. Both Fannie Mae and Freddie Mac have published comprehensive requirements to become and remain a qualified mortgage insurer (the “Eligibility Requirements”). In light of the severe housing and economic downturn that began in mid-2007 and the resulting adverse impact to the MI industry, both Fannie Mae and Freddie Mac believed it was necessary to revise the Eligibility Requirements. Fannie Mae issued new draft requirements dated August 5, 2010 and Freddie Mac issued new draft requirements dated June 30, 2010. Freddie Mac subsequently issued revised draft eligibility requirements dated February 2011. These draft requirements have not yet been finalized, however the FHFA, as regulator and conservator of the GSEs, has announced an intent to achieve uniformity of these requirements among the GSEs and to finalize these requirements in the near term future.
In addition to the Eligibility Requirements, Fannie Mae and Freddie Mac have imposed capitalization, operational and reporting conditions in connection with their January 2013 approvals of NMIC as a qualified mortgage insurer. Some of these conditions remain in effect for a three (3) year period from the date of GSE Approval while others do not expressly expire. These conditions require, among other things, that NMIC:
|
•
|
be initially capitalized in the amount of $200 million and that its affiliate reinsurance companies, Re One and Re Two (merged in 2013), be initially capitalized in the amount of $10 million each;
|
|
•
|
maintain minimum capital of $150 million;
|
|
•
|
operate at a risk-to-capital ratio not to exceed 15:1 for its first three (3) years and then pursuant to the Eligibility Requirements;
|
|
•
|
insure only (i) GSE-eligible loans or (ii) loans that are GSE-eligible, other than as related to loan amount subject to additional portfolio limitation requirements;
|
|
•
|
obtain prior written approval to enter into any transaction involving the issuance of insurance on other than an individual loan “flow” basis;
|
|
•
|
have and maintain a fully operational business and technology platform;
|
|
•
|
not declare or pay dividends to affiliates or to NMIH for its first three (3) years, then in conformance with the Eligibility Requirements;
|
|
•
|
not enter into capital support agreements or guarantees for the benefit of, or purchase or otherwise invest in the debt of, affiliates without the prior written approval of the GSEs for its first three (3) years, then in conformance with the Eligibility Requirements;
|
|
•
|
not invest in or make loans to affiliates for its first three (3) years, then in conformance with the Eligibility Requirements;
|
|
•
|
not enter into reinsurance or other risk share arrangements without the GSEs' prior written approval for its first three (3) years, then in conformance with the Eligibility Requirements; and
|
|
•
|
at the direction of one or both of the GSEs, re-domicile from Wisconsin to another state.
|
The conditional approvals also include certain additional conditions, limitations and reporting requirements that we anticipate will be included in the final Eligibility Requirements, such as limits on costs allocated to NMIC under affiliate expense sharing arrangements, risk concentration, rates of return, requirements to obtain a financial strength rating, provision of ancillary services (i.e., non-insurance) to customers, transfers of underwriting to affiliates, notification requirements regarding change of ownership and new five percent (5%) shareholders, provisions regarding underwriting policies and claims processing as well as certain other obligations.
State Insurance Regulation
Our insurance subsidiaries are subject to comprehensive, detailed regulation both by our domiciliary and primary regulator, the Wisconsin Office of the Commissioner of Insurance ("Wisconsin OCI") and by state insurance departments in each state in which they are licensed. As mandated by state insurance laws, mortgage insurers are generally single-line companies restricted to writing only MI business. These regulations are principally designed for the protection of our insured policyholders rather than for the
21
benefit of investors. Although their scope varies, state insurance laws generally grant broad supervisory powers to insurance regulatory officials to examine insurance companies and interpret and/or enforce rules or exercise discretion affecting almost every significant aspect of the insurance business.
In general, state insurance regulation of our subsidiaries' businesses relates to:
|
•
|
licenses to transact business;
|
|
•
|
policy forms;
|
|
•
|
premium rates;
|
|
•
|
insurable loans;
|
|
•
|
annual and other reports on our financial condition;
|
|
•
|
the basis upon which assets and liabilities must be stated;
|
|
•
|
requirements regarding loss, unearned premium and contingency reserves;
|
|
•
|
minimum capital levels and adequacy ratios;
|
|
•
|
affiliate transactions;
|
|
•
|
reinsurance requirements;
|
|
•
|
limitations on the types of investment instruments which may be held in an investment portfolio;
|
|
•
|
the size of risks and limits on coverage of individual risks which may be insured;
|
|
•
|
special deposits of securities;
|
|
•
|
limits on dividends payable;
|
|
•
|
claims handling; and
|
|
•
|
conformance with the operating plan filed with each licensing state, unless modified by an approved amendment.
|
State insurance receivership law, not federal bankruptcy law, would govern any insolvency or financially hazardous condition of our insurance subsidiaries. The Wisconsin OCI has substantial authority to issue orders or seek and control a state insurance receivership proceeding to address the insolvency or a financially hazardous condition of an insurance company that it regulates. Under Wisconsin law, the Wisconsin OCI has substantial flexibility to restructure an insurance company in a receivership proceeding. Under Wisconsin law, the OCI is obligated to optimize the value of an insolvent insurer's estate for the benefit of its policyholders, whose claims are prioritized relative to the claims of shareholders.
As an insurance holding company, we are registered with the Wisconsin OCI, the domiciliary state of NMIC and Re One, and must provide certain information to the Wisconsin OCI on an ongoing basis including insurance holding company annual audited consolidated financial statements. We, as an insurance holding company, and each of our affiliates, are prohibited from engaging in certain transactions with our insurance subsidiaries without submission to, and in some instances, prior approval by applicable insurance departments. Like most states, Wisconsin regulates transactions between domestic insurance companies and their parents or affiliates. Under Wisconsin law, all transactions involving us, or an affiliate, and an insurance subsidiary, must conform to certain standards including that the transaction is “reasonable and fair” to the insurance subsidiary. Wisconsin law also provides that reports of certain transactions must be filed with the Wisconsin OCI at least 30 days before the transaction is entered into and that these transactions may be disapproved by Wisconsin OCI within that period.
Wisconsin's insurance regulations generally provide that no person may merge with or acquire control (which is defined as possession, directly or indirectly, of the power to direct or cause the direction of the management and policies of a person, whether through the ownership of voting securities, by contract, by common management or otherwise) of us or our insurance subsidiaries unless the merger or transaction in which control is acquired has been approved by the Wisconsin OCI. Wisconsin law provides for a rebuttable presumption of control when a person owns or has the right to vote, directly or indirectly, more than 10% of the voting securities of a company. Pursuant to applicable Wisconsin regulations, voting securities include securities convertible into or evidencing the right to acquire securities with the right to vote. For purposes of determining whether control exists, the Wisconsin OCI may aggregate the direct or indirect ownership of us by entities under common control with one another. Accordingly, any investor that may be deemed to own 10% or more of our common stock or other securities that are considered to be voting securities, whether separately or through the aggregation of its ownership with that of its affiliates or other third parties whose holdings are required to be aggregated, should consult with its legal advisors to ensure that it complies with applicable requirements of Wisconsin
22
law. In addition, the insurance regulations of certain states require prior notification to the state's insurance department before a person acquires control of an insurance company licensed in such state. An insurance company's licenses to conduct business in those states could be affected by any such change in control. As of the date of this report, we are aware of one stockholder that owns more than 10% of our shares of common stock. This stockholder has filed a disclaimer of control with the Wisconsin OCI in connection therewith, which the Wisconsin OCI has not disapproved.
Our insurance subsidiaries are subject to Wisconsin statutory requirements as to maintenance of policyholders' surplus and payment of dividends. The maximum amount of dividends that the insurance subsidiaries may pay in any 12-month period without approval by the Wisconsin OCI is the lesser of adjusted statutory net income or 10% of statutory policyholders' surplus as of the preceding calendar year end. Adjusted statutory net income is defined for this purpose to be the greater of the following:
|
a.
|
The net income of the insurer for the calendar year preceding the date of the dividend or distribution, minus realized capital gains for that calendar year; or
|
|
b.
|
The aggregate of the net income of the insurer for the 3 calendar years preceding the date of the dividend or distribution, minus realized capital gains for those calendar years and minus dividends paid or credited and distributions made within the first 2 of the preceding 3 calendar years.
|
Also under Wisconsin law our insurance subsidiaries may not pay any dividend or distribution before providing at least 30 days' notice to the Wisconsin OCI, unless, with respect to non-extraordinary dividends, the exception of Section 617.22(3) is applicable. Wisconsin law prohibits our insurance subsidiaries from paying any dividend or distribution unless it is fair and reasonable to the insurance subsidiary. In addition to Wisconsin, other states may limit or restrict our insurance subsidiaries' ability to pay stockholder dividends. For example, California and New York prohibit mortgage insurers licensed in such states from declaring dividends except from undivided profits remaining above the aggregate of their paid-in capital, paid-in surplus and contingency reserves. In addition, it is possible that Wisconsin will adopt revised statutory provisions or interpretations of existing statutory provisions that will be more or less restrictive than those described above or will otherwise take actions that may further restrict the ability of our insurance subsidiaries to pay dividends or make distributions or returns of capital.
Wisconsin law imposes certain additional restrictions on our insurance subsidiaries for the first 5 years after the dates of issuance of their certificates of authority, including:
|
•
|
The insurance subsidiaries must give the Wisconsin OCI up to 90 days', rather than 30 days', notice of a proposed dividend.
|
|
•
|
The insurance subsidiaries must give the Wisconsin OCI up to 60 days' notice of any proposed substantive change in their business plans. The Wisconsin OCI may disapprove the proposed changes, and the insurance subsidiaries must conform at all times to their filed business plans.
|
|
•
|
The insurance subsidiaries' directors and officers may be disapproved by the Wisconsin OCI.
|
|
•
|
The insurance subsidiaries' investments are restricted unless otherwise approved by the Wisconsin OCI.
|
We believe that we are in compliance with these requirements.
MI companies licensed in Wisconsin are required to establish contingency loss reserves for purposes of statutory accounting, with annual contributions equal to the greater of (i) 50% of net earned premiums or (ii) minimum policyholders’ position divided by seven. These amounts cannot be withdrawn for a period of 10 years, except as permitted by insurance regulations. With prior approval from the Wisconsin OCI, an MI company may make early withdrawals from the contingency reserve when incurred losses exceed 35% of net premiums earned in a calendar year.
Under applicable Wisconsin law, as well as that of 15 other states, a mortgage insurer must maintain a minimum amount of statutory capital relative to the risk in force in order for the mortgage insurer to continue to write new business. We refer to these requirements as the "risk-to-capital requirement". While formulations of minimum capital may vary in certain jurisdictions, the most common measure applied allows for a maximum permitted risk-to-capital ratio of 25 to 1. Wisconsin has formula-based limits that typically result in limits slightly higher than the 25 to 1 ratio. In its agreement with the Florida Office of Insurance Regulation, NMIH agreed, consistent with the conditions of the GSE Approval, to downstream additional capital from time to time, as needed, to maintain NMIC's risk-to-capital ratio at or below 15 to 1. Our operation plan filed with the Wisconsin OCI and other state insurance departments in connection with NMIC's applications for licensure includes the expectation that NMIH will downstream additional capital if needed so that NMIC does not exceed an 18 to 1 risk-to-capital ratio. We may in the future seek state insurance department approvals, as needed, of an amendment to NMIC's business plan to increase the permitted ratio to the Wisconsin regulatory maximum of 25 to 1. If one or more states do not approve the change in our plan of operation, we may be at a competitive disadvantage compared to other MI companies that are not limited to these lower maximum risk-to-capital ratio requirements.
23
We compute our risk-to-capital ratio on a separate company statutory basis, as well as for our combined insurance operations. The risk-to-capital ratio is our net risk in force divided by our statutory capital. Our net risk in force includes both primary and pool risk in force, and excludes risk on policies that are currently in default and for which loss reserves have been established. The net risk in force includes direct and assumed risk, less risk ceded and less risk already reserved. Wisconsin requires a mortgage insurer to maintain a "minimum policyholders' position" as calculated in accordance with the applicable regulations. Policyholders' position, which is also known as statutory capital, is the sum of statutory policyholders' surplus (which increases as a result of statutory net income and contributions and decreases as a result of statutory net loss and dividends paid), and the statutory contingency reserve. Under statutory accounting rules, the contingency reserve is reported as a liability on the statutory balance sheet; however, for purposes of statutory capital and risk-to-capital ratio calculations, it is included as a capital component.
Most states, including Wisconsin, have anti-inducement and anti-rebate laws applicable to mortgage insurers, which prohibit mortgage insurers from inducing lenders to enter into insurance contracts by offering benefits not specified in the policy, including rebates of insurance premiums. For example, Wisconsin prohibits a mortgage insurer from allowing any commission, fee, remuneration, or other compensation to be paid to, or received by, any insured lender, including any subsidiary or affiliate, officer, director, or employee of any insured, any member of their immediate family, any corporation, partnership, trust, trade association in which any insured is a member, or other entity in which any insured or any such officer, director, or employee or any member of their immediate family has a financial interest.
MI premium rates are also subject to state regulation to protect policyholders against the adverse effects of excessive, inadequate or unfairly discriminatory rates and to encourage competition in the insurance marketplace. Any increase in premium rates must be justified, generally on the basis of the insurer's loss experience, expenses and future trend analysis. The general mortgage default experience may also be considered. Premium rates are subject to review and challenge by state regulators.
Statutory Accounting
The statutory financial statements of NMIC are presented on the basis of accounting practices prescribed or permitted by the Wisconsin OCI.
The Wisconsin OCI recognizes only statutory accounting practices prescribed or permitted by the State of Wisconsin for determining and reporting the financial condition and results of operations of an insurance company and for determining its solvency under the Wisconsin Insurance Statutes. The National Association of Insurance Commissioners' (“NAIC”)
Accounting Practices and Procedures
manual, in the version currently in effect, (“NAIC SAP”) has been adopted as a component of prescribed or permitted practices by the State of Wisconsin. The state has adopted certain prescribed accounting practices that differ from those found in NAIC SAP. Specifically, Wisconsin domiciled companies record changes in the contingency reserve through the income statement as an underwriting deduction. In NAIC SAP, changes in the contingency reserve are recorded directly to unassigned surplus.
The Wisconsin Commissioner of Insurance has the right to permit other specific practices that deviate from prescribed practices.
A reconciliation of net income and capital and surplus between NAIC SAP and practices prescribed and permitted by the State of Wisconsin is shown below:
|
National Mortgage Insurance Corporation
|
December 31, 2013
|
December 31, 2012
|
||||||
|
NET LOSS
|
(In Thousands)
|
|||||||
|
(1) State basis (Page 4, Line 20, Columns 1 & 3)
|
$
|
(32,695
|
)
|
$
|
18
|
|
||
|
(2) State Prescribed Practices that increase/(decrease) NAIC SAP
|
||||||||
|
Change in contingency reserves
|
(1,740
|
)
|
—
|
|
||||
|
(3) NAIC SAP (1 - 2 = 3)
|
$
|
(30,955
|
)
|
$
|
18
|
|
||
|
SURPLUS
|
||||||||
|
(4) State basis (Page 3, Line 37, Columns 1 & 2)
|
$
|
180,310
|
|
$
|
210,004
|
|
||
|
(5) State Prescribed Practices that increase/(decrease) NAIC SAP
|
—
|
|
—
|
|
||||
|
(6) NAIC SAP (4 - 5 = 6)
|
$
|
180,310
|
|
$
|
210,004
|
|
||
The statutory basis statements of our insurance subsidiaries determine those subsidiaries' ability to make dividend payments to our holding company, NMIH.
24
The preparation of financial statements in conformity with Statutory Accounting Principles requires management to make estimates and assumptions that affect the reported amounts of assets and liabilities. It also requires disclosure of contingent assets and liabilities at the date of the financial statements and the reported amounts of revenue and expenses during the period. Actual results could differ from those estimates.
|
Combined Statutory Balances
|
Net Loss
|
Surplus (Deficit)
|
Contingency Reserve
|
||||||
|
(In Thousands)
|
|||||||||
|
Year ended December 31, 2013
|
$
|
(33,307
|
)
|
$
|
189,698
|
|
$
|
2,314
|
|
|
Year ended December 31, 2012
|
(18
|
)
|
220,004
|
|
—
|
|
|||
|
Period from May 19, 2011 to December 31, 2011
|
(598
|
)
|
(1,450
|
)
|
—
|
|
|||
Licensing Process Overview
NMIC requires a certificate of authority, or insurance license, in each state or jurisdiction in which it issues insurance policies. As discussed below in Part II, Item 7,
"Management's Discussion and Analysis of Financial Condition and Results of Operations - Start-up Operations - State Licensing"
, NMIC is currently licensed in 49 states and D.C., and it has not yet received a certificate of authority in Wyoming.
Other U.S. Regulation
Certain federal laws directly affect private mortgage insurers. Private mortgage insurers are also impacted indirectly by federal legislation and regulation affecting mortgage originators and lenders, purchasers of mortgage loans, such as the GSEs, and governmental insurers such as the FHA and VA. For example, changes in federal housing legislation and other laws and regulations may affect the demand for MI and therefore may have a material effect on our business. As discussed below, since the GSEs were placed into the conservatorship of the FHFA in 2008, there has been ongoing policy debate regarding the roles of the GSEs, the government and private capital in the U.S. housing finance system, and legislation has been proposed in both the House and Senate that if enacted would have differing impacts on the current role of mortgage insurance as credit enhancement.
In addition, the Dodd-Frank Wall Street Reform and Consumer Protection Act of 2010 amended certain provisions of the Truth In Lending Act ("TILA"), the Real Estate Settlement Procedures Act ("RESPA"), and the Securities Exchange Act of 1934 (the "Exchange Act") that may have a significant impact on our business prospects. The Consumer Financial Protection Bureau ("CFPB"), a Federal agency created by the Dodd-Frank Act, is charged with implementation and enforcement of these provisions. In 2013, the CFPB published its final ability to repay rule defining Qualified Mortgages (QM) which went into effect in January 2014, and Federal Banking Regulators are in the process of finalizing a rule on Qualified Residential Mortgages (QRM), both of which are discussed further below. In 2013, the CFPB also published residential mortgage servicing rules providing amendments to Regulation Z (TILA) and Regulation X (RESPA).
We believe that a strong, viable private MI market is a critical component of the U.S. housing finance system. Mortgage insurance provides private capital to mitigate mortgage credit risk within the system, supports increased levels of homeownership, offers liquidity and process efficiencies for lenders, and provides consumers with lower-cost products and increased choice of mortgage and homeownership options. We meet frequently with regulatory agencies, including our state insurance regulators and the FHFA, the GSEs, our customers and other industry participants to promote the role and value of private mortgage insurance and exchange views on the U.S. housing finance system. We believe we have a good relationship with our domiciliary regulator and often share our views on current matters regarding the MI industry. We actively participate in industry discussions regarding potential changes to the MI regulatory environment. We intend to continue to promote legislative and regulatory policies that support a viable and competitive private MI industry and a well-functioning U.S. housing finance system.
We are further impacted by broader regulation of residential mortgage transactions. Mortgage origination and servicing transactions are subject to compliance with various federal and state consumer protection laws, including RESPA, the Equal Credit Opportunity Act, the Fair Housing Act, the TILA, the Homeowners Protection Act of 1998, the Fair Credit Reporting Act of 1970 (“FCRA”), the Fair Debt Collection Practices Act and others. Among other things, these laws and their implementing regulations prohibit payments for referrals of settlement service business, require fairness and non-discrimination in granting or facilitating the granting of credit and insurance, govern the circumstances under which companies may obtain and use consumer credit information, establish standards for cancellation of borrower-paid mortgage insurance, define the manner in which companies may pursue collection activities, require disclosures of the cost of credit and provide for other consumer protections. The application of certain of these laws may depend on whether charges for mortgage insurance are included in determining whether the loan charges exceed a specified level that triggers application of the consumer protections.
25
Housing Finance Reform
Since the GSEs were placed into the conservatorship of the FHFA in 2008, there has been ongoing policy debate regarding the roles of the GSEs, the Federal government and private capital in the U.S. housing finance system. The Federal government currently plays a dominant role in the U.S. housing finance system through the GSEs and the FHA, VA and Ginnie Mae. There is broad policy consensus toward the need for private capital to play a larger role and government credit risk to be reduced. However, to date there has been a lack of consensus with regard to the specific changes necessary to return a larger role for private capital and how small the eventual role of government should become. The placement of the GSEs into the conservatorship of the FHFA has increased the likelihood that the U.S. Congress will act to address the role and purpose of the GSEs in the U.S. housing market and potentially legislate structural and other changes to the GSEs and the functioning of the secondary mortgage market. Such changes, if they come to pass, could have a profound impact on our business.
In February 2011, the U.S. Department of the Treasury reported its recommendations regarding options for ending the conservatorship of the GSEs, and while the Treasury's recommendations do not provide any definitive timeline for GSE reform, the recommendations include substantially reducing the government's footprint in housing finance. With respect to long-term reform, the Treasury's proposal outlined three options for a future housing finance system, each of which differs in both the structure and scale of the Federal government's future role:
|
•
|
Recommendation One: Privatized system of housing finance with the Federal government's role limited to providing assistance for narrowly targeted groups of borrowers, leaving the vast majority of the mortgage market to the private sector;
|
|
•
|
Recommendation Two: Similar to One, but with ability for the Federal government to scale up to a larger share of the market if private capital withdraws in times of financial stress; and
|
|
•
|
Recommendation Three: Similar to Two, but with assistance to low- and moderate-income borrowers and with the Federal government providing catastrophic reinsurance behind private capital for securities of a targeted range of mortgages.
|
Since 2011, there have been numerous legislative proposals that are premised on a Recommendation Three model, with government providing a backstop or guarantee for mortgage-backed securities for some portion of the market and are intended to wind down the GSEs in a piecemeal fashion. In addition, there were several broader, comprehensive housing finance reform proposals introduced in Congress, which have been designed to eliminate the GSEs, while replacing them with a new mortgage financing system. The proposals vary greatly with regard to the government's role in the housing market, and more specifically, with regard to the existence of an explicit or implicit government guarantee. Under a Recommendation Three model, MI could have a role in providing private capital to reduce taxpayer credit risk where government provides a backstop or guarantee.
Several proposals have been and are currently being considered by Congress. On July 24, 2013, the House Financial Services Committee passed H.R. 2767, "The Protecting American Taxpayers and Homeowners Act of 2013" (the "PATH Act"), a comprehensive secondary market reform plan similar to Recommendation One including a very limited risk-bearing role for government and winding down of the GSEs, as well as extensive reforms to the FHA. Legislation in the Senate is likely to be influenced by, among other things, proposed bipartisan legislation co-authored by Senators Bob Corker (R-TN) and Mark Warner (D-VA), titled S. 1217, "The Housing Finance Reform and Taxpayer Protection Act" (the "Corker-Warner Bill"). The Corker-Warner Bill sets a framework for GSE and secondary market reform that includes winding down the GSEs over a five year period and the creation of a new entity, the Federal Mortgage Insurance Corporation, or FMIC, as a successor to FHFA with responsibility for running a catastrophic government insurance fund for certain mortgage-backed securities and regulating the operation of the secondary market. Among its provisions, properly underwritten mortgages meeting certain conditions, including private mortgage insurance on loans with LTVs in excess of 80%, will be eligible to be securitized with the catastrophic government guarantee provided by FMIC. On March 11, 2014, the leaders of the Senate Banking Committee, Senators Tim Johnson and Mike Crapo, outlined plans for legislation that they intend to introduce "in the coming" days" to wind down the GSEs. Under the proposal, Fannie Mae and Freddie Mac would be wound down and replaced with a new government reinsurer called the Federal Mortgage Insurance Corporation ("FMIC"), which would provide assistance only after private creditors had taken a hit. The plan anticipates that the FMIC would be financed by fees on lenders who want the government backstop. The prospects for passage of housing finance and GSE reform legislation continue to remain uncertain in both the House and Senate.
During the third fiscal quarter of 2013, President Obama publicly addressed housing finance and, among other announcements, issued a set of core principles for housing finance reform which endorsed a Recommendation Three model intended to ensure widespread and consistent access to 30-year fixed rate mortgages as the role of the GSEs is eventually transitioned out of the housing finance system. The Obama Administration also endorsed intermediate steps to transition to a new housing finance system, including systematically reducing the government's credit risk exposure at the GSEs through two key approaches, (i) a capital markets approach in which private investors take on the risk of the portfolio's first losses, and (ii) an insurance approach in which well capitalized and regulated private institutions insure a portfolio of mortgages against default and collect insurance premiums.
26
FHA Reform
We compete with the single-family mortgage insurance programs of the Federal Housing Administration ("FHA"), which is part of HUD. The FHA's role in the mortgage insurance industry is also significantly dependent upon regulatory developments. In 2012, an FHA reform bill, H.R. 4264 "The FHA Emergency Fiscal Solvency Act of 2012," passed the House of Representatives and came close to passage in the Senate. In July 2013, the House Financial Services Committee passed the PATH Act, which contains among its provisions extensive reforms to the FHA, including an increase to the minimum capital reserve ratio to 4%, a 5% minimum borrower down payment, mandated minimum premiums and increased ability to change premiums, increased authority for the FHA to seek indemnification from lenders for improperly originated loans and requires the implementation of loan level risk sharing agreements. In addition, on July 31, 2013, the Senate Banking Committee passed S. 1376 "The FHA Solvency Act of 2013," which among other changes, raises the minimum capital reserve ratio to 3%, sets certain minimum and maximum premiums and grants authority for higher premiums than currently permitted, and strengthens the authority of the FHA to seek indemnifications from lenders for improperly originated loans. Despite areas of similarity, such as provisions to strengthen the solvency of the FHA Mutual Mortgage Insurance Fund’s (“MMIF”), there are significant differences between the PATH Act and the FHA Solvency Act of 2013. Each year, FHA is required to perform an actuarial projection on its insurance portfolio and report the results to Congress. On December 13, 2013, HUD made a report to Congress that the FHA’s MMIF's net worth improved from last year’s estimate, from negative $16.3 billion to negative $1.3 billion. In addition, HUD reported that the MMIF's capital ratio is -0.11% but is expected to return to a required capital reserve ratio of 2% by 2015, 2 years sooner than earlier projections. Although the MMIF's outlook has improved considerably, Congress will continue to consider legislation to reform the FHA. The prospects for passage of FHA reform legislation in either the House or Senate, and how differences in proposed reforms between the House and Senate might be resolved in any final legislation, remain uncertain. If FHA reform were to raise FHA premiums, tighten FHA credit guidelines, make other changes which make lender use of the FHA less attractive, or implement credit risk sharing between the FHA and private mortgage insurers, these changes may be beneficial to our business. However, there can be no assurance that any FHA reform legislation will be enacted into law, and what provisions may be contained in final legislation, if any.
Qualified Mortgage Regulations
The Dodd-Frank Act contains the ability to repay ("ATR") mortgage provisions, which govern the obligation of lenders to determine the borrower's ability to pay when originating a mortgage loan. The CFPB issued final ATR regulations on January 10, 2013 and amendments on May 29, 2013, July 10, 2013 and September 13, 2013 implementing detailed requirements on how lenders must establish a borrower's ability to repay a covered mortgage loan. The ATR rule went into effect on January 10, 2014. A subset of mortgages within the ATR rule is known as a "qualified mortgage" ("QM"). For a mortgage loan to be a QM, the rule first prohibits certain loan features, such as negative amortization, points and fees in excess of 3% of the loan amount, and terms exceeding 30 years. The rule also establishes underwriting criteria for QMs including that a borrower must have a total debt-to-income ratio of less than or equal to 43%. The ATR rule provides that a covered first mortgage loan meeting the QM definition bearing an annual percentage rate no greater than 1.5% plus a prevailing market rate is regarded as complying with ATR requirements, while if a loan bears an annual percentage rate of greater than 1.5% plus a prevailing market rate, it will carry a rebuttable presumption of compliance with the ATR rule. QMs under the rule benefit from a statutory presumption of compliance with the ATR rule, thus potentially mitigating the risk of the liability of the creditor and assignees of the loan under TILA. Because of the QM evidentiary standards for proof of compliance, we anticipate that most loans originated after the ATR rule goes into effect will be QMs.
The rule also provides a temporary category of QMs that have more flexible underwriting requirements so long as they satisfy the general product feature requirements of QMs and so long as they meet the underwriting requirements of the GSEs or those of HUD, Department of Veterans Affairs or Rural Housing Service (collectively, “Other Federal Agencies”). The temporary category of QMs that meet the underwriting requirements of the GSEs will phase out upon the earlier to occur of the end of conservatorship of the GSEs or January 10, 2021. The rules for the Other Federal Agencies will terminate when they issue their own qualified mortgage rules, respectively. On December 11, 2013, HUD announced its own final rule defining a "Qualified Mortgage" that would be insured, guaranteed or administered by FHA, which went into effect on January 10, 2014. HUD's Qualified Mortgage definition is less restrictive than the CFPB's definition in certain respects, including that (i) it has no borrower DTI limit, and (ii) it has a higher pricing threshold for loans to fall into the "safe harbor" category of QM loans rather than the "rebuttable presumption" category of QM loans. We expect that most lenders will be reluctant to make loans that do not qualify as QMs because absent full compliance with the ATR rule, such loans will not be entitled to a "safe-harbor" presumption of compliance with the ability-to-pay requirements.
The ATR regulation may impact the mortgage insurance industry in several ways. First, the ATR regulation will have a direct impact on establishing a subset of borrowers who can meet the regulatory QM standards and will have a direct effect on the size of the mortgage market in any given year once the regulations become effective. Second, under the ATR regulation, if the lender requires the borrower to purchase MI, then the MI premiums are included in monthly mortgage costs in determining the borrower's ability to repay the loan. The demand for MI may decrease if, and to the extent that, monthly MI premiums make it less likely that a loan will qualify for QM status, especially if MI alternatives, such as piggy-back loans, are relatively less expensive than MI.
27
Third, under the ATR regulation, mortgage insurance premiums that are payable at or prior to consummation of the loan are includible in points and fees for purposes of determining QM status unless, and to the extent that, such up-front premiums (“UFP”) are (i) less than or equal to the UFP charged by the FHA,
and
(ii) are automatically refundable on a
pro rata
basis upon satisfaction of the loan. (The FHA currently charges UFP of 1.75% on all residential mortgage loans, but it has the authority to change its UFP from time to time.) As inclusion of MI premiums towards the 3% cap will reduce the capacity for other points and fees in covered transactions, mortgage originators will be less likely to purchase single premium MI products to the extent that the associated premiums are deemed to be points and fees. As a result, we believe that the ATR rule may increase demand for monthly and annual MI products relative to single premium products.
Qualified Residential Mortgage Regulations
The Dodd-Frank Act generally requires an issuer of an asset-backed security or a person who organizes and initiates an asset-backed transaction (a “securitizer”) to retain at least 5% of the risk associated with securitized mortgage loans, although in some cases the retained risk may be allocated between the securitizer and the mortgage originator. This risk retention requirement does not apply to mortgage loans that are Qualified Residential Mortgages (“QRMs”) or that are insured by the FHA or another federal agency. By exempting QRMs from the risk-retention requirement, the cost of securitizing these mortgages would be reduced, thus providing a market incentive for the origination of loans that are exempt from the risk-retention requirement.
The Dodd-Frank Act requires certain federal regulators, including the SEC, the Federal Deposit Insurance Corporation ("FDIC"), the OCC and (as to residential mortgage transactions) HUD and FHFA, to promulgate regulations providing for minimum credit risk-retention requirements in securitizations of residential mortgage loans that do not meet the definition of QRM. In March 2011, federal regulators issued the proposed credit risk retention rule, which the regulators re-proposed with certain revisions on August 28, 2013. The initial proposed rule suggested a maximum LTV of 80% in purchase transactions, 75% in rate and term refinance transactions, and 70% in cash-out refinancings, along with other restrictions such as limits on a borrower's debt-to-income ratio. The suggested LTV figures did not give consideration to MI in computing LTV. According to the re-proposal, the majority of commenters, including securitization sponsors, housing industry groups, mortgage bankers, lenders, consumer groups, and legislators opposed the agencies' original QRM proposal, recommending instead that almost all mortgages without features such as negative amortization, balloon payments, or teaser rates should qualify for an exemption from risk retention. Some commenters expressed support for additional factors, such as less stringent LTV restrictions and reliance on MI for high-LTV loans. The re-proposed rule did not carry forward the minimum LTV requirements and other specific restrictions. Instead, the federal regulators proposed that whether a particular loan transaction is a QRM, and thus not subject to the credit risk retention requirement, should be determined by reference to the “qualified mortgage” (QM) rule, discussed above. That is, if a residential mortgage loan is a QM loan, the loan would be considered a QRM loan. The federal regulators requested comment on whether the common definition of QRM should be limited to “safe harbor” QM loans or QM loans that satisfy either the “safe harbor” or “rebuttable presumption” QM standard.
Under this part of the re-proposed rule, because of the capital support provided by the U.S. government, the GSEs during their conservatorship would not be subject to the Dodd-Frank Act credit risk retention requirements. Changes in the conservatorship status of the GSEs or capital support provided to the GSEs by the U.S. government could impact the manner in which the credit risk retention rules apply to the GSEs. If the QRM rule is finalized in accordance with the federal regulators' re-proposal, it is difficult to predict the impact on the non-GSE loan securitization market and the demand for MI within this market.
The federal regulators in the re-proposal also presented an alternative approach to defining QRM, referred to as “QM plus.” Under this alternative, only certain types of residential mortgage loans, such as first-lien loans secured by 1-to-4 family principal dwelling units, could be considered QRM transactions. To be eligible for QRM status, the loan would have to be free of certain loan terms and have an LTV at closing no greater than 70%. Junior liens under the QM plus alternative would be permitted only in non-purchase money loan transactions and if permitted, would need to be included in the 70% LTV calculation. Under this alternative, mortgage insurance would not reduce the minimum LTV requirement. In addition, loans that achieve a QM status because they meet the CFPB's QM requirements for GSE-eligible transactions would not be considered QRM transactions under the alternative proposal. Changes in final regulations regarding treatment of GSE eligible mortgage loans could impact the manner in which the credit risk retention rule applies to GSE securitizations.
We, and the industry, continue to evaluate the expected impact of the re-proposed QRM rule on the MI industry, and such potential impact depends on, among other things, (i) the final definition of QRM and its requirements for LTV, loan features and debt-to-income ratio, (ii) whether the final definition will affect the size of the high-LTV mortgage market and (iii) the extent to which the mortgage purchase and securitization activities of the GSEs become a smaller portion of the overall mortgage finance market and securitizations subject to the risk retention requirements and the QRM exemption become a larger part of the mortgage market.
28
Basel III
In 1988, the Basel Committee on Banking Supervision developed the Basel Capital Accord (“Basel I”), which set out international benchmarks for assessing banks' capital adequacy requirements. In June 2005, the Basel Committee issued an update to Basel I (as revised in November 2005, “Basel II”), which, among other factors, governs the capital treatment of MI purchased by domestic and international banks in respect of their origination and securitization activities. In November 2010, the United States agreed to a new capital framework known as Basel III. This new capital framework will replace the Basel II capital rules, which have not yet been implemented for U.S. depository institutions or holding companies. The Basel III framework will apply to the 10 to 12 largest U.S. banking organizations, as well as banking companies that have significant international operations. It may also be imposed on non-banking financial companies that are determined by the relevant regulators to present systemic risks to the U.S. financial system. The Basel III framework refines the Basel II risk-based structure by requiring the use of highly stressed scenarios in determining the appropriate levels of risk undertaken by banks, and it will also increase the required minimum capital ratios. The Basel III framework restricts the instruments that can count toward meeting the capital requirements, placing greater emphasis on common equity and retained earnings. Finally, Basel III will impose a new minimum liquidity standard on banking organizations.
The phase in period for the Basel III regime for larger banking organizations will begin in 2014 and for community banks in 2015. The final regulations increase the amount of capital and the quality of the capital required to be held by banks. In addition, the capital rules will continue to risk-weight assets based on internal models that use inputs such as the probability of default and the bank's expected loss given a default. The final version of the regulations continues the current treatment for the risk weighting of residential mortgage assets and the treatment of mortgage insurance as reducing the risk weighting on mortgages where the borrower has made a down payment of less than 10% of the value of the residential property. The draft Basel III regulations proposed by the regulators in 2012 would have increased the risk weightings of residential mortgage assets and did not require that MI be factored into the calculation of the risk weightings. In addition, the final regulations increase the risk weighting for mortgage servicing assets held by banks and require the mortgage servicing assets above certain levels be deducted from the calculation of Tier I equity. Since most low down payment mortgages originated today are either sold to the GSEs or insured by the FHA or guaranteed by the VA, we cannot predict what, if any, impact to the MI industry the Basel III regulations will have. Since a significant percentage of the mortgages insured by the MI industry are serviced by banks or bank-owned mortgage companies, the changes in risk weighting for mortgage servicing assets and the deductions from Tier I equity capital for mortgage servicing assets above certain levels could cause shifts in the amounts of mortgages serviced by banks and bank affiliates or subsidiaries relative to non-banking organizations. It is difficult to predict the impact these shifts may have on the quality of the servicing of insured mortgages or the ultimate impact on the MI industry.
Mortgage Servicing Rules
The Dodd-Frank Act amended and expanded upon mortgage servicing requirements under TILA and RESPA. The CFPB was required to amend Regulation Z (TILA) and Regulation X (RESPA) to conform these regulations to the statutory requirements. The CFPB issued final regulations on January17, 2013, amendments to the final regulations on July 10, 2013 and an interim final rule on October 15, 2013 implementing these detailed new mortgage servicing requirements. These rules went into effect on January 10, 2014. Included within these rules are new or enhanced requirements for handling escrow accounts, responding to borrower assertions of error and inquiries from borrower, special handling of loans that are in default, and loss mitigation in the event of borrower default. A provision of the required loss mitigation procedures prohibits the loan holder or servicer from commencing foreclosure until 120 days after the borrower's delinquency. Violation of the loss mitigation rules, largely mandating special notices, handling and processing procedures (with deadlines) based on borrower submissions, may subject the servicer to private rights of action under RESPA. Such actions or threats of such actions could cause delays in and increase costs and expenses associated with default servicing, including foreclosure. Complying with the new rules, especially the rules that apply to loans in default, could cause the servicing of mortgage loans to become more burdensome and costly than it is today. As to servicing of mortgage loans covered by our insurance policies, these rules could contribute to delays in and increased costs associated with realization upon collateral and have an adverse impact on the cost and resolution of claims.
Homeowners Protection Act of 1998 ("HOPA")
HOPA provides for the automatic termination, or cancellation upon a borrower's request, of "borrower-paid MI", as defined in HOPA, upon satisfaction of certain conditions. HOPA requires that lenders give borrowers certain notices with regard to the automatic termination or cancellation of borrower-paid mortgage insurance. These provisions apply to borrower-paid MI for purchase money, refinance and construction loans secured by the borrower's principal dwelling. FHA and VA loans are not covered by HOPA. Under HOPA, automatic termination of borrower-paid MI would generally occur when the mortgage is first scheduled to reach an LTV of 78% of the home's original value, assuming that the borrower is current on the required mortgage payments. A borrower who has a “good payment history,” as defined by HOPA, may generally request cancellation of borrower-paid MI when the LTV is first scheduled to reach 80% of the home's original value or when actual payments reduce the loan balance to 80% of the home's
29
original value, whichever occurs earlier. If borrower-paid MI coverage is not canceled at the borrower's request or by the automatic termination provision, the mortgage servicer must terminate such MI coverage by the first day of the month following the date that is the midpoint of the loan's amortization, assuming the borrower is current on the required mortgage payments.
Real Estate Settlement Procedures Act of 1974
RESPA will apply to most residential mortgages insured by us. MI generally may be considered to be a “settlement service” for purposes of RESPA under applicable regulations. Subject to limited exceptions, RESPA prohibits persons from giving or accepting anything of value in connection with the referral of a settlement service. RESPA authorizes the CFPB to bring civil enforcement actions, and also provides for criminal penalties and private rights of action. RESPA also affects how we structure ancillary services that we may provide to our customers, if any, including underwriting services and risk-share arrangements. RESPA, in addition, imposes various duties and obligations on mortgage servicers.
Home Mortgage Disclosure Act of 1975
Most originators of mortgage loans are required to collect and report data relating to a mortgage loan applicant's race, nationality, gender, marital status, and census tract to the CFPB under the Home Mortgage Disclosure Act of 1975 (“HMDA”). Mortgage insurers are not required pursuant to any law or regulation to report HMDA data, although, under the laws of several states, mortgage insurers are currently prohibited from discriminating on the basis of certain protected classifications. Certain mortgage insurers have, through the former industry trade group, Mortgage Insurance Companies of America (“MICA”), entered voluntarily into an agreement with the Federal Financial Institutions Examinations Council to report the same data on loans submitted for insurance as is required for most mortgage lenders under HMDA. Although not a signatory to the agreement, NMIC intends to comply with its terms in the future.
SAFE Act (Mortgage Loan Originator Licensing)
As part of transfer of authority under the Dodd-Frank Act, the CFPB became responsible for federal jurisdiction over mortgage loan originators. The CFPB exercised its rulemaking authority over depositories and non-depositories under the Secure and Fair Enforcement for Mortgage Licensing Act of 2008, or SAFE Act by promulgating Regulation G and Regulation H, respectively, on December 19, 2011. The CFPB set forth minimum qualifications requirements for loan originators as part of the Regulation Z loan originator compensation rule issued on January 20, 2013. The SAFE Act requires mortgage loan originators to be licensed and/or registered with the Nationwide Mortgage Licensing System and Registry (the "Registry"). The Registry is a database established by the Conference of State Bank Supervisors and the American Association of Residential Mortgage Regulators. Among other things, the database was established to support the licensing of mortgage loan originators by each state. As part of this licensing and registration process, loan originators who are employees of institutions other than depository institutions or certain of their subsidiaries that are regulated by a Federal banking agency, must generally be licensed under the SAFE Act guidelines enacted by each state in which they engage in loan originator activities and registered with the Registry. The SAFE Act generally prohibits employees of a depository institution (including certain of their subsidiaries that are regulated by a Federal banking agency) from originating residential mortgage loans without first registering with the Registry and maintaining that registration. We do not believe that the SAFE Act applies to our employees and/or third party service providers who review loan files in connection with underwriting mortgage insurance applications for the purpose of making mortgage insurance decisions. If, however, the SAFE Act is interpreted to apply to our underwriters or other employees or contractors, we would take steps to comply, which would increase our costs.
Mortgage Insurance Tax Deduction
In 2006, Congress enacted the private mortgage insurance tax deduction in order to foster homeownership. The deduction was enacted on a temporary basis and it expired at the end of 2011. In January 2013, Congress passed the American Taxpayer Relief Act, which extended the private mortgage insurance tax deduction retroactively for one year and prospectively for one year until December 31, 2013. In 2012, legislation was also introduced that would make the private mortgage insurance deduction permanent. The proposed legislation may be reintroduced in the 113th Congress and considered as a part of the comprehensive tax reform debate. We cannot predict whether the tax deduction will be made permanent and if not, whether it will be further extended following its expiration on December 31, 2013.
Privacy and Information Security
We provide mortgage insurance products and services to financial institutions with which we have business relationships. In the normal course of providing our products and services, we may receive non-public personal information regarding such financial institutions’ customers. The Gramm-Leach-Bliley Act of 1999 ("GLB") and related state and federal regulations implementing its privacy and safeguarding provisions impose privacy and information security requirements on financial institutions, including obligations to protect and safeguard consumers’ non-public personal information. GLB and its implementing regulations are enforced
30
by state insurance regulators and state attorneys general, and by the U.S. Federal Trade Commission ("FTC") and the CFPB. In addition, many states have enacted privacy and data security laws which impose compliance obligations beyond GLB, including obligations to protect social security numbers and provide notification in the event that a security breach results in a reasonable belief that unauthorized persons may have obtained access to consumer non-public personal information.
Fair Credit Reporting Act
The Fair Credit Reporting Act of 1970, as amended, or FCRA, imposes restrictions on the permissible use of credit report information. FCRA has been interpreted by some FTC staff to require mortgage insurance companies to provide “adverse action” notices to consumers in the event an application for mortgage insurance is declined on the basis of a review of the consumer’s credit. We provide such notices when required.
Anti-Discrimination Laws
The Equal Credit Opportunity Act, or ECOA, requires creditors and insurers to handle applications for credit and for insurance in accordance with specified requirements and prohibits discrimination in lending or insurance based on prohibited factors such as gender, race, ethnicity, age and familial status. The Fair Housing Act prohibits discrimination on the basis of race, gender and other prohibited bases in connection with housing-secured credit transactions. The U.S. Department of Justice has investigated at least one mortgage insurer since 2012 in connection with alleged Fair Housing Act violations associated with mortgage insurance underwriting.
Implications of and Elections Under the JOBS Act
As a company that had gross revenues of less than $1 billion during its last fiscal year, we are an “emerging growth company,” as defined in the JOBS Act (an “EGC”). We will retain that status until the earliest of (i) the last day of the fiscal year in which we have total annual gross revenues of $1,000,000,000 (as indexed for inflation in the manner set forth in the JOBS Act) or more; (ii) the last day of the fiscal year following the fifth anniversary of the date of the first sale of our common stock pursuant to an effective registration statement under the Securities Act of 1933 (the "Securities Act"); (iii) the date on which we have, during the previous 3-year period, issued more than $1,000,000,000 in non-convertible debt; or (iv) the date on which we are deemed to be a “large accelerated filer,” as defined in Rule 12b-2 under the Exchange Act or any successor thereto. We expect to retain our status as an EGC through year end 2014. We believe there is a substantial possibility that our ability to take advantage of any of the JOBS Act elections will cease by the end of 2014, depending in large part on the market value of our equity at that time, as we believe that we will no longer meet all of the requirements to be considered an EGC at that point.
As an EGC:
|
•
|
we are exempted from compliance with Section 404(b) of Sarbanes-Oxley, which otherwise would have required our auditors to attest to and report on our internal control over financial reporting;
|
|
•
|
we are not required to comply with any new or revised financial accounting standard until such date as a private company (i.e., a company that is not an “issuer” as defined by Section 2(a) of Sarbanes-Oxley) is required to comply with such new or revised accounting standard. As a result, our financial statements may not be comparable with another public company which is neither an EGC nor an EGC which has opted out of using the extended transition period;
|
|
•
|
we may elect to not comply with Item 402 of Regulation S-K, which requires extensive quantitative and qualitative disclosure regarding executive compensation, but instead disclose the more limited information required of a “smaller reporting company”;
|
|
•
|
we are exempted from the following additional compensation-related disclosure provisions that were imposed on U.S. public companies pursuant to the Dodd-Frank Act: (i) the advisory vote on executive compensation required by Section 14A(a) of the Exchange Act, (ii) the requirements of Section 14A(b) of the Exchange Act relating to stockholder advisory votes on “golden parachute” compensation, (iii) the requirements of Section 14(i) of the Exchange Act as to disclosure relating to the relationship between executive compensation and our financial performance, and (iv) the requirement of Section 953(b)(1)of the Dodd-Frank Act, which will require disclosure as to the relationship between the compensation of the Company's chief executive officer and median employee pay.
|
Since we are not required, among other things, to file reports under Section 13 of the Exchange Act or to comply with certain provisions of Sarbanes-Oxley and the Dodd-Frank Act and certain provisions and reporting requirements of or under the Securities Act and the Exchange Act or to comply with new or revised financial accounting standards as long as we are an EGC, the JOBS Act has the effect of reducing the amount of information that we are required to provide for the foreseeable future.
31
Employees
As of December 31, 2013, we had
141
full-time employees. None of our employees are parties to a collective bargaining agreement. We utilize a third-party professional employer organization to manage our human resource and payroll administration and related compliance requirements.
32
You should carefully consider the following risk factors, as well as all of the other information contained in this report, including our consolidated financial statements and the related notes thereto, before deciding to invest in our common stock. The occurrence of any of the following risks could materially and adversely affect our business, prospects, financial condition, operating results and cash flow. In such case, the trading price of our common stock could decline and you could lose all or part of your investment.
This report contains forward-looking statements that involve risks and uncertainties. See “Cautionary Note Regarding Forward-Looking Statements.” Our actual results could differ materially and adversely from those anticipated in these forward-looking statements, including any such statements made in Part II, Item 7, "Management's Discussion and Analysis of Financial Condition and Results of Operations."
Risk Factors Relating to Our Business Generally
We are a new company that, prior to receipt of GSE Approval in January 2013, did not engage in any substantive insurance operations. Therefore, we do not have a track record or operating history on which investors may rely for purposes of projecting our future operating results.
We are a new company that received GSE Approval in January 2013. We did not engage in any substantive operations (including writing MI) prior to receipt of GSE Approval and, therefore, do not have a track record or operating history on which investors may rely for purposes of projecting future operating results. Having a short insurance operating history, we are subject to substantial business and financial risks and could suffer significant losses, all of which are difficult to predict. We are continuing to develop business relationships, develop and implement our technology platform, gain customers, establish operating procedures, continue to hire staff and complete other tasks appropriate for the conduct of our intended business activities. Our success will also be dependent upon our ability to implement the operating procedures we have established, and continue to develop the internal controls (including the timely and successful implementation of information technology systems and programs) to effectively support our business and our regulatory and reporting requirements. In addition to the foregoing, as a new company with limited insurance operating history, we do not have all the necessary licenses and authorizations to operate the insurance business described in this prospectus in all of the United States. As of the date of this report, we have obtained certificates of authority to write MI business in 49 states and D.C. We do not yet have a certificate of authority in Wyoming. Further, industry conditions may change in a manner that adversely affects the development or profitability of our business, and there can be no assurance that we will be successful in our efforts to develop our business in a timely manner, if at all.
We have reported net losses since our inception, expect to continue to report annual net losses in the near term, and cannot assure you when we will achieve profitability.
We have reported net losses since our inception. For the
year ended
December 31, 2013
, we reported a net loss of
$55.2 million
and for the year ended December 31, 2012, we reported a net loss of
$27.5 million
. We currently expect to continue to report annual net losses in the near term, the size of which will depend primarily on the amount of insurance business we can transact and the returns generated from our investment portfolio. We expect that cash and investments and projected cash flows from operations will provide us with sufficient liquidity to fund our anticipated growth by providing capital to increase our insurance company surplus as well as for payment of operating expenses through 2015, at which point we currently expect we will need to raise additional capital. Any such capital raise may be in the form of debt, preferred equity, or common equity and may be senior to our common stock and may result in dilution to you. No assurance as to the ultimate availability, costs or other terms of any such additional capital can be given at this time. We cannot assure you when, or if, we will achieve profitability. Conditions that could delay our profitability primarily include our ability to attract and retain a diverse customer base, fully develop and implement our enterprise technology platform, maintain GSE eligibility and our certificates of authority from state insurance departments, and to a lesser extent, include increasing unemployment rates, decreasing housing values, unfavorable GSE reform and unfavorable resolution of ongoing legal proceedings.
As a participant in the mortgage lending and MI industry, we rely on e-commerce and other technologies to conduct business with our customers. Our inability to meet the technological demands of customers could adversely impact our business, financial condition and operating results.
As a participant in the mortgage lending and MI industry, we rely on e-commerce and other technologies to provide and expand our products and services. Customers require us to provide certain products and services in a secure manner, electronically via the Internet or electronic data transmission, and we will process a significant amount of our new insurance written and claims electronically. Accordingly, we are investing resources in establishing and maintaining electronic connectivity with customers and, more generally, in e-commerce and technological advancements. In order to integrate electronically with mortgage lenders,
33
we will need to continue to activate customers that utilize the largest and leading servicing system providers, LPS MSP and Fiserv LoanServ™, leveraging the integrations we have completed with these providers, and connect our systems to the industry's leading third-party loan origination systems. As discussed below in Part II, Item 7, "
Management's Discussion and Analysis of Financial Condition and Results of Operations - Start-up Operations - Customer Development
," we have completed integration with LPS MSP and Fiserv LoanServ
TM
and have integrated with certain leading third-party loan origination systems, including Ellie Mae Encompass360
®
. We expect this integration process may take a significant amount of time before it is complete. We are also working to integrate directly with those lenders that maintain their own, proprietary loan origination and servicing system technologies, recognizing that the time-lines for these integrations are heavily dependent upon the lenders' internal technology resources. Our inability to continue to make progress with these e-commerce connections could negatively impact our ability to attract as customers the larger mortgage lenders who rely on these connections to do business. Many customers require us to have such connectivity in place as a precursor to doing business with them. Our business, financial condition and operating results may be adversely impacted if we do not successfully establish these arrangements or otherwise keep pace with the technological demands of customers.
If we, together with third parties with whom we have contracted, are unable to develop, enhance and maintain our technology platform with respect to the products and services we offer, our business and financial performance could be significantly harmed.
As discussed above in this report, we have developed an enterprise technology platform designed to support our mortgage insurance operations. If our technology platform fails to perform in the manner we expect, our business, financial condition and operating results will be significantly harmed. Further, if we are unable to timely and effectively enhance our platform when necessary to support our current and future business functions, our business would be negatively impacted. Furthermore, such system development and enhancement efforts are critical to having and maintaining a fully operational business and technology platform, as specifically required in our approval conditions from the GSEs. Until we reach a significant volume of mortgage insurance applications through our policy acquisition system, and even if we reach a significant volume, we cannot be assured that we will not experience difficulties. The success of our business will be dependent on our ability to resolve any issues identified with our technology platform during operations and to make timely improvements. could have an adverse impact on our business, financial condition and operating results. Further, we will need to match or exceed the technological capabilities of our competitors over time. We cannot predict with certainty the cost of such maintenance and improvements, but failure to make such improvements and any significant shortfall in any technology enhancements or negative variance in the time-line in which system enhancements are delivered could have an adverse effect on our business, financial condition and operating results.
In addition, we have contracted with a number of third parties in connection with the development and operation of the platform and rely on these third parties to competently perform their obligations in a timely manner. Any failure to maintain acceptable arrangements with these third parties, or the failure of any of these third parties to perform and/or deliver in an acceptable and timely manner, could have an adverse effect on our business, financial condition and operating results.
We may not receive, or be able to retain, licenses in all states, which would hamper our ability to issue MI on a nationwide basis.
In addition to GSE Approval, in order to transact MI on a nationwide basis NMIC must receive certificates of authority in each of the 50 states and D.C. As of the date of this prospectus, NMIC has obtained certificates of authority in 49 states and D.C. NMIC has not yet received a certificate of authority in Wyoming. On March 7, 2014, we received a letter from the Wyoming Insurance Department ("WY DOI") notifying us that our application for a certificate of authority in Wyoming has been recommended for approval subject to NMIC posting a statutory deposit with the Wyoming Insurance Commissioner, which is customary for mortgage insurance companies. Although it appears likely based on written correspondence from the WY DOI that we will soon obtain a certificate of authority in Wyoming, there can be no assurance when the certificate of authority will ultimately be issued or if it will even be issued at all. The WY DOI has considerable discretion as to whether to grant us a certificate of authority. Unless and until we are successful in obtaining a license in Wyoming, our mortgage insurance business will be confined to those states where we have been issued certificates of authority and where our forms and rates have been approved. In addition, certain lenders may require that we hold certificates of authority in all states before they are willing to do business with us, which could also have an adverse effect on the volume of business we are able to write.
Our mortgage insurance master policies contain restrictions on our ability to rescind coverage for fraud and underwriting defects, and if we were to fail to timely discover any such fraud or underwriting defects, our rights of rescission would be significantly limited, and we could suffer increased losses as a result of paying claims on loans with unacceptable risk profiles.
On December 10, 2013, we announced that through a new version of our master policy and through an endorsement to our existing master policy, we will provide rescission relief after a borrower has timely made 12 consecutive monthly payments on a
34
loan, rather than 18 months as provided in the current master policy. The new master policy and endorsement are pending final approvals from some state insurance regulators. Under our current mortgage insurance policies, after a borrower has timely made 18 consecutive monthly payments on a loan we insure, we have agreed that we will not rescind or cancel coverage of that loan for borrower fraud or underwriting defects. In addition, upon the borrower attaining 18 full and timely consecutive monthly payments, we have agreed to limitations on our ability to initiate an investigation of fraud or misrepresentation by our insureds or any other party involved in the origination of an insured loan, which we collectively refer to in our master policies as a "First Party." Although we have processes in place to review every loan we insure, we may not discover fraud and/or underwriting defects prior to a borrower making the 18th payment, or after we implement the new terms of coverage, after the 12th payment. If this were to occur, we would be contractually prohibited from exercising our rights of rescission for borrower fraud; our rights to investigate potential First Party fraud or misrepresentation would be significantly curtailed; and we may be obligated to pay claims on certain loans with unacceptable risk profiles or which failed to meet our underwriting guidelines at the time of origination. As a result, we could suffer significant unexpected losses, which could adversely impact our business, financial condition and operating results.
We are outsourcing the underwriting of our mortgage insurance on certain loans to third-party service providers. If these service providers fail to adequately perform their underwriting services or place our coverage on loans we would deem ineligible, we could experience increased losses on loans underwritten by them and our customer relationships could be negatively impacted.
If our underwriting service providers fail to adequately perform their underwriting services, such as mishandling of customer inquiries or an inability to underwrite a sufficient volume of applications per day, we may lose opportunities to place mortgage insurance coverage on particular loans, our reputation may suffer, and customers may choose not to do business with us at all. In addition, if our underwriting service providers place our coverage on loans that are ineligible for coverage under our underwriting guidelines, our risk of loss will be increased on those loans or the premiums we charge will be inadequate to the risk presented. We do not have the right under our mortgage insurance policies to cancel coverage of an ineligible loan as a result of an underwriting vendor's inappropriate decision. Further, other than being able to terminate our contracts with these service providers, we do not have explicit monetary contractual remedies against these service providers in the event we are obligated to pay claims on ineligible loans that they improperly agreed to insure on our behalf. If these service providers fail to adequately perform their underwriting services or consistently place coverage on ineligible loans, we could experience increased losses on loans underwritten by them and our customer relationships could be negatively impacted, which would have an adverse impact on our business, financial condition and operating results.
We currently intend to perform a post-close underwriting review of every loan that has been insured through our delegated mortgage insurance program within the first months of coverage, which will increase our costs of doing business and could negatively impact our ability to compete. In addition, a delegated lender could commit us to insure loans with unacceptable risk profiles before we discover and remedy the problem.
Our delegated underwriting program permits lenders who are approved by us to bind coverage on our behalf, so long as the insurance decision is consistent with applicable eligibility and underwriting criteria. Historically, delegated underwriting of mortgage insurance by lenders has been perceived by both lenders and MI companies as affording mutually beneficial efficiencies to the mortgage underwriting process. Compared to the prevailing delegated programs of our competitors, our delegated program is costlier and less efficient for us and our customers. The terms of coverage that apply to loans insured under our delegated program require the lenders to submit complete loan origination files to us within 60 days of the coverage effective dates. To comply with the loan file delivery requirement, our customers' processes would likely need to be modified, which will require the expenditure of greater resources on their part and could have the effect of driving our customers to choose our competitors' products over ours. In addition, we intend to conduct a post-close underwriting review (with the assistance of third-party service providers) of every loan insured under our delegated program to determine whether such loans meet applicable eligibility and underwriting criteria. While we believe our timely post-close review will afford greater certainty of coverage to our customers, this process could significantly increase our costs of doing business compared to our competitors. For these reasons, the structure of our delegated program could negatively impact our ability to compete, which would have an adverse effect on our business, financial condition and operating results.
NMIC is required to maintain minimum capital under its agreements with the GSEs and certain states, and if NMIC falls below these capital requirements or exceeds certain risk-to-capital ratios, we could be required to cease writing business in these states and would likely lose our GSE eligibility, either of which would adversely impact our business, financial condition and operating results.
As a condition of GSE Approval, we have agreed with Fannie Mae and Freddie Mac to limit NMIC's risk-to-capital ("RTC") ratio to no greater than 15 to 1 for the first three years of operations (expiring December 31, 2015) and at all times to maintain total statutory capital of at least $150 million. After that date, we agree to comply with the risk-to-capital ratios that are imposed in the GSEs' then existing eligibility requirements. In addition, our operation plan filed with our principal regulator, the Wisconsin Office
35
of the Commissioner of Insurance ("Wisconsin OCI") and other state insurance departments in connection with NMIC's applications for licensure includes the expectation that we will downstream additional capital, if needed, so that NMIC does not exceed an 18 to 1 risk-to-capital ratio. Further, as part of our process of obtaining certificates of authority, NMIC entered into risk-to-capital agreements with the California Insurance Department, the Missouri Department of Insurance, the New York State Department of Financial Services, the Ohio Department of Insurance and the Texas Commissioner of Insurance. These agreements require NMIC to maintain a risk-to-capital ratio not to exceed 20 to 1 until January 2016. Finally, in connection with obtaining a certificate of authority in Florida, NMIH, consistent with conditions of the GSE Approval, has agreed to downstream additional capital from time to time, as needed, to maintain NMIC's risk-to-capital ratio at or below 15 to 1. If our business grows faster (i.e. our risk-in-force grows faster than expected) or is less profitable than expected (i.e. our revenues do not generate the return we expect), our actual RTC ratios over the short to mid-term could exceed our expected RTC ratios and could begin to approach the limits to which we are subject, which could require us to raise additional capital or enter into alternative arrangements to reduce our risk-in-force ("RIF"), including through reinsurance. With respect to each policy, primary RIF is the product of an insured loan's coverage percentage (the level of insurance protection) specified in the policy multiplied by that loan's unpaid principal balance. We can give no assurance that our efforts to raise capital or reduce our RIF would be successful. If we are unable to raise additional capital or enter into alternative arrangements to reduce our RIF, we may exceed the GSE and/or state-imposed capital requirements. If this were to occur, we may lose our GSE eligibility and/or may be required to cease transacting new business in these states, which would substantially impair our business and adversely impact our financial position and operating results.
Our insurance subsidiary is subject to state insurance department capital adequacy requirements, which if breached, could result in NMIC being required to cease writing new business or lose GSE eligibility.
NMIC's principal regulator is the Wisconsin OCI. Under applicable Wisconsin law, as well as that of 15 other states, a mortgage insurer must maintain a minimum amount of statutory capital relative to the risk-in-force in order for the mortgage insurer to continue to write new business. We refer to these requirements as the “risk-to-capital" requirement or "RTC" requirement. While formulations of minimum capital may vary in each jurisdiction that has such a requirement, the most common measure applied allows for a maximum permitted RTC ratio of 25 to 1. Wisconsin and certain other states, including California and Illinois, apply a substantially similar requirement referred to as minimum policyholders' position. Accordingly, if we fail to meet the capital adequacy requirements in one or more states, we could be required to suspend writing business in some or all of the states in which we do business.
Our inability to timely attract and retain the largest mortgage originators as customers could negatively impact our ability to achieve our business goals.
The success of our mortgage insurance business is highly dependent on our ability to attract and retain as customers the largest mortgage originators in the United States. To that end, we have identified 36 lenders and classified them as our National Accounts. These National Accounts generally represent the nation's largest home mortgage lenders. These lenders originate loans through their retail channels, as well as purchase loans from other originators, including the smaller correspondent lenders. Within the National Accounts, there are approximately five national mortgage originators who we consider critical to the achievement of our business goals because of their dominant market share. As a result of their size and market share, these entities originate a significant majority of low down payment mortgages in the United States and, therefore, influence the size of the MI market. In order to insure low down payment loans originated by these five largest originators, we must first obtain their respective approvals as an authorized MI provider, including their review and approval of our terms of coverage set forth in our master policies. We must also achieve connectivity with their loan origination systems and servicing platforms. The process of obtaining such approvals and integrating our systems is time-consuming and requires the dedication and coordination of significant resources by us and the lenders. There is no assurance we will receive approvals from these lenders to do MI business in this channel in a timely manner or at all. If we cannot timely obtain such approvals, or fail to obtain and retain one or more approvals, our business, financial condition and operating results could be adversely impacted.
If we ultimately gain these entities as customers, we cannot be certain that any loss of business from a single lender would be replaced from other new or existing lending customers in the industry. Such lending customers may decide to write business only with certain mortgage insurers based on their views with respect to an insurer's pricing, underwriting guidelines, loss mitigation practices, financial strength or other factors. Our customers may choose to diversify the mortgage insurers with which they do business, which could negatively affect our level of new insurance written and our market share. In addition, our master policies do not, and by law cannot, require our customers to do business with us. The loss of business from a significant customer could have an adverse effect on the amount of new business we are able to write, and consequently, our financial condition and operating results.
36
The mortgage market is dominated by the largest mortgage originators. We have identified thirty-six lenders as critical to our success and termed these lenders our National Accounts. If these lenders experience disruptions to their ability to originate mortgage loans, our business and financial performance could suffer.
Maintaining business relationships and new origination volumes with these National Accounts, particularly those who we believe to be the largest five originators, once they become customers, will be critical to the success of our business. The economic downturn and challenging market conditions of the recent past have adversely affected the financial condition of a number of them. If the U.S. economy fails to fully recover or re-enters a recessionary period, these lenders could again become subject to serious financial constraints that may jeopardize the viability of their business plans or their access to additional capital, forcing them to consider alternatives such as bankruptcy or consolidation with others in the industry. If this were to happen to any of our National Accounts the overall health of the U.S. mortgage origination market would be negatively impacted. The loss of business from a significant customer could have an adverse effect on the amount of new business we are able to write, and consequently, our financial condition and operating results.
There can be no assurance that the GSEs will continue to treat us as a qualified mortgage insurer in the future.
Fannie Mae and Freddie Mac have imposed certain capitalization, operational and reporting conditions in connection with their recent approvals of NMIC as a qualified mortgage insurer. Some of these conditions remain in effect for a three-year period from the date of GSE Approval, while others do not expressly expire. Even though we have received GSE Approval to be a qualified mortgage insurer, there can be no assurance that the GSEs will continue to treat us as a qualified mortgage insurer in the future or, alternatively, they could, in their own discretion, require additional limitations and/or conditions on certain of our activities and practices in order to remain qualified. Such additional requirements or conditions could limit our operating flexibility and the areas in which we may write new business. The GSEs, as major purchasers of conventional mortgage loans in the United States, will likely be the primary beneficiaries of our MI coverage. If, in the future, either or both of the GSEs were to cease to consider us a qualified mortgage insurer and, therefore, cease accepting our MI products, our business, financial condition and operating results would be adversely impacted.
Under the terms of the GSE Approval, either or both of the GSEs could require us to redomicile from Wisconsin to another state, which, if required, could have an adverse impact on our business, financial condition and operating results.
Under the terms of Fannie Mae's and Freddie Mac's respective approvals of NMIC as a qualified mortgage insurer, each GSE has the right to require NMIC to redomicile to another state approved by such GSE. If either or both of the GSEs were to require that NMIC redomicile to another state, the process to redomicile would likely be time consuming, and redomicile is subject to approval by both current and proposed state insurance regulators. NMIC's primary insurance regulator is currently the Wisconsin OCI. If NMIC were required to redomicile to another state acceptable to the GSEs, NMIC's primary insurance regulator would change and become the insurance regulator in the new state of domicile. If this were to occur, there is no assurance that NMIC would develop a favorable relationship with the new regulator. A requirement to redomicile could slow or prevent the successful execution of our plan of operations, which could adversely impact our business, financial condition and operating results.
We expect to face intense competition for business in our industry from existing MI providers and potentially from new entrants. If we are unable to compete effectively, we may not be able to gain market share and our business may be adversely affected.
The MI industry is highly competitive. We compete with other private mortgage insurers based on our financial strength, underwriting guidelines, product features, pricing, operating efficiencies, customer relationships, name recognition, reputation, the strength of management teams and field organizations, comprehensiveness of databases covering insured loans, effective use of technology and innovation in the delivery and servicing of insurance products and ability to execute. However, the existing MI companies, many of which have larger operations than us and/or are part of larger diversified companies, have established relationships and infrastructure, personnel and other resources than we are anticipated to have during our initial years of operation. In addition, we believe there is a substantial likelihood that one or more additional companies will enter the industry, as discussed above in
Part 1, Item 1,
"Business - Sales and Marketing and Competition
," and provide products similar to those that we provide. In addition, the perceived increase in credit quality of loans that are being insured today, the deterioration of the financial strength ratings of the existing mortgage insurance companies and the possibility of a decrease in the FHA's share of the mortgage insurance market may encourage additional new entrants. During 2011, two mortgage insurers stopped writing new business and, based on public disclosures, these insurers approximated more than 20% of the MI industry volume in the first half of 2011. We believe their new origination market share has since been redistributed among the other MI companies.
If our information technology systems are inferior to our competitors', existing and potential customers may choose our competitors' products over ours. If we are unable to compete effectively against our competitors and attract our target customers, our revenue may be adversely impacted and we may not be able to gain market share. Increased competition could result in fewer
37
submissions of policy applications to us and therefore result in premiums written being lower than expected, which could adversely impact our growth and profitability.
In its agreement with the Florida Office of Insurance Regulation, NMIH agreed, consistent with the conditions of the GSE Approval, to downstream additional capital from time to time, as needed, to maintain NMIC's risk-to-capital ratio at or below 15 to 1. Our operation plan filed with the Wisconsin OCI and other state insurance departments in connection with NMIC's applications for licensure includes the expectation that NMIH will downstream additional capital if needed so that NMIC does not exceed an 18 to 1 risk-to-capital ratio. We may in the future seek state insurance department approvals, as needed, of an amendment to NMIC's business plan to increase the permitted ratio to the Wisconsin regulatory maximum of 25 to 1 (or to whatever lower RTC may be required by the GSEs). If one or more states do not approve the change in our plan of operation, we may be at a competitive disadvantage compared to other MI companies that are not limited to these lower maximum risk-to-capital ratio requirements. If this were to occur our business could be adversely impacted.
Our underwriting and risk management policies and practices may not anticipate all risks and/or the magnitude of potential for loss as the result of unforeseen risks.
We have established underwriting and risk management policies and practices that seek to mitigate our exposure to borrower default risk in our insured loan portfolio by anticipating future risks and the magnitude of those risks. We believe the major factors that impact mortgage credit risk include but are not limited to the following:
|
•
|
the borrower's credit strength, including the borrower's credit history, debt-to-income ratios and cash reserves and the willingness of a borrower with sufficient resources to make mortgage payments when the mortgage balance exceeds the value of the home;
|
|
•
|
the loan product, which encompasses the LTV ratio, the type of loan instrument, including whether the instrument provides for fixed or variable payments and the amortization schedule, the type of property, the purpose of the loan and the interest rate;
|
|
•
|
origination practices of lenders;
|
|
•
|
the percentage coverage on insured loans;
|
|
•
|
the size of loans insured; and
|
|
•
|
the condition of the economy, including housing values and employment, in the geographic area in which the property is located.
|
We believe that, excluding other factors, claim incidence increases:
|
•
|
for loans with higher LTV ratios compared to loans with lower LTV ratios;
|
|
•
|
for loans with higher debt-to-income ratios;
|
|
•
|
for loans to borrowers with lower credit scores compared to loans to borrowers with higher credit scores;
|
|
•
|
during periods of economic contraction and housing price depreciation, including when these conditions may not be nationwide, compared to periods of economic expansion and housing price appreciation;
|
|
•
|
for adjustable rate mortgages (or, "ARMs") when the reset interest rate significantly exceeds the interest rate of loan origination;
|
|
•
|
for loans in which the original loan amount exceeds the GSEs' established conforming loan limit compared to loans below that limit; and
|
|
•
|
for cash out refinance loans compared to purchase or rate and term refinance loans.
|
There may be other types of loan characteristics relating to the individual loan or borrower that also affect the risk potential for a loan. In addition, the presence of multiple higher-risk characteristics in a loan materially increases the likelihood of a claim on such a loan unless there are other characteristics to lower the risk.
The frequency and severity of claims we incur will be uncertain and will depend largely on general economic conditions, including rates of unemployment and home prices. Given the uncertainties caused by the slow pace of economic recovery and recent instability in the housing and mortgage markets and, to the extent that a risk is unforeseen or is underestimated in terms of magnitude of loss, these policies and practices may not completely insulate us from the effects of those risks. If our risk management policies and practices do not correctly anticipate risk or the potential for loss we may underwrite business for which we have not charged
38
premium commensurate with the risk or we may establish our reserves at a rate that does not accurately approximate our actual ultimate loss payments. Either one of these could result in severe adverse material results.
Our insurance in force may be concentrated in specific geographic regions and could make our business highly susceptible to downturns in local economies, which could be detrimental to our financial condition.
We will seek to diversify our insured loan portfolio geographically; however, the availability of business might lead to concentrations in specific regions in the United States, which could make our business highly susceptible to economic downturns in these regions. As discussed below in Part II, Item 7, "
Management's Discussion and Analysis of Financial Condition and Results of Operations - Start-up Operations - New Business Writings,
" NMIC entered into a pool insurance agreement with Fannie Mae pursuant to which NMIC agreed to insure approximately 22,000 loans with approximately
28%
of the borrowers located in California. A deterioration in local or national economic conditions in the mortgage market and other economic conditions, including home prices, levels of unemployment and interest rates or an increase in default rates in specific geographical areas or generally could have a material adverse effect on our operating results and financial position.
Actual premiums and investment earnings may not be sufficient to cover claim payments and our operating costs.
We set premiums at the time a policy is issued based on our expectations regarding likely performance over the term of the policy. Our premiums are subject to approval by state regulatory agencies, which can delay or limit our ability to increase our premiums. Generally, we will not be able to cancel the MI coverage or adjust renewal premiums during the life of an MI policy. As a result, higher than anticipated claims generally will not be able to be offset by premium increases on policies in force or mitigated by our non-renewal or cancellation of insurance coverage. While we believe our initial capital, premiums and investment earnings will provide a pool of resources sufficient to cover expected loss payments and have made estimates regarding loss payments and potential claims, the ultimate number and magnitude of claims we experience cannot be predicted with certainty and the actual premiums and investment earnings may not be sufficient to cover losses and/or our operating costs. An increase in the number or size of claims, compared to what we anticipate, could adversely affect our operating results or financial condition. We may not be able to achieve the results that we expect, and there can be no assurance that losses will not exceed our total resources.
Adverse investment performance may affect our financial results and ability to conduct business.
Our investment portfolio consists primarily of highly rated debt obligations. Our investments are subject to market-wide risks and fluctuations, as well as to risks inherent in particular securities. Changing and unprecedented market conditions could materially impact the future valuation of securities in our investment portfolio, which may cause us to impair, in the future, some portion of those securities. Volatility or illiquidity in the markets in which we hold positions may cause certain other-than-temporary impairments within our portfolio, which could have a significant adverse effect on our liquidity, financial condition and operating results.
Income from our investment portfolio is one of our primary sources of cash flow to support our operations and claim payments. If we improperly structure our investments to meet those future liabilities or have unexpected losses, including losses resulting from the forced liquidation of investments before their maturity, we may be unable to meet those obligations. NMIC's investments and investment policies are subject to state insurance laws, which results in our portfolio being predominantly limited to highly rated fixed income securities. Interest rates on our fixed income securities are near historical lows. If interest rates rise above the rates on our fixed income securities, the market value of our investment portfolio would decrease. Any significant decrease in the value of our investment portfolio would adversely impact our financial condition.
In addition, compared to historical averages, interest rates and investment yields on highly rated investments have generally declined, which has the effect of limiting the investment income we can generate. We depend on our investments as a source of revenue, and a prolonged period of low investment yields would have an adverse impact on our revenues and could potentially adversely affect our operating results.
We may be forced to change our investments or investment policies depending upon regulatory, economic and market conditions, and our existing or anticipated financial condition and operating requirements, including the tax position, of our business. Our investment objectives may not be achieved. Although our portfolio consists mostly of highly-rated investments and complies with applicable regulatory requirements, the success of our investment activity is affected by general economic conditions, which may adversely affect the markets for credit and interest-rate-sensitive securities, including the extent and timing of investor participation in these markets, the level and volatility of interest rates and, consequently, the value of fixed-income securities.
39
Estimating future claims and the timing of future claims is inherently uncertain and requires significant judgment, and as a result, our claim estimates may vary widely and are dependent on a number of factors.
Estimating future claims and the timing of future claims is inherently uncertain and requires significant judgment. Our expectations regarding future claims may change significantly over time. Our future claims and ability to meet applicable capital adequacy requirements could be affected by a variety of factors. Such factors include, among others:
|
•
|
current and future economic conditions, including continued slow economic recovery from the most recent recession or the potential of the U.S. economy to reenter a recessionary period, borrower access to credit, levels of unemployment, interest rates and home prices;
|
|
•
|
the level of defaults, the claim rates on loans in default and the claim severity within NMIC's mortgage insurance portfolio;
|
|
•
|
potentially negative economic changes in geographic regions where our insurance in force may be more concentrated;
|
|
•
|
the rate at which our MI portfolio remains in force (persistency rate);
|
|
•
|
future levels of new insurance written (and the profitability of such business), which will impact future premiums written and earned and future losses;
|
|
•
|
the performance of our investment portfolio and the extent to which issuers of the fixed-income securities that we own default on principal and interest payments or the extent to which we are required to impair portions of the portfolio as a result of deteriorating capital markets;
|
|
•
|
our limited operating history, which adds to the speculative nature of our loss estimates; and
|
|
•
|
our operating performance for at least the next few years, which likely will continue to be an unreliable indicator of future performance due to the nature of the MI business and our expectation that our claims incidence is expected to be lower as a result of the typical distribution of claims over the life of a book resulting in fewer defaults during the first two to three years after loans are originated.
|
Many of these factors are outside of our control and difficult to predict. In addition, some of these factors are subjective and not subject to specific quantitative standards. Due to the inherent uncertainty and significant judgment involved in the numerous assumptions required in order to estimate our losses, our loss estimates may vary widely. If we incorrectly estimate the factors that drive our losses, our business, financial condition and operating results could be adversely impacted.
We will establish loss reserves when we are notified that a loan we insure is in default for at least 60 days, based on management's estimate of claim rates and claim sizes, which will be subject to uncertainties and will be based on assumptions about certain estimation parameters that may be volatile. As a result, our actual ultimate claim payments may materially exceed the amount of our loss reserves.
We are a new company that recently commenced transacting mortgage insurance in April 2013. We do not anticipate a material level of losses (relative to written premiums or stockholders' equity) in the first few years of our operations. Our practice, consistent with United States generally accepted accounting principles (“GAAP”) for the MI industry, will be to establish loss reserves only for loans at least 60 days in default. We will also establish reserves for estimated losses incurred on loans that have been in default for at least 60 days that have not yet been reported to us by the servicers (this is often referred to as incurred but not reported or “IBNR”).
The establishment of loss and IBNR reserves is subject to inherent uncertainty and will require significant judgment by management. We plan to establish loss reserves using our best estimates of claim rates,
i.e.
, the percent of loan defaults that ultimately result in claim payments, and claim amounts,
i.e.
, the dollar amounts required to settle claims, to estimate the ultimate losses on loans reported to us as being at least 60 days in default as of the end of each reporting period. We will estimate IBNR by analyzing historical lags in default reporting to determine a specific number of IBNR claims in each reporting period. Our estimates of claim rates and claim sizes will be strongly influenced by prevailing economic conditions, for example current rates or trends in unemployment, housing price appreciation and/or interest rates, and our best judgments as to the future values or trends of these macroeconomic factors. If prevailing economic conditions deteriorate suddenly and/or unexpectedly, our estimates of loss reserves could be materially understated, which may adversely impact our financial condition and operating results. Because loss and IBNR reserves are based on estimates and judgments, there can be no assurance that even in a stable economic environment, actual claims paid by us will not be substantially different than our loss and IBNR reserves for such claims. Our business, operating results and financial condition will be adversely impacted if, and to the extent, our actual losses are greater than our loss and IBNR reserves.
40
We may be required to establish a premium deficiency reserve if the net present value of our premiums and reserves is less than the net present value of our loss payments and expenses
In addition to establishing loss reserves for loans in default, under GAAP, we are required to establish a premium deficiency reserve, or PDR, for our mortgage insurance products if the amount by which the net present value of expected future losses for a particular product and the expenses for such product exceeds the net present value of expected future premiums and existing reserves for such product. We evaluate whether a premium deficiency exists at the end of each fiscal quarter. Our evaluation of premium deficiency is based on our best estimates of future losses, expenses and premiums. This evaluation depends upon many significant assumptions, including assumptions regarding future macroeconomic conditions, and therefore, is inherently uncertain and may prove to be inaccurate. There can be no assurance that premium deficiency reserves will not be required in future periods after we commence writing insurance business. If this were to occur, our business, financial condition and operating results would be adversely impacted.
As a condition of obtaining approval from Freddie Mac to be a qualified mortgage insurer, we are required to obtain an insurance financial rating by July 31, 2015, and if we fail to obtain a rating by the deadline, we may lose our Freddie Mac approval status. Further, our failure to obtain a rating may negatively impact our ability to attract and retain certain lenders as customers or to transact business in the private label (non-GSE) mortgage-backed securities (“MBS”) market.
As a condition of our approval from Freddie Mac to be a qualified mortgage insurer, we are required to obtain a rating from a Nationally Recognized Statistical Rating Organization by July 31, 2015. While we have commenced the process of obtaining such a rating, we are still in the exploratory phase and have not yet engaged any particular rating agency to obtain a rating. If we fail to obtain a rating by July 31, 2015, we may lose our Freddie Mac approval status, which would adversely affect our business, financial condition and operating results.
We believe many lenders who hold mortgages in portfolio and choose to obtain MI on the loans may assess a mortgage insurer's financial strength rating as a factor in their choice of an MI provider. As a result, failure to obtain a rating may impact our ability to attract and/or retain certain lenders as customers. In addition, if MI is again utilized as a form of credit enhancement in connection with the issuance of private-label MBS, our failure to obtain a rating or inability to obtain a rating better than our competitors could harm our prospects of transacting business in the private label MBS market.
If we are unsuccessful in our efforts to attract, train and retain qualified personnel, or to retain those personnel we have already recruited, our business may be adversely affected.
We believe that our growth and future success will depend in large part on the services and skills of our management team and our ability to motivate and retain these individuals and other key personnel, which include members of our Finance, Sales, Legal, Risk, Insurance Operations and IT departments. We intend to pay competitive salaries, bonuses and equity-based rewards in order to attract and retain such personnel, but there can be no assurance that we will be successful in such endeavors. The loss of key personnel, or the inability to recruit and retain qualified personnel in the future, could have an adverse effect on our business, financial condition or operating results.
The mix of business we write affects our revenue stream and the likelihood of losses occurring.
Even when housing values are stable or rising, mortgages with certain characteristics have higher probabilities of claims. These characteristics include loans with LTV ratios over 95% (or in certain markets that have experienced declining housing values, over 90%), FICO credit scores, with lower scores tending to have higher probabilities of claims, or higher total debt-to-income ratios, as well as loans having combinations of these higher risk factors and thus have layered risk. In general, we charge higher premiums for loans with higher risk characteristics. There is, however, no guarantee that our premiums will compensate us for the losses we incur on loans with higher risk characteristics. From time to time, in response to market conditions, we may change the types of loans that we insure and the guidelines under which we insure them, and in doing so, the concentration of insured loans with higher risk characteristics in our portfolio may increase. In addition, we may make exceptions to our underwriting guidelines on a loan-by-loan basis and for certain customer programs. We expect any exceptions to be very limited and on a case-by-case basis. Even though underwriting that falls outside of our guidelines would be on a case-by-case basis, we could incur greater than expected claims and claim payments on this business, which could negatively impact our revenues and operating results.
41
We may not be able to effectively manage our growth.
Our future operating results depend to a large extent on our ability to successfully manage our growth. Our growth has placed, and it may continue to place, significant demands on our operations and management. Our current plan is dependent upon our ability to:
|
•
|
continue to implement and improve our operational, credit, financial, management and other internal risk controls and processes and our reporting systems and procedures in order to manage a growing number of client relationships;
|
|
•
|
scale our technology platform; and
|
|
•
|
attract and retain management talent.
|
We may not successfully implement improvements to, or integrate, our management information and control systems, procedures and processes in an efficient or timely manner and may discover deficiencies in existing systems and controls. In particular, our controls and procedures must be able to accommodate an increase in loan volume in various markets and the infrastructure that comes with new customers. If we are unable to manage future expansion in our operations, we may experience compliance and operational problems, be required to slow the pace of growth, or have to incur additional expenditures beyond current projections to support such growth, any one of which could have an adverse effect on our business, financial condition or operating results.
We rely on our systems and employees, and any errors or fraud could materially and adversely affect us.
We are exposed to many types of operational risk, including the risk of fraud by employees and outsiders, clerical record-keeping errors and transactional errors. Our business is dependent on our employees as well as third parties to process a large number of increasingly complex transactions. We could be materially and adversely affected if one of our employees causes a significant operational breakdown or failure, either as a result of human error or where an individual purposefully sabotages or fraudulently manipulates our operations or systems. Third parties with which we do business also could be sources of operational risk to us, including breakdowns or failures of such parties' own systems or employees. Any of these occurrences could result in our diminished ability to operate our business, potential liability to customers, reputational damage and regulatory intervention, which could result in a material adverse effect on our financial position and operating results.
We are dependent on our information technology and telecommunications systems and third-party servicer providers, and termination of third-party contracts, systems failures, interruptions, or breaches of security could have a material adverse effect on us.
Our business is highly dependent on the successful and uninterrupted functioning of our information technology and telecommunications systems and third-party service providers. We outsource many of our major information technology functions, including for the development and operation of our enterprise technology platform, data center hosting and management, email and collaboration, and human resource systems. The failure of any of these third parties to perform and/or deliver on a timely basis, or the failure of these systems, either individually or collectively, or the termination of a third-party software license or service agreement on which any of our systems is based, could interrupt our operations. Because our information technology and telecommunications systems interface with and depend on third parties, we could experience service denials if demand for such services exceeds capacity or such third-party systems fail or experience interruptions. If significant, sustained or repeated, a system failure or service denial could compromise our ability to operate effectively, damage our reputation, result in a loss of customer business, and/or subject us to additional regulatory scrutiny and possible financial liability, any of which could have an adverse effect on our business, financial condition and operating results.
The security of our information technology may be compromised and confidential information could be inappropriately disclosed.
As part of our business, our computer systems process and retain large amounts of personal information of the borrowers whose mortgages we insure. The security of our computer systems and networks, and those functions that we may outsource, may be subject to cyber threats that could result in failures, unauthorized access or disruptions in our business. Additionally, our employees and vendors may use portable computers or mobile devices which can be stolen, lost or damaged. Despite our efforts to ensure the integrity of our systems and information, it is possible that we may not be able to anticipate or to implement effective preventive measures against all cyber threats, particularly because the techniques used change frequently or are not recognized until launched, and because security attacks can originate from a wide variety of sources. Those parties may also attempt to fraudulently induce employees, customers or other users of our systems to disclose sensitive information in order to gain access to our data or that of our customers. We maintain technology errors and omissions coverage to limit our exposure in the event an incident occurs. This insurance provides coverage for (i) claims related to, among other things, unauthorized network or computer access, unintentional disclosure or misuse of personally identifiable information in our possession, unintentional failure to disclose a breach and (ii) certain
42
costs related to privacy notification, crisis management and business interruption. While we maintain such coverage, any compromise of the security of our information technology systems that results in the loss of personally identifiable information may result in loss of customer business, would be costly and time-consuming, could expose us to liability for damages, harm our reputation, subject us to regulatory scrutiny or expose us to civil litigation, any of which could have an adverse effect on our business, financial condition and operating results. Further, our insurance coverage may be inadequate to cover any claims or costs associated with an incident that may occur in the future.
If servicers fail to adhere to appropriate servicing standards or experience disruptions to their businesses, our losses could unexpectedly increase.
We depend on reliable, consistent third-party servicing of the loans that we insure. Among other things, our mortgage insurance policies require our insureds and their servicers to timely submit premium and monthly insurance-in-force and default reports and utilize commercially reasonable efforts to limit and mitigate loss when a loan is in default. If these servicers fail to adhere to such servicing standards and fail to limit and mitigate loss when appropriate, our losses may unexpectedly increase. In addition, if one or more servicers were to experience adverse effects to its business, such servicers could experience delays in their reporting and premium payment requirements. Without reliable, consistent third-party servicing, our insurance subsidiaries may be unable to correctly record new loans as they are underwritten, receive and process payments on insured loans and/or properly recognize and establish loss reserves on loans when a default exists or occurs but is not reported to us. Significant failures by large servicers or disruptions in the servicing of mortgage loans covered by our insurance policies would adversely impact our business, financial condition and operating results.
The occurrence of natural or man-made disasters or a pandemic could adversely affect our business, financial condition and operating results.
We could be exposed to various risks arising out of natural disasters, including earthquakes, hurricanes, floods and tornadoes and man-made disasters, including acts of terrorism, military actions and pandemics. For example, a natural or man-made disaster or a pandemic could lead to unexpected changes in persistency rates as policyholders and contract holders who are directly or indirectly affected by the disaster may be unable to meet their contractual obligations, such as payment of premiums on our insurance policies, interest payments due on our invested assets, and mortgage payments on loans insured by our MI policies. The continued threat of terrorism may cause significant volatility in global financial markets, and a natural or man-made disaster or a pandemic could trigger an economic downturn in the areas directly or indirectly affected by the disaster. These consequences could, among other things, result in a decline in business and increased claims from those areas, as well as an adverse effect on home prices in those areas, which could result in increased loss experience in our business. Disasters or a pandemic also could disrupt public and private infrastructure, including communications and financial services, which could disrupt our normal business operations. In addition, a disaster or a pandemic could adversely affect the value of the assets in our investment portfolio if it affects companies' ability to pay us principal or interest on their securities.
Our holding company structure and certain regulatory and other constraints, including adverse business performance, could affect our ability to satisfy our obligations and potentially require us to raise more capital.
We serve as the holding company for our insurance subsidiaries, which are mono-line insurance companies restricted to writing residential MI business only, and we do not have any significant operations of our own. As a result, our principal sources of funds will be income from our investment portfolio, dividends and other distributions from our insurance subsidiaries, including permitted payments under our tax and expense-sharing arrangements, and funds that may be raised from time-to-time in the capital markets. Our dividend income is limited to upstream dividend payments from our mono-line insurance subsidiaries, which dividends are restricted by agreements with the GSEs and various state insurance departments and by Wisconsin law. Under agreements with the GSEs, we are not permitted to extract dividends from our insurance subsidiaries until December 31, 2015. In addition, NMIC has agreed with various state insurance regulators to restrict dividend payments until January 2016. In general, dividends in excess of prescribed limits are deemed “extraordinary” and require approval of the Wisconsin OCI. For a further discussion of state insurance regulatory dividend limitations, see above in Item 1, “
Business - Regulation - U.S. Mortgage Insurance Laws - State Insurance Regulation
.” As a result of these dividend limitations, we will not receive dividend income from our subsidiaries for several years, if at all. In addition, the expense-sharing arrangements between us and our insurance subsidiaries, as amended, have been approved by the Wisconsin OCI, but such approval may be revoked at any time. If this were to occur, payments to us could be curtailed or limited which would adversely impact our business and operating results.
Our principal liquidity demands include funds for: (i) the payment of certain corporate operating expenses; (ii) capital support for our MI subsidiaries; and (iii) potential payments to the Internal Revenue Service ("IRS") and local taxing and licensing authorities. Under the terms of the GSE Approvals, we are required to make additional capital contributions to NMIC in order to support a minimum surplus of $150 million and maintain a risk-to-capital ratio under 15 to 1 through December 31, 2015. We could
43
be required to provide additional capital support for NMIC and Re One if additional capital is required pursuant to insurance laws and regulations or by the GSEs. If we were unable to meet our obligations, our insurance subsidiaries could lose GSE Approval and/or be required to cease writing business in one or more states, which would adversely impact our business, financial condition and operating results.
Our future capital requirements depend on many factors, including our ability to successfully write new business and establish premium rates at levels sufficient to cover losses, expenses and allow us to achieve profitability, which may be delayed or never occur. To the extent that the funds generated by our ongoing operations and initial capitalization are insufficient to fund future operating requirements or to achieve a return on capital attractive to investors, we may need to raise additional funds, including through equity or debt financings or reinsurance, or curtail our growth. We cannot be sure that we will be able to raise equity or debt financing on terms favorable to us and our stockholders and in the amounts that we require, or at all. If we cannot obtain adequate capital, our business, financial condition and operating results could be adversely affected.
We, as well as certain of our officers, are party to a lawsuit, which if determined adverse to us and our officers could have an adverse effect on our financial condition and operating results.
We, as well as our Chief Executive Officer, Chief Financial Officer, Chief Sales Officer and Vice President of Sales Operations, Analytics & Planning, are defendants in a lawsuit titled:
Germaine L. Marks, as Receiver of PMI Mortgage Insurance Co. , et al v. NMI Holdings, Inc. et al.,
filed on August 8, 2012 in California Superior Court, Alameda County (the "PMI Complaint"). The PMI Complaint, as amended, alleges breach of fiduciary duty, breach of loyalty, aiding and abetting breach of fiduciary duty and loyalty, misappropriation of trade secrets, conversion, breach of proprietary information agreement, breach of separation agreement, intentional interference with contractual relations and unfair competition. The lawsuit seeks injunctive relief as well as unspecified monetary damages. We and the individual defendants believe these claims are without merit and have filed answers denying all allegations. The court has set the trial date for September 29, 2014.
On January 30, 2014, Arch announced the closing of its acquisition of CMG and certain assets of PMI Mortgage Insurance Co. ("PMI"). The terms of the February 7, 2013 Asset Purchase Agreement ("APA") between Arch and PMI provide that effective as of the closing of that transaction, PMI shall transfer and assign to Arch all causes of action being pursued in the PMI Complaint. The APA further provides that within thirty (30) days after the closing of the transaction, Arch shall have its attorney file appropriate pleadings and other documents and instruments with the court requesting that PMI be removed as a party plaintiff in the PMI Complaint and that Arch be substituted as the real party in interest. Although Arch has not yet filed any such request with the Court, the plaintiff is now described in pleadings as “Plaintiff and Real Party in Interest Arch U.S. MI Services, Inc.”
There is no assurance that we and the individual defendants will prevail in the lawsuit. If the lawsuit is determined adversely to us, the court could grant injunctive relief to the plaintiffs preventing NMIC from conducting insurance operations and/or subject us to significant monetary damages. In addition, if the lawsuit is determined adversely to any of our employees, we may be required to remove and replace those employees under the terms of agreements NMIC and/or NMIH entered into with each of the Alabama Department of Insurance, the Florida Office of Insurance Regulation, the Texas Commissioner of Insurance and the New York State Department of Financial Services, as a condition of NMIC obtaining certificates of authority in those states. If we were required to replace any of our employees, our business and reputation could be significantly impaired, which could result in an adverse effect on our financial position and operating results.
Risk Factors Relating to the Mortgage Insurance Industry and Its Regulation
The implementation of the Basel III Capital Accord may affect the use of MI by and, our ability to conduct business with, certain banks.
In 1988, the Basel Committee on Banking Supervision developed the Basel Capital Accord (“Basel I”), which set out international benchmarks for assessing banks' capital adequacy requirements. In June 2005, the Basel Committee issued an update to Basel I (as revised in November 2005, “Basel II”), which, among other factors, governs the capital treatment of MI purchased by domestic and international banks in respect of their origination and securitization activities. In November 2010, the United States agreed to a new capital framework known as Basel III. This new capital framework will replace the Basel II capital rules, which have not yet been implemented for U.S. depository institutions or holding companies. The Basel III framework will apply to the 10 to 12 largest U.S. banking organizations, as well as banking companies that have significant international operations. It may also be imposed on non-banking financial companies that are determined by the relevant regulators to present systemic risks to the U.S. financial system. The Basel III framework refines the Basel II risk-based structure by requiring the use of highly stressed scenarios in determining the appropriate levels of risk undertaken by banks, and it will also increase the required minimum capital ratios. The Basel III framework restricts the instruments that can count toward meeting the capital requirements, placing greater emphasis on common equity and retained earnings. Finally, Basel III will impose a new minimum liquidity standard on banking organizations.
44
The phase in period for the Basel III regime for larger banking organizations will begin in 2014 and for community banks in 2015. The final regulations increase the amount of capital and the quality of the capital required to be held by banks. In addition, the capital rules will continue to risk-weight assets based on internal models that use inputs such as the probability of default and the bank's expected loss given a default. The final version of the regulations continues the current treatment for the risk weighting of residential mortgage assets and the treatment of mortgage insurance as reducing the risk weighting on mortgages where the borrower has made a down payment of less than 10% of the value of the residential property. In addition, the final regulations increase the risk weighting for mortgage servicing assets held by banks and require the mortgage servicing assets above certain levels be deducted from the calculation of Tier I equity. Since most low down payment mortgages originated today are either sold to the GSEs or insured by the FHA or guaranteed by the VA, we cannot predict what, if any, impact to the MI industry the Basel III regulations will have. Since a significant percentage of the mortgages insured by the MI industry are serviced by banks or bank-owned mortgage companies, the changes in risk weighting for mortgage servicing assets and the deductions from Tier I equity capital for mortgage servicing assets above certain levels could cause shifts in the amounts of mortgages serviced by banks and bank affiliates or subsidiaries relative to non-banking organizations. It is difficult to predict the impact these shifts may have on the quality of the servicing of insured mortgages or the ultimate impact on the MI industry.
Implementation of the Dodd-Frank Act could negatively impact private mortgage insurers and the amount of insurance they can write, including if the definition of Qualified Residential Mortgage (“QRM”) results in a reduction of the number of low down payment loans available to be insured.
The Dodd-Frank Act, enacted by Congress in July 2010, expands federal oversight of consumer financial products and services, including mortgage loans. The Dodd-Frank Act established the CFPB as the central federal supervisory, rulemaking and enforcement regulator with jurisdiction over bank and non-bank providers of consumer financial products and services. The Dodd-Frank Act also authorized the formation of the Federal Insurance Office, charging it with, among other things, monitoring all aspects of the insurance industry (excluding certain insurance lines other than MI), including the identification of gaps in regulation of insurers that could contribute to financial crisis. As discussed below in Part II, Item 7, "
Management's Discussion and Analysis of Financial Condition and Results of Operations - Factors Expected to Affect Results as our Mortgage Insurance Operations Grow - Qualified Residential Mortgage Rule,
" the Dodd-Frank Act requires certain federal regulators to promulgate regulations providing for minimum credit risk-retention requirements in securitizations of residential mortgage loans that do not meet the definition of “qualified residential mortgages” (QRM). In March 2011, federal regulators issued the proposed credit risk retention rule, which the regulators re-proposed with certain revisions on August 28, 2013. The initial proposed rule suggested maximum LTV ratios, along with other restrictions such as to borrowers' debt-to-income ratios, and did not give consideration to MI in computing LTV. The re-proposed rule did not carry forward the minimum LTV requirements and other specific restrictions. Instead, the federal regulators proposed that whether a particular loan transaction is a QRM, and thus not subject to the credit risk retention requirement, should be determined by reference to the “qualified mortgage” (QM) rule under the Truth in Lending Act and Regulation Z. That is, if a residential mortgage loan is a QM loan, the loan would be considered a QRM loan. The federal regulators requested comment on whether the common definition of QRM should be limited to “safe harbor” QM loans or QM loans that satisfy either the “safe harbor” or “rebuttable presumption” QM standard.
We, and the MI industry, continue to evaluate the expected impact of the re-proposed QRM rule on our industry, and such potential impact depends on, among other things, (i) the final definition of QRM and its requirements for LTV, loan features and debt-to-income ratio, (ii) whether the final definition will affect the size of the high-LTV mortgage market and (iii) the extent to which the mortgage purchase and securitization activities of the GSEs become a smaller portion of the overall mortgage finance market and securitizations subject to the risk retention requirements and the QRM exemption, become a larger part of the mortgage market. If the final QRM rule adopted by the federal regulators materially reduces the size of the high-LTV mortgage market and therefore the population of loans eligible for MI, our business could be adversely affected.
Under this part of the re-proposed rule, because of the capital support provided by the U.S. government, the GSEs during their conservatorship would not be subject to the Dodd-Frank Act credit risk retention requirements. Changes in the conservatorship status of the GSEs or capital support provided to the GSEs by the U.S. government could impact the manner in which the credit risk retention rules apply to the GSEs. Changes in final regulations regarding treatment of GSE eligible mortgage loans could impact the manner in which the credit risk retention rule applies to GSE securitizations. If, in the future, the GSEs become subject to the credit risk retention requirements, or if the portion of the mortgage market that the GSEs either purchase
or securitize diminishes, the MI industry, as well as the amount of new insurance that we may write, may be adversely affected.
The federal regulators in the re-proposal presented an alternative approach to defining QRM, referred to as “QM plus.” Under this alternative, only certain types of residential mortgage loans, such as first-lien loans secured by 1-to-4 family principal dwelling units, could be considered QRM transactions. To be eligible for QRM status, the loan would have to be free of certain loan terms and have an LTV at closing that does not exceed 70%. Junior liens under the QM plus alternative would be permitted only in non-purchase money loan transactions and if permitted, would need to be included in the 70% LTV calculation. Under this alternative,
45
credit insurance, including MI, would not reduce the minimum LTV requirement. In addition, loans that achieve a QM status because they meet the CFPB's QM provisions for GSE-eligible transactions would not be considered QRM transactions under the alternative proposal. If the federal regulators adopt a final QRM rule that is similar to the QM plus proposal and such final rule does not give consideration to MI in computing LTV, the attractiveness of MI may be reduced, and the MI industry and our business could be adversely impacted.
Our business prospects and operating results could be adversely impacted if, and to the extent that, the Consumer Financial Protection Bureau's final ability to repay rules defining a qualified mortgage reduce the size of the origination market.
The Dodd-Frank Act established the CFPB to regulate the offering and provision of consumer financial products and services under federal law, including residential mortgages. As discussed below in Part II, Item 7, "
Management's Discussion and Analysis of Financial Condition and Results of Operations - Factors Expected to Affect Results as our Mortgage Insurance Operations Grow - Qualified Mortgage Rule
," the Dodd-Frank Act authorized the CFPB to issue regulations governing a loan originator's determination that, at the time a loan is originated, the consumer has a reasonable ability to repay the loan ("ATR"). The CFPB issued final ATR regulations on January 10, 2013 and amendments on May 29, 2013, July 10, 2013 and September 13, 2013 implementing detailed requirements on how lenders must establish a borrower's ability to repay a covered mortgage loan. The ATR rule went into effect for residential mortgage loan applications received on or after January 10, 2014.
A subset of mortgages within the ATR rule are known as "qualified mortgages" ("QMs"). The Dodd-Frank Act provides a statutory presumption that a borrower will have the ability to repay a loan if the loan has the characteristics that meet the definition of QM, potentially mitigating the risk of liability of the creditor and assignee of the creditor for special ATR remedies under the Truth in Lending Act. One of the characteristics of a lawful QM transaction is that the "points and fees" payable in connection with the transaction should not exceed 3% of the total loan amount. The ATR rule provides that a covered first mortgage loan meeting the QM definition bearing an annual percentage rate no greater than 1.5% plus a prevailing market rate is regarded as complying with ATR requirements, while if a loan bears an annual percentage rate of greater than 1.5% plus a prevailing market rate, it will carry a rebuttable presumption of compliance with the ATR rule. We expect that most lenders will be reluctant to make loans that do not qualify as QMs because they will not be entitled to such protection against civil liability under the Dodd-Frank Act. As a result, we believe ATR regulations will have a direct impact on establishing a subset of borrowers who can meet the regulatory standards and will have a direct effect on the size of the residential mortgage market in any given year once the regulations become effective. We expect that the majority of our new insurance written will be on loans that will meet the QM definition, and therefore do not believe such limitations would materially affect our business. However, it is difficult to predict with any certainty how lenders' origination practices will change as a result of the QM rule and whether any such changes would have a negative impact on the MI industry. Our business prospects and operating results could be adversely impacted if, and to the extent that, the QM regulations reduce the size of the origination market.
In addition, there are certain aspects of the ATR regulations that could have an adverse impact on mortgage insurers. Under the QM regulations, if the lender requires the borrower to purchase MI, then the MI premiums are included in monthly mortgage costs in determining the borrower's ability to repay the loan. The demand for MI may decrease if, and to the extent that, monthly MI premiums make it less likely that a loan will qualify for QM status, especially if MI alternatives (discussed below in "
—
The amount of insurance we may be able to write could be adversely affected if lenders and investors select alternatives to MI."
) are relatively less expensive than MI.
In addition, under the QM regulations, mortgage insurance premiums that are payable at or prior to consummation of the loan are includible in points and fees
unless
, and to the extent that, such up-front premiums (“UFP”) are (i) less than or equal to the UFP charged by the FHA,
and
(ii) are automatically refundable on a
pro rata
basis upon satisfaction of the loan. (The FHA currently charges UFP of 1.75% on all residential mortgage loans, but it has the authority to change its UFP from time to time.) The QM rule includes a limitation on points and fees in excess of 3% of the total loan amount. As inclusion of MI premiums towards the 3% cap will reduce the capacity for other points and fees in covered transactions, mortgage originators may be less likely to purchase single premium MI products to the extent that the associated premiums are deemed to be points and fees. As a result, we believe that the QM rule may increase demand for monthly and annual MI products relative to single premium products, which may have an adverse impact on our business, financial condition and operating results to the extent that profitability of single premium products exceeds that of monthly and annual MI products.
46
Changes in the business practices of the GSEs, including a decision to modify the mortgage insurer eligibility requirements or decrease or discontinue the use of MI, federal legislation that changes their charters or a restructuring of the GSEs could reduce our revenues or increase our losses.
We currently expect that the significant majority of our insurance written will be on loans sold to Fannie Mae and Freddie Mac. As discussed above in Item 1,
"Business - Overview of the Private Mortgage Insurance Industry - GSEs,"
the requirements and practices of the GSEs impact the operating results and financial performance of MI companies. Changes in the charters or business practices of Freddie Mac or Fannie Mae could reduce the number of mortgages they purchase that are insured by us and consequently diminish our franchise value. The GSEs could be directed to make such changes by the Federal Housing Finance Agency ("FHFA"), which was appointed as their conservator in September 2008 and has the authority to control and direct the operations of the GSEs.
The appointment of the FHFA as conservator may increase the likelihood that the business practices of the GSEs change in ways that could negatively impact the mortgage insurance industry and have an adverse effect on us. Each GSE maintains qualified mortgage insurer eligibility requirements, which they have been in the process of revising since mid-2010. The FHFA has announced its intent that the GSEs achieve uniformity in their respective requirements and that the requirements be finalized in the near term future. Although the GSEs and FHFA have not publicly commented on the final content of the revised mortgage insurer requirements, we believe they will include a new capital adequacy framework. Under the terms of our GSE Approval, the GSEs have already imposed certain capitalization, operational and reporting conditions on NMIC. It is difficult to predict whether any changes the GSEs might impose in their revised mortgage insurer eligibility requirements will have an effect on our business. See also Part II, Item 7, "
Management's Discussion and Analysis of Financial Condition and Results of Operations - Factors Expected to Affect Results as our Mortgage Insurance Operations Grow - GSE Reform
."
In addition, in connection with the FHFA's mandate that the GSEs align their mortgage insurer eligibility standards, the GSEs have imposed minimum standards for mortgage insurer master policies, including standards related to limitations on rescission rights. The new standards will be implemented in 2014, and to comply with the GSEs' master policy requirements we and our competitors have filed new master policies with state insurance regulators. As discussed above, our master policy includes coverage terms that we believe are more favorable to our customers than our competitors', particularly our rescission relief provisions. While we do not believe the GSEs' master policy standards will require other mortgage insurers to provide the same coverage terms as we do, the fact that the GSEs have imposed master policy standards could make it more difficult for us to distinguish ourselves from our competitors.
The placement of the GSEs into the conservatorship of the FHFA has also increased the likelihood that the U.S. Congress will act to address the role and purpose of the GSEs in the U.S. housing market and potentially legislate structural and other changes to the GSEs and the functioning of the secondary mortgage market. In February 2011, the U.S. Department of the Treasury reported its recommendations regarding options for ending the conservatorship of the GSEs, and while it does not provide any definitive timeline for GSE reform, it does recommend substantially reducing the government's footprint in housing finance.
Since 2011, there have been numerous legislative proposals, including in the current Congressional session, that are intended to wind down the GSEs in a piecemeal fashion. Among other changes, these bills, if ultimately enacted, would gradually reduce the GSE maximum portfolio size, prohibit the GSEs from engaging in any new activities or businesses and repeal the GSE affordable housing goals. In addition, there were several comprehensive housing finance reform proposals introduced in Congress. Each of these proposals has been designed to eliminate the GSEs, while most of them would also replace the GSEs with a new mortgage financing system. The proposals vary greatly with regard to the government's role in the housing market, and more specifically, with regard to the existence of an explicit or implicit government guarantee. During the third fiscal quarter of 2013, President Obama endorsed bipartisan mortgage reform legislation pending in the Senate and in the House of Representatives which would, as part of the proposed bills, eliminate and/or replace Fannie Mae and Freddie Mac and have private investors (in lieu of the government) bear the risk undertaken by Fannie Mae and Freddie Mac. This legislation currently pending in Congress would have differing impacts on the role of the GSEs in the housing finance market, including their elimination, and the current role of mortgage insurance as credit enhancement, including its reduction or elimination, all of which could have an adverse effect on our revenue, operating results or financial condition. We cannot predict whether any mortgage reform legislation will be passed by the Senate or the House of Representatives, the changes such reform would introduce or the effect the legislation would have on private mortgage insurers including NMIC.
As a result of the matters referred to above, it is uncertain what role the GSEs, FHFA and private capital, including MI, will play in the domestic residential housing finance system in the future or the impact of any such changes on our business. In addition, the timing of the impact on our business is uncertain. Any changes to the charters or statutory authorities of the GSEs would require Congressional action to implement, and it is difficult to estimate when Congressional action would be final and how long any associated phase-in period may last.
47
The U.S. MI industry is subject to regulatory risk and has been subject to increased scrutiny by insurance and other regulatory authorities.
The U.S. MI industry and our insurance subsidiaries are and will be subject to substantial federal and state regulation, which has increased in recent years as a result of the recent financial crisis. Increased federal or state regulatory scrutiny could lead to new legal precedents, new regulations or new practices, or regulatory actions or investigations, which could adversely affect our financial condition and operating results. In addition, given the recent significant losses incurred by many insurers in the mortgage and financial guaranty industries, our insurance subsidiaries may be subject to heightened scrutiny by insurance regulators. State insurance regulatory authorities could take actions, including making changes to capital requirements, that could have a material adverse effect on us. Further, failure to comply with the various federal and state regulations promulgated by federal consumer protection authorities and state insurance regulatory authorities could lead to enforcement or disciplinary action, including the imposition of penalties and the revocation of our authorization to operate. See above in Item 1, “
Business - Regulation.
”
The NAIC has formed a working group to explore, among other things, whether the risk-to-capital requirements applicable to mortgage insurers should be overhauled. We, along with other MI companies are working with the Mortgage Guaranty Insurance Working Group of the Financial Condition (E) Committee of the NAIC (the “Working Group”). The Working Group will determine and make a recommendation to the Financial Condition (E) Committee of the NAIC as to what changes, if any, the Working Group believes are necessary to the solvency regulation of MI companies, including changes to the Mortgage Guaranty Insurers Model Act (Model #630). The Working Group is in the early stages of discussion and the ultimate outcome of these discussions and any potential actions taken by the NAIC cannot be predicted at this time. If the Working Group proposes that the NAIC adopt more stringent capital requirements, this could ultimately lead to NMIC being obligated to hold more capital for its insured business, which would reduce our profitability compared to the profitability we expect under the existing capital requirements.
A downturn in the U.S. economy or a decline in the value of borrowers' homes from their value at the time their loans close may result in more homeowners defaulting and could increase our losses.
Losses result from events that reduce a borrower's ability to continue to make mortgage payments, such as increasing unemployment and whether the home of a borrower who defaults on his or her mortgage can be sold for an amount that will cover unpaid principal and interest and the expenses of the sale. In general, favorable economic conditions reduce the likelihood that borrowers will lack sufficient income to pay their mortgages and also favorably affect the value of homes, thereby reducing and in some cases even eliminating a loss from a mortgage default. Deterioration in economic conditions generally increases the likelihood that borrowers will not have sufficient income to pay their mortgages and can also adversely affect housing values, which in turn can decrease the willingness of borrowers with sufficient resources to make mortgage payments to do so when the mortgage balance exceeds the value of the home. Housing values may decline even absent deterioration in economic conditions due to declines in demand for homes, which in turn may result from changes in buyers' perceptions of the potential for future appreciation, rising interest rates, restrictions on mortgage credit due to more stringent underwriting standards, liquidity issues affecting lenders or other factors, such as the phase-out of the mortgage interest deduction. In recent years, the residential mortgage market in the United States experienced a variety of worsening economic conditions, and housing values have only recently begun to stabilize. If our loss projections are inaccurate, our loss payments could materially exceed our recorded loss reserves resulting in an adverse effect on our financial position and operating results. Also, if unemployment rates materially exceed and home price trends materially differ from our forecasts, our underwriting standards may prove inadequate to shield us from materially increased losses.
If interest rates decline, house prices appreciate or mortgage insurance cancellation requirements change, the length of time that our policies remain in force could decline and result in a decrease in our actual versus projected revenue.
In each year, most of our premiums will be from insurance that has been written in prior years. As a result, the length of time insurance remains in force,
which is also generally referred to as persistency, is a significant determinant of our revenues. The factors affecting the length of time our insurance remains in force include:
|
•
|
the level of current mortgage interest rates compared to the mortgage rates on the insurance in force, which affects the vulnerability of the insurance in force to refinancings (i.e., lower current interest rates make it more attractive for borrowers to refinance and receive a lower interest rate); and
|
|
•
|
mortgage insurance cancellation policies of mortgage investors along with the current value of the homes underlying the mortgages in the insurance in force.
|
Current mortgage interest rates are at or near historic lows. Future premiums on our insurance in force represent a material portion of our claims paying resources. We are unsure what the impact on our revenues will be as mortgages are refinanced, because the number of policies we write for replacement mortgages may be more or less than the terminated policies associated with the
48
refinanced mortgages. Our revenues might be negatively impacted if there is a higher than expected level of refinance activity on loans we insure in the future.
The amount of insurance we may be able to write could be adversely affected if lenders and investors select alternatives to MI.
If lenders and investors select alternatives to MI, our business could be adversely affected. These alternatives to MI include, but are not limited to:
|
•
|
lenders using government mortgage insurance programs, including those of the FHA and the VA;
|
|
•
|
state-supported mortgage insurance funds in several states, including California and New York;
|
|
•
|
lenders and other investors holding mortgages in portfolio and self-insuring;
|
|
•
|
investors using credit enhancements other than MI, using other credit enhancements in conjunction with reduced levels of MI coverage, or accepting credit risk without credit enhancement;
|
|
•
|
lenders originating mortgages using “piggy-back” structures to avoid MI, such as a first mortgage with an 80% LTV and a second mortgage with a 10%, 15% or 20% LTV (referred to as 80-10-10, 80-15-5 or 80-20 loans, respectively) rather than a first mortgage with an LTV above 80% that has MI; and
|
|
•
|
if borrowers pay cash versus securing mortgage financing, which has occurred with greater frequency in recent years.
|
Any of these alternatives to MI could reduce or eliminate the need for our product, could cause us to lose business and/or could limit our ability to attract the business that we would prefer to underwrite. In particular, since 2008 government mortgage insurance programs, principally the FHA, have captured a significant share of the insured loan market. Government mortgage insurance programs are not subject to the same capital requirements, risk tolerance or business objectives that we and other private MI companies are, and therefore, generally have greater financial flexibility in setting their pricing, guidelines and capacity, which could put us at a competitive disadvantage. On December 11, 2013, HUD announced its own final rule defining a "Qualified Mortgage" that would be insured, guaranteed or administered by FHA, which went into effect on January 10, 2014 and which is less restrictive than the CFPB's definition in certain respects, including that (i) it has no borrower DTI limit, and (ii) it has a higher pricing threshold for loans to fall into the "safe harbor" category of QM loans rather than the "rebuttable presumption" category of QM loans. Because of this, it is possible that lenders will prefer FHA-insured loans to loans insured by MI. In addition, loans insured under FHA and other Federal government-supported mortgage insurance programs are eligible for securitization in Ginnie Mae securities, which may be viewed by investors as more desirable than Fannie Mae and Freddie Mac securities due to the explicit backing of Ginnie Mae securities by the full faith and credit of the U.S. Federal government. While declining from a high of approximately 85% in 2009, the market share of governmental agencies remains substantially above the low of approximately 23% in 2007, according to statistics reported by Inside Mortgage Finance. If the FHA or other government-supported mortgage insurance programs maintain or increase their share of the mortgage insurance market, our business and industry could be negatively affected.
The degree to which lenders or borrowers may select these alternatives now, or in the future, is difficult to predict. As one or more of the alternatives described above, or new alternatives that enter the market, are chosen over MI, our revenues could be adversely impacted. The loss of business in general or the specific loss of more profitable business could have a material adverse effect on our financial position and operating results.
49
If the volume of low down payment home mortgage originations declines, the amount of insurance that we may be able to write could decline, which would reduce our revenues.
Our revenues, in part, depend on the volume of low down payment home mortgage originations and may be negatively affected if the volume declines. The factors that affect the volume of low down payment mortgage originations include, among other things:
|
•
|
restrictions on mortgage credit due to more stringent underwriting standards, more restrictive regulatory requirements and liquidity issues affecting lenders;
|
|
•
|
the level of home mortgage interest rates and deductibility of mortgage interest for income tax purposes;
|
|
•
|
the health of the real estate industry and the national economy as well as the conditions in regional and local economies;
|
|
•
|
housing affordability;
|
|
•
|
population trends, including the rate of household formation;
|
|
•
|
the rate of home price appreciation, which in times of heavy refinancing can affect whether refinance loans have LTVs that require MI; and
|
|
•
|
U.S. government housing policy encouraging loans to first-time homebuyers.
|
A decline in the volume of low down payment home mortgage originations could decrease demand for MI, decrease our new insurance written and therefore reduce our revenues and have an adverse effect on our operating results.
The U.S. MI industry is, and as a participant we will be, subject to litigation risk generally.
The MI industry faces litigation risk in the ordinary course of operations, including the risk of class action lawsuits and administrative enforcement by federal agencies. Litigation and enforcement actions relating to capital markets transactions and securities-related matters in general has increased as a result of the recent financial crisis. Consumers are bringing a growing number of lawsuits against home mortgage lenders and settlement service providers. Mortgage insurers have been involved in litigation alleging violations of the Real Estate Settlement Procedures Act of 1974 (“RESPA”) and the Fair Credit Reporting Act (“FCRA”). RESPA generally precludes mortgage insurers from paying referral fees to mortgage lenders for the referral of MI business. This limitation also can prohibit providing services or products to mortgage lenders free of charge, charging fees for services that are lower than their reasonable or fair market value, and paying fees for services that mortgage lenders provide that are higher than their reasonable or fair market value, in exchange for the referral of MI business services. Violations of the referral fee limitations of RESPA may be enforced by the federal CFPB, as well as by private litigants in class actions. In the past, a number of lawsuits have challenged the actions of private mortgage insurers under RESPA, alleging that the insurers have violated the referral fee prohibition by entering into captive reinsurance arrangements or providing products or services to mortgage lenders at improperly reduced prices in return for the referral of MI. In addition to these private lawsuits, other MI companies received Civil Investigative Demands (“CID”) from the CFPB as part of its investigation to determine whether mortgage lenders and mortgage insurance providers engaged in acts or practices in connection with their captive mortgage insurance arrangements in violation of the RESPA, the Consumer Financial Protection Act and the Dodd-Frank Act. In 2013, the CFPB entered into consent orders with five other MI companies settling the CFPB's allegations related to those MI companies' respective captive arrangements. Under the consent orders, each company agreed to discontinue the challenged captive reinsurance practices, pay monetary penalties and be subject to ongoing monitoring by the CFPB. We do not currently have any captive reinsurance arrangements, and are not currently subject to RESPA-related inquiries by the CFPB or other regulators or RESPA-related litigation. However, should we become a party to such an inquiry or action, the ultimate outcome is difficult to predict and it is possible that any outcome could be negative to us specifically or the industry in general and such a negative outcome could have an adverse effect on our business, financial position and operating results.
Risks Related to Our Common Stock
We do not anticipate paying any dividends on our common stock in the near future, and payment of any declared dividends may be delayed.
As a condition of GSE Approval, the GSEs have prohibited NMIC from paying a dividend to us before December 31, 2015. NMIC has also agreed with various state insurance regulators to restrictions on the payment of dividends until January 2016. After the expiration of these periods, we must obtain prior approval from the GSEs for the payment of any dividend by NMIC and we will have to obtain permission from our state of domicile regulator, the Wisconsin OCI or any successor domestic regulator, for the payment of any extraordinary dividend. Without the payment of dividends from NMIC to us, it may be difficult for us to pay dividends to stockholders.
50
We have not declared or paid dividends in the past, and we do not expect to pay dividends in the near future. Further, we do not have earnings from which dividends may be paid. In our early years, to the extent we have earnings, we intend to retain such earnings to expand our business. As a result, only appreciation in the price of our common stock, which may never occur, will provide a return to investors. Any future declaration and payment of dividends by our Board will depend on many factors, including general economic and business conditions, our strategic plans, our financial results and condition, legal requirements and other factors that our Board deems relevant. In addition, we may enter into credit agreements or other debt arrangements in the future that will restrict our ability to declare or pay cash dividends on our common stock.
The market price of our common stock could decline due to the large number of outstanding shares of our common stock eligible for future sale.
As of
March 7, 2014
, we had
58,065,326
shares of our common stock issued and outstanding. Of the outstanding shares of our common stock, the shares held by a person (or persons whose shares are aggregated) who is not deemed to be an affiliate of ours at any time during the three months preceding a sale, and who has beneficially owned restricted securities within the meaning of Rule 144 of the Securities Act may be eligible for resale in the public market under Rule 144 under the Securities Act subject to applicable restrictions under Rule 144. Sales of substantial amounts of our common stock in the public market in the future, or the perception that these sales could occur, could cause the market price of our common stock to decline. These sales could also make it more difficult for us to sell equity or equity-related securities in the future, at a time and place that we deem appropriate.
In addition, we have filed a registration statement on Form S-8 under the Securities Act to register an aggregate of 5.5 million shares of our common stock for issuance under our 2012 Stock Incentive Plan. Any shares issued in connection with acquisitions, the exercise of stock options or otherwise would dilute the percentage ownership held by investors who purchase our shares.
Future issuances of shares of our common stock may depress our share price and might dilute the book value of our common stock and reduce your influence over matters on which stockholders vote.
Our Board has the authority, without action or vote of our stockholders, to issue all or any part of our authorized but unissued shares of common stock, including shares that may be issued to satisfy our obligations under our incentive plans, and securities and instruments that are convertible into our common stock. Such stock issuances could be made at a price that reflects a discount or a premium from the then-current trading price of our common stock and might dilute the book value of our common stock or result in a decrease in the per share price of our common stock.
Future issuance of debt or preferred stock, which would rank senior to our common stock upon our liquidation, may adversely affect the market value of our common stock.
In the future, we may attempt to increase our capital resources by issuing debt, including bank debt, commercial paper, medium-term notes, senior or subordinated notes or classes of shares of preferred stock. Our preferred stock, if issued, could have a preference on liquidating distributions or a preference on dividend payments that would limit amounts available for distribution to holders of shares of our common stock. Accordingly, upon our liquidation, holders of our debt securities and preferred stock and lenders with respect to other borrowings will receive a distribution of our available assets prior to the holders of shares of our common stock. In addition, if we incur debt in the future, our future interest cost could increase and adversely affect our liquidity, cash flow and operating results.
Our decision to issue debt or preferred stock will depend on market conditions and other factors, some of which will be beyond our control. We cannot predict or estimate the amount, timing or nature of such future issuances. Holders of our common stock
bear the risk of such future issuances of debt or preferred stock reducing the market value of our common stock.
The market price of our common stock may be volatile, which could cause the value of an investment in our common stock to decline.
Because our IPO occurred recently, our common stock has limited trading history, and the market price of our common stock may fluctuate substantially and be highly volatile, which may make it difficult for stockholders to sell their shares of our common stock at the volume, prices and times desired. There are many factors that will impact the market price of our common stock, including, without limitation:
|
•
|
general market conditions, including price levels and volume and changes in interest rates;
|
|
•
|
national, regional and local economic or business conditions;
|
51
|
•
|
the effects of, and changes in, trade, monetary and fiscal policies, including the interest rate policies of the Federal Reserve;
|
|
•
|
our actual or projected financial condition, liquidity, operating results, cash flows and capital levels;
|
|
•
|
changes in, or failure to meet, our publicly disclosed expectations as to our future financial and operating performance;
|
|
•
|
publication of research reports about us, our competitors or the financial services industry generally, or changes in, or failure to meet, securities analysts' estimates of our financial and operating performance, or lack of research reports by industry analysts or ceasing of coverage;
|
|
•
|
market valuations, as well as the financial and operating performance and prospects, of similar companies;
|
|
•
|
future issuances or sales, or anticipated issuances or sales, of our common stock or other securities convertible into or exchangeable or exercisable for our common stock;
|
|
•
|
expenses incurred in connection with changes in our stock price, such as changes in the value of the liability reflected on our financial statements associated with outstanding warrants;
|
|
•
|
the potential failure to establish and maintain effective internal controls over financial reporting;
|
|
•
|
additions or departures of key personnel;
|
|
•
|
our failure to satisfy the continued listing requirements of the NASDAQ;
|
|
•
|
our failure to comply with the Sarbanes-Oxley Act of 2002; and
|
|
•
|
our treatment as an “emerging growth company” under the federal securities laws.
|
The stock markets in general have experienced substantial volatility that has often been unrelated to the operating performance of particular companies. These types of broad market fluctuations may adversely affect the trading price of our common stock. In the past, stockholders have sometimes instituted securities class action litigation against companies following periods of volatility in the market price of their securities. Any similar litigation against us could result in substantial costs, divert management's attention and resources and harm our business or operating results.
We are an emerging growth company and the reduced disclosure requirements applicable to emerging growth companies may make our common stock less attractive to investors.
As a company that had gross revenues of less than $1 billion during its last fiscal year, we are an EGC. As an EGC, we are relieved from certain significant requirements, including, among other things, the requirement to (i) file reports under Section 13 of the Exchange Act, (ii) comply with certain provisions of Sarbanes-Oxley and the Dodd-Frank Act and certain provisions and reporting requirements of or under the Securities Act and the Exchange Act or (iii) comply with new or revised financial accounting standards as long as we are an EGC, which, under the JOBS Act, has the effect of reducing the amount of information that we are required to provide for the foreseeable future. For example, as an EGC, we are exempt from complying with Section 404(b) of Sarbanes-Oxley, which otherwise would have required our auditors to attest to and report on our internal control over financial reporting. These reduced disclosure requirements may make our common stock less attractive to investors. To the extent that other companies do not, or cannot, take advantage of the benefits under the JOBS Act, this distinction may make our common stock less attractive to investors.
Provisions contained in our organizational documents, as well as provisions of Delaware law, could delay or prevent a change of control of us, which could adversely affect the price of shares of our common stock.
Our certificate of incorporation and bylaws and Delaware law contain provisions that could have the effect of rendering more difficult or discouraging an acquisition deemed undesirable by our Board. Our corporate governance documents include provisions that:
|
•
|
provide that special meetings of our stockholders generally can only be called by the chairman of the Board or the president or by resolution of the Board;
|
|
•
|
provide our Board the ability to issue undesignated preferred stock, the terms of which may be established and the shares of which may be issued without stockholder approval, and which may grant preferred holders super voting, special approval, dividend or other rights or preferences superior to the rights of the holder of common stock;
|
|
•
|
provide our Board the ability to issue common stock and warrants within the amount of authorized capital;
|
52
|
•
|
provide that, subject to the rights of the holders of any series of preferred stock with respect to such series of preferred stock, any action required or permitted to be taken by our stockholders must be effected at a duly called annual or special meeting of our stockholders and may not be effected by any consent in writing by such stockholders;
|
|
•
|
provide that stockholders seeking to bring business before our annual meeting of stockholders, or to nominate candidates for election as directors at our annual meeting of stockholders, generally must provide timely advance notice of their intent in writing and certain other information not less than 90 days nor more than 120 days prior to the meeting; and
|
|
•
|
eliminate the ability of stockholders to act by consent in lieu of a meeting.
|
These provisions, alone or together, could delay hostile takeovers and changes of control of the Company or changes in our management.
As a Delaware corporation, we are also subject to anti-takeover provisions of Delaware law. The Delaware General Corporation Law (the “DGCL”) provides that stockholders are not entitled the right to cumulate votes in the election of directors unless a corporation's certificate of incorporation provides otherwise. Our certificate of incorporation does not provide for cumulative voting in the election of directors.
We are subject to Section 203 of the DGCL, which, subject to certain exceptions, prohibits a public Delaware corporation from engaging in a business combination (as defined in such section) with an “interested stockholder” (defined generally as any person who beneficially owns 15% or more of the outstanding voting stock of such corporation or any person affiliated with such person) for a period of three years following the time that such stockholder became an interested stockholder, unless (i) prior to such time, the board of directors of such corporation approved either the business combination or the transaction that resulted in the stockholder becoming an interested stockholder; (ii) upon consummation of the transaction that resulted in the stockholder becoming an interested stockholder, the interested stockholder owned at least 85% of the voting stock of such corporation at the time the transaction commenced (excluding for purposes of determining the voting stock outstanding (but not the outstanding voting stock owned by the interested stockholder) the voting stock owned by directors who are also officers or held in employee benefit plans in which the employees do not have a confidential right to tender or vote stock held by the plan); or (iii) on or subsequent to such time the business combination is approved by the board of directors of such corporation and authorized at a meeting of stockholders by the affirmative vote of at least two-thirds of the outstanding voting stock of such corporation not owned by the interested stockholder.
In addition, Wisconsin's insurance regulations generally provide that no person may acquire control of us unless the transaction in which control is acquired has been approved by the Wisconsin OCI. The regulations provide for a rebuttable presumption of control when a person owns or has the right to vote more than 10% of the voting securities. In addition, the insurance regulations of other states in which NMIC and/or Re One are licensed insurers require notification to the state's insurance department a specified time before a person acquires control of us. If regulators in these states disapprove the change of control, our licenses to conduct business in the disapproving states could be terminated.
Any provision of our certificate of incorporation or bylaws or Delaware law or under the Wisconsin insurance regulation that has the effect of delaying or deterring a change in control could limit the opportunity for our stockholders to receive a premium for their shares of common stock, and could also affect the price that some investors are willing to pay for shares of our common stock.
53
None.
We entered into an office facility lease in Emeryville, California, effective July 1, 2012 for a term of two years. This facility is approximately 24,000 square feet and fully furnished. In October 2013, we amended our facility's lease to (i) add approximately 23,000 square feet of furnished office space and (ii) extend the facility's lease period through October 31, 2017, which allows for expansion based on near-term projected staffing growth. We do not own or lease any other facilities.
On August 8, 2012, Germaine Marks, as Receiver, and Truitte Todd, as Special Deputy Receiver, of PMI Mortgage Insurance Co., an Arizona insurance company in receivership, filed a complaint (the “PMI Complaint”) against the Company, NMIC and certain named individuals, in California Superior Court, Alameda County (the "Court"). The PMI Complaint, as amended, alleges breach of fiduciary duty, breach of loyalty, aiding and abetting breach of fiduciary duty and loyalty, misappropriation of trade secrets, conversion, breach of proprietary information agreement, breach of separation agreement, intentional interference with contractual relations and unfair competition. The lawsuit seeks injunctive relief as well as unspecified monetary damages. We and the individual defendants believe these claims are without merit and have filed answers denying all allegations. We and the individual defendants intend to defend ourselves vigorously.
On January 30, 2014, Arch announced the closing of its acquisition of CMG and certain assets of PMI. The terms of the February 7, 2013 Asset Purchase Agreement ("APA") between Arch and PMI provide that effective as of the closing of that transaction, PMI shall transfer and assign to Arch all causes of action being pursued in the PMI Complaint. The APA further provides that within thirty (30) days after the closing of the transaction, Arch shall have its attorney file appropriate pleadings and other documents and instruments with the court requesting that PMI be removed as a party plaintiff in the PMI Complaint and that Arch be substituted as the real party in interest. Although Arch has not yet filed any such request with the Court, the plaintiff is now described in pleadings as “Plaintiff and Real Party in Interest Arch U.S. MI Services, Inc.”
If the lawsuit is determined adversely to us, the Court could subject us to significant monetary damages and/or enter an injunction that might include preventing NMIC from conducting insurance operations. In addition, if the lawsuit is determined adversely to any of our employees, we may be required to remove and replace those employees under the terms of agreements NMIC and/or NMIH entered into with each of the Alabama Department of Insurance, the Florida Office of Insurance Regulation, the Texas Commissioner of Insurance and the New York State Department of Financial Services, as a condition of NMIC obtaining certificates of authority in those states. The Court has set the trial date for September 29, 2014.
Because the litigation and related discovery are ongoing, we do not have sufficient information to determine or predict the ultimate outcome or estimate the range of possible losses, if any. Accordingly, no provision for litigation losses has been included in our financial statements.
Not applicable.
54
Our common stock is listed on the NASDAQ under the symbol "NMIH." At March 7, 2014, there were
58,065,326
shares of our Class A common stock outstanding and approximately
48
holders of record. There are no shares of our Class B common stock outstanding. On November 8, 2013, we filed a final prospectus announcing the sale of approximately 2.4 million shares of common stock through our IPO and began trading on the NASDAQ We used the net proceeds received by us for working capital and other general corporate purposes. Prior to our IPO, we had approximately 55.6 million shares of common stock outstanding for which there was no established public market and, therefore, no public trading activity for any periods before the fourth quarter of 2013.
The following table shows the high and low sales prices of our common stock on the NASDAQ for the financial quarters indicated:
|
2013
|
|||||||
|
High
|
Low
|
||||||
|
4th Quarter
|
$
|
14.15
|
|
$
|
12.00
|
|
|
No dividends on our common stock have previously been declared or paid, and we do not expect to declare or pay dividends in the near future. For information on our ability to pay dividends, see Item 7,
"Management's Discussion and Analysis of Financial Condition and Results of Operations - Factors That Impact Holding Company Operations"
and Item 8,
"Financial Statements and Supplementary Data - Notes to Consolidated Financial Statements, Notes 9 and 14."
Issuer Purchases of Equity Securities
We did not repurchase any shares of Common Stock during
2013
.
Common Stock Performance Graph
The following graph compares the cumulative total stockholder return on our Class A Common Stock from November 8, 2013 (our first trading day on the NASDAQ) until December 31, 2013, with the cumulative total stockholder return on the Russell 2000 Index and a mortgage insurance company index ("Peer Index"). Prior to November 2013, there was no established public market for our securities. The Peer Index consists of Essent Group, Ltd., MGIC Investment Corporation and Radian Group, Inc. The graph plots the changes in value of an initial $100 investment over the indicated time periods, assuming all dividends are reinvested quarterly. The total stockholder’s returns are not necessarily indicative of future returns. Information contained or referenced in the stock performance graph below is being furnished with this report and will not be deemed “filed” for purposes of Section 18 of the Exchange Act or deemed to be incorporated by reference into any filing under the Exchange Act or the Securities Act.
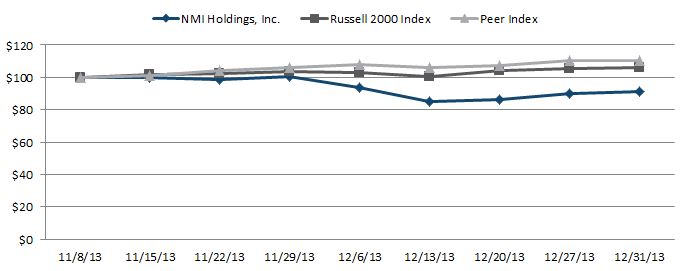
55
|
11/8/13
|
11/15/13
|
11/22/13
|
11/29/13
|
12/6/13
|
12/13/13
|
12/20/13
|
12/27/13
|
12/31/13
|
|||||||||||||||||||
|
NMI Holdings, Inc.
|
$
|
100
|
|
$
|
100
|
|
$
|
99
|
|
$
|
100
|
|
$
|
94
|
|
$
|
85
|
|
$
|
86
|
|
$
|
90
|
|
$
|
91
|
|
|
Russell 2000 Index
|
100
|
|
101
|
|
102
|
|
104
|
|
103
|
|
101
|
|
104
|
|
106
|
|
106
|
|
|||||||||
|
Peer Group Index (ESNT, MTG, RDN)
|
100
|
|
101
|
|
104
|
|
106
|
|
108
|
|
106
|
|
108
|
|
110
|
|
110
|
|
|||||||||
The information in the following table should be read in conjunction with the information included in Item 7
, "Management's Discussion and Analysis of Financial Condition and Results of Operations
" and the consolidated financial statements and notes thereto included in Item 8, "
Financial Statements and Supplementary Data.
"
|
2013
|
2012
|
2011
|
|||||||||
|
Consolidated Statements of Operations
|
(In Thousands, except for share data and ratios)
|
||||||||||
|
Net premiums earned
|
$
|
2,095
|
|
$
|
—
|
|
$
|
—
|
|
||
|
Net investment income
|
4,808
|
|
6
|
|
—
|
|
|||||
|
Net realized investment gains
|
186
|
|
—
|
|
—
|
|
|||||
|
(Loss) Gain from change in fair value of warrant liability
|
(1,529
|
)
|
278
|
|
—
|
|
|||||
|
Total Revenues
|
5,560
|
|
284
|
|
—
|
|
|||||
|
Losses incurred
|
—
|
|
—
|
|
—
|
|
|||||
|
Amortization of deferred policy acquisition costs
|
1
|
|
—
|
|
—
|
|
|||||
|
Other underwriting and operating expenses
|
60,743
|
|
27,775
|
|
1,349
|
|
|||||
|
Net Loss
|
(55,184
|
)
|
(27,491
|
)
|
(1,349
|
)
|
|||||
|
Basic and diluted loss per share
|
$
|
(0.99
|
)
|
$
|
(0.73
|
)
|
$
|
(13,490.00
|
)
|
||
|
Weighted average common shares outstanding
|
56,005,326
|
|
37,909,936
|
|
100
|
|
|||||
|
2013
|
2012
|
2011
|
|||||||||
|
Consolidated Balance Sheets
|
(In Thousands, except for share data and ratios)
|
||||||||||
|
Total investments
|
$
|
409,088
|
|
$
|
4,864
|
|
$
|
—
|
|
||
|
Cash and cash equivalents
|
55,929
|
|
485,855
|
|
—
|
|
|||||
|
Total Assets
|
481,219
|
|
542,768
|
|
210
|
|
|||||
|
Unearned premiums
|
1,446
|
|
—
|
|
—
|
|
|||||
|
Reserve for insurance claims and claims expenses
|
—
|
|
—
|
|
—
|
|
|||||
|
Shareholders' Equity
|
463,217
|
|
488,748
|
|
(1,349
|
)
|
|||||
|
Book value per share
|
$
|
7.98
|
|
$
|
8.81
|
|
$
|
(13,490.00
|
)
|
||
|
Selected Ratios
|
|||||||||||
|
Loss ratio
|
—
|
%
|
—
|
%
|
—
|
%
|
|||||
|
Expense ratio
|
2,900
|
|
—
|
|
—
|
|
|||||
|
Combined ratio
|
2,900
|
|
—
|
|
—
|
|
|||||
|
Risk-to-capital ratio
|
0.7:1
|
|
—
|
|
—
|
|
|||||
|
Other Data
|
|||||||||||
|
New primary insurance written
|
$
|
162,172
|
|
$
|
—
|
|
$
|
—
|
|
||
|
New primary risk written
|
36,516
|
|
—
|
|
—
|
|
|||||
|
New pool risk written
|
93,090
|
|
—
|
|
—
|
|
|||||
|
Direct primary insurance in force
|
161,731
|
|
—
|
|
—
|
|
|||||
|
Direct primary risk in force
|
36,516
|
|
—
|
|
—
|
|
|||||
|
Direct pool risk in force
|
93,090
|
|
—
|
|
—
|
|
|||||
56
The following analysis of our financial condition and results of operations should be read in conjunction with our consolidated financial statements and notes thereto included below in Item 8 of this report and the Risk Factors included above in Part I, Item 1A of this report. In addition, investors should review the "Cautionary Note Regarding Forward Looking Statements" above.
Overview
NMI Holdings, Inc. ("NMIH" or the "Company") was formed in May 2011 and, through its subsidiaries, provides private mortgage guaranty insurance (which we refer to as "mortgage insurance" or "MI"). As used below, "we" and "our" refer to NMIH's consolidated operations. MI protects mortgage lenders from all or a portion of default-related losses on residential mortgage loans made to home buyers who generally make down payments of less than 20% of the home’s purchase price. By protecting lenders and investors from credit losses, we help facilitate the availability of mortgages to prospective, primarily first-time, U.S. home buyers, thus promoting homeownership and helping to revitalize our residential communities. MI also facilitates the sale of these mortgage loans in the secondary mortgage market, most of which are sold to Fannie Mae and Freddie Mac. Our business strategy is to become a leading national MI company with our principal focus on writing insurance on high quality, low down payment residential mortgages in the United States. Following our formation, we focused our efforts on organizational development, capital raising and other start-up related activities. In November 2011, we entered into a definitive agreement to acquire MAC Financial Holding Corporation and its Wisconsin licensed insurance subsidiaries, Mortgage Assurance Corporation, Mortgage Assurance Reinsurance Inc One and Mortgage Assurance Reinsurance Inc Two, each a Wisconsin corporation, which we renamed National Mortgage Insurance Corporation (“NMIC”), National Mortgage Reinsurance Inc One (“Re One”) and National Mortgage Reinsurance Inc Two (“Re Two”), respectively. In April 2012, we raised net proceeds of approximately
$510 million
from a private placement of our common stock (the "Private Placement") and completed the acquisition of MAC Financial Holding Corporation and its insurance subsidiaries. The proceeds from the Private Placement were and will be primarily used to capitalize our insurance subsidiaries and fund our operating expenses until our insurance subsidiaries generate positive cash flows. On September 30, 2013, we merged MAC Financial Holding Corporation into NMIH, with NMIH surviving the merger, and we merged Re Two into NMIC, with NMIC surviving the merger.
In January 2013, Fannie Mae and Freddie Mac (collectively the “GSEs”) approved NMIC as a qualified MI provider on loans purchased by the GSEs. With our GSE Approval, our customers who originate loans insured by NMIC may sell such loans to the GSEs (as of April 1, 2013 for Freddie Mac and as of June 1, 2013 for Fannie Mae). Our primary insurance subsidiary, NMIC, requires a certificate of authority, or insurance license, in each state or jurisdiction where we issue insurance policies. We applied for a certificate of authority in each of the 50 states and D.C. in June 2012. We are currently licensed in 49 states and D.C.
On November 8, 2013, we filed a final prospectus announcing the sale of approximately
2.1 million
shares of common stock through our IPO. The principal reason for conducting the IPO was to expedite an increase in the number of holders of our common stock to permit a listing of our common stock on the NASDAQ. Obtaining a listing on the NASDAQ satisfied certain contractual obligations we had to our stockholders under a Registration Rights Agreement we entered into in connection with the Private Placement. On November 12, 2013, the underwriters exercised their option in full to purchase an additional
315,000
shares of common stock at a price of
$13.00
per share, before underwriting discounts. The offering closed on November 14, 2013. Gross proceeds to us were
$31.4 million
. Net proceeds from the offering were approximately
$28 million
, after an approximate
6%
underwriting fee and other offering expenses and reimbursements pursuant to the underwriting agreement.
Following our IPO, and to meet our obligations under the Registration Rights Agreement, we filed a final prospectus on December 9, 2013 registering 51,101,434 Class A common shares. These shares had previously been issued during our Private Placement.
Through our primary mortgage insurance subsidiary, NMIC, a monoline MI company, and its affiliated reinsurance company, Re One, we provide residential MI in the United States. We are one of seven companies in the U.S. who offer such insurance.
We believe the MI industry has significant barriers to entry due to the substantial capital necessary to fund operations and satisfy GSE requirements, the need for a customer-integrated operating platform capable of issuing and servicing mortgage insurance policies, the competitive positions and established customer relationships of existing mortgage insurance providers, and in order to conduct MI business nationwide, the need to obtain and maintain insurance licenses in all 50 states and D.C. Additionally, the resource commitment required by customers, and larger lenders in particular, to connect to a new mortgage insurance platform, such as ours, is significant, and absent a critical need, such as the capital constraints in the MI industry during the financial crisis, they have historically, in our view, been reluctant to make such an investment. We were formed at a time when the severe dislocation in the private mortgage insurance industry caused by the financial crisis created a need for newly capitalized mortgage insurers and this has facilitated our efforts to establish relationships with lenders.
57
Since the Company's inception, our efforts to build our MI business have included, among other things, building an executive management team and hiring other key officers and directors and staff, building our operating processes, designing and developing our business and technology applications, environment and infrastructure, and obtaining state licenses and GSE approval.
NMIC works to differentiate itself primarily by prompt and predictable underwriting, thereby aiming to provide our customers with a higher degree of confidence of coverage than our competitors provide. We have established risk management controls throughout our organization that we believe will support our continued financial strength. As a newly capitalized mortgage insurer, we have the ability to write new business without the burden of risky legacy exposures and believe our current capital supports our current business writing strategy while staying within the regulatory guidelines imposed by state insurance departments and the GSEs.
Our financial results to date have been primarily driven by expenditures related to our business development activities, and to a lesser extent, by our investment activities. Since we commenced writing MI on a limited test basis in April 2013, we have become a fully operational MI company, with
$161.7 million
of primary insurance-in-force and
$5.1 billion
of pool insurance in force as of
December 31, 2013
. For the year ended December 31, 2013, the Company had primary risk-in-force of
$36.5 million
compared to primary risk-in-force of
$1.2 million
at September 30, 2013. Pool risk-in-force for the year ended December 31,
2013
was
$93.1 million
.
We discuss the following in turn below:
|
•
|
the significant conditions and factors that have affected our operating results, including the costs associated with the key start-up activities in which we were engaged and development of our investment portfolio;
|
|
•
|
the factors we expect will impact our future results as our mortgage insurance business continues to grow, and certain issues impacting our holding company, NMIH;
|
|
•
|
our sources and uses of liquidity and capital resources;
|
|
•
|
our operating results, which were primarily driven by our start up activities, and the composition of our NIW and IIF; and
|
|
•
|
critical accounting estimates that require management to exercise significant judgments, often as a result of the need to make estimates about the effect of matters that are inherently uncertain.
|
Operating Expenses from Start Up Activities
Our expenses for the
years ended
December 31, 2013
,
2012
and
2011
, were
$60.7 million
,
$27.8 million
and
$1.3 million
, respectively, and consist largely of expenses associated with start up activities, including payroll and related expenses, share-based compensation and professional fees. The costs that we have incurred to date represent the culmination of our start-up activities. As such, they do not reflect the same types of expenses that an MI company with an established insurance portfolio after many years of operations would be expected to incur. We anticipate that, as our insurance writings grow and our sale activities increase, our underwriting expenses in future periods will be considerably higher than in the periods presented to date.
Although we expect our year-over-year expenses to increase as we grow our business, we ultimately expect that the majority of our operating expenses will be relatively fixed in the long term. As our business matures and we deploy the majority of our capital, we are targeting our expense ratio (expenses to premiums written) to fall into a range of
20%
to
25%
. During the first few years of operation, our expense ratio is expected to be significantly higher than this range given the low levels of premium written compared to our "fixed" costs customary to operating a mortgage insurance company. We believe that we will have an efficient expense structure providing us with greater flexibility. We do not expect to achieve operating profitability through at least 2014. Additionally, we are targeting an average unlevered return on equity in the mid-teens over time.
We discuss below the significant start up activities that have driven our results to date.
Start-up Operations
Since the closing of our Private Placement, we engaged in the following activities, which culminated in writing mortgage insurance business beginning in April 2013:
|
•
|
we obtained certificates of authority for NMIC from state insurance regulators to write mortgage insurance in
49
states and D.C.;
|
|
•
|
in January 2013, NMIC obtained approvals from the GSEs as a qualified mortgage insurer;
|
58
|
•
|
we made substantial progress in the design, development and implementation of our information technology platform and are actively using the applications today to transact business with customers;
|
|
•
|
we established customer relationships with mortgage originators; and
|
|
•
|
we have attracted and retained our employee base and support systems.
|
State Licensing
NMIC applied for a certificate of authority in each of the 50 states and D.C. in June 2012. As of the date of this report, NMIC has obtained certificates of authority in
49
states and D.C. NMIC has not yet received a certificate of authority in Wyoming. On March 7, 2014, we received a letter from the Wyoming Insurance Department ("WY DOI") notifying us that our application for a certificate of authority in Wyoming has been recommended for approval subject to NMIC posting a statutory deposit with the Wyoming Insurance Commissioner, which is customary for mortgage insurance companies. See Part I, Item 1A, "
Risk Factors - We may not receive, or be able to retain, licenses in all states, which would hamper our ability to issue MI on a nationwide basis."
Many states also require approval of NMIC's insurance rates and/or policy forms before it may issue insurance policies in such states. NMIC currently has effective rates and effective policy forms in each of the
49
states and D.C. in which NMIC has received certificates of authority.
As conditions of obtaining licenses in Alabama, Arizona, California, Florida, Missouri, New York, Ohio and Texas, NMIC entered into agreements with the Alabama Department of Insurance ("ALDOI"), the California Insurance Department (“CADOI”), the Florida Office of Insurance Regulation ("FLDOI"), the Missouri Department of Insurance (“MODOI”), the New York State Department of Financial Services (“NYDOI”), the Ohio Department of Insurance ("OHDOI") and the Texas Commissioner of Insurance (“TXDOI”). The agreements with the CADOI, FLDOI, MODOI, NYDOI, OHDOI and TXDOI, provide, among other things, that:
|
•
|
NMIC (i) refrain from paying any dividends; (ii) retain all profits; and (iii) other than in Florida, maintain a risk-to-capital ratio not to exceed 20 to 1, for three years from the date of GSE Approval (i.e., until January 2016); and
|
|
•
|
certain start-up compensation expenses and equity compensation in the form of stock options and restricted stock units ("RSUs") shall not be allocated to or assumed as a cost or expense by NMIC.
|
In its agreements with the FLDOI and NYDOI, NMIC is required to obtain the FLDOI's and NYDOI's respective prior written approvals to significantly deviate from the plan of operations and/or financial projections that were submitted to the FLDOI and NYDOI in connection with NMIC's license applications in those states. In addition, if the lawsuit brought by PMIC's Receiver is determined adversely to any of our officers who are named as defendants in the lawsuit (including our Chief Executive Officer, Chief Financial Officer, Chief Sales Officer and Vice President of Sales Operations, Analytics & Planning), we may be required to remove and replace those officers under the terms of the agreements with the ALDOI, FLDOI, NYDOI and TXDOI, as a condition of NMIC obtaining certificates of authority in those states.
In connection with NMIC's license applications in California, Missouri and New York, NMIH entered into agreements with the CADOI, MODOI and NYDOI requiring NMIH to contribute capital to NMIC as necessary to maintain NMIC's risk-to-capital ratio at or below 20 to 1 for three years from the date of GSE Approval. In the agreement with the FLDOI, NMIH agreed, consistent with conditions of the GSE Approval, to downstream additional capital from time to time, as needed, to maintain NMIC's risk-to-capital ratio at or below 15 to 1. In addition, our operation plan filed with the Wisconsin OCI and other state insurance departments in connection with NMIC's applications for licensure includes the expectation that NMIH will downstream additional capital, if needed, so that NMIC does not exceed an 18 to 1 risk-to-capital ratio. Re One is also a party to the agreement with the CADOI. Additionally, and as part of the approval process with the GSEs, we are required for the first three years of operations (expiring December 31, 2015) to maintain NMIC's risk-to-capital ratio at no greater than 15 to 1 and at all times to maintain NMIC's total statutory capital of at least $150 million. For further discussion of the GSE Approvals, see "—
GSE Approvals
," below.
Capital Position
In addition to the requirement that NMIC adhere to the above minimum capital requirements, in 16 states, NMIC is also subject to regulatory minimum capital requirements based on its insured risk-in-force. While formulations of this minimum capital may vary in each jurisdiction, the most common measure allows for a maximum permitted risk-to-capital ratio of 25 to 1. As a new entrant to the MI business, our insurance writings to date have been minimal compared to the volume of insurance we expect to write as our business grows in the near future.
59
As of
December 31, 2013
, NMIC's primary risk-in-force was approximately
$36.5 million
on a total of
653
policies in force and pool risk-in-force was approximately
$93.1 million
on a total of approximately
22,000
loans. Based on NMIC's reported total statutory capital of
$182 million
at
December 31, 2013
, NMIC's risk-to-capital ratio was 0.6:1, significantly below the contractual and regulatory maximum risk-to-capital thresholds. As our insurance writings grow and our risk-in-force increases, our risk-to-capital ratio will increase and NMIC's risk-to-capital metrics will become more important to an evaluation of its compliance with all of the capital requirements to which it is subject. State insurance regulators and the GSEs are currently examining their respective risk-to-capital ratio requirements to determine whether in light of the recent financial crisis, changes are needed to more accurately assess mortgage insurers' ability to withstand stressful economic conditions.
The NAIC has formed a working group to explore, among other things, whether the risk-to-capital requirements applicable to mortgage insurers should be overhauled. We, along with other MI companies are working with the Mortgage Guaranty Insurance Working Group of the Financial Condition (E) Committee of the NAIC. The Working Group will determine and make a recommendation to the Financial Condition (E) Committee of the NAIC as to what changes, if any, the Working Group believes are necessary to the solvency regulation for MI companies, including changes to the Mortgage Guaranty Insurers Model Act (Model #630). We have participated in the Working Group since early 2013 and continue to advocate for a strong capital model, as the industry migrates from a risk-to-capital metric to a more traditional risk-based capital approach. The discussions are ongoing and the ultimate outcome of these discussions and any potential actions taken by the NAIC cannot be predicted at this time. However, given our current strong capital position and having no exposure to risk written in the 2005 through 2008 book years (which we consider to be some of the poorest performing books of business ever written by the MI industry), we believe that NMIC will be able to fully comply with any new capital requirements at the time they are enacted.
In late 2013, the FHFA informed the MI industry that the GSEs have jointly developed new qualified mortgage insurer eligibility standards that will be issued in draft form for public comment in 2014. However, in January, 2014, the FHFA informed the MI industry that issuance of the new MI eligibility standards in draft form had been delayed by FHFA's Director Mel Watt in order to permit Director Watt to review the draft standards. FHFA has not announced when the draft standards will be issued.
GSE Approvals
The GSEs are the principal purchasers of mortgages insured by MI companies, primarily as a result of their legislative mandate to provide liquidity in the secondary mortgage market. Consequently, the ability to successfully commence mortgage insurance operations in the U.S. is largely dependent on obtaining approvals from Fannie Mae and Freddie Mac as a qualified MI provider. Following the Company's Private Placement in April 2012, NMIC's key focus was to secure approvals from the GSEs. In January 2013, Fannie Mae and Freddie Mac each approved NMIC as a qualified mortgage insurer. We expect that the significant majority of insurance we will write will be for loans sold to the GSEs. With the GSE Approval, our customers who originate loans insured by NMIC may sell such loans to the GSEs (as of April 1, 2013 for Freddie Mac and as of June 1, 2013 for Fannie Mae). For additional discussion of the conditions we agreed to in connection with obtaining GSE Approval, see Part I, Item 1, "
Business - Regulation - GSE Qualified Mortgage Insurer Requirements.
"
Development of Our Insurance Management System (“AXIS”) and Integration with Loan Origination Systems
AXIS
We are currently underwriting and servicing loans within our AXIS platform. Having a fully functional, cost efficient and scalable insurance management system is critical to our ability to conduct business with customers that control the majority of the mortgage insurance market. We continue to develop AXIS, which is primarily comprised of two modules: (i) underwriting and (ii) billing, servicing, and default and claims management.
The underwriting module currently in production was acquired in connection with the MAC Acquisition in April 2012. We have made investments in this module and have upgraded it from the time of the acquisition and believe it is capable of supporting our anticipated mortgage insurance volume through at least the end of 2014. During the fourth quarter of 2013, in order to reduce future operating costs, improve operational efficiencies and achieve a more flexible and enhanced user experience for loan originators, we decided to further enhance our underwriting module. The new design and development of this underwriting module started in late 2013 with deployment expected to occur in the fourth quarter of 2014. We continue to accept MI commitments from all of our customers and expect the new module to be viewed as an enhanced user experience by our customers. This upgrade does not impact our ability to service existing or new customers.
The currently deployed billing, servicing, default and claims module was designed and developed during 2013 and successfully deployed in late 2013 and early 2014. The module generates and processes premium bills and statements, processes monthly premium payments, and performs service transfers, principal balance updates and cancellations, among other functions. AXIS is integrated with the two largest servicing system providers, facilitating an automated and efficient process between us and
60
our customers related to all aspects of billing and servicing our policies. Integrating with the two largest servicing system providers was integral to many of our customers who require this automation prior to doing business with us. AXIS also accepts and processes NODs, allowing us to automatically track claim time-lines for adherence to the terms and conditions of our insurance policies and provide timely feedback and metrics to internal groups, among other functions.
Both modules replaced similar modules acquired as part of the MAC Acquisition. This was done to reduce future operating costs, improve operational efficiencies and achieve a more flexible and enhanced user experience for customers. We expect the software portion of the MAC Acquisition will be fully amortized by the end of 2014 when the new underwriting module is deployed.
Loan Origination Systems
Our fully operational, cost efficient and scalable AXIS platform is critical to our ability to integrate with third party and proprietary loan origination systems and to our ability to address the majority of the mortgage insurance market. Loan origination systems provide the functionality to automate the mortgage loan origination process, including point of sale support, processing, settlement services, document preparation and tracking, underwriting, closing and funding. We continue to work through the integration process with additional lenders and third party loan origination systems.
Customer Development
As discussed above in Part I, Item 1,
"Business - Sales and Marketing and Competition - Sales and Marketing,"
we organize our sales and marketing efforts based on our national and regional customer segmentation. Our sales strategy is focused on attracting as customers mortgage originators in the United States that fall into two distinct categories, which we refer to as "National Accounts" and "Regional Accounts".
We define National Accounts as the
37
most significant residential mortgage originators as determined by volume of their own originations as well as volume of insured business they may acquire from other originators. These National Accounts generally originate loans through their retail channels as well as purchase loans originated by other entities, primarily mortgage originators who we would classify as Regional Accounts, as described below. National Account lenders may sell their loans to the GSEs or private label secondary markets or securitize the loans themselves. We plan to service these customers with a specialized team of National Account sales people who have experience sourcing business from this segment. To date, approximately
20
of the National Accounts have indicated that they intend to do business with us, and we continue to work towards completing our customer boarding processes. We believe we have favorable relationships with the approximately
20
National Accounts who have indicated they will purchase MI from NMIC. As of the date of this report, we have received a limited amount of business from four of these national account providers and have continued to work with the other National Accounts to engage them as customers. We expect to begin insuring loans in the correspondent channels of two large National Accounts in the near term future.
The Regional Accounts originate mortgage loans on a local or regional level throughout the country. Some of these Regional Accounts have origination platforms that span across multiple regions; however, their primary lending focus is local. They sell the majority of their originations to National Accounts, but Regional Accounts may also retain loans in their portfolios or sell portions of their production directly to the GSEs. Our nationwide and regional sales teams address the Regional Accounts segment of the market, and with the early efforts of these teams, we have been able to attract lenders in this segment who have agreed to purchase MI from NMIC. Our future efforts will be focused on growing this segment of our customer base. Our ability to make progress penetrating Regional Accounts is primarily dependent on the following three factors:
|
•
|
Obtaining approval from National Account lenders to be an authorized MI provider enables Regional Accounts to sell loans with insurance from NMIC to those National Accounts. Consequently, these approvals are critical to making inroads with Regional Accounts. As discussed above, approximately
20
of the
37
National Accounts have indicated that they intend to do business with us.
|
|
•
|
Achieving connectivity with the largest loan servicing systems. Many loan servicers, including large lenders and those in the industry who service loans originated by Regional Accounts, that do not maintain proprietary servicing systems rely primarily on the two most significant servicing systems, LPS MSP and Fiserv LoanServ
TM
, to service their loans. In 2013, we completed integration with LPS MSP and Fiserv LoanServ
TM
. Attaining connectivity with these servicing systems is one of the important steps with respect to both National and Regional Accounts purchasing MI from NMIC.
|
|
•
|
Achieving connectivity with leading third-party loan origination systems utilized by Regional Accounts, including Ellie Mae Encompass360®. The Regional Accounts who originate loans using these third-party loan origination systems will be able to automatically select NMIC as an MI provider within those systems. The progress we have made to date connecting with these loan origination systems is another significant achievement with respect to our readiness to engage with Regional Accounts.
|
61
Competition
The MI industry is highly competitive and includes other private mortgage insurers, governmental agencies that sponsor government-backed mortgage insurance programs and alternatives to credit enhancement products, such as piggy-back loans. See Part I, Item 1,
"Business - Sales and Marketing and Competition - Competition,
" for additional discussion of our competitors.
The MI industry has recently been in a state of flux, with some existing companies exiting and new companies entering the space. In addition to ourselves, in 2010 another new MI company was formed and started writing MI. One existing company that had been serving credit unions only was acquired and announced its intent to expand operations to serve the entire mortgage market. In addition, an existing MI company that had previously stopped writing MI business has announced its intent to attempt to resume its MI operations. Given this dynamic, we expect that there will be pressure in the coming years for industry participants to establish, grow or maintain their market share and that many MI companies will respond to this pressure by lowering their rates, which will in turn put pressure on the rest of the industry.
We believe that our strong capital position and clear terms of coverage convey upon us an advantage in the marketplace. We expect that this advantage will translate to achieving our pro-rata market share on a faster than normal timeline. Our competitors' market share of the private MI industry for the year ended December 31, 2013 varied from a low of approximately 3% to a high of approximately 28%. In general, we expect the total origination market to decline in 2014. However, within the total market of low-down payment loan originations, we expect the overall private MI penetration rate to increase as the FHA continues to scale back. See
"- Factors Expected to Affect Results as Our Mortgage Insurance Operations Grow - Competition with FHA,"
below.
Employees
We believe our Company is an attractive, stable place of employment, given that we are a well-capitalized insurance company that has made significant progress in commencing business in the MI marketplace, allowing us to attract what we believe to be high-quality talent. We believe that our growth and future success will depend in large part on our services and the skills of our management team and our ability to motivate and retain these individuals and other key personnel. As of
December 31, 2013
, we had significantly developed our employee base to support our regional and national sales teams, policy acquisition and servicing, IT, and all other back-office functions. Based on the execution of our business plan, we hired a substantial number of employees since raising our initial capital in April 2012 and expect to continue to add additional staff throughout the first half of
2014
. As of December 31, 2013, we had
141
total full-time employees.
New Business Writings
NMIC commenced, on a limited test basis, writing insurance business in April 2013. As of
December 31, 2013
, NMIC has primary insurance-in-force of
$161.7 million
and
$36.5 million
of primary risk-in-force, representing
653
loans. We expect NMIC's insurance-in-force and risk-in-force to increase over the coming months as our operations continue to mature.
During the second fiscal quarter of 2013, NMIC bid on a pool insurance transaction proposed by Fannie Mae. As discussed previously, the FHFA set targets for reducing the GSEs' mortgage risk in 2013. One of the methods available to the GSEs was to utilize MI companies as insurers of particular groups, or pools, of loans. In July 2013, we were notified that Fannie Mae had selected NMIC for this pool transaction. NMIC entered into an agreement with Fannie Mae, pursuant to which NMIC initially insured approximately
22,000
loans with insurance-in-force of $5.2 billion (as of September 1, 2013). The effective date of the agreement and the coverage was September 1, 2013, and in September 2013, we received our first monthly premium payment from Fannie Mae. The agreement has an expected term of
10
years from the coverage effective date.
The risk-in-force to NMIC is
$93.1 million
which represents the amount between a deductible payable by Fannie Mae on initial losses and a stop loss, above which, losses are borne by Fannie Mae. NMIC provides this same level of risk coverage over the term of the agreement. In addition, the agreement contains counterparty requirements that specify the amount of capital NMIC will need to maintain to support the agreement, which is equal to the amount of primary net risk-in-force on this pool. The capital we are required to maintain to support this risk will decline over the
10
-year term of the agreement as the loans in the pool amortize. NMIC will be paid monthly premiums by Fannie Mae based on a fixed premium rate and the aggregate outstanding unpaid principal balance of loans in the pool. Similar to other monthly products, we will record the premium received on a monthly basis as written premium. In addition, all of the premium will be recorded as earned in the month received, with no unearned premium reserve established.
All of the loans in the pool were originated between July 1 and December 31, 2012. In order for a loan to have been and remain eligible for coverage under the agreement, it must have been current as of the coverage effective date and not have had a 30-day delinquency prior to the coverage effective date. The maximum LTV of the loans in the pool is
80%
and the weighted average LTV of the loans in the pool is
77%
, which is below the typical LTV of low-down payment loans we would expect to insure through
62
our flow channel, which we anticipate will have average LTVs at origination of between
85%
and
95%
. The average LTV of the loans in the pool was calculated based on the loans' origination values and the unpaid principal balances as of February 1, 2013, the date as of which the bid data was prepared. Because the LTVs are below 80%, the loans which make up this particular pool do not have primary MI on them. The average credit score at origination of borrowers in the pool is
764
which is considered to be an excellent credit score by the three major credit bureaus. All of the loans in the pool are
30
-year, fixed rate mortgages and were made to borrowers whose incomes we believe were fully documented, with approximately
29%
of those borrowers located in California. Based on the foregoing attributes, we believe that NMIC has insured a high quality loan pool. Related premiums and IIF will decline over the
10
-year term of the agreement as loans in the pool amortize over time.
Development of our Investment Portfolio
Our net investment income for the
year ended December 31, 2013
was
$4.8 million
compared to
$6 thousand
for the
year ended December 31, 2012
and
$0
for the
year ended December 31, 2011
. During the first quarter of
2013
, we began investing our cash holdings in fixed income securities which provide a higher yield than cash. We continued to invest our cash holdings in fixed income securities during the remainder of
2013
. As of
December 31, 2013
, we consider our portfolio to be in conformity with our investment guidelines. The principal factors affecting our investment income include the size of our portfolio and its net yield. As measured by amortized cost (which excludes changes in fair market value, such as those resulting from changes in interest rates), the size of our investment portfolio is mainly a function of capital raised, cash generated from (or used in) operations, such as net premiums received, and investment earnings.
Consistent with Wisconsin law, our investment policies emphasize preservation of capital, as well as total return. Based on our guidelines, our current investment portfolio is comprised entirely of cash and cash equivalents and fixed-income securities, all of which are investment grade and rated “A-” or higher. Our policy guidelines contain limits on the amount of credit exposure to any one issue, issuer and type of instrument. We expect to preserve the liquidity of our portfolio through diversification and investment in publicly traded securities. We plan to maintain a level of liquidity commensurate with our perceived business outlook and the expected timing, direction and degree of changes in interest rates.
Factors Expected to Affect Results as Our Mortgage Insurance Operations Grow
We expect that as our insurance business develops, our results of operations will be affected by the following factors.
Premiums Written and Earned
In our industry, a “book” is a group of loans that an MI company insures in a particular period, normally a calendar year.
We set premiums at the time a policy is issued based on our expectations regarding likely performance over the term of coverage. We expect the average premium rate we charge on our monthly primary flow MI policies, which we expect to comprise the majority of our business, to be comparable with the rates charged by the industry in general.
Premiums written and earned in a year are generally influenced by:
|
•
|
new insurance written, which is the new insurance-in-force (aggregate principal amount of the mortgages) that are insured during a period. Many factors affect new insurance written, including, among others, the volume of low down payment home mortgage originations (which tend to be generated to a greater extent in purchase financings as compared to refinancings) and the competition to provide credit enhancement on those mortgages, which includes primarily competition from the FHA and other private mortgage insurers;
|
|
•
|
cancellations, which reduce insurance-in-force. Cancellations due to refinancings are affected by the level of current mortgage interest rates compared to the mortgage rates on our insurance-in-force. Refinancings are also affected by current home values compared to values when the loans became insured and the terms on which mortgage credit is available. To a lesser extent, we expect our future cancellations to be impacted by rescissions, which require us to return any premiums received related to the rescinded policy, and policies canceled due to claim payment, which require us to return any premium received subsequent to the date the insured mortgage defaults. Finally, cancellations are affected by home price appreciation, which may give homeowners the right to cancel the MI on their loans. Based on current market conditions, we expect our MI policies to have a persistency rate of between
80%
and 85%;
|
|
•
|
premium rates, which are based on the risk characteristics of the loans insured, the percentage of coverage on the loans, competition from other mortgage insurers, and general industry conditions; and
|
|
•
|
premiums ceded under reinsurance agreements. The only reinsurance agreements we currently have in place are between NMIC and Re One and they are for the sole purpose of allowing NMIC to comply with certain statutory regulations regarding the amount of risk an MI company may retain on any single MI policy.
|
63
Mortgage Insurance Earnings and Cash Flow Cycle
In general, the majority of any underwriting profit (
i.e.
, the earned premium revenue minus claims and expenses, excluding investment income) that a book generates occurs in the early years of the book, with the largest portion of the underwriting profit for that book realized in the first year. The earnings we record and the cash flow we receive varies based on the type of MI product and premium plan our customers select. We offer monthly, annual and single premium payment plans. We currently expect that the majority of lenders who purchase MI from us will select one of our monthly premium plans.
Claims Incurred
Claims incurred are the current expense that is booked within a particular period to reflect actual and estimated claim payments that we believe will ultimately be made as a result of insured loans that are in default. As explained under “
Critical Accounting Estimates
,”
we do not recognize an estimate of claim expense for loans that are not in default. Claims incurred are generally affected by:
|
•
|
the state of the economy, including unemployment, which affects the likelihood that borrowers may default on their loans;
|
|
•
|
declines in housing values, as such declines may negatively affect loss mitigation opportunities on loans in default, as well as increase the likelihood that borrowers will default when the value of the home is below or perceived to be below the mortgage balance;
|
|
•
|
the product mix of insurance-in-force, with loans having higher risk characteristics generally resulting in higher defaults and claims;
|
|
•
|
the size of loans insured, with higher average loan amounts tending to increase claims incurred;
|
|
•
|
the loan-to-value ratio, with higher average loan-to-value ratios tending to increase claims incurred;
|
|
•
|
the percentage of coverage on insured loans, with higher percentages of insurance coverage tending to result in higher incurred claim amounts than lower percentages of insurance coverage;
|
|
•
|
higher debt-to-income ratios, which tend to increase incurred claims;
|
|
•
|
the rate at which we rescind policies. Because of tighter underwriting standards generally in the mortgage lending industry and the terms of our master policy, we expect that our level of rescission activity will be lower than recent rescission activity experienced by the MI industry; and
|
|
•
|
the distribution of claims over the life of a book. Historically, the first two to three years after loans are originated are a period of relatively low claims, with claims increasing substantially for several years subsequent and then declining. Factors, such as persistency of the book, the condition of the economy, including unemployment and housing prices, and others, can affect this pattern. See “
Mortgage Insurance Earnings and Cash Flow Cycle.
”
|
We expect that claims incurred for the first two to three years of our operations will be relatively low for the following reasons:
|
•
|
we underwrite every loan and we believe that this will lower our incurred claims;
|
|
•
|
as stated above, the typical distribution of claims over the life of a book results in fewer defaults during the first two to three years after loans are originated, usually peaking in years three through six and declining thereafter;
|
|
•
|
we expect that the frequency of claims on our initial primary books of business should be between
3%
and
4%
of mortgages insured over the life of the book. For claims that we may receive, we expect the severity of the claim to be between
85%
and
95%
of the coverage amount. Based on these expectations, we believe that the loss ratio over the life of each book will be between
20%
and
25%
of earned premiums. Because we expect the claims on insured mortgages to develop over time, we believe that the reported loss ratio in our first 2-3 years of operation will be less than
10%
of earned premiums; and
|
|
•
|
under the pool insurance agreement between NMIC and Fannie Mae, as discussed above in this report, NMIC is responsible for claims only to the extent they exceed a deductible.
|
We developed our estimates of the expected frequency and severity of claims based on statutory filings by many of our competitors, which contain historical book year performance, as well as an industry dataset which consists of nearly 150 million mortgages and 80 data fields per mortgage, gathered over the past 17 years. As state-regulated entities, mortgage insurers are required to file actuarial justifications for premium rate changes in many states, many of which are publicly available and include historical
64
information on claim frequency and severity. Historical performance data from similar underwriting, house price, and interest rate periods were compared to today to determine a range of expected performance.
Qualified Residential Mortgage Rule
The Dodd-Frank Act, which was enacted by Congress in July 2010, requires a securitizer to retain at least 5% of the credit risk associated with securitized mortgage loans. In some cases the retained risk may be allocated between the securitizer and the mortgage originator. This risk retention requirement does not apply to mortgage loans that are Qualified Residential Mortgages (“QRMs”) or that are insured by the FHA or another federal agency. By exempting QRMs from the risk-retention requirement, the cost of securitizing these mortgages would be reduced, thus providing a market incentive for the origination of loans that are exempt from the risk-retention requirement.
The Dodd-Frank Act requires certain federal regulators, including the SEC, the FDIC, the Office of the Comptroller of the Currency ("OCC") and (as to residential mortgage transactions) U.S. Department of Housing and Urban Development ("HUD") and FHFA, to promulgate regulations providing for minimum credit risk-retention requirements in securitizations of residential mortgage loans that do not meet the definition of QRM. In March 2011, federal regulators issued the proposed credit risk retention rule, which the regulators re-proposed with certain revisions on August 28, 2013. The initial proposed rule suggested a maximum LTV of 80% in purchase transactions, 75% in rate and term refinance transactions, and 70% in cash-out refinancings, along with other restrictions such as limits on a borrower's debt-to-income ratio. The suggested LTV figures did not give consideration to MI in computing LTV. According to the re-proposal, the majority of commenters, including securitization sponsors, housing industry groups, mortgage bankers, lenders, consumer groups, and legislators opposed the agencies' original QRM proposal, recommending instead that almost all mortgages without features such as negative amortization, balloon payments, or teaser rates should qualify for an exemption from risk retention. Some commenters expressed support for additional factors, such as less stringent LTV restrictions and reliance on MI for high-LTV loans. The re-proposed rule did not carry forward the minimum LTV requirements and other specific restrictions. Instead, the federal regulators proposed that whether a particular loan transaction is a QRM, and thus not subject to the credit risk retention requirement, should be determined by reference to the “qualified mortgage” (QM) rule under the Truth in Lending Act and Regulation Z, discussed below. That is, if a residential mortgage loan is a QM loan, the loan would be considered a QRM loan. The federal regulators requested comment on whether the common definition of QRM should be limited to “safe harbor” QM loans or QM loans that satisfy either the “safe harbor” or “rebuttable presumption” QM standard.
Under this part of the re-proposed rule, because of the capital support provided by the U.S. government, the GSEs during their conservatorship would not be subject to the Dodd-Frank Act credit risk retention requirements. Changes in the conservatorship status of the GSEs or capital support provided to the GSEs by the U.S. government could impact the manner in which the credit risk retention rules apply to the GSEs. If the QRM rule is finalized in accordance with the federal regulators' re-proposal, it is difficult to predict the impact on the size of the non-GSE loan securitization market and the demand for MI within this market.
The federal regulators in the re-proposal also presented an alternative approach to defining QRM, referred to as “QM plus.” Under this alternative, only certain types of residential mortgage loans, such as first-lien loans secured by 1-to-4 family principal dwelling units, could be considered QRM transactions. To be eligible for QRM status, the loan would have to be free of certain loan terms and have an LTV at closing no greater than 70%. Junior liens under the QM plus alternative would be permitted only in non-purchase money loan transactions and if permitted, would need to be included in the 70% LTV calculation. Under this alternative, mortgage insurance would not reduce the minimum LTV requirement. In addition, loans that achieve a QM status because they meet the CFPB QM requirements for GSE-eligible transactions would not be considered QRM transactions under the alternative proposal. Changes in final regulations regarding treatment of GSE eligible mortgage loans could impact the manner in which the credit risk retention rule applies to GSE securitizations.
We, and the industry, continue to evaluate the expected impact of the re-proposed QRM rule on the MI industry, and such potential impact depends on, among other things, (i) the final definition of QRM and its requirements for LTV, loan features and debt-to-income ratio, (ii) whether the final definition will affect the size of the high-LTV mortgage market and (iii) the extent to which the mortgage purchase and securitization activities of the GSEs become a smaller portion of the overall mortgage finance market and securitizations subject to the risk retention requirements and the QRM exemption, become a larger part of the mortgage market.
65
Qualified Mortgage Rule
The Dodd-Frank Act contains the ability to repay ("ATR") mortgage provisions, which govern the obligation of lenders to determine the borrower's ability to pay when originating a mortgage loan. The CFPB issued final ATR regulations on January 10, 2013 and amendments on May 29, 2013, July 10, 2013 and September 13, 2013 implementing detailed requirements on how lenders must establish a borrower's ability to repay a covered mortgage loan. The ATR rule went into effect on January 10, 2014. A subset of mortgages within the ATR rule are known as "qualified mortgages" ("QMs"). For a mortgage loan to be a QM, the rule first prohibits certain loan features, such as negative amortization, points and fees in excess of 3% of the loan amount, and terms exceeding 30 years. The rule also establishes underwriting criteria for QMs including that a borrower must have a total debt-to-income ratio of less than or equal to 43%. The ATR rule provides that a covered first mortgage loan meeting the QM definition bearing an annual percentage rate no greater than 1.5% plus a prevailing market rate is regarded as complying with ATR requirements, while if a loan bears an annual percentage rate of greater than 1.5% plus a prevailing market rate, it will carry a rebuttable presumption of compliance with the ATR rule. QMs under the rule benefit from a statutory presumption of compliance with the ATR rule, potentially mitigating the risk of the liability of the creditor and assignee of the creditor under the Truth in Lending Act. Because of the QM evidentiary standard that gives presumption of compliance, we anticipate that most loans originated after the ATR rule goes into effect will be QMs.
The rule also provides a temporary category of QMs that have more flexible underwriting requirements so long as they satisfy the general product feature requirements of QMs and so long as they meet the underwriting requirements of the GSEs or those of HUD, Department of Veterans Affairs or Rural Housing Service (collectively, “Other Federal Agencies”). The temporary category of QMs that meet the underwriting requirements of the GSEs will phase out upon the earlier to occur of the end of the conservatorship of the GSEs or January 10, 2021. The rules for the Other Federal Agencies will terminate when they issue their own qualified mortgage rules, respectively. On December 11, 2013, HUD announced its own final rule defining a "Qualified Mortgage" that would be insured, guaranteed or administered by FHA, which went into effect on January 10, 2014. We expect that most lenders will be reluctant to make loans that do not qualify as QMs because absent full compliance with the ATR rule, such loans will not be entitled to the presumptions about compliance with the ability-to-repay requirements.
The ATR regulation may impact the mortgage insurance industry in several ways. First, the ATR regulation will have a direct impact on establishing a subset of borrowers who can meet the regulatory QM standards and will have a direct effect on the size of the mortgage market in any given year, once the regulations become effective. Second, under the ATR regulation, if the lender requires the borrower to purchase MI, then the MI premiums are included in monthly mortgage costs in determining the borrower's ability to repay the loan. The demand for MI may decrease if, and to the extent that, monthly MI premiums make it less likely that a loan will qualify for QM status, especially if MI alternatives, such as piggy-back loans, are relatively less expensive.
Third, under the ATR regulation, mortgage insurance premiums that are payable at or prior to consummation of the loan are includible in points and fees for purposes of determining QM status unless, and to the extent that, such up-front premiums (“UFP”) are (i) less than or equal to the UFP charged by the FHA, and (ii) are refundable on a
pro rata
basis upon satisfaction of the loan. (The FHA currently charges UFP of 1.75% on all residential mortgage loans, but it has the authority to change its UFP from time to time.) As inclusion of MI premiums towards the 3% cap will reduce the capacity for other points and fees in covered transactions, mortgage originators may be less likely to purchase single premium MI products to the extent that the associated premiums are deemed to be points and fees. As a result, we believe that the ATR rule may increase demand for monthly and annual MI products relative to single premium products.
GSE Reform
The FHFA is the conservator of the GSEs and has the authority to control and direct their operations. The increased role that the federal government has assumed in the residential mortgage market through the GSE conservatorship may increase the likelihood that the business practices of the GSEs change in ways that affect the MI industry. In addition, these factors may increase the likelihood that the charters of the GSEs are changed by new federal legislation. The Dodd-Frank Act required the U.S. Department of the Treasury to report its recommendations regarding options for ending the conservatorship of the GSEs. This report was released in February 2011 and while it does not provide any definitive timeline for GSE reform, it does recommend using a combination of federal housing policy changes to wind down the GSEs, shrink the government's footprint in housing finance, and help bring private capital back to the mortgage market. Since 2011, there have been numerous legislative proposals, including in the current Congressional session, intended to scale back the GSEs, however, no legislation has been enacted to date.
In the second quarter of 2012, both Fannie Mae and Freddie Mac reported profits for the first time since the fourth quarter of 2006. Also, the second quarter of 2012 was the first time that neither of the GSEs had to request financial support from the U.S. Treasury. Based on continued improvements in the housing market, as of December 31, 2013, Fannie Mae had posted profits for eight consecutive quarters. Through December 31, 2013, Fannie Mae had paid $121.1 billion in dividends to the U.S. Treasury.
66
Freddie Mac also reported that for 2013 it has paid $71.3 billion in cash dividends to the U.S. Treasury, slightly exceeding their cash draws from the U.S Treasury. The payouts do not constitute a repayment of the money the U.S. government used to maintain Fannie Mae’s solvency during the housing crisis. The Treasury continues to hold $117.1 billion in senior preferred Fannie Mae shares. Under the terms of the preferred stock investment agreements between the U.S. Treasury and the GSEs, all GSE profits are remitted to the U.S. Treasury, and as such the return to profitability of the GSEs has become a source of revenues to the Federal government at a time of large Federal deficits. The profitability of the GSEs, and the active interest of investors in GSE securities which would benefit from a recapitalization of the GSEs, may impact the pace and direction of housing finance reform. For further discussion of housing finance reform, see Part I, Item 1, "
Business - Regulation - Other U.S. Regulation - Housing Finance Reform
."
Competition with FHA
The FHA, which is part of HUD, substantially increased its share of the total combined private and governmental mortgage insurance market beginning in 2008. We believe that the FHA's market share increased, in part, because private mortgage insurers tightened their underwriting guidelines (which led to increased utilization of the FHA's programs) and because of increases in the amount of loan level delivery fees that the GSEs assess on loans (which result in higher costs to borrowers). We believe that federal legislation and programs that were adopted as emergency measures to support the declining housing market provided the FHA with greater flexibility in establishing new products and resulted in increased market share for the FHA. During 2011, the FHA's market share began to gradually decline. In part, we believe the decline in market share has been driven by multiple increases in the FHA's mortgage insurance premium rates and upfront fees since 2010, as well as greater availability of private capital with new entrants to the MI sector, such as us. We believe that the FHA's current premium pricing, when compared to our current premium pricing (and considering the effects of GSE pricing changes), allows us to be competitive with the FHA.
We believe the MI industry will continue to recover market share from the FHA as it pulls back and permits more private capital to return to the market. On December 6, 2013, HUD announced that beginning on January 1, 2014, the FHA will reduce the maximum size of residential mortgage loans that it will insure in nearly 650 counties. The new national maximum loan limit for certain "high-cost" areas will be reduced from $729,750 to $625,500. The current national standard loan limit for areas where housing costs are relatively low will remain unchanged at $271,050. Areas are eligible for FHA loan limits above the national standard limit, and up to the national maximum level, based on median area home prices. According to HUD's news release, the higher limits that had been in place for six years were established by the Economic Stimulus Act of 2008 as emergency measures to assure that mortgage credit was widely available during a time when private lending options were severely constrained. FHA's Commissioner Carol Galante acknowledged that as the housing market continues its recovery, the FHA lowering its loan limits is an important and appropriate step as private capital returns to portions of the market. We cannot predict, however, the FHA's share of new insurance written in the future due to, among other factors, different loan eligibility terms between the FHA and the GSEs; future increases in guarantee fees charged by the GSEs; changes to the FHA's annual premiums; and the total profitability that may be realized by mortgage lenders from securitizing loans through the Government National Mortgage Association ("Ginnie Mae") when compared to securitizing loans through Fannie Mae or Freddie Mac.
The FHA's role in the mortgage insurance industry is also significantly dependent upon regulatory developments. The U.S. Congress is considering reforms of the housing finance market, which includes consideration of the future mission, size and structure of the FHA. Each year, FHA is required to perform an actuarial projection on its insurance portfolio and report the results to Congress. On December 13, 2013, HUD made a report to Congress that the FHA’s Mutual Mortgage Insurance Fund’s (“Fund”) net worth improved from the prior year’s estimate, from negative $16.3 billion to negative $1.3 billion. In addition, HUD reported that the Fund’s capital ratio is -0.11% but is expected to return to a required capital reserve ratio of 2% by 2015, 2 years sooner than earlier projections. Although the Fund’s outlook has improved considerably, Congress continues to consider legislation to reform the FHA.
In the Federal Budget released on March 4, 2014, the Obama administration predicted that the FHA will not need any further federal subsidies. For the federal fiscal year ending September 30, 2013, the FHA had drawn $1.7 billion from the Treasury, the first time it had ever needed to draw funds. If FHA reform were to raise FHA premiums, tighten FHA credit guidelines, make other changes which make lender use of FHA less attractive, or implement credit risk sharing between FHA and private mortgage insurers, these changes may be beneficial to our business. However, there can be no assurance that any FHA reform legislation will be enacted into law, and even if there is reform legislation, it is uncertain what provisions may be contained in any final legislation, if any. Therefore, the future impact on our business is uncertain.
As a result of the foregoing, it is uncertain what role the GSEs, FHA and private capital, including MI, will play in the domestic residential housing finance system in the future or the impact of any such changes on our business. In addition, the timing of the impact on our business is uncertain. Most meaningful changes would require Congressional action to implement, and it is difficult to estimate when Congress would take action, and if it did, how long it would take for such action to be final and how long any associated phase-in period may last. Considering the recent financial turnaround or the perceived turnaround of the GSEs, the timing of any of these changes becomes more difficult to assess.
67
Factors that Impact Holding Company Operations
NMIH serves as the holding company for our insurance subsidiaries and does not have any significant operations of its own. NMIH's principal liquidity demands include funds for: (i) the payment of certain corporate expenses and reimbursable expenses of its insurance subsidiaries; (ii) capital support for our mortgage insurance subsidiaries; (iii) potential payments to the IRS; and (iv) the payment of dividends, if any, on its common stock.
Our future capital requirements depend on many factors, including our ability to successfully write new business and establish premium rates at levels sufficient to cover claims and operating costs. To the extent that the funds generated by our ongoing operations and capitalization are insufficient to fund future operating requirements, we may need to raise additional funds through financing activities or curtail our growth and reduce our expenses.
In order to support a minimum surplus of
$150 million
and maintain a risk-to-capital ratio under 15 to 1 through December 31, 2015 at NMIC, NMIH may be required to make additional capital contributions to NMIC. NMIH could be required to provide additional capital support for NMIC and Re One if additional capital is required pursuant to state insurance laws and regulations, by the GSEs or the rating agencies. As of
December 31, 2013
, NMIC's and Re One's total statutory capital was approximately
$182 million
and
$10 million
, respectively. As of
December 31, 2013
, we had
$36.5 million
in primary risk-in-force and
$93.1 million
in pool risk-in-force.
In addition to investment income, dividends from NMIC and permitted payments under our tax- and expense-sharing arrangements with our subsidiaries are NMIH's principal sources of operating cash. The expense-sharing arrangements between NMIH and our insurance subsidiaries, as amended, have been approved by applicable state insurance departments, but such approval may be changed or revoked at any time. NMIC's ability to pay dividends to NMIH is subject to various conditions imposed by the GSEs and by insurance regulations requiring insurance department approval. In general, dividends in excess of prescribed limits are deemed “extraordinary” and require insurance regulatory approval. Additionally, under agreements with the GSEs, NMIH is not permitted to extract dividends from our insurance subsidiaries until December 31, 2015 and under agreements with various state insurance regulators, is not permitted to extract dividends from our insurance subsidiaries until January 2016.
NMIH is not subject to any limitations on its ability to pay dividends except those generally applicable to corporations, such as NMI Holdings, Inc., that are incorporated in Delaware. Delaware corporation law provides that dividends are only payable out of a corporation's capital surplus or (subject to certain limitations) recent net profits. As of
December 31, 2013
, NMIH's capital surplus was
$463 million
.
Liquidity and Capital Resources
Our MI companies' principal operating sources of liquidity will be premiums that we receive from policies and income generated by our investment portfolio. Our MI companies' primary liquidity needs include the payment of claims on our MI policies, operating expenses, investment expenses and other costs of our business.
We raised net proceeds of
$510 million
in our Private Placement, which we have primarily used to fund our operations. We contributed
$210 million
to NMIC, whereupon NMIC contributed
$10 million
to its wholly-owned subsidiary, Re Two. In addition, we contributed
$10 million
to Re One. On September 30, 2013, we merged Re Two into NMIC with NMIC surviving the merger.
As of
December 31, 2013
, we had approximately
$465 million
in cash and investments of which
$265 million
was held at our holding company. As of
December 31, 2013
, the amount of restricted net assets held by our consolidated insurance subsidiaries totaled approximately
$193 million
of our consolidated net assets of approximately
$463 million
.
The following table summarizes our consolidated cash flows from operating, investing and financing activities:
|
NMI Holdings, Inc.
|
For the Year Ended December 31,
|
For the Year Ended December 31,
|
For the Period May 19, 2011 (inception) to December 31,
|
||||||||
|
2013
|
2012
|
2011
|
|||||||||
|
(In Thousands)
|
|||||||||||
|
Net Cash (Used in) Provided by:
|
|||||||||||
|
Operating Activities
|
$
|
(36,311
|
)
|
$
|
(14,596
|
)
|
$
|
(205
|
)
|
||
|
Investing Activities
|
(419,949
|
)
|
(9,809
|
)
|
—
|
|
|||||
|
Financing Activities
|
26,334
|
|
510,260
|
|
205
|
|
|||||
|
Net (Decrease) Increase in Cash and Cash Equivalents
|
$
|
(429,926
|
)
|
$
|
485,855
|
|
$
|
—
|
|
||
68
Cash used in operating activities for the
year ended
December 31, 2013
was higher compared to the same period in
2012
due primarily to significant hiring of management and staff personnel beginning in May 2012 through year end 2013 and professional costs incurred in conjunction with our state licensing process and litigation support, offset somewhat by collected premiums during 2013.
Cash used in operating activities for the year ended
December 31, 2012
compared to the period from May 19, 2011 (inception) to
December 31, 2011
was higher due to the ramp up of operations in
2012
following the receipt of proceeds from the Private Placement in April 2012. Prior to the completion of the Private Placement, our activities were focused on organizational development, capital raising and other start-up related activities.
Cash used in investing activities for the
year ended
December 31,
2013
was higher compared to the same period in
2012
as a result primarily of investing our cash holdings in fixed income securities starting in the first quarter of 2013. We continued to invest our cash holdings in fixed income securities during the remainder of 2013 as we sought to balance and optimize our portfolio consistent with our investment policy.
Cash used in investing activities for the year ended
December 31, 2012
consisted primarily of the purchase of short-term investments held on deposit with various states, purchases of software and equipment and the MAC Acquisition. There were no cash flows from investing activities during the period from May 19, 2011 (inception) to
December 31, 2011
.
Cash provided by financing activities for the
year ended
December 31, 2013
consisted primarily of net proceeds from our IPO in November 2013, offset somewhat by taxes paid related to the net share settlement of equity awards. Cash provided by financing activities for the year ended
December 31, 2012
consisted of net proceeds from the issuance of common stock through our Private Placement. Cash provided by financing activities during the period from May 19, 2011 (inception) to
December 31, 2011
consisted of proceeds from a line of credit secured to fund the organizational development and Private Placement and other start-up activities until completion of the Private Placement.
We expect that cash and investments and projected cash flows from operations will provide us with sufficient liquidity to fund our anticipated growth by providing capital to increase our insurance company surplus as well as for payment of operating expenses through 2015, at which point we currently expect to consider various capital options. We expect that as our insurance-in-force grows, the premium revenue we receive will increase. However, if our risk-in-force or our expenses materially exceed our expectations or our risk-to-capital ratio is expected to exceed 15 to 1, we may have to consider our capital options sooner to support our growth. In addition, we may seek to raise additional capital to leverage our fixed expenses in order to achieve a return on capital attractive to investors. We expect to leverage and manage our fixed operating expenses so that they grow at a much slower rate than sales over the coming years. Following 2014, as we anticipate an increase in our volume of MI business, we expect to see our costs increase primarily within underwriting and sales; however, we expect to see only marginal increases in what we consider our corporate related costs (i.e., management, finance, legal, risk and information technology) as these areas of the business were required to be in place before we could generate significant revenue. We believe we will not need to incur significant additional fixed costs to be able to successfully service an increased volume of business with our existing structure, thereby growing revenue and producing greater levels of operating profits with marginal increases in such fixed costs. Eventually, we will need to expand our fixed cost structure in order to service an even greater level of business. We may choose to generate additional liquidity through the issuance of a combination of debt or equity securities, as well as consider our reinsurance options.
69
Mortgage Insurance Results
Prior to the completion of our Private Placement, our activities were focused on organizational development, capital raising and other start-up related activities. Additionally, for the period from May 19, 2011 through the majority of 2013, our efforts were primarily directed toward attracting an executive management team and other key officers and directors, hiring staff, building our operating processes, designing and developing our business and technology applications, environment and infrastructure, and securing state licensing and GSE Approval for our mortgage insurance subsidiaries. Since we commenced writing MI on a limited test basis in April 2013, we have become a fully operational MI company, with direct premiums written of
$3.5 million
and primary insurance -in-force of
$161.7 million
and pool insurance-in-force of
$5.1 billion
for the year ended December 31, 2013.
|
National Mortgage Insurance Corporation & National Mortgage Reinsurance Inc One - Combined Results
|
For the Year Ended December 31, 2013
|
For the Year Ended December 31, 2012
|
For the Period May 19, 2011 (inception) to December 31, 2011
|
||||||||
|
Revenues
|
(In Thousands)
|
||||||||||
|
Direct premiums written
|
$
|
3,541
|
|
$
|
—
|
|
$
|
—
|
|
||
|
(Increase) decrease in unearned premium
|
(1,446
|
)
|
—
|
|
—
|
|
|||||
|
Net premiums earned
|
2,095
|
|
—
|
|
—
|
|
|||||
|
Net investment income
|
2,050
|
|
4
|
|
—
|
|
|||||
|
Other revenue
|
(3
|
)
|
—
|
|
—
|
|
|||||
|
Total Revenues
|
4,142
|
|
4
|
|
—
|
|
|||||
|
Expenses
|
|||||||||||
|
Insurance claims and claims expenses, net
|
—
|
|
—
|
|
—
|
|
|||||
|
Amortization of deferred policy acquisition costs
|
1
|
|
—
|
|
—
|
|
|||||
|
Other underwriting and operating expenses
|
36,423
|
|
1,200
|
|
—
|
|
|||||
|
Total Expenses
|
36,424
|
|
1,200
|
|
—
|
|
|||||
|
Net Loss
|
$
|
(32,282
|
)
|
$
|
(1,196
|
)
|
$
|
—
|
|
||
|
December 31, 2013
|
December 31, 2012
|
December 31, 2011
|
|||||||||
|
(In Thousands)
|
|||||||||||
|
Total investment portfolio
|
$
|
180,024
|
|
$
|
4,864
|
|
$
|
—
|
|
||
|
Cash and cash equivalents
|
19,496
|
|
215,138
|
|
—
|
|
|||||
|
Restricted cash
|
—
|
|
—
|
|
—
|
|
|||||
|
Software and equipment, net
|
1,302
|
|
5,107
|
|
—
|
|
|||||
|
Other assets
|
4,716
|
|
3,638
|
|
—
|
|
|||||
|
Total Assets
|
$
|
205,538
|
|
$
|
228,747
|
|
$
|
—
|
|
||
|
Reserve for losses and loss adjustment expenses
|
$
|
—
|
|
$
|
—
|
|
$
|
—
|
|
||
|
Accounts payable and accrued expenses
|
10,717
|
|
—
|
|
—
|
|
|||||
|
Other liabilities
|
1,579
|
|
133
|
|
—
|
|
|||||
|
Total Liabilities
|
12,296
|
|
133
|
|
—
|
|
|||||
|
Total Shareholders' Equity (Deficit)
|
193,242
|
|
228,614
|
|
—
|
|
|||||
|
Total Liabilities and Shareholders' Equity
|
$
|
205,538
|
|
$
|
228,747
|
|
$
|
—
|
|
||
We have funded our operations primarily through funds raised through our Private Placement in which we received net proceeds of approximately
$510 million
. Following the Private Placement, NMIH capitalized its mortgage insurance subsidiaries with
$220.0 million
.
During May 2013, we recorded our first premium revenue. For the year ended
December 31, 2013
, we had net premiums written and earned of approximately
$2 million
. As of
December 31, 2013
, we had
653
primary policies in force and approximately
22,000
pool policies in force.
70
|
Primary and Pool Insurance and Risk in Force
|
|||||||||||
|
December 31,
|
|||||||||||
|
2013
|
2012
|
2011
|
|||||||||
|
(In Thousands)
|
|||||||||||
|
Primary Insurance In Force
|
$
|
161,731
|
|
$
|
—
|
|
$
|
—
|
|
||
|
Pool Insurance in Force
|
5,098,517
|
|
—
|
|
—
|
|
|||||
|
Total Insurance in Force
|
$
|
5,260,248
|
|
$
|
—
|
|
$
|
—
|
|
||
|
Primary Risk In Force
|
$
|
36,516
|
|
$
|
—
|
|
$
|
—
|
|
||
|
Pool Risk in Force
|
93,090
|
|
—
|
|
—
|
|
|||||
|
Total Risk in Force
|
$
|
129,606
|
|
$
|
—
|
|
$
|
—
|
|
||
Primary insurance may be written on a flow basis, in which loans are insured in individual, loan-by-loan transactions, or may be written on a bulk basis, in which each loan in a portfolio of loans is individually insured in a single, bulk transaction. MI may also be written in a pool policy, where a group of loans (or pool) are insured under a single contract. Pool insurance may have a stated aggregate loss limit for a pool of loans and may also have a deductible under which no losses are paid by the insurer until losses on the pool of loans exceed the deductible. Primary new insurance written was
$162.2 million
for the
year ended
December 31,
2013
. Pool new insurance written was
$5.2 billion
for the
year ended
December 31, 2013
. Combined risk-in-force as of
December 31, 2013
was
$129.6 million
.
For the
year ended December 31, 2013
, we have direct premiums written of
$3.5 million
compared to direct premiums written of
$0
for the
years ended
December 31, 2012
and
2011
. We commenced writing MI in April 2013 through NMIC. The primary driver of the increase in premiums written was the pool agreement with Fannie Mae, under which the MI coverage became effective September 1, 2013, as well as an increase in our primary insurance written which occurred during the fourth quarter of 2013. We expect that related pool premiums will decline over the
10
-year term of the agreement as loans in the pool amortize over time. We also expect our primary business writings to continue to increase as we engage with more customers.
For the
year ended December 31, 2013
, we have no claim reserves. The probability of a default within the first months of loan age, for loans of the quality we have insured, is not statistically significant. Given that IBNR itself is historically a small percentage of actual reported defaults, the probability of an IBNR default is also not statistically significant. We expect to establish a claim reserve during 2014.
We have incurred significant net losses since our inception. Our net losses were
$55.2 million
and
$27.5 million
for the
years ended
December 31, 2013
and
2012
, respectively, compared to a net loss of
$1.3 million
for the
year
ended
December 31, 2011
. The primary drivers of the increased net losses between periods were the hiring of management and staff personnel and external and professional costs incurred in conjunction with our state licensing and GSE Approval processes. Additionally, we entered into a two-year lease in July 2012 for our principal location of operations and in October 2013, extended the terms of this lease through October 31, 2017. These expenses were slightly offset by increased investment income during the year ended
December 31, 2013
, as we began investing our cash following GSE Approval in mid-January 2013, and premiums received, particularly during the fourth quarter of 2013.
Employee compensation represents the majority of our operating expense, which includes both cash and share-based compensation. Our payroll and related expense was
$28.2 million
for the
year ended December 31, 2013
and
$11.6 million
for the
year
ended
December 31, 2012
and
$0
for the year ended
December 31, 2011
. As part of our compensation plan, certain employees were granted stock options and RSUs under our 2012 Stock Incentive Plan, which was not in place prior to 2012. As a result, our share-based compensation expense was
$10.4 million
for the
year ended December 31, 2013
,
$6.1 million
for the
year
ended
December 31, 2012
and
$0
for the year ended
December 31, 2011
. We account for our stock options and RSUs under the Financial Accounting Standards Board Accounting Standards Codification ("ASC") No. 718,
Compensation
—
Stock Compensation
(“ASC 718”), which requires all compensation expense from share-based payments to be measured and recognized in the financial statements at their grant date fair values.
Our total assets, comprised largely of cash and investments, were
$481.2 million
as of
December 31, 2013
compared to total assets of
$542.8 million
and
$0.2 million
, as of
December 31, 2012
and
December 31, 2011
, respectively. The reduction in 2013 compared to 2012 was driven by operating costs and the payout of the restricted cash (approximately $40 million) related to the MAC Acquisition in 2013, partially offset by proceeds from our IPO and premium income. The primary driver of the increase in total assets in 2012 compared to 2011 was the proceeds from the Private Placement in April 2012.
71
Our accounts payable and accrued expenses were
$10.1 million
as of
December 31, 2013
,
$8.7 million
at
December 31, 2012
, and
$1.4 million
at
December 31, 2011
. The balances at
December 31, 2013
and
December 31, 2012
were comprised primarily of accrued bonuses and accrued expenses compared to the
December 31, 2011
balance, which only consisted of accrued expenses related to start-up activities.
Prior to GSE Approval, we held most of our assets in cash, and our investments consisted of U.S. Treasury Notes, which were purchased for the sole purpose of complying with certain state licensing conditions. These states required NMIC to place various amounts on deposit with the states as a prerequisite for obtaining a certificate of authority in those states. Other mortgage guaranty insurers also have placed similar deposits. As of
December 31, 2013
and
December 31, 2012
, in those states with the a statutory deposit requirement, we had placed on deposit aggregate amounts of
$7.0 million
and
$4.9 million
respectively, in the form of U.S Treasury Notes and cash.
New Insurance Written, Insurance in Force, and Risk in Force
We manage our portfolio credit risk by using several loan eligibility matrices which describe the maximum LTV, minimum borrower credit score, maximum loan size, property type and occupancy status of loans that we will insure. Our loan eligibility matrices, as well as all of our detailed underwriting guidelines, are contained in our Underwriting Guideline Manual that is publicly available on our website. Our eligibility criteria and underwriting guidelines are designed to mitigate the layered risk inherent in a single insurance policy. "Layered risk" refers to the accumulation of borrower, loan risk and property risk. For example, we have higher credit score and lower maximum allowed LTV requirements for riskier property types, such as investor properties, compared to owner-occupied properties.
Another tool we use to manage our credit risk is to underwrite every loan we insure, including loans coming through our delegated channel (the aforementioned “DAR” process). See Part 1, Item 1, "
Business - Underwriting."
We believe the prevailing standard of the MI industry has been to conduct partial quality assurance testing of loans that come through their delegated channels. We believe the industry's practice has exacerbated the negative impact of the recent mortgage crisis on legacy mortgage insurers because their partial quality control reviews did not adequately prevent the issuance of mortgage insurance through their delegated channels on ineligible, poor quality loans. Our pricing policies also help mitigate credit risk in the form of higher premium rates for loan features or borrower characteristics associated with historically higher default rates.
These risk principles form the basis of NIW for 2013. Since we recently began writing MI in April 2013, our portfolio does not yet reflect our expected distribution of maximum LTV, minimum borrower credit score, maximum loan size, property type and occupancy status of loans that we will insure, as well as the concentrations within states and metropolitan statistical areas ("MSAs"). We expect to move toward our optimal balance in our portfolio as we continue to write more business. We will continuously monitor these concentration balances and readjust them, as necessary. Our total NIW of $5.3 billion for the year ended December 31, 2013 was driven by our Fannie Mae pool transaction, which represented $5.2 billion in NIW.
Our NIW and RIF for the year ended December 31, 2013 was made up of approximately 81% and 78%, respectively, of credit scores at or above 740, which is generally considered to be a high quality credit score. We expect that such good credit quality loans will tend to lower claim incidence we experience for the insurance written in 2013. Generally, insuring loans made to borrowers with lower credit scores tends to result in a higher frequency of claims. As we continue to increase our insurance writings, we expect to continue to seek out and insure high credit quality mortgages.
72
|
As of December 31, 2013
|
NIW
|
IIF
|
RIF
|
||||||||||||||
|
Total Portfolio by FICO Score
|
(Dollars in Thousands)
|
||||||||||||||||
|
Primary
|
|||||||||||||||||
|
>= 740
|
$
|
113,907
|
|
70.2
|
%
|
$
|
113,741
|
|
70.3
|
%
|
$
|
25,783
|
|
70.6
|
%
|
||
|
680 - 739
|
47,102
|
|
29.0
|
|
46,827
|
|
29.0
|
|
10,459
|
|
28.6
|
|
|||||
|
620 - 679
|
1,163
|
|
0.8
|
|
1,163
|
|
0.7
|
|
274
|
|
0.8
|
|
|||||
|
<= 619
|
—
|
|
—
|
|
—
|
|
—
|
|
—
|
|
—
|
|
|||||
|
Total Primary
|
162,172
|
|
100.0
|
|
161,731
|
|
100.0
|
|
36,516
|
|
100.0
|
|
|||||
|
Pool
|
|||||||||||||||||
|
>= 740
|
4,186,844
|
|
81.0
|
|
4,127,451
|
|
81.0
|
|
75,195
|
|
80.8
|
|
|||||
|
680 - 739
|
832,755
|
|
16.1
|
|
821,852
|
|
16.1
|
|
15,146
|
|
16.2
|
|
|||||
|
620 - 679
|
152,065
|
|
2.9
|
|
149,214
|
|
2.9
|
|
2,749
|
|
3.0
|
|
|||||
|
<= 619
|
—
|
|
—
|
|
—
|
|
—
|
|
—
|
|
—
|
|
|||||
|
Total Pool
|
5,171,664
|
|
100.0
|
|
5,098,517
|
|
100.0
|
|
93,090
|
|
100.0
|
|
|||||
|
Total
|
|||||||||||||||||
|
>= 740
|
4,300,751
|
|
80.6
|
|
4,241,192
|
|
80.6
|
|
100,978
|
|
77.9
|
|
|||||
|
680 - 739
|
879,857
|
|
16.5
|
|
868,679
|
|
16.5
|
|
25,605
|
|
19.8
|
|
|||||
|
620 - 679
|
153,228
|
|
2.9
|
|
150,377
|
|
2.9
|
|
3,023
|
|
2.3
|
|
|||||
|
<= 619
|
—
|
|
—
|
|
—
|
|
—
|
|
—
|
|
—
|
|
|||||
|
Total Portfolio
|
$
|
5,333,836
|
|
100.0
|
%
|
$
|
5,260,248
|
|
100.0
|
%
|
$
|
129,606
|
|
100.0
|
%
|
||
|
RIF on defaulted loans
|
$
|
—
|
|
||||||||||||||
|
As of December 31, 2013
|
Primary
|
Pool
|
|||
|
Percentage of RIF by Loan Type
|
|||||
|
Fixed
|
91.3
|
%
|
100.0
|
%
|
|
|
Adjustable rate mortgages:
|
|||||
|
Less than five years
|
—
|
|
—
|
|
|
|
Five years and longer
|
8.7
|
|
—
|
|
|
|
Total Primary
|
100.0
|
%
|
100.0
|
%
|
|
The following chart reflects our RIF by LTV. In general, the lower the LTV the lower the likelihood of a default, and for loans that default, a lower LTV generally results in a lower severity for any claim, as the borrower has a higher amount of equity in the property.
73
|
As of December 31, 2013
|
Primary
|
Pool
|
|||||||||||||||||
|
RIF
|
% of Total LTV
|
Policy Count
|
RIF
|
% of Total LTV
|
Policy Count
|
||||||||||||||
|
Total RIF by LTV
|
(Dollars in Thousands)
|
||||||||||||||||||
|
95.01% and above
|
$
|
324
|
|
0.9
|
%
|
4
|
|
$
|
—
|
|
—
|
%
|
—
|
|
|||||
|
90.01% to 95.00%
|
16,777
|
|
45.9
|
|
255
|
|
—
|
|
—
|
|
—
|
|
|||||||
|
85.01% to 90.00%
|
15,031
|
|
41.2
|
|
241
|
|
—
|
|
—
|
|
—
|
|
|||||||
|
80.01% to 85.00%
|
4,384
|
|
12.0
|
|
153
|
|
—
|
|
—
|
|
—
|
|
|||||||
|
80.00% and below
|
—
|
|
—
|
|
—
|
|
93,090
|
|
100.0
|
|
21,921
|
|
|||||||
|
Total RIF
|
$
|
36,516
|
|
100.0
|
%
|
653
|
|
$
|
93,090
|
|
100.0
|
%
|
21,921
|
|
|||||
|
As of December 31, 2013
|
Loan Size
|
Coverage
|
||||
|
Average Primary Loan Size and Coverage by FICO
|
(Dollars in Thousands)
|
|||||
|
>= 740
|
$
|
253
|
|
23.0
|
%
|
|
|
680 - 739
|
237
|
|
23.4
|
|
||
|
620 - 679
|
194
|
|
22.3
|
|
||
|
<= 619
|
—
|
|
—
|
|
||
The following charts show the distribution by state of our IIF and RIF, on a primary and a pool basis. The majority of our IIF and RIF was added during the last four months of 2013. As a result, the state concentrations that existed for the year ended December 31, 2013 are not necessarily representative of the state concentrations that we will have once our insurance portfolio matures. We expect to maintain a diverse insurance portfolio, and we will carefully monitor and manage our exposure to any one state, in either our primary or pool writings. Our current state concentration is a reflection of our acquisition of new customers, which acquisition may lend itself to state concentrations that we find less than ideal. Over the next year, when we expect to add many new customers, we will gain greater flexibility to manage our state concentration levels.
|
As of December 31, 2013
|
IIF
|
RIF
|
||||
|
Top 10 Primary IIF and RIF by State
|
||||||
|
1.
|
California
|
18.2
|
%
|
17.6
|
%
|
|
|
2.
|
Michigan
|
8.4
|
|
9.1
|
|
|
|
3.
|
Virginia
|
5.4
|
|
5.0
|
|
|
|
4.
|
Texas
|
4.5
|
|
4.1
|
|
|
|
5.
|
New Jersey
|
4.4
|
|
4.3
|
|
|
|
6.
|
Arizona
|
4.2
|
|
4.3
|
|
|
|
7.
|
Pennsylvania
|
4.1
|
|
4.1
|
|
|
|
8.
|
Maryland
|
3.8
|
|
3.1
|
|
|
|
9.
|
Florida
|
3.7
|
|
4.0
|
|
|
|
10.
|
Illinois
|
3.6
|
|
3.9
|
|
|
|
Total
|
60.3
|
%
|
59.5
|
%
|
||
74
|
As of December 31, 2013
|
IIF
|
RIF
|
||||
|
Top 10 Pool IIF and RIF by State
|
||||||
|
1.
|
California
|
28.5
|
%
|
27.9
|
%
|
|
|
2.
|
Texas
|
5.5
|
|
5.6
|
|
|
|
3.
|
Colorado
|
3.9
|
|
3.9
|
|
|
|
4.
|
Washington
|
3.9
|
|
3.9
|
|
|
|
5.
|
Virginia
|
3.7
|
|
3.7
|
|
|
|
6.
|
Massachusetts
|
3.7
|
|
3.6
|
|
|
|
7.
|
Illinois
|
3.7
|
|
3.7
|
|
|
|
8.
|
New York
|
2.9
|
|
2.9
|
|
|
|
9.
|
Florida
|
2.8
|
|
2.9
|
|
|
|
10.
|
New Jersey
|
2.7
|
|
2.7
|
|
|
|
Total
|
61.3
|
%
|
60.8
|
%
|
||
|
December 31, 2013
|
September 30, 2013
|
June 30, 2013
|
March 31, 2013
|
||||||||||||
|
Primary
|
(Dollars in Thousands)
|
||||||||||||||
|
New insurance written
|
$
|
157,568
|
|
$
|
3,560
|
|
$
|
1,045
|
|
$
|
—
|
|
|||
|
Insurance in force (end of period)
|
$
|
161,731
|
|
$
|
4,604
|
|
$
|
1,045
|
|
$
|
—
|
|
|||
|
Policies in force
|
653
|
|
22
|
|
6
|
|
—
|
|
|||||||
|
Weighted-average coverage
(1)
|
22.6
|
%
|
26.0
|
%
|
24.6
|
%
|
—
|
%
|
|||||||
|
Loans in default (count)
|
—
|
|
—
|
|
—
|
|
—
|
|
|||||||
(1)
End of period risk in force divided by insurance in force.
Investment Operations
Upon GSE Approval, we invested our investment portfolio according to our investment guidelines. The pre-tax net investment income yield was approximately
1.5%
for the
year ended
December 31, 2013
. The pre-tax investment income yields are calculated based on amortized cost of the investments. We believe that the yield on our investment portfolio likely will change over time based on potential changes to the interest rate environment, the duration or mix of our investment portfolio, or other factors.
The sectors of our investment portfolio, including cash and cash equivalents, at
December 31, 2013
appear in the table below:
|
Percentage of Portfolio's Fair Value
|
|||
|
1.
|
Corporate debt securities
|
47
|
%
|
|
2.
|
U.S. Treasury securities and obligations of U.S. government agencies
|
23
|
|
|
3.
|
Asset-backed securities
|
16
|
|
|
4.
|
Cash and cash equivalents
|
12
|
|
|
5.
|
Municipal bonds
|
2
|
|
|
Total
|
100
|
%
|
|
75
The ratings of our investment portfolio at
December 31, 2013
were:
|
Investment Portfolio Ratings
|
||
|
AAA
|
15
|
%
|
|
AA
|
31
|
|
|
A
|
54
|
|
|
Investment grade
|
100
|
|
|
Below investment grade
|
—
|
|
|
Total
|
100
|
%
|
The amortized cost, gross unrealized gains and losses and fair value of the investment portfolio at
December 31, 2013
and
December 31, 2012
are shown below.
|
December 31, 2013
|
Amortized
Cost |
Unrealized
Gains |
Unrealized
Losses (1) |
Fair
Value |
|||||||||||
|
(In Thousands)
|
|||||||||||||||
|
U.S. Treasury securities and obligations of U.S. government agencies
|
$
|
108,067
|
|
$
|
—
|
|
$
|
(1,461
|
)
|
$
|
106,606
|
|
|||
|
Municipal bonds
|
12,017
|
|
1
|
|
(85
|
)
|
11,933
|
|
|||||||
|
Corporate debt securities
|
221,899
|
|
157
|
|
(4,799
|
)
|
217,257
|
|
|||||||
|
Asset-backed securities
|
74,152
|
|
114
|
|
(974
|
)
|
73,292
|
|
|||||||
|
Total Bonds
|
416,135
|
|
272
|
|
(7,319
|
)
|
409,088
|
|
|||||||
|
Short-term investments
|
39,695
|
|
—
|
|
—
|
|
39,695
|
|
|||||||
|
Total Investments
|
$
|
455,830
|
|
$
|
272
|
|
$
|
(7,319
|
)
|
$
|
448,783
|
|
|||
|
As of December 31, 2012
|
Amortized
Cost |
Unrealized
Gains |
Unrealized
Losses (1) |
Fair
Value |
|||||||||||
|
(In Thousands)
|
|||||||||||||||
|
Short-term investments
|
$
|
4,863
|
|
$
|
1
|
|
$
|
—
|
|
$
|
4,864
|
|
|||
|
Total Investments
|
$
|
4,863
|
|
$
|
1
|
|
$
|
—
|
|
$
|
4,864
|
|
|||
There were no investment holdings in
2011
.
(1) There were no other-than-temporary impairment losses recorded in other comprehensive income at
December 31, 2013
,
2012
, or
2011
.
|
December 31, 2013
|
Amortized
Cost |
Fair
Value |
|||||
|
(In Thousands)
|
|||||||
|
Due in one year or less
|
$
|
—
|
|
$
|
—
|
|
|
|
Due after one through five years
|
260,855
|
|
257,501
|
|
|||
|
Due after five through ten years
|
65,687
|
|
63,440
|
|
|||
|
Due after ten years
|
15,441
|
|
14,855
|
|
|||
|
Asset-backed securities
|
74,152
|
|
73,292
|
|
|||
|
Total Bonds
|
$
|
416,135
|
|
$
|
409,088
|
|
|
All investments held at
December 31, 2012
had a scheduled maturity of one year or less.
76
At
December 31, 2013
, the investment portfolio had gross unrealized losses of approximately
$7.3 million
. For those securities in an unrealized loss position, the length of time the securities were in such a position, as measured by their month-end fair values, is as follows:
|
December 31, 2013
|
Less Than 12 Months
|
12 Months or Greater
|
Total
|
|||||||||||||||
|
Fair Value
|
Unrealized Losses
|
Fair Value
|
Unrealized Losses
|
Fair Value
|
Unrealized Losses
|
|||||||||||||
|
(In Thousands)
|
||||||||||||||||||
|
U.S. Treasury Securities and Obligations of U.S. government agencies
|
$
|
106,606
|
|
$
|
(1,461
|
)
|
$
|
—
|
|
$
|
—
|
|
$
|
106,606
|
|
$
|
(1,461
|
)
|
|
Municipal bonds
|
4,915
|
|
(85
|
)
|
—
|
|
—
|
|
4,915
|
|
(85
|
)
|
||||||
|
Corporate debt securities
|
187,714
|
|
(4,799
|
)
|
—
|
|
—
|
|
187,714
|
|
(4,799
|
)
|
||||||
|
Assets-backed securities
|
58,225
|
|
(974
|
)
|
—
|
|
—
|
|
58,226
|
|
(974
|
)
|
||||||
|
Total Bonds
|
$
|
357,460
|
|
$
|
(7,319
|
)
|
$
|
—
|
|
$
|
—
|
|
$
|
357,460
|
|
$
|
(7,319
|
)
|
There were no unrealized losses as of
December 31, 2012
.
Net investment income is comprised of the following:
|
For the Year Ended December 31, 2013
|
For the Year Ended December 31, 2012
|
For the Period May 19, 2011 (inception) to December 31, 2011
|
|||||||||
|
(In Thousands)
|
|||||||||||
|
Bonds
|
$
|
5,289
|
|
$
|
4
|
|
$
|
—
|
|
||
|
Cash equivalents
|
—
|
|
2
|
|
—
|
|
|||||
|
Other
|
2
|
|
—
|
|
—
|
|
|||||
|
Investment income
|
5,291
|
|
6
|
|
—
|
|
|||||
|
Investment expenses
|
(483
|
)
|
—
|
|
—
|
|
|||||
|
Net Investment Income
|
$
|
4,808
|
|
$
|
6
|
|
$
|
—
|
|
||
77
Fair Value Measurements
Fair value measurements for items measured at fair value included the following as of
December 31, 2013
and
2012
:
|
December 31, 2013
|
Quoted Prices in
Active Markets for Identical Assets (Level 1) |
Significant Other
Observable Inputs (Level 2) |
Significant
Unobservable Inputs (Level 3) |
Fair Value
|
|||||||||||
|
(In Thousands)
|
|||||||||||||||
|
U.S. Treasury securities and obligations of U.S. government agencies
|
$
|
49,484
|
|
$
|
57,122
|
|
$
|
—
|
|
$
|
106,606
|
|
|||
|
Municipal bonds
|
—
|
|
11,933
|
|
—
|
|
11,933
|
|
|||||||
|
Corporate debt securities
|
—
|
|
217,257
|
|
—
|
|
217,257
|
|
|||||||
|
Asset-backed securities
|
—
|
|
73,292
|
|
—
|
|
73,292
|
|
|||||||
|
Cash and cash equivalents
|
55,929
|
|
—
|
|
—
|
|
55,929
|
|
|||||||
|
Total Assets
|
$
|
105,413
|
|
$
|
359,604
|
|
$
|
—
|
|
$
|
465,017
|
|
|||
|
Warrant liability
|
—
|
|
—
|
|
6,371
|
|
6,371
|
|
|||||||
|
Total Liabilities
|
$
|
—
|
|
$
|
—
|
|
$
|
6,371
|
|
$
|
6,371
|
|
|||
|
December 31, 2012
|
Quoted Prices in
Active Markets for Identical Assets (Level 1) |
Significant Other
Observable Inputs (Level 2) |
Significant
Unobservable Inputs (Level 3) |
Fair Value
|
|||||||||||
|
(In Thousands)
|
|||||||||||||||
|
U.S. Treasury securities and obligations of U.S. government agencies
|
$
|
4,864
|
|
$
|
—
|
|
$
|
—
|
|
$
|
4,864
|
|
|||
|
Cash and cash equivalents
|
526,194
|
|
—
|
|
—
|
|
526,194
|
|
|||||||
|
Total Assets
|
$
|
531,058
|
|
$
|
—
|
|
$
|
—
|
|
$
|
531,058
|
|
|||
|
Warrant liability
|
—
|
|
—
|
|
4,842
|
|
4,842
|
|
|||||||
|
Total Liabilities
|
$
|
—
|
|
$
|
—
|
|
$
|
4,842
|
|
$
|
4,842
|
|
|||
There were no transfers of securities between Level 1 and Level 2 during
2013
or
2012
.
For assets and liabilities measured at fair value using significant unobservable inputs (Level 3), a reconciliation of the beginning and ending balances for the years ended
December 31, 2013
and
2012
:
|
Warrant Liability
|
|||
|
(In Thousands)
|
|||
|
Balance at December 31, 2012
|
$
|
4,842
|
|
|
Change in fair value of warrant liability included in earnings
|
1,529
|
|
|
|
Balance at December 31, 2013
|
$
|
6,371
|
|
|
Warrant Liability
|
|||
|
(In Thousands)
|
|||
|
Balance at December 31, 2011
|
$
|
—
|
|
|
Initial fair value of warrant liability
|
5,120
|
|
|
|
Change in fair value of warrant liability included in earnings
|
(278
|
)
|
|
|
Balance at December 31, 2012
|
$
|
4,842
|
|
78
The fair value of the warrants issued to FBR and MAC Financial Ltd. (which are now held by the former stockholders of MAC Financial Ltd. as a result of its liquidation) was estimated on the date of grant using the Black-Scholes option-pricing model, including consideration of any potential additional value associated with pricing protection features. The volatility assumption used,
39.0%
, was derived from the historical volatility of the share price of a range of publicly-traded companies with business types similar to ours. No allowance was made for any potential illiquidity associated with the private trading of our shares. We revalue the warrant liability quarterly using a Black-Scholes option-pricing model in combination with a binomial model and a Monte-Carlo simulation model to value the pricing protection features within the warrant. As of
December 31, 2013
, the assumptions used in the option pricing model were as follows: a common stock price as of
December 31, 2013
of
$12.73
, risk free interest rate of
2.25%
, expected life of
6.58
years and a dividend yield of
0%
. The loss from change in fair value for the
twelve months ending
December 31, 2013
is primarily due to an increase in the price of our common stock as compared to
December 31, 2012
. The warrants have an exercise price of
$10.00
. The remaining contractual term on the warrants is
8.3
years.
There were no assets or liabilities measured at fair value using significant unobservable inputs as of
December 31, 2011
.
Share Based Compensation
The 2012 Stock Incentive Plan (the “Plan”) was approved by the Board on April 16, 2012, and authorized
5.5 million
shares to be reserved for issuance under the Plan with
3.85 million
shares available for stock options and
1.65 million
shares available for RSU grants. Options granted under the Plan are non-qualified stock options and may be granted to employees, directors and other key persons of the Company. The exercise price per share for the common stock covered by the Plan shall be determined by the Board at the time of grant, but shall not be less than the fair market value on the date of the grant. The term of the stock option grants will be fixed by the Board, but no stock option shall be exercisable more than
10
years after the date the stock option is granted. The vesting period of the stock option grants will also be fixed by the Board at the time of grant and generally is for a three year period.
A summary of option activity in the plan during the years ended
December 31, 2013
and
December 31, 2012
is as follows:
|
Option Activity
|
Shares
|
Weighted Average Exercise Price
|
Weighted Average Grant Date Fair Value per Share
|
|||||||
|
(Shares in Thousands)
|
||||||||||
|
Options balance outstanding at December 31, 2012
|
2,547
|
|
$
|
10.00
|
|
$
|
3.86
|
|
||
|
Options granted
|
532
|
|
11.78
|
|
4.57
|
|
||||
|
Less: Options forfeited
|
(15
|
)
|
10.00
|
|
3.84
|
|
||||
|
Less: Options canceled
|
(1
|
)
|
10.00
|
|
3.84
|
|
||||
|
Options balance outstanding at December 31, 2013
|
3,063
|
|
$
|
10.31
|
|
$
|
3.98
|
|
||
|
Option Activity
|
Shares
|
Weighted Average Exercise Price
|
Weighted Average Grant Date Fair Value per Share
|
|||||||
|
(Shares in Thousands)
|
||||||||||
|
Options balance outstanding at December 31, 2011
|
—
|
|
$
|
—
|
|
$
|
—
|
|
||
|
Options granted
|
2,829
|
|
10.00
|
|
3.87
|
|
||||
|
Less: Options forfeited
|
(282
|
)
|
10.00
|
|
3.88
|
|
||||
|
Less: Options canceled
|
—
|
|
—
|
|
—
|
|
||||
|
Options balance outstanding at December 31, 2012
|
2,547
|
|
$
|
10.00
|
|
$
|
3.86
|
|
||
As of December 31, 2013, there were no option exercises, and approximately
743,000
and zero options were exercisable as of
December 31, 2013
and
December 31, 2012
, respectively.
The remaining weighted average contractual life of options outstanding as of
December 31, 2013
was
8.5
years. As of
December 31, 2013
, there was
$3.6 million
of total unrecognized compensation cost related to non-vested stock options. The remaining weighted average contractual life of options outstanding as of
December 31, 2012
was
9.4
years. As of
December 31, 2012
, there was
$6.4 million
of total unrecognized compensation cost related to non-vested stock options.
79
The estimated grant date fair values of the stock options granted during
2013
were calculated using a Black-Scholes valuation model. See "-
Critical Accounting Estimates—Share-Based Compensation,
" below.
A summary of RSU activity in the plan during the years ended
December 31, 2013
and
December 31, 2012
is as follows:
|
Shares
|
Weighted Average Grant Date Fair Value per Share
|
|||||
|
(Shares in Thousands)
|
||||||
|
Non-vested restricted stock units at December 31, 2012
|
1,429
|
|
$
|
7.35
|
|
|
|
Restricted stock units granted
|
76
|
|
12.03
|
|
||
|
Less: Restricted stock units vested
|
(263
|
)
|
6.79
|
|
||
|
Less: Restricted stock units forfeited
|
—
|
|
—
|
|
||
|
Non-vested restricted stock units at December 31, 2013
|
1,242
|
|
$
|
7.75
|
|
|
|
Shares
|
Weighted Average Grant Date Fair Value per Share
|
|||||
|
(Shares in Thousands)
|
||||||
|
Non-vested restricted stock units at December 31, 2011
|
—
|
|
$
|
—
|
|
|
|
Restricted stock units granted
|
1,667
|
|
7.35
|
|
||
|
Less: Restricted stock units forfeited
|
(238
|
)
|
7.35
|
|
||
|
Non-vested restricted stock units at December 31, 2012
|
1,429
|
|
$
|
7.35
|
|
|
In February 2013, the Board approved a modification to the vesting terms of approximately
400,000
granted and non-vested RSUs held by our employees. The modification to the vesting terms removed the market condition leaving the RSUs subject to a service condition only. The modification resulted in a change in the period over which compensation costs are recognized and prospective recognition of incremental compensation cost. Incremental compensation cost is measured as the excess of the fair value of the modified award over the fair value of the original award immediately before its terms are modified using relevant valuation inputs as of the modification date.
At
December 31, 2013
, the
1.2 million
shares of granted and non-vested RSUs consisted of
0.5 million
shares that are subject to both a market and service condition and
0.7 million
shares that are subject only to service conditions. The non-vested RSUs subject to both a market and service condition vest in one-half increments upon the achievement of certain market price goals and continued service. Non-vested RSUs subject only to a service condition vest over a service period ranging from 1 to 3 years. The fair value of RSUs subject to market and service conditions is determined based on a Monte Carlo simulation model at the date of grant. The fair value of RSUs subject only to service conditions are valued at our stock price on the date of grant less the present value of anticipated dividends.
The estimated grant date fair values of the RSUs granted in
2012
that are subject to both a market and service condition were calculated using a Monte Carlo simulation model based on the average outcome of
150,000
simulations. See "
Critical Accounting Estimates—Share-Based Compensation
."
The remaining weighted average contractual life of non-vested RSUs as of
December 31, 2013
was
4.0 years
. As of
December 31, 2013
, there was
$4.3 million
of total unrecognized compensation cost related to non-vested RSUs.
On April 5, 2013 approximately
263,000
RSUs containing a market condition vested resulting in an acceleration of compensation expense of
$1.1 million
in the second quarter of 2013.
Taxes
We are a U.S. taxpayer and are subject to a statutory U.S. federal corporate income tax rate of approximately
35%
. Our holding company files a consolidated U.S. federal and various state income tax returns on behalf of itself and its subsidiaries. As we deploy our capital and achieve profitability, we plan to invest a portion of our investment portfolio in tax-exempt municipal securities, which investment may have the effect of lowering our effective tax rate below
35%
. Our effective income tax (benefit) rate on our pre-tax loss was
0%
for the
year ended December 31, 2013
and for the
year ended December 31, 2012
. During those periods, the benefit from income taxes was eliminated or reduced by the recognition of a valuation allowance which was recorded to reflect the amount of the deferred taxes that may not be realized. The Company does not yet have sufficient history to provide
80
a basis for reliable future net income projections. If the valuation allowance is reduced in the future, we would recognize an income tax benefit for accounting purposes in the period in which the valuation allowance is reduced. See Item 8, "
Financial Statements and Supplementary Data - Notes to Consolidated Financial Statements - Note 10 - Income Taxes
."
There is a tax sharing agreement between NMIH and its subsidiaries, dated August 23, 2012. Under this agreement, each of the parties mutually agrees to file a consolidated federal income tax return for 2012 and subsequent tax years, with NMIH as the direct tax filer. The tax liability of each insurer that is party to the agreement is limited to the amount of liability it would incur if it filed a separate tax return. All settlements under this agreement between NMIH and any subsidiary that is party to the agreement shall be made within 30 days of the filing of the applicable federal corporate income tax return with the Internal Revenue Service ("IRS"), including subsequent amended filings and IRS adjustments, except when a refund is due to an insurer, in which case payment shall be made to the insurer within 30 days after NMIH's receipt of the applicable tax refund.
Under current guidance, when evaluating a tax position for recognition and measurement, an entity shall presume that the tax position will be examined by the relevant taxing authority that has full knowledge of all relevant information. The interpretation adopts a benefit recognition model with a two-step approach, a more-likely-than-not threshold for recognition and derecognition, and a measurement attribute that is the greatest amount of benefit that is cumulatively greater than 50% likely of being realized. As of December 31, 2013 and as of December 31, 2012, we had no reserve for unrecognized tax benefits.
Excluded from deferred tax assets is
$1.5 million
of excess stock compensation for which any benefit realized will be recorded to stockholders' equity.
As of December 31, 2013, the Company had federal net operating loss carryforwards of $65.3 million, which expire from 2029 to 2033 and state net operating loss carryforwards of $30.5 million, which expire from 2032 to 2033. Section 382 of the Internal Revenue Code ("Section 382") imposes annual limitations on a corporation's ability to utilize its net operating losses ("NOLs") if it experiences an “ownership change.” As a result of the MAC Acquisition,
$7.3 million
of NOLs are subject to annual limitations of
$0.8 million
through 2016, then
$0.3 million
through 2029.
As the Company has limited underwriting operations and premium generation and therefore has no history to provide a basis for reliable future income projections, a valuation allowance of
$35.8 million
and
$8.2 million
was recorded at
December 31, 2013
and
December 31, 2012
, respectively, to reflect the amount of the deferred taxes that may not be realized.
The net deferred tax liability of
$0.1 million
as of
December 31, 2013
is due to the acquisition of indefinite-lived intangibles in the MAC Acquisition for which a benefit has been reflected in the acquired net operating loss carry forwards. The deferred tax liability recorded in connection with the MAC Acquisition effectively increased goodwill that resulted from the transaction. Our financial statements reflect a valuation allowance with respect to our gross deferred tax assets less capitalized software. If the valuation reserve is reduced at some future date, we would recognize an income tax benefit for accounting purposes in the period in which the valuation allowance is reduced. For a further discussion, see below in Item 8, "
Financial Statements and Supplementary Data - Notes to Consolidated Financial Statements - Note 10 - Income Taxes."
81
Off-Balance Sheet Arrangements and Contractual Obligations
We had no off-balance sheet arrangements at
December 31, 2013
. Contractual obligations at
December 31, 2013
are summarized in the table that follows.
|
Less than 1 year
|
1-3 years
|
3-5 years
|
More than 5 years
|
|||||||||
|
(In Thousands)
|
||||||||||||
|
Contractual obligations
|
$
|
—
|
|
$
|
—
|
|
$
|
—
|
|
$
|
—
|
|
|
Long-term debt obligations
|
—
|
|
—
|
|
—
|
|
—
|
|
||||
|
Capital lease obligations
|
—
|
|
—
|
|
—
|
|
—
|
|
||||
|
Operating lease obligations
|
1,570
|
|
4,900
|
|
—
|
|
—
|
|
||||
|
Purchase obligations
|
1,829
|
|
439
|
|
—
|
|
—
|
|
||||
|
Other long-term liabilities reflected on the Registrant's Balance Sheet under GAAP
|
—
|
|
—
|
|
—
|
|
—
|
|
||||
|
Total
|
$
|
3,399
|
|
$
|
5,339
|
|
$
|
—
|
|
$
|
—
|
|
Geographic Dispersion
We intend to build a geographically diverse portfolio without geographic concentrations that might expose us to undue risk. Risk will be managed by establishing targets and limits for new origination mix and/or portfolio limits. Therefore, aside from the impact of market restrictions (discussed above), we desire that our insurance origination mix by state be consistent with the overall distribution of mortgage insurance originations.
On an ongoing and recurring basis, we plan to evaluate changing market conditions to determine if it is appropriate to establish, tighten, loosen or eliminate lending restrictions established by geographic area. The evaluation is expected to include factors such as historical performance and the historical performance of other market participants, forward-looking projections for key risk drivers, estimated impact on loss performance, and existing portfolio concentrations. Consistent with our governance processes, the geographic concentrations will be monitored on an ongoing basis and changes to market restrictions will be reviewed and approved.
Critical Accounting Estimates
We use accounting principles and methods that conform to generally accepted accounting principles in the United States ("GAAP"). Where GAAP specifically excludes mortgage insurance we follow general industry practices. We are required to apply significant judgment and make material estimates in the preparation of our financial statements and with regard to various accounting, reporting and disclosure matters. Assumptions and estimates are required to apply these principles where actual measurement is not possible or practical. These critical accounting policies and estimates are summarized below.
Revenue Recognition
In the MI industry, a “book” is a group of loans that an MI company insures in a particular period, normally a calendar year.
We set premiums at the time a policy is issued based on our expectations regarding likely performance over the term of coverage. The policies we write are guaranteed renewable contracts at the policyholder's option on a single, annual or monthly premium basis. We generally have no ability to re-underwrite or reprice these contracts. However, we review every loan and through this review process confirm underwriting eligibility, either prior to loan closing in the non-delegated channel or through a post-closing underwriting review in the delegated channel. Based on this review, we may re-price. Premiums written on a single premium basis and an annual premium basis are initially deferred as unearned premium reserve and earned over the policy term. Premiums written on policies covering more than one year are amortized over the policy life in accordance with the expiration of risk which is the anticipated claim payment pattern based on industry experience. Premiums written on annual policies are earned on a monthly pro rata basis. Premiums written on monthly policies are earned as coverage is provided. Premiums written on pool transactions are earned over the period that coverage is provided. Upon cancellation of a policy, all premium that is non-refundable is immediately earned. Any refundable premium is returned to the policyholder. Premiums returned to policyholders are recorded as a reduction of written and earned premiums in the current period, which affects premiums written and earned in those periods.
82
Reserve for Claims and Claim Adjustment Expenses
We wrote our first MI business in April 2013. We do not anticipate a material level of claims (relative to written premiums or stockholder equity) in the first few years of our operations. Our practice is to establish claim reserves only for loans in default. We do not consider a loan to be in default for claim reserve purposes until we receive notice from the servicer that a borrower has failed to make two (2) regularly scheduled payments and is at least 60 days in default. Default is defined in NMIC's mortgage guaranty insurance policies as the failure by a borrower to pay when due an amount equal to the scheduled mortgage payment due under the terms of a loan or the failure by a borrower to pay all amounts due under a loan after the exercise of the due on sale clause of such loan. In addition to reserves on reported defaults, we establish reserves for estimated claims incurred on loans that have been in default for at least 60 days that have not yet been reported to us by the servicers, often referred to as IBNR.
Consistent with industry accounting practices, for purposes of establishing claim reserves, we consider our MI policies to be short-duration contracts and, as such, we will adhere to the general claim reserving principles contained in ASC Topic 944,
Financial Services
—
Insurance
("ASC 944"), even though that standard expressly excludes mortgage insurance from its guidance. Like other mortgage insurers, however, we will not establish claim reserves for anticipated future claims on insured loans that are not currently in default.
The establishment of claim and IBNR reserves is subject to inherent uncertainty and requires significant judgment by management. We establish claim reserves using our best estimates of claim rates,
i.e.
, the percent of loan defaults that ultimately result in claim payments, and claim amounts,
i.e.
, the dollar amounts required to settle claims, to estimate the ultimate claims on loans reported to us as being at least 60 days in default as of the end of each reporting period. We estimate IBNR by analyzing historical lags in default reporting to determine a specific number of IBNR claims in each reporting period. Our actuary utilizes internal and external data to estimate lags in notice of default reporting. We believe that given recent tightening of GSE guidelines lag times have decreased. Additionally, our estimates of claim rates and claim sizes are strongly influenced by prevailing economic conditions, for example current rates or trends in unemployment, house price appreciation and/or interest rates, and our best judgment as to the future values or trends of these macroeconomic factors. If prevailing economic conditions deteriorate suddenly and/or unexpectedly, our estimates of claim reserves could be materially understated, which may adversely impact our financial condition and operating results. Because claim and IBNR reserves are based on estimates and judgments, there can be no assurance that even in a stable economic environment, actual claims paid by us will not be substantially different than our claim and IBNR reserves for such claims.
Changes in claim reserves can materially affect our consolidated net income or loss. It is possible that even a relatively small change in estimated claim rate or a relatively small percentage change in estimated claim amount could have a significant impact on reserves and, correspondingly, on operating results. The claim reserving process is complex and subjective and, therefore, our ultimate liabilities may vary significantly from our estimates.
Fair Value Measurements
The following describes the valuation techniques used by us to determine the fair value of financial instruments held as of
December 31, 2013
and
December 31, 2012
:
We established a fair value hierarchy by prioritizing the inputs to valuation techniques used to measure fair value. The hierarchy gives the highest priority to unadjusted quoted prices in active markets for identical assets or liabilities (Level 1 measurements) and the lowest priority to unobservable inputs (Level 3 measurements). The three levels of the fair value hierarchy under this standard are described below:
|
•
|
Level 1 - Unadjusted quoted prices for identical assets or liabilities in active markets that are accessible at the measurement date for identical assets or liabilities;
|
|
•
|
Level 2 - Prices or valuations based on observable inputs other than quoted prices in active markets for identical assets and liabilities; and
|
|
•
|
Level 3 - Unobservable inputs that are significant to the fair value of the assets or liabilities. Level 3 assets and liabilities include financial instruments whose value is determined using pricing models, discounted cash flow methodologies, or similar techniques, as well as instruments for which the determination of fair value requires significant management judgment or estimation.
|
The level of market activity used to determine the fair value hierarchy is based on the availability of observable inputs market participants would use to price an asset or a liability, including market value price observations.
83
Assets classified as Level 1 and Level 2
To determine the fair value of securities available-for-sale in Level 1 and Level 2 of the fair value hierarchy, independent pricing sources have been utilized. One price is provided per security based on observable market data. To ensure securities are appropriately classified in the fair value hierarchy, we review the pricing techniques and methodologies of the independent pricing sources and believe that their policies adequately consider market activity, either based on specific transactions for the issue valued or based on modeling of securities with similar credit quality, duration, yield and structure that were recently traded. A variety of inputs are utilized by the independent pricing sources including benchmark yields, reported trades, non-binding broker/dealer quotes, issuer spreads, two sided markets, benchmark securities, bids, offers and reference data including data published in market research publications. Inputs may be weighted differently for any security, and not all inputs are used for each security evaluation. Market indicators, industry and economic events are also considered. This information is evaluated using a multidimensional pricing model. Quality controls are performed by the independent pricing sources throughout this process, which include reviewing tolerance reports, trading information and data changes, and directional moves compared to market moves. This model combines all inputs to arrive at a value assigned to each security. We have not made any adjustments to the prices obtained from the independent pricing sources; however, we do perform quality checks and review the prices received.
Liabilities classified as Level 3
The warrants held by FBR and MAC Financial Ltd. (which are now held by its former stockholders after completion of its liquidation) are valued using a Black-Scholes option-pricing model in combination with a binomial model and Monte-Carlo simulation model used to value the pricing protection features within the warrant. Variables in the model include the risk-free rate of return, dividend yield, expected life and expected volatility of the Company's stock price.
ASC 825,
Disclosures about Fair Value of Financial Instruments
, requires all entities to disclose the fair value of their financial instruments, both assets and liabilities recognized and not recognized in the balance sheet, for which it is practicable to estimate fair value.
Investment Portfolio
We classify our entire investment portfolio as available-for-sale and report it at fair value. The related unrealized gains or losses, after considering the related tax expense or benefit, are reported as a component of accumulated other comprehensive income in stockholders' equity. We expect to hold short-term investments with maturities of greater than three and less than 12 months when purchased, and such investments will be carried at fair value. Any realized gains and losses on sales of investments are determined on a specific-identification basis. We expect that our investment income will consist primarily of interest. We plan to recognize interest income on an accrual basis. Net investment income would represent interest income, net of investment expenses.
The guidance regarding the recognition and presentation of other-than-temporary impairment ("OTTI"), requires that an OTTI of a debt security be separated into two components when there are credit-related losses associated with the impaired debt security for which we assert that we do not have the intent to sell the security, and it is more likely than not that we will not be required to sell the security before recovery of our cost basis. Under this guidance the amount of the OTTI related to a credit loss is recognized in earnings, and the amount of the OTTI related to other factors (such as changes in interest rates or market conditions) is recorded as a component of other comprehensive income (loss). In instances where no credit loss exists but it is more likely than not that we would have to sell the debt security prior to the anticipated recovery, the decline in fair value below amortized cost is recognized as an OTTI in earnings. In periods after recognition of an OTTI on debt securities, we plan to account for such securities as if they had been purchased on the measurement date of the OTTI at an amortized cost basis equal to the previous amortized cost basis less the OTTI recognized in earnings. For debt securities for which OTTI are recognized in earnings, the difference between the new amortized cost basis and the cash flows expected to be collected would be accreted or amortized into net investment income.
Each fiscal quarter we perform reviews of our investments in order to determine whether declines in fair value below amortized cost are considered other-than-temporary in accordance with applicable guidance. In evaluating whether a decline in fair value is other-than-temporary, we may consider several factors including, but not limited to:
|
•
|
our intent to sell the security and whether it is more likely than not that we would be required to sell the security before recovery;
|
|
•
|
extent and duration of the decline;
|
|
•
|
failure of the issuer to make scheduled interest or principal payments;
|
|
•
|
change in rating below investment grade; and
|
|
•
|
adverse conditions specifically related to the security, an industry, or a geographic area.
|
84
Under the current guidance, a debt security impairment is deemed other-than-temporary if either it is intended that the security be sold or it is more likely than not that we would be required to sell the security before recovery or we do not expect to collect cash flows sufficient to recover the amortized cost basis of the security.
Deferred Policy Acquisition Costs
Costs directly associated with the successful acquisition of mortgage insurance policies, consisting of employee compensation and other policy issuance and underwriting expenses, are initially deferred and reported as deferred insurance policy acquisition costs. Deferred insurance policy acquisition costs arising from each book of business are charged against revenue in the same proportion that the underwriting profit for the period of the charge bears to the total underwriting profit over the life of the policies. The underwriting profit and the life of the policies are estimated and are reviewed quarterly and updated when necessary to reflect actual experience and any changes to key variables such as persistency or loss development. Because our insurance premiums are earned over time, changes in persistency result in deferred insurance policy acquisition costs being amortized against revenue over a comparable period of time.
If a premium deficiency exists, we reduce the related deferred insurance policy acquisition costs by the amount of the deficiency or to zero through a charge to current period earnings. If the deficiency is more than the deferred insurance policy acquisition costs balance, we then establish a premium deficiency reserve equal to the excess, by means of a charge to current period earnings.
Premium Deficiency Reserve
After our claim reserves are established, we will perform a premium deficiency calculation each fiscal quarter using best estimate assumptions as of the testing date. Per ASC 944, a premium deficiency reserve shall be recognized if the sum of expected claim costs and claim adjustment expenses, expected dividends to policyholders, unamortized acquisition costs, and maintenance costs exceeds related unearned premiums. The calculation of premium deficiency reserves requires the use of significant judgment and estimates to determine the present value of future premiums and present value of expected claims and expenses on our business. The present value of future premiums relies on, among other things, assumptions about persistency and repayment patterns on underlying loans. The present value of expected claims and expenses depends on assumptions relating to severity of claims and claim rates on current defaults, and expected defaults in future periods. These assumptions may also include an estimate of expected rescission activity. Assumptions used in calculating the deficiency reserves can be affected by volatility in the current housing and mortgage lending industries. To the extent premium patterns and actual claim experience differ from the assumptions used in calculating the premium deficiency reserve, the differences between the actual results and our estimate will affect future period earnings. In considering the potential sensitivity of the factors underlying our best estimate of premium deficiency reserves, it is possible that even a relatively small change in estimated claim rate or a relatively small percentage change in estimated claim amount could have a significant impact on the premium deficiency reserve, should one be needed, and, correspondingly, on our operating results.
Income Taxes
We account for income taxes using the liability method in accordance with ASC Topic 740,
Income Taxes
. The liability method measures the expected future tax effects of temporary differences at the enacted tax rates applicable for the period in which the deferred asset or liability is expected to be realized or settled. Temporary differences are differences between the tax basis of an asset or liability and its reported amount in the consolidated financial statements that would result in future increases or decreases in taxes owed on a cash basis compared to amounts already recognized as tax expense in the consolidated statement of operations. We evaluate the need for a valuation allowance against deferred tax assets on a quarterly basis. In the course of our review, we assess all available evidence, both positive and negative, including future sources of income, tax planning strategies, future contractual cash flows and reversing temporary differences. Additional valuation allowance benefits or charges could be recognized in the future due to changes in management's expectations regarding the realization of tax benefits.
85
Warrants
In conjunction with the MAC Acquisition and funding of our start-up costs, we issued warrants to FBR and MAC Financial Ltd (which are now held by its former stockholders after completion of its liquidation). We account for warrants to purchase our common shares in accordance with ASC 470-20
Debt with Conversion and Other Options
and ASC 815-40
Derivatives and Hedging - Contracts in Entity's Own Equity.
Our outstanding warrants may be settled by us using either (i) a physical settlement method or (ii) cashless exercise, where shares that are issued upon exercise of the warrants are reduced, to cover the cost of the exercise, in lieu of the holder remitting a cash payment of the exercise price. The warrants expire on the 10
th
anniversary after the date the warrant was issued, after which they are not exercisable. The exercise price and the number of warrants are subject to anti-dilution provisions whereby the existing exercise price is adjusted downward, and the number of warrants increased, for events that may not be dilutive. The adjustment may be in excess of any dilution suffered. As a result, the warrants are classified as a liability. We revalue the warrants at the end of each reporting period and any change in fair value is reported in the statements of operations in the period in which the change occurred. The fair value of the warrants is calculated using a Black-Scholes option-pricing model in combination with a binomial model and a Monte Carlo simulation model used to value the pricing protection features within the warrant. Variables in the model include the fair value of the stock, risk-free rate of return, dividend yield, expected life and expected volatility of the Company's stock price.
Share-Based Compensation
We adopted ASC 718,
Compensation - Stock Compensation
(“ASC 718”). ASC 718 addresses accounting for share-based awards and recognizes compensation expense, measured using grant date fair value, over the requisite service or performance period of the award. Share-based payments include stock options and RSUs grants under the 2012 Stock Incentive Plan. The fair value of stock option grants issued are determined based on an option pricing model which takes into account various assumptions that are subjective. Key assumptions used in the stock option valuation include the the fair value of the stock on the grant date, the expected term of the equity award taking into account the contractual term of the award, the effects of expected exercise and post-vesting termination behavior, expected volatility, expected dividends and the risk-free interest rate for the expected term of the award. RSU grants to employees contain a market and service condition. The fair value of RSU grants to employees prior to our IPO was determined using a Monte Carlo Simulation model at the date of grant. Following the IPO, fair value was determined based on closing price on the grant date. Restricted grants to non-employee directors are valued at our stock price on the date of grant less the present value of anticipated dividends. Expense is recognized over the required service period, which is generally a three-year vesting period for the options (vesting in one-third increments per year).
The estimated grant date fair values of the stock options granted during
2013
and
2012
were calculated using the Black-Scholes valuation model based on the following assumptions:
|
2013
|
2012
|
||||
|
Expected life
|
6 years
|
|
6 years
|
|
|
|
Risk free interest rate
|
0.98% - 1.12%
|
|
0.85% - 1.12%
|
|
|
|
Dividend yield
|
0.00
|
%
|
0.00
|
%
|
|
|
Expected stock price volatility
|
39.00
|
%
|
39.00
|
%
|
|
|
Projected forfeiture rate
|
1.00
|
%
|
1.00
|
%
|
|
Expected Life -
is the period of time over which the options granted are expected to remain outstanding giving consideration to vesting schedules, historical exercise and forfeiture patterns. We use the simplified method outlined in SEC Staff Accounting Bulletin No. 107 to estimate expected lives for options granted during the period as historical exercise data is not available and the options meet the requirements set out in the Bulletin. Options granted have a maximum term of ten years.
Risk Free Interest Rate -
is the U.S. Treasury rate for the date of the grant having a term approximating the expected life of the option.
Dividend Yield -
is calculated by dividing the expected annual dividend by our stock price at the valuation date.
Expected Stock Price Volatility
—
is a measure of the amount by which a price has fluctuated or is expected to fluctuate. At the time of grant, our common shares trading history was less than six months, which was not sufficient to calculate an expected volatility representative of the volatility over the expected lives of the options. As a substitute for such estimate, we used historical volatilities of a set of comparable companies in the industry in which we operate.
86
Projected Forfeiture Rate -
is the estimated percentage of options granted that are expected to be forfeited or canceled before becoming fully vested. An increase in the forfeiture rate will decrease compensation expense.
Restricted Stock Units
The estimated grant date fair values of the RSUs granted in
2012
that are subject to both a market and service condition were calculated using a Monte Carlo Simulation model based on the average outcome of 150,000 simulations using the following assumptions:
|
•
|
Expected life -
5.0 years
|
|
•
|
Risk free interest rate -
0.86%
|
|
•
|
Dividend yield -
0.00%
|
|
•
|
Expected stock price volatility -
39.00%
|
|
•
|
Projected forfeiture rate -
1.00%
|
In February 2013, the Board approved a modification to the vesting terms of approximately
400,000
granted and non-vested RSUs held by our employees. The modification to the vesting terms removed the market condition leaving the RSUs subject to a service condition only. The modification resulted in a change in the period over which compensation costs are recognized and prospective recognition of incremental compensation cost. Incremental compensation cost is measured as the excess of the fair value of the modified award over the fair value of the original award immediately before its terms are modified using relevant valuation inputs as of the modification date.
87
We own and manage a large portfolio of various holdings, types and maturities. Investment income is one of our primary sources of cash flow supporting operations and claim payments. The assets within the investment portfolio are exposed to the same factors that affect overall financial market performance. While our investment portfolio is exposed to factors affecting global companies and markets worldwide, because the company insures loans only in the United States, it is most sensitive to fluctuations in the drivers of U.S. markets.
We manage market risk via a defined investment policy implemented by our treasury function with oversight from our Board's Risk Committee. Important drivers of our market risk exposure monitored and managed by us include but are not limited to:
|
•
|
Changes to the level of interest rates
. Increasing interest rates may reduce the value of certain fixed-rate bonds held in the investment portfolio. Higher rates may cause variable rate assets to generate additional income. Decreasing rates will have the reverse impact. Significant changes in interest rates can also affect persistency and claim rates to the extent that the investment portfolio must be restructured to better align it with future liabilities and claim payments. Such restructuring may cause investments to be liquidated when market conditions are adverse.
|
|
•
|
Changes to the term structure of interest rates
. Rising or falling rates typically change by different amounts along the yield curve. These changes may have unforeseen impacts on the value of certain assets.
|
|
•
|
Market volatility/changes in the real or perceived credit quality of investments
. Deterioration in the quality of investments, identified through changes to our own or third party (e.g., rating agency) assessments, will reduce the value and potentially the liquidity of investments.
|
|
•
|
Concentration Risk
. If the investment portfolio is highly concentrated in one asset, or in multiple assets whose values are highly correlated, the value of the total portfolio may be greatly affected by the change in value of just one asset or a group of highly correlated assets.
|
|
•
|
Prepayment Risk
. Bonds may have call provisions that permit debtors to repay prior to maturity when it is to their advantage. This typically occurs when rates fall below the interest rate of the debt.
|
We did not have any market risk at
December 31, 2012
as a result of our portfolio being primarily comprised of cash prior to receiving GSE approval in January 2013. The only investments held were short-term securities. At
December 31, 2013
, the duration of our fixed income portfolio, including cash and cash equivalents, was
3.15
years, which means that an instantaneous parallel shift (movement up or down) in the yield curve of 100 basis points would result in a change of
3.15%
in fair value of our fixed income portfolio. Excluding cash, our fixed income portfolio duration was
3.46
years, which means that an instantaneous parallel shift (movement up or down) in the yield curve of 100 basis points would result in a change of
3.46%
in fair value of our fixed income portfolio.
88
INDEX TO FINANCIAL STATEMENTS
|
Report of Independent Registered Public Accounting Firm - BDO USA LLP
|
|
|
Consolidated Balance Sheets as of December 31, 2013 and 2012
|
|
|
Consolidated Statements of Comprehensive Loss for each of the three years in the period ended December 31, 2013
|
|
|
Consolidated Statements of Changes in Shareholders' Equity for each of the three years in the period ended December 31, 2013
|
|
|
Consolidated Statements of Cash Flows for each of the three years in the period ended December 31, 2013
|
|
|
Notes to Consolidated Financial Statements
|
|
89
REPORT OF INDEPENDENT REGISTERED PUBLIC ACCOUNTING FIRM
Board of Directors and Stockholders
NMI Holdings, Inc.
Emeryville, CA
We have audited the accompanying consolidated balance sheets of NMI Holdings, Inc. as of December 31, 2013 and 2012 and the related consolidated statement of comprehensive loss, changes in stockholders’ equity, and cash flows for each of the two years in the period ended December 31, 2013 and for the period from May 19, 2011 (inception) to December 31, 2011. In connection with our audits of the financial statements, we have also audited the financial statement schedules listed in the accompanying index. These financial statements and schedules are the responsibility of the Company’s management. Our responsibility is to express an opinion on these financial statements and schedules based on our audits.
We conducted our audits in accordance with the standards of the Public Company Accounting Oversight Board (United States). Those standards require that we plan and perform the audit to obtain reasonable assurance about whether the financial statements are free of material misstatement. The Company is not required to have, nor were we engaged to perform, an audit of its internal control over financial reporting. Our audits included consideration of internal control over financial reporting as a basis for designing audit procedures that are appropriate in the circumstances, but not for the purpose of expressing an opinion on the effectiveness of the Company’s internal control over financial reporting. Accordingly, we express no such opinion. An audit also includes examining, on a test basis, evidence supporting the amounts and disclosures in the financial statements, assessing the accounting principles used and significant estimates made by management, as well as evaluating the overall presentation of the financial statements and schedules. We believe that our audits provide a reasonable basis for our opinion.
In our opinion, the consolidated financial statements referred to above present fairly, in all material respects, the financial position of NMI Holdings, Inc. at December 31, 2013 and 2012, and the results of its operations and its cash flows for each of the two years in the period ended December 31, 2013
and for the period from May 19, 2011 (inception) to December 31, 2011, in conformity with accounting principles generally accepted in the United States of America.
Also, in our opinion, the financial statement schedules, when considered in relation to the basic consolidated financial statements taken as a whole, present fairly, in all material respects, the information set forth therein.
/s/ BDO USA, LLP
San Francisco, CA.
March 12, 2014
90
NMI HOLDINGS, INC.
CONSOLIDATED BALANCE SHEETS
|
December 31, 2013
|
December 31, 2012
|
||||||
|
Assets
|
(In Thousands, except for share data)
|
||||||
|
Investments, available-for-sale, at fair value:
|
|||||||
|
Fixed maturities (amortized cost of $416,135 and $0 as of December 31, 2013 and December 31, 2012, respectively)
|
$
|
409,088
|
|
$
|
—
|
|
|
|
Short-term investments
|
—
|
|
4,864
|
|
|||
|
Total investments
|
409,088
|
|
4,864
|
|
|||
|
Cash and cash equivalents
|
55,929
|
|
485,855
|
|
|||
|
Accrued investment income
|
2,001
|
|
6
|
|
|||
|
Prepaid expenses
|
1,519
|
|
417
|
|
|||
|
Restricted cash
|
—
|
|
40,338
|
|
|||
|
Deferred policy acquisition costs, net
|
90
|
|
—
|
|
|||
|
Goodwill and other indefinite lived intangible assets
|
3,634
|
|
3,634
|
|
|||
|
Software and equipment, net
|
8,876
|
|
7,550
|
|
|||
|
Premiums receivable
|
19
|
|
—
|
|
|||
|
Other assets
|
63
|
|
104
|
|
|||
|
Total Assets
|
$
|
481,219
|
|
$
|
542,768
|
|
|
|
Liabilities
|
|||||||
|
Unearned premiums
|
$
|
1,446
|
|
$
|
—
|
|
|
|
Reserve for insurance claims and claims expenses
|
—
|
|
—
|
|
|||
|
Accounts payable and accrued expenses
|
10,052
|
|
8,707
|
|
|||
|
Placement fee payable
|
—
|
|
38,305
|
|
|||
|
Purchase consideration payable
|
—
|
|
2,033
|
|
|||
|
Warrant liability, at fair value
|
6,371
|
|
4,842
|
|
|||
|
Deferred tax liability
|
133
|
|
133
|
|
|||
|
Total Liabilities
|
18,002
|
|
54,020
|
|
|||
|
Commitments and Contingencies
|
|
|
|
|
|||
|
Shareholders' Equity
|
|||||||
|
Common stock - Class A shares, $0.01 par value,
58,052,480 and 55,250,100 shares issued and outstanding as of December 31, 2013 and December 31, 2012, respectively (250,000,000 shares authorized) |
581
|
|
553
|
|
|||
|
Common stock - Class B shares, $0.01 par value, 0 and 250,000 shares issued and outstanding as of December 31, 2013 and December 31, 2012, respectively (250,000 authorized)
|
—
|
|
2
|
|
|||
|
Additional paid-in capital
|
553,707
|
|
517,032
|
|
|||
|
Accumulated other comprehensive (loss) income
|
(7,047
|
)
|
1
|
|
|||
|
Accumulated deficit
|
(84,024
|
)
|
(28,840
|
)
|
|||
|
Total Shareholders' Equity
|
463,217
|
|
488,748
|
|
|||
|
Total Liabilities and Shareholders' Equity
|
$
|
481,219
|
|
$
|
542,768
|
|
|
See accompanying notes to consolidated financial statements.
91
NMI HOLDINGS, INC.
CONSOLIDATED STATEMENTS OF COMPREHENSIVE LOSS
|
For the Year Ended December 31,
|
For the Period May 19, 2011 (inception) to December 31, 2011
|
||||||||||
|
2013
|
2012
|
||||||||||
|
(In Thousands, except for share data)
|
|||||||||||
|
Revenues
|
|||||||||||
|
Premiums written
|
|||||||||||
|
Direct
|
$
|
3,541
|
|
$
|
—
|
|
$
|
—
|
|
||
|
Net premiums written
|
3,541
|
|
—
|
|
—
|
|
|||||
|
Increase in unearned premium
|
(1,446
|
)
|
—
|
|
—
|
|
|||||
|
Net premiums earned
|
2,095
|
|
—
|
|
—
|
|
|||||
|
Net investment income
|
4,808
|
|
6
|
|
—
|
|
|||||
|
Net realized investment gains
|
186
|
|
—
|
|
—
|
|
|||||
|
(Loss) Gain from change in fair value of warrant liability
|
(1,529
|
)
|
278
|
|
—
|
|
|||||
|
Total Revenues
|
5,560
|
|
284
|
|
—
|
|
|||||
|
Expenses
|
|||||||||||
|
Insurance claims and claims expenses, net
|
—
|
|
—
|
|
—
|
|
|||||
|
Amortization of deferred policy acquisition costs
|
1
|
|
—
|
|
—
|
|
|||||
|
Other underwriting and operating expenses
|
60,743
|
|
27,775
|
|
1,349
|
|
|||||
|
Total Expenses
|
60,744
|
|
27,775
|
|
1,349
|
|
|||||
|
Net Loss
|
$
|
(55,184
|
)
|
$
|
(27,491
|
)
|
$
|
(1,349
|
)
|
||
|
Other Comprehensive (Loss) Income (net of tax)
|
|||||||||||
|
Net unrealized holding (losses) gains for the period included in accumulated other comprehensive (loss) income
|
(7,047
|
)
|
1
|
|
—
|
|
|||||
|
Other Comprehensive (Loss) Income (net of tax)
|
(7,047
|
)
|
1
|
|
—
|
|
|||||
|
Total Comprehensive Loss
|
$
|
(62,231
|
)
|
$
|
(27,490
|
)
|
$
|
(1,349
|
)
|
||
|
Loss per share
|
|||||||||||
|
Basic and diluted loss per share
|
$
|
(0.99
|
)
|
$
|
(0.73
|
)
|
$
|
(13,490.00
|
)
|
||
|
Weighted average common shares outstanding
|
56,005,326
|
|
37,909,936
|
|
100
|
|
|||||
See accompanying notes to consolidated financial statements.
92
NMI HOLDINGS, INC.
CONSOLIDATED STATEMENTS OF CHANGES IN SHAREHOLDERS' EQUITY
|
Common stock
|
Additional Paid-in capital
|
Accumulated Other Comprehensive Income (Loss)
|
Accumulated Deficit
|
Total
|
||||||||||||||||||
|
Class A
|
Class B
|
|||||||||||||||||||||
|
Shares
|
Amount
|
Shares
|
Amount
|
|||||||||||||||||||
|
(In Thousands)
|
||||||||||||||||||||||
|
Balance, May 19, 2011 (inception)
|
—
|
|
$
|
—
|
|
—
|
|
$
|
—
|
|
$
|
—
|
|
$
|
—
|
|
$
|
—
|
|
$
|
—
|
|
|
Issuance of common stock
|
*
|
|
*
|
|
—
|
|
—
|
|
—
|
|
—
|
|
—
|
|
*
|
|
||||||
|
Net loss
|
—
|
|
—
|
|
—
|
|
—
|
|
—
|
|
—
|
|
(1,349
|
)
|
(1,349
|
)
|
||||||
|
Balance, December 31, 2011
|
—
|
|
$
|
—
|
|
—
|
|
$
|
—
|
|
$
|
—
|
|
$
|
—
|
|
$
|
(1,349
|
)
|
$
|
(1,349
|
)
|
|
Balance, December 31, 2011
|
—
|
|
$
|
—
|
|
—
|
|
$
|
—
|
|
$
|
—
|
|
$
|
—
|
|
$
|
(1,349
|
)
|
$
|
(1,349
|
)
|
|
Issuance of Class A shares of common stock
|
55,000
|
|
551
|
|
—
|
|
—
|
|
508,419
|
|
—
|
|
—
|
|
508,970
|
|
||||||
|
Issuance of Class B shares of common stock
|
—
|
|
—
|
|
250
|
|
2
|
|
—
|
|
—
|
|
—
|
|
2
|
|
||||||
|
Issuance of common stock related to acquisition of subsidiaries
|
250
|
|
2
|
|
—
|
|
—
|
|
2,498
|
|
—
|
|
—
|
|
2,500
|
|
||||||
|
Share-based compensation expense
|
—
|
|
—
|
|
—
|
|
—
|
|
6,115
|
|
—
|
|
—
|
|
6,115
|
|
||||||
|
Change in unrealized investment gains/losses
|
—
|
|
—
|
|
—
|
|
—
|
|
—
|
|
1
|
|
—
|
|
1
|
|
||||||
|
Net loss
|
—
|
|
—
|
|
—
|
|
—
|
|
—
|
|
—
|
|
(27,491
|
)
|
(27,491
|
)
|
||||||
|
Balance, December 31, 2012
|
55,250
|
|
$
|
553
|
|
250
|
|
$
|
2
|
|
$
|
517,032
|
|
$
|
1
|
|
$
|
(28,840
|
)
|
$
|
488,748
|
|
|
Balance, January 1, 2013
|
55,250
|
|
$
|
553
|
|
250
|
|
$
|
2
|
|
$
|
517,032
|
|
$
|
1
|
|
$
|
(28,840
|
)
|
$
|
488,748
|
|
|
Issuance of Class A shares of common stock related to restricted stock units
|
137
|
|
1
|
|
—
|
|
—
|
|
(1,579
|
)
|
—
|
|
—
|
|
(1,578
|
)
|
||||||
|
Issuance of Class A shares of common stock related to initial public offering (net of expenses of $3,483)
|
2,415
|
|
25
|
|
—
|
|
—
|
|
27,887
|
|
—
|
|
—
|
|
27,912
|
|
||||||
|
Conversion of Class B shares of common stock into Class A shares of common stock
|
250
|
|
2
|
|
(250
|
)
|
(2
|
)
|
—
|
|
—
|
|
—
|
|
—
|
|
||||||
|
Share-based compensation expense
|
—
|
|
—
|
|
—
|
|
—
|
|
10,367
|
|
—
|
|
—
|
|
10,367
|
|
||||||
|
Change in unrealized investment gains/losses
|
—
|
|
—
|
|
—
|
|
—
|
|
—
|
|
(7,048
|
)
|
—
|
|
(7,048
|
)
|
||||||
|
Net loss
|
—
|
|
—
|
|
—
|
|
—
|
|
—
|
|
—
|
|
(55,184
|
)
|
(55,184
|
)
|
||||||
|
Balance, December 31, 2013
|
58,052
|
|
$
|
581
|
|
—
|
|
$
|
—
|
|
$
|
553,707
|
|
$
|
(7,047
|
)
|
$
|
(84,024
|
)
|
$
|
463,217
|
|
|
*
|
At inception, we issued
100
common shares with a par value of
$0.01
to FBR & Co. in consideration of their investment of
$1
in the Company, which are not visible in this schedule due to rounding.
|
See accompanying notes to consolidated financial statements.
93
NMI HOLDINGS, INC.
CONSOLIDATED STATEMENTS OF CASH FLOWS
|
For the Year Ended December 31, 2013
|
For the Year Ended December 31, 2012
|
For the Period May 19, 2011 (inception) to December 31, 2011
|
|||||||||
|
Cash Flows from Operating Activities
|
(In Thousands)
|
||||||||||
|
Net loss
|
$
|
(55,184
|
)
|
$
|
(27,491
|
)
|
$
|
(1,349
|
)
|
||
|
Adjustments to reconcile net loss to net cash used in operating activities:
|
|||||||||||
|
Share-based compensation expense
|
10,367
|
|
6,115
|
|
—
|
|
|||||
|
Warrants issued in connection with line of credit
|
—
|
|
1,620
|
|
—
|
|
|||||
|
Loss (gain) from change in fair value of warrant liability
|
1,529
|
|
(278
|
)
|
—
|
|
|||||
|
Net realized investment gains
|
(186
|
)
|
—
|
|
—
|
|
|||||
|
Loss on impairment
|
—
|
|
1,200
|
|
—
|
|
|||||
|
Depreciation and other amortization
|
8,116
|
|
3
|
|
—
|
|
|||||
|
Changes in operating assets and liabilities:
|
|||||||||||
|
Accrued investment income
|
(2,001
|
)
|
(6
|
)
|
—
|
|
|||||
|
Unearned premiums
|
1,446
|
|
—
|
|
—
|
|
|||||
|
Prepaid expenses
|
(1,102
|
)
|
(234
|
)
|
(183
|
)
|
|||||
|
Deferred policy acquisition costs, net
|
(90
|
)
|
—
|
|
—
|
|
|||||
|
Premiums receivable
|
(19
|
)
|
—
|
|
—
|
|
|||||
|
Other assets
|
46
|
|
(78
|
)
|
(27
|
)
|
|||||
|
Accounts payable and accrued expenses
|
767
|
|
4,553
|
|
1,354
|
|
|||||
|
Net Cash Used in Operating Activities
|
(36,311
|
)
|
(14,596
|
)
|
(205
|
)
|
|||||
|
Cash Flows from Investing Activities
|
|||||||||||
|
Purchase of short-term investments
|
(510
|
)
|
(4,862
|
)
|
—
|
|
|||||
|
Purchase of fixed maturities, available-for-sale
|
(559,875
|
)
|
—
|
|
—
|
|
|||||
|
Proceeds from maturity of short-term investments
|
5,374
|
|
—
|
|
—
|
|
|||||
|
Proceeds from sale of fixed maturities, available-for-sale
|
141,754
|
|
—
|
|
—
|
|
|||||
|
Purchase of software and equipment
|
(6,692
|
)
|
(2,447
|
)
|
—
|
|
|||||
|
Acquisition of subsidiaries
|
—
|
|
(2,500
|
)
|
—
|
|
|||||
|
Net Cash Used in Investing Activities
|
(419,949
|
)
|
(9,809
|
)
|
—
|
|
|||||
|
Cash Flows from Financing Activities
|
|||||||||||
|
(Payments) Proceeds on line of credit
|
—
|
|
(205
|
)
|
205
|
|
|||||
|
Taxes paid related to net share settlement of equity awards
|
(1,578
|
)
|
—
|
|
—
|
|
|||||
|
Issuance of common stock
|
27,912
|
|
510,465
|
|
—
|
|
|||||
|
Net Cash Provided by Financing Activities
|
26,334
|
|
510,260
|
|
205
|
|
|||||
|
Net (Decrease) Increase in Cash and Cash Equivalents
|
(429,926
|
)
|
485,855
|
|
—
|
|
|||||
|
Cash and Cash Equivalents, beginning of period
|
485,855
|
|
—
|
|
—
|
|
|||||
|
Cash and Cash Equivalents, end of period
|
$
|
55,929
|
|
$
|
485,855
|
|
$
|
—
|
|
||
|
Supplemental Disclosures of Cash Flow Information
|
|||||||||||
|
Restricted Cash
|
$
|
—
|
|
$
|
40,338
|
|
$
|
—
|
|
||
|
Noncash Financing Activities
|
|||||||||||
|
Conversion of Class B shares of common stock into Class A shares of common stock
|
2
|
|
—
|
|
—
|
|
|||||
|
Acquisition of subsidiaries
|
|||||||||||
|
Warrants issued in connection with acquisition of subsidiaries
|
—
|
|
3,500
|
|
—
|
|
|||||
|
Common stock issued in connection with acquisition of subsidiaries
|
—
|
|
2,500
|
|
—
|
|
|||||
See accompanying notes to consolidated financial statements.
94
NMI HOLDINGS, INC.
NOTES TO CONSOLIDATED FINANCIAL STATEMENTS
1. Organization and Basis of Presentation
NMI Holdings, Inc. ("NMIH"), a Delaware corporation, was formed in May 2011 with the intention of providing private mortgage guaranty insurance through a wholly owned insurance subsidiary. From May 2011 through March 2013, our activities were limited to raising capital, seeking to acquire the assets and approvals necessary to become a private mortgage guaranty insurance provider and hiring personnel. The accompanying consolidated financial statements include the accounts of NMI Holdings, Inc. and its wholly owned subsidiaries, MAC Financial Holding Corporation, National Mortgage Insurance Corporation ("NMIC"), previously named Mortgage Assurance Corporation, National Mortgage Reinsurance Inc One ("Re One"), previously named Mortgage Assurance Reinsurance Inc One, and National Mortgage Reinsurance Inc Two ("Re Two"), previously named Mortgage Assurance Reinsurance Inc Two. In April 2013, we, through our primary insurance subsidiary, wrote our first mortgage guaranty insurance policy. On September 30, 2013, we merged Re Two into NMIC with NMIC surviving the merger and MAC Financial Holding Corporation merged into NMI Holdings, Inc., with NMI Holdings, Inc. surviving the merger.
On November 30, 2011, we entered into an agreement with MAC Financial Ltd. to acquire MAC Financial Holding Corporation and its subsidiaries, Mortgage Assurance Corporation, Mortgage Assurance Reinsurance Inc One and Mortgage Assurance Reinsurance Inc Two, for
$8.5 million
in cash, common stock and warrants plus the assumption of
$1.3 million
in liabilities . In addition, we incurred
$0.1 million
in tax liabilities as a result of the acquisition of certain indefinite-lived intangibles. The MAC Acquisition was completed in April 2012.
In April 2012, we offered and sold
55.0 million
shares of common stock at an issue price of
$10.00
per share in our Private Placement. Gross proceeds from the Private Placement were
$550.0 million
. Net proceeds from the Private Placement, after an approximate
7%
underwriting fee and other offering expenses, were approximately
$510 million
. The fee was escrowed for the benefit of FBR Capital Markets and Co. ("FBR") and was released to FBR upon our receipt of approval from Federal National Home Mortgage Association ("Fannie Mae") and Federal Home Loan Mortgage Corporation ("Freddie Mac") ("GSE Approval").
Under the terms of the Private Placement, we had until January 17, 2013 to obtain GSE Approval ("GSE Approval Deadline"). NMIC was approved as an eligible mortgage guaranty insurer by Freddie Mac and Fannie Mae, on January 15, 2013 and January 16, 2013, respectively, which approvals are conditioned upon NMIC maintaining certain conditions. For a further discussion of these conditions, see
"Note 9, Commitments and Contingencies."
In November 2013, we completed an initial public offering of
2.4
million shares of our common stock and our common stock began trading on the NASDAQ on November 8, 2013, under the symbol “NMIH.” For a further discussion see
"Note 3, Common Stock Offerings."
Basis of Presentation
The accompanying consolidated financial statements include the results of NMIH and its wholly owned subsidiaries. All intercompany transactions have been eliminated. These financial statements have been prepared in accordance with GAAP and our accounts are maintained in US dollars. The preparation of financial statements in accordance with GAAP requires management to make estimates and assumptions that affect reported amounts of assets and liabilities, as well as disclosure of contingent assets and liabilities as of the balance sheet date. Estimates also affect the reported amounts of income and expenses for the reporting period. Actual results could differ from those estimates.
Basic net loss per share is based on the weighted-average number of common shares outstanding, while diluted net loss per share is based on the weighted-average number of common shares outstanding and common stock equivalents that would be issuable upon the exercise of stock options, other stock-based compensation arrangements, and the dilutive effect of outstanding warrants. As a result of our net losses for the years ended
December 31, 2013
and
December 31, 2012
,
5,303,394
and
4,414,165
shares of our common stock equivalents issued under stock-based compensation arrangements and warrants, respectively, were not included in the calculation of diluted net loss per share as of such dates because they were anti-dilutive.
2. Summary of Accounting Principles
Cash and Cash Equivalents
We consider items such as certificates of deposit and money market funds with original maturities of 90 days or less to be cash equivalents.
There was no restricted cash as of
December 31, 2013
; however, we had restricted cash as of
December 31, 2012
. The restricted cash balance was comprised of
two
escrow accounts that were initially funded on April 24, 2012, in connection with our
95
NMI HOLDINGS, INC.
NOTES TO CONSOLIDATED FINANCIAL STATEMENTS
Private Placement, with an agreement that the funds would be released to FBR and MAC Financial Ltd. upon GSE Approval. On January 23, 2013, after receipt of GSE approval, the restricted cash was released from escrow.
Investments
We have designated our investment portfolio as available-for-sale and report it at fair value. The related unrealized gains and losses are, after considering the related tax expense or benefit, recognized as a component of accumulated other comprehensive (loss) income in shareholders' equity. Net realized investment gains and losses are reported in income based upon specific identification of securities sold.
Purchases and sales of investments are recorded on a trade date basis. Net investment income is recognized when earned and includes interest and dividend income together with amortization of market premiums and discounts using the effective yield method and is net of investment management fees and other investment related expenses. For asset-backed securities and any other holdings for which there is a prepayment risk, prepayment assumptions are evaluated and revised as necessary. Any adjustments required due to the change in effective yields and maturities are recognized on a prospective basis through yield adjustments.
Each quarter we evaluate our investments in order to determine whether declines in fair value below amortized cost were considered other-than-temporary in accordance with applicable guidance. In evaluating whether a decline in fair value is other-than-temporary, we consider several factors including, but not limited to:
|
•
|
our intent to sell the security or whether it is more likely than not that we will be required to sell the security before recovery;
|
|
•
|
severity and duration of the decline in fair value;
|
|
•
|
the financial condition of the issuer;
|
|
•
|
the failure of the issuer to make scheduled interest or principal payments;
|
|
•
|
recent credit downgrades of the applicable security or the issuer below investment grade; and
|
|
•
|
adverse conditions specifically related to the security, an industry, or a geographic area.
|
Under the current guidance, a debt security impairment is deemed other than temporary if (i) we either intend to sell the security, or it is more likely than not that we will be required to sell the security before recovery or (ii) we do not expect to collect cash flows sufficient to recover the amortized cost basis of the security. In the event of the decline in fair value of a debt security, a holder of that security that does not intend to sell the debt security and for whom it is more likely than not that such holder will be required to sell the debt security before recovery of its amortized cost basis is required to separate the decline in fair value into (a) the amount representing the credit loss and (b) the amount related to other factors. The amount of total decline in fair value related to the credit loss shall be recognized in earnings as OTTI with the amount related to other factors recognized in accumulated other comprehensive income or loss, net of tax. In periods after recognition of an OTTI on debt securities, we account for such securities as if they had been purchased on the measurement date of the OTTI at an amortized cost basis equal to the previous amortized cost basis less the OTTI recognized in earnings. For debt securities for which OTTI were recognized in earnings, the difference between the new amortized cost basis and the cash flows expected to be collected will be accreted into net investment income. The determination of OTTI is a subjective process, and different judgments and assumptions could affect the timing of the loss realization.
Revenue Recognition
In the mortgage guaranty insurance industry, a “book” is a group of loans that an MI company insures in a particular period, normally a calendar year.
We set premiums at the time a policy is issued based on our expectations regarding likely performance over the term of coverage. The policies we write are guaranteed renewable contracts at the policyholder's option on a single, annual or monthly premium basis. We generally have no ability to re-underwrite or reprice these contracts. However, we review every loan and through this review process confirm underwriting eligibility, either prior to loan closing in the non-delegated channel or through a post-closing underwriting review in the delegated channel. Based on this review, we may re-price. Premiums written on a single premium basis and an annual premium basis are initially deferred as unearned premium reserve and earned over the policy term. Premiums written on policies covering more than one year are amortized over the policy life in accordance with the expiration of risk which is the anticipated claim payment pattern based on industry experience. Premiums written on annual policies are earned on a monthly pro rata basis. Premiums written on monthly policies are earned as coverage is provided. Premiums written on pool transactions are earned over the period that coverage is provided. Upon cancellation of a policy, all premium that is non-refundable is immediately earned. Any refundable premium is returned to the policyholder. Premiums returned to policyholders are recorded as a reduction of written and earned premiums in the current period. The actual return of premium for all periods affects premiums written and earned in those periods.
96
NMI HOLDINGS, INC.
NOTES TO CONSOLIDATED FINANCIAL STATEMENTS
For the year ended
December 31, 2013
,
one
insured represented
97%
of our NIW. At
December 31, 2013
, approximately
28%
of our IIF was concentrated in
California
. We commenced mortgage guaranty insurance operations in April of 2013. As such, our insurance-in-force and customer concentrations are not representative of those concentrations that will exist when our insurance portfolio is more mature. Furthermore, given the relatively small size of the portfolio, small concentrations can appear to be larger than normal.
Deferred Policy Acquisition Costs
Costs directly associated with the successful acquisition of mortgage guaranty insurance policies, consisting of certain selling expenses and other policy issuance and underwriting expenses, are initially deferred and reported as deferred policy acquisition costs ("DAC"). For each book year of business, these costs are amortized to income in proportion to estimated gross profits over the estimated life of the policies.
Business Combinations, Goodwill and Intangible Assets
Goodwill represents the excess of the purchase price over the estimated fair value of net assets acquired from a business combination. In accordance with ASC 350,
Intangibles - Goodwill and Other
, we test goodwill for impairment during the third quarter each year or more frequently if we believe indicators of impairment exist. We have not identified any impairments of goodwill through
December 31, 2013
.
Our intangible assets consist of state licenses and GSE applications which have indefinite lives. We test indefinite-lived intangible assets for impairment during the fourth quarter of each year or more frequently if we believe indicators of impairment exist. We do not believe that the indefinite-lived intangible assets were impaired as of
December 31, 2013
.
Software and Equipment
Software and equipment are stated at cost, less accumulated amortization and depreciation. Amortization and depreciation are calculated using the straight-line method over the estimated useful lives of the respective assets ranging typically from
3
to
7
years, unless factors indicate a shorter useful life. Amortization of software and depreciation of equipment commences at the beginning of the month following the placement of the assets into use by us. We have reduced the useful life of our insurance management system. For further detail see "
Note 7, Software and Equipment."
Warrants
We account for warrants to purchase our common shares in accordance with ASC 470-20
Debt with Conversion and Other Options
and ASC 815-40
Derivatives and Hedging - Contracts in Entity's Own Equity.
Our outstanding warrants, issued to FBR and former stockholders of MAC Financial Ltd., may be settled by us using either (i) physical settlement method or (ii) cashless exercise, where shares that are issued upon exercise of the warrants are reduced, to cover the cost of the exercise, in lieu of the holder remitting a cash payment of the exercise price. The warrants expire and are not exercisable on the 10
th
anniversary after the date the warrant was issued. The exercise price and the number of warrants are subject to anti-dilution provisions whereby the existing exercise price is adjusted downward, and the number of warrants increased, for events that may not be dilutive. The adjustment may be in excess of any dilution suffered. As a result, the warrants are classified as a liability. We revalue the warrants at the end of each reporting period and any change in fair value is reported in the statements of operations in the period in which the change occurred. The fair value of the warrants is calculated using a Black-Scholes option-pricing model in combination with a binomial model and a Monte Carlo simulation model used to value the pricing protection features within the warrant.
Share-Based Compensation
We account for stock compensation in accordance with ASC 718,
Compensation - Stock Compensation
. This addresses accounting for share-based awards and recognition of compensation expense, measured using grant date fair value, over the requisite service or performance period of the award. Share-based payments include RSUs and stock option grants under the 2012 Stock Incentive Plan. The fair value of stock option grants issued are determined based on an option pricing model which takes into account various assumptions that are subjective. Key assumptions used in the stock option valuation include the expected term of the equity award taking into account the contractual term of the award, the effects of expected exercise and post-vesting termination behavior, expected volatility, expected dividends and the risk-free interest rate for the expected term of the award. RSU grants to employees contain a market condition and/or service condition. The fair value of RSU grants to employees with a market condition is determined based on a Monte Carlo simulation model at the date of grant. RSU grants to employees with a service condition and RSU grants to non-employee directors are valued at our stock price on the date of grant less the present value of anticipated dividends.
97
NMI HOLDINGS, INC.
NOTES TO CONSOLIDATED FINANCIAL STATEMENTS
Offering and Incorporation Expenses
Offering expenses incurred in connection with our capitalization were recorded as a reduction of paid-in-capital at closing. These costs include certain investment banking fees, legal fees, printer fees and audit fees. Any incorporation and organizational expenses not related to the raising of capital are expensed as incurred and are included in the statement of operations.
Reserve for Insurance Claims and Claims Expenses
We establish reserves to recognize the estimated liability for insurance claims and claim expenses related to defaults on insured mortgage loans. Our method, consistent with industry practice, is to establish claims reserves only for loans in default. We are a new company and have only recently commenced transacting mortgage guaranty insurance. We have not received any primary NODs, and thus have not established any primary reserves for claims or IBNR for the
years ended
December 31, 2013
,
2012
or
2011
. Additionally, we entered into a pool insurance transaction with Fannie Mae, effective September 1, 2013. For this pool transaction, any claims reserve potentially established would be in excess of the transaction's deductible, which represents the amount payable by Fannie Mae on initial claims. The consideration of the deductible would serve to delay the recording of any claim reserve until estimated claims exceed the deductible amount. In addition, all of the loans in the pool have LTVs below 80%. As a result, the potential for any one default to result in a loss to the insured is mitigated. We have not established any pool reserves for claims or IBNR for the
years ended
December 31, 2013
,
2012
or
2011
. See "
Note 9, Commitments and Contingencies"
, for more information on this pool transaction.
Premium Deficiency Reserves
After our insurance claim reserves are established, we will perform a premium deficiency calculation each fiscal quarter using best estimate assumptions as of the testing date. Per ASC 944, a premium deficiency reserve shall be recognized if the sum of expected claim costs and claim adjustment expenses, expected dividends to policyholders, unamortized acquisition costs, and maintenance costs exceeds related unearned premiums. Because we have not established any reserves, as discussed above, we have also determined that no premium deficiency reserves were necessary for the
years ended
December 31, 2013
,
2012
or
2011
.
Income Taxes
We account for income taxes using the liability method in accordance with ASC 740 -
Income Taxes
. The liability method measures the expected future tax effects of temporary differences at the enacted tax rates applicable for the period in which the deferred asset or liability is expected to be realized or settled. Temporary differences are differences between the tax basis of an asset or liability and its reported amount in the consolidated financial statements that will result in future increases or decreases in taxes owed on a cash basis compared to amounts already recognized as tax expense in the consolidated statement of operations.
We evaluate the need for a valuation allowance against our deferred tax assets on a quarterly basis. In the course of our review, we assess all available evidence, both positive and negative, including future sources of income, tax planning strategies, future contractual cash flows and reversing temporary differences. Additional valuation allowance benefits or charges could be recognized in the future due to changes in our expectation regarding the realization of tax benefits. Uncertain tax positions taken or expected to be taken in a tax return by us are recognized in the financial statements when it is more likely than not that the position would be sustained upon examination by tax authorities. There are no tax uncertainties that are expected to result in significant increases or decreases to unrecognized tax benefits within the next twelve month period.
In assessing the valuation of deferred tax assets, we consider whether it is more likely than not that some portion or all of the deferred tax assets will not be realized. The ultimate realization of deferred tax assets is dependent upon the generation of future taxable income during the periods in which those temporary differences become deductible.
Recent Accounting Standards Updates Adopted
Clarifying the Scope of Disclosures about Offsetting Assets and Liabilities
In January 2013, the FASB issued an Accounting Standards Update clarifying that the scope of Update 2011-11,
Balance Sheet (Topic 210): Disclosures about Offsetting Assets and Liabilities
, applies to derivatives accounted for in accordance with Topic 815,
Derivatives and Hedging
, including bifurcated embedded derivatives, repurchase agreements and reverse repurchase agreements, and securities borrowing and securities lending transactions that are either offset in accordance with Section 210-20-45 or Section 815-10-45 or subject to an enforceable master netting arrangement or similar agreement. The amendments are effective for fiscal years beginning on or after January 1, 2013, and interim periods within those annual periods. The adoption of this guidance in January 2013 did not have any effect on our results of operations, financial position or liquidity.
98
NMI HOLDINGS, INC.
NOTES TO CONSOLIDATED FINANCIAL STATEMENTS
Reporting of Amounts Reclassified Out of Accumulated Other Comprehensive Income
In February 2013, the FASB issued an Accounting Standards Update addressing the reporting of reclassifications out of accumulated other comprehensive income. The Update requires an entity to report the effect of significant reclassifications out of accumulated other comprehensive income on the respective line items in the statement of operations if the amount being reclassified is required under GAAP to be reclassified in its entirety to net income. For other amounts that are not required under GAAP to be reclassified in their entirety to net income in the same reporting period, an entity is required to cross-reference other disclosures required under GAAP that provide additional detail about those amounts. The adoption of this guidance in December 2013 did not have any impact on our results of operations, financial position or liquidity.
Reclassifications
Certain items in the financial statements as of
December 31, 2012
and for the periods ending
December 31, 2012
and
December 31, 2011
have been reclassified to conform to the current period's presentation. There was no effect on net income or shareholders' equity previously reported.
Subsequent Events
On January 24, 2014, NMIC's principal regulator declined to disapprove of the faculative pool excess share reinsurance agreement with Re One, which was effective September 1, 2013.
On January 30, 2014, Arch announced the closing of its acquisition of CMG and certain assets of PMI. The terms of the February 7, 2013 Asset Purchase Agreement ("APA") between Arch and PMI provide that effective as of the closing of that transaction, PMI shall transfer and assign to Arch all causes of action being pursued by PMI in the PMI Complaint. The APA further provides that within thirty (30) days after the closing of the transaction, Arch shall have its attorney file appropriate pleadings and other documents and instruments with the court requesting that PMI be removed as a party plaintiff in the PMI Complaint and that Arch be substituted as the real party in interest. Although Arch has not yet filed any such request with the Court, the plaintiff is now described in pleadings as “Plaintiff and Real Party in Interest Arch U.S. MI Services, Inc.”
We have considered subsequent events through the date of this filing.
3. Common Stock Offerings
We entered into a purchase/placement agreement with FBR on April 17, 2012 and offered and sold an aggregate of
55,000,000
of our Class A common shares resulting in net proceeds of approximately
$510 million
. In accordance with the terms of the Private Placement, we placed approximately
93%
(or
$476 million
) of our net proceeds from this Private Placement into investment accounts established for the purpose of preserving such proceeds, on a short-term basis, prior to approval from at least one of the GSEs, as an eligible mortgage guaranty insurance provider to the GSE. As provided in our certificate of incorporation, this amount was not to be disbursed (used for operating activities) until the earlier of (i) receipt by us of GSE Approval or (ii) our liquidation. Approximately
$35 million
of the net proceeds were available for paying the cash portion of the MAC Acquisition and to pay off the FBR line of credit. The remaining balance of approximately
$32 million
was placed in an operating account for the purpose of funding our operations through the time of GSE Approval.
The initial purchaser's discount and placement fee of
$38.3 million
was comprised of
$19.5 million
in common stock and
$18.8 million
in cash. On October 24, 2012, FBR sold the aforementioned common stock and proceeds of
$19.5 million
were retained in an escrow account until we received GSE Approval.
In January 2013, following GSE Approval, the escrow funds were released and distributed to FBR (its initial purchasers' discount and placement fees from the escrow account) and to MAC (its cash portion of the MAC Acquisition), respectively.
On November 8, 2013, we filed a final prospectus announcing the sale of
2.1 million
shares of common stock through an initial public offering. The underwriters of the offering were granted a 30-day option to purchase up to an additional
315,000
shares of common stock from us at an initial public offering price of
$13.00
, less underwriting discounts and commissions, to cover over-allotments. The principal reason for conducting the public offering was to expedite an increase in the number of holders of our common stock to permit a listing of our common stock on the NASDAQ. Obtaining a listing on the NASDAQ satisfied certain contractual obligations we had to our stockholders under a Registration Rights Agreement.
On November 12, 2013, the underwriters exercised their option in full to purchase an additional
315,000
shares of common stock at a price of
$13.00
per share, before underwriting discounts. The offering closed on November 14, 2013. Gross proceeds to us were
$31.4 million
. Net proceeds from the offering were approximately
$28 million
, after an approximate
6%
underwriting fee and other offering expenses and reimbursements pursuant to the underwriting agreement.
99
NMI HOLDINGS, INC.
NOTES TO CONSOLIDATED FINANCIAL STATEMENTS
4. Acquisition of MAC
On November 30, 2011, we entered into a definitive stock purchase agreement with MAC Financial Ltd. to acquire MAC Financial Holdings Corporation and its wholly owned subsidiaries (collectively "MAC"). The transaction closed shortly after the closing of the common stock Private Placement described above. Under the agreement, the total initial consideration paid for MAC was
$8.5 million
consisting of
$2.5 million
in cash,
$2.5 million
in our common stock, and warrants to acquire our common stock valued at
$3.5 million
. The consideration (net of expenses paid on MAC's behalf) was held in an escrow account until we received GSE Approval, upon which time it was released to MAC Financial Ltd. The total purchase consideration was allocated to the acquired assets and liabilities as follows:
|
April 24, 2012
|
(In Thousands)
|
||
|
Current assets
|
$
|
52
|
|
|
Intangibles
|
1,590
|
|
|
|
Capitalized software
|
5,000
|
|
|
|
Goodwill
|
3,244
|
|
|
|
Subtotal
|
9,886
|
|
|
|
Current liabilities and deferred tax liabilities
|
(1,386
|
)
|
|
|
Estimated fair value of net assets acquired
|
$
|
8,500
|
|
Pursuant to the terms of the stock purchase agreement, we assumed
$1.3 million
of MAC's existing liabilities, which related to outstanding payment obligations under its vendor contracts with CDW, LLC, Milliman, Inc., and Intellect/SEEC, Inc. and incurred
$0.1 million
in tax liabilities as a result of the acquisition of certain indefinite-lived intangibles. All other liabilities which existed at closing were the sole obligation of MAC Financial Ltd. As of
December 31, 2013
and
December 31, 2012
, the total amount of cash held in escrow (net of expenses paid on MAC's behalf) was
$0
and
$2.0 million
, respectively.
Included in the acquired intangibles of
$1.6 million
are operational manuals valued at
$1.2 million
which at the time of acquisition, were a key deliverable in our GSE application and were expected to be placed in service following GSE Approval. Subsequently, the processes and procedures underlying the operational manuals were reengineered to be substantially different as defined by our current management. Therefore, at December 31, 2012, we determined the carrying value of operational manuals would not be recovered and the manuals could not be sold and would be disposed of, and as a result, we assessed the fair value at zero and recognized a loss on impairment of
$1.2 million
in the fourth quarter of 2012.
5. Investments
Fair Values and Gross Unrealized Gains and Losses on Investments
|
Amortized
Cost |
Gross Unrealized
|
Fair
Value |
|||||||||||||
|
Gains
|
(Losses)
|
||||||||||||||
|
As of December 31, 2013
|
(In Thousands)
|
||||||||||||||
|
U.S. Treasury securities and obligations of U.S. government agencies
|
$
|
108,067
|
|
$
|
—
|
|
$
|
(1,461
|
)
|
$
|
106,606
|
|
|||
|
Municipal bonds
|
12,017
|
|
1
|
|
(85
|
)
|
11,933
|
|
|||||||
|
Corporate debt securities
|
221,899
|
|
157
|
|
(4,799
|
)
|
217,257
|
|
|||||||
|
Asset-backed securities
|
74,152
|
|
114
|
|
(974
|
)
|
73,292
|
|
|||||||
|
Total bonds
|
416,135
|
|
272
|
|
(7,319
|
)
|
409,088
|
|
|||||||
|
Short-term investments
|
39,695
|
|
—
|
|
—
|
|
39,695
|
|
|||||||
|
Total Investments
|
$
|
455,830
|
|
$
|
272
|
|
$
|
(7,319
|
)
|
$
|
448,783
|
|
|||
100
NMI HOLDINGS, INC.
NOTES TO CONSOLIDATED FINANCIAL STATEMENTS
|
Amortized
Cost |
Gross Unrealized
|
Fair
Value |
|||||||||||||
|
Gains
|
(Losses)
|
||||||||||||||
|
As of December 31, 2012
|
(In Thousands)
|
||||||||||||||
|
Short-term investments
|
$
|
4,863
|
|
$
|
1
|
|
$
|
—
|
|
$
|
4,864
|
|
|||
|
Total Investments
|
$
|
4,863
|
|
$
|
1
|
|
$
|
—
|
|
$
|
4,864
|
|
|||
Scheduled Maturities as of
December 31, 2013
The amortized cost and fair values of available for sale securities at
December 31, 2013
, by contractual maturity, are shown below. Expected maturities will differ from contractual maturities because issuers may have the right to call or prepay obligations with or without call or prepayment penalties. Because most asset-backed securities provide for periodic payments throughout their lives, they are listed below in separate categories.
|
Amortized
Cost |
Fair
Value |
||||||
|
(In Thousands)
|
|||||||
|
Due in one year or less
|
$
|
—
|
|
$
|
—
|
|
|
|
Due after one through five years
|
260,855
|
|
257,501
|
|
|||
|
Due after five through ten years
|
65,687
|
|
63,440
|
|
|||
|
Due after ten years
|
15,441
|
|
14,855
|
|
|||
|
Asset-backed securities
|
74,152
|
|
73,292
|
|
|||
|
Total Bonds
|
$
|
416,135
|
|
$
|
409,088
|
|
|
All investments held at
December 31, 2012
had a scheduled maturity of one year or less. The Company held no investments at
December 31, 2011
.
Net Realized Investment Gains (Losses) on Investments
|
For the Year Ended December 31, 2013
|
|||
|
(In Thousands)
|
|||
|
Corporate Bond
|
$
|
323
|
|
|
U.S. Treasury securities and obligations of U.S. government agencies
|
(87
|
)
|
|
|
Mortgage-backed security
|
(50
|
)
|
|
|
Total Net Realized Investment Gains
|
$
|
186
|
|
There were no realized investment gains or losses for the
years ended
December 31, 2012
and
2011
.
Aging of Unrealized Losses
At
December 31, 2013
, the investment portfolio had gross unrealized losses of approximately
$7 million
. We did not consider these securities to be other-than-temporarily impaired as of
December 31, 2013
. We based our conclusion on the following facts (i) the unrealized losses were generally caused by interest rate or credit spread movements since the purchase date; (ii) we did not intend to sell these investments and; (iii) we did not believe that it was more likely than not that we will be required to sell these investments before recovery of our amortized cost basis, which may be at maturity; therefore, we did not consider these investments to be other-than-temporarily impaired at
December 31, 2013
. For those securities in an unrealized loss position, the length of time the securities were in such a position is as follows:
101
NMI HOLDINGS, INC.
NOTES TO CONSOLIDATED FINANCIAL STATEMENTS
|
Less Than 12 Months
|
12 Months or Greater
|
Total
|
||||||||||||||||||
|
Fair Value
|
Unrealized Losses
|
Fair Value
|
Unrealized Losses
|
Fair Value
|
Unrealized Losses
|
|||||||||||||||
|
As of December 31, 2013
|
(In Thousands)
|
|||||||||||||||||||
|
U.S. Treasury securities and obligations of U.S. government agencies
|
$
|
106,606
|
|
$
|
(1,461
|
)
|
$
|
—
|
|
$
|
—
|
|
$
|
106,606
|
|
$
|
(1,461
|
)
|
||
|
Municipal bonds
|
4,915
|
|
(85
|
)
|
—
|
|
—
|
|
4,915
|
|
(85
|
)
|
||||||||
|
Corporate debt securities
|
187,714
|
|
(4,799
|
)
|
—
|
|
—
|
|
187,714
|
|
(4,799
|
)
|
||||||||
|
Assets-backed securities
|
58,225
|
|
(974
|
)
|
—
|
|
—
|
|
58,225
|
|
(974
|
)
|
||||||||
|
Total Bonds
|
$
|
357,460
|
|
$
|
(7,319
|
)
|
$
|
—
|
|
$
|
—
|
|
$
|
357,460
|
|
$
|
(7,319
|
)
|
||
At
December 31, 2012
, the investment portfolio had no unrealized losses.
Net investment income is comprised of the following:
|
For the Year Ended December 31, 2013
|
For the Year Ended December 31, 2012
|
For the Period May 19, 2011 (inception) to December 31, 2011
|
|||||||||
|
(In Thousands)
|
|||||||||||
|
Fixed maturities
|
$
|
5,289
|
|
$
|
4
|
|
$
|
—
|
|
||
|
Cash equivalents
|
—
|
|
2
|
|
—
|
|
|||||
|
Other
|
2
|
|
—
|
|
—
|
|
|||||
|
Investment income
|
5,291
|
|
6
|
|
—
|
|
|||||
|
Investment expenses
|
(483
|
)
|
—
|
|
—
|
|
|||||
|
Net Investment Income
|
$
|
4,808
|
|
$
|
6
|
|
$
|
—
|
|
||
As of
December 31, 2013
and
December 31, 2012
, there were approximately
$7 million
and
$5 million
, respectively, of cash and investments in the form of U.S. Treasury securities on deposit with various state insurance departments to satisfy regulatory requirements.
6. Fair Value of Financial Instruments
The following describes the valuation techniques used by us to determine the fair value of financial instruments held at
December 31, 2013
and
December 31, 2012
:
We established a fair value hierarchy by prioritizing the inputs to valuation techniques used to measure fair value. The hierarchy gives the highest priority to unadjusted quoted prices in active markets for identical assets or liabilities (Level 1 measurements) and the lowest priority to unobservable inputs (Level 3 measurements). The three levels of the fair value hierarchy under this standard are described below:
Level 1 - Unadjusted quoted prices for identical assets or liabilities in active markets that are accessible at the measurement date for identical assets or liabilities;
Level 2 - Prices or valuations based on observable inputs other than quoted prices in active markets for identical assets and liabilities; and
Level 3 - Unobservable inputs that are significant to the fair value of the assets or liabilities. Level 3 assets and liabilities include financial instruments whose value is determined using pricing models, discounted cash flow methodologies, or similar techniques, as well as instruments for which the determination of fair value requires significant management judgment or estimation.
The level of market activity used to determine the fair value hierarchy is based on the availability of observable inputs market participants would use to price an asset or a liability, including market value price observations.
102
NMI HOLDINGS, INC.
NOTES TO CONSOLIDATED FINANCIAL STATEMENTS
Assets classified as Level 1 and Level 2
To determine the fair value of securities available-for-sale in Level 1 and Level 2 of the fair value hierarchy, independent pricing sources have been utilized. One price is provided per security based on observable market data. To ensure securities are appropriately classified in the fair value hierarchy, we review the pricing techniques and methodologies of the independent pricing sources and believe that their policies adequately consider market activity, either based on specific transactions for the issue valued or based on modeling of securities with similar credit quality, duration, yield and structure that were recently traded. A variety of inputs are utilized by the independent pricing sources including benchmark yields, reported trades, non-binding broker/dealer quotes, issuer spreads, two sided markets, benchmark securities, bids, offers and reference data including data published in market research publications. Inputs may be weighted differently for any security, and not all inputs are used for each security evaluation. Market indicators, industry and economic events are also considered. This information is evaluated using a multidimensional pricing model. Quality controls are performed by the independent pricing sources throughout this process, which include reviewing tolerance reports, trading information and data changes, and directional moves compared to market moves. This model combines all inputs to arrive at a value assigned to each security. We have not made any adjustments to the prices obtained from the independent pricing sources.
Liabilities classified as Level 3
The warrants outstanding are valued using a Black-Scholes option-pricing model in combination with a binomial model and Monte Carlo simulation used to value the pricing protection features within the warrants. Variables in the model include the risk-free rate of return, dividend yield, expected life and expected volatility of our stock price. We assess any potential value associated with pricing protection features using internal models and management estimation.
ASC 825,
Disclosures about Fair Value of Financial Instruments
, requires all entities to disclose the fair value of their financial instruments, both assets and liabilities recognized and not recognized in the balance sheet, for which it is practicable to estimate fair value.
The following is a list of those assets and liabilities that are measured at fair value by hierarchy level as of
December 31, 2013
and
December 31, 2012
:
|
Fair Value Measurements Using
|
|||||||||||||||
|
Assets and Liabilities at Fair Value
|
Quoted Prices in
Active Markets for Identical Assets (Level 1) |
Significant Other
Observable Inputs (Level 2) |
Significant
Unobservable Inputs (Level 3) |
Fair Value
|
|||||||||||
|
As of December 31, 2013
|
(In Thousands)
|
||||||||||||||
|
U.S. Treasury securities and obligations of U.S. government agencies
|
$
|
49,484
|
|
$
|
57,122
|
|
$
|
—
|
|
$
|
106,606
|
|
|||
|
Municipal bonds
|
—
|
|
11,933
|
|
—
|
|
11,933
|
|
|||||||
|
Corporate debt securities
|
—
|
|
217,257
|
|
—
|
|
217,257
|
|
|||||||
|
Asset-backed securities
|
—
|
|
73,292
|
|
—
|
|
73,292
|
|
|||||||
|
Cash and cash equivalents
|
55,929
|
|
—
|
|
—
|
|
55,929
|
|
|||||||
|
Total Assets
|
$
|
105,413
|
|
$
|
359,604
|
|
$
|
—
|
|
$
|
465,017
|
|
|||
|
Warrant liability
|
—
|
|
—
|
|
$
|
6,371
|
|
$
|
6,371
|
|
|||||
|
Total Liabilities
|
$
|
—
|
|
$
|
—
|
|
$
|
6,371
|
|
$
|
6,371
|
|
|||
103
NMI HOLDINGS, INC.
NOTES TO CONSOLIDATED FINANCIAL STATEMENTS
|
Fair Value Measurements Using
|
|||||||||||||||
|
Assets and Liabilities at Fair Value
|
Quoted Prices in
Active Markets for Identical Assets (Level 1) |
Significant Other
Observable Inputs (Level 2) |
Significant
Unobservable Inputs (Level 3) |
Fair Value
|
|||||||||||
|
As of December 31, 2012
|
(In Thousands)
|
||||||||||||||
|
U.S. Treasury securities and obligations of U.S. government agencies
|
$
|
4,864
|
|
$
|
—
|
|
$
|
—
|
|
$
|
4,864
|
|
|||
|
Cash and cash equivalents
|
526,194
|
|
—
|
|
—
|
|
526,194
|
|
|||||||
|
Total Assets
|
$
|
531,058
|
|
$
|
—
|
|
$
|
—
|
|
$
|
531,058
|
|
|||
|
Warrant liability
|
—
|
|
—
|
|
$
|
4,842
|
|
$
|
4,842
|
|
|||||
|
Total Liabilities
|
$
|
—
|
|
$
|
—
|
|
$
|
4,842
|
|
$
|
4,842
|
|
|||
The following is a roll-forward of Level 3 liabilities measured at fair value for the
year ended December 31, 2013
:
|
Warrant Liability
|
|||
|
Year Ended December 31, 2013
|
(In Thousands)
|
||
|
Level 3 Instruments Only
|
|||
|
Balance, January 1, 2013
|
$
|
4,842
|
|
|
Change in fair value of warrant liability included in earnings
|
1,529
|
|
|
|
Balance, December 31, 2013
|
$
|
6,371
|
|
The fair value of the warrants issued to FBR and MAC Financial Ltd. was estimated on the date of grant using the Black-Scholes option-pricing model, including consideration of any potential additional value associated with pricing protection features. The volatility assumption used,
39.0%
, was derived from the historical volatility of the share price of a range of publicly-traded companies with similar types of business to that of ours. No allowance was made for any potential illiquidity associated with the private trading of our shares. We revalue the warrant liability quarterly using a Black-Scholes option-pricing model in combination with a binomial model and a Monte-Carlo simulation model used to value the pricing protection features within the warrant.
As of December 31, 2013
the assumptions used in the option pricing model were as follows: a common stock price as of
December 31, 2013
of
$12.73
, risk free interest rate of
2.25%
, expected life of
6.58 years
and a dividend yield of
0%
.
The carrying value of other selected assets on our consolidated balance sheet approximates fair value.
7. Software and Equipment
Software and equipment consist largely of capitalized software purchased in connection with the MAC Acquisition which had a fair value of
$5.0 million
at the date of acquisition. Software and equipment, net of accumulated amortization and depreciation, as of
December 31,
consist of the following:
|
2013
|
2012
|
||||||
|
(In Thousands)
|
|||||||
|
Software
|
$
|
14,140
|
|
$
|
7,268
|
|
|
|
Equipment
|
542
|
|
285
|
|
|||
|
Leasehold improvements
|
141
|
|
—
|
|
|||
|
Less accumulated amortization and depreciation
|
(5,947
|
)
|
(3
|
)
|
|||
|
Software and equipment, net
|
$
|
8,876
|
|
$
|
7,550
|
|
|
Amortization and depreciation expense for the
years ended
December 31, 2013
and
2012
was
$5.9 million
and
$3,000
, respectively.
104
NMI HOLDINGS, INC.
NOTES TO CONSOLIDATED FINANCIAL STATEMENTS
In connection with the MAC Acquisition in April 2012, we purchased an insurance management system. Given the time required to upgrade the underwriting module of the system, we made the business decision during the second quarter of 2013 to pursue the development of a new module to support (i) policy servicing and billing and (ii) default and claims management within a new insurance management system. We refer to this new insurance management platform as "AXIS", of which this new module is a component. The new policy servicing, billing and default and claims management module was deployed for production use in November 2013.
Additionally, during the fourth quarter of 2013, in order to reduce future operating costs, improve operational efficiencies and achieve a more flexible and enhanced user experience for loan originators, we decided to further enhance our underwriting module. The new design and development of this underwriting module started in late 2013 with deployment expected to occur in the fourth quarter of 2014. We have invested and will continue to invest resources to develop AXIS to support our MI operations.
As a result of the above changes, we were required to reduce the useful life of the purchased insurance management system and shorten the amortization period of the modules. Reducing the useful life of this system has the effect of shortening the amortization period, causing us to record the same amount of amortization expense over a shorter period of time, which was implemented in the second quarter of 2013 and will continue to amortize over the coming quarters. The modules will be completely amortized by November 2014.
8. Intangible Assets and Goodwill
Intangible assets and goodwill consist of identifiable intangible assets and goodwill purchased in connection with the MAC Acquisition. Intangible assets and goodwill, net, as of
December 31, 2013
and
December 31, 2012
, consist of the following:
|
As of December 31, 2013 and December 31, 2012
|
(In Thousands)
|
Expected Lives
|
|||
|
Goodwill
|
$
|
3,244
|
|
Indefinite
|
|
|
State licenses
|
260
|
|
Indefinite
|
||
|
GSE approvals
|
130
|
|
Indefinite
|
||
|
Total Intangible Assets and Goodwill
|
$
|
3,634
|
|
||
We test goodwill and intangibles for impairment in the third and fourth quarter, respectively, of every year, or more frequently if we believe indicators of impairment exist. At the time of the MAC Acquisition, we, as part of the acquisition, acquired operational manuals that were a key deliverable in our GSE application and were expected to be placed in service following GSE Approval. Subsequently, the processes and procedures underlying the operational manuals were reengineered to be substantially different as defined by our current management. Therefore, at December 31, 2012 we determined the carrying value of operational manuals would not be recovered and the manuals could not be sold and would be disposed, and as a result, assessed the fair value at zero and recognized a loss on impairment of
$1.2 million
. No impairments of indefinite-lived intangibles were identified as of
December 31, 2013
.
9. Commitments and Contingencies
GSE Approvals
Fannie Mae and Freddie Mac have imposed certain capitalization, operational and reporting conditions in connection with their approvals of NMIC as a qualified mortgage guaranty insurer. Some of these conditions remain in effect for a
three
(3) year period from the date of GSE Approval while others do not expressly expire. These conditions require, among other things, that NMIC:
|
•
|
be initially capitalized in the amount of
$200 million
and that its affiliate reinsurance companies, Re One and Re Two, be initially capitalized in the amount of
$10 million
each (as of September 30, 2013, Re Two was merged into NMIC, with NMIC surviving the merger. See "
|
|
•
|
maintain minimum capital of
$150 million
;
|
|
•
|
operate at a risk-to-capital ratio not to exceed
15
:1 for its first three (
3
) years and then pursuant to the GSE Eligibility Requirements then in effect;
|
|
•
|
not declare or pay dividends to affiliates or to NMIH for its first three (
3
) years, then pursuant to the Eligibility Requirements;
|
105
NMI HOLDINGS, INC.
NOTES TO CONSOLIDATED FINANCIAL STATEMENTS
|
•
|
not enter into capital support agreements or guarantees for the benefit of, or purchase or otherwise invest in the debt of, affiliates without the prior written approval of the GSEs for its first three (
3
) years, then pursuant to the Eligibility Requirements;
|
|
•
|
not enter into reinsurance or other risk share arrangements without the GSEs' prior written approval for its first three (
3
) years, then pursuant to the Eligibility Requirements; and
|
|
•
|
at the direction of one or both of the GSEs, re-domicile from Wisconsin to another state.
|
The conditional approvals also include certain additional conditions, limitations and reporting requirements that we anticipate will be included in the GSEs' final Eligibility Requirements, such as limits on costs allocated to NMIC under affiliate expense sharing arrangements, risk concentration, rates of return, requirements to obtain a financial strength rating, provision of ancillary services (i.e., non-insurance) to customers, transfers of underwriting to affiliates, notification requirements regarding change of ownership and new five percent (
5%
) shareholders, provisions regarding underwriting policies and claims processing as well as certain other obligations.
Fannie Mae Pool Transaction
NMIC entered into an agreement (effective coverage date of September 1, 2013) with Fannie Mae, pursuant to which NMIC insures a pool of approximately
22,000
loans with insurance-in-force of approximately
$5.2 billion
. In September 2013, NMIC received the first premium payment from Fannie Mae. The agreement has an expected term of
10
years from the coverage effective date.
The pool risk-in-force to NMIC, as of September 1, 2013 was
$93.1 million
which represents the amount between a deductible payable by Fannie Mae on initial losses and a stop loss, above which, losses are borne by Fannie Mae. NMIC provides this same level of risk coverage over the term of the agreement. The pool agreement obligates NMIC to maintain the greater of (i) the risk-to-capital requirements outlined in the January 2013 approval letter, or (ii) a risk-to-capital ratio of
18
:1 on primary business plus statutory capital equal to the amount of net risk-in-force of the pool.
In addition to the conditions noted above, NMIC, entered into risk-to-capital agreements with certain state insurance regulators. See
"Note 14, Statutory Financial Information
."
Office Lease
We entered into an office facility lease effective July 1, 2012 for a term of
two
years. In October 2013, we amended our facility’s lease to (i) add
23,000
square feet of furnished office space, and (ii) extend the facility’s lease period through October 31, 2017.
Management expects that, in the normal course of business, as of
December 31, 2013
, future minimum lease payments under this lease will be as follows:
|
Years ending December 31,
|
(In Thousands)
|
||
|
2014
|
$
|
1,570
|
|
|
2015
|
1,670
|
|
|
|
2016
|
1,741
|
|
|
|
2017
|
1,489
|
|
|
|
Totals
|
$
|
6,470
|
|
We incurred rent expense, related to this lease, of
$0.8 million
for the year ended December 31, 2013
. Rent expense
for the year ended December 31, 2012
was
$0.2 million
.
106
NMI HOLDINGS, INC.
NOTES TO CONSOLIDATED FINANCIAL STATEMENTS
10. Income Taxes
Following is a reconciliation of our net deferred income tax asset as of
December 31, 2013
and
December 31, 2012
:
|
December 31, 2013
|
|||||||
|
Gross
|
Tax Effected
|
||||||
|
Deferred tax asset:
|
(In Thousands)
|
||||||
|
Capitalized start-up costs
|
$
|
2,579
|
|
$
|
903
|
|
|
|
Stock compensation
|
14,701
|
|
5,990
|
|
|||
|
Unrealized loss on investments
|
7,047
|
|
2,694
|
|
|||
|
Net operating loss carry forwards
|
65,276
|
|
24,602
|
|
|||
|
Other
|
10,118
|
|
3,760
|
|
|||
|
Total gross deferred tax assets
|
99,721
|
|
37,949
|
|
|||
|
Less: valuation allowance
|
(94,497
|
)
|
(35,778
|
)
|
|||
|
Total deferred tax assets
|
5,224
|
|
2,171
|
|
|||
|
Deferred tax liability:
|
|||||||
|
Capitalized software
|
(5,008
|
)
|
(2,095
|
)
|
|||
|
Intangible assets
|
(390
|
)
|
(133
|
)
|
|||
|
Other
|
(216
|
)
|
(76
|
)
|
|||
|
Total deferred tax liabilities
|
(5,614
|
)
|
(2,304
|
)
|
|||
|
Net deferred income tax liability
|
$
|
(390
|
)
|
$
|
(133
|
)
|
|
|
December 31, 2012
|
|||||||
|
Gross
|
Tax Effected
|
||||||
|
Deferred tax asset:
|
(In Thousands)
|
||||||
|
Capitalized start-up costs
|
$
|
21,796
|
|
$
|
7,411
|
|
|
|
Net operating loss carry forwards
|
7,307
|
|
2,484
|
|
|||
|
Total gross deferred tax assets
|
29,103
|
|
9,895
|
|
|||
|
Less: valuation allowance
|
(24,103
|
)
|
(8,195
|
)
|
|||
|
Total deferred tax assets
|
5,000
|
|
1,700
|
|
|||
|
Deferred tax liability:
|
|||||||
|
Capitalized software
|
(5,000
|
)
|
(1,700
|
)
|
|||
|
Intangible assets
|
(390
|
)
|
(133
|
)
|
|||
|
Total deferred tax liabilities
|
(5,390
|
)
|
(1,833
|
)
|
|||
|
Net deferred income tax liability
|
$
|
(390
|
)
|
$
|
(133
|
)
|
|
At December 31, 2013 and December 31, 2012, we have a net deferred tax liability of
$0.1 million
as a result of the acquisition of indefinite-lived intangibles in the MAC Acquisition for which no benefit has been reflected in the acquired net operating loss carry forwards. The tax liability incurred at the acquisition is recorded as an increase in Goodwill.
Excluded from deferred tax assets as of December 31, 2013 is
$1.5 million
of excess stock compensation for which any benefit realized will be recorded to stockholders' equity.
As of December 31, 2013, the Company had federal net operating loss carryforwards of
$65.3 million
, which expire from 2029 to 2033 and state net operating loss carryforwards of
$30.5 million
, which expire from 2032 to 2033. Section 382 of the Internal Revenue Code imposes annual limitations on a corporation's ability to utilize its net operating loss carryforwards if it experiences an "ownership change." As a result of the MAC Acquisition,
$7.3 million
of NOLs are subject to annual limitations of
$0.8 million
through 2016, then
$0.3 million
through 2029.
107
NMI HOLDINGS, INC.
NOTES TO CONSOLIDATED FINANCIAL STATEMENTS
As we have just recently begun insurance operations and have no history to provide a basis for reliable future net income projections, a valuation allowance of
$35.8 million
and
$8.2 million
was recorded at
December 31, 2013
and
December 31, 2012
, respectively, to reflect the amount of the deferred tax asset that may not be realized.
Reconciliation of the federal statutory income tax (benefit) rate to the effective income tax (benefit) rate is as follows:
|
Year Ended December 31, 2013
|
For the Year Ended December 31, 2012
|
||||
|
Federal statutory income tax rate
|
35.00
|
%
|
35.00
|
%
|
|
|
Loss on impairment
|
—
|
|
(1.48
|
)
|
|
|
Prior year adjustment
|
3.52
|
|
1.66
|
|
|
|
Other
|
1.66
|
|
(1.00
|
)
|
|
|
Valuation allowance
|
(40.18
|
)
|
(28.00
|
)
|
|
|
Purchase accounting adjustment
|
—
|
|
(6.18
|
)
|
|
|
Effective income tax rate
|
—
|
%
|
—
|
%
|
|
As of December 31, 2013 and 2012, we have no reserve for unrecognized tax benefits, and have taken no material uncertain positions in its tax returns that would require measurement and recognition.
We file income tax returns with the U.S. federal government and various state jurisdictions which are subject to potential examination by tax authorities. We are not currently under examination, and federal and state tax years remain open by statute.
11. Share-Based Compensation
The 2012 Stock Incentive Plan (the "Plan") was approved by the Board on April 16, 2012, and authorized
5.5 million
shares be reserved for issuance under the Plan with
3.85 million
shares available for stock options and
1.65 million
shares available for RSUs. Options granted under the Plan are Non-Qualified Stock Options and may be granted to employees, directors and other key persons. The exercise price per share for the common stock covered by this Plan shall be determined by the Board at the time of grant, but shall not be less than the fair market value on the date of the grant. The term of the stock option grants will be established by the Board, but no stock option shall be exercisable more than
10
years after the date the stock option is granted. The vesting period of the stock option grants will also be established by the Board at the time of grant and generally is for a
three
year period. Upon the exercise of stock options, we issue shares from the authorized, unissued share reserve.
108
NMI HOLDINGS, INC.
NOTES TO CONSOLIDATED FINANCIAL STATEMENTS
A summary of option activity in the plan during the years ending
December 31, 2013
and
December 31, 2012
is as follows:
|
Option Activity
|
Shares
|
Weighted Average Exercise Price
|
Weighted Average Grant Date Fair Value per Share
|
|||||||
|
(Shares in Thousands)
|
||||||||||
|
Options balance outstanding at December 31, 2012
|
2,547
|
|
$
|
10.00
|
|
$
|
3.86
|
|
||
|
Options granted
|
532
|
|
11.78
|
|
4.57
|
|
||||
|
Less: Options forfeited
|
(15
|
)
|
10.00
|
|
3.84
|
|
||||
|
Less: Options canceled
|
(1
|
)
|
10.00
|
|
3.84
|
|
||||
|
Options balance outstanding at December 31, 2013
|
3,063
|
|
$
|
10.31
|
|
$
|
3.98
|
|
||
|
Option Activity
|
Shares
|
Weighted Average Exercise Price
|
Weighted Average Grant Date Fair Value per Share
|
|||||||
|
(Shares in Thousands)
|
||||||||||
|
Options balance outstanding at December 31, 2011
|
—
|
|
$
|
—
|
|
$
|
—
|
|
||
|
Options granted
|
2,829
|
|
10.00
|
|
3.87
|
|
||||
|
Less: Options forfeited
|
(282
|
)
|
10.00
|
|
3.88
|
|
||||
|
Less: Options canceled
|
—
|
|
—
|
|
—
|
|
||||
|
Options balance outstanding at December 31, 2012
|
2,547
|
|
$
|
10.00
|
|
$
|
3.86
|
|
||
As of
December 31, 2013
there were no exercises and approximately
743,000
options were fully vested and exercisable. The weighted average exercise price for the fully vested and exercisable options was
$10.00
. The remaining weighted average contractual life of options fully vested and exercisable as of December 31, 2013 was
8.4 years
. The aggregate intrinsic value for fully vested and exercisable options was
$2.0 million
as of December 31, 2013.
The remaining weighted average contractual life of options outstanding as of
December 31, 2013
was
8.5
years. As of
December 31, 2013
, there was
$3.6 million
of total unrecognized compensation cost related to non-vested stock options. The weighted-average period over which total compensation related to non-vested stock options will be recognized is
0.72
years.
We account for stock options under ASC 718, which requires all share-based payments to be recognized in the financial statements at their fair values. To measure the fair value of stock options granted, we utilize the Black-Scholes options pricing model. Expense is recognized over the required service period, which is generally the three-year vesting period of the options (vesting in one-third increments per year).
The estimated grant date fair values of the stock options granted during
2013
and
2012
were calculated using the Black-Scholes valuation model based on the following assumptions:
|
2013
|
2012
|
||||
|
Expected life
|
6 years
|
|
6 years
|
|
|
|
Risk free interest rate
|
0.98% - 1.12%
|
|
0.85% - 1.12%
|
|
|
|
Dividend yield
|
0.00
|
%
|
0.00
|
%
|
|
|
Expected stock price volatility
|
39.00
|
%
|
39.00
|
%
|
|
|
Projected forfeiture rate
|
1.00
|
%
|
1.00
|
%
|
|
Expected Life -
is the period of time over which the options granted are expected to remain outstanding giving consideration to vesting schedules, historical exercise and forfeiture patterns. We use the simplified method outlined in SEC Staff Accounting Bulletin No. 107 to estimate expected lives for options granted during the period as historical exercise data is not available and the options meet the requirements set out in the Bulletin. Options granted have a maximum term of
ten
years.
Risk-Free Interest Rate -
is the U.S. Treasury rate for the date of the grant having a term approximating the expected life of the option.
Dividend Yield -
is calculated by dividing the expected annual dividend by our stock price at the valuation date.
109
NMI HOLDINGS, INC.
NOTES TO CONSOLIDATED FINANCIAL STATEMENTS
Expected Price Volatility -
is a measure of the amount by which a price has fluctuated or is expected to fluctuate. At the time of grant, our common shares trading history was not sufficient to calculate an expected volatility representative of the volatility over the expected lives of the options. As a substitute for such estimate, we used historical volatilities of a set of comparable companies in the industry in which we operate.
Projected Forfeiture Rate -
is the estimated percentage of options granted that are expected to be forfeited or canceled before becoming fully vested. An increase in the forfeiture rate will decrease compensation expense.
A summary of RSU activity in the plan during the years ending
December 31, 2013
and
December 31, 2012
is as follows:
|
Shares
|
Weighted Average Grant Date Fair Value per Share
|
|||||
|
(Shares in Thousands)
|
||||||
|
Non-vested restricted stock units at December 31, 2012
|
1,429
|
|
$
|
7.35
|
|
|
|
Restricted stock units granted
|
76
|
|
12.03
|
|
||
|
Less: Restricted stock units vested
|
(263
|
)
|
6.79
|
|
||
|
Less: Restricted stock units forfeited
|
—
|
|
—
|
|
||
|
Non-vested restricted stock units at December 31, 2013
|
1,242
|
|
$
|
7.75
|
|
|
|
Shares
|
Weighted Average Grant Date Fair Value per Share
|
|||||
|
(Shares in Thousands)
|
||||||
|
Non-vested restricted stock units at December 31, 2011
|
—
|
|
$
|
—
|
|
|
|
Restricted stock units granted
|
1,667
|
|
7.35
|
|
||
|
Less: Restricted stock units forfeited
|
(238
|
)
|
7.35
|
|
||
|
Non-vested restricted stock units at December 31, 2012
|
1,429
|
|
$
|
7.35
|
|
|
In February 2013, the Board approved a modification to the vesting terms of approximately
400,000
granted and non-vested RSUs held by our employees. The modification to the vesting terms removed the market condition leaving the RSUs subject to a service condition only. The modification resulted in a change in the period over which compensation costs are recognized and prospective recognition of incremental compensation cost. Incremental compensation cost is measured as the excess of the fair value of the modified award over the fair value of the original award immediately before its terms are modified using relevant valuation inputs as of the modification date.
At
December 31, 2013
, the
1.2 million
shares of granted and non-vested RSUs consisted of
0.5 million
shares that are subject to both a market and service condition and
0.7 million
shares that are subject only to service conditions. The non-vested RSUs subject to both a market and service condition vest in one-half increments upon the achievement of certain market price goals and continued service. Non-vested RSUs subject only to a service condition vest over a service period ranging from 1 to 3 years. The fair value of RSUs subject to market and service conditions is determined based on a Monte Carlo simulation model at the date of grant. The fair value of RSUs subject only to service conditions are valued at our stock price on the date of grant less the present value of anticipated dividends.
The estimated grant date fair values of the RSUs granted in
2012
that are subject to both a market and service condition were calculated using a Monte Carlo simulation model based on the average outcome of
150,000
simulations using the following assumption:
|
Expected life
|
5 years
|
|
|
Risk free interest rate
|
0.86
|
%
|
|
Dividend yield
|
0.00
|
%
|
|
Expected stock price volatility
|
39.00
|
%
|
|
Projected forfeiture rate
|
1.00
|
%
|
110
NMI HOLDINGS, INC.
NOTES TO CONSOLIDATED FINANCIAL STATEMENTS
The remaining weighted average contractual life of non-vested RSUs as of
December 31, 2013
was
4.0 years
. As of
December 31, 2013
, there was
$4.3 million
of total unrecognized compensation cost related to non-vested RSUs. The weighted-average period over which total compensation related to non-vested RSUs will be recognized is
0.77
years.
On April 5, 2013 approximately
263,000
RSUs containing a market condition vested resulting in an acceleration of compensation expense of
$1.1 million
in the second quarter of 2013.
12. Warrants
As of December 31, 2011, prior to our Private Placement, FBR granted an uncommitted line of credit up to an aggregate principal amount of
$1.5 million
to support legal, accounting and others costs associated with the formation and our capitalization.
As part of the consideration for granting the line of credit, upon successful completion of the common stock Private Placement on April 24, 2012, we issued warrants to FBR having an aggregate value equal to three times the amount of the outstanding line of credit balance. Each warrant gave the holder thereof the right to purchase one share of common stock at an exercise price equal to
$10.00
. Accordingly, FBR was issued approximately
314,000
warrants with an aggregate fair value of
$1.6 million
which approximated three times the outstanding line of credit amount at that time. These warrants were measured at fair value and recorded as a finance fee with an offsetting charge to liabilities. As the line of credit was paid off on April 24, 2012, the debt discount was fully amortized as of April 24, 2012.
In addition, in conjunction with the MAC Acquisition, we issued approximately
678,000
warrants to the stockholders of MAC Financial Ltd. at an exercise price equal to
$10.00
and an aggregate fair value of
$3.5 million
. Those stockholders have wound up their affairs pursuant to a members voluntary liquidation under Bermuda law. The shares of our common stock and the warrants previously held by MAC Financial Ltd. have been divided and distributed to its former stockholders.
Upon exercise of these warrants, the amounts will be reclassified from warrant liability to additional paid-in capital. For the year ended
December 31, 2013
all issued warrants are outstanding.
We account for these warrants to purchase common shares of ours in accordance with ASC 470-20,
Debt with Conversion and Other Options
and ASC 815-40,
Derivatives and Hedging - Contracts in Entity's Own Equity.
For more detail on how we account for all warrants see "
Note 2, Summary of Accounting Principles - Warrants."
13. Litigation
On August 8, 2012, Germaine Marks, as Receiver, and Truitte Todd, as Special Deputy Receiver, of PMI Mortgage Insurance Co. (“PMI”), an Arizona insurance company in receivership, filed a complaint (the “PMI Complaint”) against NMIH, NMIC and certain named individuals, in California Superior Court, Alameda County. The PMI Complaint, as amended, alleges breach of fiduciary duty, breach of loyalty, aiding and abetting breach of fiduciary duty and loyalty, misappropriation of trade secrets, conversion, breach of proprietary information agreement, breach of separation agreement, intentional interference with contractual relations and unfair competition. The lawsuit seeks injunctive relief as well as unspecified monetary damages. We have filed answers to PMI's complaint denying all allegations and believe the claims are without merit. See
"Note 2, Summary of Accounting Principles, Subsequent Events."
The parties are now engaged in discovery and the court has set a trial date for September 29, 2014. Because the litigation and related discovery are ongoing, we do not have sufficient information to determine or predict the ultimate outcome or estimate the range of possible losses, if any. Accordingly, no provision for litigation losses has been included in the financial statements.
14. Statutory Information
Our insurance subsidiaries, NMIC, Re One and Re Two, file financial statements in conformity with statutory basis accounting principles ("SAP") prescribed or permitted by the Wisconsin OCI. Prescribed SAP includes state laws, regulations and general administrative rules, as well as a variety of publications of the National Association of Insurance Commissioners ("NAIC"). The Wisconsin OCI recognizes only statutory accounting practices prescribed or permitted by the state of Wisconsin for determining and reporting the financial condition and results of operations of an insurance company and for determining its solvency under Wisconsin insurance laws. As of September 30, 2013, Re Two was merged into NMIC, with NMIC surviving the merger. See
"Note 1, Organization
."
Prescribed and permitted practices generally vary in some respects from accounting principles found in GAAP. The principal differences between these accounting practices and GAAP are as follows: (1) acquisition expenses incurred in connection with acquiring new business are charged to expense under SAP but under GAAP are deferred and amortized as the related premiums are earned; (2) under SAP there are limitations on the net deferred tax assets created by the tax effects of temporary differences; (3) under SAP unpaid claims and claim expenses ceded to reinsurers are reported as a deduction of the related reserve rather than as an
111
NMI HOLDINGS, INC.
NOTES TO CONSOLIDATED FINANCIAL STATEMENTS
asset as would be required under GAAP; (4) under SAP, fixed maturity investments are generally valued at amortized cost while under GAAP, those investments are considered to be available-for-sale and are recorded at fair value, with the unrealized gain or loss recognized, net of tax, as an increase or decrease to shareholders' equity.
NMIC and Re One's combined statutory net income, statutory surplus and contingency reserve as of and for the years ended December 31, 2012 , 2011 and 2010 were as follows:
|
December 31,
|
|||||||||||
|
2013
|
2012
|
2011
|
|||||||||
|
(In Thousands)
|
|||||||||||
|
Statutory net loss
|
$
|
(33,307
|
)
|
$
|
(18
|
)
|
$
|
—
|
|
||
|
Statutory surplus
|
189,698
|
|
220,004
|
|
—
|
|
|||||
|
Contingency reserve
|
2,314
|
|
—
|
|
—
|
|
|||||
NMIC's principal regulator is the Wisconsin OCI. Under applicable Wisconsin law, as well as that of
15
other states, a mortgage guaranty insurer must maintain a minimum amount of statutory capital relative to the risk-in-force (Risk to Capital ratio or “RTC ratio”) in order for the mortgage guaranty insurer to continue to write new business. We refer to these requirements as the “RTC requirement.” While formulations of minimum capital may vary in each jurisdiction that has such a requirement, the most common measure applied allows for a maximum permitted RTC ratio of
25
to 1. Wisconsin and certain other states, including California and Illinois, apply a substantially similar requirement referred to as minimum policyholders position. Our operation plan filed with the Wisconsin OCI and other state insurance departments in connection with NMIC's applications for licensure includes the expectation that NMIH will downstream additional capital if needed so that NMIC does not exceed an
18
to 1 risk-to-capital ratio. NMIC may in the future seek state insurance department approvals, as needed, of an amendment to our business plan to increase this ratio to the Wisconsin regulatory minimum of
25
to 1.
Additionally, as a condition of GSE Approval, NMIC has agreed with Fannie Mae and Freddie Mac to limit NMIC's RTC ratio to no greater than
15
to 1 and to maintain total statutory capital of at least
$150 million
for a
three
year period ending on December 31, 2015. After that date, NMIC agreed to comply with the risk-to-capital ratios that are imposed in the GSEs' then existing eligibility requirements. As part of the state licensing process, NMIC entered into risk-to-capital agreements with the California Insurance Department, the Missouri Department of Insurance, the New York State Department of Financial Services, the Ohio Department of Insurance and the Texas Commissioner of Insurance. These agreements require NMIC to maintain a risk-to-capital ratio not to exceed
20
to 1 until January 15, 2016.
Certain states limit the amount of risk a mortgage guaranty insurer may retain on a single loan to
25%
of the indebtedness to the insured and as a result the portion of such insurance in excess of
25%
must be reinsured. NMIC has entered into a primary excess share reinsurance agreement with Re One effective August 1, 2012. NMIC cedes premiums and claims to Re One on an excess share basis for any primary or pool policy which offers coverage greater than
25%
. NMIC will use reinsurance provided by Re One solely for purposes of compliance with statutory coverage limits. During April 2013, NMIC wrote its first mortgage insurance policies and ceded premium and risk to Re One the following month.
As of
December 31, 2012
, none of our insurance subsidiaries had written any business, had no risk-in-force and therefore had no ratios. As of
December 31, 2013
NMIC's RTC ratio is less than 1:1, significantly below the limits established with the GSEs and state insurance departments.
112
NMI HOLDINGS, INC.
NOTES TO CONSOLIDATED FINANCIAL STATEMENTS
The risk-to-capital calculation for each of our insurance subsidiaries, as well as our combined risk-to-capital calculation, as of
December 31, 2013
, is presented below.
|
As of December 31, 2013
|
NMIC
|
Re One
|
Combined
|
||||||||
|
(In Thousands)
|
|||||||||||
|
Pool risk-in-force
(1)
|
|||||||||||
|
Direct
|
$
|
93,090
|
|
$
|
—
|
|
$
|
93,090
|
|
||
|
Assumed
|
—
|
|
25,171
|
|
25,171
|
|
|||||
|
Ceded
|
(25,171
|
)
|
—
|
|
(25,171
|
)
|
|||||
|
Total pool risk-in-force
|
67,919
|
|
25,171
|
|
93,090
|
|
|||||
|
Primary risk-in-force
|
|||||||||||
|
Direct
|
36,516
|
|
—
|
|
36,516
|
|
|||||
|
Assumed
|
—
|
|
2,637
|
|
2,637
|
|
|||||
|
Ceded
|
(2,637
|
)
|
—
|
|
(2,637
|
)
|
|||||
|
Total primary risk-in-force
|
33,879
|
|
2,637
|
|
36,516
|
|
|||||
|
Total risk-in-force
|
101,798
|
|
27,808
|
|
129,606
|
|
|||||
|
Statutory policyholders' surplus
|
180,310
|
|
9,388
|
|
189,698
|
|
|||||
|
Statutory contingency reserve
|
1,740
|
|
574
|
|
2,314
|
|
|||||
|
Total statutory policyholders' position
|
182,050
|
|
9,962
|
|
192,012
|
|
|||||
|
Risk-to-Capital
(2)
|
0.6:1
|
|
2.8:1
|
|
0.7:1
|
|
|||||
|
(1)
|
Pool risk-in-force as shown in the table above is equal to the aggregate stop loss less a deductible.
|
|
(2)
|
Represents total risk-in-force divided by statutory policyholders' position which is the metric by which the majority of state insurance regulators will assess our capital adequacy. Additionally, Fannie Mae requires us to maintain the greater of (a) the risk-to-capital requirements outlined in the January 2013 approval letter, or (b) a risk-to-capital ratio of
18
:1 on primary business plus statutory capital equal to the amount of net risk-in-force of the pool.
|
NMIH is not subject to any limitations on its ability to pay dividends except those generally applicable to corporations that are incorporated in Delaware, such as NMIH. Delaware corporation law provides that dividends are only payable out of a corporation's capital surplus or (subject to certain limitations) recent net profits. As of
December 31, 2012
, NMIH's capital surplus was approximately
$489 million
. NMIH assets, which, excluding investment in NMIC and Re One, are approximately
$276 million
at
December 31, 2013
, are unencumbered by any debt or other subsidiary commitments or obligations. As such, at December 31, 2013, NMIH had sufficient resources to downstream to either insurance subsidiary the cash necessary to fully comply with all commitments. The insurance subsidiaries are both mono-line mortgage guaranty insurance companies and the assets of each are dedicated only to the support of direct risk and obligations of each mortgage insurance entity. NMIC only writes direct mortgage guaranty insurance business and assumes no business from any other entity. Re One only assumes business from NMIC to allow NMIC to comply with statutory risk requirements. Neither NMIC nor Re One have subsidiaries, and therefore do not have risks and obligations that compete for its resources, and neither entity counts a subsidiary's asset in their admitted statutory assets.
The GSEs and state insurance regulators may restrict our insurance subsidiaries' ability to pay dividends to NMIH. See
"Note 9, Commitments and Contingencies"
for a discussion of the dividend restrictions imposed by the GSEs in the GSE Approval, as well as restrictions imposed by various states in conjunction with NMIC's receipt of certificates of authority in those states. In addition to the restrictions imposed during the GSE Approval and licensing process, the ability of our insurance subsidiaries to pay dividends to NMIH is limited by insurance laws of the State of Wisconsin and certain other states. Wisconsin law provides that an insurance company may pay out dividends without the prior approval of the Wisconsin OCI (“ordinary dividends”) in an amount, when added to other shareholder distributions made in the prior 12 months, not to exceed the lesser of (a)
10%
of the insurer's surplus as regards to policyholders as of the prior December 31, or (b) its net income (excluding realized capital gains) for the twelve month period ending December 31 of the immediately preceding calendar year. In determining net income, an insurer may carry forward net income from the previous calendar years that has not already been paid out as a dividend. Dividends that exceed this amount are “extraordinary dividends”, which require prior approval of the Wisconsin OCI. As of
December 31, 2013
, the amount of restricted net assets held by our consolidated insurance subsidiaries totaled approximately
$193 million
of NMIH's consolidated net assets of
113
NMI HOLDINGS, INC.
NOTES TO CONSOLIDATED FINANCIAL STATEMENTS
$463 million
. The amount of restricted assets used to determine any dividend to NMIH, once all restrictions expire, would be computed under SAP which may differ from the amount of restricted assets computed under GAAP.
15. Quarterly Financial Data (Unaudited)
|
2013 Quarters
|
2013
|
||||||||||||||||||
|
First
|
Second
|
Third
|
Fourth
|
Year
|
|||||||||||||||
|
(In Thousands, except share data)
|
|||||||||||||||||||
|
Net premiums written
|
$
|
—
|
|
$
|
1
|
|
$
|
482
|
|
$
|
3,058
|
|
$
|
3,541
|
|
||||
|
Net premiums earned
|
—
|
|
1
|
|
482
|
|
1,612
|
|
2,095
|
|
|||||||||
|
Net investment income
|
410
|
|
1,407
|
|
1,519
|
|
1,472
|
|
4,808
|
|
|||||||||
|
Net realized investment gains (losses)
|
28
|
|
452
|
|
(308
|
)
|
14
|
|
186
|
|
|||||||||
|
Gain (Loss) from change in fair value of warrant liability
|
35
|
|
(1,115
|
)
|
469
|
|
(918
|
)
|
(1,529
|
)
|
|||||||||
|
Insurance claims and claims expenses
|
—
|
|
—
|
|
—
|
|
—
|
|
—
|
|
|||||||||
|
Amortization of deferred policy acquisition costs
|
—
|
|
—
|
|
—
|
|
1
|
|
1
|
|
|||||||||
|
Other underwriting and operating expenses
|
12,426
|
|
17,019
|
|
16,035
|
|
15,263
|
|
60,743
|
|
|||||||||
|
Net Loss
|
(11,953
|
)
|
(16,274
|
)
|
(13,873
|
)
|
(13,084
|
)
|
(55,184
|
)
|
|||||||||
|
Loss per share
(1)
|
|||||||||||||||||||
|
Basic and diluted loss per share
|
$
|
(0.22
|
)
|
$
|
(0.29
|
)
|
$
|
(0.25
|
)
|
$
|
(0.23
|
)
|
$
|
(0.99
|
)
|
||||
|
Weighted average common shares outstanding
|
55,500,100
|
|
55,629,932
|
|
55,637,480
|
|
57,238,730
|
|
56,005,326
|
|
|||||||||
|
2012 Quarters
|
2012
|
||||||||||||||||||
|
First
|
Second
|
Third
|
Fourth
|
Year
|
|||||||||||||||
|
(In Thousands, except share data)
|
|||||||||||||||||||
|
Net premiums written
|
$
|
—
|
|
$
|
—
|
|
$
|
—
|
|
$
|
—
|
|
$
|
—
|
|
||||
|
Net premiums earned
|
—
|
|
—
|
|
—
|
|
—
|
|
—
|
|
|||||||||
|
Net investment income
|
—
|
|
—
|
|
1
|
|
5
|
|
6
|
|
|||||||||
|
Net realized investment gains (losses)
|
—
|
|
—
|
|
—
|
|
—
|
|
—
|
|
|||||||||
|
Gain (Loss) from change in fair value of warrant liability
|
—
|
|
—
|
|
—
|
|
278
|
|
278
|
|
|||||||||
|
Insurance claims and claims expenses
|
—
|
|
—
|
|
—
|
|
—
|
|
—
|
|
|||||||||
|
Amortization of deferred policy acquisition costs
|
—
|
|
—
|
|
—
|
|
—
|
|
—
|
|
|||||||||
|
Other underwriting and operating expenses
|
386
|
|
6,196
|
|
8,114
|
|
13,079
|
|
27,775
|
|
|||||||||
|
Net Loss
|
(386
|
)
|
(6,196
|
)
|
(8,113
|
)
|
(12,796
|
)
|
(27,491
|
)
|
|||||||||
|
Loss per share
(1)
|
|||||||||||||||||||
|
Basic and diluted loss per share
|
$
|
(3,860.00
|
)
|
$
|
(0.15
|
)
|
$
|
(0.15
|
)
|
$
|
(0.23
|
)
|
$
|
(0.73
|
)
|
||||
|
Weighted average common shares outstanding
|
100
|
|
40,252,847
|
|
55,500,100
|
|
55,500,100
|
|
37,909,936
|
|
|||||||||
|
(1)
|
Due to the use of weighted average shares outstanding when calculating earnings per share, the sum of quarterly per share data may not equal the per share data for the year.
|
114
None.
Disclosure Controls and Procedures
We maintain disclosure controls and procedures designed to ensure that information required to be disclosed in the reports we file or submit under the Exchange Act is recorded, processed, summarized and reported within the time periods specified in the SEC's rules and forms, and that such information is accumulated and communicated to our management, including our Chief Executive Officer and Chief Financial Officer, as appropriate, to allow timely decisions regarding required disclosure.
Our management, including our Chief Executive Officer and Chief Financial Officer, conducted an evaluation of the effectiveness of our disclosure controls and procedures (as defined in Rule 13a-15(e) of the Exchange Act) as of December 31, 2013, pursuant to Rule 15d-15(e) under the Exchange Act. Management applied its judgment in assessing the costs and benefits of such controls and procedures, which by their nature, can provide only reasonable assurance regarding management's control objectives. Management does not expect that our disclosure controls and procedures will prevent or detect all errors and fraud. A control system, irrespective of how well it is designed and operated, can only provide reasonable assurance, and cannot guarantee that it will succeed in its stated objectives.
Based upon that evaluation, our Chief Executive Officer and Chief Financial Officer concluded that, as of
December 31, 2013
, our disclosure controls and procedures were effective to provide reasonable assurance that the information required to be disclosed by us in the reports we file or submit under the Exchange Act is recorded, processed, summarized, and reported within the time periods specified in the SEC's rules and forms.
Internal Control Over Financial Reporting
This annual report does not include a report of management's assessment regarding internal control over financial reporting or an attestation report of our registered public accounting firm due to a transition period established by rules of the Securities Exchange Commission for newly public companies.
There was no change in our internal control over financial reporting that occurred during the period covered by this report that has materially affected, or is reasonably likely to materially affect, our internal control over financial reporting.
None.
115
The information required by this Item is incorporated by reference to, and will be contained in, our definitive proxy statement, which will be filed within 120 days after
December 31, 2013
. Accordingly, we have omitted the information from this Item pursuant to General Instruction G (3) of Form 10-K.
116
1. Financial Statements — See the
"Index to Financial Statements"
included in Part II, Item 8 of this report for a list of the financial statements filed as part of this report.
2. Financial Statement Schedules — See the
"Index to Financial Statement Schedules"
on page 123 of this report for a list of the financial statement schedules filed as part of this report.
3. Exhibits — See
"Exhibit Index"
on page i of this report for a list of exhibits filed as part of this report.
117
Exhibits
|
Exhibit Number
|
Description
|
|
|
2.1
|
Stock Purchase Agreement, dated November 30, 2011, between NMI Holdings, Inc. and MAC Financial Ltd. (incorporated herein by reference to Exhibit 2.1 to our Form S-1 Registration Statement (Registration No. 333-191635), filed on October 9, 2013)
|
|
|
2.2
|
Amendment to Stock Purchase Agreement, dated April 6, 2012, between NMI Holdings, Inc. and MAC Financial Ltd. (incorporated herein by reference to Exhibit 2.2 to our Form S-1 Registration Statement (Registration No. 333-191635), filed on October 9, 2013)
|
|
|
3.1
|
Second Amended and Restated Certificate of Incorporation (incorporated herein by reference to Exhibit 3.1 to our Form S-1 Registration Statement (Registration No. 333-191635), filed on October 9, 2013)
|
|
|
3.2
|
Amended and Restated By-Laws (incorporated herein by reference to Exhibit 3.2 to our Form S-1 Registration Statement (Registration No. 333-191635), filed on October 9, 2013)
|
|
|
4.1
|
Specimen Class A common stock certificate (incorporated herein by reference to Exhibit 4.1 to our Form S-1 Registration Statement (Registration No. 333-191635), filed on October 9, 2013)
|
|
|
4.2
|
Registration Rights Agreement between NMI Holdings, Inc. and FBR Capital Markets & Co., dated April 24, 2012 (incorporated herein by reference to Exhibit 4.2 to our Form S-1 Registration Statement (Registration No. 333-191635), filed on October 9, 2013)
|
|
|
4.3
|
Registration Rights Agreement by and between MAC Financial Ltd. and NMI Holdings, Inc., dated April 24, 2012 (incorporated herein by reference to Exhibit 4.3 to our Form S-1 Registration Statement (Registration No. 333-191635), filed on October 9, 2013)
|
|
|
4.4
|
Registration Rights Agreement between FBR & Co., FBR Capital Markets LT, Inc., FBR Capital Markets & Co., FBR Capital Markets PT, Inc. and NMI Holdings, Inc., dated April 24, 2012 (incorporated herein by reference to Exhibit 4.4 to our Form S-1 Registration Statement (Registration No. 333-191635), filed on October 9, 2013)
|
|
|
4.5
|
Warrant No. 1 to Purchase Common Stock of NMI Holdings, Inc. issued to FBR Capital Markets & Co., dated June 13, 2013 (incorporated herein by reference to Exhibit 4.5 to our Form S-1 Registration Statement (Registration No. 333-191635), filed on October 9, 2013)
|
|
|
4.6
|
Form of Warrant to Purchase Common Stock of NMI Holdings, Inc. issued to former stockholders of MAC Financial Ltd.(incorporated herein by reference to Exhibit 4.6 to our Form S-1 Registration Statement (Registration No. 333-191635), filed on October 9, 2013)
|
|
|
10.1
|
NMI Holdings, Inc. 2012 Stock Incentive Plan (incorporated herein by reference to Exhibit 10.1 to our Form S-1 Registration Statement (Registration No. 333-191635), filed on October 9, 2013)
|
|
|
10.2
|
Form of NMI Holdings, Inc. 2012 Stock Incentive Plan Restricted Stock Unit Award Agreement for Chief Executive Officer and Chief Financial Officer (incorporated herein by reference to Exhibit 10.2 to our Form S-1 Registration Statement (Registration No. 333-191635), filed on October 9, 2013)
|
|
|
10.3
|
Form of NMI Holdings, Inc. 2012 Stock Incentive Plan Restricted Stock Unit Award Agreement for Management (incorporated herein by reference to Exhibit 10.3 to our Form S-1 Registration Statement (Registration No. 333-191635), filed on October 9, 2013)
|
|
|
10.4
|
Form of NMI Holdings, Inc. 2012 Stock Incentive Plan Restricted Stock Unit Award Agreement for Directors (incorporated herein by reference to Exhibit 10.4 to our Form S-1 Registration Statement (Registration No. 333-191635), filed on October 9, 2013)
|
|
|
10.5
|
Form of NMI Holdings, Inc. 2012 Stock Incentive Plan Nonqualified Stock Option Award Agreement for Chief Executive Officer and Chief Financial Officer (incorporated herein by reference to Exhibit 10.5 to our Form S-1 Registration Statement (Registration No. 333-191635), filed on October 9, 2013)
|
|
|
10.6
|
Form of NMI Holdings, Inc. 2012 Stock Incentive Plan Nonqualified Stock Option Award Agreement for Management (incorporated herein by reference to Exhibit 10.6 to our Form S-1 Registration Statement (Registration No. 333-191635), filed on October 9, 2013)
|
|
|
10.7
|
Form of NMI Holdings, Inc. 2012 Stock Incentive Plan Nonqualified Stock Option Award Agreement for Directors (incorporated herein by reference to Exhibit 10.7 to our Form S-1 Registration Statement (Registration No. 333-191635), filed on October 9, 2013)
|
|
|
10.8
|
Employment Agreement by and between NMI Holdings, Inc. and Bradley M. Shuster, dated March 6, 2012 and Amendment, dated April 24, 2012 (incorporated herein by reference to Exhibit 10.8 to our Form S-1 Registration Statement (Registration No. 333-191635), filed on October 9, 2013)
|
|
|
10.9
|
Amendment to Employment Agreement by and between NMI Holdings, Inc. and Bradley M. Shuster, dated April 24, 2012 (incorporated herein by reference to Exhibit 10.9 to our Form S-1 Registration Statement (Registration No. 333-191635), filed on October 9, 2013)
|
|
118
|
Exhibit Number
|
Description
|
|
|
10.10
|
Employment Agreement by and between NMI Holdings, Inc. and Jay M. Sherwood, dated March 6, 2012 and Amendment, dated April 24, 2012 (incorporated herein by reference to Exhibit 10.10 to our Form S-1 Registration Statement (Registration No. 333-191635), filed on October 9, 2013)
|
|
|
10.11
|
Amendment to Employment Agreement by and between NMI Holdings, Inc. and Jay M. Sherwood, dated April 24, 2012 (incorporated herein by reference to Exhibit 10.11 to our Form S-1 Registration Statement (Registration No. 333-191635), filed on October 9, 2013)
|
|
|
10.12
|
Letter Agreement by and between NMI Holdings, Inc. and Stanley M. Pachura, dated April 26, 2012 (incorporated herein by reference to Exhibit 10.12 to our Form S-1 Registration Statement (Registration No. 333-191635), filed on October 9, 2013)
|
|
|
10.13
|
Form of Indemnification Agreement between NMI Holdings, Inc. and certain of its directors (incorporated herein by reference to Exhibit 10.13 to our Form S-1 Registration Statement (Registration No. 333-191635), filed on October 9, 2013)
|
|
|
10.14
|
Commitment Letter dated July 12, 2013 for Bulk Fannie Mae-Paid Loss-on-Sale Mortgage Insurance on the Portfolio of approximately $5.46 billion Purchased by Fannie Mae and Identified by Fannie Mae as Deal No. 2013 MIRT 01 and by the Company as Policy No. P-0001-01 (incorporated herein by reference to Exhibit 10.14 to our Form S-1 Registration Statement (Registration No. 333-191635), filed on October 9, 2013)
|
|
|
21.1
|
Subsidiaries of NMI Holdings, Inc. (incorporated herein by reference to Exhibit 21.1 to our Form S-1 Registration Statement (Registration No. 333-191635), filed on October 9, 2013)
|
|
|
23.1
|
Consent of BDO USA, LLP
|
|
|
31.1
|
Principal Executive Officer's Certification Pursuant to Section 302 of the Sarbanes-Oxley Act of 2002
|
|
|
31.2
|
Principal Financial Officer's Certification Pursuant to Section 302 of the Sarbanes-Oxley Act of 2002
|
|
|
32 #
|
Certifications of CEO and CFO Pursuant to 18 U.S.C. Section 1350, as Adopted Pursuant to Section 906 of the Sarbanes-Oxley Act of 2002
|
|
|
99.1
|
Conditional Approval Letter, dated January 15, 2013, from Freddie Mac to National Mortgage Insurance Corporation (incorporated herein by reference to Exhibit 99.1 to our Form S-1 Registration Statement (Registration No. 333-191635), filed on October 9, 2013)
|
|
|
99.2
|
Conditional Approval Agreement, dated January 16, 2013, by and among Federal National Mortgage Association, NMI Holdings, Inc. and National Mortgage Insurance Corporation (incorporated herein by reference to Exhibit 99.2 to our Form S-1 Registration Statement (Registration No. 333-191635), filed on October 9, 2013)
|
|
|
101 *
|
The following financial information from NMI Holdings, Inc.’s Annual Report on Form 10-K for the year ended December 31, 2013, formatted in XBRL (eXtensible Business Reporting Language):
(i) Consolidated Balance Sheets as of December 31, 2013 and 2012
(ii) Consolidated Statements of Comprehensive Loss for each of the three years in the period ended December 31, 2013
(iii) Consolidated Statements of Changes in Shareholders' Equity for each of the three years in the period ended December 31, 2013
(iv) Consolidated Statements of Cash Flows for each of the years in the period ended December 31, 2013, and
(v) Notes to Consolidated Financial Statements
|
|
|
#
|
In accordance with Item 601(b)(32)(ii) of Regulation S-K and SEC Release No. 34-47986, the certifications furnished in Exhibit 32 hereto are deemed to accompany this Form 10-K and will not be deemed “filed” for purposes of Section 18 of the Exchange Act or deemed to be incorporated by reference into any filing under the Exchange Act or the Securities Act except to the extent that the registrant specifically incorporates it by reference.
|
|
*
|
In accordance with Rule 406T of Regulation S-T, the information furnished in these exhibits will not be deemed “filed” for purposes of Section 18 of the Exchange Act. Such exhibits will not be deemed to be incorporated by reference into any filing under the Securities Act or the Exchange Act except to the extent that the registrant specifically incorporates it by reference.
|
119
SIGNATURES
Pursuant to the requirements of the Securities Exchange Act of 1934, the registrant has duly caused this report to be signed on its behalf by the undersigned thereunto duly authorized.
|
NMI HOLDINGS, INC.
|
|
|
March 12, 2014
|
By: /s/ Bradley M. Shuster
|
|
Name: Bradley M. Shuster
Title: Chairman, President and Chief Executive Officer
|
|
120
|
Signature
|
Title
|
Date
|
||
|
/s/ Bradley M. Shuster
|
Chairman, President and Chief Executive Officer
|
March 12, 2014
|
||
|
Bradley M. Shuster
|
(Principal Executive Officer)
|
|||
|
/s/ John (Jay) M. Sherwood, Jr.
|
Chief Financial Officer
|
March 12, 2014
|
||
|
John (Jay) M. Sherwood, Jr.
|
(Principal Financial and Accounting Officer)
|
|||
|
/s/ Steven L. Scheid
|
Director
|
March 12, 2014
|
||
|
Steven L. Scheid
|
||||
|
/s/ James G. Jones
|
Director
|
March 12, 2014
|
||
|
James G. Jones
|
||||
|
/s/ John Brandon Osmon
|
Director
|
March 12, 2014
|
||
|
John Brandon Osmon
|
||||
|
/s/ Michael Montgomery
|
Director
|
March 12, 2014
|
||
|
Michael Montgomery
|
||||
|
/s/ Michael Embler
|
Director
|
March 12, 2014
|
||
|
Michael Embler
|
||||
|
/s/ James H. Ozanne
|
Director
|
March 12, 2014
|
||
|
James H. Ozanne
|
||||
121
INDEX TO FINANCIAL STATEMENT SCHEDULES
All other schedules are omitted because the required information is not present or is not present in amounts sufficient to require submission of the schedules, or because the information required is included in our Consolidated Financial Statements and notes thereto.
122
NMI HOLDINGS, INC.
SCHEDULE I
SUMMARY OF INVESTMENTS - OTHER THAN INVESTMENTS IN RELATED PARTIES
PARENT COMPANY ONLY
|
December 31, 2013
|
Amortized Cost
|
Fair Value
|
Amount Reflected on Balance Sheet
|
||||||||
|
(In Thousands)
|
|||||||||||
|
Fixed Maturities:
|
|||||||||||
|
Bonds:
|
|||||||||||
|
U.S. Treasury securities and obligations of U.S. government agencies
|
$
|
58,251
|
|
$
|
57,421
|
|
$
|
57,421
|
|
||
|
Municipal bonds
|
5,259
|
|
5,204
|
|
5,204
|
|
|||||
|
Corporate debt securities
|
130,499
|
|
127,928
|
|
127,928
|
|
|||||
|
Asset-backed securities
|
39,014
|
|
38,511
|
|
38,511
|
|
|||||
|
Total investments other than investments in related parties
|
$
|
233,023
|
|
$
|
229,064
|
|
$
|
229,064
|
|
||
F-1
NMI HOLDINGS, INC.
SCHEDULE II - FINANCIAL INFORMATION OF REGISTRANT
BALANCE SHEETS
PARENT COMPANY ONLY
|
December 31, 2013
|
December 31, 2012
|
||||||
|
(In Thousands, except for share data)
|
|||||||
|
Assets
|
|||||||
|
Investments, available-for-sale
|
$
|
229,064
|
|
$
|
—
|
|
|
|
Cash and cash equivalents
|
36,433
|
|
270,717
|
|
|||
|
Restricted cash
|
—
|
|
40,338
|
|
|||
|
Investment in subsidiaries, at equity in net assets
|
193,242
|
|
228,612
|
|
|||
|
Accrued investment income
|
1,038
|
|
—
|
|
|||
|
Prepaid expenses
|
1,519
|
|
417
|
|
|||
|
Due from affiliates, net
|
10,565
|
|
—
|
|
|||
|
Software and equipment, net
|
7,574
|
|
2,444
|
|
|||
|
Other assets
|
61
|
|
107
|
|
|||
|
Total Assets
|
$
|
479,496
|
|
$
|
542,635
|
|
|
|
Liabilities
|
|||||||
|
Accounts payable and accrued expenses
|
$
|
9,908
|
|
$
|
8,707
|
|
|
|
Placement fee payable
|
—
|
|
38,305
|
|
|||
|
Purchase consideration payable
|
—
|
|
2,033
|
|
|||
|
Warrant liability, at fair value
|
6,371
|
|
4,842
|
|
|||
|
Total Liabilities
|
16,279
|
|
53,887
|
|
|||
|
Shareholders' Equity
|
|||||||
|
Common stock - Class A shares, $0.01 par value,
58,052,480 and 55,250,100 shares issued and outstanding as of December 31, 2013 and December 31, 2012, respectively (250,000,000 shares authorized) |
581
|
|
553
|
|
|||
|
Common stock - Class B shares, $0.01 par value, 0 and 250,000 shares issued and outstanding as of December 31, 2013 and December 31, 2012, respectively (250,000 authorized)
|
—
|
|
2
|
|
|||
|
Additional paid-in capital
|
553,707
|
|
517,032
|
|
|||
|
Accumulated other comprehensive (loss) income
|
(7,047
|
)
|
1
|
|
|||
|
Accumulated deficit
|
(84,024
|
)
|
(28,840
|
)
|
|||
|
Total Shareholders' Equity
|
463,217
|
|
488,748
|
|
|||
|
Total Liabilities and Shareholders' Equity
|
$
|
479,496
|
|
$
|
542,635
|
|
|
F-2
NMI HOLDINGS, INC.
SCHEDULE II - FINANCIAL INFORMATION OF REGISTRANT
STATEMENT OF OPERATIONS
PARENT COMPANY ONLY
|
For the Year Ended December 31,
|
For the Period from May 19, 2011 (inception) to December 31, 2011
|
||||||||||
|
2013
|
2012
|
||||||||||
|
(In Thousands)
|
|||||||||||
|
Revenues
|
|||||||||||
|
Net investment income
|
$
|
2,758
|
|
$
|
2
|
|
$
|
—
|
|
||
|
Net realized investment gains
|
188
|
|
—
|
|
—
|
|
|||||
|
(Loss) Gain from change in fair value of warrant liability
|
(1,529
|
)
|
278
|
|
—
|
|
|||||
|
Total Revenues
|
1,417
|
|
280
|
|
—
|
|
|||||
|
Expenses
|
|||||||||||
|
Other operating expenses
|
24,319
|
|
26,575
|
|
1,349
|
|
|||||
|
Total Expenses
|
24,319
|
|
26,575
|
|
1,349
|
|
|||||
|
Equity in net loss of subsidiaries
|
(32,282
|
)
|
(1,196
|
)
|
—
|
|
|||||
|
Net Loss
|
$
|
(55,184
|
)
|
$
|
(27,491
|
)
|
$
|
(1,349
|
)
|
||
F-3
NMI HOLDINGS, INC.
SCHEDULE II - FINANCIAL INFORMATION OF REGISTRANT
STATEMENTS OF CASH FLOWS
PARENT COMPANY ONLY
|
For the Year Ended December 31, 2013
|
For the Year Ended December 31, 2012
|
For the Period May 19, 2011 (inception) to December 31, 2011
|
|||||||||
|
Cash Flows from Operating Activities
|
(In Thousands)
|
||||||||||
|
Net loss
|
$
|
(55,184
|
)
|
$
|
(27,491
|
)
|
$
|
(1,349
|
)
|
||
|
Adjustments to reconcile net loss to net cash used in operating activities:
|
|||||||||||
|
Share-based compensation expense
|
10,367
|
|
6,115
|
|
—
|
|
|||||
|
Warrants issued in connection with line of credit
|
—
|
|
1,620
|
|
—
|
|
|||||
|
Loss (gain) from change in fair value of warrant liability
|
1,529
|
|
(278
|
)
|
—
|
|
|||||
|
Net realized investment gains
|
(188
|
)
|
—
|
|
—
|
|
|||||
|
Depreciation and other amortization
|
3,325
|
|
3
|
|
—
|
|
|||||
|
Accrued investment income
|
(1,038
|
)
|
(2
|
)
|
—
|
|
|||||
|
Changes in operating assets and liabilities:
|
|||||||||||
|
Receivable from affiliates
|
(10,565
|
)
|
—
|
|
—
|
|
|||||
|
Prepaid expenses
|
(1,102
|
)
|
(234
|
)
|
(183
|
)
|
|||||
|
Other assets
|
32,326
|
|
1,118
|
|
(26
|
)
|
|||||
|
Accounts payable and accrued expenses
|
623
|
|
4,550
|
|
1,353
|
|
|||||
|
Net Cash Used in Operating Activities
|
(19,907
|
)
|
(14,599
|
)
|
(205
|
)
|
|||||
|
Cash Flows from Investing Activities
|
|||||||||||
|
Capitalization of subsidiaries
|
—
|
|
(220,000
|
)
|
—
|
|
|||||
|
Purchase of fixed maturities, available-for-sale
|
(293,470
|
)
|
—
|
|
—
|
|
|||||
|
Proceeds from sale of fixed maturities, available-for-sale
|
59,454
|
|
—
|
|
—
|
|
|||||
|
Purchase of software and equipment
|
(6,695
|
)
|
(2,444
|
)
|
—
|
|
|||||
|
Acquisition of subsidiaries
|
—
|
|
(2,500
|
)
|
—
|
|
|||||
|
Net Cash Used in Investing Activities
|
(240,711
|
)
|
(224,944
|
)
|
—
|
|
|||||
|
Cash Flows from Financing Activities
|
|||||||||||
|
(Payments) Proceeds on line of credit
|
—
|
|
—
|
|
205
|
|
|||||
|
Payment of financing debt
|
—
|
|
(205
|
)
|
—
|
|
|||||
|
Issuance of common stock
|
27,912
|
|
510,465
|
|
—
|
|
|||||
|
Taxes paid related to net share settlement of equity awards
|
(1,578
|
)
|
—
|
|
—
|
|
|||||
|
Net Cash Provided by Financing Activities
|
26,334
|
|
510,260
|
|
205
|
|
|||||
|
Net (Decrease) Increase in Cash and Cash Equivalents
|
(234,284
|
)
|
270,717
|
|
—
|
|
|||||
|
Cash and Cash Equivalents, beginning of period
|
270,717
|
|
—
|
|
—
|
|
|||||
|
Cash and Cash Equivalents, end of period
|
$
|
36,433
|
|
$
|
270,717
|
|
$
|
—
|
|
||
F-4
NMI HOLDINGS, INC.
SCHEDULE II - FINANCIAL INFORMATION OF REGISTRANT
SUPPLEMENTAL NOTES
PARENT COMPANY ONLY
Note A
The NMI Holdings, Inc. (the “Parent Company”) financial statements represent the stand-alone financial statements of the Parent Company. These financial statements have been prepared on the same basis and using the same accounting policies as described in the consolidated financial statements included herein. Refer to the Parent Company’s consolidated financial statements for additional information.
Revisions to Prior Periods
Certain other prior balances have been reclassified to conform to the current period presentation.
Note B
Our insurance subsidiaries are subject to statutory regulations as to maintenance of policyholders' surplus and payment of dividends. The maximum amount of dividends that the insurance subsidiaries may pay in any twelve-month period without regulatory approval by the Office of the Commissioner of Insurance of the State of Wisconsin is the lesser of adjusted statutory net income or 10% of statutory policyholders' surplus as of the preceding calendar year end. Adjusted statutory net income is defined for this purpose to be the greater of statutory net income, net of realized investment gains, for the calendar year preceding the date of the dividend or statutory net income, net of realized investment gains, for the three calendar years preceding the date of the dividend less dividends paid within the first two of the preceding three calendar years.
Note C
The Parent Company provides certain services to its subsidiaries. The Parent Company allocates to its subsidiaries corporate expense it incurs in the capacity of supporting those subsidiaries, based on either an allocated percentage of time spent or internally allocated capital. Total operating expenses allocated to subsidiaries for 2013 were
$32.5 million
. No expenses were allocated to subsidiaries during 2012 or 2011. Amounts charged to the subsidiaries for operating expenses are based on actual cost, without any mark-up. The Parent Company considers these charges fair and reasonable. The subsidiaries reimburse the Parent Company for these costs in a timely manner, which has the impact of improving the cash flows of the Parent Company.
F-5
NMI HOLDINGS, INC.
SCHEDULE IV - FINANCIAL INFORMATION OF REGISTRANT
REINSURANCE
PARENT COMPANY ONLY
The Parent Company has no reinsurance agreements. The insurance subsidiaries are both mono-line mortgage guaranty insurance companies and the assets of each are dedicated only to the support of our mortgage insurance operations. NMIC only writes direct mortgage guaranty insurance business and assumes no business from any other entity. Re One only assumes business from NMIC to allow NMIC to comply with statutory risk requirements. Neither NMIC nor Re One count any subsidiary of any kind in their admitted statutory assets.
F-6
EXHIBIT INDEX
|
Exhibit Number
|
Description
|
|
|
2.1
|
Stock Purchase Agreement, dated November 30, 2011, between NMI Holdings, Inc. and MAC Financial Ltd. (incorporated herein by reference to Exhibit 2.1 to our Form S-1 Registration Statement (Registration No. 333-191635), filed on October 9, 2013)
|
|
|
2.2
|
Amendment to Stock Purchase Agreement, dated April 6, 2012, between NMI Holdings, Inc. and MAC Financial Ltd. (incorporated herein by reference to Exhibit 2.2 to our Form S-1 Registration Statement (Registration No. 333-191635), filed on October 9, 2013)
|
|
|
3.1
|
Second Amended and Restated Certificate of Incorporation (incorporated herein by reference to Exhibit 3.1 to our Form S-1 Registration Statement (Registration No. 333-191635), filed on October 9, 2013)
|
|
|
3.2
|
Amended and Restated By-Laws (incorporated herein by reference to Exhibit 3.2 to our Form S-1 Registration Statement (Registration No. 333-191635), filed on October 9, 2013)
|
|
|
4.1
|
Specimen Class A common stock certificate (incorporated herein by reference to Exhibit 4.1 to our Form S-1 Registration Statement (Registration No. 333-191635), filed on October 9, 2013)
|
|
|
4.2
|
Registration Rights Agreement between NMI Holdings, Inc. and FBR Capital Markets & Co., dated April 24, 2012 (incorporated herein by reference to Exhibit 4.2 to our Form S-1 Registration Statement (Registration No. 333-191635), filed on October 9, 2013)
|
|
|
4.3
|
Registration Rights Agreement by and between MAC Financial Ltd. and NMI Holdings, Inc., dated April 24, 2012 (incorporated herein by reference to Exhibit 4.3 to our Form S-1 Registration Statement (Registration No. 333-191635), filed on October 9, 2013)
|
|
|
4.4
|
Registration Rights Agreement between FBR & Co., FBR Capital Markets LT, Inc., FBR Capital Markets & Co., FBR Capital Markets PT, Inc. and NMI Holdings, Inc., dated April 24, 2012 (incorporated herein by reference to Exhibit 4.4 to our Form S-1 Registration Statement (Registration No. 333-191635), filed on October 9, 2013)
|
|
|
4.5
|
Warrant No. 1 to Purchase Common Stock of NMI Holdings, Inc. issued to FBR Capital Markets & Co., dated June 13, 2013 (incorporated herein by reference to Exhibit 4.5 to our Form S-1 Registration Statement (Registration No. 333-191635), filed on October 9, 2013)
|
|
|
4.6
|
Form of Warrant to Purchase Common Stock of NMI Holdings, Inc. issued to former stockholders of MAC Financial Ltd.(incorporated herein by reference to Exhibit 4.6 to our Form S-1 Registration Statement (Registration No. 333-191635), filed on October 9, 2013)
|
|
|
10.1
|
NMI Holdings, Inc. 2012 Stock Incentive Plan (incorporated herein by reference to Exhibit 10.1 to our Form S-1 Registration Statement (Registration No. 333-191635), filed on October 9, 2013)
|
|
|
10.2
|
Form of NMI Holdings, Inc. 2012 Stock Incentive Plan Restricted Stock Unit Award Agreement for Chief Executive Officer and Chief Financial Officer (incorporated herein by reference to Exhibit 10.2 to our Form S-1 Registration Statement (Registration No. 333-191635), filed on October 9, 2013)
|
|
|
10.3
|
Form of NMI Holdings, Inc. 2012 Stock Incentive Plan Restricted Stock Unit Award Agreement for Management (incorporated herein by reference to Exhibit 10.3 to our Form S-1 Registration Statement (Registration No. 333-191635), filed on October 9, 2013)
|
|
|
10.4
|
Form of NMI Holdings, Inc. 2012 Stock Incentive Plan Restricted Stock Unit Award Agreement for Directors (incorporated herein by reference to Exhibit 10.4 to our Form S-1 Registration Statement (Registration No. 333-191635), filed on October 9, 2013)
|
|
|
10.5
|
Form of NMI Holdings, Inc. 2012 Stock Incentive Plan Nonqualified Stock Option Award Agreement for Chief Executive Officer and Chief Financial Officer (incorporated herein by reference to Exhibit 10.5 to our Form S-1 Registration Statement (Registration No. 333-191635), filed on October 9, 2013)
|
|
|
10.6
|
Form of NMI Holdings, Inc. 2012 Stock Incentive Plan Nonqualified Stock Option Award Agreement for Management (incorporated herein by reference to Exhibit 10.6 to our Form S-1 Registration Statement (Registration No. 333-191635), filed on October 9, 2013)
|
|
|
10.7
|
Form of NMI Holdings, Inc. 2012 Stock Incentive Plan Nonqualified Stock Option Award Agreement for Directors (incorporated herein by reference to Exhibit 10.7 to our Form S-1 Registration Statement (Registration No. 333-191635), filed on October 9, 2013)
|
|
|
10.8
|
Employment Agreement by and between NMI Holdings, Inc. and Bradley M. Shuster, dated March 6, 2012 and Amendment, dated April 24, 2012 (incorporated herein by reference to Exhibit 10.8 to our Form S-1 Registration Statement (Registration No. 333-191635), filed on October 9, 2013)
|
|
|
10.9
|
Amendment to Employment Agreement by and between NMI Holdings, Inc. and Bradley M. Shuster, dated April 24, 2012 (incorporated herein by reference to Exhibit 10.9 to our Form S-1 Registration Statement (Registration No. 333-191635), filed on October 9, 2013)
|
|
i
|
Exhibit Number
|
Description
|
|
|
10.10
|
Employment Agreement by and between NMI Holdings, Inc. and Jay M. Sherwood, dated March 6, 2012 and Amendment, dated April 24, 2012 (incorporated herein by reference to Exhibit 10.10 to our Form S-1 Registration Statement (Registration No. 333-191635), filed on October 9, 2013)
|
|
|
10.11
|
Amendment to Employment Agreement by and between NMI Holdings, Inc. and Jay M. Sherwood, dated April 24, 2012 (incorporated herein by reference to Exhibit 10.11 to our Form S-1 Registration Statement (Registration No. 333-191635), filed on October 9, 2013)
|
|
|
10.12
|
Letter Agreement by and between NMI Holdings, Inc. and Stanley M. Pachura, dated April 26, 2012 (incorporated herein by reference to Exhibit 10.12 to our Form S-1 Registration Statement (Registration No. 333-191635), filed on October 9, 2013)
|
|
|
10.13
|
Form of Indemnification Agreement between NMI Holdings, Inc. and certain of its directors (incorporated herein by reference to Exhibit 10.13 to our Form S-1 Registration Statement (Registration No. 333-191635), filed on October 9, 2013)
|
|
|
10.14
|
Commitment Letter dated July 12, 2013 for Bulk Fannie Mae-Paid Loss-on-Sale Mortgage Insurance on the Portfolio of approximately $5.46 billion Purchased by Fannie Mae and Identified by Fannie Mae as Deal No. 2013 MIRT 01 and by the Company as Policy No. P-0001-01 (incorporated herein by reference to Exhibit 10.14 to our Form S-1 Registration Statement (Registration No. 333-191635), filed on October 9, 2013)
|
|
|
21.1
|
Subsidiaries of NMI Holdings, Inc. (incorporated herein by reference to Exhibit 21.1 to our Form S-1 Registration Statement (Registration No. 333-191635), filed on October 9, 2013)
|
|
|
23.1
|
Consent of BDO USA, LLP
|
|
|
31.1
|
Principal Executive Officer's Certification Pursuant to Section 302 of the Sarbanes-Oxley Act of 2002
|
|
|
31.2
|
Principal Financial Officer's Certification Pursuant to Section 302 of the Sarbanes-Oxley Act of 2002
|
|
|
32 #
|
Certifications of CEO and CFO Pursuant to 18 U.S.C. Section 1350, as Adopted Pursuant to Section 906 of the Sarbanes-Oxley Act of 2002
|
|
|
99.1
|
Conditional Approval Letter, dated January 15, 2013, from Freddie Mac to National Mortgage Insurance Corporation (incorporated herein by reference to Exhibit 99.1 to our Form S-1 Registration Statement (Registration No. 333-191635), filed on October 9, 2013)
|
|
|
99.2
|
Conditional Approval Agreement, dated January 16, 2013, by and among Federal National Mortgage Association, NMI Holdings, Inc. and National Mortgage Insurance Corporation (incorporated herein by reference to Exhibit 99.2 to our Form S-1 Registration Statement (Registration No. 333-191635), filed on October 9, 2013)
|
|
|
101 *
|
The following financial information from NMI Holdings, Inc.’s Annual Report on Form 10-K for the year ended December 31, 2013, formatted in XBRL (eXtensible Business Reporting Language):
(i) Consolidated Balance Sheets as of December 31, 2013 and 2012
(ii) Consolidated Statements of Comprehensive Loss for each of the three years in the period ended December 31, 2013
(iii) Consolidated Statements of Changes in Shareholders' Equity for each of the three years in the period ended December 31, 2013
(iv) Consolidated Statements of Cash Flows for each of the years in the period ended December 31, 2013, and
(v) Notes to Consolidated Financial Statements
|
|
|
#
|
In accordance with Item 601(b)(32)(ii) of Regulation S-K and SEC Release No. 34-47986, the certifications furnished in Exhibit 32 hereto are deemed to accompany this Form 10-Q and will not be deemed “filed” for purposes of Section 18 of the Exchange Act or deemed to be incorporated by reference into any filing under the Exchange Act or the Securities Act except to the extent that the registrant specifically incorporates it by reference.
|
|
*
|
In accordance with Rule 406T of Regulation S-T, the information furnished in these exhibits will not be deemed “filed” for purposes of Section 18 of the Exchange Act. Such exhibits will not be deemed to be incorporated by reference into any filing under the Securities Act or the Exchange Act except to the extent that the registrant specifically incorporates it by reference.
|
ii
TABLE OF CONTENTS
Part IItem 1. BusinessItem 1A. Risk FactorsPart 1, Item 1,Item 1B. Unresolved Staff CommentsItem 2. PropertiesItem 3. Legal ProceedingsItem 4. Mine Safety DisclosuresPart IIItem 5. Market For Registrant's Common Equity, Related Stockholder Matters and Issuer Purchases Of Equity SecuritiesItem 6. Selected Financial DataItem 7. Management's Discussion and Analysis Of Financial Condition and Results Of OperationsItem 7A. Quantitative and Qualitative Disclosures About Market RiskItem 8. Financial Statements and Supplementary DataNote 7, Software and Equipment."Note 9, Commitments and Contingencies"Note 1. Organization"Note 2, Summary Of Accounting Principles - Warrants."Item 9. Changes in and Disagreements with Accountants on Accounting and Financial DisclosureItem 9A. Controls and ProceduresItem 9B. Other InformationPart IIIItem 10. Directors, Executive Officers and Corporate GovernanceItem 11. Executive CompensationItem 12. Security Ownership Of Certain Beneficial Owners and Management and Related Stockholder MattersItem 13. Certain Relationships and Related Transactions, and Director IndependenceItem 14. Principal Accountant Fees and ServicesPart IVItem 15. Exhibits and Financial Statement Schedules