NMI HOLDINGS, INC.
10-Ks and 10-Qs
|
|
|
|
|
|
|
|
|
|
|
|
|
|
|
|
|
|
|
|
|
|
|
|
|
|
|
|
|
|
|
|
|
|
|
|
|
|
|
|
|
|
|
|
UNITED STATES
SECURITIES AND EXCHANGE COMMISSION
WASHINGTON, D.C. 20549
|
FORM 10-K
|
|
(Mark One)
|
|
|
x
|
ANNUAL REPORT PURSUANT TO SECTION 13 OR 15(d) OF THE SECURITIES EXCHANGE ACT OF 1934
For the fiscal year ended
December 31, 2018
|
OR
|
o
|
TRANSITION REPORT PURSUANT TO SECTION 13 OR 15(d) OF THE SECURITIES EXCHANGE ACT OF 1934
For the transition period from
to
|
|
Commission file number
001-36
174
|
|
NMI Holdings, Inc.
|
|
(Exact name of registrant as specified in its charter)
|
|
DELAWARE
|
|
45-4914248
|
|
(State or other jurisdiction of incorporation or organization)
|
(I.R.S. Employer Identification No.)
|
|
|
2100 Powell Street, Emeryville, CA
|
|
94608
|
|
(Address of principal executive offices)
|
(Zip Code)
|
|
(855) 530-6642
(Registrant's telephone number, including area code)
|
Securities registered pursuant to Section 12(b) of the Act:
|
||
|
Title of each class
|
Name of each exchange on which registered
|
|
|
Class A Common Stock, $.01 par value per share
|
NASDAQ Stock Market LLC
|
|
|
Securities registered pursuant to Section 12(g) of the Act:
|
||
|
None
|
||
Indicate by check mark if the registrant is a well-known seasoned issuer, as defined in Rule 405 of the Securities Act.
YES
x
NO
o
Indicate by check mark if the registrant is not required to file reports pursuant to Section 13 or 15(d) of the Act.
YES
o
NO
x
Indicate by check mark whether the registrant (1) has filed all reports required to be filed by Section 13 or 15(d) of the Securities Exchange Act of 1934 during the preceding 12 months (or for such shorter period that the registrant was required to file such reports), and (2) has been subject to such filing requirements for the past 90 days.
YES
x
NO
o
Indicate by check mark whether the registrant has submitted electronically every Interactive Data File required to be submitted pursuant to Rule 405 of Regulation S-T during the preceding 12 months (or for such shorter period that the registrant was required to submit such files).
YES
x
NO
o
Indicate by check mark if disclosure of delinquent filers pursuant to Item 405 of Regulation S-K (§229.405 of this chapter) is not contained herein, and will not be contained, to the best of registrant's knowledge, in definitive proxy or information statements incorporated by reference in Part III of this Form 10-K or any amendment to this Form 10-K.
o
Indicate by check mark whether the registrant is a large accelerated filer, an accelerated filer, a non-accelerated filer, smaller reporting company or an emerging growth company. See the definitions of "large accelerated filer," "accelerated filer" "smaller reporting company" and "emerging growth company" in Rule 12b-2 of the Exchange Act. (Check one):
|
Large accelerated filer
x
|
Accelerated filer
o
|
Non-accelerated filer
o
|
Smaller reporting company
o
|
|
Emerging growth company
o
|
|||
If an emerging growth company, indicate by check mark if the registrant has elected not to use the extended transition period for complying with any new or revised financial accounting standards provided pursuant to Section 13(a) of the Exchange Act.
o
Indicate by check mark whether the registrant is a shell company (as defined in Rule 12b-2 of the Exchange Act).
YES
o
NO
x
As of June 30, 2018, the last business day of the registrant's most recently completed second fiscal quarter, the calculated aggregate market value of common stock held by non-affiliates was $1,052,831,735.
The number of shares of common stock, $0.01 par value per share, of the registrant outstanding on February 11, 2019 was
66,427,675
shares.
DOCUMENTS INCORPORATED BY REFERENCE
Portions of the registrant's Proxy Statement for the 2019 Annual Meeting of Stockholders are incorporated herein by reference in Part III of this Annual Report on Form 10-K to the extent stated herein. Such Proxy Statement will be filed with the Securities and Exchange Commission within 120 days of the registrant's fiscal year ended December 31, 2018.
TABLE OF CONTENTS
|
Cautionary Note Regarding Forward Looking Statements
|
||
|
PART I
|
||
|
Item 1.
|
||
|
Item 1A.
|
||
|
Item 1B.
|
||
|
Item 2.
|
||
|
Item 3.
|
||
|
Item 4.
|
||
|
PART II
|
||
|
Item 5.
|
||
|
Item 6.
|
||
|
Item 7.
|
||
|
Item 7A.
|
||
|
Item 8.
|
||
|
Item 9.
|
||
|
Item 9A.
|
||
|
Item 9B.
|
||
|
PART III
|
||
|
Item 10.
|
||
|
Item 11.
|
||
|
Item 12.
|
||
|
Item 13.
|
||
|
Item 14.
|
||
|
PART IV
|
||
|
Item 15.
|
||
2
CAUTIONARY NOTE REGARDING FORWARD LOOKING STATEMENTS
This report contains forward looking statements within the meaning of Section 27A of the Securities Act of 1933, as amended (Securities Act), Section 21E of the Securities Exchange Act of 1934, as amended (Exchange Act), and the U.S. Private Securities Litigation Reform Act of 1995. Any statements about our expectations, beliefs, plans, predictions, forecasts, objectives, assumptions or future events or performance are not historical facts and may be forward looking. These statements are often, but not always, made through the use of words or phrases such as "anticipate," "believe," "can," "could," "may," "predict," "potential," "should," "will," "estimate," "plan," "project," "continuing," "ongoing," "expect," "intend" or words of similar meaning and include, but are not limited to, statements regarding the outlook for our future business and financial performance. All forward looking statements are necessarily only estimates of future results, and actual results may differ materially from expectations. You are, therefore, cautioned not to place undue reliance on such statements which should be read in conjunction with the other cautionary statements that are included elsewhere in this report. Further, any forward looking statement speaks only as of the date on which it is made and we undertake no obligation to update or revise any forward looking statement to reflect events or circumstances after the date on which the statement is made or to reflect the occurrence of unanticipated events. We have based these forward looking statements on our current expectations and projections about future events and financial trends that we believe may affect our financial condition, operating results, business strategy and financial needs. There are important factors that could cause our actual results, level of activity, performance or achievements to differ materially from the results, level of activity, performance or achievements expressed or implied by the forward looking statements including, but not limited to:
|
•
|
changes in the business practices of Fannie Mae and Freddie Mac (collectively, the GSEs), including decisions that have the impact of decreasing or discontinuing the use of mortgage insurance as credit enhancement;
|
|
•
|
our ability to remain an eligible mortgage insurer under the private mortgage insurer eligibility requirements (PMIERs) and other requirements imposed by the GSEs, which they may change at any time;
|
|
•
|
retention of our existing certificates of authority in each state and the District of Columbia (D.C.) and our ability to remain a mortgage insurer in good standing in each state and D.C.;
|
|
•
|
our future profitability, liquidity and capital resources;
|
|
•
|
actions of existing competitors, including other private mortgage insurers and government mortgage insurers like the Federal Housing Administration (FHA), the U.S. Department of Agriculture's Rural Housing Service (USDA) and the Veterans Administration (VA) (collectively, government MIs), and potential market entry by new competitors or consolidation of existing competitors;
|
|
•
|
developments in the world's financial and capital markets and our access to such markets, including reinsurance;
|
|
•
|
adoption of new or changes to existing laws and regulations that impact our business or financial condition directly or the mortgage insurance industry generally or their enforcement and implementation by regulators;
|
|
•
|
legislative or regulatory changes to the GSEs' role in the secondary mortgage market or other changes that could affect the residential mortgage industry generally or mortgage insurance in particular;
|
|
•
|
potential future lawsuits, investigations or inquiries or resolution of current lawsuits or inquiries;
|
|
•
|
changes in general economic, market and political conditions and policies, interest rates, inflation, and investment results or other conditions that affect the housing market or the markets for home mortgages or mortgage insurance;
|
|
•
|
our ability to successfully execute and implement our capital plans, including our ability to access the capital, credit and reinsurance markets and to enter into, and receive approval of, reinsurance arrangements on terms and conditions that are acceptable to us, the GSEs and our regulators;
|
|
•
|
our ability to implement our business strategy, including our ability to write mortgage insurance on high quality low down payment residential mortgage loans, implement successfully and on a timely basis, complex infrastructure, systems, procedures, and internal controls to support our business and regulatory and reporting requirements of the insurance industry;
|
|
•
|
our ability to attract and retain a diverse customer base, including the largest mortgage originators;
|
|
•
|
failure of risk management or pricing or investment strategies;
|
|
•
|
emergence of unexpected claim and coverage issues, including claims exceeding our reserves or amounts we had expected to experience;
|
3
|
•
|
potential adverse impacts arising from recent natural disasters, including, with respect to the affected areas, a decline in new business, adverse effects on home prices, and an increase in notices of default on insured mortgages;
|
|
•
|
the inability of our counter-parties, including third party reinsurers, to meet their obligations to us;
|
|
•
|
failure to maintain, improve and continue to develop necessary information technology (IT) systems or the failure of technology providers to perform; and
|
|
•
|
ability to recruit, train and retain key personnel.
|
For more information regarding these risks and uncertainties as well as certain additional risks that we face, you should refer to the
Risk Factors
described in this report in Item 1A, "
Risk Factors,
" Item 7, "
Management's Discussion and Analysis of Financial Condition and Results of Operations
" and elsewhere in this report, including the exhibits hereto.
Unless expressly indicated or the context requires otherwise, the terms "we," "our," "us," "Company" and "NMI" in this document refer to NMI Holdings, Inc., a Delaware corporation, and its wholly owned subsidiaries on a consolidated basis.
4
PART I
Item 1. Business
General
We provide mortgage insurance (referred to as "mortgage insurance" or "MI") through our wholly owned insurance subsidiaries, National Mortgage Insurance Corporation (NMIC) and National Mortgage Reinsurance Inc One (Re One). NMIC and Re One are domiciled in Wisconsin and principally regulated by the Wisconsin Office of the Commissioner of Insurance (Wisconsin OCI). NMIC is our primary insurance subsidiary, and is approved as an MI provider by the GSEs and is licensed to write MI coverage in all 50 states and D.C. Re One provides reinsurance to NMIC on insured loans with coverage levels in excess of 25%, after giving effect to third-party reinsurance. Our subsidiary, NMI Services, Inc. (NMIS), provides outsourced loan review services to mortgage loan originators.
MI protects lenders and investors from default-related losses on a portion of the unpaid principal balance of a covered mortgage. MI plays a critical role in the U.S. housing market by mitigating mortgage credit risk and facilitating the secondary market sale of high loan-to-value (LTV) (
i.e.
above 80%) residential loans to the GSEs, who are otherwise restricted by their charters from purchasing or guaranteeing high-LTV mortgages that are not covered by certain credit protections. Such credit protection and secondary market sales allow lenders to increase their capacity for mortgage commitments and expand financing access to existing and prospective homeowners.
NMI Holdings, Inc. (NMIH), a Delaware corporation, was incorporated in May 2011, and we began start-up operations in 2012 and wrote our first MI policy in 2013. Since formation, we have sought to establish customer relationships with a broad group of mortgage lenders and build a diversified, high-quality insured portfolio. As of
December 31, 2018
, we had master policies with
1,374
customers, including national and regional mortgage banks, money center banks, credit unions, community banks, builder-owned mortgage lenders, internet-sourced lenders and other non-bank lenders. As of
December 31, 2018
, we had
$71.5
billion of total insurance-in-force (IIF), including primary IIF of
$68.6 billion
, and
$17.2 billion
of gross risk-in-force (RIF), including primary RIF of
$17.1 billion
. For the year ended
December 31, 2018
, we generated new insurance written (NIW) of
$27.3 billion
. As of
December 31, 2018
, we had 304 full-time employees.
We believe that our success in acquiring a large and diverse group of lender customers and growing a portfolio of high-quality IIF traces to our founding principles, whereby we aim to help qualified individuals achieve the dream of homeownership, ensure that we remain a strong and credible counterparty, deliver a unique customer service experience, establish a differentiated risk management approach that emphasizes the individual underwriting review or validation of the vast majority of the loans we insure, and foster a culture of collaboration and excellence that helps us attract and retain experienced industry leaders.
Our strategy is to continue to build on our position in the private MI market, expand our customer base and grow our insured portfolio of high-quality residential loans by focusing on long-term customer relationships, disciplined and proactive risk selection and pricing, fair and transparent claims payment practices, responsive customer service, financial strength and profitability.
Our common stock trades on the NASDAQ under the symbol "NMIH."
Overview of Residential Mortgage Finance and the Role of the Private MI Industry in the Current Operating Environment
U.S. Residential Mortgage Market
According to statistics published by the U.S. Federal Reserve, the U.S. residential mortgage market is one of the largest in the world, with more than $10 trillion of mortgage debt outstanding as of December 31, 2018, and includes both primary and secondary components. The primary market consists of lenders originating home loans to borrowers and includes loans made in connection with home purchases, which are referred to as purchase originations, and loans made to refinance existing mortgages, which are referred to as refinancing originations. The secondary market includes institutions that buy and sell mortgages in the form of whole loans or securitized assets, such as mortgage-backed securities.
The U.S. residential mortgage market attracts and involves participation from a range of private and governmental institutions. Private industry participants include national and regional mortgage banks, money center banks, mortgage brokers, community banks, builder-owned mortgage lenders, internet-sourced lenders, commercial, regional and investment banks, savings institutions, credit unions, REITs and other financial institutions. Government participants include government agencies such as the government MIs and Ginnie Mae, as well as government-sponsored enterprises, such as Fannie Mae and Freddie Mac.
5
GSEs
The GSEs are the largest participants in the secondary mortgage market, buying residential mortgages from banks and other primary lenders in connection with their federal mandate to provide liquidity and promote stability in the U.S. housing finance system. The GSEs' charters prohibit them from purchasing or guaranteeing high-LTV loans unless such loans are covered by an authorized form of credit enhancement, including insurance from a GSE-approved MI company, retention by the mortgage seller of at least a 10% participation in the loan or agreement by the seller to repurchase or replace the loan in the event of a default. As the largest participants in the secondary mortgage market, the GSEs are the principal purchasers of mortgages insured by mortgage insurers, including NMIC. As a result, the private MI industry in the U.S. is driven in large part by the GSEs' mortgage insurance requirements and business practices. See "
Business - U.S. Mortgage Insurance Regulation - GSE Oversight
," below.
Mortgage Insurance
MI protects lenders and investors from default-related losses on a portion of the unpaid principal balance of a covered mortgage and plays a central role in the U.S. housing market. MI is provided by both government MIs and private MI companies, such as NMIC, and is primarily geared toward high-LTV loans where borrowers make a down-payment that is less than 20% of the value of a home. MI helps facilitate secondary market sales of such mortgages, primarily to the GSEs, and provides lenders and investors a means to diversify and mitigate their exposure to mortgage credit risk. Such credit protection and secondary market sales allow lenders to increase their capacity for mortgage commitments and expand financing access to existing and prospective homeowners.
Competition
Our competition includes other private mortgage insurers, government MIs and other alternatives designed to eliminate the need for MI, such as piggy-back loans or front-end risk sharing arrangements that do not require private MI on loans sold to the GSEs.
The private MI industry is highly competitive and currently consists of six active participants, including us, Arch Capital Group Ltd., Essent Group Ltd. (Essent), Genworth Financial, Inc., MGIC Investment Corporation (MGIC), and Radian Group Inc. (Radian). Private mortgage insurers generally compete based on terms of coverage, underwriting guidelines, pricing, customer service (including speed of MI underwriting and decisioning), availability of ancillary products and services (including training and loan review services), financial strength, information security, customer relationships, name recognition and reputation, the strength of management teams and sales organizations, the effective use of technology, and innovation in the delivery and servicing of insurance products. We expect the MI market to remain competitive, with pressure for industry participants to grow or maintain their market share.
We and other private mortgage insurers also compete directly with the government MI companies, who significantly increased their presence in the MI market following the 2008 financial crisis. Prior to the financial crisis, private mortgage insurers accounted for the majority of the insured mortgage origination market. Beginning in 2008, government MIs significantly expanded their role in the MI market as incumbent private mortgage insurers came under significant financial stress. According to data reported by Inside Mortgage Finance, in 2007, government MIs accounted for 23% of the total insured mortgage origination market. By 2009, government MI share had peaked at approximately 82% of the total insured mortgage origination market. Government MI share has since declined and is estimated to have been 57% in 2018. Although there has been broad policy consensus toward the need for private capital to play a larger role and government credit risk to be reduced in the U.S. housing finance system, it remains difficult to predict whether the combined market share of government MIs will recede to historical levels. A range of factors influence a lender's decision to choose private over government MI, including among others, premium rates and other charges, loan eligibility requirements, cancelability, loan size limits and the relative ease of use of private MI products compared to government MI alternatives.
Products and Services
Mortgage Insurance Products
We offer two principal types of MI coverage, primary and pool.
Primary Mortgage Insurance
Primary MI provides default protection on individual mortgage loans at specified coverage percentages. Primary MI is typically written on a flow basis, whereby mortgages are insured on an individual, loan-by-loan basis at the time of origination. Primary MI can also be written on an aggregated basis, whereby each mortgage in a given loan portfolio is individually insured in a single transaction after the point of origination.
6
All of our primary insurance is written on first-lien mortgage loans, with nearly all secured by owner occupied single-family homes (defined as one-to-four family homes and condominiums). We also write a small amount of primary insurance on first-lien mortgages secured by vacation properties, second homes and investment properties, although we have formal risk policies in place to limit the amount of such business we underwrite.
Lenders select specific coverage levels for each loan insured on a primary basis. For loans sold to a GSE, the coverage level must comply with the requirements established by that GSE. For other loans, lenders determine their desired coverage levels.
IIF is the unpaid principal balance of all insured loans on a given date, and RIF is the product of the coverage percentages multiplied by the IIF on such date. We expect our RIF across all policies written to approximate 25% of primary IIF; however, coverage levels will vary on an individual loan basis between 6% and 35%. Higher coverage percentages generally result in greater amounts paid per claim relative to policies with lower coverage percentages. In general, our premium rates increase as coverage levels increase.
Our maximum obligation with respect to a claim is generally determined by multiplying the selected coverage percentage by the loss amount on an insured loan. The loss amount is defined in our master mortgage insurance policy (together with its related endorsements, the Master Policy) and includes unpaid loan principal, delinquent interest and certain expenses associated with the default and subsequent foreclosure or sale of the property securing the insured loan. See "
Business - Defaults and Claims; Loss Mitigation - Defaults and Claims
," below for a description of our claim settlement processes.
The terms of our primary mortgage insurance coverage are governed by our Master Policy, which we issue to each approved lender with which we do business. The Master Policy sets forth the terms and conditions of our MI coverage, including, among others, loan eligibility requirements, coverage terms, premium payment obligations, exclusions or reductions in coverage, rescission and rescission relief provisions, policy administration requirements, conditions precedent to payment of a claim and loss payment procedures. Our Master Policy is publicly available on our website. Upon receipt of an insurable loan, we issue a certificate of insurance that extends coverage for such loan under our Master Policy. See "
Business - Underwriting
," below for a description of our underwriting processes. Our MI coverage attaches at a loan level and remains in effect whether a mortgage is retained by the originating lender or sold, assigned or otherwise transferred in the secondary market. We consider the original lender or any subsequent owner of an insured loan to be our insured or, with respect to the GSEs, third-party beneficiaries under our Master Policy.
Premium payments for primary MI are the contractual responsibility of our insureds; however, depending on how the loan is structured, the premium payments may be paid by either the lender or the borrower, notwithstanding that the borrower is not a beneficiary under the terms of the policy. Policies with premium payments made by the borrower are referred to as borrower paid mortgage insurance (BPMI) and those with premium payments made by the lender are referred to as lender paid mortgage insurance (LPMI). Lenders may structure loans to recover LPMI premiums from borrowers, including through increases in mortgage note rates or higher origination fees.
Our premiums are based on statutory rating rules and rates that we file with various state insurance departments. We establish our premium rates based on models that assess risk across a spectrum of variables, including coverage percentages, LTV ratios, loan and property attributes, borrower debt-to-income (DTI) profiles, and market and macroeconomic conditions. We have discretion under our rates and rating rules to flex our premium rates to a limited degree, and we may choose to do so for lenders or programs that meet certain criteria. We generally cannot change premium rates on insured loans after coverage is established.
In general, premiums are calculated as a percentage of the original principal balance of an insured loan. We have four premium plans:
|
•
|
single — entire premium is paid upfront at the time coverage is placed;
|
|
•
|
annual — premiums are paid in advance for a subsequent 12 month period over the life of a policy;
|
|
•
|
monthly — premiums are paid in advance on a monthly basis over the life of the policy; and
|
|
•
|
Monthly Advantage
®
— premiums are billed and paid in arrears upon our receipt of notice of a mortgage close, and on a monthly basis in arrears thereafter over the life of the policy.
|
In general, we may not terminate MI coverage except when an insured fails to pay premium as due or for certain material violations of our Master Policy; although, as discussed below in "
Business
-
Underwriting - Independent Validation and Rescission Relief
," the terms of our Master Policy restrict our ability to rescind coverage when certain criteria are met. Insureds may cancel coverage on a loan at any time at their option or upon mortgage repayment, which may be accelerated because a borrower refinances a mortgage or sells the underlying property. GSE guidelines generally provide that a borrower on a GSE-owned or guaranteed loan meeting certain conditions may require their mortgage servicer to cancel BPMI upon the borrower's request when the principal
7
balance of the loan is 80% or less of the property's current assessed value. The federal Homeowners Protection Act of 1998 (HOPA) also requires the automatic termination of BPMI on most current loans when the LTV ratio (based on the original value of the underlying property and original amortization schedule of the loan) is first scheduled to reach 78%. The HOPA also provides for cancellation of BPMI upon a borrower's request when the LTV ratio (based on the original value of the underlying property and original amortization schedule of the loan) is first scheduled to reach or, based on actual payments, reaches 80%, upon satisfaction of the conditions set forth in the HOPA, including that the loan be current at the time. In addition, some states impose their own MI notice and cancellation requirements on mortgage loan servicers.
Pool Insurance
Pool insurance is generally used to provide additional "credit enhancement" for certain secondary market mortgage transactions. Pool insurance generally covers the excess of loss on a defaulted mortgage loan that exceeds the claim payment under the primary MI coverage, if such loan has primary coverage, as well as the total loss on a defaulted mortgage loan that did not have primary coverage. Pool insurance may have a stated aggregate loss limit for a pool of loans and may also have a deductible under which no losses are paid by the mortgage insurer until the aggregate loss on the pool of loans exceeds the deductible.
In 2013, NMIC entered into a pool agreement with Fannie Mae, pursuant to which NMIC initially insured 21,921 loans with IIF of $5.2 billion (as of September 1, 2013). Fannie Mae pays monthly premiums for this transaction, which are recorded as written and earned in the month received. The agreement has a term of 10 years from September 1, 2013, the coverage effective date. The RIF to NMIC is $93.1 million, which represents the difference between a deductible payable by Fannie Mae on initial losses and a stop loss above which losses are borne by Fannie Mae. NMIC provides this same level of risk coverage over the term of the agreement. 100% of this pool risk is reinsured under the Company's September 2016 quota-share reinsurance transaction (2016 QSR Transaction), discussed below at "
Business - Reinsurance - Third Party Reinsurance - Quota Share Reinsurance
."
We did not write any pool insurance in 2018 and at present do not expect to write any meaningful amount of pool insurance in the near future.
Loan Review Services
We offer outsourced loan review services to mortgage originators on a limited basis through NMIS. In connection with these services, NMIS reviews loan data and documentation and assesses whether individual loan applications comply with the originator's and/or GSE underwriting guidelines. We provide loan review services for mortgages that require MI and those that do not. Under the terms of its loan review agreements, NMIS provides customers with limited indemnification against losses if NMIS makes certain material loan review errors. The indemnification may be in the form of monetary or other remedies, subject to per loan and annual limits. NMIS utilizes third party service providers to conduct individual loan reviews.
Customers
Since our inception, we have sought to establish customer relationships with a broad group of mortgage lenders. As of December 31, 2018, we had Master Policies with
1,374
customers. We classify our customers into two primary categories, which we refer to as "National Accounts" and "Regional Accounts." We consider National Accounts to be the most significant residential mortgage originators as determined by the combined volume of their own "retail" originations and insured business they acquire from "correspondents," or other smaller mortgage originators. National Account lenders primarily sell their loans to the GSEs or, less frequently, to private label secondary markets. National Account lenders may also retain loans they originate or purchase in their portfolios. Regional Account lenders typically originate loans on a local or regional level. Some Regional Account lenders have origination platforms that span multiple regions; however, their primary lending focus is local. Regional Account lenders sell the majority of their origination volume to National Accounts; however, they may also retain loans in their portfolios or sell portions of their production directly to the GSEs.
We further define customers as "centralized" or "decentralized" based on how they allocate their mortgage insurance purchasing decisions across each of their MI providers. Centralized lenders make decisions about the placement and allocation of private mortgage insurance at a centralized, corporate level. Decentralized lenders make decisions about the placement and allocation of private mortgage insurance at a loan level by loan production personnel, such as loan officers. National Account lenders primarily utilize the centralized allocation model and Regional Account lenders primarily utilize the decentralized allocation model. There are, however, a number of National Account lenders who opt for a decentralized approach and a number of Regional Account lenders who opt for a centralized approach.
The GSEs, as major purchasers of conventional mortgage loans in the U.S., are the primary beneficiaries of our mortgage insurance coverage. Revenues from our customers have been generated in the U.S. only.
8
Customers exceeding 10% of consolidated revenues
No individual customer accounted for greater than 10% of our consolidated revenues in 2018.
Sales and Marketing
Our sales and marketing efforts are designed to help us establish and maintain high-quality customer relationships. Our sales force consists of qualified mortgage professionals that generally have well-established relationships with industry leading lenders and significant experience in both MI and mortgage lending. We structure our sales force into National Accounts that focus on relationships with national or large regional lenders, and Regional Accounts that focus on relationships with small or regional lenders, such as community banks, credit unions, mortgage bankers and branches of National Accounts. We also maintain a dedicated customer service team, which we refer to as the Solution Center and which offers support in loan submission and underwriting service, risk management and technology to support our sales efforts.
We also have a product development and marketing department that has primary responsibility for the creation, launch and management of our MI products and technological offerings and coordination of our marketing strategy. Our marketing efforts seek to raise brand awareness through advertising and marketing campaigns, customer training programs, sponsorship of industry and educational events, and our web-based presence and proprietary mobile technology.
Underwriting
We have established underwriting and risk management guidelines based on what we believe to be the major factors that influence the performance of mortgage credit. Our underwriting guidelines incorporate credit eligibility requirements that, among other things, restrict our coverage to mortgages that meet our thresholds with respect to borrower credit scores (FICO), maximum DTI levels, maximum LTVs and documentation requirements. Our underwriting guidelines also limit the coverage we provide for certain higher-risk mortgages, including those for cash-out refinancings, second homes or investment properties.
We gather extensive data, perform detailed loan-level risk analysis and continuously monitor and assess trends in key macroeconomic factors such as housing prices, interest rates and employment, to refine and adapt our underwriting guidelines and pricing assumptions within the context of the current risk environment.
We evaluate loans and issue policies through two underwriting platforms:
|
•
|
Non-Delegated
: Customers submit loan information and documentation to us so that we may individually underwrite each application to reach a decision as to whether we will insure a loan. On receipt of a non-delegated submission, we review the information, documentation and data provided by the lender to underwrite the MI application.
|
|
•
|
Delegated
: We provide eligible customers who we have vetted and approved with the ability to directly underwrite our policies and bind our coverage based on pre-established eligibility rules, approved underwriting guidelines and according to the terms of our Master Policy and Delegated Underwriting Endorsement. We offer delegated underwriting to lenders that have a track record of originating quality mortgage loans and meet our delegated authority approval requirements. To complete the underwriting process and bind coverage, delegated lenders are required to provide us with certain loan characteristics to demonstrate such loans meet our threshold eligibility rules. Our delegated eligibility rules are programmed into our insurance management system, which provides us the ability to automatically reject policies that fail to meet threshold requirements.
|
Lenders elect whether to be non-delegated or delegated customers at the time they apply to become Master Policy holders. Non-delegated lenders deliver all MI applications to us on a non-delegated basis. Certain delegated lenders may choose to deliver some or all of their MI applications to us on a non-delegated basis, but retain their authority to underwrite our MI on a delegated basis. Our underwriting guidelines and risk criteria are consistent across all policies whether originated on a non-delegated or delegated basis.
We employ a team of experienced underwriters who review and evaluate our non-delegated loan submissions. Our underwriters are located remotely across the continental United States, facilitating our ability to service our customers nationwide across the different time zones. We also engage third-party underwriting service providers (USPs) who provide us with incremental underwriting capacity. Our USPs are trained and required under the terms of our outsourcing agreements to follow the same processes and underwriting guidelines that our own employees follow when rendering insurance decisions.
We have processes in place to manage the risk associated with outsourcing a component of our underwriting function. In collaboration with our USPs' management teams, we monitor our USPs' day-to-day underwriting performance and MI decisioning. We also review the qualifications of each individual underwriter assigned by our USPs to service our account and provide them with
9
NMI specific systems and guideline training to ensure they have the necessary training to render underwriting decisions consistent with our underwriting guidelines and credit policies. Our outsourcing agreements require our USPs to perform and provide us with the results of internal quality control reviews on a periodic basis. Individual underwriters with unacceptable performance records are monitored and generally subject to replacement with 30 days' notice. We also perform quarterly quality control reviews of a statistically relevant sample of our non-delegated underwriting decisions, including those made by our USPs.
Our business has been subject to modest seasonality in NIW production. Consistent with the seasonality of home sales, purchase origination volumes typically increase in late spring and peak during the summer months, leading to a rise in NIW volume during the second and third quarters of a given year. Refinancing volume, however, does not follow a set seasonal trend and instead is primarily influenced by mortgage rates. An increase in refinancing volume may limit the seasonal effect of home purchase patterns on mortgage insurance NIW.
Independent Validation and Rescission Relief
We offer post-closing underwriting reviews, which we refer to as "independent validations," for both non-delegated and delegated loans, as described below. Upon satisfactory completion of an independent validation, which involves reviewing certain post-close documentation to confirm our original assessment of non-delegated loans and performing a comprehensive full-file review for delegated loans, we agree on an accelerated basis that we will not rescind coverage under certain circumstances.
Our Master Policy generally provides us the ability to rescind coverage of a loan if there are material misrepresentations and/or fraud in the origination process. When we rescind coverage of a loan, we cancel the certificate as of the original certificate effective date and return all premiums received related to the impacted loan. We believe our Master Policy sets forth clear and straightforward terms regarding our rescission rights, including limitations on our right to rescind coverage when certain conditions are met, which we refer to as "rescission relief." Subject to our independent validation of coverage eligibility of an insured loan, we stipulate in our Master Policy that we will not rescind or cancel coverage of such loan for material borrower misrepresentations or underwriting defects provided the borrower makes the first 12 monthly mortgage payments in a timely fashion. Lenders have the ability to select whether or not to have insured loans subjected to our independent validation process. If a borrower does not make 12 timely payments or a lender has elected not to pursue independent validation and accelerated rescission relief, the loan is still eligible for rescission relief if it is current after 36 months and the borrower has had no more than two 30-day delinquencies and no 60-day or greater delinquencies during such 36-month period. Our rescission relief provisions include additional limitations on our ability to initiate an investigation of fraud or misrepresentation by a "First Party," defined in the Master Policy as our insured or any other party involved in the origination of an insured loan (other than the borrower).
Non-delegated lenders who desire 12-month rescission relief are required to submit additional loan documentation post-closing that allows us to independently validate such loans, including a loan's closing disclosures, note, executed mortgage and title insurance commitment. Loans from non-delegated lenders who choose not to participate in the independent validation process or who fail to submit the necessary documentation are eligible for 36-month rescission relief in accordance with the terms of our Master Policy.
Delegated lenders who desire 12-month rescission relief are required to submit a full file (which contains all the underwriting information and documentation otherwise required by us as part of a non-delegated review and the above-referenced post-closing documentation) after a loan's coverage effective date. We refer to our independent validation of delegated loans as our "Delegated Assurance Review" or "DAR" process. Through DAR, we assess and validate the MI underwriting process and decisions made by our delegated customers on an individual loan level basis. Loans from delegated lenders who choose not to participate in our DAR process are eligible for 36-month rescission relief in accordance with the terms of our Master Policy. All delegated loans, whether included in the DAR process or not, are eligible for review under our quality control process.
In December 2017, the GSEs issued an updated set of principles, the Amended and Restated GSE Rescission Relief Principles (RRPs), which specify the rescission relief provisions that are required to, or may, be included in the master policies of GSE-approved mortgage insurers. In September 2018, the GSEs issued revised RRPs to clarify and align the RRPs with the GSEs' representation and warranty relief framework that applies to lenders who sell their loans to the GSEs. To comply with the revised RRPs, we are drafting a new master mortgage insurance policy that will replace our existing Master Policy and stipulate terms of coverage for new insurance written on or after its effective date. We anticipate that our new master policy will be introduced and take effect no sooner than the second half of 2019. In accordance with the revised RRPs, our rescission rights under the new master policy will be more limited than those under our existing Master Policy. Among other changes, we will be required to grant immediate rescission relief following our satisfactory completion of an independent validation, rather than waiting for the borrower to timely make the first 12 payments. In addition, we will be required to sunset our rescission rights at the 60 month anniversary of the inception of our coverage, provided an insured loan is then current or subsequently cures. We will retain our rescission rights for certain fraud for the life of coverage of a loan; however, the limitations on our ability to pursue this right will be more stringent than in the current Master Policy.
10
We engage USPs to perform the majority of our delegated and non-delegated independent validation work. As with our non-delegated USPs, we review the qualifications of each individual underwriter engaged by our USPs to service our account and provide them with NMI specific systems and guideline training to ensure they have the necessary training to render independent validation decisions consistent with our underwriting guidelines and credit policies.
Policy Pricing
We utilize a proprietary risk-based pricing platform, which we refer to as Rate GPS
SM
, to establish individualized premium rates for most new loans that we insure based on our modeled view of the relative risk and anticipated performance of each loan. Rate GPS considers a broad range of variables, including property type, type of loan product, borrower credit characteristics, and lender and market factors, and provides us with the ability to set and charge premium rates commensurate with the underlying risk of each loan that we insure.
We introduced Rate GPS in June 2018 to replace our previous rate card pricing system. While we expect most of our new business will be priced through Rate GPS, we also continue to offer a rate card pricing option to a limited number of lender customers who require a rate card for operational reasons.
Our pricing approach targets through-the-cycle returns that exceed our cost of capital. We believe the introduction and utilization of Rate GPS provides us with a more granular and analytical approach to evaluating and pricing risk, and that this approach enhances our ability to continue building a high-quality mortgage insurance portfolio and delivering attractive risk-adjusted returns.
Policy Servicing
Our Policy Servicing Department is responsible for various servicing activities related to Master Policy administration, premium billing and payment processing and certificate administration. With respect to servicing activities related to insured loans, our Policy Servicing Department primarily interfaces with our insureds' mortgage loan servicers. Some insureds retain the servicing rights and responsibilities for their own loan originations, while others transfer such rights and responsibilities to third party servicers. A residential mortgage loan servicer handles the day-to-day tasks of managing a lender's loan portfolio, including processing borrowers' loan payments, paying MI premiums to the mortgage insurer, responding to borrower inquiries, keeping track of principal and interest payments, managing escrow accounts and initiating loss mitigation and foreclosure activities. Our servicing specialists are assigned to our servicers to assist with day-to-day transactions and monitoring of their insured loans.
Over time a servicer may change on an insured loan if the related servicing rights are transferred to a different servicer during the life of such loan. Servicing rights and responsibilities related to an insured loan may be sold, assigned or transferred, subject to all of the terms and conditions of the Master Policy and to all defenses we may have had prior to any such sale, assignment or transfer. Under the Master Policy, if the servicing rights for a loan are sold, assigned or transferred, coverage of the loan will continue, provided that the loan is thereafter serviced by a servicer we approve. We have the right under our Master Policy to revoke approval of a servicer; if the impacted insureds wish to maintain coverage of insured loans serviced by the disapproved provider, such insureds must find another servicer that we approve.
We have established policies and procedures that accommodate various methods for servicers to communicate loan and certificate information to us. Our Master Policy requires our insureds, typically through their servicers, to regularly provide us with reports regarding the statuses of their insured loans, including information on both current and delinquent loans. Generally, servicers submit reports to us on a monthly basis. We are currently integrated with the two largest third-party mortgage servicing systems, Black Knight Financial Services and FiServ. We are also integrated directly with certain lender customers who manage their own servicing systems. These parties' servicing platforms are used by the majority of our larger servicing accounts to exchange billing, payment and certificate level information on a daily or monthly basis. We also have our own external facing servicing website that may be utilized by servicers to process their servicing transactions.
Defaults and Claims; Loss Mitigation
Defaults and Claims
The MI claim cycle begins with the receipt of a Notice of Default (NOD) for an insured loan from a loan servicer. Our Master Policy requires our insureds to notify us within 45 days if a borrower defaults on one of the first 12 loan payments and no later than 10 days after a borrower has defaulted on three payments after the first 12 months of a loan. A significant majority of our insureds notify us when a loan is two payments in default. We establish claim reserves when a borrower has failed to make two consecutive, regularly scheduled mortgage payments and is 60 days in default. The incidence of default is affected by a variety of factors, many of which are unforeseen, including a borrowers' loss of income, unemployment, divorce, illness or death. Defaults that are not cured result in a claim to us. A default may be cured by a borrower remitting all delinquent loan payments, achieving a
11
modification of loan terms, or refinancing the loan or selling the property and satisfying all amounts due under the loan. While macroeconomic factors in any given period may influence default experience to a greater extent than does seasonality, our industry has typically experienced a fourth quarter seasonal increase in the number of defaults and a first quarter seasonal decline in the number of defaults and increase in the number of cures.
Claims result from foreclosures following uncured defaults, losses on approved pre-foreclosure short sales (short sales) or borrowers surrendering their property deeds to their lenders in lieu of foreclosure (deeds-in-lieu). A range of factors impact the frequency and severity of claims, including the macroeconomic environment, local housing prices, loan and borrower level risk profiles, and the size and coverage level of a loan. If a default is not cured and we receive a claim, we refund any unearned premium collected between the date of default and the date of the claim payment.
Under the terms of our Master Policy, our insureds are generally required to file claims within 60 days of acquiring title to a property securing an insured loan (typically through foreclosure) or when there has been an approved short sale. In the years following the most recent financial crisis, foreclosure time-lines and the average time from initial default by a borrower to MI claim submission have extended due to legislation and GSE programs requiring mortgage servicers to mitigate losses by offering forbearance and loan modifications prior to pursuing foreclosure on delinquent loans.
Upon timely receipt of a covered claim we have the option to pay (i) the coverage percentage specified for a loan, with the insured retaining title to the underlying property and receiving all proceeds from an eventual sale of the property (the percentage option), (ii) the actual loss incurred by the insured upon sale of the property to a third party, if less than the percentage option, or (iii) 100% of the insured's claim amount (as defined in the Master Policy) in exchange for the insured's conveyance of good and marketable title to the property to us. If we elect to receive title to a property, we will market and sell the acquired property and retain all proceeds. We have opted to settle the significant majority of our claims paid to date through the percentage option.
Loss Mitigation
Before paying a claim, we review loan and servicing files to determine the appropriateness of the claim submission and claim amount and to ensure we only pay for expenses covered under our Master Policy. Our Master Policy provides that we can reduce or deny a claim if the servicer did not comply with its obligations required by our policy, including the requirement to pursue reasonable loss mitigation efforts. Such efforts may include pursuing foreclosure or bankruptcy relief in a timely and diligent manner. We deem a reduction in the claim amount to be a "curtailment." We may also receive claims submissions that include costs and expenses not covered by our Master Policy, such as mortgage insurance premiums, hazard insurance premiums for periods after the claim date and losses resulting from property damage that has not been repaired.
Under our Master Policy, insureds, typically through their servicers, must obtain prior approval from us before executing a deed-in-lieu of foreclosure, short sale or loan modification. Our right to pre-approve these transactions provides us the ability to mitigate actual or potential loss on an insured loan by ensuring that properties are being marketed and sold at reasonable values and that, in appropriate cases, borrowers are offered modified loan terms that are structured to help them sustain their mortgage payments. Proceeds from approved third-party sales occurring before we settle a claim are factored into the claim settlement and can often mitigate the claim amount for which we are responsible to pay. In connection with our approval rights for short sales or deed-in-lieu of foreclosure transactions, our Master Policy also provides us the right to obtain a contribution from borrowers with appropriate financial capacity, either in the form of cash or promissory notes, to cover a portion of our claim payments. We have entered into delegation agreements with the GSEs that provide them and their designated servicers the right to approve certain transactions on our behalf including pre-foreclosure sales, deeds-in-lieu of foreclosure and loan modifications for most GSE- owned loans that we insure.
12
Reinsurance
Internal Reinsurance
Prior to January 10, 2019, Ohio regulation limited the amount of risk a mortgage insurer was permitted to retain on a single loan to 25% of the borrower's indebtedness (after giving effect to third-party reinsurance) and, as a result, the portion of such insurance in excess of 25% was required to be reinsured. Ohio has repealed this requirement for future periods beginning January 10, 2019. Several other states previously imposed the same or similar coverage restrictions and repealed these measures prior to 2018. To comply with these previous state coverage limits, NMIC and Re One have reinsurance agreements in place under which Re One provides reinsurance to NMIC on insured loans with coverage levels in excess of 25%, after giving effect to third-party reinsurance.
Third-Party Reinsurance
We utilize third-party reinsurance to actively manage our risk, ensure compliance with the GSEs PMIERs and support the growth of our business. We currently have both excess-of-loss and quota share reinsurance agreements in place.
Excess-of-loss reinsurance
In May 2017, NMIC entered into a reinsurance agreement with Oaktown Re Ltd. (Oaktown Re), which provides for up to $211.3 million of aggregate excess-of-loss reinsurance coverage at inception for new defaults on an existing portfolio of our mortgage insurance policies written from 2013 through December 31, 2016. For the reinsurance coverage period, NMIC retains the first layer of $126.8 million of aggregate losses, and Oaktown Re then provides second layer coverage up to the outstanding reinsurance coverage amount. NMIC then retains losses in excess of the outstanding reinsurance coverage amount. The outstanding reinsurance coverage amount decreases from $211.3 million at inception over a ten-year period as the underlying covered mortgages are amortized or repaid, and/or the mortgage insurance coverage is canceled. The outstanding reinsurance coverage amount will stop amortizing if certain credit enhancement or delinquency thresholds are triggered.
Oaktown Re financed the coverage by issuing mortgage insurance-linked notes in an aggregate amount of $211.3 million to unaffiliated investors (the 2017 Notes). The 2017 Notes mature on April 26, 2027. All of the proceeds paid to Oaktown Re from the sale of the 2017 Notes were deposited into a reinsurance trust to collateralize and fund the obligations of Oaktown Re to NMIC under the reinsurance agreement. Funds in the reinsurance trust account are required to be invested in high credit quality money market funds at all times. We refer collectively to NMIC's reinsurance agreement with Oaktown Re and the issuance of the 2017 Notes by Oaktown Re as the 2017 ILN Transaction. Under the terms of the 2017 ILN Transaction, NMIC makes risk premium payments for the applicable outstanding reinsurance coverage amount and pays Oaktown Re for its anticipated operating expenses (up to a cap of $300 thousand per year).
Under the reinsurance agreement, NMIC holds an optional termination right if certain events occur, including, among others, a clean-up call if the outstanding reinsurance coverage amount amortizes to 10% or less of the reinsurance coverage amount at inception or if NMIC reasonably determines that changes to GSE or rating agency asset requirements would cause a material and adverse effect on the capital treatment afforded to NMIC under the agreement. In addition, there are certain events that will result in mandatory termination of the agreement, including NMIC's failure to pay premiums or consent to reductions in the trust account to make principal payments to noteholders, among others.
In July 2018, NMIC entered into a reinsurance agreement with Oaktown Re II Ltd. (Oaktown Re II), which provides for up to $264.5 million of aggregate excess-of-loss reinsurance coverage at inception for new defaults on an existing portfolio of mortgage insurance policies written between January 1, 2017 and May 31, 2018. For the reinsurance coverage period, NMIC retains the first layer of $125.3 million of aggregate losses, and Oaktown Re II then provides second layer coverage up to the outstanding reinsurance coverage amount. NMIC then retains losses in excess of the outstanding reinsurance coverage amount. The outstanding reinsurance coverage amount decreases from $264.5 million at inception over a ten-year period as the underlying covered mortgages are amortized or repaid, and/or the mortgage insurance coverage is canceled. The outstanding reinsurance coverage amount will begin amortizing after an initial period in which a target level of credit enhancement is obtained and will stop amortizing if certain credit enhancement or delinquency thresholds are triggered.
Oaktown Re II financed the coverage by issuing mortgage insurance-linked notes in an aggregate amount of
$264.5 million
to unaffiliated investors (the 2018 Notes). The 2018 Notes mature on July 25, 2028. All of the proceeds paid to Oaktown Re II from the sale of the 2018 Notes were deposited into a reinsurance trust to collateralize and fund the obligations of Oaktown Re II to NMIC under the reinsurance agreement. Funds in the reinsurance trust account are required to be invested in high credit quality money market funds at all times. We refer collectively to NMIC's reinsurance agreement with Oaktown Re II and the issuance of the 2018 Notes by Oaktown Re II as the 2018 ILN Transaction, and the 2017 ILN Transaction and 2018 ILN Transaction as the ILN Transactions.
13
Under the terms of the 2018 ILN Transaction, NMIC makes risk premium payments for the applicable outstanding reinsurance coverage amount and pays Oaktown Re II for anticipated operating expenses (up to a cap of
$250 thousand
per year).
Under the reinsurance agreement, NMIC holds an optional termination right if certain events occur, including, among others, a clean-up call if the outstanding reinsurance coverage amount amortizes to
10%
or less of the reinsurance coverage amount at inception or if NMIC reasonably determines that changes to GSE or rating agency asset requirements would cause a material and adverse effect on the capital treatment afforded to NMIC under the agreement. In addition, there are certain events that will result in mandatory termination of the agreement, including NMIC's failure to pay premiums or consent to reductions in the trust account to make principal payments to noteholders, among others.
Under the terms of the 2018 ILN Transaction, we are required to maintain a certain level of restricted funds in a premium deposit account with Bank of New York Mellon until the 2018 Notes have been redeemed in full. We are not required to deposit additional funds into the premium deposit account, and the restricted balance will decrease over time as the principal balance of the 2018 Notes declines.
Quota share reinsurance
Under a quota share reinsurance agreement, the ceding insurer pays a premium in exchange for coverage on an agreed-upon portion of incurred losses. Quota share arrangements reduce net premiums written and earned and also reduce net RIF, providing capital relief to the ceding insurer and reducing incurred claims in accordance with the terms of the reinsurance agreement. In addition, reinsurers typically pay ceding commissions as part of quota share transactions, which offset the ceding company's acquisition and underwriting expenses. Certain quota share agreements include profit commissions that are earned based on loss performance and serve to reduce ceded premiums.
Effective September 1, 2016, NMIC entered into the 2016 QSR Transaction with a panel of third-party reinsurers. Each of the third-party reinsurers has an insurer financial strength rating of A- or better by Standard and Poor's Rating Services (S&P), AM Best or both. Under the 2016 QSR Transaction, NMIC ceded premiums written related to (1) 100% of the risk under our pool agreement with Fannie Mae, (2) 25% of existing risk written on eligible policies as of August 31, 2016, and (3) 25% of risk on eligible primary insurance policies written between September 1, 2016 and December 31, 2017, in exchange for reimbursement of ceded claims and claims expenses on covered policies, a 20% ceding commission, and a profit commission of up to 60% that varies directly and inversely with ceded claims. The 2016 QSR Transaction is scheduled to terminate on December 31, 2027, except with respect to ceded pool risk, which is scheduled to terminate on August 31, 2023. NMIC has the option, based on certain conditions and subject to a termination fee, to terminate the agreement at December 31, 2020, or at the end of any calendar quarter thereafter, which would result in NMIC reassuming the reinsured risk.
Effective January 1, 2018, NMIC entered into a second quota share reinsurance treaty with a panel of third-party reinsurers (2018 QSR Transaction, together with the 2016 QSR Transaction, the QSR Transactions). Each of the third-party reinsurers has an insurer financial strength rating of A- or better by S&P, AM Best or both. Under the 2018 QSR Transaction, NMIC cedes premiums earned related to 25% of risk on eligible policies written in 2018 and 20% of risk on eligible policies written in 2019, in exchange for reimbursement of ceded claims and claims expenses on covered policies, a 20% ceding commission, and a profit commission of up to 61% that varies directly and inversely with ceded claims. The 2018 QSR Transaction is scheduled to terminate on December 31, 2029. NMIC has the option, based on certain conditions and subject to a termination fee, to terminate the agreement at December 31, 2022, or at the end of any calendar quarter thereafter, which would result in NMIC reassuming the reinsured risk.
NMIC may terminate either or both of the QSR Transactions if, due to a change in PMIERs requirements, it is no longer able to take full PMIERs asset credit for the RIF ceded under the respective agreements. NMIC has additional termination rights under the QSR Transactions, whereby it may elect to selectively terminate its engagement with individual reinsurers under the agreements on a run-off basis (
i.e.
, reinsurers continue providing coverage on all risk ceded prior to the termination date, with no new cessions going forward) or cut-off basis (
i.e.
, the reinsurance arrangement is completely terminated with NMIC recapturing all previously ceded risk) under certain circumstances. Such selective termination rights arise when, among other reasons, a reinsurer experiences a deterioration in its capital position below a prescribed threshold and/or a reinsurer breaches (and fails to cure) its collateral posting obligations under the relevant agreement.
For further discussion of the effect of reinsurance on our business, see Item 7, "
Management's Discussion and Analysis of Financial Condition and Results of Operations - Conditions and Trends Impacting our Business - Net Premiums Written and Net Premiums Earned - Effect of reinsurance on our results.
"
14
Enterprise Risk Management
We have established enterprise wide policies, procedures and processes to allow us to identify, assess, monitor and manage credit market and operational risks in our business, as well as other risks discussed below in Item 1A, "
Risk Factors
." Management of these risks is an interdepartmental endeavor including specific operational responsibilities and ongoing senior management and compliance personnel oversight. The Risk Committee of our Board of Directors (Board) has responsibility for oversight and review of our enterprise risk management approach and is supported by a management risk committee comprised of senior members of our management team. Our internal audit function, which reports to the Audit Committee of our Board, provides independent ongoing assessments of our management of certain enterprise risks and reports its findings to our Board's Risk Committee. Our internal audit function also periodically engages external resources to assist in the assessment of enterprise risks and our related control and monitoring processes.
Credit Market Risk
We have implemented a complementary range of strategies to actively monitor and manage the credit performance of our insured portfolio, including:
|
•
|
establishing prudential underwriting standards and loan-level eligibility matrices which describe the maximum LTV, minimum borrower credit score, maximum borrower DTI ratio, maximum loan size, property type and occupancy status of loans that we will insure, and memorializing these standards and eligibility matrices in our Underwriting Guideline Manual;
|
|
•
|
conducting diligence of our lender customers before and after we formally engage with them to ensure they have appropriate financial resources, operational capabilities, management experience and a track record of strong origination quality, and subjecting them to well-defined parameters regarding underwriting delegation status, credit guideline requirements and, on a more limited basis, variances;
|
|
•
|
implementing a quality control process to ensure ongoing adherence with our underwriting guidelines and eligibility criteria, under which our quality control group performs audits of insured loans identified on a random, high risk and targeted basis to measure the quality of the underwriting decision and loan closing process, and specifically assess the accuracy and adequacy of the information and documentation used to underwrite our MI;
|
|
•
|
setting concentration limits to regulate the aggregation of loan-level risks in our overall portfolio and manage our overall portfolio exposure to certain risk classes that typically experience greater volatility and loss during periods of economic and housing market downturns, such as higher LTV loans, loans with higher borrower DTIs, investor loans, cash-out refinances, certain state concentration levels and several other borrower or loan attributes;
|
|
•
|
individually underwriting the significant majority of the loans we insure through our non-delegated platform and DAR validation process, in order to evaluate borrower and loan-level risk characteristics on an individual policy level, and monitor and assess the manufacturing capabilities of our lender customers in order to provide them feedback to help enhance their own production and control processes;
|
|
•
|
deploying Rate GPS, our proprietary risk-based pricing platform, to dynamically consider a granular set of risk attributes in our policy pricing process and assign individualized premium rates based on the relative risk and anticipated performance of each loan we insure;
|
|
•
|
further utilizing Rate GPS to actively manage the flow of business into our portfolio and target loans with higher quality risk characteristics that typically experience lower volatility and loss across market cycles; and
|
|
•
|
securing reinsurance coverage under quota share and excess-of-loss transactions that are structured to absorb losses in periods of economic and/or housing market stress and, in doing so, mitigate the impact of credit volatility on our financial results.
|
We view our comprehensive approach to credit risk management as a core competency and believe that it provides us with the ability to actively manage the aggregation of borrower default risk in our insured loan portfolio and mitigate the impact of such exposure under a range of macroeconomic scenarios.
Operational Risk
Operational risks are inherent in our daily business activities, and include, among others, the risk of damage to physical assets, reliance on outside vendors, continued access to qualified underwriting resources, cyber security threats, including breaches of our
15
system or other compromises resulting in unauthorized access to confidential, private and proprietary information, reliance on a complex IT system and employee fraud or negligence. We seek to manage our operational exposures through a variety of standard risk management practices and procedures, such as purchasing hazard insurance coverage, maintaining oversight of third-party vendors, establishing IT system redundancy and security and disaster recovery practices, maintaining internal controls and ensuring appropriate segregation of duties.
Information Technology Systems and Intellectual Property
We rely on information technology to directly engage with our lender customers, receive MI applications and supporting documentation, stream-line our underwriting and validation processes, deliver binding policy certificates, and facilitate post-close MI policy servicing. Our customers and regulators require us to provide and service our products in a secure manner, either electronically via our internet website or through direct electronic data transmissions.
We have invested in our infrastructure and technology through the design, development, integration and implementation of what we believe is an efficient, secure, scalable platform that supports our current business activities and provides capacity for significant future growth. We underwrite and service our MI portfolio within this proprietary insurance management platform, which we refer to as AXIS.
Since the initial development of AXIS, we have continued to upgrade and enhance our systems and technical capabilities, including:
|
•
|
deploying technology that enables our customers to transact business faster and easier, whether via a secure internet connection or through a secure system-to-system interface;
|
|
•
|
integrating our platform with third-party technology providers used by our customers in their loan origination process and to price and order our MI and in their servicing processes for servicing and maintaining their MI policies;
|
|
•
|
implementing advanced document and business process management software that focuses on improving our underwriting productivity and that may also be used to improve our quality assurance and loss management functions;
|
|
•
|
launching our award-winning mobile applications, which enable customers to view and access information through mobile devices, including our premium rate calculators, guideline updates and other resources and information notices; and
|
|
•
|
designing, developing and deploying Rate GPS, our risk-based pricing platform, which allows us to dynamically consider a granular set of risk attributes in our policy pricing process and assign individualized rates based on the relative risk and anticipated performance of each loan we insure.
|
We aim to utilize and develop technology that enhances our current operating capabilities and supports future growth, while allowing us to realize current efficiencies. We engage contractors to assist with the development and maintenance of certain areas of our IT architecture as a means to manage our technology costs and selectively draw in relevant expertise for particular projects.
Investment Portfolio
Our primary objectives with respect to our investment portfolio are to preserve capital and generate investment income, while maintaining sufficient liquidity to cover our operating needs. We aim to achieve diversification as to type, quality, maturity, industry and issuer. At December 31, 2018, our investment portfolio was comprised of fixed income securities including: U.S. Treasury securities and obligations of U.S. government agencies, municipal debt securities, corporate debt securities, and asset-backed securities. We also held other short-term investments (such as commercial paper).
We have adopted an investment policy that defines, among other things, eligible and ineligible investments, concentration limits for asset types, industry sectors, single issuers, and certain credit ratings, and benchmarks for asset duration. Our investments are rated by one or more nationally recognized statistical rating organizations. We review our investment policies and strategies on a consistent basis, and they are subject to change depending upon regulatory, economic and market conditions and our existing or anticipated financial condition and operating requirements, including our tax position.
We engage a third-party investment manager, Wells Capital Management, Inc., to assist with day-to-day management of our portfolio and implementation of our investment policy.
Employees
As of December 31, 2018, we had 304 full-time employees. None of our employees are party to a collective bargaining
16
agreement. We utilize a third-party professional employer organization to manage our payroll administration and related compliance requirements.
Available Information
Our principal office is located at 2100 Powell Street, 12th floor, Emeryville, CA 94608. Our main telephone number is (855) 530 - NMIC (6642), and our website address is www.nationalmi.com. Copies of our Annual Reports on Form 10-K, Quarterly Reports on Form 10-Q, Current Reports on Form 8-K and any amendments to those reports are available free of charge through our website as soon as reasonably practicable after they are electronically filed with, or furnished to, the Securities and Exchange Commission (SEC). In addition, a written copy of the Company's Business Conduct Policy, containing our code of ethics that is applicable to all of our directors, officers and employees, is available on our website. Information contained or referenced on our website is not incorporated by reference into, and does not form a part of, this report.
17
U.S. MORTGAGE INSURANCE REGULATION
As discussed below, private mortgage insurers operating in the U.S. are subject to comprehensive state and federal regulation and to significant oversight by the GSEs, the primary beneficiaries of our insurance coverage. NMIC and Re One are principally regulated by our domiciliary and primary regulator, the Wisconsin OCI and by state insurance departments in each state in which these companies are licensed. We are also significantly impacted and, in some cases, directly regulated by federal laws and regulations affecting the housing finance system.
We believe that a strong, viable private MI market is a critical component of the U.S. housing finance system. We routinely meet with regulatory agencies, including our state insurance regulators and the Federal Housing Finance Agency (FHFA), the GSEs, our customers and other industry participants to promote the role and value of private mortgage insurance and exchange views on the U.S. housing finance system. We believe we have an open dialogue with the Wisconsin OCI and often share our views on current matters regarding the MI industry. We actively participate in industry discussions regarding potential changes to the laws impacting private mortgage insurers and the regulatory environment. We intend to continue to promote legislative and regulatory policies that support a viable and competitive private MI industry and a well-functioning U.S. housing finance system. We are a member of U.S. Mortgage Insurers (USMI
®
), an organization formed to promote the use of private MI as a credit risk mitigant in the U.S. residential mortgage market.
GSE Oversight
The GSEs are the principal purchasers of mortgages insured by private mortgage insurers. As a result, the nature of the private MI industry in the U.S. is driven in large part by the requirements and practices of the GSEs, which include:
|
•
|
the PMIERs, including operational, business and remedial requirements and minimum capital levels applicable to GSE-qualified MI providers;
|
|
•
|
the terms that the GSEs require to be included in MI policies for loans that they purchase, including terms governing rescission relief;
|
|
•
|
the underwriting standards and loan amount limits that determine what loans are eligible for purchase by the GSEs, which affects the quality of the risk insured by the mortgage insurer and the availability of mortgage loans;
|
|
•
|
the level of MI coverage, subject to the requirements of the GSEs' charters, when MI is used as the required credit enhancement on high-LTV mortgages;
|
|
•
|
the circumstances in which MI coverage can be canceled before reaching the cancellation thresholds established by law, including under the HOPA;
|
|
•
|
the amount of loan level delivery fees (which result in higher costs to borrowers) that the GSEs assess on loans that require private MI, which impacts private MI providers' ability to compete with government MIs and other forms of credit enhancement used by the GSEs in lieu of private MI;
|
|
•
|
the terms on which the GSEs offer lenders relief on their representations and warranties made to a GSE at the time of sale of a loan to a GSE, which creates pressure on private mortgage insurers to alter their rescission rights to conform to the GSE relief;
|
|
•
|
loss mitigation programs established by the GSEs that impact insured mortgages and the circumstances under which servicers must implement such programs; and
|
|
•
|
the availability and scope of different loan purchase programs, including first time home buyer and affordable lending initiatives, from the GSEs that allow different levels of MI coverage.
|
In January 2013, the GSEs approved NMIC as a qualified mortgage insurer (as defined in the PMIERs, an
approved insurer
). (
Italicized
terms have the same meaning that such terms have in the PMIERs.) As an
approved insurer
, NMIC is subject to ongoing compliance with the PMIERs. The PMIERs establish operational, business, remedial and financial requirements applicable to
approved insurers
. The GSEs have significant discretion under the PMIERs as well as a broad range of consent rights and notice requirements with respect to various actions of an
approved insurer.
The PMIERs financial requirements prescribe a risk-based methodology whereby the amount of assets required to be held against each insured loan is determined based on certain risk characteristics, such as FICO, vintage (year of origination), performing vs. non-performing (
i.e.
, current vs. delinquent), LTV and other risk features. An asset charge is calculated for each insured loan based on its risk profile. In general, higher quality loans carry lower charges.
Under the PMIERs,
approved insurers
must maintain
available assets
that equal or exceed
minimum required assets
, which
18
is an amount equal to the greater of (i)
$400 million
or (ii) a total
risk-based required asset amount
. The
risk-based required asset amount
is a function of the risk profile of an
approved insurer's
RIF, assessed on a loan-by-loan basis and considered against certain risk-based factors derived from tables set out in the PMIERs to gross
RIF,
which is then adjusted on an aggregate basis for reinsurance transactions approved by the GSEs, such as with respect to our ILN Transactions and QSR Transactions. The
risk-based required asset amount
for performing, primary insurance is subject to a floor of
5.6%
of
performing primary adjusted RIF
, and the
risk-based required asset amount
for pool insurance considers both factors in the PMIERs tables and the
net remaining stop loss
for each pool insurance policy.
By April 15th of each year, NMIC must certify it met all PMIERs requirements as of December 31st of the prior year. We certified to the GSEs by April 15, 2018 that NMIC was in full compliance with the PMIERs as of December 31, 2017. NMIC also has an ongoing obligation to immediately notify the GSEs in writing upon discovery of a failure to meet one or more of the PMIERs requirements. We continuously monitor NMIC's compliance with the PMIERs.
On September 27, 2018, the GSEs published revised PMIERs that will take effect and become applicable to NMIC on March 31, 2019 (the Revised PMIERs). The rules governing
minimum required assets
and calculation of
available assets
and the
risk-based required asset amount
will remain largely the same under the Revised PMIERs, with a few differences in the elements that may (
e.g.
, certain premiums receivable) and may not (
e.g.
, funds withheld for the benefit of a
reinsurer
) be included in the calculation of
available assets
. The Revised PMIERs also introduce a comprehensive reinsurance counter-party grading framework, which includes a modest haircut (based on the credit rating of the
reinsurer
) to the capital credit available to an
approved insurer
for any un-collateralized reinsurance coverage. We expect that NMIC will remain in full compliance with the Revised PMIERs, as applicable, prior to and after March 31, 2019.
State Mortgage Insurance Regulation
Certificates of Authority
NMIC holds a certificate of authority, or insurance license, in all 50 states and D.C. As a licensed insurer in these jurisdictions, NMIC is subject to ongoing financial reporting and disclosure requirements relating to its business, operations, management or affiliate arrangements.
State Insurance Laws
Our insurance subsidiaries are subject to comprehensive regulation by state insurance departments. As mandated by certain state insurance laws, private MI companies are restricted to writing only MI business. We understand that the primary purpose underlying this restriction, which is referred to in the industry as a "monoline" requirement, is to make it easier for regulators to assess the overall risk in a mortgage insurer's insurance portfolio, to determine its capital adequacy under varying economic scenarios and to prevent the depletion of capital due to the diversion of financial resources in support of non-MI lines of business. State insurance laws and regulations are principally designed for the protection of insured policyholders rather than for the benefit of investors. Although their scope varies, state insurance laws generally grant broad supervisory powers to insurance regulatory officials to examine insurance companies and interpret and/or enforce rules or exercise discretion affecting almost every significant aspect of the insurance business.
In general, state insurance regulation of our business relates to:
|
•
|
licenses to transact business;
|
|
•
|
policy forms;
|
|
•
|
premium rates;
|
|
•
|
insurable loans;
|
|
•
|
annual and quarterly financial reports prepared in accordance with statutory accounting principles;
|
|
•
|
determination of loss, unearned premium and contingency reserves;
|
|
•
|
minimum capital levels and adequacy ratios;
|
|
•
|
affiliate transactions;
|
|
•
|
reinsurance requirements;
|
|
•
|
limitations on the types of investment instruments which may be held in an investment portfolio;
|
|
•
|
the size of risks and limits on coverage of individual risks which may be insured;
|
19
|
•
|
special deposits of securities;
|
|
•
|
stockholder dividends;
|
|
•
|
insurance policy sales practices; and
|
|
•
|
claims handling.
|
As the ultimate controlling parent of an insurance holding company system, NMIH is registered with the Wisconsin OCI, which is NMIC and Re One's primary regulator, and must provide certain information to the Wisconsin OCI on an ongoing basis, including insurance holding company annual audited consolidated financial statements. We, as an insurance holding company, and each of our affiliates, are prohibited from engaging in certain transactions with our insurance subsidiaries without disclosure to, and in some instances, prior approval by the Wisconsin OCI. Like all other states, Wisconsin regulates transactions between domestic insurance companies and their controlling stockholders or affiliates. Under Wisconsin law, all transactions involving us, or an affiliate, and an insurance subsidiary, must conform to certain standards including that the transaction be "reasonable and fair" to the insurance subsidiary. Wisconsin law also provides that disclosure of certain transactions must be filed with the Wisconsin OCI at least 30 days before the transaction is entered into and that these transactions may be disapproved by the Wisconsin OCI within that period.
Under Wisconsin law, domestic insurers, such as NMIC, are required to submit and obtain prior Wisconsin OCI approval on all reinsurance agreements with non-affiliate reinsurers. In addition, Wisconsin OCI requires that reinsurance agreements with non-authorized and non-accredited reinsurers be collateralized through letters of credit and/or trust accounts in order for a domestic insurer to take credit for reinsurance on its statutory balance sheet.
Wisconsin's insurance regulations generally provide that no person may merge with or acquire control (which is defined as possession, directly or indirectly, of the power to direct or cause the direction of the management and policies of a person, whether through the ownership of voting securities, by contract, by common management or otherwise) of us or our insurance subsidiaries unless the merger or transaction in which control is acquired has been approved by the Wisconsin OCI. Wisconsin law provides for a rebuttable presumption of control when a person owns or has the right to vote, directly or indirectly, more than 10% of the voting securities of a company. Pursuant to applicable Wisconsin regulations, voting securities include securities convertible into or evidencing the right to acquire securities with the right to vote. For purposes of determining whether control exists, the Wisconsin OCI may aggregate the direct or indirect ownership of us by entities under common control with one another. Notwithstanding the presumption of control, any person or persons acting in concert or whose shares may be aggregated for purposes of determining control, may file a disclaimer of affiliation with the Wisconsin OCI if such person or persons do not intend to control or direct or influence the management of a domestic insurer. Such disclaimer will become effective unless it is expressly "disapproved" by the OCI within 30 days. In addition, the insurance regulations of certain states require prior notification to the state's insurance department before a person acquires control of an insurance company licensed in such state. An insurance company's licenses to conduct business in those states could be affected by any such change in control. As of the date of this report, we are aware of one NMIH stockholder that owns more than 10% of our shares of common stock. We understand that this stockholder has filed a disclaimer of control with the Wisconsin OCI in connection therewith, which has not been disapproved.
Our insurance subsidiaries are subject to Wisconsin statutory requirements as to maintenance of minimum policyholders' surplus and payment of dividends or distributions to stockholders. Under Wisconsin law, our insurance subsidiaries may pay "ordinary" stockholder dividends with 30 days' prior notice to the Wisconsin OCI. Ordinary dividends are defined as payments or distributions to stockholders in any 12-month period that do not exceed the lesser of (i) 10% of statutory policyholders' surplus as of the preceding calendar year end or (ii) adjusted statutory net income. Adjusted statutory net income is defined for this purpose to be the greater of the following:
|
a.
|
The net income of the insurer for the calendar year preceding the date of the dividend or distribution, minus realized capital gains for that calendar year; or
|
|
b.
|
The aggregate of the net income of the insurer for the 3 calendar years preceding the date of the dividend or distribution, minus realized capital gains for those calendar years and minus dividends paid or credited and distributions made within the first 2 of the preceding 3 calendar years.
|
The Wisconsin OCI may prohibit the payment of ordinary dividends or other payments by our insurance subsidiaries to us if they determine that such payments could be adverse to policyholders. In addition, our insurance subsidiaries may make or pay "extraordinary" stockholder dividends (
i.e.
, amounts in excess of ordinary dividends) only with the prior approval of the Wisconsin OCI.
In addition to Wisconsin, other states may limit or restrict our insurance subsidiaries' ability to pay stockholder dividends. For example, California and New York prohibit mortgage insurers licensed in such states from declaring dividends except from undivided profits remaining above the aggregate of their paid-in capital, paid-in surplus and contingency reserves. In addition,
20
Florida requires mortgage insurers to hold capital and surplus not less than the lesser of (i) 10% of its total liabilities, or (ii) $100 million. It is possible that Wisconsin will adopt revised statutory provisions or interpretations of existing statutory provisions that will be more or less restrictive than those described above or will otherwise take actions that may further restrict the ability of our insurance subsidiaries to pay dividends or make distributions or returns of capital.
Mortgage insurers licensed in Wisconsin are required to establish a contingency loss reserve for purposes of statutory accounting, with annual contributions equal to the greater of (i) 50% of net earned premiums for such year or (ii) the minimum policyholders' position (as described below) relating to NIW in the period, divided by 7. These additions to contingency reserves cannot be withdrawn for a period of 10 years, except as permitted by insurance regulations. With prior approval from the Wisconsin OCI, an MI company may make early withdrawals from the contingency reserve when incurred losses for a calendar quarter exceed the greater of either (i) 35% of net premiums earned in a calendar year or (ii) 70% of the annual amount contributed to the contingency loss reserve.
Under applicable Wisconsin law and the laws of 15 other states, a mortgage insurer must maintain a minimum amount of statutory capital relative to its RIF in order for the mortgage insurer to continue to write new business. These are typically referred to as "risk-to-capital requirements." While formulations of minimum capital may vary in certain jurisdictions, the most common measure applied allows for a maximum permitted risk-to-capital (RTC) ratio of 25:1. Wisconsin has formula-based limits that generally result in RTC limits slightly higher than the 25:1 ratio.
We compute RTC ratios for each of our insurance subsidiaries, as well as for our combined insurance operations. The RTC ratio is our net RIF divided by our statutory capital. Our net RIF includes both direct and assumed primary and pool RIF, less risk ceded and excluding risk on policies that are currently in default and for which loss reserves have been established. Wisconsin requires a mortgage insurer to maintain a "minimum policyholders' position" as calculated in accordance with the applicable regulations. Policyholders' position, which is also known as statutory capital, is generally the sum of statutory policyholders' surplus (which increases as a result of statutory net income and capital contributions, and decreases as a result of statutory net loss and capital distributions), plus the statutory contingency reserve. Under statutory accounting rules, the contingency reserve is reported as a liability on the statutory balance sheet; however, for purposes of statutory capital and RTC ratio calculations, it is included in capital.
State insurance regulators also have the authority to make changes to capital requirements. The National Association of Insurance Commissioners (NAIC) has formed a working group to develop and recommend more robust regulations governing mortgage insurance, including, among other things, strengthened capital requirements, underwriting standards, claims practices and market conduct regulation. We, along with other mortgage insurers, are working with the Mortgage Guaranty Insurance Working Group of the Financial Condition (E) Committee of the NAIC (the Working Group). The Working Group will determine and make a recommendation to the Financial Condition (E) Committee of the NAIC as to what changes the Working Group believes are necessary to the solvency and market practices regulation of mortgage insurers, including changes to the Mortgage Guaranty Insurers Model Act (Model #630). The Working Group has proposed a draft revised Model Act that contains risk-based capital requirements, which we and the MI industry are evaluating. We have provided feedback to the Working Group since early 2013, including comments on the risk-based capital approach.
Most states, including Wisconsin, have enacted anti-inducement and anti-rebate laws applicable to mortgage insurers, which prohibit mortgage insurers from inducing lenders to enter into insurance contracts by offering benefits not specified in the policy, including rebates of insurance premiums. For example, Wisconsin prohibits mortgage insurers from allowing any commission, fee, remuneration, or other compensation to be paid to, or received by, any insured lender, including any subsidiary or affiliate, officer, director, or employee of any insured, any member of their immediate family, any corporation, partnership, trust, trade association in which any insured is a member, or other entity in which any insured or any such officer, director, or employee or any member of their immediate family has a material financial interest.
MI premium rates are subject to prior approval in certain states, which requirement is designed to protect policyholders against rates that are excessive, inadequate or unfairly discriminatory. In these states, any change in premium rates must be justified, generally on the basis of the insurer's loss experience, expenses and future trend analysis. Trends in mortgage default rates are also considered.
State insurance receivership law, not federal bankruptcy law, would govern any insolvency or financially hazardous condition of our insurance subsidiaries. The Wisconsin OCI has substantial authority to issue orders or seek to control a state insurance receivership proceeding to address the insolvency or financially hazardous condition of an insurance company that it regulates. Under Wisconsin law, the Wisconsin OCI has substantial flexibility to restructure an insurance company in a receivership proceeding. The Wisconsin OCI is obligated to maximize the value of an insolvent insurer's estate for the benefit of its policyholders. In all insurance receiverships under state insurance law, policyholder claims are prioritized relative to the claims of stockholders.
21
Other U.S. Regulation
Federal laws and regulations applicable to participants in the housing finance industry, including mortgage originators and servicers, purchasers of mortgage loans, such as the GSEs, and the government MIs directly and indirectly impact private mortgage insurers. Changes in federal housing legislation may have significant effects on the demand for private MI and, therefore, may materially affect our business.
We are also impacted by federal regulation of residential mortgage transactions. Mortgage origination and servicing transactions are subject to compliance with various federal and state consumer protection laws, including the Real Estate Settlement Procedures Act of 1974 (RESPA), the Truth in Lending Act (TILA), the Equal Credit Opportunity Act (ECOA), the Fair Housing Act, the HOPA, the Fair Credit Reporting Act of 1970 (FCRA), the Fair Debt Collection Practices Act, the Gramm-Leach-Bliley Act of 1999 (GLBA) and others. Among other things, these laws and their implementing regulations prohibit payments for referrals of real estate settlement service business, require fairness and non-discrimination in granting or facilitating the granting of credit and insurance, govern the circumstances under which companies may obtain and use consumer credit information, establish standards for cancellation of BPMI, define the manner in which companies may pursue collection activities, require disclosures of the cost of credit and provide for other consumer protections.
Housing Finance Reform
The federal government currently plays a dominant role in the U.S. housing finance system through the GSEs and government MIs (
i.e.
, the FHA, USDA and VA) and Ginnie Mae. There is broad policy consensus toward the need for private capital to play a larger role and government credit risk to be reduced. However, to date there has been a lack of consensus with regard to the specific changes necessary to return to a larger role for private capital and what size the government's role should be. On September 6, 2008, the FHFA used its authority to place the GSEs into conservatorship. As the GSEs' conservator, the FHFA has the authority to control and direct the GSEs' operations, and the FHFA's policy objectives can result in changes to the GSEs' requirements and practices. With the GSEs in a prolonged conservatorship, there has been ongoing debate over the future role and purpose of the GSEs in the U.S. housing market. Since 2011, there have been numerous legislative proposals intended to incrementally scale back or eliminate the GSEs (such as a statutory mandate for the GSEs to transfer mortgage credit risk to the private sector) or to completely reform the housing finance system. Congress, however, has not enacted any legislation to date. There has recently been increased focus on the possibility of administrative reform that the White House and Treasury Department may pursue independent of any legislative action; however, no former proposal for administrative reform has been introduced at this time. Passage and timing of comprehensive GSE reform or incremental change (whether legislative or administrative in nature) is uncertain, making the actual impact on us and our industry difficult to predict. Any such changes that come to pass could have a significant impact on our business. Additionally, the term of the former Director of the FHFA expired in January 2019, and the agency is currently led by a new acting Director, pending confirmation of a new permanent Director, both of whom may exercise their oversight authority over the GSEs differently than the previous Director and/or have different objectives with regard to the GSEs' operations. Any such changes in how the FHFA engages with and influences the GSEs could have a significant impact on our business.
FHA Reform
We compete with the single-family MI programs of the FHA, which is part of the U.S. Department of Housing and Urban Development (HUD). During the financial crisis, the FHA captured an increasing share of the high-LTV MI market as incumbent private MIs came under significant financial stress. Previous FHA rate actions and product introductions continue to impact its market share, and by extension, the private MI market.
The FHA's role in the mortgage insurance industry is significantly dependent upon regulatory developments. Since 2012, there have been several legislative proposals intended to reform the FHA; however, no legislation has been enacted to date. The prospect for future unilateral FHA action on premium rates or the passage of FHA reform legislation in either the House or Senate, and how differences in proposed reforms between the House and Senate might be resolved in any final legislation, remain uncertain.
The Dodd-Frank Act
The Dodd-Frank Wall Street Reform and Consumer Protection Act of 2010 (Dodd-Frank Act) amended certain provisions of TILA, RESPA and other statutes that have had a significant impact on our business and the residential mortgage market. The Dodd-Frank Act created the Consumer Financial Protection Bureau (CFPB), a federal agency with responsibility for regulating and enforcing the offering and provision of consumer financial products and services under the federal consumer financial laws. Actions taken or rules implemented by the CFPB have the potential to impact the overall housing finance market, and by extension the private MI industry and our business. Leadership at the CFPB has recently changed, and it is difficult to predict whether or how the CFPB might seek to implement these laws in the future.
22
Ability-to-Repay Rule
In January 2014, the CFPB implemented the Dodd-Frank Act Ability to Repay (ATR) mortgage provisions, which govern the obligation of lenders to determine a borrower's ability to pay when originating a mortgage loan covered by the rule. A subset of mortgages within the ATR rule are known as "qualified mortgages" (QMs), which generally are defined as loans without certain risky features, such as negative amortization, points and fees in excess of 3% of the loan amount, borrowers with DTI ratios in excess of43% and terms exceeding 30 years. QMs under the rule benefit from a statutory presumption of compliance with the ATR rule, thus potentially mitigating the risk of the liability of the creditor and assignees of the loan under TILA. The rule also provides a temporary category of QMs that have more flexible underwriting requirements so long as they satisfy the general product feature requirements of QMs (other than borrower DTI) and so long as they meet the underwriting requirements of the GSEs (the QM Patch). The QM patch is scheduled to phase out upon the earlier to occur of the end of conservatorship or receivership of the GSEs or January 10, 2021. The expiration of the QM Patch or any action by Congress or the CFPB to modify it could affect the residential mortgage market and demand for private mortgage insurance.
The Dodd-Frank Act also gave statutory authority to HUD, the VA, and the USDA to develop their own definitions of "QM," which they have completed. To the extent lenders find that these agencies' definitions of QM are more favorable to certain segments of their borrowers, they may choose government MI products over private MI products.
We, along with other industry participants, have observed that the significant majority of covered loans made after the effective date of the CFPB's ATR rule have been QMs. We expect that most lenders will continue to be reluctant to make loans that do not qualify as QMs (either under the rules' specific underwriting guidelines, GSE underwriting guidelines or the HUD definition of a QM) because absent full compliance with the ATR rule, such loans will not be entitled to a "safe-harbor" presumption of compliance with the ability-to-pay requirements.
The ATR rule may continue to impact the mortgage insurance industry in other ways, including because the ATR rule has given rise to a subset of borrowers who cannot meet the regulatory QM standards, thus restricting their access to mortgage credit and reducing the size of the mortgage market. While Congress is considering certain reforms that may address this restrictiveness, there is no certainty about whether legislation will be enacted or be successful in increasing access to mortgage loans for affected borrowers. Additionally, the CFPB recently completed its statutorily mandated assessment of the ATR rule's impact and effectiveness in meeting its objectives. It is also unclear what, if any, changes the CFPB may implement to address the findings of this assessment.
Basel III
The Basel Capital Accord, as updated, sets out international benchmarks for assessing banks' capital adequacy requirements, which, among other factors, governs the capital treatment of MI purchased and held on balance sheet by domestic and international banks in respect of their residential mortgage loan origination and securitization activities. In July 2013, U.S. banking regulators promulgated regulations to implement significant elements of the Basel framework, which we refer to as Basel III. The effective date for the U.S. Basel III regulations was January 1, 2014, although the majority of its provisions are subject to multi-year phase-in periods to achieve full implementation.
Under the "Standardized Approach" in the U.S. Basel III capital rules, loans secured by one-to-four-family residential properties (residential mortgage exposures) receive a 50% or 100% risk weight. Generally, first lien residential mortgage exposures that are prudently underwritten, including with respect to regulatory standards for LTV limits, and that are performing according to their original terms receive a 50% risk weight, while all other residential mortgage exposures are assigned a 100% risk weight. The banking regulators clarified in a set of frequently asked questions issued in March 2015 that LTV ratios can account for private MI in determining whether a loan is made in accordance with prudent underwriting standards for purposes of receiving a 50% risk weight. A mortgage exposure guaranteed by the federal government through the FHA or VA will have a risk weight of 20%.
In December 2014, the Basel Committee on Banking Supervision (Basel Committee) issued a proposal for further revisions to Basel III's Standardized Approach for credit risk. The proposal sets forth proposed adjustments to the risk weights for residential mortgage exposures that take into account LTV and the borrower's ability to service a mortgage as a proxy for a debt service coverage ratio. The proposed LTV ratio did not take into consideration any credit enhancement, including private MI. Comments closed on the 2014 proposal in March 2015, and in December 2015, the Basel Committee released a second proposal that retained the LTV provisions of the initial draft, but not the debt servicing coverage ratios. In December 2017, the Basel Committee finalized its revisions to the Standardized Approach for credit risk, including the adoption of risk weights for residential mortgage exposures that, like the December 2015 proposal, take into account LTV but not debt servicing coverage ratios. The revisions to the international Basel III framework would only take effect in the United States to the extent that they are adopted by the federal banking regulators and incorporated into the U.S. Basel III rules.
23
We believe the existing U.S. implementation of the Basel III capital framework supports continued use of private MI by portfolio lenders as a risk and capital management tool; however, with the ongoing implementation of Basel III and the continued evolution of the Basel framework, it is difficult to predict the impact, if any, on the MI industry and the ultimate form of any potential future modifications to the regulations by federal banking regulators.
Current Expected Credit Loss Model
In June 2016, the Financial Accounting Standards Board (FASB) issued Accounting Standards Update (ASU) 2016-13, Financial Instruments-Credit Losses (Topic 326) which will be effective for public business entities in fiscal years beginning after December 15, 2019. This standard changes the accounting for credit losses for certain instruments and applies to financial assets measured at amortized cost, including residential mortgage loans. The new measurement approach based on expected losses, commonly referred to as the current expected credit loss (commonly known as CECL) model will require financial institutions to measure the life-time expected credit losses for financial assets held at the reporting date based on historical experience, current conditions and reasonable and supportable forecasts. This is expected to result in earlier recognition of credit losses as reserves are required to be recorded for lifetime losses at origination. However, public entities subject to the new measurement and disclosure standard will be allowed to consider mitigating factors, such as credit enhancement, when estimating lifetime credit losses. Private mortgage insurance is considered an acceptable form of credit enhancement for such purposes and will provide an offset to a portion of the lifetime loss reserving requirements. We believe the continued use of private MI will benefit financial institutions as they adopt this standard; however, as the accounting change is not yet effective, it is difficult to predict what, if any, impact it will have on the private MI industry.
Mortgage Servicing Rules
New residential mortgage servicing rules under RESPA and TILA, promulgated by the CFPB, went into effect in 2014. These rules included new or enhanced servicer requirements for handling escrow accounts, responding to borrower assertions of error and inquiries from borrowers, special handling of loans that are in default and loss mitigation when borrowers default, along with other provisions. A provision of the required loss mitigation procedures prohibits the servicer from commencing foreclosure until 120 days after a borrower defaults. Additional servicing regulations became effective in October 2017, providing some borrowers with foreclosure protections more than once over the life of the loan, imposing specific timing requirements for loss mitigation activities when servicing rights are transferred, and requiring that loss mitigation applications be properly dispositioned before allowing pursuit of a foreclosure action, among other requirements. Violation of these loss mitigation rules, which mandate special notices, handling and processing procedures (with deadlines) based on borrower submissions, may subject the servicer to private rights of action under consumer protection laws. Such actions or threats of such actions could cause delays in and increase costs and expenses associated with default servicing, including foreclosure. As to servicing of delinquent mortgage loans covered by our insurance policies, these rules could contribute to delays in and increased costs associated with foreclosure proceedings and have a negative impact on the cost and resolution of claims.
Homeowners Protection Act of 1998
HOPA provides for the automatic termination, or cancellation upon a borrower's request, of BPMI, as defined in HOPA, upon satisfaction of certain conditions. HOPA requires that lenders give borrowers certain notices with regard to the automatic termination or cancellation of BPMI. These provisions apply to BPMI for purchase money, refinance and construction loans secured by the borrower's principal dwelling. FHA and VA loans are not covered by HOPA. Under HOPA, automatic termination of BPMI would generally occur when the mortgage is first scheduled to reach an LTV of 78% of the home's original value, assuming that the borrower is current on the required mortgage payments. A borrower who has a "good payment history," as defined by HOPA, may generally request cancellation of BPMI when the LTV is first scheduled to reach 80% of the home's original value or when actual payments reduce the loan balance to 80% of the home's original value, whichever occurs earlier. If BPMI coverage is not canceled at the borrower's request or by the automatic termination provision, the mortgage servicer must terminate such BPMI coverage by the first day of the month following the date that is the midpoint of the loan's amortization, assuming the borrower is current on the required mortgage payments.
24
Section 8 of RESPA
Section 8 of RESPA applies to most residential mortgages insured by us. Subject to limited exceptions, Section 8 of RESPA prohibits persons from giving or accepting anything of value pursuant to an agreement or understanding to refer a "settlement service." MI generally may be considered to be a "settlement service" for purposes of Section 8 of RESPA under applicable regulations. Section 8 of RESPA affects how we structure ancillary services that we may provide to our customers, if any, including loan review services, risk-share arrangements and customer training programs. RESPA authorizes the CFPB and other regulators to bring civil enforcement actions and also provides for criminal penalties and private rights of action. The CFPB has brought a number of enforcement actions under Section 8 of RESPA, including settlements with several mortgage insurers. The CFPB's interpretation and enforcement of Section 8 of RESPA presents regulatory risk for many providers of "settlement services," including mortgage insurers.
Mortgage Insurance Tax Deduction
In 2006, Congress enacted a private mortgage insurance tax deduction on a temporary basis through the end of 2011. Upon expiration in 2011, Congress temporarily extended the deduction for each tax year from 2012 through 2017. Congress did not extend the deduction in 2018. Under the Tax Cuts and Jobs Act (TCJA) enacted in December 2017, Congress increased the standard deduction for individuals and maintained the tax deductibility of second mortgages. The combination of maintaining the deduction for second mortgages and not extending deductibility for private MI under the TCJA could have the effect of reducing demand for private MI products.
SAFE Act
The federal Secure and Fair Enforcement for Mortgage Licensing Act (SAFE Act), enacted by Congress in 2008, establishes minimum standards for the licensing and registration of state-licensed mortgage loan originators. The SAFE Act also requires the establishment of a nationwide mortgage licensing system and registry for the residential mortgage industry and its employees. As part of this licensing and registration process, loan originators who are employees of certain lending institutions must generally be licensed under the SAFE Act guidelines enacted by each state in which they engage in loan originator activities and registered with the registry. The CFPB administers and enforces the SAFE Act. Employees of NMIC are not required to be licensed and/or registered under the SAFE Act as NMIC does not originate mortgage loans. NMIS currently provides loan review services through third-party service providers, which have represented and warranted to NMIS that they comply with SAFE Act requirements in all applicable jurisdictions.
Privacy and Information Security
We provide mortgage insurance products and services to financial institutions with which we have business relationships. In the normal course of providing our products and services, we may receive non-public personal information regarding such financial institutions' customers. The GLBA and related state and federal regulations implementing its privacy and safeguarding provisions impose privacy and information security requirements on financial institutions, including obligations to protect and safeguard consumers' non-public personal information. GLBA and its implementing regulations are enforced by state insurance regulators and state attorneys general, and by the U.S. Federal Trade Commission (FTC) and the CFPB. In addition, many states have enacted privacy and data security laws which impose compliance obligations beyond GLBA, including obligations to protect social security numbers, maintain comprehensive information security programs and provide notification if a security breach results in a reasonable belief that unauthorized persons may have obtained access to consumer non-public personal information. We have adopted certain risk management and security practices designed to facilitate our compliance with these federal and state privacy and information security laws.
Fair Credit Reporting Act
FCRA imposes restrictions on the permissible use of credit report information. The CFPB and FTC each have authority to enforce the FCRA. FCRA has been interpreted by some FTC staff and federal courts to require mortgage insurers to provide "adverse action" notices to consumers if an application for mortgage insurance is declined or offered at higher than the best available rate for the program applied for on the basis of a review of the consumer's credit. We provide such notices when required.
Anti-Discrimination Laws
ECOA requires creditors and insurers to handle applications for credit and for insurance in accordance with specified requirements and prohibits discrimination in lending or insurance based on prohibited factors such as gender, race, ethnicity, age and familial status. The Fair Housing Act prohibits discrimination on the basis of race, gender and other prohibited bases in connection with housing-secured credit transactions.
25
Item 1A. Risk Factors
You should carefully consider the following risk factors, as well as all of the other information contained in this report, including our consolidated financial statements and the related notes thereto, before deciding to invest in our common stock. The occurrence of any of the following risks could materially and adversely affect our business, prospects, financial condition, operating results and cash flow. In such case, the trading price of our common stock could decline and you could lose some or all of your investment.
This report contains forward-looking statements that involve risks and uncertainties. See "Cautionary Note Regarding Forward-Looking Statements" on page 3 of this report. Our actual results could differ materially and adversely from those anticipated in these forward-looking statements, including any such statements made in Item 7, "Management's Discussion and Analysis of Financial Condition and Results of Operations."
Risk Factors Relating to Our Business Operations
We face intense competition for business in our industry, and if we are unable to compete effectively, we may not be able to achieve our business goals, which would adversely affect our business, financial condition and operating results.
The MI industry is highly competitive. With six private MI companies actively competing for business from the same residential mortgage originators, it is important that we continue to differentiate ourselves from the other mortgage insurers, each of which sells substantially similar products to ours. One or more of our competitors may seek to capture increased market share from the government MIs or from other private mortgage insurers by reducing prices, offering alternative coverage and product options, including offerings for loans not intended to be sold to the GSEs, loosening their underwriting guidelines or relaxing risk management policies, which could, in turn, improve their competitive positions in the industry and negatively impact our ability to achieve our business goals. Competition within the private mortgage insurance industry could result in our loss of customers, lower premiums, riskier credit guidelines and other changes that could lower our revenues or increase our expenses. If our IT systems are inferior to our competitors', existing and potential customers may choose our competitors' products over ours. If we are unable to compete effectively against our competitors and attract and retain our target customers, our revenue may be adversely impacted, which could adversely impact our growth and profitability.
In addition, we and most of our competitors, either directly or indirectly, offer certain ancillary services to mortgage lenders with which we also conduct MI business, including loan review, training and other services. For various reasons, including those related to resources or compliance, we may choose not to offer some or all of these services or not to offer them in a form or to the extent that is similar to the prevailing offerings of our competitors. If we choose not to offer these services, or if we were to offer ancillary services that are not well-received by the market and fail to perform as anticipated, we could be at a competitive disadvantage which could adversely impact our profitability.
Certain of our competitors are subsidiaries of larger and more diversified corporations that may have access to greater amounts of capital and financial resources than we do, or a lower cost of capital, and some have better financial strength ratings than we have. As a result, they may be better positioned to compete in and outside of the traditional MI market, including when the GSEs pursue alternative forms of credit enhancement other than private MI. In particular, in 2018, each GSE piloted a new credit risk transfer program under which the GSE purchases high-LTV loans (
i.e.
, LTVs above 80%) without MI and subsequently places mortgage insurance with a captive insurer controlled by one of our competitors, which captive in turn cedes 100% of the risk to a panel of offshore reinsurers. Freddie Mac's program is known as IMAGIN and Fannie Mae's program is known as Enterprise-Paid Mortgage Insurance or EPMI. We believe these programs compete with traditional LPMI products offered by private MI companies, including ours, and they may gain traction in the market if, and to the extent, the pricing for these products is lower than prevailing LPMI rates and features of the GSEs' offerings cause originators and the GSEs to materially modify their historical preference for private MI as credit enhancement on high-LTV loans. In addition, the pricing of the IMAGIN and EPMI programs and competing LPMI products may allow these products to begin to impinge on BPMI market share, or may cause MIs, including NMIC, to reduce BPMI rates to more effectively compete with these products.
Our financial strength ratings are important for our customers to maintain confidence in our products and our competitive position. PMIERs require all
approved insurers
, except newly-approved insurers, to maintain at least one rating with a rating agency acceptable to the GSEs. A downgrade in NMIC's ratings or ratings outlook, or our failure to maintain a rating acceptable to one or both of the GSEs, could have an adverse effect on our business, including (i) potentially impacting our eligibility as an
approved insurer
, (ii)
increased scrutiny of our financial condition by our customers, resulting in potential reduction in our NIW or (iii) negative impacts to our ability to conduct business in the non-GSE mortgage market, where financial strength ratings may be a more important counter-party consideration for lenders.
26
The amount of insurance we may be able to write could be adversely affected if lenders and investors select alternatives to private MI.
If lenders and investors select alternatives to private MI on high-LTV loans, our business could be adversely affected. These alternatives to private MI include, but are not limited to:
|
•
|
lenders using government mortgage insurance programs, including those of the FHA, USDA and VA, and state-supported mortgage insurance funds in several states, including Massachusetts and California;
|
|
•
|
lenders and other investors holding mortgages in portfolio and self-insuring;
|
|
•
|
GSEs and other investors using credit enhancements other than MI (including alternative forms of credit risk transfer such as IMAGIN and EPMI), using other credit enhancements in conjunction with reduced levels of MI coverage, or accepting credit risk without credit enhancement;
|
|
•
|
lenders originating mortgages using "piggy-back" or other structures to avoid MI, such as a first mortgage with an 80% LTV and a second mortgage with a 10%, 15% or 20% LTV (referred to as 80-10-10, 80-15-5 or 80-20 loans, respectively) rather than a first mortgage with an LTV above 80% that has MI; and
|
|
•
|
borrowers paying cash or making large down payments versus securing mortgage financing, which occurred with greater frequency in the years following the most recent financial crisis.
|
Any of these alternatives to private MI could reduce or eliminate the need for our products, could cause us to lose business and/or could limit our ability to attract the business that we would prefer to insure.
Further, at the direction of the FHFA, the GSEs have expanded their credit and mortgage risk transfer programs. These programs have included the use of structured finance vehicles, obtaining insurance from non-mortgage insurers (
e.g.
, IMAGIN and EPMI), including off-shore reinsurance, engaging in credit-linked note transactions in the capital markets, or using other forms of debt issuances or securitizations that transfer credit risk directly to other investors. The growing success of these programs and the perception that some of these risk-sharing structures have beneficial features in comparison to private MI (
e.g.
, lower costs, reduced counter-party risk due to collateral requirements or more diversified insurance exposures) may create increased competition for private MI on loans traditionally sold to the GSEs with private MI.
In the last ten years, the government MIs, principally the FHA and VA, significantly expanded their role in the MI market. While declining from peak market share, government MIs' market share remains substantially above their historical levels. Government mortgage insurance programs are not subject to the same capital requirements, costs of capital, risk tolerance or business objectives that we and other private mortgage insurers are, and therefore, generally have greater financial flexibility in setting their pricing, guidelines and capacity, which could put us at a competitive disadvantage. Although there has been broad policy consensus toward the need for private capital to play a larger role and government credit risk to be reduced in the U.S. housing finance system, it remains difficult to predict whether the combined market share of the government MIs will recede to historical levels. These agencies may continue to maintain a strong combined market position and could increase their market share in the future.
Factors that could cause government-supported mortgage insurance programs to remain significant include:
|
•
|
change to federal housing policy, including government MIs reducing their premiums or loosening their underwriting guidelines;
|
|
•
|
increase in premium rates or tightening of underwriting guidelines by private mortgage insurers;
|
|
•
|
capital constraints in the private MI industry;
|
|
•
|
increases in capital requirements imposed on private mortgage insurers by the GSEs or states;
|
|
•
|
continuation of increases to or imposition of new GSE loan delivery fees on loans that require MI, which may result in higher borrower costs for MI loans compared to loans insured by government MIs;
|
|
•
|
loans insured under federal government-supported mortgage insurance programs are eligible for securitization in Ginnie Mae securities, which may be viewed by investors as more desirable than GSE securities due to the explicit backing of Ginnie Mae securities by the full faith and credit of the U.S. federal government;
|
|
•
|
difference in the spread between GSE mortgage-backed securities and Ginnie Mae mortgage-backed securities;
|
|
•
|
increase in government MIs' loan limits above GSE loan limits; and
|
|
•
|
perceived operational ease of using insurance from government MIs compared to private MI.
|
27
If the government MIs maintain or increase their share of the mortgage insurance market, our business and industry could be negatively affected.
The degree to which lenders or borrowers may select these alternatives now, or in the future, is difficult to predict. As one or more of the alternatives described above, or new alternatives that enter the market, are chosen over MI, our revenues could be adversely impacted. The loss of business in general or the specific loss of more profitable business could have a material adverse effect on our financial position and operating results.
If we are unable to continue to attract and retain the most significant mortgage originators as customers, our ability to achieve our business goals could be negatively impacted.
The success of our mortgage insurance business is highly dependent on our ability to attract and retain as customers the most significant mortgage lenders in the U.S., measured through the combined volume of their retail originations and/or the insured loans they may acquire from other originators. As a result of their size and market share, these entities originate a significant majority of high-LTV mortgages in the U.S. and, therefore, influence the size of the MI market. We are currently doing business with a majority of these lenders. However, there is no assurance we will receive approvals from each of the remaining lenders to transact MI business with them or that those lenders who have approved us will continue to maintain our business relationship. If we are unable to maintain our approved status with one or more of these mortgage lenders, our business, financial condition and operating results could be adversely impacted.
If we lose one or more lenders that become our customers, we cannot be certain that any loss of business from one would be replaced from other new or existing lender customers. Some lenders may decide to write business only with certain mortgage insurers based on their views with respect to an insurer's pricing, service levels, underwriting guidelines, servicing and loss mitigation practices, financial strength or other factors. Our customers may choose to diversify the mortgage insurers with which they do business, which could negatively affect our level of NIW and our market share. In addition, our Master Policy does not require our customers to do business with us. Loss of business from significant customers, if not offset by additional business from other customers, could have an adverse effect on the amount of new business we are able to write, and consequently, our financial condition and operating results.
If the volume of high-LTV loan originations declines, the amount of insurance that we may be able to write could decline, which would reduce our revenues.
Our revenues, in part, depend on the volume of high-LTV loan originations and may be negatively affected if the volume declines. The factors that affect the volume of high-LTV loan originations include, among other things:
|
•
|
the level of loan interest rates. Higher interest rates may increase the potential housing costs of consumers hoping to purchase homes, which may have the effect of reducing the pool of potential borrowers available to purchase homes;
|
|
•
|
restrictions on mortgage credit due to more stringent underwriting standards, more restrictive regulatory and capital requirements and lender liquidity issues;
|
|
•
|
the health of the real estate industry and the national economy as well as conditions in regional and local economies;
|
|
•
|
housing affordability;
|
|
•
|
population trends, including the rate of household formation, preferences of potential mortgage borrowers and cultural shifts;
|
|
•
|
the rate of home price appreciation, which in times of heavy refinancing can affect whether refinance loans have LTVs that require MI;
|
|
•
|
deductibility of mortgage interest or other changes in tax policy, including the TCJA of 2017, which may have an effect on the residential housing market;
|
|
•
|
U.S. government housing policy encouraging loans to first-time homebuyers; and
|
|
•
|
the extent to which the GSEs' guaranty and other fees, credit underwriting guidelines and other business terms affect lenders' willingness to extend credit for high-LTV mortgages.
|
A decline in the volume of high-LTV loan originations could decrease demand for MI, decrease our NIW and therefore reduce our revenues and have an adverse effect on our operating results.
28
Our underwriting and credit risk management policies and practices may not anticipate all risks and/or the magnitude of potential for loss as the result of unforeseen risks.
We have established underwriting and credit risk management policies and practices that seek to mitigate our exposure to borrower default risk in our insured loan portfolio by anticipating future risks and the magnitude of those risks. Our underwriting and credit risk management guidelines are based on what we believe to be the major factors that influence the performance of mortgage credit, including borrower and loan-level risk characteristics, lender origination practices and macroeconomic variables that influence the housing market. The presence of multiple higher-risk characteristics (
i.e.,
layered risk) in a loan materially increases the likelihood of a default on such a loan unless, and to the extent, there are other characteristics to mitigate the risk.
The frequency and severity of claims we incur is uncertain and depends largely on general economic conditions, including unemployment and interest rates and trends in home prices. To the extent that a risk is unforeseen or is underestimated in terms of frequency and/or severity of loss, our underwriting and credit risk management policies and practices may not be sufficient to mitigate the effects of those risks. If these policies and practices do not correctly anticipate risk or the potential for loss, we may underwrite business for which we have not charged premium commensurate with the risk, which could result in material adverse effects on our business, financial condition and operating results.
Unexpected material increases in borrower defaults could cause our actual losses to materially exceed our expected loss rates, including in certain geographic regions in which our business may be concentrated and more susceptible to downturns.
Losses result from events that reduce a borrower's ability or willingness to continue to make mortgage payments, which include borrower-specific factors, such as job loss, illness, death and divorce, and macroeconomic factors, such as rising unemployment, market deterioration, rising interest rates and home price depreciation. Borrowers of high-LTV mortgages often have more difficulty weathering personal financial hardships caused by unforeseen events, because they may not have sufficient personal savings or available credit to structure viable workout solutions. Rising unemployment rates and deterioration in economic conditions for extended periods of time, across the U.S. or in specific regional economies, generally increases the likelihood of borrower defaults. An increase in interest rates typically leads to higher monthly payments for borrowers with existing ARMs and could materially impact the cost and availability of refinance options for borrowers. A decline in home values typically makes it more difficult for borrowers to sell or refinance their homes, generally increasing the likelihood of a default followed by a claim when borrowers are impacted by events that reduce their incomes or increase their expenses. In addition, home price depreciation may also decrease the willingness of borrowers with sufficient resources to make mortgage payments when their mortgage balances exceed the values of their homes. Declines in home values typically increase the severity of any claims we may pay. Home values may decline even absent deterioration in economic conditions due to declines in demand for homes, which may result from changes in buyers' perceptions of the potential for future home price appreciation, rising interest rates or availability of mortgage credit. If our default and loss projections are materially inaccurate, our actual losses could materially exceed our expectations and adversely affect our financial condition and operating results.
Additionally, while we seek to diversify our insured loan portfolio geographically, the availability of business might lead to concentrations in specific regions in the U.S., which could make our business more susceptible to economic downturns in these regions. Certain regions of the U.S. from time to time will experience weaker economic conditions, higher unemployment, lower property values or weaker housing markets. Consequently, loans in these regions will experience higher rates of default, foreclosure and loss than on loans nationally, and struggling borrowers in regions with an oversupply of homes may be unable to sell their homes as a means to avoid foreclosure. Any deterioration in housing prices, housing markets or economic conditions in regions in which we have a significant concentration of IIF and which adversely affects the ability of borrowers to make payments on their insured loans may increase the likelihood and severity of our losses, which could have a material adverse effect on our financial condition and operating results.
The premiums we charge may not be sufficient to cover claim payments and our operating costs.
Our mortgage insurance premiums may not be adequate to cover future claim payments. We set premiums at the time a policy is issued based on our expectations regarding likely performance over the term of the policy. Our premium rates are developed based on expectations that may ultimately prove to be inaccurate. Our premiums are subject to approval by certain state insurance regulators, which can delay or limit our ability to increase our premiums. Generally, we will not be able to cancel the MI coverage or adjust renewal premiums during the life of an MI policy to mitigate adverse development. As a result, higher than anticipated claims generally will not be able to be offset by premium increases on policies in force or mitigated by our non-renewal or cancellation of insurance coverage. While we believe our capital, premiums and investment earnings will provide a pool of resources sufficient to cover expected loss payments and have made estimates regarding loss payments and potential claims, the ultimate number and magnitude of claims we experience cannot be predicted with certainty and the actual premiums (along with investment earnings) may not be sufficient to cover losses and/or our operating costs. An increase in the number or size of claims, compared to what we
29
anticipate, could adversely affect our operating results or financial condition. We may not be able to achieve the results that we expect, and there can be no assurance that losses will not exceed our total resources.
Changes in factors that impact the length of time that our policies remain in force may adversely affect our future revenues and claims experience.
The premium from a single premium policy is collected up front and generally earned over the estimated life of the policy. In contrast, premiums from a monthly premium policy are received and earned each month over the life of the policy. Each year, most of our premiums will be from insurance that has been written in prior years. As a result, the length of time insurance remains in force, which is also generally referred to as persistency, is a significant determinant of our future revenues and claims paying resources. A lower level of persistency could reduce our future revenues from our monthly-paid premium products, which constituted about
75%
of our primary IIF at year-end 2018. In contrast, a higher than expected persistency rate will decrease the profitability from single premium policies because they will remain in force longer than was estimated when the policies were written.
The factors affecting persistency include:
|
•
|
the level of current mortgage interest rates compared to the mortgage rates on the IIF, which affects the sensitivity of the IIF to refinancings (
i.e.
, lower current interest rates make it more attractive for borrowers to refinance and receive a lower interest rate);
|
|
•
|
amount of equity in a home, as homeowners with more equity in their homes can more readily move to a new residence or refinance their existing mortgage;
|
|
•
|
changes in rates of home price appreciation or depreciation;
|
|
•
|
economic conditions that affect a borrower's decision to pay-off a mortgage earlier than required;
|
|
•
|
lenders' credit policies, which may make it more difficult for borrowers to refinance their loans;
|
|
•
|
efforts of lenders to solicit borrower refinancing; and
|
|
•
|
cancellation of BPMI mandated by the HOPA, and mortgage insurance cancellation policies of the GSEs and other mortgage investors, along with the current value of the homes underlying the mortgages in the IIF.
|
Mortgage interest rates have been increasing and are likely to continue to rise as a result of expected future changes in monetary policy by the Federal Reserve. We are unsure what the impact on our revenues will be as insured mortgages are refinanced, because the number of policies we write for replacement mortgages may be more or less than the terminated policies associated with the refinanced mortgages and written at different premium rates. Our expected revenues from monthly premium policies in particular might be negatively impacted if there is a higher than expected level of refinance activity in the future. In addition, if interest rates continue to rise, persistency is likely to increase, which may extend the average life of our insured portfolio and increase expected future claims, particularly for LPMI policies that are non-cancelable.
We are outsourcing the underwriting of our mortgage insurance on certain loans to third-party underwriting service providers (USPs). If these USPs fail to adequately perform their underwriting services or place our coverage on loans we would deem ineligible, we could experience increased claims on loans underwritten by them and our customer relationships could be negatively impacted.
If our USPs fail to adequately perform their underwriting services, such as mishandling of customer inquiries or an inability to underwrite a sufficient volume of applications per day, we may lose opportunities to place mortgage insurance coverage on particular loans, our reputation may suffer and customers may choose not to do business with us. In addition, if our USPs place our MI coverage on loans that are ineligible for coverage under our underwriting guidelines, our risk of claims will be increased on those loans or the premiums we charge may be inadequate for the corresponding risk. We do not have the right under our Master Policy to cancel coverage of an ineligible loan as a result of a USP making an incorrect decision. Further, other than being able to terminate our contracts with these USPs, we generally do not have express loan-level monetary contractual remedies against these USPs if we are obligated to pay claims on ineligible loans that they improperly agreed to insure on our behalf. If these USPs fail to adequately perform their underwriting services or consistently place coverage on ineligible loans, we could experience increased claims on loans underwritten by them and our customer relationships could be negatively impacted, which would have an adverse impact on our business, financial condition and operating results.
30
Our Master Policy contains restrictions on our ability to rescind coverage for certain material misrepresentations (including fraud) and underwriting defects, and if we were to fail to timely discover any such misrepresentations or underwriting defects, our rights of rescission would be significantly limited, and we could suffer increased losses as a result of paying claims on loans with unacceptable risk characteristics.
Under our Master Policy's current rescission relief provisions, we agree that we will not rescind coverage of an insured loan for material borrower misrepresentation (including fraud) or underwriting defects after a borrower timely makes a certain number of payments (either 12 or 36, as applicable), as specified in our Master Policy. In addition, once the borrower has made the requisite number of payments, we have agreed to limitations on our ability to initiate an investigation of fraud or misrepresentation by our insureds or any First Party involved in the origination of an insured loan. Twelve-month rescission relief on an insured loan is subject to our successful completion of an independent validation on such loan. If we are unable to perform an independent validation on an insured loan, such loan may qualify for rescission relief after a borrower timely makes 36 consecutive monthly payments. The current processes we have in place to review insured loans may be ineffective in detecting material misrepresentations and/or underwriting defects prior to a borrower making the requisite number of payments. After a loan meets the conditions for rescission relief, we are contractually prohibited from exercising our rights of rescission for borrower misrepresentation (including fraud) and certain First Party misrepresentations and our rights to investigate potential First Party fraud or misrepresentation are significantly curtailed. In addition, after we amend our Master Policy to comply with the new RRPs (discussed above in Item 1, "
Business - Underwriting - Independent Validation and Rescission Relief"
), our rescission rights will be more limited than they are now. With these provisions in place, we may be obligated to pay claims on certain loans with unacceptable risk characteristics or which failed to meet our underwriting guidelines at the time of origination. As a result, we could suffer unexpected losses, which could adversely impact our business, financial condition and operating results.
The mix of business we write affects our revenue stream and the likelihood of losses occurring.
Even when housing values are stable or rising, mortgages with certain characteristics have higher probabilities of claims. These characteristics include loans with LTVs over 95% (or in certain markets that have experienced declining housing values, over 90%), lower credit scores, with lower scores tending to have higher probabilities of claims, or higher total DTI ratios (
i.e.
, DTIs greater than 45%). Loans with high LTVs leave the borrower with little, no or negative-equity in the related property, which may result in increased defaults by such borrowers. In addition, depreciation in the values of properties underpinning our insured loans may increase the likelihood of default, and consequently the frequency or severity of losses. Loans with combinations of these risk factors have a higher degree of layered risk. In general, we charge higher premiums for loans with higher risk characteristics; however, there is no guarantee that our premiums will compensate us for any losses we incur on such loans. From time to time, in response to market conditions, we may change the types of loans that we insure and the guidelines under which we insure them, and in doing so, the concentration of insured loans with higher risk characteristics in our portfolio may increase. In addition, we may make exceptions to our underwriting guidelines on a loan-by-loan basis and for certain customer programs. Even though underwriting that falls outside of our guidelines would be on a case-by-case basis, we could incur greater than expected claims and claim payments on this business, which could negatively impact our revenues and operating results.
We expect our claims to increase as our insured loan portfolio grows and matures.
We believe, based on our experience and industry data, that claims incidence for mortgage insurance is generally highest in the third through sixth years after loan origination, and then declining. Factors, such as persistency of the book and the condition of the economy, including unemployment and housing prices can affect this pattern. We began writing mortgage insurance coverage in 2013. Although our claims experience to date has been generally as expected, we anticipate incurred losses and claims to increase as each book year reaches its anticipated period of highest claim frequency. The actual default rate and the average loss per default that we experience is difficult to predict and is dependent on the specific characteristics of our current in-force book, as well as the profile of business we write in the future. Our default experience and claims incurred are also generally affected by macroeconomic factors. See Item 7, "
Management's Discussion and Analysis of Financial Condition and Results of Operations - Insurance Claims and Claims Expenses."
Incurred losses and claims may exceed our expectations in the event of general economic weakness or decreases in housing values. An increase in the number or size of claims, compared to what we anticipate, could adversely affect our operating results and financial condition.
If servicers fail to adhere to appropriate servicing standards or experience disruptions to their businesses, our claims could unexpectedly increase.
We depend on reliable, consistent third-party servicing of the loans that we insure. Among other things, our Master Policy requires our insureds and their servicers to timely submit premium and monthly IIF and default reports and use commercially reasonable efforts to limit and mitigate loss when a loan is in default. If these servicers fail to adhere to such servicing standards and fail to limit and mitigate loss when appropriate, our losses may unexpectedly increase. In addition, if one or more servicers were to
31
experience adverse effects to its business, such servicers could experience delays in their reporting and premium payment requirements, which could result in our inability to correctly record new loans as they are underwritten, receive and process premium payments on insured loans and/or properly recognize and establish loss reserves on loans when defaults exist or occur but are not reported to us. Significant failures by large servicers or disruptions in the servicing of mortgage loans we insure would adversely impact our business, financial condition and operating results.
Furthermore, we have delegated the authority to implement certain loss mitigation options on loans we insure (
e.g.
, modifications, short sales and deeds-in-lieu) to the GSEs, who have in turn delegated such authority to most of their approved servicers, pursuant to the delegation agreements. Servicers who service GSE-owned loans are required to operate under the GSEs' required standards in accepting certain loss mitigation alternatives. We are dependent on these servicers to appropriately make these decisions under their delegated authority to mitigate our exposure to loss. In some cases, loss mitigation decisions favorable to the GSEs may not be favorable to us and may increase the incidence of paid claims. Inappropriate delegation procedures or failure of servicers to adhere to required standards may increase the magnitude of our losses and have an adverse effect on our business, financial condition and operating results. Our delegation of loss management decisions to the GSEs is subject to cancellation; however, exercise of these rights may have an adverse effect on our relationship with the GSEs and servicers.
We establish claims reserves when we are notified that an insured loan is in default for at least 60 days, based on management's estimate of claim rates and claim sizes, which are subject to uncertainties and are based on assumptions about certain estimation parameters that may be volatile. As a result, the actual claim payments we make may materially exceed the amount of our corresponding claims reserves.
Our practice, consistent with generally accepted accounting principles in the U.S. (GAAP) for the MI industry, is to establish loss reserves only for loans that servicers have reported to us as being at least 60 days in default. We also establish IBNR reserves for estimated losses incurred on loans that have been in default for at least 60 days that have not yet been reported to us by the servicers. The establishment of loss and IBNR reserves is subject to inherent uncertainty and requires significant judgment by management. We establish loss reserves using our best estimates of claim rates,
i.e.
, the percent of loan defaults that ultimately result in claim payments, and claim amounts,
i.e.
, the dollar amounts required to settle claims, to estimate the ultimate losses on loans reported to us as being at least 60 days in default as of the end of each reporting period. We estimate IBNR reserves by analyzing historical lags in default reporting to determine a specific number of IBNR claims in each reporting period. Our estimates of claim rates and claim sizes are strongly influenced by prevailing economic conditions, including current rates or trends in unemployment, housing price appreciation and/or interest rates, and our best judgments as to the future values or trends of these macroeconomic factors. These factors are outside of our control and difficult to predict. Further, our expectations regarding future claims may change significantly over time. If prevailing economic conditions deteriorate suddenly and/or unexpectedly, our estimates of loss reserves could be materially understated. Due to the inherent uncertainty and significant judgment involved in the numerous assumptions required to estimate our losses, our loss estimates may vary widely. Because loss and IBNR reserves are based on such estimates and judgments, there can be no assurance that even in a stable economic environment, actual claims paid by us will not be substantially different than our loss and IBNR reserves for such claims. Our business, operating results and financial condition will be adversely impacted if, and to the extent, our actual losses are greater than our loss and IBNR reserves.
Further, consistent with industry practice, our reserving method does not take account of losses that could occur from insured loans that are not in default. Thus, future potential losses that may develop from loans not currently in default are not reflected in our financial statements, except in the case where we are required to establish a premium deficiency reserve. As a result, future losses on loans that are not currently in default may have a material impact on future results if, and when, such losses emerge.
The occurrence of natural or man-made disasters or a pandemic could adversely affect our business, financial condition and operating results.
We are exposed to various risks arising out of natural disasters, including earthquakes, wildfires, hurricanes, floods and tornadoes and man-made disasters, including acts of terrorism, military actions and pandemics. For example, a natural or man-made disaster or a pandemic could lead to unexpected changes in persistency rates as policyholders, contract-holders and borrowers who are affected by the disaster may be unable to meet their contractual obligations, such as payment of premiums on our insurance policies and mortgage payments on loans we insure. The continued threat of terrorism may cause significant volatility in global financial markets, and a natural or man-made disaster or a pandemic could trigger an economic downturn in the areas directly or indirectly affected by the disaster. These consequences could, among other things, result in a decline in business and increased claims from those areas, as well as an adverse effect on home prices in those areas, which could result in unexpected increased loss experience in our business. Disasters or a pandemic also could disrupt public and private infrastructure, including communications and financial services, which could disrupt our normal business operations. In addition, a disaster or a pandemic could adversely affect the value of the assets in our investment portfolio if it affects companies' ability to pay us principal or interest on their securities.
32
We insure mortgages for homes in areas that have been impacted by natural disasters, including from hurricanes and wildfires. Following such natural disasters, we and other MIs typically experience an increase in NODs on mortgages secured by homes in the impacted areas that negatively impact incurred losses in the periods in which we received such NODs. Our ultimate claims exposure when we experience these events depends on the number of NODs ultimately received, proximate cause of each default and cure rate of the NOD population. Cure rates on loan defaults following natural disasters are influenced by the adequacy of homeowners and other hazard insurance carried on a related property, GSE-sponsored forbearance and other assistance programs, and a borrower's access to aid from government entities and private organizations, in ad
dition to other factors which generally impact cure rates in unaffected areas. We have observed that l
oans in default in disaster zones typically cure at a higher rate than non-disaster related loans in default. As such, we historically have established lower reserves for these type of NODs than we otherwise do for similarly situated NODs in non-disaster zones. Due to the inherent uncertainty and significant judgment involved in our assumptions, our loss estimates may turn out to be materially inaccurate and we can provide no assurance that actual claims paid by us, if any, on NODs in disaster zones will not be substantially different than the reserves we establish for such claims.
We are exposed to certain risks associated with our third-party reinsurance transactions, including the possibility that our reinsurers will fail to perform their obligations or that we will lose the capital credit we expected to receive when we entered into the transactions as a result of future GSE or Wisconsin OCI action or if any of our reinsurers experiences a downgrade or other adverse business event.
To actively manage our risk, ensure PMIERs compliance and support the growth of our business, we utilize third-party reinsurance, including the QSR Transactions and the ILN Transactions. There is a risk that these transactions will not continue to provide the benefits we expected when we entered into them, including as a result of our counter-parties under the QSR Transactions (which are not fully collateralized like the ILN Transactions) not performing their obligations, the GSEs or the Wisconsin OCI not continuing to give us full capital credit as anticipated for the duration of the contracts, or if one or more reinsurers under the QSR Transactions experiences a downgrade or other adverse business event. Any of these events could have negative impacts on the credit for the risk transferred under the reinsurance agreements and, in turn, on our capital needs, PMIERs position and growth potential.
Reinsurance does not relieve us of our direct liability to our insureds to pay claims, even when there are reinsurance recoverables available to us under the QSR Transactions. Accordingly, we bear credit risk with respect to such reinsurers. To mitigate this risk, there are certain contractual protections that establish sources from which we may directly obtain our reinsurance recoverables under the QSR Transactions. The ILN Transactions are fully collateralized with funds deposited into trust accounts to secure the obligations of the reinsurers to NMIC under the respective reinsurance agreement. See Item 8, "
Financial Statements and Supplementary Data - Notes to Consolidated Financial Statements - Note 6, Reinsurance
," below. To the extent the amounts in the QSR trust accounts are insufficient to cover loss recoveries and other amounts to which we are entitled under the QSR Transactions, we would attempt to recover such amounts directly from the reinsurers. One or more reinsurers may be unable or unwilling to pay reinsurance recoverables owed to us in the future, which could have an adverse effect on our financial condition.
If any reinsurer under the QSR Transactions experiences a ratings downgrade, the related reinsurance agreements obligate any such reinsurer, consistent with PMIERs requirements, to increase collateral in the related trust account. If the reinsurer breaches its collateral obligations, and fails to cure after notice, we may terminate the agreement with respect to such reinsurer. The QSR Transactions also give us the right to terminate the agreements in certain other circumstances, including, among other reasons, if a reinsurer becomes insolvent, has its license revoked or reinsures its entire liability under the relevant QSR Transaction with another entity. If we experience an early termination, we would be required to re-assume the risk ceded to the breaching reinsurer and the PMIERs and statutory capital credit we received when we entered into the agreement would be reversed. Depending on the timing and severity, such an event could have a material adverse effect on our financial condition, growth potential and future capital needs.
In addition, the GSEs and the Wisconsin OCI have the right periodically to review performance under our third party reinsurance transactions, including the reinsurers' financial strength and other factors the GSEs and Wisconsin OCI may believe are important to an evaluation of the transactions, which factors may be unknown to us. As a result of such reviews, the GSEs or the Wisconsin OCI could withdraw their approvals or continue their approvals, but grant less than full capital credit. If we do not continue to receive full capital credit in connection with these transactions, we would likely need to seek other sources of capital or reductions in RIF sooner than we would have expected with full capital credit under PMIERs and state insurance laws. Future sources of capital will depend on the cost, availability and terms and conditions that are acceptable to us, our regulators and the GSEs. We cannot be sure that we will be able to secure other sources of capital or substitute reductions in RIF in the amounts we require and on favorable terms, if at all.
Our operating results depend in large part on our ability to manage the risks related to the growth of our business and on maintaining and enhancing effective operating procedures and internal controls.
We have experienced significant growth since we started our mortgage insurance business in 2013. Our future operating
33
results depend to a large extent on our ability to successfully manage the continued growth of our business and the demands such growth places on our operations personnel and senior management team. The unexpected loss of key management and other personnel, or the inability to recruit, develop and retain qualified management talent in the future, could have an adverse effect on our business, financial condition or operating results. If we are unable to manage future expansion in our operations, we may experience compliance and operational problems, be required to slow the pace of growth, or have to incur additional expenditures beyond current projections to support such growth, any one of which could have an adverse effect on our business, financial condition or operating results.
Our future operating results also depend on our ability to continue to implement and improve our operational, credit, financial, management and other disclosure and internal risk controls and procedures and our reporting systems and procedures. Our management does not expect that our disclosure and internal risk controls and procedures will prevent all potential errors and fraud. We may not successfully implement improvements to, or integrate, our controls and procedures in an efficient or timely manner and may discover deficiencies in existing controls and procedures. For example, in 2017, as a result of the existence of a material weakness in the design and operating effectiveness of an internal control related to reconciliation support used to validate our deferred tax inventory, we reported that our disclosure controls and procedures were not effective at that time. We enhanced existing controls and designed and implemented new controls applicable to our deferred tax accounting, including those related to stock compensation, to ensure that our DTA is accurately calculated and appropriately reflected in our financial statements and reports we file with the SEC. The actions we took remediated the identified material weakness in 2017 and strengthened our internal control over financial reporting; however, there can be no guarantee that we will not experience flaws in our internal controls and procedures in the future.
The design of any system of controls is based in part upon certain assumptions about the likelihood of future events, and there can be no assurance that any design will succeed in achieving its stated goals under all potential future conditions. If our controls are not effective or not properly implemented, we could suffer financial or other loss, disruption of our business, regulatory sanctions or damage to our reputation. Losses resulting from these failures can vary significantly in size, scope and scale and may have a material adverse effect on our business, financial condition and operating results.
We are exposed to operational risk from fraud, malfeasance or error by employees and third-party service providers, and any such fraud, malfeasance or error could materially and adversely affect us.
We are exposed to many types of operational risk, including the risk of fraud or malfeasance by employees and outsiders, including third-party service providers, clerical record-keeping errors and transactional errors. Our business depends on our employees as well as third parties to process a large number of transactions. We could be materially and adversely affected if one of our employees or one of our systems causes a significant operational breakdown or failure, either as a result of human error or where an individual purposefully sabotages or fraudulently manipulates our operations or systems. Third parties with which we do business also could be sources of operational risk to us, including breakdowns or failures of such parties' own systems or employees. Any of these occurrences could result in a diminished ability to operate our business, potential liability to customers, reputational damage and regulatory intervention, which could result in a material adverse effect on our financial position and operating results.
If we do not maintain connectivity with or otherwise meet the technological demands of our customers or are unable to develop, enhance and maintain our proprietary technology platform, our business and financial performance could be adversely affected.
We primarily rely on e-commerce and other technologies to provide and distribute our MI products and services. Our customers require us to provide and service our MI products in a secure manner, including through our proprietary technology platform, our internet website or direct electronic data transmissions. Accordingly, we invest significant resources in maintaining and enhancing our technology platform and in establishing and maintaining electronic connectivity with our customers. Our customers may choose to do business only with mortgage insurers with which they are technologically compatible and may choose to retain existing MI providers rather than invest the time and resources to integrate with a new MI provider. Our business, financial condition and operating results may be adversely impacted if we do not successfully establish and maintain these arrangements or otherwise keep pace with the technological demands of customers.
The success of our business depends on our ability to timely and effectively resolve any significant issues that may arise with the operation of our technology platform. If our technology platform fails to perform in the manner we expect, our business, financial condition and operating results may be significantly harmed. Further, our business would be negatively impacted if we are unable to enhance our platform when necessary to support our primary business functions, including to match or exceed the technological capabilities of our competitors over time. We cannot predict with certainty the cost of maintaining and improving our platform, but failure to make necessary improvements and any significant shortfall in any technology enhancements or negative variance in the time-line in which system enhancements are delivered could have an adverse effect on our business, financial condition and operating results.
34
We may not be able to prevent the unauthorized disclosure or misuse of confidential, personal or proprietary information.
Our IT systems process, transmit, store and protect large amounts of personal information of borrowers whose mortgages we insure, in addition to the confidential, proprietary, financial and other information that are critical to our business. Our technology systems and networks, including those functions that we may outsource, are vulnerable to unauthorized access, interruptions or failures due to events that are often beyond our control, including cyber-attacks, natural disasters, theft, terrorist attacks and general technology failures. Additionally, our employees and vendors may use portable computers or mobile devices which can be stolen or lost or mis-used, making information accessible through such devices more vulnerable to unauthorized access, including by employee malfeasance. We have adopted information security procedures and controls to safeguard our systems and the information that we process, transmit and store. Despite these efforts, we may not be able to anticipate or implement effective preventive measures against all cyber threats, or detect and contain a breach in a timely manner, including because employees may not follow the controls we have implemented, the techniques used change frequently or are not recognized until launched, and because security attacks can originate from a wide variety of sources and methods. Our employees, customers or other users of our systems are from time-to-time subject to fraudulent inducements by parties attempting to gain access to our data or that of our customers. There is no assurance that our information security policies and systems in place can prevent unauthorized use or disclosure of confidential information, including nonpublic personal information. Any compromise of the security of our IT systems may result in loss of personally identifiable information, financial losses, loss of customers and the inability to transact business; could be costly and time-consuming to address and resolve; could expose us to liability for damages, harm our reputation, subject us to regulatory scrutiny and/or expose us to civil litigation. If any of these were to occur, our business, financial condition and operating results could be materially adversely affected. Further, the technology errors and omissions insurance coverage we maintain may be inadequate to cover claims and/or costs associated with incidents that may occur in the future.
Adverse investment performance may affect our financial results and ability to conduct business.
Income from our investment portfolio provides a growing source of revenue and cash flow to support our operations and claim payments. If we improperly structure our investments to meet those future liabilities or have unexpected losses in our portfolio, including losses resulting from impairments or the forced liquidation of investments before their maturity, we may be unable to meet those obligations. NMIC's investments and investment policies are subject to state insurance laws, which results in our portfolio being predominantly limited to highly rated fixed income securities. To date, our investment portfolio has been established at a time of historically low interest rates. If interest rates rise above the rates on our fixed income securities, the market value of our investment portfolio would decrease. Any significant decrease in the value of our investment portfolio would adversely impact our financial condition.
We may be required or find it advisable to change our investments or investment policies depending upon regulatory, economic and market conditions, or our existing or anticipated financial condition and operating requirements, including the tax position, of our business. Our investment objectives may not be achieved. Although our portfolio consists mostly of highly-rated investments and complies with applicable regulatory requirements, the success of our investment activity is affected by general economic conditions, which may adversely affect the markets for credit and interest-rate-sensitive securities, including the extent and timing of investor participation in these markets, the level and volatility of interest rates and, consequently, the value of fixed income securities.
We face risks associated with offering loan review services.
We provide loan review services for certain of our customers, including on loans for which we are not providing mortgage insurance. Under the terms of our loan review agreements with customers and subject to contractual limitations on liability, we provide these customers with limited indemnity rights if we make a material error in providing such services and the error materially restricts or impairs the saleability of a loan, results in a material reduction in the value of a loan or results in the customer being required to repurchase a loan. The indemnification may be in the form of monetary or other remedies, subject to per loan and annual limitations. Accordingly, we have assumed some credit risk in connection with providing these services. We also face regulatory and litigation risk in providing these services. See "
The private MI industry is, and as a participant we are, subject to litigation and regulatory enforcement risk generally
," below.
Risk Factors Relating to Regulation of the Mortgage Insurance Industry
There can be no assurance that the GSEs will continue to treat us as an approved insurer in the future, and our failure to maintain compliance with the GSEs' PMIERs could adversely impact our business, financial condition and operating results.
NMIC is a GSE
approved insurer
, and the significant majority of insurance we write is on loans sold to the GSEs. (
Italicized
terms have the same meaning that such terms have in the PMIERs, the GSE's eligibility requirements.) As a result, our compliance with the PMIERs is necessary to maintain NMIC's status as an
approved insurer
. The PMIERs establish operational, business,
35
remedial and financial requirements applicable to
approved insurers
. By April 15th of each year, NMIC must certify it met all PMIERs requirements as of December 31st of the prior year. NMIC also has an ongoing obligation to immediately notify the GSEs in writing upon discovery of its failure to meet one or more of the PMIERs requirements, some of which do not have materiality thresholds. We certified to the GSEs by April 15, 2018 that NMIC was in full compliance with the PMIERs as of December 31, 2017.
There can be no assurance, however, that NMIC will continue to comply with the PMIERs financial requirements. If NMIC were to experience a material reduction to revenues or an unexpected, significant increase in losses, NMIC's
available assets
could fall below the
minimum required assets
mandated by the PMIERs financial requirements. In addition, as NMIC continues to grow its business and increase its net RIF, NMIC may need to raise additional capital or reduce its net RIF, including through the use of additional reinsurance, to remain in compliance with the PMIERs financial requirements and to continue to support new business writings. Any future growth capital may be in the form of debt, equity, or a combination of both. We can give no assurance that our efforts to raise capital, obtain additional reinsurance or otherwise reduce our RIF would be successful.
The PMIERs provide that the table of factors that determine
minimum required assets
will be updated every two years or more frequently to reflect macroeconomic conditions, loan performance or to address other issues the GSEs deem important. In addition, the GSEs may amend or clarify other aspects of the PMIERs at any time. On September 27, 2018, the GSEs published revised PMIERs, including updated financial requirements, which will take effect and become applicable to NMIC on March 31, 2019. We expect that NMIC will remain in full compliance with the revised PMIERs, as applicable, prior to and after March 31, 2019; however, there is no assurance NMIC will remain in compliance or that the GSEs will not make the PMIERs financial requirements more onerous in the future. If any future updates to the PMIERs would require NMIC to materially increase the amount of
available assets
to support its business writings, the amount of capital NMIC is required to hold will increase, which may have a negative effect on our returns. Any such effect could have a negative impact on our flexibility to meet our business plans and our future operating results.
Compliance with PMIERs requires us to seek the GSEs' prior approval before taking many actions, including implementing new products or services or entering into reinsurance arrangements and inter-company agreements among others. PMIERs' prior approval requirements could prohibit, materially modify or delay us in our intended course of action. Further, the GSEs may modify or change their interpretation of terms they require us to include in our mortgage insurance policies for loans purchased by them, requiring us to modify our terms of coverage or operational procedures to remain an
approved insurer
, and such changes could have a material adverse impact on our financial position and operating results. For example, we and other
approved insurers
are currently drafting new master policies to, among other things, include terms that will conform to the new RRPs. It is possible the GSEs could, in their own discretion, require additional limitations and/or conditions on certain of our activities and practices that are not currently in the PMIERs in order for us to remain an
approved insurer
. Additional requirements or conditions imposed by the GSEs could limit our operating flexibility and the areas in which we may write new business.
If, in the future, NMIC fails to comply with the PMIERs, including the financial requirements, it may lose its
approved insurer
status from one or both GSEs, or may have to enter into a remediation plan (with the approval of the GSEs), curtail its business writings or cease transacting new business altogether. Any of these events would have a material adverse impact on our financial condition and future business prospects.
Changes in the business practices of the GSEs, including a decision to decrease or discontinue the use of private MI, federal legislation that changes their charters or a restructuring of the GSEs could reduce our revenues or increase our losses.
The requirements and practices of the GSEs impact the operating results and financial performance of
approved insurers
, including NMIC
.
Changes in the charters or business practices of Freddie Mac or Fannie Mae could materially reduce the number of mortgages they purchase that are insured by us and consequently diminish our franchise value. The GSEs could be directed to make such changes by the FHFA, which was appointed as their conservator in September 2008 and has the authority to control and direct the operations of the GSEs.
With the GSEs in a prolonged conservatorship, there has been ongoing debate over the future role and purpose of the GSEs in the U.S. housing market. The U.S. Congress may legislate, or the administration may implement through administrative reform, structural and other changes to the GSEs and the functioning of the secondary mortgage market. Since 2011, there have been numerous legislative proposals intended to incrementally scale back the GSEs (such as a statutory mandate for the GSEs to transfer mortgage credit risk to the private sector) or to completely reform the housing finance system. Congress, however, has not enacted any legislation to date. Recently, there has been increased focus on and discussion of administrative reform independent of legislative action. The proposals vary with regard to the government's role in the housing market, and more specifically, with regard to the existence of an explicit or implicit government guarantee. If any GSE reform is adopted, whether through legislation or administrative action, it could impact the current role of private mortgage insurance as credit enhancement, including its reduction or elimination, which would have an adverse effect on our revenue, operating results, prospects or financial condition. In addition, the term of the former
36
FHFA director expired in 2018, and the agency is currently led by a new acting director, pending confirmation of a permanent director. The new director may attempt to implement different objectives with regard to the GSEs' operations and activities. As a result of these matters, it is uncertain what role private capital, including MI, will play in the domestic residential housing finance system in the future or the impact of any such changes on our business. Any changes to the charters or statutory authorities of the GSEs would require Congressional action to implement. Passage and timing of any comprehensive GSE reform or incremental change (legislative or administrative) is uncertain, making the actual impact on us and our industry difficult to predict. Any such changes that come to pass could have a significant impact on our business.
In recent years, the FHFA has set goals for the GSEs to transfer significant portions of the GSEs' mortgage credit risk to the private sector. To date, several credit risk transfer products have been created under the program, including IMAGIN and EPMI and others discussed above in "
The amount of insurance we may be able to write could be adversely affected if lenders and investors select alternatives to private MI.
" To the extent these credit risk products evolve in a manner that displaces primary MI coverage, the amount of insurance we write may be reduced. It is difficult to predict the impact of alternative credit risk transfer products, if any, that are developed to meet the goals established by the FHFA.
We are subject to comprehensive state insurance regulations and capital adequacy requirements, which we must satisfy to continue to operate our MI business.
The U.S. MI industry and our insurance subsidiaries are subject to comprehensive state regulation in each jurisdiction in which they are licensed or authorized to do business. Regulatory scrutiny could lead to new legal precedents, new regulations or new practices, or regulatory actions or investigations, which could adversely affect our financial condition and operating results. Although their scope varies, state insurance laws generally grant broad supervisory powers to state insurance regulatory authorities to examine insurance companies and enforce rules or exercise discretion affecting almost every significant aspect of the insurance business, including premium rates, trade and claims practices, accounting methods, marketing practices, policy forms and capital adequacy. These state insurance regulatory authorities could take actions that could materially impact the types of products and services we and our industry are permitted to offer, including requiring us (and other MI companies) to modify current pricing and business practices. Further, failure to comply with the applicable regulations could lead to enforcement or disciplinary action, including the imposition of penalties and the revocation of our authorization to operate.
NMIC's principal regulator is the Wisconsin OCI. Under applicable Wisconsin law, as well as that of 15 other states, a mortgage insurer must maintain a minimum amount of statutory capital relative to its RIF in order for the mortgage insurer to continue to write new business. While formulations of minimum capital may vary in each jurisdiction that has such a requirement, the most common measure applied allows for a maximum permitted RTC ratio of 25:1. Wisconsin and certain other states, including California and Illinois, apply a substantially similar requirement referred to as minimum policyholders' position. If our business grows faster (
i.e.
, our RIF grows faster than expected) or is less profitable than expected (
i.e.
, our revenues do not generate the return we expect), our actual RTC ratios over the short to mid-term could exceed our expected RTC ratios and could begin to approach the limits to which we are subject, which could require us to enter into alternative arrangements to reduce our RIF, including through additional reinsurance, or raise additional capital. We can give no assurance that our efforts to obtain additional reinsurance or otherwise reduce our RIF, or to raise capital would be successful. If we are unable to obtain additional reinsurance or enter into alternative arrangements to reduce our RIF or raise additional capital, we may exceed these state-imposed capital requirements. Accordingly, if we fail to meet the capital adequacy requirements in one or more states, we could be required to suspend writing business in some or all of the states in which we do business.
The NAIC's Working Group has proposed a draft revised Model Act that contains risk-based capital requirements, which we and the MI industry are evaluating. We have provided feedback to the Working Group since early 2013, including comments on the risk-based capital approach. The Working Group's discussions are ongoing and the ultimate outcome of these discussions and any potential actions taken by the NAIC cannot be predicted at this time. If the Working Group's final proposal to the NAIC contains more stringent capital requirements, this could ultimately lead to NMIC being obligated to hold more capital for its insured business than we are required to hold under PMIERs, which would reduce our profitability compared to the profitability we expect under the existing capital requirements.
The private MI industry is, and as a participant we are, subject to litigation and regulatory enforcement risk generally.
We operate in highly regulated industries that inherently pose a heightened risk of litigation and regulatory proceedings. As a result, the members of the MI industry, including NMIC, face litigation risk, including the risk of class action lawsuits, and administrative enforcement by federal and state insurance agencies in the ordinary course of operations.
In the past, mortgage insurers (other than NMIC) have been involved in litigation and regulatory enforcement actions alleging violations of Section 8 of RESPA. Among other things, Section 8 of RESPA generally precludes mortgage insurers from paying referral fees to mortgage lenders for the referral of MI business. This limitation also can prohibit providing services or products
37
to mortgage lenders free of charge, charging fees for services that are lower than their reasonable or fair market value, and paying fees for services that mortgage lenders provide that are higher than their reasonable or fair market value, in exchange for the referral of MI business. Various regulators, including the CFPB, state insurance commissioners and state attorneys general, may bring actions seeking various forms of relief in connection with alleged violations of the referral fee limitations of RESPA, as can private litigants in class actions. In the years following the most recent financial crisis, the CFPB pursued a higher volume of enforcement actions against mortgage industry participants, including mortgage insurers. In particular, the CFPB focused on challenging mortgage insurers' captive reinsurance arrangements under Section 8 of RESPA. The insurance law provisions of many states also prohibit paying for the referral of insurance business and provide various mechanisms to enforce this prohibition. New leadership at the CFPB may also have an impact on future CFPB enforcement activity. The CFPB's interpretation and enforcement of Section 8 of RESPA presents regulatory risk for many providers of "settlement services," including mortgage insurers.
We currently are not a party to any federal or state regulatory enforcement actions; however, such proceedings could arise in the future. The cost to defend, and the ultimate resolution of, any such action or proceeding could have a material adverse impact on our business, financial condition and operating results. Should we become a party to an action by any of these regulators, the ultimate outcome is difficult to predict, and it is possible that any outcome could be negative to us specifically or the industry in general and such a negative outcome could have an adverse effect on our business, financial position and operating results.
From time-to-time, we have been involved in certain legal proceedings in the ordinary course of business. To date, we have not recognized a material liability related to any of our legal proceedings. However, the outcome of litigation and other legal and regulatory matters is inherently uncertain, and it is possible that one or more of any such matters in the future could have an unanticipated material adverse effect on our liquidity, financial position and operating results.
The implementation of Basel III may adversely affect the use of MI by certain banks.
In July 2013, U.S. federal banking regulators adopted regulations to implement Basel III. The effective date for the U.S. Basel III regulations was January 1, 2014, although the majority of its provisions are subject to multi-year phase-in periods to achieve full implementation. With the ongoing implementation of U.S. Basel III and the potential continued evolution of the international Basel capital framework, it is difficult to predict the impact, if any, on the MI industry and the ultimate form of any potential future modifications to the regulations by federal banking regulators. If federal regulators revise the U.S. Basel III rules to reduce or eliminate the capital benefit banks receive from insuring high-LTV loans with private MI, or if our customers who are subject to Basel III believe that adverse changes may occur at some time in the future, our current and future business may be adversely affected.
Our business prospects and operating results could be adversely impacted if, and to the extent that, the Consumer Financial Protection Bureau's ATR Rules defining a QM further reduce the size of the origination market.
The Dodd-Frank Act authorized the CFPB to issue regulations requiring a loan originator to determine whether, at the time a loan is originated, the consumer has a reasonable ability to repay the loan (ATR). The CFPB's final ATR rule went into effect on January 10, 2014. A subset of mortgages within the ATR rule are known as "qualified mortgages" or QMs, which generally are defined as loans without certain risky features, such as negative amortization, points and fees in excess of 3% of the loan amount, borrowers with DTI ratios above 43% and terms exceeding 30 years. QMs under the rule benefit from a statutory presumption of compliance with the ATR rule, thus potentially mitigating the risk of the liability of the creditor and assignees of the loan. The rule also provides for the "QM Patch," so long as loans satisfy the general product feature requirements of QMs (other than borrower DTI) and so long as they meet the underwriting requirements of the GSEs. The QM Patch is scheduled to phase out upon the earlier to occur of the end of conservatorship or receivership of the GSEs or January 10, 2021. The expiration of the QM Patch or any action by Congress or the CFPB to modify it could affect the residential mortgage market and demand for private mortgage insurance.
The Dodd-Frank Act also gave statutory authority to the HUD, the VA, and the USDA to develop their own definitions of "QM," which those agencies have completed. To the extent lenders find that the HUD definition of QM is more favorable to certain segments of their borrowers, they may choose FHA products over private MI products.
We, along with other industry participants, have observed that the significant majority of covered loans made after the effective date of the ATR rule have been QMs. We expect that most lenders will continue to be reluctant to make loans that do not qualify as QMs (either under the rule's specific underwriting guidelines, GSE underwriting guidelines or the HUD definition of a QM) because absent full compliance with the ATR rule, such loans will not be entitled to a safe-harbor presumption of compliance with the ability-to-pay requirements. As a result, we believe ATR regulations have given rise to a subset of borrowers who cannot meet the regulatory QM standards, thus restricting their access to mortgage credit and reducing the size of the residential mortgage market. The CFPB recently completed its statutorily mandated assessment of the ATR rule's impact and effectiveness in meeting its objectives. Additionally, the CFPB recently completed its statutorily mandated assessment of the ATR rule's impact and effectiveness in meeting its objectives. It is unclear what, if any, changes the CFPB may implement to address the findings of this assessment. Our business prospects and operating results could be adversely impacted if, and to the extent that, the QM regulations or the CFPB's
38
actions have the impact of further reducing the size of the origination market, including potentially when the temporary GSE QM status expires.
Risks Related to Our Holding Company
Our holding company structure and certain regulatory and other constraints could affect our ability to satisfy our obligations and potentially require us to raise more capital.
NMIH serves as the holding company for our operating subsidiaries and does not have any significant operations of its own. NMIH's principal source of operating cash is investment income, and could in the future include dividends from NMIC, if available and permitted under law or by state insurance regulators. In addition, NMIH currently receives cash from our insurance subsidiaries, consisting of payments made under our tax and expense-sharing arrangements. The expense-sharing arrangements between us and our subsidiaries, as amended, have been approved by the Wisconsin OCI, but such approval may be revoked at any time. NMIH depends on these sources of liquidity to make principal and interest payments under its current debt arrangements and to pay certain corporate expenses and income taxes, among other things. If payments to NMIH were curtailed or limited, there is a risk that NMIH would be unable to satisfy its financial obligations.
Our dividend income is limited to upstream dividend payments from our subsidiaries. With respect to our insurance subsidiaries, under Wisconsin law, dividends in excess of prescribed limits are deemed "extraordinary" and require approval of the Wisconsin OCI. Other states in which our insurance subsidiaries are licensed also limit or restrict their ability to pay dividends. It is possible that Wisconsin and other states that have dividend restrictions will adopt revised statutory provisions or interpretations of existing statutory provisions that could be more restrictive than those currently in effect or will otherwise take actions that may further restrict the ability of our insurance subsidiaries to pay dividends or make distributions or returns of capital. In addition, under the PMIERs, if an
approved insurer
fails to meet the PMIERs financial requirements, such
approved insurer
may not pay dividends without the prior approval of the GSEs. While Re One currently has the capacity to pay ordinary dividends, NMIC reported a statutory net loss for the twelve months ended December 31, 2018 and cannot pay any ordinary dividends to NMIH through December 31, 2019 without the prior approval of the Wisconsin OCI. As a result of the state dividend limitations, we do not expect to receive material dividend income from our subsidiaries for several years, if at all.
In addition, to support NMIC's future growth, we could be required to provide additional capital support for NMIC if additional capital is required by the GSEs or pursuant to insurance laws and regulations. If we were unable to meet our obligations, NMIC could lose GSE approval and/or be required to cease writing business in one or more states, which would adversely impact our business, financial condition and operating results.
To the extent that the funds generated from investment income or by our ongoing operations and capitalization are insufficient to fund future operating requirements, we may need to raise additional funds through future financing activities, including through the issuance of additional debt, equity, or a combination of both, reduce our RIF, including through additional reinsurance, or curtail our growth and reduce our expenses. NMIH's future capital requirements depend on many factors, including NMIC's ability to successfully write new business, establish premium rates at levels sufficient to cover claims and operating costs and meet minimum required asset thresholds under the PMIERs. We can give no assurance that our efforts to raise capital, obtain additional reinsurance or otherwise reduce our RIF would be successful. If we cannot obtain adequate capital, our business, financial condition and operating results could be adversely affected.
Our 2018 Credit Agreement contains various covenants, restrictions and required financial ratios and tests that limit our operating flexibility. The violation of one or more of these covenants, ratios or tests could have a material adverse effect on our business, financial condition and operating results.
In May 2018, NMIH entered into a credit agreement (2018 Credit Agreement), providing for (i) a
$150 million
five-year senior secured term loan facility (2018 Term Loan) that matures on May 24, 2023; and (ii) an
$85 million
three-year secured revolving credit facility (2018 Revolving Credit Facility) that matures on May 24, 2021. Proceeds from the 2018 Term Loan were used to repay in full the outstanding amount due under our previous
$150 million
amended term loan (the 2015 Term Loan) and to pay fees and expenses incurred in connection with the 2018 Credit Agreement. The 2018 Credit Agreement is secured by substantially all of the assets of NMIH, including the capital stock of NMIC and Re One.
Among other requirements, under both the 2018 Term Loan and the 2018 Revolving Credit Facility, NMIH may not permit our debt to total capitalization ratio to exceed 35% as of the last day of any fiscal quarter. Under the 2018 Revolving Credit Facility, NMIH may not permit (i) the aggregate amount of our unrestricted cash and cash equivalents to be less than $10 million at any time when NMIH does not have an investment-grade credit rating from both S&P and Moody's Investors Service (Moody's), (ii) the statutory capital of NMIC to be less than $414,424,624 as of the last day of any fiscal quarter, or (iii) our consolidated net worth to be, as of the last day of any fiscal quarter, less than the sum of (A) $461,607,905, plus (B) 50% of our cumulative consolidated net
39
income for each fiscal quarter for which such consolidated net income is positive, plus (C) 50% of any increase in our consolidated net worth after March 31, 2018 resulting from certain issuances of equity by or capital contributions to NMIH or our subsidiaries. In addition, under the Revolving Credit Facility, NMIC must remain at all times in compliance with all applicable "financial requirements" imposed pursuant to the PMIERs, subject to any allowed transition period or forbearance thereunder.
Further, the 2018 Credit Agreement prohibits, restricts or limits, among other things, NMIH's and its subsidiaries' ability to (i) incur additional indebtedness, (ii) incur liens on their property, (iii) pay dividends or make other distributions, (iv) sell their assets, (v) make certain loans or investments, (vi) merge or consolidate and (vii) enter into transactions with affiliates, in each case subject to certain limitations, exceptions and qualifications as set forth in the 2018 Credit Agreement.
These covenants place significant restrictions on the manner in which we may operate our business, and our ability to meet these covenants may be affected by events beyond our control. If we fail to meet any of these covenants, the lenders could declare the outstanding principal amount of the 2018 Term Loan, accrued and unpaid interest and all other amounts owing and payable thereunder to be immediately due and payable, which could have a material adverse effect on our business, financial condition and operating results.
We are required to assess our ability to continue as a going concern as part of our preparation of financial statements at each quarter-end. This assessment includes, among other things, our ability to comply with the covenants and requirements under the 2018 Credit Agreement. If in future periods we are not able to demonstrate that we will be in compliance with the financial covenant requirements in the 2018 Credit Agreement for at least 12 months following the date of the financial statements, management could conclude there is substantial doubt about our ability to continue as a going concern, and the audit opinion that we would receive from our independent registered public accounting firm would include an explanatory paragraph regarding our ability to continue as a going concern. Such an opinion would cause us to be in breach of the covenants in the 2018 Credit Agreement.
NMIH's obligations under the Credit Agreement are guaranteed (Guarantee) by one of its subsidiaries, NMIS (the Guarantor). NMIH's and the Guarantor's obligations under the 2018 Credit Agreement and the Guarantee, respectively, are secured by first-priority liens on substantially all the assets of NMIH and the Guarantor, respectively, subject to certain exceptions. If we fail to make the required payments on the 2018 Term Loan, do not meet the financial covenants or otherwise default on the terms of the 2018 Credit Agreement, the lenders under the 2018 Credit Agreement could declare all of the obligations under the 2018 Credit Agreement to be immediately due and payable. We cannot assure you that our assets would be sufficient to repay such amounts in full if this were to occur, and the lenders could foreclose on the collateral securing the 2018 Credit Agreement and the Guarantee, including, subject to regulatory approval, the stock of NMIC and Re One. In addition, although we currently expect that we will have sufficient assets to repay the outstanding principal of the 2018 Term Loan at maturity; we can give no assurance that our assets at that time will be sufficient to repay such amounts in full or that NMIH will be able to extend or refinance the 2018 Term Loan. Any of these actions could have a material adverse effect on our business, financial condition and operating results.
Our existing, and any future, variable rate indebtedness subjects us to interest rate risk, which could cause our annual debt service obligations to increase significantly.
Our indebtedness under the 2018 Credit Agreement is, and our future indebtedness may be, subject to variable rates of interest, exposing us to interest rate risk. If interest rates increase, our debt service obligations on such variable rate indebtedness would increase, resulting in a reduction of our net income that could be significant, even though the principal amount borrowed would remain the same.
Despite our substantial level of debt, we may incur more debt, which could exacerbate any or all of the risks described above.
We may incur substantial additional debt in the future, including up to $85 million in borrowings we may choose to make under the 2018 Revolving Credit Facility. Although our 2018 Credit Agreement limits our ability and the ability of certain of our subsidiaries to incur additional debt, these restrictions are subject to a number of qualifications and exceptions, and, under certain circumstances, we may incur additional debt in compliance with these restrictions. In addition, the 2018 Credit Agreement does not prevent us from incurring certain obligations that do not constitute "indebtedness" as defined therein. To the extent that we incur additional debt or such other obligations, the risks associated with our 2018 Credit Agreement described above, including our possible inability to service our debt or other obligations, would increase.
Our current credit ratings may adversely affect our ability to access capital and the cost of such capital, which could have a material adverse effect on our business, financial condition and operating results.
Our current issuer credit and debt ratings are below investment grade. Our current credit ratings, or any future negative actions the credit agencies may take, could affect our ability to access the reinsurance, credit and capital markets in the future and could lead to worsened trade terms and adversely affect the cost. An inability to access reinsurance, capital and credit markets when
40
needed to continue to grow our business, refinance our existing debt or raise new debt or equity could have a material adverse effect on our business, financial condition, operating results and liquidity.
We do not anticipate paying any dividends on our common stock in the near future, and payment of any declared dividends may be delayed.
We have not declared or paid dividends in the past, and we do not expect to pay dividends in the near future. We currently intend to retain all of our earnings, if any, to fund our growth. As a result, only appreciation in the price of our common stock, which may not occur, will provide a return to investors. Any future declaration and payment of dividends by our Board will depend on many factors, including general economic and business conditions, our strategic plans, our financial results and condition, legal requirements and other factors that our Board deems relevant. In addition, we may enter into additional credit agreements or other debt arrangements in the future that could restrict our ability to declare or pay cash dividends on our common stock.
The market price of our common stock may be volatile, which could cause the value of an investment in our common stock to decline.
The market price of our common stock may fluctuate substantially and be highly volatile, which may make it difficult for stockholders to sell their shares of our common stock at the volume, prices and times desired. There are many factors that impact the market price of our common stock, including, without limitation:
|
•
|
general market conditions, including price levels and volume and changes in interest rates;
|
|
•
|
national, regional and local economic or business conditions;
|
|
•
|
the effects of, and changes in, trade, tax, monetary and fiscal policies, including the interest rate policies of the Federal Reserve;
|
|
•
|
changes in U.S. housing and housing finance policy, including changes to the GSEs;
|
|
•
|
our actual or projected financial condition, liquidity, operating results, cash flows and capital levels;
|
|
•
|
changes in, or failure to meet, our publicly disclosed expectations as to our future financial and operating performance;
|
|
•
|
publication of research reports about us, our competitors or the financial services industry generally, or changes in, or failure to meet, securities analysts' estimates of our financial and operating performance, or lack of research reports by industry analysts or ceasing of coverage;
|
|
•
|
market valuations, as well as the financial and operating performance and prospects, of similar companies;
|
|
•
|
future issuances or sales, or anticipated issuances or sales, of our common stock or other securities convertible into or exchangeable or exercisable for our common stock;
|
|
•
|
additional indebtedness we may incur in the future;
|
|
•
|
expenses incurred in connection with changes in our stock price, such as changes in the value of the liability reflected on our financial statements associated with outstanding warrants;
|
|
•
|
the potential failure to establish and maintain effective internal controls over financial reporting;
|
|
•
|
additions or departures of key personnel and management;
|
|
•
|
our failure to satisfy the continued listing requirements of the NASDAQ; and
|
|
•
|
our failure to comply with the Sarbanes-Oxley Act of 2002.
|
The stock markets in general have experienced substantial volatility that has often been unrelated to the operating performance of particular companies. These types of broad market fluctuations may adversely affect the trading price of our common stock. In the past, stockholders of certain companies other than NMIH have sometimes instituted securities class action litigation against such companies following periods of volatility in the market price of their securities. Any similar litigation against us could result in substantial costs, divert management's attention and resources and harm our business or operating results.
The market price of our common stock could decline due to the large number of outstanding shares of our common stock eligible for future sale, and future issuances of our common stock may depress our share price and dilute the book value of our common stock.
As of December 31, 2018, we had
66,318,849
shares of our common stock issued and outstanding. Sales of substantial amounts of our common stock in the public market in the future, or the perception that these sales could occur, could cause the market price of our common stock to decline. These sales could also make it more difficult for us to sell equity or equity-related securities in the future, at a time and place that we deem appropriate.
41
In addition, we have filed registration statements on Form S-8 under the Securities Act to register an aggregate of 5.5 million shares of our common stock for issuance under our 2012 Stock Incentive Plan (2012 Plan) and an aggregate of 6 million shares of our common stock for issuance under our Amended and Restated 2014 Omnibus Incentive Plan (2014 Plan, and together with the 2012 Plan, the Stock Plans). Any shares issued under our Stock Plans, including as a result of the exercise of stock options, would dilute the percentage ownership held by investors who purchase our shares prior to such issuance.
We have the authority, without action or vote of our stockholders except as required under Nasdaq rules, to issue all or any part of our authorized but unissued shares of common stock, including shares that may be issued to satisfy our obligations under our Stock Plans, and securities and instruments that are convertible into shares of our common stock. Such stock issuances could be made at a price that reflects a discount or a premium from the then-current trading price of our common stock and might dilute the book value of our common stock or result in a decrease in the per share price of our common stock.
Future issuance of debt or preferred stock, which would rank senior to our Class A common stock upon our liquidation, may adversely affect the market value of our common stock.
Shares of our common stock are equity interests and do not constitute indebtedness of NMIH. In the future, we may attempt to increase our capital resources by issuing additional debt, including bank debt, commercial paper, medium-term notes, senior or subordinated notes or classes of shares of preferred stock. Our preferred stock, if issued, could have a preference on liquidating distributions or a preference on dividend payments that would limit amounts available for distribution to holders of shares of our common stock. Accordingly, if we were liquidated, holders of our debt securities and preferred stock and lenders with respect to our 2018 Credit Agreement or other future borrowings, if any, would receive a distribution of our available assets prior to the holders of shares of our common stock. Any decision to issue debt or preferred stock in the future will depend on market conditions and other factors, some of which will be beyond our control. We cannot predict or estimate the amount, timing or nature of such future issuances. Holders of our common stock bear the risk of such future issuances of debt or preferred stock reducing the market value of our common stock.
Provisions contained in our organizational documents, as well as provisions of Delaware law and Wisconsin insurance law, could delay or prevent a change of control of us, which could adversely affect the price of shares of our common stock.
Our certificate of incorporation and bylaws and Delaware law contain provisions that could have the effect of rendering more difficult or discouraging an acquisition deemed undesirable by our Board. Our corporate governance documents include provisions that:
|
•
|
provide that special meetings of our stockholders generally can only be called by the chairman of the Board or the president or by resolution of the Board;
|
|
•
|
provide our Board the ability to issue undesignated preferred stock, the terms of which may be established and the shares of which may be issued without stockholder approval, and which may grant preferred holders voting, special approval, dividend or other rights or preferences superior to the rights of the holder of common stock;
|
|
•
|
provide our Board the ability to issue common stock and warrants within the amount of authorized capital;
|
|
•
|
provide that, subject to the rights of the holders of any series of preferred stock with respect to such series of preferred stock, any action required or permitted to be taken by our stockholders must be effected at a duly called annual or special meeting of our stockholders and may not be effected by any consent in writing by such stockholders; and
|
|
•
|
provide that stockholders seeking to bring business before our annual meeting of stockholders, or to nominate candidates for election as directors at our annual meeting of stockholders, generally must provide timely advance notice of their intent in writing and certain other information not less than 90 days nor more than 120 days prior to the meeting.
|
These provisions, alone or together, could delay hostile takeovers and changes of control of the Company or changes in our management. Additionally, cumulative voting in the election of our directors in not allowed.
As a Delaware corporation, we are also subject to anti-takeover provisions of Delaware law, including Section 203 of The Delaware General Corporation Law, which, subject to certain exceptions, prohibits a public Delaware corporation from engaging in a business combination (as defined in such section) with an "interested stockholder" (defined generally as any person who beneficially owns 15% or more of the outstanding voting stock of such corporation or any person affiliated with such person) for a period of three years following the time that such stockholder became an interested stockholder, unless (i) prior to such time, the board of such corporation approved either the business combination or the transaction that resulted in the stockholder becoming an interested stockholder; (ii) upon consummation of the transaction that resulted in the stockholder becoming an interested stockholder, the interested stockholder owned at least 85% of the voting stock of such corporation at the time the transaction commenced (excluding for purposes of determining the voting stock outstanding (but not the outstanding voting stock owned by the interested stockholder)
42
the voting stock owned by directors who are also officers or held in employee benefit plans in which the employees do not have a confidential right to tender or vote stock held by the plan); or (iii) on or subsequent to such time the business combination is approved by the board of such corporation and authorized at a meeting of stockholders by the affirmative vote of at least two-thirds of the outstanding voting stock of such corporation not owned by the interested stockholder.
In addition, Wisconsin's insurance laws and regulations generally provide that no person may acquire control of us unless the transaction in which control is acquired has been approved by the Wisconsin OCI. The regulations provide for a rebuttable presumption of control when a person owns or has the right to vote more than 10% of our voting securities. In addition, the insurance laws and regulations of other states in which NMIC and/or Re One are licensed insurers require notification to the state's insurance department a specified period before a person acquires control of us. If regulators in these states disapprove the change of control, our licenses to conduct business in the disapproving states could be terminated.
Any provision of our certificate of incorporation or bylaws or Delaware law or under the Wisconsin insurance regulations that has the effect of delaying or deterring a change in control could limit the opportunity for our stockholders to receive a premium for their shares of common stock, and could also affect the price that some investors are willing to pay for shares of our common stock.
43
Item 1B. Unresolved Staff Comments
None.
Item 2. Properties
We lease approximately 47,000 square feet of office space in Emeryville, California pursuant to an office facility lease that we initially entered into in 2012 (as amended, the Lease). The term of the Lease extends through March 2023. We do not own or lease any other facilities.
Item 3. Legal Proceedings
Certain lawsuits and claims arising in the ordinary course of business may be filed or pending against us or our affiliates from time to time. In accordance with applicable accounting guidance, we establish accruals for all lawsuits, claims and expected settlements when we believe it is probable that a loss has been incurred and the amount of the loss is reasonably estimable. When a loss contingency is not both probable and reasonably estimable, we do not establish an accrual. Any such loss estimates are inherently uncertain, based on currently available information and are subject to management's judgment and various assumptions. Due to the inherent subjectivity of these estimates and unpredictability of outcomes of legal proceedings, any amounts accrued may not represent the ultimate resolution of such matters.
To the extent we believe any potential loss relating to such lawsuits and claims may have a material impact on our liquidity, consolidated financial position, results of operations, and/or our business as a whole and is reasonably possible but not probable, we disclose information relating to any such potential loss, whether in excess of any established accruals or where there is no established accrual. We also disclose information relating to any material potential loss that is probable but not reasonably estimable. Where reasonably practicable, we will provide an estimate of loss or range of potential loss. No disclosures are generally made for any loss contingencies that are deemed to be remote.
Based on information available to us and our review of lawsuits and claims filed or pending against us to date, we have not recognized a material accrual liability for these matters, nor do we currently expect it is reasonably possible that these matters will result in a material liability to the Company. However, the outcome of litigation and other legal and regulatory matters is inherently uncertain, and it is possible that one or more of such matters currently pending or threatened could have an unanticipated material adverse effect on our liquidity, consolidated financial position, results of operations, and/or our business as a whole, in the future.
Item 4. Mine Safety Disclosures
Not applicable.
44
PART II
Item 5. Market for Registrant's Common Equity, Related Stockholder Matters and Issuer Purchases of Equity Securities
Our common stock is listed on the NASDAQ under the symbol "NMIH." At February 11, 2019, there were
66,427,675
shares of our Class A common stock outstanding and approximately 19 holders of record. There are no shares of our Class B common stock outstanding. The closing price of our common stock on NASDAQ on February 11, 2019 was $22.16.
No dividends on our common stock have previously been declared or paid, and we do not expect to declare or pay dividends in the near future. For information on our ability to pay dividends, see Item 7, "
Management's Discussion and Analysis of Financial Condition and Results of Operations - Holding Company Liquidity and Capital Resources
" and Item 8, "
Financial Statements and Supplementary Data - Notes to Consolidated Financial Statements - Note16, Regulatory Information - Dividend Restrictions.
"
Issuer Purchases of Equity Securities
We did not repurchase any shares of our common stock during 2018.
Common Stock Performance Graph
The following graph compares the cumulative total stockholder return on our Class A common stock from December 31, 2013 until December 31, 2018, with the cumulative total stockholder return on the Russell 2000 Index, S&P Small Cap 600 Index and an index of selected mortgage insurance companies (Peer Index). Consistent with the Russell 2000 Index, NMIH is included in the S&P Small Cap 600 Index, therefore we have added this index to our common stock performance graph. The Peer Index includes Essent, MGIC and Radian. The total stockholder's returns are not necessarily indicative of future returns. Information contained or referenced in the stock performance graph below is being furnished with this report and will not be deemed "filed" for purposes of Section 18 of the Exchange Act or deemed to be incorporated by reference into any filing under the Exchange Act or the Securities Act.
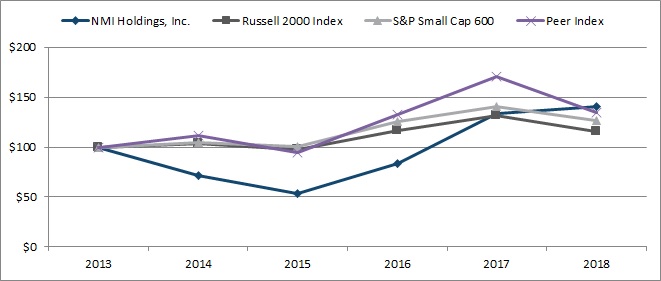
|
12/31/2013
|
12/30/2014
|
12/31/2015
|
12/31/2016
|
12/31/2017
|
12/31/2018
|
|||||||||||||
|
NMI Holdings, Inc.
|
$
|
100
|
|
$
|
72
|
|
$
|
53
|
|
$
|
84
|
|
$
|
134
|
|
$
|
140
|
|
|
Russell 2000 Index
|
100
|
|
104
|
|
98
|
|
117
|
|
132
|
|
116
|
|
||||||
|
S&P Small Cap 600
|
100
|
|
104
|
|
101
|
|
126
|
|
141
|
|
127
|
|
||||||
|
Peer Index (ESNT, MTG, RDN)
|
100
|
|
112
|
|
94
|
|
133
|
|
171
|
|
135
|
|
||||||
45
Item 6. Selected Financial Data
The information in the following table should be read in conjunction with the information included in Item 7
,
"
Management's Discussion and Analysis of Financial Condition and Results of Operations
" and the consolidated financial statements and notes thereto included in Item 8, "
Financial Statements and Supplementary Data.
"
|
For the years ended December 31,
|
|||||||||||||||||||
|
2018
|
2017
|
2016
|
2015
|
2014
|
|||||||||||||||
|
Consolidated statements of operations
|
(In Thousands, except for ratios)
|
||||||||||||||||||
|
Net premiums earned
|
$
|
251,197
|
|
$
|
165,740
|
|
$
|
110,481
|
|
$
|
45,506
|
|
$
|
13,407
|
|
||||
|
Net investment income
|
23,538
|
|
16,273
|
|
13,751
|
|
7,246
|
|
5,618
|
|
|||||||||
|
Net realized investment gains (losses)
|
57
|
|
208
|
|
(693
|
)
|
831
|
|
197
|
|
|||||||||
|
Total revenues
|
275,025
|
|
182,743
|
|
123,815
|
|
53,608
|
|
19,222
|
|
|||||||||
|
Insurance claims & claims expenses
|
5,452
|
|
5,339
|
|
2,392
|
|
650
|
|
83
|
|
|||||||||
|
Underwriting and operating expenses
|
117,236
|
|
106,979
|
|
93,223
|
|
80,599
|
|
73,417
|
|
|||||||||
|
Net income (loss)
|
107,927
|
|
22,050
|
|
64,001
|
|
(27,793
|
)
|
(48,906
|
)
|
|||||||||
|
Basic income (loss) per share
|
1.66
|
|
$
|
0.37
|
|
$
|
1.08
|
|
$
|
(0.47
|
)
|
$
|
(0.84
|
)
|
|||||
|
Weighted average common shares outstanding
|
65,019
|
|
59,816
|
|
59,071
|
|
58,683
|
|
58,281
|
|
|||||||||
|
2018
|
2017
|
2016
|
2015
|
2014
|
|||||||||||||||
|
Consolidated balance sheets
|
(In Thousands, except for ratios)
|
||||||||||||||||||
|
Total investments
|
$
|
911,490
|
|
$
|
715,875
|
|
$
|
628,969
|
|
$
|
559,235
|
|
$
|
336,501
|
|
||||
|
Cash and cash equivalents
|
25,294
|
|
19,196
|
|
47,746
|
|
57,317
|
|
103,021
|
|
|||||||||
|
Total assets
|
1,092,043
|
|
894,848
|
|
839,897
|
|
662,451
|
|
463,265
|
|
|||||||||
|
Term loan
|
146,757
|
|
143,882
|
|
144,353
|
|
143,939
|
|
—
|
|
|||||||||
|
Unearned premiums
|
158,893
|
|
163,166
|
|
152,906
|
|
90,733
|
|
22,069
|
|
|||||||||
|
Reserve for insurance claims and claims expenses
|
12,811
|
|
8,761
|
|
3,001
|
|
679
|
|
83
|
|
|||||||||
|
Shareholders' equity
|
701,500
|
|
509,077
|
|
475,509
|
|
402,731
|
|
426,958
|
|
|||||||||
|
Book value per share
|
$
|
10.58
|
|
$
|
8.41
|
|
$
|
8.04
|
|
$
|
6.85
|
|
$
|
7.31
|
|
||||
|
Selected ratios
|
|||||||||||||||||||
|
Loss ratio
|
2.2
|
%
|
3.2
|
%
|
2.2
|
%
|
1.4
|
%
|
0.6
|
%
|
|||||||||
|
Expense ratio
|
46.7
|
%
|
64.5
|
%
|
84.4
|
%
|
177.1
|
%
|
544.8
|
%
|
|||||||||
|
Combined ratio
|
48.9
|
%
|
67.7
|
%
|
86.6
|
%
|
178.5
|
%
|
545.4
|
%
|
|||||||||
|
Risk-to-capital ratio
|
13.1:1
|
|
13.2:1
|
|
11.6:1
|
|
8.7:1
|
|
3.6:1
|
|
|||||||||
|
Other data
|
|||||||||||||||||||
|
New primary insurance written
|
$
|
27,295,409
|
|
$
|
21,586,880
|
|
$
|
21,189,392
|
|
$
|
12,424,156
|
|
$
|
3,451,354
|
|
||||
|
New primary risk written
|
6,909,005
|
|
5,271,463
|
|
5,085,562
|
|
2,932,035
|
|
775,575
|
|
|||||||||
|
New pool risk written
|
—
|
|
—
|
|
—
|
|
—
|
|
—
|
|
|||||||||
|
Direct primary insurance in force
|
68,550,696
|
|
48,465,157
|
|
32,167,539
|
|
14,823,926
|
|
3,369,664
|
|
|||||||||
|
Direct primary risk in force
|
17,091,385
|
|
11,843,047
|
|
7,790,060
|
|
3,586,462
|
|
801,561
|
|
|||||||||
|
Direct pool risk in force
|
93,090
|
|
93,090
|
|
93,090
|
|
93,090
|
|
93,090
|
|
|||||||||
|
Available Assets
(1)
|
733,762
|
|
527,897
|
|
453,523
|
|
431,411
|
|
—
|
|
|||||||||
|
Net Risk-Based Required Assets
(1)
|
511,268
|
|
446,226
|
|
366,584
|
|
249,805
|
|
—
|
|
|||||||||
|
(1)
|
As reported by NMIC under the PMIERs financial requirements, which took effect as of December 31, 2015.
|
46
Item 7. Management's Discussion and Analysis of Financial Condition and Results of Operations
The following analysis of our financial condition and results of operations should be read in conjunction with our consolidated financial statements and notes thereto included below in Item 8 of this report and the Risk Factors included above in Item 1A of this report. In addition, investors should review the
"
Cautionary Note Regarding Forward Looking Statements
"
above.
Overview
We provide private MI through our wholly owned insurance subsidiaries NMIC and Re One. NMIC and Re One are domiciled in Wisconsin and principally regulated by the Wisconsin OCI. NMIC is our primary insurance subsidiary, and is approved as an MI provider by the GSEs and is licensed to write coverage in all 50 states and D.C. Re One provides reinsurance to NMIC on insured loans with coverage levels in excess of 25% after giving effect to third-party reinsurance. Our subsidiary, NMIS, provides outsourced loan review services to mortgage loan originators.
MI protects lenders and investors from default-related losses on a portion of the unpaid principal balance of a covered mortgage. MI plays a critical role in the U.S. housing market by mitigating mortgage credit risk and facilitating the secondary market sale of high-LTV (
i.e.
above 80%) residential loans to the GSEs, who are otherwise restricted by their charters from purchasing or guaranteeing high-LTV mortgages that are not covered by certain credit protections. Such credit protection and secondary market sales allow lenders to increase their capacity for mortgage commitments and expand financing access to existing and prospective homeowners.
NMIH, a Delaware corporation, was incorporated in May 2011, and we began start-up operations in 2012 and wrote our first MI policy in 2013. Since formation, we have sought to establish customer relationships with a broad group of mortgage lenders and build a diversified, high-quality insured portfolio.
As of December 31, 2018
, we had master policies with
1,374
customers, including national and regional mortgage banks, money center banks, credit unions, community banks, builder-owned mortgage lenders, internet-sourced lenders and other non-bank lenders. We had total IIF of
$71.5
billion and gross RIF of
$17.2 billion
as of
December 31, 2018
, compared to total IIF of
$51.7 billion
and gross RIF of
$11.9 billion
as of
December 31, 2017
, and total IIF of
$35.8 billion
and gross RIF of
$7.9 billion
as of
December 31, 2016
. Included in our total IIF as of
December 31, 2018
,
2017
, and
2016
was
$68.6 billion
,
$48.5 billion
and
$32.2 billion
of primary IIF, respectively.
As of December 31, 2018
, our gross primary RIF was
$17.1 billion
,
compared to
$11.8 billion
and
$7.8 billion
as of
December 31, 2017
and
2016
, respectively.
For the year ended December 31, 2018
, we generated NIW of
$27.3 billion
, compared to
$21.6 billion
and
$21.2 billion
for the years ended
December 31, 2017
and
2016
, respectively.
As of December 31, 2018
, we had
304
full-time employees.
We believe that our success in acquiring a large and diverse group of lender customers and growing a portfolio of high-quality IIF traces to our founding principles, whereby we aim to help qualified individuals achieve the dream of homeownership, ensure that we remain a strong and credible counter-party, deliver a unique customer service experience, establish a differentiated risk management approach that emphasizes the individual underwriting review or validation of the vast majority of the loans we insure, and foster a culture of collaboration and excellence that helps us attract and retain experienced industry leaders.
Our strategy is to continue to build on our position in the private MI market, expand our customer base and grow our insured portfolio of high-quality residential loans by focusing on long-term customer relationships, disciplined and proactive risk selection and pricing, fair and transparent claims payment practices, responsive customer service, financial strength and profitability.
Our common stock trades on the NASDAQ under the symbol "NMIH."
We discuss below our results of operations for the periods presented, as well as the conditions and trends that have impacted or are expected to impact our business and results, including customer development, new insurance writings, the composition of our insurance portfolio, reinsurance among other factors.
47
Conditions and Trends Impacting Our Business
Customer Development
We have important relationships with customers across all categories and allocation profiles, including National Accounts and Regional Accounts, and centralized and decentralized lenders. Our sales and marketing efforts are broadly focused on expanding our presence with existing customers and activating new customer relationships. We consider an activation to be the point at which we have signed a Master Policy, established IT connectivity and generated a first application or first NIW from a customer. During the year ended
December 31, 2018
, we activated
121
lenders, compared to
127
and
173
for the years ended
December 31, 2017
and
December 31, 2016
, respectively. We also continued to expand our business with existing customers, deepening our existing relationships and capturing what we believe to be an increasing portion of their annual MI volume. At
December 31, 2018
, we had
1,374
Master Policies and
1,005
active customer relationships, compared to
1,267
and
841
, respectively, as of
December 31, 2017
and
1,131
and
715
, respectively, as of
December 31, 2016
.
New Insurance Written, Insurance-In-Force and Risk-In-Force
NIW is the aggregate unpaid principal balance of mortgages underpinning new policies written during a given period. Our NIW is affected by the overall size of the mortgage origination market and the volume of high-LTV mortgage originations, which tend to be generated to a greater extent in purchase originations as compared to refinancings. Our NIW is also affected by the percentage of such high-LTV originations covered by private versus government MI or other alternative credit enhancement structures and our share of the private MI market. NIW, together with persistency, drives our IIF. IIF is the aggregate unpaid principal balance of the mortgages we insure, as reported to us by servicers at a given date, and represents the sum total of NIW from all prior periods less principal payments on insured mortgages and policy cancellations (including for prepayment, nonpayment of premiums, coverage rescission and claim payments). RIF is related to IIF and represents the aggregate amount of coverage we provide on all outstanding policies at a given date. RIF is calculated as the sum total of the coverage percentage of each individual policy in our portfolio applied to the unpaid principal balance of such insured mortgage. RIF is affected by IIF and the LTV profile of our insured mortgages, with lower LTV loans generally having a lower coverage percentage and higher LTV loans having a higher coverage percentage. Gross RIF represents RIF before consideration of reinsurance. Net RIF is gross RIF net of ceded reinsurance.
Net Premiums Written and Net Premiums Earned
We set our premium rates on individual policies based on the risk characteristics of the underlying mortgage loans and borrowers, and in accordance with our filed rates and applicable rating rules. On June 4, 2018, we introduced a proprietary risk-based pricing platform, which we refer to as Rate GPS
SM
. Rate GPS considers a broad range of individual variables, including property type, type of loan product, borrower credit characteristics, and lender and market factors, and provides us with the ability to set and charge premium rates commensurate with the underlying risk of each loan that we insure. We introduced Rate GPS in June 2018 to replace our previous rate card pricing system. While we expect most of our new business will be priced through Rate GPS, we also continue to offer a rate card pricing option to a limited number of lender customers who require a rate card for operational reasons. We believe the introduction and utilization of Rate GPS provides us with a more granular and analytical approach to evaluating and pricing risk, and that this approach enhances our ability to continue building a high-quality mortgage insurance portfolio and delivering attractive risk-adjusted returns.
Premiums are generally fixed for the duration of our coverage of the underlying loans. Net premiums written are equal to gross premiums written minus ceded premiums written under our reinsurance arrangements, less premium refunds. As a result, net premiums written are generally influenced by:
|
•
|
NIW;
|
|
•
|
premium rates and the mix of premium payment type, which are either single, monthly or annual premiums, as described below;
|
|
•
|
cancellation rates of our insurance policies, which are impacted by payments or prepayments on mortgages, refinancings (which are affected by prevailing mortgage interest rates as compared to interest rates on loans underpinning our in-force policies), levels of claims payments and home prices; and
|
|
•
|
cession of premiums under third-party reinsurance arrangements.
|
Premiums are paid either by the borrower (BPMI) or the lender (LPMI) in a single payment at origination (single premium), on a monthly installment basis (monthly premium) or on an annual installment basis (annual premium). Our net premiums written will differ from our net premiums earned due to policy payment type. For single premiums, we receive a single premium payment at origination, which is earned over the estimated life of the policy. A majority of our single premium policies in force as of December
48
31, 2018 were non-refundable under most cancellation scenarios. If non-refundable single premium policies are canceled, we immediately recognize the remaining unearned premium balances as earned premium revenue. Monthly premiums are recognized in the month billed and when the coverage is effective. Annual premiums are earned on a straight-line basis over the year of coverage. Substantially all of our policies provide for either single or monthly premiums.
The percentage of IIF that remains on our books after any 12-month period is defined as our persistency rate. Because our insurance premiums are earned over the life of a policy, higher persistency rates can have a significant impact on our net premiums earned and profitability. Generally, faster speeds of mortgage prepayment lead to lower persistency. Prepayment speeds and the relative mix of business between single and monthly premium policies also impact our profitability. Our premium rates include certain assumptions regarding repayment or prepayment speeds of the mortgages underlying our policies. Because premiums are paid at origination on single premium policies and substantially all of our single premium policies are non-refundable on cancellation, assuming all other factors remain constant, if single premium loans are prepaid earlier than expected, our profitability on these loans is likely to increase and, if loans are repaid slower than expected, our profitability on these loans is likely to decrease. By contrast, if monthly premium loans are repaid earlier than anticipated, we do not earn any more premium with respect to those loans and, unless we replace the repaid monthly premium loan with a new loan at the same premium rate or higher, our profitability is likely to decline.
Effect of reinsurance on our results
We utilize third-party reinsurance to actively manage our risk, ensure PMIERs compliance and support the growth of our business. We currently have both quota share and excess-of-loss reinsurance agreements in place, which impact our results of operations and regulatory capital and PMIERs asset positions. Under a quota share reinsurance agreement, the reinsurer receives a premium in exchange for covering an agreed-upon portion of incurred losses. Such a quota share arrangement reduces premiums written and earned and also reduces RIF, providing capital relief to the ceding insurance company and reducing incurred claims in accordance with the terms of the reinsurance agreement. In addition, reinsurers typically pay ceding commissions as part of quota share transactions, which offset the ceding company's acquisition and underwriting expenses. Certain quota share agreements include profit commissions that are earned based on loss performance and serve to reduce ceded premiums. Under an excess-of-loss agreement, the ceding insurer is typically responsible for losses up to an agreed-upon threshold and the reinsurer then provides coverage in excess of such threshold up to a maximum agreed-upon limit. In general, there are no ceding commissions under excess-of-loss reinsurance agreements. We expect to continue to evaluate reinsurance opportunities in the normal course of business.
Quota share reinsurance
Effective September 1, 2016, NMIC entered into the 2016 QSR with a panel of third-party reinsurers. Under the terms of the 2016 QSR Transaction, NMIC ceded premiums written related to (1) 100% of the risk under our pool agreement with Fannie Mae, (2) 25% of the existing risk on eligible policies written as of August 31, 2016 and (3) 25% of the risk on eligible policies written between September 1, 2016 and December 31, 2017, in exchange for reimbursement of ceded claims and claims expenses on covered policies, a 20% ceding commission, and a profit commission of up to 60% that varies directly and inversely with ceded claims.
Effective January 1, 2018, NMIC entered into the 2018 QSR Transaction with a panel of third-party reinsurers. Under the 2018 QSR Transaction, NMIC cedes premiums earned related to 25% of risk on eligible policies written in 2018 and will cede premiums earned related to 20% of risk on eligible policies written in 2019, in exchange for reimbursement of ceded claims and claims expenses on covered policies, a 20% ceding commission, and a profit commission of up to 61% that varies directly and inversely with ceded claims.
Excess-of-loss reinsurance
In May 2017, NMIC secured $211.3 million of aggregate excess-of-loss reinsurance coverage at inception for an existing portfolio of policies written from 2013 through December 31, 2016, through a mortgage insurance-linked notes offering by Oaktown Re. The reinsurance coverage amount under the terms of the 2017 ILN Transaction decreases from $211.3 million at inception over a ten-year period as the underlying covered mortgages are amortized or repaid, and/or the mortgage insurance coverage is canceled and was $131.1 million as of December 31, 2018. For the reinsurance coverage period, NMIC retains the first layer of $126.8 million of aggregate losses, of which $125.2 million remained as of December 31, 2018, and Oaktown Re then provides second layer coverage up to the outstanding reinsurance coverage amount. NMIC then retains losses in excess of the outstanding reinsurance coverage amount.
In July 2018, NMIC secured $264.5 million of aggregate excess-of-loss reinsurance coverage at inception for an existing portfolio of policies written from January 1, 2017 through May 31, 2018, through a mortgage insurance-linked notes offering by Oaktown Re II. The reinsurance coverage amount under the terms of the 2018 ILN Transaction decreases from $264.5 million at inception over a ten-year period as the underlying covered mortgages are amortized or repaid, and/or the mortgage insurance coverage
49
is canceled. The outstanding reinsurance coverage amount will begin amortizing after an initial period in which a target level of credit enhancement is obtained and was $264.5 million as of December 31, 2018. For the reinsurance coverage period, NMIC retains the first layer of $125.3 million of aggregate losses, of which
$125.3 million
remained at December 31, 2018, and Oaktown Re II then provides second layer coverage up to the outstanding reinsurance coverage amount. NMIC then retains losses in excess of the outstanding reinsurance coverage amount.
See, Item 8, "
Financial Statements and Supplementary Data - Notes to Consolidated Financial Statements - Note 6, Reinsurance
" for further discussion of these third-party reinsurance arrangements.
Portfolio Data
The following table presents primary and pool NIW and IIF as of the dates and for the periods indicated. Unless otherwise noted, the tables below do not include the effects of our third-party reinsurance arrangements described above.
|
Primary and pool IIF and NIW
|
As of and for the years ended
|
||||||||||||||||||||||
|
December 31, 2018
|
December 31, 2017
|
December 31, 2016
|
|||||||||||||||||||||
|
IIF
|
NIW
|
IIF
|
NIW
|
IIF
|
NIW
|
||||||||||||||||||
|
(In Millions)
|
|||||||||||||||||||||||
|
Monthly
|
$
|
51,655
|
|
$
|
24,122
|
|
$
|
33,268
|
|
$
|
17,560
|
|
$
|
19,205
|
|
$
|
14,261
|
|
|||||
|
Single
|
16,896
|
|
3,173
|
|
15,197
|
|
4,027
|
|
12,963
|
|
6,928
|
|
|||||||||||
|
Primary
|
68,551
|
|
27,295
|
|
48,465
|
|
21,587
|
|
32,168
|
|
21,189
|
|
|||||||||||
|
Pool
|
2,901
|
|
—
|
|
3,233
|
|
—
|
|
3,650
|
|
—
|
|
|||||||||||
|
Total
|
$
|
71,452
|
|
$
|
27,295
|
|
$
|
51,698
|
|
$
|
21,587
|
|
$
|
35,818
|
|
$
|
21,189
|
|
|||||
For the year ended
December 31, 2018
, primary NIW increased 26%, compared to the year ended
December 31, 2017
, due to growth in our monthly premium policy volume tied to increased penetration of existing customer accounts and new customer account activations, offset slightly by a reduction in our single premium policy production. Overall private MI market NIW increased by approximately 8% from 2017 to 2018. For the year ended December 31, 2017, primary NIW increased 2% compared to the year ended December 31, 2016 as growth in our monthly premium policy volume was offset by a reduction in our single premium policy production tied to actions we initiated in 2017 to reduce the concentration of single policies in our product mix.
For the year ended
December 31, 2018
, monthly premium polices accounted for
88%
of our NIW, compared to
81%
and
67%
for the years ended
December 31, 2017
and
2016
, respectively. As of
December 31, 2018
, monthly premium policies accounted for
75%
of our primary IIF, compared to
69%
at December 31, 2017 and
60%
at December 31, 2016. We expect the break-down of monthly premium policies and single premium policies (which we refer to as "mix") in our primary IIF to continue to trend toward an increased monthly mix over time given the composition of our NIW. Our total IIF at
December 31, 2018
increased 38% compared to
December 31, 2017
, which in turn increased
44%
compared to
December 31, 2016
, primarily due to NIW generated between such measurement dates and the persistency of in force policies.
The following table presents net premiums written and earned for the periods indicated.
|
Primary and pool premiums written and earned
|
For the year ended
|
||||||||||
|
December 31, 2018
|
December 31, 2017
|
December 31, 2016
|
|||||||||
|
(In Thousands)
|
|||||||||||
|
Net premiums written
|
$
|
256,803
|
|
$
|
173,672
|
|
$
|
134,692
|
|
||
|
Net premiums earned
|
251,197
|
|
165,740
|
|
110,481
|
|
|||||
For the year ended
December 31, 2018
, net premiums written and earned increased
48%
and
52%
, respectively, compared to the year ended
December 31, 2017
. The increases in net premiums written and earned are due to the growth of our IIF and increased monthly policy production, partially offset by increased cessions under the QSR Transactions and ILN Transactions, and a decrease in earnings from the cancellation of single premium policies.
50
For the year ended
December 31, 2017
, net premiums written and earned increased
29%
and
50%
, respectively, compared to the year ended
December 31, 2016
. The increase in net premiums written is due to the growth of our IIF and increased monthly policy production, partially offset by a decrease in single premium NIW. The increase in net premiums earned is due to the growth of our IIF and increased monthly policy production, partially offset by decreases in our single premium NIW and earnings from cancellations, and the impact of cessions under the 2017 ILN transaction and 2016 QSR Transaction.
Pool premiums written and earned for the years ended
December 31, 2018
,
2017
and
2016
, were
$3.4 million
,
$3.8 million
and $
4.4 million
, respectively, before giving effect to the 2016 QSR Transaction, under which all of our written and earned pool premiums have been ceded. A portion of our ceded pool premiums written and earned are recouped through profit commission under the 2016 QSR Transaction.
Portfolio Statistics
Unless otherwise noted, the portfolio statistics tables presented below do not include the effects of our third-party reinsurance arrangements described above. The table below highlights trends in our primary portfolio as of the dates and for the periods indicated.
|
Primary portfolio trends
|
As of and for the year ended
|
||||||||||
|
December 31, 2018
|
December 31, 2017
|
December 31, 2016
|
|||||||||
|
($ Values In Millions)
|
|||||||||||
|
New insurance written
|
$
|
27,295
|
|
$
|
21,587
|
|
$
|
21,189
|
|
||
|
Percentage of monthly premium
|
88
|
%
|
81
|
%
|
67
|
%
|
|||||
|
Percentage of single premium
|
12
|
%
|
19
|
%
|
33
|
%
|
|||||
|
New risk written
|
$
|
6,909
|
|
$
|
5,271
|
|
$
|
5,086
|
|
||
|
Insurance in force
(IIF)
(1)
|
68,551
|
|
48,465
|
|
32,168
|
|
|||||
|
Percentage of monthly premium
|
75
|
%
|
69
|
%
|
60
|
%
|
|||||
|
Percentage of single premium
|
25
|
%
|
31
|
%
|
40
|
%
|
|||||
|
Risk in force
(1)
|
$
|
17,091
|
|
$
|
11,843
|
|
$
|
7,790
|
|
||
|
Policies in force (count)
(1)
|
280,825
|
|
202,351
|
|
134,662
|
|
|||||
|
Average loan size
(1)
|
$
|
0.244
|
|
$
|
0.240
|
|
$
|
0.239
|
|
||
|
Average coverage
(2)
|
25
|
%
|
24
|
%
|
24
|
%
|
|||||
|
Loans in default (count)
(1)
|
877
|
|
928
|
|
179
|
|
|||||
|
Percentage of loans in default
|
0.3
|
%
|
0.5
|
%
|
0.1
|
%
|
|||||
|
Risk in force on defaulted loans
(1)
|
$
|
48
|
|
$
|
53
|
|
$
|
10
|
|
||
|
Earnings from cancellations
|
$
|
11
|
|
$
|
15
|
|
$
|
17
|
|
||
|
Annual persistency
(1)
|
87
|
%
|
86
|
%
|
81
|
%
|
|||||
|
(1)
|
Reported as of the end of the period.
|
|
(2)
|
Calculated as end of period RIF divided by IIF.
|
The table below presents a summary of the change in total primary IIF for the dates and periods indicated.
|
Primary IIF
|
As of and for the year ended
|
||||||||||
|
December 31, 2018
|
December 31, 2017
|
December 31, 2016
|
|||||||||
|
(In Millions)
|
|||||||||||
|
IIF, beginning of period
|
$
|
48,465
|
|
$
|
32,168
|
|
$
|
14,824
|
|
||
|
NIW
|
27,295
|
|
21,587
|
|
21,189
|
|
|||||
|
Cancellations and other reductions
|
(7,209
|
)
|
(5,290
|
)
|
(3,845
|
)
|
|||||
|
IIF, end of period
|
$
|
68,551
|
|
$
|
48,465
|
|
$
|
32,168
|
|
||
51
We consider a "book" to be a collective pool of policies insured during a particular period, normally a calendar year. In general, the majority of underwriting profit, calculated as earned premium revenue minus claims and underwriting and operating expenses, generated by a particular book year emerges in the years immediately following origination. This pattern generally occurs because relatively few of the claims that a book will ultimately experience typically occur in the first few years following origination, when premium revenue is highest, while subsequent years are affected by declining premium revenues, as the number of insured loans decreases (primarily due to loan prepayments), and by increasing losses.
The table below reflects a summary of our primary IIF and RIF by book year as of the dates indicated.
|
Primary IIF and RIF
|
As of
|
||||||||||||||||||||||
|
December 31, 2018
|
December 31, 2017
|
December 31, 2016
|
|||||||||||||||||||||
|
IIF
|
RIF
|
IIF
|
RIF
|
IIF
|
RIF
|
||||||||||||||||||
|
(In Millions)
|
|||||||||||||||||||||||
|
2018
|
26,310
|
|
6,664
|
|
—
|
|
—
|
|
—
|
|
—
|
|
|||||||||||
|
2017
|
18,858
|
|
4,627
|
|
20,739
|
|
5,059
|
|
—
|
|
—
|
|
|||||||||||
|
2016
|
15,400
|
|
3,795
|
|
18,066
|
|
4,383
|
|
20,193
|
|
4,850
|
|
|||||||||||
|
2015
|
6,860
|
|
1,723
|
|
8,256
|
|
2,051
|
|
10,071
|
|
2,472
|
|
|||||||||||
|
2014
|
1,093
|
|
275
|
|
1,368
|
|
341
|
|
1,856
|
|
457
|
|
|||||||||||
|
2013
|
30
|
|
7
|
|
36
|
|
9
|
|
48
|
|
11
|
|
|||||||||||
|
Total
|
$
|
68,551
|
|
$
|
17,091
|
|
$
|
48,465
|
|
$
|
11,843
|
|
$
|
32,168
|
|
$
|
7,790
|
|
|||||
We utilize certain risk principles that form the basis of how we underwrite and originate primary NIW. We have established prudential underwriting standards and loan-level eligibility matrices which prescribe the maximum LTV, minimum borrower FICO score, maximum borrower DTI ratio, maximum loan size, property type, loan type, loan term and occupancy status of loans that we will insure, and memorialized these standards and eligibility matrices in our Underwriting Guideline Manual that is publicly available on our website. Our underwriting standards and eligibility criteria are designed to limit the layering of risk in a single insurance policy. "Layered risk" refers to the accumulation of borrower, loan and property risk. For example, we have higher credit score and lower maximum allowed LTV requirements for investor-owned properties, compared to owner-occupied properties. We monitor the concentrations of various risk attributes in our insurance portfolio, which may change over time, in part, as a result of regional conditions or public policy shifts.
The tables below present our primary NIW by FICO, LTV and purchase/refinance mix for the periods indicated. We calculate the LTV of a loan as the percentage of the original loan amount to the original purchase value of the property securing the loan.
|
Primary NIW by FICO
|
For the year ended
|
||||||||||
|
December 31, 2018
|
December 31, 2017
|
December 31, 2016
|
|||||||||
|
(In Millions)
|
|||||||||||
|
>= 760
|
$
|
11,741
|
|
$
|
9,711
|
|
$
|
10,985
|
|
||
|
740-759
|
4,629
|
|
3,332
|
|
3,452
|
|
|||||
|
720-739
|
4,006
|
|
2,833
|
|
2,517
|
|
|||||
|
700-719
|
3,232
|
|
2,539
|
|
2,099
|
|
|||||
|
680-699
|
2,227
|
|
1,699
|
|
1,315
|
|
|||||
|
<=679
|
1,460
|
|
1,473
|
|
821
|
|
|||||
|
Total
|
$
|
27,295
|
|
$
|
21,587
|
|
$
|
21,189
|
|
||
|
Weighted average FICO
|
747
|
|
746
|
|
754
|
|
|||||
52
|
Primary NIW by LTV
|
For the year ended
|
||||||||||
|
December 31, 2018
|
December 31, 2017
|
December 31, 2016
|
|||||||||
|
(In Millions)
|
|||||||||||
|
95.01% and above
|
$
|
3,226
|
|
$
|
2,458
|
|
$
|
1,273
|
|
||
|
90.01% to 95.00%
|
12,658
|
|
9,512
|
|
9,229
|
|
|||||
|
85.01% to 90.00%
|
8,240
|
|
6,242
|
|
6,576
|
|
|||||
|
85.00% and below
|
3,171
|
|
3,375
|
|
4,111
|
|
|||||
|
Total
|
$
|
27,295
|
|
$
|
21,587
|
|
$
|
21,189
|
|
||
|
Weighted average LTV
|
92.2
|
%
|
92.2
|
%
|
91.6
|
%
|
|||||
|
Primary NIW by purchase/refinance mix
|
For the year ended
|
||||||||||
|
December 31, 2018
|
December 31, 2017
|
December 31, 2016
|
|||||||||
|
(In Millions)
|
|||||||||||
|
Purchase
|
$
|
25,210
|
|
$
|
18,627
|
|
$
|
15,293
|
|
||
|
Refinance
|
2,085
|
|
2,960
|
|
5,896
|
|
|||||
|
Total
|
$
|
27,295
|
|
$
|
21,587
|
|
$
|
21,189
|
|
||
The tables below present our total primary IIF and RIF by FICO and LTV and total primary RIF by loan type as of the dates indicated.
|
Primary IIF by FICO
|
As of
|
|||||||||||||||||||
|
December 31, 2018
|
December 31, 2017
|
December 31, 2016
|
||||||||||||||||||
|
($ Values In Millions)
|
||||||||||||||||||||
|
>= 760
|
$
|
31,870
|
|
47
|
%
|
$
|
23,438
|
|
48
|
%
|
$
|
16,166
|
|
50
|
%
|
|||||
|
740-759
|
11,294
|
|
16
|
|
7,781
|
|
16
|
|
5,248
|
|
16
|
|
||||||||
|
720-739
|
9,338
|
|
14
|
|
6,259
|
|
13
|
|
4,130
|
|
13
|
|
||||||||
|
700-719
|
7,574
|
|
11
|
|
5,179
|
|
11
|
|
3,245
|
|
10
|
|
||||||||
|
680-699
|
5,062
|
|
7
|
|
3,408
|
|
7
|
|
2,151
|
|
7
|
|
||||||||
|
<=679
|
3,413
|
|
5
|
|
2,400
|
|
5
|
|
1,228
|
|
4
|
|
||||||||
|
Total
|
$
|
68,551
|
|
100
|
%
|
$
|
48,465
|
|
100
|
%
|
$
|
32,168
|
|
100
|
%
|
|||||
|
Primary RIF by FICO
|
As of
|
|||||||||||||||||||
|
December 31, 2018
|
December 31, 2017
|
December 31, 2016
|
||||||||||||||||||
|
($ Values In Millions)
|
||||||||||||||||||||
|
>= 760
|
$
|
7,955
|
|
47
|
%
|
$
|
5,764
|
|
48
|
%
|
$
|
3,934
|
|
50
|
%
|
|||||
|
740-759
|
2,836
|
|
16
|
|
1,909
|
|
16
|
|
1,281
|
|
16
|
|
||||||||
|
720-739
|
2,341
|
|
14
|
|
1,527
|
|
13
|
|
1,000
|
|
13
|
|
||||||||
|
700-719
|
1,886
|
|
11
|
|
1,256
|
|
11
|
|
782
|
|
10
|
|
||||||||
|
680-699
|
1,256
|
|
7
|
|
821
|
|
7
|
|
511
|
|
7
|
|
||||||||
|
<=679
|
817
|
|
5
|
|
566
|
|
5
|
|
282
|
|
4
|
|
||||||||
|
Total
|
$
|
17,091
|
|
100
|
%
|
$
|
11,843
|
|
100
|
%
|
$
|
7,790
|
|
100
|
%
|
|||||
53
|
Primary IIF by LTV
|
As of
|
|||||||||||||||||||
|
December 31, 2018
|
December 31, 2017
|
December 31, 2016
|
||||||||||||||||||
|
($ Values In Millions)
|
||||||||||||||||||||
|
95.01% and above
|
$
|
6,774
|
|
10
|
%
|
$
|
3,946
|
|
8
|
%
|
$
|
1,686
|
|
5
|
%
|
|||||
|
90.01% to 95.00%
|
31,507
|
|
46
|
|
21,763
|
|
45
|
|
14,358
|
|
45
|
|
||||||||
|
85.01% to 90.00%
|
20,668
|
|
30
|
|
14,766
|
|
30
|
|
10,282
|
|
32
|
|
||||||||
|
85.00% and below
|
9,602
|
|
14
|
|
7,990
|
|
17
|
|
5,842
|
|
18
|
|
||||||||
|
Total
|
$
|
68,551
|
|
100
|
%
|
$
|
48,465
|
|
100
|
%
|
$
|
32,168
|
|
100
|
%
|
|||||
|
Primary RIF by LTV
|
As of
|
|||||||||||||||||||
|
December 31, 2018
|
December 31, 2017
|
December 31, 2016
|
||||||||||||||||||
|
($ Values In Millions)
|
||||||||||||||||||||
|
95.01% and above
|
$
|
1,801
|
|
11
|
%
|
$
|
1,054
|
|
9
|
%
|
$
|
467
|
|
6
|
%
|
|||||
|
90.01% to 95.00%
|
9,185
|
|
54
|
|
6,354
|
|
53
|
|
4,226
|
|
55
|
|
||||||||
|
85.01% to 90.00%
|
4,994
|
|
29
|
|
3,523
|
|
30
|
|
2,439
|
|
31
|
|
||||||||
|
85.00% and below
|
1,111
|
|
6
|
|
912
|
|
8
|
|
658
|
|
8
|
|
||||||||
|
Total
|
$
|
17,091
|
|
100
|
%
|
$
|
11,843
|
|
100
|
%
|
$
|
7,790
|
|
100
|
%
|
|||||
|
Primary RIF by Loan Type
|
As of
|
|||||||
|
December 31, 2018
|
December 31, 2017
|
December 31, 2016
|
||||||
|
Fixed
|
98
|
%
|
98
|
%
|
99
|
%
|
||
|
Adjustable rate mortgages:
|
||||||||
|
Less than five years
|
—
|
|
—
|
|
—
|
|
||
|
Five years and longer
|
2
|
|
.
|
|
1
|
|
||
|
Total
|
100
|
%
|
100
|
%
|
100
|
%
|
||
The table below shows selected primary portfolio statistics, by book year, as of
December 31, 2018
.
|
As of December 31, 2018
|
||||||||||||||||||||||||||||
|
Book year
|
Original Insurance Written
|
Remaining Insurance in Force
|
% Remaining of Original Insurance
|
Policies Ever in Force
|
Number of Policies in Force
|
Number of Loans in Default
|
# of Claims Paid
|
Incurred Loss Ratio (Inception to Date)
(1)
|
Cumulative default rate
(2)
|
|||||||||||||||||||
|
($ Values in Millions)
|
||||||||||||||||||||||||||||
|
2013
|
$
|
162
|
|
$
|
30
|
|
19
|
%
|
655
|
|
161
|
|
—
|
|
1
|
|
0.2
|
%
|
0.2
|
%
|
||||||||
|
2014
|
3,451
|
|
1,093
|
|
32
|
%
|
14,786
|
|
5,709
|
|
51
|
|
28
|
|
3.6
|
%
|
0.5
|
%
|
||||||||||
|
2015
|
12,422
|
|
6,860
|
|
55
|
%
|
52,548
|
|
31,846
|
|
181
|
|
56
|
|
2.7
|
%
|
0.5
|
%
|
||||||||||
|
2016
|
21,187
|
|
15,400
|
|
73
|
%
|
83,626
|
|
64,320
|
|
258
|
|
39
|
|
2.2
|
%
|
0.4
|
%
|
||||||||||
|
2017
|
21,582
|
|
18,858
|
|
87
|
%
|
85,897
|
|
77,617
|
|
293
|
|
6
|
|
2.8
|
%
|
0.3
|
%
|
||||||||||
|
2018
|
27,295
|
|
26,310
|
|
96
|
%
|
104,043
|
|
101,172
|
|
94
|
|
—
|
|
1.3
|
%
|
0.1
|
%
|
||||||||||
|
Total
|
$
|
86,099
|
|
$
|
68,551
|
|
341,555
|
|
280,825
|
|
877
|
|
130
|
|
||||||||||||||
|
(1)
|
The ratio of total claims incurred (paid and reserved) divided by cumulative premiums earned, net of reinsurance.
|
|
(2)
|
The sum of the number of claims paid ever to date and number of loans in default as of the end of the period divided by policies ever in force.
|
54
Geographic Dispersion
The following table shows the distribution by state of our primary RIF as of the periods indicated. As of
December 31, 2018
our RIF continues to be relatively more concentrated in California, primarily as a result of the size of the California mortgage market relative to the rest of the country and the location and timing of our acquisition of new customers. The distribution of our primary RIF as of
December 31, 2018
is not necessarily representative of the geographic distribution we expect in the future.
|
Top 10 primary RIF by state as of December 31, 2018
|
As of
|
|||||||
|
December 31, 2018
|
December 31, 2017
|
December 31, 2016
|
||||||
|
California
|
13.0
|
%
|
13.5
|
%
|
13.6
|
%
|
||
|
Texas
|
8.2
|
|
7.8
|
|
7.0
|
|
||
|
Florida
|
5.0
|
|
4.5
|
|
4.5
|
|
||
|
Arizona
|
4.9
|
|
4.6
|
|
3.9
|
|
||
|
Virginia
|
4.9
|
|
5.3
|
|
6.5
|
|
||
|
Michigan
|
3.6
|
|
3.7
|
|
3.7
|
|
||
|
Pennsylvania
|
3.6
|
|
3.6
|
|
3.6
|
|
||
|
Colorado
|
3.5
|
|
3.6
|
|
3.9
|
|
||
|
Illinois
|
3.4
|
|
3.4
|
|
3.0
|
|
||
|
Maryland
|
3.2
|
|
3.5
|
|
3.7
|
|
||
|
Total
|
53.3
|
%
|
53.5
|
%
|
53.4
|
%
|
||
Insurance Claims and Claims Expenses
Insurance claims and claims expenses incurred represent estimated future payments on newly defaulted insured loans and any change in our claim estimates for previously existing defaults. Claims incurred is generally affected by a variety of factors, including:
|
•
|
future macroeconomic factors, including unemployment rates, which affect the likelihood that borrowers may default on their loans, and rising interest rates, which tend to increase persistency, thereby extending the average life of our insured portfolio and increasing expected future claims;
|
|
•
|
changes in housing values, as such changes may affect loss mitigation opportunities on loans in default, as well as borrowers' behaviors and willingness to default if the values of their homes are below or perceived to be below their mortgage balances;
|
|
•
|
borrowers' FICO scores, with lower FICO scores tending to have higher probabilities of claims;
|
|
•
|
borrowers' DTI ratios, with higher DTI ratios tending to have higher probabilities of claims;
|
|
•
|
LTV ratios, with higher average LTV ratios tending to increase claims incurred;
|
|
•
|
the size of loans insured, with higher average loan amounts tending to increase claims incurred;
|
|
•
|
the percentage of coverage on insured loans, with higher percentages of insurance coverage tending to result in higher incurred claim amounts than lower percentages of insurance coverage;
|
|
•
|
other borrower, property-type and loan level risk characteristics, such as cash-out refinancings, second homes or investment properties;
|
|
•
|
the rate at which we rescind policies, which we expect to be lower for us than recent rescission rates experienced by the private MI industry due to the terms of our Master Policy and generally tighter underwriting standards; and
|
|
•
|
the distribution of claims over the life of a book year.
|
Reserves for claims and allocated claims expenses are established for reported mortgage loan defaults, which we refer to as case reserves, when we are notified that a borrower has missed two or more mortgage payments (
i.e.
, an NOD). We also make estimates of IBNR defaults, which are defaults that have been incurred but have not been reported by loan servicers, based on historical reporting trends, and establish IBNR reserves for those estimates. We also establish reserves for unallocated claims expenses not associated with a specific claim. The claims expenses consist of the estimated cost of the claim administration process, including legal and other fees, as well as other general expenses of administering the claims settlement process
55
Reserves are established by estimating the number of loans in default that will result in a claim payment, which is referred to as claim frequency, and the amount of the claim payment expected to be paid on each such loan in default, which is referred to as claim severity. Claim frequency and severity estimates are established based on historical observed experience regarding certain loan factors, such as age of the default, cure rates, size of the loan and estimated change in property value. Reserves are released the month in which a loan in default is brought current by the borrower, which is referred to as a cure. Adjustments to reserve estimates are reflected in the period in which the adjustment is made. Reserves are also ceded to reinsurers under the QSR Transactions. We will not cede claims to reinsurers under the ILN Transactions unless losses exceed the respective retained coverage layers. Reserves are not established for future claims on insured loans which are not currently in default.
Based on our experience and industry data, we believe that claims incidence for mortgage insurance is generally highest in the third through sixth years after loan origination. As of December 31, 2018, over 85% of our primary IIF related to business written since January 1, 2016. Although the claims experience on our IIF to date has been modest, we expect incurred claims to increase as a greater amount of our existing insured portfolio reaches its anticipated period of highest claim frequency. Additionally, our pool insurance agreement with Fannie Mae contains a claim deductible through which Fannie Mae absorbs specified losses before we are obligated to pay any claims. We have not established any pool reserves for claims or IBNR to date.
The actual claims we incur as our portfolio matures are difficult to predict and depend on the specific characteristics of our current in-force book (including the credit score and DTI of the borrower, the LTV ratio of the mortgage and geographic concentrations, among others), as well as the risk profile of new business we write in the future. In addition, claims experience will be affected by future macroeconomic factors such as housing prices, interest rates, unemployment rates and other events, such as natural disasters. To date, our claims experience is developing at a slower pace than historical trends indicate, as a result of high quality underwriting, a strong macroeconomic environment and a favorable housing market. For additional discussion of our reserves, see Item 8, "
Financial Statements and Supplementary Data - Notes to Consolidated Financial Statements - Note 7, Reserves for Insurance Claims and Claim Expenses
."
We insure mortgages for homes in areas that have been impacted by recent natural disasters. We do not provide coverage for property or casualty claims related to physical damage of a home underpinning an insured mortgage. We experienced an increase in NODs on insured loans in areas impacted by such disasters in the fourth quarter of 2017, the first quarter of 2018 and the fourth quarter of 2018. Our ultimate claims exposure for loans in areas impacted by natural disasters will depend on the number of NODs received, proximate cause of each default, cure rate of the NOD population, and potential repair cost curtailment for appropriate claims on damaged properties as permitted under our Master Policy. Cure rates on loan defaults following natural disasters are influenced by the adequacy of homeowners and other hazard insurance carried on a related property, GSE-sponsored forbearance and other assistance programs, and a borrower's access to aid from government entities and private organizations, in addition to other factors which generally impact cure rates in unaffected areas. In 2018, we experienced higher cure rates on our NOD population in disaster-affected areas as compared to our NOD population in unaffected areas.
56
The following table provides a reconciliation of the beginning and ending reserve balances for primary insurance claims and claims expenses.
|
For the year ended
|
|||||||||||
|
December 31, 2018
|
December 31, 2017
|
December 31, 2016
|
|||||||||
|
(In Thousands)
|
|||||||||||
|
Beginning balance
|
$
|
8,761
|
|
$
|
3,001
|
|
$
|
679
|
|
||
|
Less reinsurance recoverables
(1)
|
(1,902
|
)
|
(297
|
)
|
—
|
|
|||||
|
Beginning balance, net of reinsurance recoverables
|
6,859
|
|
2,704
|
|
679
|
|
|||||
|
Add claims incurred:
|
|||||||||||
|
Claims and claim expenses incurred:
|
|||||||||||
|
Current year
(2)
|
7,860
|
|
6,140
|
|
2,457
|
|
|||||
|
Prior years
(3)
|
(2,408
|
)
|
(801
|
)
|
(65
|
)
|
|||||
|
Total claims and claims expenses incurred
|
5,452
|
|
5,339
|
|
2,392
|
|
|||||
|
Less claims paid:
|
|||||||||||
|
Claims and claim expenses paid:
|
|||||||||||
|
Current year
(2)
|
130
|
|
27
|
|
171
|
|
|||||
|
Prior years
(3)
|
2,371
|
|
1,157
|
|
196
|
|
|||||
|
Total claims and claim expenses paid
|
2,501
|
|
1,184
|
|
367
|
|
|||||
|
Reserve at end of period, net of reinsurance recoverables
|
9,810
|
|
6,859
|
|
2,704
|
|
|||||
|
Add reinsurance recoverables
(1)
|
3,001
|
|
1,902
|
|
297
|
|
|||||
|
Ending balance
|
$
|
12,811
|
|
$
|
8,761
|
|
$
|
3,001
|
|
||
|
(1)
|
Related to ceded losses recoverable on the QSR Transactions, included in "Other Assets" on the Consolidated Balance Sheets. See Item 8, "
Financial Statements and Supplementary Data - Notes to Consolidated Financial Statements - Note 6, Reinsurance,
" for additional information.
|
|
(2)
|
Related to insured loans with their most recent defaults occurring in the current year. For example, if a loan had defaulted in a prior year and subsequently cured and later re-defaulted in the current year, that default would be included in the current year. Amounts are presented net of reinsurance.
|
|
(3)
|
Related to insured loans with defaults occurring in prior years, which have been continuously in default since that time. Amounts are presented net of reinsurance.
|
The "claims incurred" section of the table above shows claims and claim expenses incurred on NODs for current and prior years, including IBNR reserves and is presented net of reinsurance. The amount of claims incurred for current year NODs represents the estimated amount to be ultimately paid on such loans in default. The decreases during the periods presented in reserves held for prior year defaults represent favorable development and are generally the result of NOD cures and ongoing analysis of recent loss development trends. We may increase or decrease our original estimates as we gather additional information about individual defaults and claims, and continue to observe and analyze loss development trends in our portfolio. Gross reserves of
$2.7 million
related to prior year defaults remained as of
December 31, 2018
.
The following table provides a reconciliation of the beginning and ending count of loans in default.
|
For the year ended
|
||||||||
|
December 31, 2018
|
December 31, 2017
|
December 31, 2016
|
||||||
|
Beginning default inventory
|
928
|
|
179
|
|
36
|
|
||
|
Plus: new defaults
|
1,559
|
|
1,262
|
|
284
|
|
||
|
Less: cures
|
(1,521
|
)
|
(486
|
)
|
(132
|
)
|
||
|
Less: claims paid
|
(89
|
)
|
(27
|
)
|
(9
|
)
|
||
|
Ending default inventory
|
877
|
|
928
|
|
179
|
|
||
57
The decrease in the ending default inventory at December 31, 2018 compared to December 31, 2017, primarily relates to cure activity on defaults on insured loans in areas declared by FEMA to be individual assistance disaster zones following Hurricanes Harvey and Irma, and the California wildfires in 2017, and to a lesser extent, cure activity on our non-disaster related NOD population. The impact of this cure activity was partially offset by an increase in new defaults tied to the growth in the number of policies in force, the aging of our earlier book years and, to a more limited extent, default experience in areas declared by FEMA to be individual assistance disaster zones following disasters that we determined to be focal events in 2018. The increase in the ending default inventory at December 31, 2017 compared to December 31, 2016 was primarily due to new defaults on insured loans in areas impacted by natural disasters, as well as the growth in the number of policies in force and aging of our earlier book years
The following table provides details of our claims paid, before giving effect to claims ceded under the 2016 QSR Transaction, for the periods indicated. We did not cede any claims paid under the 2018 QSR Transaction during the periods indicated.
|
For the year ended
|
|||||||||||
|
December 31, 2018
|
December 31, 2017
|
December 31, 2016
|
|||||||||
|
($ Values In Thousands)
|
|||||||||||
|
Number of claims paid
(1)
|
89
|
|
27
|
|
9
|
|
|||||
|
Total amount paid for claims
|
$
|
3,164
|
|
$
|
1,266
|
|
$
|
367
|
|
||
|
Average amount paid per claim
(2)
|
$
|
39
|
|
$
|
47
|
|
$
|
41
|
|
||
|
Severity
(3)
|
72
|
%
|
86
|
%
|
64
|
%
|
|||||
|
(1)
|
Count includes claims settled without payment.
|
|
(2)
|
Calculation is net of claims settled without payment.
|
|
(3)
|
Severity represents the total amount of claims paid including claims expenses divided by the related RIF on the loan at the time the claim is perfected, and is calculated including claims settled without payment.
|
The increase in the number of claims paid for the year ended
December 31, 2018
compared to the years ended
December 31, 2017
and
2016
, was due to the continued growth and seasoning of our insured portfolio. Over time, we expect the severity of claims paid to be between 85% and 95% of the coverage amount.
|
Average reserve per default:
|
As of
|
||||||||||
|
December 31, 2018
|
December 31, 2017
|
December 31, 2016
|
|||||||||
|
(In Thousands)
|
|||||||||||
|
Case
(1)
|
$
|
14
|
|
$
|
8
|
|
$
|
15
|
|
||
|
IBNR
(2)
|
1
|
|
1
|
|
2
|
|
|||||
|
Total
|
$
|
15
|
|
$
|
9
|
|
$
|
17
|
|
||
|
(1)
|
Defined as the gross reserve per insured loan in default.
|
|
(2)
|
Amount includes claims adjustment expenses.
|
The average reserve per default at December 31, 2018 increased from December 31, 2017, primarily due to cure activity on defaults in areas impacted by natural disasters in 2017. We established lower reserves for these NODs than we otherwise do for similarly situated NODs in non-disaster zones. As this default population declined with increased cure activity, the average reserve per remaining default increased. As of
December 31, 2018
,
58
of the
877
loans in default relate to homes in areas declared by FEMA to be individual assistance disaster zones following natural catastrophes that we determine to be focal events, compared to 533 of 928 loans at December 31, 2017. We anticipate that focal disaster-related loans in default will cure at a higher rate than the estimated rate we apply to non-disaster related loans in default, due to our historical and observed industry experience, and current economic indicators and relief programs. As such, we establish lower reserves for these NODs than we otherwise do for our broader NOD population.
Seasonality
Historically, our business has been subject to modest seasonality in both NIW production and default experience. Consistent with the seasonality of home sales, purchase origination volumes typically increase in late spring and peak during the summer months, leading to a rise in NIW volume during the second and third quarters of a given year. Refinancing volume, however, does not follow a set seasonal trend and instead is primarily influenced by mortgage rates. An increase in refinancing volume may limit the seasonal effect of home purchase patterns on mortgage insurance NIW. In addition, while macroeconomic factors in any given period may
58
influence default experience to a greater extent than does seasonality, our industry has typically experienced a fourth quarter seasonal increase in the number of defaults and a first quarter seasonal decline in the number of defaults and increase in the number of cures.
GSE Oversight
As an
approved insurer
, NMIC is subject to ongoing compliance with the PMIERs established by each of the GSEs (i
talicized
terms have the same meaning that such terms have in the PMIERs, as described below). The PMIERs establish operational, business, remedial and financial requirements applicable to
approved insurers
. The PMIERs financial requirements prescribe a risk-based methodology whereby the amount of assets required to be held against each insured loan is determined based on certain loan-level risk characteristics, such as FICO, vintage (year of origination), performing vs. non-performing (
i.e.
, current vs. delinquent), LTV ratio and other risk features. In general, higher quality loans carry lower asset charges.
Under the PMIERs,
approved insurers
must maintain
available assets
that equal or exceed
minimum required assets
, which is an amount equal to the greater of (i)
$400 million
or (ii) a total
risk-based required asset amount
. The
risk-based required asset amount
is a function of the risk profile of an
approved insurer's
RIF, assessed on a loan-by-loan basis and considered against certain risk-based factors derived from tables set out in the PMIERs to gross
RIF,
which is then adjusted on an aggregate basis for reinsurance transactions approved by the GSEs, such as with respect to our ILN Transactions and QSR Transactions. The
risk-based required asset amount
for performing, primary insurance is subject to a floor of
5.6%
of
performing primary adjusted RIF
, and the
risk-based required asset amount
for pool insurance considers both factors in the PMIERs tables and the
net remaining stop loss
for each pool insurance policy.
By April 15th of each year, NMIC must certify it met all PMIERs requirements as of December 31st of the prior year. We certified to the GSEs by April 15, 2018 that NMIC was in full compliance with the PMIERs as of December 31, 2017. NMIC also has an ongoing obligation to immediately notify the GSEs in writing upon discovery of a failure to meet one or more of the PMIERs requirements. We continuously monitor NMIC’s compliance with the PMIERs.
The following table provides a comparison of the PMIERs
available assets
and
risk-based required asset amount
as reported by NMIC as of the dates indicated.
|
As of
|
|||||||||||
|
December 31, 2018
|
December 31, 2017
|
December 31, 2016
|
|||||||||
|
($ values in thousands)
|
|||||||||||
|
Available Assets
|
$
|
733,762
|
|
$
|
527,897
|
|
$
|
453,523
|
|
||
|
Risk-Based Required Asset Amount
|
511,268
|
|
446,226
|
|
366,584
|
|
|||||
Available assets
were
$734 million
at
December 31, 2018
, compared to
$528 million
at
December 31, 2017
and
$454 million
at
December 31, 2016
. The increase in
available assets
of
$206 million
at
December 31, 2018
compared to December 31, 2017 was driven by positive cash flow from operations and a $70 million capital contribution from NMIH to NMIC during the second quarter of 2018. The increase in
available assets
of
$74 million
at
December 31, 2017
compared to December 31, 2016 was driven by positive cash flow from operations and the amortization of unearned premium reserves during the period. The increase in the
risk-based required asset amount
at each measurement date was due to the growth of our gross RIF, partially offset by the increased cession of risk under our third-party reinsurance agreements.
On September 27, 2018, the GSEs published revised PMIERs that will take effect and become applicable to NMIC on March 31, 2019. We expect that NMIC will remain in full compliance with the existing and revised PMIERs, as applicable, prior to and after March 31, 2019.
Cybersecurity
As a participant in the mortgage lending and MI industries, we rely on e-commerce and other technologies to provide and expand our products and services. We have established and implemented security measures, controls and procedures to safeguard our IT systems and to prevent and detect unauthorized access to such systems and any data processed and/or stored in such systems. We periodically employ third parties to evaluate and test the adequacy of such systems, controls and procedures. In addition, we have established a business continuity plan that is designed to allow our business to continue to operate in the midst of certain disruptive events, including any disruptions to our IT systems. We also have an incident response plan that is designed to address
59
information security incidents, including breaches of our IT systems. Despite these safeguards, disruptions to and breaches of our IT systems are possible and may negatively impact our business.
We maintain cyber errors and omissions coverage to limit our exposure if an incident occurs. This insurance provides coverage for (i) claims related to, among other things, unauthorized network or computer access, unintentional disclosure or misuse of personally identifiable information in our possession, unintentional failure to disclose a breach and (ii) certain costs related to privacy notification, crisis management, cyber extortion, data recovery, business interruption and reputational harm.
Capital Position of Our Insurance Subsidiaries and Financial Strength Ratings
In addition to GSE-imposed asset requirements, NMIC is also subject to state regulatory minimum capital requirements based on its RIF. While formulations of this minimum capital may vary by jurisdiction, the most common measure allows for a maximum permitted RTC ratio of 25:1.
As of
December 31, 2018
, NMIC's performing primary RIF, net of reinsurance, was approximately
$10.0
billion. NMIC ceded 100% of its pool RIF pursuant to the 2016 QSR Transaction. Based on NMIC's total statutory capital of
$729 million
(including contingency reserves) as of
December 31, 2018
, NMIC's RTC ratio was
13.7:1
. Re One had total statutory capital of
$35 million
as of
December 31, 2018
, with a RTC ratio of
1.0:1
. We continuously monitor our compliance with state capital requirements.
In May 2018, Moody's upgraded its financial strength rating from "Ba1" to "Baa3" for NMIC and issued a "Ba3" rating for NMIH's $150 million senior secured 2018 Term Loan, compared to its previous "B1" rating on the 2015 Term Loan. In August 2018, Moody's assigned a "Ba3" rating to our
2
018 Revolving Credit Facility. The outlook for Moody's ratings is stable. In July 2018, S&P affirmed its "BBB-" financial strength and long-term counter-party credit ratings on NMIC and its "BB-" long-term counter-party credit rating on NMIH. The outlook on S&P's ratings is positive.
Competition
The MI industry is highly competitive and currently consists of six private mortgage insurers, including NMIC, as well as the government MIs. Private MI companies compete based on service, customer relationships, underwriting and other factors, including price. See Item 1,
"Business - Overview of Residential Mortgage Finance and the Role of the Private MI Industry in the Current Operating Environment - Competition,"
above. We expect the MI market to remain competitive, with pressure for industry participants to grow or maintain their market share.
The private MI industry overall competes more broadly with government MIs who significantly increased their presence in the MI market following the financial crisis. Although there has been broad policy consensus toward the need for private capital to play a larger role and government credit risk to be reduced in the U.S. housing finance system, it remains difficult to predict whether the combined market share of government MIs will recede to historical levels. A range of factors influence a lender's decision to choose private over government MI, including among others, premium rates and other charges, loan eligibility requirements, cancelability, loan size limits and the relative ease of use of private MI products compared to government MI alternatives.
60
Consolidated Results of Operations
|
Consolidated statements of operations
|
For the year ended December 31,
|
||||||||||
|
2018
|
2017
|
2016
|
|||||||||
|
Revenues
|
(In Thousands, except for share data)
|
||||||||||
|
Net premiums earned
|
$
|
251,197
|
|
$
|
165,740
|
|
$
|
110,481
|
|
||
|
Net investment income
|
23,538
|
|
16,273
|
|
13,751
|
|
|||||
|
Net realized investment gains (losses)
|
57
|
|
208
|
|
(693
|
)
|
|||||
|
Other revenues
|
233
|
|
522
|
|
276
|
|
|||||
|
Total revenues
|
275,025
|
|
182,743
|
|
123,815
|
|
|||||
|
Expenses
|
|||||||||||
|
Insurance claims and claims expenses
|
5,452
|
|
5,339
|
|
2,392
|
|
|||||
|
Underwriting and operating expenses
|
117,236
|
|
106,979
|
|
93,223
|
|
|||||
|
Total expenses
|
122,688
|
|
112,318
|
|
95,615
|
|
|||||
|
Other expense
|
|||||||||||
|
Loss from change in fair value of warrant liability
|
(1,397
|
)
|
(4,105
|
)
|
(1,900
|
)
|
|||||
|
Interest expense
|
(14,979
|
)
|
(13,528
|
)
|
(14,848
|
)
|
|||||
|
Income before income taxes
|
135,961
|
|
52,792
|
|
11,452
|
|
|||||
|
Income tax expense (benefit)
|
28,034
|
|
30,742
|
|
(52,549
|
)
|
|||||
|
Net income
|
$
|
107,927
|
|
$
|
22,050
|
|
$
|
64,001
|
|
||
|
Diluted EPS
|
$
|
1.60
|
|
$
|
0.35
|
|
$
|
1.05
|
|
||
|
Loss ratio
(1)
|
2.2
|
%
|
3.2
|
%
|
2.2
|
%
|
|||||
|
Expense ratio
(2)
|
46.7
|
%
|
64.5
|
%
|
84.4
|
%
|
|||||
|
Combined ratio
|
48.9
|
%
|
67.7
|
%
|
86.6
|
%
|
|||||
|
(1)
|
Loss ratio is calculated by dividing the provision for insurance claims and claims expenses by net premiums earned.
|
|
(2)
|
Expense ratio is calculated by dividing other underwriting and operating expenses by net premiums earned.
|
Revenues
For
the year ended
December 31, 2018
, net premiums earned totaled
$251.2 million
compared to $165.7 million for
the year ended
December 31, 2017
and
$110.5 million
for
the year ended
December 31, 2016
. The increase of net premiums earned of
$85.5 million
in 2018 was primarily due to the growth of our IIF and increased monthly policy production, partially offset by a decrease in earnings from cancellations and increases in cessions under the QSR Transactions and ILN Transactions. The
$55.2 million
increase in net premiums earned in 2017 was primarily due to the growth of our IIF and increased monthly policy production, partially offset by a decrease in earnings from cancellations and the impact of cessions under the 2017 ILN transaction and 2016 QSR Transaction.
For the
year ended December 31, 2018
, net investment income was
$23.5 million
compared to
$16.3 million
for the
year ended December 31, 2017
and $13.8 million for the year ended
December 31, 2016
. The increase in both periods was due to an increase in the size of and improved yields on our total investment portfolio.
61
Expenses
We recognize insurance claims and claims expenses in connection with the loss experience of our insured portfolio and incur other underwriting and operating expenses, including employee compensation and benefits, policy acquisition costs, and technology, professional services and facilities expenses, in connection with the development and operation of our business.
For
the year ended
December 31, 2018
, insurance claims and claims expenses were
$5.5 million
compared to $5.3 million for
the year ended
December 31, 2017
and $2.4 million for
the year ended
December 31, 2016
. Insurance claims and claims expenses increased $0.2 million in 2018, primarily due to an increase in our average reserve per default tied to the aging of our NOD population and composition of our default inventory between loans in disaster and non-disaster impacted areas, largely offset by a reduction in the total number of NODs and related release of prior year reserves on cured defaults. Insurance claims and claims expenses increased
$2.9 million
in 2017, as a result of an increase in NODs tied to new defaults on insured loans in areas impacted by natural disasters, as well as an increase in the overall number of policies in our portfolio and aging of earlier book years, offset by the partial release of reserves related to prior year defaults.
Underwriting and operating expenses were
$117.2 million
for
the year ended
December 31, 2018
, compared to
$107.0 million
and
$93.2 million
for the years ended December 31,
2017
and
2016
, respectively. Employee compensation accounts for the majority of our operating expenses, which increased to support the growth of our business. In addition, certain variable expenses, such as underwriting costs and premium taxes, increased due to the growth in our NIW and IIF. Growth in underwriting and operating expenses in 2018 was partially offset, by increased ceding commissions under the QSR Transactions and a decrease in transaction-related expenses incurred in 2018 as compared to those incurred in 2017. We incurred $2.7 million of expenses in 2018 in connection with the 2018 ILN Transaction, compared to
$4.9 million
of expenses incurred in 2017 related to the 2017 ILN Transaction and amendment of our 2015 Credit Agreement.
Interest expense was
$15.0 million
, $13.5 million and $14.8 million for the years ended
December 31, 2018
,
2017
and
2016
, respectively. Interest expense increased in 2018 compared to 2017 due in part to $2.2 million of costs incurred with the extinguishment of the 2015 Term Loan and issuance of the 2018 Term Loan, as well as interest expense incurred following the inception of the 2018 Revolving Credit Facility and a rise in the underlying LIBOR rate during 2018. The increase was partially offset by the reduction in interest spread payable on the 2018 Term Loan compared to the 2015 Term Loan. Interest expense declined in 2017 compared to 2016 in connection with the amendment of our 2015 Credit Agreement completed in February 2017, which among other items, reduced the interest spread payable on the 2015 Term Loan. The interest expense reduction was partially offset by a rise in the underlying LIBOR rate during 2017. See Item 8, "
Financial Statements and Supplementary Data - Notes to Consolidated Financial Statements - Note 5, Debt.
"
Income tax expense was
$28.0 million
for the year ended
December 31, 2018
compared to income tax expense of $30.7 million for the year ended
December 31, 2017
and income tax benefit of $52.5 million for the year ended
December 31, 2016
. The decrease in income tax expense for the year ended
December 31, 2018
relates to the TCJA. The TCJA, which took effect on December 22, 2017, lowered the statutory U.S. federal corporate income tax rate to 21% from 35%. As a U.S. taxpayer, our 2018 income tax expense benefited from the 21% federal corporate income tax rate as compared to the 35% rate applicable for all prior years through December 31, 2017. Additionally, our 2017 tax expense reflects a $13.6 million one-time non-cash charge related to the re-measurement of net deferred tax assets in connection with the enactment of the TCJA. For the year ended
December 31, 2016
, we recorded a one-time non-cash benefit of $58.5 million related to the release of the valuation allowance recorded against our federal and certain state net deferred tax assets. For further information regarding income taxes and their impact on our results of operations and financial position, see Item 8,
"Financial Statements and Supplementary Data - Notes to Consolidated Financial Statements - Note 11, Income Taxes."
Net Income
Net income was $107.9 million for the year ended December 31, 2018, compared to $22.1 million and $64.0 million for the years ended December 31, 2017 and 2016, respectively. The increase in net income in 2018 compared to 2017 primarily relates to growth in total revenues, partially offset by an increase in total expenses. The decline in net income in 2017 compared to 2016 primarily relates to one-time non-cash tax items that impacted each period. 2017 net income reflects a $13.6 million one-time non-cash tax charge, compared to a $58.5 million one-time non-cash benefit realized in 2016. Partially offsetting the tax impact was growth in total revenues in 2017.
Diluted EPS was $1.60, $0.35 and $1.05 for the years ended December 31, 2018, 2017 and 2016, respectively. Diluted EPS increased compared to 2017 due to the growth in net income, partially offset by an increase in weighted average diluted shares outstanding primarily driven by our common stock offering in March 2018.
62
Consolidated balance sheets
|
Consolidated balance sheets
|
December 31, 2018
|
December 31, 2017
|
|||||
|
(In Thousands)
|
|||||||
|
Total investment portfolio
|
$
|
911,490
|
|
$
|
715,875
|
|
|
|
Cash and cash equivalents
|
25,294
|
|
19,196
|
|
|||
|
Premiums receivable
|
36,007
|
|
25,179
|
|
|||
|
Deferred policy acquisition costs, net
|
46,840
|
|
37,925
|
|
|||
|
Software and equipment, net
|
24,765
|
|
22,802
|
|
|||
|
Prepaid reinsurance premiums
|
30,370
|
|
40,250
|
|
|||
|
Deferred tax asset, net
|
—
|
|
19,929
|
|
|||
|
Other assets
|
17,277
|
|
13,692
|
|
|||
|
Total assets
|
$
|
1,092,043
|
|
$
|
894,848
|
|
|
|
Term loan
|
$
|
146,757
|
|
$
|
143,882
|
|
|
|
Unearned premiums
|
158,893
|
|
163,166
|
|
|||
|
Accounts payable and accrued expenses
|
31,141
|
|
23,364
|
|
|||
|
Reserve for insurance claims and claim expenses
|
12,811
|
|
8,761
|
|
|||
|
Reinsurance funds withheld
|
27,114
|
|
34,102
|
|
|||
|
Deferred ceding commission
|
3,791
|
|
5,024
|
|
|||
|
Warrant liability
|
7,296
|
|
7,472
|
|
|||
|
Deferred tax liability, net
|
2,740
|
|
—
|
|
|||
|
Total liabilities
|
390,543
|
|
385,771
|
|
|||
|
Total shareholders' equity
|
701,500
|
|
509,077
|
|
|||
|
Total liabilities and shareholders' equity
|
$
|
1,092,043
|
|
$
|
894,848
|
|
|
As of
December 31, 2018
, we had
$936.8 million
in cash and investments, including
$64.3 million
held at NMIH. The increase in cash and cash equivalents and investments from December 31, 2017 primarily relates to cash generated from operations and
$79.2 million
of net proceeds raised from the common stock offering we completed in March 2018.
Net deferred policy acquisition costs (DAC) were
$46.8 million
as of
December 31, 2018
, compared to
$37.9 million
as of
December 31, 2017
. The increase was primarily driven by growth in the number of policies written during the year ended December 31, 2018 and the deferral of certain costs associated with the origination of those policies, partially offset by the amortization of previously deferred acquisition costs.
Premiums receivable increased to
$36.0 million
as of
December 31, 2018
, compared to
$25.2 million
as of
December 31, 2017
due to the increase in our monthly premium policies in force, where premiums are generally paid one month in arrears.
Prepaid reinsurance premiums were
$30.4 million
as of
December 31, 2018
, compared to
$40.3 million
as of December 31, 2017. Prepaid reinsurance premiums represent the unearned premiums reserve on single premium policies ceded under the 2016 QSR Transaction. The reinsurance coverage period of the 2016 QSR Transaction ended for new business written after December 31, 2017 and the coverage period for the 2018 QSR Transaction began for new business written on or after January 1, 2018. Under the 2018 QSR Transaction we cede premiums on singles policies on an earned basis, and consequently, we did not cede any unearned premiums reserve on singles policies in 2018. The decrease in prepaid reinsurance premiums reflects the amortization of the unearned premiums reserve on singles policies previously ceded under the 2016 QSR Transaction.
At December 31, 2018, we had net deferred tax liabilities of $2.7 million compared to net deferred tax assets of
$19.9 million
at
December 31, 2017
due to the utilization of net operating loss carryforwards and claimed deductibility of our statutory contingency reserve in 2018. Our ability to claim a contingency reserve deduction in prior periods was restricted by our taxable income profile. For further information regarding income taxes and their impact on our results of operations and financial position, see Item 8,
"Financial Statements and Supplementary Data - Notes to Consolidated Financial Statements - Note 11, Income Taxes."
63
Unearned premiums de
creased
$4.3 million
to
$158.9 million
as of
December 31, 2018
, primarily due to the amortization of existing unearned premiums through earnings in accordance with the expiration of risk on related single premium policies and the cancellation of other single premium policies, partially offset by single premium policy originations in 2018.
Reserve for insurance claims and claims expenses increased
$4.1 million
to
$12.8 million
at
December 31, 2018
, primarily due to the aging of existing defaults in our insured portfolio, offset by the release of reserves on cured defaults and claims paid during the period. See "
- Insurance Claims and Claims Expenses
," above
for further details.
Reinsurance funds withheld was
$27.1 million
as of
December 31, 2018
, representing the net of our ceded reinsurance premiums written, less our profit and ceding commission receivables related to the 2016 QSR Transaction. The decrease in reinsurance funds withheld of
$7.0 million
from
December 31, 2017
, was a result of a decline in ceded premiums written on single premium policies, due to the end of the reinsurance coverage period for new business under the 2016 QSR Transaction at December 31, 2017. See, Item 8, "
Financial Statements and Supplementary Data - Notes to Consolidated Financial Statements - Note 6, Reinsurance
."
Warrant liability decreased to
$7.3 million
at
December 31, 2018
, compared to
$7.5 million
at
December 31, 2017
primarily due to exercises of outstanding warrants. This was partially offset by an increase in fair value of the warrant liability due to an increase in our stock price in 2018 and changes in the Black-Scholes model inputs. For further information regarding the valuation of our warrant liability and its impact on our results of operations and financial position, see Item 8, "
Financial Statements and Supplementary Data - Notes to Consolidated Financial Statements - Note 4, Fair Value of Financial Instruments.
"
The following table summarizes our consolidated cash flows from operating, investing and financing activities:
|
Consolidated cash flows
|
For the years ended December 31,
|
||||||||||
|
2018
|
2017
|
2016
|
|||||||||
|
Net cash provided by (used in):
|
(In Thousands)
|
||||||||||
|
Operating activities
|
$
|
145,861
|
|
$
|
67,763
|
|
$
|
71,944
|
|
||
|
Investing activities
|
(220,650
|
)
|
(93,072
|
)
|
(79,792
|
)
|
|||||
|
Financing activities
|
80,887
|
|
(3,241
|
)
|
(1,723
|
)
|
|||||
|
Net increase (decrease) in cash and cash equivalents
|
$
|
6,098
|
|
$
|
(28,550
|
)
|
$
|
(9,571
|
)
|
||
Net cash provided by operating activities was
$145.9 million
for the
year ended
December 31, 2018
, compared to $67.8 million for the year ended December 31,
2017
, and $71.9 million for the year ended
December 31, 2016
. The increase in cash generated from operating activities in
2018
compared to
2017
was primarily driven by growth in premiums written and investment income, partially offset by an increase in operating expenses and growth in claims paid tied to the growth and aging of our insured portfolio. The decrease in cash generated from operating activities in
2017
compared to
2016
was primarily caused by increased operating expenses in connection with employee compensation and benefits costs and higher claims paid, offset by growth in premiums written.
Cash used in investing activities for the periods presented was driven by the purchase of fixed and short-term maturities during those periods. Cash used in investing activities during 2018, reflects, in part, the investment of net proceeds raised in the common stock offering we completed in March 2018.
Cash provided by financing activities was
$80.9 million
for the
year ended
December 31, 2018
and relates to the
$79.2 million
of net cash proceeds raised in the common stock offering we completed in March 2018, as well as additional cash received in connection with the exercise of vested stock options and warrants, partially offset by net cash paid in connection with the extinguishment of the 2015 Term Loan and establishment of the 2018 Term Loan and 2018 Revolving Credit Facility. Cash used in financing activities was $3.2 million and $1.7 million for the years ended December 31, 2017 and 2016, respectively, and primarily relates to taxes paid on the net share settlement of equity awards for certain employees.
Holding Company Liquidity and Capital Resources
NMIH serves as the holding company for our insurance subsidiaries and does not have any significant operations of its own. NMIH's principal liquidity demands include funds for: (i) payment of certain corporate expenses; (ii) payment of certain reimbursable expenses of its insurance subsidiaries; (iii) payment of principal and interest related to the 2018 Term Loan and 2018 Revolving Credit Facility; (iv) tax payments to the Internal Revenue Service; (v) capital support for its subsidiaries; and (vi) payment of dividends, if any, on its common stock. NMIH is not subject to any limitations on its ability to pay dividends except those generally applicable to corporations that are incorporated in Delaware. Delaware law provides that dividends are only payable out of a corporation's surplus or recent net profits (subject to certain limitations).
64
As of
December 31, 2018
, NMIH had
$64.3 million
of cash and investments. NMIH's principal source of net cash is investment income. NMIH also has access to $85 million of undrawn revolving credit capacity under the 2018 Revolving Credit Facility and $2.7 million of ordinary course dividend capacity from Re One. In the future, NMIH could benefit from dividend capacity from NMIC, as available and permitted under law and by the GSEs.
In March 2018, NMIH completed the sale of 4.3 million shares of common stock, including the exercise of a 15% overallotment option to purchase additional shares, and raised proceeds of approximately
$79.2 million
, net of underwriting discounts, commissions and other direct offering expenses. In April 2018, NMIH made a capital contribution of $70 million to NMIC.
NMIH has entered into tax and expense-sharing agreements with its subsidiaries which have been approved by the Wisconsin OCI, but such approval may be changed or revoked at any time. With the Wisconsin OCI's approval, NMIH began allocating the interest expense on the 2015 Term Loan to NMIC in the first quarter of 2017, consistent with the benefits NMIC received when NMIH contributed the loan proceeds to NMIC. NMIH received similar approval from the Wisconsin OCI to allocate interest expense to NMIC on the 2018 Term Loan and 2018 Revolving Credit Facility.
NMIC and Re One's ability to pay dividends to NMIH is subject to insurance department notice or approval. Under Wisconsin law, NMIC and Re One may pay dividends up to specified levels (
i.e.
, "ordinary" dividends) with 30 days' prior notice to the Wisconsin OCI. Dividends in larger amounts, or "extraordinary" dividends, are subject to the Wisconsin OCI's prior approval. Under Wisconsin insurance laws, an extraordinary dividend is defined as any payment or distribution that together with other dividends and distributions made within the preceding 12 months exceeds the lesser of (i) 10% of the insurer's statutory policyholders' surplus as of the preceding December 31 or (ii) adjusted statutory net income for the 12-month period ending the preceding December 31.
NMIC has never paid any dividends to NMIH. NMIC reported a statutory net
loss
for the 12 month period ending December 31, 2018 and cannot pay any dividends to NMIH through December 31, 2019 without the prior approval of the Wisconsin OCI. Re One has never paid dividends to NMIH. Re One has capacity to pay ordinary dividends of up to
$2.7 million
to NMIH December 31, 2019. Certain other states in which NMIC and Re One are licensed also have statutes or regulations that may restrict their ability to pay dividends.
As an
approved insurer
under PMIERs, NMIC would be subject to additional restrictions on its ability to pay dividends to NMIH if it failed to meet the financial requirements prescribed by PMIERs.
Approved insurers
that fail to meet the PMIERs financial requirements are not permitted to pay dividends without prior approval of the GSEs.
NMIC's capital needs depend on many factors including its ability to successfully write new business, establish premium rates at levels sufficient to cover claims and operating costs, and meet
minimum required asset
thresholds under the PMIERs and minimum state capital requirements. NMIC's capital needs also depend on its decision to access the reinsurance markets. NMIH may require liquidity to fund the capital needs of its insurance subsidiaries.
In May 2018, NMIH entered into the 2018 Credit Agreement covering the 2018 Term Loan and 2018 Revolving Credit Facility. The 2018 Term Loan bears interest at the Eurodollar Rate, as defined in the 2018 Credit Agreement and subject to a
1.00%
floor, plus an annual margin rate of
4.75%
, payable monthly based on our current interest period election. Borrowings under the 2018 Revolving Credit Facility will accrue interest at a variable rate equal to, at our discretion, (i) a base rate (as defined in the 2018 Credit Agreement, subject to a floor of 1.00% per annum) plus a margin of 1.00% to 2.50% per annum, based on the applicable corporate credit rating at the time, or (ii) the Eurodollar Rate (subject to a floor of 0.00% per annum) plus a margin of 2.00% to 3.50% per annum, based on the applicable corporate credit rating at the time. The 2018 Revolving Credit Facility also requires a quarterly commitment fee on the average daily undrawn amount ranging from 0.30% to 0.60%, based on the applicable corporate credit rating at the time.
We are subject to certain covenants under the 2018 Term Loan and 2018 Revolving Credit Facility. Under the 2018 Term Loan (and as defined in the 2018 Credit Agreement), we are subject a maximum debt-to-total capitalization ratio of 35%. Under the 2018 Revolving Credit Facility (and as defined in the 2018 Credit Agreement), we are subject to a maximum debt-to-total capitalization ratio of 35%, a minimum liquidity requirement, compliance with the PMIERs financial requirements (subject to any GSE-approved waivers), and minimum consolidated net worth and statutory capital requirements. We were in compliance with all covenants as of December 31, 2018.
Consolidated Investment Portfolio
Our primary objectives with respect to our investment portfolio are to preserve capital and generate investment income, while maintaining sufficient liquidity to cover our operating needs. We aim to achieve diversification by type, quality, maturity, and industry. We have adopted an investment policy that defines, among other things, eligible and ineligible investments, concentration limits for asset types, industry sectors, single issuers, and certain credit ratings, and benchmarks for asset duration.
65
Our investment portfolio consists of fixed maturity instruments. As of
December 31, 2018
, the fair value of our investment portfolio was
$911.5 million
. We also had an additional
$25.3 million
of cash and equivalents as of
December 31, 2018
. Pre-tax book yield on the investment portfolio for the year ended
December 31, 2018
was
2.9%
. The book yield is calculated as period-to-date net investment income divided by average amortized cost of the investment portfolio. Yield on the investment portfolio is likely to change over time based on movements in interest rates, credit spreads, the duration or mix of our investment portfolio and other factors.
The following tables present a breakdown of our investment portfolio and cash and cash equivalents by investment type and credit rating:
|
Percentage of portfolio's fair value
|
December 31, 2018
|
December 31, 2017
|
|||
|
Corporate debt securities
|
58
|
%
|
59
|
%
|
|
|
Asset-backed securities
|
18
|
|
14
|
|
|
|
Municipal debt securities
|
10
|
|
12
|
|
|
|
Cash, cash equivalents, and short-term investments
|
9
|
|
6
|
|
|
|
U.S. treasury securities and obligations of U.S. government agencies
|
5
|
|
9
|
|
|
|
Total
|
100
|
%
|
100
|
%
|
|
|
Investment portfolio ratings at fair value
(1)
|
December 31, 2018
|
December 31, 2017
|
|||
|
AAA
|
22
|
%
|
21
|
%
|
|
|
AA
(2)
|
18
|
|
19
|
|
|
|
A
(2)
|
42
|
|
46
|
|
|
|
BBB
(2)
|
18
|
|
14
|
|
|
|
BB
(3)
|
—
|
|
—
|
|
|
|
Total
|
100
|
%
|
100
|
%
|
|
|
(1)
|
Excluding certain operating cash accounts.
|
|
(2)
|
Includes +/– ratings.
|
|
(3)
|
We held one security with a BB rating at December 31, 2018, which is not identifiable in the table due to rounding.
|
Our investments are rated by one or more nationally recognized statistical rating organizations. If multiple ratings are available, we assign the middle rating for classification purposes, otherwise we assign the lowest rating.
Other-than-Temporary Impairment (OTTI)
As of
December 31, 2018
, 2017 and 2016, we held no other-than-temporarily impaired securities. For the years ended December 31, 2018 and 2016 we did not recognize any OTTI losses. For the year ended December 31, 2017, we recognized
$0.1 million
of OTTI losses in earnings. There were no credit losses recognized in earnings for which a portion of an OTTI loss was recognized in accumulated other comprehensive income (loss) for any period presented.
Taxes
We are a U.S. taxpayer and are subject to a statutory U.S. federal corporate income tax rate of
21%
. Our holding company files a consolidated U.S. federal and various state income tax returns on behalf of itself and its subsidiaries. Prior to the enactment of the TCJA on December 22, 2017, we were subject to a statutory U.S. federal corporate income tax rate of 35% for all prior years through December 31, 2017.
In December of 2017, the SEC issued Staff Accounting Bulletin No. 118 (SAB 118) which provided a one-year measurement period from December 22, 2017, the enactment date of the TCJA, to allow the registrant sufficient time to obtain, prepare and analyze information to complete the accounting required under Accounting Standards Codification (ASC) 740. We completed our full assessment of the tax effects of the enactment of the TCJA as of December 22, 2018. The impact of our final assessment as compared to the provisional amount recorded at December, 31, 2017 was immaterial.
Our effective income tax rate on pre-tax income was
20.6%
for the year ended
December 31, 2018
. Our effective income tax rate on pre-tax income was
58.2%
and (459.0)% for the years ended December 31,
2017
and
2016
, respectively. The difference between our statutory tax rate and our effective tax rate for the year ended December 31, 2018 was primarily due to a tax benefit of $3.1 million from excess share-based compensation for vested RSUs and exercised stock options. The difference between our statutory
66
tax rate and our effective tax rate for the year ended December 31, 2017 was primarily due to a tax expense of $13.6 million associated with the enactment of the TCJA, partially offset by a tax benefit of $3.3 million from excess share-based compensation for vested RSUs and exercised stock options. The difference between our statutory tax rate and our effective tax rate for the year ended December 31, 2016 was due to the release of the valuation allowance in 2016.
Since inception and prior to December 31, 2016, we recorded a valuation allowance against net deferred tax assets, and, as such, we generally did not record a benefit associated with the losses incurred in prior periods or other income tax benefits. At December 31, 2016, after weighing applicable evidence, we concluded that it was more-likely-than-not that our net deferred tax asset would be realized. As a result, as of December 31, 2016, we released the valuation allowance on federal and certain state net deferred tax assets. We continued to record a valuation allowance against state net deferred tax assets, primarily related to state net operating losses generated by NMIH that we do not expect to be utilized, as NMIH operates at a loss and currently only generates revenue from its investment portfolio.
As of December 31, 2016, the positive evidence that weighed in favor of releasing the valuation allowance and ultimately outweighed the negative evidence against releasing the allowance included:
|
•
|
our net operating loss carryforwards were expected to be fully utilized by 2018;
|
|
•
|
our other deferred tax assets were based on known recognition schedules and our expectation was that the majority would either reverse in the next three years or were related to deferred tax liabilities;
|
|
•
|
our significant unearned premium balance, which represents future revenue to be earned over the policies' lives;
|
|
•
|
the substantial growth in our IIF driving the increase in net premiums;
|
|
•
|
our positive earnings trends from quarterly and annual increases in revenue;
|
|
•
|
our taxable income in 2016 and our expected taxable income in future years; and
|
|
•
|
our expectation that we would be in a cumulative profit in a three-year period in 2017.
|
The primary negative evidence that was considered was our cumulative loss in the three year period through December 31, 2016. Although ASC 740 does not define the term or the length of time to consider when calculating the cumulative loss, practice and interpretations suggest that the guideline, not a "bright line," is to aggregate the pre-tax results as adjusted for permanent items for three years (
i.e.
, the then current and two preceding years).
At December 31, 2016, we concluded that positive evidence of sufficient quantity and quality outweighed negative evidence, and supported our conclusion that it was more-likely-than-not that we would realize our federal and certain state net deferred tax assets. The reversal of our beginning-of-the-year valuation allowance against such net deferred tax assets (resulting from a change in judgment about the realizability of the related net deferred tax assets in future years) was consistent with the requirements of ASC 740-10-45-20.
We continue to evaluate the realizability of our net deferred tax asset position, and our examination of results through December 31, 2018 and review of future expectations, continue to support the conclusion that it is more-likely-than-not that we will realize our federal and certain state net deferred tax assets. We also concluded it was appropriate to continue to apply a valuation allowance against state net deferred tax assets, primarily related to state net operating losses by NMIH that we do not expect to be utilized.
At December 31, 2018, we had a federal net operating loss carryforward of
$2.6 million
which expire in varying amounts in 2030 and 2031, and state net operating loss carryforwards of
$93.3 million
, which expire in varying amounts from 2031 to 2038. Our ability to utilize our remaining federal net operating loss carryforward is restricted by Section 382 of the Internal Revenue Code, which imposes annual limitations if there is an "ownership change." As a result of the acquisition of our insurance subsidiaries in 2012,
$7.3 million
of federal NOLs were subject to annual limitations of
$0.8 million
through 2016, and
$0.3 million
, thereafter. Our federal net operating loss carryforward balance is a result of this limitation.
NMIH and its subsidiaries entered into a tax sharing agreement effective August 23, 2012, which was subsequently amended on September 1, 2016. Under original and amended agreements, each of the parties agreed to file consolidated federal income tax returns for all tax years beginning in and subsequent to 2012, with NMIH as the direct tax filer. The tax liability of each subsidiary that is party to the agreement is limited to the amount of the liability it would incur if it filed separate returns.
67
Off-Balance Sheet Arrangements and Contractual Obligations
We had no material off-balance sheet arrangements at December 31, 2018. In connection with the ILN Transactions, we have certain future contractual commitments to Oaktown Re and Oaktown Re II, special purpose VIEs that are not consolidated in our financial results. See Item 8, "
Financial Statements and Supplementary Data - Notes to Consolidated Financial Statements - Note 2, Summary of Accounting Principles - Variable interest entity.
"
Contractual obligations at December 31, 2018 are summarized in the following table:
|
Less than 1 year
|
1-3 years
|
3-5 years
|
More than 5 years
|
||||||||||||
|
(In Thousands)
|
|||||||||||||||
|
Contractual obligations
|
$
|
—
|
|
$
|
—
|
|
$
|
—
|
|
$
|
—
|
|
|||
|
Long-term debt obligations
(1)
|
12,713
|
|
25,226
|
|
159,747
|
|
—
|
|
|||||||
|
Capital lease obligations
|
—
|
|
—
|
|
—
|
|
—
|
|
|||||||
|
Operating lease obligations
|
2,346
|
|
4,906
|
|
3,027
|
|
—
|
|
|||||||
|
Purchase obligations
|
6,114
|
|
1,922
|
|
—
|
|
—
|
|
|||||||
|
Other long-term liabilities reflected on the registrant's balance sheet under GAAP
|
—
|
|
—
|
|
—
|
|
—
|
|
|||||||
|
Total
|
$
|
21,173
|
|
$
|
32,054
|
|
$
|
162,774
|
|
$
|
—
|
|
|||
|
(1)
|
Long-term debt relates to our 2018 Credit Agreement and includes future interest payments on the 2018 Term Loan using the minimum interest rate in effect at December 31, 2018 and future undrawn commitment fees on the 2018 Revolving Credit Facility at the rate in effect at December 31, 2018.
|
Critical Accounting Estimates
Our discussion and analysis of our financial condition and results of operation are based on our consolidated financial statements, which have been prepared in conformity with U.S. GAAP. In preparing our consolidated financial statements, management has made estimates, assumptions and judgments that affect the reported amounts of assets and liabilities at the date of the financial statements and the reported amounts of revenues and expenses during the reporting periods. Because the use of estimates is inherent in GAAP, actual results could differ materially from those estimates. A summary of the accounting policies that management believes are critical to the preparation of our consolidated financial statements is set forth below.
Insurance Premium Revenue Recognition
Premiums for primary mortgage insurance policies may be paid in a single payment at origination (single premium), on a monthly installment basis (monthly premium) or on an annual installment basis (annual premium). Premiums written at origination for single premium policies are initially deferred as unearned premiums and amortized into earnings over the estimated policy life in accordance with the anticipated expiration of risk. Monthly premiums are recognized as revenue in the month billed as coverage is effective. Annual premiums are initially deferred and earned on a straight-line basis over the year of coverage. Upon cancellation of a policy, all remaining non-refundable deferred and unearned premium is immediately earned, and any refundable premium is returned to the policyholder. Premiums returned to policyholders are recorded as a reduction to written and earned premiums in the period paid.
Premiums written on pool transactions are earned over the period that coverage is provided.
Reserve for Claims and Claims Expenses
Consistent with industry standards for mortgage insurers, we establish reserves for claims based on our best estimate of ultimate claim costs for defaulted loans using the general principles contained in ASC 944,
Financial Services
-
Insurance
(ASC 944).
We establish case reserves when we are notified that a borrower has missed two or more mortgage payments (i.e., a default) and IBNR reserves based on an estimate of defaults which have been incurred by have not yet been reported to us by loan servicers. We also establish reserves for unallocated claims expenses not associated with specific claims. Claims expenses consist of the estimated cost of the claim administration process, including legal and other fees, as well as other general expenses of administering the claims settlement process.
The establishment of claims and claims expense reserves is subject to inherent uncertainty and requires significant judgment by management. Reserves are established by estimating the number of loans in default that will result in a claim payment, which is referred to as claim frequency, and the amount of the claim payment expected to be paid on each such loan in default, which is
68
referred to as claim severity. Claim frequency and severity estimates are established based on historical observed experience regarding certain loan factors, such as age of the default, size of the loan and LTV ratios, and are strongly influenced by prevailing economic conditions, such as mortgage rates, trends in unemployment and house price appreciation. We conduct an annual actuarial review to evaluate, and, if necessary, update these assumptions.
Investments
We have designated our investment portfolio as available-for-sale and report it at fair value. The related unrealized gains and losses, after considering the related tax expense or benefit, are recognized as a component of accumulated other comprehensive income (loss) in shareholders' equity. Net realized investment gains and losses are reported in income based on specific identification of securities sold or other than temporarily impaired, and are reclassified out of accumulated other comprehensive income (loss).
We measure fair value and classify invested assets in a hierarchy for disclosure purposes consisting of three "levels" based on the observability of inputs available in the marketplace used to measure fair value. The hierarchy gives the highest priority to unadjusted quoted prices in active markets for identical assets (Level 1 measurements) and the lowest priority to unobservable inputs (Level 3 measurements). See Item 8,
"Financial Statements and Supplementary Data - Notes to Consolidated Financial Statements - Note 4, Fair Value of Financial Instruments."
Each fiscal quarter, we evaluate our investments to determine whether declines in fair value below amortized cost were considered other-than-temporary in accordance with applicable guidance. Under current guidance, a debt security impairment is deemed other-than-temporary if (i) we either intend to sell the security or it is more likely than not that we will be required to sell the security before recovery or (ii) we do not expect to collect cash flows sufficient to recover the amortized cost basis of the security. In evaluating whether a decline in fair value is other-than-temporary, we consider several factors including, but not limited to:
|
•
|
our intent to sell the security or whether it is more likely than not that we will be required to sell the security before recovery;
|
|
•
|
the severity and duration of the decline in fair value;
|
|
•
|
the financial condition of the issuer;
|
|
•
|
the failure of the issuer to make scheduled interest or principal payments;
|
|
•
|
recent credit downgrades of the applicable security or the issuer below investment grade; and
|
|
•
|
adverse conditions specifically related to the security, an industry or a geographic area.
|
Based on this evaluation, we record OTTI adjustments on securities with declines in fair value below their amortized cost, if it is more likely than not that we will sell the securities prior to recovery of their amortized cost or if the present value of the discounted cash flows we expect to collect on the securities through recovery under a “most likely” scenario is less than their amortized cost. If our intent is to sell securities and their fair value is below its amortized cost, the securities are classified as other-than-temporarily impaired and the full amount of the impairment is recognized as a loss in earnings Otherwise, losses on other-than-temporarily impaired securities are bifurcated between credit-related losses and losses related to other factors (e.g., interest rate fluctuations), with credit-related losses recognized in the statement of operations and losses related to other factors recognized in accumulated other comprehensive income (loss), net of taxes.
Deferred Policy Acquisition Costs
Costs directly associated with the successful acquisition of mortgage insurance policies, consisting of certain selling expenses and other policy issuance and underwriting expenses, are initially deferred and reported as DAC. DAC is subsequently amortized to expense in proportion to estimated gross profits over the estimated life of the associated policies. DAC is reviewed periodically to determine that it does not exceed recoverable amounts.
Premium Deficiency Reserve
We consider whether a premium deficiency exists and premium deficiency reserve is required at each fiscal quarter using best estimate assumptions as of the testing date. Per ASC 944, a premium deficiency reserve shall be recognized if the sum of expected claim costs and claim adjustment expenses, expected dividends to policyholders, unamortized acquisition costs and maintenance costs exceeds future premiums, existing reserves and anticipated investment income. The premium deficiency assessment requires the use of significant judgment and estimates to determine the present value of future premiums and present value of expected claims and expenses on our business. The present value of future premiums relies on, among other things, assumptions about persistency and repayment patterns on underlying loans. The present value of expected claims and expenses depends on assumptions relating to severity of claims, claim rates on current defaults and expected defaults in future periods. These assumptions may also include an estimate of expected rescission activity. Assumptions used in the premium deficiency calculation can be affected by volatility in the
69
current housing and mortgage lending industries. It is possible that even a relatively small change in estimated claim rates or a relatively small percentage change in estimated claim amounts could have a significant impact on our premium deficiency analysis. If we determine it is necessary and appropriate to establish a premium deficiency reserve, and actual premium patterns and claims experience differ from the assumptions used to establish the reserve, the differences between the actual results and our estimates will affect future period earnings.
Income Taxes
We account for income taxes using the liability method in accordance with ASC 740,
Income Taxes
. Under this method, we determine deferred tax assets and liabilities based on the expected future tax effects of temporary differences at the enacted tax rates applicable for the period in which the deferred tax assets or liabilities are expected to be realized or settled. Temporary differences are differences between the tax basis of an asset or liability and its reported amount in the consolidated financial statements that would result in future increases or decreases in taxes owed on a cash basis as compared to amounts already recognized as tax expense in the consolidated statement of operations. Changes in tax laws, rates, regulations and policies, or the final determination of tax audits or examinations, could materially affect our tax estimates.
We are required to establish a valuation allowance against our net deferred tax assets when it is more likely than not that all or a portion of our net deferred tax assets will not be realized. We assess our need for a valuation allowance on a quarterly basis. In the course of our review, we assess all available evidence, both positive and negative, including future sources of income, tax planning strategies, future contractual cash flows and reversing temporary differences, and are required to exercise judgment and make assumptions in this regard.
Our provision for income taxes for interim financial periods is based on an estimate of our annual effective tax rate for the full year. When estimating our full year effective tax rate, we adjust our forecasted pre-tax income for gains and losses on our investments, changes in the accounting for uncertainty in income taxes, changes in our beginning of year valuation allowance, and other adjustments. The impact of these items is accounted for discretely at the applicable federal tax rate.
70
Item 7A. Quantitative and Qualitative Disclosures About Market Risk
We own and manage a large portfolio of various holdings, types and maturities. NMIH's principal source of operating cash is investment income. The assets within the investment portfolio are exposed to the same factors that affect overall financial market performance.
We manage market risk via a defined investment policy implemented by our treasury function with oversight from our Board's Risk Committee. Important drivers of our market risk exposure monitored and managed by us include but are not limited to:
|
•
|
Changes to the level of interest rates
. Increasing interest rates may reduce the value of certain fixed-rate bonds held in the investment portfolio. Higher rates may cause variable rate assets to generate additional income. Decreasing rates will have the reverse impact. Significant changes in interest rates can also affect persistency and claim rates of our insurance portfolio, and as a result we may determine that our investment portfolio needs to be restructured to better align it with future liabilities and claim payments. Such restructuring may cause investments to be liquidated when market conditions are adverse. Additionally, the changes in Eurodollar based interest rates affect the interest expense related to the Company's debt.
|
|
•
|
Changes to the term structure of interest rates
. Rising or falling rates typically change by different amounts along the yield curve. These changes may have unforeseen impacts on the value of certain assets.
|
|
•
|
Market volatility/changes in the real or perceived credit quality of investments
. Deterioration in the quality of investments, identified through changes to our own or third party (
e.g.
, rating agency) assessments, will reduce the value and potentially the liquidity of investments.
|
|
•
|
Concentration Risk
. If the investment portfolio is highly concentrated in one asset, or in multiple assets whose values are highly correlated, the value of the total portfolio may be greatly affected by the change in value of just one asset or a group of highly correlated assets.
|
|
•
|
Prepayment Risk
. Bonds may have call provisions that permit debtors to repay prior to maturity when it is to their advantage. This typically occurs when rates fall below the interest rate of the debt.
|
The carrying value of our investment portfolio as of December 31, 2018 and 2017 was
$911 million
and
$716 million
, respectively, of which 100% was invested in fixed maturity securities. The primary market risk to our investment portfolio is interest rate risk associated with investments in fixed maturity securities. We mitigate the market risk associated with our fixed maturity securities portfolio by matching the duration of our fixed maturity securities with the expected duration of the liabilities that those securities are intended to support.
As of December 31, 2018, the duration of our fixed income portfolio, including cash and cash equivalents, was
3.40 years,
which means that an instantaneous parallel shift (movement up or down) in the yield curve of 100 basis points would result in a change of
3.40%
in fair value of our fixed income portfolio. Excluding cash, our fixed income portfolio duration was
3.42 years
, which means that an instantaneous parallel shift (movement up or down) in the yield curve of 100 basis points would result in a change of
3.42%
in fair value of our fixed income portfolio.
We are also subject to market risk related to our 2018 Term Loan and the ILN Transactions. As discussed in Item 8, "
Financial Statements and Supplementary Data - Notes to Consolidated Financial Statements - Note 5, Debt,
" the 2018 Term Loan bears interest at a variable rate and, as a result, increases in market interest rates would generally result in increased interest expense on our outstanding principal.
The risk premium amounts under the ILN Transactions are calculated by multiplying the outstanding reinsurance coverage amount at the beginning of any payment period by a coupon rate, which is the sum of 1-month LIBOR and a risk margin, and then subtracting actual investment income earned on the trust balance during that payment period. An increase in 1-month LIBOR rates would generally increase the risk premium payments, while an increase to money market rates, which directly affect investment income earned on the trust balance, would generally decrease them. Although we expect the two rates to move in tandem, to the extent they do not, it could increase or decrease the risk premium payments that otherwise would be due.
71
Item 8. Financial Statements and Supplementary Data
INDEX TO FINANCIAL STATEMENTS
|
Report of Independent Registered Public Accounting Firm
|
|
|
Consolidated Balance Sheets as of December 31, 2018 and 2017
|
|
|
Consolidated Statements of Operations and Comprehensive Income for each of the years in the three-year period ended December 31, 2018
|
|
|
Consolidated Statements of Changes in Shareholders' Equity for each of the years in the three-year period ended December 31, 2018
|
|
|
Consolidated Statements of Cash Flows for each of the years in the three-year period ended December 31, 2018
|
|
|
Notes to Consolidated Financial Statements
|
|
72
Report of Independent Registered Public Accounting Firm
To the Shareholders and Board of Directors of NMI Holdings, Inc.
NMI Holdings, Inc.
Emeryville, CA
Opinion on the Consolidated Financial Statements
We have audited the accompanying consolidated balance sheets of NMI Holdings, Inc. (the "Company") and subsidiaries as of December 31, 2018 and 2017, the related consolidated statements of operations and comprehensive income, changes in shareholders' equity, and cash flows for each of the three years in the period ended December 31, 2018, and the related notes and financial statement schedules included in the accompanying index(collectively referred to as the "consolidated financial statements"). In our opinion, the consolidated financial statements present fairly, in all material respects, the financial position of the Company and subsidiaries at December 31, 2018 and 2017, and the results of their operations and their cash flows for each of the three years in the period ended December 31, 2018
,
in conformity with accounting principles generally accepted in the United States of America.
We also have audited, in accordance with the standards of the Public Company Accounting Oversight Board (United States) ("PCAOB"), the Company's internal control over financial reporting as of December 31, 2018, based on criteria established in Internal Control - Integrated Framework (2013) issued by the Committee of Sponsoring Organizations of the Treadway Commission ("COSO") and our report dated February 14, 2019 expressed an unqualified opinion thereon.
Basis for Opinion
These consolidated financial statements are the responsibility of the Company's management. Our responsibility is to express an opinion on the Company's consolidated financial statements based on our audits. We are a public accounting firm registered with the PCAOB and are required to be independent with respect to the Company in accordance with the U.S. federal securities laws and the applicable rules and regulations of the Securities and Exchange Commission and the PCAOB.
We conducted our audits in accordance with the standards of the PCAOB. Those standards require that we plan and perform the audit to obtain reasonable assurance about whether the consolidated financial statements are free of material misstatement, whether due to error or fraud.
Our audits included performing procedures to assess the risks of material misstatement of the consolidated financial statements, whether due to error or fraud, and performing procedures that respond to those risks. Such procedures included examining, on a test basis, evidence regarding the amounts and disclosures in the consolidated financial statements. Our audits also included evaluating the accounting principles used and significant estimates made by management, as well as evaluating the overall presentation of the consolidated financial statements. We believe that our audits provide a reasonable basis for our opinion.
/s/ BDO USA, LLP
We have served as the Company's auditor since 2011.
San Francisco, California
February 14, 2019
73
NMI HOLDINGS, INC.
CONSOLIDATED BALANCE SHEETS
|
December 31, 2018
|
December 31, 2017
|
||||||
|
Assets
|
(In Thousands, except for share data)
|
||||||
|
Fixed maturities, available-for-sale, at fair value (amortized cost of $924,987 and $713,859 as of December 31, 2018 and December 31, 2017, respectively)
|
$
|
911,490
|
|
$
|
715,875
|
|
|
|
Cash and cash equivalents (including restricted cash of $1,414 and $0 as of December 31, 2018 and December 31, 2017, respectively)
|
25,294
|
|
19,196
|
|
|||
|
Premiums receivable
|
36,007
|
|
25,179
|
|
|||
|
Accrued investment income
|
5,694
|
|
4,212
|
|
|||
|
Prepaid expenses
|
3,241
|
|
2,151
|
|
|||
|
Deferred policy acquisition costs, net
|
46,840
|
|
37,925
|
|
|||
|
Software and equipment, net
|
24,765
|
|
22,802
|
|
|||
|
Intangible assets and goodwill
|
3,634
|
|
3,634
|
|
|||
|
Prepaid reinsurance premiums
|
30,370
|
|
40,250
|
|
|||
|
Deferred tax asset, net
|
—
|
|
19,929
|
|
|||
|
Other assets
|
4,708
|
|
3,695
|
|
|||
|
Total assets
|
$
|
1,092,043
|
|
$
|
894,848
|
|
|
|
Liabilities
|
|||||||
|
Term loan
|
$
|
146,757
|
|
$
|
143,882
|
|
|
|
Unearned premiums
|
158,893
|
|
163,166
|
|
|||
|
Accounts payable and accrued expenses
|
31,141
|
|
23,364
|
|
|||
|
Reserve for insurance claims and claim expenses
|
12,811
|
|
8,761
|
|
|||
|
Reinsurance funds withheld
|
27,114
|
|
34,102
|
|
|||
|
Deferred ceding commission
|
3,791
|
|
5,024
|
|
|||
|
Warrant liability, at fair value
|
7,296
|
|
7,472
|
|
|||
|
Deferred tax liability, net
|
2,740
|
|
—
|
|
|||
|
Total liabilities
|
390,543
|
|
385,771
|
|
|||
|
Commitments and contingencies (see Note 14)
|
|
|
|
|
|||
|
Shareholders' equity
|
|||||||
|
Common stock - class A shares, $0.01 par value; 66,318,849 and 60,517,512 shares issued and outstanding as of December 31, 2018 and December 31, 2017, respectively (250,000,000 shares authorized)
|
663
|
|
605
|
|
|||
|
Additional paid-in capital
|
682,181
|
|
585,488
|
|
|||
|
Accumulated other comprehensive loss, net of tax
|
(14,832
|
)
|
(2,859
|
)
|
|||
|
Retain earnings (accumulated deficit)
|
33,488
|
|
(74,157
|
)
|
|||
|
Total shareholders' equity
|
701,500
|
|
509,077
|
|
|||
|
Total liabilities and shareholders' equity
|
$
|
1,092,043
|
|
$
|
894,848
|
|
|
See accompanying notes to consolidated financial statements.
74
NMI HOLDINGS, INC.
CONSOLIDATED STATEMENTS OF OPERATIONS AND COMPREHENSIVE INCOME
|
For the years ended December 31,
|
|||||||||||
|
2018
|
2017
|
2016
|
|||||||||
|
(In Thousands, except for per share data)
|
|||||||||||
|
Revenues
|
|||||||||||
|
Net premiums earned
|
$
|
251,197
|
|
$
|
165,740
|
|
$
|
110,481
|
|
||
|
Net investment income
|
23,538
|
|
16,273
|
|
13,751
|
|
|||||
|
Net realized investment gains (losses)
|
57
|
|
208
|
|
(693
|
)
|
|||||
|
Other revenues
|
233
|
|
522
|
|
276
|
|
|||||
|
Total revenues
|
275,025
|
|
182,743
|
|
123,815
|
|
|||||
|
Expenses
|
|||||||||||
|
Insurance claims and claim expenses
|
5,452
|
|
5,339
|
|
2,392
|
|
|||||
|
Underwriting and operating expenses
|
117,236
|
|
106,979
|
|
93,223
|
|
|||||
|
Total expenses
|
122,688
|
|
112,318
|
|
95,615
|
|
|||||
|
Other expense
|
|||||||||||
|
Loss from change in fair value of warrant liability
|
(1,397
|
)
|
(4,105
|
)
|
(1,900
|
)
|
|||||
|
Interest expense
|
(14,979
|
)
|
(13,528
|
)
|
(14,848
|
)
|
|||||
|
Total other expense
|
(16,376
|
)
|
(17,633
|
)
|
(16,748
|
)
|
|||||
|
Income before income taxes
|
135,961
|
|
52,792
|
|
11,452
|
|
|||||
|
Income tax expense (benefit)
|
28,034
|
|
30,742
|
|
(52,549
|
)
|
|||||
|
Net income
|
$
|
107,927
|
|
$
|
22,050
|
|
$
|
64,001
|
|
||
|
Earnings per share (EPS)
|
|||||||||||
|
Basic
|
$
|
1.66
|
|
$
|
0.37
|
|
$
|
1.08
|
|
||
|
Diluted
|
$
|
1.60
|
|
$
|
0.35
|
|
$
|
1.05
|
|
||
|
Weighted average common shares outstanding
|
|||||||||||
|
Basic
|
65,019
|
|
59,816
|
|
59,071
|
|
|||||
|
Diluted
|
67,652
|
|
62,186
|
|
60,829
|
|
|||||
|
Net income
|
$
|
107,927
|
|
$
|
22,050
|
|
$
|
64,001
|
|
||
|
Other comprehensive (loss) income, net of tax:
|
|||||||||||
|
Unrealized (losses) gains in accumulated other comprehensive income, net of tax (benefit) expense of ($3,285), $1,234 and $1,178 for each of the years in the three-year period ended December 31, 2018, respectively
|
(12,357
|
)
|
2,559
|
|
1,429
|
|
|||||
|
Reclassification adjustment for realized losses (gains) included in net income, net of tax expense (benefit) of ($27), $73, and $0 for each of the years in the three-years ended December 31, 2018, respectively
|
102
|
|
(131
|
)
|
758
|
|
|||||
|
Other comprehensive (loss) income, net of tax
|
(12,255
|
)
|
2,428
|
|
2,187
|
|
|||||
|
Comprehensive income
|
$
|
95,672
|
|
$
|
24,478
|
|
$
|
66,188
|
|
||
See accompanying notes to consolidated financial statements.
75
NMI HOLDINGS, INC.
CONSOLIDATED STATEMENTS OF CHANGES IN SHAREHOLDERS' EQUITY
|
Common Stock - Class A
|
Additional
Paid-in Capital |
Accumulated Other Comprehensive Income (Loss)
|
Retained Earnings (Accumulated Deficit)
|
Total
|
|||||||||||||
|
Shares
|
Amount
|
||||||||||||||||
|
(In Thousands)
|
|||||||||||||||||
|
Balances, December 31, 2015
|
58,808
|
|
$
|
588
|
|
$
|
570,340
|
|
$
|
(7,474
|
)
|
$
|
(160,723
|
)
|
$
|
402,731
|
|
|
Common stock: class A shares issued under stock plans, net of shares withheld for employee taxes
|
337
|
|
3
|
|
(227
|
)
|
—
|
|
—
|
|
(224
|
)
|
|||||
|
Share-based compensation expense
|
—
|
|
—
|
|
6,814
|
|
—
|
|
—
|
|
6,814
|
|
|||||
|
Change in unrealized investment gains/losses, net of tax expense of $1,178
|
—
|
|
—
|
|
—
|
|
2,187
|
|
—
|
|
2,187
|
|
|||||
|
Net Income
|
—
|
|
—
|
|
—
|
|
—
|
|
64,001
|
|
64,001
|
|
|||||
|
Balances, December 31, 2016
|
59,145
|
|
$
|
591
|
|
$
|
576,927
|
|
$
|
(5,287
|
)
|
$
|
(96,722
|
)
|
$
|
475,509
|
|
|
Cumulative effect of change in accounting principle
|
—
|
|
$
|
—
|
|
$
|
388
|
|
$
|
—
|
|
$
|
515
|
|
$
|
903
|
|
|
Common stock: class A shares issued related to warrants
|
32
|
|
*
|
|
183
|
|
—
|
|
—
|
|
183
|
|
|||||
|
Common stock: class A shares issued under stock plans, net of shares withheld for employee taxes
|
1,341
|
|
14
|
|
(1,494
|
)
|
—
|
|
—
|
|
(1,480
|
)
|
|||||
|
Share-based compensation expense
|
—
|
|
—
|
|
9,484
|
|
—
|
|
—
|
|
9,484
|
|
|||||
|
Change in unrealized investment gains/losses, net of tax expense of $1,307
|
—
|
|
—
|
|
—
|
|
2,428
|
|
—
|
|
2,428
|
|
|||||
|
Net income
|
—
|
|
—
|
|
—
|
|
—
|
|
22,050
|
|
22,050
|
|
|||||
|
Balances, December 31, 2017
|
60,518
|
|
$
|
605
|
|
$
|
585,488
|
|
$
|
(2,859
|
)
|
$
|
(74,157
|
)
|
$
|
509,077
|
|
|
Cumulative effect of change in accounting principle
|
—
|
|
$
|
—
|
|
$
|
—
|
|
$
|
282
|
|
$
|
(282
|
)
|
$
|
—
|
|
|
Common stock: class A shares issued related to public offering
|
4,255
|
|
43
|
|
79,122
|
|
—
|
|
—
|
|
79,165
|
|
|||||
|
Common stock: class A shares issued related to warrants
|
91
|
|
1
|
|
1,893
|
|
—
|
|
—
|
|
1,894
|
|
|||||
|
Common stock: class A shares issued under stock plans, net of shares withheld for employee taxes
|
1,455
|
|
14
|
|
3,121
|
|
—
|
|
—
|
|
3,135
|
|
|||||
|
Share-based compensation expense
|
—
|
|
—
|
|
12,557
|
|
—
|
|
—
|
|
12,557
|
|
|||||
|
Change in unrealized investment gains/losses, net of tax benefit of $3,258
|
—
|
|
—
|
|
—
|
|
(12,255
|
)
|
—
|
|
(12,255
|
)
|
|||||
|
Net income
|
—
|
|
—
|
|
—
|
|
—
|
|
107,927
|
|
107,927
|
|
|||||
|
Balances, December 31,
2018
|
66,319
|
|
$
|
663
|
|
$
|
682,181
|
|
$
|
(14,832
|
)
|
$
|
33,488
|
|
$
|
701,500
|
|
|
*
|
During 2017, we issued
32,368
common shares with a par value of
$0.01
related to the exercise of warrants, which is not identifiable in this schedule due to rounding.
|
See accompanying notes to consolidated financial statements.
76
NMI HOLDINGS, INC.
CONSOLIDATED STATEMENTS OF CASH FLOWS
|
For the years ended December 31,
|
|||||||||||
|
2018
|
2017
|
2016
|
|||||||||
|
Cash flows from operating activities
|
(In Thousands)
|
||||||||||
|
Net income
|
$
|
107,927
|
|
$
|
22,050
|
|
$
|
64,001
|
|
||
|
Adjustments to reconcile net income to net cash provided by operating activities:
|
|||||||||||
|
Net realized investment (gains) losses
|
(57
|
)
|
(208
|
)
|
693
|
|
|||||
|
Loss from change in fair value of warrant liability
|
1,397
|
|
4,105
|
|
1,900
|
|
|||||
|
Depreciation and amortization
|
7,811
|
|
6,663
|
|
5,660
|
|
|||||
|
Net amortization of premium on investment securities
|
1,519
|
|
1,599
|
|
1,259
|
|
|||||
|
Amortization of debt discount and debt issuance costs
|
3,390
|
|
1,473
|
|
1,914
|
|
|||||
|
Deferred income taxes
|
25,927
|
|
31,102
|
|
(52,909
|
)
|
|||||
|
Share-based compensation expense
|
12,557
|
|
9,484
|
|
6,854
|
|
|||||
|
Changes in operating assets and liabilities:
|
|||||||||||
|
Premiums receivable
|
(10,828
|
)
|
(11,451
|
)
|
(8,585
|
)
|
|||||
|
Accrued investment income
|
(1,482
|
)
|
(791
|
)
|
(548
|
)
|
|||||
|
Prepaid expenses
|
(1,090
|
)
|
(160
|
)
|
(563
|
)
|
|||||
|
Deferred policy acquisition costs, net
|
(8,915
|
)
|
(7,816
|
)
|
(12,579
|
)
|
|||||
|
Other assets
(1)
|
1,304
|
|
(1,547
|
)
|
(156
|
)
|
|||||
|
Unearned premiums
|
(4,273
|
)
|
10,260
|
|
62,133
|
|
|||||
|
Reserve for insurance claims and claim expenses
|
4,050
|
|
5,760
|
|
2,322
|
|
|||||
|
Reinsurance balances, net
(1)
|
560
|
|
(274
|
)
|
(2,752
|
)
|
|||||
|
Accounts payable and accrued expenses
|
6,064
|
|
(2,486
|
)
|
3,300
|
|
|||||
|
Net cash provided by operating activities
|
145,861
|
|
67,763
|
|
71,944
|
|
|||||
|
Cash flows from investing activities
|
|||||||||||
|
Purchase of short-term investments
|
(257,916
|
)
|
(131,196
|
)
|
(170,067
|
)
|
|||||
|
Purchase of fixed-maturity investments, available-for-sale
|
(356,337
|
)
|
(219,079
|
)
|
(143,568
|
)
|
|||||
|
Proceeds from maturity of short-term investments
|
221,685
|
|
170,278
|
|
129,033
|
|
|||||
|
Proceeds from redemptions, maturities and sale of fixed-maturity investments, available-for-sale
|
179,978
|
|
95,435
|
|
116,281
|
|
|||||
|
Software and equipment
|
(8,060
|
)
|
(8,510
|
)
|
(11,471
|
)
|
|||||
|
Net cash used in investing activities
|
(220,650
|
)
|
(93,072
|
)
|
(79,792
|
)
|
|||||
|
Cash flows from financing activities
|
|||||||||||
|
Proceeds from issuance of common stock related to public offering, net of issuance costs
|
79,165
|
|
—
|
|
—
|
|
|||||
|
Proceeds from issuance of common stock related to employee equity plans
|
12,857
|
|
7,103
|
|
532
|
|
|||||
|
Proceeds from issuance of common stock related to warrants
|
321
|
|
183
|
|
—
|
|
|||||
|
Taxes paid related to net share settlement of equity awards
|
(9,722
|
)
|
(8,582
|
)
|
(755
|
)
|
|||||
|
Proceeds from term loan
|
149,250
|
|
—
|
|
—
|
|
|||||
|
Repayments of term loan
|
(147,375
|
)
|
(1,500
|
)
|
(1,500
|
)
|
|||||
|
Payments of debt issuance/modification costs
|
(3,609
|
)
|
(445
|
)
|
—
|
|
|||||
|
Net cash provided by (used in) financing activities
|
80,887
|
|
(3,241
|
)
|
(1,723
|
)
|
|||||
|
Net increase (decrease) in cash, cash equivalents and restricted cash
|
6,098
|
|
(28,550
|
)
|
(9,571
|
)
|
|||||
|
Cash, cash equivalents and restricted cash, beginning of period
|
19,196
|
|
47,746
|
|
57,317
|
|
|||||
|
Cash, cash equivalents and restricted cash, end of period
|
$
|
25,294
|
|
$
|
19,196
|
|
$
|
47,746
|
|
||
|
Supplemental disclosures of cash flow information
|
|||||||||||
|
Interest paid
|
$
|
12,093
|
|
$
|
13,355
|
|
$
|
9,669
|
|
||
|
Income taxes paid
|
867
|
|
1,220
|
|
200
|
|
|||||
|
(1)
|
Ceded losses recoverable on the QSR Transactions were reclassified from "Other Assets" in prior periods to "Reinsurance balance, net".
|
See accompanying notes to consolidated financial statements.
77
NMI HOLDINGS, INC.
NOTES TO CONSOLIDATED FINANCIAL STATEMENTS
DECEMBER 31, 2018
1. Organization and Basis of Presentation
NMI Holdings, Inc. (NMIH) is a Delaware corporation, incorporated in May 2011, to provide private mortgage guaranty insurance (which we refer to as mortgage insurance or MI) through its wholly owned insurance subsidiaries, National Mortgage Insurance Corporation (NMIC) and National Mortgage Reinsurance Inc One (Re One).
In April 2012, we completed a private placement of our securities, through which we offered and sold an aggregate of
55
million of our Class A common stock resulting in net proceeds of approximately
$510 million
(the Private Placement), and we completed the acquisition of our insurance subsidiaries for
$8.5 million
in cash, common stock and warrants, plus the assumption of
$1.3 million
in liabilities. In November 2013, we completed an initial public offering of
2.4 million
shares of our common stock, and our common stock began trading on the NASDAQ exchange on November 8, 2013, under the symbol "NMIH."
In April 2013, NMIC, our primary insurance subsidiary, issued its first mortgage insurance policy. NMIC is licensed to write mortgage insurance in all
50
states and D.C. In August 2015, NMIH capitalized a wholly owned subsidiary, NMI Services, Inc. (NMIS), through which we offer outsourced loan review services to mortgage loan originators.
Basis of Presentation
The accompanying consolidated financial statements include the results of NMIH and its wholly owned subsidiaries. All inter-company transactions have been eliminated. These financial statements have been prepared in accordance with accounting principles generally accepted in the U.S. (GAAP) and our accounts are maintained in US dollars. The preparation of financial statements in accordance with GAAP requires management to make estimates and assumptions that affect reported amounts of assets and liabilities, as well as disclosure of contingent assets and liabilities as of the balance sheet date. Estimates also affect the reported amounts of income and expenses for the reporting period. Actual results could differ from those estimates. Certain reclassifications to previously reported financial information have been made to conform to our current period presentation.
2. Summary of Accounting Principles
Use of Estimates
We use accounting principles and methods that conform to GAAP. We are required to apply significant judgment and make material estimates in the preparation of our financial statements and with regard to various accounting, reporting and disclosure matters. Assumptions and estimates are required to apply these principles where actual measurement is not possible or practical.
Insurance Premium Revenue Recognition
Premiums for primary mortgage insurance policies may be paid in a single payment at origination (single premium), on a monthly installment basis (monthly premium) or on an annual installment basis (annual premium), with such election and payment type fixed at policy inception. Premiums written at origination for single premium policies are initially deferred as unearned premiums and amortized into earnings over the estimated policy life, in accordance with the anticipated expiration of risk. Monthly premiums are recognized as revenue in the month billed and when the coverage is effective. Annual premiums are initially deferred and earned on a straight-line basis over the year of coverage. Upon cancellation of a policy, all remaining non-refundable deferred and unearned premium is immediately earned, and any refundable premium is returned to the policyholder. Premiums returned to policyholders are recorded as a reduction of written and earned premiums in the current period.
Premiums written on pool transactions are earned over the period that coverage is provided.
Concentrations
For the year ended
December 31, 2018
,
no
customer accounted for more than 10% of our consolidated revenues. At
December 31, 2018
, approximately
13%
of our total risk-in-force (RIF) was concentrated in California.
Reserves for Insurance Claims and Claims Expenses
Consistent with industry practice, we establish reserves for claims based on our best estimate of ultimate claim costs for defaulted loans using the general principles contained in ASC 944,
Financial Services
-
Insurance
(ASC 944). We establish reserves for loans that have been in default for at least
60
days. Reserves for claims and allocated claims expenses, referred to as case reserves, are established when we are notified of defaults by loan servicers. Additional claims reserves, referred to as IBNR reserves, are established for loans that we estimate (based on actuarial review) have been in default for at least 60 days, but have not yet been reported to us as such by servicers. We also establish reserves for unallocated claims expenses not associated with specific claims.
78
NMI HOLDINGS, INC.
NOTES TO CONSOLIDATED FINANCIAL STATEMENTS
DECEMBER 31, 2018
Claims expenses represent the estimated cost of the claim administration process, including legal and other fees, as well as other general expenses of administering the claims settlement process.
The establishment of claims and claims expense reserves is subject to inherent uncertainty and requires significant judgment by management. Reserves are established by estimating the number of loans in default that will result in a claim payment, which is referred to as claim frequency, and the amount of the claim payment expected to be paid on each such loan in default, which is referred to as claim severity. Claim frequency and severity estimates are established based on historical observed experience regarding certain loan factors, such as age of the default, size of the loan and LTV ratios, and are strongly influenced by prevailing economic conditions, such as mortgage rates, trends in unemployment and house price appreciation. We conduct an annual actuarial review to evaluate and, if necessary, update these assumptions.
Investments
We have designated our investment portfolio as available-for-sale and report it at fair value. The related unrealized gains and losses, after considering the related tax expense or benefit, are recognized as a component of accumulated other comprehensive income (loss) in shareholders' equity. Net realized investment gains and losses are reported in income based on specific identification of securities sold or other-than-temporarily impaired, and are reclassified out of accumulated other comprehensive income (loss).
We measure fair value and classify invested assets in a hierarchy for disclosure purposes consisting of three "levels" based on the observability of inputs available in the marketplace used to measure fair value. The hierarchy gives the highest priority to unadjusted quoted prices in active markets for identical assets (Level 1 measurements) and the lowest priority to unobservable inputs (Level 3 measurements). See Note 4, "
Fair Value of Financial Instruments
" for further discussion.
Purchases and sales of investments are recorded on a trade date basis. Net investment income is recognized when earned, and includes interest and dividend income together with amortization of market premiums and discounts using the effective yield method, and is net of investment management fees and other investment related expenses. For asset-backed securities and any other holdings for which there is a prepayment risk, prepayment assumptions are evaluated and revised as necessary. Any adjustments required due to changes in effective yields and maturities are recognized on a prospective basis through yield adjustments.
Each quarter, we evaluate our investments to determine whether declines in fair value below amortized cost were considered other-than-temporary in accordance with applicable guidance. Under the current guidance, a debt security impairment is deemed other-than-temporary if (i) we either intend to sell the security or it is more likely than not that we will be required to sell the security before recovery or (ii) we do not expect to collect cash flows sufficient to recover the amortized cost basis of the security. In evaluating whether a decline in fair value is other-than-temporary, we consider several factors including, but not limited to:
|
•
|
our intent to sell the security or whether it is more likely than not that we will be required to sell the security before recovery;
|
|
•
|
the severity and duration of the decline in fair value;
|
|
•
|
the financial condition of the issuer;
|
|
•
|
the failure of the issuer to make scheduled interest or principal payments;
|
|
•
|
recent credit downgrades of the applicable security or the issuer below investment grade; and
|
|
•
|
adverse conditions specifically related to the security, an industry, or a geographic area.
|
Based on this evaluation, we record OTTI adjustments on securities with declines in fair value below their amortized cost, if it is more likely than not that we will sell the securities prior to recovery of their amortized cost or if the present value of the discounted cash flows we expect to collect on the securities through recovery under a "most likely" scenario is less than their amortized cost. If our intent is to sell securities and their fair value is below amortized cost, the securities are classified as other-than-temporarily impaired and the full amount of the impairment is recognized as a loss in earnings. Otherwise, losses on other-than-temporarily impaired securities are bifurcated between credit-related losses and losses related to other factors (
e.g.
, interest rate fluctuations), with credit-related losses recognized in earnings and losses related to other factors recognized in accumulated other comprehensive income (loss), net of taxes.
We consider items such as commercial paper with original maturities of 90 days or less to be short-term investments.
79
NMI HOLDINGS, INC.
NOTES TO CONSOLIDATED FINANCIAL STATEMENTS
DECEMBER 31, 2018
Deferred Policy Acquisition Costs
Costs directly associated with the successful acquisition of mortgage insurance policies, consisting of certain selling expenses and other policy issuance and underwriting expenses, are initially deferred and reported as DAC. DAC is reviewed periodically to determine that it does not exceed recoverable amounts. DAC is amortized to expense in proportion to estimated gross profits over the estimated life of the associated policies. We estimate the rate of amortization to reflect actual experience and any changes to persistency or loss development. Total amortization of DAC for the years ended
December 31, 2018
, 2017 and 2016, net of a portion of ceding commission related to the QSR Transactions (see
"
Reinsurance
", below
)
, was
$8.1 million
,
$5.8 million
and
$4.3 million
, respectively.
Premium Deficiency Reserves
We consider whether a premium deficiency exists and premium deficiency reserve is required at each fiscal quarter using best estimate assumptions as of the testing date. Per ASC 944, a premium deficiency reserve shall be recognized if the sum of expected claim costs and claim adjustment expenses, expected dividends to policyholders, unamortized acquisition costs and maintenance costs exceeds future premiums, existing reserves and anticipated investment income. We have determined that
no
premium deficiency reserves were necessary for any of the years in the three year period ended
December 31, 2018
.
Reinsurance
We account for premiums, claims and claims expenses that are ceded to reinsurers on a consistent basis with that which we use to account for the original policies we issue and pursuant to the terms of our reinsurance contracts. We account for premiums ceded or otherwise paid to reinsurers as a reduction to premium revenue.
We earn profit and ceding commissions in connection with the QSR Transactions (see Note 6, "
Reinsurance
"). Profit commissions represent a percentage of the profits recognized by reinsurers that are returned to us, based on the level of claims and claims expenses that we cede. We recognize any profit commissions we earn as an increase to premium revenue. Ceding commissions are calculated as a percentage of ceded written premiums under the 2016 QSR Transaction and as a percentage of ceded earned premiums under the 2018 QSR Transaction, and are intended to cover our costs of acquiring and servicing direct policies. We recognize any ceding commissions we earn in a manner consistent with our recognition of earnings on the underlying insurance policies, over the terms of the policies reinsured. We account for ceding commissions earned as a reduction to underwriting and operating expenses.
Under the QSR Transactions, we cede a portion of claims and claims expenses reserves to our reinsurers, and account for such ceded reserves as reinsurance recoverables in "Other Assets" on the consolidated balance sheets and as reductions to claims expenses on the consolidated statements of operations. We remain directly liable for all claims payments if we are unable to collect from any reinsurer.
Income Taxes
We account for income taxes using the liability method in accordance with ASC Topic 740,
Income Taxes
. The liability method measures the expected future tax effects of temporary differences at the enacted tax rates applicable for the period in which the deferred asset or liability is expected to be realized or settled. Temporary differences are differences between the tax basis of an asset or liability and its reported amount in the consolidated financial statements that would result in future increases or decreases in taxes owed on a cash basis compared to amounts already recognized as tax expense in the consolidated statement of operations.
Warrants
We account for warrants to purchase our common shares in accordance with ASC 470-20,
Debt with Conversion and Other Options
and ASC 815-40
Derivatives and Hedging - Contracts in Entity's Own Equity
. Our outstanding warrants may be settled through either (i) physical settlement method, or (ii) cashless exercise, where the number of shares issued upon exercise of the warrants is reduced to cover the cost of the exercise in lieu of the holder remitting a cash payment for the exercise price. The warrants expire and are not exercisable after the 10th anniversary of the date issued. The number of warrants and exercise price are subject to anti-dilution provisions whereby the number of warrants may be increased and their exercise price may be adjusted downward under certain circumstances. The anti-dilutive adjustments may be in excess of any dilution incurred by the warrant holders, and may be triggered by events that are not dilutive. As a result, the warrants are classified as a liability. We revalue the warrants at the end of each reporting period, and any change in fair value is reported in the statements of operations in the period in which the change occurred. We calculated the fair value of the warrants using a Black-Scholes option-pricing model in combination with a binomial model.
80
NMI HOLDINGS, INC.
NOTES TO CONSOLIDATED FINANCIAL STATEMENTS
DECEMBER 31, 2018
Share-Based Compensation
We account for stock compensation in accordance with ASC 718,
Compensation - Stock Compensation
, which addresses accounting for share-based awards and recognition of compensation expense, measured using grant date fair value, over the requisite service or performance period of the award. Share-based compensation includes RSUs and stock option grants under our Stock Plans. We calculate the fair value of stock option grants using a Black-Scholes option pricing model, which takes into account various subjective assumptions. Key assumptions used in the model include the expected volatility of our stock price, dividend yield and the risk-free interest rate, as well as the expected option term, giving consideration to the contractual terms of any award. RSU grants may contain a service condition, or performance and service conditions. RSU grants are valued at our stock price on the date of grant less the present value of anticipated dividends. We account for stock option and RSU forfeitures as they occur.
Earnings per Share
Basic earnings (loss) per share is based on the weighted-average number of common shares outstanding. Diluted earnings (loss) per share is based on the weighted-average number of common shares outstanding and common share equivalents that would be issuable upon the vesting of existing service based and certain performance and service based RSUs, and exercise of vested and unvested stock options and outstanding warrants.
Cash and Cash Equivalents
We consider items such as certificates of deposit and money market funds with original maturities of 90 days or less to be cash equivalents.
Software and Equipment
We capitalize certain costs associated with the development of internal-use software and equipment. Software and equipment are stated at cost, less accumulated amortization and depreciation. Amortization of software and depreciation of equipment commences at the beginning of the month following our placement of the assets into use. Amortization and depreciation are calculated on a straight-line basis over the estimated useful life of the respective assets, typically from three to five years, unless factors indicate a shorter useful life. For further detail, see Note 12, "
Software and Equipment.
"
Business Combinations, Goodwill and Intangible Assets
Goodwill represents the excess of the purchase price over the estimated fair value of net assets acquired from a business combination. In accordance with ASC 350,
Intangibles - Goodwill and Other
, we test goodwill for impairment during the third quarter each year, or more frequently if we believe indicators of impairment exist. We have not identified any impairments of goodwill through December 31, 2018.
Our intangible assets consist of state licenses and GSE applications which have indefinite lives. We test indefinite-lived intangible assets for impairment during the fourth quarter of each year or more frequently if we believe indicators of impairment exist. We have not identified any impairments of indefinite-lived intangible assets through December 31, 2018.
Premiums Receivable
Premiums receivable consist of premiums due on our mortgage insurance policies. If a mortgage insurance premium is unpaid for more than
120
days, the receivable is written off against earned premium and the related insurance policy is canceled. Premiums receivable may be written off prior to 120 days in the ordinary course of business for reasons including, but not limited to, the modification or refinancing of underlying insured loans. We have determined that the receivable write-off was immaterial as of December 31, 2018.
Variable interest entity
NMIC entered into aggregate excess of loss reinsurance agreements with Oaktown Re and Oaktown Re II, each a Bermuda-domiciled special purpose reinsurer, in May 2017 and August 2018, respectively. At inception of each reinsurance agreement, we determined that each of Oaktown Re and Oaktown Re II were variable interest entities (VIEs), as defined under GAAP (ASC 810), because they did not have sufficient equity at risk to finance their respective activities. We evaluated the VIEs at inception to determine whether NMIC was the primary beneficiary under each deal and, if so, whether we were required to consolidate the assets and liabilities of each VIE. The primary beneficiary of a VIE is an enterprise that (1) has the power to direct the activities of the VIE, which most significantly impact its economic performance and (2) has significant economic exposure to the VIE,
i.e.,
the obligation to absorb losses or receive benefits that could potentially be significant. The determination of whether an entity is the primary
81
NMI HOLDINGS, INC.
NOTES TO CONSOLIDATED FINANCIAL STATEMENTS
DECEMBER 31, 2018
beneficiary of a VIE is complex and requires management judgment regarding determinative factors, including the expected results of the VIE and how those results are absorbed by beneficial interest holders, as well as which party has the power to direct activities that most significantly impact the performance of the VIE.
We concluded that we are not the primary beneficiary of either Oaktown Re or Oaktown Re II because NMIC does not have significant economic exposure to either Oaktown Re or Oaktown Re II, and, as such, we do not consolidate the VIEs in our consolidated financial statements.
See Note 6, "
Reinsurance
"
for further discussion of the reinsurance arrangements.
Recent Accounting Pronouncements - Adopted
In May 2014, the FASB issued ASU 2014-09,
Revenue from Contracts with Customers
(Topic 606). This update is intended to provide a consistent approach in recognizing revenue. In December 2016, the FASB clarified that all contracts that are within the scope of Topic 944,
Financial Services-Insurance
, are excluded from the scope of ASU 2014-09. Accordingly, this update did not impact the recognition of revenue related to insurance premiums or investment income, which represent a majority of our total revenues. The update impacted our loan review services revenue, which is the only revenue stream in scope of the update. We adopted this update on January 1, 2018 using the modified-retrospective approach and the impact was immaterial to our consolidated financial statements.
In January 2016, the FASB issued ASU 2016-01,
Financial Instruments - Overall: Recognition and Measurement of Financial Assets and Financial Liabilities
(Subtopic 825-10). This update requires certain equity investments to be measured at fair value with changes in fair value recognized in net income. This update also requires public entities to use the exit price notion when measuring the fair value of financial instruments for disclosure purposes. In addition, it requires entities to evaluate the need for a valuation allowance on a deferred tax asset related to available-for-sale investment securities in combination with the entities other deferred tax assets. We adopted this update effective January 1, 2018. The impact was immaterial to our consolidated financial statements.
In August 2016, the FASB issued ASU 2016-15,
Statement of Cash Flows
(Topic 230). This update is intended to reduce diversity in practice in how certain cash receipts and cash payments are presented and classified in the statement of cash flows. We adopted this update effective January 1, 2018 and the adoption had no impact on our consolidated financial statements.
In August 2016, the FASB issued ASU 2016-16,
Income Taxes- Intra-Entity Transfers of Assets Other Than Inventory
(Topic 740). This update is intended to improve the accounting for the income tax consequences of intra-entity transfers of assets other than inventory. We adopted this update effective January 1, 2018 and the adoption had no impact on our consolidated financial statements.
In January 2017, the FASB issued ASU 2017-04,
Intangibles - Goodwill and Other
(Topic 350). This update is intended to simplify the test for goodwill impairment. We adopted this update effective January 1, 2018 and the adoption had no impact on our consolidated financial statements.
In March 2017, the FASB issued ASU 2017-08,
Receivables - Nonrefundable Fees and Other Costs
(Subtopic 310-20). This update shortened the amortization period for the premium on certain purchased callable debt securities to the earliest call date. We adopted this update effective January 1, 2018 and the adoption had no impact on our consolidated financial statements.
In February 2018, the FASB issued ASU 2018-02,
Reclassification of
Ce
rtain Tax Effects from Accumulated Other Comprehensive Income
(Topic 220). This update permits a company to reclassify the disproportionate income tax effects as a result of the TCJA on items within accumulated other comprehensive income (AOCI) to retained earnings.
This standard will take effect for public business entities for fiscal years, and interim periods within those fiscal years, beginning after December 15, 2018. Early adoption is permitted.
We adopted this update on January 1, 2018 and adjusted the disproportionate incom
e tax effects, or "stranded tax effects," resulting in a
$0.3 million
reduction to our beginning retained earnings as of January 1, 2018.
Recent Accounting Pronouncements - Not Yet Adopted
In February 2016, the FASB issued ASU 2016-02,
Leases
(Topic 842). This update requires that businesses recognize rights and obligations associated with certain leases as assets and liabilities on the balance sheet. The standard also requires additional disclosures regarding the amount, timing, and uncertainty of cash flows arising from leases. For public business entities, this update is effective for annual periods beginning after December 15, 2018 and interim periods therein. We adopted this update on January 1, 2019 using the modified-retrospective method and applied it prospectively as of the effective date, without adjusting comparative periods presented as permitted by ASU 2018-11, Leases (Topic 842),
Targeted Improvement
. At adoption, our assets and liabilities each increased by approximately
$7.6 million
in connection with the recognition of right-of-use assets and lease liabilities, primarily
82
NMI HOLDINGS, INC.
NOTES TO CONSOLIDATED FINANCIAL STATEMENTS
DECEMBER 31, 2018
related to the operating lease on our corporate headquarters. Adoption of this standard is not expected to have a material impact to our consolidated statements of operations or cash flows.
In June 2016, the FASB issued ASU 2016-13,
Financial Instruments-Credit Losses
(Topic 326). This update requires companies to measure all expected credit losses for financial assets held at the reporting date. The standard also amends the accounting for credit losses on available-for-sale debt securities and purchased financial assets with credit deterioration. The standard will take effect for public business entities for fiscal years, and interim periods within those fiscal years, beginning after December 15, 2019. We are currently reviewing the impacts the adoption of this guidance will have, on any financial assets. We do not expect it to impact our accounting for insurance claims and claims expenses as these items are not in the scope of this ASU.
In July 2017, the FASB issued ASU 2017-11,
Earnings Per Share
(Topic 260),
Distinguishing Liabilities from Equity
(Topic 480), and
Derivatives and Hedging
(Topic 815). This update is intended to simplify the accounting for certain equity-linked financial instruments. The standard will take effect for public business entities for fiscal years, and interim periods within those fiscal years, beginning after December 15, 2018. Early adoption is permitted. The guidance must be applied using a full or modified retrospective approach. We adopted this ASU on January 1, 2019, and have determined that it has no impact on our consolidated financial statements.
In June 2018, the FASB issued ASU 2018-07,
Compensation-Stock Compensation (Topic 718).
This update expands the scope of Topic 718 to include share-based payments made to non-employees in connection with the acquisition of goods and services. The standard will take effect for public business entities for fiscal years, beginning after December 15, 2019, and interim periods within fiscal years, beginning after December 15, 2020. We adopted this ASU on January 1, 2019, and have determined that it has no impact on our financial results at this time as we have not made any share-based grants to non-employees as defined in ASC 718-10-20.
In August 2018, the FASB issued ASU 2018-12,
Targeted Improvements to the Accounting for Long-Duration Contracts
. This update provides guidance to the existing recognition, measurement, presentation and disclosure requirements for long-duration contracts issued by an insurance entity. The standard will take effect for public business entities for fiscal years, and interim periods within those fiscal years, beginning after December 15, 2020. We are currently evaluating the impact the adoption of this ASU will have, if any, on our consolidated financial statements.
In August 2018, the FASB issued ASU 2018-13,
Fair Value Measurement
(Topic 820). This update modifies the fair value measurement disclosure requirements of ASC 820. The standard will take effect for public business entities for fiscal years, and interim periods within those fiscal years, beginning after December 15, 2019. We are currently evaluating the impact the adoption of this ASU will have, if any, on our fair value of financial instruments disclosures.
In August 2018, the FASB issued ASU 2018-15,
Intangibles - Goodwill and Other - Internal-Use Software
(Subtopic 350-40). This update applies to cloud computing arrangements hosted by a vendor and provides companies with guidance on the criteria for capitalizing implementation, set-up and other up-front costs incurred in association with these arrangements. The standard will take effect for public business entities for fiscal years, and interim periods within those fiscal years, beginning after December 15, 2019. We are currently evaluating the impact the adoption of this ASU will have, if any, on our consolidated financial statements.
3. Investments
We have designated our investment portfolio as available-for-sale and report it at fair value. The related unrealized gains and losses are, after considering the related tax expense or benefit, recognized through comprehensive income and loss, and on an accumulated basis in shareholders' equity. Net realized investment gains and losses are reported in earnings based on specific identification of securities sold or other-than-temporarily impaired.
83
NMI HOLDINGS, INC.
NOTES TO CONSOLIDATED FINANCIAL STATEMENTS
DECEMBER 31, 2018
Fair Values and Gross Unrealized Gains and Losses on Investments
|
Amortized
Cost |
Gross Unrealized
|
Fair
Value |
|||||||||||||
|
Gains
|
Losses
|
||||||||||||||
|
As of December 31, 2018
|
(In Thousands)
|
||||||||||||||
|
U.S. Treasury securities and obligations of U.S. government agencies
|
$
|
48,171
|
|
$
|
35
|
|
$
|
(1,376
|
)
|
$
|
46,830
|
|
|||
|
Municipal debt securities
|
92,014
|
|
206
|
|
(963
|
)
|
91,257
|
|
|||||||
|
Corporate debt securities
|
554,079
|
|
847
|
|
(11,688
|
)
|
543,238
|
|
|||||||
|
Asset-backed securities
|
171,990
|
|
792
|
|
(1,457
|
)
|
171,325
|
|
|||||||
|
Total bonds
|
866,254
|
|
1,880
|
|
(15,484
|
)
|
852,650
|
|
|||||||
|
Short-term investments
|
58,733
|
|
107
|
|
—
|
|
58,840
|
|
|||||||
|
Total investments
|
$
|
924,987
|
|
$
|
1,987
|
|
$
|
(15,484
|
)
|
$
|
911,490
|
|
|||
|
Amortized
Cost |
Gross Unrealized
|
Fair
Value |
|||||||||||||
|
Gains
|
Losses
|
||||||||||||||
|
As of December 31, 2017
|
(In Thousands)
|
||||||||||||||
|
U.S. Treasury securities and obligations of U.S. government agencies
|
$
|
65,669
|
|
$
|
—
|
|
$
|
(981
|
)
|
$
|
64,688
|
|
|||
|
Municipal debt securities
|
89,973
|
|
534
|
|
(659
|
)
|
89,848
|
|
|||||||
|
Corporate debt securities
|
435,562
|
|
4,231
|
|
(1,958
|
)
|
437,835
|
|
|||||||
|
Asset-backed securities
|
100,153
|
|
916
|
|
(125
|
)
|
100,944
|
|
|||||||
|
Total bonds
|
691,357
|
|
5,681
|
|
(3,723
|
)
|
693,315
|
|
|||||||
|
Long-term investments - other
|
353
|
|
—
|
|
—
|
|
353
|
|
|||||||
|
Short-term investments
|
22,149
|
|
58
|
|
—
|
|
22,207
|
|
|||||||
|
Total investments
|
$
|
713,859
|
|
$
|
5,739
|
|
$
|
(3,723
|
)
|
$
|
715,875
|
|
|||
We did not own any mortgage-backed securities in our asset-backed portfolio as December 31, 2018 and 2017.
The following table presents a breakdown of the fair value of our corporate debt securities by issuer industry group as of December 31, 2018 and 2017:
|
December 31, 2018
|
December 31, 2017
|
||||
|
Financial
|
38
|
%
|
43
|
%
|
|
|
Consumer
|
27
|
|
21
|
|
|
|
Communications
|
12
|
|
12
|
|
|
|
Industrial
|
7
|
|
5
|
|
|
|
Utilities
|
7
|
|
1
|
|
|
|
Technology
|
6
|
|
10
|
|
|
|
Energy
|
2
|
|
3
|
|
|
|
Other
|
1
|
|
5
|
|
|
|
Total
|
100
|
%
|
100
|
%
|
|
As of
December 31, 2018
and
December 31, 2017
, approximately
$5.3 million
and
$7.0 million
of our cash and investments were held in the form of U.S. Treasury securities on deposit with various state insurance departments to satisfy regulatory requirements.
Scheduled Maturities
The amortized cost and fair values of available-for-sale securities as of
December 31, 2018
and
December 31, 2017
, by contractual maturity, are shown below. Expected maturities will differ from contractual maturities because issuers may have the
84
NMI HOLDINGS, INC.
NOTES TO CONSOLIDATED FINANCIAL STATEMENTS
DECEMBER 31, 2018
right to call or prepay obligations with or without call or prepayment penalties. Because most asset-backed securities provide for periodic payments throughout their lives, they are listed below in a separate category.
|
As of December 31, 2018
|
Amortized
Cost |
Fair
Value |
|||||
|
(In Thousands)
|
|||||||
|
Due in one year or less
|
$
|
76,087
|
|
$
|
76,104
|
|
|
|
Due after one through five years
|
352,282
|
|
347,701
|
|
|||
|
Due after five through ten years
|
318,728
|
|
310,633
|
|
|||
|
Due after ten years
|
5,900
|
|
5,727
|
|
|||
|
Asset-backed securities
|
171,990
|
|
171,325
|
|
|||
|
Total investments
|
$
|
924,987
|
|
$
|
911,490
|
|
|
|
As of December 31, 2017
|
Amortized
Cost |
Fair
Value |
|||||
|
(In Thousands)
|
|||||||
|
Due in one year or less
|
$
|
97,406
|
|
$
|
97,394
|
|
|
|
Due after one through five years
|
195,795
|
|
195,626
|
|
|||
|
Due after five through ten years
|
305,798
|
|
306,930
|
|
|||
|
Due after ten years
|
14,707
|
|
14,981
|
|
|||
|
Asset-backed securities
|
100,153
|
|
100,944
|
|
|||
|
Total investments
|
$
|
713,859
|
|
$
|
715,875
|
|
|
Aging of Unrealized Losses
As of
December 31, 2018
, the investment portfolio had gross unrealized losses of
$15.5 million
,
$10.4 million
of which has been in an unrealized loss position for a period of 12 months or greater. We did not consider these securities to be other-than-temporarily impaired as of
December 31, 2018
. We based our conclusion that these investments were not other-than-temporarily impaired as of
December 31, 2018
on the following facts: (i) the unrealized losses were primarily caused by interest rate movements and market fluctuations in credit spreads since the purchase date, (ii) we do not intend to sell these investments; and (iii) we do not believe that it is more likely than not that we will be required to sell these investments before recovery of our amortized cost basis, which may not occur until maturity. For those securities in an unrealized loss position, the length of time the securities were in such a position is as follows:
|
Less Than 12 Months
|
12 Months or Greater
|
Total
|
||||||||||||||||||||||||
|
# of Securities
|
Fair Value
|
Unrealized Losses
|
# of Securities
|
Fair Value
|
Unrealized Losses
|
# of Securities
|
Fair Value
|
Unrealized Losses
|
||||||||||||||||||
|
As of December 31, 2018
|
(Dollars in Thousands)
|
|||||||||||||||||||||||||
|
U.S. Treasury securities and obligations of U.S. government agencies
|
—
|
|
$
|
—
|
|
$
|
—
|
|
19
|
|
$
|
41,817
|
|
$
|
(1,376
|
)
|
19
|
|
$
|
41,817
|
|
$
|
(1,376
|
)
|
||
|
Municipal debt securities
|
4
|
|
7,409
|
|
(11
|
)
|
31
|
|
58,658
|
|
(952
|
)
|
35
|
|
66,067
|
|
(963
|
)
|
||||||||
|
Corporate debt securities
|
118
|
|
226,477
|
|
(3,952
|
)
|
126
|
|
221,675
|
|
(7,736
|
)
|
244
|
|
448,152
|
|
(11,688
|
)
|
||||||||
|
Asset-backed securities
|
25
|
|
36,017
|
|
(1,136
|
)
|
22
|
|
33,988
|
|
(321
|
)
|
47
|
|
70,005
|
|
(1,457
|
)
|
||||||||
|
Total
|
147
|
|
$
|
269,903
|
|
$
|
(5,099
|
)
|
198
|
|
$
|
356,138
|
|
$
|
(10,385
|
)
|
345
|
|
$
|
626,041
|
|
$
|
(15,484
|
)
|
||
85
NMI HOLDINGS, INC.
NOTES TO CONSOLIDATED FINANCIAL STATEMENTS
DECEMBER 31, 2018
|
Less Than 12 Months
|
12 Months or Greater
|
Total
|
||||||||||||||||||||||||
|
# of Securities
|
Fair Value
|
Unrealized Losses
|
# of Securities
|
Fair Value
|
Unrealized Losses
|
# of Securities
|
Fair Value
|
Unrealized Losses
|
||||||||||||||||||
|
As of December 31, 2017
|
(Dollars in Thousands)
|
|||||||||||||||||||||||||
|
U.S. Treasury securities and obligations of U.S. government agencies
|
16
|
|
$
|
29,806
|
|
$
|
(394
|
)
|
26
|
|
$
|
34,882
|
|
$
|
(587
|
)
|
42
|
|
$
|
64,688
|
|
$
|
(981
|
)
|
||
|
Municipal debt securities
|
21
|
|
38,628
|
|
(264
|
)
|
10
|
|
17,945
|
|
(395
|
)
|
31
|
|
56,573
|
|
(659
|
)
|
||||||||
|
Corporate debt securities
|
94
|
|
128,313
|
|
(829
|
)
|
23
|
|
48,978
|
|
(1,129
|
)
|
117
|
|
177,291
|
|
(1,958
|
)
|
||||||||
|
Asset-backed securities
|
22
|
|
27,947
|
|
(63
|
)
|
5
|
|
12,438
|
|
(62
|
)
|
27
|
|
40,385
|
|
(125
|
)
|
||||||||
|
Total
|
153
|
|
$
|
224,694
|
|
$
|
(1,550
|
)
|
64
|
|
$
|
114,243
|
|
$
|
(2,173
|
)
|
217
|
|
$
|
338,937
|
|
$
|
(3,723
|
)
|
||
Net Investment Income
The following table presents the components of net investment income:
|
For the year ended December 31,
|
|||||||||||
|
2018
|
2017
|
2016
|
|||||||||
|
(In Thousands)
|
|||||||||||
|
Investment income
|
$
|
24,342
|
|
$
|
17,046
|
|
$
|
14,503
|
|
||
|
Investment expenses
|
(804
|
)
|
(773
|
)
|
(752
|
)
|
|||||
|
Net investment income
|
$
|
23,538
|
|
$
|
16,273
|
|
$
|
13,751
|
|
||
The following table presents the components of net realized investment gains (losses):
|
For the year ended December 31,
|
|||||||||||
|
2018
|
2017
|
2016
|
|||||||||
|
(In Thousands)
|
|||||||||||
|
Gross realized investment gains
|
$
|
525
|
|
$
|
546
|
|
$
|
748
|
|
||
|
Gross realized investment losses
|
(468
|
)
|
(338
|
)
|
(1,441
|
)
|
|||||
|
Net realized investment gains (losses)
|
$
|
57
|
|
$
|
208
|
|
$
|
(693
|
)
|
||
Investment Securities - Other-than-Temporary Impairment (OTTI)
As of
December 31, 2018
, 2017 and 2016, we held no other-than-temporarily impaired securities. For the years ended December 31, 2018 and 2016 we did not recognize any OTTI losses. For the year ended December 31, 2017, we recognized
$0.1 million
of OTTI losses in earnings. There were no credit losses recognized in earnings for which a portion of an OTTI loss was recognized in accumulated other comprehensive income (loss) for any period presented.
4. Fair Value of Financial Instruments
The following describes the valuation techniques used by us to determine the fair value of our financial instruments:
We established a fair value hierarchy by prioritizing the inputs to valuation techniques used to measure fair value. The hierarchy gives the highest priority to unadjusted quoted prices in active markets for identical assets or liabilities (Level 1 measurements) and the lowest priority to unobservable inputs (Level 3 measurements). The three levels of the fair value hierarchy under this standard are described below:
Level 1 - Fair value measurements based on quoted prices in active markets that we have the ability to access for identical assets or liabilities. Market price data generally is obtained from exchange or dealer markets. We do not adjust the quoted price for such instruments.
Level 2 - Fair value measurements based on inputs other than quoted prices included in Level 1 that are observable for the asset or liability, either directly or indirectly. Level 2 inputs include quoted prices for similar assets and liabilities in active markets, quoted prices for identical or similar assets or liabilities in markets that are not active, and inputs other than quoted
86
NMI HOLDINGS, INC.
NOTES TO CONSOLIDATED FINANCIAL STATEMENTS
DECEMBER 31, 2018
prices that are observable for the asset or liability, such as interest rates and yield curves that are observable at commonly quoted intervals.
Level 3 - Fair value measurements based on valuation techniques that use significant inputs that are unobservable. Both observable and unobservable inputs may be used to determine the fair values of positions classified in Level 3. The circumstances for using these measurements include those in which there is little, if any, market activity for the asset or liability. Therefore, we must make certain assumptions, which require significant management judgment or estimation about the inputs a hypothetical market participant would use to value that asset or liability.
In certain cases, the inputs used to measure fair value may fall into different levels of the fair value hierarchy. In such cases, the level in the fair value hierarchy is determined based on the lowest level input that is significant to the fair value measurement in its entirety.
Assets classified as Level 1 and Level 2
To determine the fair value of securities available-for-sale in Level 1 and Level 2 of the fair value hierarchy, independent pricing sources have been utilized. One price is provided per security based on observable market data. To ensure securities are appropriately classified in the fair value hierarchy, we review the pricing techniques and methodologies of the independent pricing sources and believe that their policies adequately consider market activity, either based on specific transactions for the issue valued or based on modeling of securities with similar credit quality, duration, yield and structure that were recently traded. A variety of inputs are utilized by the independent pricing sources including benchmark yields, reported trades, non-binding broker/dealer quotes, issuer spreads, two sided markets, benchmark securities, bids, offers and reference data including data published in market research publications. Inputs may be weighted differently for any security, and not all inputs are used for each security evaluation. Market indicators, industry and economic events are also considered. This information is evaluated using a multidimensional pricing model. Quality controls are performed by the independent pricing sources throughout this process, which include reviewing tolerance reports, trading information and data changes, and directional moves compared to market moves. This model combines all inputs to arrive at a value assigned to each security. We have not made any adjustments to the prices obtained from the independent pricing sources.
Liabilities classified as Level 3
We calculate the fair value of outstanding warrants utilizing Level 3 inputs, including a Black-Scholes option-pricing model, in combination with a binomial model, and we value the pricing protection features within the warrants using a Monte-Carlo simulation model. Variables in the model include the risk-free rate of return, dividend yield, expected life and expected volatility of our stock price.
The following tables present the level within the fair value hierarchy at which our financial instruments were measured:
|
Fair Value Measurements Using
|
|||||||||||||||
|
Quoted Prices in
Active Markets for Identical Assets (Level 1) |
Significant Other
Observable Inputs (Level 2) |
Significant
Unobservable Inputs (Level 3) |
Fair Value
|
||||||||||||
|
As of December 31, 2018
|
(In Thousands)
|
||||||||||||||
|
U.S. Treasury securities and obligations of U.S. government agencies
|
$
|
46,830
|
|
$
|
—
|
|
$
|
—
|
|
$
|
46,830
|
|
|||
|
Municipal debt securities
|
—
|
|
91,257
|
|
—
|
|
91,257
|
|
|||||||
|
Corporate debt securities
|
—
|
|
543,238
|
|
—
|
|
543,238
|
|
|||||||
|
Asset-backed securities
|
—
|
|
171,325
|
|
—
|
|
171,325
|
|
|||||||
|
Cash, cash equivalents and short-term investments
|
84,134
|
|
|
|
84,134
|
|
|||||||||
|
Total assets
|
$
|
130,964
|
|
$
|
805,820
|
|
$
|
—
|
|
$
|
936,784
|
|
|||
|
Warrant liability
|
—
|
|
—
|
|
7,296
|
|
7,296
|
|
|||||||
|
Total liabilities
|
$
|
—
|
|
$
|
—
|
|
$
|
7,296
|
|
$
|
7,296
|
|
|||
87
NMI HOLDINGS, INC.
NOTES TO CONSOLIDATED FINANCIAL STATEMENTS
DECEMBER 31, 2018
|
Fair Value Measurements Using
|
|||||||||||||||
|
Quoted Prices in
Active Markets for Identical Assets (Level 1) |
Significant Other
Observable Inputs (Level 2) |
Significant
Unobservable Inputs (Level 3) |
Fair Value
|
||||||||||||
|
As of December 31, 2017
|
(In Thousands)
|
||||||||||||||
|
U.S. Treasury securities and obligations of U.S. government agencies
|
$
|
59,844
|
|
$
|
4,844
|
|
$
|
—
|
|
$
|
64,688
|
|
|||
|
Municipal debt securities
|
—
|
|
89,848
|
|
—
|
|
89,848
|
|
|||||||
|
Corporate debt securities
|
—
|
|
437,835
|
|
—
|
|
437,835
|
|
|||||||
|
Asset-backed securities
|
—
|
|
100,944
|
|
—
|
|
100,944
|
|
|||||||
|
Long-term investment - other
|
353
|
|
—
|
|
—
|
|
353
|
|
|||||||
|
Cash, cash equivalents and short-term investments
|
41,403
|
|
—
|
|
—
|
|
41,403
|
|
|||||||
|
Total assets
|
$
|
101,600
|
|
$
|
633,471
|
|
$
|
—
|
|
$
|
735,071
|
|
|||
|
Warrant liability
|
—
|
|
—
|
|
7,472
|
|
7,472
|
|
|||||||
|
Total liabilities
|
$
|
—
|
|
$
|
—
|
|
$
|
7,472
|
|
$
|
7,472
|
|
|||
There were no transfers between Level 1 and Level 2, nor any transfers in or out of Level 3, of the fair value hierarchy during the years ended
December 31, 2018
and 2017.
The following is a roll-forward of Level 3 liabilities measured at fair value:
|
For the year ended December 31,
|
|||||||||||
|
2018
|
2017
|
2016
|
|||||||||
|
(In Thousands)
|
|||||||||||
|
Balance, January 1
|
$
|
7,472
|
|
$
|
3,367
|
|
$
|
1,467
|
|
||
|
Change in fair value of warrant liability included in earnings
|
1,397
|
|
4,105
|
|
1,900
|
|
|||||
|
Issuance of common stock on warrant exercise
|
(1,573
|
)
|
—
|
|
—
|
|
|||||
|
Balance, December 31
|
$
|
7,296
|
|
$
|
7,472
|
|
$
|
3,367
|
|
||
The following table outlines the key inputs and assumptions used to calculate the fair value of the warrant liability in the Black-Scholes option-pricing model as of the dates indicated.
|
As of December 31,
|
|||||||||||
|
2018
|
2017
|
2016
|
|||||||||
|
Common Stock Price
|
$
|
17.85
|
|
$
|
17.00
|
|
$
|
10.65
|
|
||
|
Risk free interest rate
|
2.46 - 2.47%
|
|
1.99
|
%
|
1.78
|
%
|
|||||
|
Expected life
|
2.58 - 3.31 years
|
|
3.07 years
|
|
4.33 years
|
|
|||||
|
Expected volatility
|
41.1 - 42.5%
|
|
30.6
|
%
|
32.7
|
%
|
|||||
|
Dividend yield
|
—
|
%
|
—
|
%
|
—
|
%
|
|||||
The changes in fair value of the warrant liability for the years ended December 31, 2018, 2017, and 2016 are primarily attributable to changes in the price of our common stock during the respective periods with additional impact related to changes in the Black-Scholes model inputs and exercises of outstanding warrants.
Financial Instruments not Measured at Fair Value
At December 31, 2018 our 2018 Term Loan was carried at cost of
$146.8 million
, net of debt issuance costs of
$2.5 million
, and had a fair value of
$146.3 million
which is classified as a Level 2 instrument.
88
NMI HOLDINGS, INC.
NOTES TO CONSOLIDATED FINANCIAL STATEMENTS
DECEMBER 31, 2018
5. Debt
On May 24, 2018, we entered into the 2018 Credit Agreement, which provides for (i) the
$150 million
2018 Term Loan that matures on May 24, 2023; and (ii) the
$85 million
2018 Revolving Credit Facility that matures on May 24, 2021. Proceeds from the 2018 Term Loan were used to repay in full the outstanding amount due under the
$150 million
2015 Term Loan, and to pay fees and expenses incurred in connection with the 2018 Credit Agreement.
2018 Term Loan
The 2018 Term Loan bears interest at the Eurodollar Rate, as defined in the 2018 Credit Agreement and subject to a
1.00%
floor, plus an annual margin rate of
4.75%
, representing an all-in rate of
7.27%
as of
December 31, 2018
, payable monthly based on our current interest period election.
Quarterly
principal payments of
$375 thousand
are also required.
Interest expense for the year ended
December 31, 2018
includes amounts related to our interest payment, one-time financing costs and the amortization of issuance costs and original issue discount. For the year ended
December 31, 2018
, we recorded
$14.4 million
of interest expense, including
$2.2 million
of costs related to the extinguishment of the 2015 Term Loan and issuance of the 2018 Term Loan. Capitalized debt issuance costs totaling
$1.8 million
, including
$820 thousand
related to modified lenders from the 2015 Term Loan; and original issue discount totaling
$1.0 million
, including
$236 thousand
related to modified lenders from the 2015 Term Loan, are being amortized to interest expense using the effective interest method over the contractual life of the 2018 Term Loan. As of
December 31, 2018
, the remaining unamortized issuance costs and original issue discount totaled
$2.5 million
, and the outstanding principal balance of the 2018 Term Loan was
$149.3 million
.
We are subject to certain covenants under the 2018 Term Loan (as defined in the 2018 Credit Agreement), including (but not limited to) a maximum debt-to-total capitalization ratio (as defined in the 2018 Credit Agreement) of
35%
under the 2018 Term Loan. We were in compliance with all covenants as of
December 31, 2018
.
Future principal payments due under the 2018 Term Loan as of December 31, 2018 are as follows:
|
As of December 31, 2018
|
Principal
|
||||
|
(In thousands)
|
|||||
|
2019
|
$
|
1,500
|
|
||
|
2020
|
1,500
|
|
|||
|
2021
|
1,500
|
|
|||
|
2022
|
1,500
|
|
|||
|
2023
|
143,250
|
|
|||
|
Total
|
$
|
149,250
|
|
||
2018 Revolving Credit Facility
Borrowings under the 2018 Revolving Credit Facility may be used for general corporate purposes and will accrue interest at a variable rate equal to, at our discretion, (i) a base rate (as defined in the 2018 Credit Agreement, subject to a floor of
1.00%
per annum) plus a margin of
1.00%
to
2.50%
per annum, based on the applicable corporate credit rating at the time, or (ii) the Eurodollar Rate (subject to a floor of
0.00%
per annum) plus a margin of
2.00%
to
3.50%
per annum, based on the applicable corporate credit rating at the time.
As of December 31, 2018
, no borrowings had been made under the 2018 Revolving Credit Facility.
We are required to pay a quarterly commitment fee on the average daily undrawn amount of the 2018 Revolving Credit Facility, which ranges from
0.30%
to
0.60%
, based on the applicable corporate credit rating at the time.
As of December 31, 2018
, the applicable commitment fee was
0.50%
. For the year ended December 31, 2018, we recorded
$0.3 million
of commitment fees in interest expense.
We incurred issuance costs of
$1.5 million
in connection with the establishment of the 2018 Revolving Credit Facility, which were deferred and recorded within Other Assets. These costs will be amortized through interest expense over the three-year life of the 2018 Revolving Credit Facility on a straight line basis. For the year ended
December 31, 2018
, we recognized
$0.3 million
of interest expense from the amortization of deferred issuance costs. At
December 31, 2018
, the remaining issuance costs were
$1.2 million
, net of accumulated amortization.
89
NMI HOLDINGS, INC.
NOTES TO CONSOLIDATED FINANCIAL STATEMENTS
DECEMBER 31, 2018
We are subject to certain covenants under the 2018 Revolving Credit Facility, including (but not limited to) the following: a maximum debt-to-total capitalization ratio of
35%
, a minimum liquidity requirement, compliance with the PMIERs financial requirements (subject to any GSE-approved waivers), and minimum consolidated net worth and statutory capital requirements (respectively, as defined therein). We were in compliance with all covenants as of
December 31, 2018
.
6. Reinsurance
We enter into third-party reinsurance transactions to actively manage our risk, ensure PMIERs compliance and support the growth of our business. The GSEs and the Wisconsin OCI have approved all such transactions (subject to certain conditions and periodic ongoing review, including levels of approved capital credit).
The effect of our reinsurance agreements on premiums written and earned is as follows:
|
For the year ended
|
|||||||||||
|
December 31, 2018
|
December 31, 2017
|
December 31, 2016
|
|||||||||
|
(In Thousands)
|
|||||||||||
|
Net premiums written
|
|||||||||||
|
Direct
|
$
|
287,791
|
|
$
|
202,586
|
|
$
|
177,962
|
|
||
|
Ceded
(1)
|
(30,988
|
)
|
(28,914
|
)
|
(43,270
|
)
|
|||||
|
Net premiums written
|
$
|
256,803
|
|
$
|
173,672
|
|
$
|
134,692
|
|
||
|
Net premiums earned
|
|||||||||||
|
Direct
|
$
|
292,064
|
|
$
|
192,326
|
|
$
|
115,830
|
|
||
|
Ceded
(1)
|
(40,867
|
)
|
(26,586
|
)
|
(5,349
|
)
|
|||||
|
Net premiums earned
|
$
|
251,197
|
|
$
|
165,740
|
|
$
|
110,481
|
|
||
|
(1)
|
Net of profit commission.
|
Excess-of-loss reinsurance
2017 ILN Transaction
In May 2017, NMIC entered into a reinsurance agreement with Oaktown Re, which provides for up to
$211.3 million
of aggregate excess-of-loss reinsurance coverage at inception for new delinquencies on an existing portfolio of mortgage insurance policies written from 2013 through December 31, 2016. For the reinsurance coverage period, NMIC retains the first layer of
$126.8 million
of aggregate losses, of which
$125.2 million
remained at
December 31, 2018
, and Oaktown Re then provides second layer coverage up to the outstanding reinsurance coverage amount. NMIC then retains losses in excess of the outstanding reinsurance coverage amount. The outstanding reinsurance coverage amount decreases from
$211.3 million
at inception over a
ten
-year period as the underlying covered mortgages are amortized or repaid, and/or the mortgage insurance coverage is canceled and was
$131.1
million as of
December 31, 2018
. The outstanding reinsurance coverage amount will stop amortizing if certain credit enhancement or delinquency thresholds are triggered.
Oaktown Re financed the coverage by issuing mortgage insurance-linked notes in an aggregate amount of
$211.3 million
to unaffiliated investors (the 2017 Notes). The 2017 Notes mature on April 26, 2027. All of the proceeds paid to Oaktown Re from the sale of the 2017 Notes were deposited into a reinsurance trust to collateralize and fund the obligations of Oaktown Re to NMIC under the reinsurance agreement. Funds in the reinsurance trust account are required to be invested in high credit quality money market funds at all times. We refer collectively to NMIC's reinsurance agreement with Oaktown Re and the issuance of the 2017 Notes by Oaktown Re as the 2017 ILN Transaction. Under the terms of the 2017 ILN Transaction, NMIC makes risk premium payments for the applicable outstanding reinsurance coverage amount and pays Oaktown Re for anticipated operating expenses (capped at
$300 thousand
per year). NMIC ceded risk premiums of
$6.3 million
and
$5.0 million
and did not cede any losses to Oaktown Re for the years ended December 31, 2018 and 2017, respectively.
Under the reinsurance agreement, NMIC holds an optional termination right if certain events occur, including, among others, a clean-up call if the outstanding reinsurance coverage amount amortizes to
10%
or less of the reinsurance coverage amount at inception or if NMIC reasonably determines that changes to GSE or rating agency asset requirements would cause a material and adverse effect on the capital treatment afforded to NMIC under the agreement. In addition, there are certain events that will result
90
NMI HOLDINGS, INC.
NOTES TO CONSOLIDATED FINANCIAL STATEMENTS
DECEMBER 31, 2018
in mandatory termination of the agreement, including NMIC's failure to pay premiums or consent to reductions in the trust account to make principal payments to noteholders, among others.
2018 ILN Transaction
In July 2018, NMIC entered into a reinsurance agreement with Oaktown Re II, which provides for up to
$264.5 million
of aggregate excess-of-loss reinsurance coverage at inception for new delinquencies on an existing portfolio of mortgage insurance policies written between January 1, 2017 and May 31, 2018. For the reinsurance coverage period, NMIC retains the first layer of
$125.3 million
of aggregate losses, of which
$125.3 million
remained at
December 31, 2018
, and Oaktown Re II then provides second layer coverage up to the outstanding reinsurance coverage amount. NMIC then retains losses in excess of the outstanding reinsurance coverage amount. The outstanding reinsurance coverage amount decreases from
$264.5 million
at inception over a ten-year period as the underlying covered mortgages are amortized or repaid, and/or the mortgage insurance coverage is canceled, and was
$264.5 million
as of December 31, 2018. The outstanding reinsurance coverage amount will begin amortizing after an initial period in which a target level of credit enhancement is obtained and will stop amortizing if certain credit enhancement or delinquency thresholds are triggered.
Oaktown Re II financed the coverage by issuing mortgage insurance-linked notes in an aggregate amount of
$264.5 million
to unaffiliated investors (the 2018 Notes). The 2018 Notes mature on July 25, 2028. All of the proceeds paid to Oaktown Re II from the sale of the 2018 Notes were deposited into a reinsurance trust to collateralize and fund the obligations of Oaktown Re II to NMIC under the reinsurance agreement. Funds in the reinsurance trust account are required to be invested in high credit quality money market funds at all times. We refer collectively to NMIC's reinsurance agreement with Oaktown Re II and the issuance of the 2018 Notes by Oaktown Re as the 2018 ILN Transaction. Under the terms of the 2018 ILN Transaction, NMIC makes risk premium payments for the applicable outstanding reinsurance coverage amount and pays Oaktown Re II for anticipated operating expenses (capped at
$250 thousand
per year). For the year ended
December 31, 2018
, NMIC ceded risk premiums of
$3.3 million
and did not cede any losses to Oaktown Re.
Under the reinsurance agreement, NMIC holds an optional termination right if certain events occur, including, among others, a clean-up call if the outstanding reinsurance coverage amount amortizes to
10%
or less of the reinsurance coverage amount at inception or if NMIC reasonably determines that changes to GSE or rating agency asset requirements would cause a material and adverse effect on the capital treatment afforded to NMIC under the agreement. In addition, there are certain events that will result in mandatory termination of the agreement, including NMIC's failure to pay premiums or consent to reductions in the trust account to make principal payments to noteholders, among others.
Under the terms of the 2018 ILN Transaction, we are required to maintain a certain level of restricted funds in a premium deposit account with Bank of New York Mellon until the 2018 Notes have been redeemed in full. "Cash and cash equivalents" on our balance sheet includes restricted cash of
$1.4 million
as of
December 31, 2018
. We are not required to deposit additional funds into the premium deposit account and the restricted balance will decrease over time as the principal balance of the 2018 Notes declines.
Quota share reinsurance
2016 QSR Transaction
Effective September 1, 2016, NMIC entered into the 2016 QSR Transaction with a panel of third-party reinsurers. Each of the third-party reinsurers has an insurer financial strength rating of A- or better by S&P, AM Best or both.
Under the 2016 QSR Transaction, NMIC ceded premiums written related to:
|
•
|
25%
of existing risk written on eligible policies as of August 31, 2016;
|
|
•
|
100%
of existing risk under our pool agreement with Fannie Mae; and
|
|
•
|
25%
of risk on eligible policies written from September 1, 2016 through December 31, 2017.
|
The 2016 QSR Transaction is scheduled to terminate on December 31, 2027, except with respect to the ceded pool risk, which is scheduled to terminate on August 31, 2023. However, NMIC has the option, based on certain conditions and subject to a termination fee, to terminate the agreement as of December 31, 2020, or at the end of any calendar quarter thereafter, which would result in NMIC reassuming the related risk.
91
NMI HOLDINGS, INC.
NOTES TO CONSOLIDATED FINANCIAL STATEMENTS
DECEMBER 31, 2018
2018 QSR Transaction
Effective January 1, 2018, NMIC entered into the 2018 QSR Transaction with a panel of third-party reinsurers. Each of the third-party reinsurers has an insurer financial strength rating of A- or better by S&P, AM Best or both. Under the 2018 QSR Transaction, NMIC cedes premiums earned related to
25%
of risk on eligible policies written in 2018 and will cede premiums earned related to
20%
of risk on eligible policies written in 2019. The 2018 QSR Transaction is scheduled to terminate on December 31, 2029. However, NMIC has the option, based on certain conditions and subject to a termination fee, to terminate the agreement as of December 31, 2022, or at the end of any calendar quarter thereafter, which would result in NMIC reassuming the related risk.
NMIC may terminate either or both of the QSR Transactions without penalty if, due to a change in PMIERs requirements, it is no longer able to take full PMIERs asset credit for the RIF ceded under the respective agreements. NMIC has additional termination rights under the QSR Transactions, whereby it may elect to selectively terminate its engagement with individual reinsurers under the agreements on a run-off basis (
i.e.
, reinsurers continue providing coverage on all risk ceded prior to the termination date, with no new cessions going forward) or cut-off basis (
i.e.
, the reinsurance arrangement is completely terminated with NMIC recapturing all previously ceded risk) under certain circumstances. Such selective termination rights arise when, among other reasons, a reinsurer experiences a deterioration in its capital position below a prescribed threshold and/or a reinsurer breaches (and fails to cure) its collateral posting obligations under the relevant agreement.
The following table shows the amounts related to the QSR Transactions:
|
For the year ended
|
||||||||||
|
December 31, 2018
|
December 31, 2017
|
December 31, 2016
|
||||||||
|
(In Thousands)
|
||||||||||
|
Ceded risk-in-force
|
$
|
4,292,450
|
|
$
|
2,983,353
|
|
$
|
2,008,385
|
|
|
|
Ceded premiums written
|
(64,188
|
)
|
(51,948
|
)
|
(50,553
|
)
|
||||
|
Ceded premiums earned
|
(74,068
|
)
|
(49,619
|
)
|
(12,632
|
)
|
||||
|
Ceded claims and claims expenses
|
1,763
|
|
1,687
|
|
297
|
|
||||
|
Ceding commission written
|
12,838
|
|
10,390
|
|
10,111
|
|
||||
|
Ceding commission earned
|
14,585
|
|
9,806
|
|
2,303
|
|
||||
|
Profit commission
|
42,846
|
|
28,084
|
|
7,283
|
|
||||
Ceded premiums written under the 2016 QSR Transaction are recorded on the balance sheet as prepaid reinsurance premiums and amortized to ceded premiums earned in a manner consistent with the recognition of revenue on direct premiums. Under the 2018 QSR Transaction, premiums are ceded on an earned basis as defined in the agreement. NMIC receives a
20%
ceding commission for premiums ceded under the QSR Transactions. NMIC also receives a profit commission, provided that the loss ratio on the loans covered under the 2016 QSR Transaction and 2018 QSR Transaction generally remains below
60%
and
61%
, respectively, as measured annually. Ceded claims and claim expenses under the QSR Transactions reduce NMIC's profit commission on a dollar-for-dollar basis.
In accordance with the terms of the 2016 QSR Transaction, rather than making a cash payment or transferring investments for ceded premiums written, NMIC established a funds withheld liability, which also includes amounts due to NMIC for ceding and profit commissions. Any loss recoveries and any potential profit commission to NMIC will be realized from this account until exhausted. NMIC's reinsurance recoverable balance is further supported by trust accounts established and maintained by each reinsurer in accordance with the PMIERs funding requirements for risk ceded to non-affiliates. The reinsurance recoverable on loss reserves related to our 2016 QSR Transaction was
$2.8 million
as of
December 31, 2018
.
In accordance with the terms of the 2018 QSR Transaction, cash payments for ceded premiums earned are settled on a quarterly basis, offset by amounts due to NMIC for ceding and profit commissions. Any loss recoveries and any potential profit commission to NMIC are also settled quarterly. NMIC's reinsurance recoverable balance is supported by trust accounts established and maintained by each reinsurer in accordance with the PMIERs funding requirements for risk ceded to non-affiliates. The reinsurance recoverable on loss reserves related to our 2018 QSR Transaction was
$0.2 million
as of
December 31, 2018
.
7. Reserves for Insurance Claims and Claim Expenses
We establish reserves to recognize the estimated liability for insurance claims and claim expenses related to defaults on insured mortgage loans. Consistent with industry practice, we establish reserves for loans that have been reported to us by servicers as having been in default for at least
60
days, referred to as case reserves, and additional loans that we estimate (based on actuarial
92
NMI HOLDINGS, INC.
NOTES TO CONSOLIDATED FINANCIAL STATEMENTS
DECEMBER 31, 2018
review) have been in default for at least
60
days that have not yet been reported to us by servicers, referred to as IBNR reserves. We also establish claims expense reserves, which represent the estimated cost of the claim administration process, including legal and other fees, as well as other general expenses of administering the claims settlement process. As of
December 31, 2018
, we had reserves for insurance claims and claims expenses of
$12.8 million
for
877
primary loans in default. For the year ended December 31, 2018, we paid
89
claims totaling
$3.2 million
, including
70
claims ceded under the 2016 QSR Transaction representing
$0.7
million of ceded claims and claims expenses. No claims were ceded under the 2018 QSR Transaction during the year ended December 31, 2018.
In 2013, we entered into a pool insurance transaction with Fannie Mae. The pool transaction includes a deductible, which represents the amount of claims to be absorbed by Fannie Mae before we are obligated to pay any claims. We only establish reserves for pool risk if we expect claims to exceed this deductible. At
December 31, 2018
,
55
loans in the pool were past due by 60 days or more. These
55
loans represented approximately
$3.4 million
of RIF. Due to the size of the remaining deductible, the low level of NODs reported on loans in the pool through December 31, 2018 and the expected severity (all loans in the pool have LTV ratios under
80%
), we did not have any case or IBNR reserves for pool risks at December 31, 2018 or December 31, 2017. In connection with the settlement of pool claims, we applied
$0.6 million
to the pool deductible through
December 31, 2018
. At December 31, 2018, the remaining pool deductible was
$9.7 million
. We have not paid any pool claims to date.
100%
of our pool RIF is reinsured under the 2016 QSR Transaction.
The following table provides a reconciliation of the beginning and ending reserve balances for primary insurance claims and claim expenses:
|
For the year ended
|
|||||||||||
|
December 31, 2018
|
December 31, 2017
|
December 31, 2016
|
|||||||||
|
(In Thousands)
|
|||||||||||
|
Beginning balance
|
$
|
8,761
|
|
$
|
3,001
|
|
$
|
679
|
|
||
|
Less reinsurance recoverables
(1)
|
(1,902
|
)
|
(297
|
)
|
—
|
|
|||||
|
Beginning balance, net of reinsurance recoverables
|
6,859
|
|
2,704
|
|
679
|
|
|||||
|
Add claims incurred:
|
|||||||||||
|
Claims and claim expenses incurred:
|
|||||||||||
|
Current year
(2)
|
7,860
|
|
6,140
|
|
2,457
|
|
|||||
|
Prior years
(3)
|
(2,408
|
)
|
(801
|
)
|
(65
|
)
|
|||||
|
Total claims and claims expenses incurred
|
5,452
|
|
5,339
|
|
2,392
|
|
|||||
|
Less claims paid:
|
|||||||||||
|
Claims and claim expenses paid:
|
|||||||||||
|
Current year
(2)
|
130
|
|
27
|
|
171
|
|
|||||
|
Prior years
(3)
|
2,371
|
|
1,157
|
|
196
|
|
|||||
|
Total claims and claim expenses paid
|
2,501
|
|
1,184
|
|
367
|
|
|||||
|
Reserve at end of period, net of reinsurance recoverables
|
9,810
|
|
6,859
|
|
2,704
|
|
|||||
|
Add reinsurance recoverables
(1)
|
3,001
|
|
1,902
|
|
297
|
|
|||||
|
Ending balance
|
$
|
12,811
|
|
$
|
8,761
|
|
$
|
3,001
|
|
||
|
(1)
|
Related to ceded losses recoverable on the QSR Transactions, included in "Other Assets" on the Consolidated Balance Sheets. See Note 6, "
Reinsurance
" for additional information.
|
|
(2)
|
Related to insured loans with their most recent defaults occurring in the current year. For example, if a loan had defaulted in a prior year and subsequently cured and later re-defaulted in the current year, that default would be included in the current year. Amounts are presented net of reinsurance.
|
|
(3)
|
Related to insured loans with defaults occurring in prior years, which have been continuously in default since that time. Amounts are presented net of reinsurance.
|
93
NMI HOLDINGS, INC.
NOTES TO CONSOLIDATED FINANCIAL STATEMENTS
DECEMBER 31, 2018
The "claims incurred" section of the table above shows claims and claim expenses incurred on NODs for current and prior years, including IBNR reserves and is presented net of reinsurance. The amount of claims incurred relating to current year NODs represents the estimated amount of claims and claims expenses to be ultimately paid on such loans in default. We recognized
$2.4 million
,
$0.8 million
, and
$0.1 million
of favorable prior year development during the year ended December 31, 2018, 2017 and 2016, respectively, due to NOD cures and ongoing analysis of recent loss development trends. We may increase or decrease our original estimates as we learn additional information about individual defaults and claims and continue to observe and analyze loss development trends in our portfolio. Gross reserves of
$2.7 million
related to prior year defaults remained as of
December 31, 2018
.
The following tables provide claim development data, by accident year and a reconciliation to the reserve for insurance claims and claims expenses.
|
Cumulative Incurred Claims and Allocated Claims Adjustment Expenses, net of Reinsurance
(1)
|
As of December 31, 2018
|
|||||||||||||||||||||||||||||
|
Accident Year
|
2013
|
2014
|
2015
|
2016
|
2017
|
2018
|
Total of IBNR
|
NODs
(2)
|
||||||||||||||||||||||
|
($ Values In Thousands)
|
||||||||||||||||||||||||||||||
|
2013
|
$
|
—
|
|
$
|
—
|
|
$
|
—
|
|
$
|
—
|
|
$
|
—
|
|
$
|
—
|
|
$
|
—
|
|
—
|
|
|||||||
|
2014
|
83
|
|
34
|
|
4
|
|
4
|
|
4
|
|
—
|
|
—
|
|
||||||||||||||||
|
2015
|
699
|
|
664
|
|
743
|
|
764
|
|
2
|
|
2
|
|
||||||||||||||||||
|
2016
|
2,394
|
|
1,568
|
|
1,790
|
|
5
|
|
7
|
|
||||||||||||||||||||
|
2017
|
6,028
|
|
3,475
|
|
100
|
|
134
|
|
||||||||||||||||||||||
|
2018
|
7,779
|
|
551
|
|
734
|
|
||||||||||||||||||||||||
|
Total
|
|
$
|
13,812
|
|
$
|
658
|
|
877
|
|
|||||||||||||||||||||
|
(1)
|
Amounts include case and IBNR reserves.
|
|
(2)
|
The number of NODs outstanding as of
December 31, 2018
is the total number of loans in default over 60 days for which we have established reserves.
|
|
Cumulative Paid Claims and Allocated Claims Adjustment Expenses, net of Reinsurance
|
|||||||||||||||||||||||
|
Accident Year
|
2013
|
2014
|
2015
|
2016
|
2017
|
2018
|
|||||||||||||||||
|
(In Thousands)
|
|||||||||||||||||||||||
|
2013
|
$
|
—
|
|
$
|
—
|
|
$
|
—
|
|
$
|
—
|
|
$
|
—
|
|
$
|
—
|
|
|||||
|
2014
|
—
|
|
4
|
|
4
|
|
4
|
|
4
|
|
|||||||||||||
|
2015
|
50
|
|
246
|
|
684
|
|
720
|
|
|||||||||||||||
|
2016
|
171
|
|
890
|
|
1,596
|
|
|||||||||||||||||
|
2017
|
27
|
|
1,655
|
|
|||||||||||||||||||
|
2018
|
$
|
—
|
|
130
|
|
||||||||||||||||||
|
Total
|
|
$
|
4,105
|
|
|||||||||||||||||||
94
NMI HOLDINGS, INC.
NOTES TO CONSOLIDATED FINANCIAL STATEMENTS
DECEMBER 31, 2018
|
Reconciliation of Disclosure of Incurred and Paid Claims Development to the Liability for Unpaid Claims and Claim Adjustment Expenses
|
||||
|
(In Thousands)
|
||||
|
As of December 31, 2018
|
||||
|
Cumulative Incurred Claims and Allocated Claims Adjustment Expenses, net of Reinsurance
|
$
|
13,812
|
|
|
|
Cumulative Paid Claims and Allocated Claims Adjustment Expenses, net of Reinsurance
|
4,105
|
|
||
|
Liabilities for unpaid claims and allocated claims adjustment expenses, net of reinsurance
|
9,707
|
|
||
|
Reinsurance recoverable on unpaid claims
|
3,001
|
|
||
|
Unallocated claims adjustment expenses
|
103
|
|
||
|
Total gross liability for unpaid claims and claim adjustment expenses
|
$
|
12,811
|
|
|
The following table shows, on average, the percentage of claims and allocated claims adjustment expenses paid over the years after a claim is incurred.
|
Average annual percentage payout of incurred claims and allocated claims adjustment expenses by age, net of reinsurance
|
|||||||||||||
|
Year 1
|
Year 2
|
Year 3
|
Year 4
|
Year 5
|
|||||||||
|
Claims duration disclosure
|
4%
|
38
|
%
|
94
|
%
|
97
|
%
|
100
|
%
|
||||
8. Earnings per Share (EPS)
Basic earnings per share is based on the weighted average number of shares of common stock outstanding. Diluted earnings per share is based on the weighted average number of shares of common stock outstanding and common stock equivalents that would be issuable upon the vesting of service based and performance and service based RSUs, and the exercise of vested and unvested stock options and outstanding warrants. The number of shares issuable for RSUs subject to performance and service based vesting requirements are only included in diluted shares if the relevant performance measurement period has commenced and results during such period meet the necessary performance criteria. The following table reconciles the net income and the weighted average shares of common stock outstanding used in the computations of basic and diluted earnings per share of common stock
|
For the year ended December 31,
|
|||||||||||
|
2018
|
2017
|
2016
|
|||||||||
|
(In Thousands, except for per share data)
|
|||||||||||
|
Net income
|
$
|
107,927
|
|
$
|
22,050
|
|
$
|
64,001
|
|
||
|
Basic weighted average shares outstanding
|
65,019
|
|
59,816
|
|
59,071
|
|
|||||
|
Basic earnings per share
|
$
|
1.66
|
|
$
|
0.37
|
|
$
|
1.08
|
|
||
|
Net income
|
$
|
107,927
|
|
$
|
22,050
|
|
$
|
64,001
|
|
||
|
Warrant gain, net of tax
|
—
|
|
—
|
|
—
|
|
|||||
|
Diluted net income
|
$
|
107,927
|
|
$
|
22,050
|
|
$
|
64,001
|
|
||
|
Basic weighted average shares outstanding
|
65,019
|
|
59,816
|
|
59,071
|
|
|||||
|
Dilutive effect of issuable shares
|
2,633
|
|
2,370
|
|
1,758
|
|
|||||
|
Diluted weighted average shares outstanding
|
67,652
|
|
62,186
|
|
60,829
|
|
|||||
|
Diluted earnings per share
|
$
|
1.60
|
|
$
|
0.35
|
|
$
|
1.05
|
|
||
|
Anti-dilutive securities
|
843
|
|
995
|
|
4,764
|
|
|||||
95
NMI HOLDINGS, INC.
NOTES TO CONSOLIDATED FINANCIAL STATEMENTS
DECEMBER 31, 2018
9. Warrants
We issued
992 thousand
warrants in connection with our Private Placement. Each warrant gives the holder thereof the right to purchase
one
share of common stock at an exercise price equal to
$10.00
. The warrants were issued with an aggregate fair value of
$5.1 million
. During the years ended December 31, 2018 and 2017,
151 thousand
and
55 thousand
warrants were exercised, respectively, resulting in
91 thousand
and
32 thousand
common shares issued, respectively. Upon exercise, we reclassified approximately
$1.6 million
of warrant fair value from warrant liability to additional paid-in capital, of which
$0.4 million
related to changes in fair value in the current period for the twelve months ended December 31, 2018.
No
warrants were exercised during the year ended December 31, 2016.
We account for these warrants to purchase our common shares in accordance with ASC 470-20,
Debt with Conversion and Other Options
and ASC 815-40,
Derivatives and Hedging - Contracts in Entity's Own Equity.
10. Share-Based Compensation
Share-based compensation includes stock options and RSUs granted under our Stock Plans.
The 2012 Plan was approved by the Board on April 16, 2012 and authorized
5.5 million
shares of common stock to be reserved for issuance, with limits of
3.85 million
shares available for stock option issuance and
1.65 million
shares available for RSU issuance. Options granted under the 2012 Plan are non-qualified stock options and may be granted to employees, directors and other key persons. The exercise price per share for options covered by the 2012 Plan is determined by the Board at the time of grant, but shall not be less than the fair market value of our common stock, defined as the closing price of our common stock, on the date of the grant. The term of the stock option grants is established by the Board, but no stock option shall be exercisable more than
ten
years after the date the stock option is granted. The vesting period of the stock option grants is also established by the Board at the time of grant and is generally a
three
-year period. Upon the exercise of stock options, we issue shares from the authorized, unissued share reserve.
The 2014 Plan was originally approved by our stockholders at our annual meeting on May 8, 2014 and authorized
4.0 million
shares of common stock to be reserved for issuance. On May 11, 2017, our stockholders approved amendments to the 2014 Plan at our annual stockholder meeting, authorizing an additional
2.0 million
shares of common stock for issuance, increasing the total shares of common stock reserved for issuance under the plan to
6.0 million
. These shares may be either authorized but unissued shares or treasury shares.
For the years ended December 31, 2018, 2017 and 2016, we incurred
$12.6 million
,
$9.5 million
, and
$6.9 million
, respectively, of expenses related to awards granted under our Stock Plans. We recognized related income tax benefits of
$2.2 million
,
$1.9 million
and
$1.4 million
for the years ended December 31, 2018, 2017 and 2016, respectively.
A summary of option activity during the years ended December 31, 2018, 2017 and 2016 is as follows:
|
For the year ended December 31, 2018
|
Shares
|
Weighted Average Grant Date Fair Value per Share
|
Weighted Average Exercise Price
|
|||||||
|
(Shares in Thousands)
|
||||||||||
|
Options outstanding at December 31, 2017
|
3,311
|
|
$
|
3.95
|
|
$
|
10.41
|
|
||
|
Options granted
|
383
|
|
6.32
|
|
18.08
|
|
||||
|
Options exercised
|
(803
|
)
|
4.06
|
|
10.43
|
|
||||
|
Options forfeited
|
—
|
|
—
|
|
—
|
|
||||
|
Options expired
|
(9
|
)
|
4.05
|
|
10.51
|
|
||||
|
Options outstanding at December 31, 2018
|
2,882
|
|
4.24
|
|
$
|
11.42
|
|
|||
96
NMI HOLDINGS, INC.
NOTES TO CONSOLIDATED FINANCIAL STATEMENTS
DECEMBER 31, 2018
|
For the Year Ended December 31, 2017
|
Shares
|
Weighted Average Grant Date Fair Value per Share
|
Weighted Average Exercise Price
|
|||||||
|
(Shares in Thousands)
|
||||||||||
|
Options outstanding at December 31, 2016
|
3,026
|
|
$
|
3.97
|
|
$
|
10.27
|
|
||
|
Options granted
|
574
|
|
3.89
|
|
11.06
|
|
||||
|
Options exercised
|
(273
|
)
|
3.93
|
|
10.17
|
|
||||
|
Options forfeited
|
(1
|
)
|
4.97
|
|
12.32
|
|
||||
|
Options expired
|
(15
|
)
|
4.76
|
|
12.02
|
|
||||
|
Options outstanding at December 31, 2017
|
3,311
|
|
$
|
3.95
|
|
$
|
10.41
|
|
||
|
For the year ended December 31, 2016
|
Shares
|
Weighted Average Grant Date Fair Value per Share
|
Weighted Average Exercise Price
|
|||||||
|
(Shares in Thousands)
|
||||||||||
|
Options outstanding at December 31, 2015
|
3,851
|
|
$
|
3.94
|
|
$
|
10.21
|
|
||
|
Options granted
|
—
|
|
—
|
|
—
|
|
||||
|
Options exercised
|
—
|
|
—
|
|
—
|
|
||||
|
Options forfeited
|
(41
|
)
|
3.33
|
|
8.92
|
|
||||
|
Options expired
|
(784
|
)
|
3.87
|
|
10.06
|
|
||||
|
Options outstanding at December 31, 2016
|
3,026
|
|
$
|
3.97
|
|
$
|
10.27
|
|
||
As of
December 31, 2018
, there were approximately
2.1 million
fully vested and exercisable options. There were
0.8 million
exercises during the year with an aggregate intrinsic value of
$8.4 million
. The weighted average exercise price for the fully vested and exercisable options was
$10.28
. The remaining weighted average contractual life of fully vested and exercisable options as of
December 31, 2018
was
4.65
years. The aggregate grant date intrinsic value of fully vested and exercisable options was
$16.0 million
as of
December 31, 2018
.
As of
December 31, 2018
, there was
$1.5 million
of total unrecognized compensation cost related to non-vested stock options. The weighted-average period over which total remaining compensation costs related to non-vested stock options will be recognized is
1.42
years.
We account for stock options under ASC 718, which requires all share-based payments to be recognized in the financial statements at their fair values. To measure the fair value of outstanding stock options granted or modified, we utilize the Black-Scholes options pricing model. Compensation expenses are recognized over the requisite service period, which is generally the
three
-year vesting period of the options.
The estimated grant date fair values of the stock options granted during the years ended December 31, 2018 and 2017 were calculated using the Black-Scholes valuation model based on the following assumptions. There were no stock options granted during 2016.
|
As of December 31,
|
||||||
|
2018
|
2017
|
|||||
|
Expected life
|
6 years
|
|
6 years
|
|
||
|
Risk free interest rate
|
2.66-2.89%
|
|
2.04-2.08%
|
|
||
|
Dividend yield
|
—
|
%
|
—
|
%
|
||
|
Expected stock price volatility
|
30.1-30.6%
|
|
30.5-32.7%
|
|
||
Expected life -
is the period of time over which the options granted are expected to remain outstanding giving consideration to vesting schedules, historical exercise and forfeiture patterns. We use the simplified method outlined in SEC Staff Accounting Bulletin No. 107 to estimate expected life for options granted during the period as historical exercise data is not available and the options meet the requirements set out in the Bulletin. Options granted have a maximum term of
ten
years.
97
NMI HOLDINGS, INC.
NOTES TO CONSOLIDATED FINANCIAL STATEMENTS
DECEMBER 31, 2018
Risk-free interest rate -
is the U.S. Treasury rate on the date of the grant having a term approximating the expected life of the option.
Dividend yield -
is calculated by dividing the expected annual dividend by our stock price at the valuation date.
Expected price volatility -
is a measure of the amount by which a price has fluctuated or is expected to fluctuate. At the time of grants, our common shares' trading history was not sufficient to calculate an expected volatility representative of the volatility over the expected lives of the options. As a substitute for such estimate, we used historical volatilities of a set of comparable companies in the industry in which we operate.
A summary of RSU activity during the years ended
December 31, 2018
, 2017 and 2016 are as follows:
|
For the year ended December 31, 2018
|
Shares
|
Weighted Average Grant Date Fair Value per Share
|
||||
|
(Shares in Thousands)
|
||||||
|
Non-vested restricted stock units at December 31, 2017
|
2,065
|
|
$
|
8.15
|
|
|
|
Restricted stock units granted
|
701
|
|
17.22
|
|
||
|
Restricted stock units vested
|
(913
|
)
|
7.42
|
|
||
|
Restricted stock units forfeited
|
(100
|
)
|
9.89
|
|
||
|
Non-vested restricted stock units at December 31, 2018
|
1,753
|
|
$
|
12.06
|
|
|
|
For the year ended December 31, 2017
|
Shares
|
Weighted Average Grant Date Fair Value per Share
|
||||
|
(Shares in Thousands)
|
||||||
|
Non-vested restricted stock units at December 31, 2016
|
2,538
|
|
$
|
6.01
|
|
|
|
Restricted stock units granted
|
988
|
|
11.22
|
|
||
|
Restricted stock units vested
|
(1,367
|
)
|
6.67
|
|
||
|
Restricted stock units forfeited
|
(94
|
)
|
8.96
|
|
||
|
Non-vested restricted stock units at December 31, 2017
|
2,065
|
|
$
|
8.15
|
|
|
|
For the year ended December 31, 2016
|
Shares
|
Weighted Average Grant Date Fair Value per Share
|
||||
|
(Shares in Thousands)
|
||||||
|
Non-vested restricted stock units at December 31, 2015
|
1,443
|
|
$
|
7.81
|
|
|
|
Restricted stock units granted
|
1,551
|
|
4.98
|
|
||
|
Restricted stock units vested
|
(381
|
)
|
8.71
|
|
||
|
Restricted stock units forfeited
|
(75
|
)
|
5.81
|
|
||
|
Non-vested restricted stock units at December 31, 2016
|
2,538
|
|
$
|
6.01
|
|
|
At
December 31, 2018
, we had
1.8 million
shares of granted and non-vested RSUs, consisting of
1.5 million
shares that are subject to service condition vesting requirements and
0.3 million
shares that are subject to performance and service condition vesting requirements. The total fair value of RSUs vested during the year ended
December 31, 2018
was
$6.8 million
. The remaining weighted average contractual life of non-vested RSUs was
1.39
years. As of
December 31, 2018
, there was
$7.8 million
of total unrecognized compensation costs related to non-vested RSUs, compared to
$7.0 million
as of
December 31, 2017
. The weighted-average period over which total remaining compensation costs related to non-vested RSUs will be recognized is
1.41
years.
Non-vested RSUs subject to service condition vesting requirements vest over a service period ranging from
one
to
five
years. Non-vested RSUs subject to performance and service condition vesting requirements are scheduled to vest in 2019 and 2020, with the number of shares eligible for vesting in each period based on the achievement of return on equity goals.
The fair value of non-vested RSUs is measured as the closing price of our common stock on the date of grant less the present value of anticipated dividends to be paid during the service period.
98
NMI HOLDINGS, INC.
NOTES TO CONSOLIDATED FINANCIAL STATEMENTS
DECEMBER 31, 2018
401(k) Savings Plan
We offer our employees a 401(k) Savings Plan (401(k) Plan) that qualifies as a deferred salary arrangement under Section 401(k) of the IRC. Under the 401(k) Plan, we matched up to
100%
of eligible employees' pre-tax contributions up to
4%
of eligible compensation for the years ended December 31, 2018, 2017 and 2016. We contributed approximately
$1.6 million
for the year ended
December 31, 2018
, compared to
$1.5 million
for each of the years ended December 31,
2017
and
2016
.
11. Income Taxes
We are a U.S. taxpayer and are subject to a statutory U.S. federal corporate income tax rate of 21%. NMIH files a consolidated U.S. federal and various state income tax returns on behalf of itself and its subsidiaries. Prior to the enactment of the TCJA on December 22, 2017, we were subject to a statutory U.S. federal corporate income tax rate of 35% for all prior years through December 31, 2017.
In December of 2017, the SEC issued Staff Accounting Bulletin No. 118 (SAB 118) which provided a one-year measurement period from December 22, 2017, the enactment date of the TCJA, to allow the registrant sufficient time to obtain, prepare and analyze information to complete the accounting required under Accounting Standards Codification (ASC) 740. We completed our full assessment of the tax effects of the enactment of the TCJA as of December 22, 2018. The impact of our final assessment as compared to the provisional amount recorded at December, 31, 2017 was immaterial.
Total income tax expense (benefit) consists of the following components:
|
For the year ended December 31,
|
|||||||||||
|
2018
|
2017
|
2016
|
|||||||||
|
(In Thousands)
|
|||||||||||
|
Current
|
$
|
1,677
|
|
$
|
778
|
|
$
|
360
|
|
||
|
Deferred
|
26,357
|
|
29,964
|
|
(52,909
|
)
|
|||||
|
Total income tax expense (benefit)
|
$
|
28,034
|
|
$
|
30,742
|
|
$
|
(52,549
|
)
|
||
For the year ended
December 31, 2018
, we had income tax expense of
$28.0 million
, including amounts related to current year federal and state income taxes and changes to our net deferred tax liability.
For the year ended December 31, 2017, we had income tax expense of
$30.7 million
, including a one-time non-cash charge of
$13.6 million
primarily due to the re-measurement of our deferred tax assets and liabilities in connection with the enactment of the TCJA on December 22, 2017.
For the year ended December 31, 2016, we had income tax benefit of
$52.5 million
primarily related to the release of the valuation allowance previously recorded against our federal and certain state net deferred tax assets. At December 31, 2016, we determined that positive evidence of sufficient quantity and quality outweighed negative evidence, and supported a conclusion that it was more-likely-than-not that the Company would realize its federal and certain state net deferred tax assets. As a result, at December 31, 2016, we released the valuation allowance previously recorded against federal and certain state net deferred tax assets and recorded the effects of the change in income from continuing operations, generating financial statement benefits of
$58.2 million
and
$0.3
million related to net federal and certain state net deferred tax assets, respectively.
99
NMI HOLDINGS, INC.
NOTES TO CONSOLIDATED FINANCIAL STATEMENTS
DECEMBER 31, 2018
The following table presents a reconciliation between the federal statutory income tax rate and our effective income tax (benefit) rate:
|
For the year ended December 31,
|
||||||||
|
2018
|
2017
|
2016
|
||||||
|
Federal statutory income tax rate
|
21.0
|
%
|
35.0
|
%
|
35.0
|
%
|
||
|
State Provision
|
0.7
|
|
0.6
|
|
1.3
|
|
||
|
Share-based and other compensation
|
(1.4
|
)
|
(4.7
|
)
|
9.7
|
|
||
|
Warrant gain/loss
|
0.2
|
|
1.8
|
|
4.0
|
|
||
|
Other
|
—
|
|
(0.2
|
)
|
2.1
|
|
||
|
Re-measurement from change in federal statutory rate
|
—
|
|
25.7
|
|
—
|
|
||
|
Valuation allowance
|
—
|
|
—
|
|
(511.1
|
)
|
||
|
True-up from prior year
|
0.1
|
|
—
|
|
—
|
|
||
|
Effective income tax rate
|
20.6
|
%
|
58.2
|
%
|
(459.0
|
)%
|
||
The components of our net deferred tax asset are summarized as follows:
|
As of December 31,
|
|||||||
|
2018
|
2017
|
||||||
|
Deferred tax asset
|
(In Thousands)
|
||||||
|
Net operating loss carry forwards
|
$
|
6,896
|
|
$
|
25,665
|
|
|
|
Share-based compensation
|
6,791
|
|
6,122
|
|
|||
|
Unearned premium reserve
|
5,568
|
|
5,306
|
|
|||
|
Accrued expenses
(1)
|
5,495
|
|
1,627
|
|
|||
|
Unrealized loss on investments
|
2,923
|
|
—
|
|
|||
|
Deferred ceding commissions
|
821
|
|
1,084
|
|
|||
|
Capitalized start-up costs
|
727
|
|
517
|
|
|||
|
Other
(1)
|
364
|
|
909
|
|
|||
|
Total gross deferred tax asset
|
29,585
|
|
41,230
|
|
|||
|
Less: valuation allowance
|
(8,136
|
)
|
(7,160
|
)
|
|||
|
Total deferred tax asset
|
21,449
|
|
34,070
|
|
|||
|
Deferred tax liability
|
|||||||
|
Contingency reserve
|
(8,149
|
)
|
—
|
|
|||
|
Deferred acquisition costs
|
(10,145
|
)
|
(8,185
|
)
|
|||
|
Capitalized software
|
(4,757
|
)
|
(4,603
|
)
|
|||
|
Intangible assets
|
(82
|
)
|
(82
|
)
|
|||
|
Unrealized gain on investments
|
—
|
|
(434
|
)
|
|||
|
Other
(1)
|
(1,056
|
)
|
(837
|
)
|
|||
|
Total deferred tax liability
|
(24,189
|
)
|
(14,141
|
)
|
|||
|
Net deferred tax (liability)/assets
|
$
|
(2,740
|
)
|
$
|
19,929
|
|
|
|
(1)
|
Prior periods have been reclassified for consistency and presentation purposes.
|
At
December 31, 2018
, our net deferred tax liability was
$2.7 million
compared to a net deferred tax asset of
$19.9 million
at December 31, 2017. The change from a net deferred tax asset to liability position was driven by our utilization of net operating loss carryforwards and claimed deductibility of our statutory contingency reserve. As a mortgage guaranty insurance company, we are eligible to claim a tax deduction of our statutory contingency reserve balance, subject to certain limitations outlined under IRC Section 832(e), and only to the extent we acquire tax and loss bonds in an amount equal to the tax benefit derived from the claimed deduction.
100
NMI HOLDINGS, INC.
NOTES TO CONSOLIDATED FINANCIAL STATEMENTS
DECEMBER 31, 2018
In February 2018, the FASB issued ASU 2018-02,
Reclassification of Certain Tax Effects from Accumulated Other Comprehensive Income
(Topic 220). This update permits the reclassification of the disproportionate income tax effects, commonly referred to as “stranded tax”, that result from the TCJA on items within AOCI to retained earnings. We adopted this update effective January 1, 2018, resulting in a
$0.3 million
reduction to retained earnings as of January 1, 2018. The remaining
$4.2 million
of stranded tax that remains in AOCI relates to our available-for-sale fixed income holdings.
At December 31, 2018, we had a federal net operating loss carryforward of
$2.6 million
which expires in varying amounts in 2030 and 2031, and state net operating loss carryforward of
$93.3 million
which expire in varying amounts from 2031 to 2038. Section 382 of the IRC imposes annual limitations on a corporation's ability to utilize its net operating loss carryforwards if it experiences an "ownership change." As a result of the acquisition of our insurance subsidiaries in 2012,
$7.3 million
of federal net operating losses were subject to annual limitations of
$0.8 million
through 2016, and
$0.3 million
, thereafter, through 2029. Our federal net operating loss carryforward arises from this limitation and the constraint on our ability to utilize the net operating loss carryforward in full during the current period.
At December 31, 2018 and 2017, we recorded valuation allowances of
$8.1 million
and
$7.2 million
, respectively against state net deferred tax assets that may not be realized in future periods. The valuation allowances for both years primarily relate to state net operating losses generated by NMIH, as NMIH operates at a loss and currently only generates revenue from its investment portfolio.
As of December 31, 2018 and 2017, we had
no
reserves for unrecognized tax benefits, and had taken
no
material uncertain tax positions that would have required recognition and measurement.
We file income tax returns with the U.S. federal government and various state jurisdictions that are subject to potential examination by tax authorities. We are not currently under examination by federal or state jurisdictions. Our U.S. federal income tax returns for 2015 and subsequent years and state income tax returns for 2014 and subsequent years remain open by statute.
12. Software and Equipment
Software and equipment consist largely of capitalized software developed to support our MI operations. Software and equipment, net of accumulated amortization and depreciation, as of
December 31, 2018
and 2017, consists of the following:
|
December 31, 2018
|
December 31, 2017
|
||||||
|
(In Thousands)
|
|||||||
|
Software
|
$
|
38,450
|
|
$
|
31,616
|
|
|
|
Equipment
|
7,035
|
|
4,133
|
|
|||
|
Leasehold improvements
|
3,491
|
|
3,491
|
|
|||
|
Subtotal
|
48,976
|
|
39,240
|
|
|||
|
Accumulated amortization and depreciation
|
(24,211
|
)
|
(16,438
|
)
|
|||
|
Software and equipment, net
|
$
|
24,765
|
|
$
|
22,802
|
|
|
The capitalized amount for software, equipment, and leasehold improvements during the year ended December 31, 2018, 2017 and 2016, was
$9.8 million
,
$9.1 million
, and
$11.2 million
, respectively. Amortization and depreciation expense for software, equipment, and leasehold improvements for the years ended December 31, 2018, 2017, and 2016 was
$7.8 million
,
$6.7 million
, and
$4.9 million
, respectively.
101
NMI HOLDINGS, INC.
NOTES TO CONSOLIDATED FINANCIAL STATEMENTS
DECEMBER 31, 2018
13. Intangible Assets and Goodwill
Intangible assets and goodwill consist of identifiable intangible assets and goodwill we purchased in connection with the acquisition of our insurance subsidiaries. Intangible assets and goodwill as of both December 31, 2018 and 2017 were as follows:
|
(In Thousands)
|
Expected Lives
|
||||
|
Goodwill
|
$
|
3,244
|
|
Indefinite
|
|
|
State licenses
|
260
|
|
Indefinite
|
||
|
GSE applications
|
130
|
|
Indefinite
|
||
|
Total intangible assets and goodwill
|
$
|
3,634
|
|
||
We test goodwill and intangible assets for impairment in the third and fourth quarter, respectively, of every year, or more frequently if we believe indicators of impairment exist. No impairments of indefinite-lived intangibles or goodwill were identified during the years ended December 31, 2018, 2017 and 2016.
14. Commitments and Contingencies
PMIERs
As an
approved insurer
, NMIC is subject to ongoing compliance with the PMIERs established by each of the GSEs (i
talicized
terms have the same meaning that such terms have in the PMIERs, as described below). The PMIERs establish operational, business, remedial and financial requirements applicable to
approved insurers
. The PMIERs financial requirements prescribe a risk-based methodology whereby the amount of assets required to be held against each insured loan is determined based on certain loan-level risk characteristics, such as FICO, vintage (year of origination), performing vs. non-performing (
i.e.
, current vs. delinquent), LTV and other risk features. In general, higher quality loans carry lower charges.
Under the PMIERs,
approved insurers
must maintain
available assets
that equal or exceed
minimum required assets
, which is an amount equal to the greater of (i)
$400 million
or (ii) a total
risk-based required asset amount
. The
risk-based required asset amount
is a function of the risk profile of an
approved insurer's
net RIF, assessed on a loan-by-loan basis and considered against certain risk-based factors derived from tables set out in the PMIERs to gross
RIF,
which is then adjusted on an aggregate basis for reinsurance transactions approved by the GSEs, such as with respect to our ILN Transactions and QSR Transactions. The
risk-based required asset amount
for performing, primary insurance is subject to a floor of
5.6%
of
performing, primary adjusted RIF
, and the
risk-based required asset amount
for pool insurance considers both factors in the PMIERs tables and the
net remaining stop loss
for each pool insurance policy.
By April 15th of each year, NMIC must certify it met all PMIERs requirements as of December 31st of the prior year. We certified to the GSEs by April 15, 2018 that NMIC was in full compliance with the PMIERs as of December 31, 2017. NMIC also has an ongoing obligation to immediately notify the GSEs in writing upon discovery of a failure to meet one or more of the PMIERs requirements. We continuously monitor NMIC’s compliance with the PMIERs,
Office Lease
The company leases office space under its facilities Lease in Emeryville, California. In December 2016, the Company amended its Lease to extend its term through March 2023.
As of December 31, 2018, the future minimum lease payments under the Lease are as follows:
|
Years ending December 31,
|
(In Thousands)
|
||
|
2019
|
$
|
2,346
|
|
|
2020
|
2,417
|
|
|
|
2021
|
2,489
|
|
|
|
2022
|
2,564
|
|
|
|
2023
|
463
|
|
|
|
Totals
|
$
|
10,279
|
|
We incurred rent expense related to the Lease of
$2.1 million
,
$2.1 million
, and
$1.5 million
for the years ended December 31, 2018, 2017, and 2016, respectively.
102
NMI HOLDINGS, INC.
NOTES TO CONSOLIDATED FINANCIAL STATEMENTS
DECEMBER 31, 2018
15. Common Stock Offering
In March 2018, we completed the sale of
3.7 million
shares of common stock and granted the underwriters on the transaction a
15%
overallotment option to purchase additional shares. The overallotment option was exercised in full, resulting in a total of
4.3 million
shares of common stock issued. The common stock offering generated total proceeds of approximately
$79.2 million
, net of underwriting discounts, commissions and other direct offering expenses.
16. Regulatory Information
Statutory Requirements
Our insurance subsidiaries, NMIC and Re One, file financial statements in conformity with statutory accounting principles (SAP) prescribed or permitted by the Wisconsin OCI, NMIC's principal regulator. Prescribed SAP includes state laws, regulations and general administrative rules, as well as a variety of publications of the NAIC. The Wisconsin OCI recognizes only statutory accounting practices prescribed or permitted by the state of Wisconsin for determining and reporting the financial condition and results of operations of an insurance company and for determining its solvency under Wisconsin insurance laws.
NMIC and Re One's combined statutory net loss, statutory surplus, contingency reserve and RTC ratios as of and for the years ended December 31, 2018, 2017 and 2016 were as follows:
|
As of and for the year ended December 31,
|
|||||||||||
|
2018
|
2017
|
2016
|
|||||||||
|
(In Thousands)
|
|||||||||||
|
Statutory net loss
|
$
|
(19,784
|
)
|
$
|
(35,946
|
)
|
$
|
(26,653
|
)
|
||
|
Statutory surplus
|
430,785
|
|
371,084
|
|
413,809
|
|
|||||
|
Contingency reserve
|
332,702
|
|
186,641
|
|
90,479
|
|
|||||
|
Risk-to-capital
|
13.1:1
|
|
13.2:1
|
|
11.6:1
|
|
|||||
Under applicable law in Wisconsin and
15
other states, mortgage insurers must maintain minimum amounts of statutory capital relative to RIF to continue to write new business. While formulations of minimum statutory capital may vary in each state, the most common measure allows for a maximum permitted RTC ratio of
25:1
. Wisconsin and certain other states, including California and Illinois, apply a substantially similar requirement referred to as minimum policyholders' position. A working group of the NAIC is currently developing a loan level capital model applicable to mortgage guaranty insurers that is expected to ultimately be incorporated into a revised NAIC Mortgage Guaranty Insurance Model Act. Following adoption by the NAIC, some or all of the
16
states that currently have minimum statutory capital requirements, and potentially others that do not, are expected to enact a portion or all of the revised Model Act, including the loan-level capital model.
As of December 31, 2018, NMIC's performing primary RIF, net of reinsurance, was approximately $
10.0
billion and its RTC ratio was
13.7:1
, significantly below applicable limits. As of December 31, 2017, NMIC's performing primary RIF, net of reinsurance, was approximately $
7.3
billion and its RTC ratio was
14.0:1
.
Reinsurance
Prior to January 10, 2019, Ohio regulation limited the amount of risk a mortgage insurer was permitted to retain on a single loan to
25%
of the borrower's indebtedness (after giving effect to third-party reinsurance) and, as a result, the portion of such insurance in excess of
25%
was required to be reinsured. Ohio has repealed this requirement for future periods beginning January 10, 2019. Several other states previously imposed similar coverage restrictions and repealed these measures prior to 2018. To comply with these previous state coverage limits, NMIC and Re One have reinsurance agreements in place under which Re One provides reinsurance to NMIC on insured loans with coverage levels in excess of
25%
, after giving effect to third-party reinsurance.
Dividend Restrictions
NMIH is not subject to any limitations on its ability to pay dividends except those generally applicable to corporations that are incorporated in Delaware. Delaware corporate law provides that dividends are only payable out of a corporation's capital surplus or, subject to certain limitations, recent net profits. As of December 31, 2018, NMIH's shareholders' equity was approximately $
701.5
million.
103
NMI HOLDINGS, INC.
NOTES TO CONSOLIDATED FINANCIAL STATEMENTS
DECEMBER 31, 2018
NMIC and Re One are subject to restrictions on their ability to pay dividends to NMIH without prior approval of the Wisconsin OCI. Under Wisconsin law, NMIC and Re One may pay dividends up to specified levels (
i.e.
, "ordinary" dividends) with 30 days' prior notice to the Wisconsin OCI. Dividends in larger amount (
i.e.
,"extraordinary" dividends), are subject to the Wisconsin OCI's prior approval. Under Wisconsin law, an extraordinary dividend is defined as any payment or distribution that together with other dividends and distributions made within the preceding 12 months exceeds the lesser of (i)
10%
of the insurer's statutory policyholders' surplus as of the preceding December 31 or (ii) adjusted statutory net income for the 12-month period ending the preceding December 31. NMIC and Re One have never paid any dividends to NMIH. NMIC reported a statutory
net loss f
or the twelve months ended December 31, 2018 and cannot pay any dividends to NMIH through December 31, 2019 without the prior approval of the Wisconsin OCI. Certain other states in which NMIC is licensed also have statutes or regulations that restrict its ability to pay dividends. Re One currently has the capacity to pay ordinary dividends of
$2.7 million
to NMIH in 2019.
As of December 31, 2018, the amount of restricted net assets held by our consolidated insurance subsidiaries totaled approximately $
766.2
million. The amount of restricted assets used to determine any dividend to NMIH, once all restrictions expire, would be computed under SAP which may differ from the amount of restricted assets computed under GAAP.
As an
approved insurer
under PMIERs, NMIC would be subject to additional restrictions on its ability to pay dividends to NMIH if it failed to meet the financial requirements prescribed by PMIERs.
Approved insurers
that fail to meet the PMIERs financial requirements are not permitted to pay dividends without prior approval of the GSEs.
104
NMI HOLDINGS, INC.
NOTES TO CONSOLIDATED FINANCIAL STATEMENTS
DECEMBER 31, 2018
17. Quarterly Financial Data (Unaudited)
|
2018 Quarters
|
2018
|
||||||||||||||||||
|
First
|
Second
|
Third
|
Fourth
|
Year
|
|||||||||||||||
|
(In Thousands, except per share data)
|
|||||||||||||||||||
|
Net premiums earned
|
$
|
54,914
|
|
$
|
61,615
|
|
$
|
65,407
|
|
$
|
69,261
|
|
$
|
251,197
|
|
||||
|
Net investment income
|
4,574
|
|
5,735
|
|
6,277
|
|
6,952
|
|
23,538
|
|
|||||||||
|
Net realized investment gains (losses)
|
—
|
|
59
|
|
(8
|
)
|
6
|
|
57
|
|
|||||||||
|
Other revenues
|
64
|
|
44
|
|
85
|
|
40
|
|
233
|
|
|||||||||
|
Insurance claims and claims expenses
|
1,569
|
|
643
|
|
1,099
|
|
2,141
|
|
5,452
|
|
|||||||||
|
Underwriting and operating expenses
|
28,453
|
|
29,020
|
|
30,379
|
|
29,384
|
|
117,236
|
|
|||||||||
|
Gain (loss) from change in fair value of warrant liability
|
420
|
|
109
|
|
(5,464
|
)
|
3,538
|
|
(1,397
|
)
|
|||||||||
|
Interest expense
|
3,419
|
|
5,560
|
|
2,972
|
|
3,028
|
|
14,979
|
|
|||||||||
|
Pre-tax income
|
26,531
|
|
32,339
|
|
31,847
|
|
45,244
|
|
135,961
|
|
|||||||||
|
Income tax expense
|
4,176
|
|
7,098
|
|
7,036
|
|
9,724
|
|
28,034
|
|
|||||||||
|
Net income
|
$
|
22,355
|
|
$
|
25,241
|
|
$
|
24,811
|
|
$
|
35,520
|
|
$
|
107,927
|
|
||||
|
Income per share:
(1)
|
|||||||||||||||||||
|
Basic earnings per share
|
$
|
0.36
|
|
$
|
0.38
|
|
$
|
0.38
|
|
$
|
0.54
|
|
$
|
1.66
|
|
||||
|
Diluted earnings per share
|
$
|
0.34
|
|
$
|
0.37
|
|
$
|
0.36
|
|
$
|
0.46
|
|
$
|
1.60
|
|
||||
|
Weighted average common shares outstanding - basic
|
62,099
|
|
65,664
|
|
65,948
|
|
66,308
|
|
65,019
|
|
|||||||||
|
Weighted average common shares outstanding - diluted
|
65,697
|
|
68,616
|
|
68,844
|
|
69,013
|
|
67,652
|
|
|||||||||
|
2017 Quarters
|
2017
|
||||||||||||||||||
|
First
|
Second
|
Third
|
Fourth
|
Year
|
|||||||||||||||
|
(In Thousands, except per share data)
|
|||||||||||||||||||
|
Net premiums earned
|
$
|
33,225
|
|
$
|
37,917
|
|
$
|
44,519
|
|
$
|
50,079
|
|
$
|
165,740
|
|
||||
|
Net investment income
|
3,807
|
|
3,908
|
|
4,170
|
|
4,388
|
|
16,273
|
|
|||||||||
|
Net realized investment gains (losses)
|
(58
|
)
|
188
|
|
69
|
|
9
|
|
208
|
|
|||||||||
|
Other revenues
|
80
|
|
185
|
|
195
|
|
62
|
|
522
|
|
|||||||||
|
Insurance claims and claims expenses
|
635
|
|
1,373
|
|
957
|
|
2,374
|
|
5,339
|
|
|||||||||
|
Underwriting and operating expenses
|
25,989
|
|
28,048
|
|
24,645
|
|
28,297
|
|
106,979
|
|
|||||||||
|
(Loss) gain from change in fair value of warrant liability
|
(196
|
)
|
19
|
|
(502
|
)
|
(3,426
|
)
|
(4,105
|
)
|
|||||||||
|
Interest expense
|
3,494
|
|
3,300
|
|
3,352
|
|
3,382
|
|
13,528
|
|
|||||||||
|
Pre-tax income
|
6,740
|
|
9,496
|
|
19,497
|
|
17,059
|
|
52,792
|
|
|||||||||
|
Income tax expense
|
1,248
|
|
3,484
|
|
7,185
|
|
18,825
|
|
30,742
|
|
|||||||||
|
Net income (loss)
|
$
|
5,492
|
|
$
|
6,012
|
|
$
|
12,312
|
|
$
|
(1,766
|
)
|
$
|
22,050
|
|
||||
|
Income (loss) per share:
(1)
|
|||||||||||||||||||
|
Basic earnings (loss) per share
|
$
|
0.09
|
|
$
|
0.10
|
|
$
|
0.21
|
|
$
|
(0.03
|
)
|
$
|
0.37
|
|
||||
|
Diluted earnings (loss) per share
|
$
|
0.09
|
|
$
|
0.10
|
|
$
|
0.20
|
|
$
|
(0.03
|
)
|
$
|
0.35
|
|
||||
|
Weighted average common shares outstanding - basic
|
59,184
|
|
59,823
|
|
59,884
|
|
60,219
|
|
59,816
|
|
|||||||||
|
Weighted average common shares outstanding - diluted
|
62,339
|
|
63,010
|
|
63,089
|
|
60,219
|
|
62,186
|
|
|||||||||
|
(1)
|
Due to the use of weighted average shares outstanding when calculating earnings per share, the sum of quarterly per share data may not equal the per share data for the year.
|
105
Item 9. Changes in and Disagreements with Accountants on Accounting and Financial Disclosure
None.
Item 9A. Controls and Procedures
Disclosure Controls and Procedures
We maintain disclosure controls and procedures designed to ensure that information required to be disclosed in the reports we file or submit under the Exchange Act is recorded, processed, summarized and reported within the time periods specified in the SEC's rules and forms, and that such information is accumulated and communicated to our management, including our Chief Executive Officer and Chief Financial Officer, as appropriate, to allow timely decisions regarding required disclosure.
Our management, including our Chief Executive Officer and Chief Financial Officer, conducted an evaluation of the effectiveness of our disclosure controls and procedures (as defined in Rule 13a-15(e) of the Exchange Act) as of December 31, 2018, pursuant to Rule 13a-15(e) under the Exchange Act. Management applied its judgment in assessing the costs and benefits of such controls and procedures, which by their nature, can provide only reasonable assurance regarding management's control objectives. Management does not expect that our disclosure controls and procedures will prevent or detect all errors and fraud. A control system, irrespective of how well it is designed and operated, can only provide reasonable assurance and cannot guarantee that it will succeed in its stated objectives.
Based on that evaluation, our Chief Executive Officer and Chief Financial Officer concluded that, as of December 31, 2018, our disclosure controls and procedures were effective to provide reasonable assurance that the information required to be disclosed by us in the reports we file or submit under the Exchange Act is recorded, processed, summarized, and reported within the time periods specified in the SEC's rules and forms.
Internal Control Over Financial Reporting
The Company's management is responsible for establishing and maintaining adequate internal control over financial reporting as defined in Rules 13a-15(f) and 15d-15(f) under the Exchange Act. The Company's internal control over financial reporting is designed to provide reasonable assurance regarding the reliability of financial reporting and the preparation of financial statements for external purposes in accordance with GAAP. Because of its inherent limitations, internal control over financial reporting may not prevent or detect misstatements. Also, projections of any evaluation of effectiveness to future periods are subject to the risk that controls may become inadequate because of changes in conditions, or that the degree of compliance with the policies or procedures may deteriorate.
Under the supervision of our Chief Executive Officer and Chief Financial Officer, our management assessed the effectiveness of the Company's internal control over financial reporting as of December 31, 2018. In making this assessment, management used the criteria set forth in the Internal Control-Integrated Framework (2013 framework) issued by the Committee of Sponsoring Organizations of the Treadway Commission. Based on this assessment, our management has concluded that the Company's internal control over financial reporting was effective as of December 31, 2018. The effectiveness of our internal control over financial reporting as of December 31, 2018 has been audited by BDO USA, LLP., an independent registered public accounting firm, as stated in their report, which appears below.
There was no change in our internal control over financial reporting that occurred during the period covered by this report that has materially affected, or is reasonably likely to materially affect, our internal control over financial reporting.
106
Report of Independent Registered Public Accounting Firm
Shareholders and Board of Directors
NMI Holdings, Inc.
Emeryville, California
Opinion on Internal Control over Financial Reporting
We have audited NMI Holdings, Inc's (the "Company's") internal control over financial reporting as of December 31, 2018, based on criteria established in
Internal Control - Integrated Framework (2013)
issued by the Committee of Sponsoring Organizations of the Treadway Commission (the "COSO criteria"). In our opinion, the Company maintained, in all material respects, effective internal control over financial reporting as of December 31, 2018, based on the COSO criteria
.
We also have audited, in accordance with the standards of the Public Company Accounting Oversight Board (United States) ("PCAOB"), the consolidated balance sheets of the Company and subsidiaries at December 31, 2018 and 2017, and the related consolidated statements of operations and comprehensive income, changes in shareholders' equity and cash flows for each of the three years in the period ended December 31, 2018 and the related notes and financial statement schedules listed in the accompanying index and our report dated February 14, 2019 expressed an unqualified opinion.
Basis for Opinion
The Company's management is responsible for maintaining effective internal control over financial reporting and for its assessment of the effectiveness of internal control over financial reporting, included in the accompanying "Item 9A, Management"s Report on Internal Control over Financial Reporting". Our responsibility is to express an opinion on the Company's internal control over financial reporting based on our audit. We are a public accounting firm registered with the PCAOB and are required to be independent with respect to the Company in accordance with U.S. federal securities laws and the applicable rules and regulations of the Securities and Exchange Commission and the PCAOB.
We conducted our audit of internal control over financial reporting in accordance with the standards of the PCAOB. Those standards require that we plan and perform the audit to obtain reasonable assurance about whether effective internal control over financial reporting was maintained in all material respects. Our audit included obtaining an understanding of internal control over financial reporting, assessing the risk that a material weakness exists, and testing and evaluating the design and operating effectiveness of internal control based on the assessed risk. Our audit also included performing such other procedures as we considered necessary in the circumstances. We believe that our audit provides a reasonable basis for our opinion.
Definition and Limitations of Internal Control over Financial Reporting
A company's internal control over financial reporting is a process designed to provide reasonable assurance regarding the reliability of financial reporting and the preparation of financial statements for external purposes in accordance with generally accepted accounting principles. A company's internal control over financial reporting includes those policies and procedures that (1) pertain to the maintenance of records that, in reasonable detail, accurately and fairly reflect the transactions and dispositions of the assets of the company; (2) provide reasonable assurance that transactions are recorded as necessary to permit preparation of financial statements in accordance with generally accepted accounting principles, and that receipts and expenditures of the company are being made only in accordance with authorizations of management and directors of the company; and (3) provide reasonable assurance regarding prevention or timely detection of unauthorized acquisition, use, or disposition of the company’s assets that could have a material effect on the financial statements.
Because of its inherent limitations, internal control over financial reporting may not prevent or detect misstatements. Also, projections of any evaluation of effectiveness to future periods are subject to the risk that controls may become inadequate because of changes in conditions, or that the degree of compliance with the policies or procedures may deteriorate.
/s/ BDO USA, LLP
San Francisco, California
February 14, 2019
107
Item 9B. Other Information
None.
108
PART III
Item 10. Directors, Executive Officers and Corporate Governance
The information required by this Item is incorporated by reference to, and will be contained in, our definitive proxy statement, which will be filed within 120 days after December 31, 2018. Accordingly, we have omitted the information from this Item pursuant to General Instruction G (3) of Form 10-K.
Item 11. Executive Compensation
The information required by this Item is incorporated by reference to, and will be contained in, our definitive proxy statement, which will be filed within 120 days after December 31, 2018. Accordingly, we have omitted the information from this Item pursuant to General Instruction G (3) of Form 10-K.
Item 12. Security Ownership of Certain Beneficial Owners and Management and Related Stockholder Matters
The information required by this Item is incorporated by reference to, and will be contained in, our definitive proxy statement, which will be filed within 120 days after December 31, 2018. Accordingly, we have omitted the information from this Item pursuant to General Instruction G (3) of Form 10-K.
Item 13. Certain Relationships and Related Transactions, and Director Independence
The information required by this Item is incorporated by reference to, and will be contained in, our definitive proxy statement, which will be filed within 120 days after December 31, 2018. Accordingly, we have omitted the information from this Item pursuant to General Instruction G (3) of Form 10-K.
Item 14. Principal Accountant Fees and Services
The information required by this Item is incorporated by reference to, and will be contained in, our definitive proxy statement, which will be filed within 120 days after December 31, 2018. Accordingly, we have omitted the information from this Item pursuant to General Instruction G (3) of Form 10-K.
109
PART IV
Item 15. Exhibits and Financial Statement Schedules
1. Financial Statements — See the "
Index to Financial Statements
" included in Item 8 of this report for a list of the financial statements filed as part of this report.
2. Financial Statement Schedules — See the "
Index to Financial Statement Schedules
" on page 114 of this report for a list of the financial statement schedules filed as part of this report.
3. Exhibits
|
Exhibit Number
|
Description
|
|
|
2.1
|
Stock Purchase Agreement, dated November 30, 2011
, between NMI Holdings, Inc. and MAC Financial Ltd. (incorporated herein by reference to Exhibit 2.1 to our Form S-1 Registration Statement (Registration No. 333-191635), filed on October 9, 2013)
|
|
|
2.2
|
Amendment to Stock Purchase Agreement, dated April 6, 2012
, between NMI Holdings, Inc. and MAC Financial Ltd. (incorporated herein by reference to Exhibit 2.2 to our Form S-1 Registration Statement (Registration No. 333-191635), filed on October 9, 2013)
|
|
|
3.1
|
Second Amended and Restated Certificate of Incorporation
(incorporated herein by reference to Exhibit 3.1 to our Form S-1 Registration Statement (Registration No. 333-191635), filed on October 9, 2013)
|
|
|
3.2
|
Third Amended and Restated By-Laws
(incorporated herein by reference to Exhibit 3.1 to our Form 8-K, filed on December 9, 2014)
|
|
|
4.1
|
Specimen Class A common stock certificate
(incorporated herein by reference to Exhibit 4.1 to our Form S-1 Registration Statement (Registration No. 333-191635), filed on October 9, 2013)
|
|
|
4.2
|
Registration Rights Agreement between NMI Holdings, Inc. and FBR Capital Markets & Co., dated April 24, 2012
(incorporated herein by reference to Exhibit 4.2 to our Form S-1 Registration Statement (Registration No. 333-191635), filed on October 9, 2013)
|
|
|
4.3
|
Registration Rights Agreement by and between MAC Financial Ltd. and NMI Holdings, Inc., dated April 24, 2012
(incorporated herein by reference to Exhibit 4.3 to our Form S-1 Registration Statement (Registration No. 333-191635), filed on October 9, 2013)
|
|
|
4.4
|
Registration Rights Agreement between FBR & Co., FBR Capital Markets LT, Inc., FBR Capital Markets & Co., FBR Capital Markets PT, Inc. and NMI Holdings, Inc., dated April 24, 2012
(incorporated herein by reference to Exhibit 4.4 to our Form S-1 Registration Statement (Registration No. 333-191635), filed on October 9, 2013)
|
|
|
4.5
|
Warrant No. 1 to Purchase Common Stock of NMI Holdings, Inc. issued to FBR Capital Markets & Co., dated June 13, 2013
(incorporated herein by reference to Exhibit 4.5 to our Form S-1 Registration Statement (Registration No. 333-191635), filed on October 9, 2013)
|
|
|
4.6
|
Form of Warrant to Purchase Common Stock of NMI Holdings, Inc. issued to former stockholders of MAC Financial Ltd.
(incorporated herein by reference to Exhibit 4.6 to our Form S-1 Registration Statement (Registration No. 333-191635), filed on October 9, 2013)
|
|
|
10.1 ~
|
NMI Holdings Inc. 2012 Stock Incentive Plan
(incorporated herein by reference to Exhibit 10.1 to our Form S-1 Registration Statement (registration No. 333-191635), filed on October 9, 2013)
|
|
|
10.2 ~
|
Form of NMI Holdings, Inc. 2012 Stock Incentive Plan Restricted Stock Unit Award Agreement for Management
(incorporated herein by reference to Exhibit 10.3 to our Form S-1 Registration Statement (Registration No. 333-191635), filed on October 9, 2013)
|
|
|
10.3 ~
|
Form of NMI Holdings, Inc. 2012 Stock Incentive Plan Nonqualified Stock Option Award Agreement for Chief Executive Officer and Chief Financial Officer
(incorporated herein by reference to Exhibit 10.5 to our Form S-1 Registration Statement (Registration No. 333-191635), filed on October 9, 2013)
|
|
|
10.4 ~
|
Form of NMI Holdings, Inc. 2012 Stock Incentive Plan Nonqualified Stock Option Award Agreement for Management
(incorporated herein by reference to Exhibit 10.6 to our Form S-1 Registration Statement (Registration No. 333-191635), filed on October 9, 2013)
|
|
|
10.5 ~
|
Form of NMI Holdings, Inc. 2012 Stock Incentive Plan Nonqualified Stock Option Award Agreement for Directors
(incorporated herein by reference to Exhibit 10.7 to our Form S-1 Registration Statement (Registration No. 333-191635), filed on October 9, 2013)
|
|
|
10.6 ~
|
Form of NMI Holdings, Inc. 2012 Stock Incentive Plan Nonqualified Stock Option Award Agreement for Chief Executive Officer and Chief Financial Office
r (incorporated herein by reference to Exhibit 10.8 to our Form 10-K, filed on February 17, 2017)
|
|
110
111
|
10.28 ~
|
Employment Letter by and between NMI Holdings, Inc. and Bradley M. Shuster, effective as of January 1, 2019
(incorporated herein by reference to Exhibit 10.1 to our Form 8-K, filed on December 28, 2018)
|
|
|
10.29 ~
|
Employment Letter by and between NMI Holdings, Inc. and Claudia J. Merkle, effective as of January 1, 2019
(incorporated herein by reference to Exhibit 10.2 to our Form 8-K, filed on December 28, 2018)
|
|
|
21.1
|
Subsidiaries of NMI Holdings, Inc.
(incorporated herein by reference to Exhibit 21.1 to our Form 10-Q, filed on October 30, 2015)
|
|
|
23.1
|
||
|
31.1
|
||
|
31.2
|
||
|
32.1 #
|
||
|
101
|
The following financial information from NMI Holdings, Inc.'s Annual Report on Form 10-K for the year ended December 31, 2018 formatted in XBRL (eXtensible Business Reporting Language):
(i) Consolidated Balance Sheets as of December 31, 2018 and 2017
(ii) Consolidated Statements of Operations and Comprehensive Income (Loss) for each of the three years in the period ended December 31, 2018
(iii) Consolidated Statements of Changes in Shareholders' Equity for each of the three years in the period ended December 31, 2018
(iv) Consolidated Statements of Cash Flows for each of the three years ended December 31, 2018, and
(v) Notes to Consolidated Financial Statements. |
|
|
~
|
Indicates a management contract or compensatory plan or contract.
|
|
+
|
Confidential treatment granted as to certain portions, which portions have been filed separately with the SEC.
|
|
#
|
In accordance with Item 601(b)(32)(ii) of Regulation S-K and SEC Release No. 34-47986, the certifications furnished in Exhibit 32 hereto are deemed to accompany this Form 10-K and will not be deemed "filed" for purposes of Section 18 of the Exchange Act or deemed to be incorporated by reference into any filing under the Exchange Act or the Securities Act except to the extent that the registrant specifically incorporates it by reference.
|
112
SIGNATURES
Pursuant to the requirements of the Securities Exchange Act of 1934, the registrant has duly caused this report to be signed on its behalf by the undersigned thereunto duly authorized.
|
NMI HOLDINGS, INC.
|
|
|
Date:
February 14, 2019
|
By:
/s/ Claudia J. Merkle
|
|
Name: Claudia J. Merkle
Title: Chief Executive Officer
|
|
|
Signature
|
Title
|
Date
|
||
|
/s/ Claudia J. Merkle
|
||||
|
Claudia J. Merkle
/s/ Adam S. Pollitzer
|
Chief Executive Officer
(Principal Executive Officer)
|
February 14, 2019
|
||
|
Adam S. Pollitzer
/s/ Julie C. Norberg
|
Chief Financial Officer
(Principal Financial Officer)
|
February 14, 2019
|
||
|
Julie C. Norberg
/s/ Bradley M. Shuster
|
Controller
|
February 14, 2019
|
||
|
Bradley M. Shuster
/s/ Steven L. Scheid
|
Executive Chairman
|
February 14, 2019
|
||
|
Steven L. Scheid
/s/ James G. Jones
|
Director
|
February 14, 2019
|
||
|
James G. Jones
/s/ Regina Muehlhauser
|
Director
|
February 14, 2019
|
||
|
Regina Muehlhauser
/s/ Michael Montgomery
|
Director
|
February 14, 2019
|
||
|
Michael Montgomery
/s/ Michael Embler
|
Director
|
February 14, 2019
|
||
|
Michael Embler
/s/ James H. Ozanne
|
Director
|
February 14, 2019
|
||
|
James H. Ozanne
|
Director
|
February 14, 2019
|
||
113
INDEX TO FINANCIAL STATEMENT SCHEDULES
All other schedules are omitted because the required information is not present or is not present in amounts sufficient to require submission of the schedules, or because the information required is included in our Consolidated Financial Statements and notes thereto.
114
NMI HOLDINGS, INC.
SCHEDULE I
SUMMARY OF INVESTMENTS - OTHER THAN INVESTMENTS IN RELATED PARTIES
|
December 31, 2018
|
Amortized Cost
|
Fair Value
|
Amount Reflected on Balance Sheet
|
||||||||
|
(In Thousands)
|
|||||||||||
|
U.S. Treasury securities and obligations of U.S. government agencies
|
$
|
48,171
|
|
$
|
46,830
|
|
$
|
46,830
|
|
||
|
Municipal debt securities
|
92,014
|
|
91,257
|
|
91,257
|
|
|||||
|
Corporate debt securities
|
554,079
|
|
543,238
|
|
543,238
|
|
|||||
|
Asset-backed securities
|
171,990
|
|
171,325
|
|
171,325
|
|
|||||
|
Total bonds
|
866,254
|
|
852,650
|
|
852,650
|
|
|||||
|
Short-term investments
|
58,733
|
|
58,840
|
|
58,840
|
|
|||||
|
Total investments
|
$
|
924,987
|
|
$
|
911,490
|
|
$
|
911,490
|
|
||
F-1
NMI HOLDINGS, INC.
SCHEDULE II - FINANCIAL INFORMATION OF REGISTRANT
BALANCE SHEETS
PARENT COMPANY ONLY
|
December 31, 2018
|
December 31, 2017
|
||||||
|
(In Thousands, except for share data)
|
|||||||
|
Assets
|
|||||||
|
Fixed maturities, available-for-sale, at fair value
|
$
|
51,957
|
|
$
|
50,505
|
|
|
|
Cash and cash equivalents
|
12,345
|
|
528
|
|
|||
|
Investment in subsidiaries, at equity in net assets
|
766,193
|
|
573,695
|
|
|||
|
Accrued investment income
|
216
|
|
203
|
|
|||
|
Prepaid expenses
|
3,118
|
|
2,108
|
|
|||
|
Due from affiliates, net
|
41,340
|
|
22,407
|
|
|||
|
Software and equipment, net
|
24,766
|
|
22,802
|
|
|||
|
Deferred tax asset, net
|
—
|
|
6,610
|
|
|||
|
Other assets
|
1,664
|
|
1,704
|
|
|||
|
Total assets
|
$
|
901,599
|
|
$
|
680,562
|
|
|
|
Liabilities
|
|||||||
|
Term loan
|
$
|
146,757
|
|
$
|
143,882
|
|
|
|
Accounts payable and accrued expenses
|
27,237
|
|
20,131
|
|
|||
|
Warrant liability, at fair value
|
7,296
|
|
7,472
|
|
|||
|
Deferred tax liability, net
|
18,809
|
|
—
|
|
|||
|
Total liabilities
|
200,099
|
|
171,485
|
|
|||
|
Shareholders' equity
|
|||||||
|
Common stock - class A shares, $0.01 par value;
66,318,849 and 60,517,512 shares issued and outstanding as of December 31, 2018 and December 31, 2017, respectively (250,000,000 shares authorized) |
663
|
|
605
|
|
|||
|
Additional paid-in capital
|
682,181
|
|
585,488
|
|
|||
|
Accumulated other comprehensive loss, net of tax
|
(14,832
|
)
|
(2,859
|
)
|
|||
|
Accumulated deficit
|
33,488
|
|
(74,157
|
)
|
|||
|
Total shareholders' equity
|
701,500
|
|
509,077
|
|
|||
|
Total liabilities and shareholders' equity
|
$
|
901,599
|
|
$
|
680,562
|
|
|
F-2
NMI HOLDINGS, INC.
SCHEDULE II - FINANCIAL INFORMATION OF REGISTRANT
STATEMENT OF OPERATIONS
PARENT COMPANY ONLY
|
For the year ended December 31,
|
|||||||||||
|
2018
|
2017
|
2016
|
|||||||||
|
(In Thousands)
|
|||||||||||
|
Revenues
|
|||||||||||
|
Net investment income
|
$
|
1,145
|
|
$
|
691
|
|
$
|
773
|
|
||
|
Net realized investment gains
|
5
|
|
1
|
|
53
|
|
|||||
|
Total revenues
|
1,150
|
|
692
|
|
826
|
|
|||||
|
Expenses
|
|||||||||||
|
Other operating expenses
|
21,095
|
|
16,374
|
|
17,600
|
|
|||||
|
Total expenses
|
21,095
|
|
16,374
|
|
17,600
|
|
|||||
|
Other expense
|
|||||||||||
|
Loss from change in fair value of warrant liability
|
(1,397
|
)
|
(4,105
|
)
|
(1,900
|
)
|
|||||
|
Interest expense
|
(2,227
|
)
|
—
|
|
(14,848
|
)
|
|||||
|
Total other expenses
|
(3,624
|
)
|
(4,105
|
)
|
(16,748
|
)
|
|||||
|
Equity in net income of subsidiaries
|
134,127
|
|
67,146
|
|
58,819
|
|
|||||
|
Income before income taxes
|
110,558
|
|
47,359
|
|
25,297
|
|
|||||
|
Income tax expense (benefit)
|
2,631
|
|
25,309
|
|
(38,704
|
)
|
|||||
|
Net income
|
$
|
107,927
|
|
$
|
22,050
|
|
$
|
64,001
|
|
||
|
Other comprehensive income (loss), net of tax:
|
|||||||||||
|
Unrealized gains in accumulated other comprehensive loss, net of tax (benefit) expense of ($34), ($49), and $82 for each of the years in the three-year period ended December 31, 2018, respectively
|
(128
|
)
|
(90
|
)
|
100
|
|
|||||
|
Reclassification adjustment for losses (gains) included in net loss, net of tax (benefit) expense of ($1), $0 and $0 for each of the years in the three-year period ended December 31, 2018
|
2
|
|
(1
|
)
|
53
|
|
|||||
|
Equity in other comprehensive income (loss) of subsidiaries
|
(12,129
|
)
|
2,519
|
|
2,034
|
|
|||||
|
Other comprehensive income (loss), net of tax
|
(12,255
|
)
|
2,428
|
|
2,187
|
|
|||||
|
Comprehensive income (loss)
|
$
|
95,672
|
|
$
|
24,478
|
|
$
|
66,188
|
|
||
F-3
NMI HOLDINGS, INC.
SCHEDULE II - FINANCIAL INFORMATION OF REGISTRANT
STATEMENTS OF CASH FLOWS
PARENT COMPANY ONLY
|
For the year ended December 31,
|
|||||||||||
|
2018
|
2017
|
2016
|
|||||||||
|
Cash flows from operating activities
|
(In Thousands)
|
||||||||||
|
Net income (loss)
|
$
|
107,927
|
|
$
|
22,050
|
|
$
|
64,001
|
|
||
|
Adjustments to reconcile net income (loss) to net cash (used in) provided by operating activities:
|
|||||||||||
|
Loss from change in fair value of warrant liability
|
1,397
|
|
4,105
|
|
1,900
|
|
|||||
|
Net realized investment (gains)
|
(5
|
)
|
(1
|
)
|
(53
|
)
|
|||||
|
Depreciation and amortization
|
274
|
|
233
|
|
5,779
|
|
|||||
|
Amortization of debt discount and debt issuance costs
|
3,390
|
|
1,474
|
|
1,914
|
|
|||||
|
Deferred income taxes
|
25,163
|
|
30,876
|
|
(36,616
|
)
|
|||||
|
Share-based compensation expense
|
12,557
|
|
9,484
|
|
6,854
|
|
|||||
|
Changes in operating assets and liabilities:
|
|||||||||||
|
Equity in net (income) loss of subsidiaries
(1)
|
(133,837
|
)
|
(67,239
|
)
|
(58,819
|
)
|
|||||
|
Accrued investment income
|
(14
|
)
|
(52
|
)
|
(2
|
)
|
|||||
|
Receivable from affiliates
|
(18,932
|
)
|
(13,103
|
)
|
(828
|
)
|
|||||
|
Prepaid expenses
|
(1,010
|
)
|
(116
|
)
|
(563
|
)
|
|||||
|
Other assets
|
1,258
|
|
(1,523
|
)
|
(126
|
)
|
|||||
|
Accounts payable and accrued expenses
|
5,393
|
|
(3,463
|
)
|
2,711
|
|
|||||
|
Net cash provided by (used in) operating activities
|
3,561
|
|
(17,275
|
)
|
(13,848
|
)
|
|||||
|
Cash flows from investing activities
|
|||||||||||
|
Capitalization of subsidiaries
|
(70,500
|
)
|
(300
|
)
|
(800
|
)
|
|||||
|
Purchase of short-term investments
|
(134,376
|
)
|
(98,255
|
)
|
(127,329
|
)
|
|||||
|
Purchase of fixed-maturity investments, available-for-sale
|
(12,906
|
)
|
(19,884
|
)
|
(172
|
)
|
|||||
|
Proceeds from maturity of short-term investments
|
122,612
|
|
114,170
|
|
115,049
|
|
|||||
|
Proceeds from redemptions, maturities and sale of fixed-maturity investments, available-for-sale
|
22,954
|
|
11,451
|
|
41,750
|
|
|||||
|
Software and equipment
|
(415
|
)
|
(1,996
|
)
|
(10,251
|
)
|
|||||
|
Net cash (used in) provided by investing activities
|
(72,631
|
)
|
5,186
|
|
18,247
|
|
|||||
|
Cash flows from financing activities
|
|||||||||||
|
Proceeds from issuance of common stock related to public offering, net of issuance costs
|
79,165
|
|
—
|
|
—
|
|
|||||
|
Proceeds from issuance of common stock related to employee equity plans
|
12,857
|
|
7,103
|
|
532
|
|
|||||
|
Proceeds from issuance of common stock related to warrants
|
321
|
|
183
|
|
—
|
|
|||||
|
Taxes paid related to net share settlement of equity awards
|
(9,722
|
)
|
(8,582
|
)
|
(756
|
)
|
|||||
|
Proceeds from term loan, net
|
149,250
|
|
—
|
|
—
|
|
|||||
|
Repayments of term loan
|
(147,375
|
)
|
(1,500
|
)
|
(1,500
|
)
|
|||||
|
Payments of debt issuance/modification costs
|
(3,609
|
)
|
(445
|
)
|
—
|
|
|||||
|
Net cash provided (used in) by financing activities
|
80,887
|
|
(3,241
|
)
|
(1,724
|
)
|
|||||
|
Net increase (decrease) in cash, cash equivalents and restricted cash
|
11,817
|
|
(15,330
|
)
|
2,675
|
|
|||||
|
Cash, cash equivalents and restricted cash, beginning of period
|
528
|
|
15,858
|
|
13,183
|
|
|||||
|
Cash, cash equivalents and restricted cash, end of period
|
$
|
12,345
|
|
$
|
528
|
|
$
|
15,858
|
|
||
|
(1)
|
Amount includes
$0.3 million
reduction to retained earnings as of January 1, 2018 as a result of the adoption of ASU 2018-02. For more information related to this adjustment, See Item 8, "
Financial Statements and Supplementary Data - Notes to Consolidated Financial Statements - Note 2, Summary of Accounting Principles - Recent Accounting Pronouncements - Adopted
."
|
F-4
NMI HOLDINGS, INC.
SCHEDULE II - FINANCIAL INFORMATION OF REGISTRANT
SUPPLEMENTAL NOTES
PARENT COMPANY ONLY
Note A
The NMI Holdings, Inc. (Parent Company) financial statements represent the stand-alone financial statements of the Parent Company. These financial statements have been prepared on the same basis and using the same accounting policies as described in the consolidated financial statements included herein. Refer to the Parent Company's consolidated financial statements for additional information.
Revisions to Prior Periods
Certain other prior balances have been reclassified to conform to the current period presentation.
Note B
Our insurance subsidiaries are subject to statutory regulations as to maintenance of policyholders' surplus and payment of dividends. The maximum amount of dividends that the insurance subsidiaries may pay in any twelve-month period without regulatory approval by the Wisconsin OCI is the lesser of adjusted statutory net income or 10% of statutory policyholders' surplus as of the preceding calendar year end. Adjusted statutory net income is defined for this purpose to be the greater of statutory net income, net of realized investment gains, for the calendar year preceding the date of the dividend or statutory net income, net of realized investment gains, for the three calendar years preceding the date of the dividend less dividends paid within the first two of the preceding three calendar years.
Note C
The Parent Company provides certain services to its subsidiaries. The Parent Company allocates to its subsidiaries corporate expense it incurs in the capacity of supporting those subsidiaries, based on either an allocated percentage of time spent or internally allocated capital. Total operating expenses allocated to subsidiaries for each of the years in the three year period ended December 31, 2018 were
$111.6 million
,
$101.0 million
and
$80.5 million
, respectively. Amounts charged to the subsidiaries for operating expenses are based on actual cost, without any mark-up. The Parent Company considers these charges fair and reasonable. The subsidiaries reimburse the Parent Company for these costs in a timely manner, which has the impact of improving the cash flows of the Parent Company.
F-5
NMI HOLDINGS, INC.
SCHEDULE IV - FINANCIAL INFORMATION OF REGISTRANT
REINSURANCE
|
Gross Amount
|
Ceded to Other Companies
|
Assumed from Other Companies
|
Net Amount
|
Percentage of Amount Assumed to Net
|
|||||||||||||||
|
For the years ended December 31,
|
(In thousands)
|
||||||||||||||||||
|
2018
|
$
|
292,064
|
|
$
|
40,867
|
|
$
|
—
|
|
$
|
251,197
|
|
—
|
%
|
|||||
|
2017
|
192,326
|
|
26,586
|
|
—
|
|
165,740
|
|
—
|
%
|
|||||||||
|
2016
|
115,830
|
|
5,349
|
|
—
|
|
110,481
|
|
—
|
%
|
|||||||||
|
2015
|
—
|
|
—
|
|
—
|
|
—
|
|
—
|
%
|
|||||||||
|
2014
|
—
|
|
—
|
|
—
|
|
—
|
|
—
|
%
|
|||||||||
F-6
TABLE OF CONTENTS
Part IItem 1. BusinessItem 1A. Risk FactorsItem 1B. Unresolved Staff CommentsItem 2. PropertiesItem 3. Legal ProceedingsItem 4. Mine Safety DisclosuresPart IIItem 5. Market For Registrant's Common Equity, Related Stockholder Matters and Issuer Purchases Of Equity SecuritiesItem 6. Selected Financial DataItem 7. Management's Discussion and Analysis Of Financial Condition and Results Of OperationsItem 7A. Quantitative and Qualitative Disclosures About Market RiskItem 8. Financial Statements and Supplementary DataItem 9. Changes in and Disagreements with Accountants on Accounting and Financial DisclosureItem 9A. Controls and ProceduresItem 9B. Other InformationPart IIIItem 10. Directors, Executive Officers and Corporate GovernanceItem 11. Executive CompensationItem 12. Security Ownership Of Certain Beneficial Owners and Management and Related Stockholder MattersItem 13. Certain Relationships and Related Transactions, and Director IndependenceItem 14. Principal Accountant Fees and ServicesPart IVItem 15. Exhibits and Financial Statement Schedules