NMI HOLDINGS, INC.
10-Ks and 10-Qs
|
|
|
|
|
|
|
|
|
|
|
|
|
|
|
|
|
|
|
|
|
|
|
|
|
|
|
|
|
|
|
|
|
|
|
|
|
|
|
|
|
|
|
|
UNITED STATES
SECURITIES AND EXCHANGE COMMISSION
WASHINGTON, D.C. 20549
|
FORM 10-Q
|
|
(Mark One)
|
|
|
x
|
QUARTERLY REPORT PURSUANT TO SECTION 13 OR 15(d) OF THE SECURITIES EXCHANGE ACT OF 1934
For the quarterly period ended
March 31, 2014
|
OR
|
o
|
TRANSITION REPORT PURSUANT TO SECTION 13 OR 15(d) OF THE SECURITIES EXCHANGE ACT OF 1934
For the transition period from
to
|
|
Commission file number
001-36
174
|
|
NMI Holdings, Inc.
|
|
(Exact name of registrant as specified in its charter)
|
|
DELAWARE
|
|
45-4914248
|
|
(State or other jurisdiction of incorporation or organization)
|
(I.R.S. Employer Identification No.)
|
|
|
2100 Powell Street, Emeryville, CA
|
|
94608
|
|
(Address of principal executive offices)
|
(Zip Code)
|
|
(855) 530-6642
(Registrant's telephone number, including area code)
Indicate by check mark whether the registrant (1) has filed all reports required to be filed by Section 13 or 15(d) of the Securities Exchange Act of 1934 during the preceding 12 months (or for such shorter period that the registrant was required to file such reports), and (2) has been subject to such filing requirements for the past 90 days.
YES
x
NO
o
Indicate by check mark whether the registrant has submitted electronically and posted on its corporate Web site, if any, every Interactive Data File required to be submitted and posted pursuant to Rule 405 of Regulation S-T during the preceding 12 months (or for such shorter period that the registrant was required to submit and post such files).
YES
x
NO
o
Indicate by check mark whether the registrant is a large accelerated filer, an accelerated filer, a non-accelerated filer, or a smaller reporting company. See the definitions of “large accelerated filer,” “accelerated filer” and “smaller reporting company” in Rule 12b-2 of the Exchange Act. (Check one):
|
Large accelerated filer
o
|
Accelerated filer
o
|
Non-accelerated filer
x
|
Smaller reporting company
o
|
|
(Do not check if a smaller reporting company)
|
|||
The number of shares of common stock, $0.01 par value per share, of the registrant outstanding on
May 9, 2014
was
58,230,104
shares.
TABLE OF CONTENTS
|
PART I
|
||
|
Item 1.
|
||
|
Item 2.
|
||
|
Item 3.
|
||
|
Item 4.
|
||
|
PART II
|
||
|
Item 1.
|
||
|
Item 1A.
|
||
|
Item 6.
|
||
2
CAUTIONARY NOTE REGARDING FORWARD LOOKING STATEMENTS
This report contains forward looking statements within the meaning of Section 27A of the Securities Act of 1933, as amended (the “Securities Act”), Section 21E of the Securities Exchange Act of 1934, as amended (the “Exchange Act”), and the U.S. Private Securities Litigation Reform Act of 1995. Any statements about our expectations, beliefs, plans, predictions, forecasts, objectives, assumptions or future events or performance are not historical facts and may be forward looking. These statements are often, but not always, made through the use of words or phrases such as “anticipate,” “believes,” “can,” “could,” “may,” “predicts,” “potential,” “should,” “will,” “estimate,” “plans,” “projects,” “continuing,” “ongoing,” “expects,” “intends” and similar words or phrases. Accordingly, these statements are only predictions and involve estimates, known and unknown risks, assumptions and uncertainties that could cause actual results to differ materially from those expressed in them. Our actual results could differ materially from those anticipated in such forward looking statements as a result of many factors. For more information regarding these risks and uncertainties as well as certain additional risks that we face, you should refer to the Risk Factors detailed in Item 1A of Part I of our Annual Report on Form 10-K for the year ended December 31, 2013, as well as factors more fully described in Part I, Item 2, "
Management's Discussion and Analysis of Financial Condition and Results of Operations"
and elsewhere in this report, including the exhibits hereto, and subsequent reports and registration statements filed from time to time with the U.S. Securities and Exchange Commission (the "SEC").
Any or all of our forward looking statements in this report may turn out to be inaccurate. The inclusion of this forward looking information should not be regarded as a representation by us or any other person that the future plans, estimates or expectations contemplated by us will be achieved. We have based these forward looking statements largely on our current expectations and projections about future events and financial trends that we believe may affect our financial condition, operating results, business strategy and financial needs. There are important factors that could cause our actual results, level of activity, performance or achievements to differ materially from the results, level of activity, performance or achievements expressed or implied by the forward looking statements including, but not limited to, statements regarding:
|
•
|
our limited operating history;
|
|
•
|
retention of our existing certificates of authority in each state and D.C. and our ability to remain a mortgage insurer in good standing in each state and D.C.;
|
|
•
|
changes in the business practices of the GSEs, including modifications to their mortgage insurer eligibility requirements or decisions to decrease or discontinue the use of mortgage insurance;
|
|
•
|
our ability to remain a qualified mortgage insurer under the requirements imposed by the GSEs;
|
|
•
|
actions of existing competitors and potential market entry by new competitors;
|
|
•
|
changes to laws and regulations, including changes to the GSEs' role in the secondary mortgage market or other changes that could affect the residential mortgage industry generally or mortgage insurance in particular;
|
|
•
|
changes in general economic, market and political conditions and policies, interest rates, inflation and investment results or other conditions that affect the housing market or the markets for home mortgages or mortgage insurance;
|
|
•
|
changes in the regulatory environment;
|
|
•
|
our ability to implement our business strategy, including our ability to attract customers, implement successfully and on a timely basis, complex infrastructure, systems, procedures, and internal controls to support our business and regulatory and reporting requirements of the insurance industry;
|
|
•
|
failure of risk management or investment strategy;
|
|
•
|
claims exceeding our reserves or amounts we had expected to experience;
|
|
•
|
failure to develop, maintain and improve necessary information technology systems or the failure of technology providers to perform;
|
|
•
|
ability to recruit, train and retain key personnel; and
|
|
•
|
emergence of claim and coverage issues.
|
3
All forward looking statements are necessarily only estimates of future results, and actual results may differ materially from expectations. You are, therefore, cautioned not to place undue reliance on such statements which should be read in conjunction with the other cautionary statements that are included elsewhere in this report. Further, any forward looking statement speaks only as of the date on which it is made and we undertake no obligation to update or revise any forward looking statement to reflect events or circumstances after the date on which the statement is made or to reflect the occurrence of unanticipated events. You should, however, review the risk factors we describe in the reports we will file from time to time with the SEC after the date of this report.
Unless expressly indicated or the context requires otherwise, the terms "we", "our", "us" and "Company" in this document refer to NMI Holdings, Inc., a Delaware corporation, and its wholly owned subsidiaries.
4
INDEX TO FINANCIAL STATEMENTS
|
Condensed Consolidated Balance Sheets as of March 31, 2014 and December 31, 2013
|
|
|
Condensed Consolidated Statements of Comprehensive Loss for the three months ended March 31, 2014 and 2013
|
|
|
Condensed Consolidated Statements of Changes in Shareholders' Equity for the three months ended March 31, 2014 and the year ended December 31, 2013
|
|
|
Condensed Consolidated Statements of Cash Flows for the three months ended March 31, 2014 and 2013
|
|
|
Notes to Condensed Consolidated Financial Statements
|
|
5
NMI HOLDINGS, INC.
CONDENSED CONSOLIDATED BALANCE SHEETS (UNAUDITED)
|
March 31, 2014
|
December 31, 2013
|
||||||
|
Assets
|
(In Thousands, except for share data)
|
||||||
|
Investments, available-for-sale, at fair value:
|
|||||||
|
Fixed maturities (amortized cost of $414,888 and $416,135 as of March 31, 2014 and December 31, 2013, respectively)
|
$
|
410,876
|
|
$
|
409,088
|
|
|
|
Total investments
|
410,876
|
|
409,088
|
|
|||
|
Cash and cash equivalents
|
42,792
|
|
55,929
|
|
|||
|
Accrued investment income
|
1,791
|
|
2,001
|
|
|||
|
Premiums receivable
|
129
|
|
19
|
|
|||
|
Prepaid expenses
|
1,702
|
|
1,519
|
|
|||
|
Deferred policy acquisition costs, net
|
977
|
|
90
|
|
|||
|
Goodwill and other indefinite lived intangible assets
|
3,634
|
|
3,634
|
|
|||
|
Software and equipment, net
|
9,226
|
|
8,876
|
|
|||
|
Other assets
|
57
|
|
63
|
|
|||
|
Total Assets
|
$
|
471,184
|
|
$
|
481,219
|
|
|
|
Liabilities
|
|||||||
|
Unearned premiums
|
$
|
4,721
|
|
$
|
1,446
|
|
|
|
Reserve for insurance claims and claims expenses
|
—
|
|
—
|
|
|||
|
Accounts payable and accrued expenses
|
7,373
|
|
10,052
|
|
|||
|
Warrant liability, at fair value
|
5,504
|
|
6,371
|
|
|||
|
Deferred tax liability
|
133
|
|
133
|
|
|||
|
Total Liabilities
|
17,731
|
|
18,002
|
|
|||
|
Commitments and contingencies
|
|
|
|
|
|||
|
Shareholders' Equity
|
|||||||
|
Common stock - Class A shares, $0.01 par value,
58,067,326 and 58,052,480 shares issued and outstanding as of March 31, 2014 and December 31, 2013, respectively (250,000,000 shares authorized) |
581
|
|
581
|
|
|||
|
Additional paid-in capital
|
555,963
|
|
553,707
|
|
|||
|
Accumulated other comprehensive loss
|
(4,012
|
)
|
(7,047
|
)
|
|||
|
Accumulated deficit
|
(99,079
|
)
|
(84,024
|
)
|
|||
|
Total Shareholders' Equity
|
453,453
|
|
463,217
|
|
|||
|
Total Liabilities and Shareholders' Equity
|
$
|
471,184
|
|
$
|
481,219
|
|
|
See accompanying notes to consolidated financial statements.
6
NMI HOLDINGS, INC.
CONDENSED CONSOLIDATED STATEMENTS OF COMPREHENSIVE LOSS (UNAUDITED)
|
For the Three Months Ended March 31,
|
|||||||
|
2014
|
2013
|
||||||
|
Revenues
|
(In Thousands, except for share data)
|
||||||
|
Premiums written
|
|||||||
|
Direct
|
$
|
5,178
|
|
$
|
—
|
|
|
|
Net premiums written
|
5,178
|
|
—
|
|
|||
|
Increase in unearned premiums
|
(3,274
|
)
|
—
|
|
|||
|
Net premiums earned
|
1,904
|
|
—
|
|
|||
|
Net investment income
|
1,489
|
|
410
|
|
|||
|
Net realized investment gains
|
—
|
|
28
|
|
|||
|
Gain from change in fair value of warrant liability
|
817
|
|
35
|
|
|||
|
Gain from settlement of warrants
|
37
|
|
—
|
|
|||
|
Total Revenues
|
4,247
|
|
473
|
|
|||
|
Expenses
|
|||||||
|
Insurance claims and claims expenses, net
|
—
|
|
—
|
|
|||
|
Amortization of deferred policy acquisition costs
|
19
|
|
—
|
|
|||
|
Other underwriting and operating expenses
|
19,283
|
|
12,426
|
|
|||
|
Total Expenses
|
19,302
|
|
12,426
|
|
|||
|
Net Loss
|
(15,055
|
)
|
(11,953
|
)
|
|||
|
Other Comprehensive Income (net of tax)
|
|||||||
|
Net unrealized holding gains for the period included in accumulated other comprehensive loss
|
3,035
|
|
888
|
|
|||
|
Other Comprehensive Income (net of tax)
|
3,035
|
|
888
|
|
|||
|
Total Comprehensive Loss
|
$
|
(12,020
|
)
|
$
|
(11,065
|
)
|
|
|
Loss per share
|
|||||||
|
Basic and diluted loss per share
|
$
|
(0.26
|
)
|
$
|
(0.22
|
)
|
|
|
Weighted average common shares outstanding
|
58,061,299
|
|
55,500,100
|
|
|||
See accompanying notes to consolidated financial statements.
7
NMI HOLDINGS, INC.
CONDENSED CONSOLIDATED STATEMENTS OF CHANGES IN SHAREHOLDERS' EQUITY (UNAUDITED)
|
Common stock
|
Additional
Paid-in Capital |
Accumulated Other Comprehensive Loss
|
Accumulated Deficit
|
Total
|
||||||||||||||
|
Class A
|
Class B
|
|||||||||||||||||
|
(In Thousands)
|
||||||||||||||||||
|
Balance, December 31, 2012
|
$
|
553
|
|
$
|
2
|
|
$
|
517,032
|
|
$
|
1
|
|
$
|
(28,840
|
)
|
$
|
488,748
|
|
|
Common stock Class A share issuance related to restricted stock units
|
1
|
|
—
|
|
(1,579
|
)
|
—
|
|
—
|
|
(1,578
|
)
|
||||||
|
Common stock Class A share issuance related to initial public offering (net of expenses of $3,483)
|
25
|
|
—
|
|
27,887
|
|
—
|
|
—
|
|
27,912
|
|
||||||
|
Conversion of Class B shares of common stock into Class A shares of common stock
|
2
|
|
(2
|
)
|
—
|
|
—
|
|
—
|
|
—
|
|
||||||
|
Share-based compensation expense
|
—
|
|
—
|
|
10,367
|
|
—
|
|
—
|
|
10,367
|
|
||||||
|
Change in unrealized investment gains/losses
|
—
|
|
—
|
|
—
|
|
(7,048
|
)
|
—
|
|
(7,048
|
)
|
||||||
|
Net loss
|
—
|
|
—
|
|
—
|
|
—
|
|
(55,184
|
)
|
(55,184
|
)
|
||||||
|
Balance, December 31, 2013
|
$
|
581
|
|
$
|
—
|
|
$
|
553,707
|
|
$
|
(7,047
|
)
|
$
|
(84,024
|
)
|
$
|
463,217
|
|
|
Balance, January 1, 2014
|
$
|
581
|
|
$
|
—
|
|
$
|
553,707
|
|
$
|
(7,047
|
)
|
$
|
(84,024
|
)
|
$
|
463,217
|
|
|
Common stock Class A share issuance related to warrants
|
*
|
|
—
|
|
13
|
|
—
|
|
—
|
|
13
|
|
||||||
|
Common stock Class A share issuance related to equity awards
|
*
|
|
—
|
|
(90
|
)
|
—
|
|
—
|
|
(90
|
)
|
||||||
|
Share-based compensation expense
|
—
|
|
—
|
|
2,333
|
|
—
|
|
—
|
|
2,333
|
|
||||||
|
Change in unrealized investment gains/losses
|
—
|
|
—
|
|
—
|
|
3,035
|
|
—
|
|
3,035
|
|
||||||
|
Net loss
|
—
|
|
—
|
|
—
|
|
—
|
|
(15,055
|
)
|
(15,055
|
)
|
||||||
|
Balance, March 31, 2014
|
$
|
581
|
|
$
|
—
|
|
$
|
555,963
|
|
$
|
(4,012
|
)
|
$
|
(99,079
|
)
|
$
|
453,453
|
|
|
*
|
During the first quarter of 2014, we issued
1,115
and
13,731
common shares with a par value of
$0.01
related to the exercise of warrants and equity awards, respectively, which are not visible in this schedule due to rounding.
|
See accompanying notes to consolidated financial statements.
8
NMI HOLDINGS, INC.
CONDENSED CONSOLIDATED STATEMENTS OF CASH FLOWS (UNAUDITED)
|
For the Three Months Ended March 31,
|
|||||||
|
2014
|
2013
|
||||||
|
Cash Flows From Operating Activities
|
(In Thousands)
|
||||||
|
Net loss
|
$
|
(15,055
|
)
|
$
|
(11,953
|
)
|
|
|
Adjustments to reconcile net loss to net cash used in operating activities:
|
|||||||
|
Share-based compensation expense
|
2,333
|
|
3,013
|
|
|||
|
Gain from change in fair value of warrant liability
|
(817
|
)
|
(35
|
)
|
|||
|
Gain from settlement of warrants
|
(37
|
)
|
—
|
|
|||
|
Net realized investment gains
|
—
|
|
(28
|
)
|
|||
|
Depreciation and other amortization
|
1,952
|
|
59
|
|
|||
|
Changes in operating assets and liabilities:
|
|||||||
|
Accrued investment income
|
210
|
|
(1,134
|
)
|
|||
|
Unearned premiums
|
3,274
|
|
—
|
|
|||
|
Prepaid expenses
|
(183
|
)
|
(116
|
)
|
|||
|
Deferred policy acquisition costs, net
|
(887
|
)
|
—
|
|
|||
|
Premiums receivable
|
(110
|
)
|
—
|
|
|||
|
Other assets
|
7
|
|
54
|
|
|||
|
Accounts payable and accrued expenses
|
(2,678
|
)
|
(3,104
|
)
|
|||
|
Net Cash Used in Operating Activities
|
(11,991
|
)
|
(13,244
|
)
|
|||
|
Cash Flows From Investing Activities
|
|||||||
|
Purchase of short-term investments
|
—
|
|
(510
|
)
|
|||
|
Purchase of fixed-maturity investments, available-for-sale
|
(110
|
)
|
(338,329
|
)
|
|||
|
Proceeds from redemptions, maturities and sale of fixed-maturity investments, available-for-sale
|
718
|
|
15,352
|
|
|||
|
Purchase of software and equipment
|
(1,664
|
)
|
(1,722
|
)
|
|||
|
Net Cash Used in Investing Activities
|
(1,056
|
)
|
(325,209
|
)
|
|||
|
Cash Flows From Financing Activities
|
|||||||
|
Taxes paid related to net share settlement of equity awards
|
(90
|
)
|
—
|
|
|||
|
Net Cash Used in Financing Activities
|
(90
|
)
|
—
|
|
|||
|
Net Decrease in Cash and Cash Equivalents
|
(13,137
|
)
|
(338,453
|
)
|
|||
|
Cash and Cash Equivalents, beginning of period
|
55,929
|
|
485,855
|
|
|||
|
Cash and Cash Equivalents, end of period
|
$
|
42,792
|
|
$
|
147,402
|
|
|
See accompanying notes to consolidated financial statements.
9
NMI HOLDINGS, INC.
NOTES TO CONDENSED CONSOLIDATED FINANCIAL STATEMENTS (UNAUDITED)
1. Organization and Basis of Presentation
NMI Holdings, Inc. ("NMIH"), a Delaware corporation, was formed in May 2011 with the intention of providing private mortgage guaranty insurance through a wholly owned insurance subsidiary. From May 2011 through March 2013, our activities were limited to raising capital, seeking to acquire the assets and approvals necessary to become a private mortgage guaranty insurance provider and hiring personnel. In April 2013, we, through our primary insurance subsidiary, National Mortgage Insurance Corporation ("NMIC"), wrote our first mortgage guaranty insurance policy. As of
March 31, 2014
, we had
$514.8 million
primary insurance in force ("IIF") and
$5.0 billion
pool IIF, with
$115.5 million
of primary risk-in-force ("RIF") and
$93.1 million
of pool RIF.
The accompanying consolidated financial statements include the accounts of NMIH and its wholly owned subsidiaries, NMIC, National Mortgage Reinsurance Inc One ("Re One"), and National Mortgage Reinsurance Inc Two ("Re Two"). On September 30, 2013, we merged Re Two into NMIC with NMIC surviving the merger.
On November 30, 2011, we entered into an agreement with MAC Financial Ltd. to acquire MAC Financial Holding Corporation and its subsidiaries, which were renamed NMIC, Re One and Re Two, for
$8.5 million
in cash, common stock and warrants plus the assumption of
$1.3 million
in liabilities ("MAC Acquisition"). In addition, we incurred
$0.1 million
in deferred tax liabilities as a result of the acquisition of certain indefinite-lived intangibles. The MAC Acquisition was completed in April 2012. On September 30, 2013, we merged MAC Financial Holding Corporation into NMIH, with NMIH surviving the merger.
In April 2012, we offered and sold
55.0 million
shares of common stock at an issue price of
$10.00
per share in a private placement ("Private Placement"). Gross proceeds from the Private Placement were
$550.0 million
. Net proceeds from the Private Placement, after an approximate
7%
underwriting fee and other offering expenses, were approximately
$510 million
. The fee was escrowed for the benefit of FBR Capital Markets and Co. ("FBR") and was released to FBR upon our receipt of approval from Federal National Home Mortgage Association ("Fannie Mae") and Federal Home Loan Mortgage Corporation ("Freddie Mac") ("GSE Approval").
Under the terms of the Private Placement, we had until January 17, 2013 to obtain GSE Approval. NMIC was approved as an eligible mortgage guaranty insurer by Freddie Mac and Fannie Mae on January 15, 2013 and January 16, 2013, respectively, which approvals require NMIC to continue meeting certain conditions.
In November 2013, we completed an initial public offering of
2.4
million shares of our common stock and our common stock began trading on the NASDAQ on November 8, 2013, under the symbol “NMIH.” For a further discussion see
"Note 2, Common Stock Offerings."
Basis of Presentation
The accompanying unaudited condensed consolidated financial statements, which include the results of NMIH and its wholly owned subsidiaries, have been prepared in accordance with the instructions to Form 10-Q as prescribed by the United States ("U.S.") Securities and Exchange Commission for interim reporting and include all of the other information and disclosures required by accounting principles generally accepted in the U.S. ("GAAP"). Our accounts are maintained in U.S. dollars. These statements should be read in conjunction with our consolidated financial statements and notes thereto for the year ended
December 31, 2013
included in our Annual Report on Form 10-K. All intercompany transactions have been eliminated. The preparation of financial statements in accordance with GAAP requires management to make estimates and assumptions that affect reported amounts of assets and liabilities, as well as disclosure of contingent assets and liabilities as of the balance sheet date. Estimates also affect the reported amounts of income and expenses for the reporting period. Actual results could differ from those estimates. The results of operations for the interim period may not be indicative of the results that may be expected for the full year ending
December 31, 2014
.
Basic net loss per share is based on the weighted-average number of common shares outstanding, while diluted net loss per share is based on the weighted-average number of common shares outstanding and common stock equivalents that would be issuable upon the exercise of stock options, other stock-based compensation arrangements, and the dilutive effect of outstanding warrants. As a result of our net losses for the quarters ended
March 31, 2014
and
March 31, 2013
,
6.2 million
and
6.5 million
shares of our common stock equivalents issued under stock-based compensation arrangements and warrants, respectively, were not included in the calculation of diluted net loss per share as of such dates because they were anti-dilutive.
10
NMI HOLDINGS, INC.
NOTES TO CONDENSED CONSOLIDATED FINANCIAL STATEMENTS (UNAUDITED)
Deferred Policy Acquisition Costs
Costs directly associated with the successful acquisition of mortgage guaranty insurance policies, consisting of certain selling expenses and other policy issuance and underwriting expenses, are initially deferred and reported as deferred policy acquisition costs ("DAC"). For each book year of business, these costs are amortized to income in proportion to estimated gross profits over the estimated life of the policies. We recorded net DAC of
$976.6 thousand
at
March 31, 2014
and
$90.2 thousand
at
December 31, 2013
.
Reserve for Insurance Claims and Claims Expenses
We establish reserves to recognize the estimated liability for insurance claims and claim expenses related to defaults on insured mortgage loans. Our method, consistent with industry practice, is to establish claims reserves only for loans in default. We are a new company and recently began transacting mortgage guaranty insurance. We have not received any primary notices of default ("NOD"), and thus have not established any primary reserves for claims or claims that we believe have been incurred but not reported ("IBNR") for the
three months ended
March 31, 2014
or for the year ended
December 31, 2013
. Additionally, we entered into a pool insurance transaction with Fannie Mae, effective September 1, 2013. For this pool transaction, any claims reserve potentially established would be in excess of the transaction's deductible, which represents the amount of claims absorbed by Fannie Mae before we are obligated to pay any claims under the policy. Due to the size of the deductible (
$10.3 million
), the low level of NODs reported through
March 31, 2014
and the high quality of the loans, we have not established any pool reserves for claims or IBNR for the
three months ended
March 31, 2014
or for the year ended
December 31, 2013
.
Premium Deficiency Reserves
We consider whether a premium deficiency exists at each fiscal quarter using best estimate assumptions as of the testing date. Per ASC 944, a premium deficiency reserve shall be recognized if the sum of expected claim costs and claim adjustment expenses, expected dividends to policyholders, unamortized acquisition costs, and maintenance costs exceeds related unearned premiums. We have determined that no premium deficiency reserves were necessary for the quarter ended
March 31, 2014
or for the year ended
December 31, 2013
.
Reclassifications
Certain items in the financial statements as of
December 31, 2013
and for the quarter ended
March 31, 2013
have been reclassified to conform to the current period's presentation. There was no effect on net income or shareholders' equity previously reported.
Subsequent Events
On April 7, 2014, we received our final certificate of authority (our insurance license permitting us to write mortgage guaranty insurance in that state) from the state of Wyoming. With Wyoming, we are now licensed in all
50
states and Washington D.C.
On May 8, 2014 we held our annual shareholder meeting. Our shareholders voted to approve several items, including our 2014 Omnibus Incentive Plan, which authorizes us to make
4 million
shares of our class A common stock available to be granted. These shares may be either authorized but unissued shares or treasury shares.
We have considered subsequent events through the date of this filing.
2. Common Stock Offerings
We entered into a purchase/placement agreement that closed in April 2012, pursuant to which we offered and sold an aggregate of
55,000,000
of our Class A common shares, resulting in net proceeds of approximately
$510 million
after an approximate
7%
underwriting fee and other offering expenses. On November 8, 2013, we completed an initial public offering of
2.4
million shares of common stock, and our common stock began trading on the NASDAQ under the symbol "NMIH". Net proceeds from the offering were approximately
$28 million
, after an approximate
6%
underwriting fee and other offering expenses and reimbursements pursuant to the underwriting agreement.
11
NMI HOLDINGS, INC.
NOTES TO CONDENSED CONSOLIDATED FINANCIAL STATEMENTS (UNAUDITED)
3. Investments
We have designated our investment portfolio as available-for-sale and report it at fair value. The related unrealized gains and losses are, after considering the related tax expense or benefit, recognized as a component of accumulated other comprehensive loss in shareholders' equity. Net realized investment gains and losses are reported in income based upon specific identification of securities sold.
Fair Values and Gross Unrealized Gains and Losses on Investments
|
Amortized
Cost |
Gross Unrealized
|
Fair
Value |
|||||||||||||
|
Gains
|
Losses
|
||||||||||||||
|
As of March 31, 2014
|
(In Thousands)
|
||||||||||||||
|
U.S. Treasury securities and obligations of U.S. government agencies
|
$
|
108,053
|
|
$
|
12
|
|
$
|
(1,224
|
)
|
$
|
106,841
|
|
|||
|
Municipal bonds
|
12,015
|
|
28
|
|
(35
|
)
|
12,008
|
|
|||||||
|
Corporate debt securities
|
221,506
|
|
351
|
|
(2,888
|
)
|
218,969
|
|
|||||||
|
Asset-backed securities
|
73,314
|
|
296
|
|
(552
|
)
|
73,058
|
|
|||||||
|
Total Investments
|
$
|
414,888
|
|
$
|
687
|
|
$
|
(4,699
|
)
|
$
|
410,876
|
|
|||
|
Amortized
Cost |
Gross Unrealized
|
Fair
Value |
|||||||||||||
|
Gains
|
Losses
|
||||||||||||||
|
As of December 31, 2013
|
(In Thousands)
|
||||||||||||||
|
U.S. Treasury securities and obligations of U.S. government agencies
|
$
|
108,067
|
|
$
|
—
|
|
$
|
(1,461
|
)
|
$
|
106,606
|
|
|||
|
Municipal bonds
|
12,017
|
|
1
|
|
(85
|
)
|
11,933
|
|
|||||||
|
Corporate debt securities
|
221,899
|
|
157
|
|
(4,799
|
)
|
217,257
|
|
|||||||
|
Asset-backed securities
|
74,152
|
|
114
|
|
(974
|
)
|
73,292
|
|
|||||||
|
Total Investments
|
$
|
416,135
|
|
$
|
272
|
|
$
|
(7,319
|
)
|
$
|
409,088
|
|
|||
12
NMI HOLDINGS, INC.
NOTES TO CONDENSED CONSOLIDATED FINANCIAL STATEMENTS (UNAUDITED)
Scheduled Maturities
The amortized cost and fair values of available for sale securities at
March 31, 2014
and
December 31, 2013
, by contractual maturity, are shown below. Expected maturities will differ from contractual maturities because issuers may have the right to call or prepay obligations with or without call or prepayment penalties. Because most asset-backed securities provide for periodic payments throughout their lives, they are listed below in separate categories.
|
As of March 31, 2014
|
Amortized
Cost |
Fair
Value |
|||||
|
(In Thousands)
|
|||||||
|
Due in one year or less
|
$
|
2,674
|
|
$
|
2,675
|
|
|
|
Due after one through five years
|
264,257
|
|
261,989
|
|
|||
|
Due after five through ten years
|
59,222
|
|
57,975
|
|
|||
|
Due after ten years
|
15,421
|
|
15,179
|
|
|||
|
Asset-backed securities
|
73,314
|
|
73,058
|
|
|||
|
Total Investments
|
$
|
414,888
|
|
$
|
410,876
|
|
|
|
As of December 31, 2013
|
Amortized
Cost |
Fair
Value |
|||||
|
(In Thousands)
|
|||||||
|
Due in one year or less
|
$
|
—
|
|
$
|
—
|
|
|
|
Due after one through five years
|
260,855
|
|
257,501
|
|
|||
|
Due after five through ten years
|
65,687
|
|
63,440
|
|
|||
|
Due after ten years
|
15,441
|
|
14,855
|
|
|||
|
Asset-backed securities
|
74,152
|
|
73,292
|
|
|||
|
Total Investments
|
$
|
416,135
|
|
$
|
409,088
|
|
|
Net Realized Investment Gains (Losses) on Investments
We had
no
net realized gains or losses for the three months ended
March 31, 2014
. For the three months ended
March 31, 2013
, we had net realized gains on corporate bonds of
$28 thousand
.
13
NMI HOLDINGS, INC.
NOTES TO CONDENSED CONSOLIDATED FINANCIAL STATEMENTS (UNAUDITED)
Aging of Unrealized Losses
At
March 31, 2014
, the investment portfolio had gross unrealized losses of
$4.7 million
,
$347 thousand
of which has been in an unrealized loss position for a period of 12 months or greater. We did not consider these securities to be other-than-temporarily impaired as of
March 31, 2014
. We based our conclusion that these investments were not other-than-temporarily impaired at
March 31, 2014
on the following facts: (i) the unrealized losses were primarily caused by interest rate movements since the purchase date; (ii) we do not intend to sell these investments and; (iii) we do not believe that it is more likely than not that we will be required to sell these investments before recovery of our amortized cost basis, which may not occur until maturity. For those securities in an unrealized loss position, the length of time the securities were in such a position is as follows:
|
Less Than 12 Months
|
12 Months or Greater
|
Total
|
||||||||||||||||||||||||
|
# of Securities
|
Fair Value
|
Unrealized Losses
|
# of Securities
|
Fair Value
|
Unrealized Losses
|
# of Securities
|
Fair Value
|
Unrealized Losses
|
||||||||||||||||||
|
As of March 31, 2014
|
(Dollars in Thousands)
|
|||||||||||||||||||||||||
|
U.S. Treasury securities and obligations of U.S. government agencies
|
41
|
|
$
|
87,817
|
|
$
|
(1,224
|
)
|
—
|
|
$
|
—
|
|
$
|
—
|
|
41
|
|
$
|
87,817
|
|
$
|
(1,224
|
)
|
||
|
Municipal bonds
|
1
|
|
1,715
|
|
(35
|
)
|
—
|
|
—
|
|
—
|
|
1
|
|
1,715
|
|
(35
|
)
|
||||||||
|
Corporate debt securities
|
93
|
|
152,174
|
|
(2,668
|
)
|
4
|
|
10,928
|
|
(220
|
)
|
97
|
|
163,102
|
|
(2,888
|
)
|
||||||||
|
Assets-backed securities
|
26
|
|
37,101
|
|
(425
|
)
|
2
|
|
5,669
|
|
(127
|
)
|
28
|
|
42,770
|
|
(552
|
)
|
||||||||
|
Total Investments
|
161
|
|
$
|
278,807
|
|
$
|
(4,352
|
)
|
6
|
|
$
|
16,597
|
|
$
|
(347
|
)
|
167
|
|
$
|
295,404
|
|
$
|
(4,699
|
)
|
||
|
Less Than 12 Months
|
12 Months or Greater
|
Total
|
||||||||||||||||||||||||
|
# of Securities
|
Fair Value
|
Unrealized Losses
|
# of Securities
|
Fair Value
|
Unrealized Losses
|
# of Securities
|
Fair Value
|
Unrealized Losses
|
||||||||||||||||||
|
As of December 31, 2013
|
(Dollars in Thousands)
|
|||||||||||||||||||||||||
|
U.S. Treasury securities and obligations of U.S. government agencies
|
19
|
|
$
|
106,606
|
|
$
|
(1,461
|
)
|
—
|
|
$
|
—
|
|
$
|
—
|
|
19
|
|
$
|
106,606
|
|
$
|
(1,461
|
)
|
||
|
Municipal bonds
|
2
|
|
4,915
|
|
(85
|
)
|
—
|
|
—
|
|
—
|
|
2
|
|
4,915
|
|
(85
|
)
|
||||||||
|
Corporate debt securities
|
47
|
|
187,714
|
|
(4,799
|
)
|
—
|
|
—
|
|
—
|
|
47
|
|
187,714
|
|
(4,799
|
)
|
||||||||
|
Assets-backed securities
|
11
|
|
58,225
|
|
(974
|
)
|
—
|
|
—
|
|
—
|
|
11
|
|
58,225
|
|
(974
|
)
|
||||||||
|
Total Investments
|
79
|
|
$
|
357,460
|
|
$
|
(7,319
|
)
|
—
|
|
$
|
—
|
|
$
|
—
|
|
79
|
|
$
|
357,460
|
|
$
|
(7,319
|
)
|
||
Net investment income is comprised of the following:
|
For the Three Months Ended March 31,
|
|||||||
|
2014
|
2013
|
||||||
|
(In Thousands)
|
|||||||
|
Fixed maturities
|
$
|
1,626
|
|
$
|
566
|
|
|
|
Cash equivalents
|
—
|
|
1
|
|
|||
|
Investment income
|
1,626
|
|
567
|
|
|||
|
Investment expenses
|
(137
|
)
|
(157
|
)
|
|||
|
Net Investment Income
|
$
|
1,489
|
|
$
|
410
|
|
|
As of
March 31, 2014
and
December 31, 2013
, there were approximately
$7.1 million
and
$7.0 million
, respectively, of cash and investments in the form of U.S. Treasury securities on deposit with various state insurance departments to satisfy regulatory requirements.
14
NMI HOLDINGS, INC.
NOTES TO CONDENSED CONSOLIDATED FINANCIAL STATEMENTS (UNAUDITED)
4. Fair Value of Financial Instruments
The following describes the valuation techniques used by us to determine the fair value of financial instruments held at
March 31, 2014
and
December 31, 2013
:
We established a fair value hierarchy by prioritizing the inputs to valuation techniques used to measure fair value. The hierarchy gives the highest priority to unadjusted quoted prices in active markets for identical assets or liabilities (Level 1 measurements) and the lowest priority to unobservable inputs (Level 3 measurements). The three levels of the fair value hierarchy under this standard are described below:
Level 1 - Unadjusted quoted prices for identical assets or liabilities in active markets that are accessible at the measurement date for identical assets or liabilities;
Level 2 - Prices or valuations based on observable inputs other than quoted prices in active markets for identical assets and liabilities; and
Level 3 - Unobservable inputs that are significant to the fair value of the assets or liabilities. Level 3 assets and liabilities include financial instruments whose value is determined using pricing models, discounted cash flow methodologies, or similar techniques, as well as instruments for which the determination of fair value requires significant management judgment or estimation.
The level of market activity used to determine the fair value hierarchy is based on the availability of observable inputs market participants would use to price an asset or a liability, including market value price observations.
Assets classified as Level 1 and Level 2
To determine the fair value of securities available-for-sale in Level 1 and Level 2 of the fair value hierarchy, independent pricing sources have been utilized. One price is provided per security based on observable market data. To ensure securities are appropriately classified in the fair value hierarchy, we review the pricing techniques and methodologies of the independent pricing sources and believe that their policies adequately consider market activity, either based on specific transactions for the issue valued or based on modeling of securities with similar credit quality, duration, yield and structure that were recently traded. A variety of inputs are utilized by the independent pricing sources including benchmark yields, reported trades, non-binding broker/dealer quotes, issuer spreads, two sided markets, benchmark securities, bids, offers and reference data including data published in market research publications. Inputs may be weighted differently for any security, and not all inputs are used for each security evaluation. Market indicators, industry and economic events are also considered. This information is evaluated using a multidimensional pricing model. Quality controls are performed by the independent pricing sources throughout this process, which include reviewing tolerance reports, trading information and data changes, and directional moves compared to market moves. This model combines all inputs to arrive at a value assigned to each security. We have not made any adjustments to the prices obtained from the independent pricing sources.
Liabilities classified as Level 3
The warrants outstanding are valued using a Black-Scholes option-pricing model in combination with a binomial model and Monte Carlo simulation used to value the pricing protection features within the warrants. Variables in the model include the risk-free rate of return, dividend yield, expected life and expected volatility of our stock price.
ASC 825,
Disclosures about Fair Value of Financial Instruments
, requires all entities to disclose the fair value of their financial instruments, both assets and liabilities recognized and not recognized in the balance sheet, for which it is practicable to estimate fair value.
15
NMI HOLDINGS, INC.
NOTES TO CONDENSED CONSOLIDATED FINANCIAL STATEMENTS (UNAUDITED)
The following is a list of those assets and liabilities that are measured at fair value by hierarchy level as of
March 31, 2014
and
December 31, 2013
:
|
Fair Value Measurements Using
|
|||||||||||||||
|
Assets and Liabilities at Fair Value
|
Quoted Prices in
Active Markets for Identical Assets (Level 1) |
Significant Other
Observable Inputs (Level 2) |
Significant
Unobservable Inputs (Level 3) |
Fair Value
|
|||||||||||
|
As of March 31, 2014
|
(In Thousands)
|
||||||||||||||
|
U.S. Treasury securities and obligations of U.S. government agencies
|
$
|
49,675
|
|
$
|
57,166
|
|
$
|
—
|
|
$
|
106,841
|
|
|||
|
Municipal bonds
|
—
|
|
12,008
|
|
—
|
|
12,008
|
|
|||||||
|
Corporate debt securities
|
—
|
|
218,969
|
|
—
|
|
218,969
|
|
|||||||
|
Asset-backed securities
|
—
|
|
73,058
|
|
—
|
|
73,058
|
|
|||||||
|
Cash and cash equivalents
|
42,792
|
|
—
|
|
—
|
|
42,792
|
|
|||||||
|
Total Assets
|
$
|
92,467
|
|
$
|
361,201
|
|
$
|
—
|
|
$
|
453,668
|
|
|||
|
Warrant liability
|
$
|
—
|
|
$
|
—
|
|
$
|
5,504
|
|
$
|
5,504
|
|
|||
|
Total Liabilities
|
$
|
—
|
|
$
|
—
|
|
$
|
5,504
|
|
$
|
5,504
|
|
|||
|
Fair Value Measurements Using
|
|||||||||||||||
|
Assets and Liabilities at Fair Value
|
Quoted Prices in
Active Markets for Identical Assets (Level 1) |
Significant Other
Observable Inputs (Level 2) |
Significant
Unobservable Inputs (Level 3) |
Fair Value
|
|||||||||||
|
As of December 31, 2013
|
(In Thousands)
|
||||||||||||||
|
U.S. Treasury securities and obligations of U.S. government agencies
|
$
|
49,484
|
|
$
|
57,122
|
|
$
|
—
|
|
$
|
106,606
|
|
|||
|
Municipal bonds
|
—
|
|
11,933
|
|
—
|
|
11,933
|
|
|||||||
|
Corporate debt securities
|
—
|
|
217,257
|
|
—
|
|
217,257
|
|
|||||||
|
Asset-backed securities
|
—
|
|
73,292
|
|
—
|
|
73,292
|
|
|||||||
|
Cash and cash equivalents
|
55,929
|
|
—
|
|
—
|
|
55,929
|
|
|||||||
|
Total Assets
|
$
|
105,413
|
|
$
|
359,604
|
|
$
|
—
|
|
$
|
465,017
|
|
|||
|
Warrant liability
|
$
|
—
|
|
$
|
—
|
|
$
|
6,371
|
|
$
|
6,371
|
|
|||
|
Total Liabilities
|
$
|
—
|
|
$
|
—
|
|
$
|
6,371
|
|
$
|
6,371
|
|
|||
The following is a roll-forward of Level 3 liabilities measured at fair value for the
three months ended March 31, 2014
and the year ended
December 31, 2013
:
|
Level 3 Instruments Only
|
Warrant Liability
|
||
|
Three Months Ended March 31, 2014
|
(In Thousands)
|
||
|
Balance, January 1, 2014
|
$
|
6,371
|
|
|
Change in fair value of warrant liability included in earnings
|
(817
|
)
|
|
|
Gain on settlement of warrants
|
(37
|
)
|
|
|
Issuance of common stock on warrant exercise
|
(13
|
)
|
|
|
Balance, March 31, 2014
|
$
|
5,504
|
|
|
Level 3 Instruments Only
|
Warrant Liability
|
||
|
Year Ended December 31, 2013
|
(In Thousands)
|
||
|
Balance, January 1, 2013
|
$
|
4,842
|
|
|
Change in fair value of warrant liability included in earnings
|
1,529
|
|
|
|
Balance, December 31, 2013
|
$
|
6,371
|
|
16
NMI HOLDINGS, INC.
NOTES TO CONDENSED CONSOLIDATED FINANCIAL STATEMENTS (UNAUDITED)
We revalue the warrant liability quarterly using a Black-Scholes option-pricing model in combination with a binomial model and a Monte-Carlo simulation model used to value the pricing protection features within the warrant.
As of March 31, 2014
the assumptions used in the option pricing model were as follows: a common stock price as of
March 31, 2014
of
$11.72
, risk free interest rate of
2.18%
, expected life of
6.57 years
, expected volatility of
39.0%
, and a dividend yield of
0%
. The change in fair value is primarily attributable to a decline in the price of our common stock from December 31, 2013 to March 31, 2014.
The carrying value of other selected assets on our consolidated balance sheet approximates fair value.
5. Software and Equipment
Software and equipment consist of capitalized software purchased in connection with the MAC Acquisition which had a fair value of
$5.0 million
at the date of acquisition, as well as software we have developed. Software and equipment, net of accumulated amortization and depreciation, as of
March 31, 2014
and
December 31, 2013
consist of the following:
|
As of March 31,
|
As of December 31,
|
||||||
|
2014
|
2013
|
||||||
|
(In Thousands)
|
|||||||
|
Software
|
$
|
15,726
|
|
$
|
14,140
|
|
|
|
Equipment
|
544
|
|
542
|
|
|||
|
Leasehold improvements
|
217
|
|
141
|
|
|||
|
Subtotal
|
16,487
|
|
14,823
|
|
|||
|
Accumulated amortization and depreciation
|
(7,261
|
)
|
(5,947
|
)
|
|||
|
Software and equipment, net
|
$
|
9,226
|
|
$
|
8,876
|
|
|
Amortization and depreciation expense for the
three months ended
March 31, 2014
and for the year ended December 31,
2013
was
$1.3 million
and
$59 thousand
, respectively.
6. Intangible Assets and Goodwill
Intangible assets and goodwill consist of identifiable intangible assets and goodwill purchased in connection with the MAC Acquisition. Intangible assets and goodwill, net, as of
March 31, 2014
and
December 31, 2013
, consist of the following:
|
As of March 31, 2014 and December 31, 2013
|
(In Thousands)
|
Expected Lives
|
|||
|
Goodwill
|
$
|
3,244
|
|
Indefinite
|
|
|
State licenses
|
260
|
|
Indefinite
|
||
|
GSE approvals
|
130
|
|
Indefinite
|
||
|
Total Intangible Assets and Goodwill
|
$
|
3,634
|
|
||
We test goodwill and intangibles for impairment in the third and fourth quarter, respectively, of every year, or more frequently if we believe indicators of impairment exist. We have not identified any impairments of goodwill or impairments of indefinite-lived intangibles as of
March 31, 2014
.
7. Income Taxes
We are a U.S. taxpayer and are subject to a statutory U.S. federal corporate income tax rate of
35%
. Our holding company files a consolidated U.S. federal and various state income tax returns on behalf of itself and its subsidiaries. Our effective income tax rate on our pre-tax loss was
0%
for the three months ended March 31, 2014, which was the same for the comparable 2013 period. During those periods, the benefit from income taxes was eliminated or reduced by the recognition of a full valuation allowance which was recorded to reflect the amount of the deferred taxes that may not be realized.
As of March 31, 2014 and December 31, 2013, we have a net deferred tax liability of
$0.1 million
as a result of the acquisition of indefinite-lived intangibles in the MAC Acquisition for which no benefit has been reflected in the acquired net operating loss carry forwards. The tax liability incurred at the acquisition is recorded as an increase in goodwill.
17
NMI HOLDINGS, INC.
NOTES TO CONDENSED CONSOLIDATED FINANCIAL STATEMENTS (UNAUDITED)
8. Share Based Compensation
A summary of option activity under our 2012 Stock Incentive Plan during the quarters ending
March 31, 2014
and
March 31, 2013
is as follows:
|
Shares
|
Weighted Average Exercise Price
|
Weighted Average Grant Date Fair Value per Share
|
||||||||
|
(Shares in Thousands)
|
||||||||||
|
Options outstanding at December 31, 2013
|
3,063
|
|
$
|
10.31
|
|
$
|
3.98
|
|
||
|
Options granted
|
693
|
|
12.32
|
|
4.97
|
|
||||
|
Options exercised
|
(2
|
)
|
10.00
|
|
3.84
|
|
||||
|
Options forfeited
|
(28
|
)
|
10.71
|
|
4.15
|
|
||||
|
Options outstanding at March 31, 2014
|
3,726
|
|
$
|
10.68
|
|
$
|
4.17
|
|
||
|
Shares
|
Weighted Average Exercise Price
|
Weighted Average Grant Date Fair Value per Share
|
||||||||
|
(Shares in Thousands)
|
||||||||||
|
Options outstanding at December 31, 2012
|
2,547
|
|
$
|
10.00
|
|
$
|
3.86
|
|
||
|
Options granted
|
514
|
|
11.75
|
|
4.56
|
|
||||
|
Options forfeited
|
(10
|
)
|
10.00
|
|
3.84
|
|
||||
|
Options outstanding at March 31, 2013
|
3,051
|
|
$
|
10.27
|
|
$
|
3.98
|
|
||
As of
March 31, 2014
, there were
2,000
options exercised and
989,000
options were fully vested and exercisable. The weighted average exercise price for the fully vested and exercisable options was
$10.32
. The remaining weighted average contractual life of options fully vested and exercisable as of
March 31, 2014
was
7.2 years
. The aggregate intrinsic value for fully vested and exercisable options was
$1.4 million
as of
March 31, 2014
. The fair value of option grants to employees is determined based on a Black-Scholes simulation model at the date of grant.
A summary of RSU activity in the plan during the quarters ending
March 31, 2014
and
March 31, 2013
is as follows:
|
Shares
|
Weighted Average Grant Date Fair Value per Share
|
|||||
|
(Shares in Thousands)
|
||||||
|
Non-vested restricted stock units at December 31, 2013
|
1,242
|
|
$
|
7.75
|
|
|
|
Restricted stock units granted
|
239
|
|
12.32
|
|
||
|
Restricted stock units vested
|
(19
|
)
|
11.31
|
|
||
|
Restricted stock units forfeited
|
(14
|
)
|
6.98
|
|
||
|
Non-vested restricted stock units at March 31, 2014
|
1,448
|
|
$
|
8.46
|
|
|
|
Shares
|
Weighted Average Grant Date Fair Value per Share
|
|||||
|
(Shares in Thousands)
|
||||||
|
Non-vested restricted stock units at December 31, 2012
|
1,429
|
|
$
|
7.35
|
|
|
|
Restricted stock units granted
|
82
|
|
11.75
|
|
||
|
Restricted stock units forfeited
|
—
|
|
—
|
|
||
|
Non-vested restricted stock units at March 31, 2013
|
1,511
|
|
$
|
7.59
|
|
|
At
March 31, 2014
, the
1.4 million
shares of non-vested RSUs consisted of
0.5 million
shares that are subject to both a market and service condition and
0.9 million
shares that are subject only to service conditions. The non-vested RSUs subject to both a market and service condition vest in one-half increments upon the achievement of certain market price goals and continued service.
18
NMI HOLDINGS, INC.
NOTES TO CONDENSED CONSOLIDATED FINANCIAL STATEMENTS (UNAUDITED)
Non-vested RSUs subject only to a service condition vest over a service period ranging from
1
to
3
years. The fair value of RSUs subject to market and service conditions is determined based on a Monte Carlo simulation model at the date of grant. The fair value of RSUs subject only to service conditions are valued at our stock price on the date of grant less the present value of anticipated dividends.
9. Warrants
We issued
992,000
warrants, to FBR and the former stockholders of MAC Financial Ltd., upon the completion of our Private Placement and in conjunction with the MAC Acquisition, respectively. Each warrant gave the holder thereof the right to purchase one share of common stock at an exercise price equal to
$10.00
. The warrants were issued with an aggregate fair value of
$5.1 million
.
Upon exercise of these warrants, the amounts will be reclassified from warrant liability to additional paid-in capital. During the first quarter of 2014,
7,790
warrants were exercised and we issued
1,115
Class A common shares via a cashless exercise. Upon exercise we reclassified the fair value of the warrants from warrant liability to additional paid in capital and recognized a gain of approximately
$37 thousand
.
We account for these warrants to purchase our common shares in accordance with ASC 470-20,
Debt with Conversion and Other Options
and ASC 815-40,
Derivatives and Hedging - Contracts in Entity's Own Equity.
10. Litigation
On August 8, 2012, Germaine Marks, as Receiver, and Truitte Todd, as Special Deputy Receiver, of PMI Mortgage Insurance Co. (“PMI”), an Arizona insurance company in receivership, filed a complaint (the “PMI Complaint”) against NMIH, NMIC and certain named individuals, in California Superior Court, Alameda County (the "Court"). The PMI Complaint, as amended, alleges breach of fiduciary duty, breach of loyalty, aiding and abetting breach of fiduciary duty and loyalty, misappropriation of trade secrets, conversion, breach of proprietary information agreement, breach of separation agreement, intentional interference with contractual relations and unfair competition. The lawsuit seeks injunctive relief as well as unspecified monetary damages. We and the individual defendants believe these claims are without merit and have filed answers denying all allegations. We and the individual defendants intend to defend ourselves vigorously.
On January 30, 2014, Arch announced the closing of its acquisition of CMG and certain assets of PMI. The terms of the February 7, 2013 Asset Purchase Agreement ("APA") between Arch and PMI provide that effective as of the closing of that transaction, PMI shall transfer and assign to Arch all causes of action being pursued by PMI in the PMI Complaint. The APA further provides that within thirty (30) days after the closing of the transaction, Arch shall have its attorney file appropriate pleadings and other documents and instruments with the court requesting that PMI be removed as a party plaintiff in the PMI Complaint and that Arch be substituted as the real party in interest. Although Arch has not yet filed any such request with the Court, the plaintiff is now described in pleadings as “Plaintiff and Real Party in Interest Arch U.S. MI Services, Inc.”
The parties are now engaged in discovery and the court has set a trial date for September 29, 2014. Because the litigation and related discovery are ongoing, we do not have sufficient information to determine or predict the ultimate outcome or estimate the range of possible losses, if any. Accordingly, no provision for litigation losses has been included in the financial statements.
11. Statutory Information
Our insurance subsidiaries, NMIC and Re One, file financial statements in conformity with statutory basis accounting principles ("SAP") prescribed or permitted by the Wisconsin Office of the Commissioner of Insurance ("Wisconsin OCI"). NMIC's principal regulator is the Wisconsin OCI. Prescribed SAP includes state laws, regulations and general administrative rules, as well as a variety of publications of the National Association of Insurance Commissioners ("NAIC"). The Wisconsin OCI recognizes only statutory accounting practices prescribed or permitted by the state of Wisconsin for determining and reporting the financial condition and results of operations of an insurance company and for determining its solvency under Wisconsin insurance laws.
19
NMI HOLDINGS, INC.
NOTES TO CONDENSED CONSOLIDATED FINANCIAL STATEMENTS (UNAUDITED)
NMIC and Re One's combined statutory net income, statutory surplus and contingency reserve as of
March 31, 2014
and for the year ended
December 31, 2013
were as follows:
|
March 31, 2014
|
December 31, 2013
|
||||||
|
(In Thousands)
|
|||||||
|
Statutory net loss
|
$
|
(12,750
|
)
|
$
|
(33,307
|
)
|
|
|
Statutory surplus
|
196,948
|
|
189,698
|
|
|||
|
Contingency reserve
|
3,265
|
|
2,314
|
|
|||
Under applicable Wisconsin law, as well as that of
15
other states, a mortgage guaranty insurer must maintain a minimum amount of statutory capital relative to the risk-in-force (Risk to Capital ratio or “RTC ratio”) in order for the mortgage guaranty insurer to continue to write new business. We refer to these requirements as the “RTC requirement.” While formulations of minimum capital may vary in each jurisdiction that has such a requirement, the most common measure applied allows for a maximum permitted RTC ratio of
25
to 1. Wisconsin and certain other states, including California and Illinois, apply a substantially similar requirement referred to as minimum policyholders position. Our operation plan filed with the Wisconsin OCI and other state insurance departments in connection with NMIC's applications for licensure includes the expectation that NMIH will downstream additional capital if needed so that NMIC does not exceed risk-to-capital ratios agreed to with those states. NMIC may in the future seek state insurance department approvals, as needed, of an amendment to our business plan to increase this ratio to the Wisconsin regulatory minimum of
25
to 1.
As part of the NMIC's approval by the GSEs, we agreed to maintain minimum capital of
$150 million
at NMIC and not exceed a risk-to-capital of
15
:1. At
March 31, 2014
, NMIH had sufficient resources to downstream cash to either insurance subsidiary, as necessary, to comply with all commitments.
Certain states limit the amount of risk a mortgage guaranty insurer may retain on a single loan to
25%
of the indebtedness to the insured and as a result the portion of such insurance in excess of
25%
must be reinsured. NMIC has entered into a primary excess share reinsurance agreement effective August 1, 2012 and a facultative pool reinsurance agreement effective September 1, 2013, both with Re One. NMIC cedes premiums and claims to Re One on an excess share basis for any primary or pool policy which offers coverage greater than
25%
. NMIC will use reinsurance provided by Re One solely for purposes of compliance with statutory coverage limits. During April 2013, NMIC wrote its first mortgage insurance policies and ceded premium and risk to Re One the following month.
As of
March 31, 2013
, none of our insurance subsidiaries had written any business, had no risk-in-force and therefore had no RTC ratios. As of
March 31, 2014
, NMIC's RTC ratio is less than 1:1, significantly below the limits established with the GSEs and state insurance departments. The risk-to-capital calculation for each of our insurance subsidiaries, as well as our combined risk-to-capital calculation, as of
March 31, 2014
, is presented below.
20
NMI HOLDINGS, INC.
NOTES TO CONDENSED CONSOLIDATED FINANCIAL STATEMENTS (UNAUDITED)
|
As of March 31, 2014
|
NMIC
|
Re One
|
Combined
|
||||||||
|
(In Thousands)
|
|||||||||||
|
Primary risk-in-force
|
|||||||||||
|
Direct
|
$
|
115,467
|
|
$
|
—
|
|
$
|
115,467
|
|
||
|
Assumed
|
—
|
|
8,172
|
|
8,172
|
|
|||||
|
Ceded
|
(8,172
|
)
|
—
|
|
(8,172
|
)
|
|||||
|
Total primary risk-in-force
|
107,295
|
|
8,172
|
|
115,467
|
|
|||||
|
Pool risk-in-force
(1)
|
|||||||||||
|
Direct
|
93,090
|
|
—
|
|
93,090
|
|
|||||
|
Assumed
|
—
|
|
25,163
|
|
25,163
|
|
|||||
|
Ceded
|
(25,163
|
)
|
—
|
|
(25,163
|
)
|
|||||
|
Total pool risk-in-force
|
67,927
|
|
25,163
|
|
93,090
|
|
|||||
|
Total risk-in-force
|
175,222
|
|
33,335
|
|
208,557
|
|
|||||
|
Statutory policyholders' surplus
|
187,593
|
|
9,355
|
|
196,948
|
|
|||||
|
Statutory contingency reserve
|
2,631
|
|
634
|
|
3,265
|
|
|||||
|
Total statutory policyholders' position
|
$
|
190,224
|
|
$
|
9,989
|
|
$
|
200,213
|
|
||
|
Risk-to-Capital
(2)
|
0.9:1
|
|
3.3:1
|
|
1:1
|
|
|||||
|
(1)
|
Pool risk-in-force as shown in the table above is equal to the aggregate stop loss less a deductible.
|
|
(2)
|
Represents total risk-in-force divided by statutory policyholders' position which is the metric by which the majority of state insurance regulators will assess our capital adequacy. Additionally, Fannie Mae requires us to maintain the greater of (a) the risk-to-capital requirements outlined in the January 2013 approval letter, or (b) a risk-to-capital ratio of
18
:1 on primary business plus statutory capital equal to the amount of net risk-in-force of the pool.
|
NMIH is not subject to any limitations on its ability to pay dividends except those generally applicable to corporations that are incorporated in Delaware, such as NMIH. Delaware corporation law provides that dividends are only payable out of a corporation's capital surplus or (subject to certain limitations) recent net profits. As of December 31, 2013, NMIH's capital surplus was approximately
$463 million
. NMIH assets, excluding investment in NMIC and Re One, were approximately
$276 million
at December 31, 2013 and were unencumbered by any debt or other subsidiary commitments or obligations. The insurance subsidiaries are both mono-line mortgage guaranty insurance companies, and the assets of each are dedicated only to the support of direct risk and obligations of each mortgage insurance entity. NMIC only writes direct mortgage guaranty insurance business and assumes no business from any other entity. Re One only assumes business from NMIC to allow NMIC to comply with statutory risk requirements. Neither NMIC nor Re One have subsidiaries, and therefore do not have risks and obligations that compete for its resources, and neither entity counts a subsidiary's asset in their admitted statutory assets.
The GSEs and state insurance regulators may restrict our insurance subsidiaries' ability to pay dividends to NMIH. In addition to the restrictions imposed during the GSE Approval and state licensing processes, the ability of our insurance subsidiaries to pay dividends to NMIH is limited by insurance laws of the State of Wisconsin and certain other states. Wisconsin law provides that an insurance company may pay out dividends without the prior approval of the Wisconsin OCI (“ordinary dividends”) in an amount, when added to other shareholder distributions made in the prior 12 months, not to exceed the lesser of (a)
10%
of the insurer's surplus as regards to policyholders as of the prior December 31, or (b) its net income (excluding realized capital gains) for the twelve month period ending December 31 of the immediately preceding calendar year. In determining net income, an insurer may carry forward net income from the previous calendar years that has not already been paid out as a dividend. Dividends that exceed this amount are “extraordinary dividends,” which require prior approval of the Wisconsin OCI. As of December 31, 2013, the amount of restricted net assets held by our consolidated insurance subsidiaries totaled approximately
$193 million
of NMIH's consolidated net assets of
$463 million
. The amount of restricted assets used to determine any dividend to NMIH, once all restrictions expire, would be computed under SAP which may differ from the amount of restricted assets computed under GAAP.
21
The following analysis should be read in conjunction with our unaudited consolidated financial statements and the notes thereto included in this report and our audited financial statements, notes thereto and “Management’s Discussion and Analysis of Financial Condition and Results of Operations” included in our Annual Report on Form 10-K for the year ended December 31, 2013, for a more complete understanding of our financial position and results of operations. In addition, investors should review the “Cautionary Note Regarding Forward-Looking Statements” above and the “Risk Factors” detailed in Item 1A of Part I of our Annual Report on Form 10-K for the year ended December 31, 2013 and in Item 1A of Part II of our Quarterly Reports on Form 10-Q filed in 2014, including this Quarterly Report on Form 10-Q, for a discussion of those risks and uncertainties that have the potential to affect our business, financial condition, results of operations, cash flows or prospects in a material and adverse manner. Our results of operations for interim periods are not necessarily indicative of results to be expected for the full year or for any other period.
Overview
NMI Holdings, Inc. ("NMIH" or the "Company") was formed in May 2011 and, through its subsidiaries, provides private mortgage guaranty insurance (which we refer to as "mortgage insurance" or "MI"). As used in this report, "we" and "our" refer to NMIH's consolidated operations. Our primary insurance subsidiary, National Mortgage Insurance Corporation ("NMIC"), is a qualified MI provider on loans purchased by Fannie Mae and Freddie Mac (collectively the “GSEs”) and is currently licensed in all 50 states and D.C. to issue mortgage guaranty insurance. Our reinsurance subsidiary, National Mortgage Reinsurance Inc One (“Re One”), solely provides reinsurance to NMIC on certain loans insured by NMIC, as described in
Note 11, Statutory Information
, above.
MI protects mortgage lenders from all or a portion of default-related losses on residential mortgage loans made to home buyers who generally make down payments of less than 20% of the home’s purchase price. By protecting lenders and investors from credit losses, we help facilitate the availability of mortgages to prospective, primarily first-time, U.S. home buyers, thus promoting homeownership and helping to revitalize our residential communities. MI also facilitates the sale of these mortgage loans in the secondary mortgage market, most of which are sold to Fannie Mae and Freddie Mac. We are one of seven companies in the U.S. who offer MI. Our business strategy is to become a leading national MI company with our principal focus on writing insurance on high quality, low down payment residential mortgages in the United States.
We believe the MI industry has significant barriers to entry due to the substantial capital necessary to fund operations and satisfy GSE requirements, the need for a customer-integrated operating platform capable of issuing and servicing mortgage insurance policies, the competitive positions and established customer relationships of existing mortgage insurance providers, and in order to conduct MI business nationwide, the need to obtain and maintain insurance licenses in all 50 states and D.C. Additionally, the resource commitment required by mortgage originators, and larger lenders in particular, to connect to a new mortgage insurance platform, such as ours, is significant, and absent a critical need, such as the capital constraints in the MI industry during the financial crisis, they have historically, in our view, been reluctant to make such an investment. We were formed at a time when the severe dislocation in the MI industry caused by the financial crisis created a need for newly capitalized mortgage insurers and this has facilitated our efforts to establish relationships with lenders. To date, we believe we have successfully navigated the Company through many of these barriers in order to start our insurance business.
Following our formation, we focused our efforts on organizational development, capital raising and other start-up related activities. Our efforts to build our MI business have included, among other things, securing GSE approval, obtaining insurance licenses in all 50 states and D.C., building an executive management team and hiring other key officers and directors and staff, building our operating processes, designing and developing our business and technology applications and environment and infrastructure. In 2014, we continue to make progress achieving our goals, through the addition of new customers and the attainment of our goal of becoming licensed nationwide by obtaining a certificate of authority in Wyoming in April 2014. Since we began writing MI in April 2013, we have become a fully operational MI company, with
$514.8 million
of primary IIF and
$5.0 billion
of pool IIF as of
March 31, 2014
. For the
quarter ended
March 31, 2014
, the Company had primary RIF of
$115.5 million
compared to primary RIF of
$36.5 million
at
December 31, 2013
. Pool RIF for the
quarter ended
March 31, 2014
and the year ended December 31, 2013 was
$93.1 million
.
NMIC primarily differentiates itself from its competitors by underwriting all loans it insures either prior to or post close, which permits us to provide loan originators and aggregators with 12-month rescission relief protection, thereby giving our customers dependable service and consistent confidence of coverage. We have established risk management controls throughout our organization that we believe will support our continued financial strength. As a newly capitalized mortgage insurer, we have the ability to write new business without the burden of risky legacy exposures and believe our current capital supports our current business writing strategy, while staying within the regulatory guidelines imposed by state insurance departments and the GSEs.
22
On November 8, 2013, we filed a final prospectus announcing the sale of approximately
2.1 million
shares of common stock through our IPO. The principal reason for conducting the IPO was to expedite an increase in the number of holders of our common stock to permit a listing of our common stock on the NASDAQ. Obtaining a listing on the NASDAQ satisfied certain contractual obligations we had to our stockholders under a Registration Rights Agreement we entered into in connection with the Private Placement. On November 12, 2013, the underwriters exercised their option in full to purchase an additional
315,000
shares of common stock at a price of
$13.00
per share, before underwriting discounts. The offering closed on November 14, 2013. Gross proceeds to us were
$31.4 million
. Net proceeds from the offering were approximately
$28 million
, after an approximate
6%
underwriting fee and other offering expenses and reimbursements pursuant to the underwriting agreement.
Following our IPO, and to meet our obligations under the Registration Rights Agreement, we filed a final prospectus on December 9, 2013 registering 51,101,434 Class A common shares. These shares had previously been issued during our Private Placement.
We discuss below the following conditions and trends that have impacted or are expected to impact our business:
•
customer development;
•
new insurance written, including insurance in force and risk in force;
•
the results of our mortgage insurance subsidiaries;
•
factors impacting our holding company operations;
•
our investment portfolio; and
•
our GSE approval conditions and status of regulatory reform.
Conditions and Trends Impacting Our Business
Customer Development
We organize our sales and marketing efforts based on our national and regional customer segmentation. Our sales strategy is focused on attracting as customers mortgage originators in the United States that fall into two distinct categories, which we refer to as "National Accounts" and "Regional Accounts," discussed below. Since April 2013, we have increased our customer base to include some of the largest loan originators in the U.S. We expect to continue to add new lenders to our customer base throughout the remainder of 2014. In addition to adding new customers, we believe our existing customers will allocate more of their business to us for placement of our MI.
We define National Accounts as the most significant residential mortgage originators as determined by volume of their own originations as well as volume of insured business they may acquire from other originators. These National Accounts generally originate loans through their retail channels as well as purchase loans originated by other entities, primarily mortgage originators who we would classify as Regional Accounts, as described below. National Account lenders may sell their loans to the GSEs or private label secondary markets or securitize the loans themselves. We currently classify approximately
40
mortgage originators and/or aggregators as National Accounts. As of April 30, 2014,
six
of these National Accounts were submitting mortgage insurance applications to us, and we had approved master policies with
18
National Accounts. We believe we continue to make progress with the remaining National Accounts.
The Regional Accounts originate mortgage loans on a local or regional level throughout the country. Some of these Regional Accounts have origination platforms across multiple regions; however, their primary lending focus is local. They sell the majority of their originations to National Accounts, but Regional Accounts may also retain loans in their portfolios or sell portions of their production directly to the GSEs. As of April 30, 2014,
87
of our Regional Accounts were submitting mortgage insurance applications to us, and we had approved master policies with
460
of our Regional Accounts. We believe we continue to make progress with the remaining Regional Accounts.
The tables below show the increase in newly issued and cumulative master policies issued to potential customers and within that population, customers generating applications, commitments and new insurance written ("NIW"), for the period from April 2013 through April 2014.
23

New Insurance Written, Insurance in Force, and Risk in Force
NMIC began writing MI in April 2013. Primary insurance may be written on a flow basis, in which loans are insured in individual, loan-by-loan transactions, or may be written on a bulk basis, in which each loan in a portfolio of loans is individually insured in a single, bulk transaction. MI may also be written in a pool policy, where a group of loans (or pool) are insured under a single contract. Pool insurance may have a stated aggregate loss limit for a pool of loans and may also have a deductible under which no losses are paid by the insurer until losses on the pool of loans exceed the deductible.
Primary NIW was
$354.3 million
during the quarter ended
March 31, 2014
, compared to primary NIW of
$157.6 million
during the quarter ended
December 31, 2013
. We did not write any new pool insurance during the quarter ended
March 31, 2014
. Our total NIW of
$5.3 billion
for the year ended
December 31, 2013
was driven by our Fannie Mae pool transaction, which represented
$5.2 billion
in NIW.
As of
March 31, 2014
, NMIC had primary IIF of
$514.8 million
and pool IIF of
$5.0 billion
and total RIF of
$208.6 million
, consisting of
$115.5 million
of primary RIF, representing insurance on
2,072
loans, and pool RIF of
$93.1 million
, representing insurance on approximately
22,000
loans. As of December 31, 2013, NMIC had primary IIF of
$161.7 million
and pool IIF of
$5.1 billion
and primary RIF of
$36.5 million
and pool RIF of
$93.1 million
. We expect NMIC's primary IIF and RIF to significantly increase over the coming months as our operations continue to mature.
Premiums Written and Earned
In the MI industry, a “book” is a group of loans that an MI company insures in a particular period, normally a calendar year.
We set premiums at the time a policy is issued based on our expectations regarding likely performance over the term of coverage. We expect the average premium rate we charge on our monthly primary flow MI policies, which we expect to comprise the majority of our business, to be comparable with the rates charged by the industry in general.
Premiums written and earned in a period are generally influenced by:
|
•
|
new insurance written, which is the new insurance-in-force (aggregate principal amount of the mortgages) that are insured during a period. Many factors affect new insurance written, including, among others, the volume of low down payment home mortgage originations (which tend to be generated to a greater extent in purchase financings as compared to refinancings) and the competition to provide credit enhancement on those mortgages, which includes primarily competition from the Federal Housing Administration ("FHA") and other private mortgage insurers;
|
|
•
|
cancellations, which reduce insurance-in-force. Cancellations due to refinancings are affected by the level of current mortgage interest rates compared to the mortgage rates on our insurance-in-force. Refinancings are also affected by current home values compared to values when the loans became insured and the terms on which mortgage credit is available. To a lesser extent, we expect our future cancellations to be impacted by rescissions, which require us to return any premiums received related to the rescinded policy, and policies canceled due to claim payment, which require us to return any premium received subsequent to the date the insured mortgage defaults. Finally, cancellations are affected by
|
24
home price appreciation, which may give homeowners the right to cancel the MI on their loans. Based on current market conditions, we expect our MI policies to have a persistency rate of between
80%
and
85%
. Persistency is generally defined as the percentage of IIF that remains on our books after any 12-month period;
|
•
|
premium rates, which are based on the risk characteristics of the loans insured, the percentage of coverage on the loans, competition from other mortgage insurers, and general industry conditions; and
|
|
•
|
premiums ceded under reinsurance agreements. The only reinsurance agreements we currently have in place are between NMIC and Re One and they are for the sole purpose of facilitating NMIC's compliance with certain statutory requirements that limit the amount of risk an MI company may retain on any single MI policy.
|
Insurance Portfolio Management
We manage our portfolio credit risk by using several loan eligibility matrices which prescribe the maximum LTV, minimum borrower credit score, maximum loan size, property type and occupancy status of loans that we will insure. Our loan eligibility matrices, as well as all of our detailed underwriting guidelines, are contained in our Underwriting Guideline Manual that is publicly available on our website. Our eligibility criteria and underwriting guidelines are designed to mitigate the layered risk inherent in a single insurance policy. "Layered risk" refers to the accumulation of borrower, loan risk and property risk. For example, we have higher credit score and lower maximum allowed LTV requirements for riskier property types, such as investor properties, compared to owner-occupied properties.
Another tool we use to manage our credit risk is to underwrite every loan we insure, including loans coming through our delegated channel. We believe the prevailing standard of the MI industry has been to conduct partial quality assurance testing of loans that come through their delegated channels. We believe the industry's practice has exacerbated the negative impact of the recent mortgage crisis on legacy mortgage insurers because their partial quality control reviews did not adequately prevent the issuance of mortgage insurance through their delegated channels on ineligible, poor quality loans. Our pricing policies also help mitigate credit risk in the form of higher premium rates for loan features or borrower characteristics associated with historically higher default rates.
These risk principles form the basis of how we originate primary NIW. We monitor the concentrations of the various risk attributes in our insurance portfolio. Since we recently began writing MI in April 2013, our portfolio does not yet reflect our expected distribution of LTVs, borrower credit scores, loan sizes, property types and occupancy statuses of loans that we expect to insure, as well as the concentrations within states and metropolitan statistical areas ("MSAs"). We believe we will move toward our expected distribution of these risk attributes in our insurance portfolio as we continue to write more business.
Fannie Mae Pool Transaction
Effective September 1, 2013, NMIC entered into an agreement with Fannie Mae, pursuant to which NMIC initially insured approximately
22,000
loans with insurance-in-force of $5.2 billion (as of September 1, 2013). We receive monthly premiums from Fannie Mae for this transaction, which are recorded as written and earned in the month received. The agreement has an expected term of
10
years from September 1, 2013, the coverage effective date.
The RIF to NMIC is
$93.1 million
, which represents the difference between a deductible payable by Fannie Mae on initial losses and a stop loss, above which, losses are borne by Fannie Mae. NMIC provides this same level of risk coverage over the term of the agreement. Until new updated MI eligibility requirements are issued by Fannie Mae, we are bound to counterparty requirements contained in the agreement that specify the amount of capital NMIC will need to maintain to support the agreement, which is equal to the amount of primary net RIF on this pool. The capital we are required to maintain to support this risk will decline over the
10
-year term of the agreement as the loans in the pool amortize or as loans payoff and is specified as follows:
|
a.
|
the amount of required capital specified in our January 2013 approval letter from Fannie Mae ($150 million); or
|
|
b.
|
the sum of:
|
|
i.
|
5.6% of net primary RIF, plus;
|
|
ii.
|
for pool insurance, the lesser of
|
|
1.
|
5.6% of the RIF, based upon loan level coverage, before application of the aggregate stop loss and deductible, or;
|
|
2.
|
the aggregate stop loss amount, net of any deductible, for the pool transaction.
|
The amount calculated under ii. 2. is equivalent to
$93.1 million
and remains the same over the term of the transaction. The current loan level RIF, as of
March 31, 2014
, is $1.72 billion, which, when multiplied by 5.6% per the calculation under b)ii.1, produces a capital requirement of $96.5 million. As this latter amount is greater than $93.1 million, our counterparty capital
25
requirement for this pool transaction as of
March 31, 2014
, is
$93.1 million
. We expect that as the loans in the pool amortize or as loans payoff, the capital required in b)ii.1 will decline below the
$93.1 million
, which is constant and set at the effective date of the transaction, and as a result we will be required to hold a declining amount of capital against this transaction.
Overview of NIW, IIF and RIF
Our NIW and risk written for the
quarter ended
March 31, 2014
was made up of approximately
72%
and
70%
, respectively, of credit scores at or above 740. Generally, insuring loans made to borrowers with higher credit scores tends to result in a lower frequency of claims. Additionally, as of March 31, 2014, we believe that all loans are full documentation loans and less than 1% of our RIF is above 95% LTV. As we continue to increase our insurance writings, we expect to continue to seek out and insure high credit quality mortgages.
|
Quarter Ending
|
|||||||||||||||
|
March 31, 2014
|
December 31, 2013
|
September 30, 2013
|
June 30, 2013
|
||||||||||||
|
Primary
|
(Dollars in Thousands)
|
||||||||||||||
|
New insurance written
|
$
|
354,313
|
|
$
|
157,568
|
|
$
|
3,560
|
|
$
|
1,045
|
|
|||
|
Insurance in force (end of period)
|
$
|
514,796
|
|
$
|
161,731
|
|
$
|
4,604
|
|
$
|
1,045
|
|
|||
|
Risk in force (end of period)
|
$
|
115,467
|
|
$
|
36,516
|
|
$
|
1,196
|
|
$
|
257
|
|
|||
|
Policies in force (end of period)
|
2,072
|
|
653
|
|
22
|
|
6
|
|
|||||||
|
Weighted-average coverage
(1)
|
22.4
|
%
|
22.6
|
%
|
26.0
|
%
|
24.6
|
%
|
|||||||
|
Loans in default (count)
|
—
|
|
—
|
|
—
|
|
—
|
|
|||||||
|
(1)
|
End of period RIF divided by IIF.
|
The table below reflects our primary NIW, IIF and RIF by FICO for the 2014 and 2013 books as of
March 31, 2014
.
|
NIW
|
IIF
|
RIF
|
|||||||||||||||
|
(Dollars in Thousands)
|
|||||||||||||||||
|
Primary - 2014 Book
|
As of March 31, 2014
|
||||||||||||||||
|
>= 740
|
$
|
255,210
|
|
72.0
|
%
|
$
|
254,904
|
|
72.0
|
%
|
$
|
56,089
|
|
70.9
|
%
|
||
|
680 - 739
|
96,708
|
|
27.3
|
|
96,701
|
|
27.3
|
|
22,498
|
|
28.4
|
|
|||||
|
620 - 679
|
2,395
|
|
0.7
|
|
2,231
|
|
0.7
|
|
557
|
|
0.7
|
|
|||||
|
<= 619
|
—
|
|
—
|
|
—
|
|
—
|
|
—
|
|
—
|
|
|||||
|
Total
|
$
|
354,313
|
|
100.0
|
%
|
$
|
353,836
|
|
100.0
|
%
|
$
|
79,144
|
|
100.0
|
%
|
||
|
Primary - 2013 Book
|
As of March 31, 2014
|
||||||||||||||||
|
>= 740
|
$
|
113,907
|
|
70.2
|
%
|
$
|
114,452
|
|
71.1
|
%
|
$
|
25,510
|
|
70.2
|
%
|
||
|
680 - 739
|
47,102
|
|
29.0
|
|
45,499
|
|
28.3
|
|
10,539
|
|
29.0
|
|
|||||
|
620 - 679
|
1,163
|
|
0.8
|
|
1,009
|
|
0.6
|
|
274
|
|
0.8
|
|
|||||
|
<= 619
|
—
|
|
—
|
|
—
|
|
—
|
|
—
|
|
—
|
|
|||||
|
Total
|
$
|
162,172
|
|
100.0
|
%
|
$
|
160,960
|
|
100.0
|
%
|
$
|
36,323
|
|
100.0
|
%
|
||
26
The table below reflects our pool NIW, IIF, and RIF by FICO for the 2013 book as of
March 31, 2014
.
|
NIW
|
IIF
|
RIF
|
|||||||||||||||
|
(Dollars in Thousands)
|
|||||||||||||||||
|
Pool - 2013 Book
|
As of March 31, 2014
|
||||||||||||||||
|
>= 740
|
$
|
4,186,844
|
|
81.0
|
%
|
$
|
4,072,426
|
|
81.0
|
%
|
$
|
75,195
|
|
80.8
|
%
|
||
|
680 - 739
|
832,755
|
|
16.1
|
|
809,222
|
|
16.1
|
|
15,146
|
|
16.2
|
|
|||||
|
620 - 679
|
152,065
|
|
2.9
|
|
147,029
|
|
2.9
|
|
2,749
|
|
3.0
|
|
|||||
|
<= 619
|
—
|
|
—
|
|
—
|
|
—
|
|
—
|
|
—
|
|
|||||
|
Total
|
$
|
5,171,664
|
|
100.0
|
%
|
$
|
5,028,677
|
|
100.0
|
%
|
$
|
93,090
|
|
100.0
|
%
|
||
The table below reflects our total NIW, IIF, and RIF as of
March 31, 2014
.
|
NIW
|
IIF
|
RIF
|
|||||||||||||||
|
(Dollars in Thousands)
|
|||||||||||||||||
|
Total Portfolio
|
As of March 31, 2014
|
||||||||||||||||
|
>= 740
|
$
|
4,555,961
|
|
80.1
|
%
|
$
|
4,441,782
|
|
80.1
|
%
|
$
|
156,794
|
|
75.2
|
%
|
||
|
680 - 739
|
976,565
|
|
17.2
|
|
951,422
|
|
17.2
|
|
48,183
|
|
23.1
|
|
|||||
|
620 - 679
|
155,623
|
|
2.7
|
|
150,269
|
|
2.7
|
|
3,580
|
|
1.7
|
|
|||||
|
<= 619
|
—
|
|
—
|
|
—
|
|
—
|
|
—
|
|
—
|
|
|||||
|
Total
|
$
|
5,688,149
|
|
100.0
|
%
|
$
|
5,543,473
|
|
100.0
|
%
|
$
|
208,557
|
|
100.0
|
%
|
||
|
Total primary RIF on defaulted loans
|
$
|
—
|
|
||||||||||||||
|
As of March 31, 2014
|
Primary
|
Pool
|
|||
|
Percentage of RIF by Loan Type
|
|||||
|
Fixed
|
91.8
|
%
|
100.0
|
%
|
|
|
Adjustable rate mortgages:
|
|||||
|
Less than five years
|
—
|
|
—
|
|
|
|
Five years and longer
|
8.2
|
|
—
|
|
|
|
Total
|
100.0
|
%
|
100.0
|
%
|
|
The following chart reflects our RIF by LTV. In general, the lower the LTV the lower the likelihood of a default, and for loans that default, a lower LTV generally results in a lower severity for any claim, as the borrower has a higher amount of equity in the property.
|
As of March 31, 2014
|
Primary
|
Pool
|
|||||||||||||||||
|
RIF
|
% of Total LTV
|
Policy Count
|
RIF
|
% of Total LTV
|
Policy Count
|
||||||||||||||
|
Total RIF by LTV
|
(Dollars in Thousands)
|
||||||||||||||||||
|
95.01% and above
|
$
|
464
|
|
0.4
|
%
|
6
|
|
$
|
—
|
|
—
|
%
|
—
|
|
|||||
|
90.01% to 95.00%
|
54,430
|
|
47.1
|
|
811
|
|
—
|
|
—
|
|
—
|
|
|||||||
|
85.01% to 90.00%
|
47,435
|
|
41.1
|
|
787
|
|
—
|
|
—
|
|
—
|
|
|||||||
|
80.01% to 85.00%
|
13,138
|
|
11.4
|
|
468
|
|
—
|
|
—
|
|
—
|
|
|||||||
|
80.00% and below
|
—
|
|
—
|
|
—
|
|
93,090
|
|
100.0
|
|
21,538
|
|
|||||||
|
Total RIF
|
$
|
115,467
|
|
100.0
|
%
|
2,072
|
|
$
|
93,090
|
|
100.0
|
%
|
21,538
|
|
|||||
27
|
March 31, 2014
|
December 31, 2013
|
||||||
|
Average Primary Loan Size by FICO
|
(In Thousands)
|
||||||
|
>= 740
|
$
|
251
|
|
$
|
253
|
|
|
|
680 - 739
|
244
|
|
237
|
|
|||
|
620 - 679
|
223
|
|
194
|
|
|||
|
<= 619
|
—
|
|
—
|
|
|||
The following charts show the distribution by state of our IIF and RIF, for both primary and pool insurance. We expect to maintain a diverse insurance portfolio, and we will carefully monitor and manage our exposure to risk written in any one state, in either our primary or pool writings. As of
March 31, 2014
, our IIF and RIF is more heavily concentrated in California, primarily as a result of the acquisition of new customers. With these new customers, we have placed our MI on a higher proportion of mortgage loans originated in California. The distribution of risk across the states as of the
quarter ended
March 31, 2014
is not necessarily representative of the geographic distribution we expect in the future as we write more business and our insurance portfolio matures. With our expectation that we will add a significant number of new customers as we grow, we believe we will gain greater flexibility to manage our state concentration levels. We expect that our insurance origination mix by state will be consistent with the overall distribution of mortgage originations in the United States that require mortgage insurance.
|
As of March 31, 2014
|
IIF
|
RIF
|
||||
|
Top 10 Primary IIF and RIF by State
|
||||||
|
1.
|
California
|
20.6
|
%
|
20.2
|
%
|
|
|
2.
|
Michigan
|
5.8
|
|
6.1
|
|
|
|
3.
|
Virginia
|
5.5
|
|
5.4
|
|
|
|
4.
|
Texas
|
4.7
|
|
4.8
|
|
|
|
5.
|
Arizona
|
4.0
|
|
4.0
|
|
|
|
6.
|
New Jersey
|
4.0
|
|
3.7
|
|
|
|
7.
|
Florida
|
3.9
|
|
3.9
|
|
|
|
8.
|
Maryland
|
3.7
|
|
3.2
|
|
|
|
9.
|
Georgia
|
3.6
|
|
3.9
|
|
|
|
10.
|
Colorado
|
3.2
|
|
3.3
|
|
|
|
Total
|
59.0
|
%
|
58.5
|
%
|
||
|
As of March 31, 2014
|
IIF
|
RIF
|
||||
|
Top 10 Pool IIF and RIF by State
|
||||||
|
1.
|
California
|
28.5
|
%
|
28.0
|
%
|
|
|
2.
|
Texas
|
5.5
|
|
5.5
|
|
|
|
3.
|
Colorado
|
3.9
|
|
3.9
|
|
|
|
4.
|
Washington
|
3.9
|
|
3.9
|
|
|
|
5.
|
Massachusetts
|
3.7
|
|
3.6
|
|
|
|
6.
|
Illinois
|
3.7
|
|
3.7
|
|
|
|
7.
|
Virginia
|
3.7
|
|
3.7
|
|
|
|
8.
|
New York
|
2.9
|
|
2.9
|
|
|
|
9.
|
Florida
|
2.8
|
|
2.9
|
|
|
|
10.
|
New Jersey
|
2.7
|
|
2.7
|
|
|
|
Total
|
61.3
|
%
|
60.8
|
%
|
||
28
Mortgage Insurance Results
In this section we discuss the results of our two mortgage insurance subsidiaries, NMIC and Re One. We have become a fully operational MI company, with direct premiums written in the
quarter ended
March 31, 2014
of
$5.2 million
and total primary insurance-in-force of
$514.8 million
and total pool insurance-in-force of
$5.0 billion
as of the
quarter ended
March 31, 2014
. We have funded our operations primarily through funds raised through our Private Placement in which we received net proceeds of approximately
$510 million
. Following the Private Placement, NMIH capitalized its mortgage insurance subsidiaries with
$220.0 million
.
|
NMIC & Re One - Combined Results
|
For the Three Months Ended March 31,
|
||||||
|
2014
|
2013
|
||||||
|
Revenues
|
(In Thousands)
|
||||||
|
Direct premiums written
|
$
|
5,178
|
|
$
|
—
|
|
|
|
Increase in unearned premium
|
(3,274
|
)
|
—
|
|
|||
|
Net premiums earned
|
1,904
|
|
—
|
|
|||
|
Net investment income
|
638
|
|
139
|
|
|||
|
Other revenue
|
—
|
|
20
|
|
|||
|
Total Revenues
|
2,542
|
|
159
|
|
|||
|
Expenses
|
|||||||
|
Insurance claims and claims expenses, net
|
—
|
|
—
|
|
|||
|
Amortization of deferred policy acquisition costs
|
19
|
|
—
|
|
|||
|
Other underwriting and operating expenses
|
13,521
|
|
5,093
|
|
|||
|
Total Expenses
|
13,540
|
|
5,093
|
|
|||
|
Net Loss
|
$
|
(10,998
|
)
|
$
|
(4,934
|
)
|
|
|
March 31, 2014
|
December 31, 2013
|
||||||
|
(In Thousands)
|
|||||||
|
Total investment portfolio
|
$
|
180,714
|
|
$
|
180,024
|
|
|
|
Cash and cash equivalents
|
26,613
|
|
19,496
|
|
|||
|
Deferred policy acquisition costs, net
|
977
|
|
90
|
|
|||
|
Software and equipment, net
|
1,093
|
|
1,302
|
|
|||
|
Other assets
|
4,482
|
|
4,626
|
|
|||
|
Total Assets
|
$
|
213,879
|
|
$
|
205,538
|
|
|
|
Reserve for insurance claims and claims expenses
|
$
|
—
|
|
$
|
—
|
|
|
|
Accounts payable and accrued expenses
|
5,487
|
|
10,717
|
|
|||
|
Other liabilities
|
4,853
|
|
1,579
|
|
|||
|
Total Liabilities
|
10,340
|
|
12,296
|
|
|||
|
Total Shareholders' Equity
|
203,539
|
|
193,242
|
|
|||
|
Total Liabilities and Shareholders' Equity
|
$
|
213,879
|
|
$
|
205,538
|
|
|
Premiums Written and Earned
For the
quarter ended
March 31, 2014
, we had total direct premiums written of
$5.2 million
and net premiums earned of
$1.9 million
. For the
quarter ended
March 31, 2014
, we had net monthly premiums written and earned of
$99.5 thousand
. We had net single premiums written and earned of
$3.7 million
and
$0.4 million
, respectively. We had net pool premiums written and earned of
$1.4 million
. We did not write any annual premiums through
March 31, 2014
. As of
March 31, 2014
, we had
2,072
primary policies in force and approximately
22,000
pool policies in force. We did not record any premium revenue in the first quarter of 2013 as we had not yet started writing business.
29
Net Investment Income
For the quarter ended
March 31, 2014
, we had net investment income of
$637.6 thousand
compared to
$139.4 thousand
for the quarter ended
March 31, 2013
. Net investment income increased in the first quarter of 2014 compared to the first quarter of 2013 primarily as the result of fully investing the cash received from our Private Placement.
Expenses
Our other underwriting and operating expenses increased from
$5.1 million
for the quarter ended
March 31, 2013
to
$13.5 million
for the quarter ended
March 31, 2014
, driven largely by the increase in our employee base and the associated increase in employee compensation. Prior to GSE Approval, all expenses were borne by the holding company, which also contributed to higher expenses for the quarter ended
March 31, 2014
compared to the quarter ended
March 31, 2013
.
Changes in Cash
During the first quarter of 2014, NMIH made an additional contribution of $20 million to NMIC, which was the primary driver of the increase in cash from
$19.5 million
at
December 31, 2013
to
$26.6 million
at
March 31, 2014
. We expect to make at least one additional capital contribution to NMIC in 2014 in order to comply with the condition of our GSE Approval, which requires us to hold at least
$150 million
in capital at NMIC.
Prior to GSE Approval, we held most of our assets in cash, and our investments consisted of U.S. Treasury Notes, which were purchased for the sole purpose of complying with certain state licensing conditions. These states required NMIC to place various amounts on deposit with the states as a prerequisite for obtaining a certificate of authority in those states, which is common in the MI industry. As of
March 31, 2014
and
December 31, 2013
, in those states with a statutory deposit requirement, we had placed on deposit aggregate amounts of
$7.1 million
and
$7.0 million
respectively, in the form of U.S Treasury Notes and cash.
Capital Position
In addition to the requirement that NMIC adhere to certain minimum capital requirements, as described in
Note 11, Statutory Information
, NMIC is also subject to regulatory minimum capital requirements based on its insured risk-in-force. While formulations of this minimum capital may vary in each jurisdiction, the most common measure allows for a maximum permitted risk-to-capital ratio of 25 to 1. As a new entrant to the MI business, our insurance writings to date have been minimal compared to the volume of insurance we expect to write as our business grows in the near future.
As of
March 31, 2014
, NMIC's primary RIF was approximately
$115.5 million
representing insurance on a total of
2,072
policies in force and pool risk-in-force was approximately
$93.1 million
representing insurance on a total of approximately
22,000
loans. Based on NMIC's reported total statutory capital of
$190 million
at
March 31, 2014
, NMIC's risk-to-capital ratio was
0.9:1
, significantly below the contractual and regulatory maximum risk-to-capital thresholds. As our insurance writings grow and our RIF increases, our risk-to-capital ratio will increase and NMIC's risk-to-capital metrics will become more important to an evaluation of its compliance with all of the capital requirements to which it is subject. State insurance regulators and the GSEs are currently examining their respective capital requirements to determine whether in light of the recent financial crisis, changes are needed to more accurately assess mortgage insurers' ability to withstand stressful economic conditions.
As discussed below under
-GSE Approvals,
the GSEs are expected to announce updated mortgage insurer eligibility requirements that we anticipate will include new capital standards. The NAIC has formed a working group to explore, among other things, whether the capital requirements applicable to mortgage insurers should be overhauled. We, along with other MI companies are working with the Mortgage Guaranty Insurance Working Group of the Financial Condition (E) Committee of the NAIC. The Working Group will determine and make a recommendation to the Financial Condition (E) Committee of the NAIC as to what changes, if any, the Working Group believes are necessary to the solvency regulation for MI companies, including changes to the Mortgage Guaranty Insurers Model Act (Model #630). We have provided feedback to the Working Group since early 2013 and we support more robust capital standards and continue to advocate for a strong capital model. The discussions are ongoing and the ultimate outcome of these discussions and any potential actions taken by the NAIC cannot be predicted at this time. However, given our current strong capital position and having no exposure to risk written in the 2005 through 2008 book years (which we consider to be some of the poorest performing books of business ever written by the MI industry), we believe that NMIC will be able to comply with any new capital requirements at the time they are enacted.
30
Competition
The MI industry is highly competitive and includes other private mortgage insurers, governmental agencies that sponsor government-backed mortgage insurance programs and alternatives to credit enhancement products, such as piggy-back loans.
The MI industry has recently been in a state of flux, with some existing companies exiting and new companies entering the space. In 2010 a new MI company was formed and started writing MI. We began writing MI in April of 2013. In January 2014, an existing reinsurance company completed its acquisition of an existing MI company that had been serving credit unions only, with the intention to expand its operations to serve the entire mortgage market. In addition, an existing MI company that had previously stopped writing MI business had announced its intent to attempt to resume its MI operations, which as of the date of this report have not been successful. Given this dynamic, we expect that there will be pressure in the coming years for industry participants to establish, grow or maintain their market share.
We believe that our strong capital position and competitive terms of coverage convey upon us an advantage in the marketplace. We expect that this advantage will translate to increasing our market share in the near term. Our competitors' share of the private MI market for the year ended December 31, 2013 varied from a low of approximately 3% to a high of approximately 28%. In general, we expect the total origination market to decline in 2014. However, within the total market of low-down payment loan originations, we expect the overall private MI penetration rate to increase as the FHA continues to scale back. See
"Competition with FHA,"
below. Because we remain in the early stages of our initial growth phase, we continue to add new customers and we believe that our existing customers will begin to allocate more of their business to us for placement of our MI. Consequently, even with a broader market slowdown, we expect that our business and share of the private MI market will continue to grow in 2014, as reflected in the trend of our NIW and growing IIF.
Mortgage Insurance Earnings and Cash Flow Cycle
In general, the majority of any underwriting profit (
i.e.
, the earned premium revenue minus claims and expenses, excluding investment income) that a book generates occurs in the early years of the book, with the largest portion of the underwriting profit for that book realized in the first year. The earnings we record and the cash flow we receive vary based on the type of MI product and premium plan our customers select. We offer monthly, annual and single premium payment plans. We currently expect that the majority of lenders who purchase MI from us will select one of our monthly premium plans.
Claims Incurred
We expect that claims incurred for the first two to three years of our operations will be relatively low for the following reasons:
|
•
|
we underwrite every loan and we believe that this will lower our incurred claims;
|
|
•
|
as stated above, the typical distribution of claims over the life of a book results in fewer defaults during the first two to three years after loans are originated, usually peaking in years three through six and declining thereafter;
|
|
•
|
we expect that the frequency of claims on our initial primary books of business should be between
3%
and
4%
of mortgages insured over the life of the book. For claims that we may receive, we expect the severity of the claim to be between
85%
and
95%
of the coverage amount. Based on these expectations, we believe that the loss ratio over the life of each book will be between
20%
and
25%
of earned premiums. Because we expect the claims on insured mortgages to develop over time, we believe that the reported loss ratio in our first 2-3 years of operation will be less than
10%
of earned premiums; and
|
|
•
|
under the pool insurance agreement between NMIC and Fannie Mae, as discussed above in this report, NMIC is responsible for claims only to the extent they exceed a deductible.
|
We developed our estimates of the expected frequency and severity of claims based on statutory filings by many of our competitors, which contain historical book year performance, as well as an industry dataset which consists of nearly 150 million mortgages and 80 data fields per mortgage, gathered over the past 17 years. As state-regulated entities, mortgage insurers are required to file actuarial justifications for premium rate changes in many states, many of which are publicly available and include historical information on claim frequency and severity. We used this publicly available historical performance data from similar credit profile, house price appreciation, and interest rate periods and we compared this performance data to today to determine a range of expected performance.
31
Factors that Impact Holding Company Operations
In this section we discuss the results of our consolidated operations. NMIH serves as the holding company for our insurance subsidiaries and does not have any significant operations of its own. NMIH's principal liquidity demands include funds for: (i) the payment of certain corporate expenses and reimbursable expenses of its insurance subsidiaries; (ii) capital support for our mortgage insurance subsidiaries; (iii) potential payments to the IRS; and (iv) the payment of dividends, if any, on its common stock.
Our future capital requirements depend on many factors, including our ability to successfully write new business and establish premium rates at levels sufficient to cover claims and operating costs. To the extent that the funds generated by our ongoing operations and capitalization are insufficient to fund future operating requirements, we may need to raise additional funds through financing activities or curtail our growth and reduce our expenses.
On March 26, 2014, NMIH contributed $20 million in cash to NMIC. In order to support a minimum surplus of
$150 million
and maintain a risk-to-capital ratio under 15 to 1 through December 31, 2015 at NMIC, we expect NMIH will make additional capital contributions to NMIC from time-to-time. NMIH could be required to provide additional capital support for NMIC and Re One if additional capital is required pursuant to state insurance laws and regulations, by the GSEs or the rating agencies.
In addition to investment income, dividends from NMIC and permitted payments under our tax- and expense-sharing arrangements with our subsidiaries are NMIH's principal sources of operating cash. The expense-sharing arrangements between NMIH and its insurance subsidiaries, as amended, have been approved by the Wisconsin OCI, but such approval may be changed or revoked at any time. NMIC's ability to pay dividends to NMIH is subject to various conditions imposed by the GSEs and by insurance regulations requiring insurance department approval. In general, dividends in excess of prescribed limits are deemed “extraordinary” and require insurance regulatory approval. Additionally, under agreements with the GSEs, NMIC is not permitted to pay shareholder dividends until December 31, 2015 and under agreements with various state insurance regulators, is not permitted to pay shareholder dividends until January 2016.
NMIH is not subject to any limitations on its ability to pay dividends except those generally applicable to corporations, such as NMIH, that are incorporated in Delaware. Delaware corporation law provides that dividends are only payable out of a corporation's capital surplus or (subject to certain limitations) recent net profits. As of
March 31, 2014
, NMIH's shareholders' equity was
$453 million
.
Liquidity, Capital Resources and Results of Operations
Our financial results to date have been primarily driven by expenditures related to our business development activities, and to a lesser extent, by our investment activities. When we compare the quarter ended March 31, 2014 to the quarter ended March 31, 2013, the primary difference is the fact that we had not written any business prior to April of 2013. Although we expect our year-over-year expenses to increase as we grow our business, we ultimately expect that the majority of our operating expenses will be relatively fixed in the long term. As our business matures and we deploy the majority of our capital, including capital raised through equity or debt offerings, or through the use of reinsurance, we are targeting our expense ratio (expenses to premiums written) to fall into a range of
20%
to
25%
. Until our business matures, our expense ratio is expected to be significantly higher than this range given the low levels of premium written compared to our "fixed" costs customary to operating a mortgage insurance company. We believe that we will have an efficient expense structure providing us with greater flexibility. We do not expect to achieve operating profitability through at least 2014. Additionally, we are targeting an average unlevered return on equity in the mid-teens over time.
Our MI companies' principal operating sources of liquidity will be premiums that we receive from policies and income generated by our investment portfolio. Our MI companies' primary liquidity needs include the payment of claims on our MI policies, operating expenses, investment expenses and other costs of our business.
For the
three months ended March 31, 2014
, we had direct premiums written of
$5.2 million
compared to direct premiums written of
$0
for the
three months ended
March 31, 2013
. We began writing MI in April 2013 through NMIC. The principal driver of the increase in premiums written was the continued significant development of our customer base.
As of
March 31, 2014
, we had no claim reserves. However, we expect to establish a claim reserve during 2014.
We have incurred significant net operating losses since our inception. Our net losses were
$15.1 million
and
$12.0 million
for the
three months ended
March 31, 2014
and
2013
, respectively. The primary drivers of the increased net losses between periods were the hiring of management and staff personnel and external and professional costs. Additionally, we entered into a two-year lease in July 2012 for our principal location of operations and in October 2013, extended the terms of this lease through October 31, 2017. These expenses were slightly offset by premiums written and investment income.
32
Employee compensation represents the majority of our operating expense, which includes both cash and share-based compensation. Our payroll and related expense was
$10.2 million
for the
three months ended March 31, 2014
and
$6.2 million
for the
three month period
ended
March 31, 2013
. As part of our compensation plan, certain employees were granted stock options and RSUs under our 2012 Stock Incentive Plan. As a result, our share-based compensation expense was
$2.3 million
for the
three months ended March 31, 2014
and
$3.0 million
for the
three month period
ended
March 31, 2013
. We account for our stock options and RSUs under the Financial Accounting Standards Board Accounting Standards Codification ("ASC") No. 718,
Compensation
—
Stock Compensation
(“ASC 718”), which requires all compensation expense from share-based payments to be measured and recognized in the financial statements at their grant date fair values.
Our total assets, comprised largely of cash and investments, were
$471.2 million
at
March 31, 2014
compared to total assets of
$481.2 million
at
December 31, 2013
. The reduction in 2014 compared to 2013 was driven by operating costs, partially offset by proceeds from our IPO and premium income.
Our accounts payable and accrued expenses were
$7.4 million
as of
March 31, 2014
and
$10.1 million
at
December 31, 2013
. The decrease at
March 31, 2014
was comprised primarily of accrued bonuses and accrued expenses which were paid during the first quarter of 2014.
As of
March 31, 2014
, we had approximately
$454 million
in cash and investments of which
$246 million
was held at our holding company. As of
March 31, 2014
, the amount of restricted net assets held by our consolidated insurance subsidiaries totaled approximately
$204 million
of our consolidated net assets of approximately
$453 million
.
The following table summarizes our consolidated cash flows from operating, investing and financing activities:
|
NMIH
|
For the Three Months Ended March 31,
|
||||||
|
2014
|
2013
|
||||||
|
Net Cash (Used in) Provided by:
|
(In Thousands)
|
||||||
|
Operating Activities
|
$
|
(11,991
|
)
|
$
|
(13,244
|
)
|
|
|
Investing Activities
|
(1,056
|
)
|
(325,209
|
)
|
|||
|
Financing Activities
|
(90
|
)
|
—
|
|
|||
|
Net (Decrease) Increase in Cash and Cash Equivalents
|
$
|
(13,137
|
)
|
$
|
(338,453
|
)
|
|
Cash used in operating activities for the quarter ended
March 31, 2014
was lower compared to the same period in
2013
due primarily to the collection of premiums offset by the continued hiring of management and staff personnel and professional costs incurred in conjunction with litigation support.
Cash used in investing activities for the
quarter ended
March 31, 2014
was lower compared to the same period in
2013
as a result primarily of investing our cash holdings in fixed income securities in the first quarter of 2013. We had very little movement in our investment portfolio during the first quarter of 2014 as during 2013, we focused on balancing and optimizing our portfolio consistent with our investment policy.
Cash used in financing activities for the
three months ended
March 31, 2014
consisted primarily of taxes paid related to the net share settlement of equity awards. There were no cash flows from financing activities during the same period in
2013
.
We expect that cash and investments and projected cash flows from operations will provide us with sufficient liquidity to fund our anticipated growth by providing capital to increase our insurance company surplus as well as for payment of operating expenses through 2015, at which point we currently expect to consider various capital options. We anticipate that as our insurance-in-force grows, the premium revenue we receive will increase. However, if our risk-in-force or expenses materially exceed our expectations or if our risk-to-capital ratio is expected to exceed 15 to 1, we may have to consider our capital options sooner to support our growth. In addition, we may seek to raise additional capital to leverage our fixed expenses in order to achieve a return on capital attractive to investors. We expect to leverage and manage our fixed operating expenses so that they grow at a much slower rate than sales over the coming years. Following 2014, as we anticipate an increase in our volume of MI business, we expect to see our costs increase primarily within underwriting and sales; however, we expect to see only marginal increases in what we consider our corporate related costs (i.e., management, finance, legal, risk and information technology) as these areas of the business were required to be in place before we could generate significant revenue. We believe we will not need to incur significant additional fixed costs to be able to successfully service an increased volume of business with our existing structure, thereby growing revenue and producing greater levels of operating profits with marginal increases in such fixed costs. Eventually, we will need to expand our fixed cost structure in order to service an even greater level of business. We may choose to generate additional liquidity through the issuance of a combination of debt or equity securities, as well as consider our reinsurance options.
33
Investment Operations
Our net investment income for the
three months ended March 31, 2014
was
$1.5 million
compared to
$0.4 million
for the
three months ended March 31, 2013
. During the first quarter of 2013, we began investing our cash holdings in fixed income securities which provide a higher yield than cash. We continued to invest our cash holdings in fixed income securities during the remainder of 2013. As of
March 31, 2014
, we believe our portfolio conforms with our investment guidelines. The principal factors affecting our investment income include the size of our portfolio and its net yield. As measured by amortized cost (which excludes changes in fair market value, such as those resulting from changes in interest rates), the size of our investment portfolio is mainly a function of capital raised, cash generated from (or used in) operations, such as net premiums received, and investment earnings.
Consistent with Wisconsin law, our investment policies emphasize preservation of capital, as well as total return. Based on our guidelines, our current investment portfolio is comprised entirely of cash and cash equivalents and fixed-income securities, all of which are investment grade and rated “A-” or higher. Our policy guidelines contain limits on the amount of credit exposure to any one issue, issuer and type of instrument. We expect to preserve the liquidity of our portfolio through diversification and investment in publicly traded securities. We plan to maintain a level of liquidity commensurate with our perceived business outlook and the expected timing, direction and degree of changes in interest rates.
Following GSE Approval, we invested our investment portfolio according to our investment guidelines. The pre-tax net investment income yield was approximately
1.0%
, including unrealized gains, for the
first three months
ended
March 31, 2014
. The pre-tax investment income yields are calculated based on the market value of the investments. We believe that the yield on our investment portfolio likely will change over time based on potential changes to the interest rate environment, the duration or mix of our investment portfolio or other factors.
The sectors of our investment portfolio, including cash and cash equivalents, at
March 31, 2014
appear in the table below:
|
Percentage of Portfolio's Fair Value
|
|||
|
1.
|
Corporate debt securities
|
48
|
%
|
|
2.
|
U.S. Treasury securities and obligations of U.S. government agencies
|
24
|
|
|
3.
|
Asset-backed securities
|
16
|
|
|
4.
|
Cash and cash equivalents
|
10
|
|
|
5.
|
Municipal bonds
|
2
|
|
|
Total
|
100
|
%
|
|
The ratings of our investment portfolio at
March 31, 2014
were:
|
Investment Portfolio Ratings
|
||
|
AAA
|
5
|
%
|
|
AA
|
41
|
|
|
A
|
54
|
|
|
Investment grade
|
100
|
|
|
Below investment grade
|
—
|
|
|
Total
|
100
|
%
|
34
The amortized cost, gross unrealized gains and losses and fair value of the investment portfolio at
March 31, 2014
and
December 31, 2013
are shown below.
|
As of March 31, 2014
|
Amortized
Cost |
Unrealized
Gains |
Unrealized
Losses (1) |
Fair
Value |
|||||||||||
|
(In Thousands)
|
|||||||||||||||
|
U.S. Treasury securities and obligations of U.S. government agencies
|
$
|
108,053
|
|
$
|
12
|
|
$
|
(1,224
|
)
|
$
|
106,841
|
|
|||
|
Municipal bonds
|
12,015
|
|
28
|
|
(35
|
)
|
12,008
|
|
|||||||
|
Corporate debt securities
|
221,506
|
|
351
|
|
(2,888
|
)
|
218,969
|
|
|||||||
|
Asset-backed securities
|
73,314
|
|
296
|
|
(552
|
)
|
73,058
|
|
|||||||
|
Total Investments
|
$
|
414,888
|
|
$
|
687
|
|
$
|
(4,699
|
)
|
$
|
410,876
|
|
|||
|
As of December 31, 2013
|
Amortized
Cost |
Unrealized
Gains |
Unrealized
Losses (1) |
Fair
Value |
|||||||||||
|
(In Thousands)
|
|||||||||||||||
|
U.S. Treasury securities and obligations of U.S. government agencies
|
$
|
108,067
|
|
$
|
—
|
|
$
|
(1,461
|
)
|
$
|
106,606
|
|
|||
|
Municipal bonds
|
12,017
|
|
1
|
|
(85
|
)
|
11,933
|
|
|||||||
|
Corporate debt securities
|
221,899
|
|
157
|
|
(4,799
|
)
|
217,257
|
|
|||||||
|
Asset-backed securities
|
74,152
|
|
114
|
|
(974
|
)
|
73,292
|
|
|||||||
|
Total Investments
|
$
|
416,135
|
|
$
|
272
|
|
$
|
(7,319
|
)
|
$
|
409,088
|
|
|||
|
(1)
|
There were no other-than-temporary impairment losses recorded in other comprehensive income at
March 31, 2014
or
December 31, 2013
.
|
|
As of March 31, 2014
|
Amortized
Cost |
Fair
Value |
|||||
|
(In Thousands)
|
|||||||
|
Due in one year or less
|
$
|
2,674
|
|
$
|
2,675
|
|
|
|
Due after one through five years
|
264,257
|
|
261,989
|
|
|||
|
Due after five through ten years
|
59,222
|
|
57,975
|
|
|||
|
Due after ten years
|
15,421
|
|
15,179
|
|
|||
|
Asset-backed securities
|
73,314
|
|
73,058
|
|
|||
|
Total Investments
|
$
|
414,888
|
|
$
|
410,876
|
|
|
|
As of December 31, 2013
|
Amortized
Cost |
Fair
Value |
|||||
|
(In Thousands)
|
|||||||
|
Due in one year or less
|
$
|
—
|
|
$
|
—
|
|
|
|
Due after one through five years
|
260,855
|
|
257,501
|
|
|||
|
Due after five through ten years
|
65,687
|
|
63,440
|
|
|||
|
Due after ten years
|
15,441
|
|
14,855
|
|
|||
|
Asset-backed securities
|
74,152
|
|
73,292
|
|
|||
|
Total Investments
|
$
|
416,135
|
|
$
|
409,088
|
|
|
35
Fair Value Measurements
Fair value measurements for items measured at fair value included the following as of
March 31, 2014
and
December 31, 2013
:
|
Quoted Prices in
Active Markets for Identical Assets (Level 1) |
Significant Other
Observable Inputs (Level 2) |
Significant
Unobservable Inputs (Level 3) |
Fair Value
|
||||||||||||
|
As of March 31, 2014
|
(In Thousands)
|
||||||||||||||
|
U.S. Treasury securities and obligations of U.S. government agencies
|
$
|
49,675
|
|
$
|
57,166
|
|
$
|
—
|
|
$
|
106,841
|
|
|||
|
Municipal bonds
|
—
|
|
12,008
|
|
—
|
|
12,008
|
|
|||||||
|
Corporate debt securities
|
—
|
|
218,969
|
|
—
|
|
218,969
|
|
|||||||
|
Asset-backed securities
|
—
|
|
73,058
|
|
—
|
|
73,058
|
|
|||||||
|
Cash and cash equivalents
|
42,792
|
|
—
|
|
—
|
|
42,792
|
|
|||||||
|
Total Assets
|
$
|
92,467
|
|
$
|
361,201
|
|
$
|
—
|
|
$
|
453,668
|
|
|||
|
Warrant liability
|
—
|
|
—
|
|
5,504
|
|
5,504
|
|
|||||||
|
Total Liabilities
|
$
|
—
|
|
$
|
—
|
|
$
|
5,504
|
|
$
|
5,504
|
|
|||
|
Quoted Prices in
Active Markets for Identical Assets (Level 1) |
Significant Other
Observable Inputs (Level 2) |
Significant
Unobservable Inputs (Level 3) |
Fair Value
|
||||||||||||
|
As of December 31, 2013
|
(In Thousands)
|
||||||||||||||
|
U.S. Treasury securities and obligations of U.S. government agencies
|
$
|
49,484
|
|
$
|
57,122
|
|
$
|
—
|
|
$
|
106,606
|
|
|||
|
Municipal bonds
|
—
|
|
11,933
|
|
—
|
|
11,933
|
|
|||||||
|
Corporate debt securities
|
—
|
|
217,257
|
|
—
|
|
217,257
|
|
|||||||
|
Asset-backed securities
|
—
|
|
73,292
|
|
—
|
|
73,292
|
|
|||||||
|
Cash and cash equivalents
|
55,929
|
|
—
|
|
—
|
|
55,929
|
|
|||||||
|
Total Assets
|
$
|
105,413
|
|
$
|
359,604
|
|
$
|
—
|
|
$
|
465,017
|
|
|||
|
Warrant liability
|
—
|
|
—
|
|
6,371
|
|
6,371
|
|
|||||||
|
Total Liabilities
|
$
|
—
|
|
$
|
—
|
|
$
|
6,371
|
|
$
|
6,371
|
|
|||
There were no transfers of securities between Level 1 and Level 2 during the
first quarter
of
2014
or the year
2013
.
The fair value of the warrants issued to FBR and MAC Financial Ltd. (which are now held by the former stockholders of MAC Financial Ltd. as a result of its liquidation) was estimated on the date of grant using the Black-Scholes option-pricing model, including consideration of any potential additional value associated with pricing protection features. The volatility assumption used,
39.0%
, was derived from the historical volatility of the share price of a range of publicly-traded companies with business types similar to ours. No allowance was made for any potential illiquidity associated with the private trading of our shares. We revalue the warrant liability quarterly using a Black-Scholes option-pricing model in combination with a binomial model and a Monte-Carlo simulation model to value the pricing protection features within the warrant. As of
March 31, 2014
, the assumptions used in the option pricing model were as follows: a common stock price as of
March 31, 2014
of
$11.72
, risk free interest rate of
2.18%
, expected life of
6.57
years and a dividend yield of
0%
. The gain from change in fair value for the
three months ending
March 31, 2014
is primarily due to a decrease in the price of our common stock as compared to
December 31, 2013
. The warrants have an exercise price of
$10.00
. The remaining contractual term on the warrants is
8.1
years.
36
Share Based Compensation
The 2012 Stock Incentive Plan (the “Plan”) was approved by the Board on April 16, 2012 and authorized
5.5 million
shares to be reserved for issuance under the Plan, with
3.85 million
shares available for stock options and
1.65 million
shares available for RSU grants. Options granted under the Plan are non-qualified stock options and may be granted to employees, directors and other key persons of the Company. The exercise price per share for the common stock covered by the Plan shall be determined by the Board at the time of grant, but shall not be less than the fair market value on the date of the grant. The term of the stock option grants will be fixed by the Board, but no stock option shall be exercisable more than
10
years after the date the stock option is granted. The vesting period of the stock option grants will also be fixed by the Board at the time of grant and generally is for a three year period. The estimated grant date fair values of the stock options granted during
2014
were calculated using a Black-Scholes valuation model.
The RSUs granted in
2014
were valued at our stock price on the date of grant less the present value of anticipated dividends. As of
March 31, 2014
, there was
$5.8 million
of total unrecognized compensation cost related to non-vested RSUs compared to
$8.8 million
as of
March 31, 2013
.
For a further discussion on how we account for our share based compensation, see "
Note 8, Share Based Compensation,"
included in the notes to our Financial Statements, above.
Taxes
We are a U.S. taxpayer and are subject to a statutory U.S. federal corporate income tax rate of
35%
. Our holding company files a consolidated U.S. federal and various state income tax returns on behalf of itself and its subsidiaries. Our effective income tax rate on our pre-tax loss was
0%
for the
three months ended March 31, 2014
, which was the same for the comparable 2013 period. During those periods, the benefit from income taxes was eliminated or reduced by the recognition of a full valuation allowance which was recorded to reflect the amount of the deferred taxes that may not be realized.
As of
March 31, 2014
and as of
December 31, 2013
, we have a net deferred tax liability of
$0.1 million
as a result of the acquisition of indefinite-lived intangibles in the MAC Acquisition for which no benefit has been reflected in the acquired net operating loss carry forwards. The tax liability incurred at the acquisition was recorded as an increase in goodwill.
Our financial statements reflect a valuation allowance with respect to our net deferred tax assets. If the valuation allowance is reduced in the future, we would recognize an income tax benefit associated primarily with the carry forward of federal net operating losses and future stock compensation tax deductions.
Under current guidance, when evaluating a tax position for recognition and measurement, an entity shall presume that the tax position will be examined by the relevant taxing authority that has full knowledge of all relevant information. The interpretation adopts (i) a benefit recognition model with a two-step approach; (ii) a more-likely-than-not threshold for recognition and derecognition; and (iii) a measurement attribute that is the greatest amount of benefit that is cumulatively greater than 50% likely of being realized. As of
March 31, 2014
and as of
December 31, 2013
, we had no reserve for unrecognized tax benefits.
Employees
We believe our Company is an attractive, stable place of employment, given that we are a well-capitalized insurance company that has made significant progress in commencing business in the MI marketplace, allowing us to attract what we believe to be high-quality talent. We believe that our growth and future success will depend in large part on our services and the skills of our management team and our ability to motivate and retain these individuals and other key personnel. As of
March 31, 2014
, we had significantly developed our employee base to support our regional and national sales teams, policy acquisition and servicing, IT, and all other back-office functions. Based on the execution of our business plan, we hired a substantial number of employees since raising our initial capital in April 2012 and expect to continue to add additional staff through the first half of
2015
. As of
March 31, 2014
, we had
163
total full-time employees. We believe that our employee compensation costs will be a primary driver of our other underwriting and operating expenses through the remainder of 2014.
37
GSE Approvals
The GSEs are the principal purchasers of mortgages insured by MI companies, primarily as a result of their legislative mandate to provide liquidity in the secondary mortgage market. Consequently, the ability to successfully commence mortgage insurance operations in the U.S. is largely dependent on obtaining approvals from Fannie Mae and Freddie Mac as a qualified MI provider. Following the Company's Private Placement in April 2012, NMIC's key focus was to first secure approvals from the GSEs. In January 2013, Fannie Mae and Freddie Mac each approved NMIC as a qualified mortgage insurer, and with their approvals, imposed certain capitalization, operational and reporting conditions on NMIC ("GSE Approval"), most of which remain in effect for a three (3) year period from the date of GSE Approval. As a GSE qualified mortgage insurer, NMIC is subject to ongoing compliance with the conditions in the GSE Approval as well as the GSEs' respective qualified mortgage insurer eligibility requirements ("Eligibility Requirements"), each of which is further discussed below. We expect that the significant majority of insurance we will write will be for loans sold to the GSEs. With the GSE Approval, our customers who originate loans insured by NMIC may sell such loans to the GSEs (as of April 1, 2013 for Freddie Mac and as of June 1, 2013 for Fannie Mae).
The conditions in the GSE Approvals require, among other things, that NMIC:
|
•
|
be initially capitalized in the amount of
$200 million
and that its affiliate reinsurance companies, Re One and Re Two, be initially capitalized in the amount of
$10 million
each (as of September 30, 2013, Re Two was merged into NMIC, with NMIC surviving the merger. See "
|
|
•
|
maintain minimum capital of
$150 million
;
|
|
•
|
operate at a risk-to-capital ratio not to exceed 15:1 for its first three (3) years and then pursuant to the GSE Eligibility Requirements then in effect;
|
|
•
|
not declare or pay dividends to affiliates or to NMIH for its first three (3) years, then pursuant to the Eligibility Requirements;
|
|
•
|
not enter into capital support agreements or guarantees for the benefit of, or purchase or otherwise invest in the debt of, affiliates without the prior written approval of the GSEs for its first three (3) years, then pursuant to the Eligibility Requirements;
|
|
•
|
not enter into reinsurance or other risk share arrangements without the GSEs' prior written approval for its first three (3) years, then pursuant to the Eligibility Requirements; and
|
|
•
|
at the direction of one or both of the GSEs, re-domicile from Wisconsin to another state.
|
The GSE Approvals also include other conditions, limitations and reporting requirements that we anticipate will be included in the GSEs' revised Eligibility Requirements, such as limits on costs allocated to NMIC under affiliate expense sharing arrangements, risk concentration, rates of return, requirements to obtain a financial strength rating, provision of ancillary services (i.e., non-insurance) to customers, transfers of underwriting to affiliates, notification requirements regarding change of ownership and new five percent (5%) shareholders, provisions regarding underwriting policies and claims processing as well as certain other obligations.
The GSEs each maintain their own Eligibility Requirements, which they have been in the process of revising since mid-2010. The Federal Housing Finance Agency ("FHFA") is the conservator of the GSEs and has the authority to control and direct their operations. The FHFA has announced its intent that the GSEs achieve uniformity in their respective requirements and that the requirements be finalized in the near term future. The GSEs have announced to the MI industry that draft standards will be issued as early as the second quarter of2014 and that there will be a public comment period prior to finalization of the standards. Although the GSEs and FHFA have not publicly commented on the final content of the revised mortgage insurer requirements, we believe they will include a new capital adequacy framework. Because the conditional GSE Approvals already impose capitalization, operational and reporting conditions on NMIC and our holding company, it is difficult to predict whether any changes the GSEs might impose in their revised mortgage insurer eligibility requirements will have an effect on our business.
In addition, in connection with the FHFA's mandate that the GSEs align their mortgage insurer eligibility standards, the GSEs have imposed minimum standards for mortgage insurer master policies, including standards related to limitations on rescission rights. We believe the new standards will be implemented in 2014, and to comply with the GSEs' master policy requirements, we and our competitors have filed new master policies with state insurance regulators.
38
GSE Reform
The increased role that the federal government has assumed in the residential mortgage market through the FHFA's conservatorship of the GSEs may increase the likelihood that the business practices of the GSEs change in ways that affect the MI industry. Since 2011, there have been numerous legislative proposals, including in the current Congressional session, intended to scale back the GSEs, however, no legislation has been enacted to date.
On March 16, 2014, Senate Banking Committee Chairman Tim Johnson (D-SD) and Ranking Member Mike Crapo (R-ID) released the legislative text of the bipartisan housing finance reform bill titled S. 1217, "The Housing Finance Reform and Taxpayer Protection Act of 2014" ("the Johnson Crapo Bill"). If enacted, the Johnson Crapo Bill would (i) wind down and eliminate Fannie Mae and Freddie Mac to allow for private entities to replace most of the functions of the GSEs; (ii) establish a new regulator called the Federal Mortgage Insurance Corporation, modeled after the Federal Deposit Insurance Corporation ("FDIC"), and (iii) create a reinsurance fund modeled after the Deposit Insurance Fund maintained by the FDIC that would be funded by private companies participating in the reorganized housing finance system.
On March 27, 2014, Congresswoman Maxine Waters (D-CA), Ranking Member of the House Financial Services Committee released a legislative proposal titled "The Housing Opportunities Move the Economy Forward Act of 2014" (the "Act"). The Act proposes eliminating Fannie Mae and Freddie Mac over 5 years and replacing them with the Mortgage Securities Cooperative ("MSC"), which would be made up of lenders and issue mortgage-backed securities. The Act would establish a new regulator called the National Mortgage Finance Administration ("NMFA") to oversee the Federal Home Loan Banks and MSC. The NMFA would establish the Mortgage Insurance Fund to provide a federal guarantee on securities backed by eligible mortgages after the first loss credit risk and all the capital of the MSC has been exhausted. The NMFA would set new standards of approval for private mortgage insurers to be able to provide private mortgage insurance on eligible mortgages.
The passage of either of these bills is uncertain and the provisions of both could change as part of the legislative process, which process could take time, making the actual impact on us and our industry difficult to predict.
Competition with FHA
The FHA, which is part of the federal U.S. Department of Housing and Urban Development, substantially increased its share of the total combined private and governmental mortgage insurance market beginning in 2008. We believe that the FHA's market share increased, in part, because private mortgage insurers tightened their underwriting guidelines (which led to increased utilization of the FHA's programs) and because of increases in the amount of loan level delivery fees that the GSEs assess on loans (which result in higher costs to borrowers). We believe that federal legislation and programs that were adopted as emergency measures to support the declining housing market provided the FHA with greater flexibility in establishing new products and resulted in increased market share for the FHA. During 2011, the FHA's market share began to gradually decline. In part, we believe the decline in market share has been driven by multiple increases in the FHA's mortgage insurance premium rates and upfront fees since 2010, as well as greater availability of private capital with new entrants to the MI sector, such as us. We believe that the FHA's current premium pricing, when compared to our current premium pricing (and considering the effects of GSE pricing changes), allows us to be competitive with the FHA.
39
The below table shows the declining market share of the FHA/VA and the rising market share of private MI.
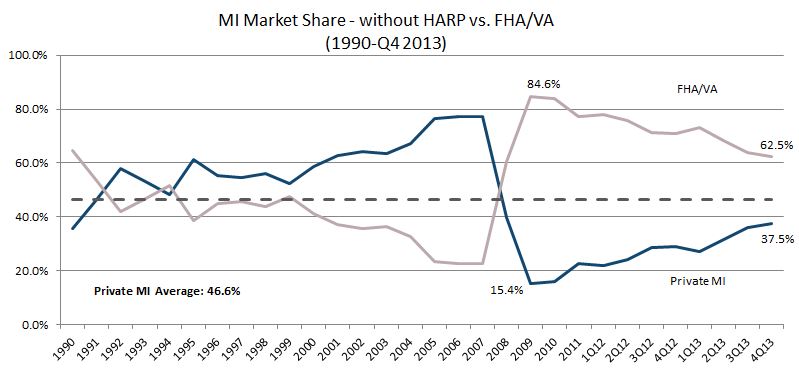

We believe the MI industry will continue to recover market share from the FHA as it pulls back and permits more private capital to return to the market.
As a result of the foregoing, it is uncertain what role the GSEs, FHA and private capital, including MI, will play in the domestic residential housing finance system in the future or the impact of any such changes on our business. In addition, the timing of the impact on our business is uncertain. Most meaningful changes would require Congressional action to implement, and it is difficult to estimate when Congress would take action, and if it did, how long it would take for such action to be final and how long any associated phase-in period may last. Considering the recent financial turnaround or the perceived turnaround of the GSEs, the timing of any of these changes becomes more difficult to assess.
Off-Balance Sheet Arrangements and Contractual Obligations
We had no off-balance sheet arrangements at
March 31, 2014
. There are no material changes outside the ordinary course of business in the contractual obligations specified in our
2013
Form 10-K.
Geographic Dispersion
We intend to build a geographically diverse portfolio and avoid geographic concentrations that might expose us to undue risk. Risk will be managed by establishing targets and limits for new origination mix and/or portfolio limits. Therefore, aside from the impact of market restrictions, we desire that our insurance origination mix by region be consistent with the overall distribution of mortgage originations in the United States that require mortgage insurance.
On an ongoing and recurring basis, we plan to evaluate changing market conditions to determine if it is appropriate to establish, tighten, loosen or eliminate lending restrictions established by geographic area. The evaluation is expected to include factors such as historical performance and the historical performance of other market participants, forward-looking projections for key risk drivers, estimated impact on loss performance, and existing portfolio concentrations. Consistent with our governance processes, the geographic concentrations will be monitored on an ongoing basis and changes to market restrictions will be reviewed and adopted as needed. We currently have no geographic market restrictions in place.
40
Critical Accounting Estimates
We use accounting principles and methods that conform to GAAP. Where GAAP specifically excludes mortgage insurance we follow general industry practices. We are required to apply significant judgment and make material estimates in the preparation of our financial statements and with regard to various accounting, reporting and disclosure matters. Assumptions and estimates are required to apply these principles where actual measurement is not possible or practical. On an ongoing basis, we evaluate our estimates and assumptions. Our actual results may differ from these estimates under different assumptions or conditions.
We believe that the assumptions and estimates associated with revenue recognition, fair value measurements, our investment portfolio, deferred policy acquisition costs, income taxes, warrants and share-based compensation have the greatest potential impact on our consolidated financial statements. Therefore, we consider these to be our critical accounting estimates.
There have been no material changes to our critical accounting policies and estimates as compared to the critical accounting policies and estimates described in our Annual Report on Form 10-K for the year ended
December 31, 2013
.
41
We own and manage a large investment portfolio of various holdings, types and maturities. Investment income is one of our primary sources of cash flow supporting operations and claim payments. The assets within the investment portfolio are exposed to the same factors that affect overall financial market performance. While our investment portfolio is exposed to factors affecting global companies and markets worldwide, it is most sensitive to fluctuations in the drivers of U.S. markets.
We manage market risk via a defined investment policy implemented by our treasury function with oversight from our Board's Risk Committee. Important drivers of our market risk exposure monitored and managed by us include but are not limited to:
|
•
|
Changes to the level of interest rates
. Increasing interest rates may reduce the value of certain fixed-rate bonds held in the investment portfolio. Higher rates may cause variable rate assets to generate additional income. Decreasing rates will have the reverse impact. Significant changes in interest rates can also affect persistency and claim rates to the extent that the investment portfolio must be restructured to better align it with future liabilities and claim payments. Such restructuring may cause investments to be liquidated when market conditions are adverse.
|
|
•
|
Changes to the term structure of interest rates
. Rising or falling rates typically change by different amounts along the yield curve. These changes may have unforeseen impacts on the value of certain assets.
|
|
•
|
Market volatility/changes in the real or perceived credit quality of investments
. Deterioration in the quality of investments, identified through changes to our own or third party (e.g., rating agency) assessments, will reduce the value and potentially the liquidity of investments.
|
|
•
|
Concentration Risk
. If the investment portfolio is highly concentrated in one asset, or in multiple assets whose values are highly correlated, the value of the total portfolio may be greatly affected by the change in value of just one asset or a group of highly correlated assets.
|
|
•
|
Prepayment Risk
. Bonds may have call provisions that permit debtors to repay prior to maturity when it is to their advantage. This typically occurs when rates fall below the interest rate of the debt.
|
At
March 31, 2014
, the duration of our fixed income portfolio, including cash and cash equivalents, was
3.05
years, which means that an instantaneous parallel shift (movement up or down) in the yield curve of 100 basis points would result in a change of
3.05%
in fair value of our fixed income portfolio. Excluding cash, our fixed income portfolio duration was
3.30
years, which means that an instantaneous parallel shift (movement up or down) in the yield curve of 100 basis points would result in a change of
3.30%
in fair value of our fixed income portfolio.
42
Disclosure Controls and Procedures
We maintain disclosure controls and procedures designed to ensure that information required to be disclosed in the reports we file or submit under the Exchange Act is recorded, processed, summarized and reported within the time periods specified in the SEC's rules and forms, and that such information is accumulated and communicated to our management, including our Chief Executive Officer and Chief Financial Officer, as appropriate, to allow timely decisions regarding required disclosure.
Our management, including our Chief Executive Officer and Chief Financial Officer, conducted an evaluation of the effectiveness of our disclosure controls and procedures (as defined in Rule 13a-15(e) of the Exchange Act) as of
March 31, 2014
, pursuant to Rule 15d-15(e) under the Exchange Act. Management applied its judgment in assessing the costs and benefits of such controls and procedures, which by their nature, can provide only reasonable assurance regarding management's control objectives. Management does not expect that our disclosure controls and procedures will prevent or detect all errors and fraud. A control system, irrespective of how well it is designed and operated, can only provide reasonable assurance, and cannot guarantee that it will succeed in its stated objectives.
Based upon that evaluation, our Chief Executive Officer and Chief Financial Officer concluded that, as of
March 31, 2014
, our disclosure controls and procedures were effective to provide reasonable assurance that the information required to be disclosed by us in the reports we file or submit under the Exchange Act is recorded, processed, summarized, and reported within the time periods specified in the SEC's rules and forms.
Internal Control Over Financial Reporting
There was no change in our internal control over financial reporting that occurred during the period covered by this report that has materially affected, or is reasonably likely to materially affect, our internal control over financial reporting.
43
On August 8, 2012, Germaine Marks, as Receiver, and Truitte Todd, as Special Deputy Receiver, of PMI Mortgage Insurance Co., an Arizona insurance company in receivership, filed a complaint (the “PMI Complaint”) against the Company, NMIC and certain named individuals, in California Superior Court, Alameda County (the "Court"). The PMI Complaint, as amended, alleges breach of fiduciary duty, breach of loyalty, aiding and abetting breach of fiduciary duty and loyalty, misappropriation of trade secrets, conversion, breach of proprietary information agreement, breach of separation agreement, intentional interference with contractual relations and unfair competition. The lawsuit seeks injunctive relief as well as unspecified monetary damages. We and the individual defendants believe these claims are without merit and have filed answers denying all allegations. We and the individual defendants intend to defend ourselves vigorously.
On January 30, 2014, Arch announced the closing of its acquisition of CMG and certain assets of PMI. The terms of the February 7, 2013 Asset Purchase Agreement ("APA") between Arch and PMI provide that effective as of the closing of that transaction, PMI shall transfer and assign to Arch all causes of action being pursued in the PMI Complaint. The APA further provides that within thirty (30) days after the closing of the transaction, Arch shall have its attorney file appropriate pleadings and other documents and instruments with the court requesting that PMI be removed as a party plaintiff in the PMI Complaint and that Arch be substituted as the real party in interest. Although Arch has not yet filed any such request with the Court, the plaintiff is now described in pleadings as “Plaintiff and Real Party in Interest Arch U.S. MI Services, Inc.”
If the lawsuit is determined adversely to us, the Court could subject us to significant monetary damages and/or enter an injunction that might include preventing NMIC from conducting insurance operations. In addition, if the lawsuit is determined adversely to any of our employees, we may be required to remove and replace those employees under the terms of agreements NMIC and/or NMIH entered into with each of the Alabama Department of Insurance, the Florida Office of Insurance Regulation, the Kentucky Department of Insurance, the Texas Commissioner of Insurance and the New York State Department of Financial Services, as a condition of NMIC obtaining certificates of authority in those states. The Court has set the trial date for September 29, 2014.
Because the litigation and related discovery are ongoing, we do not have sufficient information to determine or predict the ultimate outcome or estimate the range of possible losses, if any. Accordingly, no provision for litigation losses has been included in our financial statements.
44
We are not aware of any material changes in our risk factors from the risk factors disclosed in our Annual Report on Form 10-K for the year ended
December 31, 2013
.
45
|
Exhibit Number
|
Description
|
|
|
2.1
|
Stock Purchase Agreement, dated November 30, 2011, between NMI Holdings, Inc. and MAC Financial Ltd. (incorporated herein by reference to Exhibit 2.1 to our Form S-1 Registration Statement (Registration No. 333-191635), filed on October 9, 2013)
|
|
|
2.2
|
Amendment to Stock Purchase Agreement, dated April 6, 2012, between NMI Holdings, Inc. and MAC Financial Ltd. (incorporated herein by reference to Exhibit 2.2 to our Form S-1 Registration Statement (Registration No. 333-191635), filed on October 9, 2013)
|
|
|
3.1
|
Second Amended and Restated Certificate of Incorporation (incorporated herein by reference to Exhibit 3.1 to our Form S-1 Registration Statement (Registration No. 333-191635), filed on October 9, 2013)
|
|
|
3.2
|
Second Amended and Restated By-Laws (incorporated herein by reference to Exhibit 3.1 to our Form 8-K, filed on May 12, 2014)
|
|
|
4.1
|
Specimen Class A common stock certificate (incorporated herein by reference to Exhibit 4.1 to our Form S-1 Registration Statement (Registration No. 333-191635), filed on October 9, 2013)
|
|
|
4.2
|
Registration Rights Agreement between NMI Holdings, Inc. and FBR Capital Markets & Co., dated April 24, 2012 (incorporated herein by reference to Exhibit 4.2 to our Form S-1 Registration Statement (Registration No. 333-191635), filed on October 9, 2013)
|
|
|
4.3
|
Registration Rights Agreement by and between MAC Financial Ltd. and NMI Holdings, Inc., dated April 24, 2012 (incorporated herein by reference to Exhibit 4.3 to our Form S-1 Registration Statement (Registration No. 333-191635), filed on October 9, 2013)
|
|
|
4.4
|
Registration Rights Agreement between FBR & Co., FBR Capital Markets LT, Inc., FBR Capital Markets & Co., FBR Capital Markets PT, Inc. and NMI Holdings, Inc., dated April 24, 2012 (incorporated herein by reference to Exhibit 4.4 to our Form S-1 Registration Statement (Registration No. 333-191635), filed on October 9, 2013)
|
|
|
4.5
|
Warrant No. 1 to Purchase Common Stock of NMI Holdings, Inc. issued to FBR Capital Markets & Co., dated June 13, 2013 (incorporated herein by reference to Exhibit 4.5 to our Form S-1 Registration Statement (Registration No. 333-191635), filed on October 9, 2013)
|
|
|
4.6
|
Form of Warrant to Purchase Common Stock of NMI Holdings, Inc. issued to former stockholders of MAC Financial Ltd.(incorporated herein by reference to Exhibit 4.6 to our Form S-1 Registration Statement (Registration No. 333-191635), filed on October 9, 2013)
|
|
|
10.1
|
NMI Holdings, Inc. 2012 Stock Incentive Plan (incorporated herein by reference to Exhibit 10.1 to our Form S-1 Registration Statement (Registration No. 333-191635), filed on October 9, 2013)
|
|
|
10.2
|
Form of NMI Holdings, Inc. 2012 Stock Incentive Plan Restricted Stock Unit Award Agreement for Chief Executive Officer and Chief Financial Officer (incorporated herein by reference to Exhibit 10.2 to our Form S-1 Registration Statement (Registration No. 333-191635), filed on October 9, 2013)
|
|
|
10.3
|
Form of NMI Holdings, Inc. 2012 Stock Incentive Plan Restricted Stock Unit Award Agreement for Management (incorporated herein by reference to Exhibit 10.3 to our Form S-1 Registration Statement (Registration No. 333-191635), filed on October 9, 2013)
|
|
|
10.4
|
Form of NMI Holdings, Inc. 2012 Stock Incentive Plan Restricted Stock Unit Award Agreement for Directors (incorporated herein by reference to Exhibit 10.4 to our Form S-1 Registration Statement (Registration No. 333-191635), filed on October 9, 2013)
|
|
|
10.5
|
Form of NMI Holdings, Inc. 2012 Stock Incentive Plan Nonqualified Stock Option Award Agreement for Chief Executive Officer and Chief Financial Officer (incorporated herein by reference to Exhibit 10.5 to our Form S-1 Registration Statement (Registration No. 333-191635), filed on October 9, 2013)
|
|
|
10.6
|
Form of NMI Holdings, Inc. 2012 Stock Incentive Plan Nonqualified Stock Option Award Agreement for Management (incorporated herein by reference to Exhibit 10.6 to our Form S-1 Registration Statement (Registration No. 333-191635), filed on October 9, 2013)
|
|
|
10.7
|
Form of NMI Holdings, Inc. 2012 Stock Incentive Plan Nonqualified Stock Option Award Agreement for Directors (incorporated herein by reference to Exhibit 10.7 to our Form S-1 Registration Statement (Registration No. 333-191635), filed on October 9, 2013)
|
|
|
10.8
|
Employment Agreement by and between NMI Holdings, Inc. and Bradley M. Shuster, dated March 6, 2012 and Amendment, dated April 24, 2012 (incorporated herein by reference to Exhibit 10.8 to our Form S-1 Registration Statement (Registration No. 333-191635), filed on October 9, 2013)
|
|
|
10.9
|
Amendment to Employment Agreement by and between NMI Holdings, Inc. and Bradley M. Shuster, dated April 24, 2012 (incorporated herein by reference to Exhibit 10.9 to our Form S-1 Registration Statement (Registration No. 333-191635), filed on October 9, 2013)
|
|
46
|
Exhibit Number
|
Description
|
|
|
10.10
|
Employment Agreement by and between NMI Holdings, Inc. and Jay M. Sherwood, dated March 6, 2012 and Amendment, dated April 24, 2012 (incorporated herein by reference to Exhibit 10.10 to our Form S-1 Registration Statement (Registration No. 333-191635), filed on October 9, 2013)
|
|
|
10.11
|
Amendment to Employment Agreement by and between NMI Holdings, Inc. and Jay M. Sherwood, dated April 24, 2012 (incorporated herein by reference to Exhibit 10.11 to our Form S-1 Registration Statement (Registration No. 333-191635), filed on October 9, 2013)
|
|
|
10.12
|
Letter Agreement by and between NMI Holdings, Inc. and Stanley M. Pachura, dated April 26, 2012 (incorporated herein by reference to Exhibit 10.12 to our Form S-1 Registration Statement (Registration No. 333-191635), filed on October 9, 2013)
|
|
|
10.13
|
Form of Indemnification Agreement between NMI Holdings, Inc. and certain of its directors (incorporated herein by reference to Exhibit 10.13 to our Form S-1 Registration Statement (Registration No. 333-191635), filed on October 9, 2013)
|
|
|
10.14
|
Commitment Letter dated July 12, 2013 for Bulk Fannie Mae-Paid Loss-on-Sale Mortgage Insurance on the Portfolio of approximately $5.46 billion Purchased by Fannie Mae and Identified by Fannie Mae as Deal No. 2013 MIRT 01 and by the Company as Policy No. P-0001-01 (incorporated herein by reference to Exhibit 10.14 to our Form S-1 Registration Statement (Registration No. 333-191635), filed on October 9, 2013)
|
|
|
10.15
|
NMI Holdings, Inc. 2014 Omnibus Incentive Plan (incorporated herein by reference to Appendix A to our 2014 Annual Proxy Statement filed on March 26, 2014)
|
|
|
21.1
|
Subsidiaries of NMI Holdings, Inc. (incorporated herein by reference to Exhibit 21.1 to our Form S-1 Registration Statement (Registration No. 333-191635), filed on October 9, 2013)
|
|
|
23.1
|
Consent of BDO USA, LLP (incorporated herein by reference to Exhibit 23.1 to our Form 10-K for the period ended December 31, 2013, filed on March 12, 2014)
|
|
|
31.1
|
Principal Executive Officer's Certification Pursuant to Section 302 of the Sarbanes-Oxley Act of 2002
|
|
|
31.2
|
Principal Financial Officer's Certification Pursuant to Section 302 of the Sarbanes-Oxley Act of 2002
|
|
|
32 #
|
Certifications of CEO and CFO Pursuant to 18 U.S.C. Section 1350, as Adopted Pursuant to Section 906 of the Sarbanes-Oxley Act of 2002
|
|
|
99.1
|
Conditional Approval Letter, dated January 15, 2013, from Freddie Mac to National Mortgage Insurance Corporation (incorporated herein by reference to Exhibit 99.1 to our Form S-1 Registration Statement (Registration No. 333-191635), filed on October 9, 2013)
|
|
|
99.2
|
Conditional Approval Agreement, dated January 16, 2013, by and among Federal National Mortgage Association, NMI Holdings, Inc. and National Mortgage Insurance Corporation (incorporated herein by reference to Exhibit 99.2 to our Form S-1 Registration Statement (Registration No. 333-191635), filed on October 9, 2013)
|
|
|
101 *
|
The following financial information from NMI Holdings, Inc.’s Quarterly Report on Form 10-Q for the quarter ended March 31, 2014, formatted in XBRL (eXtensible Business Reporting Language):
(i) Condensed Consolidated Balance Sheets (Unaudited) as of March 31, 2014 and December 31, 2013
(ii) Condensed Consolidated Statements of Comprehensive Loss (Unaudited) for the three months ended March 31, 2014 and 2013
(iii) Condensed Consolidated Statements of Changes in Common Shareholders' Equity (Unaudited) for the three months ended March 31, 2014 and the year ended December 31, 2013
(iv) Condensed Consolidated Statements of Cash Flows (Unaudited) for the three months ended March 31, 2014 and 2013, and
(v) Notes to Condensed Consolidated Financial Statements (Unaudited)
|
|
|
#
|
In accordance with Item 601(b)(32)(ii) of Regulation S-K and SEC Release No. 34-47986, the certifications furnished in Exhibit 32 hereto are deemed to accompany this Form 10-Q and will not be deemed “filed” for purposes of Section 18 of the Exchange Act or deemed to be incorporated by reference into any filing under the Exchange Act or the Securities Act except to the extent that the registrant specifically incorporates it by reference.
|
|
*
|
In accordance with Rule 406T of Regulation S-T, the information furnished in these exhibits will not be deemed “filed” for purposes of Section 18 of the Exchange Act. Such exhibits will not be deemed to be incorporated by reference into any filing under the Securities Act or the Exchange Act except to the extent that the registrant specifically incorporates it by reference.
|
47
SIGNATURES
Pursuant to the requirements of the Securities Exchange Act of 1934, the registrant has duly caused this report to be signed on its behalf by the undersigned thereunto duly authorized.
|
NMI HOLDINGS, INC.
|
|
|
May 14, 2014
|
By: /s/ John (Jay) M. Sherwood, Jr.
|
|
Name: John (Jay) M. Sherwood, Jr.
Title: Chief Financial Officer
|
|
48
EXHIBIT INDEX
|
Exhibit Number
|
Description
|
|
|
2.1
|
Stock Purchase Agreement, dated November 30, 2011, between NMI Holdings, Inc. and MAC Financial Ltd. (incorporated herein by reference to Exhibit 2.1 to our Form S-1 Registration Statement (Registration No. 333-191635), filed on October 9, 2013)
|
|
|
2.2
|
Amendment to Stock Purchase Agreement, dated April 6, 2012, between NMI Holdings, Inc. and MAC Financial Ltd. (incorporated herein by reference to Exhibit 2.2 to our Form S-1 Registration Statement (Registration No. 333-191635), filed on October 9, 2013)
|
|
|
3.1
|
Second Amended and Restated Certificate of Incorporation (incorporated herein by reference to Exhibit 3.1 to our Form S-1 Registration Statement (Registration No. 333-191635), filed on October 9, 2013)
|
|
|
3.2
|
Second Amended and Restated By-Laws (incorporated herein by reference to Exhibit 3.1 to our Form 8-K, filed on May 12, 2014)
|
|
|
4.1
|
Specimen Class A common stock certificate (incorporated herein by reference to Exhibit 4.1 to our Form S-1 Registration Statement (Registration No. 333-191635), filed on October 9, 2013)
|
|
|
4.2
|
Registration Rights Agreement between NMI Holdings, Inc. and FBR Capital Markets & Co., dated April 24, 2012 (incorporated herein by reference to Exhibit 4.2 to our Form S-1 Registration Statement (Registration No. 333-191635), filed on October 9, 2013)
|
|
|
4.3
|
Registration Rights Agreement by and between MAC Financial Ltd. and NMI Holdings, Inc., dated April 24, 2012 (incorporated herein by reference to Exhibit 4.3 to our Form S-1 Registration Statement (Registration No. 333-191635), filed on October 9, 2013)
|
|
|
4.4
|
Registration Rights Agreement between FBR & Co., FBR Capital Markets LT, Inc., FBR Capital Markets & Co., FBR Capital Markets PT, Inc. and NMI Holdings, Inc., dated April 24, 2012 (incorporated herein by reference to Exhibit 4.4 to our Form S-1 Registration Statement (Registration No. 333-191635), filed on October 9, 2013)
|
|
|
4.5
|
Warrant No. 1 to Purchase Common Stock of NMI Holdings, Inc. issued to FBR Capital Markets & Co., dated June 13, 2013 (incorporated herein by reference to Exhibit 4.5 to our Form S-1 Registration Statement (Registration No. 333-191635), filed on October 9, 2013)
|
|
|
4.6
|
Form of Warrant to Purchase Common Stock of NMI Holdings, Inc. issued to former stockholders of MAC Financial Ltd.(incorporated herein by reference to Exhibit 4.6 to our Form S-1 Registration Statement (Registration No. 333-191635), filed on October 9, 2013)
|
|
|
10.1
|
NMI Holdings, Inc. 2012 Stock Incentive Plan (incorporated herein by reference to Exhibit 10.1 to our Form S-1 Registration Statement (Registration No. 333-191635), filed on October 9, 2013)
|
|
|
10.2
|
Form of NMI Holdings, Inc. 2012 Stock Incentive Plan Restricted Stock Unit Award Agreement for Chief Executive Officer and Chief Financial Officer (incorporated herein by reference to Exhibit 10.2 to our Form S-1 Registration Statement (Registration No. 333-191635), filed on October 9, 2013)
|
|
|
10.3
|
Form of NMI Holdings, Inc. 2012 Stock Incentive Plan Restricted Stock Unit Award Agreement for Management (incorporated herein by reference to Exhibit 10.3 to our Form S-1 Registration Statement (Registration No. 333-191635), filed on October 9, 2013)
|
|
|
10.4
|
Form of NMI Holdings, Inc. 2012 Stock Incentive Plan Restricted Stock Unit Award Agreement for Directors (incorporated herein by reference to Exhibit 10.4 to our Form S-1 Registration Statement (Registration No. 333-191635), filed on October 9, 2013)
|
|
|
10.5
|
Form of NMI Holdings, Inc. 2012 Stock Incentive Plan Nonqualified Stock Option Award Agreement for Chief Executive Officer and Chief Financial Officer (incorporated herein by reference to Exhibit 10.5 to our Form S-1 Registration Statement (Registration No. 333-191635), filed on October 9, 2013)
|
|
|
10.6
|
Form of NMI Holdings, Inc. 2012 Stock Incentive Plan Nonqualified Stock Option Award Agreement for Management (incorporated herein by reference to Exhibit 10.6 to our Form S-1 Registration Statement (Registration No. 333-191635), filed on October 9, 2013)
|
|
|
10.7
|
Form of NMI Holdings, Inc. 2012 Stock Incentive Plan Nonqualified Stock Option Award Agreement for Directors (incorporated herein by reference to Exhibit 10.7 to our Form S-1 Registration Statement (Registration No. 333-191635), filed on October 9, 2013)
|
|
|
10.8
|
Employment Agreement by and between NMI Holdings, Inc. and Bradley M. Shuster, dated March 6, 2012 and Amendment, dated April 24, 2012 (incorporated herein by reference to Exhibit 10.8 to our Form S-1 Registration Statement (Registration No. 333-191635), filed on October 9, 2013)
|
|
|
10.9
|
Amendment to Employment Agreement by and between NMI Holdings, Inc. and Bradley M. Shuster, dated April 24, 2012 (incorporated herein by reference to Exhibit 10.9 to our Form S-1 Registration Statement (Registration No. 333-191635), filed on October 9, 2013)
|
|
i
|
Exhibit Number
|
Description
|
|
|
10.10
|
Employment Agreement by and between NMI Holdings, Inc. and Jay M. Sherwood, dated March 6, 2012 and Amendment, dated April 24, 2012 (incorporated herein by reference to Exhibit 10.10 to our Form S-1 Registration Statement (Registration No. 333-191635), filed on October 9, 2013)
|
|
|
10.11
|
Amendment to Employment Agreement by and between NMI Holdings, Inc. and Jay M. Sherwood, dated April 24, 2012 (incorporated herein by reference to Exhibit 10.11 to our Form S-1 Registration Statement (Registration No. 333-191635), filed on October 9, 2013)
|
|
|
10.12
|
Letter Agreement by and between NMI Holdings, Inc. and Stanley M. Pachura, dated April 26, 2012 (incorporated herein by reference to Exhibit 10.12 to our Form S-1 Registration Statement (Registration No. 333-191635), filed on October 9, 2013)
|
|
|
10.13
|
Form of Indemnification Agreement between NMI Holdings, Inc. and certain of its directors (incorporated herein by reference to Exhibit 10.13 to our Form S-1 Registration Statement (Registration No. 333-191635), filed on October 9, 2013)
|
|
|
10.14
|
Commitment Letter dated July 12, 2013 for Bulk Fannie Mae-Paid Loss-on-Sale Mortgage Insurance on the Portfolio of approximately $5.46 billion Purchased by Fannie Mae and Identified by Fannie Mae as Deal No. 2013 MIRT 01 and by the Company as Policy No. P-0001-01 (incorporated herein by reference to Exhibit 10.14 to our Form S-1 Registration Statement (Registration No. 333-191635), filed on October 9, 2013)
|
|
|
10.15
|
NMI Holdings, Inc. 2014 Omnibus Incentive Plan (incorporated herein by reference to Appendix A to our 2014 Annual Proxy Statement, filed on March 26, 2014)
|
|
|
21.1
|
Subsidiaries of NMI Holdings, Inc. (incorporated herein by reference to Exhibit 21.1 to our Form S-1 Registration Statement (Registration No. 333-191635), filed on October 9, 2013)
|
|
|
23.1
|
Consent of BDO USA, LLP (incorporated herein by reference to Exhibit 23.1 to our Form 10-K for the period ended December 31, 2013, filed on March 12, 2014)
|
|
|
31.1
|
Principal Executive Officer's Certification Pursuant to Section 302 of the Sarbanes-Oxley Act of 2002
|
|
|
31.2
|
Principal Financial Officer's Certification Pursuant to Section 302 of the Sarbanes-Oxley Act of 2002
|
|
|
32 #
|
Certifications of CEO and CFO Pursuant to 18 U.S.C. Section 1350, as Adopted Pursuant to Section 906 of the Sarbanes-Oxley Act of 2002
|
|
|
99.1
|
Conditional Approval Letter, dated January 15, 2013, from Freddie Mac to National Mortgage Insurance Corporation (incorporated herein by reference to Exhibit 99.1 to our Form S-1 Registration Statement (Registration No. 333-191635), filed on October 9, 2013)
|
|
|
99.2
|
Conditional Approval Agreement, dated January 16, 2013, by and among Federal National Mortgage Association, NMI Holdings, Inc. and National Mortgage Insurance Corporation (incorporated herein by reference to Exhibit 99.2 to our Form S-1 Registration Statement (Registration No. 333-191635), filed on October 9, 2013)
|
|
|
101 *
|
The following financial information from NMI Holdings, Inc.’s Quarterly Report on Form 10-Q for the quarter ended March 31, 2014, formatted in XBRL (eXtensible Business Reporting Language):
(i) Condensed Consolidated Balance Sheets (Unaudited) as of March 31, 2014 and December 31, 2013
(ii) Condensed Consolidated Statements of Comprehensive Loss (Unaudited) for the three months ended March 31, 2014 and 2013
(iii) Condensed Consolidated Statements of Changes in Common Shareholders' Equity (Unaudited) for the three months ended March 31, 2014 and the year ended December 31, 2013
(iv) Condensed Consolidated Statements of Cash Flows (Unaudited) for the three months ended March 31, 2014 and 2013, and
(v) Notes to Condensed Consolidated Financial Statements (Unaudited)
|
|
|
#
|
In accordance with Item 601(b)(32)(ii) of Regulation S-K and SEC Release No. 34-47986, the certifications furnished in Exhibit 32 hereto are deemed to accompany this Form 10-Q and will not be deemed “filed” for purposes of Section 18 of the Exchange Act or deemed to be incorporated by reference into any filing under the Exchange Act or the Securities Act except to the extent that the registrant specifically incorporates it by reference.
|
|
*
|
In accordance with Rule 406T of Regulation S-T, the information furnished in these exhibits will not be deemed “filed” for purposes of Section 18 of the Exchange Act. Such exhibits will not be deemed to be incorporated by reference into any filing under the Securities Act or the Exchange Act except to the extent that the registrant specifically incorporates it by reference.
|
ii
TABLE OF CONTENTS
Part IItem 1. Financial Statements and Supplementary DataItem 2. Management's Discussion and Analysis Of Financial Condition and Results Of OperationsNote 11, Statutory InformationNote 8, Share Based Compensation,"Note 1, Organization and Basis Of Presentation"Item 3. Quantitative and Qualitative Disclosures About Market RiskItem 4. Controls and ProceduresPart IIItem 1. Legal ProceedingsItem 1A. Risk FactorsItem 6. Exhibits