UNITED STATES
SECURITIES AND EXCHANGE COMMISSION
Washington, D.C. 20549
FORM
20-F
|
|
REGISTRATION STATEMENT PURSUANT TO SECTION 12(b) OR 12(g) OF THE SECURITIES EXCHANGE ACT OF 1934
|
OR
|
|
ANNUAL REPORT PURSUANT TO SECTION 13 OR 15(d) OF THE SECURITIES EXCHANGE ACT OF 1934
|
For the fiscal year ended
March 31, 2020
OR
|
|
TRANSITION REPORT PURSUANT TO SECTION 13 OR 15(d) OF THE SECURITIES EXCHANGE ACT OF 1934
|
For the transition period from to
OR
|
|
SHELL COMPANY REPORT PURSUANT TO SECTION 13 OR 15(d) OF THE SECURITIES EXCHANGE ACT OF 1934
|
Date of event requiring this shell company report
Commission file number:
1-15270
Nomura Horudingusu Kabushiki Kaisha
(Exact name of registrant as specified in its charter
)
.
(Translation of registrant’s name into English)
|
|
|
|
|
(Jurisdiction of incorporation or organization)
|
(Address of principal executive offices)
|
81-3-6746-7850
(Name, Telephone,
E-mail
and/or Facsimile number and Address of Company Contact Person)
Securities registered or to be registered pursuant to Section 12(b) of the Act:
|
Title of Each Class
|
Trading Symbol(s)
|
Name of Each Exchange On Which Registered
|
||
|
|
|
|
|
*
|
Not for trading, but only in connection with the registration of the American Depositary Shares, each representing one share of Common Stock.
|
Securities registered or to be registered pursuant to Section 12(g) of the Act:
None
(Title of Class)
Securities for which there is a reporting obligation pursuant to Section 15(d) of the Act:
None
(Title of Class)
Indicate the number of outstanding shares of each of the issuer’s classes of capital or common stock as of the close of the period covered by the annual report.
As of March 31, 2020,
3,038,587,493
shares of Common Stock were outstanding, including
30,223,151
shares represented by
30,223,151
American Depositary Shares.
Indicate by check mark if the registrant is a well-known seasoned issuer, as defined in Rule 405 of the Securities Act.
Yes
☒
☐
No
If this report is an annual or transition report, indicate by check mark if the registrant is not required to file reports pursuant to Section 13 or 15(d) of the Securities Exchange Act of 1934.
No
☐
Yes
☒
Indicate by check mark whether the registrant: (1) has filed all reports required to be filed by Section 13 or 15(d) of the Securities Exchange Act of 1934 during the preceding 12 months (or for such shorter period that the registrant was required to file such reports), and (2) has been subject to such filing requirements for the past 90 days.
Yes
☒
No
☐
Indicate by check mark whether the registrant has submitted electronically every Interactive Data File required to be submitted pursuant to Rule 405 of Regulation
Yes
S-T
(§232.405 of this chapter) during the preceding 12 months (or for such shorter period that the registrant was required to submit such files).
☒
No
☐
Indicate by check mark whether the registrant is a large accelerated filer, an accelerated filer, a
non-accelerated
filer, or an emerging growth company. See definition of “large accelerated filer,” “accelerated filer,” and “emerging growth company” in Rule
12b-2
of the Exchange Act. (Check one):
|
☒
|
Accelerated filer
☐
|
Non-accelerated
filer
☐
|
Emerging growth company
|
If an emerging growth company that prepares its financial statements in accordance with U.S. GAAP, indicate by check mark if the registrant has elected not to use the extended transition period for complying with any new or revised financial accounting standards† provided pursuant to Section 13(a) of the Exchange Act.
☐
† The term “new or revised financial accounting standard” refers to any update issued by the Financial Accounting Standards Board to its Accounting Standards Codification after April 5, 2012.
Indicate by check mark whether the registrant has filed a report on and attestation to its management’s assessment of the effectiveness of its internal control over financial reporting under Section 404(b) of the Sarbanes-Oxley Act (15 U.S.C. 7262(b)) by the registered public accounting firm that prepared or issued its audit report.
☒
Indicate by check mark which basis of accounting the registrant has used to prepare the financial statements included in this filing:
|
☒
|
International Financial Reporting Standards as issued
by the International Accounting Standards Board
☐
|
Other
☐
|
If “Other” has been checked in response to the previous question, indicate by check mark which financial statement item the registrant has elected to follow.
☐
Item 17
☐
Item 18
If this is an annual report, indicate by check mark whether the registrant is a shell company (as defined in Rule
☒
No
12b-2
of the Exchange Act).
☐
Yes
(APPLICABLE ONLY TO ISSUERS INVOLVED IN BANKRUPTCY PROCEEDINGS DURING THE PAST FIVE YEARS)
Indicate by check mark whether the registrant has filed all documents and reports required to be filed by Sections 12, 13 or 15(d) of the Securities Exchange Act of 1934 subsequent to the distribution of securities under a plan confirmed by a court.
☐
Yes
☐
No
TABLE OF CONTENTS
|
|
|
Page
|
|
|||
|
|
PART I
|
|
|
|
||
|
Item 1.
|
2
|
|||||
|
Item 2.
|
2
|
|||||
|
Item 3.
|
2
|
|||||
|
Item 4.
|
20
|
|||||
|
Item 4A.
|
43
|
|||||
|
Item 5.
|
43
|
|||||
|
Item 6.
|
81
|
|||||
|
Item 7.
|
102
|
|||||
|
Item 8.
|
103
|
|||||
|
Item 9.
|
103
|
|||||
|
Item 10.
|
104
|
|||||
|
Item 11.
|
112
|
|||||
|
Item 12.
|
127
|
|||||
|
|
PART II
|
|
|
|
||
|
Item 13.
|
129
|
|||||
|
Item 14.
|
129
|
|||||
|
Item 15.
|
129
|
|||||
|
Item 16A.
|
129
|
|||||
|
Item 16B.
|
130
|
|||||
|
Item 16C.
|
130
|
|||||
|
Item 16D.
|
131
|
|||||
|
Item 16E.
|
131
|
|||||
|
Item 16F.
|
132
|
|||||
|
Item 16G.
|
132
|
|||||
|
Item 16H.
|
133
|
|||||
|
|
PART III
|
|
|
|
||
|
Item 17.
|
134
|
|||||
|
Item 18.
|
134
|
|||||
|
Item 19.
|
135
|
|||||
|
F-
1
|
||||||
__________________________
1
As used in this annual report, references to th
“Company”
Nomura
, the
Nomura Group
,
we
,
us
and “our
are to Nomura Holdings, Inc. and, except as the context otherwise requires, its consolidated subsidiaries. As part of certain line items in Nomura’s financial statements and information included in this annual report, references to “NHI” are to Nomura Holdings, Inc.
As used in this annual report, “yen” or “¥” means the lawful currency of Japan, “dollar” or “$” means the lawful currency of the United States of America (“U.S.”), and “EUR” means the lawful currency of the member states of the European Monetary Union.
As used in this annual report, “ADS” means an American Depositary Share, currently representing one share of the Company’s common stock, and “ADR” means an American Depositary Receipt evidencing one or more ADSs. See “Rights of ADR Holders” under Item 10.B of this annual report.
As used in this annual report, except as the context otherwise requires, the “Companies Act” means the Companies Act of Japan and the “FSA” means the Financial Services Agency of Japan.
Amounts shown in this annual report have been rounded to the nearest indicated digit unless otherwise specified. In tables and graphs with rounded figures, sums may not add up due to rounding.
PART I
Item 1. Identity of Directors, Senior Management and Advisers
Not applicable.
Item 2. Offer Statistics and Expected Timetable
Not applicable.
Item 3. Key Information
A. Selected Financial Data
The following table presents selected financial information as of and for the years ended March 31, 2016, 2017, 2018, 2019 and 2020 which is derived from our consolidated financial statements. The consolidated balance sheets for the years ended March 31, 2019 and 2020, the consolidated statements of income, comprehensive income, changes in equity and cash flows for each of the years ended March 31, 2018, 2019 and 2020, and notes thereto appear elsewhere in this annual report. These financial statements are prepared in accordance with accounting principles generally accepted in the U.S. (“U.S. GAAP”). Certain reclassifications of previously reported amounts have been made to conform to the current period presentation.
2
The selected consolidated financial information set forth below should be read in conjunction with Item 5. “
” in this annual report and our consolidated financial statements and notes thereto included in this annual report.
Operating and Financial Review and Prospects
|
|
Millions of yen, except per share data and percentages
|
|||||||||||||||||||
|
|
Year ended March 31
|
|||||||||||||||||||
|
|
2016
|
|
2017
|
|
2018
|
|
2019
|
|
2020
|
|
||||||||||
|
Statement of income data:
|
|
|
|
|
|
|
|
|
|
|
|
|
|
|
|
|||||
|
Revenue
|
¥ |
1,723,096
|
¥ |
1,715,516
|
¥ |
1,972,158
|
¥ |
1,835,118
|
¥ |
1,952,482
|
||||||||||
|
Interest expense
|
327,415
|
312,319
|
475,189
|
718,348
|
664,653
|
|||||||||||||||
|
Net revenue
|
1,395,681
|
1,403,197
|
1,496,969
|
1,116,770
|
1,287,829
|
|||||||||||||||
|
Non-interest
expenses
|
1,230,523
|
1,080,402
|
1,168,811
|
1,154,471
|
1,039,568
|
|||||||||||||||
|
Income (loss) before income taxes
|
165,158
|
322,795
|
328,158
|
(37,701
|
) |
248,261
|
||||||||||||||
|
Income tax expense
|
22,596
|
80,229
|
103,866
|
57,010
|
28,894
|
|||||||||||||||
|
Net income (loss)
|
¥ |
142,562
|
¥ |
242,566
|
¥ |
224,292
|
¥ |
(94,711
|
) | ¥ |
219,367
|
|||||||||
|
Less: Net income attributable to noncontrolling interests
|
11,012
|
2,949
|
4,949
|
5,731
|
2,369
|
|||||||||||||||
|
Net income (loss) attributable to Nomura Holdings, Inc. (“NHI”) shareholders
|
¥ |
131,550
|
¥ |
239,617
|
¥ |
219,343
|
¥ |
(100,442
|
) | ¥ |
216,998
|
|||||||||
|
Balance sheet data (period end):
|
|
|
|
|
|
|
|
|
|
|
|
|
|
|
|
|||||
|
Total assets
(1)
|
¥ |
40,934,217
|
¥ |
42,531,972
|
¥ |
40,343,947
|
¥ |
40,969,439
|
¥ |
43,999,815
|
||||||||||
|
Total NHI shareholders’ equity
|
2,700,239
|
2,789,916
|
2,749,320
|
2,631,061
|
2,653,467
|
|||||||||||||||
|
Total equity
|
2,743,015
|
2,843,791
|
2,799,824
|
2,680,793
|
2,731,264
|
|||||||||||||||
|
Common stock
|
594,493
|
594,493
|
594,493
|
594,493
|
594,493
|
|||||||||||||||
|
Per share data:
|
|
|
|
|
|
|
|
|
|
|
|
|
|
|
|
|||||
|
Net income (loss) attributable to NHI shareholders
—
|
¥ |
36.53
|
¥ |
67.29
|
¥ |
63.13
|
¥ |
(29.90
|
) | ¥ |
67.76
|
|||||||||
|
Net income (loss) attributable to NHI shareholders
—
|
35.52
|
65.65
|
61.88
|
(29.92
|
) |
66.20
|
||||||||||||||
|
Total NHI shareholders’ equity
(2)
|
748.32
|
790.70
|
810.31
|
794.69
|
873.26
|
|||||||||||||||
|
Cash dividends
(2)
|
13.00
|
20.00
|
20.00
|
6.00
|
20.00
|
|||||||||||||||
|
Cash dividends in USD
(3)
|
$ |
0.12
|
$ |
0.18
|
$ |
0.19
|
$ |
0.05
|
$ |
0.19
|
||||||||||
|
Weighted average number of shares outstanding (in thousands)
(4)
|
3,600,701
|
3,560,776
|
3,474,593
|
3,359,565
|
3,202,370
|
|||||||||||||||
|
Return on equity
(5)
:
|
4.9
|
% |
8.7
|
% |
7.9
|
% |
(3.7
|
%) |
8.2
|
% | ||||||||||
| (1) |
Due to Accounting Standards Update
2014-09,
“
Revenue from Contracts with Customers
|
| (2) | Calculated using the number of shares outstanding at year end. |
| (3) | Calculated using the Japanese Yen—U.S. Dollar exchange rate as of the respective fiscal year end date, the noon buying rate in New York City for cable transfers in foreign currencies as certified for customs purposes by the Federal Reserve Bank of New York. |
| (4) | The number shown is used to calculate basic earnings per share. |
| (5) | Calculated as net income (loss) attributable to NHI shareholders divided by total NHI shareholders’ equity. |
B. Capitalization and Indebtedness.
Not applicable.
C. Reasons for the Offer and Use of Proceeds.
Not applicable.
3
D. Risk Factors.
Risk Factors
You should carefully consider the risks described below before making an investment decision. If any of the risks described below actually occurs, our business, financial condition, results of operations or cash flows could be adversely affected. In that event, the trading prices of our shares could decline, and you may lose all or part of your investment. In addition to the risks listed below, risks not currently known to us or that we now deem immaterial may also harm us and affect your investment.
Our business may be materially affected by financial markets, economic conditions and market fluctuations in Japan and elsewhere around the world
Our business and revenues may be affected by any adverse changes in the Japanese and global economic environments and financial markets. In addition, not only purely economic factors but also future wars, acts of terrorism, economic or political sanctions, pandemics, forecasts of geopolitical risks and geopolitical events which have actually occurred, natural disasters or other similar events could have an effect on the financial markets and economies of each country. If any adverse events including those discussed above were to occur, a market or economic downturn may last for a long period of time, which could adversely affect our business and can result in us incurring substantial losses. In particular, global turmoil and economic conditions caused by the coronavirus
(”COVID-19”)
pandemic could continue to negatively affect Nomura’s business, even after the pandemic itself has subsided. It is highly uncertain and difficult to predict how critically our business continuity and revenue will be affected if this situation continues for an extended period. Furthermore, the long-term trends of population aging and population decline faced by Japan, are expected to continue to put downward pressure on demand in the businesses in which we operate, including, in particular, our retail business. Even in the absence of a prolonged market or economic downturn, changes in market volatility and other changes in the environment may adversely affect our business, financial condition and results of operations. The following are certain risks related to the financial markets and economic conditions for our specific businesses.
Governmental fiscal and monetary policy changes in Japan, or in any other country or region where we conduct business may affect our business, financial condition and results of operations
We engage in our business globally through domestic and international offices. Governmental fiscal, monetary and other policy changes in Japan, or in any other country or region where we conduct business may affect our business, financial condition and results of operations. In addition, any changes to the monetary policy of the Bank of Japan or central banks in major economies worldwide, which could potentially be followed by volatility of interest rate or yields may negatively affect our ability to provide asset management products to our clients as well as our and our clients’ trading and investment activities, as exemplified by decreased returns for fixed income products in the prolonged low interest rate environment in Japan.
The
COVID-19
pandemic has affected Nomura’s business, customers and employees and this may continue in the future
In 2020, the
COVID-19
pandemic and the measures taken by governments to prevent its spread had a severe impact on our business environment, particularly in the capital markets, which are expected to see continued instability due to the ongoing turmoil including an extreme volatility in global equity prices, interest rates and elsewhere and a widening of credit spreads, as well as the possibility that uncertainty in the economic outlook will continue in the future.
Post-Transition Brexit may adversely affect our business on various fronts
On January 31, 2020, the United Kingdom (“U.K.”) withdrew from the European Union (“EU”) under the Withdrawal Agreement between the U.K. and the EU (“Brexit”), which provides for a transition period during
4
which the rules and regulations of the EU continue to apply to the U.K. until December 31, 2020. The legal deadline for the U.K. and the EU to agree on whether to extend the transition period is currently June 30, 2020. If the transition period ends without the U.K. and the EU agreeing upon the terms of their relationship, such as a free trade arrangement, tariffs and other trade restrictions may come into force immediately, including on the provision of services such as ours.
Because we conduct a substantial level of business throughout Europe where London is our regional hub, the outcome of the negotiations following Brexit may adversely affect our business on various fronts. Currently, our regulated activities in the European region are carried out mainly through Nomura International plc (“NIP”), our broker-dealer arm established in London. NIP currently can provide the entire European Economic Area (“EEA”) cross-border services under the relevant EU single market legislation known as “passporting rights.” If the transition period ends without an agreement between the U.K. and the EU in respect to the continuation of access for financial services, including passporting rights, NIP may lose access to the EEA and, as a result, our revenue and profitability from business in the European region remaining in the NIP legal entity may be adversely affected. This situation would also similarly apply to other group entities operating in the European region.
In order to address the consequences of Brexit, we established a broker-dealer entity, Nomura Financial Products Europe GmbH (“NFPE”) as a licensed broker-dealer in the Federal Republic of Germany. As a German entity, NFPE will continue to hold passporting rights even if the transition period ends with no agreement. However, potential risks are associated with timely migration of European clients to NFPE and ability to provide the same level of service as the NIP entity. In addition as discussed below, a number of uncertainties affecting our business in the European region remain.
For example, agreements between the U.K. and the EU on financial services after the end of the transition period may adversely affect our business in the European region. Moreover, if no agreement is reached, financial stability both in the U.K. and the wider European region may be adversely affected. Any market turmoil and increased volatility may adversely affect our business, with potentially severe liquidity and operational pressures on our financial position, particularly in the short term. Even if the U.K. and the EU agree on extending the transition period to maintain the status quo until a final agreement for the future relationship becomes effective, this may affect the behavior of market participants. For example, market participants may postpone or cancel transactions or other activities that they would otherwise engage in, which may adversely affect our revenues and profitability.
Depending on the content of any future agreement between the U.K. and the EU, the wider financial system and regulatory and supervisory regime in the European region may also be substantially changed, which could adversely affect our business as well. Euro-denominated financial transactions in the market, which are currently centralized in London, in particular may be affected by any regulatory regime emerging after the transition period, in terms of the physical location for financial market infrastructure, liquidity provision and pricing. Operating conditions for financial institutions and financial market infrastructures may also become more stringent for all market participants depending on the content of any such new regulatory or supervisory regime.
These potential changes in the relevant regulatory or supervisory regimes in the wider financial system may accelerate fragmentation of the financial markets and, as a result, we may be adversely affected due to increasing operating costs, which could impact our profitability. Such increased operating costs may result from a number of factors, including the introduction or modification of regulatory requirements such as regulatory capital, liquidity, governance, risk management control and overall entity structure planning.
Overall, the final form that Brexit takes poses a high level of potentially prolonged uncertainties both politically and economically, mainly in the U.K. and the EU. There may also be certain extraterritorial effects in markets outside of the region. These uncertainties, together with other potential developments such as rising trade tensions, may add further downward pressure to the world economic growth and global financial stability
5
and, as a result, we may see lower liquidity in financial markets, an unexpected increase in volatility across various asset classes, higher funding costs, a trend towards increasing risk averseness in investment activities and negative business sentiment, all of which may adversely affect our business.
Our brokerage and asset management revenues may decline
A market downturn could result in a decline in the revenues generated by our brokerage business because of a decline in the volume and value of securities that we broker for our clients. Also, within our asset management business, in most cases, we charge fees and commissions for managing our clients’ portfolios that are based on the market value of their portfolios. A market downturn that reduces the market value of our clients’ portfolios may increase the amount of withdrawals or reduce the amount of new investments in these portfolios, and would reduce the revenue we receive from our asset management business. Also, any changes in our clients’ investment preference on their asset portfolios, including shifting investment assets to stable assets such as deposits and/or passive funds, which bring relatively low commission rates, may reduce our revenue as well.
Our investment banking revenues may decline
Changes in financial or economic conditions would likely affect the number and size of transactions for which we provide securities underwriting, financial advisory and other investment banking services. Our investment banking revenues, which include fees from these services, are directly related to the number and size of the transactions in which we participate and would therefore decrease if there are financial and market changes unfavorable to our investment banking business and our clients.
The
COVID-19
pandemic in 2020 has increased uncertainty in the business environment for investment banking, negatively affecting investment banking revenues. A potential reduction in M&A activities and other investment banking is expected to continue to have negative impact on our revenues in the future.
Our electronic trading business revenues may decline
Electronic trading is essential for our business in order to execute trades faster with fewer resources. Utilizing these systems allows us to provide an efficient execution platform and
on-line
content and tools to our clients via exchanges or other automated trading facilities. Revenue from our electronic trading, which includes trading commissions and
bid-offer
spreads is directly correlated with the number and size of the transactions in which we participate. Competition in electronic trading is intense and the introduction of highly discounted or
no-commission
trades at competitors has and will continue to exert pressure on our electronic and traditional trading revenue. Moreover, such revenue would decrease if there are financial market or economic changes that would cause our clients to trade less frequently or in a smaller amounts. Even if trade volumes increase due to the convenience of electronic trading, this may not be sufficient to offset margin erosion in our execution business, leading to a potential decline in revenue generated from this business. We continue to invest in developing technologies to provide an efficient trading platform; however, we may fail to maximize returns on these investments due to this increased pressure on lowering margins.
We may incur significant losses from our trading and investment activities
We maintain trading and investment positions in fixed income, equity and other markets, both for proprietary purposes and for the purpose of facilitating our clients’ trades. Our positions consist of various types of assets, including securities, derivatives transactions with equity, interest rate, currency, credit and other underliers, as well as loans, and reverse repurchase agreements. Fluctuations in the markets where these assets are traded can adversely affect the value of our positions, in these assets, with downturns potentially negatively affecting long positions and upturns potentially negatively affecting short positions. Although we continue to
6
mitigate these position risks with a variety of hedging techniques, we may also incur losses if the value of these assets fluctuate or if the financial system is overly stressed and the markets move in a way we have not anticipated.
Our businesses have been, and may continue to be, affected by changes in market volatility levels. Certain of our trading businesses such as those engaged in trading and arbitrage opportunities depend on market volatility to generate revenues. Lower volatility may lead to a decrease in business opportunities which may affect the results of operations of these businesses. On the other hand, while higher volatility can increase trading volumes and spreads, it also increases risk as measured by
Value-at-Risk
(“VaR”) and may expose us to higher risks in connection with our market-making and proprietary businesses. Higher volatility can also cause us to reduce the outstanding positions or size of these businesses in order to avoid increasing our VaR.
Furthermore, we commit capital to take relatively large positions for underwriting or warehousing assets to facilitate certain capital market transactions. We also structure and take positions in pilot funds for developing financial investment products and invest seed money to set up and support financial investment products. We may incur significant losses from these positions in the event of significant market fluctuations.
In addition, if we are the party providing collateral in a transaction, significant declines in the value of the collateral or a requirement to provide additional collateral due to a decline in our creditworthiness (by way of a lowered credit rating or otherwise) can increase our costs and reduce our profitability. On the other hand, if we are the party receiving collateral from our clients and counterparties, such declines may also affect our profitability due to decrease in client transactions. Assuming a
one-notch
and
two-notch
downgrade of our credit ratings on March 31, 2020, absent other changes, we estimate that the aggregate fair value of assets required to be posted as additional collateral in connection with our derivative contracts would have been approximately ¥5.5 billion and ¥64.3 billion, respectively.
Transition from LIBOR to alternative rate indices may adversely affect our business
We trade derivatives including interest rate swaps and underwrite bonds and loans which refer to Interbank Offered Rates (“IBORs”) such as the London Interbank Offered Rate (“LIBOR”). Following the LIBOR manipulation scandal in 2012, the Chief Executive of the U.K. Financial Conduct Authority (“FCA”), which regulates LIBOR, announced on July 27, 2017 that FCA will no longer persuade or compel banks to submit rates for the calculation of LIBOR after 2021, and indicated that the continuation of LIBOR cannot and will not be guaranteed after 2021. Since then, the regulators of each country including Japan have expressed their intention to request that financial transactions that refer to LIBOR be converted to alternative rate indices and that measures be taken in preparation for the permanent cessation of LIBOR. So, almost all the transaction agreements which refer to LIBOR are expected to be replaced or to be amended adding “fallback” clause by the end of 2021. But details of calculation methodologies of alternative rate indices are under discussion in each country currently, and such transfers will involve the development of new calculation methods for alternative rates, revisions to relevant contracts and modifications to the application of accounting principles to the relevant transactions. These changes could require us to incur additional costs and subject us to risks associated with systematic reform, operational application and client disclosure, or adversely impact the pricing, volatility and liquidity of financial products including derivatives, bonds and loans which refer IBORs as floating rate. Therefore, our business, financial condition and results of operations could be impacted materially adversely and/or we could be subject to disputes, litigation or other actions with counterparties or relative participants.
We have established a firmwide LIBOR transition program to manage the transition away from these LIBOR. However, the transactions referring to the alternative rate indices are not familiarized and fixed in the market yet since the details of calculation methods are still under discussion, so these developments are the subject of significant uncertainty, and we may not be successful in managing this transition without potentially serious disruption to our business.
7
Holding large and concentrated positions of securities and other assets may expose us to large losses
Holding large and concentrated positions of certain securities can expose us to large losses in our businesses such as market-making, block trading, underwriting, asset securitization, acquiring newly-issued convertible debt securities through third-party allotment or providing business solutions to meet clients’ needs. We have committed substantial amounts of capital to these businesses. This often requires us to take large positions in the securities of a particular issuer or issuers in a particular industry, country or region. We generally have higher exposure to those issuers engaged in financial services businesses, including commercial banks, broker-dealers, clearing houses, exchanges and investment companies. There may also be cases where we hold relatively large amounts of securities by issuers in particular countries or regions due to the business we conduct with our clients or our counterparties. In addition, we may incur losses due to market fluctuations on asset-backed securities such as residential mortgage-backed securities (“RMBS”) and commercial mortgage-backed securities (“CMBS”).
Extended market declines and decreases in market participants can reduce liquidity and lead to material losses
Extended market declines can reduce the level of market activity and the liquidity of the assets traded in those markets in which we operate. Market liquidity may also be affected by decreases in market participants that could occur, for example, if financial institutions scale back market-related businesses due to increasing regulation or other reasons. As a result, it may be difficult for us to sell, hedge or value such assets held. Also, in the event that a market fails in pricing such assets, it will be difficult to estimate their value. If we cannot properly close out or hedge our associated positions in a timely manner or in full, particularly with respect to
Over-The-Counter
(“OTC”) derivatives, we may incur substantial losses. Further, if the liquidity of a market significantly decreases and the market may become unable to price financial instruments held by us, this could lead to unanticipated losses.
While the
COVID-19
pandemic in 2020 and the associated measures taken to prevent its spread led to a rapid contraction of the global economy, our trading business was active due to an increase in client activity driven by volatility in equity markets and interest rates and flight to risk-free assets. However in future, it is unclear how long this trend will continue.
Our hedging strategies may not prevent losses
We use a variety of financial instruments and strategies to hedge our exposure to various types of risk. If our hedging strategies are not effective, we may incur losses. We base many of our hedging strategies on historical trading patterns and correlations. For example, if we hold an asset, we may hedge this position by taking a position in another asset which has, historically, moved in a direction that would offset a change in value of the former asset. However, historical trading patterns and correlations may not continue, as seen in the case of past financial crises, and these hedging strategies may not be fully effective in mitigating our risk exposure because we are exposed to all types of risk in a variety of market environments.
Our risk management policies and procedures may not be fully effective in managing market risk
Our policies and procedures to identify, monitor and manage risks may not be fully effective. Although some of our methods of managing risk are based upon observed historical market data, the future movements in the financial markets may not be the same as was observed in the past. As a result, we may suffer large losses through unexpected future risk exposures. Other risk management methods that we use also rely on our evaluation of information regarding markets, clients or other matters, which is publicly available or otherwise accessible by us. This information may not be accurate, complete,
up-to-date
or properly evaluated, and we may be unable to properly assess our risks, and thereby suffer large losses. Furthermore, certain factors, such as market volatility, may render our risk evaluation model unsuitable for a new market environment. In such event, we may become unable to evaluate or otherwise manage our risks adequately.
8
Market risk may increase other risks that we face
In addition to the potentially adverse effects on our businesses described above, market risk could exacerbate other risks that we face. For example, the risks inherent in financial instruments developed through financial engineering and innovation may be increased by market risk.
Also, if we incur substantial trading losses caused by our exposure to market risk, our need for liquidity could rise sharply while our access to cash may be impaired as a result of market perception of our credit risk.
Furthermore, in a market downturn, our clients and counterparties could incur substantial losses of their own, thereby weakening their financial condition and, as a result, increasing our credit risk to them.
We may have to recognize impairment charges with regard to the amount of goodwill, tangible and intangible assets recognized on our consolidated balance sheets
We have purchased all or a part of the equity interests in, or operations from, certain other companies in order to pursue our business expansion, and expect to continue to do so when and as we deem appropriate. We account for certain of those and similar purchases and acquisitions as a business combination under U.S. GAAP by allocating our acquisition costs to the assets acquired and liabilities assumed and recognizing the remaining amount as goodwill. We also possess tangible and intangible assets other than those stated above.
We may have to recognize impairment charges, as well as other losses associated with subsequent transactions, with regard to the amount of goodwill, tangible and intangible assets and, if recognized, such changes may adversely affect our financial condition and results of operations. For example, during the year ended March 31, 2019, we recognized an impairment loss on goodwill in our Wholesale segment attributable to previous overseas acquisitions of ¥81,372 million.
Liquidity risk could impair our ability to fund operations and jeopardize our financial condition
Liquidity, or having ready access to cash, is essential to our business. We define liquidity risk as the risk of loss arising from difficulty in securing the necessary funding or from a significantly higher cost of funding than normal levels due to deterioration of our creditworthiness or deterioration in market conditions. In addition to maintaining a readily available cash position, we seek to secure ample liquidity through repurchase agreements and securities lending transactions, long-term borrowings and the issuance of long-term debt securities, diversification of our short-term funding sources such as commercial paper, and by holding a portfolio of highly liquid assets. We bear the risk that we may lose liquidity under certain circumstances, including the following:
We may be unable to access unsecured or secured funding
We continuously access unsecured funding from issuance of securities in the short-term credit markets and debt capital markets as well as bank borrowings to finance our
day-to-day
operations, including refinancing. We also enter into repurchase agreements and securities lending transactions to raise secured funding for our trading businesses. An inability to access unsecured or secured funding or funding at significantly higher cost than normal levels could have a substantial negative effect on our liquidity. For example, lenders could refuse to extend the credit necessary for us to conduct our business based on their assessment of our long-term or short-term financial prospects if:
| • | we incur large trading losses, |
| • | the level of our business activity decreases due to a market downturn, |
| • | regulatory authorities take significant action against us, or |
| • | our credit rating is downgraded. |
9
In addition to the above, our ability to borrow in the debt capital markets could also be adversely impacted by factors that are not specific to us, such as reductions in banks’ lending capacity, a severe disruption of the financial and credit markets, negative views about the general prospects for the investment banking, brokerage or financial services industries, or negative market perceptions of Japan’s financial soundness.
We may be unable to sell assets
If we are unable to raise funds or if our liquidity declines significantly, we will need to liquidate assets or take other actions in order to meet our maturing liabilities. In volatile or uncertain market environments, overall market liquidity may decline. In a time of reduced market liquidity, we may be unable to sell some of our assets, or we may have to sell at depressed prices, which could adversely affect our results of operations and financial condition. Our ability to sell assets may also be adversely impacted by other market participants seeking to sell similar assets into the market at the same time.
Lowering of our credit ratings could impact our funding
Our funding depends significantly on our credit ratings. Rating agencies may reduce or withdraw their ratings or place us on “credit watch” with negative implications. Future downgrades could increase our funding costs and limit our funding. This, in turn, could adversely affect our result of operations and our financial condition. In addition, other factors which are not specific to us may impact our funding, such as negative market perceptions of Japan’s financial soundness.
Event risk may cause losses in our trading and investment assets as well as market and liquidity risk
Event risk refers to potential losses we may suffer through unpredictable events that cause large unexpected market price movements such as natural or
man-made
disasters, epidemics, acts of terrorism, armed conflicts or political instability, as well as adverse events specifically affecting our business activities or counterparties. These events include not only significant events such as the Great East Japan Earthquake in March 2011, the increasing tensions on Korean Peninsula following North Korean nuclear tests in 2017, sudden and unexpected developments in global trade or security policies such as tensions between the United States and China in 2018 and 2019, and the
COVID-19
pandemic in 2020 but also more specifically the following types of events that could cause losses in our trading and investment assets:
| • | sudden and significant reductions in credit ratings with regard to financial instruments held by our trading and investment businesses by major rating agencies, |
| • | sudden changes in trading, tax, accounting, regulatory requirements, laws and other related rules which may make our trading strategy obsolete, less competitive or no longer viable, or |
| • | an unexpected failure in a corporate transaction in which we participate resulting in our not receiving the consideration we should have received, as well as bankruptcy, deliberate acts of fraud, and administrative penalty with respect to the issuers of our trading and investment assets. |
We may be exposed to losses when third parties that are indebted to us do not perform their obligations
Our counterparties are from time to time indebted to us as a result of transactions or contracts, including loans, commitments to lend, other contingent liabilities and derivative transactions. We may incur material losses when our counterparties default or fail to perform on their obligations to us due to their filing for bankruptcy, a deterioration in their creditworthiness, lack of liquidity, operational failure, an economic or political event, repudiation of the transaction or for other reasons. In particular, as the effects of the
COVID-19
pandemic, or governmental responses thereto, are felt, we may see an increase in defaults by counterparties. Although we establish and maintain allowances for credit losses, such allowances reflect management judgments and assumptions based on information available to them. For example, our allowances as of March 31, 2020 reflect
10
certain assumptions on short- and long-term effects of the
COVID-19
pandemic on the ability of our counterparties to perform their obligations to us. However, these judgments and assumptions may prove to be incorrect, potentially significantly so.
Credit risk may also arise from:
| • | holding securities issued by third parties, or |
| • | the execution of securities, futures, currency or derivative transactions that fail to settle at the required time due to nondelivery by the counterparty, such as financial institutions and hedge funds which are counterparties to credit default swaps or systems failure by clearing agents, exchanges, clearing houses or other financial infrastructure. |
Issues related to third party credit risk may include the following:
Defaults by a large financial institution could adversely affect the financial markets generally and us specifically
The commercial soundness of many financial institutions is closely interrelated as a result of credit, trading, clearing or other relationships among the institutions. As a result, concern about the creditworthiness of or a default by, a certain financial institution could lead to significant liquidity problems or losses in, or defaults by, other financial institutions. This may adversely affect financial intermediaries, such as clearing agencies, clearing houses, banks, securities firms and exchanges, with which we interact on a daily basis. Actual defaults, increases in perceived default risk and other similar events could arise in the future and could have an adverse effect on the financial markets and on us. Our funding operations may be adversely affected if major financial institutions, Japanese or otherwise, fail or experience severe liquidity or solvency problems.
There can be no assurance as to the accuracy of the information about, or the sufficiency of the collateral we use in managing, our credit risk
We regularly review our credit exposure to specific clients or counterparties and to specific countries and regions that we believe may present credit concerns. Default risk, however, may arise from events or circumstances that are difficult to detect, such as account-rigging and fraud. We may also fail to receive full information with respect to the risks of a counterparty. In addition, in cases where we have extended credit against collateral, we may fall into a deficiency in value in the collateral if sudden declines in market values reduce the value of our collateral.
Our clients and counterparties may be unable to perform their obligations to us as a result of political or economic conditions
Country, regional and political risks are components of credit risk, as well as market risk. Political or economic pressures in a country or region, including those arising from local market disruptions or currency crises, may adversely affect the ability of clients or counterparties located in that country or region to obtain credit or foreign exchange, and therefore to perform their obligations owed to us.
Environmental, Social and Governance (“ESG”) factors including Climate change and broader associated policy changes in each jurisdiction could adversely affect our business
Increasing attention on the management of Environmental, Social and Governance (“ESG”) factors in the business makes it imperative that Nomura continues to develop its policies in these areas, and positions itself in a positive light to its stakeholders including shareholders, customers and broader society. Lack of sufficient focus on ESG considerations may not only impede Nomura’s ability to build a sustainable business model, but may also increase Nomura’s vulnerability to ESG related risks such as risks associated with climate change in the medium- to long-term.
11
The direct impact of climate change, and the resulting changes in the business environment could cause losses to Nomura. The climate change related risk is broadly divided into two parts; Physical Risks and Transition Risks.
| - | Physical Risk: The risk of physical damage or the impairment of the operating capability of the assets of Nomura Group, customers and business partners due to climate change. This includes the potential impact of extreme weather events, fire and sea level flooding. |
| - | Transition Risk: The risks associated with accelerated policy and external changes associated with the move towards addressing Climate Risk. This includes changes in government policies, industrial policy or carbon based taxes, and rapid changes in technologies which have the potential to leave stranded assets that are no longer viable. |
The financial services industry faces intense competition
Our businesses are intensely competitive, and are expected to remain so. We compete on the basis of a number of factors, including transaction execution capability, our products and services, innovation, reputation and price. We have experienced intense price competition, particularly in brokerage, investment banking and other businesses.
Competition with commercial banks, commercial bank-owned securities subsidiaries,
non-Japanese
firms and online securities firms in the Japanese market is increasing
Since the late 1990s, the financial services sector in Japan has undergone deregulation. Banks and certain other financial institutions became able to enter into the securities brokerage business in 2004 and firewalls between commercial banks and securities firms were deregulated in 2009, increasing the ability of securities firms with affiliated commercial banks to cooperate more closely them. As a result, securities subsidiaries of commercial banks and
non-Japanese
firms with increased competitiveness have been affecting our market shares in the sales and trading, investment banking and retail businesses. In recent years, the rise of online securities firms has further intensified the competition. In order to address such changes in the competitive landscape, we have taken certain measures, including the establishment of a business alliance with a social networking and messaging service provider. However, these measures may not be successful in growing or maintaining our market share in this increasingly fierce competitive environment, and we may lose business or transactions to our competitors, harming our business and results of operations.
Increased consolidation, business alliance and cooperation in the financial services groups industry mean increased competition for us
There has been substantial consolidation and convergence among companies in the financial services industry. In particular, a number of large commercial banks and other broad-based large financial services groups have established or acquired broker-dealers or have consolidated with other financial institutions. Recently, these large financial services groups have been further developing business linkage within their respective groups in order to provide comprehensive financial services to clients. These financial services groups continue to offer a wide range of products, including loans, deposit-taking, insurance, brokerage, asset management and investment banking services within their group, which may enhance their competitive position compared with us. They also have the ability to supplement their investment banking and brokerage businesses with commercial banking and other financial services revenues in an effort to gain market share. In addition, the financial services industry has seen collaboration beyond the borders of businesses and industries, such as alliances between commercial banks and securities companies outside of framework of existing corporate groups and recent alliances with
non-financial
companies including emerging companies. Our competitiveness may be adversely affected if our competitors are able to expand their businesses and improve their profitability through such business alliances.
12
Our global business strategies have not resulted in the anticipated outcome to date, and we may not be able to successfully rebuild them
We continue to believe there are significant opportunities in the international markets, but there is also significant competition associated with such opportunities. In order to take advantage of these opportunities, we will have to compete successfully with financial services firms based in important
non-Japanese
markets, including the U.S., Europe and Asia. For example, as a means to bolster our international operations, we acquired certain Lehman Brothers operations in Europe, the Middle East and Asia in 2008 After the acquisition, however, market structures have changed drastically due to the scaling back of market-related businesses by European financial institutions and the monetary easing policies by European central banks, resulting in decline in whole market liquidity. Although we endeavored to reallocate our management resources to optimize our global operations and thereby improve our profitability, due in part to the challenging environment facing these businesses, we recognized an impairment loss of ¥81,372 million in the fiscal year ended March 31, 2019.
Accordingly, since April 2019, we have been working to rebuild our global business platform, under which we aim to simplify our operating model, transform our business portfolio and pivot towards client businesses and growth areas. However, we may be unable to successfully execute this strategy. Even if we are able to successfully execute this strategy, we may be required to incur greater expenses than expected, or to commit greater financial, management and other resources to this strategy than expected, which could adversely affect our business and results of operations. Moreover, the assumptions and expectations upon which this strategy is based may not be correct, which could lead to us realizing fewer benefits than expected or could even harm our business and results of operations overall. For example, we may not correctly select business lines to streamline, which could lead to us missing or otherwise being unable to take advantage of a potential opportunity. Furthermore, to the extent we reduce compensation or headcount as part of this strategy, our ability to attract and retain the employees needed to successfully run our businesses could be adversely affected. We may also be unsuccessful in designing a streamlined management structure, which could harm our ability to properly control or supervise our many businesses across the world.
Misconduct or fraud by an employee, director or officer, or any third party, could occur, and our reputation in the market and our relationships with clients could be harmed
We face the risk that our employees, directors or officers, or any third party, could engage in misconduct that may adversely affect our business. Misconduct by an employee, director or officer includes conduct such as entering into transactions in excess of authorized limits, acceptance of risks that exceed our limits, or concealment of unauthorized or unsuccessful activities. The misconduct could also involve the improper use or disclosure of
non-public
information relating to us or our clients , such as insider trading and the recommendation of trades based on such information, as well as other crimes, which could result in regulatory sanctions, legal liability and serious reputational or financial damage to us.
For example, on March 5, 2019, a researcher at Nomura Research Institute, Ltd. (“NRI”), our equity-method affiliate, revealed information that there was a high possibility that the standard for designating the top market of the Tokyo Stock Exchange (the “TSE”) would fall to ¥25 billion, which had been under review at the TSE, to a chief strategist (the “NSC Strategist”) in the research division of Nomura Securities Co., Ltd. (“NSC”). The researcher at NRI was a member of the Advisory Group to Review the TSE Equity Market Structure and received this information in such capacity. On the same day and the next day, the NSC Strategist communicated the information to certain people including members of Japanese stock sales team of NSC and Nomura International (Hong Kong) Limited, some of whom provided the information to their institutional investor clients. Although the provision of the information did not represent a violation of law, they were inappropriate conducts and impaired the implicit trust placed in us and our employees by other market participants. Following a special internal investigation conducted by external experts, on May 24, 2019, we announced a remediation plan and the reduction of compensation of certain of our executives and those of NSC. On May 28, 2019, the FSA issued a business improvement order to us and to NSC, requiring us to clarify responsibility for this
13
incident, develop and submit a detailed improvement plan, and report periodically on the implementation and effectiveness of measures for improvement, and on August 28, 2019, a fine of ¥10 million was imposed by Tokyo Stock Exchange, Inc. as a penalty.
Although we have taken measures in line with the improvement plan to detect and prevent such misconduct in the future, including the establishment of the “Nomura Group Code of Conduct” on December 3, 2019, including ensuring its thorough dissemination throughout the group and ensuring thorough compliance with its terms, the measures we have implemented or may implement may not be effective in all cases, and we may not always be able to detect or deter misconduct by an employee, director or officer. If any administrative or judicial sanction is issued against us as a result of such misconduct, we may lose business opportunities for a period of time, even after the sanction is lifted, if and to the extent that our clients, especially public institutions, decide not to engage us for their financial transactions.
Third parties may also engage in fraudulent activities, including devising a fraudulent scheme to induce our investment, loans, guarantee or any other form of financial commitment, both direct and indirect. Because of the broad range of businesses that we engage in and the large number of third parties with whom we deal in our
day-to-day
business operations, such fraud or any other misconduct may be difficult to prevent or detect.
We may not be able to recover the financial losses caused by such activities and our reputation may also be damaged by such activities.
A failure to identify and appropriately address conflicts of interest could adversely affect our business
We are a global financial institution that provides a wide range of products and services to a diverse group of clients, including individuals, corporations, other financial institutions and governmental institutions. As such, we face potential conflicts of interest in the ordinary course of our business. Conflicts of interests can arise when our services to a particular client conflict or compete, or are perceived to conflict or compete, with our own interests. In addition, where
non-public
information is not appropriately restricted or shared within the firm, conflicts of interest can also arise where a transaction within the Nomura Group and or a transaction with another client conflict or compete, or is perceived to conflict or compete, with a transaction with a particular client. While we have extensive internal procedures and controls designed to identify and address conflicts of interest on the basis of the Nomura Group Conflicts of Interest Management Policy, a failure, or a perceived failure, to identify, disclose and appropriately address such conflicts could adversely affect our reputation and the willingness of current or potential clients to do business with us. In addition, conflicts of interest could give rise to regulatory actions or litigation.
Our business is subject to substantial legal, regulatory and reputational risks
Substantial legal liability or a significant regulatory action against us could have a material financial effect on us or cause reputational harm to us, which in turn could adversely affect our business prospects, financial condition and results of operations. Also, material changes in regulations applicable to us or to the markets in which we operate could adversely affect our business. See Note 21
in our consolidated financial statements included in this annual report for further information regarding the significant investigations, lawsuits and other legal proceedings that we are currently facing.
“Commitments, contingencies and guarantees”
Our exposure to legal liability is significant
We face significant legal risks in our businesses. These risks include liability under securities or other laws in connection with securities underwriting and offering transactions, liability arising from the purchase or sale of any securities or other financial products, disputes over the terms and conditions of complex trading arrangements or the validity of contracts for our transactions, disputes with our business alliance partners and legal claims concerning our other businesses.
14
During a prolonged market downturn or upon the occurrence of an event that adversely affects the market, we would expect claims against us to increase. We may also face significant litigation. The cost of defending such litigation may be substantial and our involvement in litigation may damage our reputation. In addition, even legal transactions might be subject to adverse public reaction according to the particular details of such transactions. These risks may be difficult to assess or quantify and their existence and magnitude may remain unknown for substantial periods of time.
Extensive regulation of our businesses limits our activities and may subject us to significant penalties and losses
The financial services industry is subject to extensive regulation. We are subject to increasing regulation by governmental and self-regulatory organizations in Japan and in virtually all other jurisdictions in which we operate, and such governmental and regulatory scrutiny may increase as our operations expand or as laws change. In addition, while regulatory complexities increase, possibilities of extra-territorial application of a regulation in one jurisdiction to business activities outside of such jurisdiction may also increase. These regulations are broadly designed to ensure the stability of financial systems and the integrity of the financial markets and financial institutions, and to protect clients and other third parties who deal with us, and often limit our activities and/or affect our profitability, through net capital, client protection and market conduct requirements. In addition, on top of traditional finance-related legislation, the scope of laws and regulations applying to, and/or impacting on, our operations may become wider depending on the situation of the wider international political and economic environment or policy approaches taken by governmental authorities in respect of regulatory application or law enforcement. In particular, the number of investigations and proceedings against the financial services industry by governmental and self-regulatory organizations has increased substantially and the consequences of such investigations and proceedings have become more severe in recent years, and we are subject to face the risk of such investigations and proceedings. For example, the U.S. Department of Justice (the “DOJ”) conducted an investigation regarding residential mortgage-backed securities securitized by some of our U.S. subsidiaries prior to 2009. On October 15, 2018, the U.S. subsidiaries settled the investigation with the DOJ and agreed to pay USD 480 million. Although we have policies in place to prevent violations of such laws and regulations, we may not always be able to prevent violations, and we could be fined, prohibited from engaging in some of our business activities, ordered to improve our internal governance procedures or be subject to revocation of our license to conduct business. Our reputation could also suffer from the adverse publicity that any administrative or judicial sanction against us may create, which may negatively affect our business opportunities and ability to secure human resources. As a result of any such sanction, we may lose business opportunities for a period of time, even after the sanction is lifted, if and to the extent that our clients, especially public institutions, decide not to engage us for their financial transactions. In addition, certain market participants may refrain from investing in or entering into transactions with us if we engage in business activities in regions subject to international sanctions, even if our activities do not constitute violations of sanctions laws and regulations.
Tightening of regulations applicable to the financial system and financial industry could adversely affect our business, financial condition and results of operations
If regulations that apply to our businesses are introduced, modified or removed, we could be adversely affected directly or through resulting changes in market conditions. The impact of such developments could make it economically unreasonable for us to continue to conduct all or certain of our businesses, or could cause us to incur significant costs to adjust to such changes.
Furthermore, the exact details of the implementation of proposals for regulatory change and its impact on us will depend on the final regulations as they become ultimately adopted by various governmental agencies and oversight boards. See Item 4.B “
” in this annual report for more information about such regulations.
Business Overview—Regulation
15
New regulations or revisions to existing regulations relating to accounting standards, regulatory capital adequacy ratios, liquidity ratios and leverage ratios applicable to us could also have a material adverse effect on our business, financial condition and results of operations. Such new regulations or revisions to existing regulations include the
so-called
Basel III package formulated by the Basel Committee on Banking Supervision (“Basel Committee”) and the finalized Basel III reforms published in December 2017. Furthermore, in October 2012, the Basel Committee developed and published a set of principles on the assessment methodology and higher loss absorbency requirements for domestic systemically important banks
(“D-SIBs”),
and, in December 2015, the FSA identified us as a
D-SIB
and imposed a surcharge of 0.5% on our required capital ratio after March 2016 with
3-year
transitional arrangement. In addition, FSB published the final standard requiring global systemically important banks
(“G-SIBs”)
to maintain a certain level of total loss-absorbing capacity (“TLAC”) upon their failure in November 2015. Under the FSA’s policy implementing the TLAC framework in Japan as updated in April 2018, the TLAC requirements in Japan apply not only to Japanese
G-SIBs
but also to Japanese
D-SIBs
that are deemed (i) of particular need for a cross-border resolution arrangement and (ii) of particular systemic significance to Japanese financial system if they fail. Based on the revised policy, in March 2019, the FSA published the notices and guidelines of TLAC regulations in Japan. According to these notices and guidelines, Nomura will be subject to the TLAC requirements in Japan from March 31, 2021 although Nomura is not identified as a
G-SIB
as of the date of this annual report. These changes in regulations may increase our funding costs or require us to liquidate financial instruments and other assets, raise additional capital or otherwise restrict our business activities in a manner that could adversely affect our operating or financing activities or the interests of our shareholders.
Deferred tax assets may be impacted due to a change in business condition or in laws and regulations, resulting in an adverse effect on our operating results and financial condition
We recognize deferred tax assets in our consolidated balance sheets as a possible benefit of tax relief in the future. If we experience or forecast future operating losses, if tax laws or enacted tax rates in the relevant tax jurisdictions in which we operate change, or if there is a change in accounting standards in the future, we may reduce the deferred tax assets recognized in our consolidated balance sheets. As a result, it could adversely affect our financial condition and results of operations. See Note 16
in our consolidated financial statements included in this annual report for further information regarding the deferred tax assets that we currently recognize.
“Income taxes”
Unauthorized disclosure or misuse of personal information held by us may adversely affect our business
We keep and manage personal information obtained from clients in connection with our business. In recent years, there have been many reported cases of personal information and records in the possession of corporations and institutions being improperly accessed disclosed or misused.
Although we exercise care to protect the confidentiality of personal information and have in place policies and procedures designed to safeguard such information and ensure that it is used in compliance with applicable laws, rules and regulations, were any unauthorized disclosure or misuse of personal information to occur, our business could be adversely affected. For example, we could be subject to government actions such as administrative actions or penalties in case there is any violation of applicable personal data protection laws, rules and regulations or be subject to complaints and lawsuits for damages from clients if they are adversely affected due to the unauthorized disclosure or misuse of their personal information (including leakage of such information by an external service provider). In addition, we could incur additional expenses associated with changing our security systems, either voluntarily or in response to administrative guidance or other regulatory initiatives. Moreover, restrictions on our ability to use personal information collected from clients may adversely affect our existing businesses or to develop new ones. Furthermore, any damage to our reputation caused by such unauthorized disclosure or misuse could lead to a decline in new clients and/or a loss of existing clients, as well as to increased costs and expenses incurred for public relations campaigns designed to prevent or mitigate damage to our corporate or brand image or reputation.
16
System failure, the information leakage and the cost of maintaining sufficient cybersecurity could adversely affect our business
Our businesses rely on secure processing, storage, transmission and reception of personal, confidential and proprietary information on our systems. We have been in the past and may again become the target of attempted unauthorized access, computer viruses or malware, and other cyber-attacks designed to access and obtain information on our systems or to disrupt and cause other damage to our services. For example, in June 2018, one of our foreign subsidiaries experienced a spear phishing incident that resulted in the unauthorized access to the firm’s desktop network, requiring us to immediately launch an internal investigation to assess and remediate the incident, notify the appropriate authorities of its occurrence and communicate with clients and other individuals whose data may have been impacted. In response to the
COVID-19
pandemic, many of our employees now work remotely using networking or other technologies, and these technologies have become even more critical to our business. The implementation of remote work arrangements may also increase the possibility that we will be subject to cyber-attacks and other information security breaches. Although these threats may originate from human error or technological failure, they may also originate from the malice or fraud of internal parties, such as employees, or third parties, including foreign
non-state
actors and extremist parties. Additionally, we could also be adversely impacted if any of the third-party vendors, exchanges, clearing houses or other financial institutions to whom we are interconnected are subject to cyber-attacks or other informational security breaches. Such events could cause interruptions to our systems, reputational damage, client dissatisfaction, legal liability, enforcement actions or additional costs, any and all of which could adversely affect our financial condition and operations.
While we continue to devote significant resources to monitor and update our systems and implement information security measures to protect our systems, there can be no assurance that any controls and procedures we have in place will be sufficient to protect us from future security breaches. As cyber threats are continually evolving, our controls and procedures may become inadequate and we may be required to devote additional resources to modify or enhance our systems in the future.
Natural disaster, terrorism, military dispute and infectious disease could adversely affect our business
We have developed a contingency plan for addressing unexpected situations. However, disaster, terrorism, military dispute or infectious disease afflicting our management and employees could exceed the assumptions of our plan, and could adversely affect our business. For example,
COVID-19
has spread globally in 2020 and was declared a pandemic by the World Health Organization. The
COVID-19
pandemic has led to successive widespread lockdowns,
shelter-in-place
orders and similar government action worldwide, including Japan, Europe, America and elsewhere. In response to the spread and lockdowns, we have activated contingency plans across global locations, and developed our capabilities for a remote working environment. In turn this increases potential unforeseen risk related to remote working including challenges in supervision. The continuation of such measures, even if limited to certain regions, will continue to impact societal and economic functions, which has and is expected to continue to adversely affect our business and results of operations.
The Company is a holding company and depends on payments from subsidiaries
The Company heavily depends on dividends, distributions and other payments from subsidiaries to make payments on the Company’s obligations. Regulatory and other legal restrictions, such as those under the Companies Act, may limit the Company’s ability to transfer funds freely, either to or from the Company’s subsidiaries. In particular, many of the Company’s subsidiaries, including the Company’s broker-dealer subsidiaries, are subject to laws and regulations, including regulatory capital requirements, that authorize regulatory bodies to block or reduce the flow of funds to the parent holding company, or that prohibit such transfers altogether in certain circumstances. For example, NSC, Nomura Securities International, Inc., Nomura International plc and Nomura International (Hong Kong) Limited, our main broker-dealer subsidiaries, are subject to regulatory capital requirements that could limit the transfer of funds to the Company. These laws and regulations may hinder the Company’s ability to access funds needed to make payments on the Company’s obligations.
17
We may not be able to realize gains we expect, and may even suffer losses, on our investments in equity securities and
non-trading
debt securities
We hold substantial investments in equity securities including private equity investments and
non-trading
debt securities. Under U.S. GAAP, depending on market conditions, we may recognize significant unrealized gains or losses on our investments in equity securities and debt securities, which could have an adverse impact on our financial condition and results of operations. For example, in the fiscal year ended March 31, 2020, we recognized a loss of ¥ 16.4 billion related to our investment in American Century Investments and ¥ 16.6 billion on our investments in equity securities resulting from market declines arising from the
COVID-19
pandemic. Depending on the market conditions, we may also not be able to dispose of these equity securities and debt securities when we would like to do so, as quickly as we may wish or at the desired price.
Equity investments in affiliates and other investees accounted for under the equity method in our consolidated financial statements may decline significantly over a period of time and result in us incurring impairment losses
We have affiliates and investees accounted for under the equity method in our consolidated financial statements and whose shares are publicly traded. Under U.S. GAAP, if there is a decline in the fair value, i.e., the market price, of the shares we hold in such affiliates over a period of time, and we determine that the decline is other-than-temporary, then we recognize an impairment loss for the applicable fiscal period which may have an adverse effect on our financial condition and results of operations.
We may face an outflow of clients’ assets due to losses of cash reserve funds or debt securities we offer
We offer many types of products to meet various needs of our clients with different risk profiles.
Cash reserve funds, such as money market funds and money reserve funds are categorized as low risk financial products. As a result of a sudden rise in interest rates, such cash reserve funds may fall below par value due to losses resulting from price decreases of debt securities in the portfolio, defaults of debt securities in the portfolio or charges of negative interest. If we determine that a stable return cannot be achieved from the investment performance of cash reserve funds, we may accelerate the redemption of, or impose a deposit limit on, such cash reserve funds. For example, Nomura Asset Management Co., Ltd., the Company’s subsidiary, ended its operation of money market funds in late August 2016 and executed an accelerated redemption of such funds in September 2016.
In addition, debt securities that we offer may default or experience delays in the payment of interest and/or principal.
Such losses, early redemption or deposit limit for the products we offer may result in the loss of client confidence and lead to an outflow of client assets from our custody or preclude us from increasing such client assets.
Because of daily price range limitations under Japanese stock exchange rules, you may not be able to sell your shares of the Company’s common stock at a particular price on any particular trading day, or at all
Stock prices on Japanese stock exchanges are determined on a real-time basis by the equilibrium between bids and offers. These exchanges are order-driven markets without specialists or market makers to guide price formation. For the purpose of protecting investors from excessive volatility, these exchanges set daily upward and downward price fluctuation limits for each stock, based on the previous day’s closing price. Although transactions may continue at the upward or downward limit price if the limit price is reached on a particular trading day, no transactions may take place outside these limits. Consequently, an investor wishing to sell at a price above or below the relevant daily limit may not be able to sell his or her shares at such price on a particular trading day, or at all.
18
Under Japan’s unit share system, holders of the Company’s shares constituting less than one unit are subject to transfer, voting and other restrictions
The Company’s Articles of Incorporation, as permitted under the Companies Act, provide that 100 shares of the Company’s stock constitute one “unit.” The Companies Act imposes significant restrictions and limitations on holdings of shares that constitute less than a whole unit. Holders of shares constituting less than one unit do not have the right to vote or any other rights relating to voting. Under the unit share system, any holders of shares constituting less than a unit may at any time request the Company to purchase their shares. Also, holders of shares constituting less than a unit may request the Company to sell them such number of shares that the Company may have as may be necessary to raise such holder’s share ownership to a whole unit. Shares constituting less than a unit are transferable under the Companies Act, but may not be traded on any Japanese stock exchange.
As a holder of ADSs, you will have fewer rights than a shareholder has and you will have to act through the depositary to exercise these rights
The rights of shareholders under Japanese law to take actions including voting their shares, receiving dividends and distributions, bringing derivative actions, examining the company’s accounting books and records and exercising appraisal rights are available only to holders of record. Because the depositary, through its custodian agent, is the record holder of the shares underlying the ADSs, only the depositary can exercise those rights in connection with the deposited shares. The depositary will make efforts to vote the shares underlying your ADSs as instructed by you and will pay you the dividends and distributions collected from the Company. However, in your capacity as an ADS holder, you will not be able to bring a derivative action, examine the Company’s accounting books or records or exercise appraisal rights except through the depositary.
Rights of shareholders under Japanese law may be more limited than under the laws of other jurisdictions
The Companies Act and the Company’s Articles of Incorporation and Regulations of the Board of Directors govern the Company’s corporate affairs. Legal principles relating to such matters as the validity of corporate procedures, directors’ and executive officers’ fiduciary duties and shareholders’ rights may be different from those that would apply to a
non-Japanese
company. Shareholders’ rights under Japanese law may not be as extensive as shareholders’ rights under the laws of other jurisdictions, including jurisdictions within the U.S. You may have more difficulty in asserting your rights as a shareholder than you would as a shareholder of a corporation organized in another jurisdiction.
The Company’s shareholders of record on a record date may not receive the dividend they anticipate
The customary dividend payout practice of publicly listed companies in Japan may significantly differ from that widely followed or otherwise deemed necessary or fair in foreign markets. The Company’s dividend payout practice is no exception. The Company ultimately determines whether the Company will make any dividend payment to shareholders of record as of a record date and such determination is made only after such record date. For the foregoing reasons, the Company’s shareholders of record as of a record date may not receive the dividends they anticipate. Furthermore, the Company does not announce any dividend forecasts.
It may not be possible for investors to secure personal jurisdiction within the U.S. over the Company or the Company’s directors or executive officers, or to enforce against the Company or those persons judgments obtained in U.S. courts predicated upon the civil liability provisions of the federal securities laws of the U.S.
The Company is a limited liability, joint-stock corporation incorporated under the laws of Japan. Most of the Company’s directors and executive officers reside in Japan. Many of the Company’s assets and the assets of these persons are located in Japan and elsewhere outside the U.S. It may not be possible, therefore, for U.S.
19
investors to obtain personal jurisdiction over the Company or these persons within the U.S. or to enforce against the Company or these persons judgments obtained in U.S. courts predicated upon the civil liability provisions of the federal securities laws of the U.S. The Company believes that there is doubt as to the enforceability in Japan, in original actions or in actions for enforcement of U.S. court judgments, of liabilities predicated solely upon the federal securities laws of the U.S.
Special Note Regarding Forward-looking Statements
This annual report contains forward-looking statements that are based on our current expectations, assumptions, estimates and projections about our business, our industry and capital markets around the world. These forward-looking statements are subject to various risks and uncertainties. Generally, these forward-looking statements can be identified by the use of forward-looking terminology such as “may”, “will”, “expect”, “anticipate”, “estimate”, “plan” or similar words. These statements discuss future expectations, identify strategies, contain projections of our results of operations or financial condition, or state other forward-looking information.
Known and unknown risks including the
COVID-19
pandemic, uncertainties and other factors may cause our actual results, performance, achievements or financial position to differ materially from any future results, performance, achievements or financial position expressed or implied by any forward-looking statement contained in this annual report. Such risks, uncertainties and other factors are set forth in this Item 3.D and elsewhere in this annual report.
Item 4. Information on the Company
A. History and Development of the Company.
The Company (previously known as The Nomura Securities Co., Ltd.) was incorporated in Japan on December 25, 1925 under the Commercial Code of Japan when the securities division of The Osaka Nomura Bank, Ltd. became a separate entity specializing in the trading and distribution of debt securities in Japan. The Company was the first Japanese securities company to develop its business internationally with the opening in 1927 of a representative office in New York. In Japan, we broadened the scope of our business when we began trading in equity securities in 1938 and when we organized the first investment trust in Japan in 1941.
Since the end of World War II, we have played a leading role in most major developments in the Japanese securities market. These developments include the resumption of the investment trust business in the 1950s, the introduction of public stock offerings by Japanese companies in the 1960s, the development of the
over-the-counter
bond market in the 1970s, the introduction of new types of investment trusts such as the medium-term Japanese government bond investment trust in the 1980s, and the growth of the corporate bond and initial public offering markets in the 1990s.
Our expansion overseas accelerated in 1967, when the Company acquired a controlling interest in Nomura International (Hong Kong) Limited for the purpose of conducting broker-dealer activities in the Hong Kong capital markets. Subsequently, we established a number of other overseas subsidiaries, including Nomura Securities International, Inc. in the U.S. in 1969 as a broker-dealer and Nomura International Limited, now Nomura International plc, in the U.K. in 1981, which acts as an underwriter and a broker, as well as other overseas affiliates, branches and representative offices.
On October 1, 2001, we adopted a holding company structure. In connection with this reorganization, the Company changed its name from “The Nomura Securities Co., Ltd.” to “Nomura Holdings, Inc.” The Company continues to be listed on the Tokyo Stock Exchange and other stock exchanges. A wholly-owned subsidiary of the Company assumed the Company’s securities businesses and was named “Nomura Securities Co., Ltd.”
The Company has proactively engaged in establishing a governance framework to ensure transparency in the Company’s management. Among other endeavors, when the Company adopted a holding company structure
20
and was listed on the New York Stock Exchange (“NYSE”) in 2001, the Company installed Outside Directors. In addition, in June 2003, the Company further strengthened and increased the transparency of the Company’s oversight functions by adopting the Company with Three Board Committees (previously known as the Committee System), a system in which management oversight and business execution functions are clearly separated.
In 2008, to pave the way for future growth, the Company acquired and integrated the operations of Lehman Brothers in Asia Pacific, Europe and the Middle East.
The address of the Company’s registered office is
9-1,
Nihonbashi
1-chome,
Chuo-ku,
Tokyo
103-8645,
Japan, telephone number:
+81-3-5255-1000.
The SEC maintains an internet site that contains reports, proxy and information statements, and other information regarding issuers that file electronically with the SEC at https://www.sec.gov. Our corporate website is https://www.nomuraholdings.com.
B. Business Overview.
Overview
We are one of the leading financial services groups in Japan and we operate offices in countries and regions worldwide including Japan, the U.S., the U.K., Singapore and Hong Kong Special Administrative Region (“Hong Kong”) through our subsidiaries.
Our clients include individuals, corporations, financial institutions, governments and governmental agencies.
Our business consists of Retail, Asset Management, Wholesale and Merchant Banking which are described in further detail below. See also Note 22 “
” in our consolidated financial statements included in this annual report.
Segment and geographic information
Corporate Goals and Principles
The Nomura Group’s management vision is to enhance its corporate value by deepening society’s trust in the firm and increasing satisfaction of stakeholders, including that of shareholders and clients.
As a global investment bank, the Company will provide high value-added solutions to clients globally, and recognizing its wider social responsibility, the Company will continue to contribute to the economic growth and development of society.
To enhance its corporate value, the Company places significance on return on equity (“ROE”) and will strive for sustainable business transformation.
Our Business Divisions
Retail
In our Retail Division, we conduct business activities by delivering a wide range of financial products and high quality investment services mainly for individuals and corporations in Japan primarily through a network of nationwide branches of Nomura Securities Co., Ltd. (“NSC”). The total number of local branches, including our head office, was 128 as of the end of March 2020. We offer investment consultation services to meet the medium and long-term needs of our clients. We discuss retail client assets in “
” under Item 5.A of this annual report.
Retail Client Assets
21
We continue to focus on delivering
top-quality
solutions including our broad range of products and services through
face-to-face
meetings, online and call center channels, so that Nomura Group can sustainably be a trusted partner to our clients.
Asset Management
Our Asset Management Division which is led by its core entity, Nomura Asset Management Co., Ltd. (“NAM”), employs approximately 1,400 professionals in various countries and regions around the world, including Japan with ¥49.3 trillion total assets under management as of March 31, 2020.
We are committed to providing high-quality investment strategies, products and services to a wide range of investors. Along with delivering investment trusts for individual investors through financial institutions in Japan, we provide various investment solutions to pension funds and institutional investors globally.
As an asset management firm practicing responsible investment, by accurately identifying the diverse investment needs of clients around the world, we aim to deliver not only superior investment returns, but to contribute to the growth and development of capital markets through stewardship activities, including dialogue with the companies in which we invest.
Wholesale
The Wholesale Division consists of Global Markets and Investment Banking, providing our corporate and institutional clients with timely, high value-adding products and services tailored to their needs across primary and secondary markets.
Global Markets
Global Markets provides research, sales, trading, agency execution, and market-making of fixed income and equity-related products.
Our global fixed income offerings include, among other products, government securities, interest rate derivatives, investment-grade and high-yield corporate debt securities, credit derivatives,
G-10
and emerging markets foreign exchange, asset-backed securities and mortgage-related products, in
over-the-counter
(“OTC”) and listed markets. We are primary dealers in the Japanese government securities market as well as in the Asian, European and U.S. markets.
Our global equity-related products include equity securities, Exchange Traded Funds (“ETFs”), convertible securities, listed and OTC equity derivatives, and prime services. In addition, we offer execution services based on cutting-edge electronic trading technology to help clients navigate through the complex market structure and achieve best execution. In order to provide extensive market access to our clients, we are also a member of various exchanges around the world, with leading positions on Tokyo Stock Exchange.
These product offerings are underpinned by electronic/digital technology, and our global structuring and quants function which provide tailored ideas and trading strategies for our institutional and corporate clients as well as our retail franchise.
Investment Banking
We offer a broad range of investment banking services to a diverse range of corporations, financial institutions, sovereigns, financial sponsors and others. We aim to establish and cultivate strong, long-term relationships with our clients by providing them with our extensive resources for each bespoke solution.
22
Underwriting.
Financial Advisory & Solutions Services.
On April 1, 2020, we completed the acquisition of Greentech Capital, LLC, an M&A boutique that is strong in sustainable technology and infrastructure. We will contribute to the realization of a sustainable society through synergy with the franchise.
Merchant Banking
Our Merchant Banking Division have embarked on principal business to primarily provide equity to transactions such as business reorganization and revitalization, business succession as well as management buyout. We will, under proper management of risk, focus on support for improving the enterprise value of portfolio companies, and will contribute to expansion of the private equity market.
Our Research Activities
We have an extensive network of intellectual capital with key research offices in Tokyo, Hong Kong and other major markets in the Asia-Pacific region, as well as in London and New York. Nomura is recognized as a leading content provider with an integrated global approach to providing capital markets research. Our analysts collaborate closely across regions and disciplines to track changes and spot future trends in politics, economics, foreign exchange, interest rates, equities, and credit, and also provide quantitative analysis.
Our Information Technology
We believe that information technology is one of the key success factors for our overall business and intend to maintain and enhance our solid technology platform to ensure that the Nomura Group is able to fulfill and exceed the various needs of our clients. Accordingly, we will continue to invest, enhance and adapt our technology platform to ensure it remains suitable for each division proactively seek and implement innovative financial technology to improve the operations of our business.
In our Retail Division, we continually invest and enhance our core system and related systems to improve efficiency on business operation. We are also continuously working on improving our internet-based and smartphone platforms.
In our Wholesale Division, we continually invest and enhance our technology platforms to provide better risk management, improved data governance and also to increase trading capabilities through platforms allowing direct market access and algorithmic trading. In order to ensure the support level of Wholesale operations, we will continue to maintain utilization of our offshore service entities in India and enhance our regional support based capabilities.
Competition
The financial services industry is intensely competitive and we expect it to continue remain so. We compete globally with other brokers and dealers, investment banking firms, commercial banks, investment advisors and
23
other financial services firms. We also face competition on regional, product and niche bases from local and specialist firms. A number of factors determine our competitive position against other firms, including:
| • | the quality, range and prices of our products and services, |
| • | our ability to originate and develop innovative client solutions, |
| • | our ability to maintain and develop client relationships, |
| • | our ability to access and commit capital resources, |
| • | our ability to retain and attract qualified employees, and |
| • | our general reputation. |
Our competitive position is also affected by the overall condition of the global financial markets, which are influenced by factors such as:
| • | the monetary and fiscal policies of national governments and international economic organizations, and |
| • | economic, political and social developments both within and between Japan, the U.S., Europe and other major industrialized and developing countries and regions, such as the COVID-19 pandemic in 2020. |
In Japan, we compete with other Japanese and
non-Japanese
securities companies and other financial institutions. Competition has become more intense due to deregulation in the Japanese financial industry since the late 1990s and the increased presence of global securities companies and other financial institutions. In particular, major global firms have increased their presence in securities underwriting, corporate advisory services (particularly, mergers and acquisitions advisory) and secondary securities sales and trading.
There has also been substantial consolidation and convergence among financial institutions, both within Japan and globally and this trend accelerated further in recent years as the credit crisis caused mergers and acquisitions and asset acquisitions in the industry. The growing presence and scale of financial groups which encompass commercial banking, securities brokerage, investment banking and other financial services has led to increased competition. Through their broadened offerings, these firms are able to create good client relationships and leverage their existing client base in the brokerage and investment banking business as well.
In addition to the breadth of their products and services, these firms have the ability to pursue greater market share in investment banking and securities products by reducing margins and relying on their commercial banking, asset management, insurance and other financial services activities. This has resulted in pricing pressure in our investment banking and trading businesses and could result in pricing pressure in other areas of our businesses. We have also competed, and expect to compete, with other financial institutions which commit capital to businesses or transactions for market share in investment banking activities. In particular, corporate clients may seek loans or commitments in connection with investment banking mandates and other assignments.
Moreover, the trend toward consolidation and convergence has significantly increased the capital base and geographic reach of some of our competitors, hastening the globalization of the securities and financial services markets. To accommodate this trend, we will have to compete successfully with financial institutions that are large and well-capitalized, and that may have a stronger local presence and longer operating history outside Japan.
Regulation
Japan
Regulation of the Securities Industry and Securities Companies
24
its authority to the Commissioner of the FSA. The Company, as a holding company of a securities company, as well as subsidiaries such as NSC and Nomura Financial Products & Services, Inc. (“NFPS”), are subject to such supervision and regulation by the FSA. The Commissioner of the FSA delegates certain authority to the Director General of Local Finance Bureaus to inspect local securities companies and branches. Furthermore, the Securities and Exchange Surveillance Commission, an external agency of the FSA which is independent from the Agency’s other bureaus, is vested with authority to conduct
day-to-day
monitoring of the securities markets and to investigate irregular activities that hinder the fair trading of securities, including inspection of securities companies. Securities companies are also subject to the rules and regulations of the Japanese stock exchanges and the Japan Securities Dealers Association, a self-regulatory organization of the securities industry.
To enhance investor protection, each Japanese securities company is required to segregate client assets and to hold membership in an Investor Protection Fund approved by the government under the FIEA. The Investor Protection Fund is funded through assessments on its securities company members. In the event of failure of a securities company that is a member of the fund, the Investor Protection Fund provides protection of up to ¥10 million per client. The Investor Protection Fund covers claims related to securities deposited by clients with the failed securities company and certain other client claims.
Regulation of Other Financial Services
Financial Instruments and Exchange Act
on-going
disclosure by securities issuers, tender offers for securities, organization and operation of securities exchanges and self-regulatory associations, and registration of securities companies. In addition, to enhance fairness and transparency in the financial markets and to protect investors, the FIEA provides for, among other things, penalties for misrepresentations in disclosure documents and unfair trading, strict reporting obligations for large shareholders and corporate information disclosure systems, including annual and quarterly report systems, submission of confirmation certificates concerning the descriptions in securities reports, and internal controls over financial reporting.
The FIEA also provides for corporate group regulations on securities companies the size of which exceeds specified parameters (Tokubetsu Kinyu Shouhin Torihiki Gyosha, “Special Financial Instruments Firm”) and on certain parent companies designated by the Prime Minister (Shitei Oyagaisha, “Designated Parent Companies”) and their subsidiaries (together, the “Designated Parent Company Group”). The FIEA aims to regulate and strengthen business management systems, compliance systems and risk management systems to ensure the protection of investors. The FIEA and its related guidelines also provide reporting requirements to the FSA on the Designated Parent Company Group’s business and capital adequacy ratios, enhanced public disclosures as well as restrictions on compensation all of which are designed to reduce excessive risk-taking by executives and employees of a Designated Parent Company Group. We were designated as the Designated Parent Company of NSC in April 2011 and were designated as the Designated Parent Company of NFPS in December 2013. As the Designated Parent Company and the final parent company within a corporate group (Saishu Shitei Oyagaisha, “a Final Designated Parent Company”), we are subject to these requirements. A violation of the FIEA may result in various administrative sanctions, including the revocation of registration or license, the suspension of business or an order to discharge any director or executive officer who has failed to comply with the FIEA.
Orderly Resolution Regime. On March 6, 2014, amendments to the FIEA and the Deposit Insurance Act, which included the establishment of an “Orderly Resolution Regime for Financial Institutions” to prevent a
25
financial crisis that may spread across financial markets and may seriously impact the real economy, took effect. Under the Orderly Resolution Regime, the Financial Crisis Response Council, chaired by the Prime Minister, will take measures such as providing liquidity to ensure the performance of obligations for critical market transactions where it is considered necessary to prevent severe market disruption. Such measures will be funded by the financial industry, except in special cases where the government will provide financial support.
TLAC. In April 2016, the FSA published its policy describing its approach and framework for the introduction of the TLAC requirements in Japan applicable to Japanese
G-SIBs
and, in April 2018, released revisions to such policy that extended the coverage of the TLAC requirements in Japan not only to Japanese
G-SIBs
but also to Japanese
D-SIBs
that are deemed (i) of particular need for a cross-border resolution arrangement and (ii) of particular systemic significance to Japanese financial system if they fail. Based on the revised policy, in March 2019, the FSA finally published the notices and guidelines of TLAC regulations in Japan (including TLAC holding regulations). Although Nomura is not identified as a
G-SIB
as of the date of this annual report, Nomura is subject to the TLAC regulations in Japan, and will be required to meet a minimum External TLAC requirement of holding TLAC in an amount at least 16% of our consolidated risk-weighted assets as from March 31, 2021 and at least 18% as from March 31, 2024 as well as at least 6% of the applicable Basel III leverage ratio denominator from March 31, 2021 and at least 6.75% from March 31, 2024.
Regulatory Changes. On May 31, 2019, a bill to amend the FIEA and the Payment Services Act, etc. was passed by the Diet of Japan. The amendment to the FIEA includes establishing the concept of “electronically recorded transferable rights” (
, “ERTRs”) and treating ERTRs as Securities defined in Paragraph 1 of the FIEA. As a result, ERTRs are subject to requirements of the Disclosure of Corporate Affairs and Other Related Matters, and regulations for Financial Instruments Business Operators Engaged in Type I Financial Instruments Business apply to institutions dealing in ERTRs. Additionally, “crypto assets” (
) are now included in the definition of “Financial Instruments”, and derivatives transactions related to crypto assets are subject to the provisions of the FIEA. As a result of the amendment, certain special provisions concerning the crypto asset-related business have been introduced, whereby Financial Instruments Business Operators, etc. must explain the nature of crypto assets and must not make any representation that may mislead their customers about the nature of crypto assets. Moreover, regulations governing unfair acts in respect of crypto asset and crypto asset derivative transactions are introduced. The amendment became effective on May 1, 2020.
denshi kiroku iten kenri
“angou shisan”
Overseas
Our overseas offices and subsidiaries are also subject to various laws, rules and regulations applicable in the countries where they conduct their operations, including, but not limited to those promulgated and enforced by the U.S. Securities and Exchange Commission (“SEC”), the Commodity Futures Trading Commission (“CFTC”), the U.S. Treasury, the Financial Stability Oversight Council (“FSOC”), the New York Stock Exchange, the Financial Industry Regulatory Authority (“FINRA”) (a private organization with quasi-governmental authority and a regulator for all securities companies doing business in the U.S.), the National Futures Association (“NFA”) (a self-regulatory organization for the U.S. derivatives industry) in the U.S.; by the Prudential Regulation Authority (“U.K. PRA”) and the Financial Conduct Authority (“U.K. FCA”) in the U.K; and by a number of EU regulators including Bundesanstalt für Finanzdienstleistungsaufsicht (BaFin), Autorité de Contrôle Prudentiel et de Résolution (ACPR) and Autorité des Marches Financiers (AMF). We are also subject to international money laundering and related regulations in various countries. For example, the USA PATRIOT Act of 2001 contains measures to prevent, detect and prosecute terrorism and international money laundering by imposing significant compliance and due diligence obligations and creating crimes and penalties. Failure to comply with such laws, rules or regulations could result in fines, suspension or expulsion, which could materially and adversely affect us.
Regulatory Changes. In response to the financial markets crisis, governments and regulatory authorities in various jurisdictions have made and continue to make numerous proposals to reform the regulatory framework for, or impose a tax or levy upon, the financial services industry to enhance its resilience against future crises,
26
contribute to the relevant economy generally or for other purposes. In July 2010, the U.S. enacted the Dodd-Frank Act and a multi-agency rulemaking process. The rulemakings include the following: (i) create a tighter regulatory framework for
over-the-counter
(“OTC”) derivatives to promote transparency and impose conduct rules in that marketplace; (ii) establish a process for designating nonbank financial firms as Systemically Important Financial Institutions (“SIFIs”), subject to increased (and sometimes new) prudential oversight including early remediation, capital standards, resolution authority and new regulatory fees; (iii) prohibit material conflicts of interest between firms that package and sell asset-backed securities (“ABS”) and firms that invest in ABS; (iv) establish risk retention requirements for ABS; (v) establish rules related to the orderly liquidation of certain broker dealers; (vi) create annual stress tests; and (vii) set forth a number of executive compensation mandates, including rules to curtail incentive compensation that promotes excessive risk taking and listing standards for recovery of erroneously awarded compensation. The new regulatory framework for OTC derivatives includes mandates for clearing transactions with designated clearing organizations, exchange trading, new capital requirements, bilateral and variation margin for
non-cleared
derivatives, reporting and recordkeeping, and internal and external business conduct rules. Some U.S. derivatives and executive compensation rules may be applied extraterritorially and therefore impact some
non-U.S.
Nomura entities.
Other aspects of the Dodd-Frank Act and related rulemakings include provisions that (i) prohibit deposit-taking banks and their affiliates from engaging in proprietary trading and limit their ability to make investments in hedge funds and private equity funds (the
so-called
“Volcker Rule”); (ii) empower regulators to liquidate failing nonbank financial companies that are systemically important; (iii) provide for new systemic risk oversight and increased capital requirements for both bank and
non-bank
SIFIs; (iv) provide for a broader regulatory oversight of hedge funds; and (v) establish new regulations regarding the role of credit rating agencies, investment advisors and others. The Economic Growth, Regulatory Relief, and Consumer Protection Act, which was enacted in May 2018, preserves the fundamental elements of the post-Dodd-Frank regulatory framework and, as to bank regulatory requirements, primarily focuses on revising certain aspects of the U.S. financial regulatory regime for small and
medium-sized
banking organizations. In connection with the implementation of the Dodd-Frank Act, the U.S. Federal financial regulatory agencies have released proposals to tailor the application of prudential requirements, including capital and liquidity requirements, for large U.S. banking organizations and foreign banking organizations with significant U.S. activities.
The CFTC has largely finalized its rulemakings that implement the OTC derivatives market reform aspects of the Dodd-Frank Act. Among other items, the CFTC Dodd-Frank rules now impose reporting, clearing, margin and trade execution requirements that will apply, to varying degrees, to commodity derivative transactions entered into by all U.S. and many
non-U.S.
Nomura entities. These rules also require swap dealers that exceed a de minimis threshold of swap dealing activity to be registered with the CFTC and subject those registered swap dealers to internal and external conduct requirements. The U.S. derivatives rules are now being applied extraterritorially and are impacting some
non-U.S.
Nomura entities. The full extent of the extraterritorial application of the CFTC’s Dodd-Frank rules continues to evolve as the CFTC updates its own guidance, and these changes may result in more or fewer aspects of the rules impacting Nomura’s entities. In relevant part, on December 18, 2019, the CFTC approved proposed rules that address the cross-border application of registration thresholds and certain requirements relevant to swap dealers, as well as changes to existing terms and definitions and the CFTC’s treatment of transactions that have been arranged, negotiated or executed by Associated Persons (“APs”) in the U.S., and the availability of substituted compliance for the limited scope of the Title VII swap requirements addressed in the proposal. Separately, on March 5, 2019, the NFA issued rules that require certain APs of NFA member firms (e.g. swap dealers and Futures Commission Merchants) to satisfy certain swaps proficiency requirements to ensure that APs engaged in swaps activities meet a minimum proficiency standard that tests both their market knowledge and their knowledge of regulatory requirements relating to swaps activities. Swap dealer APs outside the U.S. that only transact swaps with
non-U.S.
persons or
non-U.S.
branches of U.S. swap dealers are exempt from the requirements. The compliance date for
in-scope
APs to complete the proficiency requirements is January 31, 2021.
27
In addition, Title VII of the Dodd-Frank Act gives the SEC regulatory authority over “security-based swaps” which are defined under the act as swaps based on a single security or loan or a narrow-based group or index of securities. Security-based swaps are included within the definition of “security” under the U.S. Securities and Exchange Act of 1934 and the U.S. Securities Act of 1933. The SEC continues to issue final rules and interpretive guidance addressing cross-border security-based swap activities. On June 25, 2014, the SEC initially finalized a portion of its cross-border rules, namely key foundational definitions and registration calculations that will become operative once the SEC sets a timeframe for the security-based swap dealer registration process to begin. Since then, the SEC has issued a series of final rules that will apply certain Dodd-Frank Act requirements to security-based swaps between two
registration calculation that would otherwise require a
counting threshold, security-based swap dealer registration and compliance with all final security-swap dealer rules will be no later than November 1, 2021.
non-U.S.
person counterparties when the security-based swaps are arranged, negotiated or executed using personnel or personnel of agents located in the U.S. On February 10, 2016, the SEC issued final rules that require a
non-U.S.
person that uses personnel or personnel of agents located in the U.S. in connection with security-based swap dealing activity to include such security-based swaps in its security-based swap dealer registration de minimis calculation. On April 14, 2016, the SEC issued final rules that require a
non-U.S.
security-based swap dealer to comply with external business conduct standards rules when facing a
non-U.S.
person counterparty if the
non-U.S.
security-based swap dealer uses personnel or personnel of agents located in the U.S. to arrange, negotiate or execute the security-based swap. On July 14, 2016 the SEC issued final rules that subject a security-based swap between a
non-U.S.
security-based swap dealer and a
non-U.S.
person counterparty to public dissemination pursuant to SEC rules if the
non-U.S.
swap dealer uses personnel or personnel of agents located in the U.S. to arrange, negotiate or execute the security-based swap. On June 21, 2019, the SEC issued its final rules governing capital, margin and segregation requirements for security-based swap dealers, revised the capital and segregation requirements for broker-dealers that are not security-based swap dealers to the extent they engage in security-based swaps activities, and increased the minimum capital requirements for broker-dealers authorized to use internal models to compute net capital. On September 19, 2019, the SEC issued final rules governing recordkeeping and reporting for security-based swap dealers and amendments to existing recordkeeping and reporting requirements for broker-dealers. On December 18, 2019, the SEC adopted rules that would require security-based swap dealers to comply with certain risk mitigation techniques with respect to portfolios of uncleared security-based swaps. These risk mitigation techniques include, inter alia, requirements that a security-based swap dealer establish, maintain and follow written policies and procedures: (1) related to bilateral offsetting of security-based swaps and periodic portfolio compression exercises; and (2) that are reasonably designed to ensure that it executes written security-based swap trading relationship documentation with each of its counterparties prior to, and contemporaneously with, executing a security-based swap. Finally, on December 18, 2019, the SEC also adopted final supplemental guidance and rule amendments addressing the cross-border application of certain security-based swap requirements. Specifically, the rules provide guidance, subject to certain conditions, on the circumstances under which providing “market color” will not constitute “arranging” or “negotiating” a security-based swap for purposes of the of the SEC rules, guidance relating to the certification and opinion requirements for
non-U.S.
security-based swap dealer registration applicants, and
non-U.S.
AP requirements relevant to registered security-based swap dealers. In addition, the SEC adopted a conditional exception from the security-based swap dealer
de minimis
non-U.S.
security-based swap entity to count a security-based swap transaction with a
non-U.S.
counterparty that was arranged, negotiated or executed by personnel or personnel of agents in the U.S. These cross-border rules and amendments may impact some
non-U.S.
Nomura entities. Significantly, the SEC’s cross-border final guidance and rule amendments trigger the eighteen (18) month countdown for security-based swap dealer registration and compliance with all final security-based swap dealer requirements. Consequently, for those dealers and other market participants who breach the
de minimis
The exact details of the Dodd-Frank Act implementation and ultimate impact on Nomura’s operations will depend on the form and substance of the final regulations adopted by various governmental agencies and oversight boards. In addition to the rulemakings required by the Dodd-Frank Act, the SEC is considering other rulemakings that will impact Nomura’s U.S. entities. While these rules have not been formally proposed, they have been publicly reported in the U.S. Office of Management and Budget’s (“OMB”) “Current Regulatory Plan
28
and Unified Agenda of Regulatory and Deregulatory Actions.” The SEC’s Division of Trading and Markets has announced that it is considering recommending that the SEC propose an amendment to its net capital rule that would prohibit a broker-dealer that carries customer accounts from having a ratio of total assets to regulatory capital in excess of a certain level. The SEC and the CFTC are also considering a number of changes to market structure rules. The SEC adopted Rule 613 to create a consolidated audit trail (“CAT”) intended to allow regulators to track all activity throughout the U.S. markets in National Markets Systems (“NMS”) securities. Self-regulatory organizations must jointly submit a NMS plan to create and implement the CAT, which will replace existing reporting systems OATS, TRACE and EBS. On June 15, 2016 the SEC approved amendments to FINRA Rule 4210, which require FINRA member broker-dealers to set risk limits on each counterparty transacting in specified forward-settling agency mortgage-backed securities (“covered agency transactions”) as of December 15, 2016, and to collect variation margin and/or maintenance margin from certain counterparties transacting in covered agency transactions as of June 25, 2018. A failure to collect required margin in a timely manner (T+1) results in an obligation for the FINRA member broker-dealer to take a capital charge, and ultimately (T+5) to liquidate the customer’s position in order to satisfy the margin deficiency. On October 25, 2019, FINRA filed a rule change with the SEC again extending the effective date of the Rule 4210 margin requirements to March 25, 2021, but has not yet issued proposed revisions to Rule 4210. On November 7, 2016, the CFTC approved a supplemental notice of proposed rulemaking modifying certain rules proposed in the CFTC’s December 17, 2015, notice of proposed rulemaking regarding Regulation AT. Proposed Regulation AT would have, among other things, required firms engaged in electronic algorithmic trading to (i) register with the CFTC and (ii) submit their trading source code to the CFTC. While the proposed Regulation AT has not been finalized, the CFTC continues to consider comments that were received in connection with the proposed rulemaking.
On February 3, 2017, U.S. President Donald J. Trump signed Executive Order 13772 outlining core principles to regulate the U.S. financial system. The order directed the Secretary of the Treasury to consult with heads of member agencies of the FSOC and report within 120 days of the date of the order (and periodically thereafter) on the extent to which existing laws, treaties, regulations, guidance, reporting and recordkeeping requirements and other government policies promote the core principles. U.S. regulatory agencies may change financial regulations through administrative procedures and rulemakings, supervisory guidance or
no-action
relief as the result of recommendations by the Treasury Secretary in accordance with the core principles of the executive order. These may have a material impact on Nomura’s business.
The core principles are as follows: (i) empower Americans to make independent financial decisions and informed choices in the marketplace, save for retirement, and build individual wealth; (ii) prevent taxpayer-funded bailouts; (iii) foster economic growth and vibrant financial markets through more rigorous regulatory impact analysis that addresses systemic risk and market failures, such as moral hazard and information asymmetry; (iv) enable American companies to be competitive with foreign firms in domestic and foreign markets; (v) advance American interests in international financial regulatory negotiations and meetings; (vi) make regulation efficient, effective, and appropriately tailored; and (vii) restore public accountability within Federal financial regulatory agencies and rationalize the Federal financial regulatory framework. The Treasury Department divided its review of the financial system into a series of reports. The reports, all of which have been issued, cover the following subjects: (1) the depository system, covering banks, savings associations, and credit unions of all sizes, types and regulatory charters: (2) capital markets: covering debt, equity, commodities and derivatives markets, central clearing and other operational functions; (3) the asset management and insurance industries, and retail and institutional investment products and vehicles; and (4)
non-bank
financial institutions, financial technology and financial innovation. In addition, President Trump issued two Presidential Memoranda to the Secretary of the Treasury. One calls for a review of the Orderly Liquidation Authority (“OLA”) established under Title II of the Dodd-Frank Act, which the Treasury Department released in February 2018, recommending reforms to the OLA and amendments to the U.S. Bankruptcy Code to make a bankruptcy proceeding a more effective solution method for large financial institutions. The other calls for Treasury to review the process by which the FSOC determines that a nonbank financial company could pose a threat to the financial stability of the U.S., subjecting such an entity to supervision by the Federal Reserve and enhanced prudential standards and
29
capital requirements. In March 2019, the FSOC proposed to revise its interpretive guidance relating to such designations (the “March Proposal”). In December 2019, the FSOC issued finalized amendments to its interpretative guidance, which adopts the March Proposal with some modifications.
On October 26, 2017, the Division of Investment Management and the Division of Trading and Markets of the SEC issued three related
no-action
letters to address certain issues raised by cross-border implementation of the European Union’s (“EU”) Markets in Financial Instruments Directive (“MiFID II”), which took effect on January 3, 2018. MiFID II will require the unbundling of execution and research payments made by investment managers to broker-dealers. Under the relief, a broker-dealer may, without becoming subject to the Advisers Act, provide research services to an investment manager that is required, either directly or by contractual obligation, to pay for such research services with MiFID
II-compliant
research payments. This
no-action
letter, which was set to expire on July 3, 2020, has been extended until July 3, 2023.
The Foreign Account Tax Compliance Act (“FATCA”), which was enacted in 2010, requires foreign financial institutions (“FFIs”) to report to the U.S. Internal Revenue Service information about financial accounts held by U.S. taxpayers, or by foreign entities in which U.S. taxpayers hold a substantial ownership interest. As a result, Nomura is subject to certain reporting requirements consistent with a mutual agreement between Japanese governmental authorities and the U.S. Treasury Department.
On December 22, 2017, President Donald Trump signed the Tax Cuts and Jobs Act into law. Among other things, the legislation includes the Base Erosion and Anti-Abuse Tax (“BEAT”), effectively a minimum tax on large corporations applied by adding back to taxable income certain deductible payments made to related foreign persons. These tax law changes are complex and raise significant interpretive issues and therefore we anticipate future guidance on these rules to address the areas of uncertainty which could also have an adverse impact on the tax liabilities of our U.S. entities.
As part of global efforts to establish a framework to improve authorities’ capacity to resolve failing SIFIs, the U.K. implemented the EU Bank Recovery and Resolution Directive (“BRRD”), which was published on June 12, 2014. The BRRD also aims to implement FSB recommendations on recovery and resolution regimes for financial institutions. The BRRD applies to banks and investment firms operating in EU member states, including EU branches and subsidiaries of third country firms. It includes requirements for the preparation of recovery and resolution plans (“RRPs”) by institutions and regulators. It also creates various powers for EU regulators to intervene to resolve institutions at risk of failure, including the ability to sell or transfer all or part of an institution and the introduction of a debt write down or
bail-in
tool.
As part of the
bail-in
rules, firms will be required to maintain capital resources sufficient to meet the stipulated minimum requirement for eligible liabilities (“MREL”). The MREL overlaps with the global capital standards on total loss absorbing capacity (“TLAC”) for
G-SIBs
issued by the FSB on November 9, 2015. As Nomura Group has adopted a single point of entry resolution strategy, European subsidiaries are subject to internal MREL. The internal MREL became applicable in the U.K. for all U.K. incorporated institutions from January 1, 2019 for firms whose failure would have a significant impact on the U.K. financial system and for certain overseas firms where the Bank of England (“BOE”) would support a home resolution authority in carrying out a cross-border resolution. From January 1, 2020, Nomura is required to hold internal MREL resources above the regulatory capital requirements for the material subsidiaries in the U.K., identified as Nomura Europe Holdings plc (“NEHS”) on a
sub-consolidated
basis and NIP.
In July 2019, the BOE and U.K. PRA published a policy statement on the Resolvability Assessment Framework (“RAF”). The proposals for the RAF bring together existing policies such as MREL and Operational Continuity in Resolution (“OCIR”) as well as other new resolution policies in order to follow the resolution principles set out by the FSB. Under the policy, it is expected firms perform an assessment of their preparations for resolution and the BOE provide a public statement concerning resolvability of each firm. The BOE and U.K. PRA may consider, in consultation with Financial Services Agency (“FSA”), apply some or all of the requirements set out in the policy statement to NEHS.
30
EU banks and investment firms including those located in the U.K. have been subject to the current prudential regulatory capital regime since the introduction of the Capital Requirements Regulation and Capital Requirements Directive (collectively, “CRD IV”) in January 2014. The aim of CRD IV was to strengthen the resilience of the EU banking sector so it would be better placed to absorb economic shocks while also ensuring that banks continued to finance economic activity and growth. CRD IV sets out regulations for minimum capital requirements for banks and investment firms and also introduced new capital and liquidity buffers.
In November 2016 the European Commission proposed amendments to this regulation in a “CRRII” package of reforms. Together with the updates to the Bank Recovery and Resolution Directive (“BRRD II”) and Single Resolution Mechanism Regulation (“SRMR”) this package is an important step towards the completion of the European post-crisis regulatory reforms and implements some of the outstanding global reforms agreed by the Basel Committee and the FSB. The EU views the amendments as essential to making its financial system more stable and resilient, and the financial institutions more resolvable. These updates entered into force in June 2019 with the majority of changes being introduced two years later in June 2021.
Among other things these proposed changes include the introduction of binding minimum leverage and net stable funding ratios, changes to the calculations for counterparty credit risk of derivatives, a tightening of large exposure limits, introduction of new reporting requirements for market risk and the introduction of a new EU intermediate parent undertaking requirement. These reforms are generally expected to lead to an increase in local capital and liquidity requirements and increased costs of compliance.
Subsequent to the finalization of work on the CRRII package the EU will introduce a “CRRIII” package of reforms to implement all outstanding elements of the Basel III framework including changes to the calculations for Operational Risk, CVA, Credit Risk, FRTB capital requirements and the introduction of an output floor to modelled calculations.
The revised MiFID II, which is split into the Markets in Financial Instruments Directive (“MiFID”) and the Markets in Financial Instruments Regulation (“MiFIR”) was published in the EU Official Journal on June 12, 2014 and entered into force on July 2, 2014. The majority of the new rules under MiFID II and MiFIR took effect from January 3, 2018, with Member States required to implement MiFID II through national legislation by July 3, 2017. The legislation sought to introduce wide-reaching changes to markets, including the extension of market transparency rules into
non-equities
and potentially reducing the size of the OTC derivative market by mandating the clearing of standardized OTC transactions through central clearing counterparties and their trading through regulated trading venues. The new framework introduced a market structure which was intended to close certain loopholes and ensure that trading, wherever appropriate, takes place on regulated platforms. It has introduced rules on high frequency trading with a view to improving the transparency and oversight of financial markets. The revised MiFID also aimed to strengthen the protection of investors by introducing more robust organizational and conduct requirements and by strengthening the role of management bodies. The new framework also increased the role and supervisory powers of regulators and established powers to prohibit or restrict the marketing and distribution of certain products in well-defined circumstances. A harmonized regime for granting firms from third countries access to EU professional markets, based on an equivalence assessment of third-country jurisdictions by the Commission, was also introduced.
Following a range of consultations and technical advice published by the European Securities and Markets Authority (“ESMA”), in April 2016 the European Commission adopted a MiFID Delegated Directive (“Directive”). The Directive contains provisions on investor protection, notably on safeguarding of clients. The Commission also adopted a delegated regulation supplementing MiFID II. This regulation was aimed at specifying, in particular, the rules relating to exemptions, the organizational requirements for investment firms, and conduct of business obligations in the provision of investment services. In May 2016, the Commission adopted a further delegated regulation supplementing MiFIR. This regulation aims at specifying, in particular, the rules relating to determining liquidity for equity instruments, the rules on the provision of market data on a reasonable commercial basis, the rules on publication, order execution and transparency obligations for
31
systematic internalisers, and the rules on supervisory measures on product intervention by the ESMA, the European Banking Authority (‘EBA’) and national authorities, as well as on position management powers by the ESMA.
After two years, the EU Commission is required to evaluate the overall functioning of the MiFID II/ MiFIR regime, in particular, addressing those areas where challenges still exist, and present a report to the European Parliament and Council together with a legislative proposal to reform the regime if required (the so called ‘MiFID Refit’). As part of this process, ESMA has already launched a number of consultations on specific areas, which will feed into the Commission’s reports.
The European Market Infrastructure Regulation (“EMIR”) became effective on August 16, 2012, and applies to any entity established in the EU that is a legal counterparty to a derivative contract, even when trading with
non-EU
firms. EMIR was created with the intention of stabilizing OTC markets found within EU member states. Although the majority of EMIR regulations have already been implemented, on May 28, 2019, Regulation (EU) 2019/834 (EMIR REFIT) was published in the EU’s Official Journal, with the aim of amending EMIR to make some of its requirements simpler and more proportionate, particularly for
non-financial
counterparties (“NFCs”). With a few exceptions, the majority of the provisions in the Regulation entered into force on June 17, 2019.
Following the announcement made by BCBS and the International Organization of Securities Commissions (‘IOSCO’) on April 3, 2020 to defer by one year, the deadline for completing the final two implementation phases of the bilateral margin requirements, the European Supervisory Authorities (ESMA, EBA and the European Insurance and Occupational Pensions Authority) have published joint draft Regulatory Technical Standards to amend the Delegated Regulation on the risk mitigation techniques for
non-centrally
cleared OTC derivatives (bilateral margining), under EMIR to incorporate in the EU, the one year deferral.
On January 12, 2016, the Securities Financing Transactions Regulation (“SFTR”), which forms part of the EU’s package of legislation targeted at reforming shadow banking and aims to improve transparency in the securities financing transactions (“SFTs”) market, came into force subject to a range of transitional provisions over a number of years. On April 11, 2019, the final regulatory technical standards entered into force and MiFID firms were due to commence their reporting one year later on April 11, 2020. However, due to the
COVID-19
pandemic, the reporting under the SFTR has been extended until July 13, 2020. Other reporting counterparties are phased in over the following months, ending with NFCs on January 11, 2021.
In June 2015, the European Parliament and Council to the EU members issued the final version of the Fourth Money Laundering Directive (“4MLD”). All EU member states, including the U.K., had until June 26, 2017 to transpose the requirements of the directive into national law. In February 2016, the EU Commission, in an effort to bolster the fight against terrorist financing, proposed amendments to the 4MLD that would enable the tracing of terrorists through financial movements and disrupt the sources of revenue for terrorist organizations by targeting their capacity to raise funds. These proposed amendments were included in a final version of the 4MLD issued by the EU Parliament in July 2016. In September 2017, additional legislation was implemented in the U.K. designed to combat financial crime including the Criminal Finances Act. The Act functions as an enhancement and extension of the Proceeds of Crime Act 2002 and, in addition to increasing the powers of authorities in investigating tax evasion, is also designed to make failure by a commercial organization to prevent the facilitation of tax evasion a punishable offence.
The Fifth Money Laundering Directive (“5MLD”), came into force in the EU on April 26, 2018 and for implementation by EU Member States by January 10, 2020. Not all Member States have yet been able to implement the changes. However the U.K. government has enacted the regulations bringing into force the 5MLD and the provisions are contained in the Money Laundering and Terrorist Financing (Amendment) Regulations 2019. The changes impose additional obligations within the financial services sector. 5MLD amends 4MLD, and includes provisions that enhance the required level of transparency around beneficial ownership of corporates
32
and trusts, tightens some controls relating to Politically-Exposed Persons and high risk third countries and also addresses risks associated with certain technological innovation, particularly virtual currencies.
The Senior Managers and Certification Regime (“SM&CR”) came into force on March 7, 2016 with the aim of reducing the risk of harm to consumers and strengthening market integrity by making firms, and individuals within those firms, more accountable for their conduct and competence. In July 2018, the U.K. FCA and U.K. PRA published near-final rules extending SM&CR to cover all financial services firms in the U.K. to apply from December 9, 2019. On March 8, 2019, the U.K. FCA announced its final rules on its proposed Directory—a new public register that will enable consumers, firms and other stakeholders to find information on key individuals working in financial services who are not otherwise appointed and publicly registered under the SM&CR. Firms were to submit data on Directory individuals in December 2019, and the Directory was expected to go live in March 2020. However, due to the
COVID-19
pandemic, the implementation date of the directory of certified and assessed persons is currently under review.
Since 2012, the European Commission sought to establish a modern and harmonized data protection framework across the EU to replace the existing Directive. On May 4, 2016, the official texts of the new EU General Data Protection Regulation (“GDPR”) were published in the EU Official Journal in all the official languages and it came into force on May 25, 2016. GDPR took effect across the EU member states on May 25, 2018. GDPR included a number of important changes to existing data protection legislation including new obligations on data processors, restrictions on the transfer of personal data outside the EEA and the introduction of new concepts such as “accountability” (and related record-keeping), the “right to be forgotten” and a requirement for data breach notifications to the relevant Regulators. Enforcement of GDPR is carried out by both national regulators (for the U.K., the Information Commissioner) and the European Commission, and the regulators also have the power to impose greater fines for any breaches of the data protection requirements of up to 4% of a firm’s global turnover.
The EU Benchmark Regulation (“BMR”) entered into force on June 30, 2016 and has applied in the U.K. since January 1, 2018. Global regulators have imposed fines on firms following attempted manipulation of the London Inter-bank Offered Rate (“LIBOR”), gold and foreign exchange benchmarks, and have taken action against individuals for misconduct related to benchmarks. The objectives of the EU BMR include, but are not limited to: (i) improving governance and controls over the benchmarking process to ensure that administrators avoid/manage conflicts of interest, (ii) improving the quality of input data and methodologies used by benchmark administrators, (iii) ensuring that contributors to benchmarks and the data they provide are subject to adequate controls, and (iv) protecting consumers and investors through greater transparency and adequate rights of redress.
Furthermore, in November 2019, the EU BMR was amended to include two new types of “climate benchmarks”—‘Paris-Aligned’ Benchmarks (“PABs”) and Climate Transition Benchmarks (“CTBs”). The
Low-Carbon
Benchmarks Regulation introduced the requirement (under Article 13 of the BMR) that administrators of benchmarks (save interest rate and foreign exchange benchmarks) must provide an explanation of how the key elements of their benchmark methodologies reflect ESG factors. The requirements are to be complied with by April 30, 2020. However, since the draft regulatory technical standards are currently subject to a public consultation and a number of important details are subject to these delegated acts, ESMA issued a ‘No Action Letter’ encouraging EU national regulators not to force these ‘Level 1’ requirements until these delegated acts are finalized.
In addition, interest rate benchmarks including, among others, the London Interbank Offered Rate (“LIBOR”), the Euro Interbank Offered Rate (EURIBOR), the Euro Overnight Index Average (EONIA) and certain other Interbank Offered Rates (“IBORs”) are being reformed.
The U.K. is due to make the transition from LIBOR to Sterling Overnight Index Average (“SONIA”) by the end of 2021 although certain interim milestones have been extended due to the
COVID-19
pandemic.
33
In the Eurozone,
€
STR (Euro Short Term Rate) is set to gradually replace the Euro Overnight Index Average (EONIA) and serve as a fallback for the Euro Interbank Offered Rate (EURIBOR). EONIA will effectively be pegged against
€
STR until January 3, 2022, when EONIA ceases to apply.
In the U.K. as a follow up to the Fair and Effective Markets Review (established by the Chancellor of the Exchequer), the Fixed Income, Currencies and Commodities (“FICC”) Markets Standards Board (“FMSB”) was established in 2015 as a private sector response to the conduct problems revealed in global wholesale FICC markets after the financial crisis. The function of the FMSB is to help raise standards of conduct in global wholesale markets by producing voluntary Standards and other guidance in areas of uncertainty that are developed by the membership and designed to illustrate best practices to all market participants. These Standards are intended to reduce the continuing uncertainty about acceptable practices in opaque and unregulated areas, which is a hazard for FMSB members, as well as other market participants. The Standards published to date cover topics including the new issue process, binary options for the commodities markets, reference price transactions for the fixed income markets and secondary market trading error compensation. The published Standards do not have legal or regulatory force and do not replace existing legislation; rather, they are intended to supplement the rules already in place. The Standards are implemented by way of FMSB member firms, including Nomura International plc, making an adherence statement on an annual basis.
The U.K.’s membership of the EU ended on January 31, 2020, commonly referred to as “
”, in accordance with the
(the “
”). The Withdrawal Agreement provides for a transition period until December 31, 2020 during which existing and new EU law will apply in the U.K. The transition period may be extended once by mutual consent of the parties by up to two years. However, the U.K. legislation ratifying the article 50 withdrawal agreement (the European Union (Withdrawal) Act 2018, as amended by the European Union (Withdrawal Agreement) Act 2020 (as so amended, the “
”)) contains a prohibition on a Minister of the Crown agreeing any extension to the transition period. While this does not entirely remove the prospect that the transition period will be extended (as the U.K. Parliament could pass legislation that would override the effect of the prohibition in the EUWA), the likelihood of a further extension is reduced.
Brexit
Agreement on the withdrawal of the United Kingdom of Great Britain and Northern Ireland from the European Union and the European Atomic Energy Community
Withdrawal Agreement
EUWA
The U.K. government and the EU are currently negotiating an equivalence arrangement for certain sectors of the financial services industry which, if agreed, would preserve some of the U.K.’s market access to the EU on the basis that the U.K.’s post-Brexit regulatory and supervisory framework is equivalent to that of the EU. However, while the final form and substance of an equivalence arrangement is undetermined at this stage (and may not be determined prior to the end of the transition period), it is unlikely to be as comprehensive as the market access that the U.K. enjoyed through its EU membership.
Regulatory Capital Rules
Japan
The FSA and regulatory authorities have revised the current regulatory capital standards applicable to Nomura to alleviate some of the impact of the
COVID-19
pandemic. In March 2020, the Basel Committee’s oversight body, the Group of Central Bank Governors and Heads of Supervision (“GHOS”), approved a set of measures that provide additional operational capacity for banks and supervisors. These measures allow banks and supervisors to immediately focus on financial stability, and priorities that alleviate the impact of the
COVID-19
pandemic on the global banking system. GHOS also made changes to the implementation timeline of the outstanding Basel III standard by deferring the deadline by 1 year. After this announcement, the FSA also announced a 1 year deferment of the implementation schedule in Japan. In April 2020, the FSA and Bank of Japan agreed to develop necessary procedures toward a temporary exemption of the outstanding balance of financial institutions’ current accounts at the BOJ from the leverage ratio exposure measure in order to facilitate the implementation of monetary policy. The FSA published the revised draft notice of the Leverage ratio requirement for implementation of the agreement, which will be effective from June 30, 2020 to March 31, 2021.
34
The FIEA requires that all Financial Instruments Firms (Category I) (“Financial Instruments Firms I”), a category that includes NSC and NFPS, ensure that their capital adequacy ratios do not fall below 120% on a
non-consolidated
basis. The FIEA also requires Financial Instruments Firms I to file monthly reports regarding their capital adequacy ratios with the Commissioner of the FSA or the Director-General of the appropriate Local Finance Bureau, and also to disclose their capital adequacy ratios to the public on a quarterly basis. In addition, if the capital adequacy ratio of a Financial Instruments Firm I falls below 140%, it must file a daily report with the authorities. The FIEA provides for actions which the Prime Minister, through the Commissioner of the FSA or the Director-General of the appropriate Local Finance Bureau, may take if any Financial Instruments Firm I fails to meet the capital adequacy requirement. More specifically, if the capital adequacy ratio of any Financial Instruments Firms I falls below 120%, the Commissioner of the FSA or the Director-General of the appropriate Local Finance Bureau may order the Financial Instruments Firm I to change its business conduct, to deposit its property in trust, or may issue any other supervisory order that such authorities deem necessary and appropriate to protect the interests of the general public or investors. If the capital adequacy ratio of a Financial Instruments Firm I falls below 100%, the authorities may take further action, including the issuance of orders to temporarily suspend its business and the revocation of its registration as a Financial Instruments Firm I under the FIEA.
Under the FIEA and regulations thereunder, the “capital adequacy ratio” means the ratio of adjusted capital to a quantified total of business risks. Adjusted capital is defined as net worth less illiquid assets. Net worth mainly consists of stated capital, additional
paid-in
capital, retained earnings, reserves for securities transactions, certain allowances for doubtful current accounts, net unrealized gains/losses in the market value of investment securities, and subordinated debt. Illiquid assets generally include
non-current
assets, certain deposits and advances and prepaid expenses. Business risks are divided into three categories: (i) market risks (i.e., risks of asset value changes due to decline in market values and other reasons), (ii) counterparty risks (i.e., risks of delinquency of counterparties and other reasons) and (iii) basic risks (i.e., risks in carrying out daily business activities, such as administrative problems with securities transactions and clerical mistakes), each quantified in the manner specified in a rule promulgated under the FIEA.
The FSA reviewed the FIEA and regulations thereunder in line with Basel 2.5 framework and the revised regulations for Basel 2.5 were implemented at the end of December 2011. Market risks increased significantly as a result of the Basel 2.5 rule implementation.
We closely monitor the capital adequacy ratio of NSC and NFPS on a continuous basis. Since the introduction of the capital adequacy requirement in Japan in 1989, we have at all times been in compliance with all appropriate requirements. We believe that we will continue to be in compliance with all applicable capital adequacy requirements for the foreseeable future.
As discussed above, the FSA amended the FIEA and introduced new rules on consolidated regulation and supervision of securities companies on a consolidated basis on April 1, 2011 to improve the stability and transparency of Japan’s financial system and ensure the protection of investors. Following introduction of these rules, NSC was designated as a Special Financial Instruments Firm, following which we have been designated as a Final Designated Parent Company. As such, we are required to calculate consolidated regulatory capital adequacy ratio according to the FSA’s “Establishment of standards on sufficiency of capital stock of a final designated parent company and its subsidiary entities, etc. compared to the assets held thereby” (2010 FSA Regulatory Notice No. 130; “Capital Adequacy Notice on Final Designated Parent Company”). Accordingly, since our designation as a Final Designated Parent Company in April 2011, we now calculate our Basel rule-based consolidated regulatory capital adequacy ratio according to the Capital Adequacy Notice on Final Designated Parent Company.
The FSA also amended the FIEA to include reporting on consolidated regulatory capital for the Final Designated Parent Companies, effective April 1, 2011. We are subject to this reporting requirements as well as the capital adequacy requirements described above.
35
The Capital Adequacy Notice on Final Designated Parent Company has been revised to be in line with Basel 2.5 and Basel III, and we have calculated a Basel
III-based
consolidated capital adequacy ratio since the end of March 2013. Basel 2.5 includes significant changes in the method of calculating market risk and Basel III includes redefinition of capital items for the purpose of requiring higher levels of capital and expansion of the scope of credit risk-weighted assets calculation.
If our capital ratios fall to the minimum level required by the FSA, our business activities may be impacted. However, these ratios are currently at well capitalized levels. We have met all capital adequacy requirements to which we are subject and have consistently operated in excess of the FSA’s capital adequacy requirements. Subject to future developments in regulatory capital regulations and standards, there has been no significant change in our capital ratios which management believes would have material impact on our operations.
The Basel Committee has issued a series of announcements regarding a broader program to strengthen the regulatory capital framework in light of weaknesses revealed by the financial crises, as described in “
” under Item 5.B of this annual report. The Capital Adequacy Notice on Final Designated Parent Company is expected to incorporate the series of rules and standards in line with the schedule proposed by the Basel Committee.
Consolidated Regulatory Capital Requirements
At the
G-20
summit in November 2011, the Financial Stability Board (“FSB”) and the Basel Committee announced the list of global systemically important banks
(“G-SIBs”)
and the additional requirements to the
G-SIBs
including the recovery and resolution plan. The FSB also announced the group of
G-SIBs
will be updated annually and published by the FSB each November. Since November 2011, we have not been designated as a
G-SIB.
On the other hand, the FSB and the Basel Committee were asked to work on extending the framework for
G-SIBs
to domestic systemically important banks
(“D-SIBs”)
and the Basel Committee developed and published a set of principles on the assessment methodology and the higher loss absorbency requirement for
D-SIBs.
In December 2015, the FSA identified us as a
D-SIB
and required additional capital charge of 0.5% after March 2016, with
3-year
transitional arrangement.
Overseas
In the U.S., Nomura Securities International, Inc. (“NSI”) is registered as a broker-dealer under the Securities Exchange Act of 1934 and is a futures commission merchant with the Commodity Futures Trading Commission (“CFTC”). NSI is also regulated by self-regulatory organizations, such as the Financial Industry Regulatory Authority (“FINRA”) and the Chicago Mercantile Exchange Group. NSI is subject to the SEC’s Uniform Net Capital Rule (“Rule
15c3-1”)
and other related rules, which require net capital, as defined under the alternative method, of not less than the greater of $1,000,000 or 2% of aggregate debit items arising from client transactions. NSI is also subject to CFTC Regulation 1.17 which requires the maintenance of net capital of 8% of the total risk margin requirement, as defined, for all positions carried in client accounts and nonclient accounts or $1,000,000, whichever is greater. NSI is required to maintain net capital in accordance with the SEC, CFTC, or other various exchange requirements, whichever is greater. Another U.S. subsidiary, Nomura Global Financial Products Inc. (“NGFP”) is registered as an OTC Derivatives Dealer under the Securities Exchange Act of 1934. NGFP is subject to Rule
15c3-1
and applies Appendix F. NGFP is required to maintain net capital of $20,000,000 in accordance with the SEC. Another U.S. subsidiary, Instinet, LLC (“ILLC”) is a broker-dealer registered with the SEC and is a member of FINRA. Further, ILLC is an introducing broker registered with the CFTC and a member of the National Futures Association and various other exchanges. ILLC is subject to Rule
15c3-1
which requires the maintenance of minimum net capital, as defined under the alternative method, equal to the greater of $1,000,000, 2% of aggregate debit items arising from client transactions, or the CFTC minimum requirement. Under CFTC rules, ILLC is subject to the greater of the following when determining its minimum net capital requirement: $45,000 minimum net capital required as a CFTC introducing broker; the amount of adjusted net capital required by a futures association of which it is a member; and the amount of net capital required by Rule
15c3-1(a).
As of March 31, 2019 and 2020, NSI, NGFP and ILLC were in compliance with relevant regulatory capital related requirements.
36
In Europe, Nomura Europe Holdings plc (“NEHS”) is subject to consolidated regulatory supervision by the Prudential Regulation Authority (“U.K. PRA”). The regulatory consolidation is produced in accordance with the requirements established under the Capital Requirements Directive and the Capital Requirements Regulation which came into effect on January 1, 2014. Nomura International plc (“NIP”), the most significant of NEHS’ subsidiaries, acts as a securities brokerage and dealing business. NIP is regulated by the U.K. PRA and has minimum capital adequacy requirements imposed on it on a standalone basis. In addition, Nomura Bank International plc (“NBI”), another subsidiary of NEHS, is also regulated by the U.K. PRA on a standalone basis and Nomura Financial Products Europe GmbH (“NFPE”), a Nomura subsidiary domiciled in Germany, is regulated by the German regulator (“BaFin”). As of March 31, 2019 and 2020, NEHS, NIP, NBI and NFPE were in compliance with relevant regulatory capital related requirements.
In Asia, Nomura International (Hong Kong) Limited (“NIHK”) and Nomura Singapore Ltd (“NSL”) are regulated by their local respective regulatory authorities. NIHK is licensed by the Securities and Futures Commission in Hong Kong to carry out regulated activities including dealing and clearing in securities and futures contracts, advising on securities, futures contracts and corporate finance and wealth management. Activities of NIHK, including its branch in Taiwan, are subject to the Securities and Futures (Financial Resources) Rules which require it, at all times, to maintain liquid capital at a level not less than its required liquid capital. Liquid capital is the amount by which liquid assets exceed ranking liabilities. Required liquid capital is calculated in accordance with provisions laid down in the Securities and Futures (Financial Resources) Rules. NSL is a merchant bank with an Asian Currency Unit (“ACU”) license governed by the Monetary Authority of Singapore (“MAS”). NSL carries out its ACU regulated activities including, among others, securities brokerage and dealing business. NSL is regulated and has minimum capital adequacy requirements imposed on it on a standalone basis by the MAS in Singapore. NIHK and NSL have always been compliant with relevant regulatory capital related requirements.
In addition, certain of our other subsidiaries are subject to various securities and banking regulations, and the capital adequacy requirements established by the regulatory and exchange authorities of the countries in which those subsidiaries operate. We believe that each such subsidiary is, and will in the foreseeable future be, in compliance with these requirements in all material respects.
Management Challenges and Strategies
Management vision
Nomura Group’s management vision is to enhance its corporate value by deepening society’s trust in the firm and increasing satisfaction of stakeholders, including that of shareholders and clients. As a global investment bank, the Company will provide high value-added solutions to clients globally, and recognizing its wider social responsibility, the Company will continue to contribute to the economic growth and development of society. To enhance its corporate value, the Company places significance on return on equity (“ROE”) and will strive for sustainable business transformation.
Addressing Urgent Priority Issues
The impact of the
COVID-19
pandemic has had, and will continue to have, significant impacts in global economy and financial markets. Nomura’s management priority is shifting to adjust to this situation and focusing on the following urgent challenges in the course of determining its overall impacts:
| • | Continued to fulfill responsibility as capital market intermediary and liquidity provider in order to maintain the financing required by companies and trading activities by market participants. |
| • | Supported the recovery of the economy and corporate activities while ensuring the safety of our clients, communities and employees and their families, Provided remote services to clients and strengthened the infrastructure to keep up business as usual during widespread work-from-home arrangements. |
37
| • | Maintained robust financial position and ensured sufficient liquidity in a highly volatile and stressful market environment. |
We carry out our business activities by recognizing those importance.
Priorities to respond to changed environment
Following the global outbreak of the
COVID-19
pandemic, it is likely that our future business platform including trends in real economy and capital markets will be dramatically changing while new types of client behavior and need will be generated. Workstyle of our employees will be also shifting. To adapt to these changes, Nomura is formulating a growth strategy to achieve sustainable enhancement in corporate value and revising its operating model.
| • |
Boost profitability and invest in growth areas to lift corporate value
|
As a part of our business strategy to improve corporate value, we are expanding and strengthening our scope of business from Public markets to Private markets. Specifically, we aim to further expand our capabilities in terms of “Products and services” “Customer base” and its “Delivery method”.
I. Products and services
In addition to our traditional strengths in financial products such as listed stocks and investment trusts, we will aggressively expand the scope of products and services that we offer to our private clients (alternative investments, including commercial assets such as private equity, private debt and infrastructure). We will also strengthen our approach to private offering as well as public offerings to meet customer needs.
II. Clients
Targeted clients in providing solutions for financing and M&A business, will be also shifted to
start-up
companies (unlisted companies), not only to listed companies. We seek to further expand our business also with new types of services by exploring needs through consultation and advisory services to existing and new clients.
III. Delivery method
The active use of digital technology will be further accelerated, in not only
non-face-to-face
but also
face-to-face
situations. Our capabilities will remain flexible to respond to the needs of individual clients not only by providing various information and products, but also by providing various contents.
Expanding our scope of business from public to private
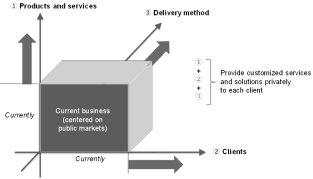
38
| • |
Improve operating model to align to new business environment
|
To remain close engagement with and diligently serve our clients, we proceed with preparing for a variety of communication methods, for example to have a flexibility to choose either
face-to-face,
telephone,
e-mail,
or online the situation demands, so that we can maximize our ability to respond to changes in client behavior and needs, despite the long-lasting effect of the
COVID-19
pandemic.
In addition, we continue our efforts to ensure our internal productivity through further investment in IT infrastructure, and digitalization, which should be effective even when working from home.
Management indicator
After the introduction of the Corporate Governance Code in Japan, the importance of management with an awareness of capital costs has increased among Japanese companies. In addition, since the financial industry is subject to financial capital regulations, more effective use of capital is required. As a result, our company believes that the optimal allocation of management resources will become even more important for the company in the future. Accordingly, beginning in the year ended March 31, 2020, we have adopted ROE as a key management indicator, which management uses to track the progress of our sustainable business transformation. ROE is defined and calculated as net income attributable to NHI shareholders divided by total NHI shareholders’ equity. We believe that disclosure of ROE is useful to investors in that it helps them to assess our management and effective use of capital to enhance corporate value.
Our medium to long-term ROE target is a level of 8-10% for the fiscal year ended March 2025, reflecting the cost of capital demanded by our company. However, ROE may be of limited use in that it does not necessarily reflect financial soundness. In order to avoid the excessive pursuit of capital efficiency with the aim of improving ROE at the expense of financial soundness, we attach importance to the creation of corporate value, giving due consideration to financial soundness, and thereby improving ROE.
There are multiple global financial regulations that Nomura Group must comply with, and, among these, the capital regulations established by Basel Committee on Banking Supervision have a direct impact on the way we conduct business. For this reason, we have set a target of maintaining a common equity Tier 1 ratio (CET1 ratio) of at least 11%. For a detailed description of our CET1 ratio and its calculation, see under Item 5.B. “
” While conducting business with an awareness of capital efficiency through the use of ROE described above, we are also mindful of our financial soundness and is mindful of the buffer in the event of severe market stress. At a meeting held in May 2020, the Board of Directors discussed certain aspects of our business strategies.
Consolidated Regulatory Capital Requirements
The challenges and strategies in each division are as follows:
| • |
Retail Division
|
Based on the basic concept of “Enriching clients by responding to their asset concerns”, Retail Division aims to become a financial institution that is required by many people. We will continue working on improving the skills of our Partners, and enhance wide range of products and services in order to accurately respond to diversifying clients’ asset issues such as; inheritance or anxiety about lack of funds after retirement. Furthermore, in order to deliver products and services to clients who have never used Nomura, we will expand our online services and strengthen our remote consulting structure through call centers and other functions.
| • |
Asset Management Division
|
In our investment trust business, we will pursue providing clients with a diverse range of investment opportunities to meet investors’ various needs, focusing on asset formation and retirement layers, where asset management needs are expected to increase further in the future. In our investment advisory business, we will aim to increase assets under management and expand our client base worldwide by providing value-added investment services.
39
Through our continued effort to deliver superior investment performance, as well as meeting various investment needs, we aim to become an asset management company highly regarded by investors from around the world.
| • |
Wholesale Division
|
The Wholesale division faces challenges presented by increasingly sophisticated needs of clients and technological advancement, coupled with challenged from uncertain market environment and potential economic downturn recently on the back of the
COVID-19
pandemic. To ensure continuity of service as well as added value to clients, we will continue to enhance collaboration across regions and divisions as well as ensure tight risk control. We will continue efforts to diversify business portfolio and deploy financial resources to selective, high growth opportunities.
Global Markets aims to provide uninterrupted liquidity to our clients while positioning portfolio to weather a possible economic downturn, keeping tight risk control and discipline. Additionally, opportunistically pursue growth opportunities in areas like asset-side structured business / structured finance as well as client coverage and continue to make progress in digitization of Flow business and improved efficiency, differentiation.
In Investment Banking, we will continue to support our clients’ cross-border M&A ambitions, facilitate their fundraising activities both in Japan and other geographies, as well as provide the full product suite of our Solutions Business as our clients continue to pursue the globalization of their business activities.
| • |
Merchant Banking Division
|
The Merchant Banking Division will primarily provide equity as a new solution for business reorganizations and revitalizations, business succession as well as management buyouts to cater to the increasingly diversified and sophisticated needs of our clients. The Merchant Banking Division will, under proper management of risk, focus on support for improving the enterprise value of portfolio companies, and will contribute to expansion of the private equity market.
| • |
Risk Management and Compliance, etc.
|
At the Nomura Group, the types and levels of risks for the purpose of achieving strategic objectives and business plans based on management philosophy is set forth as the Risk Appetite. We will continue to develop a risk management framework which ensures financial soundness, enhances corporate value, and is strategically aligned to the business plan and incorporated in decision making by senior management.
With regard to compliance, we will continue to focus on improving the management structure to comply with local laws and regulations in the countries where we operate. We also continue to review our internal systems and rules so that all executive management and employees can work autonomously with high ethical standards.
In March 2019, there was an incident that information related to the listing and delisting criteria for the upper market under review by the Tokyo Stock Exchange was handled improperly from the viewpoint of ensuring fair and sound markets in the course of communicating information at Nomura Securities Co., Ltd. In May the same year, Japan’s Financial Services Agency issued a business improvement order against Nomura Holdings and Nomura Securities for their management control framework relating to information management. We have taken this matter very seriously, and are reviewing our organizational structures and developing rules. In addition, in order to ensure not only compliance with laws and regulations, but also that all executive management and employees are able to act in accordance with social norms, Nomura Group has established the “Nomura Group Code of Conduct” as guidelines for action to be taken, and is developing an effective internal management system to promote appropriate actions (Conduct) based on the Code of Conduct.
40
In addition, Nomura Group established the Nomura Founding Principles and Corporate Ethics Day in 2015. Commemorated annually, this day aims to remind all of our executive officers and employees of the lessons learned from the incident and to renew our determination to prevent similar incidents from recurring in the future and further improve public trust In this initiative, we strive to maintain a sound corporate culture through discussions on appropriate conduct, and will make further efforts to enable all of our executive officers and employee to act with high ethical standards as professionals engaged in capital markets.
As described above, we are working to achieve our management targets and devote our efforts to the stability and further develop financial and capital markets. Also, we aim to be a financial services group that society needs and our clients trust.
41
C. Organizational Structure.
The following table lists the Company and its significant subsidiaries and their respective countries of incorporation. Indentation indicates the principal parent of each subsidiary. Proportions of ownership interest include indirect ownership.
|
Name
|
Country/Region
|
|
Ownership
Interest
|
|
||||
|
|
|
|
(%)
|
|
||||
|
Nomura Holdings, Inc.
|
Japan
|
—
|
||||||
|
Nomura Securities Co., Ltd.
|
Japan
|
100
|
||||||
|
Nomura Asset Management Co., Ltd.
|
Japan
|
100
|
||||||
|
The Nomura Trust & Banking Co., Ltd.
|
Japan
|
100
|
||||||
|
Nomura Babcock & Brown Co., Ltd.
|
Japan
|
100
|
||||||
|
Nomura Capital Investment Co., Ltd.
|
Japan
|
100
|
||||||
|
Nomura Investor Relations Co., Ltd.
|
Japan
|
100
|
||||||
|
Nomura Funds Research and Technologies Co., Ltd.
|
Japan
|
100
|
||||||
|
Nomura Research & Advisory Co., Ltd.
|
Japan
|
100
|
||||||
|
Nomura Business Services Co., Ltd.
|
Japan
|
100
|
||||||
|
Nomura Facilities, Inc.
|
Japan
|
100
|
||||||
|
Nomura Institute of Capital Markets Research
|
Japan
|
100
|
||||||
|
Nomura Healthcare Co., Ltd.
|
Japan
|
100
|
||||||
|
Nomura Agri Planning & Advisory Co., Ltd.
|
Japan
|
100
|
||||||
|
Nomura Land and Building Co., Ltd.
|
Japan
|
100
|
||||||
|
Nomura Financial Products & Services, Inc.
|
Japan
|
100
|
||||||
|
Nomura Institute of Estate Planning
|
Japan
|
100
|
||||||
|
N-Village
Co., Ltd.
|
Japan
|
100
|
||||||
|
Nomura Capital Partners Co., Ltd.
|
Japan
|
100
|
||||||
|
Nomura Mezzanine Partners Co., Ltd.
|
Japan
|
100
|
||||||
|
Corporate Design Partners Co., Ltd.
|
Japan
|
100
|
||||||
|
Nomura Kagayaki Co., Ltd.
|
Japan
|
100
|
||||||
|
Nomura Asia Pacific Holdings Co., Ltd.
|
Japan
|
100
|
||||||
|
Nomura International (Hong Kong) Limited
|
Hong Kong
|
100
|
||||||
|
Nomura Singapore Limited
|
Singapore
|
100
|
||||||
|
Nomura Securities Singapore Pte. Ltd.
|
Singapore
|
100
|
||||||
|
Nomura Australia Limited
|
Australia
|
100
|
||||||
|
PT Nomura Sekuritas Indonesia
|
Indonesia
|
96
|
||||||
|
Nomura Asia Investment (Fixed Income) Pte. Ltd.
|
Singapore
|
100
|
||||||
|
Nomura Asia Investment (Singapore) Pte. Ltd.
|
Singapore
|
100
|
||||||
|
Capital Nomura Securities Public Co., Ltd.
|
Thailand
|
99
|
||||||
|
Nomura Financial Advisory and Securities (India) Private Limited
|
India
|
100
|
||||||
|
Nomura Holding America Inc.
|
U.S.
|
100
|
||||||
|
Nomura Securities International, Inc.
|
U.S.
|
100
|
||||||
|
Nomura Corporate Research and Asset Management Inc.
|
U.S.
|
100
|
||||||
|
Nomura Derivative Products Inc.
|
U.S.
|
100
|
||||||
|
Nomura America Mortgage Finance, LLC
|
U.S.
|
100
|
||||||
|
Nomura Global Financial Products, Inc.
|
U.S.
|
100
|
||||||
|
NHI Acquisition Holding, Inc.
|
U.S.
|
100
|
||||||
|
Instinet Incorporated
|
U.S.
|
100
|
||||||
|
Nomura Europe Holdings plc
|
U.K.
|
100
|
||||||
|
Nomura International plc
|
U.K.
|
100
|
||||||
|
Nomura Bank International plc
|
U.K.
|
100
|
||||||
|
Nomura Financial Products Europe GmbH
|
Germany
|
100
|
||||||
|
Banque Nomura France
|
France
|
100
|
||||||
|
Nomura Bank (Luxembourg) S.A.
|
Luxemburg
|
100
|
||||||
|
Nomura Bank (Switzerland) Ltd.
|
Switzerland
|
100
|
||||||
|
Nomura Europe Finance N.V.
|
The Netherlands
|
100
|
||||||
|
Nomura European Investment Limited
|
U.K.
|
100
|
||||||
|
Nomura Asia Investment (India Powai) Pte. Ltd.
|
Singapore
|
100
|
||||||
|
Nomura Services India Private Limited
|
India
|
100
|
||||||
|
Nomura International Funding Pte. Ltd.
|
Singapore
|
100
|
||||||
|
Nomura Orient International Securities Co., Ltd.
|
China
|
51
|
||||||
42
D. Property, Plants and Equipment.
Our Properties
As of March 31, 2020, our principal head office is located in Tokyo, Japan and occupies 1,007,309 square feet of office space. Our other major offices in Japan are our Osaka branch office, which occupies 125,184 square feet, our Nagoya branch office, which occupies 82,914 square feet, and the head office of NAM in Tokyo, which occupies 178,218 square feet.
As of March 31, 2020, our major offices outside Japan are the head offices of NIP located in London, which occupies 239,777 square feet, the New York head office of Nomura Securities International, Inc., which occupies 194,770 square feet, and the offices of Nomura International (Hong Kong) Limited located in Hong Kong which occupies 146,389 square feet. We lease most of our overseas office space.
As of March 31, 2020, the major office of Nomura Services India Private Limited, our specialized service company in Mumbai, India, occupies 562,038 square feet.
As of March 31, 2020, the aggregate book value of the land and buildings we owned was ¥121 billion, and the aggregate book value of equipment we owned, including communications and data processing facilities, was ¥36 billion.
Item 4A. Unresolved Staff Comments
We are a large accelerated filer as defined in Rule
12b-2
under the Securities Exchange Act of 1934. There are no written comments which have been provided by the staff of the Securities and Exchange Commission regarding our periodic reports under that Act not less than 180 days before the end of the fiscal year ended March 31, 2020 and which remain unresolved as of the date of the filing of this annual report with the Commission.
Item 5. Operating and Financial Review and Prospects
A. Operating Results.
You should read the following discussion of our operating and financial review and prospects together with Item 3.A “Selected Financial Data” of this annual report and our consolidated financial statements included elsewhere in this annual report.
This discussion and analysis contains forward-looking statements that involve risks, uncertainties and assumptions. Our actual results may differ materially from those anticipated in these forward-looking statements as a result of factors, including, but not limited to, those under Item 3.D “Risk Factors” and elsewhere in this annual report.
Business Environment
Japan
The performance of Japan’s economy deteriorated substantially in the latter half of the fiscal year ended March 31, 2020. Real gross domestic product (GDP) grew by 2.1% on a
quarter-on-quarter
annualized basis in April-June 2019, but then flattened out with 0.0% growth in July-September. The country’s economy then saw two consecutive quarters of substantial contraction, with real GDP shrinking by 7.3% in October-December 2019 and by 3.4% in January-March 2020. Exports from Japan were weak since the start of the fiscal year, as global economic growth had already started slowing as a result of U.S.-China trade friction. Up through the July-September quarter, however, capital spending remained at a high level, buoyed by labor-saving investments
43
pursued by companies dealing with labor shortages, and consumer spending and housing investment trended upward thanks in part to rush demand ahead of the consumption tax rate hike that went into effect in October 2019. Once the consumption tax rate was raised, however, consumer spending slumped on the backlash from the last-minute demand ahead of the tax hike, and corporate capital spending followed consumer spending sharply downward. There were signs early in 2020 that the decline in economic activity was coming to a halt, but the global spread of
COVID-19
then started putting fresh downward pressure on economic activity. China intentionally suppressed economic activity in Wuhan and many other cities as a way to contain the pandemic, and European countries and the United States soon followed suit. In Japan, the national government issued a call to the populace in February 2020 to minimize movements outside the home and to consider canceling events with a nationwide audience, and in March 2020, the Tokyo Metropolitan Government called on residents of the prefecture not to venture outside the home on
non-urgent
business. Restrictions on international arrivals and immigration were strengthened around the same time. The number of visitors to Japan dropped off steeply as a result, declining by more than 90%
year-on-year
on March, and exports, consumer spending, and various other sorts of economic activity all fell off sharply.
With respect to corporate earnings, recurring profits at major companies in the fiscal year ended March 31, 2019 declined steeply
year-on-year,
hit by both U.S.-China trade friction and the COVID-19 pandemic. The U.S.-China trade issues blunted global economic growth, and among manufacturers, earnings deteriorated in materials industries and processing industries alike. In a number of industry sectors, profits were also dragged down by the recording of unrealized valuation losses on equity securities, forced by changes in the market valuations of companies’ shareholdings. However, some industries did manage to achieve strong earnings performance, including the software industry, where the amusement
sub-sector
benefitted from strong sales of new game consoles and the system application
sub-sector
benefitted from corporate investment in labor-saving technology. Estimated recurring profits at major companies (those in the Russell/Nomura Large Cap Index) with fiscal years ending in March 2020 fell by 18.7%
year-on-year,
for the first profit decline in four years. Estimated return on equity (ROE) for the fiscal year ending in March 2020 came to 6.7%, significantly worse than the ROE result of 9.2% for the previous fiscal year.
In the equity market, Japanese stocks at one point touched highs not seen since 2018, as investors welcomed the news of progress in U.S.-China trade negotiations. However, Japan’s major stock indices ended up declining for the second fiscal year in a row due to worries over the impact that the spreading
COVID-19
pandemic would have on the economy, both at home and abroad. From the beginning of the fiscal year ending in March 2020 through August 2019, Japanese equities alternately advanced and retreated in response to the shifting outlook for the outcome of U.S.-China trade talks. Investor sentiment then improved starting in September 2019 on the combination of expectations for a resolution to the U.S.-China trade standoff and a swing back to monetary easing in Europe and the United States. A marked uptrend in Japanese equities ensued. The Nikkei Stock Average closed above 24,000 on December 13, 2019, doing so for the first time in roughly 14 months, and remained at a high level into the new year. Shortly thereafter, however, Japanese stocks turned downward as investors increasingly took to the view that the spreading
COVID-19
outbreak in China would cause a slump in Chinese manufacturing output and consumption. These concerns soon turned into worries over the negative impact on global economic growth from the growing number of reported new infections in Japan and elsewhere, and U.S. stocks led what turned into a deep correction in major stock markets worldwide. The Nikkei Stock Average even briefly dipped below 17,000 in March 2020, but U.S. stocks then rebounded on hopes for economic stimulus, and Japanese stocks pared their losses by the end of the month. The Tokyo Stock Price Index (“TOPIX”), a broadly representative index of Japanese stock performance, closed at 1,403.4 at the end of March 2020, down 11.8% from its
end-March
2019 close of 1,591.64. The Nikkei Stock Average similarly finished the year down 10.8%, falling from 21,205.81 as of the end of March 2019 to 18,917.01 at the end of March 2020.
In the bond market, yields remained confined to a fairly tight range as a result of the BOJ keeping up its program of quantitative and qualitative easing (“QQE”) with yield curve control (“YCC”). Even so, yields drifted generally downward through early September 2019 and then started rising thereafter. The yield on newly issued
10-year
Japanese government debt securities started off April 2019 at roughly
-0.05%,
and from there moved
44
generally downward as U.S.-China trade friction and other forces clouded the global economic outlook, eventually falling to as low as
-0.295%
on September 4, 2019. The BOJ was also becoming increasingly concerned, and at its monetary policy meeting held on July 30, 2019, the Bank formalized its stance that it would “not hesitate to take additional easing measures” if needed. This change in language fueled market expectations that the BOJ would lower its policy interest rate further or adopt additional easing measures of some other sort, and the result was further downward pressure on yields. Subsequently, however, a U.S.-China trade agreement began to look more likely, spurring hopes that the global economy was on its way to bottoming out and sending the yield on newly issued
10-year
Japanese government debt securities upward again, to around 0% by
mid-January
2020. In the interim, the BOJ indicated at its September 19 meeting that it would reexamine economic and price developments when updating its outlook for economic activity and prices at its meeting in October 2019. Although this brought on heightened expectations in the market for additional monetary easing, the BOJ ultimately did not lower its policy interest rate. From late January 2020 onward, as the spreading
COVID-19
outbreak led to growing worry over the global economic outlook, the yield on newly issued
10-year
Japanese government debt securities turned downward again, falling to
-0.165%
on March 9, 2020. Thereafter, the
10-year
yield reversed course as dollar-buying demand surged on news of the virus spreading widely in the United States, and by March 23, 2020 it had climbed to 0.080%. Demand for the dollar then stabilized, and the yield on newly issued
10-year
Japanese government debt finished March 2020 back at approximately 0%. The BOJ held an extraordinary monetary policy meeting on March 16, 2020 at which it promised an ample supply of liquidity, and it increased the amount of its actual government debt security purchases in March. These actions seem to have helped to stabilize yields.
In foreign exchange markets, USD/JPY started the fiscal year above $1 = ¥110, but the yen then appreciated steeply starting in May 2019 on concerns over U.S.-China friction. The yen gained against the dollar over the course of the summer, with USD/JPY even falling below $1 = ¥105 in August 2019 after the Fed’s preemptive rate cut in July 2019. USD/JPY eventually recovered to above $1 = ¥112 in February 2020, after expectations for a U.S.-China trade agreement began building in September 2019 and the two countries actually reached a
phase-one
deal in January 2020. However, the spread of the
COVID-19
outbreak to Europe and the United States from China rattled markets starting in late February 2020, and the yen appreciated steeply enough to send USD/JPY briefly below $1 = ¥102 in early March 2020. The turbulence continued, with USD/JPY actually returning to above $1 = ¥111 in late March 2020 as global demand for dollar liquidity increased. USD/JPY ended up finishing March 2020 at $1 = ¥107.54 as the supply of dollar liquidity provided by the FRB and the BOJ late in the month eased what had been relentless upward pressure on the dollar.
Meanwhile, EUR/JPY started the fiscal of 2019 at around
€
1 = ¥125, but fell to below
€
1 = ¥116 during the summer as concern over the U.S.-China trade standoff caused the mood to turn more
risk-off
and investors increasingly came to expect that the European Central Bank (“ECB”) would resume monetary easing. EUR/JPY ultimately finished at
€
1 = ¥118.64, as the yen came under upward pressure against the euro again as the
COVID-19
pandemic spread to Europe.
Overseas
Global economic growth slowed during the summer of 2019. The heightened worry over U.S.-China trade tensions destabilized financial markets, prompting major central banks to resume monetary easing. In the United States, the Federal Reserve Board (“FRB”) began making preemptive rate cuts in July, while in the euro area, the ECB settled on an easing package in September that included taking the negative policy interest rate lower while
re-introducing
quantitative easing. The BOJ, despite also becoming the subject of expectations for further easing, chose not to go deeper with its negative policy interest rate. Beginning in late summer, expectations for a global economic recovery picked up as the manufacturing sector entered an up leg in the business cycle and a resolution to the U.S.-China trade standoff began to look more likely. Once 2020 got under way, the threat posed by the
COVID-19
outbreak began to weigh on the global economy. Economic growth in the world’s major economies fell off steeply in January-March 2020, with the four economic powerhouses of the United States, the euro area, Japan, and China all sinking into negative growth. Slowed economic growth became a worry for commodity countries and
oil-producing
countries as well, with the price of crude oil plummeting in March.
45
In the United States, GDP for calendar year 2019 grew by 2.3%. While this was slower than the growth for calendar year 2018 at 2.9%, it nevertheless represented a gradual recovery. Up through the middle of 2019, the United States hiked tariffs on Chinese imports and broadened the scope of imports subject to the tariffs, and concerns mounted that the manufacturing sector in particular would suffer a slowdown. The FRB executed a series of three 25bp rate cuts in response. Trade worries eased over the course of the latter half of 2019 as the United States and China worked their way closer to an agreement. The United States and China ultimately signed a
phase-one
trade agreement in January 2020. Beginning in late February, however, social distancing measures and
stay-at-home
restrictions put in place to combat the
COVID-19
outbreak brought about a deep slump in the U.S. economy. Real GDP in the United States contracted by a steep 4.8% on a
quarter-on-quarter
annualized basis in January-March 2020. The FRB responded to the sharp
drop-off
in economic activity with a massive monetary easing package in March. In addition to a zero interest rate policy (with the target range for the federal funds rate set at
0.00%-0.25%),
the range of measures introduced to ease credit and provide liquidity included a promise to buy U.S. Treasury securities and agency mortgage-backed securities (“MBSs”) in the amounts needed to preserve market functioning (effectively a commitment to unlimited purchases) and the establishment of a new facility for purchases of corporate bonds. Also by the end of March, the United States enacted fiscal stimulus measures totaling more than $2 trillion. Consumer price inflation in the United States slowed from 1.9%
year-on-year
as of the end of March 2019 to 1.5% as of the end of March 2020. The Dow Jones Industrial Average closed at 21,917 at the end of March 2020, down 15% from its
end-March
2019 close of 25,929. The yield on
10-year
U.S. Treasury securities dropped by 1.74% over that span, falling from 2.41% as of the end of March 2019 to 0.67% as of the end of March 2020.
The euro area economy managed to keep up positive growth in 2019, but the pace of growth went slack, particularly in the manufacturing sector. Strengthened environmental regulations that the EU imposed on new vehicles in the autumn of 2018 had a negative impact on demand for new automobiles by way of the resulting rise in average new vehicle prices. The automotive sector thus ended up being at the center of a decline in manufacturing sector output. To address the economic sluggishness, the ECB announced a cut to its deposit facility interest rate (its primary policy interest rate) in September 2019 along with the resumption of quantitative easing. The risk of the bottom dropping out of the euro area economy subsequently receded with the U.K.’s relatively smooth departure from the EU at the end of January 2020 and the news that economic relations between the U.K. and the EU would remain unaltered through the end of 2020. In March, however, the number of reported
COVID-19
cases in Europe surged, and the economy rapidly deteriorated as national governments responded with
stay-at-home
restrictions. In the January-March 2020 quarter, the euro area’s real GDP suffered its worst
quarter-on-quarter
decline since the euro area’s inception in 1999, and the ECB announced an expansion of its quantitative easing measures in March.
In
ex-Japan
Asia, China’s real GDP grew by 6.1% in 2019, continuing the pattern of slowing growth that has taken shape in recent years. One major factor here is that Chinese authorities worked harder to control the hidden debts of regional and local governments; another is that U.S.-China trade friction did damage to private-sector appetite for capital spending. Monetary policy stayed on the easing track it has been on since late 2018, but fundraising by private-sector companies in capital markets stagnated. The Chinese government, for its part, ramped up economic stimulus measures in dealing with the spread of COVID-19. Already as of March 2020, growth in domestic infrastructure spending had picked up remarkably
year-on-year,
and credit expansion has accelerated again.
Ex-Japan
Asia managed to achieve solid economic growth in 2019 (excluding Hong Kong, which was hit with widespread demonstrations), although exports from the region and consumption within the region sharply declined in March as the COVID-19 pandemic took its toll.
Executive Summary
As described in “—Business Environment” above, the business environment surrounding our company has changed significantly. Furthermore, from a regulatory perspective, in addition to the implementation of Basel III requirements relating to capital ratio, liquidity ratio, and leverage ratio, Nomura has been identified as one of Domestic Systemically Important Banks. Nomura will continue to monitor closely and take necessary measures
46
in responding to wide-ranging reforms as part of the global tightening of financial regulations. Also, amid the global economic downturn caused by the
COVID-19
pandemic and subsequent changes in monetary policies by central banks as well as uncertainty created by Brexit in January 2020, Nomura is contemplating and implementing appropriate measures by paying necessary attention to the changes in global operating environment.
In such a difficult environment, we made a company-wide effort to rebuild the business platform announced in April 2019, as a result of our ongoing initiatives and continuing focus on providing solutions to our clients in areas where we have a competitive advantage, pretax income rebounded strongly, while our environment is changing drastically.
We generated net revenue of ¥1,287.8 billion for the year ended March 31, 2020, a 15.3% increase from the previous fiscal year.
Non-interest
expenses decreased by 10.0% to ¥1,039.6 billion, income before income taxes was ¥248.3 billion, and net income attributable to the shareholders of Nomura Holdings, Inc. was ¥217.0 billion. Return on equity (“ROE”) was 8.2%. Diluted EPS
(1)
for the year ended March 31, 2020 was ¥66.20, an increase from diluted loss per share of ¥29.92 for the year ended March 31, 2019.
We have decided to pay a dividend of ¥5 per share to shareholders of record as of March 31, 2020. As a result, the total annual dividend was ¥20 per share.
Based on our long-term management vision “Vision C & C” which targeted the fiscal year ended March 2020, we have designated net income per share (EPS) as a key management indicator and worked to continuously improve this indicator. However, with the establishment of the new structure in April 2020, we have decided to use return on equity (ROE) as a management indicator and to pursue sustainable business reforms. At the same time, we have set a pretax profit target of ¥280 billion for the Retail, Asset Management and Wholesale businesses in fiscal 2023.
In our Retail Division, net revenue for the year ended March 31, 2020 decreased by 0.9% from the previous fiscal year to ¥336.4 billion.
Non-interest
expenses decreased by 1.1% to ¥286.9 billion. As a result, income before income taxes decreased by 0.1% to ¥49.4 billion. Based on the basic concept of “Enriching clients by responding to their asset concerns”, Retail Division has been working on consulting business in close cooperation with each customer with the aim of becoming “the most trusted partner”. In the current fiscal year, sales of investment trusts and equities were sluggish due to the decline in customers’ investment mindset against the backdrop of the unstable market environment, which was exacerbated by the COVID-19 pandemic. However, signs of changes are beginning to appear, as we have made a transition to the sales structure that meets the needs of our clients. In addition to Asset Management, we will enhance our products and services such as; Real Estate, Inheritance, or Succession, which aims to provide various solutions and advices to clients’ entire asset. We are also taking digital approaches in addition to
face-to-face
approaches, to provide services to a wider range of clients. We will further strengthen our digital approach.
In our Asset Management Division, net revenue for the year ended March 31, 2020 decreased by 5.4% from the previous fiscal year to ¥92.6 billion.
Non-interest
expenses increased by 0.3% to ¥63.8 billion. As a result, income before income taxes decreased by 15.8% to ¥28.8 billion. In the investment trust business, the inflow to ETFs, funds that contribute to asset formation and funds for defined contribution pension plans for the concept of “100 years of life” (the idea that Japanese individuals should prepare financially to live to 100 years of age) is continuing. On the other hand, there was an outflow of funds such as emerging markets funds. In the investment advisory business, although we saw cash inflow mainly from public pension funds, there was an outflow mainly from high yield related products in overseas. As a result, revenue decreased as assets under management decreased from the end of the previous fiscal year as of March 31, 2020, and due to the valuation of American Century Investments, our strategic partner.
In our Wholesale Division, net revenue for the year ended March 31, 2020 increased by 16.8% from the previous fiscal year to ¥648.6 billion.
Non-interest
expenses decreased by 16.6% to ¥556.4 billion. As a result,
|
(1)
|
Diluted net income attributable to Nomura Holdings’ shareholders per share (loss). |
47
income before income taxes was ¥92.2 billion. In Global Markets, the year ended March 2020, we focused on core strengths in each region and stabilizing our performance, following strategic repositioning of business undertaken in April 2019. As a result, we delivered steady performance in both Fixed Income and Equities and continued to remain engaged with our clients, despite geopolitical uncertainties leading to challenging market environment for most part of the year. For Investment Banking, the global IB business performed stably until the third quarter, but the decline in customer activity and in the market caused by the spread of
COVID-19
in the fourth quarter affected business results. On the other hand, the diversification of revenue opportunities that we have worked on mainly overseas has progressed. Europe, Middle East and Africa (“EMEA”) and Asia
ex-Japan
(“AEJ”) revenues from M&A and DCM (debt-related fundraising business) exceeded the previous fiscal year’s revenue respectively. We provide custom-made solutions by carefully grasping the needs of our clients.
On April 1, 2020, we completed the acquisition of Greentech Capital, LLC, an M&A boutique that is strong in sustainable technology and infrastructure.
Results of Operations
Overview
The following table provides selected consolidated statements of income information for the years ended March 31, 2018, 2019 and 2020.
|
|
Millions of yen, except percentages
|
|||||||||||||||||||
|
|
Year ended March 31
|
|||||||||||||||||||
|
|
2018
|
|
2019
|
|
% Change from
previous year |
|
2020
|
|
% Change from
previous year |
|
||||||||||
|
Non-interest
revenues:
|
|
|
|
|
|
|||||||||||||||
|
Commissions
|
¥ |
373,313
|
¥ |
293,069
|
(21.5
|
)% | ¥ |
308,805
|
5.4
|
% | ||||||||||
|
Fees from investment banking
|
101,663
|
101,521
|
(0.1
|
) |
103,222
|
1.7
|
||||||||||||||
|
Asset management and portfolio service fees
|
245,616
|
245,519
|
—
|
238,202
|
(3.0
|
) | ||||||||||||||
|
Net gain on trading
|
442,885
|
342,964
|
(22.6
|
) |
356,609
|
4.0
|
||||||||||||||
|
Gain (loss) on private equity and debt investments
|
(869
|
) |
1,007
|
—
|
(93
|
) |
—
|
|||||||||||||
|
Gain (loss) on investments in equity securities
|
2,683
|
(6,983
|
) |
—
|
(14,726
|
) |
—
|
|||||||||||||
|
Other
|
221,192
|
81,057
|
(63.4
|
) |
165,991
|
104.8
|
||||||||||||||
|
Total
Non-interest
revenues
|
1,386,483
|
1,058,154
|
(23.7
|
) |
1,158,010
|
9.4
|
||||||||||||||
|
Net interest revenue
|
110,486
|
58,616
|
(46.9
|
) |
129,819
|
121.5
|
||||||||||||||
|
Net revenue
|
1,496,969
|
1,116,770
|
(25.4
|
) |
1,287,829
|
15.3
|
||||||||||||||
|
Non-interest
expenses
|
1,168,811
|
1,154,471
|
(1.2
|
) |
1,039,568
|
(10.0
|
) | |||||||||||||
|
Income (loss) before income taxes
|
328,158
|
(37,701
|
) |
—
|
248,261
|
—
|
||||||||||||||
|
Income tax expense
|
103,866
|
57,010
|
(45.1
|
) |
28,894
|
(49.3
|
) | |||||||||||||
|
Net income (loss)
|
¥ |
224,292
|
¥ |
(94,711
|
) |
—
|
% | ¥ |
219,367
|
—
|
% | |||||||||
|
Less: Net income attributable to noncontrolling interests
|
4,949
|
5,731
|
15.8
|
2,369
|
(58.7
|
) | ||||||||||||||
|
Net income (loss) attributable to NHI shareholders
|
¥ |
219,343
|
¥ |
(100,442
|
) |
—
|
% | ¥ |
216,998
|
—
|
% | |||||||||
|
Return on equity
|
7.9
|
% |
(3.7
|
) % |
|
8.2
|
% |
|
||||||||||||
Net revenue
Commissions
Net gain on trading
Commissions
48
increased from the year ended March 31, 2019 to the year ended March 31, 2020 primarily due to an increase in commissions received from the distribution of investment trusts and brokerage commissions received from equity and equity-related products.
increased from the year ended March 31, 2019 to the year ended March 31, 2020 primarily due to an increase in revenue from M&A advisory services and our solution services associated with fund raising.
decreased from the year ended March 31, 2019 to the year ended March 31, 2020 in response to the decrease in assets under management.
increased from the year ended March 31, 2019 to the year ended March 31, 2020, primarily driven by an increase in revenue from the Fixed Income business.
also included total gains of ¥17.5 billion attributable to changes in Nomura’s own creditworthiness with respect to derivative liabilities primarily due to a widening of Nomura’s credit spreads particularly as a result of the
increased from the year ended March 31, 2019 to the year ended March 31, 2020, primarily due to the realized gain of ¥73,293 million by the partial sale of Nomura’s investment in ordinary shares of Nomura Research Institute, Ltd.
Fees from investment banking
Asset management and portfolio service fees
Net gain on trading
Net gain on trading
COVID-19
pandemic during the fiscal year.
Other
Net revenue
Commissions
Net gain on trading
Commissions
Fees from investment banking
Asset management and portfolio service fees
Net gain on trading
Net gain on trading
Other
Net interest revenue
Net interest revenue
Net interest revenue
Non-interest revenues
Net
interest revenue
Net interest revenue
Gain (loss) on investments in equity securities
COVID-19
pandemic in the year ended March 31, 2020.
Non-interest expenses
49
Non-interest expenses
We are subject to a number of different taxes in Japan and have adopted the consolidated tax filing system permitted under Japanese tax law. The consolidated tax filing system only imposes a national tax. Nomura’s domestic effective statutory tax rate was approximately 31% for the fiscal year ended March 31, 2018, 2019 and 2020, respectively. Our foreign subsidiaries are subject to the income taxes of the countries in which they operate, which are generally lower than those in Japan. The Company’s effective statutory tax rate in any one year is therefore dependent on our geographic mix of profits and losses and also on the specific tax treatment applicable in each location.
Income tax expense
Non-taxable
income which decreased the effective tax rate by 23.5%, partially offset by
Non-deductible
expenses which increased the effective tax rate by 2.9%.
Income tax expense
Non-deductible
expenses which decreased the effective tax rate by 110.3%, partially offset by
Non-taxable
income which increased the effective tax rate by 16.8%.
Income tax expense
Results by Business Segment
Our operating management and management reporting is prepared based on our Retail, Asset Management and Wholesale divisions and we disclose business segment information in accordance with this structure. Our Merchant Banking division is reported as part of our Other segment.
Realized gain on investments in equity securities held for operating purposes, our share of equity in the earnings of affiliates, corporate items and other financial adjustments (including the operating results of our Merchant Banking division) are included as “Other” operating results outside of business segments in our segment information. Unrealized gain (loss) on investments in equity securities held for operating purposes is classified as a reconciling item outside of our segment information. The following segment information should be read in conjunction with Item 4.B “
” of this annual report and Note 22 “
” in our consolidated financial statements included in this annual report. The reconciliation of our segment results of operations and consolidated financial statements is provided in Note 22 “
” in our consolidated financial statements included in this annual report.
Business Overview
Segment and geographic information
Segment and geographic information
Retail
In our Retail division, our sales activities focus on providing consultation services and investment proposals to clients for which we receive commissions and fees. Additionally, we receive fees from asset management companies in connection with administration services we provide in connection with investment trust certificates that we distribute. We also receive agent commissions from insurance companies for the insurance products we sell as an agent.
50
Operating Results of Retail
|
|
Millions of yen
|
|||||||||||||||||||
|
|
Year ended March 31
|
|||||||||||||||||||
|
|
2018
|
|
2019
|
|
% Change from
previous year |
|
2020
|
|
% Change from
previous year |
|
||||||||||
|
Non-interest
revenue
|
¥ |
406,295
|
¥ |
331,743
|
(18.3
|
)% | ¥ |
329,983
|
(0.5
|
)% | ||||||||||
|
Net interest revenue
|
6,613
|
7,737
|
17.0
|
6,376
|
(17.6
|
) | ||||||||||||||
|
Net revenue
|
412,908
|
339,480
|
(17.8
|
) |
336,359
|
(0.9
|
) | |||||||||||||
|
Non-interest
expenses
|
309,771
|
289,990
|
(6.4
|
) |
286,926
|
(1.1
|
) | |||||||||||||
|
Income before income taxes
|
¥ |
103,137
|
¥ |
49,490
|
(52.0
|
)% | ¥ |
49,433
|
(0.1
|
)% | ||||||||||
Net revenue
Net revenue
Non-interest expenses
Non-interest expenses
The following table shows the breakdown of Retail
non-interest
revenues for the year ended March 31, 2019 and 2020.
|
|
Millions of yen
|
|||||||||||
|
|
Year ended March 31
|
|||||||||||
|
|
2019
|
|
2020
|
|
% Change from
previous year |
|
||||||
|
Commissions
|
¥ |
142,764
|
¥ |
153,170
|
7.3
|
% | ||||||
|
Brokerage commissions
|
60,167
|
61,207
|
1.7
|
|||||||||
|
Commissions for distribution of investment trusts
|
57,880
|
66,940
|
15.7
|
|||||||||
|
Other commissions
|
24,717
|
25,023
|
1.2
|
|||||||||
|
Net gain on trading
|
55,829
|
56,756
|
1.7
|
|||||||||
|
Fees from investment banking
|
33,981
|
23,239
|
(31.6
|
) | ||||||||
|
Asset management fees
|
95,384
|
92,139
|
(3.4
|
) | ||||||||
|
Others
|
3,785
|
4,679
|
23.6
|
|||||||||
|
Non-interest
revenues
|
¥ |
331,743
|
¥ |
329,983
|
(0.5
|
)% | ||||||
Commissions
Net gain on trading
Fees from investment banking
51
Retail Client Assets
The following table presents amounts and details regarding the composition of Retail client assets as of March 31, 2019 and 2020. Retail client assets consist of clients’ assets held in our custody and assets relating to variable annuity insurance products.
|
|
Trillions of yen
|
|||||||||||||||||||
|
|
Year ended March 31, 2019
|
|||||||||||||||||||
|
|
Balance at
beginning of year
|
|
Gross inflows
|
|
Gross outflows
|
|
Market
appreciation /
(depreciation)
|
|
Balance at
end of year
|
|
||||||||||
|
Equities
|
¥ |
75.7
|
¥ |
22.5
|
¥ |
(21.4
|
) | ¥ |
(4.9
|
) | ¥ |
71.9
|
||||||||
|
Debt securities
|
17.9
|
29.2
|
(27.2
|
) |
(1.1
|
) |
18.8
|
|||||||||||||
|
Stock investment trusts
|
9.1
|
2.9
|
(2.7
|
) |
(0.3
|
) |
9.0
|
|||||||||||||
|
Bond investment trusts
|
7.1
|
0.3
|
(0.7
|
) |
0.1
|
6.8
|
||||||||||||||
|
Overseas mutual funds
|
1.2
|
—
|
(0.1
|
) |
0.0
|
1.1
|
||||||||||||||
|
Others
|
6.7
|
0.9
|
(0.6
|
) |
0.1
|
7.1
|
||||||||||||||
|
Total
|
¥ |
117.7
|
¥ |
55.8
|
¥ |
(52.7
|
) | ¥ |
(6.1
|
) | ¥ |
114.7
|
||||||||
|
|
Trillions of yen
|
|||||||||||||||||||
|
|
Year ended March 31, 2020
|
|||||||||||||||||||
|
|
Balance at
beginning of year
|
|
Gross inflows
|
|
Gross outflows
|
|
Market
appreciation /
(depreciation)
|
|
Balance at
end of year
|
|
||||||||||
|
Equities
|
¥ |
71.9
|
¥ |
12.4
|
¥ |
(13.4
|
) | ¥ |
(8.2
|
) | ¥ |
62.7
|
||||||||
|
Debt securities
|
18.8
|
29.3
|
(27.3
|
) |
(2.4
|
) |
18.4
|
|||||||||||||
|
Stock investment trusts
|
9.0
|
3.1
|
(3.2
|
) |
(1.3
|
) |
7.6
|
|||||||||||||
|
Bond investment trusts
|
6.8
|
0.9
|
(0.5
|
) |
0.1
|
7.3
|
||||||||||||||
|
Overseas mutual funds
|
1.1
|
0.1
|
(0.1
|
) |
(0.1
|
) |
1.0
|
|||||||||||||
|
Others
|
7.1
|
0.8
|
(1.0
|
) |
0.1
|
7.0
|
||||||||||||||
|
Total
|
¥ |
114.7
|
¥ |
46.6
|
¥ |
(45.5
|
) | ¥ |
(11.8
|
) | ¥ |
104.0
|
||||||||
Retail client assets decreased from March 31, 2019 to March 31, 2020. The balances of our clients’ equity and equity-related products decreased by ¥9.2 trillion from ¥71.9 trillion as of March 31, 2019 to ¥62.7 trillion as of March 31, 2020, mainly due to the disruptions in the Japanese equity market from February 2020 reflecting the effect of the COVID-19 pandemic and increase of net outflows. The balances of our clients’ investment trusts decreased by ¥1.1 trillion from ¥16.9 trillion as of March 31, 2019 to ¥15.8 trillion as of March 31, 2020.
Retail client assets decreased from March 31, 2018 to March 31, 2019. The balances of our clients’ equity and equity-related products decreased by ¥3.8 trillion from ¥75.7 trillion as of March 31, 2018 to ¥71.9 trillion as of March 31, 2019, mainly due to the deterioration of Japanese equity market and increase of net outflows. The balances of our clients’ investment trusts decreased by ¥0.5 trillion from ¥17.4 trillion as of March 31, 2018 to ¥16.9 trillion as of March 31, 2019.
Asset Management
Our Asset Management Division is conducted principally through Nomura Asset Management Co., Ltd. (“NAM”). We earn portfolio management fees through the development and management of investment trusts, which are distributed through Nomura Securities Co., Ltd. (“NSC”), other brokers and banks. We also provide investment advisory services for pension funds and other institutional clients. Net revenue generally consist of asset management and portfolio service fees that are attributable to Asset Management.
52
Operating Results of Asset Management
|
|
Millions of yen
|
|||||||||||||||||||
|
|
Year ended March 31
|
|||||||||||||||||||
|
|
2018
|
|
2019
|
|
% Change from
previous year |
|
2020
|
|
% Change from
previous year |
|
||||||||||
|
Non-interest
revenue
|
¥ |
118,545
|
¥ |
89,607
|
(24.4
|
)% | ¥ |
85,190
|
(4.9
|
)% | ||||||||||
|
Net interest revenue
|
8,792
|
8,238
|
(6.3
|
) |
7,415
|
(10.0
|
) | |||||||||||||
|
Net revenue
|
127,337
|
97,845
|
(23.2
|
) |
92,605
|
(5.4
|
) | |||||||||||||
|
Non-interest
expenses
|
61,167
|
63,660
|
4.1
|
63,833
|
0.3
|
|||||||||||||||
|
Income before income taxes
|
¥ |
66,170
|
¥ |
34,185
|
(48.3
|
)% | ¥ |
28,772
|
(15.8
|
)% | ||||||||||
Net revenue
Net revenue
Non-interest expenses
Non-interest expenses
The following table presents assets under management of each principal Nomura entity within the Asset Management Division as of March 31, 2019 and 2020.
|
|
Billions of yen
|
|||||||||||||||||||||||
|
|
Year ended March 31, 2019
|
|||||||||||||||||||||||
|
|
Balance at
beginning of year
|
|
Adjustment in
beginning balance |
|
Gross inflows
|
|
Gross outflows
|
|
Market
appreciation /
(depreciation)
|
|
Balance at
end of year
|
|
||||||||||||
|
Nomura Asset Management Co., Ltd .
|
¥ |
52,381
|
¥ |
—
|
¥ |
24,988
|
¥ |
(23,850
|
) | ¥ |
(148
|
) | ¥ |
53,371
|
||||||||||
|
Nomura Funds Research and Technologies Co., Ltd.
|
2,765
|
(2,765
|
) |
—
|
—
|
—
|
—
|
|||||||||||||||||
|
Nomura Corporate Research and Asset Management Inc.
|
2,684
|
—
|
902
|
(732
|
) |
157
|
3,011
|
|||||||||||||||||
|
Combined total
|
57,830
|
(2,765
|
) |
25,890
|
(24,582
|
) |
9
|
56,382
|
||||||||||||||||
|
Shared across group companies
|
(7,815
|
) |
2,649
|
(1,187
|
) |
1,521
|
(176
|
) |
(5,008
|
) | ||||||||||||||
|
Total
|
¥ |
50,015
|
¥ |
(116
|
) | ¥ |
24,703
|
¥ |
(23,061
|
) | ¥ |
(167
|
) | ¥ |
51,374
|
|||||||||
53
|
|
Billions of yen
|
|||||||||||||||||||||||
|
|
Year ended March 31, 2020
|
|||||||||||||||||||||||
|
|
Balance at
beginning of year
|
|
Adjustment in
beginning balance |
|
Gross inflows
|
|
Gross outflows
|
|
Market
appreciation /
(depreciation)
|
|
Balance at
end of year
|
|
||||||||||||
|
Nomura Asset Management Co., Ltd .
|
¥ |
53,371
|
¥ |
—
|
¥ |
26,098
|
¥ |
(25,076
|
) | ¥ |
(3,745
|
) | ¥ |
50,648
|
||||||||||
|
Nomura Corporate Research and Asset Management Inc.
|
3,011
|
—
|
568
|
(739
|
) |
(351
|
) |
2,489
|
||||||||||||||||
|
Combined total
|
56,382
|
—
|
26,666
|
(25,815
|
) |
(4,096
|
) |
53,137
|
||||||||||||||||
|
Shared across group companies
|
(5,008
|
) |
—
|
(882
|
) |
1,501
|
577
|
(3,812
|
) | |||||||||||||||
|
Total
|
51,374
|
—
|
25,784
|
(24,314
|
) |
(3,519
|
) |
49,325
|
||||||||||||||||
Notes:
Nomura Funds Research and Technologies Co. , Ltd. was reclassified to Other segment as a result of our organizational structure change in April 2018.
In our investment trust business, asset under management decreased primary due to market depreciation, partially offset by continuous inflow to ETF.
The following table presents NAM’s share, in terms of net asset value, of the Japanese publicly offered investment trusts market as of March
31, 2018, 2019 and 2020.
|
|
March 31
|
|||||||||||
|
|
2018
|
|
2019
|
|
2020
|
|
||||||
|
Total of publicly offered investment trusts
|
27
|
% |
28
|
% |
28
|
% | ||||||
|
Stock investment trusts
|
25
|
% |
26
|
% |
26
|
% | ||||||
|
Bond investment trusts
|
44
|
% |
45
|
% |
44
|
% | ||||||
The investment trust assets included in assets under management by NAM were ¥34.0 trillion as of March 31, 2020, a ¥1.6 trillion, 4% decrease from March 31, 2019. This decrease is due to positive net inflows of ¥1.4 trillion and market depreciation of ¥3.0 trillion. Despite the market depreciation, the balances of certain investment trusts, such as TOPIX Exchange Traded Fund increased.
The investment trust assets included in assets under management by NAM were ¥35.6 trillion as of March 31, 2019, a ¥1.5 trillion, 4% increase from March 31, 2018. This increase is due to positive net inflows of ¥2.2 trillion and market depreciation of ¥0.7 trillion. The balances of investment trusts, such as TOPIX Exchange Traded Fund and Nikkei 225 Exchange Traded Fund increased.
54
Wholesale
Operating Results of Wholesale
The operating results of our Wholesale Division comprise the combined results of our Global Markets and Investment Banking businesses.
|
|
Millions of yen
|
|||||||||||||||||||
|
|
Year ended March 31
|
|||||||||||||||||||
|
|
2018
|
|
2019
|
|
% Change from
previous year |
|
2020
|
|
% Change from
previous year |
|
||||||||||
|
Non-interest
revenue
|
¥ |
587,474
|
¥ |
496,484
|
(15.5
|
)% | ¥ |
506,203
|
2.0
|
% | ||||||||||
|
Net interest revenue
|
127,859
|
58,904
|
(53.9
|
) |
142,416
|
141.8
|
||||||||||||||
|
Net revenue
|
715,333
|
555,388
|
(22.4
|
) |
648,619
|
16.8
|
||||||||||||||
|
Non-interest
expenses
|
614,745
|
666,787
|
8.5
|
556,399
|
(16.6
|
) | ||||||||||||||
|
Income (loss) before income taxes
|
¥ |
100,588
|
¥ |
(111,399
|
) |
—
|
% | ¥ |
92,220
|
—
|
% | |||||||||
Net revenue
Net revenue
Non-interest expenses
Non-interest expenses
one-off
expenses related to revision of business portfolio.
The following table presents a breakdown of net revenue for Wholesale for the year ended March 31, 2018, 2019 and 2020.
|
|
Millions of yen
|
|||||||||||||||||||
|
|
Year ended March 31
|
|||||||||||||||||||
|
|
2018
|
|
2019
|
|
% Change from
previous year |
|
2020
|
|
% Change from
previous year |
|
||||||||||
|
Wholesale net revenue:
|
|
|
|
|
|
|
|
|
|
|
|
|
|
|
|
|||||
|
Global Markets net revenue
|
¥ |
603,197
|
¥ |
453,044
|
(24.9
|
)% | ¥ |
562,927
|
24.3
|
% | ||||||||||
|
Investment Banking net revenue
|
112,136
|
102,344
|
(8.7
|
) |
85,692
|
(16.3
|
) | |||||||||||||
|
Net revenue
|
¥ |
715,333
|
¥ |
555,388
|
(22.4
|
)% | ¥ |
648,619
|
16.8
|
% | ||||||||||
Nomura established Client Financing and Solutions (“CFS”) in April, 2018. In CFS, Global Markets and Investment Banking
co-work
and revenue generated from CFS is allocated to Global Markets and Investment Banking in a certain manner. Accordingly, certain net revenue which was previously allocated to Global Markets has been reclassified to Investment Banking.
55
Global Markets
We have a proven track record in sales and trading of debt securities, equity securities, and foreign exchange, as well as derivative products based on these financial instruments, mainly to domestic and overseas institutional investors. In response to the increasingly diverse and complex needs of our clients, we continue to enhance our trading and product origination capabilities to offer superior products not only to domestic and overseas institutional investors, but also to our Retail and Asset Management Divisions. This cross-divisional approach also extends to Investment Banking, where close collaboration leads to high value-adding solutions for our clients. These ties enable us to identify the types of product of interest for investors and develop and deliver products that meet their needs. We continue to develop extensive ties with institutional investors in Japan and international markets, as well as wealthy investors, public-sector agencies, and regional financial institutions in Japan, and government agencies, financial institutions, and corporations around the world.
Net
nue
Net revenue
Net revenue
Net revenue
Net revenue
Net revenue
The net revenue figures in Global Markets discussed are
non-GAAP
financial measures prepared on a management accounting basis that are a useful supplement to financial information of our Wholesale segment. We disclose these measures to show the performance of Global Markets as an individual business line, which we believe can help enhance the understanding of underlying trends in Global Markets.
Investment Banking
We provide a broad range of investment banking services, such as underwriting and advisory activities. We underwrite offerings of debt, equity and other financial instruments in major financial markets, such as Asia, Europe and the U.S. We have been enhancing our M&A and financial advisory expertise to secure more
high-profile
deals both across and within regions. We develop and forge solid relationships with clients on a long-term basis by providing extensive resources in a seamless fashion to facilitate bespoke solutions.
Net revenue
Net revenue
The net revenue figures in Investment Banking discussed are
non-GAAP
financial measures prepared on a management accounting basis that we believe are a useful supplement to financial information of our Wholesale segment. We disclose these measures to show the performance of Investment Banking as an individual business line, which we believe can help enhance the understanding of underlying trends in Investment Banking.
56
Other Operating Results
Other operating results include net gain (loss) related to economic hedging transactions, realized gain on investments in equity securities held for operating purposes, equity in earnings of affiliates, operating results of the Merchant Banking Division, corporate items, and other financial adjustments. See Note 22 “
” in our consolidated financial statements included within this annual report.
Segment and geographic information
Income (loss) before income taxes
Other operating results for the year ended March 31, 2020 include the negative impact of our own creditworthiness on derivative liabilities which resulted in gains of ¥16,333 million and losses from changes in counterparty credit spreads of ¥12,056 million.
Other operating results for the year ended March 31, 2019 include the negative impact of our own creditworthiness on derivative liabilities which resulted in gains of ¥183 million and losses from changes in counterparty credit spreads of ¥725 million.
Other operating results for the year ended March 31, 2018 include the positive impact of our own creditworthiness on derivative liabilities which resulted in losses of ¥630 million and gains from changes in counterparty credit spreads of ¥6,846 million.
Summary of Regional Contribution
For a summary of our
and long-lived assets by geographic region, see Note 22 “
” in our consolidated financial statements included in this annual report.
net revenue, income (loss) before income taxes
Segment and geographic information
Regulatory Capital Requirements
Many of our business activities are subject to statutory capital requirements, including those of Japan, the U.S., the U.K. and certain other countries in which we operate. For further discussion on statutory capital requirements, see Note 19 “
” in our consolidated financial statements included in this annual report.
Regulatory requirements
Translation Exposure
A significant portion of our business is conducted in currencies other than Japanese Yen—most significantly, U.S. dollars, British pounds and Euros. We prepare financial statements of each of our consolidated subsidiaries in its functional currency, which is the currency of the primary economic environment in which the entity operates. Translation exposure is the risk arising from the effect of fluctuations in exchange rates on the net assets of our foreign subsidiaries. Translation exposure is not recognized in our consolidated statements of income unless and until we dispose of, or liquidate, the relevant foreign subsidiary.
Critical Accounting Policies and Estimates
Critical accounting policies are the accounting policies which have the most significant impact on the preparation of our consolidated financial statements included within this annual report and which require the most difficult, subjective and complex judgments by management to develop estimates used in the application of these policies. Such estimates determined by management include estimates regarding the fair value of financial
57
instruments, the outcome of litigation and tax examinations, the recovery of the carrying value of goodwill, the allowance for doubtful accounts, the realization of deferred tax assets, the impairment of equity method investments and other non-financial assets and other matters that affect the reported amounts of assets and liabilities as well as the disclosures in the consolidated financial statements. Estimates, by their nature, are based on underlying assumptions which require management judgment and depend on the extent of available information. Actual results in future periods may differ from current estimates, which could have a material impact on the consolidated financial statements.
The COVID-19 pandemic has impacted some of the critical accounting estimates used in these consolidated financial statements during the year ended March 31, 2020 and is expected to continue to impact these estimates in future periods. Assumptions around how long the COVID-19 pandemic will last and how long the economies and financial markets in the key jurisdictions in which Nomura and its clients operate will take to recover has, and will continue to, affect these estimates. The key assumptions and estimates impacted by COVID-19 include:
| • | The ability of clients to perform on their contractual obligations to Nomura arising from financial instruments for determination of fair value measurements or allowances for doubtful accounts; |
| • | The volatility and dislocation in global financial markets for determination of fair value measurements; |
| • | The expected duration of declines in global equity markets for determination of fair value measurements and impairment of equity method investments; |
| • | The future use of non-financial assets within Nomura for determination of whether impairments are required; and |
| • | The future profitability of Nomura to realize deferred tax assets. |
The following table summarizes critical accounting policies within our consolidated financial statements, the critical accounting estimates inherent within application of those policies, the nature of the estimates, the underlying assumptions made by management used to derive those estimates and how the
for more information on the critical accounting policies we apply for all of these areas and the relevant additional footnotes referred to in the table for more information around how these critical accounting policies and critical accounting estimates have been applied.
COVID-19
pandemic, has and is expected to continue to impact these estimates and therefore amounts reported in the consolidated financial statements. See Note 1
“Summary of Accounting Policies”
|
Critical
accounting policy |
Critical accounting
estimates |
Underlying subjective key
assumptions by management |
Impact of
COVID-19
pandemic
|
|||
|
Fair value of financial instruments
Note 2
“Fair value measurements”
|
Estimating fair value for financial instruments
|
•
Election of appropriate valuation techniques
•
Principal markets are active or inactive
•
Significance of level 3 inputs
|
•
Dislocated financial markets as a result of the
COVID-19
pandemic has increased market volatility and reduced price transparency for certain financial instruments
•
Updates to inputs used to determine fair value of financial instruments
|
58
|
Critical
accounting policy |
Critical accounting
estimates |
Underlying subjective key
assumptions by management |
Impact of
COVID-19
pandemic
|
|||
|
Allowances for doubtful accounts
Note 7
“Financing receivables”
|
Determination of whether loans, other receivables and loan commitments are impaired and measurement of impairment losses
|
•
Ability of borrowers to pay in accordance with contractual terms of the financial instruments
•
Future cash flows for impaired loans where impairment measurement using a discounted cash flow method.
•
Fair value of collateral in impaired collateral dependent loans.
|
•
Ability of borrowers to pay increasingly subjective as has required consideration both to pay in the short-term while governments imposed lockdowns and similar restrictions on trading, and in the longer-term once the restrictions were lifted and economies were expected to improve.
•
Estimating future cash flows increasingly subjective due to uncertainty in future performance of borrowers
•
Estimating fair value increasingly subjective due to dislocated financial and
non-financial
markets
•
Allowances for credit losses increased to ¥13,012 m as of March 31, 2020 from ¥4,169 m as of March 31, 2019 primarily due to additional impairments identified in the fourth quarter due to the
COVID-19.
|
|||
|
Goodwill and intangible assets
Note 10
“Other assets—Other/Other liabilities”
|
Determination of whether goodwill and intangible assets are impaired and measurement of any impairment loss.
|
•
Identifying impairment indicators which trigger an impairment test
•
Inputs to the fair value of reporting units which include goodwill and fair value of indefinite-life intangibles.
•
Future cash flows for recoverability of finite-lived intangible assets.
|
•
Annual goodwill impairment test performed in the fourth quarter. No impairment loss recognized as estimated fair value of reporting units exceeded carrying value.
•
Annual impairment test of indefinite-lived intangibles performed in the fourth quarter. No impairment loss recognized as estimated fair value exceeded carrying value.
•
The COVID
-19
pandemic was not considered an impairment indicator for finite-lived intangible assets during the fourth quarter. No impairment testing of the relevant asset groups including these intangible assets was required.
|
59
|
Critical
accounting policy |
Critical accounting
estimates |
Underlying subjective key
assumptions by management |
Impact of
COVID-19
pandemic
|
|||
|
Equity method investees
Note 20
“Affiliated companies and other equity-method investees”
|
Determination of whether equity method investees are impaired.
|
•
When a decline in the share price of listed equity method investees below carrying value is other-than-temporary.
|
•
As a result of significant declines in global equity markets during the fourth quarter due to the
COVID-19
pandemic, we assessed and concluded no other-than-temporary impairment losses were required to be recognized.
|
|||
|
Litigation provisions
Note 21
“Commitments, contingencies and guarantees”
|
Determination of whether a loss is probable and measurement of provisions
|
•
Likelihood of eventual loss and ability to appeal or recover the loss from other parties
•
Management appetite to settle the matter
•
Loss amounts when claims are substantial, indeterminate or at an early stage
|
•
While the
COVID-19
pandemic has delayed the potential resolution of certain litigation matters, it has not had a direct significant impact on our litigation provisions as of March 31, 2020.
|
|||
|
Income taxes
Note 16
“Income taxes”
|
Realization of deferred tax assets
|
•
Future profitability of Nomura entities
•
Interpretation of tax rules by courts and regulatory authorities and tax examinations by taxing authorities.
•
Weighting of positive and negative evidence around the likelihood that sufficient future taxable income will be generated to realize deferred tax assets in the relevant tax jurisdiction
|
•
Although estimating future taxable income was increasingly subjective due to uncertainty in future profitability of Nomura, it did not result in a significant impact on our determination of realization of deferred tax assets as of March 31, 2020.
|
Level 3 financial assets as a proportion of total financial assets, carried at fair value on a recurring basis were 5% as of March 31, 2020 (5% as of March 31, 2019) as listed below:
|
|
Billions of yen
|
|||||||||||||||||||
|
|
March 31, 2020
|
|||||||||||||||||||
|
|
Level 1
|
|
Level 2
|
|
Level 3
|
|
Counterparty
and Cash
Collateral
Netting
|
|
Total
|
|
||||||||||
|
Financial assets measured at fair value (Excluding derivative assets)
|
¥ |
6,855
|
¥ |
9,699
|
¥ |
751
|
¥ |
—
|
¥ |
17,305
|
||||||||||
|
Derivative assets
|
71
|
20,921
|
198
|
(19,248
|
) |
1,942
|
||||||||||||||
|
Total
|
¥ |
6,926
|
¥ |
30,620
|
¥ |
949
|
¥ |
(19,248
|
) | ¥ |
19,247
|
|||||||||
60
See Note 2 “
” in our consolidated financial statements included in this annual report.
Fair value measurements
Derivative contracts
We use a variety of derivative financial instruments including futures, forwards, swaps and options, for trading and
non-trading
purposes. All derivatives are carried at fair value, with changes in fair value recognized either through the consolidated statements of income or the consolidated statements of comprehensive income depending on the purpose for which the derivatives are used.
Derivative assets and liabilities with the same counterparty documented under a master netting agreement are offset in the consolidated balance sheets where the specific criteria defined by ASC
” and ASC 815 “
” are met. These criteria include requirements around the legal enforceability of such
210-20
“
Balance Sheet—Offsetting
Derivatives and Hedging
close-out
and offset rights under the master netting agreement. In addition, fair value amounts recognized for the right to reclaim cash collateral (a receivable) and the obligation to return cash collateral (a payable) are also offset against net derivative liabilities and net derivative assets, respectively, where certain additional criteria are met.
Derivative contracts consist of listed derivatives and OTC derivatives. The fair value of listed derivatives are determined based on quoted market prices or valuation models. OTC derivatives are valued using valuation models. Listed derivative and OTC derivative assets and liabilities after netting are shown below:
|
|
Billions of yen
|
|||||||
|
|
March 31, 2019
|
|||||||
|
|
Assets
|
|
Liabilities
|
|
||||
|
Listed derivatives
|
¥ |
103
|
¥ |
241
|
||||
|
OTC derivatives
|
749
|
574
|
||||||
|
|
¥ |
852
|
¥ |
815
|
||||
|
|
Billions of yen
|
|||||||
|
|
March 31, 2020
|
|||||||
|
|
Assets
|
|
Liabilities
|
|
||||
|
Listed derivatives
|
¥ |
559
|
¥ |
716
|
||||
|
OTC derivatives
|
1,383
|
1,093
|
||||||
|
|
¥ |
1,942
|
¥ |
1,809
|
||||
The following table presents the fair value of OTC derivative assets and liabilities as of March 31, 2020 by remaining contractual maturity.
|
|
Billions of yen
|
|||||||||||||||||||||||||||
|
|
March 31, 2020
|
|||||||||||||||||||||||||||
|
|
Years to Maturity
|
|
|
|
|
|||||||||||||||||||||||
|
|
Less than
1 year
|
|
1 to 3
years
|
|
3 to 5
years
|
|
5 to 7
years
|
|
More than
7 years
|
|
Cross-maturity
netting
(1)
|
|
Total
fair value
|
|
||||||||||||||
|
OTC derivative assets
|
¥ |
2,026
|
¥ |
1,319
|
¥ |
944
|
¥ |
617
|
¥ |
3,853
|
¥ |
(7,376
|
) | ¥ |
1,383
|
|||||||||||||
|
OTC derivative liabilities
|
1,748
|
1,256
|
922
|
626
|
3,392
|
(6,851
|
) |
1,093
|
||||||||||||||||||||
| (1) | Represents the impact of netting derivative assets with derivative liabilities for the same counterparty across maturity band categories. Derivative assets and derivative liabilities with the same counterparty in the same maturity category are netted within the maturity category. This column also includes cash collateral netting with the same counterparty. |
61
The fair value of derivative contracts includes adjustments for credit risk, both with regards to counterparty credit risk on positions held and our own creditworthiness on positions issued. We realize gains or losses relating to changes in credit risk on our derivative contracts together with the movements of trading positions, which include derivatives that are expected to mitigate the above mentioned impact of changes in credit risk.
Assets and Liabilities Associated with Investment and Financial Services Business
Exposure to Certain Financial Instruments and Counterparties
Market conditions continue to impact numerous products to which we have certain exposures. We also have exposures to Special Purpose Entities (“SPEs”) and others in the normal course of business.
Leveraged Finance
We provide loans to clients in connection with leveraged
buy-outs
and leveraged
buy-ins.
As this type of financing is usually initially provided through a commitment, we have both funded and unfunded exposures on these transactions.
The following table sets forth our exposure to leveraged finance
with unfunded commitments, presenting funded and unfunded portions
by geographic location of the target company as of March 31, 2020.
|
|
Millions of yen
|
|||||||||||
|
|
March 31, 2020
|
|||||||||||
|
|
Funded
|
|
Unfunded
|
|
Total
|
|
||||||
|
Europe
|
¥ |
120,362
|
¥ |
71,840
|
¥ |
192,202
|
||||||
|
Americas
|
53,878
|
57,280
|
111,158
|
|||||||||
|
Asia and Oceania
|
7,761
|
5,166
|
12,927
|
|||||||||
|
Total
|
¥ |
182,001
|
¥ |
134,286
|
¥ |
316,287
|
||||||
Special Purpose Entities (“SPEs”)
Our involvement with these entities includes structuring, underwriting, as well as, subject to prevailing market conditions, distributing and selling debt instruments and beneficial interests issued by these entities. In the normal course of securitization and equity derivative activities business, we also act as a transferor of financial assets to, and underwriter, distributor and seller of repackaged financial instruments issued by these entities. We retain, purchase and sell variable interests in SPEs in connection with our market-making, investing and structuring activities. Our other types of involvement with SPEs include guarantee agreements and derivative contracts.
For further discussion on Nomura’s involvement with variable interest entities, see Note 6 “
” in our consolidated financial statements included in this annual report.
Securitizations and Variable Interest Entities
Accounting Developments
See Note 1 “
” in our consolidated financial statements included in this annual report.
Summary of accounting policies: New accounting pronouncements adopted during the current year
62
Deferred Tax Assets
Details of deferred tax assets and liabilities
The following table presents details of deferred tax assets and liabilities reported within
, respectively, in the consolidated balance sheets as of March 31, 2020.
Other assets—Other and Other liabilities
|
|
Millions of yen
|
|
||
|
|
March 31, 2020
|
|
||
|
Deferred tax assets
|
|
|
|
|
|
Depreciation, amortization and valuation of fixed assets
|
¥ |
19,932
|
||
|
Investments in subsidiaries and affiliates
|
1,209
|
|||
|
Valuation of financial instruments
|
77,054
|
|||
|
Accrued pension and severance costs
|
24,356
|
|||
|
Other accrued expenses and provisions
|
51,566
|
|||
|
Operating losses
|
308,504
|
|||
|
Lease liabilities
|
47,680
|
|||
|
Other
|
9,394
|
|||
|
Gross deferred tax assets
|
539,695
|
|||
|
Less
—
|
(388,411
|
) | ||
|
Total deferred tax assets
|
151,284
|
|||
|
Deferred tax liabilities
|
|
|
|
|
|
Investments in subsidiaries and affiliates
|
89,630
|
|||
|
Valuation of financial instruments
|
52,780
|
|||
|
Undistributed earnings of foreign subsidiaries
|
2,423
|
|||
|
Valuation of fixed assets
|
9,497
|
|||
|
Right-of-use
assets
|
47,438
|
|||
|
Other
|
2,992
|
|||
|
Total deferred tax liabilities
|
204,760
|
|||
|
Net deferred tax assets (liabilities)
|
¥ |
(53,476
|
) | |
Calculation method of deferred tax assets
In accordance with U.S. GAAP, we recognize deferred tax assets to the extent we believe that it is more likely than not that a benefit will be realized. A valuation allowance is provided for tax benefits available to us, which are not deemed more likely than not to be realized.
B. Liquidity and Capital Resources.
Funding and Liquidity Management
Overview
We define liquidity risk as the risk of loss arising from difficulty in securing the necessary funding or from a significantly higher cost of funding than normal levels due to deterioration of the Nomura Group’s creditworthiness or deterioration in market conditions. This risk could arise from Nomura-specific or market-wide events such as inability to access the secured or unsecured debt markets, a deterioration in our credit ratings, a failure to manage unplanned changes in funding requirements, a failure to liquidate assets quickly and with minimal loss in value, or changes in regulatory capital restrictions which may prevent the free flow of funds between different group entities. Our global liquidity risk management policy is based on liquidity risk appetite formulated by the Executive Management Board (“EMB”). Nomura’s liquidity risk management, under market-wide stress and in addition, under Nomura-specific stress, seeks to ensure enough continuous liquidity to meet all
63
funding requirements and unsecured debt obligations across one year and
30-day
periods, respectively, without raising funds through unsecured funding or through the liquidation of assets. We are required to meet regulatory notice on the liquidity coverage ratio issued by the FSA.
We have in place a number of liquidity risk management frameworks that enable us to achieve our primary liquidity objective. These frameworks include (1) Centralized Control of Residual Cash and Maintenance of Liquidity Portfolio; (2) Utilization of Unencumbered Assets as Part of Our Liquidity Portfolio; (3) Appropriate Funding and Diversification of Funding Sources and Maturities Commensurate with the Composition of Assets; (4) Management of Credit Lines to Nomura Group Entities; (5) Implementation of Liquidity Stress Tests; and (6) Contingency Funding Plan.
Our EMB has the authority to make decisions concerning group liquidity management. The Chief Financial Officer (“CFO”) has the operational authority and responsibility over our liquidity management based on decisions made by the EMB.
1. Centralized Control of Residual Cash and Maintenance of Liquidity Portfolio.
We centrally control residual cash held at Nomura Group entities for effective liquidity utilization purposes. As for the usage of funds, the CFO decides the maximum amount of available funds, provided without posting any collateral, for allocation within Nomura and the EMB allocates the funds to each business division. Global Treasury monitors usage by businesses and reports to the EMB.
In order to enable us to transfer funds smoothly between group entities, we limit the issuance of securities by regulated broker-dealers or banking entities within the Nomura Group and seek to raise unsecured funding primarily through the Company or through unregulated subsidiaries. The primary benefits of this strategy include cost minimization, wider investor name recognition and greater flexibility in providing funding to various subsidiaries across the Nomura Group.
To meet any potential liquidity requirement, we maintain a liquidity portfolio, managed by Global Treasury apart from other assets, in the form of cash and highly liquid, unencumbered securities that may be sold or pledged to provide liquidity. As of March 31, 2020, our liquidity portfolio was ¥5,354.4 billion which sufficiently met liquidity requirements under the stress scenarios even amid the highly volatile financial market due to the pandemic of the
COVID-19
pandemic.
The following table presents a breakdown of our liquidity portfolio by type of financial assets as of March 31, 2019 and 2020 and averages maintained for the years ended March 31, 2019 and 2020. Yearly averages are calculated using
month-end
amounts.
|
|
Billions of yen
|
|||||||||||||||
|
|
Average for
year ended
March 31, 2019
|
|
March 31,
2019
|
|
Average for
year ended
March 31, 2020
|
|
March 31,
2020
|
|
||||||||
|
Cash, cash equivalents and time deposits
(1)
|
¥ |
2,280.3
|
¥ |
2,113.1
|
¥ |
2,323.6
|
¥ |
2,540.4
|
||||||||
|
Government debt securities
|
2,553.0
|
2,424.6
|
2,371.5
|
2,412.2
|
||||||||||||
|
Others
(2)
|
301.1
|
332.8
|
310.6
|
401.8
|
||||||||||||
|
Total liquidity portfolio
|
¥ |
5,134.4
|
¥ |
4,870.5
|
¥ |
5,005.7
|
¥ |
5,354.4
|
||||||||
| (1) | Cash, cash equivalents, and time deposits include nostro balances and deposits with both central banks and market counterparties that are readily available to support the liquidity position of Nomura. |
| (2) | Others include other liquid financial assets such as money market funds and U.S. agency securities. |
64
The following table presents a breakdown of our liquidity portfolio by currency as of March 31, 2019 and 2020 and averages maintained for the years ended March 31, 2019 and 2020. Yearly averages are calculated using
month-end
amounts.
|
|
Billions of yen
|
|||||||||||||||
|
|
Average for
year ended
March 31, 2019
|
|
March 31,
2019
|
|
Average for
year ended
March 31, 2020
|
|
March 31,
2020
|
|
||||||||
|
Japanese Yen
|
¥ |
1,696.8
|
¥ |
1,570.7
|
¥ |
1,500.6
|
¥ |
1,341.9
|
||||||||
|
U.S. Dollar
|
2,231.0
|
1,961.7
|
2,219.9
|
2,732.5
|
||||||||||||
|
Euro
|
734.0
|
898.8
|
818.4
|
789.5
|
||||||||||||
|
British Pound
|
325.2
|
265.7
|
310.5
|
315.5
|
||||||||||||
|
Others
(1)
|
147.4
|
173.6
|
156.3
|
175.0
|
||||||||||||
|
Total liquidity portfolio
|
¥ |
5,134.4
|
¥ |
4,870.5
|
¥ |
5,005.7
|
¥ |
5,354.4
|
||||||||
| (1) | Includes other currencies such as the Australian dollar, the Canadian dollar and the Swiss franc. |
We assess our liquidity portfolio requirements globally as well as by each major operating entity in the Nomura Group. We primarily maintain our liquidity portfolio at Nomura Holdings, Inc. (“NHI”) and Nomura Securities Co. Ltd. (“NSC”), our other major broker-dealer subsidiaries, our bank subsidiaries, and other group entities. In determining the amounts and entities which hold this liquidity portfolio, we consider legal, regulatory and tax restrictions which may impact our ability to freely transfer liquidity across different entities in the Nomura Group. For more information regarding regulatory restrictions, see Note 19 “
” in our consolidated financial statements included within this annual report.
Regulatory requirements
The following table presents a breakdown of our liquidity portfolio by entity as of March 31, 2019 and 2020.
|
|
Billions of yen
|
|||||||
|
|
March 31, 2019
|
|
March 31, 2020
|
|
||||
|
NHI and NSC
(1)
|
¥ |
1,142.9
|
¥ |
1,382.9
|
||||
|
Major broker-dealer subsidiaries
|
2,473.5
|
2,645.8
|
||||||
|
Bank subsidiaries
(2)
|
799.4
|
775.8
|
||||||
|
Other affiliates
|
454.7
|
549.9
|
||||||
|
Total liquidity portfolio
|
¥ |
4,870.5
|
¥ |
5,354.4
|
||||
| (1) | NSC, a broker-dealer located in Japan, holds an account with the Bank of Japan (“BOJ”) and has direct access to the BOJ Lombard facility through which same day funding is available for our securities pool. Any liquidity surplus at NHI is lent to NSC via short-term intercompany loans, which can be unwound immediately when needed. |
| (2) | Includes Nomura Bank International plc (“NBI”), Nomura Singapore Limited and Nomura Bank Luxembourg S.A. |
2. Utilization of Unencumbered Assets as Part of Our Liquidity Portfolio.
In addition to our liquidity portfolio, we had ¥2,573.6 billion of other unencumbered assets comprising mainly of unpledged trading assets that can be used as an additional source of secured funding. Global Treasury monitors other unencumbered assets and can, under a liquidity stress event when the contingency funding plan has been invoked, monetize and utilize the cash generated as a result. The aggregate of our liquidity portfolio and other unencumbered assets as of March 31, 2020 was ¥7,928.0 billion, which represented 258.0% of our total unsecured debt maturing within one year.
65
|
|
Billions of yen
|
|||||||
|
|
March 31, 2019
|
|
March 31, 2020
|
|
||||
|
Net liquidity value of other unencumbered assets
|
¥ |
2,268.1
|
¥ |
2,573.6
|
||||
|
Liquidity portfolio
|
4,870.5
|
5,354.4
|
||||||
|
Total
|
¥ |
7,138.6
|
¥ |
7,928.0
|
||||
3. Appropriate Funding and Diversification of Funding Sources and Maturities Commensurate with the Composition of Assets
We seek to maintain a surplus of long-term debt and equity above the cash capital requirements of our assets. We also seek to achieve diversification of our funding by market, instrument type, investors, currency, and staggered maturities in order to reduce unsecured refinancing risk.
We diversify funding by issuing various types of debt instruments—these include both structured loans and structured notes with returns linked to interest rates, currencies, equities, commodities, or related indices. We issue structured loans and structured notes in order to increase the diversity of our debt instruments. We typically hedge the returns we are obliged to pay with derivatives and/or the underlying assets to obtain funding equivalent to our unsecured long-term debt. The proportion of our
non-Japanese
Yen denominated long-term debt increased to 46.1% of total long-term debt outstanding as of March 31, 2020 from 43.6% as of March 31, 2019.
3.1 Short-Term Unsecured Debt
Our short-term unsecured debt consists of short-term bank borrowings (including long-term bank borrowings maturing within one year), other loans, commercial paper, deposit at banking entities, certificates of deposit and debt securities maturing within one year. Deposits at banking entities and certificates of deposit comprise customer deposits and certificates of deposit of our banking subsidiaries. Short-term unsecured debt includes the current portion of long-term unsecured debt.
The following table presents an analysis of our short-term unsecured debt by type of financial liability as of March 31, 2019 and 2020.
|
|
Billions of yen
|
|||||||
|
|
March 31, 2019
|
|
March 31, 2020
|
|
||||
|
Short-term bank borrowings
|
¥ |
107.0
|
¥ |
572.1
|
||||
|
Other loans
|
231.4
|
154.3
|
||||||
|
Commercial paper
|
313.0
|
525.1
|
||||||
|
Deposits at banking entities
|
1,149.1
|
1,116.2
|
||||||
|
Certificates of deposit
|
11.1
|
12.1
|
||||||
|
Debt securities maturing within one year
|
707.2
|
692.5
|
||||||
|
Total short-term unsecured debt
|
¥ |
2,518.8
|
¥ |
3,072.3
|
||||
3.2 Long-Term Unsecured Debt
We meet our long-term capital requirements and also achieve both cost-effective funding and an appropriate maturity profile by routinely funding through long-term debt and diversifying across various maturities and currencies.
Our long-term unsecured debt includes senior and subordinated debt issued through U.S. registered shelf offerings and our U.S. registered medium-term note programs, our Euro medium-term note programs, registered shelf offerings in Japan and various other debt programs.
66
As a globally competitive financial services group in Japan, we have access to multiple global markets and major funding centers. The Company, NSC, Nomura Europe Finance N.V., NBI, Nomura International Funding Pte. Ltd. and Nomura Global Finance Co., LTD. are the main group entities that borrow externally, issue debt instruments and engage in other funding activities. By raising funds to match the currencies and liquidities of our assets or by using foreign exchange swaps as necessary, we pursue optimization of our funding structures.
We use a wide range of products and currencies to ensure that our funding is efficient and well diversified across markets and investor types. Our unsecured senior debt is mostly issued without financial covenants, such as covenants related to adverse changes in our credit ratings, cash flows, results of operations or financial ratios, which could trigger an increase in our cost of financing or accelerate repayment of the debt.
The following table presents an analysis of our long-term unsecured debt by type of financial liability as of March 31, 2019 and 2020.
|
|
Billions of yen
|
|||||||
|
|
March 31, 2019
|
|
March 31, 2020
|
|
||||
|
Long-term deposits at banking entities
|
¥ |
232.5
|
¥ |
147.9
|
||||
|
Long-term bank borrowings
|
2,727.5
|
2,591.5
|
||||||
|
Other loans
|
87.9
|
82.5
|
||||||
|
Debt securities
(1)
|
3,435.6
|
3,522.1
|
||||||
|
Total long-term unsecured debt
|
¥ |
6,483.5
|
¥ |
6,344.0
|
||||
| (1) |
Excludes long-term debt securities issued by consolidated special purpose entities and similar entities that meet the definition of variable interest entities under ASC 810 “
Consolidation
Long-term borrowings
Transfer and Servicing.
|
3.3 Maturity Profile
We also seek to maintain an average maturity for our plain vanilla debt securities and borrowings greater than or equal to three years. The average maturity for our plain vanilla debt securities and borrowings with maturities longer than one year was 4.5 years as of March 31, 2020. A significant amount of our structured loans and structured notes are linked to interest rates, currencies, equities, commodities, or related indices. These maturities are evaluated based on internal models and monitored by Global Treasury. Where there is a possibility that these may be called prior to their scheduled maturity date, maturities are based on our internal stress option adjusted model. The model values the embedded optionality under stress market conditions in order to determine when the debt securities or borrowing is likely to be called. The graph below shows the distribution of maturities of our outstanding long-term debt securities and borrowings by the model.
On this basis, the average maturity of our structured loans and structured notes with maturities longer than one year was 6.4 years as of March 31, 2020. The average maturity of our entire long-term debt with maturities longer than one year including plain vanilla debt securities and borrowings, was 5.5 years as of March 31, 2020.
67

3.4 Secured Funding
We typically fund our trading activities through secured borrowings, repurchase agreements and Japanese “Gensaki Repo” transactions. We believe such funding activities in the secured markets are more cost-efficient and less credit-rating sensitive than financing in the unsecured market. Our secured funding capabilities depend on the quality of the underlying collateral and market conditions. While we have shorter term secured financing for highly liquid assets, we seek longer terms for less liquid assets. We also seek to lower the refinancing risks of secured funding by transacting with a diverse group of global counterparties and delivering various types of securities collateral. In addition, we reserve an appropriate level of liquidity portfolio for the refinancing risks of secured funding maturing in the short term for less liquid assets. For more detail of secured borrowings and repurchase agreements, see Note 5 “
” in our consolidated financial statements.
Collateralized transactions
4. Management of Credit Lines to Nomura Group Entities
We maintain and expand credit lines to Nomura Group entities from other financial institutions to secure stable funding. We ensure that the maturity dates of borrowing agreements are distributed evenly throughout the year in order to prevent excessive maturities in any given period.
5. Implementation of Liquidity Stress Tests
We maintain our liquidity portfolio and monitor the sufficiency of our liquidity based on an internal model which simulates changes in cash outflow under specified stress scenarios to comply with our above mentioned liquidity management policy.
We assess the liquidity requirements of the Nomura Group under various stress scenarios with differing levels of severity over multiple time horizons. We evaluate these requirements under Nomura-specific and broad market-wide events, including potential credit rating downgrades at the Company and subsidiary levels. We call this risk analysis our Maximum Cumulative Outflow (“MCO”) framework.
68
The MCO framework is designed to incorporate the primary liquidity risks for Nomura and models the relevant future cash flows in the following two primary scenarios:
| • | Stressed scenario—To maintain adequate liquidity during a severe market-wide liquidity event without raising funds through unsecured financing or through the liquidation of assets for a year; and |
| • | Acute stress scenario—To maintain adequate liquidity during a severe market-wide liquidity event coupled with credit concerns regarding Nomura’s liquidity position, without raising funds through unsecured funding or through the liquidation of assets for 30 days. |
We assume that Nomura will not be able to liquidate assets or adjust its business model during the time horizons used in each of these scenarios. The MCO framework therefore defines the amount of liquidity required to be held in order to meet our expected liquidity needs in a stress event to a level we believe appropriate based on our liquidity risk appetite.
As of March 31, 2020, our liquidity portfolio exceeded net cash outflows under the stress scenarios described above.
We constantly evaluate and modify our liquidity risk assumptions based on regulatory and market changes. The model we use in order to simulate the impact of stress scenarios includes the following assumptions:
| • | No liquidation of assets; |
| • | No ability to issue additional unsecured funding; |
| • | Upcoming maturities of unsecured debt (maturities less than one year); |
| • | Potential buybacks of our outstanding debt; |
| • | Loss of secured funding lines particularly for less liquid assets; |
| • | Fluctuation of funding needs under normal business circumstances; |
| • |
Cash deposits and free collateral
roll-off
in a stress event;
|
| • | Widening of haircuts on outstanding repo funding; |
| • | Additional collateralization requirements of clearing banks and depositories; |
| • | Drawdown on loan commitments; |
| • | Loss of liquidity from market losses; |
| • |
Assuming a
two-notch
downgrade of our credit ratings, the aggregate fair value of assets that we would be required to post as additional collateral in connection with our derivative contracts; and
|
| • | Legal and regulatory requirements that can restrict the flow of funds between entities in the Nomura Group. |
6. Contingency Funding Plan
We have developed a detailed contingency funding plan to integrate liquidity risk control into our comprehensive risk management strategy and to enhance the quantitative aspects of our liquidity risk control procedures. As a part of our Contingency Funding Plan (“CFP”), we have developed an approach for analyzing and quantifying the impact of any liquidity crisis. This allows us to estimate the likely impact of both Nomura-specific and market-wide events; and specifies the immediate action to be taken to mitigate any risk. The CFP lists details of key internal and external parties to be contacted and the processes by which information is to be disseminated. This has been developed at a legal entity level in order to capture specific cash requirements at the local level—it assumes that our parent company does not have access to cash that may be trapped at a subsidiary
69
level due to regulatory, legal or tax constraints. We periodically test the effectiveness of our funding plans for different Nomura-specific and market-wide events. We also have access to central banks including, but not exclusively, the BOJ, which provide financing against various types of securities. These operations are accessed in the normal course of business and are an important tool in mitigating contingent risk from market disruptions.
Liquidity Regulatory Framework
In 2008, the Basel Committee published “Principles for Sound Liquidity Risk Management and Supervision”. To complement these principles, the Committee has further strengthened its liquidity framework by developing two minimum standards for funding liquidity. These standards have been developed to achieve two separate but complementary objectives.
The first objective is to promote short-term resilience of a financial institution’s liquidity risk profile by ensuring that it has sufficient high-quality liquid assets to survive a significant stress scenario lasting for 30 days. The Committee developed the Liquidity Coverage Ratio (“LCR”) to achieve this objective.
The second objective is to promote resilience over a longer time horizon by creating additional incentives for financial institutions to fund their activities with more stable sources of funding on an ongoing basis. The Net Stable Funding Ratio (“NSFR”) has a time horizon of one year and has been developed to provide a sustainable maturity structure of assets and liabilities.
These two standards are comprised mainly of specific parameters which are internationally “harmonized” with prescribed values. Certain parameters, however, contain elements of national discretion to reflect jurisdiction-specific conditions.
In Japan, the regulatory notice on the LCR, based on the international agreement issued by the Basel Committee with necessary national revisions, was published by Financial Services Agency (on October 31, 2014). The notices have been implemented since the end of March 2015 with
phased-in
minimum standards. Average of Nomura’s LCRs for the three months ended March 31, 2020 was 201.1%, and Nomura was compliant with requirements of the above notices. As for the NSFR, it is not yet implemented in Japan.
Cash Flows
Nomura’s cash flows are primarily generated from operating activities undertaken in connection with our client flows and trading and from financing activities which are closely related to such activities. As a financial institution, growth in operations tends to result in cash outflows from operating activities as well as investing activities. For the years ended March 2019, we recorded net cash outflows from operating activities and investing activities. For the years ended March 2020, we recorded net cash outflows from operating activities and net cash inflow from investing activities as discussed in the comparative analysis below.
70
The following table presents the summary information on our consolidated cash flows for the years ended March 31, 2019 and 2020.
|
|
Billions of yen
|
|||||||
|
|
Year Ended March 31
|
|||||||
|
|
2019
|
|
2020
|
|
||||
|
Net cash used in operating activities
|
¥ |
(361.2
|
) | ¥ |
(15.9
|
) | ||
|
Net income (loss)
|
(94.7
|
) |
219.4
|
|||||
|
Trading assets and private equity and debt investments
|
925.4
|
(2,754.7
|
) | |||||
|
Trading liabilities
|
(143.1
|
) |
429.0
|
|||||
|
Securities purchased under agreements to resell, net of securities sold under agreements to repurchase
|
(3,274.9
|
) |
2,224.4
|
|||||
|
Securities borrowed, net of securities loaned
|
1,987.3
|
291.8
|
||||||
|
Other, net
|
238.8
|
(425.7
|
) | |||||
|
Net cash provided by (used in) investing activities
|
(112.5
|
) |
216.3
|
|||||
|
Net cash provided by financing activities
|
761.2
|
332.1
|
||||||
|
Long-term borrowings, net
|
516.7
|
(38.4
|
) | |||||
|
Increase in short-term borrowings, net
|
85.9
|
656.2
|
||||||
|
Increase (decrease) in deposits received at banks, net
|
257.5
|
(93.3
|
) | |||||
|
Other, net
|
(98.9
|
) |
(192.5
|
) | ||||
|
Effect of exchange rate changes on cash, cash equivalents, restricted cash and restricted cash equivalents
|
44.7
|
(27.3
|
) | |||||
|
Net increase in cash, cash equivalents, restricted cash and restricted cash equivalents
|
332.3
|
505.2
|
||||||
|
Cash, cash equivalents, restricted cash and restricted cash equivalents at beginning of the year
|
2,354.9
|
2,687.1
|
||||||
|
Cash, cash equivalents, restricted cash and restricted cash equivalents at end of the year
|
¥ |
2,687.1
|
¥ |
3,192.3
|
||||
See the consolidated statements of cash flows in our consolidated financial statements included within this annual report for more detailed information.
For the year ended March 31, 2020, our cash, cash equivalents, restricted cash and restricted cash equivalents increased by ¥505.2 billion to ¥3,192.3 billion. Net cash of ¥332.1 billion was provided by financing activities due to net cash inflows of ¥656.2 billion from
. As part of trading activities, while there were net cash outflows of ¥2,325.7 billion due to an increase in
in combination with cash inflows due to an increase in
they were offset by net cash inflows of ¥2,516.1 billion from repo transactions and securities borrowed and loaned transactions such as
, and
As a result, net cash of ¥15.9 billion was used in operating activities.
Short-term borrowings
Trading assets and Private equity and debt investments
Trading liabilities,
Securities purchased under agreements to resell, Securities sold under agreements to repurchase
Securities borrowed, net of Securities loaned.
For the year ended March 31, 2019, our cash, cash equivalents, restricted cash and restricted cash equivalents increased by ¥332.3 billion to ¥2,687.1 billion. Net cash of ¥761.2 billion was provided by financing activities due to net cash inflows of ¥516.7 billion from
. As part of trading activities, while there were net cash inflows of ¥782.2 billion due to a decrease in
in combination with cash outflows due to a decrease in
they were offset by net cash outflows of ¥1,287.5 billion from repo transactions and securities borrowed and loaned transactions such as
, and
As a result, net cash of ¥361.2 billion was used in operating activities.
Long-term borrowings
Trading assets and Private equity and debt investments
Trading liabilities,
Securities purchased under agreements to resell, Securities sold under agreements to repurchase
Securities borrowed, net of Securities loaned.
71
Balance Sheet and Financial Leverage
Total assets as of March 31, 2020, were ¥43,999.8 billion, an increase of ¥3,030.4 billion compared with ¥40,969.4 billion as of March 31, 2019, reflecting primarily an increase in
. Total liabilities as of March 31, 2020, were ¥41,268.6 billion, an increase of ¥2,979.9 billion compared with ¥38,288.6 billion as of March 31, 2019, reflecting primarily an increase in
. NHI shareholders’ equity as of March 31, 2020 was ¥2,653.5 billion, an increase of ¥22.4 billion compared with ¥2,631.1 billion as of March 31, 2019, primarily due to an increase in
Trading assets
Securities sold under agreements to repurchase
Retained earnings.
We seek to maintain sufficient capital at all times to withstand losses due to extreme market movements. The EMB is responsible for implementing and enforcing capital policies. This includes the determination of our balance sheet size and required capital levels. We continuously review our equity capital base to ensure that it can support the economic risk inherent in our business. There are also regulatory requirements for minimum capital of entities that operate in regulated securities or banking businesses.
As leverage ratios are commonly used by other financial institutions similar to us, we voluntarily provide a leverage ratio and adjusted leverage ratio primarily for benchmarking purposes so that users of our annual report can compare our leverage against other financial institutions. Adjusted leverage ratio is a
non-GAAP
financial measure that Nomura considers to be a useful supplemental measure of leverage.
The following table presents NHI shareholders’ equity, total assets, adjusted assets and leverage ratios as of March 31, 2019 and 2020.
|
|
Billions of yen, except ratios
|
|||||||
|
|
March 31
|
|||||||
|
|
2019
|
|
2020
|
|
||||
|
NHI shareholders’ equity
|
¥ |
2,631.1
|
¥ |
2,653.5
|
||||
|
Total assets
|
40,969.4
|
43,999.8
|
||||||
|
Adjusted assets
(1)
|
23,662.5
|
28,092.7
|
||||||
|
Leverage ratio
(2)
|
15.6 x
|
16.6 x
|
||||||
|
Adjusted leverage ratio
(3)
|
9.0 x
|
10.6 x
|
||||||
| (1) |
Represents total assets less
Securities purchased under agreements to resell
Securities borrowed
non-GAAP
financial measure and is calculated as follows:
|
|
|
Billions of yen
|
|||||||
|
|
March 31
|
|||||||
|
|
2019
|
|
2020
|
|
||||
|
Total assets
|
¥ |
40,969.4
|
¥ |
43,999.8
|
||||
|
Less:
|
|
|
||||||
|
Securities purchased under agreements to resell
|
13,194.5
|
12,377.3
|
||||||
|
Securities borrowed
|
4,112.4
|
3,529.8
|
||||||
|
Adjusted assets
|
¥ |
23,662.5
|
¥ |
28,092.7
|
||||
| (2) | Equals total assets divided by NHI shareholders’ equity. |
| (3) | Equals adjusted assets divided by NHI shareholders’ equity. |
Total assets increased by 7.4% reflecting primarily an increase in
. Total NHI shareholders’ equity increased by 0.9% reflecting primarily an increase in
. As a result, our leverage ratio increased from 15.6 times as of March 31, 2019 to 16.6 times as of March 31, 2020.
Trading assets
Retained earnings
Adjusted assets increased primarily due to an increase in
. As a result, our adjusted leverage ratio was 9.0 times as of March 31, 2019 and 10.6 times as of March 31, 2020.
Trading assets
72
Capital Management
Capital Management Policy
We seek to enhance shareholder value and to capture growing business opportunities by maintaining sufficient levels of capital. We will continue to review our levels of capital as appropriate, taking into consideration the economic risks inherent to operating our businesses, the regulatory requirements, and maintaining our ratings necessary to operate businesses globally.
Dividends
We believe that raising corporate value over the long term and paying dividends is essential to rewarding shareholders. We will strive to pay dividends using a consolidated
pay-out
ratio of 30 percent of each semi-annual consolidated earnings as a key indicator.
Dividend payments are determined taking into account a comprehensive range of factors such as the tightening of Basel regulations and other changes to the regulatory environment as well as the Company’s consolidated financial performance.
Dividends will in principle be paid on a semi-annual basis with record dates of September 30 and March 31.
Additionally we will aim for a total payout ratio, which includes dividends and share buybacks, of at least 50 percent.
With respect to retained earnings, in order to implement measures to adapt to regulatory changes and to increase shareholder value, we seek to efficiently invest in business areas where high profitability and growth may reasonably be expected, including the development and expansion of infrastructure.
Dividends for the Fiscal Year
Based on our Capital Management Policy described above, we paid a dividend of ¥15 per share to shareholders of record as of September 30, 2019 and have decided to pay a dividend of ¥5 per share to shareholders of record as of March 31, 2020. As a result, the total annual dividend will be ¥20 per share.
The following table sets forth the amounts of dividends per share paid by us in respect of the periods indicated:
|
Fiscal year ended or ending March 31,
|
First Quarter
|
|
Second Quarter
|
|
Third Quarter
|
|
Fourth Quarter
|
|
Total
|
|
||||||||||
|
2015
|
¥ |
—
|
¥ |
6.00
|
¥ |
—
|
¥ |
13.00
|
¥ |
19.00
|
||||||||||
|
2016
|
—
|
10.00
|
—
|
3.00
|
13.00
|
|||||||||||||||
|
2017
|
—
|
9.00
|
—
|
11.00
|
20.00
|
|||||||||||||||
|
2018
|
—
|
9.00
|
—
|
11.00
|
20.00
|
|||||||||||||||
|
2019
|
—
|
3.00
|
—
|
3.00
|
6.00
|
|||||||||||||||
|
2020
|
—
|
15.00
|
—
|
5.00
|
20.00
|
|||||||||||||||
Consolidated Regulatory Capital Requirements
The FSA established the “Guideline for Financial Conglomerates Supervision” (“Financial Conglomerates Guideline”) in June 2005 and set out the rules on consolidated regulatory capital. We started monitoring our consolidated capital adequacy ratio in accordance with the Financial Conglomerates Guideline from April 2005.
The Company has been assigned by the FSA as a Final Designated Parent Company who must calculate a consolidated capital adequacy ratio according to the Capital Adequacy Notice on Final Designated Parent
73
Company in April 2011. Since then, we have been calculating our consolidated capital adequacy ratio according to the Capital Adequacy Notice on Final Designated Parent Company. The Capital Adequacy Notice on Final Designated Parent Company has been revised to be in line with Basel 2.5 and Basel III since then. We have calculated a Basel
III-based
consolidated capital adequacy ratio from the end of March 2013. Basel 2.5 includes significant change in calculation method of market risk and Basel III includes redefinition of capital items for the purpose of requiring higher quality of capital and expansion of the scope of credit risk-weighted assets calculation.
In accordance with Article 2 of the Capital Adequacy Notice on Final Designated Parent Company, our consolidated capital adequacy ratio is currently calculated based on the amounts of common equity Tier 1 capital, Tier 1 capital (sum of common equity Tier 1 capital and additional Tier 1 capital), total capital (sum of Tier 1 capital and Tier 2 capital), credit risk-weighted assets, market risk and operational risk. As of March 31, 2020, our common equity Tier 1 capital ratio (common equity Tier 1 capital divided by risk-weighted assets) is 15.34%, Tier 1 capital ratio (Tier 1 capital divided by risk-weighted assets) is 16.40% and consolidated capital adequacy ratio (total capital divided by risk-weighted assets) is 16.60% and we were in compliance with the requirement for each ratio set out in the Capital Adequacy Notice on Final Designated Parent Company, etc. (required level including applicable minimum consolidated capital buffers as of March 31, 2020 is 7.51% for the common equity Tier 1 capital ratio, 9.01% for the Tier 1 capital ratio and 11.01% for the consolidated capital adequacy ratio).
The following table presents the Company’s consolidated capital adequacy ratios as of March 31, 2019 and March 31, 2020.
|
|
Billions of yen, except ratios
|
|||||||
|
|
March 31
|
|||||||
|
|
2019
|
|
2020
|
|
||||
|
Common equity Tier 1 capital
|
¥ |
2,439.7
|
¥ |
2,404.6
|
||||
|
Tier 1 capital
|
2,605.9
|
2,571.5
|
||||||
|
Total capital
|
2,651.9
|
2,602.4
|
||||||
|
Risk-Weighted Assets
|
|
|
|
|
|
|
||
|
Credit risk-weighted assets
|
7,527.4
|
7,634.7
|
||||||
|
Market risk equivalent assets
|
4,211.1
|
5,549.3
|
||||||
|
Operational risk equivalent assets
|
2,513.1
|
2,490.5
|
||||||
|
Total risk-weighted assets
|
¥ |
14,251.6
|
¥ |
15,674.5
|
||||
|
Consolidated Capital Adequacy Ratios
|
|
|
|
|
|
|
||
|
Common equity Tier 1 capital ratio
|
17.11
|
% |
15.34
|
% | ||||
|
Tier 1 capital ratio
|
18.28
|
% |
16.40
|
% | ||||
|
Consolidated capital adequacy ratio
|
18.60
|
% |
16.60
|
% | ||||
Since the end of March 2011, we have been calculating credit risk-weighted assets and operational risk equivalent assets by using the foundation Internal Ratings-Based Approach and the Standardized Approach, respectively, with the approval of the FSA. Furthermore, Market risk equivalent assets are calculated by using the Internal Models Approach for market risk.
We provide consolidated capital adequacy ratios not only to demonstrate that we are in compliance with the requirements set out in the Capital Adequacy Notice on Final Designated Parent Company but also for benchmarking purposes so that users of this annual report can compare our capital position against those of other financial groups to which Basel III is applied. Management receives and reviews these capital ratios on a regular basis.
74
Consolidated Leverage Ratio Requirements
In March 2019, the FSA set out requirements for the calculation and disclosure and minimum requirement of 3% of a consolidated leverage ratio, and the publication of “Notice of the Establishment of Standards for Determining Whether the Adequacy of Leverage, the Supplementary Measure to the Adequacy of Equity Capital of a Final Designated Parent Company and its Subsidiary Corporations, etc. is Appropriate Compared to the Assets Held by the Final Designated Parent Company and its Subsidiary Corporations, etc., under Paragraph 1, Article
57-17
of the Financial Instruments and Exchange Act” (2019 FSA Regulatory Notice No. 13; “Notice on Consolidated Leverage Ratio”), through amendments to revising “Specification of items which a final designated parent company should disclose on documents to show the status of its sound management” (2010 FSA Regulatory Notice No. 132; “Notice on Pillar 3 Disclosure”). We started calculating and disclosing a consolidated leverage ratio from March 31, 2015 in accordance with the Notices. And we have started calculating a consolidated leverage ratio from March 31, 2019 in accordance with the Notice on Pillar 3 Disclosure, Notice on Consolidated Leverage Ratio and other related Notices. Management receives and reviews this consolidated leverage ratio on a regular basis. As of March 31 2020, our consolidated leverage ratio was 4.83%.
Regulatory changes which affect us
The Basel Committee has issued a series of announcements regarding a Basel III program designed to strengthen the regulatory capital framework in light of weaknesses revealed by the financial crises. The following is a summary of the proposals which are most relevant to us.
Results of operations and financial condition have been impacted by economic dislocations caused by the
COVID-19
pandemic; risk weighted assets grew by ¥1.6 trillion to ¥16 trillion, common equity Tier 1 capital ratio was 15.34%, Tier 1 capital ratio was 16.40%, and Leverage Ratio was 4.83% for the March 2020
quarter-end.
These figures were influenced by increased market volatility, and widening credit spread caused by
COVID-19.
Nomura Group has been dedicated to supporting our clients through the extremely challenging economic and financial market conditions that developed during the quarter.
On December 16, 2010, in an effort to promote a more resilient banking sector, the Basel Committee issued Basel III, that is, “International framework for liquidity risk measurement, standards and monitoring” and “A global regulatory framework for more resilient banks and banking systems”. They include raising the quality, consistency and transparency of the capital base; strengthening the risk coverage of the capital framework such as the implementation of a credit value adjustment (“CVA”) charge for OTC derivative trades; introducing a leverage ratio requirement as a supplemental measure to the risk-based framework; introducing a series of measures to address concerns over the “procyclicality” of the current framework; and introducing a minimum liquidity standard including a
30-day
liquidity coverage ratio as well as a longer-term structural liquidity ratio. These standards were implemented from 2013, which includes transitional treatment, (i.e. they are phased in gradually from 2013). In addition, the Basel Committee has issued interim rules for the capitalization of bank exposures to central counterparties (“CCPs”) on July 25, 2012, which came into effect in 2013 as part of Basel III. Moreover, in addition to Basel III leverage ratio framework under which we started the calculation and disclosure of consolidated leverage ratio as above, a series of final standards on the regulatory frameworks such as capital requirements for banks’ equity investments in funds, the standardized approach for measuring counterparty credit risk exposures, capital requirements for bank exposures to CCPs, supervisory framework for measuring and controlling large exposures, Basel III: The Net Stable Funding Ratio and revisions to the securitization framework, and revised framework for market risk capital requirements have been published by the Basel Committee.
At the
G-20
summit in November 2011, the Financial Stability Board (“FSB”) and the Basel Committee announced the list of global systemically important banks
(“G-SIBs”)
and the additional requirements to the
G-SIBs
including the recovery and resolution plan. The group of
G-SIBs
have been updated annually and published by the FSB each November. Since November 2011, we have not been designated as a
G-SIBs.
On the
75
other hand, the FSB and the Basel Committee were asked to work on extending the framework for
G-SIBs
to domestic systemically important financial institutions
(“D-SIBs”)
and the Basel Committee developed and published a set of principles on the assessment methodology and the higher loss absorbency requirement for
D-SIBs.
In December 2015, the FSA identified us as a
D-SIB
and required additional capital charge of 0.5% after March 2016, with
3-year
transitional arrangement.
In November 2015, the FSB issued the final TLAC standard for
G-SIBs.
The TLAC standard has been designed so that failing
G-SIBs
will have sufficient loss-absorbing and recapitalization capacity available in resolution for authorities to implement an orderly resolution. In response to the FSB’s publication of the TLAC standard, in April 2016, the FSA published its policy to develop the TLAC framework in Japan applicable to Japanese
G-SIBs
and, in April 2018, revised such policy to apply the TLAC requirements in Japan not only to Japanese
G-SIBs
but also to Japanese
D-SIBs
that are deemed (i) of particular need for a cross-border resolution arrangement and (ii) of particular systemic significance to Japanese financial system if they fail. In the revised policy, the Japanese
G-SIBs
and Nomura (“TLAC Covered SIBs”) would be subject to the TLAC requirements in Japan. On March 2019, the FSA published the notices and revised the guidelines of TLAC regulations. Although Nomura is not identified as a
G-SIB
as of the date of this annual report, the TLAC Covered SIBs, including Nomura, will be required to meet the TLAC requirement alongside the minimum regulatory requirements set out in the Basel III framework. Specifically, Nomura will be required to meet a minimum TLAC requirement of holding TLAC in an amount at least 16% of our consolidated risk-weighted assets as from March 31, 2021 and at least 18% as from March 31, 2024 as well as at least 6% of the applicable Basel III leverage ratio denominator from March 31, 2021 and at least 6.75% from March 31, 2024.
Furthermore, according to the FSA’s revised policy published in April 2018, which is subject to change based on future international discussions, the preferred resolution strategy for the TLAC Covered SIBs is Single Point of Entry (“SPE”) resolution, in which resolution powers are applied to the top of a group by a single national resolution authority (i.e. the FSA), although the actual measures to be taken will be determined on a
case-by-case
basis considering the actual condition of the relevant the TLAC Covered SIBs in crisis.
To implement this SPE resolution strategy effectively, the FSA requires holding companies of the TLAC Covered SIBs (“Domestic Resolution Entities”) to (i) meet the minimum external TLAC requirements and (ii) cause their material subsidiaries that are designated as systemically important by the FSA, including but not limited to certain material
sub-groups
as provided in the FSB’s TLAC standard, to maintain a certain level of capital and debt recognized by the FSA as having loss-absorbing and recapitalization capacity, or Internal TLAC.
In addition, the TLAC Covered SIBs’ Domestic Resolution Entities will be allowed to count the amount equivalent to 2.5% of their consolidated risk-weighted assets from the implementation date of the TLAC requirements in Japan (March 31, 2021 for Nomura) and 3.5% of their consolidated risk-weighted assets from 3 years after the implementation date (March 31, 2024 for Nomura) as our external TLAC, considering the Japanese Deposit Insurance Fund Reserves.
It is likely that the FSA’s regulation and notice will be revised further to be in line with a series of rules and standards proposed by the Basel Committee, FSB or International Organization of Securities Commissions.
Credit Ratings
The cost and availability of unsecured funding are generally dependent on credit ratings. Our long-term and short-term debt is rated by several recognized credit rating agencies. We believe that our credit ratings include the credit ratings agencies’ assessment of the general operating environment, our positions in the markets in which we operate, reputation, earnings structure, trend and volatility of our earnings, risk management framework, liquidity and capital management. An adverse change in any of these factors could result in a downgrade of our credit ratings, and that could, in turn, increase our borrowing costs and limit our access to the capital markets or require us to post additional collateral and permit counterparties to terminate transactions
76
pursuant to certain contractual obligations. In addition, our credit ratings can have a significant impact on certain of our trading revenues, particularly in those businesses where longer term counterparty performance is critical, such as OTC derivative transactions.
On August 2, 2019, S&P Global Ratings downgraded the long-term issuer credit rating of the Company to BBB+ from
A-.
S&P Global Ratings also downgraded the long-term issuer credit rating of Nomura Securities Co., Ltd. (“NSC”) to
A-
from A, and the short-term credit rating of NSC to
A-2
from
A-1.
On May 13, 2020, Fitch Ratings placed the bbb+ viability ratings of the Company and NSC on negative watch. Fitch Ratings affirmed the Issuer Default Rating at
A-
and the Outlook at Stable.
As of May 28, 2020, the credit ratings of the Company and NSC were as follows.
|
Nomura Holdings, Inc.
|
Short-term
Debt
|
|
Long-term
Debt
|
|
||||
|
S&P Global Ratings
|
A-2
|
BBB+ (Stable)
|
||||||
|
Moody’s Investors Service
|
—
|
Baa1 (Negative)
|
||||||
|
Fitch Ratings
|
F1
|
A-
(Stable)
|
||||||
|
Rating and Investment Information, Inc.
|
a-1
|
A+ (Stable)
|
||||||
|
Japan Credit Rating Agency, Ltd.
|
—
|
AA-
(Stable)
|
||||||
|
Nomura Securities Co., Ltd.
|
Short-term Debt
|
|
Long-term Debt
|
|
||||
|
S&P Global Ratings
|
A-2
|
A-
(Stable)
|
||||||
|
Moody’s Investors Service
|
P-2
|
A3 (Negative)
|
||||||
|
Fitch Ratings
|
F1
|
A-
(Stable)
|
||||||
|
Rating and Investment Information, Inc.
|
a-1
|
A+ (Stable)
|
||||||
|
Japan Credit Rating Agency, Ltd.
|
—
|
AA-
(Stable)
|
||||||
Both Rating and Investment Information, Inc. and Japan Credit Rating Agency, Ltd. are credit rating agencies nationally recognized in Japan. We rely on, or utilize, credit ratings on our long-term and short-term debt provided by these Japanese credit rating agencies, as well as S&P Global Ratings, Moody’s Investors Service, and Fitch Ratings for unsecured funding and other financing purposes and also for our trading and other business activities. Within the rating classification system of Rating and Investment Information, Inc.,
“a-1”
is the highest of five categories for short-term debt and indicates “a strong degree of certainty regarding debt repayment”; and “A” is the third highest of nine categories for long-term debt and indicates “a high degree of certainty regarding debt repayment with excellence in specific component factors”, with a plus (+) or minus (-) sign added to a rating in that category to indicate its relative standing within that category. Within the rating classification system of Japan Credit Rating Agency, Ltd., “AA” is the second highest of eleven categories for long-term debt and indicates “a very high level of capacity to honor the financial commitment on the obligation”, with a plus (+) or minus (-) sign added to a rating in that category to indicate its relative standing within that category.
There has been no change to the ratings in the above table since the date indicated.
C. Research and Development, Patents and Licenses, etc.
Not applicable.
D. Trend Information.
The information required by this item is set forth in Item 5.A of this annual report.
77
E.
Off-Balance
Sheet Arrangements.
Off-balance
sheet entities
In the normal course of business, we engage in a variety of
off-balance
sheet arrangements with
off-balance
sheet entities which may have an impact on Nomura’s future financial position and performance.
Off-balance
sheet arrangements with
off-balance
sheet entities include where Nomura has:
| • | an obligation under a guarantee contract; |
| • |
a retained or contingent interest in assets transferred to an
off-balance
sheet entity or similar arrangement that serves to provide credit, liquidity or market risk support to such entity;
|
| • | any obligation, including a contingent obligation, under a contract that would be accounted for as a derivative instrument; or |
| • |
any obligation, including a contingent obligation, arising out of a variable interest in an
off-balance
sheet entity that is held by, and material to, us, where such entity provides financing, liquidity, market risk or credit risk support to, or engages in leasing, hedging or research and development services with, us.
|
Off-balance
sheet entities may take the form of a corporation, partnership, fund, trust or other legal vehicle which is designed to fulfill a limited, specific purpose by its sponsor. We both create or sponsor these entities and also enter into arrangements with entities created or sponsored by others.
Our involvement with these entities includes structuring, underwriting, distributing and selling debt instruments and beneficial interests issued by these entities, subject to prevailing market conditions. In connection with our securitization and equity derivative activities, we also act as a transferor of financial assets to these entities, as well as, underwriter, distributor and seller of asset-repackaged financial instruments issued by these entities. We retain, purchase and sell variable interests in SPEs in connection with our market-making, investing and structuring activities. Our other types of
off-balance
sheet arrangements include guarantee agreements and derivative contracts. Significant involvement is assessed based on all of our arrangements with these entities, even if the probability of loss, as assessed at the balance sheet date, is remote.
For further information about transactions with VIEs, see Note 6 “
” in our consolidated financial statements included in this annual report.
Securitizations and Variable Interest Entities
F. Tabular Disclosure of Contractual Obligations.
In the ordinary course of our business, we enter into a variety of contractual obligations and contingent commitments, which may require future payments. These arrangements include:
Standby letters of credit and other guarantees:
| • | In connection with our banking and financing activities, we enter into various guarantee arrangements with counterparties in the form of standby letters of credit and other guarantees, which generally have fixed expiration dates. |
Long-term borrowings and contractual interest payments:
| • |
In connection with our operating activities, we issue Japanese Yen and
non-Japanese
Yen denominated long-term borrowings which incur variable and fixed interest payments in accordance with our funding policy.
|
78
Operating lease commitments:
| • | We lease office space, residential facilities for employees, motor vehicles, equipment and technology assets in the ordinary course of business both in Japan and overseas as lessee. These arrangements predominantly consist of operating leases; |
| • | Separately we sublease certain real estate and equipment through operating lease arrangements. |
Finance lease commitments:
| • | We lease certain equipment and facilities in Japan and overseas which are classified as finance lease agreements. |
Purchase obligations:
| • | We have purchase obligations for goods and services which include payments for construction, advertising, and computer and telecommunications maintenance agreements. |
Commitments to extend credit:
| • | In connection with our banking and financing activities, we enter into contractual commitments to extend credit, which generally have fixed expiration dates; |
| • | In connection with our investment banking activities, we enter into agreements with clients under which we commit to underwrite securities that may be issued by clients. |
| • | As a member of certain central clearing counterparties, Nomura is committed to provide liquidity facilities through entering into reverse repo transactions backed by government and government agency debt securities with those counterparties in a situation where a default of another clearing member occurs. |
Commitments to invest in partnerships:
| • | We have commitments to invest in interests in various partnerships and other entities and commitments to provide financing for investments related to those partnerships. |
Note 8 “
” in our consolidated financial statements contains further detail on our operating leases and finance leases. Note 11 “
” in our consolidated financial statements contains further detail on our short-term and long-term borrowing obligations and Note 21 “
” in our consolidated financial statements included in this annual report contains further detail on our other commitments, contingencies and guarantees.
Leases
Borrowings
Commitments, contingencies and guarantees
The contractual amounts of commitments to extend credit represent the maximum amounts at risk should the contracts be fully drawn upon, should the counterparties default, and assuming the value of any existing collateral becomes worthless. The total contractual amount of these commitments may not represent future cash requirements since the commitments may expire without being drawn upon. The credit risk associated with these commitments varies depending on our clients’ creditworthiness and the value of collateral held. We evaluate each client’s creditworthiness on a
case-by-case
basis. The amount of collateral obtained, if deemed necessary by us upon extension of credit, is based on management’s credit evaluation of the counterparty.
79
The following table presents information regarding amounts and timing of our future contractual obligations and contingent commitments as of March 31, 2020.
|
|
Millions of yen
|
|||||||||||||||||||
|
|
Total
contractual
amount
|
|
Years to maturity
|
|||||||||||||||||
|
Less than
1 year
|
|
1 to 3
years
|
|
3 to 5
years
|
|
More than
5 years
|
|
|||||||||||||
|
Standby letters of credit and other guarantees
|
¥ |
2,351
|
¥ |
10
|
¥ |
1,184
|
¥ |
1,156
|
¥ |
1
|
||||||||||
|
Long-term borrowings
(1)
|
7,720,941
|
778,008
|
1,224,258
|
1,645,653
|
4,073,022
|
|||||||||||||||
|
Contractual interest payments
(2)
|
458,021
|
74,270
|
125,210
|
91,478
|
167,063
|
|||||||||||||||
|
Operating lease commitments
(3)
|
215,916
|
41,270
|
56,349
|
43,751
|
74,546
|
|||||||||||||||
|
Purchase obligations
(4)
|
126,949
|
20,523
|
35,720
|
8,392
|
62,314
|
|||||||||||||||
|
Commitments to extend credit
(5)
|
2,247,433
|
1,399,086
|
139,295
|
167,322
|
541,730
|
|||||||||||||||
|
Commitments to invest
|
15,278
|
491
|
4
|
5,628
|
9,155
|
|||||||||||||||
|
Total
|
¥ |
10,786,889
|
¥ |
2,313,658
|
¥ |
1,582,020
|
¥ |
1,963,380
|
¥ |
4,927,831
|
||||||||||
| (1) | The amounts disclosed within long-term borrowings exclude financial liabilities recognized within long-term borrowings as a result of transfers of financial assets that are accounted for as financings rather than sales in accordance with ASC 860. These are not borrowings issued for our own funding purposes and therefore do not represent actual contractual obligations by us to deliver cash. |
| (2) | The amounts represent estimated future interest payments related to long-time borrowings based on the period through to their maturity and applicable interest rates as of March 31, 2020. |
| (3) | The amounts of operating lease commitments are undiscounted future minimum lease payments. The amounts of finance lease contracts were immaterial. |
| (4) |
The minimum contractual obligations under enforceable and legally binding contracts that specify all significant terms. Amounts exclude obligations that are already reflected on our consolidated balance sheets as liabilities or payables. Includes the commitment to purchase parts of the redeveloped real estate in Tokyo Nihonbashi district from the redevelopment partnership. See Note 23 “
Significant subsequent events
|
| (5) | Contingent liquidity facilities to central clearing counterparties are included. |
Excluded from the above table are obligations that are generally short-term in nature, including short-term borrowings, deposits received at banks and other payables, collateralized agreements and financing transactions (such as reverse repurchase and repurchase agreements), and trading liabilities.
In addition to amounts presented above, we have commitments under reverse repurchase and repurchase agreements including amounts in connection with collateralized agreements and collateralized financing. These commitments amount to ¥1,969 billion for reverse repurchase agreements and ¥677 billion for repurchase agreements as of March 31, 2020.
80
Item 6. Directors, Senior Management and Employees
A. Directors and Senior Management.
Directors
The following table provides information about Directors of the Company as of June 30, 2020.
|
Name
(Date of Birth)
|
Responsibilities and Status within Nomura/
Other Principal Business Activities
|
Business Experience
|
||||
|
Koji Nagai
(Jan. 25, 1959)
|
Director
Chairman of Board Directors
Member of the Nomination Committee
Member of the Compensation Committee
Director and Chairman of Nomura Securities Co., Ltd.
|
Apr. 1981
|
Joined the Company
|
|||
|
Apr. 2003
|
Director of Nomura Securities Co., Ltd.
|
|||||
|
Jun. 2003
|
Senior Managing Director of Nomura Securities Co., Ltd.
|
|||||
|
Apr. 2007
|
Executive Managing Director of Nomura Securities Co., Ltd.
|
|||||
|
Oct. 2008
|
Senior Corporate Managing Director of Nomura Securities Co., Ltd.
|
|||||
|
Apr. 2009
|
Executive Managing Director and Executive Vice President of Nomura Securities Co., Ltd.
|
|||||
|
Apr. 2011
|
Co-COO
and Deputy President of Nomura Securities Co., Ltd.
|
|||||
|
Apr. 2012
|
Senior Managing Director of the Company
Director and President of Nomura Securities Co., Ltd.
|
|||||
|
Aug. 2012
|
Representative Executive Officer & Group CEO of the Company
Director and President of Nomura Securities Co., Ltd.
|
|||||
|
Jun. 2013
|
Director, Representative Executive Officer & Group CEO of the Company
Director and President of Nomura Securities Co., Ltd.
|
|||||
|
Apr. 2017
|
Director, Representative Executive Officer, President & Group CEO of the Company
Director and Chairman of Nomura Securities Co., Ltd.
|
|||||
|
Apr. 2020
|
Director and Chairman of the Company (Current)
Director and Chairman of Nomura Securities Co., Ltd. (Current)
|
|||||
81
|
Name
(Date of Birth)
|
Responsibilities and Status within Nomura/
Other Principal Business Activities
|
Business Experience
|
||||
|
Kentaro Okuda
(Nov. 7, 1963)
|
Director, Representative Executive Officer, President and Group CEO
Representative Director of Nomura Securities Co., Ltd.
|
Apr. 1987
|
Joined the Company
|
|||
|
Apr. 2010
|
Senior Managing Director of Nomura Securities Co., Ltd.
|
|||||
|
Apr. 2012
|
Senior Corporate Managing Director of Nomura Securities Co., Ltd.
|
|||||
|
Aug. 2012
|
Senior Corporate Managing Director of the Company
Senior Corporate Managing Director of Nomura Securities Co., Ltd.
|
|||||
|
|
|
Apr. 2013
|
Senior Managing Director of the Company
Senior Corporate Managing Director of Nomura Securities Co., Ltd.
|
|||
|
|
|
Apr. 2015
|
Senior Managing Director of the Company
Executive Vice President of Nomura Securities Co., Ltd.
|
|||
|
|
|
Apr. 2016
|
Senior Managing Director of the Company
Executive Managing Director and Executive Vice President of Nomura Securities Co., Ltd.
|
|||
|
|
|
Apr. 2017
|
Senior Managing Director of the Company
Executive Vice President of Nomura Securities Co., Ltd.
|
|||
|
|
|
Apr. 2018
|
Executive Managing Director, and Group
Co-COO
and Head of Americas (based in New York) of the Company
Director, Executive Managing Director and Deputy President of Nomura Securities Co., Ltd.
|
|||
|
|
|
Apr. 2019
|
Executive Managing Director and Deputy President, Group
Co-COO
of the Company
|
|||
|
|
|
Apr. 2020
|
Representative Executive Officer and President, Group CEO of the Company
Representative Director of Nomura Securities Co., Ltd.
|
|||
|
|
|
Jun. 2020
|
Director, Representative Executive Officer, President & Group CEO of the Company (Current)
Representative Director of Nomura Securities Co., Ltd. (Current)
|
|||
82
|
Name
(Date of Birth)
|
Responsibilities and Status within Nomura/
Other Principal Business Activities
|
Business Experience
|
||||
|
Toshio Morita
(Apr. 17, 1961)
|
Director, Representative Executive Officer
Representative Director and President of Nomura Securities Co., Ltd.
|
Apr. 1985
|
Joined the Company
|
|||
|
Apr. 2008
|
Executive Managing Director of Nomura Securities Co., Ltd.
|
|||||
|
Oct. 2008
|
Senior Managing Director of Nomura Securities Co., Ltd.
|
|||||
|
Apr. 2010
|
Senior Corporate Managing Director of Nomura Securities Co., Ltd.
|
|||||
|
|
|
Apr. 2011
|
Senior Corporate Managing Director of the Company
|
|||
|
|
|
Apr. 2012
|
Senior Corporate Managing Director of the Company
Senior Corporate Managing Director of Nomura Securities Co., Ltd.
|
|||
|
|
|
Aug. 2012
|
Executive Managing Director of the Company
Executive Vice President of Nomura Securities Co., Ltd.
|
|||
|
|
|
Apr. 2015
|
Executive Managing Director of the Company
Representative Executive Officer and Executive Vice President of Nomura Securities Co., Ltd.
|
|||
|
|
|
Apr. 2016
|
Representative Executive Officer and Deputy President of Nomura Securities Co., Ltd.
|
|||
|
|
|
Apr. 2017
|
Executive Managing Director of the Company
Director, Representative Executive Officer and President of Nomura Securities Co., Ltd.
|
|||
|
|
|
Apr. 2018
|
Executive Managing Director and Group
Co-COO
of the Company
Director, Representative Executive Officer and President of Nomura Securities Co., Ltd.
|
|||
|
|
|
Apr. 2019
|
Executive Managing Director and Group
Co-COO
of the Company
Representative Director and President of Nomura Securities Co., Ltd.
|
|||
|
|
|
Apr. 2020
|
Representative Executive Officer of the Company
Representative Director and President of Nomura Securities Co., Ltd.
|
|||
83
|
Name
(Date of Birth)
|
Responsibilities and Status within Nomura/
Other Principal Business Activities
|
Business Experience
|
||||
|
|
|
Jun. 2020
|
Director, Representative Executive Officer of the Company (Current)
Representative Director and President of Nomura Securities Co., Ltd. (Current)
|
|||
|
Hisato Miyashita
(Dec. 26, 1958)
|
Director
Member of the Audit Committee
(full-time)
Statutory Auditor of Nomura Financial Products & Services, Inc.
|
Jul. 1987
|
Joined the Company
|
|||
|
Jun. 1993
|
Joined Union Bank of Switzerland (currently, UBS)
|
|||||
|
|
Aug. 1996
|
Joined Bankers Trust Asia Securities Ltd.
|
||||
|
|
Apr. 1998
|
Joined Credit Suisse First Boston Securities (Japan) Limited
|
||||
|
|
Dec. 1999
|
Joined Nikko Citigroup Limited (currently, Citigroup Global Markets Japan Inc.)
|
||||
|
|
Mar. 2005
|
Executive Officer of Nikko Citigroup Limited, Internal Control Supervisory Manager
|
||||
|
|
Jul. 2009
|
Managing Director of Group Compliance Department of the Company
|
||||
|
|
Apr. 2012
|
Senior Managing Director of the Company, Head of Wholesale Compliance
|
||||
|
|
|
Jun. 2012
|
Senior Managing Director of the Company, Group Compliance Head Senior Managing Director of Nomura Securities Co., Ltd.
|
|||
|
|
|
Apr. 2013
|
Senior Managing Director of the Company, Group Compliance Head Representative Executive Officer of Nomura Securities Co., Ltd., Internal Control Supervisory Manager
|
|||
|
|
|
Apr. 2015
|
Senior Managing Director of the Company, Deputy Chief of Staff and Group Compliance Head
Representative Executive Officer and Senior Corporate Managing Director of Nomura Securities Co., Ltd., Internal Control Supervisory Manager
|
|||
|
|
|
Apr. 2016
|
Advisor of the Company
|
|||
|
|
|
Jun. 2016
|
Director of the Company (Current)
|
|||
84
|
Name
(Date of Birth)
|
Responsibilities and Status within Nomura/
Other Principal Business Activities
|
Business Experience
|
||||
|
Hiroshi Kimura
(Apr. 23, 1953)
|
Outside Director
Chairman of the Nomination Committee
Chairman of the Compensation Committee
Honorary Company Fellow of Japan Tobacco Inc.
|
Apr. 1976
|
Joined Japan Tobacco and Salt Public Corporation (currently, Japan Tobacco Inc.) (“JT”)
|
|||
|
Jun. 1999
|
Director of JT
|
|||||
|
|
Jun. 2001
|
Resigned as Director of JT
|
||||
|
|
Jun. 2005
|
Director of JT
|
||||
|
|
Jun. 2006
|
President and CEO and Representative Director of JT
|
||||
|
|
Jun. 2012
|
Chairman of the Board of JT
|
||||
|
|
Jun. 2014
|
Special Advisor of JT
|
||||
|
|
Jun. 2015
|
Outside Director of the Company (Current)
|
||||
|
|
|
Jul. 2016
|
Advisor of JT
|
|||
|
|
|
Mar. 2018
|
Honorary Company Fellow of JT (Current)
|
|||
|
Kazuhiko Ishimura
(Sep. 18, 1954)
|
Outside Director
Member of the Nomination Committee
Member of the Compensation Committee
Director of AGC Inc.
Outside Director of TDK Corporation
Outside Director of IHI Corporation
President of the National Institute of Advanced Industrial Science and Technology
|
Apr. 1979
|
Joined Asahi Glass Co., Ltd. (currently, AGC Inc.) (“AGC”)
|
|||
|
|
Jan. 2006
|
Executive Officer and GM of Kansai Plant of AGC
|
||||
|
|
Jan. 2007
|
Senior Executive Officer and GM of Electronics & Energy General Division of AGC
|
||||
|
|
Mar. 2008
|
Representative Director and President & COO of AGC
|
||||
|
|
Jan. 2010
|
Representative Director and President & CEO of AGC
|
||||
|
|
Jan. 2015
|
Representative Director & Chairman of AGC
|
||||
|
|
Jan. 2018
|
Director & Chairman of AGC
|
||||
|
|
Jun. 2018
|
Outside Director of the Company (Current)
|
||||
|
|
Mar. 2020
|
Director of AGC (Current)
|
||||
|
|
Apr. 2020
|
President of the National Institute of Advanced Industrial Science and
Technology (Current)
|
||||
|
Noriaki Shimazaki
(Aug. 19, 1946)
|
Outside Director
Chairman of the Audit Committee
Director of Nomura Securities Co., Ltd.
Outside Director of Loginet Japan Co., Ltd.
|
Apr. 1969
|
Joined Sumitomo Corporation
|
|||
|
Jun. 1998
|
Director of Sumitomo Corporation
|
|||||
|
|
Apr. 2002
|
Representative Director and Managing Director of Sumitomo Corporation
|
||||
|
|
Jan. 2003
|
Member of the Business Accounting Council of the Financial Services Agency
|
||||
|
|
|
Apr. 2004
|
Representative Director and Senior Managing Executive Officer of Sumitomo Corporation
|
|||
85
|
Name
(Date of Birth)
|
Responsibilities and Status within Nomura/
Other Principal Business Activities
|
Business Experience
|
||||
|
|
|
Apr. 2005
|
Representative Director and Executive Vice President of Sumitomo Corporation
|
|||
|
|
|
Jan. 2009
|
Trustee of the IASC (currently, IFRS Foundation)
|
|||
|
|
|
Jul. 2009
|
Special Advisor of Sumitomo Corporation
|
|||
|
|
|
Jun. 2011
|
Director of the Financial Accounting Standards Foundation
Chairman of Self-regulation Board and Public Governor of the Japan Securities Dealers Association
|
|||
|
|
|
Sep. 2013
|
Advisor of the IFRS Foundation Asia-Oceania Office (Current)
Advisor of the Japanese Institute of Certified Public Accountants (Current)
|
|||
|
|
|
Jun. 2016
|
Outside Director of the Company (Current)
Director of Nomura Securities Co., Ltd. (Current)
|
|||
|
Mari Sono
(Feb. 20, 1952)
|
Outside Director
Member of the Audit Committee
|
Oct. 1976
|
Joined NISSHIN Audit Corporation(*)
|
|||
|
Mar. 1979
|
Registered as Certified Public Accountant
|
|||||
|
|
|
Nov. 1988
|
Partner of CENTURY Audit Corporation(*)
|
|||
|
|
|
Nov. 1990
|
Member of “Certified Public Accountant Examination System Subcommittee”, Certified Public Accountant Examination and Investigation Board, Ministry of Finance
|
|||
|
|
|
Apr. 1992
|
Member of “Business Accounting Council”, Ministry of Finance
|
|||
|
|
|
Dec. 1994
|
Senior Partner, CENTURY Audit Corporation(*)
|
|||
|
|
|
Oct. 2002
|
Member of Secretariat of the Information Disclosure, Cabinet Office (currently, Secretariat of the Information Disclosure and Personal Information Protection Review Board, Ministry of Internal Affairs and Communications)
|
|||
|
|
|
Apr. 2005
|
External Comprehensive Auditor, Tokyo
|
|||
86
|
Name
(Date of Birth)
|
Responsibilities and Status within Nomura/
Other Principal Business Activities
|
Business Experience
|
||||
|
|
|
Jul. 2008
|
Senior Partner of Ernst & Young ShinNihon LLC
|
|||
|
|
|
Aug. 2012
|
Retired Ernst & Young ShinNihon LLC
|
|||
|
|
|
Dec. 2013
|
Commissioner of the Securities and Exchange Surveillance Commission
|
|||
|
|
|
Jun. 2017
|
Outside Director of the Company (Current)
* Each of the corporation is currently Ernst & Young ShinNihon LLC
|
|||
|
Michael Lim Choo
San
(Sep. 10, 1946)
|
Outside Director
Non-Executive
Chairman of Fullerton Healthcare Corporation Limited
Non-Executive
Chairman of Nomura Singapore Ltd.
|
Aug. 1972
|
Joined Price Waterhouse, Singapore
|
|||
|
Jan. 1992
|
Managing Partner of Price Waterhouse, Singapore
|
|||||
|
|
Oct. 1998
|
Member of the Singapore Public Service Commission (Current)
|
||||
|
|
|
Jul. 1999
|
Executive Chairman of PricewaterhouseCoopers, Singapore
|
|||
|
|
|
Sep. 2002
|
Chairman of the Land Transport Authority of Singapore
|
|||
|
|
|
Sep. 2004
|
Independent Director of Olam International Limited
|
|||
|
|
|
Jun. 2011
|
Outside Director of the Company (Current)
|
|||
|
|
|
Nov. 2011
|
Chairman of the Accounting Standards Council, Singapore
|
|||
|
|
|
Apr. 2013
|
Chairman of the Singapore Accountancy Commission
|
|||
|
|
|
Sep. 2016
|
Non-Executive
Chairman of Fullerton Healthcare Corporation Limited (Current)
|
|||
|
Laura Simone Unger
(Jan. 8, 1961)
|
Outside Director
Independent Director of CIT Group Inc.
Independent Director of Navient Corporation
Independent Director of Nomura Securities International, Inc.
|
Jan. 1988
|
Enforcement Attorney of U.S. Securities and Exchange Commission (SEC)
|
|||
|
|
Oct. 1990
|
Counsel of U.S. Senate Committee on Banking, Housing, and Urban Affairs
|
||||
|
|
Nov. 1997
|
Commissioner of SEC
|
||||
|
|
Feb. 2001
|
Acting Chairperson of SEC
|
||||
|
|
Jul. 2002
|
Regulatory Expert of CNBC
|
||||
|
|
May 2003
|
Independent Consultant of JPMorgan Chase & Co.
|
||||
|
|
Aug. 2004
|
Independent Director of CA Inc.
|
||||
87
|
Name
(Date of Birth)
|
Responsibilities and Status within Nomura/
Other Principal Business Activities
|
Business Experience
|
||||
|
|
|
Jan. 2010
|
Special Advisor of Promontory Financial Group
|
|||
|
|
|
Dec. 2010
|
Independent Director of CIT Group Inc. (Current)
|
|||
|
|
|
Nov. 2014
|
Independent Director of Navient Corporation (Current)
|
|||
|
|
|
Jun. 2018
|
Outside Director of the Company (Current)
|
|||
Among the Directors listed above, Hiroshi Kimura, Kazuhiko Ishimura, Noriaki Shimazaki, Mari Sono, Michael Lim Choo San and Laura Simone Unger satisfy the requirements for an “Outside Director” under the Companies Act.
88
Executive Officers
The following table provides information about the Company’s Executive Officers as of June 30, 2020.
|
Name
(Date of Birth)
|
Responsibilities and Status within Nomura/
Other Principal Business Activities
|
Business Experience
|
||||
|
Kentaro Okuda
(Nov. 7, 1963)
|
See “
Directors
|
See “
Directors
|
||||
|
Toshio Morita
(Apr. 17, 1961)
|
See “
Directors
|
See “
Directors
|
||||
|
Junko Nakagawa
(Jul. 26, 1965)
|
Executive Managing Director
Head of Asset Management
Representative Director, President and CEO of Nomura Asset Management Co., Ltd.
|
Apr. 1988
|
Joined the Company
|
|||
|
Mar. 2004
|
Retired Nomura Securities Co., Ltd.
|
|||||
|
|
|
Jan. 2008
|
Joined Nomura Healthcare Co., Ltd.
|
|||
|
|
|
Apr. 2008
|
Representative Director and President of Nomura Healthcare Co., Ltd.
|
|||
|
|
|
Jun. 2010
|
Director of Nomura Healthcare Co., Ltd.
Rejoined Nomura Securities Co., Ltd.
|
|||
|
|
|
Apr. 2011
|
Executive Managing Director and Chief Financial Officer of the Company
Executive Managing Director and Financial Officer of Nomura Securities Co., Ltd.
|
|||
|
|
|
Apr. 2013
|
Senior Managing Director of the Company
|
|||
|
|
|
Apr. 2016
|
Senior Managing Director of the Company
Senior Managing Director of Nomura Securities Co., Ltd.
|
|||
|
|
|
Apr. 2017
|
Executive Managing Director and Executive Vice President of Nomura Asset Management Co., Ltd.
|
|||
|
|
|
Apr. 2019
|
Executive Managing Director and Head of Asset Management of the Company (Current)
Representative Director, President and CEO of Nomura Asset Management Co., Ltd. (Current)
|
|||
89
|
Name
(Date of Birth)
|
Responsibilities and Status within Nomura/
Other Principal Business Activities
|
Business Experience
|
||||
|
Tomoyuki Teraguchi
(Aug. 4, 1962)
|
Executive Managing Director
Chief of Staff and Chief Compliance Officer
Representative Director and Deputy President of Nomura Securities Co., Ltd.
|
Apr. 1986
|
Joined the Company
|
|||
|
Apr. 2009
|
Senior Managing Director of Nomura Securities Co., Ltd.
|
|||||
|
Apr. 2016
|
Senior Managing Director of the Company
Representative Executive Officer of Nomura Securities Co., Ltd.
|
|||||
|
|
|
Apr. 2017
|
Senior Managing Director of the Company
Representative Executive Officer and Senior Corporate Managing Director of Nomura Securities Co., Ltd.
|
|||
|
|
|
Apr. 2019
|
Executive Managing Director and Chief Compliance Officer of the Company
Representative Director and Executive Vice President of Nomura Securities Co., Ltd.
|
|||
|
|
|
Apr. 2020
|
Executive Managing Director, Chief of Staff and Chief Compliance Officer of the Company (Current)
Representative Director and Deputy President of Nomura Securities Co., Ltd. (Current)
|
|||
|
Takumi Kitamura
(Nov. 26, 1966)
|
Executive Managing Director
Chief Financial Officer
Director and Senior Corporate Managing
Director of Nomura Securities Co., Ltd.
|
Apr. 1990
|
Joined the Company
|
|||
|
Apr. 2016
|
Executive Managing Director and Chief Financial Officer of the Company
Executive Managing Director and Financial Officer of Nomura Securities Co., Ltd.
|
|||||
|
|
|
Apr. 2019
|
Executive Managing Director and Chief Financial Officer of the Company (Current)
Director and Senior Corporate Managing Director of Nomura Securities Co., Ltd. (Current)
|
|||
|
Sotaro Kato
(Oct. 9, 1969)
|
Executive Managing Director
Chief Risk Officer
Director and Senior Corporate Managing
Director of Nomura Securities Co., Ltd.
|
Sep. 2002
|
Joined the Company
|
|||
|
Apr. 2020
|
Executive Managing Director and Chief Risk Officer of the Company (based in New York) (Current)
Director and Senior Corporate Managing Director of Nomura Securities Co., Ltd. (Current)
|
|||||
90
B. Compensation of Statutory Officers
Nomura’s compensation program for statutory officers is outlined as following.
1. Compensation program
(1) Compensation policy
We have developed our compensation policy for both senior management and employees of the Nomura Group to enable us to achieve sustainable growth, realize a long-term increase in shareholder value, deliver client excellence, compete in a global market and enhance our reputation.
Our compensation policy is based around the following six key themes. It aims to:
| 1. | align with Nomura values and strategies; |
| 2. | reflect group, divisional and individual performance; |
| 3. | establish appropriate performance measurement with a focus on risk; |
| 4. | align employee and shareholder interests; |
| 5. | establish appropriate compensation structures; and |
| 6. | ensure robust governance and control processes. |
(2) Nomura’s compensation framework
Nomura delivers compensation to senior management and employees through fixed and variable components. The key objectives of these components are provided below, together with the specific elements of each component.
.
|
Compensation
Components
|
Objectives
|
Specific Elements
|
||||||
|
Fixed Compensation
|
•
|
Rewards individuals for their knowledge, skills, competencies and experiences
|
•
|
Base salary
|
||||
|
|
•
|
Reflects local labor market standards
|
|
|
||||
|
|
•
|
Reflects practices of local labor markets to deliver allowances as a part of fixed compensation to individuals
|
•
•
|
Housing allowances
Overtime pay
|
||||
|
Variable Compensation
|
•
|
Rewards team and individual performances, and their contribution to results as well as the Company’s strategic and future value
|
•
•
|
Cash bonuses
Deferred compensation
|
||||
|
|
•
|
Reflects appropriate internal and market-based peer comparisons
|
|
|
||||
|
|
•
|
Reflects broad views on compensation, including individual performances, approaches to risk, compliance and cross-divisional cooperation
|
|
|
||||
Note: Benefits driven by local market regulations and practices are not included in the above.
91
(3) Determination process for fixed and variable compensations
Fixed and variable compensations are determined based on various aspects such as internal and market-based peer comparisons, local and regional labor market standards and practices, besides some KPIs listed below sections. The total compensation amount determined here makes the percentage of variable compensation which is linked to organizational and individual performance.
(a) Fixed compensation
Fixed compensation is primarily consisted of base salary and other allowances.
Base salary is determined by reflecting individual role, responsibility, knowledge, skills, competencies, experience, etc. Other allowances are determined by reflecting the local labor market standards and practices.
(b) Variable compensation
Variable compensation is consisted of cash bonuses and deferred compensation, which are performance-linked compensations.
In determining performance-linked compensation, following indicators are referred: Income before income taxes, Net income attributable to NHI shareholders (Diluted), Cash dividends, and share prices. In addition to referring these financial indicators, the total compensation is determined by comprehensively considering individual responsibility and performance, as well as trends of global competitors and industry-wide compensation movements.
(b
-1)
Cash Bonuses
A proportion of variable compensation is delivered in the form of a cash payment following the end of the fiscal year. Individuals with higher levels of compensation receive a lower proportion in cash. This is in line with regulatory guidance, and while the policy is global in application, specific local regulatory requirements are adhered to when deciding on proportions of cash bonuses.
(b
-2)
Deferred Compensation
Certain senior management and employees whose compensation is above a certain level receive a portion of their variable compensation through deferred compensation awards. By linking the economic value of a part of compensation to the price of the Company’s stock and imposing certain vesting conditions, such plans will:
| • | align employee interest with that of shareholders; |
| • | increase employee retention through providing opportunities to grow personal wealth over the period from grant to vesting; and |
| • | encourage cross-divisional and cross-regional collaboration by focusing individuals on a common goal of long-term increase in corporate value. |
As a result of these benefits, deferred compensation awards are also recommended by regulators in the key jurisdictions in which we operate.
The deferral period over which our deferred compensation awards vest is generally three or more years. This is in line with the “Principles for Sound Compensation Practices” issued by the Japanese Financial Stability Board which recommends, among other things, a deferral period of three or more years.
All current deferred compensation awards except Plan A awards include “Full Career Retirement” (“FCR”) provisions which permit recipients of the awards to continue to vest in the awards upon voluntary termination if certain criteria are met.
92
The following table summarizes the main features of the key types of deferred compensation awards currently granted by Nomura to senior management and employees. Unless otherwise stated, deferred compensation awards are generally reduced, forfeited or clawed back in the event of termination of employment, material conduct issues, material downturns in performance of the Nomura Group and/or a material failure of risk management.
|
Type of award
|
|
Key features
|
||
|
Restricted Stock Unit (“RSU”) awards
|
•
|
Settled in the Company’s common stock.
|
||
|
•
|
Graded vesting period generally over three years.
|
|||
|
•
|
Extended vesting period of up to seven years for certain senior management and employees in order to meet local regulatory requirements based on the role they perform in Nomura.
|
|||
|
•
|
New type of award introduced in 2018 as the primary type of deferred compensation award in Nomura. Granted in May 2018 in respect of the prior fiscal year.
|
|||
|
Notional Stock Unit
(“NSU”) awards
|
•
|
Linked to the price of Company’s common stock and cash-settled.
|
||
|
•
|
Graded vesting period generally over three years. Extended vesting period of up to seven years for certain senior management and employees based on the role they perform in Nomura in order to meet local regulatory requirements.
|
|||
|
•
|
Used in countries where equity-settled RSU awards are less favorably treated from a tax or other perspective.
|
|||
|
•
|
Following the introduction of RSU awards, NSU awards are less commonly used in Nomura.
|
|||
|
•
|
Granted in May each year in respect of the prior fiscal year and also quarterly to new employees as a recruitment incentive to replace awards forfeited from prior employers.
|
|||
|
Stock Acquisition Right (“SAR”) Plan A awards
|
•
|
Exercisable into 100 of the Company’s common stock.
|
||
|
•
|
Exercise price not less than the fair value of the Company’s common stock on grant date.
|
|||
|
•
|
Cliff vesting period of two years.
|
|||
|
•
|
Expire approximately seven years after grant date.
|
|||
|
•
|
Not subject to claw back.
|
|||
|
•
|
Granted in November each year in respect of various performance periods.
|
|||
Following the introduction of Restricted Stock Unit (“RSU”) awards in 2018 as the primary type of deferred compensation award to be used by Nomura, certain core deferral awards and all supplemental awards are no longer used by Nomura.
For fiscal years ended March 31, 2017 and prior fiscal years, we granted SAR Plan B awards as a type of core deferral award to certain senior management which are stock unit awards linked to price of the Company’s common stock pursuant to several stock unit plans designed to replicate the structure of restricted stock awards commonly used in the United States and Europe. These awards are physically-settled upon exercise into the Company’s common stock, have an exercise price of ¥1 per share and graded vesting generally over three years
93
with certain longer vesting or holding periods where required under local regulations, and are subject to forfeiture, reduction or clawback in the same way as the above awards.
For fiscal years ended March 31, 2011 through to March 31, 2017, we granted supplemental deferral awards comprising Collared Notional Stock Unit (“CSU”) awards and Notional Index Unit (“NIU”) awards. CSU awards are linked to the price of the Company’s stock subject to a cap and a floor and NIU awards are linked to a world stock index quoted by Morgan Stanley Capital International. Both types of award are cash-settled with graded vesting generally over three years with certain longer vesting periods where required by local regulations, and are subject to forfeiture, reduction or clawback in the same way as the above awards.
Following the introduction of RSU awards, no new SAR Plan B, CSU or NIU awards were granted in May 2018 in respect of the fiscal year ended March 31, 2018. However, existing unvested awards continue to vest in accordance with their original contractual terms.
(b
-3)
Consistency with risk management and linkage to performance
In determining aggregate compensation, Nomura considers the ratio of compensation and benefit expenses to adjusted net income (defined as net income before income taxes and before deduction of compensation and benefits expenses followed by a specific risk adjustment). The risk adjustment to income is determined by deducting a certain proportion of economic capital from each division’s revenue. Such economic capital comprehensively recognizes quantitatively assessed risks, and reflects various risks including market, credit, liquidity, and operational risks.
Nomura recognizes that its aggregate compensation should maintain consistency with the current financial soundness and future prospects of Nomura, and that it should not have significant impact on capital adequacy in the future.
2. Compensation for Directors and Executive Officers
Pursuant to the fundamental approach and framework of compensation as described above, and as a company which adopts a committee-based corporate governance system, a Compensation Committee of Nomura determines compensation of its Directors and Executive Officers in accordance with our applicable compensation policy.
2-1. Aggregate compensation
|
|
Number of
Directors or
Executive
Officers
(1)
|
|
Millions of yen
|
|||||||||||||||||
|
|
Year ended March 31, 2020
|
|||||||||||||||||||
|
|
Basic Compensation
(2)(3)
|
|
Bonus
|
|
Deferred Compensation
(4)
|
|
Total
|
|
||||||||||||
|
Directors
|
8
|
¥ |
253
|
¥ |
100
|
¥ |
15
|
¥ |
368
|
|||||||||||
|
(Outside Directors included in above)
|
(6
|
) |
(129
|
) |
( —
|
) |
( —
|
) |
(129
|
) | ||||||||||
|
Executive Officers
|
8
|
560
|
538
|
203
|
1,301
|
|||||||||||||||
|
Total
|
16
|
¥ |
813
|
¥ |
638
|
¥ |
218
|
¥ |
1,669
|
|||||||||||
| (1) | Compensation to Directors who were concurrently serving as Executive Officers is included in that of Executive Officers. |
| (2) | Basic compensation of ¥813 million includes other compensation (such as commuter pass allowances) of ¥750 thousand. |
| (3) | In addition to basic compensation of Executive Officers, ¥27 million of corporate housing costs, such as housing allowance and related tax adjustments, were provided. |
94
| (4) | Deferred compensation (such as RSU, SAR Plan A and B) granted during and prior to the fiscal year ended March 31, 2020 is recognized as expense in the financial statements for the fiscal year ended March 31, 2020. |
| (5) | Subsidiaries of the Company paid ¥61 million to Outside Directors as compensation etc. for their directorship at those subsidiaries for the year ended March 31, 2020. |
| (6) | The Company abolished retirement bonuses to Directors in 2001. |
2-2. Individual compensation of Directors and Executive Officers receiving
|
|
|
|
|
|
Millions of yen
|
|||||||||||||||||||||||||||||||
|
|
|
|
|
|
Fixed Remuneration
(Basic Compensation)
|
Variable Compensation
(1)
|
|
|
||||||||||||||||||||||||||||
|
Name
|
Company
|
|
Category
|
|
Base Salary
|
|
Equity
Compensation
(RSUs)
|
|
Total
|
|
Cash
Bonus
|
|
Deferred
Compensation
(RSUs, etc.)
|
|
Total
|
|
Total
|
|
||||||||||||||||||
|
Nobuyuki Koga
|
Nomura
|
Chairman of the Board of Directors
|
¥ |
87
|
¥ |
—
|
¥ |
87
|
¥ |
83
|
¥ |
83
|
¥ |
167
|
¥ |
254
|
||||||||||||||||||||
|
Koji Nagai(2)(3)
|
Nomura
|
Director,
Representative
Executive
Officer
(Group CEO)
|
¥ |
94
|
¥ |
17
|
¥ |
112
|
¥ |
155
|
¥ |
155
|
¥ |
311
|
¥ |
422
|
||||||||||||||||||||
|
Syoichi Nagamatsu(2)
|
Nomura
|
Director,
Representative Executive Officer,
Deputy President
|
¥ |
72
|
¥ |
14
|
¥ |
86
|
¥ |
106
|
¥ |
106
|
¥ |
211
|
¥ |
297
|
||||||||||||||||||||
|
Kentaro Okuda(2)(4)
|
Nomura
|
Executive Managing Director, Deputy President
(Group
Co-COO)
|
¥ |
82
|
¥ |
15
|
¥ |
97
|
¥ |
90
|
¥ |
90
|
¥ |
181
|
¥ |
277
|
||||||||||||||||||||
|
Toshio Morita(2)
|
Nomura
|
Executive Managing Director
(Group
Co-COO)
|
¥ |
80
|
¥ |
15
|
¥ |
95
|
¥ |
90
|
¥ |
90
|
¥ |
181
|
¥ |
275
|
||||||||||||||||||||
|
Yuji Nakata
|
Nomura
|
Executive Managing Director
|
¥ |
66
|
¥ |
13
|
¥ |
79
|
¥ |
46
|
¥ |
46
|
¥ |
93
|
¥ |
172
|
||||||||||||||||||||
|
Tomoyuki Teraguchi(2)
|
Nomura
|
Executive Managing Director
|
¥ |
59
|
¥ |
13
|
¥ |
72
|
¥ |
18
|
¥ |
18
|
¥ |
37
|
¥ |
109
|
||||||||||||||||||||
| (1) | Variable Compensation indicates the amount determined as remuneration based on the performance during the fiscal year ended March 31, 2020. |
| (2) | The amount reflects voluntary salary cut, conducted in May 2019. |
| (3) | In addition to basic compensation, ¥24 million of corporate housing costs, such as housing allowance and related tax adjustments, were provided. |
| (4) | In addition to basic compensation, ¥3 million of corporate housing costs, such as housing allowance and related tax adjustments, were provided. |
2-3.
Performance-linked compensation has been determined based on the mechanism described in above sections and certain indicators. Changes of the indicators between actuals of previous fiscal year and current year are referred in determining the performance-linked compensation as well as other qualitative information, compensation trends among competitors and industry.
95
Please refer to Item 3.A. “
” for the actual values of the referring indicators.
Selected Financial Data
3. Compensation governance and control
The Compensation Committee of Nomura, which is a statutory committee, is responsible for approving our overall compensation policy and for ensuring that the Nomura Group’s compensation framework supports our business strategy.
The Compensation Committee was held 8 times during the fiscal year to review and determine policies, framework, and individual compensation of directors and executive officers. To ensure effective discussion and determination at the Compensation Committee, executive officers are invited. Regarding the members of the Compensation Committee, please refer to Item 6.A. “
”
Directors and Senior Management.
The Compensation Committee’s activities during the fiscal year are following, variable compensation were discussed and determined on April 25, 2019. In addition, voluntary salary cut was reported on May 24, 2019. On June 24, 2019, after the appointment of directors at the annual shareholder meeting, the Compensation Committee reviewed and confirmed our compensation policy and determined fixed compensation for new directors. Also, checked and confirmed a partial amendment of the Nomura Group Compensation Policy. Furthermore, held 3 consequtive meetings since August 26, 2019, for discussing compensation control of directors and executive officers, which resulted to a resolution for a few sections on March 3, 2020, aiming to apply from the performance period ending March 31, 2021. On March 30, 2020, the fixed remuneration was determined for newly appointed executive officers as of April 1.
96
Stock Acquisition Rights (“SARs”)
The following table presents information regarding unexercised Stock Acquisition Rights as of March 31, 2020.
|
|
March 31, 2020
|
|||||||||||||||
|
Series of SARs
|
Allotment Date
|
Number of
Shares under
SARs
|
|
Exercise Period
of SARs
|
Exercise
Price per
Share under
SARs
|
|
Paid-in
Amount for
SARs
|
|
||||||||
|
Stock Acquisition Rights No.46
|
June 5, 2012
|
115,300
|
From April 20, 2015
to April 19, 2020
|
¥ |
1
|
¥ |
0
|
|||||||||
|
Stock Acquisition Rights No.47
|
June 5, 2012
|
372,000
|
From April 20, 2016
to April 19, 2021
|
1
|
0
|
|||||||||||
|
Stock Acquisition Rights No.48
|
June 5, 2012
|
526,800
|
From April 20, 2017
to April 19, 2022
|
1
|
0
|
|||||||||||
|
Stock Acquisition Rights No.49
|
June 5, 2012
|
39,800
|
From October 20, 2015
to April 19, 2021
|
1
|
0
|
|||||||||||
|
Stock Acquisition Rights No.50
|
June 5, 2012
|
39,700
|
From October 20, 2016
to April 19, 2022
|
1
|
0
|
|||||||||||
|
Stock Acquisition Rights No.53
|
June 5, 2013
|
93,700
|
From April 20, 2015
to April 19, 2020
|
1
|
0
|
|||||||||||
|
Stock Acquisition Rights No.54
|
June 5, 2013
|
456,300
|
From April 20, 2016
to April 19, 2021
|
1
|
0
|
|||||||||||
|
Stock Acquisition Rights No.55
|
November 19, 2013
|
2,678,200
|
From November 19, 2015
to November 18, 2020
|
821
|
0
|
|||||||||||
|
Stock Acquisition Rights No.56
|
June 5, 2014
|
189,200
|
From April 20, 2015
to April 19, 2020
|
1
|
0
|
|||||||||||
|
Stock Acquisition Rights No.57
|
June 5, 2014
|
652,400
|
From April 20, 2016
to April 19, 2021
|
1
|
0
|
|||||||||||
|
Stock Acquisition Rights No.58
|
June 5, 2014
|
1,014,500
|
From April 20, 2017
to April 19, 2022
|
1
|
0
|
|||||||||||
|
Stock Acquisition Rights No.60
|
June 5, 2014
|
375,400
|
From March 31, 2016
to March 30, 2021
|
1
|
0
|
|||||||||||
|
Stock Acquisition Rights No.61
|
June 5, 2014
|
1,374,600
|
From March 31, 2017
to March 30, 2022
|
1
|
0
|
|||||||||||
|
Stock Acquisition Rights No.62
|
November 18, 2014
|
2,673,700
|
From November 18, 2016
to November 17, 2021
|
738
|
0
|
|||||||||||
|
Stock Acquisition Rights No.63
|
June 5, 2015
|
546,100
|
From April 20, 2016
to April 19, 2021
|
1
|
0
|
|||||||||||
|
Stock Acquisition Rights No.64
|
June 5, 2015
|
928,200
|
From April 20, 2017
to April 19, 2022
|
1
|
0
|
|||||||||||
|
Stock Acquisition Rights No.65
|
June 5, 2015
|
1,497,500
|
From April 20, 2018
to April 19, 2023
|
1
|
0
|
|||||||||||
|
Stock Acquisition Rights No.68
|
November 18, 2015
|
2,568,800
|
From November 18, 2017
to November 17, 2022
|
802
|
0
|
|||||||||||
|
Stock Acquisition Rights No.69
|
June 7, 2016
|
1,034,100
|
From April 20, 2017
to April 19, 2022
|
1
|
0
|
|||||||||||
|
Stock Acquisition Rights No.70
|
June 7, 2016
|
1,552,200
|
From April 20, 2018
to April 19, 2023
|
1
|
0
|
|||||||||||
|
Stock Acquisition Rights No.71
|
June 7, 2016
|
2,028,300
|
From April 20, 2019
to April 19, 2024
|
1
|
0
|
|||||||||||
97
|
|
March 31, 2020
|
|||||||||||||||
|
Series of SARs
|
Allotment Date
|
Number of
Shares under
SARs
|
|
Exercise Period
of SARs
|
Exercise
Price per
Share under
SARs
|
|
Paid-in
Amount for
SARs
|
|
||||||||
|
Stock Acquisition Rights No.72
|
June 7, 2016
|
259,200
|
From October 30, 2016
to October 29, 2021
|
¥ |
1
|
¥ |
0
|
|||||||||
|
Stock Acquisition Rights No.73
|
June 7, 2016
|
105,400
|
From April 30, 2017
to April 29, 2022
|
1
|
0
|
|||||||||||
|
Stock Acquisition Rights No.74
|
November 11, 2016
|
2,535,400
|
From November 11, 2018
to November 10, 2023
|
593
|
0
|
|||||||||||
|
Stock Acquisition Rights No.75
|
June 9, 2017
|
1,188,600
|
From April 20, 2018
to April 19, 2023
|
1
|
0
|
|||||||||||
|
Stock Acquisition Rights No.76
|
June 9, 2017
|
1,456,900
|
From April 20, 2019
to April 19, 2024
|
1
|
0
|
|||||||||||
|
Stock Acquisition Rights No.77
|
June 9, 2017
|
4,258,000
|
From April 20, 2020
to April 19, 2025
|
1
|
0
|
|||||||||||
|
Stock Acquisition Rights No.78
|
June 9, 2017
|
811,800
|
From April 20, 2021
to April 19, 2026
|
1
|
0
|
|||||||||||
|
Stock Acquisition Rights No.79
|
June 9, 2017
|
809,900
|
From April 20, 2022
to April 19, 2027
|
1
|
0
|
|||||||||||
|
Stock Acquisition Rights No.80
|
June 9, 2017
|
136,200
|
From April 20, 2023
to April 19, 2028
|
1
|
0
|
|||||||||||
|
Stock Acquisition Rights No.81
|
June 9, 2017
|
136,200
|
From April 20, 2024
to April 19, 2029
|
1
|
0
|
|||||||||||
|
Stock Acquisition Rights No.82
|
June 9, 2017
|
276,700
|
From October 30, 2017
to October 29, 2022
|
1
|
0
|
|||||||||||
|
Stock Acquisition Rights No.83
|
June 9, 2017
|
63,900
|
From April 30, 2018
to April 29, 2023
|
1
|
0
|
|||||||||||
|
Stock Acquisition Rights No.84
|
November 17, 2017
|
2,488,900
|
From November 17, 2019
to November 16, 2024
|
684
|
0
|
|||||||||||
|
Stock Acquisition Rights No.85
|
November 20, 2018
|
2,507,900
|
From November 20, 2020
to November 19, 2025
|
573
|
0
|
|||||||||||
| (1) | SARs (including those granted to Directors and Executive Officers of Nomura which are stated in the table below) are issued in conjunction with deferred compensation plan. |
| (2) | The number of shares issuable under SARs is subject to adjustments under certain circumstances including stock splits. |
98
SARs Held by Directors and Executive Officers of Nomura
The following table presents details of Stock Acquisition Rights held by Directors and Executive Officers as of March 31, 2020.
|
|
March 31, 2020
|
|||||||
|
|
|
|
Numbers of Holders
|
|
||||
|
Series of SARs
|
Number of
Shares under
SARs
|
|
Directors and
Executive Officers
(excluding
Outside Directors)
|
|
||||
|
Stock Acquisition Rights No.47
|
1,700
|
1
|
||||||
|
Stock Acquisition Rights No.48
|
7,600
|
2
|
||||||
|
Stock Acquisition Rights No.54
|
4,900
|
1
|
||||||
|
Stock Acquisition Rights No.58
|
26,400
|
2
|
||||||
|
Stock Acquisition Rights No.60
|
9,500
|
2
|
||||||
|
Stock Acquisition Rights No.61
|
41,400
|
3
|
||||||
|
Stock Acquisition Rights No.63
|
6,900
|
1
|
||||||
|
Stock Acquisition Rights No.64
|
20,600
|
2
|
||||||
|
Stock Acquisition Rights No.65
|
57,400
|
3
|
||||||
|
Stock Acquisition Rights No.69
|
45,100
|
3
|
||||||
|
Stock Acquisition Rights No.70
|
93,800
|
5
|
||||||
|
Stock Acquisition Rights No.71
|
113,000
|
6
|
||||||
|
Stock Acquisition Rights No.75
|
88,900
|
5
|
||||||
|
Stock Acquisition Rights No.76
|
88,700
|
5
|
||||||
|
Stock Acquisition Rights No.77
|
109,900
|
7
|
||||||
Pension, Retirement or Similar Benefits
See Note 13 “
” in our consolidated financial statements included in this annual report.
Employee benefit plans
C. Board Practices.
Information Concerning Directors
The Companies Act states that a Company with Three Board Committees (as defined below) must establish three committees; a nomination committee, an audit committee and a compensation committee. The members of each committee are chosen from the company’s directors, and the majority of the members of each committee must be outside directors. At a Company with Three Board Committees, the board of directors is entitled to establish the basic management policy for the company, has decision-making authority over certain prescribed matters, and supervises the execution by the executive officers of their duties. Executive officers and representative executive officers appointed by a resolution adopted by the board of directors manage the business affairs of the company, based on a delegation of authority by the board of directors.
Since June 2003, the Company has adopted a corporate governance structure that separates management oversight functions from business execution functions (“Company with Three Board Committees”). Through this governance structure, the Company aims to strengthen management oversight, increase the transparency of the Company’s management and expedite the decision-making process within the Nomura Group. An outline of the Company’s Board of Directors, Nomination Committee, Audit Committee and Compensation Committee is provided below.
Board of Directors
The Company’s Board of Directors consists of Directors who are elected at a general meeting of shareholders and the Company’s Articles of Incorporation provide that the number of Directors shall not exceed
99
twenty. The term of office of each Director expires upon the conclusion of the ordinary general meeting of shareholders with respect to the last fiscal year ending within one year after their appointment. Directors may serve any number of consecutive terms. From among its members, the Company’s Board of Directors elects the Chairman. The Company’s Board of Directors met eleven times during the fiscal year ended March 31, 2020. As a group, the Directors attended 100% of the total number of meetings of the Board of Directors during the year. The Board of Directors has the authority to determine the Company’s basic management policy and supervise the execution by the Executive Officers of their duties. Although the Board of Directors also has the authority to make decisions with regard to the Company’s business, most of this authority has been delegated to the Executive Officers by a resolution adopted by the Board of Directors. There are no Directors’ service contracts with the Company or any of its subsidiaries providing for benefits upon termination of employment.
Nomination Committee
The Nomination Committee, in accordance with the Company’s Regulations of the Nomination Committee, determines the details of any proposals concerning the election and dismissal of Directors to be submitted to general meetings of shareholders by the Board of Directors. The Nomination Committee met nine times during the fiscal year ended March 31, 2020. As a group, the member Directors attended all of the meetings of the Nomination Committee during the year. As of June 24, 2020, the members of the Nomination Committee are Koji Nagai, a Director not concurrently serving as an Executive Officer, and Outside Directors Hiroshi Kimura and Kazuhiko Ishimura. Hiroshi Kimura is the Chairman of this Committee.
Audit Committee
The Audit Committee, in accordance with the Company’s Regulations of the Audit Committee, (i) audits the execution by the Directors and the Executive Officers of their duties and the preparation of audit reports and (ii) determines the details of proposals concerning the election, dismissal or
non-reappointment
of the accounting auditor to be submitted to general meetings of shareholders by the Board of Directors. With respect to financial reporting, the Audit Committee has the statutory duty to examine financial statements and business reports to be prepared by Executive Officers designated by the Board of Directors and is authorized to report its opinion to the ordinary general meeting of shareholders.
The Audit Committee met sixteen times during the fiscal year ended March 31, 2020. As a group, the member Directors attended all of the meetings of the Audit Committee during the year. As of June 24, 2020, the members of the Audit Committee are Hisato Miyashita (a full-time member of the Audit Committee) and Outside Directors, Noriaki Shimazaki and Mari Sono. Noriaki Shimazaki is the Chairman of this Committee.
Compensation Committee
The Compensation Committee, in accordance with the Company’s Regulations of the Compensation Committee, determines the Company’s policy with respect to the determination of the details of each Director and Executive Officer’s compensation. The Compensation Committee also determines the details of each Director and Executive Officer’s actual compensation. The Compensation Committee met eight times during the fiscal year ended March 31, 2020. As a group, the member Directors attended all of the meetings of the Compensation Committee during the year. As of June 24, 2020, the members of the Compensation Committee are Koji Nagai, a Director not concurrently serving as an Executive Officer, and Outside Directors Hiroshi Kimura and Kazuhiko Ishimura. Hiroshi Kimura is the Chairman of this Committee.
Limitation of Director Liability
In accordance with Article 33, Paragraph 2 of the Company’s Articles of Incorporation and Article 426, Paragraph 1 of the Companies Act, the Company may execute agreements with Directors (excluding a person who serves as an executive director, etc.) that limit their liability to the Company for damages suffered by the
100
Company if they acted in good faith and without gross negligence. Accordingly, the Company has entered into agreements to limit Companies Act Article 423 Paragraph 1 liability for damages (“Limitation of Liability Agreements”) with each of the following Directors: Hisato Miyashita, Hiroshi Kimura, Kazuhiko Ishimura, Noriaki Shimazaki, Mari Sono, Michael Lim Choo San and Laura Simone Unger. Liability under each such agreement is limited to either ¥20 million or the amount prescribed by laws and regulations, whichever is greater.
Information Concerning Executive Officers
Executive Officers of the Company are appointed by the Board of Directors, and the Company’s Articles of Incorporation provide that the number of Executive Officers shall not exceed forty-five. The term of office of each Executive Officer expires upon the conclusion of the first meeting of the Board of Directors convened after the ordinary general meeting of shareholders for the last fiscal year ending within one year after each Executive Officer’s assumption of office. Executive Officers may serve any number of consecutive terms. Executive Officers have the authority to determine matters delegated to them by resolutions adopted by the Board of Directors and to execute business activities.
D. Employees.
The following table shows the number of our employees as of the dates indicated:
|
|
March 31,
|
|||||||||||
|
|
2018
|
|
2019
|
|
2020
|
|
||||||
|
Japan
|
15,819
|
15,852
|
15,748
|
|||||||||
|
Europe
|
3,057
|
2,909
|
2,691
|
|||||||||
|
Americas
|
2,362
|
2,357
|
2,120
|
|||||||||
|
Asia and Oceania
|
6,810
|
6,746
|
6,070
|
|||||||||
|
Total
|
28,048
|
27,864
|
26,629
|
|||||||||
As of March 31, 2020, we had 15,748 employees in Japan, including 9,215 in our Retail Division, 1,630 in our Wholesale Division and 837 in our Asset Management Division. In overseas, we had 10,881 employees, of which 2,691 were located in Europe, 2,120 in the Americas, and 6,070 in Asia and Oceania.
As of March 31, 2020, 8,856 of Nomura Securities’ employees in Japan were members of the Nomura employees’ union, with which we have a labor contract. The Company and labor union communicate frequently in order to resolve labor-related matters.
We have not experienced any strikes or other labor disputes in Japan or overseas and consider our employee relations to be excellent.
E. Share Ownership.
The following table shows the number of shares owned by our Directors and Executive Officers as of May 31, 2020. As of that date, none of them owned 1% or more of our issued and outstanding shares. None of the shares referred to below have different voting rights.
101
Directors
|
Name
|
Number of
Shareholdings
|
|
||
|
Koji Nagai
|
382,001
|
|||
|
Kentaro Okuda
|
103,125
|
|||
|
Toshio Morita
|
283,642
|
|||
|
Hisato Miyashita
|
84,200
|
|||
|
Hiroshi Kimura
|
359
|
|||
|
Kazuhiko Ishimura
|
—
|
|||
|
Noriaki Shimazaki
|
16,808
|
|||
|
Mari Sono
|
—
|
|||
|
Michael Lim Choo San
|
—
|
|||
|
Laura Simone Unger
|
(1,000ADR
|
)
(1)
|
||
|
Total
|
870,135
|
|||
| (1) | ADRs are not included in the total. |
Executive Officers
|
Name
|
Number of
Shareholdings
|
|
||
|
Kentaro Okuda
|
See above
|
|||
|
Toshio Morita
|
See above
|
|||
|
Junko Nakagawa
|
138,558
|
|||
|
Tomoyuki Teraguchi
|
135,910
|
|||
|
Takumi Kitamura
|
46,749
|
|||
|
Sotaro Kato
|
3,840
|
|||
|
Total
|
325,057
|
|||
For information regarding stock options granted to our Directors and Executive Officers, see Item 6.B “
” of this annual report.
Compensation
Item 7. Major Shareholders and Related Party Transactions
A. Major Shareholders.
According to a statement on Schedule 13G (Amendment No.5) filed by BlackRock, Inc. with the SEC on February 5, 2020, BlackRock, Inc. owned 201,152,010 shares, representing 5.80% of the issued shares of the Company’s common stock. However the Company has not confirmed the status of these shareholdings as of March 31, 2020.
According to a statement on Schedule 13G filed by Sumitomo Mitsui Trust Holdings, Inc. with the SEC on February 12, 2020, Sumitomo Mitsui Trust Holdings, Inc. owned 176,742,300 shares, representing 5.10% of the issued shares of the Company’s common stock. However the Company has not confirmed the status of these shareholdings as of March 31, 2020.
To our knowledge, we are not directly or indirectly owned or controlled by another corporation, by any government or by any other natural or legal person severally or jointly. We know of no arrangements the operation of which may at a later time result in a change of control of Nomura. Also as of March 31, 2020, there were 273 Nomura shareholders of record with addresses in the U.S., and those U.S. holders held 350,494,286
102
shares of the Company’s common stock, representing 10.0% of Nomura’s then outstanding common stock. As of March 31, 2020, there were 30,223,151 ADSs outstanding, representing 30,223,151 shares of the Company’s common stock or 0.8% of Nomura’s then outstanding common stock. Our major shareholders above do not have different voting rights.
B. Related Party Transactions.
Nomura Research Institute, Ltd.
NRI develops and manages computer systems and provides research services and management consulting services. We are one of the major clients of NRI.
We held 28.8% of NRI’s outstanding share capital as of March 31, 2020.
For the year ended March 31, 2020, we purchased ¥17,716 million worth of software and computer equipment and paid ¥45,911 million for other services to NRI, while received ¥642 million from NRI.
See also Note 20 “
” in the consolidated financial statements included in this annual report.
Affiliated companies and other equity-method investees
Directors
There were no significant transactions.
C. Interests of Experts and Counsel.
Not applicable.
Item 8. Financial Information
A. Consolidated Statements and Other Financial Information.
Financial Statements
The information required by this item is set forth in our consolidated financial statements included elsewhere in this annual report.
Legal Proceedings
For a discussion of our litigation and related matters, see Note 21 “
” in the consolidated financial statements included in this annual report.
Commitments, contingencies and guarantees
Dividend Policy
For our dividend policy, see Item 5.B
this annual report.
“Liquidity and Capital Resources—Capital Management—Dividends” in
B. Significant Changes.
Except as disclosed in this annual report, there have been no significant changes since March 31, 2020.
Item 9. The Offer and Listing
A. Offer and Listing Details.
See Item 9. C. “The Offer and Listing—Markets”.
103
B. Plan of Distribution.
Not applicable.
C. Markets.
The principal trading market for the Company’s common stock is the Tokyo Stock Exchange. The Company’s common stock has been listed on the Tokyo Stock Exchange and the Nagoya Stock Exchange since 1961. The trading symbol on those trading markets is “8604”.
Since December 2001, the Company’s common stock has been listed on the New York Stock Exchange in the form of ADSs evidenced by ADRs. Each ADS represents one share of common stock. The trading symbol is “NMR”. The Company’s common stock has been listed on the Singapore Stock Exchange since 1994. The trading symbol is “N33”.
D. Selling Shareholders.
Not applicable.
E. Dilution.
Not applicable.
F. Expenses of the Issue.
Not applicable.
Item 10. Additional Information
A. Share Capital.
Not applicable.
B. Memorandum and Articles of Association.
Register, Objects and Purposes in the Company’s Articles of Incorporation
Nomura Holdings, Inc. is incorporated in Japan and is registered in the Commercial Register (
in Japanese) maintained by the Tokyo Legal Affairs Bureau.
Shogyo Tokibo
Article 2 of the Company’s Articles of Incorporation, which is an exhibit to this annual report, states that the Company’s purpose is, by means of holding shares, to control and manage the business activities of domestic companies which engage in the following businesses and the business activities of foreign companies which engage in the businesses equivalent to the following businesses:
| (1) | Financial instruments business prescribed in the Financial Instruments and Exchange Law; |
| (2) | Banking business prescribed in the Banking Law and trust business prescribed in the Trust Business Law; and |
| (3) | Any other financial services and any business incidental or related to such financial services. |
| (4) | Other than as prescribed in the items above, any other business ancillary or related to survey and research in connection with the economy, financial or capital markets, or infrastructure or undertaking the outsourcing thereof. |
104
Provisions Regarding the Company’s Directors
Although there is no provision in the Company’s Articles of Incorporation as to a Director’s power to vote on a proposal or arrangement in which the Director is materially interested, under the Companies Act and the Company’s Regulations of the Board of Directors, a Director must abstain from voting on such matters at meetings of the Board of Directors.
As a Company with Three Board Committees, the compensation of the Company’s Directors and Executive Officers is determined by the Compensation Committee (see Item 6.C.
in this annual report). The Compensation Committee establishes the policy with respect to the determination of the individual compensation (including variable compensation) of each of the Company’s Directors and Executive Officers and makes determinations in accordance with that compensation policy.
“Board Practices-Information Concerning Directors-Compensation Committee”
With respect to borrowing powers, these as well as other powers relating to the management of the business (with the exception of certain exclusions specified under the Companies Act) have been delegated to the Executive Officers by the Board of Directors as a Company with Three Board Committees.
There is no mandatory retirement age for the Company’s Directors under the Companies Act or the Company’s Articles of Incorporation.
There is no requirement concerning the number of shares an individual must hold in order to qualify him or her to serve as a Director of the Company under the Companies Act or the Company’s Articles of Incorporation.
Pursuant to the Companies Act and the Company’s Articles of Incorporation, the Company may, by a resolution adopted by the Company’s Board of Directors, release the liabilities of any Directors or Executive Officers to the Company for damages suffered by the Company due to their acts taken in good faith and without gross negligence, to the extent permitted by the Companies Act and the Company’s Articles of Incorporation. In addition, the Company may execute with Directors (excluding a person who serves as an executive director, etc.) agreements that limit their liabilities to the Company for damages suffered by the Company if they acted in good faith and without gross negligence, to the extent permitted by the Companies Act and the Company’s Articles of Incorporation. See Item 6.C.
in this annual report.
“Board Practices-Limitation of Director Liability”
Other Matters
For disclosures under the following items, see
which is an exhibit to this annual report: Item 10.B.3, B.4, B.5, B.6, B.7, B.8, B.9 and B.10.
“Description of rights of each class of securities registered under Section 12 of the Securities Exchange Act of 1934”
C. Material Contracts.
In addition to the items disclosed in Item 6.C “Board Practices” of this annual report, Nomura tendered to the self-tender offer made by Nomura Research Institute, Ltd. (“NRI”) conducted between July 1, 2019 and July 29, 2019. Upon the settlement on August 21, 2019, Nomura sold ¥101,889,300 ordinary shares it held at ¥159,966,201,000 (¥1,570 per share) to NRI. NRI remains an equity method affiliate of NHI.
D. Exchange Controls.
Acquisition of Shares
The following summary is not intended to be a complete analysis of the prior notification or reporting requirements under Japanese foreign exchange regulations as a result of the acquisition by investors of shares of the Company. Potential investors should consult their own legal advisors on the consequences of the acquisition of shares of the Company, including specifically the applicable notification, reporting and other procedures and any available exemption therefrom under Japanese foreign exchange regulations.
105
The Foreign Exchange and Foreign Trade Law of Japan and its related cabinet orders and ministerial ordinances (“Foreign Exchange Regulations”) governs certain aspects relating to the acquisition and holding of shares of the Company by “foreign investors,” as defined below.
If a foreign investor acquires shares of the Company and as a result of this acquisition directly or indirectly holds 1% or more of the issued shares of the Company, together with its existing holdings and those of other parties who have a close relationship with that foreign investor (the “closely-related person”), the foreign investor is, in general, required to report the acquisition to the Minister of Finance and any other competent ministers via the Bank of Japan within 45 days from the date of acquisition. If (i) the foreign investor or its closely-related person will not become a board member of the Company, (ii) the foreign investor will not propose, at a general shareholders meeting of the Company, a transfer or disposition of its business, and (iii) the foreign investor will not have access to any
non-public
information regarding the Company’s technologies in relation to its business, in general, a prior notification is exempted.
“Foreign investors” are generally defined as (i) individuals who are not residents in Japan, (ii) corporations which are organized under the laws of foreign countries or whose principal offices are located outside Japan, (iii) corporations of which (a) 50% or more of the voting rights are held directly or indirectly by (i) and/or (ii) above, (b) a majority of officers consists of
non-residents
of Japan or (c) a majority of officers having the power of representation consists of
non-residents
of Japan, and (iv) partnerships or limited partnerships engaging in investment business, in which (a) 50% or more of the total amount of contributions are made directly or indirectly by (i) and/or (ii) above or (b) a majority of the managing partners are (i) and/or (ii) above.
Dividends and Proceeds of Sale
Under the Foreign Exchange Regulations, dividends paid on, and the proceeds of sales in Japan of, shares held by
non-residents
of Japan may in general be converted into any foreign currency and repatriated abroad. Under the terms of the deposit agreement pursuant to which ADSs of the Company will be issued, the depositary is required, to the extent that in its judgment it can convert yen on a reasonable basis into dollars and transfer the resulting dollars to the U.S., to convert all cash dividends that it receives in respect of deposited shares into dollars and to distribute the amount received (after deduction of applicable withholding taxes) to the holders of ADSs.
“Non-residents
of Japan” are generally defined as individuals who are not resident in Japan and corporations whose principal offices are located outside Japan. Branches and other offices of Japanese corporations located outside Japan are considered
non-residents
of Japan, and branches and other offices located within Japan of
non-resident
corporations are considered residents of Japan.
E. Taxation.
U.S. Federal Income Taxation
This section describes the material U.S. federal income tax consequences of owning shares or ADSs. It applies to you only if you are a U.S. holder (as defined below), you acquire your shares or ADSs in an offering and you hold your shares or ADSs as capital assets for tax purposes. This section does not apply to you if you are a member of a special class of holders subject to special rules, including:
| • | a dealer in securities, |
| • |
a trader in securities that elects to use a
mark-to-market
method of accounting for your securities holdings,
|
| • |
a
tax-exempt
organization,
|
| • | a life insurance company, |
106
| • | a person liable for alternative minimum tax, |
| • | a person that actually or constructively owns 10% or more of the combined voting power of our voting stock or of the total value of our stock, |
| • | a person that holds shares or ADSs as part of a straddle or a hedging, conversion, integrated or constructive sale transaction, |
| • | a person that purchases or sells shares or ADSs as part of a wash sale for tax purposes, or |
| • | a person whose functional currency is not the U.S. dollar. |
This section is based on the Internal Revenue Code of 1986, as amended, its legislative history, existing and proposed regulations, published rulings and court decisions, all as currently in effect, as well as on the Income Tax Convention Between the U.S. and Japan
(“Japan-U.S.
Tax Treaty”). These laws are subject to change, possibly on a retroactive basis. In addition, this section is based in part upon the representations of The Bank of New York Mellon (“depositary”) and the assumption that each obligation in the deposit agreement and any related agreement will be performed in accordance with its terms.
If a partnership holds the shares or ADSs, the U.S. federal income tax treatment of a partner will generally depend on the status of the partner and the tax treatment of the partnership. A partner in a partnership holding the shares or ADSs should consult its tax advisor with regard to the U.S. federal income tax treatment of an investment in the shares or ADSs.
You are a U.S. holder if you are a beneficial owner of shares or ADSs and you are:
| • | a citizen or resident of the U.S., |
| • | a corporation created or organized in or under the laws of the U.S. or any political subdivision thereof, |
| • | an estate whose income is subject to U.S. federal income tax regardless of its source, or |
| • | a trust if a U.S. court can exercise primary supervision over the trust’s administration and one or more U.S. persons are authorized to control all substantial decisions of the trust. |
You should consult your own tax advisor regarding the U.S. federal, state, local and other tax consequences of owning and disposing of shares and ADSs in your particular circumstances.
This discussion addresses only U.S. federal income taxation.
In general, and taking into account the earlier assumptions, for U.S. federal income tax purposes, if you hold ADRs evidencing ADSs, you will be treated as the owner of the shares represented by those ADSs. Exchanges of shares for ADRs, and ADRs for shares, generally will not be subject to U.S. federal income tax.
Taxation of Dividends
Under the U.S. federal income tax laws, and subject to the passive foreign investment company (“PFIC”) rules discussed below, the gross amount of any dividend we pay out of our current or accumulated earnings and profits (as determined for U.S. federal income tax purposes) is subject to U.S. federal income taxation. If you are a
non-corporate
U.S. holder, dividends that constitute qualified dividend income will be taxable to you at the preferential rates applicable to long-term capital gains provided that you hold the shares or ADSs for more than 60 days during the
121-day
period beginning 60 days before the
ex-dividend
date and meet other holding period requirements. Dividends we pay with respect to the shares or ADSs generally will be qualified dividend income.
You must include any Japanese tax withheld from the dividend payment in this gross amount even though you do not in fact receive it.
107
The dividend is taxable when you, in the case of shares, or the depositary, in the case of ADSs, receive the dividend, actually or constructively. The dividend will not be eligible for the “dividends-received deduction” generally allowed to U.S. corporations in respect of dividends received from other U.S. corporations. The amount of the dividend distribution that you must include in your income as a U.S. holder will be the U.S. dollar value of the Japanese yen payments made, determined at the spot Japanese yen/U.S. dollar rate on the date the dividend distribution is includible in your income, regardless of whether the payment is in fact converted into U.S. dollars. Generally, any gain or loss resulting from currency exchange fluctuations during the period from the date you include the dividend payment in income to the date you convert the payment into U.S. dollars will be treated as ordinary income or loss and will not be eligible for the special tax rate applicable to qualified dividend income. The gain or loss generally will be income or loss from sources within the U.S. for foreign tax credit limitation purposes. Distributions in excess of current and accumulated earnings and profits, as determined for U.S. federal income tax purposes, will be treated as a
non-taxable
return of capital to the extent of your basis in the shares or ADSs and thereafter as capital gain. However, we do not expect to calculate earnings and profits in accordance with United States federal income tax principles. Accordingly, you should expect generally to treat distributions we make as dividends.
Subject to certain limitations, the Japanese tax withheld in accordance with the
Japan-U.S.
Tax Treaty and paid over to Japan will be creditable against your U.S. federal income tax liability. Special rules apply in determining the foreign tax credit limitation with respect to dividends that are subject to the preferential tax rates. To the extent a refund of the tax withheld is available under Japanese law or the
Japan-U.S.
Tax Treaty, the amount of tax withheld that is refundable will not be eligible for credit against your U.S. federal income tax liability.
For foreign tax credit purposes, dividends will generally be income from sources outside the U.S. and will generally be “passive income” for purposes of computing the foreign tax credit allowable to you.
Taxation of Capital Gains
Subject to the PFIC rules discussed below, if you are a U.S. holder and you sell or otherwise dispose of your shares or ADSs, you will recognize capital gain or loss for U.S. federal income tax purposes equal to the difference between the U.S. dollar value of the amount that you realize and your tax basis, determined in U.S. dollars, in your shares or ADSs. Capital gain of a
non-corporate
U.S. holder is generally taxed at preferential rates where the property is held for more than one year. The gain or loss will generally be income or loss from sources within the U.S. for foreign tax credit limitation purposes.
PFIC Rules
We do not expect our shares and ADSs to be treated as stock of a PFIC for U.S. federal income tax purposes, but this conclusion is a factual determination that is made annually and thus may be subject to change. Moreover, the application of the PFIC rules to a corporation, such as Nomura, that is primarily engaged in an active business as a securities dealer is not entirely clear.
In general, if you are a U.S. holder, we will be a PFIC with respect to you if for any taxable year in which you held our ADSs or shares:
| • | at least 75% of our gross income for the taxable year is passive income, or |
| • | at least 50% of the value, determined on the basis of a quarterly average, of our assets is attributable to assets that produce or are held for the production of passive income. |
Passive income generally includes dividends, interest, royalties, rents (other than certain rents and royalties derived in the active conduct of a trade or business), annuities and gains from assets that produce passive income. If a foreign corporation owns at least 25% by value of the stock of another corporation, the foreign corporation is treated for purposes of the PFIC tests as owning its proportionate share of the assets of the other corporation, and as receiving directly its proportionate share of the other corporation’s income.
108
If we are treated as a PFIC, and you are a U.S. holder that did not make a
mark-to-market
election, as described below, you will be subject to special rules with respect to:
| • | any gain you realize on the sale or other disposition of your shares or ADSs, and |
| • | any excess distribution that we make to you (generally, any distributions to you during a single taxable year that are greater than 125% of the average annual distributions received by you in respect of the shares or ADSs during the three preceding taxable years or, if shorter, your holding period for the shares or ADSs). |
Under these rules:
| • | the gain or excess distribution will be allocated ratably over your holding period for the shares or ADSs, |
| • | the amount allocated to the taxable year in which you realized the gain or excess distribution, or to prior years before the first year in which we were a PFIC with respect to you, will be taxed as ordinary income, |
| • | the amount allocated to each other previous year will be taxed at the highest tax rate in effect for that year, and |
| • | the interest charge generally applicable to underpayments of tax will be imposed in respect of the tax attributable to each such year. |
Special rules apply for calculating the amount of the foreign tax credit with respect to excess distributions by a PFIC.
If you own shares or ADSs in a PFIC that are regularly traded on a qualified exchange, they will be treated as marketable stock, and you may elect to mark your shares or ADSs to market. If you make this election, you will not be subject to the PFIC rules described above. Instead, in general, you will include as ordinary income each year the excess, if any, of the fair market value of your shares or ADSs at the end of the taxable year over your adjusted basis in your shares or ADSs. These amounts of ordinary income will not be eligible for the favorable tax rates applicable to qualified dividend income or long-term capital gains. You will also be allowed to take an ordinary loss in respect of the excess, if any, of the adjusted basis of your shares or ADSs over their fair market value at the end of the taxable year (but only to the extent of the net amount of previously included income as a result of the
mark-to-market
election). Your basis in the shares or ADSs will be adjusted to reflect any such income or loss amounts.
Your shares or ADSs will be treated as stock in a PFIC if we were a PFIC at any time during your holding period in your shares or ADSs, even if we are not currently a PFIC. For purposes of this rule, if you make a
mark-to-market
election with respect to your shares or ADSs, you will be treated as having a new holding period in your shares or ADSs beginning on the first day of the first taxable year beginning after the last taxable year for which the
mark-to-market
election applies.
In addition, notwithstanding any election you make with regard to the shares or ADSs, dividends that you receive from us will not constitute qualified dividend income to you if we are a PFIC (or treated as a PFIC with respect to you) either in the taxable year of the distribution or the preceding taxable year. Dividends that you receive that do not constitute qualified dividend income are not eligible for taxation at the preferential rates applicable to qualified dividend income. Instead, you must include the gross amount of any such dividend paid by us out of our accumulated earnings and profits (as determined for U.S. federal income tax purposes) in your gross income, and it will be subject to tax at rates applicable to ordinary income.
If you own shares or ADSs during any year that we are a PFIC with respect to you, you may be required to file Internal Revenue Service Form 8621.
109
Japanese Taxation
The following is a summary of the principal Japanese tax consequences to owners of shares of the Company who are
non-resident
individuals or
non-Japanese
corporations
(“non-resident
shareholders”) without a permanent establishment in Japan to which the relevant income is attributable. As tax laws are frequently revised, the tax treatments described in this summary are also subject to changes in the applicable Japanese laws and/or double taxation conventions occurring in the future, if any. This summary is not exhaustive of all possible tax considerations which may apply to specific investors under particular circumstances. Potential investors should, by consulting with their own tax advisers, satisfy themselves as to
| • | the overall tax consequences of the acquisition, ownership and disposition of shares or ADSs, including specifically the tax consequences under Japanese law, |
| • | the laws of the jurisdiction of which they are resident, and |
| • | any tax treaty between Japan and their country of residence. |
Generally, a
non-resident
shareholder is subject to Japanese withholding tax on dividends on the shares paid by the Company. A stock split is not subject to Japanese income or corporation tax, as it is characterized merely as an increase of number of shares (as opposed to an increase of value of shares) from Japanese tax perspectives. Conversion of retained earnings or legal reserve (but other than additional
paid-in
capital, in general) into stated capital on a
non-consolidated
basis is not characterized as a deemed dividend for Japanese tax purposes, and therefore such a conversion does not trigger Japanese withholding taxation (Article 2(16) of the Japanese Corporation Tax Law and Article 8(1)(xiii) of the Japanese Corporation Tax Law Enforcement Order).
Unless an applicable tax treaty, convention or agreement reducing the maximum rate of withholding tax applies, the rate of Japanese withholding tax applicable to dividends on listed shares such as those paid by the Company to
non-resident
shareholders is currently 15%, except for dividends paid to any individual shareholder who holds 3% or more of the issued shares for which the applicable rate is 20% (please refer to Article 170 and Article 213(1)(i) of the Japanese Income Tax Law and Article
9-3(1)(i)
of the Japanese Special Tax Measures Law).
On December 2, 2011, the “Special measures act to secure the financial resources required to implement policy on restoration after the East Japan Earthquake” (Act No. 117 of 2011) was promulgated and special surtax measures on income tax were introduced to fund the restoration effort from the earthquake. Income tax and withholding tax payers will need to pay a surtax, calculated by multiplying the base income tax with 2.1% for 25 years starting from January 1, 2013. As a result of the fractional tax rate increase, 15.315% is applicable until December 31, 2037. If a
non-resident
taxpayer is a resident of a country that Japan has tax treaty with, as described below, such
non-residents
will not be subject to the surtax to the extent that the applicable rate agreed in the tax treaty is lower than the aggregate domestic rate.
Japan has income tax treaties, conventions or agreements whereby the above-mentioned withholding tax rate is reduced, generally to 15% for portfolio investors, with, among others, Canada, Denmark, Finland, Germany, Ireland, Italy, Luxembourg, New Zealand, Norway, Singapore and Spain. Under the
Japan-U.S.
Tax Treaty, the withholding tax rate on dividends is 10% for portfolio investors, provided that they do not have a permanent establishment in Japan, or if there is a permanent establishment, the shares with respect to which such dividends are paid are not effectively connected with such permanent establishment, and that they are qualified U.S. residents eligible to enjoy treaty benefits. It shall be noted that, under the
Japan-U.S.
Tax Treaty, withholding tax on dividends to be paid is exempt from Japanese taxation by way of withholding or otherwise for pension funds which are qualified U.S. residents eligible to enjoy treaty benefits unless such dividends are derived from the carrying on of a business, directly or indirectly, by such pension funds (please refer to Article 10(3)(b) of the
Japan-U.S.
Tax Treaty). In addition to the
Japan-U.S.
Tax Treaty, Japan currently has income tax treaties with, among others, the U.K., France, Australia, the Netherlands, Switzerland, Sweden and Belgium whereby the withholding tax rate on dividends is also reduced from 15% to 10% for portfolio investors.
110
Non-resident
shareholders who are entitled to a reduced treaty rate of Japanese withholding tax on payment of dividends on the shares by the Company are required to submit the “Application Form for Income Tax Convention regarding Relief from Japanese Income Tax and Special Income Tax for Reconstruction on Dividends” or the “Application Form for Income Tax Convention regarding Relief from Japanese Income Tax and Special Income Tax for Reconstruction on Dividends with respect to Foreign Depositary Receipt”, as the case may be, in advance through the Company, which is the case for ADS holders, or (in cases where the relevant withholding taxpayer for the dividend payment is not the Company but a financial institution in Japan) through the financial institution, to the relevant tax authority before payment of dividends.
Non-resident
shareholders who receive dividends through a financial institution may select a simplified procedure with respect to dividends payable on or after January 1, 2014. Under such procedure,
non-resident
shareholders who submit the “Special Application Form for Income Tax Convention regarding Relief from Japanese Income Tax and Special Income Tax for Reconstruction on Dividends of Listed Stocks” to the relevant tax authority through a financial institution are deemed to have submitted the “Application Form for Income Tax Convention regarding Relief from Japanese Income Tax and Special Income Tax for Reconstruction on Dividends” mentioned above with respect to any dividend which will be paid by the Company to
non-resident
shareholders through the financial institution thereafter, provided that such
non-resident
shareholders shall notify the financial institution of certain information regarding the dividends before the payment of such dividends.
Non-resident
shareholders who do not submit an application in advance will be entitled to claim the refund of withholding taxes withheld in excess of the rate of an applicable tax treaty from the relevant Japanese tax authority. For Japanese tax purpose, the treaty rate normally applies superseding the tax rate under the domestic law. However, due to the
so-called
“preservation doctrine” under Article
3-2
of the Special Measures Law for the Income Tax Law, Corporation Tax Law and Local Taxes Law with respect to the Implementation of Tax Treaties, if the tax rate under the domestic tax law is lower than that promulgated under the applicable income tax treaty, then the domestic tax rate is still applicable. Consequently, if the domestic tax rate still applies, no treaty application is required to be filed.
Gains derived from the sale of shares outside Japan by a
non-resident
shareholder without a permanent establishment in Japan as a portfolio investor, are, in general, not subject to Japanese income or corporation taxes.
Japanese inheritance and gift taxes at progressive rates may be payable by an individual who has acquired shares as a legatee, heir or donee, even if the individual is not a Japanese resident.
You should consult your own tax advisers regarding the Japanese tax consequences of the acquisition, ownership and disposition of the shares and ADSs in your particular circumstances.
F. Dividends and Paying Agents.
Not applicable.
G. Statement by Experts.
Not applicable.
H. Documents on Display.
The Company is subject to the informational requirements of the Securities Exchange Act of 1934 and, in accordance therewith, the Company will file with the Securities and Exchange Commission annual reports on Form
20-F
within four months of the Company’s fiscal
year-end
and other reports and information on Form
6-K.
You can access the documents filed via the Electronic Data Gathering, Analysis, and Retrieval system on the SEC’s website (http://www.sec.gov).
I. Subsidiary Information.
Not applicable.
111
Item 11. Quantitative and Qualitative Disclosures about Market Risk
Risk Management
Nomura defines risks as (i) the potential erosion of Nomura’s capital base due to unexpected losses arising from risks to which its business operations are exposed, such as market risk, credit risk, operational risk and model risk, (ii) liquidity risk, the potential lack of access to funds or higher cost of funding than normal levels due to a deterioration in Nomura’s creditworthiness or deterioration in market conditions, and (iii) strategic risk, the potential failure of revenues to cover costs due to a deterioration in the earnings environment or a deterioration in the efficiency or effectiveness of its business operations.
A fundamental principle established by Nomura is that all employees shall regard themselves as principals of risk management and appropriately manage these risks. Nomura seeks to promote a culture of proactive risk management throughout all levels of the organization and to limit risks to the confines of its risk appetite. The risk management framework that Nomura uses to manage these risks consists of its risk appetite, risk management governance and oversight, the management of financial resources, the management of all risk classes, and processes to measure and control risks. Each of these key components is explained in further detail below.
Risk Appetite
Nomura has determined the types and levels of risk that it will assume in pursuit of its strategic objectives and business plan and has articulated this in its Risk Appetite Statement. This document is jointly submitted by the Chief Risk Officer (“CRO”), the Chief Financial Officer (“CFO”) and the Chief Compliance Officer (“CCO”) to the Executive Management Board (“EMB”) for approval.
The Risk Appetite Statement provides an aggregated view of risk and includes capital adequacy, liquidity, financial risk and
non-financial
risk. It is subject to regular monitoring and breach escalation as appropriate by the owner of the relevant risk appetite statement.
Nomura’s Risk Appetite Statement is required to be reviewed at least annually by the EMB but it is reviewed on an ad hoc basis if necessary, and must specifically be reviewed following any significant changes in Nomura’s strategy. Risk appetite underpins all additional aspects of Nomura’s risk management framework.
112
Risk Management Governance and Oversight
Committee Governance
Nomura has established a committee structure to facilitate effective business operations and management of Nomura’s risks. The formal governance structure for risk management within Nomura is as follows:

Board of Directors (
BoD
)
The BoD determines the policy for the execution of the business of Nomura and other matters prescribed in laws and regulations, supervises the execution of Directors’ and Executive Officers’ duties and has the authority to adopt, alter or abolish the regulations of the EMB.
Executive Management Board (
EMB
)
The EMB deliberates on and determines management strategy, the allocation of management resources and important management matters of Nomura, and seeks to increase shareholder value by promoting effective use of management resources and unified decision-making with regard to the execution of business. The EMB delegates responsibility for deliberation of matters concerning risk management to the Group Integrated Risk Management Committee (“GIRMC”). Key responsibilities of the EMB include the following:
| • | Resource Allocation—At the beginning of each financial year, the EMB determines the allocation of management resources and financial resources such as risk-weighted asset and unsecured funding to business units and establishes usage limits for these resources; |
| • | Business Plan—At the beginning of each financial year, the EMB approves the business plan and budget of Nomura. Introduction of significant new businesses, changes to business plans, the budget and the allocation of management resources during the year are also approved by the EMB; and |
| • | Reporting—The EMB reports the status of its deliberations to the BoD. |
Group Integrated Risk Management Committee (
GIRMC
)
Upon delegation from the EMB, the GIRMC deliberates on or determines important matters concerning integrated risk management of Nomura to assure the sound and effective management of its businesses. The GIRMC establishes a framework of integrated risk management consistent with Nomura’s risk appetite. The GIRMC supervises Nomura’s risk management by establishing and operating its risk management framework. The GIRMC reports the status of key risk management issues and any other matters deemed necessary by the committee chairman to the BoD and the EMB.
113
In addition, the GIRMC, upon delegation from the EMB, has established the Risk Management Policy, describing Nomura’s overall risk management framework including the fundamental risk management principles followed by Nomura.
Global Portfolio Committee (
GPC
)
Upon delegation from the GIRMC, the GPC deliberates on or determines all matters in relation to the management of a specific portfolio, for the purpose of achieving a risk profile consistent with the risk allocation and risk appetite of Nomura. The portfolio consists of businesses and products that fall within at least one of the three following categories: event financing, term financing and asset-based financing
.
Asset Liability Committee (
ALCO
)
Upon delegation from the EMB and the GIRMC, the ALCO deliberates on, based on Nomura’s risk appetite determined by the EMB, balance sheet management, financial resource allocation, liquidity management and related matters. The ALCO reports to the GIRMC the status of discussions at its meetings and any other matters as deemed necessary by the committee chairman.
Global Transaction Committee (
GTC
)
Upon delegation from the GPC, the GTC deliberates on or determines individual transactions in line with Nomura’s risk appetite determined by the EMB and thereby assures the sound and effective management of Nomura’s businesses.
Other Committees
The Global Risk Analytics Committee and the Model Risk Analytics Committee deliberate on or determine matters concerning the development, management and strategy of risk models and valuation models upon delegation from the CRO, respectively. The primary responsibility of these committees is to govern and provide oversight of model management, including the approval of new models and significant model changes. Both committees report all significant matters and material decisions taken to the CRO on a regular basis. The Collateral Steering Committee deliberates on or determines Nomura’s collateral risk management, including concentrations, liquidity, collateral
re-use,
limits and stress tests, provides direction on Nomura’s collateral strategy and ensures compliance with regulatory collateral requirements upon delegation from the CRO.
Chief Risk Officer (
CRO
)
The CRO is responsible for setting the overall strategy and direction of the Risk Management Division. The CRO is responsible for supervising the Risk Management Division and maintaining the effectiveness of the risk management framework independently from the business units within Nomura. The CRO regularly reports on the status of Nomura’s risk management to the GIRMC, and reports to and seeks the approval of the GIRMC on measures required for risk management.
Chief Financial Officer (
CFO
)
The CFO is responsible for overall financial strategy of Nomura, and has operational authority and responsibility over Nomura’s liquidity management based on decisions made by the EMB.
Chief Compliance Officer (“CCO”)
The CCO is responsible for supervising the Legal, Compliance and Controls Division (“LCC Division”) and maintaining the effectiveness of the
non-financial
risk management framework (operational risk and reputational risk).
114
Risk Management Division, Finance Division and LCC Division
The Risk Management Division, the Finance Division and the LCC Division comprise various departments or units established independently from Nomura’s business units. These three divisions are responsible for establishing and operating risk management processes, establishing and enforcing risk management policies and regulations, verifying the effectiveness of risk management methods, gathering reports from Nomura Group entities, reporting to Executive Officers/Senior Managing Directors and the GIRMC and others, as well as reporting to regulatory bodies and handling regulatory applications concerning risk management methods and other items as necessary. Important risk management issues are closely communicated between these three divisions and the CRO, CFO and CCO. The CRO, CFO and CCO regularly attend the EMB and GIRMC meetings to report specific risk issues.
Risk Policy Framework
Policies and procedures are essential tools of governance and define principles, rules and standards, and the specific processes that must be adhered to in order to effectively manage risk at Nomura. Risk management operations are run in accordance with these policies and procedures.
Monitoring, Reporting and Data Integrity
Development, consolidation, monitoring and reporting of risk management information (“risk MI”) are fundamental to the appropriate management of risk. The aim of all risk MI is to provide a basis for sound decision-making, action and escalation as required. The Risk Management Division, the Finance Division and the LCC Division are responsible for producing regular risk MI, which reflects the position of Nomura relative to stated risk appetite. Risk MI includes information from across the risk classes defined in the risk management framework and reflect the use of the various risk tools used to identify and assess those risks. These three divisions are responsible for implementing appropriate controls over data integrity for risk MI.
Management of Financial Resources
Nomura has established a framework for management of financial resources in order to adequately manage utilization of these resources. The EMB allocates financial resources to business units at the beginning of each financial year. These allocations are used to set revenue forecasts for each business units. Key components are set out below:
Risk-weighted assets
A key component used in the calculation of our consolidated capital adequacy ratios is risk-weighted assets. The EMB determines the risk appetite for our consolidated Tier 1 capital ratio on an annual basis and sets the limits for the usage of risk-weighted assets by each division and by additional lower levels of the division. In addition the EMB determines the risk appetite for the level of exposures under the leverage ratio framework which is a
non-risk
based measure to supplement risk-weighted assets. See Item 4.B. “Business Overview—Regulatory Capital Rules”, Item 5.B. “Consolidated Regulatory Capital Requirements” and “Consolidated Leverage Ratio Requirements” in this annual report for further information on our consolidated capital adequacy ratios and risk-weighted assets.
Economic Capital
Nomura’s internal measure of the capital required to support its business is the Nomura Capital Allocation Target (“NCAT”). NCAT is measured as the amount of capital required to absorb maximum potential losses over a
one-year
time horizon, computed by the risk model at the 99.95th percentile, or the equivalent Expected Shortfall. NCAT consists of Portfolio NCAT and
Non-Portfolio
NCAT. Portfolio NCAT consists of market risk,
115
credit risk, event risk, principal finance risk, private equity risk and investment securities risk.
Non-Portfolio
NCAT consists of business risk and operational risk. NCAT is aggregated by taking into account the correlation among its various components. Nomura’s NCAT limit is initially set by the EMB, and the EMB subsequently allocates it to each business division and additional lower levels of the organization. (Please note the management by NCAT was abolished on March 31, 2020 and the management with risk-weighted asset is solely in place since April 1, 2020.)
Available Funds
The CFO decides the maximum amount of available funds, provided without posting of any collateral, for allocation within Nomura and the EMB approves the allocation of the funds to each business division. Global Treasury monitors the usage by businesses and reports to the EMB.
Classification and Definition of Risk
Nomura classifies and defines risks as follows and has established departments or units to manage each risk type.
|
Risk Category
|
Definition
|
|
|
Market risk
|
Risk of loss arising from fluctuations in values of financial assets and liabilities (including
off-balance
sheet items) due to fluctuations in market risk factors (interest rates, foreign exchange rates, prices of securities and others).
|
|
|
Credit risk
|
Risk of loss arising from an obligor’s default, insolvency or administrative proceeding which results in the obligor’s failure to meet its contractual obligations in accordance with agreed terms. This includes both on and
off-balance
sheet exposures. It is also the risk of loss arising through a credit valuation adjustment (“CVA”) associated with deterioration in the creditworthiness of a counterparty.
|
|
|
Operational risk
|
Risk of financial loss or
non-financial
impact arising from inadequate or failed internal processes, people and systems, or from external events. Operational risk includes in its definition Compliance, Legal, IT and Cyber Security, Fraud, Third Party and other
non-financial
risks. Operational risk does not include strategic risk and reputational risk, however, some operational risks can lead to reputational issues and as such operational and reputational risks may be closely linked.
|
|
|
Model risk
|
Risk of financial loss, incorrect decision making, or damage to the firm’s credibility arising from model errors or incorrect or inappropriate model application.
|
|
|
Funding and Liquidity risk
|
Risk of loss arising from difficulty in securing the necessary funding or from a significantly higher cost of funding than normal levels due to deterioration of Nomura’s creditworthiness or deterioration in market conditions.
|
|
|
Business risk
|
Risk of failure of revenues to cover costs due to deterioration of the earnings environment or deterioration of the efficiency or effectiveness of business operations. Business risk is managed by the senior management at Nomura.
|
Market Risk Management
Market risk is the risk of loss arising from fluctuations in values of financial assets and liabilities (including
off-balance
sheet items) due to fluctuations in market risk factors (interest rates, foreign exchange rates, prices of securities and others).
116
Market Risk Management Process
Effective management of market risk requires the ability to analyze a complex and evolving portfolio in a constantly changing global market environment, identify problematic trends and ensure that appropriate action is taken in a timely manner.
Nomura uses a variety of statistical risk measurement tools to assess and monitor market risk on an ongoing basis, including, but not limited to, Value at Risk (“VaR”), Stressed VaR (“SVaR”) and Incremental Risk Charge (“IRC”). In addition, Nomura uses sensitivity analysis and stress testing to measure and analyze its market risk. Sensitivities are measures used to show the potential changes to a portfolio due to standard moves in market risk factors. They are specific to each asset class and cannot usually be aggregated across risk factors. Stress testing enables the analysis of portfolio risks or tail risks, including
non-linear
behaviors and can be aggregated across risk factors at any level of the group hierarchy, from group level to business division, units or desk levels. Market risk is monitored against a set of approved limits, with daily reports and other management information provided to the business units and senior management.
Value at Risk
VaR is a measure of the potential loss due to adverse movements of market factors, such as equity prices, interest rates, credit, foreign exchange rates, and commodities with associated volatilities and correlations.
VaR Methodology Assumptions
Nomura uses a single VaR model which has been implemented globally in order to determine the total trading VaR. A historical simulation is implemented, where historical market moves over a
two-year
window are applied to current exposure in order to construct a profit and loss distribution. Potential losses can be estimated at required confidence levels or probabilities. A scenario weighting scheme is employed to ensure that the VaR model responds to changing market volatility. Nomura uses the same VaR model for both internal risk management purposes and for regulatory reporting. For internal risk management purposes, VaR is calculated across Nomura at a 99% confidence level and using a
1-day
time horizon. For regulatory reporting purposes, Nomura uses the same confidence level but a
10-day
time horizon, calculated using actual
10-day
historical market moves. To complement VaR under Basel 2.5 regulations, Nomura also computes SVaR, which samples from a
one-year
window during a period of financial stress. The SVaR window is regularly calibrated and observations are equally weighted.
Nomura’s VaR model uses exact time series for each individual risk factor. However, if good quality data is not available, a ‘proxy logic’ maps the exposure to an appropriate time series. The level of proxying taking place is carefully monitored through internal risk management processes and there is a continual effort to source new time series to use in the VaR calculation.
VaR Backtesting
The performance of Nomura’s VaR model is constantly monitored to ensure that it remains fit for purpose. The main approach for validating VaR is to compare actual
1-day
trading losses with the corresponding VaR estimate. Nomura’s VaR model is backtested at different hierarchy levels. Backtesting results are reviewed on a monthly basis by Nomura’s Risk Management Division.
One-day
trading losses did not exceed the 99% VaR estimate at the Nomura Group level on any occasion for the twelve months ended March 31, 2020.
Limitations and Advantages of VaR
VaR aggregates risks from different asset classes in a transparent and intuitive way. However, there are limitations. VaR is a backward-looking measure: it implicitly assumes that distributions and correlations of
117
recent factor moves are adequate to represent moves in the near future. VaR is appropriate for liquid markets and is not appropriate for risk factors that exhibit sudden jumps. Therefore it may understate the impact of severe events. Given these limitations, Nomura uses VaR only as one component of a diverse market risk management process.
VaR metrics
The following graph shows the daily VaR over the last six quarters for substantially all of Nomura’s trading positions:
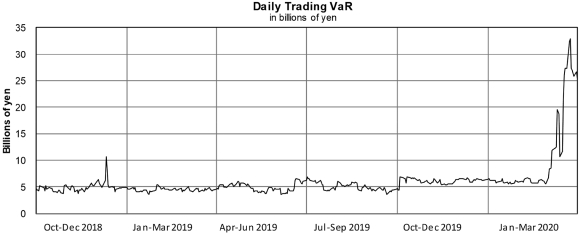
The following tables show the VaR as of each of the dates indicated for substantially all of Nomura’s trading positions:
|
|
Billions of yen
|
|||||||||||
|
|
As of
|
|||||||||||
|
|
March 31,
2018
|
|
March 31,
2019
|
|
March 31,
2020
|
|
||||||
|
Equity
|
¥ |
1.21
|
¥ |
1.07
|
¥ |
8.88
|
||||||
|
Interest rate
|
3.10
|
2.85
|
22.35
|
|||||||||
|
Foreign exchange
|
3.20
|
1.88
|
5.08
|
|||||||||
|
Subtotal
|
7.52
|
5.79
|
36.31
|
|||||||||
|
Less: Diversification Benefit
|
(1.13
|
) |
(1.30
|
) |
(11.00
|
) | ||||||
|
VaR
|
¥ |
6.38
|
¥ |
4.49
|
¥ |
25.31
|
||||||
|
|
Billions of yen
|
|||||||||||
|
|
For the twelve months ended
|
|||||||||||
|
|
March 31,
2018
|
|
March 31,
2019
|
|
March 31,
2020
|
|
||||||
|
Maximum daily VaR
(1)
|
¥ |
8.98
|
¥ |
10.61
|
¥ |
32.89
|
||||||
|
Average daily VaR
(1)
|
4.25
|
4.58
|
6.67
|
|||||||||
|
Minimum daily VaR
(1)
|
3.05
|
3.05
|
3.62
|
|||||||||
| (1) | Represents the maximum, average and minimum VaR based on all daily calculations for the twelve months ended March 31, 2018, March 31, 2019, and March 31, 2020. |
Total VaR increased to ¥253.12 billion as of March 31, 2020 from ¥4.49 billion as of March 31, 2019. VaR relating to foreign exchange risk increased to ¥50.83 billion as of March 31, 2020, compared to ¥1.88 billion as
118
of March 31, 2019. VaR relating to equity risk increased to ¥88.82 billion as of March 31, 2020, compared to ¥1.07 billion as of March 31, 2019. VaR relating to interest rate risk increased to ¥223.54 billion as of March 31, 2020, compared to ¥2.85 billion as of March 31, 2019.
Total VaR decreased to ¥4.49 billion as of March 31, 2019 from ¥6.38 billion as of March 31, 2018. VaR relating to foreign exchange risk decreased to ¥1.88 billion as of March 31, 2019, compared to ¥3.20 billion as of March 31, 2018. VaR relating to equity risk decreased to ¥1.07 billion as of March 31, 2019, compared to ¥1.21 billion as of March 31, 2018. VaR relating to interest rate risk decreased to ¥2.85 billion as of March 31, 2019, compared to ¥3.10 billion as of March 31, 2018.
Stress Testing
Nomura conducts market risk stress testing since VaR and sensitivity analysis have limited ability to capture all portfolio risks or tail risks. Stress testing for market risk is conducted regularly, using various scenarios based upon features of trading strategies. Nomura conducts stress testing not only at each desk level, but also at the Nomura Group level with a set of common global scenarios in order to capture the impact of market fluctuations on the entire Nomura Group.
Non-Trading
Risk
A major market risk in Nomura’s
non-trading
portfolio relates to equity investments held for operating purposes and on a long-term basis. Equity investments held for operating purposes are minority stakes in the equity securities of unaffiliated Japanese financial institutions and corporations held in order to promote existing and potential business relationships. This
non-trading
portfolio is exposed mainly to volatility in the Japanese stock market. One method that can estimate the market risk in this portfolio is to analyze market sensitivity based on changes in the TOPIX, which is a leading index of prices of stocks on the First Section of the Tokyo Stock Exchange.
Nomura uses regression analysis covering the previous 90 days which tracks and compares fluctuations in the TOPIX and the fair value of Nomura’s equity investments held for operating purposes, which allows to determine a correlation factor. Based on this analysis for each 10% change in the TOPIX, the fair value of Nomura’s operating equity investments held for operating purposes can be expected to change by 10,043 million at the end of March 2019 and 7,658 million at the end of March 2020. The TOPIX closed at 1,591.64 points at the end of March 2019 and at 1,403.04 points at the end of March 2020. This simulation analyzes data for the entire portfolio of equity investments held for operating purposes at Nomura and therefore actual results may differ from Nomura’s expectations because of price fluctuations of individual equities.
Credit Risk Management
Credit risk is the risk of loss arising from an obligor’s default, insolvency or administrative proceeding which results in the obligor’s failure to meet its contractual obligations in accordance with agreed terms. This includes both on and
off-balance
sheet exposures. It is also the risk of loss arising through a CVA associated with deterioration in the creditworthiness of a counterparty.
Nomura manages credit risk on a global basis and on an individual Nomura legal entity basis.
Credit Risk Management Framework
The measurement, monitoring and management of credit risk at Nomura are governed by a set of global policies and procedures. Credit Risk Management (“CRM”), a global function within the Risk Management Division, is responsible for the implementation and maintenance of these policies and procedures. These policies are authorized by the GIRMC and/or Global Risk Strategic Committee (“GRSC”), prescribe the basic principles of credit risk management and set delegated authority limits, which enables CRM personnel to set credit limits.
119
Credit risk is managed by CRM together with various global and regional risk committees. This ensures transparency of material credit risks and compliance with established credit limits, the approval of material extensions of credit and the escalation of risk concentrations to appropriate senior management.
Credit Risk Management Process
CRM operates as a credit risk control function within the Risk Management Division, reporting to the CRO. The process for managing credit risk at Nomura includes:
| • | Evaluation of likelihood that a counterparty defaults on its payments and obligations; |
| • | Assignment of internal ratings to all active counterparties; |
| • | Approval of extensions of credit and establishment of credit limits; |
| • | Measurement, monitoring and management of Nomura’s current and potential future credit exposures; |
| • | Setting credit terms in legal documentation; and |
| • | Use of appropriate credit risk mitigants including netting, collateral and hedging. |
The scope of credit risk management includes counterparty trading and various debt or equity instruments including loans, private equity investments, fund investments, investment securities and any other as deemed necessary from a credit risk management perspective.
The evaluation of counterparties’ creditworthiness involves a thorough due diligence and analysis of the business environments in which they operate, their competitive positions, management and financial strength and flexibility. Credit analysts also take into account the corporate structure and any explicit or implicit credit support. CRM evaluates credit risk not only by counterparty, but also by counterparty group.
Following the credit analysis, CRM estimates the probability of default of a given counterparty or obligor through an alphanumeric ratings scale similar to that used by rating agencies and a corresponding numeric scale. Credit analysts are responsible for assigning and maintaining the internal ratings, ensuring that each rating is reviewed and approved at least annually.
Nomura’s internal rating system employs a range of ratings models to ensure global consistency and accuracy. These models are developed and maintained by the Risk Methodology Group. Internal ratings represent a critical component of Nomura’s approach to managing counterparty credit risk. They are used as key factors in:
| • | Establishing the amount of counterparty credit risk that Nomura is willing to take to an individual counterparty or counterparty group (setting of credit limits); |
| • | Determining the level of delegated authority for setting credit limits (including tenor); |
| • | The frequency of credit reviews (renewal of credit limits); |
| • | Reporting counterparty credit risk to senior management within Nomura; and |
| • | Reporting counterparty credit risk to stakeholders outside of Nomura. |
The Credit Risk Control Unit is a function within the Model Validation Group (“MVG”) which is independent of CRM. It ensures that Nomura’s internal rating system is properly reviewed and validated, reporting any breaks or issues to senior management for timely resolution. The unit is responsible for ensuring that the system remains accurate and predictive of risk and provides periodic reporting on the system to senior management.
120
For regulatory capital calculation purposes, Nomura has been applying the Foundation Internal Rating Based Approach in calculating credit risk-weighted assets since the end of March 2011. The Standardized Approach is applied to certain business units or asset types, which are considered immaterial to the calculation of credit risk-weighted assets.
Credit Limits and Risk Measures
Internal ratings form an integral part in the assignment of credit limits to counterparties. Nomura’s credit limit framework is designed to ensure that Nomura takes appropriate credit risk in a manner that is consistent with its overall risk appetite. Global Credit policies define the delegated authority matrices that establish the maximum aggregated limit amounts and tenors that may be set for any single counterparty group based on their internal rating.
Nomura’s main type of counterparty credit risk exposures arise from derivatives transactions or securities financing transactions. Credit exposures against counterparties are managed by means of setting credit limits based upon credit analysis of individual counterparty. Credit risk is managed daily through the monitoring of credit exposure against approved credit limits and the ongoing monitoring of the creditworthiness of Nomura’s counterparties. Any change in circumstance that alters Nomura’s risk appetite for any particular counterparty, sector, industry or country is reflected in changes to the internal rating and credit limit as appropriate.
Nomura’s global credit risk management systems record all credit limits and capture credit exposures to Nomura’s counterparties allowing CRM to measure, monitor and manage utilization of credit limits, ensure appropriate reporting and escalation of any limit breaches.
For derivatives and securities financing transactions, Nomura measures credit risk primarily by way of a Monte Carlo-based simulation model that determines a Potential Exposure profile at a specified confidence level. The exposure calculation model used for counterparty credit risk management has also been used for the Internal Model Method based exposure calculation for regulatory capital reporting purposes since the end of December 2012.
Loans and lending commitments are measured and monitored on both a funded and unfunded basis.
Wrong Way Risk
Wrong Way Risk (“WWR”) occurs when exposure to a counterparty is highly correlated with the deterioration of creditworthiness of that counterparty. Nomura has established global policies that govern the management of any WWR exposures. Stress testing is used to support the assessment of any WWR embedded within existing portfolios and adjustments are made to credit exposures and regulatory capital, as appropriate.
Stress Testing
Stress Testing is an integral part of Nomura’s management of credit risk. Regular stress tests are used to support the assessment of credit risks by counterparties, sectors and regions. The stress tests include potential concentrations that are highlighted as a result of applying shocks to risk factors, probabilities of default or rating migrations.
Risk Mitigation
Nomura utilizes financial instruments, agreements and practices to assist in the management of credit risk. Nomura enters into legal agreements, such as the International Swap and Derivatives Association, Inc. (“ISDA”) agreements or equivalent (referred to as “Master Netting Agreements”), with many of its counterparties. Master Netting Agreements allow netting of receivables and payables and reduce losses potentially incurred as a result
121
of a counterparty default. Further reduction in credit risk is achieved through entering into collateral agreements that allow Nomura to obtain collateral from counterparties either upfront or contingent on exposure levels, changes in credit rating or other factors.
Credit Risk to Counterparties in Derivatives Transaction
The credit exposures arising from Nomura’s trading-related derivatives as of March 31, 2020 are summarized in the table below, showing the positive fair value of derivative assets by counterparty credit rating and by remaining contractual maturity. The credit ratings are internally determined by Nomura’s CRM.
|
|
Billions of yen
|
|||||||||||||||||||||||||||||||||||
|
|
Years to Maturity
|
Cross-
Maturity
Netting
(1)
|
|
Total
Fair Value
|
|
Collateral
obtained
|
|
Replacement
cost
(3)
|
|
|||||||||||||||||||||||||||
|
Credit Rating
|
Less than
1 year
|
|
1 to 3
years
|
|
3 to 5
years
|
|
5 to 7
years
|
|
More than
7 years
|
|
||||||||||||||||||||||||||
|
|
|
|
|
|
|
|
|
|
|
|
|
|
(a)
|
|
(b)
|
|
(a)-(b)
|
|
||||||||||||||||||
|
AAA
|
¥ |
41
|
¥ |
33
|
¥ |
12
|
¥ |
4
|
¥ |
65
|
¥ |
(134)
|
¥ |
21
|
¥ |
20
|
¥ |
1
|
||||||||||||||||||
|
AA
|
704
|
318
|
144
|
108
|
686
|
(1,528
|
) |
432
|
48
|
384
|
||||||||||||||||||||||||||
|
A
|
785
|
511
|
416
|
185
|
1,280
|
(2,873
|
) |
304
|
126
|
178
|
||||||||||||||||||||||||||
|
BBB
|
282
|
224
|
185
|
134
|
761
|
(1,206
|
) |
380
|
79
|
301
|
||||||||||||||||||||||||||
|
BB and lower
|
136
|
147
|
52
|
34
|
108
|
(216
|
) |
261
|
243
|
18
|
||||||||||||||||||||||||||
|
Other
(2)
|
78
|
86
|
135
|
152
|
953
|
(1,419
|
) |
(15
|
) |
60
|
0
|
|||||||||||||||||||||||||
|
Sub-total
|
¥ |
2,026
|
¥ |
1,319
|
¥ |
944
|
¥ |
617
|
¥ |
3,853
|
¥ |
(7,376
|
) | ¥ |
1,383
|
¥ |
576
|
¥ |
882
|
|||||||||||||||||
|
Listed
|
1,027
|
88
|
6
|
—
|
—
|
(562
|
) |
559
|
194
|
365
|
||||||||||||||||||||||||||
|
Total
|
¥ |
3,053
|
¥ |
1,407
|
¥ |
950
|
¥ |
617
|
¥ |
3,853
|
¥ |
(7,938
|
) | ¥ |
1,942
|
¥ |
770
|
¥ |
1,247
|
|||||||||||||||||
| (1) |
Represents netting of derivative liabilities against derivatives assets entered into with the same counterparty across different maturity bands. Derivative assets and derivative liabilities with the same counterparty in the same maturity band are net within the relevant maturity band. Cash collateral netting against net derivative assets in accordance with ASC
210-20
“
Balance Sheet—Offsetting
Derivatives and Hedging
|
| (2) | “Other” comprises unrated counterparties and certain portfolio level valuation adjustments not allocated to specific counterparties. |
| (3) | Zero balances represent instances where total collateral received is in excess of the total fair value; therefore, Nomura’s credit exposure is zero. |
Country Risk
At Nomura, country risk is defined as the risk of loss arising from country-specific events (such as political, economic, legal and other events) that affect counterparties and/or issuers within that country, causing those counterparties and/or issuers to be unable to meet financial obligations. Nomura’s country risk framework acts as a complement to other risk management areas and encompasses a number of tools including, but not limited to, country limits, which restrict credit exposure concentration to any given country. Other tools to manage country risk include country ratings as well as country risk policies and procedures that describe responsibilities and delegation for decision-making.
122
Nomura’s credit portfolio remains well-diversified by country and concentrated towards highly-rated countries. Over 95% of the exposure was from investment-grade rated countries. The breakdown of top 10 country exposures is as follows:
|
|
Billions of Yen
|
|
||
|
Top 10 Country Exposures
(1)
|
(As of March 31, 2020)
|
|
||
|
United States
|
4,880
|
|||
|
Japan
|
2,713
|
|||
|
United Kingdom
|
710
|
|||
|
India
|
210
|
|||
|
Singapore
|
207
|
|||
|
France
|
144
|
|||
|
South Korea
|
130
|
|||
|
China
|
116
|
|||
|
Hong Kong S.A.R.
|
113
|
|||
|
Saudi Arabia
|
106
|
|||
| (1) | The table represents the Top 10 country exposures as of March 31, 2020 based on country of risk, combining counterparty and inventory exposures |
| - |
Counterparty exposures include cash and cash equivalents held at banks; the outstanding default fund and initial margin balances posted by Nomura to central clearing counterparties as legally required under its direct and affiliate clearing memberships; the aggregate
marked-to-market
exposure by counterparty of derivative transactions and securities financing transactions (net of collateral where the collateral is held under a legally enforceable margin agreement); and the fair value of total commitment amount less any applicable reserves
|
| - | Inventory exposures are the market value of debt and equity securities, and equity and credit derivatives, using the net of long versus short positions. |
Operational Risk Management
Operational risk is the risk of financial loss or
non-financial
impact arising from inadequate or failed internal processes, people and systems, or from external events. Operational risk includes in its definition Compliance, Legal, IT and Cyber Security, Fraud, Third Party and other
non-financial
risks. Operational risk does not include strategic risk and reputational risk, however, some operational risks can lead to reputational issues and as such operational and reputational risks may be closely linked.
The Three Lines of Defense
Nomura adopts the industry standard “Three Lines of Defense” for the management of operational risk, comprising the following elements:
| 1) | 1st Line of Defense: The business which owns and manages its risks |
| 2) |
2nd Line of Defense: The Operational Risk Management (“ORM”) function, which
co-ordinates
the Operational Risk Management Framework and its implementation
|
| 3) | 3rd Line of Defense: Internal Audit, who provide independent assurance |
123
Operational Risk Management Framework
An Operational Risk Management Framework has been established in order to allow Nomura to identify, assess, manage, monitor and report on operational risk. The GIRMC, with delegated authority from the EMB has formal oversight over the management of operational risk.
This framework is set out below:
Infrastructure of the framework
| • | Policy framework: Sets standards for managing operational risk and details how to monitor adherence to these standards. |
| • | Training and awareness: Action taken by ORM to improve business understanding of operational risk. |
Products and Services
| • | Event Reporting: This process is used to identify and report any event which resulted in or had the potential to result in a loss or gain or other impact associated with inadequate or failed internal processes, people and systems, or from external events. |
| • | Risk and Control Self-Assessment (“RCSA”): This process is used to identify the inherent risks the business faces, the key controls associated with those risks and relevant actions to mitigate the residual risks. Global ORM are responsible for developing the RCSA process and supporting the business in its implementation. |
| • | Key Risk Indicators (“KRI”): KRIs are metrics used to monitor the business’ exposure to operational risk and trigger appropriate responses as thresholds are breached. |
| • | Scenario Analysis: The process used to assess and quantify potential high impact, low likelihood operational risk events. During the process actions may be identified to enhance the control environment which are then tracked via the Operational Risk Management Framework. |
Outputs
| • | Analysis and reporting: A key aspect of ORM’s role is to analyze, report, and challenge operational risk information provided by business units, and work with business units to develop action plans to mitigate risks. |
| • | Operational risk capital calculation: Calculate operational risk capital as required under applicable Basel standards and local regulatory requirements. |
Regulatory Capital Calculation for Operational Risk
Nomura uses the Standardized Approach for calculating regulatory capital for operational risk. This involves using a three-year average of gross income allocated to business lines, which is multiplied by a fixed percentage (“Beta Factor”) determined by the FSA, to establish the amount of required operational risk capital.
124
Nomura uses consolidated net revenue as gross income, however for certain consolidated subsidiaries, gross operating profit is used as gross income. Gross income allocation is performed by mapping the net revenue of each business segment as defined in Nomura’s management accounting data to each business line defined in the Standardized Approach as follows:
|
Business Line
|
Description
|
Beta Factor
|
|
|||
|
Retail Banking
|
Retail deposit and loan-related services
|
12%
|
||||
|
Commercial Banking
|
Deposit and loan-related services except for Retail Banking business
|
15%
|
||||
|
Payment and Settlement
|
Payment and settlement services for clients’ transactions
|
18%
|
||||
|
Retail Brokerage
|
Securities-related services mainly for individuals
|
12%
|
||||
|
Trading and Sales
|
Market-related business
|
18%
|
||||
|
Corporate Finance
|
M&A, underwriting, secondary and private offerings, and other funding services for clients
|
18%
|
||||
|
Agency Services
|
Agency services for clients such as custody
|
15%
|
||||
|
Asset Management
|
Fund management services for clients
|
12%
|
||||
Nomura calculates the required amount of operational risk capital for each business line by multiplying the allocated annual gross income amount by the appropriate Beta Factor defined above. The operational risk capital for any gross income amount not allocated to a specific business line is determined by multiplying such unallocated gross income amount by a fixed percentage of 18%.
The total operational risk capital for Nomura is calculated by aggregating the total amount of operational risk capital required for each business line and unallocated amount and by determining a three-year average. Where the aggregated amount for a given year is negative, then the total operational risk capital amount for that year will be calculated as zero.
In any given year, negative amounts in any business line are offset against positive amounts in other business lines. However, negative unallocated amounts are not offset against positive amounts in other business lines and are calculated as zero.
Operational risk capital is calculated at the end of September and March each year.
Model Risk Management
Model Risk is the risk of financial loss, incorrect decision making, or damage to the firm’s credibility arising from Model errors or incorrect or inappropriate Model application.
To effectively manage the Firm’s Model Risk, Nomura has established a Model Risk Management Framework to govern the development, ownership, validation, approval, usage, ongoing monitoring, and periodic review of the Firm’s Models. The framework is supported by a set of policies and procedures that articulate process requirements for the various elements of the model lifecycle, including monitoring of model risk with respect to the Firm’s appetite.
New models and material changes to approved models must be independently validated prior to official use. Thresholds to assess the materiality of model changes are defined in Model Risk Management’s procedures. During independent validation, validation teams analyze a number of factors to assess a model’s suitability, identify model limitations, and quantify the associated model risk, which is ultimately mitigated through the imposition of approval conditions, such as usage conditions, model reserves and capital adjustments. Approved models are subject to Model Risk Management’s annual
re-approval
process and ongoing performance monitoring to assess their continued suitability. Appropriately delegated Model Risk Management Committees provide oversight, challenge, governance, and ultimate approval of validated Models.
125
Funding and Liquidity Risk Management
For further information on funding and liquidity risk management, see Item 5.B. “
” in this annual report.
Liquidity and Capital Resources—Funding and Liquidity Management
Risk Measures and Controls
Limit Frameworks
The establishment of robust limit monitoring and management is central to appropriate monitoring and management of risk. The limit management frameworks incorporate clear escalation policies to ensure approval of limits at appropriate levels of seniority. The Risk Management Division, the Finance Division and the LCC Division are responsible for
day-to-day
operation of these limit frameworks including approval, monitoring, and reporting as required. Business units are responsible for complying with the agreed limits. Limits apply across a range of quantitative measures of risk and across market and credit risks.
New Business Risk Management
The new business approval process represents the starting point for new business in Nomura and exists to support management decision-making and ensure that risks associated with new products and transactions are identified and managed appropriately. The new business approval process consists of two components:
| 1) | Transaction committees are in place to provide formal governance over the review and decision-making process for individual transactions. |
| 2) | The new product approval process allows business unit sponsors to submit applications for new products and obtain approval from relevant departments prior to execution of the new products. The process is designed to capture and assess risks across various risk classes as a result of the new product or business. |
The new business approval process continues to seek assuring the sound and effective management to better meet the various changes observed in the market environment.
Stress Testing
Stress testing performed at the Nomura Group provides comprehensive coverage of risks across different hierarchical levels, and covers different time horizons, severities, plausibilities and stress testing methodologies. The results of stress tests are used in capital planning processes, capital adequacy assessments, liquidity adequacy assessments, recovery and resolution planning, assessments of whether risk appetite is appropriate, and in routine risk management.
Stress tests are run on a regular basis or on an ad hoc basis as needed, for example, in response to material changes in the external environment and/or in the Nomura Group risk profile. The results of stress tests with supporting detailed analysis are reported to senior management and other stakeholders as appropriate for the stress test being performed.
Stress testing is categorized either as sensitivity analysis or scenario analysis and may be performed on a Nomura Group-wide basis or at more granular levels.
| • | Sensitivity analysis is used to quantify the impact of a market move in one or two associated risk factors (for example, equity prices, equity volatilities) in order primarily to capture those risks which may not be readily identified by other risk models; |
| • | Scenario analysis is used to quantify the impact of a specified event across multiple asset classes and risk classes. This is a primary approach used in performing stress testing at the different hierarchical levels of the Nomura Group; |
126
Scenario analysis includes following examples.
| • | Nomura Group establishes several stress scenarios to validate risk appetite for capital and liquidity soundness, taking into account the business environment, business’s risk profile, economic environment and forecasts. |
| • | Group-wide stress to assess the capital adequacy of the Nomura Group under severe but plausible market scenarios is conducted on a quarterly basis at a minimum; and |
| • | Reverse stress testing, a process of considering the vulnerabilities of the firm and hence how it may react to situations where it becomes difficult to continue its business and reviewing the results of that analysis, is conducted on an annual basis at a minimum. |
Stress testing is an integral part of the Nomura Group’s overall governance and is used as a tool for forward-looking risk management, decision-making and enhancing communication amongst Corporate Functions, Business Divisions, and senior management.
Item 12. Description of Securities Other Than Equity Securities
A. Debt Securities
Not applicable.
B. Warrants and Rights
Not applicable.
C. Other Securities
Not applicable.
127
D. American Depositary Shares
Fees payable by ADR Holders
The following table shows the fees and charges that a holder of the Company’s ADR may have to pay, either directly or indirectly:
|
Type of Services:
|
Amount of Fee (U.S. Dollars)
|
|
|
Taxes and other governmental charges
|
As applicable. The depositary may offset any taxes or governmental charges it is obligated to withhold, if applicable, against the proceeds from sale of the property received.
|
|
|
Transfers of the Company’s shares to or from the name of the depositary (or its nominee) or the Custodian (or its nominee) in connection with deposits or withdrawals
|
Such registration fees as may be in effect for the registration of transfers of the Company’s shares on the Company’s share register (or any entity that presently carries out the duties of registrar).
|
|
|
Cable, telex and facsimile transmission expenses
|
As applicable.
|
|
|
Expenses incurred by the depositary in the conversion of foreign currency
|
As applicable.
|
|
|
Execution and delivery of Receipts in connection with deposits, stock splits or exercise of subscription rights
|
$5.00 or less per 100 ADSs (or portion thereof).
|
|
|
Surrender of Receipts in connection with a withdrawal or termination of the Deposit Agreement
|
$5.00 or less per 100 ADSs (or portion thereof).
|
|
|
Any cash distribution pursuant to the Deposit Agreement, including, but not limited to, cash distribution(s) made in connection with cash dividends; distributions in securities, property or subscription rights; and stock splits.
|
$.02 or less per ADS (or portion thereof). Only the cash amounts net of this fee, if applicable, are distributed.
|
|
|
Distribution by the depositary of securities (other than common shares of the Company) that accrued on the underlying shares to owners of the Receipts
|
Treating for the purpose of this fee all such securities as if they were common shares of the Company, $5.00 or less per 100 ADSs (or portion thereof).
|
|
|
General depositary services
|
$.02 or less per ADS (or portion thereof), accruing on the last day of each calendar year, except where the fee for cash distribution described above was assessed during that calendar year.
|
|
|
Any other charge payable by the depositary, any of the depositary’s agents, including the Custodian, or the agents of the depositary’s agents in connection with the servicing of the Company’s shares or other deposited securities
|
As applicable.
|
Fees paid to Nomura by the depositary
The Bank of New York Mellon, as depositary, has agreed to pay all its standard
out-of-pocket
administration and maintenance expenses for providing services to the registered shareholders and up to 100,000
non-registered
shareholders of ADRs. From April 1, 2019 to March 31, 2020, the Bank of New York Mellon has waived a total of $159,315.68 in fees (including $28,435.84 in connection with the expenses related to the Annual General Meeting of Shareholders) associated with the administration of the ADR program and administrative fees for routine corporate actions and for providing investor relations information services.
128
PART II
Item 13. Defaults, Dividend Arrearages and Delinquencies
None.
Item 14. Material Modifications to the Rights of Security Holders and Use of Proceeds
None.
Item 15. Controls and Procedures
Disclosure Controls and Procedures.
Our Disclosure Committee is responsible for the establishment and maintenance of our disclosure controls and procedures. As of March 31, 2020, an evaluation was carried out under the supervision and with the participation of our management, including our Group Chief Executive Officer and Chief Financial Officer, and the Disclosure Committee, of the effectiveness of the disclosure controls and procedures (as defined in Rules
13a-15(e)
and
15d-15(e)
under the Securities Exchange Act of 1934). Based on that evaluation, our Group Chief Executive Officer and Chief Financial Officer concluded that, as of March 31, 2020, our disclosure controls and procedures were effective.
Management’s Annual Report on Internal Control Over Financial Reporting.
Our management is responsible for establishing and maintaining adequate internal control over financial reporting (as defined in Rules
13a-15(f)
and
15d-15(f)
under the Securities Exchange Act of 1934). Our management, with the participation of our Group Chief Executive Officer and Chief Financial Officer, evaluated the effectiveness of our internal control over financial reporting using the criteria set forth in the Internal Control—Integrated Framework (2013) issued by the Committee of Sponsoring Organizations of the Treadway Commission (COSO). Based on this evaluation, management concluded that our internal control over financial reporting was effective as of March 31, 2020. Our independent registered public accounting firm, Ernst & Young ShinNihon LLC, has issued an attestation report on the effectiveness of our internal control over financial reporting, which appears on page
F-6
of this annual report.
Changes in Internal Control Over Financial Reporting.
Our management also carried out an evaluation, with the participation of our Group Chief Executive Officer and Chief Financial Officer, of changes in our internal control over financial reporting during the year ended March 31, 2020. Based upon that evaluation, there was no change in our internal control over financial reporting during the year ended March 31, 2020 that has materially affected, or is reasonably likely to affect, our internal control over financial reporting.
We have implemented remote work arrangements over a significant portion of our workforce in response to the
COVID-19
pandemic and announced a delay in the announcement of our results for the fiscal year ended March 31, 2020 due to a delay in the necessary procedures caused by the pandemic. Nevertheless, we completed such procedures and announced our results well within the timeframes applicable to us by law and/or stock exchange rule, and we do not believe that the shift to remote work has had or is likely to have a material affect on our internal control over financial reporting, although we are continually monitoring and assessing the impact of the pandemic on our internal control over financial reporting.
Item 16A. Audit Committee Financial Expert
The Company’s Board of Directors has determined that Mr. Noriaki Shimazaki, a member of the Audit Committee, qualifies as an “audit committee financial expert” as such term is defined by the General Instructions
129
for Item 16A of Form
in this annual report.
20-F.
Additionally, Mr. Noriaki Shimazaki meets the independence requirements applicable to him under Section 303A.06 of the NYSE Listed Company Manual. For a description of his business experience, see Item 6.A
“Directors and Senior Management—Directors”
Item 16B. Code of Ethics
We adopted on December 2019 a new code of ethics (as defined in Item 16B of Form
Code of Ethics for Financial Professionals” to replace the prior code of ethics. The new code of ethics presents ethics rules and requirements with more visual aids than the previous code of ethics without substantively altering the rules and requirements. A copy of the code of ethics is attached as Exhibit 11.1 and Exhibit 11.2 to this annual report.
20-F)
consisting of the “Nomura Group Code of Conduct 2020” and the “Nomura Group
Item 16C. Principal Accountant Fees and Services
Ernst & Young ShinNihon LLC has been our principal accountant for the last eighteen fiscal years. The table set forth below contains the aggregate fees billed for each of the last two fiscal years by our principal accountant in each of the following categories: (i) Audit Fees, which are fees for professional services for the audit or review of our financial statements or services that are normally provided in connection with statutory and regulatory filings or engagements for those fiscal years, (ii) Audit-Related Fees, which are fees for assurance and related services that are related to the performance of the audit or review of our financial statements and are not reported as Audit Fees, (iii) Tax Fees, which are fees for professional services provided for tax compliance, tax advice and tax planning, and (iv) All Other Fees, which are fees for products and services other than Audit Fees, Audit-Related Fees and Tax Fees, such as advisory services concerning risk management and regulatory matters.
|
|
Millions of yen
|
|||||||
|
|
Year ended March 31
|
|||||||
|
|
2019
|
|
2020
|
|
||||
|
Audit Fees
|
¥ |
3,414
|
¥ |
3,409
|
||||
|
Audit-Related Fees
|
179
|
136
|
||||||
|
Tax Fees
|
293
|
113
|
||||||
|
All Other Fees
|
39
|
7
|
||||||
|
Total
|
¥ |
3,925
|
¥ |
3,665
|
||||
Audit-Related Fees included fees for consultations on accounting issues relating to our business. Tax Fees included fees for services relating to tax planning and compliance. All Other Fees included fees for services relating to advice with respect to regulations and disclosures under the Financial Instruments and Exchange Act in connection with our underwriting business.
In accordance with the regulations of the Securities and Exchange Commission issued pursuant to Sections 202 and 208 of the Sarbanes-Oxley Act of 2002, our Audit Committee has adopted a
pre-approval
policy regarding the engagements of our principal accountant. Under the
pre-approval
policy, there are two types of
pre-approval
procedures, “General
Pre-Approval”
and “Specific
Pre-Approval.”
Under “General
Pre-Approval,”
our CFO in conjunction with our principal accountant must make a proposal to our Audit Committee for the types of services and estimated fee levels of each category of services to be generally
pre-approved.
Such a proposal must be made at least annually. The Audit Committee will discuss the proposal and if necessary, consult with outside professionals as to whether the proposed services would impair the independence of our principal accountant. If such proposal is accepted, the Audit Committee will inform our CFO and principal accountant of the services that have been
pre-approved
and are included in a “General
Pre-Approved
List.” Our Audit Committee is informed of each such service that is provided.
130
Under “Specific
Pre-Approval,”
if any proposed services are not on the General
Pre-Approved
List, our CFO is required to submit an application to the Audit Committee for such services. After reviewing the details and estimated fee levels for each engagement and if necessary, consulting with outside professionals as to whether the proposed services would impair the independence of the principal accountant, the Audit Committee may make a specific
pre-approval
decision on these services. Also, if any approved services in the General
Pre-Approved
List exceed the fee levels prescribed on the List, our CFO is required to submit an application to the Audit Committee for new fee levels for such services. The Audit Committee may make a
pre-approval
decision after reviewing the details of the services and the estimated fee levels for each engagement.
None of the services described in the first paragraph under this Item 16C were waived from the
pre-approval
requirement pursuant to Rule
2-01(c)(7)(i)(C)
of Regulation
S-X.
Item 16D. Exemptions from the Listing Standards for Audit Committees
Not applicable.
Item 16E. Purchases of Equity Securities by the Issuer and Affiliated Purchasers
During the year ended March 31, 2020, we acquired 19,481 shares of the Company’s common stock by means of repurchase of shares constituting less than one unit upon the request of the holders of those shares and 300,000,000 shares under a share buyback program in accordance with Article
” which is an exhibit to this annual report. As of March 31, 2020, we had 3,038,937,493 outstanding shares of our common stock excluding 454,625,108 shares held as treasury stock.
459-1
of the Companies Act. For an explanation of the right of our shareholders to demand such repurchases by us, see “
Description of rights of each class of securities registered under Section 12 of the Securities Exchange Act of 1934
The following table sets forth certain information with respect to our purchases of shares of our common stock during the year ended March 31, 2020.
|
Month
|
Total
Number of
Shares
Purchased
|
|
Average Price
Paid per
Share
(in yen)
|
|
Total
Number of
Shares
Purchased
as Part of
Publicly
Announced
Program
|
|
Maximum
Number of
Shares that
May Yet Be
Purchased
Under the
Program
|
|
||||||||
|
April 1 to 30, 2019
|
937
|
¥ |
416
|
—
|
—
|
|||||||||||
|
May 1 to 31, 2019
|
1,049
|
387
|
—
|
—
|
||||||||||||
|
June 1 to 30, 2019
|
1,203
|
354
|
—
|
300,000,000
|
||||||||||||
|
July 1 to 31, 2019
|
1,724
|
378
|
—
|
300,000,000
|
||||||||||||
|
August 1 to 31, 2019
|
45,819,214
|
404
|
45,817,600
|
254,182,400
|
||||||||||||
|
September 1 to 30, 2019
|
50,074,124
|
456
|
50,072,700
|
204,109,700
|
||||||||||||
|
October 1 to 31, 2019
|
63,977,892
|
481
|
63,976,200
|
140,133,500
|
||||||||||||
|
November 1 to 30, 2019
|
34,922,851
|
544
|
34,921,100
|
105,212,400
|
||||||||||||
|
December 1 to 31, 2019
|
47,518,385
|
561
|
47,515,800
|
57,696,600
|
||||||||||||
|
January 1 to 31, 2020
|
45,000,953
|
567
|
44,998,000
|
12,698,600
|
||||||||||||
|
February 1 to 29, 2020
|
12,062,257
|
562
|
12,060,900
|
637,700
|
||||||||||||
|
March 1 to 31, 2020
|
1,192
|
442
|
—
|
—
|
||||||||||||
|
Total
|
299,381,781
|
¥ |
501
|
299,362,300
|
—
|
|||||||||||
On June 18, 2019, a resolution of the Board of Directors authorized the Company to purchase up to 300,000,000 shares of our common stock or to a maximum of ¥150 billion during the period from June 19, 2019 through March 31, 2020.
131
Nomura recognizes the need to set out flexible financial strategies that allow the Board of Directors to respond quickly to any changes in the business environment and is looking into implementing further share buybacks. Details will be announced when finalized.
As of May 31, 2020, 3,055,764,370 shares of common stock were outstanding, excluding 437,798,231 shares held as treasury stock.
Item 16F. Change in Registrant’s Certifying Accountant
Not applicable.
Item 16G. Corporate Governance
Companies listed on the NYSE must comply with certain standards regarding corporate governance under Section 303A of the NYSE Listed Company Manual. However, listed companies that are foreign private issuers, such as the Company, are permitted to follow home country practice in lieu of certain provisions of Section 303A.
The following table shows the significant differences between the corporate governance practices followed by U.S. listed companies under Section 303A of the NYSE Listed Company Manual and those followed by the Company. The information set forth below is current as of the date of this annual report.
|
Corporate Governance Practices Followed
by NYSE-listed U.S. Companies
|
Corporate Governance Practices Followed by the Company
|
|
|
A NYSE-listed U.S. company must have a majority of Directors meeting the independence requirements under Section 303A of the NYSE Listed Company Manual.
|
Under the Companies Act, a company which adopts the Company with Three Board Committees structure is not required to have a majority of outside directors, but is required to have a majority of outside directors on each of the audit, nomination and compensation committees.
The Company currently has six outside directors among its ten Directors.
|
|
|
A NYSE-listed U.S. company must have an audit committee that satisfies the requirements under Section 303A of the NYSE Listed Company Manual, including those imposed by Rule
10A-3
under the U.S. Securities Exchange Act of 1934. The audit committee must be composed entirely of independent directors and have at least three members.
|
The Company has an Audit Committee consisting of three Directors, two of whom are outside directors in compliance with the requirements under the Companies Act. All three Audit Committee members are independent directors under Rule
10A-3
under the U.S. Securities Exchange Act of 1934 with one member qualified as audit committee financial expert.
|
|
|
A NYSE-listed U.S. company must have a nominating/corporate governance committee with responsibilities described under Section 303A of the NYSE Listed Company Manual. The nominating/corporate governance committee must be composed entirely of independent directors.
|
The Company has a Nomination Committee consisting of three Directors, two of whom are outside directors and the chairman is an outside director in compliance with the requirements under the Companies Act.
|
|
|
A NYSE-listed U.S. company must have a compensation committee composed entirely of independent directors. Compensation committee members must satisfy the additional independence
|
The Company has a Compensation Committee consisting of three Directors, two of whom are outside directors and the chairman is an outside
|
132
|
Corporate Governance Practices Followed
by NYSE-listed U.S. Companies
|
Corporate Governance Practices Followed by the Company
|
|
|
requirements under Section 303A.02(a)(ii) of the NYSE Listed Company Manual. A compensation committee must also have authority to retain or obtain the advice of compensation and other advisers, subject to prescribed independence criteria that the committee must consider prior to engaging any such adviser.
|
director in compliance with the requirements under the Companies Act.
|
|
|
A NYSE-listed U.S. company must generally obtain shareholder approval with respect to any equity compensation plan.
|
Under the Companies Act, Restricted Stock Unit (“RSU”) and Stock Acquisition Right (“SAR”) awards are deemed to be compensation for the services performed by the Company’s Directors and Executive Officers and do not require shareholders’ approval. The Compensation Committee establishes the policy with respect to the determination of the individual compensation of each of the Company’s Directors and Executive Officers (including RSU and SAR awards as equity compensation) and makes determinations in accordance with that compensation policy.
|
|
|
A NYSE-listed U.S. company must adopt and disclose corporate governance guidelines.
|
Under the Companies Act, the Company is not required to adopt and disclose corporate governance guidelines. However, in response to Japan’s Corporate Governance Code, which was incorporated into the Tokyo Stock Exchange’s Securities Listing Regulations, the Company has established and publicly disclosed the “Nomura Holdings Corporate Governance Guidelines.”
|
|
|
The
non-management
directors of a NYSE-listed U.S. company must meet at regularly scheduled executive sessions without management.
|
Under the Companies Act, outside directors of the Company are not required to meet at regularly scheduled executive sessions without management. However, in accordance with the “Nomura Holdings Corporate Governance Guidelines,” outside directors hold meetings consisting solely of outside directors in order to discuss matters such as the business and corporate governance of the Company.
|
|
|
A NYSE-listed U.S. company must adopt and disclose a code of business conduct and ethics for directors, officers and employees, and promptly disclose any waivers of the code for directors or executive officers.
|
Under the Companies Act, the Company is not required to adopt and disclose a code of business conduct and ethics for directors, officers or employees. However, the Company has adopted the “Nomura Group Code of Conduct” Please see Item 16B of this annual report for further information regarding the “Nomura Group Code of Conduct.”
|
Item 16H. Mine Safety Disclosure
Not applicable.
133
PART III
Item 17. Financial Statements
In lieu of responding to this item, we have responded to Item 18 of this annual report.
Item 18. Financial Statements
The information required by this item is set forth in our consolidated financial statements included in this annual report.
134
Item 19. Exhibits
|
Exhibit
Number |
Description
|
|
|
1.1
|
Articles of Incorporation of Nomura Holdings, Inc. (English translation) (filed on June 25, 2015 as an exhibit to the Annual Report on Form
20-F
(File No.
001-15270)
and incorporated herein by reference)
|
|
|
1.2
|
Share Handling Regulations of Nomura Holdings, Inc. (English translation) (filed on June 25, 2015 as an exhibit to the Annual Report on Form
20-F
(File No.
001-15270)
and incorporated herein by reference)
|
|
|
1.3
|
Regulations of the Board of Directors of Nomura Holdings, Inc. (English translation)
|
|
|
1.4
|
Regulations of the Nomination Committee of Nomura Holdings, Inc. (English translation) (filed on June 23, 2016 as an exhibit to the Annual Report on Form
20-F
(File No.
001-15270)
and incorporated herein by reference)
|
|
|
1.5
|
Regulations of the Audit Committee of Nomura Holdings, Inc. (English translation)
|
|
|
1.6
|
Regulations of the Compensation Committee of Nomura Holdings, Inc. (English translation) (filed on June 27, 2012 as an exhibit to the Annual Report on Form
20-F
(File No.
001-15270)
and incorporated herein by reference)
|
|
|
2.1
|
Form of Deposit Agreement among Nomura Holdings, Inc., The Bank of New York Mellon as depositary and all owners and holders from time to time of American Depositary Receipts, including the form of American Depositary Receipt (filed on April 28, 2010 as an exhibit to the Registration Statement on Form
F-6
(File No.
333-166346)
and incorporated herein by reference)
|
|
|
2.2
|
Description of rights of each class of securities registered under Section 12 of the Securities Exchange Act of 1934 (filed on June 25, 2019 as an exhibit to the Annual Report on Form
20-F
(File No.
001-15270)
and incorporated herein by reference)
|
|
|
4.1
|
Limitation of Liability Agreement (filed on June 30, 2011 as an exhibit to the Annual Report on Form
20-F
(File No.
001-15270)
and incorporated herein by reference)
(1)
|
|
|
4.2
|
Limitation of Liability Agreement (English translation) (filed on June 25, 2015 as an exhibit to the Annual Report on Form
20-F
(File No.
001-15270)
and incorporated herein by reference)
(2)
|
|
|
4.3
|
Limitation of Liability Agreement (filed on June 25, 2015 as an exhibit to the Annual Report on Form
20-F
(File No.
001-15270)
and incorporated herein by reference)
(3)
|
|
|
8.1
|
Subsidiaries of Nomura Holdings, Inc.—See Item 4.C. “
Organizational Structure
|
|
|
11.1
|
Nomura Group Code of Conduct 2020 (English translation)
|
|
|
11.2
|
Nomura Group Code of Ethics for Financial Professionals (English translation)
|
|
|
12.1
|
Certification of the principal executive officer required by 17 C.F.R. 240.
13a-14(a)
|
|
|
12.2
|
Certification of the principal financial officer required by 17 C.F.R. 240.
13a-14(a)
|
|
|
13.1
|
Certification of the chief executive officer required by 18 U.S.C. Section 1350
|
|
|
13.2
|
Certification of the chief financial officer required by 18 U.S.C. Section 1350
|
|
|
15.1
|
Consent of Ernst & Young ShinNihon LLC with respect to its report on the audit of the financial statements included in this annual report
|
|
|
101.INS
|
Inline XBRL Instance Document—the instance document does not appear in the Interactive Data File because its XBRL tags are embedded within the Inline XBRL document
|
|
|
101.SCH
|
Inline XBRL Taxonomy Extension Schema Document
|
|
|
101.CAL
|
Inline XBRL Taxonomy Extension Calculation Linkbase Document
|
|
|
101.DEF
|
Inline XBRL Taxonomy Extension Definition Linkbase Document
|
|
|
101.LAB
|
Inline XBRL Taxonomy Extension Label Linkbase Document
|
|
|
101.PRE
|
Inline XBRL Taxonomy Extension Presentation Linkbase Document
|
|
|
104
|
The cover page for the Company’s Annual Report on Form
20-F
for the year ended March 31, 2020, has been formatted in Inline XBRL
|
135
| (1) | The Company and Michael Lim Choo San entered into a Limitation of Liability Agreement substantially in the form of this exhibit. |
| (2) | The Company and each of Hiroshi Kimura, Noriaki Shimazaki, Hisato Miyashita, Mari Sono and Kazuhiko Ishimura entered into a Limitation of Liability Agreement substantially in the form of this exhibit. |
| (3) | The Company and Laura Simone Unger entered into a Limitation of Liability Agreement substantially in the form of this exhibit. |
The Company has not included as exhibits certain instruments with respect to our long-term debt. The amount of debt authorized under each such debt instrument does not exceed 10% or our total assets. We will furnish a copy of any such instrument to the SEC upon request.
136
NOMURA HOLDINGS, INC.
INDEX TO THE CONSOLIDATED FINANCIAL STATEMENTS
|
|
Page
|
|
||
|
Consolidated Financial Statements of Nomura Holdings, Inc.:
|
|
|
|
|
|
F-
2
|
||||
|
F-
7
|
||||
|
F-
10
|
||||
|
F-
11
|
||||
|
F-
12
|
||||
|
F-
14
|
||||
|
F-
16
|
||||
F-1
Report of Independent Registered Public Accounting Firm
To the Shareholders and the Board of Directors of
Nomura Holdings, Inc.
Opinion on the Financial Statements
We have audited the accompanying consolidated balance sheets of Nomura Holdings, Inc. (the Company) as of March 31, 2020 and 2019, the related consolidated statements of income, comprehensive income, changes in equity, and cash flows for each of the three years in the period ended March 31, 2020, and the related notes (collectively referred to as the “consolidated financial statements”). In our opinion, the consolidated financial statements present fairly, in all material respects, the consolidated financial position of the Company at March 31, 2020 and 2019, and the consolidated results of its operations, and its cash flows for each of the three years in the period ended March 31, 2020, in conformity with U.S. generally accepted accounting principles.
We also have audited, in accordance with the standards of the Public Company Accounting Oversight Board (United States) (PCAOB), the Company’s internal control over financial reporting as of March 31, 2020, based on criteria established in Internal Control-Integrated Framework issued by the Committee of Sponsoring Organizations of the Treadway Commission (2013 framework) and our report dated June 30, 2020 expressed an unqualified opinion thereon.
Basis for Opinion
These financial statements are the responsibility of the Company’s management. Our responsibility is to express an opinion on the Company’s financial statements based on our audits. We are a public accounting firm registered with the PCAOB and are required to be independent with respect to the Company in accordance with the U.S. federal securities laws and the applicable rules and regulations of the Securities and Exchange Commission and the PCAOB.
We conducted our audits in accordance with the standards of the PCAOB. Those standards require that we plan and perform the audit to obtain reasonable assurance about whether the financial statements are free of material misstatement, whether due to error or fraud. Our audits included performing procedures to assess the risks of material misstatement of the financial statements, whether due to error or fraud, and performing procedures that respond to those risks. Such procedures included examining, on a test basis, evidence regarding the amounts and disclosures in the financial statements. Our audits also included evaluating the accounting principles used and significant estimates made by management, as well as evaluating the overall presentation of the financial statements. We believe that our audits provide a reasonable basis for our opinion.
Critical Audit Matters
The critical audit matters communicated below are matters arising from the current period audit of the financial statements that were communicated or required to be communicated to the audit committee and that: (1) relate to accounts or disclosures that are material to the financial statements and (2) involved our especially challenging, subjective or complex judgments. The communication of critical audit matters does not alter in any way our opinion on the consolidated financial statements, taken as a whole, and we are not, by communicating the critical audit matters below, providing separate opinions on the critical audit matters or on the accounts or disclosures to which they relate.
F-2
|
|
Valuation—Less Liquid Financial Instruments
|
|
|
Description of the Matter
|
The Company holds investment positions in the fixed income and equity markets both for trading and customer facilitation. The Company had JPY 949 billion and JPY 668 billion of financial instruments assets and liabilities, respectively, categorized within Level 3 of the fair value hierarchy. In determining the fair value of these financial instruments, the Company used unobservable valuation inputs which reflect their assumptions and specific data. These inputs are significant to the fair value of the financial instruments and are supported by little or no market activity as of March 31, 2020. The methodologies applied by management to determine the fair value of such instruments are described in Note 2 to the consolidated financial statements.
Auditing the fair value of the Company’s Level 3 financial instruments was complex and highly judgmental due to the subjectivity of the judgments used and estimations made by management in determining the fair value for these financial instruments especially considering the impact of
COVID-19
on global financial markets. In particular, to value certain financial instruments, management used a variety of valuation techniques which involved certain underlying assumptions and significant unobservable valuation inputs, including weighted average cost of capital (WACC), growth rates, liquidity discounts, market multiples including enterprise value over earnings before interest, taxes, depreciation, and amortization (EV/ EBITDA) ratios, volatilities and correlations which are significant to the value of these investments.
|
|
|
How We Addressed the Matter in Our Audit
|
We obtained an understanding, evaluated the design and tested the operating effectiveness of controls that address the risk of material misstatement relating to management’s assessment of the significant inputs and estimates included in fair value measurement. This included the testing of model validation controls by various departments within the Company. It also included the testing of model performance and suitability controls as a result of significant market volatility due to the impact of
COVID-19.
Our audit procedures to evaluate the valuation methodologies used by the Company included, among others, testing significant unobservable inputs, estimates and the mathematical accuracy of the Company’s valuation models. We independently developed fair value estimates and compared them to the Company’s results, and involved our valuation specialists to assist with the application of these procedures, on a sample basis. We also agreed significant inputs and underlying data used in the Company’s valuations to agreements, information available from third party sources and market data, where available. We evaluated subsequent events and transactions and considered whether they corroborate or contradict the Company’s
year-end
valuations.
|
|
|
|
Income Taxes—Valuation Allowance
|
|
|
Description of the Matter
|
As disclosed in Note 16 to the consolidated financial statements at March 31, 2020, the Company had deferred tax assets of JPY 151 billion, net of a JPY 388 billion valuation allowance. The gross deferred tax assets are reduced by a valuation allowance if, based upon the weight of all available evidence, it is more likely than not that some portion, or all, of the deferred tax assets will not be realized.
Auditing management’s analysis of the assessment for realizing the deferred tax asset was complex and highly judgmental because the assessment process involves significant judgment. For example, assumptions used may be affected by future market events, economic conditions and decisions made by the management, including the impact associated with rebuilding the business platform and
COVID-19.
These assumptions feed into the revenue and cost projections used to assess whether the deferred tax assets will be realized.
|
F-3
|
How We Addressed the Matter in Our Audit
|
We obtained an understanding, evaluated the design and tested the operating effectiveness of controls that address the risks of material misstatement relating to management’s assessment for realizing the deferred tax assets. This included controls over management’s projections of future taxable income, that included the impact of rebuilding the business platform and
COVID-19,
and the future reversal of existing taxable temporary differences, and management’s identification and use of available tax planning strategies.
Our audit procedures to evaluate the realizability of deferred tax assets included, among others, inspecting the supporting documents and meeting minutes of the Board of Directors and Executive Management Board, and assessing whether management’s estimate of future taxable income and schedule of future deductible temporary differences to be reversed are consistent with the business plan. We evaluated the reasonableness of assumptions used by the Company to develop the projections of future taxable income and tested the completeness and accuracy of the underlying data used in its projections. For example, we compared the projections of future taxable income with the actual results of prior periods, as well as management’s consideration of current industry and economic trends with the corresponding actual results and evaluated the sensitivity of the outcomes by making reasonably possible changes in the assumptions of the projections.
|
|
|
|
Provisions for conduct and litigation
|
|
|
Description of the Matter
|
As disclosed in Note 21 to the consolidated financial statements, the Company is involved in investigations, lawsuits and other legal proceedings. The Company recognizes a liability for those contingencies for which it is probable that a liability has been incurred at the date of the consolidated financial statements and the amount is reasonably estimable. As part of this, management performs an assessment of the materiality of contingencies where a loss is either reasonably possible or it is reasonably possible that an exposure to loss exists in excess of the amount accrued. If it is reasonably possible that such a loss or an additional loss may have been incurred and the effect on the consolidated financial statements is material, the Company discloses the nature of the loss contingency and an estimate of the possible loss or range of loss or a statement that such an estimate cannot be made within the notes to the consolidated financial statements.
Auditing management’s determination of whether a loss contingency is probable and reasonably estimable, reasonably possible or remote, and the related disclosures, is highly subjective, complex and requires significant judgment. Management judgment is needed to determine whether an obligation exists, and a loss contingency should be recorded at March 31, 2020. This includes judgment in the determination of whether an outflow in respect of identified loss contingency is probable and can be estimated reliably. In addition, management judgment is needed to determine if an estimated loss is only reasonably possible rather than probable.
|
|
|
How We Addressed the Matter in Our Audit
|
We obtained an understanding, evaluated the design and tested the operating effectiveness of controls that address the risks of material misstatement relating to management’s assessment for timely identification of contingencies that may arise out of lawsuits and regulatory investigations including the Company’s assessment of whether they are probable or reasonably possible and the associated measurement of the best estimate.
|
|
|
|
Our audit procedures to test the assessment of the probability of incurrence of a loss and whether the loss was reasonably estimable included, among others, reading the minutes of the meetings of the Board of Directors and Executive Management Board, and reading relevant regulatory and legal correspondence to assess developments in significant matters, requesting and receiving external legal counsel confirmation letters, meeting with internal and external legal counsel to discuss the allegations, and obtaining a representation letter from the Company’s management. In addition, our audit procedures to test the measurement of the loss contingency and the disclosure of the reasonably possible additional loss in excess of amounts
|
F-4
|
|
recognized as a liability included, among others, evaluating the method of measuring the contingency, testing the accuracy and completeness of the data, reading correspondence received from internal and external counsel used to determine a range of reasonably possible loss and performing a search for new or contrary evidence affecting the estimate.
|
/s/ Ernst & Young ShinNihon LLC
We have served as the Company’s auditor for SEC reporting purposes since 2002, and as its Japanese statutory auditor since 1973, which includes the years we served as joint auditors between 1978 and 2002.
Tokyo, Japan
June 30, 2020
F-5
Report of Independent Registered Public Accounting Firm
To the Shareholders and the Board of Directors of
Nomura Holdings, Inc.
Opinion on Internal Control over Financial Reporting
We have audited Nomura Holdings, Inc.’s internal control over financial reporting as of March 31, 2020, based on criteria established in Internal Control—Integrated Framework issued by the Committee of Sponsoring Organizations of the Treadway Commission (2013 framework) (the COSO criteria). In our opinion, Nomura Holdings, Inc. (the Company) maintained, in all material respects, effective internal control over financial reporting as of March 31, 2020, based on the COSO criteria.
We also have audited, in accordance with the standards of the Public Company Accounting Oversight Board (United States) (PCAOB), the consolidated balance sheets of Nomura Holdings, Inc. (the Company) as of March 31, 2020 and 2019, the related consolidated statements of income, comprehensive income, changes in equity and cash flows for each of the three years in the period ended March 31, 2020, and the related notes and our report dated June 30, 2020 expressed an unqualified opinion thereon.
Basis for Opinion
The Company’s management is responsible for maintaining effective internal control over financial reporting and for its assessment of the effectiveness of internal control over financial reporting included in the accompanying Management’s Report on Internal Control over Financial Reporting. Our responsibility is to express an opinion on the Company’s internal control over financial reporting based on our audit. We are a public accounting firm registered with the PCAOB and are required to be independent with respect to the Company in accordance with the U.S. federal securities laws and the applicable rules and regulations of the Securities and Exchange Commission and the PCAOB.
We conducted our audit in accordance with the standards of the PCAOB. Those standards require that we plan and perform the audit to obtain reasonable assurance about whether effective internal control over financial reporting was maintained in all material respects.
Our audit included obtaining an understanding of internal control over financial reporting, assessing the risk that a material weakness exists, testing and evaluating the design and operating effectiveness of internal control based on the assessed risk, and performing such other procedures as we considered necessary in the circumstances. We believe that our audit provides a reasonable basis for our opinion.
Definition and Limitations of Internal Control Over Financial Reporting
A company’s internal control over financial reporting is a process designed to provide reasonable assurance regarding the reliability of financial reporting and the preparation of financial statements for external purposes in accordance with generally accepted accounting principles. A company’s internal control over financial reporting includes those policies and procedures that (1) pertain to the maintenance of records that, in reasonable detail, accurately and fairly reflect the transactions and dispositions of the assets of the company; (2) provide reasonable assurance that transactions are recorded as necessary to permit preparation of financial statements in accordance with generally accepted accounting principles, and that receipts and expenditures of the company are being made only in accordance with authorizations of management and directors of the company; and (3) provide reasonable assurance regarding prevention or timely detection of unauthorized acquisition, use, or disposition of the company’s assets that could have a material effect on the financial statements.
Because of its inherent limitations, internal control over financial reporting may not prevent or detect misstatements. Also, projections of any evaluation of effectiveness to future periods are subject to the risk that controls may become inadequate because of changes in conditions, or that the degree of compliance with the policies or procedures may deteriorate.
/s/ Ernst & Young ShinNihon LLC
Tokyo, Japan
June 30, 2020
F-6
NOMURA HOLDINGS, INC.
CONSOLIDATED BALANCE SHEETS
|
|
Millions of yen
|
|||||||
|
|
March 31
|
|||||||
|
|
2019
|
|
2020
|
|
||||
|
ASSETS
|
|
|
|
|
|
|
||
|
Cash and cash deposits:
|
|
|
||||||
|
Cash and cash equivalents
|
¥ |
|
¥ |
|
||||
|
Time deposits
|
|
|
||||||
|
Deposits with stock exchanges and other segregated cash
|
|
|
||||||
|
Total cash and cash deposits
|
|
|
||||||
|
Loans and receivables:
|
|
|
||||||
|
Loans receivable (including ¥
|
|
|
||||||
|
Receivables from customers (including ¥
|
|
|
||||||
|
Receivables from other than customers
|
|
|
||||||
|
Allowance for doubtful accounts
|
(
|
) |
(
|
) | ||||
|
Total loans and receivables
|
|
|
||||||
|
Collateralized agreements:
|
|
|
||||||
|
Securities purchased under agreements to resell (including ¥
|
|
|
||||||
|
Securities borrowed
|
|
|
||||||
|
Total collateralized agreements
|
|
|
||||||
|
Trading assets and private equity and debt investments:
|
|
|
||||||
|
Trading assets (including securities pledged as collateral of ¥
|
|
|
||||||
|
Private equity and debt investments (including ¥
|
|
|
||||||
|
Total trading assets and private equity and debt investments
|
|
|
||||||
|
Other assets:
|
|
|
||||||
|
Office buildings, land, equipment and facilities (net of accumulated depreciation and amortization of ¥
|
|
|
||||||
|
Non-trading
debt securities
|
|
|
||||||
|
Investments in equity securities
|
|
|
||||||
|
Investments in and advances to affiliated companies
|
|
|
||||||
|
Other (including ¥
|
|
|
||||||
|
Total other assets
|
|
|
||||||
|
Total assets
|
¥ |
|
¥ |
|
||||
The accompanying notes are an integral part of these consolidated financial statements.
F-
7
NOMURA HOLDINGS, INC.
CONSOLIDATED BALANCE SHEETS—(Continued)
|
|
Millions of yen
|
|||||||
|
|
March 31
|
|||||||
|
|
2019
|
|
2020
|
|
||||
|
LIABILITIES AND EQUITY
|
|
|
|
|
|
|
||
|
Short-term borrowings (including ¥
|
¥ |
|
¥ |
|
||||
|
Payables and deposits:
|
|
|
||||||
|
Payables to customers
|
|
|
||||||
|
Payables to other than customers
|
|
|
||||||
|
Deposits received at banks (including ¥
|
|
|
||||||
|
Total payables and deposits
|
|
|
||||||
|
Collateralized financing:
|
|
|
||||||
|
Securities sold under agreements to repurchase (including ¥
|
|
|
||||||
|
Securities loaned (including ¥
|
|
|
||||||
|
Other secured borrowings
|
|
|
||||||
|
Total collateralized financing
|
|
|
||||||
|
Trading liabilities
|
|
|
||||||
|
Other liabilities (including ¥
|
|
|
||||||
|
Long-term borrowings (including ¥
|
|
|
||||||
|
Total liabilities
|
|
|
||||||
|
Commitments and contingencies (Note 21)
|
|
|
||||||
|
Equity:
|
|
|
||||||
|
Nomura Holdings, Inc. (“NHI”) shareholders’ equity:
|
|
|
||||||
|
Common stock
|
|
|
||||||
|
No par value shares;
Authorized— Issued— Outstanding
—
March 31, 2020 |
|
|
||||||
|
Additional
paid-in
capital
|
|
|
||||||
|
Retained earnings
|
|
|
||||||
|
Accumulated other comprehensive income
|
(
|
) |
(
|
) | ||||
|
Total NHI
shareholders’
equity before treasury stock
|
|
|
||||||
|
Common stock held in treasury, at cost
—
|
(
|
) |
(
|
) | ||||
|
Total NHI shareholders’ equity
|
|
|
||||||
|
Noncontrolling interests
|
|
|
||||||
|
Total equity
|
|
|
||||||
|
Total liabilities and equity
|
¥ |
|
¥ |
|
||||
The accompanying notes are an integral part of these consolidated financial statements.
F-
8
The following table presents the classification of consolidated variable interest entities’ (“VIEs”) assets and liabilities included in the consolidated balance sheets above. The assets of a consolidated VIE may only be used to settle obligations of that VIE. Creditors do not typically have any recourse to Nomura beyond the assets held in the VIEs. See Note 6 “
” for further information.
Securitizations and Variable Interest Entities
|
|
Billions of yen
|
|||||||
|
|
March 31
|
|||||||
|
|
2019
|
|
2020
|
|
||||
|
Cash and cash deposits
|
¥ |
|
¥ |
|
||||
|
Trading assets and private equity and debt investments
|
|
|
||||||
|
Other assets
|
|
|
||||||
|
Total assets
|
¥ |
|
¥ |
|
||||
|
Trading liabilities
|
¥ |
|
¥ |
|
||||
|
Other liabilities
|
|
|
||||||
|
Borrowings
|
|
|
||||||
|
Total liabilities
|
¥ |
|
¥ |
|
||||
The accompanying notes are an integral part of these consolidated financial statements.
F-
9
NOMURA HOLDINGS, INC.
CONSOLIDATED STATEMENTS OF INCOME
|
|
Millions of yen
|
|||||||||||
|
Year ended March 31
|
||||||||||||
|
2018
|
|
2019
|
|
2020
|
|
|||||||
|
Revenue:
|
|
|
|
|||||||||
|
Commissions
|
¥ |
|
¥ |
|
¥ |
|
||||||
|
Fees from investment banking
|
|
|
|
|||||||||
|
Asset management and portfolio service fees
|
|
|
|
|||||||||
|
Net gain on trading
|
|
|
|
|||||||||
|
Gain (loss) on private equity and debt investments
|
(
|
) |
|
(
|
) | |||||||
|
Interest and dividends
|
|
|
|
|||||||||
|
Gain (loss) on investments in equity securities
|
|
(
|
) |
(
|
) | |||||||
|
Other
|
|
|
|
|||||||||
|
Total revenue
|
|
|
|
|||||||||
|
Interest expense
|
|
|
|
|||||||||
|
Net revenue
|
|
|
|
|||||||||
|
Non-interest
expenses:
|
|
|
|
|||||||||
|
Compensation and benefits
|
|
|
|
|||||||||
|
Commissions and floor brokerage
|
|
|
|
|||||||||
|
Information processing and communications
|
|
|
|
|||||||||
|
Occupancy and related depreciation
|
|
|
|
|||||||||
|
Business development expenses
|
|
|
|
|||||||||
|
Other
|
|
|
|
|||||||||
|
Total
non-interest
expenses
|
|
|
|
|||||||||
|
Income (loss) before income taxes
|
|
(
|
) |
|
||||||||
|
Income tax expense
|
|
|
|
|||||||||
|
Net income (loss)
|
¥ |
|
¥ |
(
|
) | ¥ |
|
|||||
|
Less: Net income attributable to noncontrolling interests
|
|
|
|
|||||||||
|
Net income (loss) attributable to NHI shareholders
|
¥ |
|
¥ |
(
|
) | ¥ |
|
|||||
|
|
Yen
|
|||||||||||
|
Per share of common stock:
|
|
|
|
|||||||||
|
Basic—
|
|
|
|
|||||||||
|
Net income (loss) attributable to NHI shareholders per share
|
¥ |
|
¥ |
(
|
) | ¥ |
|
|||||
|
Diluted—
|
|
|
|
|||||||||
|
Net income (loss) attributable to NHI shareholders per share
|
¥ |
|
¥ |
(
|
) | ¥ |
|
|||||
The accompanying notes are an integral part of these consolidated financial statements.
F-
10
NOMURA HOLDINGS, INC.
CONSOLIDATED STATEMENTS OF COMPREHENSIVE INCOME
|
|
Millions of yen
|
|||||||||||
|
|
Year ended March 31
|
|||||||||||
|
|
2018
|
|
2019
|
|
2020
|
|
||||||
|
Net income (loss)
|
¥ |
|
¥ |
(
|
) | ¥ |
|
|||||
|
Other comprehensive income (loss):
|
|
|
|
|||||||||
|
Change in cumulative translation adjustments:
|
|
|
|
|||||||||
|
Change in cumulative translation adjustments
|
(
|
) |
|
(
|
) | |||||||
|
Deferred income taxes
|
|
(
|
) |
|
||||||||
|
Total
|
(
|
) |
|
(
|
) | |||||||
|
Defined benefit pension plans:
|
|
|
|
|||||||||
|
Pension liability adjustment
|
(
|
) |
(
|
) |
|
|||||||
|
Deferred income taxes
|
|
|
|
|||||||||
|
Total
|
(
|
) |
(
|
) |
|
|||||||
|
Non-trading
securities:
|
|
|
|
|||||||||
|
Net unrealized gain (loss) on
non-trading
securities
|
(
|
) |
|
|
||||||||
|
Deferred income taxes
|
|
|
|
|||||||||
|
Total
|
(
|
) |
|
|
||||||||
|
Own credit adjustments:
|
|
|
|
|||||||||
|
Own credit adjustments
|
(
|
) |
|
|
||||||||
|
Deferred income taxes
|
|
(
|
) |
(
|
) | |||||||
|
Total
|
(
|
) |
|
|
||||||||
|
Total other comprehensive income (loss)
|
(
|
) |
|
|
||||||||
|
Comprehensive income (loss)
|
|
(
|
) |
|
||||||||
|
Less: Comprehensive income (loss) attributable to noncontrolling interests
|
(
|
) |
|
|
||||||||
|
Comprehensive income (loss) attributable to NHI shareholders
|
¥ |
|
¥ |
(
|
) | ¥ |
|
|||||
The accompanying notes are an integral part of these consolidated financial statements.
F-
11
NOMURA HOLDINGS, INC.
CONSOLIDATED STATEMENTS OF CHANGES IN EQUITY
|
|
Millions of yen
|
|||||||||||
|
|
Year ended March 31
|
|||||||||||
|
|
2018
|
|
2019
|
|
2020
|
|
||||||
|
Common stock
|
|
|
|
|||||||||
|
Balance at beginning of year
|
¥ |
|
¥ |
|
¥ |
|
||||||
|
Balance at end of year
|
|
|
|
|||||||||
|
Additional
paid-in
capital
|
|
|
|
|||||||||
|
Balance at beginning of year
|
|
|
|
|||||||||
|
Stock-based compensation awards
|
(
|
) |
|
(
|
) | |||||||
|
Changes in ownership interests in subsidiaries
|
(
|
) |
|
(
|
) | |||||||
|
Balance at end of year
|
|
|
|
|||||||||
|
Retained earnings
|
|
|
|
|||||||||
|
Balance at beginning of year
|
|
|
|
|||||||||
|
Cumulative effect of change in accounting principle
(1)
|
|
|
|
|||||||||
|
Net income (loss) attributable to NHI shareholders
|
|
(
|
) |
|
||||||||
|
Cash dividends
|
(
|
) |
(
|
) |
(
|
) | ||||||
|
Gain (loss) on sales of treasury stock
|
(
|
) |
(
|
) |
(
|
) | ||||||
|
Cancellation of treasury stock
|
(
|
) |
(
|
) |
|
|||||||
|
Balance at end of year
|
|
|
|
|||||||||
|
Accumulated other comprehensive income (loss)
|
|
|
|
|||||||||
|
Cumulative translation adjustments
|
|
|
|
|||||||||
|
Balance at beginning of year
|
|
(
|
) |
|
||||||||
|
Net change during the year
|
(
|
) |
|
(
|
) | |||||||
|
Balance at end of year
|
(
|
) |
|
(
|
) | |||||||
|
Defined benefit pension plans
|
|
|
|
|||||||||
|
Balance at beginning of year
|
(
|
) |
(
|
) |
(
|
) | ||||||
|
Pension liability adjustment
|
(
|
) |
(
|
) |
|
|||||||
|
Balance at end of year
|
(
|
) |
(
|
) |
(
|
) | ||||||
|
Own credit adjustments
|
|
|
|
|||||||||
|
Balance at beginning of year
|
|
|
|
|||||||||
|
Own credit adjustments
|
(
|
) |
|
|
||||||||
|
Balance at end of year
|
|
|
|
|||||||||
|
Balance at end of year
|
(
|
) |
(
|
) |
(
|
) | ||||||
|
(1)
|
Represents the adjustment to initially apply Accounting Standards Update (“ASU”) 2014-09, “
Revenue from Contracts with Customers
Leases
|
F-
12
NOMURA HOLDINGS, INC.
CONSOLIDATED STATEMENTS OF CHANGES IN EQUITY—(Continued)
|
|
Millions of yen
|
|||||||||||
|
|
Year ended March 31
|
|||||||||||
|
|
2018
|
|
2019
|
|
2020
|
|
||||||
|
Common stock held in treasury
|
|
|
|
|||||||||
|
Balance at beginning of year
|
(
|
) |
(
|
) |
(
|
) | ||||||
|
Repurchases of common stock
|
(
|
) |
(
|
) |
(
|
) | ||||||
|
Sales of common stock
|
|
|
|
|||||||||
|
Common stock issued to employees
|
|
|
|
|||||||||
|
Cancellation of treasury stock
|
|
|
|
|||||||||
|
Other net change in treasury stock
|
|
|
|
|||||||||
|
Balance at end of year
|
(
|
) |
(
|
) |
(
|
) | ||||||
|
Total NHI shareholders’ equity
|
|
|
|
|||||||||
|
Balance at end of year
|
|
|
|
|||||||||
|
Noncontrolling interests
|
|
|
|
|||||||||
|
Balance at beginning of year
|
|
|
|
|||||||||
|
Cash dividends
|
(
|
) |
(
|
) |
(
|
) | ||||||
|
Net income attributable to noncontrolling interests
|
|
|
|
|||||||||
|
Accumulated other comprehensive income (loss) attributable to noncontrolling interests
|
|
|
|
|||||||||
|
Cumulative translation adjustments
|
|
|
(
|
) | ||||||||
|
Net unrealized gain (loss) on
non-trading
securities
|
(
|
) |
|
|
||||||||
|
Purchase/sale (disposition) of subsidiary shares, etc., net
|
(
|
) |
|
|
||||||||
|
Other net change in noncontrolling interests
|
|
(
|
) |
|
||||||||
|
Balance at end of year
|
|
|
|
|||||||||
|
Total equity
|
|
|
|
|||||||||
|
Balance at end of year
|
¥ |
|
¥ |
|
¥ |
|
||||||
The accompanying notes are an integral part of these consolidated financial statements.
F-1
3
NOMURA HOLDINGS, INC.
CONSOLIDATED STATEMENTS OF CASH FLOWS
|
|
Millions of yen
|
|||||||||||
|
Year ended March 31
|
||||||||||||
|
|
2018
|
|
2019
|
|
2020
|
|
||||||
|
Cash flows from operating activities:
|
|
|
|
|||||||||
|
Net income (loss)
|
¥ |
|
¥ |
(
|
) | ¥ |
|
|||||
|
Adjustments to reconcile net income (loss) to net cash used in operating activities:
|
|
|
|
|||||||||
|
Depreciation and amortization
|
|
|
|
|||||||||
|
Impairment of goodwill
|
|
|
|
|||||||||
|
Stock-based compensation
|
|
|
|
|||||||||
|
(Gain) loss on investments in equity securities
|
(
|
) |
|
|
||||||||
|
(Gain) loss on investments in subsidiaries and affiliates
|
(
|
) |
|
(
|
) | |||||||
|
Equity in earnings of affiliates, net of dividends received
|
(
|
) |
(
|
) |
(
|
) | ||||||
|
Loss on disposal of office buildings, land, equipment and facilities
|
|
|
(
|
) | ||||||||
|
Deferred income taxes
|
|
|
(
|
) | ||||||||
|
Changes in operating assets and liabilities:
|
|
|
|
|||||||||
|
Time deposits
|
(
|
) |
|
(
|
) | |||||||
|
Deposits with stock exchanges and other segregated cash
(2)
|
(
|
) |
|
(
|
) | |||||||
|
Trading assets and private equity and debt investments
(1)
|
(
|
) |
|
(
|
) | |||||||
|
Trading liabilities
(1)
|
|
(
|
) |
|
||||||||
|
Securities purchased under agreements to resell, net of securities sold under agreements to repurchase
|
(
|
) |
(
|
) |
|
|||||||
|
Securities borrowed, net of securities loaned
|
|
|
|
|||||||||
|
Other secured borrowings
|
|
|
|
|||||||||
|
Loans and receivables, net of allowance for doubtful accounts
(1)
|
(
|
) |
|
(
|
) | |||||||
|
Payables
(1)
|
|
(
|
) |
|
||||||||
|
Bonus accrual
|
(
|
) |
(
|
) |
|
|||||||
|
Accrued income taxes, net
|
(
|
) |
|
(
|
) | |||||||
|
Other, net
|
(
|
) |
(
|
) |
(
|
) | ||||||
|
Net cash used in operating activities
(2)
|
(
|
) |
(
|
) |
(
|
) | ||||||
|
Cash flows from investing activities:
|
|
|
|
|||||||||
|
Payments for purchases of office buildings, land, equipment and facilities
|
(
|
) |
(
|
) |
(
|
) | ||||||
|
Proceeds from sales of office buildings, land, equipment and facilities
|
|
|
|
|||||||||
|
Payments for purchases of investments in equity securities
|
(
|
) |
|
|
||||||||
|
Proceeds from sales of investments in equity securities
|
|
|
|
|||||||||
|
Decrease (increase) in loans receivable at banks, net
|
(
|
) |
(
|
) |
|
|||||||
|
Decrease (increase) in
non-trading
debt securities, net
|
|
|
(
|
) | ||||||||
|
Business combinations or disposals, net
|
(
|
) |
|
(
|
) | |||||||
|
Decrease (increase) in investments in affiliated companies, net
|
|
(
|
) |
|
||||||||
|
Other, net
|
(
|
) |
(
|
) |
|
|||||||
|
Net cash provided by (used in) investing activities
|
(
|
) |
(
|
) |
|
|||||||
|
Cash flows from financing activities:
|
|
|
|
|||||||||
|
Increase in long-term borrowings
|
|
|
|
|||||||||
|
Decrease in long-term borrowings
|
(
|
) |
(
|
) |
(
|
) | ||||||
|
Increase in short-term borrowings, net
|
|
|
|
|||||||||
|
Increase (decrease) in deposits received at banks, net
|
(
|
) |
|
(
|
) | |||||||
|
Proceeds from sales of common stock held in treasury
|
|
|
|
|||||||||
|
Payments for repurchases of common stock held in treasury
|
(
|
) |
(
|
) |
(
|
) | ||||||
|
Payments for cash dividends
|
(
|
) |
(
|
) |
(
|
) | ||||||
|
Contribution from noncontrolling interests
|
|
|
|
|||||||||
|
Net cash provided by
|
|
|
|
|||||||||
|
Effect of exchange rate changes on cash, cash equivalents, restricted cash and restricted cash equivalents
(2)
|
(
|
) |
|
(
|
) | |||||||
|
Net increase (decrease) in cash, cash equivalents, restricted cash and restricted cash equivalents
(2)
|
(
|
) |
|
|
||||||||
|
Cash, cash equivalents, restricted cash and restricted cash equivalents at beginning of year
(2)
|
|
|
|
|||||||||
|
Cash, cash equivalents, restricted cash and restricted cash equivalents at end of year
(2)
|
¥ |
|
¥ |
|
¥ |
|
||||||
|
Supplemental information:
|
|
|
|
|||||||||
|
Cash paid during the year for
—
|
|
|
|
|||||||||
|
Interest
|
¥ |
|
¥ |
|
¥ |
|
||||||
|
Income tax payments, net
|
¥ |
|
¥ |
|
¥ |
|
||||||
| (1) |
Due to changes in accounting policy which Nomura adopted on April 1, 2018, certain reclassifications of amounts previously reported have been made to conform to the current year presentation. See Note 1
“Summary of accounting policies: New accounting pronouncements adopted during the current year”
|
F-1
4
NOMURA HOLDINGS, INC.
CONSOLIDATED STATEMENTS OF CASH FLOWS—(Continued)
| (2) |
In accordance with ASU
2016-18
“Restricted Cash”
|
The following table presents a reconciliation of
, and restricted cash and restricted cash equivalents reported in
within the consolidated balance sheets to the total of the same such amounts shown in the statements of cash flows above. Restricted cash and restricted cash equivalents are amounts where access, withdrawal or usage by Nomura is substantively prohibited by a third party entity outside of the Nomura group.
cash and cash equivalents
deposits with stock exchanges and other segregated cash
|
|
Millions of yen
|
|||||||||||
|
|
Year ended March 31
|
|||||||||||
|
|
2018
|
|
2019
|
|
2020
|
|
||||||
|
Cash and cash equivalents reported in
Cash and cash equivalents
|
¥ |
|
¥ |
|
¥ |
|
||||||
|
Restricted cash and restricted cash equivalents reported in
Deposits with stock exchanges and other segregated cash
|
|
|
|
|||||||||
|
Total cash, cash equivalent, restricted cash and restricted cash equivalents
|
¥ |
|
¥ |
|
¥ |
|
||||||
The accompanying notes are an integral part of these consolidated financial statements.
F-1
5
NOMURA HOLDINGS, INC.
NOTES TO THE CONSOLIDATED FINANCIAL STATEMENTS
1. Summary of accounting policies:
Description of business—
Nomura Holdings, Inc. (“Company”) and its broker-dealer, banking and other financial services subsidiaries provide investment, financing and related services to individual, institutional and government clients on a global basis. The Company and other entities in which it has a controlling financial interest are collectively referred to as “Nomura” within these consolidated financial statements.
Nomura operates its business through various divisions based upon the nature of specific products and services, its main client base and its management structure. Nomura reports operating results through
three
business segments: Retail, Asset Management, and Wholesale.
In its Retail segment, Nomura provides investment consultation services mainly to individual clients in Japan. In its Asset Management segment, Nomura develops and manages investment trusts, and provides investment advisory services. In its Wholesale segment, Nomura engages in the sales and trading of debt and equity securities, derivatives, and currencies on a global basis, and provides investment banking services such as the underwriting of debt and equity securities as well as mergers and acquisitions and financial advice.
Basis of presentation—
The accounting and financial reporting policies of the Nomura conform to accounting principles generally accepted in the United States (“U.S. GAAP”) as applicable to broker-dealers.
These consolidated financial statements include the financial statements of the Company and other entities in which it has a controlling financial interest. Nomura initially determines whether it has a controlling financial interest in an entity by evaluating whether the entity is a variable interest entity (“VIE”) under Financial Accounting Standards Board (“FASB”) Accounting Standard Codification (“ASC”) 810 “
” (“ASC 810”). VIEs are entities in which equity investors do not have the characteristics of a controlling financial interest or which do not have sufficient equity at risk for the entity to finance its activities without additional subordinated financial support. Nomura consolidates VIEs where Nomura is the primary beneficiary, which is where Nomura holds variable interests that provide power over the most significant activities of the VIE and the right to receive benefits or the obligation to absorb losses meeting a significance test, provided that Nomura is not acting as a fiduciary for other interest holders.
Consolidation
For entities other than VIEs, Nomura is generally determined to have a controlling financial interest in an entity when it owns a majority of the voting interests.
Equity investments in entities in which Nomura has significant influence over operating and financial decisions (generally defined as a holding of
20
to
50
percent of the voting stock of a corporate entity, or at least
3
percent of a limited partnership) are accounted for under the equity method of accounting (“equity method investments”) and reported within
—
or at fair value by electing the fair value option permitted by ASC 825 “
” (“ASC 825”) and reported within
,
Other financial investments are generally reported within
.
in which Nomura has neither control nor significant influence are carried at fair value, with changes in fair value recognized through the consolidated statements of income or the consolidated statements of comprehensive income.
Other assets
Investments in and advances to affiliated companies
Financial Instruments
Trading assets
Private equity investments
or Other assets—Other.
Trading assets
Equity investments
Certain entities in which Nomura has a financial interest are investment companies under ASC 946 “
” (“ASC 946”). These entities carry all of their investments at fair value, with changes in fair value recognized through the consolidated statements of income.
Financial Services—Investment Companies
F-1
6
NOMURA HOLDINGS, INC.
NOTES TO THE CONSOLIDATED FINANCIAL STATEMENTS—(Continued)
The Company’s principal subsidiaries include Nomura Securities Co., Ltd. (“NSC”), Nomura Securities International, Inc. (“NSI”), Nomura International plc (“NIP”) and Nomura Financial Products & Services, Inc. (“NFPS”).
All material intercompany transactions and balances have been eliminated on consolidation. Certain reclassifications of previously reported amounts have been made to conform to the current year presentation.
Use of estimates
—
Critical accounting estimates are those that are the most important accounting estimates used to prepare these consolidated financial statements and which require the most difficult, subjective and complex judgments by management. Such estimates determined by management include estimates regarding the fair value of financial instruments, the outcome of litigation and tax examinations, the recovery of the carrying value of goodwill, the allowance for doubtful accounts, the realization of deferred tax assets, the impairment of equity method investments and other non-financial assets and other matters that affect the reported amounts of assets and liabilities as well as the disclosures in these consolidated financial statements. Estimates, by their nature, are based on underlying assumptions which require management judgment and depend on the extent of available information. Actual results in future periods may differ from current estimates, which could have a material impact on these consolidated financial statements.
The COVID-19 pandemic has impacted some of the critical accounting estimates used in these consolidated financial statements during the year ended March 31, 2020 and is expected to continue to impact these estimates in future periods. Assumptions around how long the COVID-19 pandemic will last and how long the economies and financial markets in the key jurisdictions in which Nomura and its clients operate will take to recover has, and will continue to, affect these estimates. The key assumptions and estimates impacted by COVID-19 include:
|
|
•
|
The ability of clients to perform on their contractual obligations to Nomura arising from financial instruments for determination of fair value measurements or allowances for doubtful accounts;
|
|
|
•
|
The volatility and dislocation in global financial markets for determination of fair value measurements;
|
|
|
•
|
The expected duration of declines in global equity markets for determination of fair value measurements and impairment of equity method investments;
|
|
|
•
|
The future use of non-financial assets within Nomura for determination of whether impairments are required; and
|
|
|
•
|
The future profitability of Nomura to realize deferred tax assets.
|
Various references are made throughout the notes to these consolidated financial statements where critical accounting estimates based on management judgment have been made, the nature of the estimates, the underlying assumptions made by management used to derive those estimates and how the COVID-19 pandemic, has and is expected to continue to impact these estimates and therefore amounts reported in these consolidated financial statements.
Fair value of financial instruments
—
A significant amount of Nomura’s financial assets and financial liabilities are carried at fair value, with changes in fair value recognized through the consolidated statements of income or the consolidated statements of comprehensive income. Use of fair value is either specifically required under U.S. GAAP or Nomura makes an election to use fair value for certain eligible items under the fair value option.
F-1
7
NOMURA HOLDINGS, INC.
NOTES TO THE CONSOLIDATED FINANCIAL STATEMENTS—(Continued)
Other financial assets and financial liabilities are carried at fair value on a nonrecurring basis, where the primary measurement basis is not fair value. Fair value is only used in specific circumstances after initial recognition, such as to measure impairment.
In both cases, fair value is generally determined in accordance with ASC 820 “
” (“ASC 820”) which defines fair value as the amount that would be exchanged to sell a financial asset or transfer a financial liability in an orderly transaction between market participants at the measurement date. It assumes that the transaction occurs in Nomura’s principal market, or in the absence of a principal market, the most advantageous market for the relevant financial asset or financial liability. See Note 2 “
” for further information regarding how Nomura estimates fair value for specific types of financial instruments used in the ordinary course of business.
Fair Value Measurements and Disclosures
Fair value measurements
The fair value of financial assets and financial liabilities of consolidated VIEs which meet the definition of collateralized financing entities are both measured using the more observable fair value of the financial assets and financial liabilities.
Transfers of financial assets—
Nomura accounts for the transfer of a financial asset as a sale when Nomura relinquishes control over the asset by meeting the following conditions: (a) the asset has been isolated from the transferor (even in bankruptcy or other receivership), (b) the transferee has the right to pledge or exchange the asset received, or if the transferee is an entity whose sole purpose is to engage in securitization or asset-backed financing activities, if, the holders of its beneficial interests have the right to pledge or exchange the beneficial interests held and (c) the transferor has not maintained effective control over the transferred asset.
In connection with its securitization activities, Nomura utilizes special purpose entities (“SPEs”) to securitize commercial and residential mortgage loans, government and corporate securities and other types of financial assets. Nomura’s involvement with SPEs includes structuring and underwriting, distributing and selling debt instruments and beneficial interests issued by SPEs to investors. Nomura derecognizes financial assets transferred in securitizations provided that Nomura has relinquished control over such assets and does not consolidate the SPE. Nomura may obtain or retain an interest in the financial assets, including residual interests in the SPEs dependent upon prevailing market conditions. Any such interests are accounted for at fair value and reported within
in the consolidated balance sheets with the change in fair value reported within
in the consolidated statements of income.
Trading assets
Revenue—Net gain on trading
Foreign currency translation—
The financial statements of the Company’s subsidiaries are measured using their functional currency which is the currency of the primary economic environment in which the entity operates. All assets and liabilities of subsidiaries which have a functional currency other than Japanese Yen are translated into Japanese Yen at exchange rates in effect at the balance sheet date, and all revenue and expenses are translated at the average exchange rates for the respective years and the resulting translation adjustments are accumulated and reported within
in NHI shareholders’ equity.
Accumulated other comprehensive income
(loss)
Foreign currency assets and liabilities are translated at exchange rates in effect at the balance sheet date and the resulting translation gains or losses are credited or charged to the consolidated statements of income.
F-1
8
NOMURA HOLDINGS, INC.
NOTES TO THE CONSOLIDATED FINANCIAL STATEMENTS—(Continued)
Revenue from services provided to clients—
Nomura earns revenue through fees and commissions from providing financial services to customers across all three business divisions. These services primarily include trade execution and clearing services, financial advisory services, asset management services, underwriting services, syndication services and distribution services.
Revenues are recognized when or as the customer obtains control of the service provided by Nomura which depends on when each of the key distinct substantive promises made by Nomura within the contract with the customer (“performance obligations”) are satisfied. Such performance obligations are generally satisfied at a particularly point in time or, if certain criteria are met, over a period of time.
Revenues from providing trade execution and clearing services are reported in the consolidated statements of income within
revenues from financial advisory services, underwriting services and syndication services are reported in
and
revenues from asset management services are reported in
.
Revenue—Commissions,
Revenue—Fees from investment banking
Revenue
—
Asset management and portfolio service fees
Costs to obtain or fulfill the underlying contract to provide services to a customer are deferred as assets if certain criteria are met. These deferred costs, which are reported in the consolidated balance sheets within
are released to the consolidated statements of income when the related revenue from providing the service is also recognized or earlier if there is evidence that the costs are not recoverable and therefore impaired.
Other
assets
Trading assets and trading liabilities
—
Trading assets and Trading liabilities
Revenue—Net gain on trading
Certain trading liabilities are held to economically hedge the price risk of investments in equity securities held for operating purposes. Changes in fair value of these trading liabilities are reported within
in the consolidated statements of income.
Revenue—Gain (loss) on investments in equity securities
Collateralized agreements and collateralized financing—
Collateralized agreements
Securities purchased under agreements to resell
Securities borrowed
Collateralized financing
Securities sold under agreements to repurchase
Securities loaned
Reverse repurchase and repurchase agreements principally involve the buying or selling of securities under agreements with clients to resell or repurchase these securities to or from those clients, respectively. These transactions are generally accounted for as collateralized agreements or collateralized financing transactions and are recognized in the consolidated balance sheets at the amount for which the securities were originally acquired or sold. Certain reverse repurchase and repurchase agreements are carried at fair value through election of the fair value option. No allowance for credit losses is generally recognized against reverse repurchase agreements due to the strict collateralization requirements.
F-1
9
NOMURA HOLDINGS, INC.
NOTES TO THE CONSOLIDATED FINANCIAL STATEMENTS—(Continued)
Nomura also enters into Gensaki Repo transactions which are the standard type of repurchase agreement used in Japanese financial markets. Gensaki Repo transactions contain margin requirements, rights of security substitution, and certain restrictions on the client’s right to sell or repledge the transferred securities. Gensaki Repo transactions are accounted for as collateralized agreements or collateralized financing transactions and are recognized on the consolidated balance sheets at the amount that the securities were originally acquired or sold.
Reverse repurchase agreements and repurchase agreements accounted for as collateralized agreements and collateralized financing transactions, respectively, entered into with the same counterparty and documented under a master netting agreement are offset in the consolidated balance sheets where the specific criteria defined by ASC
” (“ASC
210-20
“
Balance Sheet—Offsetting
210-20”)
are met. These criteria include requirements around the maturity of the transactions, the underlying systems on which the collateral is settled, associated banking arrangements and the legal enforceability of
close-out
and offsetting rights under the master netting agreement.
Securities borrowing and lending transactions are generally accounted for as collateralized agreements and collateralized financing transactions, respectively. These transactions are generally cash collateralized and are recognized on the consolidated balance sheets at the amount of cash collateral advanced or received. No allowance for credit losses is generally recognized against securities borrowing transactions due to the strict collateralization requirements.
Securities borrowing and lending transactions accounted for as collateralized agreements and collateralized financing transactions, respectively, entered into with the same counterparty and documented under a master netting agreement are also offset in the consolidated balance sheets where the specific criteria defined by ASC
210-20
are met.
Other secured borrowings
Trading balances of secured borrowings
Transfers and Servicing
Long-term borrowings
Securitizations and Variable Interest Entities
Borrowings
All Nomura-owned securities pledged to counterparties where the counterparty has the right to sell or repledge the securities, including collateral transferred under Gensaki Repo transactions, are reported parenthetically within
in the consolidated balance sheets.
Trading assets as Securities pledged as collateral
See Note 5 “
” for further information.
Collateralized transactions
Derivatives
—
Nomura uses a variety of derivative financial instruments, including futures, forwards, swaps and options, for both trading and
depending on whether fair value at the balance sheet date is positive or negative, respectively. Certain derivatives embedded in hybrid financial instruments such as structured notes and certificates of deposit are bifurcated from the host contract and are also carried at fair value in the consolidated balance sheets and reported within
depending on the maturity of the underlying host contract.
non-trading
purposes. All freestanding derivatives are carried at fair value in the consolidated balance sheets and reported within
Trading assets or Trading liabilities
Short-term borrowings or Long-term borrowings
F-
20
NOMURA HOLDINGS, INC.
NOTES TO THE CONSOLIDATED FINANCIAL STATEMENTS—(Continued)
Changes in fair value are recognized either through the consolidated statements of income or the consolidated statements of comprehensive income depending on the purpose for which the derivatives are used.
Derivative assets and liabilities with the same counterparty documented under a master netting agreement are offset in the consolidated balance sheets where the specific criteria defined by ASC
” (“ASC 815”) are met. These criteria include requirements around the legal enforceability of such
210-20
and ASC 815 “
Derivatives and Hedging
close-out
and offset rights under the master netting agreement. In addition, fair value amounts recognized for the right to reclaim cash collateral (a receivable) and the obligation to return cash collateral (a payable) are also offset against net derivative liabilities and net derivative assets, respectively, where certain additional criteria are met.
Exchange traded and centrally cleared OTC derivatives typically involve daily variation margin payments and receipts which reflect changes in the fair value of the related derivative. Such variation margin amounts are accounted for as either a partial settlement of the derivative or as a separate cash collateral receivable or payable depending on the legal form of the arrangement.
Trading
Derivative financial instruments used for trading purposes, including bifurcated embedded derivatives, are carried at fair value with changes in fair value reported in the consolidated statements of income within
.
Revenue—Net gain on trading
Non-trading
In addition to its trading activities, Nomura uses derivative financial instruments for other than trading purposes such as to manage risk exposures arising from recognized assets and liabilities, forecasted transactions and firm commitments. Certain derivatives used for
non-trading
purposes are formally designated as fair value and net investment hedges under ASC 815.
Nomura designates certain derivative financial instruments as fair value hedges of interest rate risk and foreign exchange risk arising from specific financial liabilities and foreign currency denominated
and
—
, respectively.
non-trading
debt securities, respectively. These derivatives are effective in reducing the risk associated with the exposure being hedged and they are highly correlated with changes in the fair value of the underlying hedged items, both at inception and throughout the life of the hedging relationship. Changes in fair value of the hedging derivatives are reported together with those of the hedged financial assets and liabilities through the consolidated statements of income within
Interest expense
Revenue
Other
Derivative financial instruments designated as hedges of the net investment in foreign operations related to specific subsidiaries with
. All other movements in fair value of highly effective hedging derivatives are reported through NHI shareholders’ equity within
.
non-Japanese
Yen functional currencies. When determining the effectiveness of net investment hedges, the effective portion of the change in fair value of the hedging derivative is determined by changes in spot exchange rates. Changes in fair value of the hedging derivatives attributable to changes in the difference between the forward rate and spot rate is excluded from the measurement of hedge effectiveness and are reported in the consolidated statements of income within
Revenue—Other
Accumulated other comprehensive income (loss)
See Note 3 “
” for further information.
Derivative instruments and hedging activities
F-
21
NOMURA HOLDINGS, INC.
NOTES TO THE CONSOLIDATED FINANCIAL STATEMENTS—(Continued)
Loans receivable—
Loans receivable are loans which management intends to hold for the foreseeable future. Loans receivable are either carried at fair value or at amortized cost. Interest earned on loans receivable is generally reported in the consolidated statements of income within
.
Revenue—Interest and dividends
Loans receivable carried at fair value
Certain loans which are risk managed on a fair value basis are carried at fair value through election of the fair value option. Nomura makes this election to mitigate volatility in the consolidated statements of income caused by the difference in measurement basis that would otherwise exist between the loans and the derivatives used to risk manage those loans. Changes in the fair value of loans receivable carried at fair value are reported in the consolidated statements of income within
.
Revenue—Net gain on trading
Loans receivable carried at amortized cost
Loans receivable which are not carried at fair value are carried at amortized cost. Amortized cost represents cost adjusted for deferred fees and direct costs, unamortized premiums or discounts on purchased loans and after deducting any applicable allowance for credit losses when loans receivable are identified as impaired.
Loan origination fees, net of direct origination costs, are amortized to
as an adjustment to yield over the life of the loan. Net unamortized deferred fees and costs were immaterial as of March 31, 2019 and March 31, 2020.
Revenue—Interest and dividends
Modifications of loans receivable where the borrower is in financial difficulty and Nomura has granted a financial concession are typically accounted for as troubled debt restructurings (“TDRs”) and the loan receivable classified as impaired with recognition of an appropriate allowance for credit losses. However, consistent with guidance issued by U.S. banking regulators in March 2020 as a result of the COVID-19 pandemic, certain modifications of loans receivable which meet the above criteria have not been accounted for TDRs nor the loan classified as impaired provider the borrower was current with payments prior to the COVID-19 pandemic, the nature of the concession is short-term and only permits a payment delay, waiver of fees or extension of repayment terms.
See Note 7 “
” for further information including how allowances for credit losses are determined and the impact of the COVID-19 pandemic on the approach.
Financing receivables
Other receivables—
Receivables from customers
on client securities transactions, amounts receivable from
customers
for securities failed to deliver and receivables for commissions.
Receivables from other than
customers
include amounts receivable from brokers and dealers for securities failed to deliver, margin deposits, cash collateral receivables for derivative transactions, and net receivables arising from unsettled securities transactions. The net receivable arising from unsettled securities transactions reported within
Receivables from other than customers
was
These amounts are carried at contractual amounts due less any applicable allowance for credit losses which reflects management’s best estimate of probable losses incurred within these receivables which have been specifically identified as impaired. The allowance for credit losses is reported in the consolidated balance sheets within
.
Allowance for doubtful accounts
F-
22
NOMURA HOLDINGS, INC.
NOTES TO THE CONSOLIDATED FINANCIAL STATEMENTS—(Continued)
Loan commitments—
Unfunded loan commitments written by Nomura are
accounted
for as either
off-balance
sheet instruments, or are carried at fair value on a recurring basis either as trading instruments or through election of the fair value option.
These loan commitments are generally accounted for in a manner consistent with the accounting for the loan receivable upon funding. Where the loan receivable will be classified as a trading asset or will be elected for the fair value option, the loan commitment is also generally held at fair value, with changes in fair value reported in the consolidated statements of income within
. Loan commitment fees integral to the loan commitment are recognized as part of the fair value of the commitment.
Revenue—Net gain on trading
For loan commitments where the loan will be held for the foreseeable future, Nomura recognizes an allowance for credit losses which is reported within
in the consolidated balance sheets which reflects management’s best estimate of probable losses incurred within the loan commitments which have been specifically classified as impaired.
Other liabilities—other
Loan commitment fees are generally deferred and recognized over the
term
of the loan when funded as an adjustment to yield. If drawdown of the loan commitment is considered remote, loan commitment fees are recognized over the commitment period as service revenue.
Payables and deposits—
Payables to customers
Payables to other than customers
Deposits received at banks
Office buildings, land, equipment and facilities—
Office buildings, land, equipment and facilities, owned and held for use by Nomura are stated at cost, net of accumulated depreciation and amortization, except for land, which is stated at cost. Significant renewals and additions are capitalized at cost. Maintenance, repairs and minor renewals are expensed as incurred in the consolidated statements of income.
Leases and subleases entered into by Nomura as either lessor or lessee are classified as either operating or finance leases on inception date in accordance with ASC 842 “
” (“ASC842”) which Nomura adopted from April 1, 2019. On lease commencement date, Nomura as lessee recognizes
and
, respectively in the consolidated balance sheets.
Leases
right-of-use
(“ROU”) assets and lease liabilities which are reported within
Other assets—Office buildings, land, equipment and facilities
Other liabilities
Lease liabilities are initially measured at present value of the future minimum lease payments over the expected lease term. The future minimum lease payments are discounted using a relevant Nomura incremental
F-23
NOMURA HOLDINGS, INC.
NOTES TO THE CONSOLIDATED FINANCIAL STATEMENTS—(Continued)
borrowing rate as derived from information available at lease commencement date. The expected lease term is generally determined based on the contractual maturity of the lease, and adjusted for periods covered by options to extend or terminate the lease when Nomura is reasonably certain to exercise those options. ROU assets are initially measured at the amount of lease liabilities, and adjusted for any prepaid lease payments, initial direct costs incurred and any lease incentives received.
After lease commencement date, for operating leases Nomura as lessee recognizes lease expense over the lease term generally on a straight-line basis within
or
in the consolidated statements of income. While for finance leases, Nomura recognizes amortization charges of ROU assets over the lease term and interest expense on finance lease liabilities.
Occupancy and related depreciation
Information processing and communications
The following table presents a breakdown of owned and leased office buildings, land,
equipment
and facilities as of March 31, 2019 and 2020.
|
|
Millions of yen
|
|||||||
|
|
March 31
|
|||||||
|
|
2019
|
|
2020
|
|
||||
|
Land
|
¥ |
|
¥ |
|
||||
|
Office buildings
|
|
|
||||||
|
Equipment and facilities
|
|
|
||||||
|
Software
|
|
|
||||||
|
Construction in progress
|
|
|
||||||
|
Operating lease ROU assets
|
—
|
|
||||||
|
Total
|
¥ |
|
¥ |
|
||||
Depreciation and amortization charges of owned assets are generally computed using the straight-line method and recognized over the estimated useful lives of each asset. The estimated useful life of an asset takes into consideration technological change, normal deterioration and actual physical usage by Nomura. Leasehold improvements are depreciated over the shorter of their useful life or the term of the lease.
The estimated useful lives for significant asset classes are as follows:
|
Office buildings
|
|
|||
|
Equipment and facilities
|
|
|||
|
Software
|
|
Depreciation and amortization charges of depreciable assets are reported within
in the amount of
¥
Non-interest expenses—Information processing and communications
and
¥
million, and in
in the amount of
¥
Non-interest expenses—Occupancy and related depreciation
Long-lived assets, including ROU
assets
and software assets but excluding goodwill and indefinite-lived intangible assets, are reviewed for impairment whenever events or changes in circumstances indicate that the carrying amount may not be recoverable. If the estimated future undiscounted cash flows generated by the asset is less than the carrying amount of the asset, a loss is recognized to the extent that the carrying value exceeds its fair value.
F-2
4
NOMURA HOLDINGS, INC.
NOTES TO THE CONSOLIDATED FINANCIAL STATEMENTS—(Continued)
Investments in equity securities—
Nomura holds minority stakes in the equity securities of unaffiliated Japanese financial institutions and corporations in order to promote existing and potential business relationships. These companies often have similar investments in Nomura. Such cross-holdings are a customary business practice in Japan and provide a way for companies to manage shareholder relationships.
These investments, which Nomura refers to as being held for operating purposes, are carried at fair value and reported within
in the consolidated balance sheets, with changes in fair value reported within
in the consolidated statements of income. These investments comprise listed and unlisted equity securities in the amounts of ¥
97,904
million and ¥
40,543
million, respectively, as of March 31, 2019 and ¥
74,755
million and ¥
37,420
million, respectively, as of March 31, 2020.
Other assets—Investments in equity securities
Revenue—Gain (loss) on investments in equity securities
Other non-trading debt and equity securities—
Certain
and
in the consolidated balance sheets with changes in fair value reported within
in the consolidated statements of income. Realized gains and losses on
in the consolidated statements of income.
non-trading
subsidiaries within Nomura hold debt securities and minority stakes in equity securities for
non-trading
purposes.
Non-trading
securities held by
non-trading
subsidiaries are carried at fair value and reported within
Other assets—Non-trading debt securities
Other assets—Other
Revenue—Other
non-trading
securities are reported within
Revenue—Other
Short-term and long-term borrowings—
Short-term borrowings are defined as borrowings which are due on demand, which have a contractual maturity of one year or less at issuance date, or which have a longer contractual maturity but which contain features outside of Nomura’s control that allows the investor to demand redemption within one year from original issuance date. Short-term and long-term borrowings primarily consist of commercial paper, bank borrowings, and certain structured notes issued by Nomura and SPEs consolidated by Nomura, and financial liabilities recognized in transfers of financial assets which are accounted for as financings rather than sales under ASC 860 (“secured financing transactions”). Of these financial liabilities, certain structured notes and secured financing transactions are accounted for at fair value on a recurring basis through election of the fair value option. Other short and long-term borrowings are carried at amortized cost.
Structured notes are debt securities which contain embedded features (often meeting the accounting definition of a derivative) that alter the return to the investor from simply receiving a fixed or floating rate of interest to a return that depends upon some other variable(s) such as an equity or equity index, commodity price, foreign exchange rate, credit rating of a third party or more complex interest rate calculation. Structured borrowings are borrowings that have similar characteristics as structured notes.
All structured notes issued by Nomura and certain structured borrowings issued by Nomura on or after April 1, 2018 are carried at fair value on a recurring basis through election of the fair value option. This blanket election for structured notes and certain structured borrowings are made primarily to mitigate the volatility in the consolidated statements of income caused by differences in the measurement basis for structured notes and the derivatives used to risk manage those positions and to generally simplify the accounting Nomura applies to these financial instruments.
F-2
5
NOMURA HOLDINGS, INC.
NOTES TO THE CONSOLIDATED FINANCIAL STATEMENTS—(Continued)
Changes in the fair value of structured notes elected for the fair value option except for those related to structured notes and attributable to Nomura’s own creditworthiness, are reported within
in the consolidated statements of income.
Revenue—Net gain on trading
See Note 11 “
” for further information.
Borrowings
Income taxes—
Deferred tax assets and liabilities are recognized to reflect the expected future tax consequences of operating loss carryforwards, tax credit carryforwards and temporary differences between the carrying amounts for financial reporting purposes and the tax bases of assets and liabilities based upon enacted tax laws and tax rates. Nomura recognizes deferred tax assets to the extent it believes that it is more likely than not that a benefit will be realized. A valuation allowance is established against deferred tax assets for tax benefits available to Nomura that are not deemed more likely than not to be realized.
Deferred tax assets and deferred tax liabilities that relate to the same
and
in the consolidated balance sheets.
tax-paying
component within a particular tax jurisdiction are offset in the consolidated balance sheets. Net deferred tax assets and net deferred tax liabilities are reported within
Other assets—Other
Other liabilities
Nomura recognizes and measures unrecognized tax benefits based on Nomura’s estimate of the likelihood, based on technical merits, that tax positions will be sustained upon examination based on the facts and circumstances and information available at the end of each period. Nomura adjusts the level of unrecognized tax benefits when there is more information available, or when an event occurs requiring a change. The reassessment of unrecognized tax benefits could have a material impact on Nomura’s effective tax rate in the period in which it occurs.
Nomura recognizes income
in the consolidated statements of income.
tax-related
interest and penalties within
Income tax expense
See Note 16 “
” for further information.
Income taxes
Stock-based and other compensation awards—
Stock-based awards issued by Nomura to senior management and other employees are classified as either equity or liability awards depending on the terms of the award.
Stock-based awards such as Stock Acquisition Rights (“SARs”) and Restricted Stock Units (“RSUs”) which are expected to be settled by the delivery of the Company’s common stock are classified as equity awards. For these awards, total compensation cost is generally fixed at the grant date and measured using the grant-date fair value of the award, net of any amount the employee is obligated to pay and estimated forfeitures.
Stock-based awards such as Notional Stock Units (“NSUs”) and Collared Notional Stock Units (“CSUs”) which are expected to be settled in cash are classified as liability awards. Other awards such as Notional Index Units (“NIUs”) which are linked to a world stock index quoted by Morgan Stanley Capital International and which are expected to be cash settled are also effectively classified as liability awards. Liability awards are remeasured to fair value at each balance sheet date, net of estimated forfeitures with the final measurement of cumulative compensation cost equal to the settlement amount.
F-2
6
NOMURA HOLDINGS, INC.
NOTES TO THE CONSOLIDATED FINANCIAL STATEMENTS—(Continued)
For both equity and liability awards, fair value is determined either by using option pricing models, the market price of the Company’s common stock or the price of the third party index, as appropriate. Compensation cost is recognized in the consolidated statements of income over the requisite service period, which generally is equal to the contractual vesting period. Where an award has graded vesting, compensation expense is recognized using the accelerated recognition method.
Certain deferred compensation awards granted since May 2013 include “Full Career Retirement” (“FCR”) provisions which permit recipients of the awards to continue to vest in the awards upon voluntary termination or by claiming FCR during a
pre-defined
election window if certain criteria based on corporate title and length of service within Nomura are met. The requisite service period for these awards ends on the earlier of the contractual vesting date and the date that the recipients become eligible for or claim FCR.
See Note 14 “
” for further information.
Deferred compensation awards
Earnings per share—
The computation of basic earnings per share is based on the weighted average number of shares outstanding during the year. Diluted earnings per share reflects the assumed conversion of all dilutive securities based on the most advantageous conversion rate or exercise price available to the investors, and assuming conversion of convertible debt under the
if-converted
method.
See Note 12 “
” for further information.
Earnings per share
Cash and cash equivalents—
Nomura defines cash and cash equivalents as cash on hand and demand deposits with banks.
Goodwill and intangible assets—
Goodwill is recognized upon completion of a business combination as the difference between the purchase price and the fair value of the net assets acquired. Subsequent to initial recognition, goodwill is not amortized but is tested for impairment at a reporting unit level during the fourth quarter of each fiscal year, or more frequently during earlier interim periods if events or circumstances indicate there may be impairment. Nomura’s reporting units are at the same level as or one level below its business segments.
Nomura tests goodwill of each separate reporting unit by initially qualitatively assessing whether events and circumstances indicate that it is more likely than not (i.e. greater than 50%) that a reporting unit’s fair value is less than its carrying amount. If such assessment indicates fair value is not less than the carrying value, the reporting unit is deemed not to be impaired and no further analysis is required. If it is more likely than not that the fair value of the reporting unit is below its carrying value, a quantitative
two-step
impairment test is then performed.
In the first step, the current estimated fair value of the reporting unit is compared with its carrying value, including goodwill. If the fair value is less than the carrying value, then a second step is performed. In the second step, the implied current fair value of the reporting unit’s goodwill is determined by comparing the fair value of the reporting unit to the fair value of the net assets of the reporting unit, as if the reporting unit were being acquired in a business combination. An impairment loss is recognized if the carrying value of goodwill exceeds its implied current fair
value.
F-27
NOMURA HOLDINGS, INC.
NOTES TO THE CONSOLIDATED FINANCIAL STATEMENTS—(Continued)
Intangible assets not subject to amortization (“indefinite-lived intangible assets”) are tested for impairment on an individual asset basis during the fourth quarter of each fiscal year, or more frequently during earlier interim periods if events or circumstances indicate there may be impairment. Similar to goodwill, Nomura tests an indefinite-lived intangible asset by initially qualitatively assessing whether events or circumstances indicate that it is more likely than not that the fair value of the intangible asset is less than its carrying amount. If such assessment indicates fair value is not less than the carrying value, the intangible asset is deemed not to be impaired and no further analysis is required. If it is more likely than not that the fair value of the intangible asset is below its carrying value, the current estimated fair value of the intangible asset is compared with its carrying value. An impairment loss is recognized if the carrying value of the intangible asset exceeds its estimated fair value.
Intangible assets with finite lives (“finite-lived intangible assets”) are amortized over their estimated useful lives and tested for impairment either individually or with other assets (“asset group”) when events and circumstances indicate that the carrying value of the intangible asset (or asset group) may not be recoverable.
A finite-lived intangible asset is impaired when its carrying amount or the carrying amount of the asset group exceeds its fair value. An impairment loss is recognized only if the carrying amount of the intangible asset (or asset group) is not recoverable and exceeds its fair value.
For both goodwill and intangible assets, to the extent an impairment loss is recognized, the loss establishes a new cost basis for the asset which cannot be subsequently reversed.
See Note 10 “
—
” for further information.
Other assets
Other / Other liabilities
Nomura’s equity method investments are tested in their entirety for other-than-temporary impairment when there is an indication of impairment. The underlying assets associated with the equity method investments, including goodwill, are not tested separately for impairment.
Restructuring costs—
Costs associated with an exit activity are recognized at fair value in the period in which the liability is incurred. Such costs include
one-time
termination benefits provided to employees, costs to terminate certain contracts and costs to relocate employees. Termination benefits provided to employees as part of ongoing benefit arrangements are recognized as liabilities at the earlier of the date an appropriately detailed restructuring plan is approved by regional executive management or the terms of the involuntary terminations are communicated to employees potentially affected. Contractual termination benefits included in an employee’s contract of employment that is triggered by the occurrence of a specific event are recognized during the period in which it is probable that Nomura has incurred a liability and the amount of the liability can be reasonably estimated. A
one-time
termination benefit is established by a plan of termination that applies to a specified termination event and is recognized when an appropriately detailed restructuring plan is approved by regional executive management and the terms of the involuntary terminations are communicated to those employees potentially affected by the restructuring.
See Note 15
” for further information.
“Restructuring initiatives
F-28
NOMURA HOLDINGS, INC.
NOTES TO THE CONSOLIDATED FINANCIAL STATEMENTS—(Continued)
Employee benefit plans—
Nomura provides certain eligible employees with various benefit plans, including pensions and other post-retirement benefits. These benefit plans are classified as either defined benefit plans or defined contribution plans.
Plan assets and benefit obligations, as well as the net periodic benefit cost of a defined benefit pension or post-retirement benefit plan, are recognized based on various actuarial assumptions such as discount rates, expected return on plan assets and future compensation levels at the balance sheet date. Actuarial gains and losses in excess of 10% of the greater of the projected benefit obligation or the fair value of plan assets and unrecognized prior service costs or credits are amortized to net periodic benefit cost on a straight-line basis over the average remaining service life of active employees expected to receive benefits. The overfunded or underfunded status of a plan is reported within
or
in the consolidated balance sheets, and changes in funded status are reflected in net periodic benefit cost and
on a
Other assets—Other
Other liabilities
Other comprehensive income (loss)
net-of-tax
basis in the consolidated statements of comprehensive income.
The net periodic pension and other benefit cost of defined contribution plans is recognized within
in the consolidated statements of income when the employee renders service to Nomura, which generally coincides with when contributions to the plan are made.
Compensation and benefits
See Note 13 “
” for further information.
Employee benefit plans
F-2
9
NOMURA HOLDINGS, INC.
NOTES TO THE CONSOLIDATED FINANCIAL STATEMENTS—(Continued)
New accounting pronouncements adopted during the current year—
The following table presents a summary of new accounting pronouncements relevant to Nomura which have been adopted during the year ended March 31, 2020:
|
Pronouncement
|
Summary of new guidance
|
Expected adoption
date and method of
adoption
|
Effect on these
consolidated statements |
|||
|
ASU
2016-02,
“
Leases
(1)
|
•
Replaces ASC 840 “
Leases
•
Requires all lessees to recognize a right of use asset and corresponding lease liability on balance sheet.
•
Lessor accounting is largely unchanged from current guidance.
•
Simplifies the accounting for sale leaseback and
“build-to-suit”
leases.
•
Requires extensive new qualitative and quantitative footnote disclosures on lease arrangements.
|
Modified retrospective adoption from April 1, 2019.
(2)
|
¥
Other Asset—Office buildings, land, equipment, and facilities
Other liabilities
¥
Retained earnings
See Note 8 “Leases” where the amended disclosures have been made.
|
|
(1)
|
As subsequently amended by ASU
2018-01
“
Land Easement Practical Expedient for Transition to Topic 842
2018-10
“
Codification Improvements to Topic 842, Leases
2018-11
“
Leases (Topic 842): Targeted Improvements
2018-20
“
Leases (Topic 842): Narrow-Scope Improvements for Lessors
2019-01
“
Leases (Topic 842): Codification Improvements.
|
|
(2)
|
Nomura used certain practical expedients permitted by ASC 842 including adopting the new requirements through a cumulative-effect adjustment to retained earnings on adoption date.
|
F-
30
NOMURA HOLDINGS, INC.
NOTES TO THE CONSOLIDATED FINANCIAL STATEMENTS—(Continued)
Future accounting developments—
The following table presents a summary of new authoritative accounting pronouncements relevant to Nomura which will be adopted on or after April 1, 2020 and which may have a material impact on these financial statements:
|
Pronouncement
|
Summary of new guidance
|
Expected adoption
date and method of
adoption
|
Effect on these
consolidated statements |
|||
|
ASU
2016-13,
“
Measurement of Credit Losses on Financial Instruments
(3)
|
•
Introduces a new model for recognition and measurement of credit losses against certain financial instruments such as loans, debt securities and receivables which are not carried at fair value with changes in fair value recognized through earnings. The model also applies to off balance sheet credit exposures such as written loan commitments, standby letters of credit and issued financial guarantees not accounted for as insurance, which are not carried at fair value through earnings.
•
The new model based on lifetime current expected credit losses (CECL) measurement, to be recognized at the time an
in-scope
instrument is originated, acquired or issued.
•
Replaces existing incurred credit losses model under current GAAP.
•
Permits electing the fair value option for certain financial instruments on adoption date.
•
Requires enhanced qualitative and quantitative disclosures around credit risk, the methodology used to estimate and monitor expected credit losses and changes in estimates of expected credit losses.
|
Modified retrospective adoption from April 1, 2020.
|
For financial instruments subject to CECL, ¥
increase in
Allowance for doubtful accounts
, ¥
Other liabilities
, ¥
Deferred tax assets
and cumulative effect adjustment to decrease
Retained
earnings
, net of tax, of ¥
For financial instruments elected for the FVO, ¥
Loans receivable
increase in
Other
liabilities
and cumulative effect adjustment to decrease
Retained
earnings
,
Allowances for credit losses as determined on adoption date under the new model increased as a result of the COVID-19 pandemic because of the increased credit risk caused by the impact of the pandemic on borrowers. Fair value measurements used
|
F-
3
1
NOMURA HOLDINGS, INC.
NOTES TO THE CONSOLIDATED FINANCIAL STATEMENTS—(Continued)
|
Pronouncement
|
Summary of new guidance
|
Expected adoption
date and method of
adoption
|
Effect on these
consolidated statements |
|||
|
|
|
|
on adoption date were also lower because of increased credit risk
and impact on financial markets caused by the pandemic.
|
|||
|
ASU
2019-12,
“
Simplifying the Accounting for Income Taxes
|
•
Simplifies the accounting for income taxes by removing certain exceptions to the general principles in ASC 740
“Income Taxes”
•
Requires an entity to recognize a franchise tax (or similar tax) that is partially based on income as an income-based tax and account for any incremental amount incurred as a
non-income—
based tax.
•
Makes other minor amendments for simplification and clarification of income taxes accounting.
|
Effective from April 1, 2021.
(4)
•
Modified retrospective adoption for the amendments related to changes in ownership of foreign equity method investments or foreign subsidiaries.
•
Full or modified retrospective adoption for the amendments related to franchise taxes that are partially based on income.
•
Prospective adoption for all other amendments.
|
Currently evaluating the potential impact.
|
|
(3)
|
As subsequently amended by ASU
2018-19
“
Codification Improvements to Topic 326, Financial Instruments—Credit Losses
2019-04
“
Codification Improvements to Topic 326, Financial Instruments—Credit Losses, Topic 815, Derivatives and Hedging, and Topic 825, Financial Instruments
2019-05
“
Financial Instruments—Credit Losses (Topic 326): Targeted Transition Relief.
2019-09
“Codification Improvements to Topic 326, Financial Instruments—Credit Losses”
ASU2019-10
“Financial Instruments—Credit Losses (Topic 326), Derivatives and Hedging (Topic 815), and Leases (Topic 842): Effective Dates”.
|
|
(4)
|
Unless Nomura early adopts which is under evaluation.
|
F-
3
2
NOMURA HOLDINGS, INC.
NOTES TO THE CONSOLIDATED FINANCIAL STATEMENTS—(Continued)
2. Fair value measurements:
The fair value of financial instruments
A significant amount of Nomura’s financial instruments are measured at fair value. Financial assets measured at fair value on a recurring basis are reported in the consolidated balance sheets within
and
. Financial liabilities measured at fair value on a recurring basis are reported within
and
Trading assets and private equity and debt investments, Loans and receivables, Collateralized agreements
Other assets
Trading liabilities, Short-term borrowings, Payables and deposits, Collateralized financing, Long-term borrowings
Other liabilities.
Other financial assets and financial liabilities are measured at fair value on a nonrecurring basis, where the primary measurement basis is not fair value but where fair value is used in specific circumstances after initial recognition, such as to measure impairment.
In all cases, fair value is determined in accordance with ASC 820 “
” (“ASC 820”) which defines fair value as the amount that would be exchanged to sell a financial asset or transfer a financial liability in an orderly transaction between market participants at the measurement date. It assumes that the transaction occurs in the principal market for the relevant financial assets or financial liabilities, or in the absence of a principal market, the most advantageous market.
Fair Value Measurements and Disclosures
Fair value is usually determined on an individual financial instrument basis consistent with the unit of account of the financial instrument. However, certain financial instruments managed on a portfolio basis are valued as a portfolio, namely based on the price that would be received to sell a net long position (i.e., a net financial asset) or transfer a net short position (i.e., a net financial liability) consistent with how market participants would price the net risk exposure at the measurement date.
Financial assets measured at fair value also include investments in certain funds where, as a practical expedient, fair value is determined on the basis of net asset value per share (“NAV per share”) if the NAV per share is calculated in accordance with certain industry standard principles.
Increases and decreases in the fair value of assets and liabilities will significantly impact Nomura’s position, performance, liquidity and capital resources. As explained below, valuation techniques applied contain inherent uncertainties and Nomura is unable to predict the accurate impact of future developments in the market. The valuation of financial instruments is more difficult during periods of market stress as a result of greater volatility and reduced price transparency, which has been the case during the COVID-19 pandemic in 2020, and may therefore require the greater use of judgement in the determination of fair value. Where appropriate, Nomura uses economic hedging strategies to mitigate its risk, although these hedges are also subject to unpredictable movements in the market.
F-
33
NOMURA HOLDINGS, INC.
NOTES TO THE CONSOLIDATED FINANCIAL STATEMENTS—(Continued)
Valuation methodology for financial instruments carried at fair value on a recurring basis
The fair value of financial instruments is based on quoted market prices including market indices, broker or dealer quotations or an estimation by management of the expected exit price under current market conditions. Various financial instruments, including cash instruments and
over-the-counter
(“OTC”) contracts, have bid and offer prices that are observable in the market. These are measured at the point within the
bid-offer
range which best represents Nomura’s estimate of fair value. Where quoted market prices or broker or dealer quotations are not available, prices for similar instruments or valuation pricing models are considered in the determination of fair value.
Where quoted prices are available in active markets, no valuation adjustments are taken to modify the fair value of assets or liabilities marked using such prices. Other instruments may be measured using valuation techniques, such as valuation pricing models incorporating observable valuation inputs, unobservable parameters or a combination of both. Valuation pricing models use valuation inputs which would be considered by market participants in valuing similar financial instruments.
Valuation pricing models and their underlying assumptions impact the amount and timing of unrealized and realized gains and losses recognized, and the use of different valuation pricing models or underlying assumptions could produce different financial results. Valuation uncertainty results from a variety of factors, including the valuation technique or model selected, the quantitative assumptions used within the valuation model, the inputs into the model, as well as other factors. Valuation adjustments are used to reflect the assessment of this uncertainty. Common valuation adjustments include model reserves, credit adjustments,
close-out
adjustments, and other appropriate instrument-specific adjustments, such as those to reflect transfer or sale restrictions.
The level of adjustments is largely judgmental and is based on an assessment of the factors that management believe other market participants would use in determining the fair value of similar financial instruments. The type of adjustments taken, the methodology for the calculation of these adjustments, and the valuation inputs for these calculations are reassessed periodically to reflect current market practice and the availability of new information.
For example, the fair value of certain financial instruments includes adjustments for credit risk; both with regards to counterparty credit risk on positions held and Nomura’s own creditworthiness on positions issued. Credit risk on financial assets is significantly mitigated by credit enhancements such as collateral and netting arrangements. Any net credit exposure is measured using available and applicable valuation inputs for the relevant counterparty. The same approach is used to measure the credit exposure on Nomura’s financial liabilities as is used to measure counterparty credit risk on Nomura’s financial assets.
Such valuation pricing models are calibrated to the market on a regular basis and inputs used are adjusted for current market conditions and risks. The Valuation Model Validation Group (“VMVG”) within Nomura’s Risk Management Department reviews pricing models and assesses model appropriateness and consistency independently of the front office. The model reviews consider a number of factors about a model’s suitability for valuation and sensitivity of a particular product. Valuation models are calibrated to the market on a periodic basis by comparison to observable market pricing, comparison with alternative models and analysis of risk profiles.
As explained above, any changes in fixed income, equity, foreign exchange and commodity markets can impact Nomura’s estimates of fair value in the future, potentially affecting trading gains and losses. Where financial contracts have longer maturity dates, Nomura’s estimates of fair value may involve greater subjectivity due to the lack of transparent market data.
F-3
4
NOMURA HOLDINGS, INC.
NOTES TO THE CONSOLIDATED FINANCIAL STATEMENTS—(Continued)
Fair value hierarchy
All financial instruments measured at fair value, including those measured at fair value using the fair value option, have been categorized into a three-level hierarchy (“fair value hierarchy”) based on the transparency of valuation inputs used by Nomura to estimate fair value. A financial instrument is classified in the fair value hierarchy based on the lowest level of input that is significant to the fair value measurement of the financial instrument. The three levels of the fair value hierarchy are defined as follows, with Level 1 representing the most transparent inputs and Level 3 representing the least transparent inputs:
Level 1:
Observable valuation inputs that reflect quoted prices (unadjusted) for identical financial instruments traded in active markets at the measurement date.
Level 2:
Valuation inputs other than quoted prices included within Level 1 that are either directly or indirectly observable for the financial instrument.
Level 3:
Unobservable valuation inputs which reflect Nomura assumptions and specific data.
The availability of valuation inputs observable in the market varies by product and can be affected by a variety of factors. Significant factors include, but are not restricted to the prevalence of similar products in the market, especially for customized products, how established the product is in the market, for example, whether it is a new product or is relatively mature, and the reliability of information provided in the market which would depend, for example, on the frequency and volume of current data. A period of significant change in the market may reduce the availability of observable data. Under such circumstances, financial instruments may be reclassified into a lower level in the fair value hierarchy.
Significant judgments used in determining the classification of financial instruments include the nature of the market in which the product would be traded, the underlying risks, the type and liquidity of market data inputs and the nature of observed transactions for similar instruments.
Where valuation models include the use of valuation inputs which are less observable or unobservable in the market, significant management judgment is used in establishing fair value. The valuations for Level 3 financial instruments, therefore, involve a greater degree of judgment than those valuations for Level 1 or Level 2 financial instruments and has become more prevalent during the COVID-19 pandemic.
Certain criteria management use to determine whether a market is active or inactive include the number of transactions, the frequency that pricing is updated by other market participants, the variability of price quotes among market participants, and the amount of publicly available information.
F-3
5
NOMURA HOLDINGS, INC.
NOTES TO THE CONSOLIDATED FINANCIAL STATEMENTS—(Continued)
The following tables present the amounts of Nomura’s financial instruments measured at fair value on a recurring basis as of March 31, 2019 and 2020 within the fair value hierarchy.
|
|
Billions of yen
|
|||||||||||||||||||
|
March 31, 2019
|
||||||||||||||||||||
|
Level 1
|
|
Level 2
|
|
Level 3
|
|
Counterparty
and
Cash Collateral
Netting
(1)
|
|
Balance as of
March 31, 2019
|
|
|||||||||||
|
Assets:
|
|
|
|
|
|
|||||||||||||||
|
Trading assets and private equity and debt investments
(2)
|
|
|
|
|
|
|||||||||||||||
|
Equities
(3)
|
¥ |
|
¥ |
|
¥ |
|
¥ |
|
¥ |
|
||||||||||
|
Private equity and debt investments
(4)
|
|
|
|
|
|
|||||||||||||||
|
Japanese government securities
|
|
|
|
|
|
|||||||||||||||
|
Japanese agency and municipal securities
|
|
|
|
|
|
|||||||||||||||
|
Foreign government, agency and municipal securities
|
|
|
|
|
|
|||||||||||||||
|
Bank and corporate debt securities and loans for trading purposes
|
|
|
|
|
|
|||||||||||||||
|
Commercial mortgage-backed securities (“CMBS”)
|
|
|
|
|
|
|||||||||||||||
|
Residential mortgage-backed securities (“RMBS”)
|
|
|
|
|
|
|||||||||||||||
|
Issued/Guaranteed by government sponsored entity
|
|
|
|
|
|
|||||||||||||||
|
Other
|
|
|
|
|
|
|||||||||||||||
|
Real estate-backed securities
|
|
|
|
|
|
|||||||||||||||
|
Collateralized debt obligations (“CDOs”) and other
(5)
|
|
|
|
|
|
|||||||||||||||
|
Investment trust funds and other
|
|
|
|
|
|
|||||||||||||||
|
Total trading assets and private equity and debt investments
|
|
|
|
|
|
|||||||||||||||
|
Derivative assets
(6)
|
|
|
|
|
|
|||||||||||||||
|
Equity contracts
|
|
|
|
|
|
|||||||||||||||
|
Interest rate contracts
|
|
|
|
|
|
|||||||||||||||
|
Credit contracts
|
|
|
|
|
|
|||||||||||||||
|
Foreign exchange contracts
|
|
|
|
|
|
|||||||||||||||
|
Commodity contracts
|
|
|
|
|
|
|||||||||||||||
|
Netting
|
|
|
|
(
|
) |
(
|
) | |||||||||||||
|
Total derivative assets
|
|
|
|
(
|
) |
|
||||||||||||||
|
Subtotal
|
¥ |
|
¥ |
|
¥ |
|
¥ |
(
|
) | ¥ |
|
|||||||||
|
Loans and receivables
(7)
|
|
|
|
|
|
|||||||||||||||
|
Collateralized agreements
(8)
|
|
|
|
|
|
|||||||||||||||
|
Other assets
|
|
|
|
|
|
|||||||||||||||
|
Non-trading
debt securities
|
|
|
|
|
|
|||||||||||||||
|
Other
(2)(3)
|
|
|
|
|
|
|||||||||||||||
|
Total
|
¥ |
|
¥ |
|
¥ |
|
¥ |
(
|
) | ¥ |
|
|||||||||
|
Liabilities:
|
|
|
|
|
|
|||||||||||||||
|
Trading liabilities
|
|
|
|
|
|
|||||||||||||||
|
Equities
|
¥ |
|
¥ |
|
¥ |
|
¥ |
|
¥ |
|
||||||||||
|
Japanese government securities
|
|
|
|
|
|
|||||||||||||||
|
Japanese agency and municipal securities
|
|
|
|
|
|
|||||||||||||||
|
Foreign government, agency and municipal securities
|
|
|
|
|
|
|||||||||||||||
|
Bank and corporate debt securities
|
|
|
|
|
|
|||||||||||||||
|
Residential mortgage-backed securities (“RMBS”)
|
|
|
|
|
|
|||||||||||||||
|
Collateralized debt obligations (“CDOs”) and other
(5)
|
|
|
|
|
|
|||||||||||||||
|
Investment trust funds and other
|
|
|
|
|
|
|||||||||||||||
|
Total trading liabilities
|
|
|
|
|
|
|||||||||||||||
|
Derivative liabilities
(6)
|
|
|
|
|
|
|||||||||||||||
|
Equity contracts
|
|
|
|
|
|
|||||||||||||||
|
Interest rate contracts
|
|
|
|
|
|
|||||||||||||||
|
Credit contracts
|
|
|
|
|
|
|||||||||||||||
|
Foreign exchange contracts
|
|
|
|
|
|
|||||||||||||||
|
Commodity contracts
|
|
|
|
|
|
|||||||||||||||
|
Netting
|
|
|
|
(
|
) |
(
|
) | |||||||||||||
|
Total derivative liabilities
|
|
|
|
(
|
) |
|
||||||||||||||
|
Subtotal
|
¥ |
|
¥ |
|
¥ |
|
¥ |
(
|
) | ¥ |
|
|||||||||
|
Short-term borrowings
(9)
|
¥ |
|
¥ |
|
¥ |
|
¥ |
|
¥ |
|
||||||||||
|
Payables and deposits
(10)
|
|
|
|
|
|
|||||||||||||||
|
Collateralized financing
(8)
|
|
|
|
|
|
|||||||||||||||
|
Long-term borrowings
(9)(11)(12)
|
|
|
|
|
|
|||||||||||||||
|
Other liabilities
(13)
|
|
|
|
|
|
|||||||||||||||
|
Total
|
¥ |
|
¥ |
|
¥ |
|
¥ |
(
|
) | ¥ |
|
|||||||||
F-3
6
NOMURA HOLDINGS, INC.
NOTES TO THE CONSOLIDATED FINANCIAL STATEMENTS—(Continued)
|
|
Billions of yen
|
|||||||||||||||||||
|
March 31, 2020
|
||||||||||||||||||||
|
Level 1
|
|
Level 2
|
|
Level 3
|
|
Counterparty
and
Cash Collateral
Netting
(1)
|
|
Balance as of
March 31, 2020
|
|
|||||||||||
|
Assets:
|
|
|
|
|
|
|||||||||||||||
|
Trading assets and private equity and debt investments
(2)
|
|
|
|
|
|
|||||||||||||||
|
Equities
(3)
|
¥ |
|
¥ |
|
¥ |
|
¥ |
|
¥ |
|
||||||||||
|
Private equity and debt investments
(4)
|
|
|
|
|
|
|||||||||||||||
|
Japanese government securities
|
|
|
|
|
|
|||||||||||||||
|
Japanese agency and municipal securities
|
|
|
|
|
|
|||||||||||||||
|
Foreign government, agency and municipal securities
|
|
|
|
|
|
|||||||||||||||
|
Bank and corporate debt securities and loans for trading purposes
|
|
|
|
|
|
|||||||||||||||
|
Commercial mortgage-backed securities (“CMBS”)
|
|
|
|
|
|
|||||||||||||||
|
Residential mortgage-backed securities (“RMBS”)
|
|
|
|
|
|
|||||||||||||||
|
Issued/Guaranteed by government sponsored entity
|
|
|
|
|
|
|||||||||||||||
|
Other
|
|
|
|
|
|
|||||||||||||||
|
Real estate-backed securities
|
|
|
|
|
|
|||||||||||||||
|
Collateralized debt obligations (“CDOs”) and other
(5)
|
|
|
|
|
|
|||||||||||||||
|
Investment trust funds and other
|
|
|
|
|
|
|||||||||||||||
|
Total trading assets and private equity and debt investments
|
|
|
|
|
|
|||||||||||||||
|
Derivative assets
(6)
|
|
|
|
|
|
|||||||||||||||
|
Equity contracts
|
|
|
|
|
|
|||||||||||||||
|
Interest rate contracts
|
|
|
|
|
|
|||||||||||||||
|
Credit contracts
|
|
|
|
|
|
|||||||||||||||
|
Foreign exchange contracts
|
|
|
|
|
|
|||||||||||||||
|
Commodity contracts
|
|
|
|
|
|
|||||||||||||||
|
Netting
|
|
|
|
(
|
) |
(
|
) | |||||||||||||
|
Total derivative assets
|
|
|
|
(
|
) |
|
||||||||||||||
|
Subtotal
|
¥ |
|
¥ |
|
¥ |
|
¥ |
(
|
) | ¥ |
|
|||||||||
|
Loans and receivables
(7)
|
|
|
|
|
|
|||||||||||||||
|
Collateralized agreements
(8)
|
|
|
|
|
|
|||||||||||||||
|
Other assets
|
|
|
|
|
|
|||||||||||||||
|
Non-trading
debt securities
|
|
|
|
|
|
|||||||||||||||
|
Other
(2)(3)
|
|
|
|
|
|
|||||||||||||||
|
Total
|
¥ |
|
¥ |
|
¥ |
|
¥ |
(
|
) | ¥ |
|
|||||||||
|
Liabilities:
|
|
|
|
|
|
|||||||||||||||
|
Trading liabilities
|
|
|
|
|
|
|||||||||||||||
|
Equities
|
¥ |
|
¥ |
|
¥ |
|
¥ |
|
¥ |
|
||||||||||
|
Japanese government securities
|
|
|
|
|
|
|||||||||||||||
|
Japanese agency and municipal securities
|
|
|
|
|
|
|||||||||||||||
|
Foreign government, agency and municipal securities
|
|
|
|
|
|
|||||||||||||||
|
Bank and corporate debt securities
|
|
|
|
|
|
|||||||||||||||
|
Residential mortgage-backed securities (“RMBS”)
|
|
|
|
|
|
|||||||||||||||
|
Collateralized debt obligations (“CDOs”) and other
(5)
|
|
|
|
|
|
|||||||||||||||
|
Investment trust funds and other
|
|
|
|
|
|
|||||||||||||||
|
Total trading liabilities
|
|
|
|
|
|
|||||||||||||||
|
Derivative liabilities
(6)
|
|
|
|
|
|
|||||||||||||||
|
Equity contracts
|
|
|
|
|
|
|||||||||||||||
|
Interest rate contracts
|
|
|
|
|
|
|||||||||||||||
|
Credit contracts
|
|
|
|
|
|
|||||||||||||||
|
Foreign exchange contracts
|
|
|
|
|
|
|||||||||||||||
|
Commodity contracts
|
|
|
|
|
|
|||||||||||||||
|
Netting
|
|
|
|
(
|
) |
(
|
) | |||||||||||||
|
Total derivative liabilities
|
|
|
|
(
|
) |
|
||||||||||||||
|
Subtotal
|
¥ |
|
¥ |
|
¥ |
|
¥ |
(
|
) | ¥ |
|
|||||||||
|
Short-term borrowings
(9)
|
¥ |
|
¥ |
|
¥ |
|
¥ |
|
¥ |
|
||||||||||
|
Payables and deposits
(10)
|
|
|
|
|
|
|||||||||||||||
|
Collateralized financing
(8)
|
|
|
|
|
|
|||||||||||||||
|
Long-term borrowings
(9)(11)(12)
|
|
|
|
|
|
|||||||||||||||
|
Other liabilities
(13)
|
|
|
|
|
|
|||||||||||||||
|
Total
|
¥ |
|
¥ |
|
¥ |
|
¥ |
(
|
) | ¥ |
|
|||||||||
| (1) | Represents the amount offset under counterparty netting of derivative assets and liabilities as well as cash collateral netting against net derivatives. |
F-3
7
NOMURA HOLDINGS, INC.
NOTES TO THE CONSOLIDATED FINANCIAL STATEMENTS—(Continued)
| (2) |
Certain investments that are measured at fair value using net asset value per share as a practical expedient have not been classified in the fair value hierarchy. As of March 31, 2019 and March 31, 2020, the fair values of these investments which are included in
Trading assets and private equity and debt investments
Other assets—Others
|
| (3) | Includes equity investments that would have been accounted for under the equity method had Nomura not chosen to elect the fair value option. |
| (4) |
Private equity and debt investments
non-traded
financial instruments including ownership or other forms of junior capital (such as mezzanine loan). Includes equity investments that would have been accounted for under the equity method had Nomura not chosen to elect the fair value option.
|
| (5) | Includes collateralized loan obligations (“CLOs”) and asset-backed securities (“ABS”) such as those secured on credit card loans, auto loans and student loans. |
| (6) | Each derivative classification includes derivatives with multiple risk underlyings. For example, interest rate contracts include complex derivatives referencing interest rate risk as well as foreign exchange risk or other factors such as prepayment rates. Credit contracts include credit default swaps as well as derivatives referencing corporate and government debt securities. |
| (7) | Includes loans for which the fair value option has been elected. |
| (8) | Includes collateralized agreements or collateralized financing for which the fair value option has been elected. |
| (9) | Includes structured notes for which the fair value option has been elected. |
| (10) | Includes embedded derivatives bifurcated from deposits received at banks. If unrealized gains are greater than unrealized losses, deposits are reduced by the excess amount. |
| (11) | Includes embedded derivatives bifurcated from issued structured notes. If unrealized gains are greater than unrealized losses, borrowings are reduced by the excess amount. |
| (12) | Includes liabilities recognized from secured financing transactions that are accounted for as financings rather than sales. Nomura elected the fair value option for these liabilities. |
| (13) | Includes loan commitments for which the fair value option has been elected. |
Valuation techniques by major class of financial instrument
The valuation techniques used by Nomura to estimate fair value for major classes of financial instruments, together with the significant inputs which determine classification in the fair value hierarchy, are as follows.
Equities
Other assets
Other assets
mid-market
prices. Nomura determines whether the market is active depending on the sufficiency and frequency of trading activity. Where these securities are classified in Level 1 of the fair value hierarchy, no valuation adjustments are made to fair value. Listed equity securities traded in inactive markets are also generally valued using the exchange price and are classified in Level 2. Whilst rare in practice, Nomura may apply a discount or liquidity adjustment to the exchange price of a listed equity security traded in an inactive market if the exchange price is not considered to be an appropriate representation of fair value. These adjustments are determined by individual security and are not determined or influenced by the size of holding. The amount of such adjustments made to listed equity securities traded in inactive markets was ¥nil as of March 31, 2019 and 2020, respectively. The fair value of unlisted equity securities is determined using the same methodology as private equity and debt investments described below and are usually classified in Level 3 because significant valuation inputs such as liquidity discounts and credit spreads are unobservable.
Private equity and debt investments
F-3
8
NOMURA HOLDINGS, INC.
NOTES TO THE CONSOLIDATED FINANCIAL STATEMENTS—(Continued)
rate discounted at a weighted average cost of capital (“WACC”). Market multiple valuation techniques include comparables such as Enterprise Value/earnings before interest, taxes, depreciation and amortization (“EV/EBITDA”) ratios, Price/Earnings (“PE”) ratios, Price/Book ratios, Price/Embedded Value ratios and other multiples based on relationships between numbers reported in the financial statements of the investee and the price of comparable companies. A liquidity discount may also be applied to either a DCF or market multiple valuation to reflect the specific characteristics of the investee. The liquidity discount includes considerations for various uncertainties in the model and inputs to valuation. Where possible these valuations are compared with the operating cash flows and financial performance of the investee or properties relative to budgets or projections, price/earnings data for similar quoted companies, trends within sectors and/or regions and any specific rights or terms associated with the investment, such as conversion features and liquidation preferences. Private equity and debt investments are generally classified in Level 3 since the valuation inputs such as those mentioned above are usually unobservable.
Government, agency and municipal securities
non-G7
securities may be classified in Level 1 because they are traded in active markets. Certain securities may be classified in Level 3 because they are traded infrequently and there is not sufficient information from comparable securities to classify them in Level 2. These are valued using DCF valuation techniques which include significant unobservable inputs such as credit spreads of the issuer.
Bank and corporate debt securities
The fair value of bank and corporate debt securities is primarily determined using DCF valuation techniques but also using broker or dealer quotations and recent market transactions of identical or similar debt securities, if available. Consideration is given to the nature of the broker and dealer quotations, namely whether these are indicative or executable, the number of available quotations and how these quotations compare to any available recent market activity or alternative pricing sources. The significant valuation inputs used for DCF valuations are yield curves, asset swap spreads, recovery rates and credit spreads of the issuer. Bank and corporate debt securities are generally classified in Level
2 of the fair value hierarchy because these valuation inputs are usually observable or market-corroborated. Certain bank and corporate debt securities will be classified in Level 3 because they are traded infrequently and there is insufficient information from comparable securities to classify them in Level 2, or credit spreads or recovery rates of the issuer used in DCF valuations are unobservable.
Commercial mortgage-backed securities (“CMBS”)
Residential mortgage-backed securities (“RMBS”)
Real estate-backed securities
F-3
9
NOMURA HOLDINGS, INC.
NOTES TO THE CONSOLIDATED FINANCIAL STATEMENTS—(Continued)
given to the nature of the broker and dealer quotations, namely whether these are indicative or executable, the number of available quotations and how these quotations compare to any available recent market activity or alternative pricing sources. Where all significant inputs are observable, the securities will be classified in Level 2. For certain securities, no direct pricing sources or comparable securities or indices may be available. These securities are valued using DCF or valuation techniques and are classified in Level 3 as the valuation includes significant unobservable valuation inputs such as yields or loss severities.
Collateralized debt obligations (“CDOs”) and other
Investment trust funds and other
Investment trust funds and other
Derivatives—Equity contracts
Derivatives—Interest rate contracts
F-
40
NOMURA HOLDINGS, INC.
NOTES TO THE CONSOLIDATED FINANCIAL STATEMENTS—(Continued)
derivatives is determined through DCF valuation techniques as well as option models such as Black-Scholes and Monte Carlo simulation. The significant valuation inputs used include interest rates, forward foreign exchange (“FX”) rates, volatilities and correlations. Valuation adjustments are also made to model valuations in order to reflect counterparty credit risk on derivative assets and Nomura‘s own creditworthiness on derivative liabilities. OTC interest rate derivatives are generally classified in Level 2 because all significant valuation inputs and adjustments are observable or market-corroborated. Certain less liquid vanilla or more complex OTC interest rate derivatives are classified in Level 3 where interest rate, volatility or correlation valuation inputs are significant and unobservable.
Derivatives—Credit contracts
Derivatives—Foreign exchange contracts
Nomura includes valuation adjustments in its estimation of fair value of certain OTC derivatives relating to funding costs associated with these transactions to be consistent with how market participants in the principal market for these derivatives would determine fair value.
Loans
Collateralized agreements
and
Collateralized financing
F-
41
NOMURA HOLDINGS, INC.
NOTES TO THE CONSOLIDATED FINANCIAL STATEMENTS—(Continued)
techniques. The significant valuation inputs used include interest rates and collateral funding spreads such as general collateral or special rates. Reverse repurchase and repurchase agreements are generally classified in Level 2 of the fair value hierarchy because these valuation inputs are usually observable.
Non-trading debt securities
non-trading
subsidiaries in the group and are valued and classified in the fair value hierarchy using the same valuation techniques used for other debt securities classified as
Government, agency and municipal securities
Bank and corporate debt securities
Short-term
long-term borrowings (“Structured notes”)
The fair value of structured notes is determined using a quoted price in an active market for the identical liability if available, and where not available, using a mixture of valuation techniques that use the quoted price of the identical liability when traded as an asset, quoted prices for similar liabilities, similar liabilities when traded as assets, or an internal model which combines DCF valuation techniques and option pricing models, depending on the nature of the embedded features within the structured note. Where an internal model is used, Nomura estimates the fair value of both the underlying debt instrument and the embedded derivative components. The significant valuation inputs used to estimate the fair value of the debt instrument component include yield curves, prepayment rates, default probabilities and loss severities. The significant valuation inputs used to estimate the fair value of the embedded derivative component are the same as those used for the relevant type of freestanding OTC derivative discussed above. A valuation adjustment is also made to the entire structured note in order to reflect Nomura’s own creditworthiness. This adjustment is determined based on recent observable secondary market transactions and executable broker quotes involving Nomura debt instruments and is therefore typically treated as a Level 2 valuation input. Structured notes are generally classified in Level 2 of the fair value hierarchy as all significant valuation inputs and adjustments are observable. Where any unobservable inputs are significant, such as yields, prepayment rates, default probabilities, loss severities, volatilities and correlations used to estimate the fair value of the embedded derivative component, structured notes are classified in Level 3.
Long-term borrowings (“Secured financing transactions”)
Transfer and Servicing
Level 3 financial instruments
The valuation of Level 3 financial assets and liabilities is dependent on certain significant valuation inputs which are unobservable. Common characteristics of an inactive market include a low number of transactions of the financial instrument, stale or
non-current
price quotes, price quotes that vary substantially either over time or among market makers,
non-executable
broker quotes or little publicly released information.
If corroborative evidence is not available to value Level 3 financial instruments, fair value may be measured using other equivalent products in the market. The level of correlation between the specific Level 3 financial
F-
42
NOMURA HOLDINGS, INC.
NOTES TO THE CONSOLIDATED FINANCIAL STATEMENTS—(Continued)
instrument and the available benchmark instrument is considered as an unobservable valuation input. Other techniques for determining an appropriate value for unobservable input may consider information such as consensus pricing data among certain market participants, historical trends, extrapolation from observable market data and other information Nomura would expect market participants to use in valuing similar instruments.
Use of reasonably possible alternative valuation input assumptions to value Level 3 financial instruments will significantly influence fair value determination. Ultimately, the uncertainties described above about input assumptions imply that the fair value of Level 3 financial instruments is a judgmental estimate. The specific valuation for each instrument is based on management’s judgment of prevailing market conditions, in accordance with Nomura’s established valuation policies and procedures.
F-
43
NOMURA HOLDINGS, INC.
NOTES TO THE CONSOLIDATED FINANCIAL STATEMENTS—(Continued)
Quantitative and qualitative information regarding significant unobservable inputs
The following tables present quantitative and qualitative information about the significant unobservable valuation inputs used by Nomura to measure the fair value of financial instruments classified in Level 3 as of March 31, 2019 and 2020. These financial instruments will also typically include observable valuation inputs (i.e. Level 1 or Level 2 valuation inputs) which are not included in the table and are also often hedged using financial instruments which are classified in Level 1 or Level 2 of the fair value hierarchy. Changes in each of these significant unobservable valuation inputs used by Nomura will impact upon the fair value measurement of the financial instrument. The following tables also therefore qualitatively summarize how an increase in those significant unobservable valuation inputs to a different amount might result in a higher or lower fair value measurement at the reporting date and summarize the interrelationship between significant unobservable valuation inputs where more than one is used to measure fair value. The impact of the COVID-19 pandemic on financial markets has been considered in determining which valuation inputs are used to measure fair value.
|
|
March 31, 2019
|
|||||||||||||
|
Financial Instrument
|
Fair
value in billions of yen |
Valuation
technique
|
Significant
unobservable
valuation input |
Range of
valuation
inputs
(1)
|
Weighted
Average
(2)
|
Impact of
increases in significant unobservable valuation inputs
(3)(4)
|
Interrelationships
between valuation inputs
(5)
|
|||||||
|
Assets:
|
|
|
|
|
|
|
|
|||||||
|
Trading assets and private equity and debt investments
|
|
|
|
|
|
|
|
|||||||
|
Equities
|
¥
|
DCF
|
Liquidity discounts
|
|
|
|
|
|||||||
|
Private equity and debt investments
|
|
Market
multiples
|
EV/EBITDA ratios
|
|
|
|
|
|||||||
|
Foreign government, agency and municipal securities
|
|
DCF
|
Credit spreads
Recovery rates
|
|
|
|
|
|||||||
|
Bank and corporate debt securities and loans for trading purposes
|
|
DCF
|
Credit spreads
Recovery rates
|
|
|
|
|
|||||||
|
Residential mortgage backed securities (“RMBS”)
|
|
DCF
|
Yields
Prepayment rates Loss severities |
|
|
|
|
|||||||
|
Real estate-backed securities
|
|
DCF
|
Yields
Loss severities
|
|
|
|
|
|||||||
|
Collateralized debt obligations (“CDOs”) and other
|
|
DCF
|
Yields
Prepayment rates Default probabilities
Loss severities |
|
|
|
|
|||||||
F-4
4
NOMURA HOLDINGS, INC.
NOTES TO THE CONSOLIDATED FINANCIAL STATEMENTS—(Continued)
|
|
March 31, 2019
|
|||||||||||||
|
Financial Instrument
|
Fair
value in billions of yen |
Valuation
technique
|
Significant
unobservable
valuation input |
Range of
valuation
inputs
(1)
|
Weighted
Average
(2)
|
Impact of
increases in significant unobservable valuation inputs
(3)(4)
|
Interrelationships
between valuation inputs
(5)
|
|||||||
|
Derivatives, net:
|
|
|
|
|
|
|
|
|||||||
|
Equity contracts
|
¥ (
|
Option models
|
Dividend yield
Volatilities Correlations |
|
|
|
|
|||||||
|
Interest rate contracts
|
(
|
DCF/
Option models
|
Interest rates
Volatilities Volatilities Correlations |
|
|
|
|
|||||||
|
Credit contracts
|
(
|
DCF/
Option models
|
Credit spreads
Recovery rates Volatilities Correlations |
|
|
|
|
|||||||
|
Foreign exchange contracts
|
|
Option models
|
Interest rates
Volatilities Volatilities Correlations |
(
|
|
|
|
|||||||
|
Loans and receivables
|
|
DCF
|
Credit spreads
|
|
|
|
|
|||||||
|
Collateralized agreements
|
|
DCF
|
Repo rate
|
|
|
|
|
|||||||
|
Other assets
|
|
|
|
|
|
|
|
|||||||
|
Other
(6)
|
|
DCF
|
WACC
Growth rates Liquidity discounts |
|
|
|
|
|||||||
|
|
|
Market multiples
|
EV/EBITDA ratios
PE Ratios Price/Book ratios Liquidity discounts |
|
|
|
|
|||||||
|
Liabilities:
|
|
|
|
|
|
|
|
|||||||
|
Short-term borrowings
|
|
DCF/
Option models
|
Volatilities
Correlations |
|
|
|
|
|||||||
|
Long-term borrowings
|
|
DCF/
Option models
|
Volatilities
Volatilities Correlations |
( |
|
|
|
|||||||
F-45
NOMURA HOLDINGS, INC.
NOTES TO THE CONSOLIDATED FINANCIAL STATEMENTS—(Continued)
|
|
March 31, 2020
|
|||||||||||||
|
Financial Instrument
|
Fair
value in billions of yen |
Valuation
technique
|
Significant
unobservable
valuation input |
Range of
valuation
inputs
(1)
|
Weighted
Average
(2)
|
Impact of
increases in significant unobservable valuation inputs
(3)(4)
|
Interrelationships
between valuation inputs
(5)
|
|||||||
|
Assets:
|
|
|
|
|
|
|
|
|||||||
|
Trading assets and private equity and debt investments
|
|
|
|
|
|
|
|
|||||||
|
Equities
|
¥
|
DCF
|
Liquidity discounts
|
|
|
|
|
|||||||
|
|
|
Market multiples
|
Liquidity discounts
|
|
|
|
|
|||||||
|
Private equity and debt investments
|
|
DCF
|
WACC
Growth rates
Liquidity discounts |
|
|
|
|
|||||||
|
|
|
Market multiples
|
EV/EBITDA ratios
PE Ratios Liquidity discounts |
|
|
|
|
|||||||
|
Foreign government, agency and municipal securities
|
|
DCF
|
Credit spreads
Recovery rates |
|
|
|
|
|||||||
|
Bank and corporate debt securities and loans for trading purposes
|
|
DCF
|
Credit spreads
Recovery rates |
|
|
|
|
|||||||
|
Residential mortgage backed securities (“RMBS”)
|
|
DCF
|
Yields
Prepayment rates Loss severities |
|
|
|
|
|||||||
|
Real estate-backed securities
|
|
DCF
|
Loss severities
|
|
|
|
|
|||||||
|
Collateralized debt obligations (“CDOs”) and other
|
|
DCF
|
Yields
Prepayment rates Default probabilities Loss severities |
|
|
|
|
|||||||
F-46
NOMURA HOLDINGS, INC.
NOTES TO THE CONSOLIDATED FINANCIAL STATEMENTS—(Continued)
|
|
March 31, 2020
|
|||||||||||||
|
Financial Instrument
|
Fair
value in billions of yen |
Valuation
technique
|
Significant
unobservable
valuation input |
Range of
valuation
inputs
(1)
|
Weighted
Average
(2)
|
Impact of
increases in significant unobservable valuation inputs
(3)(4)
|
Interrelationships
between valuation inputs
(5)
|
|||||||
|
Derivatives, net:
|
|
|
|
|
|
|
|
|||||||
|
Equity contracts
|
¥
|
Option models
|
Dividend yield
Volatilities Correlations |
( |
|
|
|
|||||||
|
Interest rate contracts
|
(
|
DCF/
Option models
|
Interest rates
Volatilities Volatilities Correlations |
(
( |
|
|
|
|||||||
|
Credit contracts
|
(
|
DCF/
Option models
|
Credit spreads
Recovery rates
Volatilities
Correlations |
|
|
|
|
|||||||
|
Foreign exchange contracts
|
|
Option models
|
Interest rates
Volatilities Volatilities Correlations |
(
( |
|
|
|
|||||||
|
Loans and receivables
|
|
DCF
|
Credit spreads
Recovery rates |
|
|
|
|
|||||||
|
Collateralized agreements
|
|
DCF
|
Repo rate
|
|
|
|
|
|||||||
|
Other assets
|
|
|
|
|
|
|
|
|||||||
|
Other
(6)
|
|
DCF
|
WACC
Growth rates Liquidity discounts |
|
|
|
|
|||||||
|
|
|
Market multiples
|
EV/EBITDA ratios
PE Ratios
Price/Book ratios
Liquidity discounts
|
|
|
|
|
|||||||
|
Liabilities:
|
|
|
|
|
|
|
|
|||||||
|
Short-term borrowings
|
|
DCF/
Option models
|
Volatilities
Correlations |
|
|
|
|
|||||||
|
Long-term borrowings
|
|
DCF/
Option models
|
Volatilities
Volatilities Correlations |
|
|
|
|
|||||||
| (1) | Range information is provided in percentages, coefficients and multiples and represents the highest and lowest level significant unobservable valuation input used to value that type of financial instrument. A wide dispersion in the range does not necessarily reflect increased uncertainty or subjectivity in the valuation input and is typically just a consequence of the different characteristics of the financial instruments themselves. |
| (2) |
Weighted average information for
non-derivative
instruments is calculated by weighting each valuation input by the fair value of the financial instrument.
|
| (3) | The above table only considers the impact of an increase in each significant unobservable valuation input on the fair value measurement of the financial instrument. However, a decrease in the significant unobservable valuation input would have the opposite effect on the fair value measurement of the financial instrument. For example, if an increase in a significant unobservable valuation input would result in a lower fair value measurement, a decrease in the significant unobservable valuation input would result in a higher fair value measurement. |
F-4
7
NOMURA HOLDINGS, INC.
NOTES TO THE CONSOLIDATED FINANCIAL STATEMENTS—(Continued)
| (4) | The impact of an increase in the significant unobservable input on the fair value measurement for a derivative assumes Nomura is long risk to the input e.g., long volatility. Where Nomura is short such risk, the impact of an increase would have a converse effect on the fair value measurement of the derivative. |
| (5) | Consideration of the interrelationships between significant unobservable inputs is only relevant where more than one unobservable valuation input is used to determine the fair value measurement of the financial instrument. |
| (6) |
Valuation technique(s) and unobservable valuation inputs in respect of equity securities reported within
Other assets
|
Qualitative discussion of the ranges of significant unobservable inputs
The following comments present qualitative discussion about the significant unobservable valuation inputs used by Nomura for financial instruments classified in Level 3.
Derivatives—Equity contracts
Derivatives—Interest rate contracts
Derivatives—Credit contracts
Derivatives—Foreign exchange contracts
F-4
8
NOMURA HOLDINGS, INC.
NOTES TO THE CONSOLIDATED FINANCIAL STATEMENTS—(Continued)
currencies that trade in narrow ranges e.g. versus the U.S. Dollar while the higher end comes from currencies with a greater range of movement such as emerging market currencies. The range of correlations moves from positive to negative because the movement of some pairs is very closely related and in the same direction causing highly positive correlations while others generally move in opposite directions causing highly negative correlations with pairs that have differing relationships through the range.
Short-term borrowings and Long-term borrowings
Movements in Level 3 financial instruments
The following tables present gains and losses as well as increases and decreases of financial instruments measured at fair value on a recurring basis which Nomura classified in Level 3 for the years ended March 31, 2019 and 2020. Financial instruments classified in Level 3 are often hedged with instruments within Level 1 or Level 2 of the fair value hierarchy. The gains or losses presented below do not reflect the offsetting gains or losses for these hedging instruments. Level 3 financial instruments are also measured using both observable and unobservable valuation inputs. Fair value changes presented below, therefore, reflect realized and unrealized gains and losses resulting from movements in both observable and unobservable valuation inputs.
F-4
9
NOMURA HOLDINGS, INC.
NOTES TO THE CONSOLIDATED FINANCIAL STATEMENTS—(Continued)
For the years ended March 31, 2019 and 2020, gains and losses related to Level 3 assets and liabilities did not have a material impact on Nomura’s liquidity and capital resources management.
|
|
|
|
|
|
Billions of yen
|
|
||||||||||||||||||||||||||||||||||
|
|
|
|
|
|
Year ended March 31, 2019
|
|
||||||||||||||||||||||||||||||||||
|
|
|
Balance
as of
April 1,
2018
|
|
|
Total gains
(losses)
recognized
in net revenue
(1)
|
|
|
Total gains
(losses)
recognized in
other
comprehensive
income
|
|
|
Purchases
/ issues
(2)
|
|
|
Sales /
redemptions
(2)
|
|
|
Settlements
|
|
|
Foreign
exchange
movements
|
|
|
Transfers
into
Level 3
(4)(5)
|
|
|
Transfers
out of
Level 3
(5)
|
|
|
Balance
as of
March 31,
2019
|
|
||||||||||
|
Assets:
|
|
|
|
|
|
|
|
|
|
|
|
|
|
|
|
|
|
|
|
|
|
|
|
|
|
|
|
|
|
|
|
|
|
|
|
|
|
|
|
|
|
Trading assets and private equity and debt investments
|
|
|
|
|
|
|
|
|
|
|
|
|
|
|
|
|
|
|
|
|
|
|
|
|
|
|
|
|
|
|
|
|
|
|
|
|
|
|
|
|
|
Equities
|
|
¥
|
|
|
|
¥
|
(
|
)
|
|
¥
|
|
|
|
¥
|
|
|
|
¥
|
(
|
)
|
|
¥
|
|
|
|
¥
|
|
|
|
¥
|
|
|
|
¥
|
(
|
)
|
|
¥
|
|
|
|
Private equity and debt investments
|
|
|
|
|
|
|
(
|
)
|
|
|
|
|
|
|
|
|
|
|
(
|
)
|
|
|
|
|
|
|
|
|
|
|
|
|
|
|
|
|
|
|
|
|
|
Japanese agency and municipal securities
|
|
|
|
|
|
|
|
|
|
|
|
|
|
|
|
|
|
|
(
|
)
|
|
|
|
|
|
|
|
|
|
|
|
|
|
|
|
|
|
|
|
|
|
Foreign government, agency and municipal securities
|
|
|
|
|
|
|
|
|
|
|
|
|
|
|
|
|
|
|
(
|
)
|
|
|
|
|
|
|
|
|
|
|
|
|
|
|
(
|
)
|
|
|
|
|
|
Bank and corporate debt securities and loans for trading
purposes |
|
|
|
|
|
|
|
|
|
|
|
|
|
|
|
|
|
|
(
|
)
|
|
|
|
|
|
|
|
|
|
|
|
|
|
|
(
|
)
|
|
|
|
|
|
Commercial mortgage-backed securities (“CMBS”)
|
|
|
|
|
|
|
|
|
|
|
|
|
|
|
|
|
|
|
(
|
)
|
|
|
|
|
|
|
|
|
|
|
|
|
|
|
|
|
|
|
|
|
|
Residential mortgage-backed securities (“RMBS”)
|
|
|
|
|
|
|
|
|
|
|
|
|
|
|
|
|
|
|
|
|
|
|
|
|
|
|
|
|
|
|
|
|
|
|
(
|
)
|
|
|
|
|
|
Real estate-backed securities
|
|
|
|
|
|
|
(
|
)
|
|
|
|
|
|
|
|
|
|
|
(
|
)
|
|
|
|
|
|
|
|
|
|
|
|
|
|
|
|
|
|
|
|
|
|
Collateralized debt obligations (“CDOs”) and other
|
|
|
|
|
|
|
|
|
|
|
|
|
|
|
|
|
|
|
(
|
)
|
|
|
|
|
|
|
|
|
|
|
|
|
|
|
(
|
)
|
|
|
|
|
|
Investment trust funds and other
|
|
|
|
|
|
|
|
|
|
|
|
|
|
|
|
|
|
|
(
|
)
|
|
|
|
|
|
|
|
|
|
|
|
|
|
|
|
|
|
|
|
|
|
|
|
|
|
|
|
|
|
|
|
|
|
|
|
|
|
|
|
|
|
|
|
|
|
|
|
|
|
|
|
|
|
|
|
|
|
|
|
|
|
|
|
Total trading assets and private equity and debt investments
|
|
|
|
|
|
|
|
|
|
|
|
|
|
|
|
|
|
|
(
|
)
|
|
|
|
|
|
|
|
|
|
|
|
|
|
|
(
|
)
|
|
|
|
|
|
|
|
|
|
|
|
|
|
|
|
|
|
|
|
|
|
|
|
|
|
|
|
|
|
|
|
|
|
|
|
|
|
|
|
|
|
|
|
|
|
|
|
Derivatives, net
(3)
|
|
|
|
|
|
|
|
|
|
|
|
|
|
|
|
|
|
|
|
|
|
|
|
|
|
|
|
|
|
|
|
|
|
|
|
|
|
|
|
|
|
Equity contracts
|
|
|
(
|
)
|
|
|
(
|
)
|
|
|
|
|
|
|
|
|
|
|
|
|
|
|
(
|
)
|
|
|
|
|
|
|
(
|
)
|
|
|
|
|
|
|
(
|
)
|
|
Interest rate contracts
|
|
|
(
|
)
|
|
|
(
|
)
|
|
|
|
|
|
|
|
|
|
|
|
|
|
|
|
|
|
|
|
|
|
|
|
|
|
|
|
|
|
|
(
|
)
|
|
Credit contracts
|
|
|
|
|
|
|
(
|
)
|
|
|
|
|
|
|
|
|
|
|
|
|
|
|
(
|
)
|
|
|
|
|
|
|
(
|
)
|
|
|
|
|
|
|
(
|
)
|
|
Foreign exchange contracts
|
|
|
|
|
|
|
(
|
)
|
|
|
|
|
|
|
|
|
|
|
|
|
|
|
|
|
|
|
|
|
|
|
(
|
)
|
|
|
|
|
|
|
|
|
|
Commodity contracts
|
|
|
|
|
|
|
|
|
|
|
|
|
|
|
|
|
|
|
|
|
|
|
|
|
|
|
|
|
|
|
|
|
|
|
|
|
|
|
|
|
|
|
|
|
|
|
|
|
|
|
|
|
|
|
|
|
|
|
|
|
|
|
|
|
|
|
|
|
|
|
|
|
|
|
|
|
|
|
|
|
|
|
|
Total derivatives, net
|
|
|
(
|
)
|
|
|
(
|
)
|
|
|
|
|
|
|
|
|
|
|
|
|
|
|
(
|
)
|
|
|
|
|
|
|
|
|
|
|
|
|
|
|
(
|
)
|
|
|
|
|
|
|
|
|
|
|
|
|
|
|
|
|
|
|
|
|
|
|
|
|
|
|
|
|
|
|
|
|
|
|
|
|
|
|
|
|
|
|
|
Subtotal
|
|
¥
|
|
|
|
¥
|
(
|
)
|
|
¥
|
|
|
|
¥
|
|
|
|
¥
|
(
|
)
|
|
¥
|
(
|
)
|
|
¥
|
|
|
|
¥
|
|
|
|
¥
|
(
|
)
|
|
¥
|
|
|
|
|
|
|
|
|
|
|
|
|
|
|
|
|
|
|
|
|
|
|
|
|
|
|
|
|
|
|
|
|
|
|
|
|
|
|
|
|
|
|
|
|
|
Loans and receivables
|
|
¥
|
|
|
|
¥
|
|
|
|
¥
|
|
|
|
¥
|
|
|
|
¥
|
(
|
)
|
|
¥
|
|
|
|
¥
|
|
|
|
¥
|
|
|
|
¥
|
(
|
)
|
|
¥
|
|
|
|
Collateralized agreements
|
|
|
|
|
|
|
|
|
|
|
|
|
|
|
|
|
|
|
|
|
|
|
|
|
|
|
|
|
|
|
|
|
|
|
|
|
|
|
|
|
|
Other assets
|
|
|
|
|
|
|
|
|
|
|
|
|
|
|
|
|
|
|
|
|
|
|
|
|
|
|
|
|
|
|
|
|
|
|
|
|
|
|
|
|
|
Other
|
|
|
|
|
|
|
(
|
)
|
|
|
|
|
|
|
|
|
|
|
(
|
)
|
|
|
|
|
|
|
|
|
|
|
|
|
|
|
|
|
|
|
|
|
|
|
|
|
|
|
|
|
|
|
|
|
|
|
|
|
|
|
|
|
|
|
|
|
|
|
|
|
|
|
|
|
|
|
|
|
|
|
|
|
|
|
|
Total
|
|
¥
|
|
|
|
¥
|
(
|
)
|
|
¥
|
|
|
|
¥
|
|
|
|
¥
|
(
|
)
|
|
¥
|
(
|
)
|
|
¥
|
|
|
|
¥
|
|
|
|
¥
|
(
|
)
|
|
¥
|
|
|
|
|
|
|
|
|
|
|
|
|
|
|
|
|
|
|
|
|
|
|
|
|
|
|
|
|
|
|
|
|
|
|
|
|
|
|
|
|
|
|
|
|
|
Liabilities:
|
|
|
|
|
|
|
|
|
|
|
|
|
|
|
|
|
|
|
|
|
|
|
|
|
|
|
|
|
|
|
|
|
|
|
|
|
|
|
|
|
|
Trading liabilities
|
|
|
|
|
|
|
|
|
|
|
|
|
|
|
|
|
|
|
|
|
|
|
|
|
|
|
|
|
|
|
|
|
|
|
|
|
|
|
|
|
|
Equities
|
|
¥
|
|
|
|
¥
|
|
|
|
¥
|
|
|
|
¥
|
|
|
|
¥
|
(
|
)
|
|
¥
|
|
|
|
¥
|
|
|
|
¥
|
|
|
|
¥
|
(
|
)
|
|
¥
|
|
|
|
Foreign government, agency and municipal securities
|
|
|
|
|
|
|
|
|
|
|
|
|
|
|
|
|
|
|
(
|
)
|
|
|
|
|
|
|
|
|
|
|
|
|
|
|
|
|
|
|
|
|
|
Bank and corporate debt securities
|
|
|
|
|
|
|
|
|
|
|
|
|
|
|
|
|
|
|
|
|
|
|
|
|
|
|
|
|
|
|
|
|
|
|
|
|
|
|
|
|
|
Collateralized debt obligations (“CDOs”) and other
|
|
|
|
|
|
|
|
|
|
|
|
|
|
|
|
|
|
|
|
|
|
|
|
|
|
|
|
|
|
|
|
|
|
|
|
|
|
|
|
|
|
Investment trust funds and other
|
|
|
|
|
|
|
|
|
|
|
|
|
|
|
|
|
|
|
|
|
|
|
|
|
|
|
|
|
|
|
|
|
|
|
|
|
|
|
|
|
|
|
|
|
|
|
|
|
|
|
|
|
|
|
|
|
|
|
|
|
|
|
|
|
|
|
|
|
|
|
|
|
|
|
|
|
|
|
|
|
|
|
|
Total trading liabilities
|
|
¥
|
|
|
|
¥
|
|
|
|
¥
|
|
|
|
¥
|
|
|
|
¥
|
(
|
)
|
|
¥
|
|
|
|
¥
|
|
|
|
¥
|
|
|
|
¥
|
(
|
)
|
|
¥
|
|
|
|
|
|
|
|
|
|
|
|
|
|
|
|
|
|
|
|
|
|
|
|
|
|
|
|
|
|
|
|
|
|
|
|
|
|
|
|
|
|
|
|
|
|
Short-term borrowings
|
|
|
|
|
|
|
(
|
)
|
|
|
|
|
|
|
|
|
|
|
(
|
)
|
|
|
|
|
|
|
|
|
|
|
|
|
|
|
(
|
)
|
|
|
|
|
|
Payables
and
deposits
|
|
|
(
|
)
|
|
|
(
|
)
|
|
|
|
|
|
|
|
|
|
|
|
|
|
|
|
|
|
|
|
|
|
|
|
|
|
|
|
|
|
|
|
|
|
Collateralized financing
|
|
|
|
|
|
|
|
|
|
|
|
|
|
|
|
|
|
|
(
|
)
|
|
|
|
|
|
|
|
|
|
|
|
|
|
|
|
|
|
|
|
|
|
Long-term borrowings
|
|
|
|
|
|
|
(
|
)
|
|
|
|
|
|
|
|
|
|
|
(
|
)
|
|
|
|
|
|
|
|
|
|
|
|
|
|
|
(
|
)
|
|
|
|
|
|
Other liabilities
|
|
|
|
|
|
|
|
|
|
|
|
|
|
|
|
|
|
|
(
|
)
|
|
|
|
|
|
|
|
|
|
|
|
|
|
|
|
|
|
|
|
|
|
|
|
|
|
|
|
|
|
|
|
|
|
|
|
|
|
|
|
|
|
|
|
|
|
|
|
|
|
|
|
|
|
|
|
|
|
|
|
|
|
|
|
Total
|
|
¥
|
|
|
|
¥
|
(
|
)
|
|
¥
|
|
|
|
¥
|
|
|
|
¥
|
(
|
)
|
|
¥
|
|
|
|
¥
|
|
|
|
¥
|
|
|
|
¥
|
(
|
)
|
|
¥
|
|
|
|
|
|
|
|
|
|
|
|
|
|
|
|
|
|
|
|
|
|
|
|
|
|
|
|
|
|
|
|
|
|
|
|
|
|
|
|
|
|
|
|
|
F-
50
NOMURA HOLDINGS, INC.
NOTES TO THE CONSOLIDATED FINANCIAL STATEMENTS—(Continued)
|
|
|
|
Billions of yen
|
|||||||||||||||||||||||||||||||||||||
|
|
|
|
Year ended March 31, 2020
|
|||||||||||||||||||||||||||||||||||||
|
|
Balance
as of
April 1,
2019
|
|
Total gains
(losses)
recognized
in net revenue
(1)
|
|
Total gains
(losses)
recognized in
other
comprehensive
income
|
|
Purchases
/ issues
(2)
|
|
Sales /
redemptions
(2)
|
|
Settlements
|
|
Foreign
exchange
movements
|
|
Transfers
into
Level 3
(4)(5)
|
|
Transfers
out of
Level 3
(5)
|
|
Balance
as of
March 31,
2020
|
|
||||||||||||||||||||
|
Assets:
|
|
|
|
|
|
|
|
|
|
|
||||||||||||||||||||||||||||||
|
Trading assets and private equity and debt investments
|
|
|
|
|
|
|
|
|
|
|
||||||||||||||||||||||||||||||
|
Equities
|
¥ |
|
¥ |
(
|
) | ¥ |
|
¥ |
|
¥ |
(
|
) | ¥ |
|
¥ |
|
¥ |
|
¥ |
(
|
) | ¥ |
|
|||||||||||||||||
|
Private equity and debt investments
|
|
|
|
|
(
|
) |
|
(
|
) |
|
|
|
||||||||||||||||||||||||||||
|
Japanese agency and municipal securities
|
|
|
|
|
|
|
|
|
|
|
||||||||||||||||||||||||||||||
|
Foreign government, agency and municipal securities
|
|
|
|
|
(
|
) |
|
|
|
(
|
) |
|
||||||||||||||||||||||||||||
|
Bank and corporate debt securities and loans for
|
|
(
|
) |
|
|
(
|
) |
|
(
|
) |
|
(
|
) |
|
||||||||||||||||||||||||||
|
Commercial mortgage-backed securities (“CMBS”)
|
|
(
|
) |
|
|
(
|
) |
|
|
|
|
|
||||||||||||||||||||||||||||
|
Residential mortgage-backed securities (“RMBS”)
|
|
(
|
) |
|
|
(
|
) |
|
|
|
(
|
) |
|
|||||||||||||||||||||||||||
|
Real estate-backed securities
|
|
|
|
|
(
|
) |
|
(
|
) |
|
|
|
||||||||||||||||||||||||||||
|
Collateralized debt obligations (“CDOs”) and other
|
|
(
|
) |
|
|
(
|
) |
|
(
|
) |
|
(
|
) |
|
||||||||||||||||||||||||||
|
Investment trust funds and other
|
|
|
|
|
(
|
) |
|
|
|
|
|
|||||||||||||||||||||||||||||
|
Total trading assets and private equity and debt investments
|
|
(
|
) |
|
|
(
|
) |
|
(
|
) |
|
(
|
) |
|
||||||||||||||||||||||||||
|
Derivatives, net
(3)
|
|
|
|
|
|
|
|
|
|
|
||||||||||||||||||||||||||||||
|
Equity contracts
|
(
|
) |
|
|
|
|
(
|
) |
|
|
(
|
) |
|
|||||||||||||||||||||||||||
|
Interest rate contracts
|
(
|
) |
|
|
|
|
(
|
) |
|
(
|
) |
|
(
|
) | ||||||||||||||||||||||||||
|
Credit contracts
|
(
|
) |
|
|
|
|
|
|
(
|
) |
|
(
|
) | |||||||||||||||||||||||||||
|
Foreign exchange contracts
|
|
(
|
) |
|
|
|
|
(
|
) |
|
|
|
||||||||||||||||||||||||||||
|
Commodity contracts
|
|
|
|
|
|
|
|
|
|
|
||||||||||||||||||||||||||||||
|
Total derivatives, net
|
(
|
) |
|
|
|
|
(
|
) |
(
|
) |
|
|
(
|
) | ||||||||||||||||||||||||||
|
Subtotal
|
¥ |
|
¥ |
(
|
) | ¥ |
|
¥ |
|
¥ |
(
|
) | ¥ |
(
|
) | ¥ |
(
|
) | ¥ |
|
¥ |
(
|
) | ¥ |
|
|||||||||||||||
|
Loans and receivables
|
¥ |
|
¥ |
|
¥ |
|
¥ |
|
¥ |
(
|
) | ¥ |
|
¥ |
(
|
) | ¥ |
|
¥ |
(
|
) | ¥ |
|
|||||||||||||||||
|
Collateralized agreements
|
|
|
|
|
(
|
) |
|
(
|
) |
|
|
|
||||||||||||||||||||||||||||
|
Other assets
|
|
|
|
|
|
|
|
|
|
|
||||||||||||||||||||||||||||||
|
Other
|
|
(
|
) |
|
|
(
|
) |
|
(
|
) |
|
|
|
|||||||||||||||||||||||||||
|
Total
|
¥ |
|
¥ |
(
|
) | ¥ |
|
¥ |
|
¥ |
(
|
) | ¥ |
(
|
) | ¥ |
(
|
) | ¥ |
|
¥ |
(
|
) | ¥ |
|
|||||||||||||||
|
Liabilities:
|
|
|
|
|
|
|
|
|
|
|
||||||||||||||||||||||||||||||
|
Trading liabilities
|
|
|
|
|
|
|
|
|
|
|
||||||||||||||||||||||||||||||
|
Equities
|
¥ |
|
¥ |
|
¥ |
|
¥ |
|
¥ |
|
¥ |
|
¥ |
|
¥ |
|
¥ |
|
¥ |
|
||||||||||||||||||||
|
Foreign government, agency and municipal securities
|
|
|
|
|
|
|
|
|
|
|
||||||||||||||||||||||||||||||
|
Bank and corporate debt securities
|
|
(
|
) |
|
|
(
|
) |
|
|
|
|
|
||||||||||||||||||||||||||||
|
Collateralized debt obligations (“CDOs”) and other
|
|
|
|
|
(
|
) |
|
|
|
|
|
|||||||||||||||||||||||||||||
|
Investment trust funds and other
|
|
|
|
|
|
|
|
|
|
|
||||||||||||||||||||||||||||||
|
Total trading liabilities
|
¥ |
|
¥ |
(
|
) | ¥ |
|
¥ |
|
¥ |
(
|
) | ¥ |
|
¥ |
|
¥ |
|
¥ |
|
¥ |
|
||||||||||||||||||
|
Short-term borrowings
|
|
|
|
|
(
|
) |
|
|
|
(
|
) |
|
||||||||||||||||||||||||||||
|
Payables and deposits
|
|
|
|
|
|
|
|
|
(
|
) |
|
|||||||||||||||||||||||||||||
|
Long-term borrowings
|
|
|
|
|
(
|
) |
|
(
|
) |
|
(
|
) |
|
|||||||||||||||||||||||||||
|
Other liabilities
|
|
(
|
) |
|
|
(
|
) |
|
|
|
|
|
||||||||||||||||||||||||||||
|
Total
|
¥ |
|
¥ |
(
|
) | ¥ |
|
¥ |
|
¥ |
(
|
) | ¥ |
|
¥ |
(
|
) | ¥ |
|
¥ |
(
|
) | ¥ |
|
||||||||||||||||
| (1) |
Includes gains and losses reported primarily within
Net gain on trading, Gain on private equity and debt investments,
Gain (loss) on investments in equity securities, Revenue—Other
Non-interest expenses—Other, Interest and dividends
Interest expense
|
F-
51
NOMURA HOLDINGS, INC.
NOTES TO THE CONSOLIDATED FINANCIAL STATEMENTS—(Continued)
| (2) |
Amounts reported in
Purchases / issues
Sales / redemptions
|
| (3) | Each derivative classification includes derivatives with multiple risk underlyings. For example, interest rate contracts include complex derivatives referencing interest rate risk as well as foreign exchange risk or other factors such as prepayment rates. Credit contracts include credit default swaps as well as derivatives referencing corporate and government debt securities. |
| (4) |
Amounts of gains and losses on these transfers which were recognized in the period when the
Transfers into Level 3
|
| (5) |
Transfers into Level 3
Transfers out of Level 3
Quantitative and qualitative information regarding significant unobservable inputs
|
Unrealized gains and losses recognized for Level 3 financial instruments
The following table presents the amounts of unrealized gains (losses) for the years ended March 31, 2019 and 2020, relating to those financial instruments which Nomura classified in Level 3 within the fair value hierarchy and that were still held by Nomura at the relevant consolidated balance sheet date.
|
|
Billions of yen
|
|||||||
|
March 31
|
||||||||
|
2019
|
|
2020
|
|
|||||
|
Unrealized gains/(losses)
(1)
|
||||||||
|
Assets:
|
|
|
||||||
|
Trading assets and private equity and debt investments
|
|
|
||||||
|
Equities
|
¥ |
(
|
) | ¥ |
(
|
) | ||
|
Private equity and debt investments
|
(
|
) |
|
|||||
|
Japanese agency and municipal securities
|
|
|
||||||
|
Foreign government, agency and municipal securities
|
|
(
|
) | |||||
|
Bank and corporate debt securities and loans for trading purposes
|
|
(
|
) | |||||
|
Commercial mortgage-backed securities (“CMBS”)
|
|
(
|
) | |||||
|
Residential mortgage-backed securities (“RMBS”)
|
|
(
|
) | |||||
|
Real estate-backed securities
|
|
|
||||||
|
Collateralized debt obligations (“CDOs”) and other
|
(
|
) |
(
|
) | ||||
|
Investment trust funds and other
|
|
|
||||||
|
Total trading assets and private equity and debt investments
|
(
|
) |
(
|
) | ||||
|
Derivatives, net
(2)
|
|
|
||||||
|
Equity contracts
|
(
|
) |
|
|||||
|
Interest rate contracts
|
(
|
) |
(
|
) | ||||
|
Credit contracts
|
(
|
) |
|
|||||
|
Foreign exchange contracts
|
(
|
) |
(
|
) | ||||
|
Commodity contracts
|
|
|
||||||
|
Total derivatives, net
|
(
|
) |
(
|
) | ||||
|
Subtotal
|
¥ |
(
|
) | ¥ |
(
|
) | ||
|
Loans and receivables
|
|
(
|
) | |||||
|
Collateralized agreements
|
|
|
||||||
|
Other assets
|
|
|
||||||
|
Other
|
(
|
) |
(
|
) | ||||
|
Total
|
¥ |
(
|
) | ¥ |
(
|
) | ||
F-
52
NOMURA HOLDINGS, INC.
NOTES TO THE CONSOLIDATED FINANCIAL STATEMENTS—(Continued)
|
|
Billions of yen
|
|||||||
|
March 31
|
||||||||
|
2019
|
|
2020
|
|
|||||
|
Unrealized gains/(losses)
(1)
|
||||||||
|
Liabilities
:
|
|
|
||||||
|
Trading liabilities
|
|
|
||||||
|
Equities
|
¥ |
|
¥ |
|
||||
|
Foreign government, agency and municipal securities
|
|
|
||||||
|
Bank and corporate debt securities
|
|
(
|
) | |||||
|
Collateralized debt obligations (“CDOs”) and other
|
|
|
||||||
|
Total trading liabilities
|
¥ |
|
¥ |
(
|
) | |||
|
Short-term borrowings
|
(
|
) |
|
|||||
|
Payables and deposits
|
(
|
) |
|
|||||
|
Long-term borrowings
|
(
|
) |
|
|||||
|
Total
|
¥ |
(
|
) | ¥ |
|
|||
| (1) |
Includes gains and losses reported within
Net gain on trading, Gain on private equity and debt investments
Gain on investments in equity securities, Revenue—Other
Non-interest expenses—Other, Interest and dividends
Interest expense
|
| (2) | Each derivative classification includes derivatives with multiple risk underlyings. For example, interest rate contracts include complex derivatives referencing interest rate risk as well as foreign exchange risk or other factors such as prepayment rates. Credit contracts include credit default swaps as well as derivatives referencing corporate and government debt securities. |
F-
53
NOMURA HOLDINGS, INC.
NOTES TO THE CONSOLIDATED FINANCIAL STATEMENTS—(Continued)
Investments in investment funds that calculate NAV per share
In the normal course of business, Nomura invests in
non-consolidated
funds which meet the definition of investment companies or are similar in nature and which do not have readily determinable fair values. For certain of these investments, Nomura uses NAV per share as the basis for valuation as a practical expedient. Some of these investments are redeemable at different amounts from NAV per share.
The following tables present information on these investments where NAV per share is calculated or disclosed as of March 31, 2019 and 2020. Investments are presented by major category relevant to the nature of Nomura’s business and risks.
|
|
Billions of yen
|
|||||||||||||||
|
|
March 31, 2019
|
|||||||||||||||
|
|
Fair value
|
|
Unfunded
commitments
(1)
|
|
Redemption frequency
(if currently eligible)
(2)
|
|
Redemption notice
(3)
|
|
||||||||
|
Hedge funds
|
¥ |
|
¥ |
|
|
day-
days
|
||||||||||
|
Venture capital funds
|
|
|
|
|
||||||||||||
|
Private equity funds
|
|
|
|
|
||||||||||||
|
Real estate funds
|
|
|
|
|
||||||||||||
|
Total
|
¥ |
|
¥ |
|
|
|
||||||||||
|
|
Billions of yen
|
|||||||||||||||
|
|
March 31, 2020
|
|||||||||||||||
|
|
Fair value
|
|
Unfunded
commitments
(1)
|
|
Redemption frequency
(if currently eligible)
(2)
|
|
Redemption notice
(3)
|
|
||||||||
|
Hedge funds
|
¥ |
|
¥ |
|
|
day-
days
|
||||||||||
|
Venture capital funds
|
|
|
|
|
||||||||||||
|
Private equity funds
|
|
|
|
|
||||||||||||
|
Real estate funds
|
|
|
|
|
||||||||||||
|
Total
|
¥ |
|
¥ |
|
|
|
||||||||||
| (1) | The contractual amount of any unfunded commitments Nomura is required to make to the entities in which the investment is held. |
| (2) | The range in frequency with which Nomura can redeem investments. |
| (3) | The range in notice period required to be provided before redemption is possible. |
Hedge funds:
These investments include funds of funds that invest in multiple asset classes. The fair values of these investments are determined using NAV per share. Although most of these funds can be redeemed within six months, certain funds cannot be redeemed within six months due to contractual, liquidity or gating issues. The redemption period is unknown for certain suspended or liquidating funds. Some of these investments contain restrictions against transfers of the investments to third parties.
Venture capital funds:
These investments include primarily
start-up
funds. The fair values of these investments are determined using NAV per share. Most of these funds cannot be redeemed within six months. The redemption period is
F-5
4
NOMURA
HOLDINGS, INC.
NOTES TO THE CONSOLIDATED FINANCIAL STATEMENTS—(Continued)
unknown for certain suspended or liquidating funds. Some of these investments contain restrictions against transfers of the investments to third parties.
Private equity funds:
These investments are made mainly in various sectors in Europe, U.S. and Japan. The fair values of these investments are determined using NAV per share. Redemption is restricted for most of these investments. Some of these investments contain restrictions against transfers of the investments to third parties.
Real estate funds:
These are investments in commercial and other types of real estate. The fair values of these investments are determined using NAV per share. Redemption is restricted for most of these investments. Some of these investments contain restrictions against transfers of the investments to third parties.
Fair value option for financial assets and financial liabilities
Nomura measures certain eligible financial assets and liabilities at fair value through the election of the fair value option permitted by ASC 815 “
Derivatives and Hedging
” and ASC 825 “
Financial Instruments
.” When Nomura elects the fair value option for an eligible item, changes in that item’s fair value are recognized through earnings. Election of the fair value option is generally irrevocable unless an event occurs that gives rise to a new basis of accounting for that instrument.
The financial assets and financial liabilities primarily elected for the fair value option by Nomura, and the reasons for the election, are as follows:
| • |
Equity method investments reported within
Trading assets and private equity and debt investments
Other assets
|
| • |
Loans reported within
Loans and receivables
|
| • |
Reverse repurchase and repurchase agreements reported within
Collateralized agreements
Collateralized financing
|
| • |
All structured notes issued on or after April 1, 2008 reported within
Short-term borrowings
Long-term borrowings
|
F-5
5
NOMURA HOLDINGS,
INC
.
NOTES TO THE CONSOLIDATED FINANCIAL STATEMENTS—(Continued)
|
|
•
|
Certain structured deposit issuances reported within
Deposits received at banks.
|
|
|
•
|
Financial liabilities reported within
Long-term borrowings
|
|
|
•
|
Financial reinsurance contracts reported within
Other assets
|
Interest and dividends arising from financial instruments for which the fair value option has been elected are recognized within
or
.
Interest and dividends, Interest expense
Net gain on trading
The following table presents gains (losses) due to changes in fair value for financial instruments measured at fair value using the fair value option for the years ended March 31, 2018, 2019 and 2020.
|
|
Billions of yen
|
|||||||||||
|
|
Year ended March 31
|
|||||||||||
|
|
2018
|
|
2019
|
|
2020
|
|
||||||
|
|
Gains/(Losses)
(1)
|
|||||||||||
|
Assets:
|
|
|
|
|||||||||
|
Trading assets and private equity and debt investments
(2)
|
|
|
|
|||||||||
|
Trading assets
|
¥ |
|
¥ |
|
¥ |
|
||||||
|
Private equity and debt investments
|
(
|
) |
|
(
|
) | |||||||
|
Loans and receivables
|
(
|
) |
(
|
) |
|
|||||||
|
Collateralized agreements
(3)
|
|
|
|
|||||||||
|
Other assets
(2)
|
|
(
|
) |
(
|
) | |||||||
|
Total
|
¥ |
(
|
) | ¥ |
(
|
) | ¥ |
(
|
) | |||
|
Liabilities:
|
|
|
|
|||||||||
|
Short-term borrowings
(4)
|
¥ |
(
|
) | ¥ |
|
¥ |
|
|||||
|
Collateralized financing
(3)
|
|
|
(
|
) | ||||||||
|
Long-term borrowings
(4)(5)
|
(
|
) |
(
|
) |
|
|||||||
|
Other liabilities
(6)
|
(
|
) |
|
|
||||||||
|
Total
|
¥ |
(
|
) | ¥ |
(
|
) | ¥ |
|
||||
| (1) |
Includes gains and losses reported primarily within
Net gain on trading
Revenue—Other
|
| (2) | Includes equity investments that would have been accounted for under the equity method had Nomura not chosen to elect the fair value option. |
| (3) | Includes reverse repurchase and repurchase agreements. |
| (4) | Includes structured notes and other financial liabilities. |
| (5) | Includes secured financing transactions arising from transfers of financial assets which did not meet the criteria for sales accounting. |
| (6) | Includes unfunded written loan commitments. |
F-5
6
NOMURA HOLDINGS, INC.
NOTES TO THE CONSOLIDATED FINANCIAL STATEMENTS—(Continued)
As of March 31, 2019 and 2020, Nomura held an economic interest of
39.52
% and
39.19
% in American Century Companies, Inc., respectively. The investment is measured at fair value on a recurring basis through election of the fair value option and is reported within
in the consolidated balance sheets
Other assets—Other
.
There was no significant impact on financial assets for which the fair value option was elected attributable to instrument-specific credit risk.
Nomura calculates the impact of changes in its own creditworthiness on certain financial liabilities for which the fair value option is elected by DCF valuation techniques using a rate which incorporates observable changes in its credit spread.
The following table presents changes in the valuation adjustment for Nomura’s own credit worthiness applied to certain financial liabilities for which the fair value option has been elected recognized in other comprehensive income during the years and cumulatively, and amounts reclassified to earnings from accumulated other comprehensive income on early settlement of such financial liabilities during the years ended March 31, 2019 and 2020. In the year ended March 31, 2020, the credit balance recognized in accumulated other comprehensive income related to Nomura’s own credit on certain financial liabilities increased, primarily due to a significant widening of spreads driven by the financial market turmoil
as
a
r
of the
e
sult
COVID-19
global pandemic.
|
|
Billions of Yen
|
|||||||
|
|
Year ended March 31
|
|||||||
|
|
2019
|
|
2020
|
|
||||
|
Changes recognized as a credit (debit) to other comprehensive income
|
¥ |
|
¥ |
|
||||
|
Credit (debit) amounts reclassified to earnings
|
(
|
) |
(
|
) | ||||
|
Cumulative credit (debit) balance recognized in accumulated other comprehensive income
|
|
|
||||||
As of March 31, 2019, the fair value of the aggregate unpaid principal balance (which is contractually principally protected) of
for which the fair value option was elected was ¥
0
billion more than the principal balance of such
. The fair value of the aggregate unpaid principal balance (which is contractually principally protected) of
for which the fair value option was elected was ¥
50
Loans and receivables
Loans and receivables
Long-term borrowings
billion less than the principal balance of such
. There were no
for which the fair value option was elected that
were 90 days or more past due.
Long-term borrowings
Loans and receivables
As of March 31, 2020, the fair value of the aggregate unpaid principal balance (which is contractually principally protected) of
for which the fair value option was elected was ¥
8
billion less than the principal balance of such
. The fair value of the aggregate unpaid principal balance (which is contractually principally protected) of
for which the fair value option was elected was ¥
27
Loans and receivables
Loans and receivables
Long-term borrowings
billion less than the principal balance of such
. There were no
for which the fair value option was elected that
were 90 days or more past due.
Long-term borrowings
Loans and receivables
Investment by Investment companies
Nomura carries all of investments by investment companies under ASC 946 “
Financial Services—Investment Companies
” (“ASC 946”) at fair value, with changes in fair value recognized through the consolidated statements of income. During the year ended March 31, 2020, N-MEZ Investment Business Limited Partnership 1 was added as an investment company under ASC 946.
F-5
7
NOMURA HOLDINGS, INC.
NOTES TO THE CONSOLIDATED FINANCIAL STATEMENTS—(Continued)
Concentrations of credit risk
Concentrations of credit risk may arise from trading, securities financing transactions and underwriting activities, and may be impacted by changes in political or economic factors. Nomura has credit risk concentrations on bonds issued by the Japanese Government, U.S. Government, British Government (“U.K.”), Governments within the European Union (“EU”), their states and municipalities, and their agencies. These concentrations generally arise from taking trading positions and are reported within
16
% of total assets as of March 31, 2019 and
16
% as of March 31, 2020.
Trading assets
in the consolidated balance sheets. Government, agency and municipal securities, including
Securities pledged as collateral
, represented
The following tables present geographic allocations of Nomura’s trading assets related to government, agency and municipal securities as of March 31, 2019 and 2020. See Note 3 “
” for further information regarding the concentration of credit risk for derivatives.
Derivative instruments and hedging activities
|
|
Billions of yen
|
|||||||||||||||||||
|
March 31, 2019
|
||||||||||||||||||||
|
Japan
|
|
U.S.
|
|
EU & U
.
K
.
|
|
Other
|
|
Total
(1)
|
|
|||||||||||
|
Government, agency and municipal securities
|
¥ |
|
¥ |
|
¥ |
|
¥ |
|
¥ |
|
||||||||||
|
|
Billions of yen
|
|||||||||||||||||||
|
March 31, 2020
|
||||||||||||||||||||
|
Japan
|
|
U.S.
|
|
EU & U
.
K
.
|
|
Other
|
|
Total
(1)
|
|
|||||||||||
|
Government, agency and municipal securities
|
¥ |
|
¥ |
|
¥ |
|
¥ |
|
¥ |
|
||||||||||
| (1) |
Other than above, there were ¥
Other assets—Non-trading debt securities
|
Estimated fair value of financial instruments not carried at fair value
Certain financial instruments are not carried at fair value on a recurring basis in the consolidated balance sheets since they are neither held for trading purposes nor are elected for the fair value option. These are typically carried at contractual amounts due or amortized cost.
The carrying value of the majority of the financial instruments detailed below will approximate fair value since they are short-term in nature and contain minimal credit risk. These financial instruments include financial assets reported within
and
and financial liabilities reported within
and
in the consolidated balance sheets.
Cash and cash equivalents, Time deposits, Deposits with stock exchanges and other segregated cash, Receivables from customers, Receivables from other than customers, Securities purchased under agreements to resell
Securities borrowed
Short-term borrowings, Payables to customers, Payables to other than customers, Deposits received at banks, Securities sold under agreements to repurchase, Securities loaned
Other secured borrowings
The estimated fair values of other financial instruments which are longer-term in nature or may contain more than minimal credit risk may be different to their carrying value. Financial assets of this type primarily include certain loans which are reported within
while financial liabilities primarily include long-term borrowings which are reported within
.
Loans receivable
Long-term borrowings
F-5
8
NOMURA HOLDINGS, INC.
NOTES TO THE CONSOLIDATED FINANCIAL STATEMENTS—(Continued)
The following tables present carrying values, fair values and classification within the fair value hierarchy for certain classes of financial instrument of which a portion of the ending balance was carried at fair value as of March 31, 2019 and 2020.
|
|
Billions of yen
|
|||||||||||||||||||
|
|
March 31, 2019
(1)
|
|||||||||||||||||||
|
|
|
|
|
|
Fair value by level
|
|||||||||||||||
|
|
Carrying
value
|
|
Fair
value |
|
Level 1
|
|
Level 2
|
|
Level 3
|
|
||||||||||
|
Assets:
|
|
|
|
|
|
|||||||||||||||
|
Cash and cash equivalents
|
¥ |
|
¥ |
|
¥ |
|
¥ |
|
¥ |
|
||||||||||
|
Time deposits
|
|
|
|
|
|
|||||||||||||||
|
Deposits with stock exchanges and other segregated cash
|
|
|
|
|
|
|||||||||||||||
|
Loans receivable
(2)
|
|
|
|
|
|
|||||||||||||||
|
Securities purchased under agreements to resell
|
|
|
|
|
|
|||||||||||||||
|
Securities borrowed
|
|
|
|
|
|
|||||||||||||||
|
Total
|
¥ |
|
¥ |
|
¥ |
|
¥ |
|
¥ |
|
||||||||||
|
Liabilities:
|
|
|
|
|
|
|||||||||||||||
|
Short-term borrowings
|
¥ |
|
¥ |
|
¥ |
|
¥ |
|
¥ |
|
||||||||||
|
Deposits received at banks
|
|
|
|
|
|
|||||||||||||||
|
Securities sold under agreements to repurchase
|
|
|
|
|
|
|||||||||||||||
|
Securities loaned
|
|
|
|
|
|
|||||||||||||||
|
Long-term borrowings
|
|
|
|
|
|
|||||||||||||||
|
Total
|
¥ |
|
¥ |
|
¥ |
|
¥ |
|
¥ |
|
||||||||||
|
|
Billions of yen
|
|||||||||||||||||||
|
|
March 31, 2020
(1)
|
|||||||||||||||||||
|
|
|
|
|
|
Fair value by level
|
|||||||||||||||
|
|
Carrying
value
|
|
Fair
value |
|
Level 1
|
|
Level 2
|
|
Level 3
|
|
||||||||||
|
Assets:
|
|
|
|
|
|
|||||||||||||||
|
Cash and cash equivalents
|
¥ |
|
¥ |
|
¥ |
|
¥ |
|
¥ |
|
||||||||||
|
Time deposits
|
|
|
|
|
|
|||||||||||||||
|
Deposits with stock exchanges and other segregated cash
|
|
|
|
|
|
|||||||||||||||
|
Loans receivable
(2)
|
|
|
|
|
|
|||||||||||||||
|
Securities purchased under agreements to resell
|
|
|
|
|
|
|||||||||||||||
|
Securities borrowed
|
|
|
|
|
|
|||||||||||||||
|
Total
|
¥ |
|
¥ |
|
¥ |
|
¥ |
|
¥ |
|
||||||||||
|
Liabilities:
|
|
|
|
|
|
|||||||||||||||
|
Short-term borrowings
|
¥ |
|
¥ |
|
¥ |
|
¥ |
|
¥ |
|
||||||||||
|
Deposits received at banks
|
|
|
|
|
|
|||||||||||||||
|
Securities sold under agreements to repurchase
|
|
|
|
|
|
|||||||||||||||
|
Securities loaned
|
|
|
|
|
|
|||||||||||||||
|
Other secured borrowings
|
|
|
|
|
|
|||||||||||||||
|
Long-term borrowings
|
|
|
|
|
|
|||||||||||||||
|
Total
|
¥ |
|
¥ |
|
¥ |
|
¥ |
|
¥ |
|
||||||||||
F-5
9
NOMURA HOLDINGS, INC.
NOTES TO THE CONSOLIDATED FINANCIAL STATEMENTS—(Continued)
| (1) | Includes financial instruments which are carried at fair value on a recurring basis. |
| (2) | Carrying values are shown after deducting relevant allowances for credit losses. |
Assets and liabilities measured at fair value on a nonrecurring basis
In addition to financial instruments carried at fair value on a recurring basis, Nomura also measures other financial and
non-financial
assets and liabilities at fair value on a nonrecurring basis, where the primary measurement basis is not fair value. Fair value is only used in specific circumstances after initial recognition such as to measure impairment.
As of March 31, 2019, goodwill allocated to the Wholesale segment was measured at fair value on a nonrecurring basis. The relevant goodwill, which is reported within
in the consolidated balance sheets, was wholly impaired. Fair value was determined using a DCF valuation technique and consequently, this nonrecurring fair value measurement was determined using valuation inputs which would be classified in Level 3 of the fair value hierarchy. See Note 10 “
” for further information.
Other assets—Other
Other assets—Other/Other liabilities
As of March 31, 2020, there were no significant amount of assets and liabilities which were measured at fair value on a nonrecurring basis.
3. Derivative instruments and hedging activities:
Nomura uses a variety of derivative financial instruments, including futures, forwards, options and swaps, for both trading and
non-trading
purposes.
Derivatives used for trading purposes
In the normal course of business, Nomura enters into transactions involving derivative financial instruments to meet client needs, for trading purposes, and to reduce its own exposure to loss due to adverse fluctuations in interest rates, currency exchange rates and market prices of securities. These financial instruments include contractual agreements such as commitments to swap interest payment streams, exchange currencies or purchase or sell securities and other financial instruments on specific terms at specific future dates.
Nomura maintains active trading positions in a variety of derivative financial instruments. Most of Nomura’s trading activities are client oriented. Nomura utilizes a variety of derivative financial instruments as a means of bridging clients’ specific financial needs and investors’ demands in the securities markets. Nomura also actively trades securities and various derivatives to assist its clients in adjusting their risk profiles as markets change. In performing these activities, Nomura carries an inventory of capital markets instruments and maintains its access to market liquidity by quoting bid and offer prices to and trading with other market makers. These activities are essential to provide clients with securities and other capital market products at competitive prices.
Futures and forward contracts are commitments to either purchase or sell securities, foreign currency or other capital market instruments at a specific future date for a specified price and may be settled in cash or through delivery. Foreign exchange contracts include spot and forward contracts and involve the exchange of two currencies at a rate agreed by the contracting parties. Risks arise from the possible inability of counterparties to meet the terms of their contracts and from movements in market prices. Futures contracts are executed through regulated exchanges which clear and guarantee performance of counterparties. Accordingly, credit risk associated with futures contracts is considered minimal. In contrast, forward contracts are generally negotiated between two counterparties and, therefore, are subject to the performance of the related counterparties.
F-
60
NOMURA HOLDINGS, INC.
NOTES TO THE CONSOLIDATED FINANCIAL STATEMENTS—(Continued)
Options are contracts that grant the purchaser, for a premium payment, the right to either purchase or sell a financial instrument at a specified price within a specified period of time or on a specified date from or to the writer of the option. The writer of options receives premiums and bears the risk of unfavorable changes in the market price of the financial instruments underlying the options.
Swaps are contractual agreements in which two counterparties agree to exchange certain cash flows, at specified future dates, based on an agreed contract. Certain agreements may result in combined interest rate and foreign currency exposures. Entering into swap agreements may involve the risk of credit losses in the event of counterparty default.
To the extent these derivative financial instruments are economically hedging financial instruments or securities positions of Nomura, the overall risk of loss may be fully or partly mitigated by the hedged position.
Nomura seeks to minimize its exposure to market risk arising from its use of these derivative financial instruments through various control policies and procedures, including position limits, monitoring procedures and hedging strategies whereby Nomura enters into offsetting or other positions in a variety of financial instruments.
Derivatives used for
non-trading
purposes
Nomura’s principal objectives in using derivatives for
non-trading
purposes are to manage interest rate risk, to modify the interest rate characteristics of certain financial liabilities, to manage foreign exchange risk of certain foreign currency denominated debt securities, to manage net investment exposure to fluctuations in foreign exchange rates arising from certain foreign operations and to mitigate equity price risk arising from certain stock-based compensation awards given to employees.
Credit risk associated with derivatives utilized for
non-trading
purposes is controlled and managed in the same way as credit risk associated with derivatives utilized for trading purposes.
Nomura designates certain derivative financial instruments as fair value hedges of interest rate risk arising from specific financial liabilities and foreign currency risk arising from specific foreign currency denominated debt securities. These derivatives are effective in reducing the risk associated with the exposure being hedged and are highly correlated with changes in the fair value and foreign currency rates of the underlying hedged items, both at inception and throughout the life of the hedging relationship. Changes in fair value of the hedging derivatives are reported together with those of the hedged liabilities and assets through the consolidated statements of income within
and
, respectively
Interest expense
Revenue—Other
Derivative financial instruments designated as hedges of the net investment in foreign operations relate to specific subsidiaries with
. All other movements in fair value of highly effective hedging derivatives are reported through NHI shareholders’ equity within
non-Japanese
Yen functional currencies. When determining the effectiveness of net investment hedges, the effective portion of the change in fair value of the hedging derivative is determined by changes in spot exchange rates. Changes in fair value of the hedging derivatives attributable to changes in the difference between the forward rate and spot rate are excluded from the measurement of hedge effectiveness and are reported in the consolidated statements of income within
Revenue—Other
Accumulated other comprehensive income (loss).
Concentrations of credit risk for derivatives
The following tables present Nomura’s significant concentration of exposures to credit risk in OTC derivatives with financial institutions including transactions cleared through central counterparties as of
F-
61
NOMURA HOLDINGS, INC.
NOTES TO THE CONSOLIDATED FINANCIAL STATEMENTS—(Continued)
March 31, 2019 and 2020. The gross fair value of derivative assets represents the maximum amount of loss due to credit risk that Nomura would incur if the counterparties of Nomura failed to perform in accordance with the terms of the instruments and any collateral or other security Nomura held in relation to those instruments proved to be of no value.
|
|
Billions of yen
|
|||||||||||||||
|
|
March 31, 2019
|
|||||||||||||||
|
|
Gross fair value of
derivative assets
|
|
Impact of
master netting
agreements
|
|
Impact of
collateral
|
|
Net exposure to
credit risk
|
|
||||||||
|
Financial institutions
|
¥ |
|
¥ |
(
|
) | ¥ |
(
|
) | ¥ |
|
||||||
|
|
Billions of yen
|
|||||||||||||||
|
|
March 31, 2020
|
|||||||||||||||
|
|
Gross fair value of
derivative assets
|
|
Impact of
master netting
agreements
|
|
Impact of
collateral
|
|
Net exposure to
credit risk
|
|
||||||||
|
Financial institutions
|
¥ |
|
¥ |
(
|
) | ¥ |
(
|
) | ¥ |
|
||||||
Derivative activities
The following tables quantify the volume of Nomura’s derivative activity as of March 31, 2019 and 2020 through a disclosure of notional amounts, in comparison with the fair value of those derivatives. All amounts are disclosed on a gross basis, prior to counterparty netting of derivative assets and liabilities and cash collateral netting against net derivatives.
|
|
|
|
Billions of yen
|
|||||||||
|
|
|
|
March 31, 2019
|
|||||||||
|
|
|
|
Derivative
assets
|
|
Derivative
liabilities
|
|
||||||
|
|
Total Notional
(1)
|
|
Fair value
|
|
Fair value
(1)
|
|
||||||
|
Derivatives used for trading and
non-trading
purposes
(2)(3)
:
|
|
|
|
|||||||||
|
Equity contracts
|
¥ |
|
¥ |
|
¥ |
|
||||||
|
Interest rate contracts
|
|
|
|
|||||||||
|
Credit contracts
|
|
|
|
|||||||||
|
Foreign exchange contracts
|
|
|
|
|||||||||
|
Commodity contracts
|
|
|
|
|||||||||
|
Total
|
¥ |
|
¥ |
|
¥ |
|
||||||
|
Derivatives designated as hedging instruments:
|
|
|
|
|||||||||
|
Interest rate contracts
|
¥ |
|
¥ |
|
¥ |
|
||||||
|
Foreign exchange contracts
|
|
|
|
|||||||||
|
Total
|
¥ |
|
¥ |
|
¥ |
|
||||||
|
Total derivatives
|
¥ |
|
¥ |
|
¥ |
|
||||||
F-
62
NOMURA HOLDINGS, INC.
NOTES TO THE CONSOLIDATED FINANCIAL STATEMENTS—(Continued)
|
|
|
|
Billions of yen
|
|||||||||
|
|
|
|
March 31, 2020
|
|||||||||
|
|
|
|
Derivative
assets
|
|
Derivative
liabilities
|
|
||||||
|
|
Total Notional
(1)
|
|
Fair value
|
|
Fair value
(1)
|
|
||||||
|
Derivatives used for trading and
non-trading
purposes
(2)(3)
:
|
|
|
|
|||||||||
|
Equity contracts
|
¥ |
|
¥ |
|
¥ |
|
||||||
|
Interest rate contracts
|
|
|
|
|||||||||
|
Credit contracts
|
|
|
|
|||||||||
|
Foreign exchange contracts
|
|
|
|
|||||||||
|
Commodity contracts
|
|
|
|
|||||||||
|
Total
|
¥ |
|
¥ |
|
¥ |
|
||||||
|
Derivatives designated as hedging instruments:
|
|
|
|
|||||||||
|
Interest rate contracts
|
¥ |
|
¥ |
|
¥ |
|
||||||
|
Foreign exchange contracts
|
|
|
|
|||||||||
|
Total
|
¥ |
|
¥ |
|
¥ |
|
||||||
|
Total derivatives
|
¥ |
|
¥ |
|
¥ |
|
||||||
| (1) | Includes the amount of embedded derivatives bifurcated in accordance with ASC 815. |
| (2) | Each derivative classification includes derivatives referencing multiple risk components. For example, interest rate contracts include complex derivatives referencing interest rate risk as well as foreign exchange risk or other factors such as prepayment rates. Credit contracts include credit default swaps as well as derivatives referencing corporate and government securities. |
| (3) |
As of March 31, 2019 and 2020, the amounts reported include derivatives used for
non-trading
purposes which are not designated as fair value or net investment hedges. These amounts have not been separately presented since such amounts were not significant.
|
Changes in fair value are recognized either through earnings or other comprehensive income depending on the purpose for which the derivatives are used.
Offsetting of derivatives
Counterparty credit risk associated with derivative financial instruments is controlled by Nomura through credit approvals, limits and monitoring procedures. To reduce the risk of loss, Nomura requires collateral, principally cash collateral and government securities, for certain derivative transactions. In certain cases, Nomura may agree for such collateral to be posted to a third-party custodian under a control agreement that enables Nomura to take control of such collateral in the event of counterparty default. From an economic standpoint, Nomura evaluates default risk exposure net of related collateral. Furthermore, OTC derivative transactions are typically documented under industry standard master netting agreements which reduce Nomura’s credit exposure to counterparties as they permit the
close-out
and offset of transactions and collateral amounts in the event of default of the counterparty. For certain OTC centrally-cleared and exchange-traded derivatives, the clearing or membership agreements entered into by Nomura provide similar rights to Nomura in the event of default of the relevant central clearing party or exchange. In order to support the enforceability of the
close-out
and offsetting rights within these agreements, Nomura generally seeks to obtain an external legal opinion.
For certain types of counterparties and in certain jurisdictions, Nomura may enter into derivative transactions which are not documented under a master netting agreement. Similarly, even when derivatives are
F-
63
NOMURA HOLDINGS, INC.
NOTES TO THE CONSOLIDATED FINANCIAL STATEMENTS—(Continued)
documented under such agreements, Nomura may not have yet sought evidence, or may not be able to obtain evidence to determine with sufficient certainty that
close-out
and offsetting rights are legally enforceable. This may be the case where relevant local laws specifically prohibit such
close-out
and offsetting rights, or where local laws are complex, ambiguous or silent on the enforceability of such rights. This may include derivative transactions executed with certain foreign governments, agencies, municipalities, central clearing counterparties, exchanges and pension funds.
Nomura considers the enforceability of a master netting agreement in determining how credit risk arising from transactions with a specific counterparty is hedged, how counterparty credit exposures are calculated and applied to credit limits and the extent and nature of collateral requirements from the counterparty.
Derivative assets and liabilities with the same counterparty documented under a master netting agreement are offset in the consolidated balance sheets where the specific criteria defined by ASC
” (“ASC
210-20
“
Balance Sheet—Offsetting
210-20”)
and ASC 815 are met. These criteria include requirements around the legal enforceability of such
close-out
and offset rights under the master netting agreement. In addition, fair value amounts recognized for the right to reclaim cash collateral (a receivable) and the obligation to return cash collateral (a payable) are also offset against net derivative liabilities and net derivative assets, respectively where certain additional criteria are met.
F-6
4
NOMURA HOLDINGS, INC.
NOTES TO THE CONSOLIDATED FINANCIAL STATEMENTS—(Continued)
The following table presents information about offsetting of derivatives and related collateral amounts in the consolidated balance sheets as of March 31, 2019 and 2020 by type of derivative contract, together with the extent to which master netting agreements entered into with counterparties, central clearing counterparties or exchanges permit additional offsetting of derivatives and collateral in the event of counterparty default. Derivative transactions which are not documented under a master netting agreement or are documented under a master netting agreement for which Nomura does not have sufficient evidence of enforceability are not offset in the following table.
|
|
Billions of yen
|
Billions of yen
|
||||||||||||||
|
|
March 31, 2019
|
March 31, 2020
|
||||||||||||||
|
|
Derivative
assets
|
|
Derivative
liabilities
(1)
|
|
Derivative
assets
|
|
Derivative
liabilities
(1)
|
|
||||||||
|
Equity contracts
|
|
|
|
|
||||||||||||
|
OTC settled bilaterally
|
¥ |
|
¥ |
|
¥ |
|
¥ |
|
||||||||
|
Exchange-traded
|
|
|
|
|
||||||||||||
|
Interest rate contracts
|
|
|
|
|
||||||||||||
|
OTC settled bilaterally
|
|
|
|
|
||||||||||||
|
OTC centrally-cleared
|
|
|
|
|
||||||||||||
|
Exchange-traded
|
|
|
|
|
||||||||||||
|
Credit contracts
|
|
|
|
|
||||||||||||
|
OTC settled bilaterally
|
|
|
|
|
||||||||||||
|
OTC centrally-cleared
|
|
|
|
|
||||||||||||
|
Exchange-traded
|
|
|
|
|
||||||||||||
|
Foreign exchange contracts
|
|
|
|
|
||||||||||||
|
OTC settled bilaterally
|
|
|
|
|
||||||||||||
|
Commodity contracts
|
|
|
|
|
||||||||||||
|
OTC settled bilaterally
|
|
|
|
|
||||||||||||
|
Exchange-traded
|
|
|
|
|
||||||||||||
|
Total gross derivative balances
(2)
|
¥ |
|
¥ |
|
¥ |
|
¥ |
|
||||||||
|
Less: Amounts offset in the consolidated balance sheets
(3)
|
(
|
) |
(
|
) |
(
|
) |
(
|
) | ||||||||
|
Total net amounts reported on the face of the consolidated balance sheets
(4)
|
¥ |
|
¥ |
|
¥ |
|
¥ |
|
||||||||
F-
65
NOMURA HOLDINGS, INC.
NOTES TO THE CONSOLIDATED FINANCIAL STATEMENTS—(Continued)
|
|
Billions of yen
|
Billions of yen
|
||||||||||||||
|
|
March 31, 2019
|
March 31, 2020
|
||||||||||||||
|
|
Derivative
assets
|
|
Derivative
liabilities
(1)
|
|
Derivative
assets
|
|
Derivative
liabilities
(1)
|
|
||||||||
|
Less: Additional amounts not offset in the consolidated balance sheets
(5)
|
|
|
|
|
||||||||||||
|
Financial instruments and
non-cash
collateral
|
¥ |
(
|
¥ |
(
|
¥ |
(
|
) | ¥ |
(
|
) | ||||||
|
Net amount
|
¥ |
|
¥ |
|
¥ |
|
¥ |
|
||||||||
|
(1)
|
Includes the amount of embedded derivatives bifurcated in accordance with ASC 815.
|
|
(2)
|
Includes all gross derivative asset and liability balances irrespective of whether they are transacted under a master netting agreement or whether Nomura has obtained sufficient evidence of enforceability of the master netting agreement. As of March 31, 2019, the gross balance of derivative assets and derivative liabilities which are not documented under master netting agreements or are documented under master netting agreements for which Nomura has not yet obtained sufficient evidence of enforceability was
¥
|
| (3) |
Represents amounts offset through counterparty netting of derivative assets and liabilities as well as cash collateral netting against net derivatives under master netting and similar agreements for which Nomura has obtained sufficient evidence of enforceability in accordance with ASC 815. As of March 31, 2019, Nomura offset a total of ¥
|
| (4) |
Net derivative assets and net derivative liabilities are generally reported within
Trading assets and private equity investments—Trading assets
Trading liabilities
Short-term borrowings
Long-term borrowings
|
| (5) |
Represents amounts which are not permitted to be offset on the face of the consolidated balance sheets in accordance with ASC
210-20
and ASC 815 but which provide Nomura with a legally enforceable right of offset in the event of counterparty default. Amounts relating to derivative and collateral agreements where Nomura has not yet obtained sufficient evidence of enforceability of such offsetting rights are excluded. As of March 31, 2019, a total of ¥
|
Derivatives used for trading purposes
Derivative financial instruments used for trading purposes, including bifurcated embedded derivatives, are carried at fair value with changes in fair value recognized through the consolidated statements of income within
.
Revenue—Net gain on trading
F-6
6
NOMURA HOLDINGS, INC.
NOTES TO THE CONSOLIDATED FINANCIAL STATEMENTS—(Continued)
The following table presents amounts included in the consolidated statements of income for the years ended March 31, 2018, 2019, 2020 related to derivatives used for trading and
non-trading
purposes by type of underlying derivative contract.
|
|
Billions of yen
|
|||||||||||
|
|
Year ended March 31
|
|||||||||||
|
|
2018
|
|
2019
|
|
2020
|
|
||||||
|
Derivatives used for trading and
non-trading
purposes
(1)(2)
:
|
|
|
|
|||||||||
|
Equity contracts
|
¥ |
|
¥ |
(
|
) | ¥ |
|
|||||
|
Interest rate contracts
|
(
|
) |
|
(
|
) | |||||||
|
Credit contracts
|
|
(
|
) |
(
|
) | |||||||
|
Foreign exchange contracts
|
|
(
|
) |
|
||||||||
|
Commodity contracts
|
|
|
(
|
) | ||||||||
|
Total
|
¥ |
|
¥ |
|
¥ |
(
|
) | |||||
| (1) | Each derivative classification includes derivatives referencing multiple risk components. For example, interest rates contracts include complex derivatives referencing interest rate risk as well as foreign exchange risk or other factors such as prepayment rates. Credit contracts include credit default swaps as well as derivatives referencing corporate and government securities. |
| (2) |
Includes net gains (losses) on derivatives used for
non-trading
purposes which are not designated as fair value or net investment hedges. For the years ended March 31, 2018, 2019 and 2020, these amounts have not been separately presented as net gains (losses) for these
non-trading
derivatives were not significant.
|
Fair value hedges
Nomura issues Japanese Yen and foreign currency denominated debt with both fixed and floating interest rates. Nomura generally enters into swap agreements to convert fixed rate interest payments on its debt obligations to a floating rate and applies fair value hedge accounting to these instruments.
The following table presents the carrying value of the hedged items that are currently designated in a hedging relationship and the related cumulative amount of fair value hedging adjustment included in the carrying amount of the hedged items as of March 31, 2019 and 2020.
|
Line items in the statement of financial
position in which the hedged item is included: |
Billions of yen
|
|||||||||||||||
|
Carrying amount of the hedged liabilities
|
Cumulative gains/(losses) of fair value hedging
adjustment included in the carrying amount of the hedged liabilities |
|||||||||||||||
|
March 31, 2019
|
|
March 31, 2020
|
|
March 31, 2019
|
|
March 31, 2020
|
|
|||||||||
|
Long-term borrowings
|
¥ |
|
¥ |
|
¥ |
(
|
¥ |
(
|
||||||||
|
Total
|
¥ |
|
¥ |
|
¥ |
(
|
¥ |
(
|
||||||||
Hedging derivatives designated as fair value hedges are carried at fair value attributable to the hedged risk, which is recognized in the consolidated statements of income within
and
, respectively together with the change in fair value of the hedged items.
Interest expense
Revenue-Other
F-6
7
NOMURA HOLDINGS, INC.
NOTES TO THE CONSOLIDATED FINANCIAL STATEMENTS—(Continued)
The following table presents amounts included in the consolidated statements of income for the years ended March 31, 2018, 2019 and 2020 related to derivatives designated as fair value hedges by type of underlying derivative contract and the nature of the hedged item.
|
|
Billions of yen
|
|||||||||||
|
|
Year ended March 31
|
|||||||||||
|
|
2018
|
|
2019
|
|
2020
|
|
||||||
|
Derivatives designated as hedging instruments:
|
|
|
|
|||||||||
|
Interest rate contracts
|
¥ |
(
|
) | ¥ |
|
¥ |
(
|
) | ||||
|
Foreign exchange contracts
|
|
|
|
|||||||||
|
Total
|
¥ |
|
¥ |
|
¥ |
(
|
) | |||||
|
|
Billions of yen
|
|||||||||||
|
|
Year ended March 31
|
|||||||||||
|
|
2018
|
|
2019
|
|
2020
|
|
||||||
|
Hedged items:
|
|
|
|
|||||||||
|
Long-term borrowings
|
¥ |
|
¥ |
(
|
) | ¥ |
|
|||||
|
Non-trading
debt securities
|
(
|
) |
|
|
||||||||
|
Total
|
¥ |
(
|
) | ¥ |
(
|
) | ¥ |
|
||||
Net investment hedges
Nomura designates foreign currency forwards, etc., as hedges of certain subsidiaries with significant foreign exchange risks and applies hedge accounting to these instruments. Accordingly, foreign exchange gains (losses) arising from the derivative contracts and
. This is offset by the foreign exchange adjustments arising from consolidation of the relevant foreign subsidiaries.
non-derivative
financial products designated as hedges, except for the portion excluded from effectiveness assessment,
are
recognized through the consolidated statements of comprehensive income within
Other comprehensive income (loss)—Change in cumulative translation adjustments, net of tax
The following table presents gains (losses) from derivatives designated as net investment hedges included in the consolidated statements of comprehensive income for the years ended March 31, 2018, 2019 and 2020.
|
|
Billions of yen
|
|||||||||||
|
|
Year ended March 31
|
|||||||||||
|
|
2018
|
|
2019
|
|
2020
|
|
||||||
|
Hedging instruments:
|
|
|
|
|||||||||
|
Foreign exchange contracts
|
¥ |
(
|
) | ¥ |
|
¥ |
|
|||||
|
Total
|
¥ |
(
|
) | ¥ |
|
¥ |
|
|||||
| (1) |
The portion of gains (losses) representing the amount of hedge ineffectiveness and the amount excluded from the assessment of hedge effectiveness are recognized within
Revenue—Other
|
F-6
8
NOMURA HOLDINGS, INC.
NOTES TO THE CONSOLIDATED FINANCIAL STATEMENTS—(Continued)
Derivatives containing credit risk related contingent features
Nomura enters into certain OTC derivatives and other agreements containing credit-risk-related contingent features. These features would require Nomura to post additional collateral or settle the instrument upon occurrence of a credit event, the most common of which would be a downgrade in the Company’s long-term credit rating.
The aggregate fair value of all derivative instruments with credit-risk-related contingent features that are in a liability position as of March 31, 2019, was ¥
486
billion with related collateral pledged of ¥
410
billion. In the event of a
3
billion.
one-notch
downgrade to Nomura’s long-term credit rating in effect as of March 31, 2019, the aggregate fair value of assets that would have been required to be posted as additional collateral or that would have been needed to settle the instruments immediately was ¥
The aggregate fair value of all derivative instruments with credit-risk-related contingent features that are in a liability position as of March 31, 2020, was ¥
750
billion with related collateral pledged of ¥
635
billion. In the event of a
3
billion.
one-notch
downgrade to Nomura’s long-term credit rating in effect as of March 31, 2020, the aggregate fair value of assets that would have been required to be posted as additional collateral or that would have been needed to settle the instruments immediately was ¥
Credit derivatives
Credit derivatives are derivative instruments in which one or more of their underlyings are related to the credit risk of a specified entity (or group of entities) or an index based on the credit risk of a group of entities that expose the seller of credit protection to potential loss from credit risk related events specified in the contract.
Written credit derivatives are instruments or embedded features where Nomura assumes third party credit risk, either as guarantor in a guarantee-type contract, or as the party that provides credit protection in an option-type contract, credit default swap, or any other credit derivative contract.
Nomura enters into credit derivatives as part of its normal trading activities as both purchaser and seller of protection for credit risk mitigation, proprietary trading positions and for client transactions.
The most significant type of credit derivatives used by Nomura are single-name credit default swaps where settlement of the derivative is based on the credit risk of a single third party. Nomura also writes credit derivatives linked to the performance of credit default indices and issues other credit risk related portfolio products.
Nomura would have to perform under a credit derivative contract if a credit event as defined in the respective contract occurs. Typical credit events include bankruptcy, failure to pay and restructuring of obligations of the reference asset.
Credit derivative contracts written by Nomura are either cash or physically settled. In cash-settled instruments, once payment is made upon an event of a default, the contract usually terminates with no further payments due. Nomura generally has no right to assume the reference assets of the counterparty in exchange for payment, nor does Nomura usually have any direct recourse to the actual issuers of the reference assets to recover the amount paid. In physically settled contracts, upon a default event, Nomura takes delivery of the reference asset in return for payment of the full notional amount of the contract.
Nomura actively monitors and manages its credit derivative exposures. Where protection is sold, risks may be mitigated by purchasing credit protection from other third parties either on identical underlying reference
F-6
9
NOMURA HOLDINGS, INC.
NOTES TO THE CONSOLIDATED FINANCIAL STATEMENTS—(Continued)
assets or on underlying reference assets with the same issuer which would be expected to behave in a correlated fashion. The most common form of recourse provision to enable Nomura to recover from third parties any amounts paid under a written credit derivative is therefore not through the derivative itself but rather through the separate purchase of credit derivatives with identical or correlated underlyings.
Nomura quantifies the value of these purchased contracts in the following tables in the column titled “Purchased Credit Protection”. These amounts represent purchased credit protection with identical underlyings to the written credit derivative contracts which act as a hedge against Nomura’s exposure. To the extent Nomura is required to pay out under the written credit derivative, a similar amount would generally become due to Nomura under the purchased hedge.
Credit derivatives have a stated notional amount which represents the maximum payment Nomura may be required to make under the contract. However, this is generally not a true representation of the amount Nomura will actually pay as in addition to purchased credit protection, other risk mitigating factors reduce the likelihood and amount of any payment, including:
The probability of default
The recovery value on the underlying asset
Nomura holds assets as collateral in relation to written credit derivatives. However, these amounts do not enable Nomura to recover any amounts paid under the credit derivative but rather mitigate the risk of economic loss arising from a counterparty defaulting against amounts due to Nomura under the contract. Collateral requirements are determined on a counterparty level rather than individual contract, and also generally cover all types of derivative contracts rather than just credit derivatives.
The following tables present information about Nomura’s written credit derivatives and purchased credit protection with identical underlyings as of March 31, 2019 and 2020.
|
|
Billions of yen
|
|||||||||||||||||||||||||||
|
|
March 31, 2019
|
|||||||||||||||||||||||||||
|
|
|
|
Maximum potential payout/Notional
|
Notional
|
|
|||||||||||||||||||||||
|
|
|
|
|
|
Years to maturity
|
Purchased
credit
protection
|
|
|||||||||||||||||||||
|
|
Carrying value
(Asset) / Liability
(1)
|
|
Total
|
|
Less than
1 year
|
|
1 to 3
years
|
|
3 to 5
years
|
|
More than
5 years
|
|
||||||||||||||||
|
Single-name credit default swaps
|
¥ |
(
|
) | ¥ |
|
¥ |
|
¥ |
|
¥ |
|
¥ |
|
¥ |
|
|||||||||||||
|
Credit default indices
|
(
|
) |
|
|
|
|
|
|
||||||||||||||||||||
|
Other credit risk related portfolio products
|
|
|
|
|
|
|
|
|||||||||||||||||||||
|
Credit-risk related options and swaptions
|
—
|
—
|
—
|
—
|
—
|
—
|
—
|
|||||||||||||||||||||
|
Total
|
¥ |
(
|
) | ¥ |
|
¥ |
|
¥ |
|
¥ |
|
¥ |
|
¥ |
|
|||||||||||||
F-
70
NOMURA HOLDINGS, INC.
NOTES TO THE CONSOLIDATED FINANCIAL STATEMENTS—(Continued)
|
|
Billions of yen
|
|||||||||||||||||||||||||||
|
|
March 31, 2020
|
|||||||||||||||||||||||||||
|
|
|
|
Maximum potential payout/Notional
|
Notional
|
|
|||||||||||||||||||||||
|
|
|
|
|
|
Years to maturity
|
Purchased
credit
protection
|
|
|||||||||||||||||||||
|
|
Carrying value
(Asset) / Liability
(1)
|
|
Total
|
|
Less than
1 year
|
|
1 to 3
years
|
|
3 to 5
years
|
|
More than
5 years
|
|
||||||||||||||||
|
Single-name credit default swaps
|
¥ |
|
¥ |
|
¥ |
|
¥ |
|
¥ |
|
¥ |
|
¥ |
|
||||||||||||||
|
Credit default indices
|
|
|
|
|
|
|
|
|||||||||||||||||||||
|
Other credit risk related portfolio products
|
|
|
|
|
|
|
|
|||||||||||||||||||||
|
Credit-risk related options and swaptions
|
|
|
—
|
—
|
|
—
|
|
|||||||||||||||||||||
|
Total
|
¥ |
|
¥ |
|
¥ |
|
¥ |
|
¥ |
|
¥ |
|
¥ |
|
||||||||||||||
| (1) | Carrying value amounts are shown on a gross basis prior to cash collateral or counterparty netting. Asset balances represent positive fair value amounts caused by tightening of credit spreads of underlyings since inception of the credit derivative contracts. |
The following tables present information about Nomura’s written credit derivatives by external credit rating of the underlying asset. Ratings are based on S&P Global Ratings (“S&P”), or if not rated by S&P, based on Moody’s Investors Service. If ratings from either of these agencies are not available, the ratings are based on Fitch Ratings Ltd. or Japan Credit Rating Agency, Ltd. For credit default indices, the rating is determined by taking the weighted average of the external credit ratings given for each of the underlying reference entities comprising the portfolio or index.
|
|
Billions of yen
|
|||||||||||||||||||||||||||
|
|
March 31, 2019
|
|||||||||||||||||||||||||||
|
|
Maximum potential payout/Notional
|
|||||||||||||||||||||||||||
|
|
AAA
|
|
AA
|
|
A
|
|
BBB
|
|
BB
|
|
Other
(1)
|
|
Total
|
|
||||||||||||||
|
Single-name credit default swaps
|
¥ |
|
¥ |
|
¥ |
|
¥ |
|
¥ |
|
¥ |
|
¥ |
|
||||||||||||||
|
Credit default indices
|
|
|
|
|
|
|
|
|||||||||||||||||||||
|
Other credit risk related portfolio products
|
|
|
|
|
|
|
|
|||||||||||||||||||||
|
Credit-risk related options and swaptions
|
—
|
—
|
—
|
—
|
—
|
—
|
—
|
|||||||||||||||||||||
|
Total
|
¥ |
|
¥ |
|
¥ |
|
¥ |
|
¥ |
|
¥ |
|
¥ |
|
||||||||||||||
|
|
Billions of yen
|
|||||||||||||||||||||||||||
|
|
March 31, 2020
|
|||||||||||||||||||||||||||
|
|
Maximum potential payout/Notional
|
|||||||||||||||||||||||||||
|
|
AAA
|
|
AA
|
|
A
|
|
BBB
|
|
BB
|
|
Other
(1)
|
|
Total
|
|
||||||||||||||
|
Single-name credit default swaps
|
¥ |
|
¥ |
|
¥ |
|
¥ |
|
¥ |
|
¥ |
|
¥ |
|
||||||||||||||
|
Credit default indices
|
|
|
|
|
|
|
|
|||||||||||||||||||||
|
Other credit risk related portfolio products
|
|
|
|
|
|
|
|
|||||||||||||||||||||
|
Credit-risk related options and swaptions
|
—
|
—
|
—
|
—
|
|
—
|
|
|||||||||||||||||||||
|
Total
|
¥ |
|
¥ |
|
¥ |
|
¥ |
|
¥ |
|
¥ |
|
¥ |
|
||||||||||||||
| (1) | “Other” includes credit derivatives where the credit rating of the underlying reference asset is below investment grade or where a rating is unavailable. |
F-
71
NOMURA HOLDINGS, INC.
NOTES TO THE CONSOLIDATED FINANCIAL STATEMENTS—(Continued)
Derivatives entered into in contemplation of sales of financial assets
Nomura enters into transactions which involve both the transfer of financial assets to a third party counterparty and a separate agreement with the same counterparty entered into in contemplation of the initial transfer through which Nomura retains substantially all of the exposure to the economic return on the transferred financial assets throughout the term of the transaction. These transactions primarily include sales of securities with bilateral OTC total return swaps or other derivative agreements which are
in the consolidated balance sheets.
in-substance
total return swaps. These transactions are accounted for as sales of the securities with the derivative accounted for separately if the criteria for derecognition of the securities under ASC 860 are met. Where the derecognition criteria are not met, the transfer and separate derivative are accounted for as a single collateralized financing transaction which is reported within
Long-term borrowings—Trading balances of secured borrowings
As of March 31, 2020 there were no outstanding sales with total return swap or
in-substance
total return swap transactions accounted for as sales rather than collateralized financing transactions.
4. Revenue from services provided to customers
Revenues by types of service
The following table presents revenue earned by Nomura from providing services to customers by relevant line item in Nomura’s consolidated statement of income for the year ended March 31, 2019 and 2020.
|
|
Millions of yen
|
|||||||
|
|
Year ended March 31
|
|||||||
|
|
2019
|
|
2020
|
|
||||
|
Commissions
|
¥ |
|
¥ |
|
||||
|
Fees from investment banking
|
|
|
||||||
|
Asset management and portfolio service fees
|
|
|
||||||
|
Other revenue
|
|
|
||||||
|
Total
|
¥ |
|
¥ |
|
||||
Commissions
Fees from investment banking
Asset management and portfolio service fees
Other
.
F-
72
NOMURA HOLDINGS, INC.
NOTES TO THE CONSOLIDATED FINANCIAL STATEMENTS—(Continued)
The following table presents summary information regarding the key methodologies, assumptions and judgments used in recognizing revenue for each of the primary types of service provided to customers, including the nature of underlying performance obligations within each type of service and whether those performance obligations are satisfied at a point in time or over a period of time. For performance obligations recognized over time, information is also provided to explain the nature of the input or output method used to recognize revenue over time.
|
Type of service provided to
customers
|
|
Overview of key services provided
|
|
Key revenue recognition policies,
assumptions and
significant judgments
|
|
Trade execution and clearing services
|
|
•
Buying and selling of securities on behalf of customers
•
Clearing of securities and derivatives on behalf of customers
|
|
•
Execution and clearing commissions recognized at a point in time, namely trade date.
•
Commissions recognized net of soft dollar credits provided to customers where Nomura is acting as agent in providing investment research and similar services to the customer.
|
|
|
|
|
|
|
|
Financial advisory services
|
|
•
Provision of financial advice to customers in connection with a specific forecasted transaction or transactions
•
Provision of financial advice not in connection with a specific forecasted transaction or transactions such as general corporate intelligence and similar research
•
Issuance of fairness opinions
•
Structuring complex financial instruments for customers
|
|
•
Fees contingent on the success of an underlying transaction are variable consideration recognized when the underlying transaction has been completed since only at such point is it probable that a significant reversal of revenue will not occur.
•
Retainer and milestone fees are recognized either over the period to which they relate or are deferred until consummation of the underlying transaction depending on whether the underlying performance obligation is satisfied at a point in time or over time.
•
Judgment is required to make this determination with factors influencing this determination including, but not limited to, whether the fee is in connection with an engagement designed to
|
F-
73
NOMURA HOLDINGS, INC.
NOTES TO THE CONSOLIDATED FINANCIAL STATEMENTS—(Continued)
|
Type of service provided to
customers
|
Overview of key services provided
|
Key revenue recognition policies,
assumptions and
significant judgments
|
||
|
|
|
achieve a specific transaction or outcome for the customer (such as the purchase or sale of a business), the nature and extent of benefit to be provided to the customer prior to, and in addition to such specific transaction or outcome and the fee structure for the engagement.
•
Retainer and milestone fees recognized over time are normally recognized on a straight-line basis over the term of the contract based on time elapsed.
|
||
|
Asset management services
|
•
Management of funds, investment trusts and other investment vehicles
•
Provision of investment advisory services
•
Distribution of fund units
•
Providing custodial and administrative services to customers
|
•
Management fees earned by Nomura in connection with managing a fund, investment trust or other vehicle generally recognized on a straight-line basis based on time elapsed.
•
Performance-based fees are variable consideration recognized when the performance metric has been determined since only at such point is it probable that a significant reversal of revenue will not occur.
•
Distribution fees are recognized at a point in time when the fund units have been sold to third party investors.
•
Custodial and administrative fees recognized on a straight-line basis over time based on time elapsed.
|
F-
74
NOMURA HOLDINGS, INC.
NOTES TO THE CONSOLIDATED FINANCIAL STATEMENTS—(Continued)
|
Type of service provided to
customers
|
|
Overview of key services provided
|
|
Key revenue recognition policies,
assumptions and
significant judgments
|
|
|
|
|
|
|
|
Underwriting and syndication services
|
|
•
Underwriting of debt, equity and other financial instruments on behalf of customers
•
Distributing securities on behalf of issuers
•
Arranging loan financing for customers
•
Syndicating loan financing on behalf of customers
|
|
•
Underwriting and syndication revenues recognized at a point in time when the underlying transaction is complete.
•
Commitment fees where drawn down of the facility is deemed remote recognized on a straight-line basis over the life of the facility based on time elapsed.
•
Underwriting and syndication costs recognized either as a reduction of revenue or on a gross basis depending on whether Nomura is acting as principal or agent for such amounts.
|
Where revenue is recognized at a point on time, payments of fees are typically received at the same time as when the performance obligation is satisfied, or within several days or months after satisfying a performance obligation. In relation to revenue recognized over time, payments of fees are typically received every month, three months or six months.
The underlying contracts entered into by Nomura in order to provide the services described above typically do not have significant financing components within the contracts either provided to or from Nomura. If such components did not exist in a contract, Nomura has made an accounting policy permitted by ASC 606 “
” (“ASC 606”) not to adjust for the effects of a significant financing component where the financing is effectively for a period of one year or less. Such contracts also typically do not contain rights of return or similar features for the customer.
Revenue from Contracts with Customers
Customer contract balances
When Nomura or the customer performs in accordance with the terms of a customer contract, a contract asset, customer contract receivable or contract liability is recognized in Nomura’s consolidated balance sheet.
A contract asset represents accrued revenue recognized by Nomura for completing or partially completing a performance obligation, namely a right of Nomura to receive consideration for providing the service to the customer, which is conditioned on something other than the passage of time. A customer contract receivable is an unconditional right of Nomura to receive consideration in exchange for providing the service. Both contract assets and customer contract receivables are reported in
within Nomura’s consolidated balance sheet. A contract liability is any liability recognized in connection with a customer contract, including obligations to provide refunds and obligations to provide a service in the future for which consideration has already been received or is due to be received. Contract liabilities are reported in
within Nomura’s consolidated balance sheet.
Receivables from Customers
Payables to Customers
F-
75
NOMURA HOLDINGS, INC.
NOTES TO THE CONSOLIDATED FINANCIAL STATEMENTS—(Continued)
The following table presents the balances of customer contract receivables, contract assets and contract liabilities in scope of ASC 606 as of March 31, 2019 and 2020. The amount of contract assets as of March 31, 2019 and 2020 were immaterial.
|
|
Millions of yen
|
|||||||
|
|
March 31, 2019
|
|
March 31, 2020
|
|
||||
|
Customer contract receivables
|
¥ |
|
¥ |
|
||||
|
Contract liabilities
(1)
|
|
|
||||||
| (1) | Contract liabilities primarily rise from investment advisory services and recognized in connection with the term of the contract based on time elapsed. |
The balance of contract liabilities as of March 31, 2018 were recognized as revenue for the year ended March 31, 2019. Nomura recognized ¥
1,334
million of revenue from performance obligations satisfied in previous periods for the year end
ed
March 31, 2019.
The balance of contract liabilities as of March 31, 2019 were recognized as revenue for the year ended March 31, 2020. Nomura recognized ¥
744
million of revenue from performance obligations satisfied in previous periods for the year ended March 31, 2020.
Transaction price allocated to the remaining performance obligatio
ns
As permitted by ASC 606, Nomura has chosen not to disclose information about remaining performance obligations that have original expected durations of one year or less as of March 31, 2019 and 2020.
Nomura retains no significant transactions for which individual estimated contract period exceeds one year. In addition, considerations arising from contracts with customers do not comprise any significant amount that is not included in transaction price.
Customer contract costs
As permitted by ASC 340 “
” Nomura has elected to expense all costs to obtain customer contracts where such amounts would be otherwise expensed within one year or less. As a result, the amount of deferred costs to obtain or fulfill customer contracts as of March 31, 2019 and 2020 were not significant.
Other Assets and Deferred Costs,
5. Collateralized transactions:
Nomura enters into collateralized transactions, including reverse repurchase agreements, repurchase agreements, securities borrowing transactions, securities lending transactions, other secured borrowings and similar transactions mainly to meet clients’ needs, finance trading inventory positions and obtain securities for settlements.
Reverse repurchase agreements, repurchase agreements, securities borrowing transactions and securities lending transactions are typically documented under industry standard master netting agreements which reduce Nomura’s credit exposure to counterparties as they permit the
close-out
and offset of transactions and collateral amounts in the event of default of the counterparty. For certain centrally-cleared reverse repurchase and repurchase agreements, the clearing or membership agreements entered into by Nomura provide similar rights to Nomura in the event of default of the relevant central clearing counterparty. In order to support the enforceability of the
close-out
and offsetting rights within these agreements, Nomura generally seeks to obtain an external legal opinion.
F-
76
NOMURA HOLDINGS, INC.
NOTES TO THE CONSOLIDATED FINANCIAL STATEMENTS—(Continued)
For certain types of counterparty and in certain jurisdictions, Nomura may enter into reverse repurchase agreements, repurchase agreements, securities borrowing and securities lending transactions which are not documented under a master netting agreement. Similarly, even when these transactions are documented under such agreements, Nomura may not have yet sought evidence, or may not be able to obtain evidence to determine with sufficient certainty that the
close-out
and offsetting rights are legally enforceable. This may be the case where relevant local laws specifically prohibit such
close-out
and offsetting rights, or where local laws are complex, ambiguous or silent on the enforceability of such rights. This may include reverse repurchase agreements, repurchase agreements, securities borrowing and securities lending transactions executed with certain foreign governments, agencies, municipalities, central clearing counterparties, agent banks and pension funds.
Nomura considers the enforceability of a master netting agreement in determining how credit risk arising from transactions with a specific counterparty is hedged, how counterparty credit exposures are calculated and applied to credit limits and the extent and nature of collateral requirements from the counterparty.
In all of these transactions, Nomura either receives or provides collateral, including Japanese and
non-Japanese
government, agency, mortgage-backed, bank and corporate debt securities and equities. In most cases, Nomura is permitted to use the securities received to enter into repurchase agreements, enter into securities lending transactions or to cover short positions with counterparties. In repurchase and reverse repurchase agreements, the value of collateral typically exceeds the amount of cash transferred. Collateral is generally in the form of securities. Securities borrowing transactions generally require Nomura to provide the counterparty with collateral in the form of cash or other securities. For securities lending transactions, Nomura generally receives collateral in the form of cash or other securities. Nomura monitors the market value of the securities either received from or provided to the counterparty. Additional cash or securities are exchanged as necessary, to ensure that such transactions are adequately collateralized throughout the life of the transactions.
Offsetting of certain collateralized transactions
Reverse repurchase agreements and repurchase agreements, securities borrowing and lending transactions with the same counterparty documented under a master netting agreement are offset in the consolidated balance sheets where the specific criteria defined by ASC
210-20
are met. These criteria include requirements around the maturity of the transactions, the underlying systems on which the collateral is settled, associated banking arrangements and the legal enforceability of
close-out
and offsetting rights under the master netting agreement.
F-
77
NOMURA HOLDINGS, INC.
NOTES TO THE CONSOLIDATED FINANCIAL STATEMENTS—(Continued)
The following tables present information about offsetting of these transactions in the consolidated balance sheets as of March 31, 2019 and 2020, together with the extent to which master netting agreements entered into with counterparties and central clearing parties permit additional offsetting in the event of counterparty default. Transactions which are not documented under a master netting agreement or are documented under a master netting agreement for which Nomura does not have sufficient evidence of enforceability are not offset in the following tables.
|
|
Billions of yen
|
|||||||||||||||
|
|
March 31, 2019
|
|||||||||||||||
|
|
Assets
|
Liabilities
|
||||||||||||||
|
|
Reverse
repurchase
agreements
|
|
Securities
borrowing
transactions
|
|
Repurchase
agreements
|
|
Securities
lending
transactions
|
|
||||||||
|
Total gross balance
(1)
|
¥ |
|
¥ |
|
¥ |
|
¥ |
|
||||||||
|
Less: Amounts offset in the consolidated balance sheets
(2)
|
(
|
) |
|
(
|
) |
|
||||||||||
|
Total net amounts of reported on the face of the consolidated balance sheets
(3)
|
¥ |
|
¥ |
|
¥ |
|
¥ |
|
||||||||
|
Less: Additional amounts not offset in the consolidated balance sheets
(4)
|
|
|
|
|
||||||||||||
|
Financial instruments and
non-cash
collateral
|
(
|
) |
(
|
) |
(
|
) |
(
|
) | ||||||||
|
Cash collateral
|
(
|
) |
|
|
|
|||||||||||
|
Net amount
|
¥ |
|
¥ |
|
¥ |
|
¥ |
|
||||||||
|
|
Billions of yen
|
|||||||||||||||
|
|
March 31, 2020
|
|||||||||||||||
|
|
Assets
|
Liabilities
|
||||||||||||||
|
|
Reverse
repurchase
agreements
|
|
Securities
borrowing
transactions
|
|
Repurchase
agreements
|
|
Securities
lending
transactions
|
|
||||||||
|
Total gross balance
(1)
|
¥ |
|
¥ |
|
¥ |
|
¥ |
|
||||||||
|
Less: Amounts offset in the consolidated balance sheets
(2)
|
(
|
) |
|
(
|
) |
|
||||||||||
|
Total net amounts of reported on the face of the consolidated balance sheets
(3)
|
¥ |
|
¥ |
|
¥ |
|
¥ |
|
||||||||
|
Less: Additional amounts not offset in the consolidated balance sheets
(4)
|
|
|
|
|
||||||||||||
|
Financial instruments and
non-cash
collateral
|
(
|
) |
(
|
) |
(
|
) |
(
|
) | ||||||||
|
Cash collateral
|
(
|
) |
|
(
|
) |
|
||||||||||
|
Net amount
|
¥ |
|
¥ |
|
¥ |
|
¥ |
|
||||||||
| (1) |
Includes all recognized balances irrespective of whether they are transacted under a master netting agreement or whether Nomura has obtained sufficient evidence of enforceability of the master netting agreement. Amounts include transactions carried at fair value through election of the fair value option. As of March 31, 2019, the gross balance of reverse repurchase agreements and repurchase agreements which were not transacted under master netting agreements or are documented under master netting agreements for which Nomura has not yet obtained sufficient evidence of enforceability was ¥
|
F-
78
NOMURA HOLDINGS, INC.
NOTES TO THE CONSOLIDATED FINANCIAL STATEMENTS—(Continued)
|
|
reverse repurchase agreements and repurchase agreements which were not transacted under master netting agreements or are documented under master netting agreements for which Nomura has not yet obtained sufficient evidence of enforceability was ¥
|
| (2) |
Represents amounts offset through counterparty netting under master netting and similar agreements for which Nomura has obtained sufficient evidence of enforceability in accordance with ASC
210-20.
Amounts offset include transactions carried at fair value through election of the fair value option.
|
| (3) |
Reverse repurchase agreements and securities borrowing transactions are reported within
Collateralized agreements—Securities purchased under agreements to resell
Collateralized agreements—Securities borrowed
Collateralized financing—Securities sold under agreements to repurchase
Collateralized financing—Securities loaned
Other liabilities
|
| (4) |
Represents amounts which are not permitted to be offset on the face of the balance sheet in accordance with ASC 210-20 but which provide Nomura with the right of offset in the event of counterparty default. Amounts relating to agreements where Nomura has not yet obtained sufficient evidence of enforceability of such offsetting rights are excluded.
|
Maturity analysis of repurchase agreements and securities lending transactions
The following table presents an analysis of the total carrying value of liabilities recognized in the consolidated balance sheets for repurchase agreements and securities lending transactions by remaining contractual maturity of the agreement as of March 31, 2020. Amounts reported are shown prior to counterparty netting in accordance with ASC
210-20.
|
|
Billions of yen
|
|||||||||||||||||||||||
|
|
March 31, 2020
|
|||||||||||||||||||||||
|
|
Overnight
and open
(1)
|
|
Up to
30 days
|
|
30 - 90
days
|
|
90 days
-
1 year |
|
Greater
than 1 year
|
|
Total
|
|
||||||||||||
|
Repurchase agreements
|
¥ |
|
¥ |
|
¥ |
|
¥ |
|
¥ |
|
¥ |
|
||||||||||||
|
Securities lending transactions
|
|
|
|
|
|
|
||||||||||||||||||
|
Total gross recognized liabilities
(2)
|
¥ |
|
¥ |
|
¥ |
|
¥ |
|
¥ |
|
¥ |
|
||||||||||||
| (1) | Open transactions do not have an explicit contractual maturity date and are terminable on demand by Nomura or the counterparty. |
| (2) |
Repurchase agreements and securities lending transactions are reported within
Collateralized financing—Securities sold under agreements to repurchase
Collateralized financing—Securities loaned
Other liabilities
|
F-
79
NOMURA HOLDINGS, INC.
NOTES TO THE CONSOLIDATED FINANCIAL STATEMENTS—(Continued)
Securities transferred in repurchase agreements and securities lending transactions
The following table presents an analysis of the total carrying value of liabilities recognized in the consolidated balance sheets for repurchase agreements and securities lending transactions by class of securities transferred by Nomura to counterparties as of March 31, 2020. Amounts reported are shown prior to counterparty netting in accordance with ASC
210-20.
|
|
Billions of yen
|
|||||||||||
|
|
March 31, 2020
|
|||||||||||
|
|
Repurchase
agreements
|
|
Securities
lending
transactions
|
|
Total
|
|
||||||
|
Equities and convertible securities
|
¥ |
|
¥ |
|
¥ |
|
||||||
|
Japanese government, agency and municipal securities
|
|
|
|
|||||||||
|
Foreign government, agency and municipal securities
|
|
|
|
|||||||||
|
Bank and corporate debt securities
|
|
|
|
|||||||||
|
Commercial mortgage-backed securities (“CMBS”)
|
|
|
|
|||||||||
|
Residential mortgage-backed securities (“RMBS”)
(1)
|
|
|
|
|||||||||
|
Collateralized debt obligations (“CDOs”) and other
|
|
|
|
|||||||||
|
Investment trust funds and other
|
|
|
|
|||||||||
|
Total gross recognized liabilities
(2)
|
¥ |
|
¥ |
|
¥ |
|
||||||
| (1) |
Includes ¥
|
| (2) |
Repurchase agreements and securities lending transactions are reported within
Collateralized financing—Securities sold under agreements to repurchase
Collateralized financing—Securities loaned
Other liabilities
|
Collateral received by Nomura
The following table presents the fair value of securities received as collateral, securities borrowed with collateral and securities borrowed without collateral, which Nomura is permitted to sell or repledge, and the portion that has been sold or repledged as of March 31, 2019 and 2020.
|
|
Billions of yen
|
|||||||
|
|
March 31
|
|||||||
|
|
2019
|
|
2020
|
|
||||
|
The fair value of securities received as collateral, securities borrowed as collateral and securities borrowed without collateral where Nomura is permitted by contract or custom to sell or repledge the securities
|
¥ |
|
¥ |
|
||||
|
The portion of the above that has been sold (reported within
Trading liabilities
|
|
|
||||||
F-
80
NOMURA HOLDINGS, INC.
NOTES TO THE CONSOLIDATED FINANCIAL STATEMENTS—(Continued)
Collateral pledged by Nomura
Nomura pledges firm-owned securities to collateralize repurchase transactions, other secured financings and derivative transactions. Pledged securities that can be sold or repledged by the transferee, including Gensaki Repo transactions, are reported in parentheses as
within
in the consolidated balance sheets.
Securities pledged as collateral
Trading assets
The following table presents the carrying amounts of financial assets recognized in the consolidated balance sheets which have been pledged as collateral, primarily to stock exchanges and clearing organizations, without allowing the secured party the right to sell or repledge them by type of asset as of March 31, 2019 and 2020.
|
|
Millions of yen
|
|||||||
|
|
March 31
|
|||||||
|
|
2019
|
|
2020
|
|
||||
|
Trading assets:
|
|
|
||||||
|
Equities and convertible securities
|
¥ |
|
¥ |
|
||||
|
Government and government agency securities
|
|
|
||||||
|
Bank and corporate debt securities
|
|
|
||||||
|
Commercial mortgage-backed securities (“CMBS”)
|
|
|
||||||
|
Residential mortgage-backed securities (“RMBS”)
|
|
|
||||||
|
Collateralized debt obligations (“CDOs”) and other
(1)
|
|
|
||||||
|
Investment trust funds and other
|
|
|
||||||
|
|
¥ |
|
¥ |
|
||||
|
Non-trading
debt securities
|
|
|
||||||
|
Investments in and advances to affiliated companies
|
¥ |
|
¥ |
|
||||
| (1) | Includes CLOs and ABS such as those secured on credit card loans, auto loans and student loans. |
The following table presents the carrying amount of financial and
non-financial
assets recognized in the consolidated balance sheets, other than those disclosed above, which are subject to lien as of March 31, 2019 and 2020.
|
|
Millions of yen
|
|||||||
|
|
March 31
|
|||||||
|
|
2019
|
|
2020
|
|
||||
|
Loans and receivables
|
¥ |
|
¥ |
|
||||
|
Trading assets and private equity
and debt investments
|
|
|
||||||
|
Office buildings, land, equipment and facilities
|
|
|
||||||
|
Non-trading
debt securities
|
|
|
||||||
|
Other
|
|
|
||||||
|
|
¥ |
|
¥ |
|
||||
Assets in the above table were primarily pledged for secured borrowings, including other secured borrowings, collateralized borrowings of consolidated VIEs, trading balances of secured borrowings, and derivative transactions. See Note 11 “
” for further information regarding trading balances of secured borrowings.
Borrowings
F-
81
NOMURA HOLDINGS, INC.
NOTES TO THE CONSOLIDATED FINANCIAL STATEMENTS—(Continued)
6. Securitizations and Variable Interest Entities:
Securitizations
Nomura utilizes special purpose entities (“SPEs”) to securitize commercial and residential mortgage loans, government agency and corporate securities and other types of financial assets. Those SPEs are incorporated as stock companies, Tokumei kumiai (silent partnerships), Cayman special purpose companies (“SPCs”) or trust accounts. Nomura’s involvement with SPEs includes structuring SPEs, underwriting, distributing and selling debt instruments and beneficial interests issued by SPEs to investors. Nomura accounts for the transfer of financial assets in accordance with ASC 860. This statement requires that Nomura accounts for the transfer of financial assets as a sale when Nomura relinquishes control over the assets. ASC 860 deems control to be relinquished when the following conditions are met: (a) the assets have been isolated from the transferor (even in bankruptcy or other receivership), (b) the transferee has the right to pledge or exchange the assets received, or if the transferee is an entity whose sole purpose is to engage in securitization or asset-backed financing activities, the holders of its beneficial interests have the right to pledge or exchange the beneficial interests, and (c) the transferor has not maintained effective control over the transferred assets. Nomura may retain an interest in the financial assets, including residual interests in the SPEs. Any such interests are accounted for at fair value and reported within
in Nomura’s consolidated balance sheets, with the change in fair value reported within
. Fair value for retained interests in securitized financial assets is determined by using observable prices; or in cases where observable prices are not available for certain retained interests, Nomura estimates fair value based on the present value of expected future cash flows using its best estimates of the key assumptions, including forecasted credit losses, prepayment rates, forward yield curves and discount rates commensurate with the risks involved. Nomura may also enter into derivative transactions in relation to the assets transferred to an SPE.
Trading assets
Revenue-Net gain on trading
As noted above, Nomura may have continuing involvement with SPEs to which Nomura transferred assets. For the years ended March 31, 2019 and 2020, Nomura received cash proceeds from SPEs in new securitizations of ¥
174
billion and ¥
202
billion, respectively, and the associated gain (loss) on sale was not significant. For the years ended March 31, 2019 and 2020, Nomura received debt securities issued by these SPEs with an initial fair value of ¥
1,308
billion and ¥
1,769
billion, respectively, and cash inflows from third parties on the sale of those debt securities of ¥
991
billion and ¥
1,245
billion, respectively. The cumulative balance of financial assets transferred to SPEs with which Nomura has continuing involvement was ¥
4,488
billion and ¥
4,177
billion as of March 31, 2019 and 2020, respectively. Nomura’s retained interests were ¥
138
billion and ¥
163
billion as of March 31, 2019 and 2020, respectively. For the years ended March 31, 2019 and 2020, Nomura received cash flows of ¥
20
billion and ¥
24
billion, respectively, from the SPEs on the retained interests held in the SPEs.
Nomura does not provide financial support to SPEs beyond its contractual obligations as of March 31, 2019 and 2020.
F-
82
NOMURA HOLDINGS, INC.
NOTES TO THE CONSOLIDATED FINANCIAL STATEMENTS—(Continued)
The following tables present the fair value of retained interests which Nomura has continuing involvement in SPEs and their classification in the fair value hierarchy, categorized by the type of transferred assets as of March 31, 2019 and 2020.
|
|
Billions of yen
|
|||||||||||||||||||||||
|
|
March 31, 2019
|
|||||||||||||||||||||||
|
|
Level 1
|
|
Level 2
|
|
Level 3
|
|
Total
|
|
Investment
grade
|
|
Other
|
|
||||||||||||
|
Government, agency and municipal securities
|
¥ |
|
¥ |
|
¥ |
|
¥ |
|
¥ |
|
¥ |
|
||||||||||||
|
Bank and corporate debt securities
|
|
|
|
|
|
|
||||||||||||||||||
|
CMBS and RMBS
|
|
|
|
|
|
|
||||||||||||||||||
|
Total
|
¥ |
|
¥ |
|
¥ |
|
¥ |
|
¥ |
|
¥ |
|
||||||||||||
|
|
Billions of yen
|
|||||||||||||||||||||||
|
|
March 31, 2020
|
|||||||||||||||||||||||
|
|
Level 1
|
|
Level 2
|
|
Level 3
|
|
Total
|
|
Investment
grade
|
|
Other
|
|
||||||||||||
|
Government, agency and municipal securities
|
¥ |
|
¥ |
|
¥ |
|
¥ |
|
¥ |
|
¥ |
|
||||||||||||
|
Bank and corporate debt securities
|
|
|
|
|
|
|
||||||||||||||||||
|
CMBS and RMBS
|
|
|
|
|
|
|
||||||||||||||||||
|
Total
|
¥ |
|
¥ |
|
¥ |
|
¥ |
|
¥ |
|
¥ |
|
||||||||||||
As of March 31, 2020, predominantly all of the retained interests held by Nomura were valued using observable prices.
The following table presents the type and carrying value of financial assets included within
which have been transferred to SPEs but which do not meet the criteria for derecognition under ASC 860 as of March 31, 2019 and 2020. These transfers are accounted for as secured financing transactions and generally reported within
The assets are pledged as collateral of the associated liabilities and cannot be removed unilaterally by Nomura and the liabilities are
Trading assets
Long-term borrowings.
non-recourse
to Nomura.
|
|
Billions of yen
|
|||||||
|
|
March 31
|
|||||||
|
|
2019
|
|
2020
|
|
||||
|
Assets
|
|
|
||||||
|
Trading assets
|
|
|
||||||
|
Loans
|
¥ |
|
¥ |
|
||||
|
Liabilities
|
|
|
||||||
|
Long-term borrowings
|
¥ |
|
¥ |
|
||||
Variable Interest Entities (“VIEs”)
In the normal course of business, Nomura acts as a transferor of financial assets to VIEs, and underwriter, distributor, and seller of repackaged financial instruments issued by VIEs in connection with its securitization and equity derivative activities. Nomura retains, purchases and sells variable interests in VIEs in connection with its market-making, investing and structuring activities.
F-
83
NOMURA HOLDINGS, INC.
NOTES TO THE CONSOLIDATED FINANCIAL STATEMENTS—(Continued)
If Nomura has an interest in a VIE that provides Nomura with control over the most significant activities of the VIE and the right to receive benefits or the obligation to absorb losses that could be significant to the VIE, Nomura is the primary beneficiary of the VIE and must consolidate the entity, provided that Nomura does not meet separate tests confirming that it is acting as a fiduciary for other interest holders. Nomura’s consolidated VIEs include those that were created to market structured securities to investors by repackaging corporate convertible securities, mortgages and mortgage-backed securities. Certain VIEs used in connection with Nomura’s aircraft leasing business as well as other purposes are consolidated. Nomura also consolidates certain investment funds, which are VIEs, and for which Nomura is the primary beneficiary.
The power to make the most significant decisions may take a number of different forms in different types of VIEs. For transactions such as securitizations, investment funds, and CDOs, Nomura considers collateral management and servicing to represent the power to make the most significant decisions. Accordingly, Nomura does not consolidate such types of VIEs for which it does not act as collateral manager or servicer unless Nomura has the right to replace the collateral manager or servicer or to require liquidation of the entity.
For many transactions, such as where VIEs are used for
re-securitizations
of residential mortgage-backed securities, there are no significant economic decisions made on an ongoing basis and no single investor has the unilateral ability to liquidate the VIE. In these cases, Nomura focuses its analysis on decisions made prior to the initial closing of the transaction, and considers factors such as the nature of the underlying assets held by the VIE, the involvement of third party investors in the design of the VIE, the size of initial third party investment and the amount and level of any subordination of beneficial interests issued by the VIE which will be held by Nomura and third party investors. Nomura has sponsored numerous
re-securitization
transactions and in many cases has determined that it is not the primary beneficiary on the basis that control over the most significant decisions relating to these entities are shared with third party investors. In some cases, however, Nomura has consolidated such VIEs, for example, where it was determined that third party investors were not involved in the design of the VIEs, including where the size of third party investment was not significant at inception of the transaction.
F-
84
NOMURA HOLDINGS, INC.
NOTES TO THE CONSOLIDATED FINANCIAL STATEMENTS—(Continued)
The following table presents the classification of consolidated VIEs’ assets and liabilities in these consolidated financial statements as of March 31, 2019 and 2020. Most of these assets and liabilities are related to consolidated SPEs which securitize corporate convertible securities, mortgages and mortgage-backed securities. The assets of a consolidated VIE may only be used to settle obligations of that VIE. Creditors do not typically have any recourse to Nomura beyond the assets held in the VIEs.
|
|
Billions of yen
|
|||||||
|
|
March 31
|
|||||||
|
|
2019
|
|
2020
|
|
||||
|
Consolidated VIE assets
|
|
|
||||||
|
Cash and cash equivalents
|
¥ |
|
¥ |
|
||||
|
Trading assets
|
|
|
||||||
|
Equities
|
|
|
||||||
|
Debt securities
|
|
|
||||||
|
CMBS and RMBS
|
|
|
||||||
|
Investment trust funds and other
|
|
|
||||||
|
Derivatives
|
|
|
||||||
|
Private equity and debt investments
|
|
|
||||||
|
Office buildings, land, equipment and facilities
|
|
|
||||||
|
Other
|
|
|
||||||
|
Total
|
¥ |
|
¥ |
|
||||
|
Consolidated VIE liabilities
|
|
|
||||||
|
Trading liabilities
|
|
|
||||||
|
Derivatives
|
|
|
||||||
|
Borrowings
|
|
|
||||||
|
Short-term borrowings
|
|
|
||||||
|
Long-term borrowings
|
|
|
||||||
|
Other
|
|
|
||||||
|
Total
|
¥ |
|
¥ |
|
||||
Nomura continuously reassesses its initial evaluation of whether it is the primary beneficiary of a VIE based on current facts and circumstances as long as it has any continuing involvement with the VIE. This determination is based upon an analysis of the design of the VIE, including the VIE’s structure and activities, the power to make significant economic decisions held by Nomura and by other parties, and the variable interests owned by Nomura and other parties.
Nomura also holds variable interests in VIEs where Nomura is not the primary beneficiary. Nomura’s variable interests in such VIEs include senior and subordinated debt, residual interests, and equity interests associated with commercial and residential mortgage-backed and other asset-backed securitizations and structured financings, equity interests in VIEs which were formed primarily to acquire high yield leveraged loans and other lower investment grade debt obligations, residual interests in operating leases for aircraft held by VIEs, and loans and investments in VIEs that acquire operating businesses.
The following tables present the carrying amount of variable interests of unconsolidated VIEs and maximum exposure to loss associated with these variable interests as of March 31, 2019 and 2020. Maximum exposure to loss does not reflect Nomura’s estimate of the actual losses that could result from adverse changes, nor does it reflect the economic hedges Nomura enters into to reduce its exposure. The risks associated with VIEs
F-
85
NOMURA HOLDINGS, INC.
NOTES TO THE CONSOLIDATED FINANCIAL STATEMENTS—(Continued)
in which Nomura is involved are limited to the amount recorded in the consolidated balance sheets and the amount of commitments and financial guarantees.
|
|
Billions of yen
|
|||||||||||
|
|
March 31, 2019
|
|||||||||||
|
|
Carrying amount of variable interests
|
Maximum exposure
to loss to
unconsolidated VIEs
|
|
|||||||||
|
|
Assets
|
|
Liabilities
|
|
||||||||
|
Trading assets and liabilities
|
|
|
|
|||||||||
|
Equities
|
¥ |
|
¥ |
|
¥ |
|
||||||
|
Debt securities
|
|
|
|
|||||||||
|
CMBS and RMBS
|
|
|
|
|||||||||
|
Investment trust funds and other
|
|
|
|
|||||||||
|
Private equity and debt investments
|
|
|
|
|||||||||
|
Loans
|
|
|
|
|||||||||
|
Other
|
|
|
|
|||||||||
|
Commitments to extend credit and other guarantees
|
|
|
|
|||||||||
|
Total
|
¥ |
|
¥ |
|
¥ |
|
||||||
|
|
Billions of yen
|
|||||||||||
|
|
March 31, 2020
|
|||||||||||
|
|
Carrying amount of variable interests
|
Maximum exposure
to loss to
unconsolidated VIEs
|
|
|||||||||
|
|
Assets
|
|
Liabilities
|
|
||||||||
|
Trading assets and liabilities
|
|
|
|
|||||||||
|
Equities
|
¥ |
|
¥ |
|
¥ |
|
||||||
|
Debt securities
|
|
|
|
|||||||||
|
CMBS and RMBS
|
|
|
|
|||||||||
|
Investment trust funds and other
|
|
|
|
|||||||||
|
Private equity and debt investments
|
|
|
|
|||||||||
|
Loans
|
|
|
|
|||||||||
|
Other
|
|
|
|
|||||||||
|
Commitments to extend credit and other guarantees
|
|
|
|
|||||||||
|
Total
|
¥ |
|
¥ |
|
¥ |
|
||||||
7. Financing receivables:
In the normal course of business, Nomura extends financing to clients primarily in the form of loans and collateralized agreements such as reverse repurchase agreements and securities borrowing transactions. These financing receivables are recognized as assets on Nomura’s consolidated balance sheets and provide a contractual right to receive money either on demand or on future fixed or determinable dates.
Collateralized agreements
Collateralized agreements
Securities purchased under agreements to resell
Securities borrowed
F-
86
NOMURA HOLDINGS, INC.
NOTES TO THE CONSOLIDATED FINANCIAL STATEMENTS—(Continued)
from customers under agreements that also require Nomura to resell these securities to those customers, or borrowing these securities with cash collateral. Nomura monitors the value of the underlying securities on a daily basis to the related receivables, including accrued interest, and requests or returns additional collateral when appropriate. Reverse repurchase agreements are generally recognized in the consolidated balance sheets at the amount for which the securities were originally acquired with applicable accrued interest. Securities borrowing transactions are generally recognized in the consolidated balance sheets at the amount of cash collateral advanced. No allowance for credit losses is generally recognized against these transactions due to the strict collateralization requirements.
Loans receivable
The key types of loans receivable recognized by Nomura are loans at banks, short-term secured margin loans, inter-bank money market loans and corporate loans.
Loans at banks include both retail and commercial secured and unsecured loans extended by licensed banking entities within Nomura such as The Nomura Trust & Banking Co., Ltd. and Nomura Bank International plc. For both retail and commercial loans secured by real estate or securities, Nomura is exposed to the risk of a decline in the value of the underlying collateral. Loans at banks also include unsecured commercial loans provided to investment banking clients for relationship purposes. Nomura is exposed to risk of default of the counterparty, although these counterparties usually have high credit ratings. Where loans are secured by guarantees, Nomura is also exposed to the risk of default by the guarantor.
Short-term secured margin loans are loans provided to clients in connection with securities brokerage business. These loans provide funding for clients in order to purchase securities. Nomura requests initial margin in the form of acceptable collateral securities or deposits against these loans and holds the purchased securities as collateral through the life of the loans. If the value of the securities declines by more than specified amounts, Nomura can make additional margin calls in order to maintain a specified ratio of
loan-to-value
(“LTV”) ratio. For these reasons, the risk to Nomura of providing these loans is limited.
Inter-bank money market loans are loans to financial institutions in the inter-bank money market, where overnight and
intra-day
financings are traded through money market dealers. The risk to Nomura of making these loans is not significant as only qualified financial institutions can participate in these markets and these loans are usually overnight or short-term in nature.
Corporate loans are primarily commercial loans provided to corporate clients extended by
non-licensed
banking entities within Nomura. Corporate loans include loans secured by real estate or securities, as well as unsecured commercial loans provided to investment banking clients for relationship purposes. The risk to Nomura of making these loans is similar to those risks arising from commercial loans reported in loans at banks.
F-
87
NOMURA HOLDINGS, INC.
NOTES TO THE CONSOLIDATED FINANCIAL STATEMENTS—(Continued)
The following tables present a summary of loans receivable reported within
or
in the consolidated balance sheets as of March 31, 2019, and 2020 by portfolio segment.
Loans receivable
Investments in and advances to affiliated companies
|
|
Millions of yen
|
|||||||||||
|
|
March 31, 2019
|
|||||||||||
|
|
Carried at
amortized cost
|
|
Carried at
fair value
(1)
|
|
Total
|
|
||||||
|
Loans receivable
|
|
|
|
|||||||||
|
Loans at banks
|
¥ |
|
¥ |
|
¥ |
|
||||||
|
Short-term secured margin loans
|
|
|
|
|||||||||
|
Inter-bank money market loans
|
|
|
|
|||||||||
|
Corporate loans
|
|
|
|
|||||||||
|
Total loans receivable
|
¥ |
|
¥ |
|
¥ |
|
||||||
|
Total
|
¥ |
|
¥ |
|
¥ |
|
||||||
|
|
Millions of yen
|
|||||||||||
|
|
March 31, 2020
|
|||||||||||
|
|
Carried at
amortized cost
|
|
Carried at
fair value
(1)
|
|
Total
|
|
||||||
|
Loans receivable
|
|
|
|
|||||||||
|
Loans at banks
|
¥ |
|
¥ |
|
¥ |
|
||||||
|
Short-term secured margin loans
|
|
|
|
|||||||||
|
Inter-bank money market loans
|
|
|
|
|||||||||
|
Corporate loans
|
|
|
|
|||||||||
|
Total loans receivable
|
¥ |
|
¥ |
|
¥ |
|
||||||
|
Total
|
¥ |
|
¥ |
|
¥ |
|
||||||
| (1) | Includes loans receivable and loan commitments carried at fair value through election of the fair value option. |
There were no significant purchases nor sales of loans receivable during the year ended March 31, 2019. During the same period, there were no significant reclassifications of loans receivable to trading assets.
There were no significant purchases nor sales of loans receivable during the year ended March 31, 2020. During the same period, there were no significant reclassifications of loans receivable to trading assets.
Allowance for credit losses
Management establishes an allowance for credit losses against loans carried at amortized cost which reflects management’s best estimate of probable losses incurred. The allowance for credit losses against loans, which is reported in the consolidated balance sheets within
, comprises two components:
Allowance for doubtful accounts
| • | A specific component for loans which have been individually evaluated for impairment; and |
| • | A general component for loans which, while not individually evaluated for impairment, have been collectively evaluated for impairment based on historical loss experience. |
F-
88
NOMURA HOLDINGS, INC.
NOTES TO THE CONSOLIDATED FINANCIAL STATEMENTS—(Continued)
The specific component of the allowance reflects probable losses incurred within loans which have been individually evaluated for impairment. A loan is defined as being impaired when, based on current information and events, it is probable that all amounts according to the contractual terms of the loan agreement will not be collected. Factors considered by management in determining impairment include an assessment of the ability of borrowers to pay by considering various factors such as the nature of the loan, prior credit loss experience, current economic conditions, the current financial situation of the borrower and the fair value of any underlying collateral. Loans that experience insignificant payment delays or insignificant payment shortfalls are not classified as impaired. Impairment is measured on a loan by loan basis by adjusting the carrying value of the loan to either the present value of expected future cash flows discounted at the loan’s effective interest rate, the loan’s observable market price, or the fair value of the collateral if the loan is collateral dependent.
The general component of the allowance is for loans not individually evaluated for impairment and includes judgment about collectability based on available information at the balance sheet date and the uncertainties inherent in those underlying assumptions. The allowance is based on historical loss experience adjusted for qualitative factors such as current economic conditions.
As a result of the COVID-19 pandemic, determination of whether certain loans were impaired as of March 31, 2020 was increasingly judgmental when compared to prior years. When applying the factors discussed above to make this determination, additional consideration was given to how the COVID-19 pandemic would affect a borrower’s ability both to pay in the short-term while governments imposed lockdowns and similar restrictions on trading, and in the longer-term once the restrictions were lifted and economies were expected to improve. Various assumptions were made around the length and severity of the impact of the pandemic and the ability and timing of borrowers to recover.
As of April 1, 2020 Nomura will adopt new guidance for determination of allowances for credit losses defined by ASC 326 “
” (“ASC 326”) which requires recognition of allowances for current expected credit losses rather than incurred losses. Specific determination of whether a loan is impaired to trigger recognition of an allowance for credit losses will no longer be required but the same factors will still be used to determine the appropriate allowance as required under the new guidance. See Note 1 “Summary accounting policies—Future accounting developments” in these consolidated financial statements for further guidance on the expected impact of ASC 326 on Nomura.
Financial Instruments—Credit Losses
Loans are
charged-off
when Nomura determines that the loans are uncollectible. This determination is based on factors such as the occurrence of significant changes in the borrower’s financial position such that the borrower can no longer pay the obligation or that the proceeds from collateral will not be sufficient to pay the loans.
F-
89
NOMURA HOLDINGS, INC.
NOTES TO THE CONSOLIDATED FINANCIAL STATEMENTS—(Continued)
The following tables present changes in the total allowance for credit losses for the years ended March 31, 2018, 2019 and 2020. The allowance for credit losses increased as of March 31, 2020 when compared to March 31, 2019 primarily as a result of specific impairments identified in March 2020 as a result of the
COVID-19
pandemic.
|
|
Millions of yen
|
|||||||||||||||||||||||
|
|
Year ended March 31, 2018
|
|||||||||||||||||||||||
|
|
Allowance for credit losses against loans
|
Allowance
for credit
losses
against
receivables
other than
loans
|
|
Total
allowance
for doubtful
accounts
|
|
|||||||||||||||||||
|
|
Loans
at banks
|
|
Short-term
secured
margin
loans
|
|
Corporate
loans
|
|
Subtotal
|
|
||||||||||||||||
|
Opening balance
|
¥ |
|
¥ |
|
¥ |
|
¥ |
|
¥ |
|
¥ |
|
||||||||||||
|
Provision for credit losses
|
|
|
(
|
) |
|
|
|
|||||||||||||||||
|
Charge-offs
|
|
|
|
|
|
|
||||||||||||||||||
|
Other
(1)
|
|
|
(
|
) |
(
|
) |
(
|
) |
(
|
) | ||||||||||||||
|
Ending balance
|
¥ |
|
¥ |
|
¥ |
|
¥ |
|
¥ |
|
¥ |
|
||||||||||||
|
|
Millions of yen
|
|||||||||||||||||||||||
|
|
Year ended March 31, 2019
|
|||||||||||||||||||||||
|
|
Allowance for credit losses against loans
|
Allowance
for credit
losses
against
receivables
other than
loans
|
|
Total
allowance
for doubtful
accounts
|
|
|||||||||||||||||||
|
|
Loans
at banks
|
|
Short-term
secured
margin
loans
|
|
Corporate
loans
|
|
Subtotal
|
|
||||||||||||||||
|
Opening balance
|
¥ |
|
¥ |
|
¥ |
|
¥ |
|
¥ |
|
¥ |
|
||||||||||||
|
Provision for credit
|
|
|
|
|
|
|
||||||||||||||||||
|
losses
|
|
|
|
|
|
|
||||||||||||||||||
|
Charge-offs
|
(
|
) |
|
(
|
) |
(
|
) |
(
|
) |
(
|
) | |||||||||||||
|
Other
(1)
|
|
|
|
|
(
|
) |
|
|||||||||||||||||
|
Ending balance
|
¥ |
|
¥ |
|
¥ |
|
¥ |
|
¥ |
|
¥ |
|
||||||||||||
|
|
Millions of yen
|
|||||||||||||||||||||||
|
|
Year ended March 31, 2020
|
|||||||||||||||||||||||
|
|
Allowance for credit losses against loans
|
Allowance
for credit
losses
against
receivables
other than
loans
|
|
Total
allowance
for doubtful
accounts
|
|
|||||||||||||||||||
|
|
Loans
at banks
|
|
Short-term
secured
margin
loans
|
|
Corporate
loans
|
|
Subtotal
|
|
||||||||||||||||
|
Opening balance
|
¥ |
|
¥ |
|
¥ |
|
¥ |
|
¥ |
|
¥ |
|
||||||||||||
|
Provision for credit
|
|
|
|
|
|
|
||||||||||||||||||
|
losses
|
|
|
|
|
|
|
||||||||||||||||||
|
Charge-offs
|
|
|
|
|
(
|
) |
(
|
) | ||||||||||||||||
|
Other
(1)
|
|
(
|
) |
(
|
) |
(
|
) |
(
|
) |
(
|
) | |||||||||||||
|
Ending balance
|
¥ |
|
¥ |
|
¥ |
|
¥ |
|
¥ |
|
¥ |
|
||||||||||||
| (1) | Includes the effect of foreign exchange movements. |
F-
90
NOMURA HOLDINGS, INC.
NOTES TO THE CONSOLIDATED FINANCIAL STATEMENTS—(Continued)
The following tables present the allowance for credit losses against loans and loans by impairment methodology and type of loans as of March 31, 2019 and 2020.
|
|
Millions of yen
|
|||||||||||||||||||
|
|
March 31, 2019
|
|||||||||||||||||||
|
|
Loans at
banks
|
|
Short-term
secured margin
loans
|
|
Inter-bank
money
market loans
|
|
Corporate
loans
|
|
Total
|
|
||||||||||
|
Allowance by impairment methodology
|
|
|
|
|
|
|||||||||||||||
|
Evaluated individually
|
¥ |
|
¥ |
|
¥ |
|
¥ |
|
¥ |
|
||||||||||
|
Evaluated collectively
|
|
|
|
|
|
|||||||||||||||
|
Total allowance for credit losses
|
¥ |
|
¥ |
|
¥ |
|
¥ |
|
¥ |
|
||||||||||
|
Loans by impairment methodology
|
|
|
|
|
|
|||||||||||||||
|
Evaluated individually
|
¥ |
|
¥ |
|
¥ |
|
¥ |
|
¥ |
|
||||||||||
|
Evaluated collectively
|
|
|
|
|
|
|||||||||||||||
|
Total loans
|
¥ |
|
¥ |
|
¥ |
|
¥ |
|
¥ |
|
||||||||||
|
|
Millions of yen
|
|||||||||||||||||||
|
|
March 31, 2020
|
|||||||||||||||||||
|
|
Loans at
banks
|
|
Short-term
secured margin
loans
|
|
Inter-bank
money
market loans
|
|
Corporate
loans
|
|
Total
|
|
||||||||||
|
Allowance by impairment methodology
|
|
|
|
|
|
|||||||||||||||
|
Evaluated individually
|
¥ |
|
¥ |
|
¥ |
|
¥ |
|
¥ |
|
||||||||||
|
Evaluated collectively
|
|
|
|
|
|
|||||||||||||||
|
Total allowance for credit losses
|
¥ |
|
¥ |
|
¥ |
|
¥ |
|
¥ |
|
||||||||||
|
Loans by impairment methodology
|
|
|
|
|
|
|||||||||||||||
|
Evaluated individually
|
¥ |
|
¥ |
|
¥ |
|
¥ |
|
¥ |
|
||||||||||
|
Evaluated collectively
|
|
|
|
|
|
|||||||||||||||
|
Total loans
|
¥ |
|
¥ |
|
¥ |
|
¥ |
|
¥ |
|
||||||||||
Loan impairment and troubled debt restructurings
In the ordinary course of business, Nomura may choose to modify a loan classified as held for investment either because of financial difficulties of the borrower, or simply as a result of market conditions or relationship reasons. TDR occurs when Nomura as lender, for economic or legal reasons related to the borrower’s financial difficulties grants a concession to the borrower that Nomura would not otherwise consider.
Any loan being modified under a TDR will generally already be identified as impaired with an applicable allowance for credit losses recognized. If not (for example if the loan is collectively assessed for impairment with other loans), the modification of the loan under a TDR will immediately result in the loan as being classified as impaired. An impairment loss for a loan modification under a TDR which only involves modification of the loan’s terms (rather than receipt of assets in full or partial settlement) is calculated in the same way as any other impaired loan. Assets received in full or partial satisfaction of a loan in a TDR are recognized at fair value.
F-
91
NOMURA HOLDINGS, INC.
NOTES TO THE CONSOLIDATED FINANCIAL STATEMENTS—(Continued)
As of March 31, 2020 and since such date, discussions continue with various borrowers to modify the existing contractual terms of certain loans. These modifications where the borrower is deemed to be in financial difficulty and Nomura has, or expects to, grant a financial concession would typically be accounted for as a TDR and the loan classified as impaired. However, consistent with guidance issued by US banking regulators in March 2020 as a result of the COVID-19 pandemic, modifications which meet the above criteria have not been accounted for TDRs nor the loan classified as impaired as of March 31, 2020 provided the borrower was current with payments prior to the COVID-19 pandemic, the nature of the concession is short-term and only permits a payment delay, waiver of fees or extension of repayment terms.
As of March 31, 2019, the amount of loans which were classified as impaired but against which no allowance for credit losses had been recognized was not significant. For impaired loans with a related allowance, the amount of recorded investment, the total unpaid principal balance and the related allowance was not significant.
As of March 31, 2020, the amount of loans which were classified as impaired but against which no allowance for credit losses had been recognized was not significant. For impaired loans with a related allowance, the amount of recorded investment and the total unpaid principal balance were ¥
14,678
million. The related allowance was ¥
8,282
million.
The amounts of TDRs which occurred during the years ended March 31, 2019 and 2020 were not significant.
Nonaccrual and past due loans
Loans which are individually evaluated as impaired are also placed on a nonaccrual status. When it is determined to suspend interest accrual as a result of an assessment, any accrued but unpaid interest is reversed. Loans are generally only returned to an accrual status if the loan is brought contractually current, i.e. all overdue principal and interest amounts are paid. In limited circumstances, a loan which has not been brought contractually current will also be returned to an accrual status if all principal and interest amounts contractually due are reasonably assured of repayment within a reasonable period of time or there has been a sustained period of repayment performance by the borrower.
Loans which have been modified, or are in the process of being modified, through modifications which do not meet the definition of a TDR through application of the interagency guidance referred to above have not been placed on a non-accrual status as of March 31, 2020.
As of March 31, 2019, the amount of loans which were placed on a nonaccrual status was not significant. The amount of loans which were 90 days past due was not significant.
As of March 31, 2020, there were ¥
14,658
million of loans which were placed on a nonaccrual status, primarily secured and unsecured corporate loans. The amount of loans which were 90 days past due was not significant.
Once a loan is impaired and placed on a nonaccrual status, interest income is subsequently recognized using the cash basis method.
F-92
NOMURA HOLDINGS, INC.
NOTES TO THE CONSOLIDATED FINANCIAL STATEMENTS—(Continued)
Credit quality indicators
Nomura is exposed to credit risks deriving from a decline in the value of loans or a default caused by deterioration of creditworthiness or bankruptcy of the obligor. Nomura’s risk management framework for such credit risks is based on a risk assessment through an internal rating process, in depth
pre-financing
credit analysis of each individual loan and continuous post-financing monitoring of obligor’s creditworthiness.
The following tables present an analysis of each class of loans not carried at fair value using Nomura’s internal ratings or equivalent credit quality indicators applied by subsidiaries as of March 31, 2019 and 2020.
|
|
Millions of yen
|
|||||||||||||||||||
|
|
March 31, 2019
|
|||||||||||||||||||
|
|
AAA-BBB
|
|
BB-CCC
|
|
CC-D
|
|
Others
(1)
|
|
Total
|
|
||||||||||
|
Secured loans at banks
|
¥ |
|
¥ |
|
¥ |
|
¥ |
|
¥ |
|
||||||||||
|
Unsecured loans at banks
|
|
|
|
—
|
|
|||||||||||||||
|
Short-term secured margin loans
|
|
|
|
|
|
|||||||||||||||
|
Unsecured inter-bank money market loans
|
|
|
|
—
|
|
|||||||||||||||
|
Secured corporate loans
|
|
|
|
|
|
|||||||||||||||
|
Unsecured corporate loans
|
|
|
|
|
|
|||||||||||||||
|
Total
|
¥ |
|
¥ |
|
¥ |
|
¥ |
|
¥ |
|
||||||||||
|
|
Millions of yen
|
|||||||||||||||||||
|
|
March 31, 2020
|
|||||||||||||||||||
|
|
AAA-BBB
|
|
BB-CCC
|
|
CC-D
|
|
Others
(1)
|
|
Total
|
|
||||||||||
|
Secured loans at banks
|
¥ |
|
¥ |
|
¥ |
|
¥ |
|
¥ |
|
||||||||||
|
Unsecured loans at banks
|
|
|
|
|
|
|||||||||||||||
|
Short-term secured margin loans
|
|
|
|
|
|
|||||||||||||||
|
Unsecured inter-bank money market loans
|
|
|
|
|
|
|||||||||||||||
|
Secured corporate loans
|
|
|
|
|
|
|||||||||||||||
|
Unsecured corporate loans
|
|
|
|
|
|
|||||||||||||||
|
Total
|
¥ |
|
¥ |
|
¥ |
|
¥ |
|
¥ |
|
||||||||||
| (1) | Relate to collateralized exposures where a specified ratio of LTV is maintained. |
F-93
NOMURA HOLDINGS, INC.
NOTES TO THE CONSOLIDATED FINANCIAL STATEMENTS—(Continued)
The following table presents a definition of each of the internal ratings used in the Nomura Group.
|
Rating Range
|
|
Definition
|
|
AAA
|
|
Highest credit quality. An obligor or facility has extremely strong capacity to meet its financial commitments. ‘AAA range’ is the highest credit rating assigned by Nomura. Extremely low probability of default.
|
|
|
|
|
|
AA
|
|
Very high credit quality category. An obligor or facility has very strong capacity to meet its financial commitments. Very low probability of default but above that of ‘AAA range.’
|
|
|
|
|
|
A
|
|
High credit quality category. An obligor or facility has strong capacity to meet its financial commitments but is somewhat more susceptible to the adverse effects of changes in circumstances and economic conditions than those in higher-rated categories. Low probability of default but higher than that of ‘AA range.’
|
|
|
|
|
|
BBB
|
|
Good credit quality category. An obligor or facility has adequate capacity to meet its financial commitments. However, adverse economic conditions or changing circumstances are more likely to lead to a weakened capacity to meet its financial commitments. Medium probability of default but higher than that of ‘A range.’
|
|
|
|
|
|
BB
|
|
Speculative credit quality category. An obligor or facility is less vulnerable in the near term than other lower-ratings. However, it faces major ongoing uncertainties and exposure to adverse business, financial, or economic conditions which could lead to the inadequate capacity to meet its financial commitments. Medium to high probability of default but higher than that of ‘BBB range.’
|
|
|
|
|
|
B
|
|
Highly speculative credit quality category. An obligor or facility is more vulnerable than those rated ‘BB range’, but the obligor currently has the capacity to meet its financial commitments. Adverse business, financial, or economic conditions will likely impair the issuer’s or obligor’s capacity or willingness to meet its financial commitments. High probability of default—more than that of ‘BB range.’
|
|
|
|
|
|
CCC
|
|
Substantial credit risk. An obligor or facility is currently vulnerable, and is dependent upon favorable business, financial, and economic conditions to meet its financial commitments. Strong probability of default—more than that of ‘B range.’
|
|
|
|
|
|
CC
|
|
An obligor or facility is currently highly vulnerable to nonpayment (default category).
|
|
|
|
|
|
C
|
|
An obligor or facility is currently extremely vulnerable to nonpayment (default category).
|
|
|
|
|
|
D
|
|
Failure of an obligor to make payments in full and on time of any financial obligations, markedly disadvantageous modification to a contractual term compared with the existing obligation, bankruptcy filings, administration, receivership, liquidation or other
winding-up
or cessation of business of an obligor or other similar situations.
|
Nomura reviews internal ratings at least once a year by using available credit information of borrowers (obligors) including financial statements and other information. Internal ratings are also reviewed more frequently for high-risk obligors, problematic exposures and upon the occurrence of significant regional or global credit events. As a result of the COVID-19 pandemic, the internal ratings of obligors in particular jurisdictions and sectors impacted by the pandemic were reviewed and updated in March and April 2020.
F-
9
4
NOMURA HOLDINGS, INC.
NOTES TO THE CONSOLIDATED FINANCIAL STATEMENTS—(Continued)
8. Leases:
Nomura as lessor
Nomura leases office buildings and aircrafts in Japan and overseas either as head lessor or through subleases. These leases and subleases are primarily classified as operating leases. The related assets are stated at cost, net of accumulated depreciation, except for land, which is stated at cost in the consolidated balance sheets and reported within
Other assets-Office buildings, land, equipment and facilities.
The following table presents the types of assets which Nomura leases under operating leases:
|
|
Millions of yen
|
|||||||||||||||||||||||
|
|
March 31
|
|||||||||||||||||||||||
|
|
2019
|
2020
|
||||||||||||||||||||||
|
|
Cost
|
|
Accumulated
depreciation
|
|
Net carrying
amount
|
|
Cost
|
|
Accumulated
depreciation
|
|
Net carrying
amount
|
|
||||||||||||
|
Real estate
(1)
|
¥ |
|
¥ |
(
|
) | ¥ |
|
¥ |
|
¥ |
(
|
) | ¥ |
|
||||||||||
|
Aircraft
|
|
(
|
) |
|
|
(
|
) |
|
||||||||||||||||
|
Total
|
¥ |
|
¥ |
(
|
) | ¥ |
|
¥ |
|
¥ |
(
|
) | ¥ |
|
||||||||||
| (1) | Cost, accumulated depreciation and net carrying amounts include amounts relating to real estate utilized by Nomura. |
Nomura recognized lease income of ¥
1,377
million, ¥
2,292
million and ¥
2,732
million for the years ended March 31, 2018, 2019 and 2020, respectively. These are included in the consolidated statements of income within
.
Revenue—Other
The following table presents an analysis of future undiscounted lease payments to be received in connection with noncancellable operating leases entered into by Nomura as lessor over the remaining lease term as of March 31, 2020. Amounts in connection with finance leases were not significant.
|
|
Millions of yen
|
|
||
|
March 31, 2020
|
|
|||
|
|
Minimum lease payments
to be received
|
|
||
|
Years of receipt
|
|
|||
|
Less than 1 year
|
¥ |
|
||
|
1 to 2 years
|
|
|||
|
2 to 3 years
|
|
|||
|
3 to 4 years
|
|
|||
|
4 to 5 years
|
|
|||
|
More than 5 years
|
|
|||
|
Total
|
¥ |
|
||
Nomura as lessee
Nomura enters into leases of office space, residential facilities for employees, motor vehicles, equipment and technology assets in the ordinary course of business in both Japan and overseas as lessee. These
F-
9
5
NOMURA HOLDINGS, INC.
NOTES TO THE CONSOLIDATED FINANCIAL STATEMENTS—(Continued)
arrangements predominantly consist of operating leases. Separately Nomura subleases certain real estate and equipment through operating lease arrangements. Nomura has adopted ASC 842 “
” with effect from April 1, 2019. The total carrying value of
(“ROU”) assets recognized in connection with operating leases as of March 31, 2020 was
¥
Leases
r
ight-of-use
The total carrying value of ROU asset recognized in connection with finance leases as of March 31, 2020 was not significant. These lease assets are reported within
in the consolidated balance sheets.
Other assets—Office buildings, land, equipment and facilities
Rental expenses, net of sublease rental income, for the years ended March 31, 2018 and 2019 under noncancellable operating lease agreements were ¥
44,202
million and ¥
44,564
million, respectively. The amount of capital lease assets as of March 31, 2019 was ¥
26,561
million and accumulated depreciations on such capital lease assets as of March 31, 2019 was ¥
8,272
million, which were reported within
in the consolidated balance sheets. Certain leases contain renewal options or escalation clauses providing for increased rental payments based upon maintenance, utilities and tax increases.
Other Assets—Office buildings, land, equipment and facilities
The
following table presents income and expense amounts recognized through the consolidated statements of income for leases where Nomura is acting as lessee for the year ended March 31, 2020. Amounts for finance lease cost, short-term lease cost, variable lease cost and net gains (losses) on qualifying sale and leaseback transactions were not significant to the consolidated statements of income for the year ended March 31, 2020
.
|
|
Millions of yen
|
|
||
|
|
Year ended
March 31, 2020
|
|
||
|
Lease expense:
|
|
|||
|
Operating lease
costs
|
¥ |
|
||
|
Other income and expenses:
|
|
|||
|
Gross sublease income
(1)
|
¥ |
|
||
| (1) | Gross sublease income represents income from subleases separate from lease payments made by Nomura on the head lease as lessee. |
Lease cash flow information
Lease payments made in cash in connection with operating leases are classified as operating activity in the consolidated statements of cash flows. The initial recognition of ROU assets and lease liabilities on lease commencement date represents noncash transactions.
The following table presents cash payments made by Nomura as lessee which meet the definition of lease payments and therefore have been included in the measurement of operating lease liabilities recorded under operating cash flows and the total amount of ROU assets and lease liabilities recognized during the year ended March 31, 2020
.
|
|
Millions of yen
|
|
||
|
|
Year ended
March 31, 2020
|
|
||
|
Operating cash
flows
for operating leases
|
¥ |
|
||
|
ROU assets recognized in connection with new operating leases
|
¥ |
|
||
F-
9
6
NOMURA HOLDINGS, INC.
NOTES TO THE CONSOLIDATED FINANCIAL STATEMENTS—(Continued)
Maturity analysis of lease liabilities
The following table presents an analysis of future undiscounted lease payments under operating leases entered into by Nomura as lessee over the remaining lease term as of March 31, 2020 and also represents a reconciliation between total of such lease payments and the discounted carrying value of operating lease liabilities recognized in the consolidated balance sheets as of March 31, 2020. Finance lease liabilities were not significant as of March 31, 2020. These lease liabilities are reported within
in the consolidated balance sheets
.
Other liabilities
|
|
Millions of yen
|
|
||
|
|
March 31, 2020
|
|
||
|
|
Operating leases
|
|
||
|
Years of payment
|
|
|
|
|
|
Less than 1 year
|
¥ |
|
||
|
1 to 2 years
|
|
|||
|
2 to 3 years
|
|
|||
|
3 to 4 years
|
|
|||
|
4 to 5 years
|
|
|||
|
More than 5 years
|
|
|||
|
Total undiscounted lease payments
|
¥ |
|
||
|
Less: Impact of discounting
|
(
|
) | ||
|
Lease liabilities as reported in the consolidated balance sheets
|
¥ |
|
||
The following table presents the weighted-average discount rate used to measure lease liabilities and the weighted-average remaining lease term of operating leases as of March 31, 2020.
|
|
March
31,
2020
|
|
||
|
|
Operati
ng leases
|
|
||
|
Weighted-average discount rate used to measure lease liabilities
|
|
|||
|
Weighted-average remaining lease term
|
|
|||
9. Business combinations:
On
April 1, 2020
, Nomura acquired
100
% of
Greentech Capital, LLC
(“Greentech”), a leading M&A advisory boutique in sustainable technology and infrastructure in the United States.
The acquisition of Greentech comprises an initial cash payment and additional contingent payments based on future performance of the company. The transaction has been accounted for as a business combination under ASC 805 and consideration for the purchase as used to determine goodwill was
¥
million which includes the estimated fair value of contingent payments accounted for as contingent consideration on acquisition date. Changes in the fair value of contingent consideration are recognized in the consolidated statements of income until the contingency is resolved. Contingent payments linked to future employment of employees of Greentech are recognized in the consolidated statements of income as compensation expense over the relevant service period and when payment of those amounts becomes
probable
.
F-
9
7
NOMURA HOLDINGS, INC.
NOTES TO THE CONSOLIDATED FINANCIAL STATEMENTS—(Continued)
10. Other assets—Other / Other liabilities:
The following table presents components of
and
in the consolidated balance sheets as of March 31, 2019 and 2020.
Other assets—Other
Other liabilities
|
|
Millions of yen
|
|||||||
|
|
March 31
|
|||||||
|
|
2019
|
|
2020
|
|
||||
|
Other assets—Other:
|
|
|
||||||
|
Securities received as collateral
|
¥ |
|
¥ |
|
||||
|
Goodwill and other intangible assets
|
|
|
||||||
|
Deferred tax assets
net
|
|
|
||||||
|
Investments in equity securities for other than operating purposes
(1)
|
|
|
||||||
|
Prepaid expenses
|
|
|
||||||
|
Other
|
|
|
||||||
|
Total
|
¥ |
|
¥ |
|
||||
|
Other liabilities:
|
|
|
||||||
|
Obligation to return securities received as collateral
|
¥ |
|
¥ |
|
||||
|
Accrued income taxes
|
|
|
||||||
|
Other accrued expenses and provisions
|
|
|
||||||
|
Other
(2)
|
|
|
||||||
|
Total
|
¥ |
|
¥ |
|
||||
| (1) |
Includes marketable and
non-marketable
equity securities held for other than trading or operating purposes. These investments
comprise
of listed equity securities and unlisted equity securities of ¥
Revenue—Other
|
|
(2)
|
As a result of adopting ASU 2016-02 as of April 1, 2019, operating lease liabilities are presented through
Other liabilities—Other
|
Goodwill is recognized upon completion of a business combination as the difference between the purchase price and the fair value of the net assets acquired. Subsequent to initial recognition, goodwill is not amortized but is tested for impairment during the fourth quarter of each fiscal year, or more often if events or circumstances, such as adverse changes in the business climate, indicate there may be impairment.
Impairment testing of goodwill is inherently subjective and often requires management judgment to determine when to perform an impairment test, whether qualitatively the fair value of a reporting unit exceeds its carrying value and also to estimate the fair value of a reporting unit when a quantitative impairment test is required.
An annual goodwill impairment test was performed in the fourth quarter. Whilst determination of fair value of the reporting unit was more subjective because of the impact of the COVID-19 pandemic, the estimated fair value of the reporting unit exceeded carrying value and therefore no impairment loss was recognized.
F-
9
8
NOMURA HOLDINGS, INC.
NOTES TO THE CONSOLIDATED FINANCIAL STATEMENTS—(Continued)
The following table presents changes in goodwill, which are reported in the consolidated balance sheets within
for the years ended March 31, 2019 and 2020.
Other assets—Other
|
|
Millions of yen
|
|||||||||||||||||||||||||||||||||||
|
|
Year ended March 31, 2019
|
|||||||||||||||||||||||||||||||||||
|
|
Beginning of year
|
Changes during year
|
End of year
|
|||||||||||||||||||||||||||||||||
|
|
Gross
carrying
amount
|
|
Accumulated
Impairment
|
|
Net
carrying
amount
|
|
Acquisition
|
|
Impairment
(2)
|
|
Other
(1)
|
|
Gross
carrying
amount
|
|
Accumulated
Impairment
|
|
Net
carrying
amount
|
|
||||||||||||||||||
|
Wholesale
|
¥ |
|
¥ |
(
|
) | ¥ |
|
¥ |
|
¥ |
(
|
) | ¥ |
|
¥ |
|
¥ |
(
|
) | ¥ |
|
|||||||||||||||
|
Other
|
|
|
|
|
|
|
|
|
|
|||||||||||||||||||||||||||
|
Total
|
¥ |
|
¥ |
(
|
) | ¥ |
|
¥ |
|
¥ |
(
|
) | ¥ |
|
¥ |
|
¥ |
(
|
) | ¥ |
|
|||||||||||||||
|
|
Millions of yen
|
|||||||||||||||||||||||||||||||||||
|
|
Year ended March 31, 2020
|
|||||||||||||||||||||||||||||||||||
|
|
Beginning of year
|
Changes during year
|
End of year
|
|||||||||||||||||||||||||||||||||
|
|
Gross
carrying
amount
|
|
Accumulated
Impairment
|
|
Net
carrying
amount
|
|
Acquisition
|
|
Impairment
|
|
Other
(1)
|
|
Gross
carrying
amount
|
|
Accumulated
Impairment
|
|
Net
carrying
amount
|
|
||||||||||||||||||
|
Wholesale
|
¥ |
|
¥ |
(
|
) | ¥ |
|
¥ |
|
¥ |
|
¥ |
|
¥ |
|
¥ |
(
|
) | ¥ |
|
||||||||||||||||
|
Other
|
|
|
|
|
|
(
|
) |
|
|
|
||||||||||||||||||||||||||
|
Total
|
¥ |
|
¥ |
(
|
) | ¥ |
|
¥ |
|
¥ |
|
¥ |
(
|
) | ¥ |
|
¥ |
(
|
) | ¥ |
|
|||||||||||||||
| (1) | Includes currency translation adjustments. |
| (2) |
For the year ended March 31, 2019, Nomura recognized impairment losses on goodwill of ¥
Non-interest expense—Other
|
During the fourth quarter, management considered but determined the COVID-19 pandemic did not indicate that certain finite-lived intangible assets were impaired. As a result, a formal impairment test over the relevant asset groups which include these intangible assets was not required.
The following table presents finite-lived intangible assets by type as of March 31, 2019 and 2020.
|
|
Millions of yen
|
|||||||||||||||||||||||
|
|
March 31, 2019
|
March 31, 2020
|
||||||||||||||||||||||
|
|
Gross
carrying
amount
|
|
Accumulated
amortization
|
|
Net carrying
amount
|
|
Gross
carrying
amount
|
|
Accumulated
amortization
|
|
Net carrying
amount
|
|
||||||||||||
|
Client relationships
|
¥ |
|
¥ |
(
|
) | ¥ |
|
¥ |
|
¥ |
(
|
) | ¥ |
|
||||||||||
|
Other
|
|
(
|
) |
|
|
(
|
) |
|
||||||||||||||||
|
Total
|
¥ |
|
¥ |
(
|
) | ¥ |
|
¥ |
|
¥ |
(
|
) | ¥ |
|
||||||||||
F
-9
9
NOMURA HOLDINGS, INC.
NOTES TO THE CONSOLIDATED FINANCIAL STATEMENTS—(Continued)
Amortization expenses for the years ended March 31, 2018, 2019 and 2020 were ¥
3,324
million, ¥
2,504
million and ¥
1,662
million, respectively. Estimated amortization expenses for the next five years are shown below.
|
|
Millions of yen
|
|
||
|
Year ending March 31
|
Estimated
amortization expense
|
|
||
|
2021
|
¥ |
|
||
|
2022
|
|
|||
|
2023
|
|
|||
|
2024
|
|
|||
|
2025
|
|
|||
The am
ounts of indefinite-lived intangibles, which primarily includes trademarks, were ¥
million and ¥
million as of March 31, 2019 and 2020, respectively.
An annual impairment test was performed in the fourth quarter against these intangibles. Whilst determination of fair value of these intangibles was more subjective because of the impact of the COVID-19 pandemic, the estimated fair value of each intangible exceeded carrying value and therefore no impairment loss was recognized.
F-100
NOMURA HOLDINGS, INC.
NOTES TO THE CONSOLIDATED FINANCIAL STATEMENTS—(Continued)
11. Borrowings:
The following table presents short-term and long-term borrowings of Nomura as of March 31, 2019 and 2020.
|
|
Millions of yen
|
|||||||
|
|
March 31
|
|||||||
|
|
2019
|
|
2020
|
|
||||
|
Short-term borrowings
(1)
:
|
|
|
||||||
|
Commercial paper
|
¥ |
|
¥ |
|
||||
|
Bank borrowings
|
|
|
||||||
|
Other
|
|
|
||||||
|
Total
|
¥ |
|
¥ |
|
||||
|
Long-term borrowings:
|
|
|
||||||
|
Long-term borrowings from banks and other financial institutions
(2)
|
¥ |
|
¥ |
|
||||
|
Bonds and notes issued
(3)
:
|
|
|
||||||
|
Fixed-rate obligations:
|
|
|
||||||
|
Japanese yen denominated
|
|
|
||||||
|
Non-Japanese
yen denominated
|
|
|
||||||
|
Floating-rate obligations:
|
|
|
||||||
|
Japanese yen denominated
|
|
|
||||||
|
Non-Japanese
yen denominated
|
|
|
||||||
|
Index / Equity-linked obligations:
|
|
|
||||||
|
Japanese yen denominated
|
|
|
||||||
|
Non-Japanese
yen denominated
|
|
|
||||||
|
|
|
|
||||||
|
Subtotal
|
|
|
||||||
|
Trading balances of secured borrowings
|
|
|
||||||
|
Total
|
¥ |
|
¥ |
|
||||
| (1) |
Includes secured borrowings of ¥
|
| (2) |
Includes secured borrowings of ¥
|
| (3) |
Includes secured borrowings of ¥
|
Trading balances of secured borrowings
These are liabilities recognized when a transfer of a financial asset does not meet the criteria for sales accounting under ASC 860 and therefore the transaction is accounted for as a secured borrowing. These borrowings are part of Nomura’s trading activities intended to generate profits from the distribution of financial products secured by those financial assets.
F-
10
1
NOMURA HOLDINGS, INC.
NOTES TO THE CONSOLIDATED FINANCIAL STATEMENTS—(Continued)
Long-term borrowings consisted of the following:
|
|
Millions of yen
|
|||||||
|
|
March 31
|
|||||||
|
|
2019
|
|
2020
|
|
||||
|
Debt issued by the Company
|
¥ |
|
¥ |
|
||||
|
Debt issued by subsidiaries—guaranteed by the Company
|
|
|
||||||
|
Debt issued by subsidiaries—not guaranteed by the Company
(1)
|
|
|
||||||
|
Total
|
¥ |
|
¥ |
|
||||
| (1) | Includes trading balances of secured borrowings. |
As of March 31, 2019, fixed-rate long-term borrowings mature between
2019
and
2067
at interest rates ranging from
0.00
% to
24.40
%. Excluding perpetual subordinated debts, floating-rate obligations, which are generally based on LIBOR, mature between
2019
and
2049
at interest rates ranging from
0.00
% to
6.78
%. Index / Equity-linked obligations mature between
2019
and
2049
at interest rates ranging from
0.00
% to
30.30
%.
As of March 31, 2020, fixed-rate long-term borrowings mature between
2020
and
2067
at interest rates ranging from
0.00
% to
24.40
%. Excluding perpetual subordinated debts, floating-rate obligations, which are generally based on LIBOR, mature between
2020
and
2050
at interest rates ranging from
0.00
% to
5.00
%. Index / Equity-linked obligations mature between
2020
and
2050
at interest rates ranging from
0.00
% to
39.90
%.
Certain borrowing agreements contain provisions whereby the borrowings are redeemable at the option of the borrower at specified dates prior to maturity and include various equity-linked or other index-linked instruments.
Nomura enters into swap agreements to manage its exposure to interest rates and foreign exchange rates. Principally, debt securities and notes issued are effectively converted to LIBOR-based floating rate obligations through such swap agreements. The carrying value of the long-term borrowings includes adjustments to reflect fair value hedges.
Following table presents the effective weighted-average interest rates of borrowings, including the effect of fair value hedges as of March 31, 2019 and 2020.
|
|
March 31
|
|||||||
|
|
2019
|
|
2020
|
|
||||
|
Short-term borrowings
|
|
% |
|
% | ||||
|
Long-term borrowings
|
|
% |
|
% | ||||
|
Fixed-rate obligations
|
|
% |
|
% | ||||
|
Floating-rate obligations
|
|
% |
|
% | ||||
|
Index / Equity-linked obligations
|
|
% |
|
% | ||||
F-
10
2
NOMURA HOLDINGS, INC.
NOTES TO THE CONSOLIDATED FINANCIAL STATEMENTS—(Continued)
Maturities of long-term borrowings
The following table presents the aggregate annual maturities of long-term borrowings, including adjustments related to fair value hedges and liabilities measured at fair value, as of March 31, 2020:
|
Year ending March 31
|
Millions of yen
|
|
||
|
2021
|
¥ |
|
||
|
2022
|
|
|||
|
2023
|
|
|||
|
2024
|
|
|||
|
2025
|
|
|||
|
2026 and thereafter
|
|
|||
|
Subtotal
|
|
|||
|
Trading balances of secured borrowings
|
|
|||
|
Total
|
¥ |
|
||
Borrowing facilities
As of March 31, 2019 and 2020, Nomura had unutilized borrowing facilities of ¥
nil and ¥
nil, respectively.
Subordinated borrowings
As of March 31, 2019 and 2020, subordinated borrowings were ¥
418,200
million and ¥
318,200
million, respectively.
12. Earnings per share:
Basic and diluted earnings per share (“EPS”) are presented on the face of the consolidated statements of income. Basic EPS is calculated by dividing net income (loss) attributable to NHI shareholders by the weighted average number of the Company’s common shares outstanding during the year. The calculation of diluted EPS is similar to basic EPS, except that the weighted average number of the Company’s common shares is adjusted to reflect all dilutive instruments where the Company’s common shares are potentially deliverable during the year. In addition, net income (loss) attributable to NHI shareholders is adjusted for any change in income or loss that would result from the assumed conversion of dilutive instruments issued by subsidiaries and affiliates.
F-
10
3
NOMURA HOLDINGS, INC.
NOTES TO THE CONSOLIDATED FINANCIAL STATEMENTS—(Continued)
The following table presents a reconciliation of the amounts and the numbers used in the calculation of net income (loss) attributable to NHI shareholders per share (basic and diluted) for the years ended March 31, 2018, 2019 and 2020.
|
|
Millions of yen
except per share data presented in yen
|
|||||||||||
|
|
Year ended March 31
|
|||||||||||
|
|
2018
|
|
2019
|
|
2020
|
|
||||||
|
Basic—
|
|
|
|
|||||||||
|
Net income (loss) attributable to NHI shareholders
|
¥ |
|
¥ |
(
|
) | ¥ |
|
|||||
|
Weighted average number of shares outstanding
|
|
|
|
|||||||||
|
Net income (loss) attributable to NHI shareholders per share
|
¥ |
|
¥ |
(
|
) | ¥ |
|
|||||
|
Diluted
—
|
|
|
|
|||||||||
|
Net income (loss) attributable to NHI shareholders
|
¥ |
|
¥ |
(
|
) | ¥ |
|
|||||
|
Weighted average number of shares outstanding
|
|
|
|
|||||||||
|
Net income (loss) attributable to NHI shareholders per share
|
¥ |
|
¥ |
(
|
) | ¥ |
|
|||||
Net income (loss) attributable to NHI shareholders was adjusted to reflect the decline in Nomura’s equity share of earnings of subsidiaries and affiliates for the years ended March 31, 2018, 2019 and 2020 arising from options to purchase common shares issued by subsidiaries and affiliates.
The weighted average number of shares used in the calculation of diluted EPS reflects the increase in potential issuance of the Company’s common shares arising from stock-based compensation plans by the Company and affiliates, which would have minimal impact on EPS for the years ended March 31, 2018, 2019 and 2020.
Antidilutive stock options and other stock-based compensation plans to purchase or deliver
13,035,600
,
104,496,000
and
15,452,900
of the Company’s common shares were not included in the computation of diluted EPS for the years ended March 31, 2018, 2019 and 2020, respectively.
Subsequent Events
On May
” for further information.
27
, 2020, the Company adopted a resolution to grant Restricted Stock Units (“RSUs”). See Note 14 “
Deferred compensation awards
13. Employee benefit plans:
Nomura provides various pension plans and other post-retirement benefits which cover certain eligible employees worldwide. In addition, Nomura provides health care benefits to certain active and retired employees through its Nomura Securities Health Insurance Society (“NSHIS”).
Defined benefit pension plans—
The Company and certain subsidiaries in Japan (“Japanese entities”) have contributory funded benefit pension plans for eligible employees. The benefits are paid as annuity payments subsequent to retirement or as
F-
10
4
NOMURA HOLDINGS, INC.
NOTES TO THE CONSOLIDATED FINANCIAL STATEMENTS—(Continued)
lump-sum
payments at the time of retirement based on a combination of years of service, age at retirement and employee’s choice. The benefits under the plans are calculated based upon position, years of service and reason for retirement. In addition to the plans described above, certain Japanese entities also have unfunded
lump-sum
payment plans. Under these plans, employees with at least
lump-sum
payments upon termination of employment. The benefits under the plans are calculated based upon position, years of service and the reason for retirement. Nomura’s funding policy is to contribute annually the amount necessary to satisfy local funding standards. In December 2008, certain contributory funded benefit pension plans and unfunded
lump-sum
payment plans were amended and “Cash balance pension plans” were introduced. Participants receive an annual benefit in their cash balance pension plan accounts, which is computed based on compensation of the participants, adjusted for the changes in market interest rate.
Interest rate applicable to cash balance pension plans is set in April of each fiscal year based on Japanese Yen LIBOR 12 months. The interest rate which was applied to the year ended March 31, 2020 was
0.09033
%.
In
April
2020, certain Japanese entities amended their pension plans. Certain
defined
benefit pension plans and unfunded
lump-sum
payment plans were
either closed for additional funding or
abolished. Defined contribution pension plans and cash balance pension plans have replaced them
for future contributions
.
Certain overseas subsidiaries have various local defined benefit plans covering certain employees. Nomura recognized an asset for surplus pension benefits for these plans amounting to ¥
12,762
million and ¥
13,949
million as of March 31, 2019 and 2020, respectively.
Net periodic benefit cost
The following table presents the components of net periodic benefit cost for defined benefit plans of Japanese entities for the years ended March 31, 2018, 2019 and 2020. Nomura’s measurement date is March 31 for defined benefit plans of Japanese entities.
|
|
Millions of yen
|
|||||||||||
|
|
Year ended March 31
|
|||||||||||
|
|
2018
|
|
2019
|
|
2020
|
|
||||||
|
Service cost
|
¥ |
|
¥ |
|
¥ |
|
||||||
|
Interest cost
|
|
|
|
|||||||||
|
Expected return on plan assets
|
(
|
) |
(
|
) |
(
|
) | ||||||
|
Amortization of net actuarial losses
|
|
|
|
|||||||||
|
Amortization of prior service cost
|
(
|
) |
(
|
) |
(
|
) | ||||||
|
Net periodic benefit cost
|
¥ |
|
¥ |
|
¥ |
|
||||||
Prior service cost is amortized on a straight-line basis over the average remaining service period of active participants. Gains and losses in excess of
10
% of the greater of the projected benefit obligation or the fair value of plan assets are amortized over the average remaining service period of active participants, which is
14
years.
F-
10
5
NOMURA HOLDINGS, INC.
NOTES TO THE CONSOLIDATED FINANCIAL STATEMENTS—(Continued)
Benefit obligations and funded status
The following table presents a reconciliation of changes in projected benefit obligation (“PBO”) and the fair value of plan assets, as well as a summary of the funded status of Japanese entities’ plans as of, and for the years ended March 31, 2019 and 2020.
|
|
Millions of yen
|
|||||||
|
|
As of or for the year
ended March 31 |
|||||||
|
|
2019
|
|
2020
|
|
||||
|
Change in projected benefit obligation:
|
|
|
|
|
|
|
||
|
Projected benefit obligation at beginning of year
|
¥ |
|
¥ |
|
||||
|
Service cost
|
|
|
||||||
|
Interest cost
|
|
|
||||||
|
Actuarial gain
|
|
(
|
) | |||||
|
Benefits paid
|
(
|
) |
(
|
) | ||||
|
Amendments of pension benefit plans
|
—
|
(
|
) | |||||
|
Acquisition, divestitures and other
|
|
|
||||||
|
Projected benefit obligation at end of year
|
¥ |
|
¥ |
|
||||
|
Change in plan assets:
|
|
|
|
|
|
|
||
|
Fair value of plan assets at beginning of year
|
¥ |
|
¥ |
|
||||
|
Actual return on plan assets
|
|
(
|
) | |||||
|
Employer contributions
|
|
|
||||||
|
Benefits paid
|
(
|
) |
(
|
) | ||||
|
Fair value of plan assets at end of year
|
¥ |
|
¥ |
|
||||
|
Funded status at end of year
|
(
|
) |
(
|
) | ||||
|
Amounts recognized in the consolidated balance sheets
|
¥ |
(
|
) | ¥ |
(
|
) | ||
The accumulated benefit obligation (“ABO”) was ¥
315,423
million and ¥
303,523
million as of March 31, 2019 and 2020, respectively.
In
April
2020, defined contribution pension plans and cash balance pension plans were adopted
for future contributions
following the amendments of pension benefit plans. Certain contributory
defined
benefit pension plans were closed for additional funding and will be managed within the accumulated funds. Unfunded
lump-sum
payment plans were abolished and transferred to cash balance plans with the calculated amount of
lump-sum
retirement payment as of the amendment date.
F-
10
6
NOMURA HOLDINGS, INC.
NOTES TO THE CONSOLIDATED FINANCIAL STATEMENTS—(Continued)
The following table presents the PBO, ABO and fair value of plan assets for Japanese entities’ plans with ABO and PBO in excess of plan assets as of March 31, 2019 and 2020.
|
|
Millions of yen
|
|||||||
|
|
March 31
|
|||||||
|
|
2019
|
|
2020
|
|
||||
|
Plans with ABO in excess of plan assets:
|
|
|
|
|
|
|
||
|
PBO
|
¥ |
|
¥ |
|
||||
|
ABO
|
|
|
||||||
|
Fair value of plan assets
|
|
|
||||||
|
Plans with PBO in excess of plan assets:
|
|
|
|
|
|
|
||
|
PBO
|
¥ |
|
¥ |
|
||||
|
ABO
|
|
|
||||||
|
Fair value of plan assets
|
|
|
||||||
The following table presents
that have not yet been recognized as components of net periodic benefit cost during the year ended March 31, 2020.
pre-tax
amounts of Japanese entities’ plans deferred in
Accumulated other comprehensive income (loss)
|
|
Millions of yen
|
|
||
|
|
For the year ended
March 31, 2020
|
|
||
|
Net actuarial loss
|
¥ |
|
||
|
Net prior service cost
|
(
|
) | ||
|
Total
|
¥ |
|
||
Pre-tax
amounts of Japanese entities’ plans in accumulated other comprehensive income which are expected to be recognized as components of net periodic benefit cost over the next fiscal year are as follows.
|
|
Millions of yen
|
|
||
|
|
For the year ending
March 31, 2021
|
|
||
|
Net actuarial loss
|
¥ |
|
||
|
Net prior service cost
|
(
|
) | ||
|
Total
|
¥ |
|
||
Assumptions
The following table presents the weighted-average assumptions used to determine projected benefit obligations of Japanese entities’ plans as of March 31, 2019 and 2020.
|
|
March 31
|
|||||||
|
|
2019
|
|
2020
|
|
||||
|
Discount rate
|
|
% |
|
% | ||||
|
Rate of increase in compensation levels
|
|
% |
|
% | ||||
F-
10
7
NOMURA HOLDINGS, INC.
NOTES TO THE CONSOLIDATED FINANCIAL STATEMENTS—(Continued)
The following table presents the weighted-average assumptions used to determine the net periodic benefit cost of Japanese entities’ plans as of March 31, 2018, 2019 and 2020.
|
|
Year ended March 31
|
|||||||||||
|
|
2018
|
|
2019
|
|
2020
|
|
||||||
|
Discount rate
|
|
% |
|
% |
|
% | ||||||
|
Rate of increase in compensation levels
|
|
% |
|
% |
|
% | ||||||
|
Expected long-term rate of return on plan assets
|
|
% |
|
% |
|
% | ||||||
Nomura generally determines the discount rates for its defined benefit plans by referencing indices for long-term, high-quality debt securities and ensuring that the discount rate does not exceed the yield reported for those indices after adjustment for the duration of the plans’ liabilities.
Nomura uses the expected long-term rate of return on plan assets to compute the expected return on assets. Nomura’s approach in determining the long-term rate of return on plan assets is primarily based on historical financial market relationships that have existed over time with the presumption that this trend will generally remain constant in the future.
Plan assets
Plan assets are managed with an objective to generate sufficient long-term value in order to enable future pension payouts. While targeting a long-term rate of return on plan assets, Nomura aims to minimize short-term volatility by managing the portfolio through diversifying risk. Based on this portfolio policy, the plan assets are invested diversely.
The plan assets of domestic plans target to invest
15
% in equities (including private equity investments),
44
% in debt securities,
25
% in life insurance company general accounts, and
16
% in other investments. Investment allocations are generally reviewed and revised at the time of the actual revaluation that takes place every five years or when there is a significant change in the portfolio assumptions.
For details of the levels of inputs used to measure the fair value of plan assets, see Note 2 “
”.
Fair value measurements
F-
10
8
NOMURA HOLDINGS, INC.
NOTES TO THE CONSOLIDATED FINANCIAL STATEMENTS—(Continued)
The following tables present information about the fair value of plan assets of Japanese entities’ plans as of March 31, 2019 and March 31, 2020 within the fair value hierarchy.
|
|
Millions of yen
|
|||||||||||||||
|
|
March 31, 2019
|
|||||||||||||||
|
|
Level 1
|
|
Level 2
|
|
Level 3
|
|
Balance as of
March 31,
2019 |
|
||||||||
|
Pension plan assets:
|
|
|
|
|
||||||||||||
|
Equities
|
¥ |
|
¥ |
|
¥ |
|
¥ |
|
||||||||
|
Private equity and pooled investments
(1)
|
|
|
|
|
||||||||||||
|
Japanese government securities
|
|
|
|
|
||||||||||||
|
Foreign government, agency and municipal securities
|
|
|
|
|
||||||||||||
|
Bank and corporate debt securities
|
|
|
|
|
||||||||||||
|
Investment trust funds and other
(2)(3)
|
|
|
|
|
||||||||||||
|
Life insurance company general accounts
|
|
|
|
|
||||||||||||
|
Other assets
|
|
|
|
|
||||||||||||
|
Total
|
¥ |
|
¥ |
|
¥ |
|
¥ |
|
||||||||
|
|
Millions of yen
|
|||||||||||||||
|
|
March 31, 2020
|
|||||||||||||||
|
|
Level 1
|
|
Level 2
|
|
Level 3
|
|
Balance as of
March 31,
2020 |
|
||||||||
|
Pension plan assets:
|
|
|
|
|
||||||||||||
|
Equities
|
¥ |
|
¥ |
|
¥ |
|
¥ |
|
||||||||
|
Private equity and pooled investments
(1)
|
|
|
|
|
||||||||||||
|
Japanese government securities
|
|
|
|
|
||||||||||||
|
Foreign government, agency and municipal securities
|
|
|
|
|
||||||||||||
|
Bank and corporate debt securities
|
|
|
|
|
||||||||||||
|
Investment trust funds and other
(2)(3)
|
|
|
|
|
||||||||||||
|
Life insurance company general accounts
|
|
|
|
|
||||||||||||
|
Other assets
|
|
|
|
|
||||||||||||
|
Total
|
¥ |
|
¥ |
|
¥ |
|
¥ |
|
||||||||
|
(1)
|
Includes corporate type equity investments.
|
|
(2)
|
Includes mainly debt investment funds. Hedge funds and real estate funds are also included.
|
|
(
3
)
|
Certain assets that are measured at fair value using net asset value per share as a practical expedient have not been classified in the fair value hierarchy. As of March 31,
2019
and March 31,
2020
, the fair values of these assets were ¥
|
The fair value of plan assets of
3,711
million, ¥
167
million and ¥
38,991
million which were classified in Level 1, Level 2 and Level 3 of the fair value hierarchy, respectively. The fair value of plan assets of
1,766
million, ¥
1,522
million and ¥
37,703
million which were classified in Level 1, Level 2 and Level 3 of the fair value hierarchy, respectively.
non-Japanese
entities’ plans as of March 31, 2019 was ¥
non-Japanese
entities’ plans as of March 31, 2020 was ¥
F-
10
9
NOMURA HOLDINGS, INC.
NOTES TO THE CONSOLIDATED FINANCIAL STATEMENTS—(Continued)
See Note 2 “
” for further information regarding how Nomura estimates fair value for specific types of financial instruments.
Fair value measurements
The following tables present information about plan assets of Japanese entities’ plans for which Nomura has utilized significant Level 3 valuation inputs to estimate fair value.
|
|
Millions of yen
|
|||||||||||||||
|
|
Year ended March 31, 2019
|
|
|
|||||||||||||
|
|
Balance
as of
April 1,
2018
|
|
Unrealized
and realized
gains / loss
|
|
Purchases /
sales and
other
settlement
|
|
Balance
as of
March 31,
2019
|
|
||||||||
|
Private equity and pooled investments
|
¥ |
|
¥ |
(
|
) | ¥ |
|
¥ |
|
|||||||
|
Investment trust funds and other
|
|
|
|
|
||||||||||||
|
Total
|
¥ |
|
¥ |
|
¥ |
|
¥ |
|
||||||||
|
|
Millions of yen
|
|||||||||||||||
|
|
Year ended March 31, 2020
|
|
|
|||||||||||||
|
|
Balance
as of
April 1,
2019
|
|
Unrealized
and realized
gains / loss
|
|
Purchases /
sales and
other
settlement
|
|
Balance
as of
March 31,
2020
|
|
||||||||
|
Private equity and pooled investments
|
¥ |
|
¥ |
(
|
) | ¥ |
|
¥ |
|
|||||||
|
Investment trust funds and other
|
|
(
|
) |
(
|
) |
|
||||||||||
|
Total
|
¥ |
|
¥ |
(
|
) | ¥ |
|
¥ |
|
|||||||
The fair value of Level 3 plan assets of
38,991
million and ¥
37,703
million as of March 31, 2019 and 2020, respectively. The amount of unrealized profit (loss) of Level 3 assets was ¥
4,358
million and ¥
2,509
million as of March 31, 2019 and 2020, respectively. The amounts of gains and losses, purchases and sales other than above, transfers between Level 1 or Level 2 and Level 3 relating to these assets during the years ended March 31, 2019 and 2020 were not significant.
non-Japanese
entities’ plans, mainly consisting of annuities, was ¥
Cash Flows
Following the amendments of pension benefit plans in Japanese entities, certain contributory funded benefit pension plans were closed for additional funding and will be managed within the accumulated funds.
The following table presents the expected benefit payments of Japanese entities’ plans during the next five fiscal years and in aggregate for the five fiscal years thereafter.
|
Year ending March 31
|
Millions of yen
|
|
||
|
2021
|
¥ |
|
||
|
2022
|
|
|||
|
2023
|
|
|||
|
2024
|
|
|||
|
2025
|
|
|||
|
2026-2030
|
|
|||
F-
1
1
0
NOMURA HOLDINGS, INC.
NOTES TO THE CONSOLIDATED FINANCIAL STATEMENTS—(Continued)
Defined contribution pension plans—
In addition to defined benefit pension plans, the Company, NSC and other Japanese and
non-Japanese
subsidiaries have defined contribution pension plans.
Nomura contributed ¥
3,627
million, ¥
3,614
million and ¥
3,585
million to defined contribution pension plans for Japanese entities’ plans for the years ended March 31, 2018, 2019 and 2020, respectively.
The contributions to overseas defined contribution pension plans were ¥
9,265
million, ¥
9,293
million and ¥
8,497
million for the years ended March 31, 2018, 2019 and 2020, respectively.
Health care benefits—
The Company and certain subsidiaries provide certain health care benefits to both active and retired employees through NSHIS. The Company and certain subsidiaries also sponsor certain health care benefits to retired employees (“Special Plan”) and who participate in the Special Plan on a
8,082
million, ¥
9,828
million and ¥
9,308
million for the years ended March 31, 2018, 2019 and 2020, respectively.
pay-all
basis, i.e., by requiring a retiree contribution based on the estimated per capita cost of coverage. The Special Plan is a multi-employer post-retirement plan because it is jointly administered by NSHIS and the Japanese government, and the funded status of it is not computed separately. Therefore, although the Company and certain subsidiaries contribute some portion of the cost of retiree health care benefits not covered through retiree contributions, the Company and certain subsidiaries do not reserve for future costs. The health care benefit costs, which are equivalent to the required contribution, amounted to ¥
14. Deferred compensation awards:
Nomura issues deferred compensation awards to senior management and employees, certain of which are linked to the price of the Company’s common stock, in order to retain and motivate key staff.
These stock-based compensation awards comprise Restricted Stock Unit (“RSU”) awards, Plan A and Plan B Stock Acquisition Right (“SAR”) awards, Notional Stock Unit (“NSU”) awards, and Collared Notional Stock Unit (“CSU”) awards. SAR Plan A awards are awards of stock options while RSU awards, SAR Plan B awards, NSU awards and CSU awards are analogous to awards of restricted common stock. The Company also issues other deferred compensation awards, namely Notional Indexed Unit (“NIU”) awards which are linked to a world stock index quoted by Morgan Stanley Capital International.
Certain deferred compensation awards include “Full Career Retirement” (“FCR”) provisions which permit recipients of the awards to continue to vest in the awards upon voluntary termination of employment if certain criteria based on corporate title and length of service within Nomura are met. The requisite service period for these awards ends on the earlier of the contractual vesting date and the date that the recipients become eligible for or claim FCR.
Unless indicated below, deferred compensation awards are generally reduced, forfeited or clawed back in the event of termination of employment, material restatements of financial statements, material conduct issues, material damage to Nomura’s business or reputation, material downturns in the performance of the Nomura group and/or a material failure of risk management.
F-
111
NOMURA HOLDINGS, INC.
NOTES TO THE CONSOLIDATED FINANCIAL STATEMENTS—(Continued)
RSU awards
The Company introduced RSU awards in the fiscal year ended March 31, 2018, and granted the first RSU awards in May 2018. For each RSU award, one common stock of the Company is delivered. The awards generally have a graded vesting period
over
three years
with an extending vesting period of up to
seven years
for certain senior management and employees in order to meet local regulatory requirements based on the role they perform within Nomura.
The grant date fair value per award is determined using the price of the Company’s common stock.
The following table presents activity relating to RSU awards for the year ended March 31, 2020.
|
|
Outstanding
(number of Nomura
shares)
|
|
Weighted-average
grant date fair
value per share
|
|
Weighted-average
remaining life
until expiry
(years)
|
|
||||||
|
Outstanding as of March 31, 2019
|
|
¥ |
|
|
||||||||
|
Granted
|
|
|
|
|||||||||
|
Forfeited
|
(
|
) |
|
|
||||||||
|
Delivered
|
(
|
) |
|
|
||||||||
|
Outstanding as of March 31, 2020
|
|
¥ |
|
|
||||||||
The weighted-average grant date fair value per award for the year ended March 31, 2019 and 2020 was ¥
530
and ¥
365
, respectively.
There were no vested RSU awards nor delivered shares during the year ended March 31, 2019.
The total intrinsic value of RSU awards vested
during the year ended March 31, 2020
was ¥
6,613
million. The total of
9,926,385
shares was delivered during the year ended March 31, 2020 and its intrinsic value was ¥
6,231
million. The aggregate intrinsic value of RSU awards outstanding as of March 31, 2020 was ¥
28,997
million.
As of March 31, 2020, total unrecognized compensation cost relating to RSU awards was ¥
3,681
million which is expected to be recognized over a weighted average period of
1.6
years.
SAR Plan A awards
The Company issues SAR Plan A awards linked to the price of the Company’s common stock pursuant to several stock option plans. These awards vest and are exercisable into the Company’s common stock approximately
two years
after grant date and expire approximately
seven years
after grant date. The exercise price is generally not less than the fair value of the Company’s common stock on grant date. These awards are subject to the above reduction and forfeiture provisions but are not subject to claw back.
The grant date fair value of SAR Plan A awards is estimated using a Black-Scholes option-pricing model and using the following assumptions:
| • | Expected volatilities based on historical volatility of the Company’s common stock; |
| • | Expected dividend yield based on the current dividend rate at the time of grant; |
| • | Expected lives of the awards determined based on historical experience; and |
F-
112
NOMURA HOLDINGS, INC.
NOTES TO THE CONSOLIDATED FINANCIAL STATEMENTS—(Continued)
|
|
•
|
Expected risk-free interest rate based on Japanese Yen swap rate with a maturity equal to the expected lives of the options.
|
The weighted-average grant date fair value of SAR Plan A awards granted during the years ended March 31, 2018 and 2019 was ¥
110
and ¥
79
per share, respectively. There was
no
SAR Plan A award granted during the year ended March 31, 2020. The weighted-average assumptions used in each of these years were as follows.
|
|
Year ended March 31
|
|||||||||||
|
|
2018
|
|
2019
|
|
2020
|
|
||||||
|
Expected volatility
|
|
% |
|
% |
|
% | ||||||
|
Expected dividends yield
|
|
% |
|
% |
|
% | ||||||
|
Expected lives (in years)
|
|
|
|
|||||||||
|
Risk-free interest rate
|
|
% |
|
% |
|
% | ||||||
The following table presents activity relating to SAR Plan A awards for the year ended March 31, 2020.
|
|
Outstanding
(number of Nomura
shares)
|
|
Weighted-average
exercise price
|
|
Weighted-average
remaining life
until expiry
(years)
|
|
||||||
|
Outstanding as of March 31, 2019
|
|
¥ |
|
|
||||||||
|
Granted
|
|
|
|
|||||||||
|
Exercised
|
(
|
) |
|
|
||||||||
|
Forfeited
|
(
|
) |
|
|
||||||||
|
Expired
|
(
|
) |
|
|
||||||||
|
Outstanding as of March 31, 2020
|
|
¥ |
|
|
||||||||
|
Exercisable as of March 31, 2020
|
|
¥ |
|
|
||||||||
The total intrinsic value of SAR Plan A awards exercised during the years ended March 31, 2018, 2019 and 2020 was ¥
450
million, ¥
241
million and ¥
139
million, respectively.
The aggregate intrinsic value of SAR Plan A awards outstanding and exercisable as of March 31, 2020 was both ¥
nil, respectively.
As of March 31, 2020, total unrecognized compensation cost relating to SAR Plan A awards was ¥
62
million which is expected to be recognized over a weighted average period of
0.6
years. The total fair value of SAR Plan A awards which vested during the years ended March 31, 2018, 2019 and 2020 was ¥
nil, respectively.
SAR Plan B awards
The Company issues SAR Plan B awards linked to the price of the Company’s common stock pursuant to several stock unit plans. These awards vest and are exercisable into the Company’s common stock, have an exercise price of ¥
1
per share and graded vesting generally over
three years
with certain longer vesting or holding periods where required under local regulations.
The grant date fair value of SAR Plan B awards is determined using the price of the Company’s common stock.
F-
11
3
NOMURA HOLDINGS, INC.
NOTES TO THE CONSOLIDATED FINANCIAL STATEMENTS—(Continued)
The following table presents activity relating to SAR Plan B awards for the year ended March 31, 2020. No new SAR Plan B awards have been granted since April 1, 2018.
|
|
Outstanding
(number of Nomura
shares)
|
|
Weighted-average
grant date fair
value per share
|
|
Weighted-average
remaining life
until expiry
(years)
|
|
||||||
|
Outstanding as of March 31, 2019
|
|
¥ |
|
|
||||||||
|
Granted
|
|
|
|
|||||||||
|
Exercised
|
(
|
) |
|
|
||||||||
|
Forfeited
|
(
|
) |
|
|
||||||||
|
Expired
|
(
|
) |
|
|
||||||||
|
Outstanding as of March 31, 2020
|
|
¥ |
|
|
||||||||
|
Exercisable as of March 31, 2020
|
|
¥ |
|
|
||||||||
The weighted-average grant date fair value per share for the years ended March 31, 2018 was ¥
588
.
No SAR Plan B award was granted for the year ended March 31, 2019 and 2020.
The total intrinsic value of SAR Plan B awards exercised during the years ended March 31, 2018, 2019 and 2020 was ¥
21,740
million, ¥
8,896
million and ¥
7,640
million, respectively.
The aggregate intrinsic value of SAR Plan B awards outstanding and exercisable as of March 31, 2020 was ¥
10,204
million and ¥
7,394
million, respectively.
As of March 31, 2020, total unrecognized compensation cost relating to SAR Plan B awards was ¥
30
million which is expected to be recognized over a weighted average period of
1.7
years. The total fair value of SAR Plan B awards which vested during the years ended March 31, 2018, 2019 and 2020 was ¥
17,539
million, ¥
10,757
million and ¥
4,309
million, respectively.
Total compensation expense recognized within
in the consolidated statements of income relating to RSU, SAR Plan A, and SAR Plan B awards for the years ended March 31, 2018, 2019 and 2020 was ¥
9,650
million, ¥
21,814
million and ¥
12,694
million, respectively.
Non-interest expenses—Compensation and benefits
Cash received from the exercise of SAR Plan A and SAR Plan B awards during the year ended March 31, 2020 was ¥
285
million and the tax benefit realized from exercise of these awards was ¥
785
million.
Total related tax benefits recognized in the consolidated statements of income relating to
566
million, ¥
90
million and ¥
13
million, respectively. The dilutive effect of outstanding deferred compensation plans is included in the weighted average number of shares outstanding used in diluted EPS computations. See Note 12
for further information.
RSU,
SAR Plan A
and
SAR Plan B awards for the years ended March 31, 2018, 2019 and 2020 were ¥
“Earnings per share”
NSU and CSU awards
NSU and CSU awards are cash-settled awards linked to the price of the Company’s common stock. NSU awards replicate the key features of SAR Plan B awards described above but are settled in cash rather than exercisable into the Company’s common stock. CSU awards are similar to NSU awards but exposure to movements in the price of the Company’s common stock is subject to a cap and floor. Both types of award have graded vesting periods generally over
three years
with certain longer vesting periods where required by local regulations.
F-
11
4
NOMURA HOLDINGS, INC.
NOTES TO THE CONSOLIDATED FINANCIAL STATEMENTS—(Continued)
The fair value of NSU and CSU awards are determined using the price of the Company’s common stock.
The following table presents activity related to NSU and CSU awards for the year ended March 31, 2020. No new CSU awards have been granted since April 1, 2018.
|
|
NSUs
|
CSUs
|
||||||||||||||
|
|
Outstanding
(number of units)
|
|
Stock
price
|
|
Outstanding
(number of units)
|
|
Stock
price
|
|
||||||||
|
Outstanding as of March 31, 2019
|
|
¥ |
|
|
¥ |
|
||||||||||
|
Granted
|
|
|
(1)
|
|
|
|||||||||||
|
Vested
|
(
|
) |
|
(2)
|
(
|
) |
|
(2)
|
||||||||
|
Forfeited
|
(
|
) |
|
(
|
) |
|
||||||||||
|
Outstanding as of March 31, 2020
|
|
¥ |
|
(3)
|
|
¥ |
|
(3)
|
||||||||
| (1) | Weighted-average price of the Company’s common stock used to determine number of awards granted. |
| (2) | Weighted-average price of the Company’s common stock used to determine the final cash settlement amount of the awards. |
| (3) | The price of the Company’s common stock used to remeasure the fair value of the remaining outstanding unvested awards as of March 31, 2020. |
Total compensation expense recognized within
in the consolidated statements of income relating to NSU and CSU awards for the years ended March 31, 2018, 2019 and 2020 was ¥
24,286
million, ¥
5,077
million and ¥
4,639
million, respectively.
Non-interest expenses—Compensation and benefits
Total unrecognized compensation cost relating to NSU awards, based on the fair value of these awards as of March 31, 2020, was ¥
613
million, which is expected to be recognized through the consolidated statements of income over a remaining weighted-average period of
0.9
years. The total fair value of NSU awards which vested during the years ended March 31, 2018, 2019 and 2020 was ¥
17,103
million, ¥
11,481
million and ¥
9,980
million, respectively.
Total unrecognized compensation cost relating to CSU awards, based on the fair value of these awards as of March 31, 2020, was ¥
37
million, which is expected to be recognized through the consolidated statements of income over a remaining weighted-average period of
2.0
years. The total fair value of CSU awards which vested during the years ended March 31, 2018, 2019 and 2020 was ¥
11,871
million, ¥
6,282
million and ¥
3,445
million, respectively.
NIU awards
In addition to the stock-based compensation awards described above, Nomura also grants NIU awards to senior management and employees. NIU awards are cash-settled awards linked to a world stock index quoted by Morgan Stanley Capital International, with graded vesting periods generally over
three years
with certain longer vesting periods where required by local regulations.
The fair value of NIU awards is determined using the price of the index.
F-
11
5
NOMURA HOLDINGS, INC.
NOTES TO THE CONSOLIDATED FINANCIAL STATEMENTS—(Continued)
The following table presents activity relating to NIU awards for the year ended March 31, 2020. No new NIU awards have been granted since April 1, 2018.
|
|
Outstanding
(number of units)
|
|
Index price
(1)
|
|
||||
|
Outstanding as of March 31, 2019
|
|
$ |
|
|||||
|
Granted
|
|
|
||||||
|
Vested
|
(
|
) |
|
(2)
|
||||
|
Forfeited
|
(
|
) |
|
|||||
|
Outstanding as of March 31, 2020
|
|
$ |
|
(3)
|
||||
| (1) | The price of each unit is determined using th of the index price. |
| (2) | Weighted-average index price used to determine the final cash settlement amount of the awards. |
| (3) | Index price used to remeasure the total fair value of the remaining outstanding unvested awards as of March 31, 2020. |
Total compensation expense recognized within
in the consolidated statements of income relating to NIU awards for the year ended March 31, 2018, 2019 and 2020 was ¥
8,697
million, ¥
1,731
million and ¥
237
million, respectively.
Non-interest expenses—Compensation and benefits
Total unrecognized compensation cost relating to NIU awards, based on the fair value of these awards as of March 31, 2020, was ¥
10
million which is expected to be recognized through the consolidated statements of income over a remaining weighted-average period of
2.0
years. The total fair value of NIU awards which vested during the years ended March 31, 2018, 2019 and 2020 was ¥
7,669
million, ¥
5,091
million and ¥
2,795
million, respectively.
Total tax benefits recognized in the consolidated statements of income for compensation expense relating to NSU, CSU and NIU awards for the years ended March 31, 2018, 2019 and 2020 were ¥
779
million, ¥
220
million and ¥
168
million, respectively.
Subsequent events
On May 27, 2020, the Company passed a resolution to grant RSU awards to certain senior management and employees.
78,054,800
RSU awards have been granted which generally have a graded vesting period from
to
three years
with an extending vesting period of up to
seven years
for certain senior management and employees in order to meet local regulatory requirements based on the role they perform within Nomura.
T
otal of
In June
6
billion and vesting periods of up to
seven years
.
2020
, Nomura also granted NSU awards to senior management and employees in countries where RSU awards are less favorably treated from tax or other perspectives. These NSU awards have a total grant date fair value of ¥
15. Restructuring initiatives:
Nomura continues to experience a major structural shift such as a breakdown of the traditional investment banking business model, advances in digitization, and demographic shifts due to the shrinking population and aging society in Japan. To respond to the changing environment created by these shifts, Nomura implemented various restructuring initiatives during the year ended March 31, 2019 to swiftly reengineer its business platforms and change its business approach in order to achieve sustainable growth in any business environment. In particular, Nomura has restructured its management reporting framework to eliminate the concept of regions to
F-
11
6
NOMURA HOLDINGS, INC.
NOTES TO THE CONSOLIDATED FINANCIAL STATEMENTS—(Continued)
minimize duplication between businesses and region, reduce the number of corporate functions, downscale unprofitable and low growth businesses and reduce its activities in EMEA. During the year ended March 31, 2020, this restructuring initiative is almost completed.
As a result of these initiatives, Nomura recognized ¥
10,348
million of severance costs reported within
in the consolidated statements of income during the year ended March 31, 2019 and within Nomura’s Wholesale and Other segments. As of March 31, 2019, these costs were reported as liabilities within
in the consolidated statements of financial position. Liabilities relating to these restructuring costs (including currency translation adjustments) were ¥
507
million as of March 31, 2020 and ¥
9,305
million were settled during the year ended March
Non-interest expenses—Compensation and benefits
Other liabilities
31
, 2020.
Nomura also recognized ¥
4,390
million of branch consolidation costs reported within
in the consolidated statements of income during the year ended March 31, 2020 and within Nomura’s Retail and Other segments. As of March 31, 2020, ¥
813
million were reported as liabilities within
Non-interest expenses—Occupancy and related depreciation
Other liabilities.
16. Income taxes:
The following table presents components of
reported in the consolidated statements of income for the years ended March 31, 2018, 2019 and 2020.
Income tax expense
|
|
Millions of yen
|
|||||||||||
|
|
Year ended March 31
|
|||||||||||
|
|
2018
|
|
2019
|
|
2020
|
|
||||||
|
Current:
|
|
|
|
|||||||||
|
Domestic
|
¥ |
|
¥ |
|
¥ |
|
||||||
|
Foreign
|
|
|
|
|||||||||
|
Subtotal
|
|
|
|
|||||||||
|
Deferred:
|
|
|
|
|||||||||
|
Domestic
|
|
|
(
|
) | ||||||||
|
Foreign
|
(
|
) |
(
|
) |
(
|
) | ||||||
|
Subtotal
|
|
|
(
|
) | ||||||||
|
Total
|
¥ |
|
¥ |
|
¥ |
|
||||||
The income tax benefit recognized from operating losses for the years ended March 31, 2018, 2019 and 2020 was ¥
4,653
million, ¥
246
million and ¥
1,195
million, respectively, which is included within deferred income tax expense above.
The Company and its wholly-owned domestic subsidiaries have adopted the consolidated tax filing system permitted under Japanese tax law. The consolidated tax filing system only imposes a national tax.
The
effective statutory tax rate applicable to Nomura in Japan
was
approximately
as of March 31, 2018, March 31, 2019 and March 31, 2020.
On March 27, 2020, the “Act to partially revise the Income Tax Act and Others ”(Act No.8 of 2020) was enacted, effective for fiscal years beginning on or after April 1, 2022. As a result of the Act, the existing Consolidated Taxation system in Japan will be replaced with the Group Tax Sharing system. The Company does not expect any significant impact on its net deferred tax liabilities on adoption of the Act.
F-
11
7
NOMURA HOLDINGS, INC.
NOTES TO THE CONSOLIDATED FINANCIAL STATEMENTS—(Continued)
On December 22, 2017, the Tax Cuts and Jobs Act (“the Act”) was enacted in the United States which significantly changes U.S. income tax law, including reducing the U.S. federal corporate income tax rate to
21
%, broadening the U.S. tax base, introducing a territorial tax system and one time repatriation tax on U.S. entities for previously deferred earnings of
2,776
million in deferred tax liabilities and deferred tax expense during the
non-U.S.
investees, allowing full expensing of certain property assets and imposing certain additional taxes on payments made from U.S. entities to foreign related parties. As a result, Nomura recognized a reduction of ¥
fiscal year ended March 31, 2018. As a result of finalizing calculations around the impact from changes in certain assumptions and interpretations made by Nomura, certain actions to be taken by Nomura and additional guidance released by the U.S. tax authorities and other bodies after April 1, 2018, Nomura did not make any material adjustments to this estimate during the fiscal year ended March 31, 2019.
Foreign subsidiaries are subject to income taxes of the countries in which they operate. The relationship between income tax expense and pretax accounting income (loss) is affected by a number of items, including various tax credits, certain revenues not subject to income taxes, certain expenses not deductible for income tax purposes, changes in deferred tax valuation allowance and different enacted tax rates applicable to foreign subsidiaries.
The following table presents a reconciliation of the effective income tax rate reflected in the consolidated statements of income to Nomura’s effective statutory tax rate for the years ended March 31, 2018, 2019 and 2020. The effective tax rate presented in the following table represents total income tax expense for the year as a percentage of
. For the years ended March 31, 2018 and 2020, where Nomura recognized
for the years, reconciling items which increase
and therefore increase Nomura’s effective tax rate are shown as positive amounts. Conversely, reconciling items which reduce
and reduce Nomura’s effective tax rate are shown as negative amounts.
For the year ended March 31, 2019, Nomura recognized
and consequently, reconciling items shown in the table which increase
are presented as negative amounts and reconciling items which reduce
are presented as positive amounts.
Income (loss) before income taxes
Income before income taxes
Income tax expense
Income tax expense
Loss before income taxes
Income tax expense
Income tax expense
|
|
Year ended March 31
|
|||||||||||
|
|
2018
|
|
2019
|
|
2020
|
|
||||||
|
Nomura’s effective statutory tax rate
|
|
% |
|
% |
|
% | ||||||
|
Impact of:
|
|
|
|
|||||||||
|
Changes in deferred tax valuation allowances
|
(
|
) |
(
|
) |
(
|
) | ||||||
|
Additional taxable income
|
|
(
|
) |
|
||||||||
|
Non-deductible
expenses
(1)
|
|
(
|
) |
|
||||||||
|
Non-taxable
income
(2)
|
(
|
) |
|
(
|
) | |||||||
|
Dividends from foreign subsidiaries
|
|
|
|
|||||||||
|
Tax effect of undistributed earnings of foreign subsidiaries
|
|
(
|
) |
|
||||||||
|
Different tax rate applicable to income (loss) of foreign subsidiaries
|
|
(
|
) |
(
|
) | |||||||
|
Effect of changes in foreign tax laws
|
|
|
(
|
) | ||||||||
|
Effect of changes in domestic tax laws
|
|
|
|
|||||||||
|
Tax benefit recognized on the devaluation of investment in subsidiaries and affiliates
|
|
|
(
|
) | ||||||||
|
Other
|
(
|
) |
(
|
) |
|
|||||||
|
Effective tax rate
|
|
% |
(
|
)% |
|
% | ||||||
| (1) |
Non-deductible expenses
|
F-
11
8
NOMURA HOLDINGS, INC.
NOTES TO THE CONSOLIDATED FINANCIAL STATEMENTS—(Continued)
| (2) |
Non-taxable income
during the year ended March 31, 2020 includes approximately
¥
billion of the tax effect from non-taxable dividend income from affiliated Nomura companies, including deemed dividend, (which decreased Nomura’s effective tax rate by
)
.
|
The following table presents the significant components of deferred tax assets and liabilities as of March 31, 2019 and 2020, before offsetting of amounts which relate to the same
tax-paying
component within a particular tax jurisdiction.
|
|
Millions of yen
|
|||||||
|
|
March 31
|
|||||||
|
|
2019
|
|
2020
|
|
||||
|
Deferred tax assets
|
|
|
|
|
|
|
||
|
Depreciation, amortization and valuation of fixed assets
|
¥ |
|
¥ |
|
||||
|
Investments in subsidiaries and affiliates
|
|
|
||||||
|
Valuation of financial instruments
|
|
|
||||||
|
Accrued pension and severance costs
|
|
|
||||||
|
Other accrued expenses and provisions
|
|
|
||||||
|
Operating losses
|
|
|
||||||
|
Lease liabilities
|
—
|
|
||||||
|
Other
|
|
|
||||||
|
Gross deferred tax assets
|
|
|
||||||
|
Less
—
|
(
|
) |
(
|
) | ||||
|
Total deferred tax assets
|
|
|
||||||
|
Deferred tax liabilities
|
|
|
|
|
|
|
||
|
Investments in subsidiaries and affiliates
|
|
|
||||||
|
Valuation of financial instruments
|
|
|
||||||
|
Undistributed earnings of foreign subsidiaries
|
|
|
||||||
|
Valuation of fixed assets
|
|
|
||||||
|
Right-of-use
assets
|
—
|
|
||||||
|
Other
|
|
|
||||||
|
Total deferred tax liabilities
|
|
|
||||||
|
Net deferred tax assets (liabilities)
|
¥ |
(
|
) | ¥ |
(
|
) | ||
After offsetting deferred tax assets and liabilities which
relate to the same
in the consolidated balance sheets were ¥
15,026
million and ¥
13,431
million as of March 31, 2019 and 2020, respectively and net deferred tax liabilities reported within
in the consolidated balance sheets were ¥
84,569
million and ¥
66,907
million as of March 31, 2019 and 2020, respectively.
tax-paying
component within a particular tax jurisdiction, net deferred tax assets reported within
Other assets—Other
Other liabilities
As of March 31, 2020, no deferred tax liabilities have been recognized for undistributed earnings of foreign subsidiaries totaling ¥
19,171
million which are not expected to be remitted in the foreseeable future. It is not practicable to determine the amount of income taxes payable in the event all such foreign earnings are repatriated.
F-
11
9
NOMURA HOLDINGS, INC.
NOTES TO THE CONSOLIDATED FINANCIAL STATEMENTS—(Continued)
The following table presents changes in total valuation allowances established against deferred tax assets for the years ended March 31, 2018, 2019 and 2020.
|
|
Millions of yen
|
|||||||||||
|
|
Year ended March 31
|
|||||||||||
|
|
2018
|
|
2019
|
|
2020
|
|
||||||
|
Balance at beginning of year
|
¥ |
|
¥ |
|
¥ |
|
||||||
|
Net change during the year
|
(
|
)
(1)
|
|
(2)
|
(
|
)
(3)
|
||||||
|
Balance at end of year
|
¥ |
|
¥ |
|
¥ |
|
||||||
| (1) |
Primarily includes a reduction of ¥
|
| (2) |
Primarily includes an increase of ¥
|
| (3) |
Primarily includes a reduction of ¥
expiration
of loss carryforwards, an increase of ¥
and
a
r
eduction of ¥
million
related to Japanese subsidiaries and the Company mainly by utilization of loss carryforwards. In total, ¥
|
As of March 31, 2020, total operating loss carryforwards were ¥
1,770,629
million, which included ¥
511,293
million relating to the Company and domestic subsidiaries, ¥
548,544
million relating to foreign subsidiaries in the United Kingdom, ¥
416,254
million relating to foreign subsidiaries in the United States, ¥
225,108
million relating to foreign subsidiaries in Hong Kong, and ¥
69,430
million relating to foreign subsidiaries in other tax jurisdictions. Of this total amount, ¥
901,463
million can be carried forward indefinitely, ¥
728,859
million expires by
March 31, 2029
and ¥
140,307
million expires in later fiscal years.
In determining the amount of valuation allowances to be established as of March 31, 2020, Nomura considered all available positive and negative evidence around the likelihood that sufficient future taxable income will be generated to realize the deferred tax assets in the relevant tax jurisdiction of the Company, its domestic subsidiaries and foreign subsidiaries. In Japan and other tax jurisdictions where domestic and foreign subsidiaries have experienced cumulative operating losses in recent years, these losses provided the most verifiable negative evidence available and outweigh positive evidence.
While Nomura has considered certain future tax planning strategies as a potential source of future taxable income, no such strategies have been relied upon as positive evidence resulting in a reduction of valuation allowances in any major tax jurisdiction in which Nomura operates as of March 31, 2018, 2019 and 2020. In
F-
1
20
NOMURA HOLDINGS, INC.
NOTES TO THE CONSOLIDATED FINANCIAL STATEMENTS—(Continued)
addition, valuation allowances have not been reduced in any of these periods as a result of changing the weighting applied to positive or negative evidence in any of the major tax jurisdictions in which Nomura
operates.
The determination of whether deferred tax assets will be realized, and therefore whether a valuation allowance is required, is inherently subjective and often requires management judgment around the future profitability of Nomura entities, an interpretation of tax rules by courts and regulatory authorities and tax examinations by taxing authorities, and the appropriate weighting of positive and negative evidence around the likelihood that sufficient future taxable income will be generated to realize deferred tax assets in the relevant tax jurisdiction. Although estimating future taxable income was increasingly subjective due to uncertainty in future profitability of Nomura as a result of the COVID-19 pandemic, it did not result in a significant impact on the determination of realization of deferred tax assets as of March 31, 2020.
The total amount of unrecognized tax benefits was not significant as of March 31, 2018, 2019 and 2020. There were also no significant movements of the gross amounts in unrecognized tax benefits and the amount of interest and penalties recognized due to unrecognized tax benefits during the years ended March 31, 2018, 2019 and 2020. Nomura is under continuous examination by the Japanese National Tax Agency and other taxing authorities in the major jurisdictions in which Nomura operates. Nomura regularly assesses the likelihood of additional assessments in each tax jurisdiction and the impact on the consolidated financial statements. It is reasonably possible that there may be a significant increase in unrecognized tax benefits within 12 months of March 31, 2020. Quantification of an estimated range cannot be made at this time due to the uncertainty of the potential outcomes. However, Nomura does not expect that any change in the gross balance of unrecognized tax benefits would have a material effect on its financial condition.
Nomura operates in multiple tax jurisdictions, and faces audits from various taxing authorities regarding many issues including, but not limited to, transfer pricing, the deductibility of certain expenses, foreign tax credits and other matters.
The table below presents information regarding the earliest year in which Nomura remains subject to examination in the major jurisdictions in which Nomura operates as of March 31, 2020. Under Hong Kong Special Administrative Region tax law, the statute of limitation does not apply if an entity incurs taxable losses and is therefore not included in the table.
|
Jurisdiction
|
Year
|
|
||
|
Japan
|
|
(1)
|
||
|
United Kingdom
|
|
|||
|
United States
|
|
|||
| (1) |
The earliest year in which Nomura remains subject to examination for transfer pricing issues is
2014
.
|
F-
121
NOMURA HOLDINGS, INC.
NOTES TO THE CONSOLIDATED FINANCIAL STATEMENTS—(Continued)
17. Other comprehensive income (loss):
The following tables present changes in
for the years ended March 31, 2019 and 2020.
Accumulated other comprehensive income (loss)
|
|
Millions of yen
|
|||||||||||||||||||
|
|
For the year ended March 31, 2019
|
|||||||||||||||||||
|
|
Balance at
beginning
of year
|
|
Other
comprehensive
income (loss)
before
reclassifications
|
|
Reclassifications out of
accumulated other
comprehensive
income (loss)
|
|
Net change
during the
year
|
|
Balance at
end of year
|
|
||||||||||
|
Cumulative translation adjustments
(1)
|
¥ |
(
|
) | ¥ |
|
¥ |
|
¥ |
|
¥ |
|
|||||||||
|
Pension liability adjustment
(2)
|
(
|
) |
(
|
) |
|
(
|
) |
(
|
) | |||||||||||
|
Own credit adjustments
|
|
|
(
|
) |
|
|
||||||||||||||
|
Total
|
¥ |
(
|
) | ¥ |
|
¥ |
|
¥ |
|
¥ |
(
|
) | ||||||||
| (1) |
Change in cumulative translation adjustments, net of tax in other comprehensive income (loss) for the year ended March 31, 2019 includes reclassification adjustment of ¥
million for loss due to substantially complete liquidation of an investment in a foreign entity. The adjustment is recognized in
Non-interest expenses-Other
.
|
|
(2)
|
See Note 13 “
Employee benefit plans
|
|
|
Millions of yen
|
|||||||||||||||||||
|
|
For the year ended March 31, 2020
|
|||||||||||||||||||
|
|
Balance at
beginning
of year
|
|
Other
comprehensive
income (loss)
before
reclassifications
|
|
Reclassifications out of
accumulated other
comprehensive
income (loss)
|
|
Net change
during the
year
|
|
Balance at
end of year
|
|
||||||||||
|
Cumulative translation adjustments
|
¥ |
|
¥ |
(
|
) | ¥ |
|
¥ |
(
|
) | ¥ |
(
|
) | |||||||
|
Pension liability adjustment
(1)
|
(
|
) |
|
|
|
(
|
) | |||||||||||||
|
Own credit adjustments
|
|
|
(
|
) |
|
|
||||||||||||||
|
Total
|
¥ |
(
|
) | ¥ |
(
|
) | ¥ |
|
¥ |
|
¥ |
(
|
) | |||||||
| (1) |
See Note 13 “
Employee benefit plans
” for further information.
|
F-
122
NOMURA HOLDINGS, INC.
NOTES TO THE CONSOLIDATED FINANCIAL STATEMENTS—(Continued)
The following tables present significant reclassifications out of
for the years ended March 31, 2019 and 2020.
Accumulated other comprehensive income (loss)
|
|
Millions of yen
|
|||||||||
|
|
For the year ended March 31
|
|||||||||
|
|
2019
|
|
2020
|
|
Affected line items in consolidated
statements of income
|
|||||
|
|
Reclassifications out of
accumulated other
comprehensive income (loss)
|
|
Reclassifications out of
accumulated other
comprehensive income (loss)
|
|
||||||
|
Cumulative translation adjustments:
|
|
|
|
|||||||
|
|
¥ |
(
|
) | ¥ |
(
|
) |
Revenue
—
Non-interest
expenses
—
|
|||
|
|
|
|
Income tax expense
|
|||||||
|
|
(
|
) |
(
|
) |
Net income (loss)
|
|||||
|
|
|
|
Net income attributable to noncontrolling interests
|
|||||||
|
|
¥ |
(
|
) | ¥ |
(
|
) |
Net income (loss) attributable to NHI shareholders
|
|||
|
|
Millions of yen
|
|||||||||
|
|
For the year ended March 31
|
|||||||||
|
|
2019
|
|
2020
|
|
Affected line items in consolidated
statements of income |
|||||
|
|
Reclassifications out of
accumulated other
comprehensive income (loss)
|
|
Reclassifications out of
accumulated other
comprehensive income (loss)
|
|
||||||
|
Pension liability adjustment:
|
|
|
|
|||||||
|
|
¥ |
(
|
) | ¥ |
(
|
) |
Non-interest
expenses
—
and benefits
/
Revenue—Other
|
|||
|
|
|
|
Income tax expense
|
|||||||
|
|
(
|
) |
(
|
) |
Net income (loss)
|
|||||
|
|
|
|
Net income attributable to noncontrolling interests
|
|||||||
|
|
¥ |
(
|
) | ¥ |
(
|
) |
Net income (loss)
attributable to NHI shareholders |
|||
F-
12
3
NOMURA HOLDINGS, INC.
NOTES TO THE CONSOLIDATED FINANCIAL STATEMENTS—(Continued)
|
|
Millions of yen
|
|||||||||
|
|
For the year ended March 31
|
|||||||||
|
|
2019
|
|
2020
|
|
Affected line items in consolidated
statements of income |
|||||
|
|
Reclassifications out of
accumulated other
comprehensive income (loss)
|
|
Reclassifications out of
accumulated other
comprehensive income (loss)
|
|
||||||
|
Own credit adjustments:
|
|
|
|
|||||||
|
|
¥ |
|
¥ |
|
Revenue
—
|
|||||
|
|
(
|
) |
(
|
) |
Income tax expense
|
|||||
|
|
|
|
Net income (loss)
|
|||||||
|
|
|
|
Net income attributable to noncontrolling interests
|
|||||||
|
|
¥ |
|
¥ |
|
Net income (loss) attributable to NHI shareholders
|
|||||
18. Shareholders’ equity:
The following table presents changes in shares of the Company’s common stock outstanding for the years ended March 31, 2018, 2019 and 2020.
|
|
Number of Shares
|
|||||||||||
|
|
Year ended March 31
|
|||||||||||
|
|
2018
|
|
2019
|
|
2020
|
|
||||||
|
Common stock outstanding at beginning of year
|
|
|
|
|||||||||
|
Decrease of common stock by cancellation of treasury stock
|
(
|
) |
(
|
) |
—
|
|||||||
|
Common stock held in treasury:
|
|
|
|
|||||||||
|
Repurchases of common stock
|
(
|
) |
(
|
) |
(
|
) | ||||||
|
Sales of common stock
|
|
|
|
|||||||||
|
Common stock issued to employees
|
|
|
|
|||||||||
|
Cancellation of treasury stock
|
|
|
—
|
|||||||||
|
Other net change in treasury stock
|
|
(
|
) |
—
|
||||||||
|
Common stock outstanding at end of year
|
|
|
|
|||||||||
The amount available for dividends and acquisition of treasury stock is subject to restrictions imposed by the Companies Act. Additional
1,311,894
million, ¥
1,209,861
million and ¥
1,297,560
million, respectively. These amounts are based on the amounts recorded in the Company’s unconsolidated financial statements maintained in accordance with accounting principles and practices prevailing in Japan. U.S. GAAP adjustments incorporated in these consolidated financial statements but not recorded in the Company’s unconsolidated financial statements have no effect on the determination of the amounts available for distributions under the Companies Act.
paid-in
capital and retained earnings include amounts which the Companies Act prohibits for the use of dividends and acquisition of treasury stock. As of March 31, 2018, 2019 and 2020, the amounts available for distributions were ¥
F-
12
4
NOMURA HOLDINGS, INC.
NOTES TO THE CONSOLIDATED FINANCIAL STATEMENTS—(Continued)
Dividends on the Company’s common stock per share were ¥
20.0
for the year ended March 31, 2018, ¥
6.0
for the year ended March 31, 2019 and ¥
20.0
for the year ended March 31, 2020.
During the year ended March 31, 2018, due to the cancellation of treasury stock on December 18, 2017, total number of issued shares and treasury stock decreased by
179,000,000
shares, respectively.
During the year ended March 31, 2019, due to the cancellation of treasury stock on December 17, 2018, total number of issued shares and treasury stock decreased by
150,000,000
shares, respectively.
On April 27, 2017, the board of directors approved a repurchase program of Nomura Holdings common stock in accordance with Article
100,000,000
shares, (b) total value of shares authorized for repurchase is up to ¥
80,000
million and (c) the share buyback will run from
May 17, 2017
to
March 30, 2018
. Under this repurchase program, the Company repurchased
100,000,000
shares of common stock at a cost of ¥
62,349
million.
459-1
of the Companies Act of Japan as follows: (a) total number of shares authorized for repurchase is up to
On October 30, 2017, the board of directors approved a repurchase program of Nomura Holdings common stock in accordance with Article
70,000,000
shares, (b) total value of shares authorized for repurchase is up to ¥
50,000
million and (c) the share buyback will run from
November 15, 2017
to
March 30, 2018
. Under this repurchase program, the Company repurchased
70,000,000
shares of common stock at a cost of ¥
46,729
million.
459-1
of the Companies Act of Japan as follows: (a) total number of shares authorized for repurchase is up to
On April 26, 2018, the board of directors approved a repurchase program of Nomura Holdings common stock in accordance with Article
100,000,000
shares, (b) total value of shares authorized for repurchase is up to ¥
70,000
million and (c) the share buyback will run from
May 16, 2018
to
March 29, 2019
. Under this repurchase program, the Company repurchased
100,000,000
shares of common stock at a cost of ¥
51,703
million.
459-1
of the Companies Act of Japan as follows: (a) total number of shares authorized for repurchase is up to
On June 18, 2019, the board of directors approved a repurchase program of Nomura Holdings common stock in accordance with Article
300,000,000
shares, (b) total value of shares authorized for repurchase is up to ¥
150,000
million and (c) the share buyback will run from
June 19, 2019
to
March 31, 2020
. Under this repurchase program, the Company repurchased
299,362,300
shares of common stock at a cost of ¥
150,000
million.
459-1
of the Companies Act of Japan as follows: (a) total number of shares authorized for repurchase is up to
In addition to the above, the change in common stock held in treasury includes the change in common stock issued to employees under stock-based compensation plans, common stock held by affiliated companies, common stock sold to enable shareholders to hold round lots of the
100
share minimum tradable quantity
(adding-to-holdings
requests) or common stock acquired to create round lots or eliminate odd lots.
19. Regulatory requirements:
In April 2011, the Company has been assigned as Final Designated Parent Company who must calculate a consolidated capital adequacy ratio and since then, our consolidated capital adequacy ratio has been calculated based on Capital Adequacy Notice on Final Designated Parent Company. The Capital Adequacy Notice on Final Designated Parent Company has been revised in line with Basel 2.5 and Basel III and Nomura has calculated a Basel
III-based
consolidated capital adequacy ratio since March 2013.
F-12
5
NOMURA HOLDINGS, INC.
NOTES TO THE CONSOLIDATED FINANCIAL STATEMENTS—(Continued)
In accordance with Article 2 of the Capital Adequacy Notice on Final Designated Parent Company, Nomura’s consolidated capital adequacy ratio is calculated based on the amounts of common equity Tier 1 capital, Tier 1 capital, total capital, credit risk-weighted assets, market risk and operational risk. As of March 31, 2019 and March 31, 2020, the Company was in compliance with common equity Tier1 capital ratio, Tier 1 capital ratio and consolidated capital adequacy ratio requirements set out in the Capital Adequacy Notice on Final Designated Parent Company, etc. The required level (including applicable minimum consolidated capital buffer) as of March 31, 2020 was
7.51
% for the common equity Tier 1 capital ratio,
9.01
% for the Tier 1 capital ratio and
11.01
% for the consolidated capital adequacy ratio.
Under the Financial Instruments and Exchange Act (“FIEA”), NSC and NFPS are subject to the capital adequacy rules of the FSA. These rules requires the maintenance of a capital adequacy ratio, which is defined as the ratio of adjusted capital to a quantified total of business risk, of not less than
120
%. Adjusted capital is defined as net worth (which includes shareholders’ equity, net unrealized gains and losses on securities held, reserves and subordinated debt) less illiquid assets. Business risks are divided into three categories: (1) market risks, (2) counterparty risks, and (3) basic risks. Under these rules, there are no restrictions on the operations of the companies provided that the resulting net capital adequacy ratio exceeds
120
%. As of March 31, 2019 and 2020, the capital adequacy ratio of NSC exceeded
120
%. Also, as of March 31, 2019 and 2020, the capital adequacy ratio of NFPS also exceeded
120
%.
In connection with providing brokerage, clearing, asset management and wealth management services to clients, Nomura maintains segregated accounts to hold financial assets such as cash and securities on behalf of its clients. These accounts are typically governed by stringent statutory or regulatory rules in the relevant jurisdiction where the accounts are maintained in order to protect the clients from loss.
As of March 31, 2019 and 2020, the total amount of segregated client cash recognized as an asset in
in the consolidated balance sheets was ¥
145,325
million and ¥
112,245
million, respectively. As of March 31, 2019 and 2020, the total amount of segregated securities recognized as assets in
and
in the consolidated balance sheets was ¥
693,192
million and ¥
901,180
million, respectively.
Deposits with stock exchanges and other segregated cash
Trading assets
Collateralized agreements
In the U.S., Nomura Securities International, Inc. (“NSI”) is registered as a broker-dealer under the Securities Exchange Act of 1934 and is a futures commission merchant with the Commodity Futures Trading Commission (“CFTC”). NSI is also regulated by self-regulatory organizations, such as the Financial Industry Regulatory Authority (“FINRA”) and the Chicago Mercantile Exchange Group. NSI is subject to the SEC’s Uniform Net Capital Rule (“Rule
1,000,000
or
2
% of aggregate debit items arising from client transactions. NSI is also subject to CFTC Regulation 1.17 which requires the maintenance of net capital of
8
% of the total risk margin requirement, as defined, for all positions carried in client accounts and nonclient accounts or $
1,000,000
, whichever is greater. NSI is required to maintain net capital in accordance with the SEC, CFTC, or other various exchange requirements, whichever is greater. Another U.S. subsidiary, Nomura Global Financial Products Inc. (“NGFP”) is registered as an OTC Derivatives Dealer under the Securities Exchange Act of 1934. NGFP is subject to Rule
20,000,000
in accordance with the SEC. Another U.S. subsidiary, Instinet, LLC (“ILLC”) is a broker-dealer registered with the SEC and is a member of FINRA. Further, ILLC is an introducing broker registered with the CFTC and a member of the National Futures Association and various other exchanges. ILLC is subject to Rule
1,000,000
,
2
% of aggregate debit items arising from client transactions, or the CFTC minimum requirement. Under CFTC rules, ILLC is subject to the greater of the following when determining its minimum
15c3-1”)
and other related rules, which require net capital, as defined under the alternative method, of not less than the greater of $
15c3-1
and applies Appendix F. NGFP is required to maintain net capital of $
15c3-1
which requires the maintenance of minimum net capital, as defined under the alternative method, equal to the greater of $
F-
12
6
NOMURA HOLDINGS, INC.
NOTES TO THE CONSOLIDATED FINANCIAL STATEMENTS—(Continued)
net capital requirement: $45,000 minimum net capital required as a CFTC introducing broker; the amount of adjusted net capital required by a futures association of which it is a member; and the amount of net
capital required by Rule
15c3-1(a).
As of March 31, 2019 and 2020, NSI, NGFP and ILLC were in compliance with relevant regulatory capital related requirements.
In Europe, Nomura Europe Holdings plc (“NEHS”) is subject to consolidated regulatory supervision by the Prudential Regulation Authority (“U.K. PRA”). The regulatory consolidation is produced in accordance with the requirements established under the Capital Requirements Directive and the Capital Requirements Regulation which came into effect on January 1, 2014. Nomura International plc (“NIP”), the most significant of NEHS’ subsidiaries, acts as a securities brokerage and dealing business. NIP is regulated by the U.K. PRA and has minimum capital adequacy requirements imposed on it on a standalone basis. In addition, Nomura Bank International plc (“NBI”), another subsidiary of NEHS, is also regulated by the U.K. PRA on a standalone basis and Nomura Financial Products Europe GmbH (“NFPE”), a Nomura subsidiary domiciled in Germany, is regulated by the German regulator (“BaFin”). As of March 31, 2019 and 2020, NEHS, NIP, NBI and NFPE were in compliance with relevant regulatory capital related requirements.
In Asia, Nomura International (Hong Kong) Limited (“NIHK”) and Nomura Singapore Ltd (“NSL”) are regulated by their local respective regulatory authorities. NIHK is licensed by the Securities and Futures Commission in Hong Kong to carry out regulated activities including dealing and clearing in securities and futures contracts, advising on securities, futures contracts and corporate finance and wealth management. Activities of NIHK, including its branch in Taiwan, are subject to the Securities and Futures (Financial Resources) Rules which require it, at all times, to maintain liquid capital at a level not less than its required liquid capital. Liquid capital is the amount by which liquid assets exceed ranking liabilities. Required liquid capital is calculated in accordance with provisions laid down in the Securities and Futures (Financial Resources) Rules. NSL is a merchant bank with an Asian Currency Unit (“ACU”) license governed by the Monetary Authority of Singapore (“MAS”). NSL carries out its ACU regulated activities including, among others, securities brokerage and dealing business. NSL is regulated and has minimum capital adequacy requirements imposed on it on a standalone basis by the MAS in Singapore. NIHK and NSL have been compliant with relevant regulatory capital related requirements.
20. Affiliated companies and other equity-method investees:
Nomura’s significant affiliated companies and other equity-method
investees include Nomura Research Institute, Ltd. (“NRI”) and Nomura Real Estate Holdings, Inc. (“NREH”).
JAFCO
JAFCO Co. Ltd. (“JAFCO”), which is a listed company in Japan, manages various venture capital funds and provides private equity-related investment services to portfolio companies. Nomura accounted for JAFCO using the equity method because Nomura had the ability to exercise significant influence over operating and financial decisions of JAFCO.
On July 28, 2017, Nomura disposed of its entire shareholding of
8,488,200
shares of JAFCO as part of a share
buy-back
program by the company. As a result, JAFCO is no longer an equity-method affiliate of Nomura.
NRI
NRI develops and manages computer systems and provides research services and management consulting services. One of the major clients of NRI is Nomura.
F-
12
7
NOMURA HOLDINGS, INC.
NOTES TO THE CONSOLIDATED FINANCIAL STATEMENTS—(Continued)
Nomura has tendered to the self-tender offer made by NRI. Upon the
settlement on August 21, 2019, Nomura has sold
101,889,300
ordinary shares it held at ¥
159,966
million to NRI. NRI remains an equity method affiliate of NHI. As a result of the transaction, a gain of ¥
73,293
million was recognized in earnings within
Revenue—Other
during the year ending March 31, 2020.
As of March 31, 2020, Nomura’s ownership of NRI was
28.8
% and the remaining balance of equity method goodwill included in the carrying value of the investment was ¥
61,310
million.
NREH
NREH is the holding company of the Nomura Real Estate Group which is primarily involved in the residential property development, leasing, investment management as well as other real estate-related activities.
As of March 31, 2020,
Nomura
’s ownership of NREH was
% and the remaining balance of equity method goodwill included in the carrying value of the investment was ¥
million.
As a result of significant declines in global equity markets during the fourth quarter due to the COVID-19 pandemic, we assessed and concluded no other-than-temporary impairment losses were required to be recognized.
Summary financial information—
The following tables present summarized financial information for significant affiliated companies of Nomura (including those elected for the fair value option) as of March 31, 2019 and 2020, and for the years ended March 31, 2018, 2019 and 2020.
|
|
Millions of yen
|
|||||||
|
|
March 31
|
|||||||
|
|
2019
|
|
2020
|
|
||||
|
Total assets
|
¥ |
|
¥ |
|
||||
|
Total liabilities
|
|
|
||||||
|
|
Millions of yen
|
|||||||||||
|
|
Year ended March 31
|
|||||||||||
|
|
2018
(1)
|
|
2019
|
|
2020
|
|
||||||
|
Net revenues
|
¥ |
|
¥ |
|
¥ |
|
||||||
|
Non-interest
expenses
|
|
|
|
|||||||||
|
Net income attributable to the companies
|
|
|
|
|||||||||
| (1) | For JAFCO, financial information while it was an affiliated company of Nomura is included. |
F-
12
8
NOMURA HOLDINGS, INC.
NOTES TO THE CONSOLIDATED FINANCIAL STATEMENTS—(Continued)
The following tables present a summary of balances and transactions with affiliated companies and other equity-method investees as of March 31, 2019 and 2020, and for the years ended March 31, 2018, 2019 and 2020.
|
|
Millions of yen
|
|||||||
|
|
March 31
|
|||||||
|
|
2019
|
|
2020
|
|
||||
|
Investments in affiliated companies
|
¥ |
|
¥ |
|
||||
|
Other receivables from affiliated companies
(1)
|
|
|
||||||
|
Other payables to affiliated companies
(1)
|
|
|
||||||
|
(1)
|
As a result of adopting ASU 2016-02 as of April 1, 2019, ROU
assets
and operating lease liabilities are included by ¥
|
|
|
Millions of yen
|
|||||||||||
|
|
Year ended March 31
|
|||||||||||
|
|
2018
|
|
2019
|
|
2020
|
|
||||||
|
Revenues
|
¥ |
|
¥ |
|
¥ |
|
||||||
|
Non-interest
expenses
|
|
|
|
|||||||||
|
Purchase of software, securities and tangible assets
|
|
|
|
|||||||||
The following table presents the aggregate carrying amount and fair value of investments in affiliated companies and other equity-method investees for which a quoted market price is available as of March 31, 2019 and 2020.
|
|
Millions of yen
|
|||||||
|
|
March 31
|
|||||||
|
|
2019
|
|
2020
|
|
||||
|
Carrying amount
|
¥ |
|
¥ |
|
||||
|
Fair value
|
|
|
||||||
The following table presents equity in earnings of equity-method investees, including those above and dividends from equity-method investees for the years ended March 31, 2018, 2019 and 2020.
|
|
Millions of yen
|
|||||||||||
|
|
Year ended March 31
|
|||||||||||
|
|
2018
|
|
2019
|
|
2020
|
|
||||||
|
Equity in earnings of equity-method investees
(1)
|
¥ |
|
¥ |
|
¥ |
|
||||||
|
Dividends from equity-method investees
|
|
|
|
|||||||||
| (1) |
Equity in earnings of equity-method investees is reported within
Revenue-Other
|
F-
12
9
NOMURA HOLDINGS, INC.
NOTES TO THE CONSOLIDATED FINANCIAL STATEMENTS—(Continued)
21. Commitments, contingencies and guarantees:
Commitments—
Credit and investment commitments
In connection with its banking and financing activities, Nomura provides commitments to extend credit which generally have fixed expiration dates. In connection with its investment banking activities, Nomura enters into agreements with clients under which Nomura commits to underwrite securities that may be issued by the clients. As a member of certain central clearing counterparties, Nomura is committed to provide liquidity facilities through entering into reverse repo transactions backed by government and government agency debt securities with those counterparties in a situation where a default of another clearing member occurs. The outstanding commitments under these agreements are included below in commitments to extend credit.
Nomura has commitments to invest in various partnerships and other entities and also has commitments to provide financing for investments related to these partnerships. The outstanding commitments under these agreements are included in commitments to invest.
The following table presents a summary of the key types of outstanding commitments provided by Nomura as of March 31, 2019 and 2020.
|
|
Millions of yen
|
|||||||
|
|
March 31, 2019
|
|
March 31, 2020
|
|
||||
|
Commitments to extend credit
|
|
|
||||||
|
Liquidity facilities to central clearing counterparties
|
¥ |
|
¥ |
|
||||
|
Other commitments to extend credit
|
|
|
||||||
|
Total
|
¥ |
|
¥ |
|
||||
|
Commitments to invest
|
¥ |
|
¥ |
|
||||
As of March 31, 2020, these commitments had the following maturities:
|
|
Millions of yen
|
|||||||||||||||||||
|
|
Total
contractual
amount
|
|
Years to maturity
|
|||||||||||||||||
|
|
Less than
1 year
|
|
1 to 3
years
|
|
3 to 5
years
|
|
More than
5 years
|
|
||||||||||||
|
Commitments to extend credit
|
|
|
|
|
|
|||||||||||||||
|
Liquidity facilities to central clearing counterparties
|
¥ |
|
¥ |
|
¥ |
—
|
¥ |
—
|
¥ |
—
|
||||||||||
|
Other commitments to extend credit
|
|
|
|
|
|
|||||||||||||||
|
Total
|
¥ |
|
¥ |
|
¥ |
|
¥ |
|
¥ |
|
||||||||||
|
Commitments to invest
|
¥ |
|
¥ |
|
¥ |
|
¥ |
|
¥ |
|
||||||||||
The contractual amounts of these commitments to extend credit represent the amounts at risk but only if the contracts are fully drawn upon, should the counterparties default, and assuming the value of any existing collateral becomes worthless. The total contractual amount of these commitments may not represent future cash requirements since the commitments may expire without being drawn upon. The credit risk associated with these commitments varies depending on the clients’ creditworthiness and the value of collateral held. Nomura evaluates each client’s creditworthiness on a
case-by-case
basis. The amount of collateral obtained, if deemed necessary by Nomura upon extension of credit, is based on credit evaluation of the counterparty.
F-
1
30
NOMURA HOLDINGS, INC.
NOTES TO THE CONSOLIDATED FINANCIAL STATEMENTS—(Continued)
Other commitments
Purchase obligations for goods or
69,003
million as of March 31, 2019 and
services
that include payments for construction-related, advertising, and computer and telecommunications maintenance agreements amounted to ¥
¥
million as of March 31, 2020.
As of March 31, 2020, these purchase obligations had the following maturities:
|
|
Millions of yen
|
|||||||||||||||||||||||||||
|
|
Total
|
|
Years of payment
|
|||||||||||||||||||||||||
|
|
Less than
1 year |
|
1 to 2
years |
|
2 to 3
years |
|
3 to 4
years |
|
4 to 5
years |
|
More than
5 years |
|
||||||||||||||||
|
Purchase obligations
|
¥ |
|
¥ |
|
¥ |
|
¥ |
|
¥ |
|
¥ |
|
¥
|
|||||||||||||||
Above table includes the commitment to purchase parts of the redeveloped real estate in Tokyo Nihonbashi district from the redevelopment partnership. See Note 23 “
” for further information.
Significant subsequent events
Nomura has commitments under resale and repurchase agreements including amounts in connection with collateralized agreements and collateralized financing. These commitments amounted to ¥
1,071
billion for resale agreements and ¥
719
billion for repurchase agreements as of March 31, 2019 and ¥
1,969
billion for resale agreements and ¥
677
billion for repurchase agreements as of March 31, 2020.
In Japan, there is a market in which participants lend and borrow debt and equity securities without collateral to and from financial institutions. Under these arrangements, Nomura had obligations to return debt and equity securities borrowed without collateral of ¥
441
billion and ¥
928
billion as of March 31, 2019 and 2020, respectively.
As a member of various securities clearing houses and exchanges, Nomura may be required to assume a certain share of the financial obligations of another member who may default on its obligations to the clearing house or the exchange. These guarantees are generally required under the membership agreements. To mitigate these risks, exchanges and clearing houses often require members to post collateral. The potential for Nomura to make payments under such guarantees is deemed remote.
Contingencies
Investigations, lawsuits and other legal proceedings
In the normal course of business as a global financial services entity, Nomura is involved in investigations, lawsuits and other legal proceedings and, as a result, may suffer loss from any fines, penalties or damages awarded against Nomura, any settlements Nomura chooses to make to resolve a matter, and legal and other advisory costs incurred to support and formulate a defense.
The ability to predict the outcome of these actions and proceedings is inherently difficult, particularly where claimants are seeking substantial or indeterminate damages, where investigations and legal proceedings are at an early stage, where the matters present novel legal theories or involve a large number of parties, or which take place in foreign jurisdictions with complex or unclear laws.
The Company regularly evaluates each legal
” (“ASC 450”), the
proceeding
and claim on a
case-by-case
basis in consultation with external legal counsel to assess whether an estimate of possible loss or range of loss can be made, if recognition of a liability is not appropriate. In accordance with ASC 450 “
Contingencies
F-
1
31
NOMURA HOLDINGS, INC.
NOTES TO THE CONSOLIDATED FINANCIAL STATEMENTS—(Continued)
Company recognizes a liability for this risk of loss arising on each individual matter when a loss is probable and the amount of such loss or range of loss can be reasonably estimated. The amount recognized as a liability is reviewed at least quarterly and is revised when further information becomes available. If these criteria are not met for an individual matter, such as if an estimated loss is only reasonably possible rather than probable, no liability is recognized. However, where a material loss is reasonably possible, the Company will disclose details of the legal proceeding or claim below. Under ASC 450 an event is defined as reasonably possible if the chance of the loss to the Company is more than remote but less than probable.
The most significant actions and proceedings against Nomura are summarized below. The Company believes that, based on current information available as of the date of these consolidated financial statements, the ultimate resolution of these actions and proceedings will not be material to the Company’s financial condition. However, an adverse outcome in certain of these matters could have a material adverse effect on the consolidated statements of income or cash flows in a particular quarter or annual period.
For certain of the significant actions and proceedings described below, the Company is currently able to estimate the amount of reasonably possible loss, or range of reasonably possible losses, in excess of amounts recognized as a liability (if any) against such cases. These estimates are based on current information available as of the date of these consolidated financial statements and include, but are not limited to, the specific amount of damages or claims against Nomura in each case. As of June 30, 2020, for those cases where an estimate of the range of reasonably possible losses can be made, the Company estimates that the total aggregate reasonably possible maximum loss in excess of amounts recognized as a liability (if any) against these cases is approximately ¥
53
billion.
While the COVID-19 pandemic has delayed the potential resolution of certain actions and proceedings, it has not had a direct significant impact on the amount of liabilities recognized in respect of these matters as of June 30, 2020 nor the total aggregate reasonably possible maximum loss disclosed above.
For certain other significant actions and proceedings, the Company is unable to provide an estimate of the reasonably possible loss or range of reasonably possible losses because, among other reasons, (i) the proceedings are at such an early stage there is not enough information available to assess whether the stated grounds for the claim are viable; (ii) damages have not been identified by the claimant; (iii) damages are unsupported and/or exaggerated; (iv) there is uncertainty as to the outcome of pending appeals or motions; (v) there are significant legal issues to be resolved that may be dispositive, such as the applicability of statutes of limitations; (vi) there are novel or unsettled legal theories underlying the claims and/or (vii) a judgment has been made against Nomura but detailed reasons for the basis for the judgment and how the amount of the judgment has been determined have not yet been received.
Nomura will continue to cooperate with regulatory investigations and to vigorously defend its position in the ongoing actions and proceedings set out below, as appropriate.
In January 2008, Nomura International plc (“NIP”) was served with a tax notice issued by the tax authorities in Pescara, Italy alleging breaches by NIP of the U.K.-Italy Double Taxation Treaty of 1998 (“Tax Notice”). The alleged breaches relate to payments to NIP of tax credits on dividends on Italian shares. The Tax Notice not only denies certain payments to which NIP claims to be entitled but also seeks reimbursement of approximately EUR
33.8
million, plus interest, already refunded. NIP continues vigorously to challenge the Pescara Tax Court’s decisions in favor of the local tax authorities.
Similar claims have been made by the tax authorities against IBJ Nomura Financial Products (UK) PLC (“IBJN”) a group company which has been in members’ voluntary liquidation since 2000. An Italian Supreme
F-132
NOMURA HOLDINGS, INC.
NOTES TO THE CONSOLIDATED FINANCIAL STATEMENTS—(Continued)
Court judgment in June 2019 confirmed that tax credit refunds of approximately EUR
38
million, plus interest, were payable by IBJN to the Italian tax authorities. NIP continues to assess the position.
In October 2010 and June 2012, two actions were brought against NIP, seeking recovery of payments allegedly made to NIP by Fairfield Sentry Ltd. and Fairfield Sigma Ltd. (collectively, “Fairfield Funds”), which are now in liquidation and were feeder funds to Bernard L. Madoff Investment Securities LLC (in liquidation pursuant to the Securities Investor Protection Act in the U.S. since December 2008) (“BLMIS”). The first suit was brought by the liquidators of the Fairfield Funds. It was filed on October 5, 2010 in the Supreme Court of the State of New York, but was subsequently removed to the United States Bankruptcy Court for the Southern District of New York. The second suit was brought by the Trustee for the liquidation of BLMIS (“Madoff Trustee”). NIP was added as a defendant in June 2012 when the Madoff Trustee filed an amended complaint in the United States Bankruptcy Court for the Southern District of New York. Both actions seek to recover approximately
$
million.
In April 2011, the Federal Home Loan Bank of Boston (“FHLB-Boston”) commenced proceedings in the Superior Court of Massachusetts against numerous issuers, sponsors and underwriters of residential mortgage-backed securities (“RMBS”), and their controlling persons, including Nomura Asset Acceptance Corporation (“NAAC”), Nomura Credit & Capital, Inc., Nomura Securities International, Inc. (“NSI”) and Nomura Holding America Inc. The action alleged that FHLB-Boston purchased RMBS certificates in four offerings issued by NAAC in the original principal amount of approximately $
406
million, for which the offering materials contained untrue statements or omitted material facts concerning the underwriting standards used by the original lenders and the characteristics of the loans underlying the securities. On December 16, 2019, the parties settled the matter for $
34
million and the action has been dismissed.
In November 2011, NIP was served with a claim filed by the Madoff Trustee in the United States Bankruptcy Court for the Southern District of New York. This is a clawback action similar to claims filed by the Madoff Trustee against numerous other institutions. The Madoff Trustee alleges that NIP received redemptions from the BLMIS feeder fund, Harley International (Cayman) Limited in the six years prior to December 11, 2008 (the date proceedings were commenced against BLMIS) and that these are avoidable and recoverable under the U.S. Bankruptcy Code and New York law. The amount that the Madoff Trustee is currently seeking to recover from NIP is approximately $
21
million.
In March 2013, Banca Monte dei Paschi di Siena SpA (“MPS”) issued a claim in the Italian Courts against (1) two former directors of MPS and (2) NIP. MPS alleged that the former directors improperly caused MPS to enter into certain structured financial transactions with NIP in 2009 (“Transactions”) and that NIP acted fraudulently and was jointly liable for the unlawful conduct of MPS’s former directors. MPS claimed damages of not less than EUR
1.1
billion.
In March 2013, NIP commenced a claim against MPS in the English Courts. The claim was for declaratory relief confirming that the Transactions remained valid and contractually binding. MPS filed and served its defence and counterclaim to these proceedings in March 2014. MPS alleged in its counterclaim that NIP was liable to make restitution of a net amount of approximately EUR
1.5
billion, and sought declarations regarding the illegality and invalidity of the Transactions.
On September 23, 2015, NIP entered into a settlement agreement with MPS to terminate the Transactions. NIP believes that the Transactions were conducted legally and appropriately, and does not accept the allegations made against it or admit any wrongdoing. Taking into account the views of relevant European financial authorities and the advice provided by external experts, NIP considered it to be in its best interests to reach a
F-
1
3
3
NOMURA HOLDINGS, INC.
NOTES TO THE CONSOLIDATED FINANCIAL STATEMENTS—(Continued)
settlement in relation to this matter. As part of the agreement, the Transactions were unwound at a discount of EUR
440
million in favour of MPS and the civil proceedings between MPS and NIP in Italy and England, respectively, will no longer be pursued. Pursuant to the settlement agreement MPS and NIP applied to the Italian Courts to discontinue the proceedings brought by MPS against NIP. These proceedings have since been discontinued.
In April 2013, an investigation was commenced by the Public Prosecutor’s office in Siena, Italy, into various allegations against MPS and certain of its former directors, including in relation to the Transactions. The investigation was subsequently transferred to the Public Prosecutor of Milan. On April 3, 2015, the Public Prosecutor’s office in Milan issued a notice concluding its preliminary investigation. The Public Prosecutor was seeking to indict MPS, three individuals from MPS’s former management, NIP and two former NIP employees for, among others, the offences of false accounting and market manipulation in relation to MPS’s previous accounts. The preliminary hearing at which the Milan criminal court considered whether or not to grant the indictment concluded on October 1, 2016, the Judge ordering the trial of all individuals and banks involved except for MPS (which entered into a plea bargaining agreement with the Public Prosecutor). The trial commenced in December 2016. As part of these proceedings, a number of civil claimants have been permitted to bring damages claims against a number of entities and individuals, including NIP.
On November 8, 2019, the court delivered its oral verdict, finding two former employees of NIP guilty of false accounting, market manipulation and obstructing the supervisory activities of CONSOB and that NIP had breached Italian corporate liability legislation. In so doing it imposed a fine of EUR
3.45
million on NIP as well as ordering confiscation of EUR
88
million. On May 12, 2020, the court issued the detailed reasoning for the verdict (including the rationale for the penalties imposed). As of the date of these consolidated financial statements, NIP continues to analyze the contents of the written reasoning to determine all of its options, including any appeal. The penalties will not be enforceable until all appeals have been concluded.
In addition, NIP is involved in a number of separate civil or administrative matters relating to the Transactions including those described further below.
In July 2013, a claim was issued against former directors of MPS, and NIP, by the shareholder group Fondazione Monte dei Paschi di Siena (“FMPS”). The grounds of the FMPS claim are similar to those on which the MPS claim was founded. The level of damages sought by FMPS is not less than EUR
315.2
million.
In January 2018, a claim before the Italian Courts brought by two claimants, Alken Fund Sicav (on behalf of two Luxembourg investment funds Alken Fund European Opportunities and Alken Fund Absolute Return Europe) and Alken Luxembourg S.A (the funds’ management company) was served on NIP. The claim is made against NIP, MPS, four MPS former directors and a member of MPS’s internal audit board, and seeks monetary damages of approximately EUR
434
million on the basis of allegations similar to those made in the MPS and FMPS claims, as well as non-monetary damages in an amount left to be quantified by the Judge.
In May 2019, a claim before the Italian Courts brought by York Global Finance Offshore BDH (Luxembourg) Sàrl and a number of seemingly related funds was served on NIP. The claim is made against NIP, MPS, two MPS former directors and a member of MPS’s internal audit board, and seeks monetary damages of approximately EUR
186.7
million on grounds similar to those in the MPS and FMPS claims, as well as non-monetary damages in an amount left to be quantified by the Judge.
Additionally, NIP was served by the Commissione Nazionale per le Società e la Borsa (“CONSOB”, the Italian financial regulatory authority) with a notice commencing administrative sanction proceedings for market
F-
13
4
NOMURA HOLDINGS, INC.
NOTES TO THE CONSOLIDATED FINANCIAL STATEMENTS—(Continued)
manipulation in connection with the Transactions. In relation to the Transactions, the notice named MPS, three individuals from MPS’s former management and two former NIP employees as defendants, whereas NIP was named only in its capacity as vicariously liable to pay any fines imposed on the former NIP employees. On May 22, 2018 CONSOB issued its decision in which it levied EUR 100,000 fines in relation to each of the two former NIP employees. In addition, CONSOB decided that the two employees do not meet the necessary Italian law integrity requirements to perform certain senior corporate functions, for a period of three months and six months respectively. NIP is vicariously liable to pay the fines imposed on its former employees. NIP has paid the fines and appealed the decision to the Milan Court of Appeal.
In June 2016 and August 2016, Nomura International (Hong Kong) Limited (“NIHK”) and Nomura Special Investments Singapore Pte Limited (“NSIS”) were respectively served with a complaint filed in the Taipei District Court against NIHK, NSIS and certain individuals by Cathay United Bank, Co., Ltd., Taiwan Cooperative Bank Ltd., Chang Hwa Commercial Bank Ltd., Taiwan Business Bank Ltd., KGI Bank and Hwatai Bank Ltd. (collectively, “Syndicate Banks”). The Syndicate Banks’ complaint relates to a $
60
million syndicated term loan to a subsidiary of Ultrasonic AG that was arranged by NIHK, and made by the Syndicate Banks together with NSIS. The Syndicate Banks’ allegations in the complaint include allegations that NIHK failed to comply with its fiduciary duties to the lenders as the arranger of the loan and the Syndicate Banks seek to recover approximately $
48
million in damages and interest.
In March 2017, certain subsidiaries of American International Group, Inc. (“AIG”) commenced proceedings in the District Court of Harris County, Texas against certain entities and individuals, including NSI, in connection with a 2012 offering of $
750
million of certain project finance notes, of which $
92
million allegedly were purchased by AIG. AIG alleges violations of the Texas Securities Act based on material misrepresentations and omissions in connection with the marketing, offering, issuance and sale of the notes and seeks rescission of the purchases or compensatory damages.
Various authorities continue to conduct investigations concerning the activities of NIP, other entities in the Nomura Group and other third parties in respect of government, supranational,
sub-sovereign
and agency debt securities trading. These investigations relate to various matters including certain activities of NIP in Europe for which NIP and the Company have received a Statement of Objections from the European Commission (“Commission”) which reflects the Commission’s initial views around certain historical conduct. NIP and NSI were also named as defendants in class action complaints filed in the United States District Court for the Southern District of New York alleging violations of U.S. antitrust law relating to the alleged manipulation of the secondary trading market for supranational,
sub-sovereign
and agency bonds. NIP and NSI are also defendants in a similar class action complaint filed in the Toronto Registry Office of the Federal Court of Canada alleging violations of Canadian competition law. Additionally, NIP and NSI have been served with a separate class action complaint filed in the United States Court for the Southern District of New York alleging violations of U.S. antitrust law in relation to the alleged manipulation of the primary and secondary markets for European government bonds.
In September 2017 and November 2017, NIHK and NSIS were respectively served with a complaint filed in the Taipei District Court against NIHK, NSIS, China Firstextile (Holdings) Limited (“FT”) and certain individuals by First Commercial Bank, Ltd., Land Bank of Taiwan Co., Ltd., Chang Hwa Commercial Bank Ltd., Taishin International Bank, E.Sun Commercial Bank, Ltd., CTBC Bank Co., Ltd., Hwatai Bank, Ltd. and Bank of Taiwan (collectively, “FT Syndicate Banks”). The FT Syndicate Banks’ complaint relates to a $
100
million syndicated term loan facility to borrower FT that was arranged by NIHK, and made by the FT Syndicate Banks together with NSIS. The FT Syndicate Banks’ allegations in the complaint include tort claims under Taiwan law against the defendants. The FT Syndicate Banks seek to recover approximately $
68
million in damages and interest.
F-
13
5
NOMURA HOLDINGS, INC.
NOTES TO THE CONSOLIDATED FINANCIAL STATEMENTS—(Continued)
In July 2018, a former Italian counterparty filed a claim against NIP in the Civil Court of Rome relating to a derivative transaction entered into by the parties in 2006, and terminated in 2009. The claim alleges that payments by the counterparty to NIP of approximately EUR
165
million were made in breach of Italian insolvency law, and seeks reimbursement of those payments.
The United States Securities and Exchange Commission (“SEC”) and the United States Department of Justice investigated past activities of several former employees of NSI in respect of commercial and residential mortgage-backed securities transactions. NSI entered into settlements with the SEC on July 15, 2019, concerning its supervision of certain former employees. Pursuant to the settlements, NSI paid penalties of $
1.5
million to the SEC and deposited $
25
million in a segregated account which will be used to reimburse certain customers in connection with the related cases.
In August 2017, the Cologne public prosecutor in Germany notified NIP that it is investigating possible tax fraud by individuals who worked for the Nomura Group in relation to the historic planning and execution of trading strategies around dividend record dates in certain German equities (known as “cum/ex” trading) and in relation to filings of tax reclaims in 2007 to 2012. During the fiscal year ended March 31, 2020, Nomura Group became aware that certain of those individuals would be the subject of investigative proceedings in Germany. NIP and another entity in the Nomura Group are cooperating with the investigation, including by disclosing to the public prosecutor certain documents and trading data. If the investigation involving Nomura Group entities and former individuals proceeds to trial, the individuals could face criminal sanctions and Nomura Group entities could face administrative sanctions such as administrative fines or profit confiscation orders. It is not yet possible to reasonably estimate the potential losses which may arise from any administrative sanction imposed on a Nomura Group entity.
Other mortgage-related contingencies in the U.S.
Certain of the Company’s subsidiaries in the U.S. securitized residential mortgage loans in the form of RMBS. These subsidiaries did not generally originate mortgage loans, but purchased mortgage loans from third-party loan originators (“originators”). In connection with such purchases, these subsidiaries received loan level representations from the originators. In connection with the securitizations, the relevant subsidiaries provided loan level representations and warranties of the type generally described below, which mirror the representations the subsidiaries received from the originators.
The loan level representations made in connection with the securitization of mortgage loans were generally detailed representations applicable to each loan and addressed characteristics of the borrowers and properties. The representations included, but were not limited to, information concerning the borrower’s credit status, the
loan-to-value
ratio, the owner occupancy status of the property, the lien position, the fact that the loan was originated in accordance with the originator’s guidelines, and the fact that the loan was originated in compliance with applicable laws. Certain of the RMBS issued by the subsidiaries were structured with credit protection provided to specified classes of certificates by monoline insurers.
The relevant subsidiaries have received claims demanding the repurchase of certain loans from trustees of various securitization trusts, made at the instance of one or more investors, or from certificate insurers. The total original principal amount of loans for which repurchase claims were received by the relevant subsidiaries within six years of each securitization is $
3,203
million. The relevant subsidiaries summarily rejected any demand for repurchase received after the expiration of the statute of limitations applicable to breach of representation claims. For those claims received within six years, the relevant subsidiaries reviewed each claim received, and rejected those claims believed to be without merit or agreed to repurchase certain loans for those claims that the relevant
F-
13
6
NOMURA HOLDINGS, INC.
NOTES TO THE CONSOLIDATED FINANCIAL STATEMENTS—(Continued)
subsidiaries determined to have merit. In several instances, following the rejection of repurchase demands, investors instituted actions through the trustee alleging breach of contract. The breach of contract claims that were brought within the
six-year
statute of limitations for breach of contract actions have survived motions to dismiss. These claims involve substantial legal, as well as factual, uncertainty and the Company cannot provide an estimate of reasonably possible loss at this time, in excess of the existing reserve.
Administrative action by Financial Services Agency of Japan
On May 28, 2019, Nomura Securities Co., Ltd. (“NSC”) received an administrative action (a business improvement order) from Financial Services Agency of Japan (“FSA”) in accordance with Article 51 of the Financial Instruments and Exchange Act of Japan (“FIEA”) due to NSC’s improper communication of information. On the same day, for the same reason, the Company also received an administrative action (a business improvement order) from FSA in accordance with Article
57-19
(1) of the FIEA. Because of such administrative action, NSC has lost some of business opportunities. On June 3, 2019, the Company and NSC submitted reports on their business improvement measures to FSA and the reports were accepted by FSA. However, there is a possibility that Nomura will continue to lose business opportunities due to the damage to our reputation and other causes, and the Company’s financial condition and business performance may be affected onward. However, it is difficult for the Company to reasonably estimate the financial impact at this moment.
Guarantees—
In the normal course of business, Nomura enters into various guarantee arrangements with counterparties in the form of standby letters of credit and other guarantees, which generally have a fixed expiration date.
In addition, Nomura enters into certain derivative contracts that meet the accounting definition of a guarantee, namely derivative contracts that contingently require a guarantor to make payment to a guaranteed party based on changes in an underlying that relate to an asset, liability or equity security held by a guaranteed party. Since Nomura does not track whether its clients enter into these derivative contracts for speculative or hedging purposes, Nomura has disclosed below information about derivative contracts that could meet the accounting definition of guarantees.
For information about the maximum potential amount of future payments that Nomura could be required to make under certain derivatives, the notional amount of contracts has been disclosed. However, the maximum potential payout for certain derivative contracts, such as written interest rate caps and written currency options, cannot be estimated, as increases in interest or foreign exchange rates in the future could be theoretically unlimited.
Nomura records all derivative contracts at fair value on its consolidated balance sheets. Nomura believes the notional amounts generally overstate its risk exposure. Since the derivative contracts are accounted for at fair value, carrying value is considered the best indication of payment and performance risk for individual contracts.
F-137
NOMURA HOLDINGS, INC.
NOTES TO THE CONSOLIDATED FINANCIAL STATEMENTS—(Continued)
The following table presents information on Nomura’s derivative contracts that could meet the accounting definition of a guarantee and standby letters of credit and other guarantees.
|
|
Millions of yen
|
|||||||||||||||
|
|
March 31
|
|||||||||||||||
|
|
2019
|
2020
|
||||||||||||||
|
|
Carrying
value
|
|
Maximum
potential
payout /
Notional total
|
|
Carrying
value
|
|
Maximum
potential
payout /
Notional total
|
|
||||||||
|
Derivative contracts
(1)(2)
|
¥ |
|
¥ |
|
¥ |
|
¥ |
|
||||||||
|
Standby letters of credit and other guarantees
(3)
|
|
|
—
|
|
||||||||||||
| (1) |
Credit derivatives are disclosed in Note 3 “
Derivative instruments and hedging activities
|
| (2) | Derivative contracts primarily consist of equity, interest rate and foreign exchange contracts. |
| (3) |
The amounts of collaterals held in connection with standby letters of credit and other guarantees as of March 31, 2019 and March 31, 2020 was ¥
|
The following table presents maturity information on Nomura’s derivative contracts that could meet the accounting definition of a guarantee and standby letters of credit and other guarantees as of March 31, 2020.
|
|
Millions of yen
|
|||||||||||||||||||||||
|
|
Carrying
value
|
|
Maximum potential payout/Notional
|
|||||||||||||||||||||
|
|
Total
|
|
Years to Maturity
|
|||||||||||||||||||||
|
|
Less than
1 year
|
|
1 to 3 years
|
|
3 to 5 years
|
|
More than
5 years
|
|
||||||||||||||||
|
Derivative contracts
|
¥ |
|
¥ |
|
¥ |
|
¥ |
|
¥ |
|
¥ |
|
||||||||||||
|
Standby letters of credit and other guarantees
|
—
|
|
|
|
|
|
||||||||||||||||||
22. Segment and geographic information:
Operating segments—
Nomura’s operating management and management reporting are prepared based on the Retail, the Asset Management, and the Wholesale segments. Nomura structures its business segments based upon the nature of its main products and services, its client base and its management structure. The operating results of the Merchant Banking division are included in “
”
Other
.
The accounting policies for segment information follow U.S. GAAP, except for the impact of unrealized gains/losses on investments in equity securities held for operating purposes, which under U.S. GAAP are included in
, but excluded from segment information.
Income (loss) before income taxes
Revenues and expenses directly associated with each business segment are included in the operating results of each respective segment. Revenues and expenses that are not directly attributable to a particular segment are allocated to each respective business segment or included in “
,” based upon Nomura’s allocation methodologies as used by management to assess each segment’s performance.
Other
Business segments’ results are shown in the following tables.
is disclosed because management views interest revenue net of interest expense for its operating decisions. Business segments’
Net interest revenue
F-
13
8
NOMURA HOLDINGS, INC.
NOTES TO THE CONSOLIDATED FINANCIAL STATEMENTS—(Continued)
|
|
Millions of yen
|
|||||||||||||||||||
|
|
Retail
|
|
Asset
Management
|
|
Wholesale
|
|
Other
(Incl. elimination)
|
|
Total
|
|
||||||||||
|
Year ended March 31, 2018
|
|
|
|
|
|
|||||||||||||||
|
Non-interest
revenue
|
¥ |
|
¥ |
|
¥ |
|
¥ |
|
¥ |
|
||||||||||
|
Net interest revenue
|
|
|
|
(
|
) |
|
||||||||||||||
|
Net revenue
|
|
|
|
|
|
|||||||||||||||
|
Non-interest
expenses
|
|
|
|
|
|
|||||||||||||||
|
Income before income taxes
|
¥ |
|
¥ |
|
¥ |
|
¥ |
|
¥ |
|
||||||||||
|
Year ended March 31, 2019
|
|
|
|
|
|
|||||||||||||||
|
Non-interest
revenue
|
¥ |
|
¥ |
|
¥ |
|
¥ |
|
¥ |
|
||||||||||
|
Net interest revenue
|
|
|
|
(
|
) |
|
||||||||||||||
|
Net revenue
|
|
|
|
|
|
|||||||||||||||
|
Non-interest
expenses
|
|
|
|
|
|
|||||||||||||||
|
Income (loss) before income taxes
|
¥ |
|
¥ |
|
¥ |
(
|
) | ¥ |
(
|
) | ¥ |
(
|
) | |||||||
|
Year ended March 31, 2020
|
|
|
|
|
|
|||||||||||||||
|
Non-interest
revenue
|
¥ |
|
¥ |
|
¥ |
|
¥ |
|
¥ |
|
||||||||||
|
Net interest revenue
|
|
|
|
(
|
) |
|
||||||||||||||
|
Net revenue
|
|
|
|
|
|
|||||||||||||||
|
Non-interest
expenses
|
|
|
|
|
|
|||||||||||||||
|
Income (loss) before income taxes
|
¥ |
|
¥ |
|
¥ |
|
¥ |
|
¥ |
|
||||||||||
Transactions between operating segments are recorded within segment results on commercial terms and conditions and are eliminated in “
.”
Other
The following table presents the major components of
in
for the years ended March 31, 2018, 2019 and 2020.
Income (loss) before income taxes
“Other”
|
|
Millions of yen
|
|||||||||||
|
|
Year ended March 31
|
|||||||||||
|
|
2018
|
|
2019
|
|
2020
|
|
||||||
|
Net gain (loss) related to economic hedging transactions
|
¥ |
(
|
) | ¥ |
|
¥ |
|
|||||
|
Realized gain on investments in equity securities held for operating purposes
|
|
|
|
|||||||||
|
Equity in earnings of affiliates
|
|
|
|
|||||||||
|
Corporate items
|
(
|
) |
(
|
) |
(
|
) | ||||||
|
Other
(1)
(2)
|
|
(
|
) |
|
||||||||
|
Total
|
¥ |
|
¥ |
(
|
) | ¥ |
|
|||||
|
(1)
|
Amounts reported for the year ended March 31, 2018 include the gain recognized in earnings in connection with the liquidation of a
non-Japanese
subsidiary during the year.
|
|
(2)
|
Includes gain of ¥
|
F-139
NOMURA HOLDINGS, INC.
NOTES TO THE CONSOLIDATED FINANCIAL STATEMENTS—(Continued)
The table below presents reconciliations of the combined business segments’ results included in the preceding table to Nomura’s reported
and
in the consolidated statements of income for the years ended March 31, 2018, 2019 and 2020.
Net revenue, Non-interest expenses
Income (loss) before income taxes
|
|
Millions of yen
|
|||||||||||
|
|
Year ended March 31
|
|||||||||||
|
|
2018
|
|
2019
|
|
2020
|
|
||||||
|
Net revenue
|
¥ |
|
¥ |
|
¥ |
|
||||||
|
Unrealized gain (loss) on investments in equity securities held for operating purposes
|
|
(
|
) |
(
|
) | |||||||
|
Consolidated net revenue
|
¥ |
|
¥ |
|
¥ |
|
||||||
|
Non-interest
expenses
|
¥ |
|
¥ |
|
¥ |
|
||||||
|
Unrealized gain (loss) on investments in equity securities held for operating purposes
|
|
|
|
|||||||||
|
Consolidated
non-interest
expenses
|
¥ |
|
¥ |
|
¥ |
|
||||||
|
Income (loss) before income taxes
|
¥ |
|
¥ |
(
|
) | ¥ |
|
|||||
|
Unrealized gain (loss) on investments in equity securities held for operating purposes
|
|
(
|
) |
(
|
) | |||||||
|
Consolidated income (loss) before income taxes
|
¥ |
|
¥ |
(
|
) | ¥ |
|
|||||
Geographic information—
Nomura’s identifiable assets, revenues and expenses are generally allocated based on the country of domicile of the legal entity providing the service. However, because of the integration of the global capital markets and the corresponding global nature of Nomura’s activities and services, it is not always possible to make a precise separation by location. As a result, various assumptions, which are consistent among years, have been made in presenting the following geographic data.
F-
140
NOMURA HOLDINGS, INC.
NOTES TO THE CONSOLIDATED FINANCIAL STATEMENTS—(Continued)
The tables below present a geographic allocation of
and
from operations by geographic areas for the years ended March 31, 2018, 2019 and 2020 and Long-lived assets
associated with Nomura’s operations as of March 31, 2018, 2019 and 2020.
in “Americas” and “Europe” substantially represents Nomura’s operations in the U.S. and the U.K., respectively.
and Long-lived assets have been allocated based on transactions with external customers while
has been allocated based on the inclusion of intersegment transactions.
Net revenue
Income (loss)
before income taxes
Net revenue
Net revenue
Income (loss)
before income taxes
|
|
Millions of yen
|
|||||||||||
|
Year ended March 31
|
||||||||||||
|
2018
|
|
2019
|
|
2020
|
|
|||||||
|
Net revenue
(1)
:
|
|
|
|
|||||||||
|
Americas
|
¥ |
|
¥ |
|
¥ |
|
||||||
|
Europe
|
|
|
|
|||||||||
|
Asia and Oceania
|
|
|
|
|||||||||
|
Subtotal
|
|
|
|
|||||||||
|
Japan
|
|
|
|
|||||||||
|
Consolidated
|
¥ |
|
¥ |
|
¥ |
|
||||||
|
Income (loss) before income taxes:
|
|
|
|
|
|
|
|
|
|
|||
|
Americas
|
¥ |
(
|
) | ¥ |
(
|
) | ¥ |
|
||||
|
Europe
|
(
|
) |
(
|
) |
(
|
) | ||||||
|
Asia and Oceania
|
|
|
|
|||||||||
|
Subtotal
|
(
|
) |
(
|
) |
|
|||||||
|
Japan
|
|
|
|
|||||||||
|
Consolidated
|
¥ |
|
¥ |
(
|
) | ¥ |
|
|||||
|
|
March 31
|
|||||||||||
|
2018
|
|
2019
|
|
2020
|
|
|||||||
|
Long-lived assets:
|
|
|
|
|
|
|
|
|
|
|||
|
Americas
|
¥ |
|
¥ |
|
¥ |
|
||||||
|
Europe
|
|
|
|
|||||||||
|
Asia and Oceania
|
|
|
|
|||||||||
|
Subtotal
|
|
|
|
|||||||||
|
Japan
|
|
|
|
|||||||||
|
Consolidated
|
¥ |
|
¥ |
|
¥ |
|
||||||
| (1) | There is no revenue derived from transactions with a single major external customer. |
23. Significant subsequent events:
Rights conversion related to the Tokyo Nihonbashi district
redevelopment
project
On May 20, 2020, the rights conversion plan of the Tokyo Nihonbashi district redevelopment project in which Nomura participate as members of the redevelopment partnership was approved by Tokyo Metropolitan Government. The rights conversion became effective on May 29, 2020.
F-
141
NOMURA HOLDINGS, INC.
NOTES TO THE CONSOLIDATED FINANCIAL STATEMENTS—(Continued)
As a result, Nomura is entitled to receive ownership in the redeveloped real estate in the future and cash representing compensation for loss of rental income and other related expenses, in exchange for the assets it held in that area.
Nomura will record
70
billion as the difference between the carrying value of the transferred assets and the fair value of the acquired assets during the first quarter of the fiscal year ending March 31, 2021. In addition, Nomura has committed to purchase other parts of the redeveloped real estate from the partnership upon its completion, and the amount of the commitment is included in Note 21 “
.”
an
income before income taxes of approximately ¥
Commitments, contingencies and guarantees
24. Supplementary subsidiary guarantee information required under SEC rules:
The Company provides several guarantees of debt of its subsidiaries. The Company has fully and unconditionally guaranteed the securities issued by Nomura America Finance LLC, which is an indirect, wholly owned finance subsidiary of the Company.
F-
142
INDEX OF EXHIBITS
|
Exhibit
Number |
|
Description
|
|
1.1
|
|
|
|
1.2
|
|
|
|
1.3
|
|
|
|
1.4
|
|
|
|
1.5
|
|
|
|
1.6
|
|
|
|
2.1
|
|
|
|
2.2
|
|
|
|
4.1
|
|
|
|
4.2
|
|
|
|
4.3
|
|
|
|
8.1
|
|
|
|
11.1
|
|
|
|
11.2
|
|
|
|
12.1
|
|
|
|
12.2
|
|
|
|
13.1
|
|
|
|
13.2
|
|
|
|
15.1
|
|
|
|
101.INS
|
|
Inline XBRL Instance Document—the instance document does not appear in the Interactive Data File because its XBRL tags are embedded within the Inline XBRL document
|
|
101.SCH
|
|
Inline XBRL Taxonomy Extension Schema Document
|
|
101.CAL
|
|
Inline XBRL Taxonomy Extension Calculation Linkbase Document
|
|
101.DEF
|
|
Inline XBRL Taxonomy Extension Definition Linkbase Document
|
|
101.LAB
|
|
Inline XBRL Taxonomy Extension Label Linkbase Document
|
|
101.PRE
|
|
Inline XBRL Taxonomy Extension Presentation Linkbase Document
|
|
104
|
|
The cover page for the Company’s Annual Report on Form
20-F
for the year ended March 31, 2020, has been formatted in Inline XBRL
|
|
(1)
|
The Company and Michael Lim Choo San entered into a Limitation of Liability Agreement substantially in the form of this exhibit.
|
|
(2)
|
The Company and each of Hiroshi Kimura, Noriaki Shimazaki, Hisato Miyashita, Mari Sono and Kazuhiko Ishimura entered into a Limitation of Liability Agreement substantially in the form of this exhibit.
|
|
(3)
|
The Company and Laura Simone Unger entered into a Limitation of Liability Agreement substantially in the form of this exhibit.
|
The Company has not included as exhibits certain instruments with respect to our long-term debt. The amount of debt authorized under each such debt instrument does not exceed 10% or our total assets. We will furnish a copy of any such instrument to the SEC upon request.
SIGNATURES
The registrant hereby certifies that it meets all of the requirements for filing on Form
20-F
and that it has duly caused and authorized the undersigned to sign this annual report on its behalf.
|
NOMURA HOLDINGS, INC.
|
||||
|
|
|
|
||
|
By:
|
|
/s/
Kentaro Okuda
|
||
|
|
|
Name:
|
|
Kentaro Okuda
|
|
|
|
Title:
|
|
Representative Executive Officer,
President and Group Chief Executive Officer
|
Date: June 30, 2020
TABLE OF CONTENTS
Part IItem 1. Identity Of Directors, Senior Management and AdvisersItem 2. Offer Statistics and Expected TimetableItem 3. Key InformationItem 4. Information on The CompanyItem 4A. Unresolved Staff CommentsItem 5. Operating and Financial Review and ProspectsNote 2 Fair Value MeasurementsNote 7 Financing ReceivablesNote 10 Other Assets Other/other LiabilitiesNote 20 Affiliated Companies and Other Equity-method InvesteesNote 21 Commitments, Contingencies and GuaranteesNote 16 Income TaxesItem 6. Directors, Senior Management and EmployeesItem 7. Major Shareholders and Related Party TransactionsItem 8. Financial InformationItem 9. The Offer and ListingItem 10. Additional InformationItem 11. Quantitative and Qualitative Disclosures About Market RiskItem 12. Description Of Securities Other Than Equity SecuritiesPart IIItem 13. Defaults, Dividend Arrearages and DelinquenciesItem 14. Material Modifications To The Rights Of Security Holders and Use Of ProceedsItem 15. Controls and ProceduresItem 16A. Audit Committee Financial ExpertItem 16B. Code Of EthicsItem 16C. Principal Accountant Fees and ServicesItem 16D. Exemptions From The Listing Standards For Audit CommitteesItem 16E. Purchases Of Equity Securities By The Issuer and Affiliated PurchasersItem 16F. Change in Registrant S Certifying AccountantItem 16G. Corporate GovernanceItem 16H. Mine Safety DisclosurePart IIIItem 17. Financial StatementsItem 18. Financial StatementsItem 19. Exhibits