NELNET INC
10-Ks and 10-Qs
|
|
|
|
|
|
|
|
|
|
|
|
|
|
|
|
|
|
|
|
|
|
|
|
|
|
|
|
|
|
|
|
|
|
|
|
|
|
|
|
|
|
|
|
|
|
|
|
|
|
|
|
|
|
|
|
UNITED STATES
SECURITIES AND EXCHANGE COMMISSION
WASHINGTON, D.C. 20549
FORM 10-K
|
(Mark One)
|
|
|
x
|
ANNUAL REPORT PURSUANT TO SECTION 13 OR 15(d) OF THE SECURITIES EXCHANGE ACT OF 1934
|
|
For the fiscal year ended December 31, 2016
|
|
|
or
|
|
|
o
|
TRANSITION REPORT PURSUANT TO SECTION 13 OR 15(d) OF THE SECURITIES EXCHANGE ACT OF 1934
|
|
For the transition period from
to
.
|
|
COMMISSION FILE NUMBER 001-31924
NELNET, INC.
(Exact name of registrant as specified in its charter)
|
NEBRASKA
(State or other jurisdiction of incorporation or organization)
|
84-0748903
(I.R.S. Employer Identification No.)
|
|
121 SOUTH 13TH STREET, SUITE 100
LINCOLN, NEBRASKA
(Address of principal executive offices)
|
68508
(Zip Code)
|
Registrant’s telephone number, including area code: (402) 458-2370
SECURITIES REGISTERED PURSUANT TO SECTION 12(b) OF THE ACT:
TITLE OF EACH CLASS:
Class A Common Stock, Par Value $0.01 per Share
NAME OF EACH EXCHANGE ON WHICH REGISTERED:
New York Stock Exchange
SECURITIES REGISTERED PURSUANT TO SECTION 12(g) OF THE ACT:
None
Indicate by check mark if the registrant is a well-known seasoned issuer, as defined in Rule 405 of the Securities Act. Yes [X] No [ ]
Indicate by check mark if the registrant is not required to file reports pursuant to Section 13 or Section 15(d) of the Act. Yes [ ] No [X]
Indicate by check mark whether the registrant (1) has filed all reports required to be filed by Section 13 or 15(d) of the Securities Exchange Act of 1934 during the preceding 12 months (or for such shorter period that the registrant was required to file such reports), and (2) has been subject to such filing requirements for the past 90 days. Yes [X] No [ ]
Indicate by check mark whether the registrant has submitted electronically and posted on its corporate Web site, if any, every Interactive Data File required to be submitted and posted pursuant to Rule 405 of Regulation S-T (§232.405 of this chapter) during the preceding 12 months (or for such shorter period that the registrant was required to submit and post such files). Yes [X] No [ ]
Indicate by check mark if disclosure of delinquent filers pursuant to Item 405 of Regulation S-K (§229.405 of this chapter) is not contained herein, and will not be contained, to the best of registrant’s knowledge, in definitive proxy or information statements incorporated by reference in Part III of this Form 10-K or any amendment to this Form 10-K. [X]
Indicate by check mark whether the registrant is a large accelerated filer, an accelerated filer, a non-accelerated filer, or a smaller reporting company. See the definitions of “large accelerated filer,” “accelerated filer” and “smaller reporting company” in Rule 12b-2 of the Exchange Act. Large accelerated filer [X ] Accelerated filer [ ] Non-accelerated filer [ ] Smaller reporting company [ ]
Indicate by check mark whether the registrant is a shell company (as defined in Rule 12b-2 of the Exchange Act). Yes [ ] No [X]
The aggregate market value of the registrant’s voting common stock held by non-affiliates of the registrant on
June 30, 2016
(the last business day of the registrant’s most recently completed second fiscal quarter), based upon the closing sale price of the registrant’s Class A Common Stock on that date of $34.75 per share, was
$781,008,370
. For purposes of this calculation, the registrant’s directors, executive officers, and greater than 10 percent shareholders are deemed to be affiliates.
As of
January 31, 2017
, there were
30,627,012
and
11,476,932
shares of Class A Common Stock and Class B Common Stock, par value $0.01 per share, outstanding, respectively (excluding 11,317,364 shares of Class A Common Stock held by wholly owned subsidiaries).
DOCUMENTS INCORPORATED BY REFERENCE
Portions of the registrant’s definitive Proxy Statement to be filed for its 2017 Annual Meeting of Shareholders, scheduled to be held May 25, 2017, are incorporated by reference into Part III of this Form 10-K.
NELNET, INC.
FORM 10-K
TABLE OF CONTENTS
December 31, 2016
FORWARD-LOOKING AND CAUTIONARY STATEMENTS
This report contains forward-looking statements and information that are based on management's current expectations as of the date of this document. Statements that are not historical facts, including statements about the Company's plans and expectations for future financial condition, results of operations or economic performance, or that address management's plans and objectives for future operations, and statements that assume or are dependent upon future events, are forward-looking statements. The words “may,” “should,” “could,” “would,” “predict,” “potential,” “continue,” “expect,” “anticipate,” “future,” “intend,” “plan,” “believe,” “estimate,” “assume,” “forecast,” “will,” and similar expressions, as well as statements in future tense, are intended to identify forward-looking statements.
The forward-looking statements are based on assumptions and analyses made by management in light of management's experience and its perception of historical trends, current conditions, expected future developments, and other factors that management believes are appropriate under the circumstances. These statements are subject to known and unknown risks, uncertainties, assumptions, and other factors that may cause the actual results and performance to be materially different from any future results or performance expressed or implied by such forward-looking statements. These factors include, among others, the risks and uncertainties set forth in “Risk Factors” and elsewhere in this report, and include such risks and uncertainties as:
|
•
|
student loan portfolio risks such as interest rate basis and repricing risk resulting from the fact that the interest rate characteristics of the student loan assets do not match the interest rate characteristics of the funding for those assets, the risk of loss of floor income on certain student loans originated under the Federal Family Education Loan Program (the "FFEL Program" or "FFELP"), risks related to the use of derivatives to manage exposure to interest rate fluctuations, uncertainties regarding the expected benefits from purchased securitized and unsecuritized FFELP student loans and initiatives to purchase additional FFELP and private education loans, and risks from changes in levels of student loan prepayment or default rates;
|
|
•
|
financing and liquidity risks, including risks of changes in the general interest rate environment and in the securitization and other financing markets for student loans, including adverse changes resulting from slower than expected payments on student loans in FFELP securitization trusts, which may increase the costs or limit the availability of financings necessary to purchase, refinance, or continue to hold student loans;
|
|
•
|
risks from changes in the educational credit and services markets resulting from changes in applicable laws, regulations, and government programs and budgets, such as the expected decline over time in FFELP loan interest income and fee-based revenues due to the discontinuation of new FFELP loan originations in 2010 and potential government initiatives or legislative proposals to consolidate existing FFELP loans to the Federal Direct Loan Program or otherwise allow FFELP loans to be refinanced with Federal Direct Loan Program loans, risks related to adverse changes in the Company's volumes allocated under the Company's loan servicing contract with the U.S. Department of Education (the "Department"), which accounted for approximately 20 percent of the Company's revenue in 2016, risks related to the Department's initiative to procure a new contract for federal student loan servicing to acquire a single servicing platform to service all loans owned by the Department, including the risk that the Company's joint venture with Great Lakes Educational Loan Services, Inc. ("Great Lakes") may not be awarded the contract, and risks related to the Company's ability to comply with agreements with third-party customers for the servicing of FFELP, Federal Direct Loan Program, and private education and consumer loans;
|
|
•
|
risks related to a breach of or failure in the Company's operational or information systems or infrastructure, or those of third-party vendors, including cybersecurity risks related to the potential disclosure of confidential student loan borrower and other customer information;
|
|
•
|
uncertainties inherent in forecasting future cash flows from student loan assets and related asset-backed securitizations;
|
|
•
|
the uncertain nature of the expected benefits from the acquisition of Allo Communications LLC and the ability to integrate its communications operations and successfully expand its fiber network in existing service areas and additional communities and manage related construction risks;
|
|
•
|
risks and uncertainties related to initiatives to pursue additional strategic investments and acquisitions, including investments and acquisitions that are intended to diversify the Company both within and outside of its historical core education-related businesses; and
|
|
•
|
risks and uncertainties associated with litigation matters and with maintaining compliance with the extensive regulatory requirements applicable to the Company's businesses, reputational and other risks, including the risk of increased regulatory costs, resulting from the recent politicization of student loan servicing, and uncertainties inherent in the estimates and assumptions about future events that management is required to make in the preparation of the Company's consolidated financial statements.
|
All forward-looking statements contained in this report are qualified by these cautionary statements and are made only as of the date of this document. Although the Company may from time to time voluntarily update or revise its prior forward-looking statements to reflect actual results or changes in the Company's expectations, the Company disclaims any commitment to do so except as required by securities laws.
2
Overview
Nelnet, Inc. (the “Company”) is a diverse company with a focus on delivering education-related products and services and student loan asset management. The largest operating businesses engage in student loan servicing, tuition payment processing and school information systems, and communications. A significant portion of the Company's revenue is net interest income earned on a portfolio of federally insured student loans. The Company also makes investments to further diversify the Company both within and outside of its historical core education-related businesses, including, but not limited to, investments in real estate and start-up ventures. Substantially all revenue from external customers is earned, and all long-lived assets are located, in the United States.
The Company was formed as a Nebraska corporation in 1978 to service federal student loans for two local banks. The Company built on this initial foundation as a servicer to become a leading originator, holder, and servicer of federal student loans, principally consisting of loans originated under the FFEL Program. A detailed description of the FFEL Program is included in Appendix A to this report.
The Health Care and Education Reconciliation Act of 2010 (the “Reconciliation Act of 2010”) eliminated new loan originations under the FFEL Program effective July 1, 2010 and requires that all new federal student loan originations be made through the Federal Direct Loan Program. This law does not alter or affect the terms and conditions of existing FFELP loans.
As a result of the Reconciliation Act of 2010, the Company no longer originates new FFELP loans. However, a significant portion of the Company's income continues to be derived from its existing FFELP student loan portfolio. As of
December 31, 2016
, the Company had a
$24.9 billion
student loan portfolio that will amortize over the next approximately 25 years. Interest income on the Company's existing FFELP loan portfolio will decline over time as the portfolio is paid down. However, since July 1, 2010, the effective date on and after which no new loans could be originated under the FFEL Program, the Company has purchased $21.1 billion of FFELP loans from other FFELP loan holders looking to adjust their FFELP businesses. The Company believes there may be additional opportunities to purchase FFELP portfolios to generate incremental earnings and cash flow. However, since all FFELP loans will eventually run off, a key objective of the Company is to reposition the Company for the post-FFELP environment.
To reduce its reliance on interest income on student loans, the Company has expanded its services and products. This expansion has been accomplished through internal growth and innovation as well as business acquisitions. In addition, in 2009, the Company began servicing federally-owned student loans for the Department.
As of December 31, 2016, the Company was servicing $162.5 billion of student loans for 6.0 million borrowers
on behalf of the Department.
Operating Segments
The Company has four reportable operating segments as summarized below.
Loan Systems and Servicing
|
•
|
Referred to as Nelnet Diversified Solutions (“NDS”)
|
|
•
|
Focuses on student loan servicing, consumer loan origination and servicing, student loan servicing-related technology solutions, and outsourcing services for lenders, guaranty agencies, and other entities
|
|
•
|
Includes the brands Nelnet Loan Servicing, Firstmark Services, GreatNet Solutions, and Proxi
|
Tuition Payment Processing and Campus Commerce
|
•
|
Commonly known as Nelnet Business Solutions (“NBS”)
|
|
•
|
Focuses on tuition payment plans, financial needs assessment services, online payment and refund processing, and school information system software
|
|
•
|
Includes the brands FACTS Management, Nelnet Campus Commerce, and RenWeb
|
Communications
|
•
|
Includes the operations of Allo Communications LLC ("Allo")
|
|
•
|
Focuses on providing fiber optic service directly to homes and businesses for internet, broadband, telephone, and television services
|
3
Asset Generation and Management
|
•
|
Includes the acquisition and management of the Company's student loan assets
|
Segment Operating Results
The Company's reportable operating segments are defined by the products and services they offer or the types of customers they serve, and they reflect the manner in which financial information is currently evaluated by management. The Company includes separate financial information about its reportable segments, including revenues, net income or loss, and total assets for each of the Company's reportable segments, for the last three fiscal years in note 14 of the notes to consolidated financial statements included in this report. For segment reporting purposes, business activities and operating segments that are not reportable are combined and included in "Corporate and Other Activities."
Loan Systems and Servicing
The primary service offerings of this operating segment include:
|
•
|
Servicing federally-owned student loans for the Department
|
|
•
|
Servicing FFELP loans
|
|
•
|
Originating and servicing private education and consumer loans
|
|
•
|
Providing student loan servicing software and other information technology products and services
|
|
•
|
Providing outsourced services including call center, processing, and marketing services
|
In addition, this segment provided servicing and outsourcing services for FFELP guaranty agencies, including FFELP guaranty collection services, through June 30, 2016.
As of
December 31, 2016
, the Company serviced $194.8 billion of student loans for 7.6 million borrowers. See Part II, Item 7, "Management's Discussion and Analysis of Financial Condition and Results of Operations - Loan Systems and Servicing Operating Segment - Results of Operations - Student Loan Servicing Volumes" for additional information related to the Company's servicing volume.
Servicing federally-owned student loans for the Department
The Company is one of four private sector companies (referred to as Title IV Additional Servicers, or "TIVAS") awarded a student loan servicing contract by the Department in June 2009 to provide additional servicing capacity for loans owned by the Department, with new loan volume historically allocated among the four servicers based on certain performance metrics established by the Department beginning in 2010. These loans include Federal Direct Loan Program loans originated directly by the Department and FFEL Program loans purchased by the Department. Under the servicing contract, the Company earns a monthly fee from the Department for each unique borrower who has loans owned by the Department and serviced by the Company. The amount paid per each unique borrower is dependent on the status of the borrower (such as in school or in repayment). The servicing contract with the Department expires on June 16, 2019.
In April 2016, the Department's Office of Federal Student Aid released information regarding a new contract procurement process for the Department to acquire a single servicing system platform with multiple customer service providers to manage all student loans owned by the Department. The contract solicitation process was divided into two phases.
On May 6, 2016, the Company and Great Lakes submitted a joint response to Phase I as part of a newly created joint venture to respond to the contract solicitation process and to provide services under the new contract in the event that the Department selects it to be awarded with the contract. The joint venture will operate as a new legal entity called GreatNet Solutions, LLC ("GreatNet"). The Company and Great Lakes each own 50 percent of the ownership interests of GreatNet. In addition to the Company, Great Lakes is currently one of four TIVAS that has a student loan servicing contract with the Department to provide servicing for loans owned by the Department. GreatNet was one of three entities selected to respond to Phase II of the procurement selection process. On January 6, 2017, GreatNet submitted its Phase II response to the Department and is currently awaiting announcement from the new administration on the next steps in the procurement process.
4
As of December 31, 2016, the Company was servicing $162.5 billion of student loans for 6.0 million borrowers
under this contract. The Department is the Company's largest customer, representing approximately 20 percent of the Company's revenue in 2016.
The Department also has contracts with 31 not-for-profit ("NFP") entities to service student loans, although currently five NFP servicers service the volume allocated to these 31 entities. While previously these entities have only serviced existing loans, effective January 1, 2015 they began to receive 25 percent of new borrower loan volume. On March 2, 2016, the Department announced that, for the period March 1, 2016 through June 30, 2016 and for the period July 1, 2016 through February 2017 month end, new student loan servicing volume would be allocated for servicing among the then group of ten TIVAS and NFP servicers on the basis of the currently established performance metrics as compared among all ten loan servicers in that group. The amended allocation methodology of new borrower loan volume has and may continue to decrease new allocation volume for the Company. However, the Company did and will continue to benefit from the allocation of additional borrowers to the three NFP servicers to which the Company licenses its remote-hosted servicing software. One NFP servicer exited the Federal Direct Loan Program servicing business, transferring its 188,956 borrowers to Nelnet for servicing in August 2016.
The Department currently allocates new loan volume among the nine servicers based on the following performance metrics:
|
•
|
Two metrics measure the satisfaction among separate customer groups, including borrowers (35 percent) and Federal Student Aid personnel who work with the servicers (5 percent).
|
|
•
|
Three metrics measure the success of keeping borrowers in an on-time repayment status and helping borrowers avoid default as reflected by the percentage of borrowers in current repayment status (30 percent), percentage of borrowers more than 90 days but less than 271 days delinquent (15 percent), and percentage of borrowers over 270 days and less than 361 days delinquent (15 percent). The loans are evaluated in 15 different loan portfolio stratifications to account for differences in portfolios.
|
The allocation of ongoing volume is determined twice each year based on the performance of each servicer in relation to the other servicers. Quarterly results are compiled for each servicer. The average of the September and December quarter end results are used to allocate volume for the period from March 1 to August 31, and the average of the March and June quarter end results are used to allocate volume for the period from September 1 to February month end, of each year.
5
The following table shows the Company's rankings and percent of new volume allocated to the Company since the inception of the Department's allocations of new loan volume based on performance metrics methodologies under this contract:
|
Initial Metrics (a)
|
New Metrics, NFPs received 25% of volume (b)
|
Current Metrics (TIVAS and NFPs using common metrics)
|
||||||||||||||||
|
Performance Evaluation Period
|
1
|
2
|
3
|
4
|
5
|
6
|
7
|
8
|
9
|
|||||||||
|
Defaulted borrower #
|
4
|
4
|
1
|
1
|
2
|
Borrower survey
|
2
|
2
|
1
|
4
|
||||||||
|
Defaulted borrower $
|
4
|
4
|
1
|
1
|
2
|
FSA survey
|
2
|
2
|
2
|
4
|
||||||||
|
Borrower survey
|
4
|
4
|
3
|
2
|
2
|
Current repay %
|
4
|
4
|
10
|
3
|
||||||||
|
School survey
|
2
|
2
|
2
|
3
|
2
|
91-270 Repay %
|
4
|
4
|
10
|
6
|
||||||||
|
FSA survey
|
3
|
3
|
3
|
3
|
4
|
271-360 Repay %
|
4
|
4
|
10
|
9
|
||||||||
|
Overall ranking
|
4
|
4
|
1
|
1
|
2
|
4
|
4
|
8
|
5
|
|||||||||
|
Allocation
|
16%
|
16%
|
30%
|
30%
|
26%
|
14%
|
13%
|
8%
|
12%
|
|||||||||
|
Allocation period
|
August 15, 2010 - August 14, 2011
|
August 15, 2011 - August 14, 2012
|
August 15, 2012 - August 14, 2013
|
August 15, 2013 - August 14, 2014
|
August 15, 2014 - February 28, 2015
|
March 1, 2015 - August 31, 2015
|
September 1, 2015 - February 29, 2016
|
March 1, 2016 - June 30, 2016
|
July 1, 2016 - February 28, 2017
|
|||||||||
|
(a)
|
During the first five years of the servicing contract, the Department allocated new loan volume among the four TIVAS based on the following performance metrics:
|
|
◦
|
Two performance metrics measured the success of default prevention efforts as reflected by the percentage of borrowers (20 percent) and percentage of dollars (20 percent) in each servicer's portfolio that went into default.
|
|
◦
|
Three metrics measured the satisfaction among separate borrower groups, including borrowers (20 percent), financial aid personnel at postsecondary schools participating in federal student loan programs (20 percent), and Federal Student Aid and other federal agency personnel or contractors who worked with the servicers (20 percent).
|
|
(b)
|
For these performance evaluation periods (6 and 7 in the above table), the numerical rankings are among the four TIVAS, since the NFPs received a fixed 25 percent of new loan volume.
|
Incremental revenue components earned by the Company from the Department (in addition to loan servicing revenues) include:
|
•
|
Administration of the Total and Permanent Disability (TPD) Discharge program
. The Company processes applications for the TPD Discharge program and is responsible for discharge, monitoring, and servicing of TPD loans. Individuals who are totally and permanently disabled may qualify for a discharge of their federal student loans, and the Company processes applications under the program and receives a fee from the Department on a per application basis, as well as a monthly servicing fee during the monitoring period. The Company is the exclusive provider of this service to the Department.
|
|
•
|
Origination of consolidation loans.
Beginning in 2014, the Department implemented a process to outsource the origination of consolidation loans whereby each of the four TIVAS receives Federal Direct Loan consolidation origination volume based on borrower choice. The Department pays the Company a fee for each completed consolidation loan application it processes. The Company services the consolidation volume it originates.
|
Servicing FFELP loans
The Loan Systems and Servicing operating segment provides for the servicing of the Company's student loan portfolio and the portfolios of third parties. The loan servicing activities include loan conversion activities, application processing, borrower updates, customer service, payment processing, due diligence procedures, funds management reconciliations, and claim processing. These activities are performed internally for the Company's portfolio, in addition to generating external fee revenue when performed for third-party clients.
The Company's student loan servicing division uses proprietary systems to manage the servicing process. These systems provide for automated compliance with most of the federal student loan regulations adopted under Title IV of the Higher Education Act of 1965, as amended (the “Higher Education Act”).
The Company serviced FFELP loans on behalf of 25 third-party servicing customers as of December 31, 2016. The Company's FFELP servicing customers include national and regional banks, credit unions, and various state and non-profit secondary markets.
6
The majority of the Company's external FFELP loan servicing activities are performed under “life of loan” contracts. Life of loan contract servicing essentially provides that as long as the loan exists, the Company shall be the sole servicer of that loan; however, the agreement may contain “deconversion” provisions where, for a fee, the lender may move the loan to another servicer.
The elimination of new FFELP loan originations in July 2010 has caused and will continue to cause FFELP servicing revenue to decline as FFELP loan portfolios are paid down. However, the Company believes there may be opportunities to service additional FFELP loan portfolios from current FFELP participants as the program winds down.
Originating and servicing private education and consumer loans
The Loan Systems and Servicing operating segment conducts origination and servicing activities for consumer loans which include both private education and personal loan products.
Private education loans are loans to students or their families that are non-federal loans; as such, the loans are not issued or guaranteed by the federal government. These loans are used primarily to bridge the gap between the cost of higher education and the amount funded through financial aid, federal loans, or the borrowers' personal resources. Although similar in terms of activities and functions as FFELP loan servicing (i.e., application processing, disbursement processing, payment processing, customer service, statement distribution, and reporting), private education loan servicing activities are not required to comply with provisions of the Higher Education Act and may be more customized to individual client requirements.
The Company has invested in modernizing key technologies and services to position the business for the long-term, expanding services to include personal loan products and other consumer installment assets. Improvements allow for diversified products to be both originated and serviced with state of the art application and servicing platforms to drive growth for the Company's client partners. Presenting a very wide market opportunity of new entrants and existing players, consumer lending is a key growth area. In both backup servicing, and full servicing partnerships, the Company is a valuable resource for consumer lenders and asset holders as it allows for leveraged economies of scale, high compliance, and secure service to client partners.
The Company serviced private education and consumer loans on behalf of 24 third-party servicing customers as of December 31, 2016. In addition, the Company provides back-up servicing arrangements to assist nine entities for more than 200,000 borrowers. For a monthly fee, these arrangements require 30 to 90 day notice from a triggering event to transfer the customer's servicing volume to the Company's platform and becoming a full servicing customer.
Providing student loan servicing software and other information technology products and services
The Loan Systems and Servicing operating segment provides data center services and student loan servicing software for servicing private education and federal loans. These proprietary software systems are used internally by the Company and licensed to third-party student loan holders and servicers. These software systems have been adapted so they can be offered as hosted servicing software solutions that can be used by third-parties to service various types of student loans, including Federal Direct Loan Program and FFEL Program loans. The Company earns a monthly fee from its remote hosting customers for each unique borrower on the Company's platform, with a minimum monthly charge for most contracts. As of
December 31, 2016
, 2.2 million borrowers were hosted on the Company's hosted servicing software solution platforms.
Providing outsourced services including call center, processing, and marketing services
The Company provides business process outsourcing specializing in contact center management. The contact center solutions and services include taking inbound calls, helping with outreach campaigns and sales, and interacting with customers through multi-channels.
Servicing and outsourcing services for FFELP guaranty agencies, including FFELP guaranty collection services
A significant amount of the Company's guaranty servicing revenue historically came from a single guaranty servicing client, College Assist, the Colorado state-designated guarantor. The contract with College Assist expired on October 31, 2015, and was not renewed. FFELP guaranty servicing and FFELP guaranty collection revenue recognized by the Company from College Assist for the years ended December 31, 2015 and 2014 was $37.4 million, and $48.8 million, respectively.
The Company’s second largest guaranty servicing client, Tennessee Student Assistance Corporation ("TSAC"), exited the FFELP guaranty business at the end of their contract term on June 30, 2016. FFELP guaranty servicing and FFELP guaranty collection
7
revenue recognized by the Company from TSAC for the years ended December 31, 2016, 2015, and 2014 was $9.6 million, $19.5 million, and $17.9 million, respectively.
After the expiration of TSAC's contract, the Company has no remaining guaranty revenue.
Competition
The Company's scalable servicing platform allows it to provide compliant, efficient, and reliable service at a low cost, giving the Company a competitive advantage over others in the industry for all of this segment's services, the competitive environment for which is discussed below.
Loan servicing
The principal competitor for existing and prospective FFELP and private education loan servicing business is Navient Corporation ("Navient"). Navient is the largest for-profit provider of servicing functions. In contrast to its competitors, the Company has segmented its private education loan servicing on a distinct platform, created specifically to meet the needs of private education student loan borrowers, their families, the schools they attend, and the lenders who serve them. This ensures access to specialized teams with a dedicated focus on servicing these borrowers.
With the elimination of new loan originations under the FFEL Program, four servicers, including the Company, were named by the Department in 2009 as servicers of federally-owned loans. The three other servicers are Great Lakes, FedLoan Servicing (Pennsylvania Higher Education Assistance Agency ("PHEAA")), and Navient. In addition, the Department has contracts with 31 NFP entities to service student loans that are serviced by five prime servicers. These NFP entities were authorized in 2012 to begin servicing loans for existing borrower accounts. While previously these entities have only serviced existing loans, effective January 1, 2015 they began to receive a portion of new borrower loan activity. The Company currently licenses its hosted servicing software to three prime servicers that represent 13 NFP organizations. PHEAA is the only other TIVAS servicer offering a hosted Federal Direct Loan Program servicing solution to the NFP servicers.
As described above, the Company's contract with the Department expires on June 16, 2019. In April 2016, the Department's Office of Federal Student Aid released information regarding a new contract procurement process for the Department to acquire a single servicing system platform with multiple customer service providers to manage all student loans owned by the Department. The contract solicitation process is divided into two phases, and the Company and Great Lakes submitted a joint response to Phase I as part of a newly created joint venture to respond to the contract solicitation process and to provide services under the new contract in the event that the Department selects it to be awarded with the contract. On June 30, 2016, the Department announced which entities were selected to respond to Phase II of the procurement selection process. GreatNet was one of three entities selected, and PHEAA and Navient were also selected to respond to Phase II. On January 6, 2017, GreatNet submitted its Phase II response to the Department and is currently awaiting announcement from the new administration on the next steps in the procurement process.
Software and technology
The Company is one of the leaders in the development of servicing software for guaranty agencies, consumer loan programs, the Federal Direct Loan Program, and FFELP student loans. Many student loan lenders and servicers utilize the Company's software either directly or indirectly. The Company believes the investments it has made to scale its systems and to create a secure infrastructure to support the Department's servicing volume and requirements increase its competitive advantage as a long-term partner in the loan servicing market.
Tuition Payment Processing and Campus Commerce
The Company's Tuition Payment Processing and Campus Commerce operating segment provides products and services to help students and families manage the payment of education costs at all levels (K-12 and higher education). It also provides innovative education-focused technologies, services, and support solutions to help schools automate administrative processes and collect and process commerce data. The majority of this segment's customers are located in the United States; however, the Company has begun providing its products and services in Australia and currently believes there are opportunities to increase its customer base and revenue in Australia.
8
See Part II, Item 7, "Management's Discussion and Analysis of Financial Condition and Results of Operations - Tuition Payment Processing and Campus Commerce Operating Segment - Results of Operations" for a discussion of the seasonality of the business in this operating segment.
K-12
In the K-12 market, the Company offers tuition management services, school information systems, and assistance with financial needs assessment and donor management. The Company provides services for nearly 13,500 K-12 schools and serves over two million families representing over three million students.
The Company is the market leader in actively managed tuition payment plans. Tuition management services include payment plan administration, incidental billing, accounts receivable management, and record keeping. K-12 educational institutions contract with the Company to administer deferred payment plans that allow families to make monthly payments generally over 6 to 12 months. The Company collects a fee from either the institution or the payer as an administration fee.
The Company's financial needs assessment service helps K-12 schools evaluate and determine the amount of financial aid to disburse to the families it serves. The Company's donor services allow schools to assess and deliver strategic fundraising solutions using the latest technology.
On June 3, 2014, the Company purchased 100 percent of the ownership interests of RenWeb. RenWeb provides school information systems to help schools automate administrative processes such as admissions, enrollment, scheduling, student billing, attendance, and grade book management. RenWeb's information systems software is sold as a subscription service to schools. The combination of RenWeb’s school administration software and the Company’s tuition management and financial needs assessment services has significantly increased the value of the Company’s offerings in this area, allowing the Company to deliver a comprehensive suite of solutions to schools.
Higher Education
The Company offers two principal products to the higher education market: actively managed tuition payment plans, and campus commerce technologies and payment processing. The Company provides service for 970 colleges and universities world-wide and serves over 7 million students and families.
Higher education institutions contract with the Company to administer actively managed payment plans that allow the student and family to make monthly payments on either a semester or annual basis. The Company collects a fee from the student or family as an administration fee.
The Company's suite of campus commerce solutions provides services that allow for families' electronic billing and payment of campus charges. Campus commerce includes cashiering for face-to-face transactions, campus-wide commerce management, and refunds management, among other activities. The Company earns revenue for e-billing, hosting and maintenance, credit card processing fees, and e-payment transaction fees, which are powered by the Company's secure payment processing systems.
The Company's campus commerce products are sold as a subscription service to colleges and universities. The systems
process payments through the appropriate channels in the banking or credit card networks to make deposits into the client's bank account. The systems can be further deployed to other departments around campus as requested (e.g., application fees, alumni giving, parking, events, etc.).
Competition
The Company is the largest provider of tuition management services to the private and faith-based K-12 market in the United States. Competitors include financial institutions, tuition management providers, financial needs assessment providers, accounting firms, and a myriad of software companies.
In the higher education market, the Company targets business offices at colleges and universities. In this market, the primary competition is limited to only a few campus commerce and tuition payment providers, as well as solutions developed in-house by colleges and universities.
The Company's principal competitive advantages are (i) the customer service it provides to institutions and consumers, (ii) the technology provided with the Company's service, and (iii) the Company's ability to integrate its technology with the institution
9
clients and their third party service providers. The Company believes its clients select products primarily based on technology features and functionality and the ability to integrate with other systems, but price and service also impact the selection process.
Communications
On December 31, 2015, the Company acquired the majority of the membership interests of Allo. Allo derives its revenue primarily from the sale of advanced telecommunication services, including internet, broadband, telephone, and television services, to business and residential customers in Nebraska, and specializes in high-speed internet and broadband services available through its all-fiber network. Allo currently serves the Scottsbluff, Gering, Bridgeport, North Platte, Ogallala, and Alliance communities in Nebraska. In September 2016, Allo began providing services in Lincoln, Nebraska, as part of a multi-year project to pass substantially all commercial and residential properties in the community. Allo currently plans to expand to additional communities in Nebraska and possibly surrounding states over the next several years.
Internet, broadband, and television services
Internet, broadband, and television services include data and video products and services to residential and business subscribers. Allo data services provide high-speed internet access over Allo's all-fiber network at various symmetrical speeds up to 1 gigabit per second, depending on the nature of the network facilities that are available, the level of service selected, and the geographic market availability. Allo also offers a variety of data connectivity services, including Ethernet services capable of connecting multiple connections over Allo's fiber-based networks. Allo's Internet Protocol Television Video ("IPTV") services range from limited basic service to advanced television, which includes several plans each with hundreds of local, national, and music channels, including premium and pay-per-view channels, as well as video on demand service. Subscribers may also subscribe to Allo's advanced video services, which consist of high-definition television, digital video recorders (“DVR”), and/or a whole home DVR. Allo's whole home DVR gives customers the ability to watch recorded shows on any television in the house, record multiple shows at one time, and utilize an intuitive on-screen guide and user interface.
Allo expects that internet and broadband services will continue to increase as a more significant component of its overall services, and offset the anticipated decline in traditional residential telephone and television services.
Telephone services
Local calling services include a full suite of telephone services, including basic services, primary rate interface ("PRI"), and session initiation protocol ("SIP"). Allo's service plans include options for voice-mail and other enhanced custom calling features including hunting, caller ID, call forwarding, and call waiting, among others. Services are charged at a fixed monthly rate or can be bundled with selected services at a discounted rate. Allo provides a hosted private branch exchange ("PBX") package, which utilizes a soft switch and allows the customer the flexibility of utilizing new telephone technology and features without investing in a new telephone system. The package bundles local service, calling features, and internet protocol (“IP”) business telephones.
Long-distance services include traditional domestic and international long distance which enables customers to make calls that terminate outside their local calling area. These services also include toll free calls and conference calling. Allo offers a variety of long-distance plans, including unlimited flat-rate calling plans, and offers a combination of subscription and usage fees.
Sales and Marketing
The key components of Allo's overall marketing strategy include:
|
•
|
Promoting the advantages of an all-fiber network connected directly to homes and businesses that delivers synchronous internet speeds of one gigabit per second (about 100 times faster than standard broadband connections with copper or coaxial cable)
|
|
•
|
Building complete fiber communities by passing all homes and businesses within their network
|
|
•
|
Organizing sales and marketing activities around consumer, enterprise, and carrier customers
|
|
•
|
Positioning Allo as a single point of contact for customers’ communications needs
|
|
•
|
Providing customers with a broad array of internet, broadband, television, and telephone services and bundling these services whenever possible
|
|
•
|
Providing excellent customer service, including 24/7/365 centralized customer support to coordinate installation of new services, repair, and maintenance functions
|
|
•
|
Developing and delivering new services to meet evolving customer needs and market demands
|
|
•
|
Utilizing proven modern technology to deliver services
|
10
Allo currently offers services through direct marketing, call centers, its website, communication centers, and commissioned sales representatives. Allo markets its services both individually and as bundled services, including its triple-play offering of internet, television, and telephone services. By bundling service offerings, Allo is able to offer and sell a more complete and competitive package of services, which simultaneously increases its margin per customer and adds value for the consumer. Allo also believes that bundling leads to increased customer loyalty and retention.
Network Architecture and Technology
Allo has made significant investments in its technologically advanced telecommunications networks. As a result, Allo is able to deliver high-quality, reliable internet, broadband, telephone, and television services through fiber optics. Allo's wide-ranging network and extensive use of fiber provide an easy reach into existing and new areas. By bringing the fiber network to the customer premises, Allo can increase its service offerings, quality, and bandwidth services. Allo's existing fiber network enables it to efficiently respond and adapt to changes in technology and is capable of supporting the rising customer demand for bandwidth in order to support the growing amount of internet devices in the home. Allo's all-fiber network enhances its operating efficiencies by facilitating new network and technology choices that provide for lower costs to operate. Allo's networks are supported by an advanced digital telephone switch and IPTV service platform. The digital switch provides all local telephone customers with access to a full suite of telecommunication products, custom calling features, and value-added services. Allo's fiber network utilizes fiber-to-the-premise (“FTTP”) networks to offer bundled residential and commercial services. Allo leverages its high definition IPTV headend equipment to distribute content across its network allowing Allo to provide a sharp video picture, and to better manage costs of future channel additions and upgrades. Allo's network provides substantially all of its marketable homes and businesses with bandwidth of 1 gigabit per second.
Growth Strategy
As discussed above, Allo plans to increase its customer base with its superior all-fiber network by increasing market share in existing markets and entering additional markets currently served by carriers using traditional copper and coaxial cable in their telecommunications network, including Lincoln, Nebraska and additional communities in Nebraska and possibly surrounding states. Although the initial capital expenditures for these expansion efforts are expected to be significant, Allo believes that its service delivery model will continue to generate customer demand sufficient to provide attractive returns on the capital investment. In addition, Allo is focused on increasing revenues per customer by capitalizing on increased demand for bandwidth by commercial and residential customers.
Competition
Telecommunications businesses are highly competitive and continue to face increased competition as a result of technology changes and industry legislative and regulatory developments. Allo faces actual or potential competition from many existing and emerging companies, including incumbent and competitive local telephone companies, long-distance carriers and resellers, wireless companies, internet service providers ("ISPs"), satellite companies, cable television companies, and in some cases by new forms of providers who are able to offer competitive services through software applications, requiring a comparatively small initial investment. Due to consolidation and strategic alliances within the industry, Allo cannot predict the number of competitors it will face at any given time. The wireless business has expanded significantly and has caused many residential subscribers of traditional telephone services to discontinue those services and to rely exclusively on wireless service. Consumers are finding individual television shows of interest to them through the internet and are watching content that is downloaded to their computers. Some providers, including television and cable television content owners, have initiated what are referred to as “over-the-top” services that deliver video content to televisions and computers over the internet. Over-the-top services can include episodes of highly-rated television series in their current broadcast seasons. They also can include content that is related to broadcast or sports content that Allo carries, but that is distinct and may be available only through the alternative source. Finally, the transition to digital broadcast television has allowed many consumers to obtain high definition local broadcast television signals (including many network affiliates) over-the-air, using a simple antenna. Consumers can pursue each of these options without foregoing any of the other options. The incumbent telephone carriers in the markets Allo serves enjoy certain business advantages, including size, financial resources, favorable regulatory position, a more diverse product mix, brand recognition, and connection to virtually all of Allo's customers and potential customers. The largest cable operators also enjoy certain business advantages, including size, financial resources, ownership of or superior access to desirable programming and other content, a more diverse product mix, brand recognition, and first-in-the-field advantages with a customer base that generates positive cash flow for its operations. Allo's competitors continue to add features and adopt aggressive pricing and packaging for services comparable to the services Allo offers. Their success in selling some services competitive with Allo's can lead to revenue erosion in other related areas. Allo faces
11
intense competition in its markets for long-distance, internet access, and other ancillary services that are important to Allo's business and to its growth strategy.
Asset Generation and Management
The Asset Generation and Management operating segment includes the acquisition, management, and ownership of the Company's student loan assets. As of
December 31, 2016
, the Company's student loan portfolio was $24.9 billion. The Company generates a substantial portion of its earnings from the spread, referred to as the Company's student loan spread, between the yield it receives on its student loan portfolio and the associated costs to finance such portfolio. See Part II, Item 7, “Management's Discussion and Analysis of Financial Condition and Results of Operations - Asset Generation and Management Operating Segment - Results of Operations - Student Loan Spread Analysis,” for further details related to the student loan spread. The student loan assets are held in a series of education lending subsidiaries and associated securitization trusts designed specifically for this purpose. In addition to the student loan spread earned on its portfolio, all costs and activity associated with managing the portfolio, such as servicing of the assets and debt maintenance, are included in this segment.
Student loans consist of federally insured student loans and private education loans. Federally insured student loans were originated under the FFEL Program. The Company's portfolio of federally insured student loans is subject to minimal credit risk, as these loans are guaranteed by the Department at levels ranging from 97 percent to 100 percent. Substantially all of the Company's loan portfolio (
98.9 percent
as of
December 31, 2016
) is federally insured. The Company's portfolio of private education loans is subject to credit risk similar to other consumer loan assets.
The Higher Education Act regulates every aspect of the federally insured student loan program, including certain communications with borrowers, loan originations, and default aversion. Failure to service a student loan properly could jeopardize the guarantee on federal student loans. In the case of death, disability, or bankruptcy of the borrower, the guarantee covers 100 percent of the loan's principal and accrued interest.
FFELP loans are guaranteed by state agencies or non-profit companies designated as guarantors, with the Department providing reinsurance to the guarantor. Guarantors are responsible for performing certain functions necessary to ensure the program's soundness and accountability. Generally, the guarantor is responsible for ensuring that loans are serviced in compliance with the requirements of the Higher Education Act. When a borrower defaults on a FFELP loan, the Company submits a claim to the guarantor, who provides reimbursements of principal and accrued interest, subject to the applicable risk share percentage.
Origination and Acquisition
The Reconciliation Act of 2010 eliminated originations of new FFELP loans effective July 1, 2010. However, the Company believes there will be ongoing opportunities to continue to purchase FFELP loan portfolios from current FFELP participants looking to adjust their FFELP businesses. For example, from July 1, 2010 through
December 31, 2016
, the Company purchased a total of $21.1 billion of FFELP student loans from various third-parties. The Company's competition for the purchase of student loan portfolios and residuals includes large banks, hedge funds, and other student loan finance companies.
Interest Rate Risk Management
Because the Company generates a significant portion of its earnings from its student loan spread, the interest rate sensitivity of the Company's balance sheet is very important to its operations. The current and future interest rate environment can and will affect the Company's interest income and net income. The effects on the Company's results of operations as a result of the changing interest rate environments are further outlined in Part II, Item 7, "Management's Discussion and Analysis of Financial Condition and Results of Operations - Asset Generation and Management Operating Segment - Results of Operations - Student Loan Spread Analysis" and Part II, Item 7A, “Quantitative and Qualitative Disclosures About Market Risk - Interest Rate Risk.”
Corporate and Other Activities
Real Estate and Other Investments
The Company makes investments to further diversify the Company both within and outside of its historical core education-related businesses, including investments in real estate and start-up ventures. Recent real estate investments have been focused on the development of commercial properties in the Midwest, and particularly in Lincoln, Nebraska, where the Company’s headquarters are located. These investments include projects for the development of properties in Lincoln’s east downtown Telegraph District, including a building planned as a new location for the Company’s student loan servicing operations, and the development of a
12
building in Lincoln’s Haymarket District that will be the new headquarters of Hudl, which provides online video analysis and coaching tools software for athletes of all levels, and where the Company will also be a tenant. As of December 31, 2016, the total amount of real estate investments by the Company was $48.4 million. In addition, the Company has an equity investment in Hudl of $41.4 million. David S. Graff, a member of the Company’s Board of Directors, is a co-founder, the Chief Executive Officer, and a director of Hudl.
Regulation and Supervision
The Company's operating segments and industry partners are heavily regulated by federal and state government regulatory agencies. The following provides a summary of the more significant existing and proposed legislation and regulations affecting the Company. A failure to comply with these laws and regulations could subject the Company to substantial fines, penalties, and remedial and other costs, restrictions on business, and the loss of business. Regulations and supervision can change rapidly, and changes could alter the manner in which the Company operates and increase the Company's operating expenses as new or additional regulatory compliance requirements are addressed.
Loan Systems and Servicing
The Company's Loan Systems and Servicing operating segment, which
services Federal Direct Loan Program, FFELP, and private education and consumer loans, is subject to federal and state consumer protection, privacy, and related laws and regulations. Some of the more significant federal laws and regulations include:
|
•
|
The Higher Education Act, which establishes financial responsibility and administrative capability that govern all third-party servicers of federally insured student loans
|
|
•
|
The Telephone Consumer Protection Act (“TCPA”), which governs communication methods that may be used to contact customers
|
|
•
|
The Truth-In-Lending Act and Regulation Z, which governs disclosures of credit terms to consumer borrowers
|
|
•
|
The Fair Credit Reporting Act and Regulation V, which governs the use and provision of information to consumer reporting agencies
|
|
•
|
The Equal Credit Opportunity Act and Regulation B, which prohibits discrimination on the basis of race, creed, or other prohibited factors in extending credit
|
|
•
|
The Servicemembers Civil Relief Act (“SCRA”), which applies to all debts incurred prior to commencement of active military service and limits the amount of interest, including certain fees or charges that are related to the obligation or liability
|
|
•
|
The Electronic Funds Transfer Act (“EFTA”) and Regulation E, which protects individual consumers engaged in electronic fund transfers (“EFTs”)
|
|
•
|
The Gramm-Leach-Bliley Act (“GLBA”) and Regulation P, which governs a financial institution’s treatment of nonpublic personal information about consumers and requires that an institution, under certain circumstances, notify consumers about its privacy policies and practices
|
|
•
|
Laws prohibiting unfair, deceptive, or abusive acts or practices
|
|
•
|
Various laws, regulations, and standards that govern government contractors
|
As a student loan servicer for the federal government and for financial institutions, including the Company’s FFELP student loan portfolio, the Company is subject to the Higher Education Act and related laws, rules, regulations, and policies. The Higher Education Act regulates every aspect of the federally insured student loan program. The Company has designed its servicing operations to comply with the Higher Education Act, and it regularly monitors the Company's operations to maintain compliance.
Under the TCPA, plaintiffs may seek actual monetary loss or damages of $500 - $1,500 per violation, whichever is greater, and the courts may treble the damage award for willful or knowing violations. In addition, TCPA lawsuits have asserted putative class action claims.
In July 2010, Congress passed The Dodd-Frank Wall Street Reform and Consumer Protection Act (the “Dodd-Frank Act”). The Dodd-Frank Act established the Consumer Financial Protection Bureau (“CFPB”), which has broad authority to regulate a wide range of consumer financial products and services. The Company's student loan servicing business is subject to CFPB oversight authority.
In May 2015, the CFPB launched a public inquiry into student loan servicing practices throughout the industry. In September 2015, the CFPB issued a report discussing public comments submitted in response to the inquiry, and suggesting a framework to improve borrower outcomes and reduce defaults, including the creation of consistent, industry-wide standards for the entire
13
servicing market. In July 2016, the Department expanded on those principles by outlining enhanced customer service standards and protections that will be incorporated into federal servicing contracts and guidelines.
The CFPB is authorized to draft new regulations implementing federal consumer financial protection laws, to enforce those laws and regulations, and to conduct examinations of the Company's operations to determine compliance. The CFPB’s authority includes the ability to assess financial penalties and fines and provide for restitution to consumers if it determines there have been violations of consumer financial protection laws. The CFPB also provides consumer financial education, tracks consumer complaints, requests data from industry participants, and promotes the availability of financial services to underserved consumers and communities. The CFPB has authority to prevent unfair, deceptive, or abusive acts or practices and to ensure that all consumers have access to fair, transparent, and competitive markets for consumer financial products and services. The CFPB’s scrutiny of financial services has impacted participants’ approach to their services, including how the Company interacts with consumers.
In addition, where a company has violated Title X of the Dodd-Frank Act or CFPB regulations implemented under Title X of the Dodd-Frank Act, the Dodd-Frank Act empowers state attorneys general and state regulators to bring civil actions to remedy violations of state law. Most states also have statutes that prohibit unfair and deceptive practices. To the extent states enact requirements that differ from federal standards or state officials and courts adopt interpretations of federal consumer laws that differ from those adopted by the CFPB under the Dodd-Frank Act, the Company's ability to offer the same products and services to consumers nationwide may be limited.
As a third-party service provider to financial institutions, the Company is subject to periodic examination by the Federal Financial Institutions Examination Council (“FFIEC”). FFIEC is a formal interagency body of the U.S. government empowered to prescribe uniform principles, standards, and report forms for the federal examination of financial institutions by the Federal Reserve Banks, the Federal Deposit Insurance Corporation, and the CFPB, and to make recommendations to promote uniformity in the supervision of financial institutions.
Tuition Payment Processing and Campus Commerce
The Tuition Payment Processing and Campus Commerce operating segment provides tuition management services and school information software for K-12 schools and tuition management services and campus commerce solutions for higher education institutions. As a service provider that takes payment instructions from institutions and their constituents and sends them to bank partners, the Company is directly or indirectly subject to a variety of federal and state laws and regulations. The Company's contracts with clients and bank partners require the Company to comply with these laws and regulations.
The Company's payment processing services are subject to the EFTA and Regulation E, which govern automatic deposits to and withdrawals from deposit accounts and customers’ rights and liabilities arising from the use of debit cards and certain other electronic banking services. The Company assists bank partners with fulfilling their compliance obligations pursuant to these requirements.
The Company's payment processing services are also subject to the National Automated Clearing House Association (“NACHA”) requirements, which include operating rules and sound risk management procedures to govern the use of the Automated Clearing House ("ACH") Network. These rules are used to ensure that the ACH Network is efficient, reliable, and secure for its members. Because the ACH Network uses a batch process, the importance of proper submissions by NACHA members is magnified.
The Company is also impacted by laws and regulations that affect the bankcard industry. The Company is registered with Visa, MasterCard, American Express, and the Discover Network as a service provider and is subject to their respective rules.
The Company's higher education institution clients are subject to the Family Educational Rights and Privacy Act (“FERPA”), which protects the privacy of student education records. The Company's higher education institution clients disclose certain non-directory information concerning their students to the Company, including contact information, student identification numbers, and the amount of students’ credit balances pursuant to one or more exceptions under FERPA. Additionally, as the Company is indirectly subject to FERPA, it may not permit the transfer of any personally identifiable information to another party other than in a manner in which an educational institution may properly disclose it. While the Company believes that it has adequate policies and procedures in place to safeguard the privacy of such information, a breach of this prohibition could result in a five-year suspension of the Company's access to the related client’s records. The Company may also be subject to similar state laws and regulations that restrict higher education institutions from disclosing certain personally identifiable student information.
Some of the Company's K-12 and higher education institution clients choose to charge convenience fees to students, parents, or other payers who make online payments using a credit or debit card. Laws and regulations related to such fees vary from state to
14
state and certain states have laws that to varying degrees prohibit the imposition of a surcharge on a cardholder who elects to use a credit or debit card in lieu of cash, check, or other means.
The CFPB has regulatory oversight authority over consumer credit services and the prepaid card industry. The CFPB has proposed regulations regarding the prepaid card industry, which, if adopted as proposed, could impose significant additional disclosure requirements, overdraft requirements, and other requirements on the prepaid card industry. Similarly, other future actions of the CFPB could require further regulatory disclosures and changes to payment card practices, fees, routing, and other matters with respect to credit, debit, and prepaid cards.
The Company's contracts with higher education institution clients also require us to comply with regulations promulgated by the Department regarding the handling of student financial aid funds received by institutions on behalf of their students under Title IV of the Higher Education Act. On October 30, 2015, the Department amended cash management and other regulations to ensure students have convenient access to their Title IV funds, do not incur unreasonable fees, and are not led to believe they must open a financial account to receive such funds.
Communications
The telecommunications business that the Company has entered through the acquisition of Allo on December 31, 2015 is subject to extensive federal, state, and local regulation. Under the Telecommunications Act of 1996 (“Telecommunications Act”), federal and state regulators share responsibility for implementing and enforcing statutes and regulations designed to encourage competition and to preserve and advance widely available, quality telephone service at affordable prices.
At the federal level, the Federal Communications Commission ("FCC") generally exercises jurisdiction over facilities and services of local exchange carriers to the extent they are used to provide, originate, or terminate interstate or international communications. The FCC has the authority to condition, modify, cancel, terminate, or revoke operating authority for failure to comply with applicable federal laws or FCC rules, regulations, and policies.
State regulatory commissions generally exercise jurisdiction over carriers’ facilities and services to the extent they are used to provide, originate, or terminate intrastate communications. In addition, municipalities and other local government agencies regulate the public rights-of-way necessary to install and operate networks.
The Communications Act of 1934 ("Communications Act") requires, among other things, that telecommunications carriers offer services at just and reasonable rates and on non-discriminatory terms and conditions. The 1996 amendments to the Communications Act, contained in the Telecommunications Act, dramatically changed, and likely will continue to change, the landscape of the telecommunications industry. The central aim of the Telecommunications Act is to open local telecommunications markets to competition while enhancing universal service. The Telecommunications Act imposes a number of interconnection and other requirements on all local communications providers. All telecommunications carriers have a duty to interconnect directly or indirectly with the facilities and equipment of other telecommunications carriers.
The State of Nebraska Public Services Commission dictates service requirements and fees which have required Allo to obtain franchises from each incorporated municipality in which Allo operates. Allo is also required to obtain permits for street opening and construction, or for operating franchises to install and expand fiber optic facilities. These permits or other licenses or agreements typically require the payment of fees.
Allo's aerial and underground construction operations are subject to extensive laws and regulations relating to the maintenance of safe conditions in the workplace. Allo could also be subject to potential liabilities in the event it causes a release of hazardous substances or other environmental damage resulting from underground objects Allo encounters.
Internet services
The provision of internet access services is not significantly regulated by either the FCC or the state commissions. However, the FCC has in recent years taken some steps toward the imposition of some controls on the provision of internet access, and has asserted that it has jurisdictional authority in some areas related to the promotion of an open internet. The extent of the FCC’s jurisdiction with respect to the internet has not been resolved, and the outcome could lead to increased costs for Allo in connection with its provision of internet services, and could affect Allo's ability to effectively compete.
As the internet has matured, it has become the subject of increasing regulatory interest. Congress and federal regulators have adopted a wide range of measures directly or potentially affecting internet use, including, for example, consumer privacy, copyright
15
protections, defamation liability, taxation, obscenity, and unsolicited commercial e-mail. Allo's internet services are subject to the Communications Assistance for Law Enforcement Act ("CALEA") requirements regarding law enforcement surveillance. Content owners are now seeking additional legal mechanisms to combat copyright infringement over the internet. Pending and future legislation in this area could adversely affect Allo's operations as an ISP and relationship with internet customers. Additionally, the FCC and Congress are considering subjecting internet access services to the Universal Service funding requirements. These funding requirements could impose significant new costs on Allo's high-speed internet service. Also, the FCC and some state regulatory commissions direct certain subsidies to telephone companies deploying broadband to areas deemed to be “unserved” or “underserved.” State and local governmental organizations have also adopted internet-related regulations. These various governmental jurisdictions are also considering additional regulations in these and other areas, such as privacy, pricing, service and product quality, and taxation. The adoption of new internet regulations or the adaptation of existing laws to the internet could adversely affect Allo's business.
On June 12, 2015, the FCC Net Neutrality Order became effective. The new rules prohibit ISPs from engaging in blocking, throttling, and paid prioritization, and transparency rules compelling the disclosure of network management policies were enhanced. The FCC would also have authority under the proposed rules to hear complaints and take enforcement action if it determines that the interconnection activities of ISPs are not just and reasonable, or if ISPs fail to meet general obligations not to harm consumers or what are referred to as edge providers. The rules could limit Allo’s ability to efficiently manage internet service and respond to operational and competitive challenges.
Television services
Federal regulations currently restrict the prices that cable systems charge for the minimum level of television programming service, referred to as “basic service,” and associated equipment. All other television service offerings are now universally exempt from rate regulation. Although basic service rate regulation operates pursuant to a federal formula, local governments, commonly referred to as local franchising authorities, are primarily responsible for administering this regulation. The majority of Allo's local franchising authorities have never been certified to regulate basic service cable rates (and order rate reductions and refunds), but they generally retain the right to do so (subject to potential regulatory limitations under state franchising laws), except in those specific communities facing “effective competition,” as defined under federal law. There have been frequent calls to impose expanded rate regulation on the cable industry. As a result of rapidly increasing cable programming costs, it is possible that Congress may adopt new constraints on the retail pricing or packaging of cable programming. Federal rate regulations currently include certain marketing restrictions that could affect Allo's pricing and packaging of service tiers and equipment. As Allo attempts to respond to a changing marketplace with competitive pricing practices, we may face regulations that impede our ability to compete.
IPTV operations require state or local franchise or other authorization in order to provide cable service to customers. Allo is subject to regulation under a Communications Act framework that addresses such issues as the use of local streets and rights of way; the carriage of public, educational, and governmental channels; the provision of channel space for leased commercial access; the amount and payment of franchise fees; consumer protection; and similar issues. In addition, federal laws and FCC regulations place limits on the common ownership of cable systems and competing multichannel television distribution systems, and on the common ownership of cable systems and local telephone systems in the same geographic area. The FCC has recently expanded its oversight and regulation of cable television-related matters. Federal law and regulations also affect numerous issues related to television programming and other content. Under federal law, certain local television broadcast stations (both commercial and non-commercial) can elect, every three years, to take advantage of rules that require a cable operator to distribute the station’s content to the cable system’s customers without charge, or to forego this “must-carry” obligation and to negotiate for carriage on an arm’s length contractual basis, which typically involves the payment of a fee by the cable operator, and sometimes involves other consideration as well. The current three year cycle began on January 1, 2015. Allo has successfully negotiated agreements with all of the local television broadcast stations that would have been eligible for “must carry” treatment in each of our current markets. The contractual relationships between cable operators and most providers of content who are not television broadcast stations generally are not subject to FCC oversight or other regulation.
The Communications Act requires most utilities owning utility poles to provide access to poles and conduits, and subjects the rates charged for this access to either federal or state regulation. In 2011, the FCC amended its existing pole attachment rules to promote broadband deployment. The 2011 order allows for new penalties in certain cases involving unauthorized attachments, but generally strengthens the ability to access investor-owned utility poles on reasonable rates, terms, and conditions.
Allo's IPTV systems are subject to a federal copyright compulsory license covering carriage of television and radio broadcast signals. The possible modification or elimination of this compulsory copyright license is the subject of continuing legislative proposals and administrative review and could adversely affect Allo's ability to obtain desired broadcast programming. Copyright clearances for non-broadcast programming services are arranged through private negotiations. IPTV operators also must obtain
16
music rights for locally originated programming and advertising from the major music performing rights organizations. These licensing fees have been the source of litigation in the past, and license fee disputes may arise in the future.
Telephone services
Allo offers voice communications services over a broadband network. The FCC has ruled that competitive telephone companies are entitled to interconnect with incumbent providers of traditional telecommunications services, which ensures that services can compete in the market. The FCC has also declared that certain services are not subject to traditional state public utility regulation. The full extent of the FCC preemption of state and local regulation of services is not yet clear. In November 2011, the FCC released an order significantly changing the rules governing intercarrier compensation payments for the origination and termination of telephone traffic between carriers. These rules have resulted and will continue to result in a substantial decrease in intercarrier compensation payments over a multi-year period.
Asset Generation and Management
The Dodd-Frank Act provides the Commodity Futures Trading Commission (the "CFTC") and the Securities and Exchange Commission (the "SEC") with substantial authority to regulate over-the-counter derivative transactions, and includes provisions that require derivative transactions to be executed through an exchange or central clearinghouse. On December 24, 2016, new risk retention rules went into effect that require issuers of asset-backed securities or persons who organize and initiate asset-backed securities transactions to retain a percentage of the underlying assets' credit risk. The higher retention requirements could decrease the leverage the Company obtains in a securitization and therefore potentially decrease the Company's return on equity from securitization transactions. These rules also expand disclosure and reporting requirements for each tranche of asset-backed securities, including new loan-level data requirements, and expand disclosure requirements relating to the representations, warranties, and enforcement mechanisms available to investors.
Corporate
Governmental bodies in the United States and abroad have adopted, or are considering the adoption of, laws and regulations restricting the transfer of, and safeguarding, non-public personal information. For example, in the United States, the Company and its financial institution clients are, respectively, subject to the Federal Trade Commission’s and the federal banking regulators’ privacy and information safeguarding requirements under the GLBA. The GLBA and Regulation P govern a financial institution’s treatment of nonpublic personal information about consumers and require that an institution, under certain circumstances, notify consumers about its privacy policies and practices. With certain exceptions, the GLBA prohibits a financial institution from disclosing a consumer’s nonpublic personal information to a nonaffiliated third-party unless the institution satisfies various notice requirements and the consumer does not elect to prevent, or “opt out of,” the disclosure. The GLBA also imposes specific requirements regarding the disclosure of customer account numbers and the reuse and redisclosure of information a financial institution provides to a third party. While the Company's operations are subject to certain provisions of these privacy laws, the Company has limited use of consumer information solely to providing services to other businesses and financial institutions. The Company limits sharing of non-public personal information to that necessary to complete transactions on behalf of the consumer and to that permitted by federal and state laws.
Intellectual Property
The Company owns numerous trademarks and service marks (“Marks”) to identify its various products and services. As of
December 31, 2016
, the Company had
56
registered Marks. The Company actively asserts its rights to these Marks when it believes infringement may exist. The Company believes its Marks have developed and continue to develop strong brand-name recognition in the industry and the consumer marketplace. Each of the Marks has, upon registration, an indefinite duration so long as the Company continues to use the Mark on or in connection with such goods or services as the Mark identifies. In order to protect the indefinite duration, the Company makes filings to continue registration of the Marks. The Company owns one patent application that has been published, but has not yet been issued, and has also actively asserted its rights thereunder in situations where the Company believes its claims may be infringed upon. The Company owns many copyright protected works, including its various computer system codes and displays, Web sites, books and other publications, and marketing materials. The Company also has trade secret rights to many of its processes and strategies and its software product designs. The Company's software products are protected by both registered and common law copyrights, as well as strict confidentiality and ownership provisions placed in license agreements, which restrict the ability to copy, distribute, or improperly disclose the software products. The Company also has adopted internal procedures designed to protect the Company's intellectual property.
17
The Company seeks federal and/or state protection of intellectual property when deemed appropriate, including patent, trademark/service mark, and copyright. The decision whether to seek such protection may depend on the perceived value of the intellectual property, the likelihood of securing protection, the cost of securing and maintaining that protection, and the potential for infringement. The Company's employees are trained in the fundamentals of intellectual property, intellectual property protection, and infringement issues. The Company's employees are also required to sign agreements requiring, among other things, confidentiality of trade secrets, assignment of inventions, and non-solicitation of other employees post-termination. Consultants, suppliers, and other business partners are also required to sign nondisclosure agreements to protect the Company's proprietary rights.
Employees
As of
December 31, 2016
, the Company had approximately
3,700
employees. None of the Company's employees are covered by collective bargaining agreements. The Company is not involved in any material disputes with any of its employees, and the Company believes that relations with its employees are good.
Available Information
Copies of the Company's annual reports on Form 10-K, quarterly reports on Form 10-Q, current reports on Form 8-K, and amendments to such reports are available on the Company's Web site free of charge as soon as reasonably practicable after such reports are filed with or furnished to the SEC. Investors and other interested parties can access these reports and the Company's proxy statements at
http://www.nelnetinvestors.com
. The Company routinely posts important information for investors on its Web site.
The Company has adopted a Code of Ethics and Conduct that applies to directors, officers, and employees, including the Company's principal executive officer and its principal financial and accounting officer, and has posted such Code of Ethics and Conduct on its Web site. Amendments to and waivers granted with respect to the Company's Code of Ethics and Conduct relating to its executive officers and directors which are required to be disclosed pursuant to applicable securities laws and stock exchange rules and regulations will also be posted on its Web site. The Company's Corporate Governance Guidelines, Audit Committee Charter, Compensation Committee Charter, Nominating and Corporate Governance Committee Charter, Risk and Finance Committee Charter, and Compliance Committee Charter are also posted on its Web site.
Information on the Company's Web site is not incorporated by reference into this report and should not be considered part of this report.
We operate our businesses in a highly competitive and regulated environment. We are subject to risks including, but not limited to, market, liquidity, credit, regulatory, technology, operational, security, and other business risks such as reputation damage related to negative publicity and dependencies on key personnel, customers, vendors, and systems. This section highlights specific risks that could affect us. Although this section attempts to highlight key risk factors, other risks may emerge at any time and we cannot predict all risks or estimate the extent to which they may affect our financial performance. These risk factors should be read in conjunction with the other information included in this report.
Student Loan Portfolio
Our student loan portfolio is subject to certain risks related to interest rates, our ability to manage the risks related to interest rates, prepayment, and credit risk, each of which could reduce the expected cash flows and earnings on our portfolio.
Interest rate risk - basis and repricing risk
We are exposed to interest rate risk in the form of basis risk and repricing risk because the interest rate characteristics of our student loan assets do not always match the interest rate characteristics of the funding for those assets.
We fund the majority of our FFELP student loan assets with one-month or three-month LIBOR indexed floating rate securities. In addition, the interest rates on some of our debt are set via a “dutch auction.” Meanwhile, the interest earned on our FFELP student loan assets is indexed to one-month LIBOR, three-month commercial paper, and Treasury bill rates. The different interest rate characteristics of our loan assets and our liabilities funding these assets result in basis risk. We also face repricing risk due to the timing of the interest rate resets on our liabilities, which may occur as infrequently as once a quarter, in contrast to the timing
18
of the interest rate resets on our assets, which generally occur daily. In a declining interest rate environment, this may cause our student loan spread to compress, while in a rising interest rate environment, it may cause the spread to increase.
As of
December 31, 2016
, we had
$22.8 billion
,
$1.3 billion
, and
$0.7 billion
of FFELP loans indexed to the one-month LIBOR, three-month commercial paper, and three-month Treasury bill rate, respectively, all of which reset daily, and
$13.7 billion
of debt indexed to three-month LIBOR, which resets quarterly, and
$9.1 billion
of debt indexed to one-month LIBOR, which resets monthly. While these indices are all short term in nature with rate movements that are highly correlated over a longer period of time, there have been points in recent history related to the U.S. and European debt crisis that have caused volatility to be high and correlation to be reduced. There can be no assurance that the indices' historically high level of correlation will not be disrupted in the future due to capital market dislocations or other factors not within our control. In such circumstances, our earnings could be adversely affected, possibly to a material extent.
We have entered into basis swaps to hedge our basis and repricing risk. For these derivatives, we receive three-month LIBOR set discretely in advance and pay one-month LIBOR plus or minus a spread as defined in the agreements (the "1:3 Basis Swaps").
Interest rate risk - loss of floor income
FFELP loans originated prior to April 1, 2006 generally earn interest at the higher of the borrower rate, which is fixed over a period of time, or a floating rate based on the Special Allowance Payments ("SAP") formula set by the Department. The SAP rate is based on an applicable index plus a fixed spread that depends on loan type, origination date, and repayment status. We generally finance our student loan portfolio with variable rate debt. In low and/or certain declining interest rate environments, when the fixed borrower rate is higher than the SAP rate, these student loans earn at a fixed rate while the interest on the variable rate debt typically continues to reflect the low and/or declining interest rates. In these interest rate environments, we may earn additional spread income that we refer to as floor income.
Depending on the type of loan and when it was originated, the borrower rate is either fixed to term or is reset to an annual rate each July 1. As a result, for loans where the borrower rate is fixed to term, we may earn floor income for an extended period of time, which we refer to as fixed rate floor income, and for those loans where the borrower rate is reset annually on July 1, we may earn floor income to the next reset date, which we refer to as variable rate floor income.
For the year ended
December 31, 2016
, we earned
$152.3 million
of fixed rate floor income, net of
$17.6 million
of settlements paid related to derivatives used to hedge loans earning fixed rate floor income. Absent the use of derivative instruments, a rise in interest rates will reduce the amount of floor income received and this will have an impact on earnings due to interest margin compression caused by increased financing costs, until such time as the federally insured loans earn interest at a variable rate in accordance with their SAP formulas. In higher interest rate environments, where the interest rate rises above the borrower rate and fixed rate loans effectively convert to variable rate loans, the impact of the rate fluctuations is reduced.
Interest rate risk - use of derivatives
We utilize derivative instruments to manage interest rate sensitivity. Our derivative instruments are intended as economic hedges but do not qualify for hedge accounting; consequently, the change in fair value, called the “mark-to-market,” of these derivative instruments is included in our operating results. Changes or shifts in the forward yield curve can and have significantly impacted the valuation of our derivatives. Accordingly, changes or shifts in the forward yield curve will impact our financial position and results of operations.
Although we believe our derivative instruments are highly effective, developing an effective strategy for dealing with movements in interest rates is complex, and no strategy can completely insulate us from risks associated with such fluctuations. Because many of our derivatives are not balance guaranteed to a particular pool of student loans and we may not elect to fully hedge our risk on a notional and/or duration basis, we are subject to the risk of being under or over hedged, which could result in material losses. In addition, our interest rate risk management activities could expose us to substantial mark-to-market losses if interest rates move in a materially different way than was expected based on the environment when the derivatives were entered into. As a result, we cannot offer any assurance that our economic hedging activities will effectively manage our interest rate sensitivity or have the desired beneficial impact on our results of operations or financial condition.
By using derivative instruments, we are exposed to credit and market risk. We attempt to manage credit and market risks associated with interest rates by establishing and monitoring limits as to the types and degree of risk that may be undertaken and by entering into transactions with high-quality counterparties that are reviewed periodically by our risk committee. As of
December 31, 2016
,
19
all of our derivative counterparties had investment grade credit ratings. We also have a policy of requiring that all derivative contracts be governed by an International Swaps and Derivatives Association, Inc. Master Agreement.
The Dodd-Frank Act provides the CFTC with substantial authority to regulate over-the-counter derivative transactions. The CFTC issued final regulations that require derivative transactions to be executed through an exchange or central clearinghouse. As such, effective June 10, 2013, all over-the-counter derivative contracts executed by us are cleared post-execution at a regulated clearinghouse. Clearing is a process by which a third-party, the clearinghouse, steps in between the original counterparties and guarantees the performance of both, by requiring that each post substantial amounts of liquid collateral on an initial and mark-to-market basis to cover the clearinghouse's potential future exposure in the event of default. The new clearing requirements did not alter or affect the terms and conditions of our derivative instruments executed prior to June 10, 2013. The new clearing requirements require us to post substantial amounts of liquid collateral when executing new derivative instruments, which could negatively impact our liquidity and capital resources and may prevent or limit us from utilizing derivative instruments to manage interest rate sensitivity and risks. However, the new clearing requirements reduce counterparty risk associated with derivatives executed by us after June 10, 2013.
When the fair value of a derivative contract is positive (an asset on our balance sheet), this generally indicates that the counterparty or clearinghouse owes us if the derivative was settled. If the counterparty or clearinghouse fails to perform, credit risk with such counterparty or clearinghouse is equal to the extent of the fair value gain in the derivative less any collateral held by us. If we were unable to collect from a counterparty or clearinghouse, we would have a loss equal to the amount the derivative is recorded on the consolidated balance sheet.
When the fair value of a derivative instrument is negative (a liability on our balance sheet), we would owe the counterparty if the derivative was settled and, therefore, have no immediate credit risk. If the negative fair value of derivatives with a counterparty exceeds a specified threshold, we may have to make a collateral deposit with the counterparty. The threshold at which we may be required to post collateral is dependent upon our unsecured credit rating. We believe any downgrades from our current unsecured credit ratings (Standard & Poor's: BBB- (stable outlook) and Moody's: Ba1 (stable outlook)), would not result in additional collateral requirements of a material nature. In addition, no counterparty has the right to terminate our contracts in the event of downgrades from the current ratings. However, some derivative contracts have mutual optional termination provisions that can be exercised during 2022. As of
December 31, 2016
, the fair value of derivatives with early termination provisions was a
negative
$2.7 million
(a
liability
on the Company's balance sheet).
Interest rate movements have an impact on the amount of collateral we are required to deposit with our derivative instrument counterparties or the clearinghouse. Based on the interest rate swaps outstanding as of
December 31, 2016
(for both the floor income and hybrid debt hedges), if the forward interest rate curve was one basis point lower for the remaining duration of these derivatives, we would have been required to post
$1.6 million
in additional collateral. In addition, if the forward basis curve between 1-month and 3-month LIBOR experienced a one basis point reduction in spread for the remaining duration of our 1:3 Basis Swaps (in which we pay 1-month LIBOR and receive 3-month LIBOR), we would have been required to post
$1.6 million
in additional collateral.
With our current derivative portfolio, we do not currently anticipate a near term movement in interest rates having a material impact on our liquidity or capital resources, nor expect future movements in interest rates to have a material impact on our ability to meet potential collateral deposit requirements with our counterparties or clearinghouse. Due to the existing low interest rate environment, our exposure to downward movements in interest rates on our interest rate swaps is limited. In addition, we believe the historical high correlation between 1-month and 3-month LIBOR limits our exposure to interest rate movements on the 1:3 Basis Swaps.
However, if interest rates move materially and negatively impact the fair value of our derivative portfolio or if we enter into additional derivatives in which the fair value of such derivatives becomes negative, we could be required to deposit a significant amount of collateral with our derivative instrument counterparties and/or the clearinghouse. The collateral deposits, if significant, could negatively impact our liquidity and capital resources.
Our outstanding cross-currency interest rate swap is a derivative entered into as a result of an asset-backed security financing. This derivative was entered into at the securitization trust level with the counterparty and does not contain credit contingent features related to our or the trust's credit ratings. As such, there are no collateral requirements and the impact of changes to foreign currency rates has no impact on the amount of collateral we would be required to deposit with the counterparty on this derivative.
20
Prepayment risk
Higher rates of prepayments of student loans, including consolidations by the Department through the Federal Direct Loan Program or private refinancing programs, would reduce our interest income.
Pursuant to the Higher Education Act, borrowers may prepay loans made under the FFEL Program at any time without penalty. Prepayments may result from consolidations of student loans by the Department through the Federal Direct Loan Program or by a lending institution through a private education loan, which historically tend to occur more frequently in low interest rate environments; from borrower defaults, which will result in the receipt of a guaranty payment; and from voluntary full or partial prepayments; among other things.
Legislative risk exists as Congress evaluates proposals to reauthorize the Higher Education Act. If the federal government and the Department initiate additional loan forgiveness, other repayment options or plans, or consolidation loan programs, such initiatives could further increase prepayments and reduce interest income, and could also reduce servicing fees.
The rate of prepayments of student loans may be influenced by a variety of economic, social, political, and other factors affecting borrowers, including interest rates, federal budgetary pressures, and the availability of alternative financing. Our profits could be adversely affected by higher prepayments, which reduce the balance of loans outstanding and, therefore, the amount of interest income we receive.
Credit risk
Future losses due to defaults on loans held by us present credit risk which could adversely affect our earnings.
The vast majority (
98.9 percent
) of our student loan portfolio is federally guaranteed. The allowance for loan losses from the federally insured loan portfolio is based on periodic evaluations of our loan portfolios, considering loans in repayment versus those in nonpaying status, delinquency status, trends in defaults in the portfolio based on Company and industry data, past experience, trends in student loan claims rejected for payment by guarantors, changes to federal student loan programs, current economic conditions, and other relevant factors. The federal government currently guarantees 97 percent of the principal and interest on federally insured student loans disbursed on and after July 1, 2006 (and 98 percent for those loans disbursed on and after October 1, 1993 and prior to July 1, 2006), which limits our loss exposure on the outstanding balance of our federally insured portfolio. Student loans disbursed prior to October 1, 1993 are fully insured for both principal and interest.
Our private education loans are unsecured, with neither a government nor a private insurance guarantee. Accordingly, we bear the full risk of loss on these loans if the borrower and co-borrower, if applicable, default. In determining the adequacy of the allowance for loan losses on the private education loans, we consider several factors, including: loans in repayment versus those in a nonpaying status, delinquency status, type of program, trends in defaults in the portfolio based on Company and industry data, past experience, current economic conditions, and other relevant factors. We place a private education loan on nonaccrual status when the collection of principal and interest is 90 days past due, and charge off the loan when the collection of principal and interest is 120 days past due.
The evaluation of the allowance for loan losses is inherently subjective, as it requires material estimates that may be subject to significant changes. As of
December 31, 2016
, our allowance for loan losses was
$51.8 million
. During the year ended
December 31, 2016
, we recognized a provision for loan losses of
$13.5 million
. The provision for loan losses reflects the activity for the applicable period and provides an allowance at a level that management believes is appropriate to cover probable losses inherent in the loan portfolio. However, future defaults can be higher than anticipated due to a variety of factors, such as downturns in the economy, regulatory or operational changes, and other unforeseen future trends. If actual performance is significantly worse than currently estimated, it would materially affect our estimate of the allowance for loan losses and the related provision for loan losses in our statements of income.
Liquidity and Funding
We fund student loans in warehouse facilities. The current maturities of these facilities do not match the maturity of the related funded assets. Therefore, we will need to modify and/or find alternative funding related to the student loan collateral in these facilities prior to their expiration. If we cannot find any funding alternatives, we would lose our collateral, including the student loan assets and cash advances, related to these facilities.
21
The majority of our portfolio of student loans is funded through asset-backed securitizations that are structured to substantially match the maturity of the funded assets, and there are minimal liquidity issues related to these facilities. We also have student loans funded in shorter term warehouse facilities. The current maturities of these facilities do not match the maturity of the related funded assets. Therefore, we will need to modify and/or find alternative funding related to the student loan collateral in these facilities prior to their expiration.
As of
December 31, 2016
, we maintained three FFELP warehouse facilities as described in note 4 of the notes to consolidated financial statements included in this report. The FFELP warehouse facilities have revolving financing structures supported by 364-day liquidity provisions, which expire in 2017 and 2018. In the event we are unable to renew the liquidity provisions for a facility, the facility would become a term facility at a stepped-up cost, with no additional student loans being eligible for financing, and we would be required to refinance the existing loans in the facility by the final maturity dates in 2018 and 2019. The FFELP warehouse facilities also contain financial covenants relating to levels of our consolidated net worth, ratio of adjusted EBITDA to corporate debt interest, and unencumbered cash. Any noncompliance with these covenants could result in a requirement for the immediate repayment of any outstanding borrowings under the facilities. As of
December 31, 2016
, $
1.7 billion
was outstanding under the FFELP warehouse facilities and $
83.8 million
was advanced as equity support.
If we are unable to obtain cost-effective funding alternatives for the loans in the warehouse facilities prior to the facilities' maturities, our cost of funds could increase, adversely affecting our results of operations. If we cannot find any funding alternatives, we would lose our collateral, including the student loan assets and cash advances, related to these facilities.
We are exposed to mark-to-formula collateral support risk on one of our FFELP warehouse facilities.
One of our FFELP warehouse facilities provides formula based advance rates based on market conditions, which requires equity support to be posted to the facility. As of December 31, 2016, $656.3 million was outstanding under this warehouse facility and
$20.3 million
was advanced as equity support. In the event that a significant change in the valuation of loans results in additional required equity funding support for this warehouse facility greater than what we can provide, the warehouse facility could be subject to an event of default resulting in termination of the facility and an acceleration of the repayment provisions. If we cannot find any funding alternatives, we would lose our collateral, including the student loan assets and cash advances, related to this facility. A default on the FFELP warehouse facility would result in an event of default on our $350.0 million unsecured line of credit that would result in the outstanding balance on the line of credit becoming immediately due and payable. The other two FFELP warehouse facilities have static advance rates that require initial equity for loan funding, but do not require increased equity based on market movements.
We are subject to economic and market fluctuations related to our investments.
We currently invest a substantial portion of our excess cash in student loan asset-backed securities and other investments that are subject to market fluctuations. The fair value of these investments was
$106.6 million
as of
December 31, 2016
, including
$103.8 million
in student loan asset-backed securities. The student loan asset-backed securities earn a floating interest rate and carry expected returns of approximately LIBOR + 200-400 basis points to maturity. While the vast majority of these securities are backed by FFELP government guaranteed student loan collateral, most are in subordinate tranches and have a greater risk of loss with respect to the applicable student loan collateral pool. While we expect these securities to have few credit issues if held to maturity, they do have limited liquidity, and we could incur a significant loss if the investments were sold prior to maturity at an amount less than the original purchase price.
Changes in ratings on asset-backed securitization transactions, including those we sponsor, can have a material adverse impact on our ability to access the asset-backed securities market.
After securitizations are initially issued, if their performance does not align with rating agencies' expectations at the time of issuance, or if the rating agencies modify their assumptions and methodologies used for rating student loan securitizations, it is possible that initial high quality ratings on our subsidiaries’ securitizations, or those of other asset-backed securities issuers, could be materially lowered. Such actions could adversely affect our ability to access the asset-backed securities market, or make new securitization transactions more expensive by requiring us to pay a higher spread over LIBOR when pricing new bonds.
Operations
Risks associated with our operations, as further discussed below, include those related to our information technology systems and potential security and privacy breaches, our ability to manage performance related to regulatory requirements, and the importance of maintaining scale by retaining existing customers and attracting new business opportunities.
22
Various events could disrupt our networks, information systems, or properties and could impair our operating activities and negatively impact our reputation.
As a loan servicer, software provider, payment provider, and telecommunications company for the federal government, financial institutions, education industry, and local communities that serve millions of customers through the internet and other distribution channels across the U.S., we depend on our ability to process, secure, record, and monitor a large number of customer transactions and confidential information on a continuous basis. Additionally, we depend on the efficient and uninterrupted operation of our computer network systems, software, datacenter, and telecommunications systems, as well as the systems of third parties.
Information security risks have significantly increased in recent years in part because of the proliferation of new technologies, the use of the internet and telecommunications technologies to support and process customer transactions, and the increased sophistication and activities of organized crime, hackers, terrorists, activists, and other external parties. Our business segments rely on our digital technologies, computer and email systems, software, and networks to conduct their operations. In addition, to access our products and services, our customers may use personal smartphones, tablet PCs, and other mobile devices that are beyond our control systems.
Although we believe we have robust information security procedures, controls, and business continuity plans, we may be subject to information technology system failures and network disruptions. Malicious and abusive activities, such as the dissemination of computer viruses, worms, and other destructive or disruptive software, computer hackings, social engineering, process breakdowns, denial of service attacks, and other malicious activities have become more common. If directed at us or technologies upon which we depend, these activities could have adverse consequences on our network and our customers, including degradation of service, excessive call volume to call centers, and damage to our or our customers' equipment and data. Further, these activities could result in security breaches, such as misappropriation, misuse, leakage, falsification or accidental release or loss of information maintained in our information technology systems and networks, and in our vendors’ systems and networks, including customer, personnel, and vendor data. System failures and network disruptions may also be caused by natural disasters, accidents, power disruptions, or telecommunications failures. If a significant incident were to occur, it could damage our reputation and credibility, lead to customer dissatisfaction and, ultimately, loss of customers or revenue, in addition to increased costs to service our customers and protect our network. These events also could result in large expenditures to repair or replace the damaged properties, networks, or information systems or to protect them from similar events in the future. System redundancy may be ineffective or inadequate, and our business continuity plans may not be sufficient for all eventualities. Any significant loss of customers or revenue, or significant increase in costs of serving those customers, could adversely affect our growth, financial condition, and results of operations.
Although to date we have not experienced a material loss relating to cyber attacks, information security breaches, or system outage, there can be no assurance that we will not suffer such losses in the future or that there is not a current threat that remains undetected at this time. Our risk and exposure to these matters remains heightened because of, among other things, the evolving nature of these threats, and the size and scale of our services.
In addition, the personal consumer data that we receive and maintain in our operations is subject to privacy laws and regulations, and we expect regulatory oversight will continue to increase and consumer privacy protection regulations, standards, supervision, examinations, and enforcement practices will continue to evolve in both detail and scope. This evolution may significantly add to our privacy compliance and operating costs.
As a result of these matters, the continued development and enhancement of our training, controls, processes, and practices designed to protect, monitor, and restore our systems, computers, software, data, and networks from attack, damage, or unauthorized access remain a priority for the Company and each of our business segments. Even though we maintain technology and telecommunication, professional services, media, network security, privacy, injury, and liability insurance coverage to offset costs that may be incurred as a result of a cyber attack, information security breach, or extended system outage, this insurance coverage may not cover all costs of such incidents.
We outsource critical operations, which exposes us to risks related to our third-party vendors.
We have entered into contracts with third-party service providers that provide critical services, technology, and software to our business segments. Some of our third-party vendors are primary service providers for which there are few substitutes. If any of these vendors should experience financial difficulties, system interruptions, regulatory violations, security threats, or they cannot otherwise meet our specifications, our ability to provide some services may be materially adversely affected, in which case our business, results of operations, and financial condition may be adversely affected.
23
We must satisfy certain requirements necessary to maintain the federal guarantees of our federally insured loans and the federally insured loans that we service for third parties, and we may incur penalties or lose our guarantees if we fail to meet these requirements.
As of
December 31, 2016
, we serviced $24.4 billion of FFELP loans that maintained a federal guarantee, of which $17.0 billion and $7.4 billion were owned by the Company and third-party entities, respectively.
We must meet various requirements in order to maintain the federal guarantee on federally insured loans. The federal guarantee on federally insured loans is conditional based on compliance with origination, servicing, and collection policies set by the Department and guaranty agencies. If the Company misinterprets Department guidance, or incorrectly applies the Higher Education Act, the Department could determine that the Company is not in compliance. Federally insured loans that are not originated, disbursed, or serviced in accordance with the Department's and guaranty agency regulations may risk partial or complete loss of the guarantee. If we experience a high rate of servicing deficiencies (including any deficiencies resulting from the conversion of loans from one servicing platform to another, errors in the loan origination process, establishment of the borrower's repayment status, and due diligence or claim filing processes), it could result in the loan guarantee being revoked or denied. In most cases we have the opportunity to cure these deficiencies by following a prescribed cure process which usually involves obtaining the borrower's reaffirmation of the debt. However, not all deficiencies can be cured.
We are allowed three years from the date of the loan rejection to cure most loan rejections. If a cure cannot be achieved during this three year period, insurance is permanently revoked, although we maintain our right to collect the loan proceeds from the borrower. In cases where we purchase loans that were previously serviced by another servicing institution and we identify a serving deficiency by the prior servicer, we may, based on the terms of the purchase agreement, have the ability to require the previous lender to repurchase the rejected loans.
A guaranty agency may also assess an interest penalty upon claim payment if the deficiency does not result in a loan rejection. These interest penalties are not subject to cure provisions and are typically related to isolated instances of due diligence deficiencies. Additionally, we may become ineligible for special allowance payment benefits from the time of the first deficiency leading to the loan rejection through the date that the loan is cured.
Failure to comply with federal and guarantor regulations may result in fines, penalties, the loss of the insurance and related federal guarantees on affected FFELP loans, the loss of special allowance payment benefits, expenses required to cure servicing deficiencies, suspension or termination of the right to participate as a FFELP servicer, negative publicity, and potential legal claims, including potential claims by our servicing customers if they lose the federal guarantee on loans that we service for them. If the Company is subjected to significant fines, or loss of insurance or guarantees on a material number of FFELP loans, or if the Company loses its ability to service FFELP loans, it could have a material, negative impact on the Company's business, financial condition, or results of operations.
Our largest fee-based customer, the Department of Education, represented approximately 20 percent of our revenue in 2016. Failure to extend the Department contract or obtain a new Department contract, unfavorable contract modifications or interpretations, or our inability to consistently surpass competitor performance metrics, could significantly lower loan servicing revenue and hinder future servicing opportunities.
We are one of four TIVAS awarded a student loan servicing contract by the Department to provide additional servicing capacity for loans owned by the Department, with new loan volume historically allocated among the four TIVAS based on certain performance metrics established by the Department and compared among that group. As of December 31, 2016, we were servicing
$162.5 billion
of student loans for
6.0 million
borrowers under this contract. For the year ended December 31, 2016, we recognized
$151.7 million
in revenue from the Department, which represented approximately 20 percent of our revenue.
The Department also has contracts with 31 NFP entities to service student loans, although currently five NFP servicers service the volume allocated to these 31 entities. On March 2, 2016, the Department announced that new student loans will be allocated for servicing among the TIVAS and NFP servicers on the basis of performance metrics as compared among all loan servicers in that group. This change resulted in a decrease in our and the other TIVAS overall government allocation of new student loans for servicing. The amount of future allocations of new loan volume could be negatively impacted if we are unable to consistently surpass comparable competitor performance metrics. In addition, in the event the existing Department servicing contract becomes subject to unfavorable modifications or interpretations by the Department, loan servicing revenue could decrease significantly.
24
Our contract with the Department expires on June 16, 2019. In April 2016, the Department's Office of Federal Student Aid released information regarding a new contract procurement process for the Department to acquire a single servicing platform with multiple customer service providers to manage all student loans owned by the Department. The contract solicitation process is divided into two phases.
On May 5, 2016, we entered into an operating agreement with Great Lakes, also one of the four TIVAS, to form the joint venture GreatNet. The joint venture will operate as a separate legal entity and was created to deliver the single federal aid servicing solution to the Department. We and Great Lakes each own 50 percent of the ownership interest of GreatNet.
On June 30, 2016, the Department announced which entities were selected to respond to Phase II of the procurement selection process. GreatNet was one of three entities selected, and PHEAA and Navient, the other two TIVAS, were also selected to respond to Phase II. On January 6, 2017, GreatNet submitted its Phase II response to the Department and is currently awaiting announcement from the new administration on the next steps in the procurement process. We have been informed that one of the two other bidders filed a bid protest in relation to this contract solicitation process on January 5, 2017.
In the event the Department servicing contract is not extended beyond the current expiration date or GreatNet is not chosen as the subsequent servicer, loan servicing revenue would decrease significantly. During a year of new political administration transitions, there are significant risks and uncertainties regarding the current Department contract and potential future Department contract, including potential delays, cancellation, or material changes to the structure of the contract procurement process.
Additionally, we are partially dependent on the existing Department contract to broaden servicing operations with the Department, other federal and state agencies, and commercial clients. The size and importance of this contract provides us the scale and infrastructure needed to profitably expand into new business opportunities. Failure to extend the Department contract beyond the current expiration date, or obtain a new Department contract, could significantly hinder future opportunities.
Our ability to continue to grow and maintain our contracts with commercial businesses and government agencies is partly dependent on our ability to maintain compliance with various laws, regulations, and industry standards applicable to those contracts.
We are subject to various laws, regulations, and industry standards related to our commercial and government contracts. In most cases, these contracts are subject to termination rights, audits, and investigations. The laws and regulations that impact our operating segments are outlined in Part I, Item 1, "Regulation and Supervision." Additionally, our contracts with the federal government require that we maintain internal controls in accordance with the National Institute of Standards and Technologies (“NIST”) and our operating segments that utilize payment cards are subject to the Payment Card Industry Data Security Standards (“PCI-DSS”). If we are found to be in noncompliance with the contract provisions or applicable laws, regulations, or standards, or the contracted party exercises its termination or other rights for that or other reasons, our reputation could be negatively affected, and our ability to compete for new contracts or maintain existing contracts could diminish. If this were to occur, our results of operations from existing contracts and future opportunities for new contracts could be negatively affected.
Although we expect that our acquisition of Allo and resulting entry into the communications business will result in benefits to us, we may not be able to realize those benefits.
The success of our acquisition of Allo and resulting entry by us into the communications business depends in large part on the ability of Allo to successfully develop and expand fiber networks in existing service areas and additional communities within acceptable cost parameters, gain market share in communities in existing service areas, and obtain acceptable market share levels in additional communities that we do not yet serve. Allo may not be able to achieve those objectives and we may not realize the expected benefits from the acquisition of Allo. In addition, the expected benefits are subject to risks related to the uncertain nature of our ability to successfully integrate operations; the ability to successfully maintain technological competitive advantages with respect to the offered telecommunications, internet, television, telephone, and other related services and minimize potential system disruptions to the availability, speed, and quality of such services; potential changes in the marketplace, including potential decreases in market pricing for telecommunications and related services; potential changes in the demand for fiber optic internet, television, and telephone services; and increases in transport and content costs as discussed below.
25
Transport and content costs related to Allo’s video products and services are substantial and continue to increase.
The cost of video transport and content costs is expected to continue to be one of Allo’s largest operating costs associated with providing television service. Television programming content includes cable-oriented programming, as well as the programming of local over-the-air television stations that Allo retransmits. In addition, on-demand programming is being made available in response to customer demand. In recent years, the cable industry has experienced rapid increases in the cost of programming, especially the costs for sports programming and for local broadcast station retransmission consent. Programming costs are generally assessed on a per-subscriber basis, and therefore are related directly to the number of subscribers to which the programming is provided. Allo’s relatively small base of subscribers limits our ability to negotiate lower per-subscriber programming costs, whereas larger providers can often obtain discounts based on the number of their subscribers. This cost difference can cause Allo to experience reduced operating margins relative to our competitors with a larger subscriber base. In addition, escalators in existing content agreements cause cost increases that are out of line with general inflation. While Allo expects these increases to continue, it may not be able to pass programming cost increases on to customers, particularly as an increasing amount of programming content becomes available via the internet at little or no cost. Also, some competitors (or their affiliates) own programming in their own right and Allo may be unable to secure license rights to that programming. As Allo’s programming contracts with content providers expire, there can be no assurance that they will be renewed on acceptable terms or that they will be renewed at all, in which case Allo may be unable to provide such television programming causing business results to be adversely affected.
If Allo cannot obtain and maintain necessary rights-of-way for its communications network, Allo's operations may be interrupted and it would likely face increased costs.
Allo is dependent on easements, franchises, and licenses from various private parties such as established telephone companies and other utilities, railroads, long-distance companies and from state highway authorities, local governments and transit authorities for access to aerial pole space, underground conduits, and other rights-of-way in order to construct and operate its networks. Some agreements relating to rights-of-way may be short-term or revocable at will, and Allo cannot be certain that it will continue to have access to existing rights-of-way after the governing agreements are terminated or expire. If any of Allo's right-of-way agreements were terminated or could not be renewed, it may be forced to remove network facilities from the affected areas, relocate, or abandon networks, which would interrupt operations and force Allo to find alternative rights-of-way, and make unexpected capital expenditures.
If Allo cannot successfully manage construction risks and uncertainties, the expansion of its communications networks may not be achieved within acceptable cost parameters or result in desired levels of market share.
The success of our acquisition of Allo depends on the ability of Allo to successfully execute its current efforts and plans to construct expanded fiber communications networks to make its services available to additional homes and businesses. The construction of communications networks is subject to various risks and uncertainties, including risks and uncertainties related to the determination of the precise locations of easements and other rights-of-way necessary to construct and operate the networks, and the management of such construction in a manner that reasonably minimizes the disruption to other private property owners, including minimizing any unintended damage to property or equipment owned or utilized by private parties. If Allo is not successful in managing these and similar construction risks, it could experience higher than expected costs and reputational damage that adversely impacts market share and future revenues, and the currently expected benefits from its expansion efforts and plans may not be realized.
Allo may incur liabilities or suffer negative financial impact relating to occupational, health, and safety matters or failure to comply with safety or environmental laws.
Aerial and underground construction of new networks and service requires employees and contractors to work in the proximity of gas, electric, water, sewer, and other competitors’ utility services, and Allo's operations are subject to extensive laws and regulations relating to the maintenance of safe conditions in the workplace. While Allo has invested, and will continue to invest, substantial resources in its robust occupational, health, and safety programs, Allo's business involves a high degree of operational risk, and there can be no assurance that it will avoid significant exposure. These hazards can cause personal injury and loss of life, severe damage to or destruction of property and equipment, and other consequential damages and could lead to suspension of operations, large damage claims and, in extreme cases, criminal liability. Allo could also be subject to potential liabilities in the event it causes a release of hazardous substances or other environmental damage resulting from underground objects they encounter. Environmental laws and regulations can impose significant fines and criminal sanctions for violations. Costs associated with the discharge of hazardous substances may include clean-up costs and related damages or liabilities. These costs could be significant and could adversely affect Allo's results of operations and cash flows.
26
Industry changes and competitive pressures may harm revenues and profit margins, including future revenues and profit margins of our new communications business through Allo.
We face aggressive price competition for our products and services and, as a result, we may have to lower our product and service prices to stay competitive, while at the same time, expand market share and maintain profit margins. Even if we are able to maintain or increase market share for a product or service, revenue or profit margins could decline because the product or service is in a maturing market or market conditions have changed due to economic, political, or regulatory pressures.
The internet, television, and telecommunications businesses are highly competitive. For a discussion of the competitive factors faced by Allo, see Part I, Item I, "Communications - Competition." Allo may not be able to successfully anticipate and respond to many of these various competitive factors affecting the industry, including regulatory changes that may affect competitors and Allo differently, new technologies, services and applications that may be introduced, and changes in consumer preferences, demographic trends, and discount or bundled pricing strategies by competitors which are larger and have more resources than Allo. If Allo does not compete effectively, it could lose customers, revenue, and market share; customers may reduce their usage of Allo's services or switch to a less profitable service; and Allo may need to lower prices or increase marketing efforts to remain competitive.
Our failure to successfully manage other business and certain asset acquisitions and other investments could have a material adverse effect on our business, financial condition, and/or results of operations.
We may acquire other new businesses, products, and services, or enhance existing businesses, products, and services, or make other investments to further diversify our businesses both within and outside of our historical education-related businesses, through acquisitions of other companies, product lines, technologies, and personnel, or through investments in real estate or other companies. Any acquisition or investment is subject to a number of risks. Such risks may include diversion of management time and resources, disruption of our ongoing businesses, difficulties in integrating acquisitions, extensive regulatory requirements, dilution to existing shareholders if our common stock is issued in consideration for an acquisition or investment, incurring or assuming indebtedness or other liabilities in connection with an acquisition, unexpected declines in real estate values or the failure to realize expected benefits from real estate development projects, lack of familiarity with new markets, and difficulties in supporting new product lines. Our failure to successfully manage acquisitions or investments, or successfully integrate acquisitions, could have a material adverse effect on our business, financial condition, and/or results of operations. Correspondingly, our expectations as to the accretive nature of the acquisitions or investments could be inaccurate.
We must adapt to rapid technological change. If we are unable to take advantage of technological developments, or if we adopt and implement them more slowly than our competitors, we may experience a decline in the demand for our products and services.
Our long-term operating results depend substantially upon our ability to continually enhance, develop, introduce, and market new products and services. We must continually and cost-effectively maintain and improve our information technology systems and infrastructure in order to successfully deliver competitive products and services to our customers. The widespread adoption of new technologies and market demands could require substantial expenditures to enhance system infrastructure and existing products and services. If we fail to enhance and scale our systems and operational infrastructure or products and services, our operating segments may lose their competitive advantage and this could adversely affect financial and operating results.
27
Regulatory and Legal
Federal and state laws and regulations can restrict our business and result in increased compliance expenses, and noncompliance with these laws and regulations could result in penalties, litigation, reputation damage, and a loss of customers.
Our operating segments and customers are heavily regulated by federal and state government regulatory agencies. See Part I, Item 1, "Regulation and Supervision." The laws and regulations enforced by these agencies are proposed or enacted to protect consumers and the financial industry as a whole, not necessarily the Company, our operating segments, or our shareholders. We have procedures and controls in place to monitor compliance with numerous federal and state laws and regulations. However, because these laws and regulations are complex, differ between jurisdictions, and are often subject to interpretation, or as a result of unintended errors, we may, from time to time, inadvertently violate these laws and regulations. Compliance with these laws and regulations is expensive and requires the time and attention of management. These costs divert capital and focus away from efforts intended to grow our business. If we do not successfully comply with laws, regulations, or policies, we could incur fines or penalties, lose existing or new customer contracts or other business, and suffer damage to our reputation. Changes in these laws and regulations can significantly alter our business environment, limit business operations, and increase costs of doing business, and we cannot predict the impact such changes would have on our profitability.
The CFPB has the authority to supervise and examine large nonbank student loan servicers, including us. If in the course of such an examination the CFPB were to determine that we were not in compliance with applicable laws, regulations, and CFPB positions, it is possible that this could result in material adverse consequences, including, without limitation, settlements, fines, penalties, adverse regulatory actions, changes in our business practices, or other actions. In 2015, the CFPB conducted a public inquiry into student loan servicing practices and issued a report recommending the creation of consistent, industry-wide standards for the entire servicing market. In July 2016, the Department expanded on this by outlining enhanced customer service standards and protections that will be incorporated into federal servicing contracts and guidelines. The CFPB has also announced that it may issue student loan servicing rules in the future. This area is expected to be a continuing focus of the CFPB.
There is significant uncertainty regarding how the CFPB's recommendations, strategies, and priorities will impact our businesses and our results of operations going forward. Actions by the CFPB could result in requirements to alter our services, causing them to be less attractive or effective and impair our ability to offer them profitably. In the event that the CFPB changes regulations adopted in the past by other regulators, or modifies past regulatory guidance, our compliance costs and litigation exposure could increase. Our litigation exposure could also increase if the CFPB exercises its authority to limit or ban pre-dispute arbitration clauses or class action waiver clauses in contracts for consumer financial services.
As a result of the Reconciliation Act of 2010, interest income on our existing FFELP loan portfolio, as well as revenue from third-party FFELP servicing and FFELP loan servicing software licensing and consulting fees, will decline over time as our and our third-party lender clients' FFELP loan portfolios are paid down and FFELP clients exit the market.
The Reconciliation Act of 2010 prohibits new loan originations under the FFEL Program and requires that all new federal loan originations be made through the Federal Direct Loan Program. The law did not alter or affect the terms and conditions of existing FFELP loans.
During the years ended
December 31, 2016
,
2015
, and
2014
, we recognized approximately
$360 million
,
$425 million
, and
$430 million
, respectively, of net interest income on our FFELP loan portfolio, approximately
$26 million
,
$71 million
, and
$80 million
, respectively, in guaranty and third-party FFELP servicing revenue, and approximately
$6 million
,
$5 million
, and
$5 million
, respectively, in FFELP loan servicing software licensing and consulting fees related to the FFEL Program. These amounts will decline over time as our and our third-party lender clients' FFELP loan portfolios are paid down.
The Company's FFELP guaranty servicing revenue was earned from two guaranty clients. A contract with one client expired on October 31, 2015 and was not renewed. The remaining guaranty client exited the FFELP guaranty business at the end of their contract term on June 30, 2016. FFELP guaranty servicing revenue recognized by us from these two clients during the years ended December 31, 2016, 2015, and 2014 was $9.6 million, $56.9 million, and $66.7 million, respectively. After June 30, 2016, we have no remaining guaranty revenue.
If we are unable to grow or develop new revenue streams, our consolidated revenue and operating margin will decrease as a result of the decline in FFELP loan volume outstanding.
28
Exposure related to certain tax issues could decrease our net income.
Federal and state income tax laws and regulations are often complex and require interpretation. The nexus standards and the sourcing of receipts from intangible personal property and services have been the subject of state audits and litigation with state taxing authorities and tax policy debates by various state legislatures. As the U.S. Congress and U.S. Supreme Court have not provided clear guidance in this regard, conflicting state laws and court decisions create significant uncertainty and expense for taxpayers conducting interstate commerce. Changes in income tax regulations could negatively impact our results of operations. If states enact legislation, alter apportionment methodologies, or aggressively apply the income tax nexus standards, we may become subject to additional state taxes.
From time to time, we engage in transactions in which the tax consequences may be subject to uncertainty. Examples of such transactions include asset and business acquisitions and dispositions, financing transactions, apportionment, nexus standards, and income recognition. Significant judgment is required in assessing and estimating the tax consequences of these transactions. We prepare and file tax returns based on the interpretation of tax laws and regulations. In the normal course of business, our tax returns are subject to examination by various taxing authorities. Such examinations may result in future tax and interest assessments by these taxing authorities. In accordance with authoritative accounting guidance, we establish reserves for tax contingencies related to deductions and credits that we may be unable to sustain. Differences between the reserves for tax contingencies and the amounts ultimately owed are recorded in the period they become known. Adjustments to our reserves could have a material effect on our financial statements.
In addition to corporate tax matters, as both a lender and servicer of student loans, we are required to report student loan interest received and cancellation of indebtedness to individuals and the Internal Revenue Service on an annual basis. These informational forms assist individuals in complying with their federal and state income tax obligations. The statutory and regulatory guidance regarding the calculations, recipients, and timing are complex and we know that interpretations of these rules vary across the industry. The complexity and volume associated with these informational forms creates a risk of error which could result in penalties or damage to our reputation.
Principal Shareholder and Related Party Transactions
Our Executive Chairman beneficially owns
77.6 percent
of the voting rights of our shareholders and effectively has control over all matters at our Company.
Michael S. Dunlap, our Executive Chairman and a principal shareholder, beneficially owns
77.6 percent
of the voting rights of our shareholders. Accordingly, each member of the Board of Directors and each member of management has been elected or effectively appointed by Mr. Dunlap and can be removed by Mr. Dunlap. As a result, Mr. Dunlap, as Executive Chairman and controlling shareholder, has control over all matters at our Company and has the ability to take actions that benefit him, but may not benefit other minority shareholders, and may otherwise exercise his control in a manner with which other minority shareholders may not agree or which they may not consider to be in their best interests.
Our contractual arrangements and transactions with Union Bank, which is under common control with us, present conflicts of interest and pose risks to our shareholders that the terms may not be as favorable to us as we could receive from unrelated third parties.
Union Bank is controlled by Farmers & Merchants Investment Inc. ("F&M"), which owns
81.4 percent
of Union Bank's common stock and
15.4 percent
of Union Bank's non-voting non-convertible preferred stock. Mr. Dunlap, a significant shareholder, as well as Executive Chairman, and a member of our Board of Directors, along with his spouse and children, owns or controls a total of
33.0
percent of the stock of F&M, including a total of 48.6 percent of the outstanding voting common stock of F&M, and Mr. Dunlap's sister, Angela L. Muhleisen, along with her spouse and children, owns or controls a total of
31.7 percent
of F&M stock, including a total of 47.5 percent of the outstanding voting common stock of F&M. Mr. Dunlap serves as a Director and Chairman of F&M. Ms. Muhleisen serves as a Director and Chief Executive Officer of F&M and as a Director, Chairperson, President, and Chief Executive Officer of Union Bank. Union Bank is deemed to have beneficial ownership of a significant number of shares of Nelnet because it serves in a capacity of trustee or account manager for various trusts and accounts holding shares of Nelnet, and may share voting and/or investment power with respect to such shares. As of
December 31, 2016
, Union Bank was deemed to beneficially own
11.4 percent
of the voting rights of our common stock. As of
December 31, 2016
, Mr. Dunlap and Ms. Muhleisen beneficially owned
77.6 percent
and
12.5 percent
, respectively, of the voting rights of our outstanding common stock.
We have entered into certain contractual arrangements with Union Bank, including loan purchases and sales, loan servicing, loan participations, banking services, 529 Plan administration services, lease arrangements, and various other investment and advisory
29
services. The net aggregate impact on our consolidated statements of income for the years ended
December 31, 2016
,
2015
, and
2014
related to the transactions with Union Bank was income (before income taxes) of
$7.0 million
,
$6.6 million
, and
$17.1 million
, respectively. See note 19 of the notes to consolidated financial statements included in this report for additional information related to the transactions between us and Union Bank.
Transactions between Union Bank and us are generally based on available market information for comparable assets, products, and services and are extensively negotiated. In addition, all related party transactions between Union Bank and us are approved by both the Union Bank Board of Directors and our Board of Directors. Furthermore, Union Bank is subject to regulatory oversight and review by the FDIC, the Federal Reserve, and the State of Nebraska Department of Banking and Finance. The FDIC and the State of Nebraska Department of Banking and Finance regularly review Union Bank's transactions with affiliates. The regulatory standard applied to the bank falls under Regulation W, which places restrictions on certain “covered” transactions with affiliates.
We intend to maintain our relationship with Union Bank, which our management believes provides certain benefits to us. Those benefits include Union Bank's knowledge of and experience in the FFELP industry, its willingness to provide services, and at times liquidity and capital resources, on an expedient basis, and the proximity of Union Bank to our corporate headquarters located in Lincoln, Nebraska.
The majority of the transactions and arrangements with Union Bank are not offered to unrelated third parties or subject to competitive bids. Accordingly, these transactions and arrangements not only present conflicts of interest, but also pose the risk to our shareholders that the terms of such transactions and arrangements may not be as favorable to us as we could receive from unrelated third parties. Moreover, we may have and/or may enter into contracts and business transactions with related parties that benefit Mr. Dunlap and his sister, as well as other related parties, that may not benefit us and/or our minority shareholders.
The Company has no unresolved comments from the staff of the Securities and Exchange Commission regarding its periodic or current reports under the Securities Exchange Act of 1934.
The following table lists the principal facilities for office space owned or leased by the Company as of
December 31, 2016
. The Company owns the building in Lincoln, Nebraska where its principal office is located.
|
Location
|
Primary function or segment
|
Approximate square feet
|
Lease expiration date
|
|||||
|
Lincoln, NE
|
Corporate Headquarters, Loan Systems and Servicing, Tuition Payment Processing and Campus Commerce
|
187,000
|
|
(a)
|
—
|
|||
|
Highlands Ranch, CO
|
Loan Systems and Servicing
|
67,000
|
|
October 2020
|
||||
|
Omaha, NE
|
Loan Systems and Servicing, Tuition Payment Processing and Campus Commerce
|
56,000
|
|
December 2017, December 2020, and December 2025
|
||||
|
Lincoln, NE
|
Loan Systems and Servicing, Asset Generation and Management
|
51,000
|
|
November 2023 and March 2024
|
||||
|
Aurora, CO
|
Loan Systems and Servicing
|
37,000
|
|
September 2019
|
||||
|
Lincoln, NE
|
Communications
|
29,000
|
|
—
|
||||
|
Lincoln, NE
|
Loan Systems and Servicing, Asset Generation and Management, Tuition Payment Processing and Campus Commerce
|
22,000
|
|
(b)
|
Month-to-month, February 2017, and October 2017 (b)
|
|||
|
Burleson, TX
|
Tuition Payment Processing and Campus Commerce
|
17,000
|
|
October 2021
|
||||
|
Imperial, NE
|
Communications
|
6,000
|
|
—
|
||||
|
(a)
|
Excludes a total of approximately 27,000 square feet of owned office space that the Company leases to third parties.
|
30
|
(b)
|
Includes a total of approximately 16,000 square feet that became subject to month-to-month lease terms upon the expiration of the original lease in December 2016. Also includes approximately 4,200 square feet under a lease that expired in February 2017, at which time the Company vacated the property.
|
Allo's physical assets consist of network plant and fiber, including signal receiving, encoding and decoding devices, headend reception facilities, distribution systems, and customer-located property. The network plant and fiber assets are generally attached to utility poles under pole rental agreements with local public utilities and telephone companies, or are buried in underground ducts or trenches, generally in utility easements. Allo owns or leases real property for signal reception sites, and owns its own vehicles. Allo's headend reception facilities and most offices are located on leased property.
The Company leases other office facilities located throughout the United States. These properties are leased on terms and for durations that are reflective of commercial standards in the communities where these properties are located. The Company believes that its respective properties are generally adequate to meet its long term business goals. The Company's principal office is located at 121 South 13
th
Street, Suite 100, Lincoln, Nebraska 68508.
The Company is subject to various claims, lawsuits, and proceedings that arise in the normal course of business. These matters frequently involve claims by student loan borrowers disputing the manner in which their student loans have been serviced or the accuracy of reports to credit bureaus, claims by student loan borrowers or other consumers alleging that state or Federal consumer protection laws have been violated in the process of collecting loans or conducting other business activities, and disputes with other business entities. In addition, from time to time the Company receives information and document requests from state or federal regulators concerning its business practices. The Company cooperates with these inquiries and responds to the requests. While the Company cannot predict the ultimate outcome of any regulatory examination, inquiry, or investigation, the Company believes its activities have materially complied with applicable law, including the Higher Education Act, the rules and regulations adopted by the Department thereunder, and the Department's guidance regarding those rules and regulations. On the basis of present information, anticipated insurance coverage, and advice received from counsel, it is the opinion of the Company's management that the disposition or ultimate determination of these claims, lawsuits, and proceedings will not have a material adverse effect on the Company's business, financial position, or results of operations.
Not applicable.
The Company's Class A common stock is listed and traded on the New York Stock Exchange under the symbol “NNI,” while its Class B common stock is not publicly traded. As of
January 31, 2017
, there were
30,627,012
and
11,476,932
shares of Class A common stock and Class B common stock outstanding, respectively. The number of holders of record of the Company's Class A common stock and Class B common stock as of
January 31, 2017
was
904
and
45
, respectively. The record holders of the Class B common stock are Michael S. Dunlap and Stephen F. Butterfield, an entity controlled by them, various members of their families, and various estate planning trusts established by them. Because many shares of the Company's Class A common stock are held by brokers and other institutions on behalf of shareholders, the Company is unable to estimate the total number of beneficial owners represented by these record holders. The following table sets forth the high and low intraday sales prices for the Company's Class A common stock for each full quarterly period in
2016
and
2015
.
|
2016
|
2015
|
||||||||||||||||||||||||||||||
|
1st Quarter
|
2nd Quarter
|
3rd Quarter
|
4th Quarter
|
1st Quarter
|
2nd Quarter
|
3rd Quarter
|
4th Quarter
|
||||||||||||||||||||||||
|
High
|
$
|
37.28
|
|
$
|
38.19
|
|
$
|
44.92
|
|
$
|
44.08
|
|
$
|
48.80
|
|
$
|
48.69
|
|
$
|
44.92
|
|
$
|
36.97
|
|
|||||||
|
Low
|
26.15
|
|
35.05
|
|
37.06
|
|
38.24
|
|
43.00
|
|
40.81
|
|
34.26
|
|
30.55
|
|
|||||||||||||||
31
Dividends on the Company's Class A and Class B common stock were paid as follows during the years ended
December 31, 2016
and
2015
.
|
2016
|
2015
|
||||||||||||||||||||||||||||||
|
Record date
|
3/1/16
|
|
6/1/16
|
|
9/1/16
|
|
12/1/16
|
|
2/27/15
|
|
6/1/15
|
|
9/1/15
|
|
12/1/15
|
|
|||||||||||||||
|
Payment date
|
3/15/16
|
|
6/15/16
|
|
9/15/16
|
|
12/15/16
|
|
3/13/15
|
|
6/15/15
|
|
9/15/15
|
|
12/15/15
|
|
|||||||||||||||
|
Dividend amount per share
|
$
|
0.12
|
|
$
|
0.12
|
|
$
|
0.12
|
|
$
|
0.14
|
|
$
|
0.10
|
|
$
|
0.10
|
|
$
|
0.10
|
|
$
|
0.12
|
|
|||||||
The Company currently plans to continue making regular quarterly dividend payments, subject to future earnings, capital requirements, financial condition, and other factors. In addition, the payment of dividends is subject to the terms of the Company's outstanding junior subordinated hybrid securities, which generally provide that if the Company defers interest payments on those securities it cannot pay dividends on its capital stock.
Performance Graph
The following graph compares the change in the cumulative total shareholder return on the Company's Class A common stock to that of the cumulative return of the S&P 500 Index and the S&P Financials Index. The graph assumes that the value of an investment in the Company's Class A common stock and each index was $100 on December 31, 2011 and that all dividends, if applicable, were reinvested. The performance shown in the graph represents past performance and should not be considered an indication of future performance.

|
Company/Index
|
12/31/2011
|
|
12/31/2012
|
|
12/31/2013
|
|
12/31/2014
|
|
12/31/2015
|
|
12/31/2016
|
|
|||||||||||
|
Nelnet, Inc.
|
$
|
100.00
|
|
$
|
128.55
|
|
$
|
183.76
|
|
$
|
203.98
|
|
$
|
149.41
|
|
$
|
228.77
|
|
|||||
|
S&P 500
|
100.00
|
|
116.00
|
|
153.58
|
|
174.60
|
|
177.01
|
|
198.18
|
|
|||||||||||
|
S&P Financials
|
100.00
|
|
128.82
|
|
174.71
|
|
201.27
|
|
198.20
|
|
243.38
|
|
|||||||||||
The preceding information under the caption “Performance Graph” shall be deemed to be “furnished” but not “filed” with the Securities and Exchange Commission.
32
Stock Repurchases
The following table summarizes the repurchases of Class A common stock during the fourth quarter of
2016
by the Company or any “affiliated purchaser” of the Company, as defined in Rule 10b-18(a)(3) under the Securities Exchange Act of 1934. Certain share repurchases included in the table below were made pursuant to a trading plan adopted by the Company in accordance with Rule 10b5-1 under the Securities Exchange Act of 1934.
|
Period
|
Total number of shares purchased (a)
|
Average price paid per share
|
Total number of shares purchased as part of publicly announced plans or programs (b)
|
Maximum number of shares that may yet be purchased under the plans or programs (b)
|
|||||||||
|
October 1 - October 31, 2016
|
154,618
|
|
$
|
39.65
|
|
154,140
|
|
4,639,743
|
|
||||
|
November 1 - November 30, 2016
|
68,955
|
|
39.18
|
|
68,649
|
|
4,571,094
|
|
|||||
|
December 1 - December 31, 2016
|
2,203
|
|
52.22
|
|
—
|
|
4,571,094
|
|
|||||
|
Total
|
225,776
|
|
$
|
39.63
|
|
222,789
|
|
|
|
||||
|
(a)
|
The total number of shares includes: (i) shares repurchased pursuant to the stock repurchase program discussed in footnote (b) below; and (ii) shares owned and tendered by employees to satisfy tax withholding obligations upon the vesting of restricted shares. Shares of Class A common stock tendered by employees to satisfy tax withholding obligations included 478 shares, 306 shares, and 2,203 shares in October, November, and December, respectively. Unless otherwise indicated, shares owned and tendered by employees to satisfy tax withholding obligations were purchased at the closing price of the Company’s shares on the date of vesting.
|
|
(b)
|
On August 4, 2016, the Company announced that its Board of Directors authorized a new stock repurchase program in May 2016 to repurchase up to a total of five million shares of the Company's Class A common stock during the three-year period ending May 25, 2019.
|
Equity Compensation Plans
For information regarding the securities authorized for issuance under the Company's equity compensation plans, see Part III, Item 12 of this report.
33
The following table sets forth selected financial and other operating information of the Company. The selected financial data in the table is derived from the consolidated financial statements of the Company. The following selected financial data should be read in conjunction with the consolidated financial statements, the related notes, and “Management's Discussion and Analysis of Financial Condition and Results of Operations” included in this report.
|
Year ended December 31,
|
|||||||||||||||
|
2016
|
2015
|
2014
|
2013
|
2012
|
|||||||||||
|
(Dollars in thousands, except share data)
|
|||||||||||||||
|
Operating Data:
|
|||||||||||||||
|
Net interest income
|
$
|
372,563
|
|
431,899
|
|
436,563
|
|
413,875
|
|
345,287
|
|
||||
|
Loan systems and servicing revenue
|
214,846
|
|
239,858
|
|
240,414
|
|
243,428
|
|
209,748
|
|
|||||
|
Tuition payment processing, school information, and campus commerce revenue
|
132,730
|
|
120,365
|
|
98,156
|
|
80,682
|
|
74,410
|
|
|||||
|
Communications revenue
|
17,659
|
|
—
|
|
—
|
|
—
|
|
—
|
|
|||||
|
Enrollment services revenue
|
4,326
|
|
51,073
|
|
62,949
|
|
79,275
|
|
98,510
|
|
|||||
|
Other income
|
53,929
|
|
47,262
|
|
73,936
|
|
65,101
|
|
58,891
|
|
|||||
|
Gain on sale of loans and debt repurchases, net
|
7,981
|
|
5,153
|
|
3,651
|
|
11,699
|
|
4,139
|
|
|||||
|
Net income attributable to Nelnet, Inc.
|
256,751
|
|
267,979
|
|
307,610
|
|
302,672
|
|
177,997
|
|
|||||
|
Earnings per common share attributable to Nelnet, Inc. shareholders - basic and diluted:
|
6.02
|
|
5.89
|
|
6.62
|
|
6.50
|
|
3.76
|
|
|||||
|
Dividends per common share
|
0.50
|
|
0.42
|
|
0.40
|
|
0.40
|
|
1.40
|
|
|||||
|
Other Data:
|
|||||||||||||||
|
Fixed rate floor income, net of derivative settlements
|
$
|
152,336
|
|
184,746
|
|
179,870
|
|
148,431
|
|
145,345
|
|
||||
|
Core student loan spread
|
1.28
|
%
|
1.43
|
%
|
1.48
|
%
|
1.54
|
%
|
1.44
|
%
|
|||||
|
Acquisition of student loans (par value)
|
$
|
356,110
|
|
4,036,333
|
|
6,099,249
|
|
4,058,997
|
|
3,885,138
|
|
||||
|
Student loans serviced (at end of period)
|
194,821,646
|
|
176,436,497
|
|
161,642,254
|
|
138,208,897
|
|
97,492,053
|
|
|||||
|
As of December 31,
|
|||||||||||||||
|
2016
|
2015
|
2014
|
2013
|
2012
|
|||||||||||
|
Balance Sheet Data:
|
(Dollars in thousands, except share data)
|
||||||||||||||
|
Cash and cash equivalents
|
$
|
69,654
|
|
63,529
|
|
130,481
|
|
63,267
|
|
66,031
|
|
||||
|
Student loans receivable, net
|
24,903,724
|
|
28,324,552
|
|
28,005,195
|
|
25,907,589
|
|
24,830,621
|
|
|||||
|
Goodwill and intangible assets, net
|
195,125
|
|
197,062
|
|
168,782
|
|
123,250
|
|
126,511
|
|
|||||
|
Total assets
|
27,180,108
|
|
30,419,144
|
|
30,027,739
|
|
27,704,028
|
|
26,543,573
|
|
|||||
|
Bonds and notes payable
|
24,668,490
|
|
28,105,921
|
|
27,956,946
|
|
25,888,468
|
|
25,034,513
|
|
|||||
|
Nelnet, Inc. shareholders' equity
|
2,061,655
|
|
1,884,432
|
|
1,725,448
|
|
1,443,662
|
|
1,165,208
|
|
|||||
|
Tangible Nelnet, Inc. shareholders' equity (a)
|
1,866,530
|
|
1,687,370
|
|
1,556,666
|
|
1,320,412
|
|
1,038,697
|
|
|||||
|
Outstanding common shares
|
42,105,044
|
|
43,953,460
|
|
46,243,316
|
|
46,376,715
|
|
46,612,290
|
|
|||||
|
Book value per common share
|
48.96
|
|
42.87
|
|
37.31
|
|
31.13
|
|
25.00
|
|
|||||
|
Tangible book value per common share (a)
|
44.33
|
|
38.39
|
|
33.66
|
|
28.47
|
|
22.28
|
|
|||||
|
Ratios:
|
|
||||||||||||||
|
Shareholders' equity to total assets
|
7.59
|
%
|
6.19
|
%
|
5.75
|
%
|
5.21
|
%
|
4.39
|
%
|
|||||
|
(a)
|
Tangible Nelnet, Inc. shareholders' equity, a non-GAAP measure, equals "Nelnet, Inc. shareholders' equity" less "Goodwill and intangible assets, net." Management believes tangible shareholders' equity and the corresponding tangible book value per common share are useful supplemental non-GAAP measures to evaluate the strength of the Company's capital position and facilitate comparisons with other companies in the financial services industry. However, there is no comprehensive
|
34
authoritative guidance for the presentation of these measures, and similarly titled measures may be calculated differently by other companies.
(Management’s Discussion and Analysis of Financial Condition and Results of Operations is for the years ended
December 31, 2016
,
2015
, and
2014
. All dollars are in thousands, except share data, unless otherwise noted.)
The following discussion and analysis provides information that the Company’s management believes is relevant to an assessment and understanding of the consolidated results of operations and financial condition of the Company. The discussion and analysis should be read in conjunction with the Company’s consolidated financial statements and related notes included in this report. This discussion and analysis contains forward-looking statements and should be read in conjunction with the disclosures and information contained in "Forward-Looking and Cautionary Statements" and Item 1A "Risk Factors" included in this report.
OVERVIEW
The Company is a diverse company with a focus on delivering education-related products and services and student loan asset management. The largest operating businesses engage in student loan servicing, tuition payment processing and school information systems, and communications. A significant portion of the Company's revenue is net interest income earned on a portfolio of federally insured student loans. The Company also makes investments to further diversify the Company both within and outside of its historical core education-related businesses, including, but not limited to, investments in real estate and start-up ventures.
GAAP Net Income and Non-GAAP Net Income, Excluding Adjustments
A reconciliation of the Company's GAAP net income to net income, excluding derivative market value and foreign currency adjustments, is provided below.
|
Year ended December 31,
|
|||||||||
|
2016
|
2015
|
2014
|
|||||||
|
GAAP net income attributable to Nelnet, Inc.
|
$
|
256,751
|
|
267,979
|
|
307,610
|
|
||
|
Derivative market value and foreign currency adjustments
|
(71,744
|
)
|
(28,651
|
)
|
(37,703
|
)
|
|||
|
Tax effect (a)
|
$
|
27,263
|
|
10,887
|
|
14,327
|
|
||
|
Net income, excluding derivative market value and foreign currency adjustments (b)
|
$
|
212,270
|
|
250,215
|
|
284,234
|
|
||
|
Earnings per share:
|
|||||||||
|
GAAP net income attributable to Nelnet, Inc.
|
$
|
6.02
|
|
5.89
|
|
6.62
|
|
||
|
Derivative market value and foreign currency adjustments
|
(1.68
|
)
|
(0.63
|
)
|
(0.81
|
)
|
|||
|
Tax effect (a)
|
0.63
|
|
0.24
|
|
0.31
|
|
|||
|
Net income, excluding derivative market value and foreign currency adjustments (b)
|
$
|
4.97
|
|
5.50
|
|
6.12
|
|
||
|
(a)
|
The tax effects are calculated by multiplying the derivative market value and foreign currency adjustments by the applicable statutory income tax rate.
|
|
(b)
|
The Company provides additional non-GAAP financial information related to specific items management believes to be important in the evaluation of its operating results and performance. "Derivative market value and foreign currency adjustments" include (i) the unrealized gains and losses that are caused by changes in fair values of derivatives which do not qualify for "hedge treatment" under GAAP; and (ii) the foreign currency transaction gains or losses caused by the re-measurement of the Company's Euro-denominated bonds to U.S. dollars. The Company believes these point-in-time estimates of asset and liability values related to these financial instruments that are subject to interest and currency rate fluctuations are subject to volatility mostly due to timing and market factors beyond the control of management, and affect the period-to-period comparability of the results of operations. Accordingly, the Company’s management utilizes operating results excluding these items for comparability purposes when making decisions regarding the Company’s performance and in presentations with credit rating agencies, lenders, and investors. Consequently, the Company reports this non-GAAP information because the Company believes that it provides additional information regarding operational and performance indicators that are closely assessed by management. There is no comprehensive, authoritative guidance for the presentation of such non-GAAP information, which is only meant to supplement GAAP results by providing additional information that management utilizes to assess performance.
|
The decrease in net income, excluding derivative market value and foreign currency adjustments, for 2016 as compared to 2015, was expected due to the runoff of the Company's student loan portfolio and lower student loan spread, which decreased net interest income.
35
Operating Results
The Company earns net interest income on its FFELP student loan portfolio in its Asset Generation and Management ("AGM") operating segment. This segment is expected to generate a stable net interest margin and significant amounts of cash as the FFELP portfolio amortizes. As of
December 31, 2016
, the Company had a $24.9 billion student loan portfolio that will amortize over the next approximately 25 years. The Company actively seeks to acquire FFELP loan portfolios to leverage its servicing scale and expertise to generate incremental earnings and cash flow.
In addition, the Company earns fee-based revenue through the following reportable operating segments:
|
•
|
Loan Systems and Servicing ("LSS") - referred to as Nelnet Diversified Solutions ("NDS")
|
|
•
|
Tuition Payment Processing and Campus Commerce ("TPP&CC") - referred to as Nelnet Business Solutions ("NBS")
|
|
•
|
Communications - referred to as Allo Communications ("Allo")
|
Other business activities and operating segments that are not reportable are combined and included in Corporate and Other Activities ("Corporate"). Corporate and Other Activities also includes income earned on certain investments and interest expense incurred on unsecured debt transactions.
Prior to January 1, 2016, the Company allocated certain corporate overhead expenses that are incurred within the Corporate and Other Activities segment to the other operating segments. These expenses included certain corporate activities related to executive management, internal audit, enterprise risk management, and other costs incurred by the Company due to corporate-wide initiatives. Effective January 1, 2016, internal reporting to executive management (the "chief operating decision maker") changed to eliminate the allocation of these expenses to the other segments. Management believes the change in its allocation methodology results in a better reflection of the operating results of each of the reportable segments as if they each operated as a standalone business entity, which also reflects how management evaluates the performance of the segments. Prior period segment operating results have been restated to conform to the current period presentation.
The information below provides the operating results for each reportable operating segment and Corporate and Other Activities for the years ended
December 31, 2016, 2015, and 2014
(dollars in millions).

|
(a)
|
Revenue includes intersegment revenue earned by LSS as a result of servicing loans for AGM.
|
|
(b)
|
Total revenue includes "net interest income after provision for loan losses" and "total other income" from the Company's segment statements of income, excluding the impact from changes in fair values of derivatives and foreign currency transaction adjustments. Net income excludes changes in fair values of derivatives and foreign currency transaction adjustments, net of tax. For information regarding the exclusion of the impact from changes in fair values of derivatives and foreign currency transaction adjustments, see "GAAP Net Income and Non-GAAP Net Income, Excluding Adjustments" above.
|
|
(c)
|
Computed as income before income taxes divided by total revenue.
|
The Company’s current outlook for 2017-2019 operating results is that the Company believes that net income for those years will be at decreased levels compared to 2016, due to the continued amortization of the Company’s FFELP loan portfolio and anticipated
36
increases in interest rates. The Company currently believes that in the short-term it will most likely not be able to invest the excess cash generated from the FFELP loan portfolio into assets that immediately generate the rates of return historically realized from that portfolio. In addition, the Company currently anticipates Allo's operating results will be dilutive to the Company's consolidated earnings over the next several years as it continues to build its network in Lincoln, Nebraska, due to large upfront capital expenditures and associated depreciation and upfront customer acquisition costs.
A summary of the results and financial highlights for each reportable operating segment and a summary of the Company's liquidity and capital resources follows. See "Results of Operations" for each reportable operating segment and "Liquidity and Capital Resources" under this Item 7 for additional detail.
Loan Systems and Servicing
|
•
|
As of December 31, 2016, the Company was servicing $194.8 billion in FFELP, private, and government owned student loans, as compared with $176.4 billion and $161.6 billion of loans as of December 31, 2015 and 2014, respectively. The year over year increase was due to an increase in government and private loan servicing volume.
|
|
•
|
Revenue decreased in 2016 compared to 2015 and 2015 compared to 2014 due primarily to the loss of two guaranty servicing and collection clients. The Company's guaranty servicing and collection revenue was earned from two guaranty clients, and a significant amount of such revenue came from one of those clients. The contract with this client expired on October 31, 2015. The other guaranty servicing and collection client exited the FFELP guaranty business at the end of their contract term on June 30, 2016. After this customer's exit from the FFELP guaranty business effective June 30, 2016, the Company has no remaining guaranty revenue. FFELP guaranty servicing and FFELP guaranty collection revenue recognized by the Company from these clients for the years ended December 31, 2016, 2015, and 2014, was $9.6 million, $56.9 million, and $66.7 million, respectively. The decrease in revenue was partially offset by an increase in government and private servicing revenue.
|
|
•
|
Revenue from the government servicing contract increased to
$151.7 million
in 2016 compared to
$133.2 million
and
$124.4 million
in 2015 and 2014, respectively. The increase in 2016 compared to 2015 was due to a shift in the portfolio of loans serviced to a greater portion of loans in higher paying repayment statuses, an increase in billable applications for TPD borrowers due to a new change request matching eligible borrowers to the social security administration database, and the transfer of borrowers from a not-for-profit servicer who exited the loan servicing business in August 2016. The increase in 2015 compared to 2014 was due to an increase in the number of borrowers serviced under the government servicing contract.
|
|
•
|
In April 2016, the Department's Office of Federal Student Aid released information regarding a new contract procurement process for the Department to acquire a single servicing system platform with multiple customer service providers to manage all student loans owned by the Department. The contract solicitation process is divided into two phases.
|
On May 6, 2016, the Company and Great Lakes submitted a joint response to Phase I as part of a newly created joint venture to respond to the contract solicitation process and to provide services under the new contract in the event that the Department selects it to be awarded with the contract. The joint venture will operate as a new legal entity called GreatNet. The Company and Great Lakes each own 50 percent of the ownership interests of GreatNet. In addition to the Company, Great Lakes is also one of four TIVAS that currently has a student loan servicing contract with the Department to provide servicing for loans owned by the Department. GreatNet was one of three entities selected to respond to Phase II of the procurement selection process. On January 6, 2017, GreatNet submitted its Phase II response to the Department and is currently awaiting announcement from the new administration on the next steps in the procurement process.
Tuition Payment Processing and Campus Commerce
|
•
|
Revenue increased in 2016 and 2015, compared to
2015
and 2014, respectively, due to increases in the number of managed tuition payment plans, campus commerce customer transaction volume, and new school customers. In addition, the Company purchased RenWeb on June 3, 2014, which contributed revenue of $8.8 million, $19.9 million, and $23.2 million in 2014, 2015, and 2016, respectively.
|
37
Communications
|
•
|
On December 31, 2015, the Company purchased the majority of the ownership interests of Allo for total cash consideration of $46.25 million. On January 1, 2016, the Company sold a 1.0 percent ownership interest in Allo to a non-related third-party for $0.5 million. The remaining 7.5 percent of the ownership interests of Allo is owned by members of Allo management, who have the opportunity to earn an additional 11.5 percent (up to 19 percent) of the total ownership interests based on the financial performance of Allo. The Allo assets acquired and liabilities assumed were recorded by the Company at their respective estimated fair values at the date of acquisition, and such assets and liabilities were included in the Company's balance sheet as of December 31, 2015. However, Allo had no impact on the consolidated statement of income for 2015. On January 1, 2016, the Company began to reflect the operations of Allo in the consolidated statements of income.
|
|
•
|
For the year ended December 31, 2016, the operating segment recorded a net loss of $5.9 million. The Company anticipates this operating segment will be dilutive to consolidated earnings over the next several years as it continues to build its network in Lincoln, Nebraska, due to large upfront capital expenditures and associated depreciation and upfront customer acquisition costs.
|
|
•
|
The Company anticipates total network capital expenditures of approximately $80 million in 2017; however, such amount could change based on customer demand for Allo's services. For the year ended December 31, 2016, Allo's capital expenditures were $38.8 million.
|
Asset Generation and Management
|
•
|
During the year ended December 31, 2016 compared to the same period in 2015, the average balance of the Company's student loan portfolio decreased $1.8 billion, to $26.9 billion, due primarily to the amortization of the portfolio, and limited portfolio acquisitions from third parties. The Company acquired $356.1 million of FFELP and private education student loans during
2016
, compared to $4.0 billion in
2015
and $6.1 billion in 2014.
|
|
•
|
Core student loan spread decreased to 1.28% for 2016, compared to 1.43% for 2015. This decrease was a result of decreases in variable student loan spread and fixed rate floor income. Variable student loan spread decreased due to a widening in the basis between the asset and debt indices in which the Company earns interest on its loans and funds such loans. Fixed rate floor income decreased due to an increase in interest rates.
|
|
•
|
Due to historically low interest rates, the Company continues to earn significant fixed rate floor income. During 2016, 2015, and
2014
, the Company earned
$152.3 million
,
$184.7 million
, and
$179.9 million
, respectively, of fixed rate floor income (net of
$17.6 million
,
$23.0 million
, and
$24.4 million
of derivative settlements, respectively, used to hedge such loans).
|
|
•
|
In the third quarter of 2016, the Company revised its policy to correct for an error in its method of applying the interest method used to amortize premiums and accrete discounts on its student loan portfolio. Previously, the Company amortized premiums and accreted discounts by including in its prepayment assumption forecasted payments in excess of contractually required payments as well as forecasted defaults. The Company has determined that only payments in excess of contractually required payments should be included in the prepayment assumption. Under the Company's revised policy, as of September 30, 2016, the constant prepayment rate used by the Company to amortize/accrete student loan premiums/discounts was decreased. During the third quarter of 2016, the Company recorded an adjustment to reflect the net impact on prior periods for the correction of this error that resulted in an
$8.2 million
reduction to the Company's net loan discount balance and a corresponding pre-tax increase to interest income ($5.1 million after tax). The Company concluded this error had an immaterial impact on 2016 results as well as the results for prior periods.
|
|
•
|
During the fourth quarter of 2016, the Company redeemed certain debt securities prior to their legal maturity and recognized $7.4 million, or $4.6 million after tax, in interest expense to write off the remaining debt discount associated with these bonds.
|
38
Corporate and Other Activities
|
•
|
Whitetail Rock Capital Management, LLC, the Company's SEC-registered investment advisory subsidiary, recognized investment advisory revenue of
$6.1 million
, $4.3 million, and $17.7 million for 2016, 2015, and
2014
, respectively. These amounts include performance fees earned from the sale of managed securities or managed securities being called prior to the full contractual maturity. Due to improvements in the capital markets, the opportunities to earn performance fees on the sale of student loan asset-backed securities were more limited in 2016 and 2015 as compared to 2014.
|
|
•
|
On February 1, 2016, the Company sold 100 percent of the membership interests in Sparkroom LLC, which includes the majority of the Company's inquiry management products and services within Nelnet Enrollment Services. The Company retained the digital marketing and content solution products and services under the brand name Peterson's within the Nelnet Enrollment Services business, which include test preparation study guides, school directories and databases, career exploration guides, on-line courses, scholarship search and selection data, career planning information and guides, and on-line information about colleges and universities. The Company reclassified the revenue and cost of goods sold attributable to the Peterson's products and services from "enrollment services revenue" and "cost to provide enrollment services" to "other income" and "other expenses," respectively, on the consolidated statements of income. After this reclassification, "enrollment services revenue" and "cost to provide enrollment services" include the operating results of the products and services sold as part of the Sparkroom disposition for all periods presented. These reclassifications had no effect on consolidated net income.
|
Liquidity and Capital Resources
|
•
|
As of
December 31, 2016
, the Company had cash and cash equivalents of
$69.7 million
. In addition, the Company had a portfolio of available-for-sale and trading investments, consisting primarily of student loan asset-backed securities, with a fair value of $106.6 million as of
December 31, 2016
.
|
|
•
|
For the year ended
December 31, 2016
, the Company generated
$325.3 million
in net cash provided by operating activities.
|
|
•
|
Forecasted undiscounted future cash flows from the Company's student loan portfolio financed in asset-backed securitization transactions are estimated to be approximately
$2.07 billion
as of
December 31, 2016
.
|
|
•
|
As of December 31, 2016
, no amounts were outstanding on the Company's unsecured line of credit and
$350.0 million
was available for future use. The unsecured line of credit has a maturity date of December 12, 2021.
|
|
•
|
During 2016, the Company repurchased a total of
2,038,368
shares of Class A common stock for
$69.1 million
(
$33.90
per share).
|
|
•
|
During 2016, the Company paid cash dividends of $21.2 million ($0.50 per share).
|
|
•
|
The Company intends to use its liquidity position to capitalize on market opportunities, including FFELP and private education loan acquisitions; strategic acquisitions and investments; expansion of Allo's telecommunications network; and capital management initiatives, including stock repurchases, debt repurchases, and dividend distributions. The timing and size of these opportunities will vary and will have a direct impact on the Company's cash and investment balances.
|
CONSOLIDATED RESULTS OF OPERATIONS
An analysis of the Company's operating results for the years ended
December 31, 2016, 2015, and 2014
is provided below.
The Company’s operating results are primarily driven by the performance of its existing portfolio and the revenues generated by its fee-based businesses and the costs to provide such services. The performance of the Company’s portfolio is driven by net interest income (which includes financing costs) and losses related to credit quality of the assets, along with the cost to administer and service the assets and related debt.
The Company operates as distinct reportable operating segments as described above. For a reconciliation of the reportable segment operating results to the consolidated results of operations, see note 14 of the notes to consolidated financial statements included in this report. Since the Company monitors and assesses its operations and results based on these segments, the discussion following the consolidated results of operations is presented on a reportable segment basis.
39
|
|
Year ended December 31,
|
||||||||||
|
|
2016
|
2015
|
2014
|
Additional information
|
|||||||
|
Loan interest
|
$
|
751,280
|
|
726,258
|
|
703,007
|
|
Increase in 2016 compared to 2015 due to an increase in the gross yield earned on the student loan portfolio and an adjustment recorded during 2016 to reflect the net impact on prior periods for a correction of an error regarding the Company's method of applying the interest method to amortize premiums and accrete discounts on its student loan portfolio, partially offset by a decrease in the average balance of student loans and a decrease in gross fixed rate floor income. Increase in 2015 compared to 2014 due to an increase in the average balance of student loans and the gross yield earned on student loans.
|
|||
|
Investment interest
|
9,466
|
|
7,851
|
|
6,793
|
|
Includes income from unrestricted interest-earning deposits and investments and funds in asset-backed securitizations.
|
||||
|
Total interest income
|
760,746
|
|
734,109
|
|
709,800
|
|
|||||
|
Interest expense
|
388,183
|
|
302,210
|
|
273,237
|
|
Increase in 2016 compared to 2015 due to an increase in the Company's cost of funds. In addition, during 2016, the Company redeemed certain debt securities prior to their legal maturity and recognized interest expense to write off the remaining debt discount associated with these bonds. These increases were partially offset by a decrease in average debt outstanding. Increase in 2015 compared to 2014 due to an increase in the Company's cost of funds and an increase in average debt outstanding.
|
||||
|
Net interest income
|
372,563
|
|
431,899
|
|
436,563
|
|
See table below for additional analysis.
|
||||
|
Less provision for loan losses
|
13,500
|
|
10,150
|
|
9,500
|
|
Represents the periodic expense of maintaining an allowance appropriate to absorb losses inherent in the portfolio of student loans. See AGM operating segment - results of operations.
|
||||
|
Net interest income after provision for loan losses
|
359,063
|
|
421,749
|
|
427,063
|
|
|||||
|
Other income:
|
|
|
|
|
|||||||
|
LSS revenue
|
214,846
|
|
239,858
|
|
240,414
|
|
See LSS operating segment - results of operations.
|
||||
|
TPP&CC revenue
|
132,730
|
|
120,365
|
|
98,156
|
|
See TPP&CC operating segment - results of operations.
|
||||
|
Communications revenue
|
17,659
|
|
—
|
|
See Communications operating segment - results of operations.
|
||||||
|
Enrollment services revenue
|
4,326
|
|
51,073
|
|
62,949
|
|
See table below for additional analysis.
|
||||
|
Other income
|
53,929
|
|
47,262
|
|
73,936
|
|
See table below for the components of "other income."
|
||||
|
Gain on sale of loans and debt repurchases, net
|
7,981
|
|
5,153
|
|
3,651
|
|
Gains are primarily from the repurchase of the Company's own asset-backed and unsecured debt securities. In 2014, gains from debt repurchases were partially offset by losses on the sale of loans.
|
||||
|
Derivative settlements, net
|
(21,949
|
)
|
(24,250
|
)
|
(21,843
|
)
|
The Company maintains an overall risk management strategy that incorporates the use of derivative instruments to reduce the economic effect of interest rate volatility. Derivative settlements for each applicable period should be evaluated with the Company's net interest income. See table below for additional analysis.
|
||||
|
Derivative market value and foreign currency adjustments, net
|
71,744
|
|
28,651
|
|
37,703
|
|
Includes (i) the unrealized gains and losses that are caused by changes in fair values of derivatives which do not qualify for "hedge treatment" under GAAP; and (ii) the foreign currency transaction gains or losses caused by the re-measurement of the Company's Euro-denominated bonds to U.S. dollars.
|
||||
|
Total other income
|
481,266
|
|
468,112
|
|
494,966
|
|
|||||
|
Operating expenses:
|
|
|
|
|
|||||||
|
Salaries and benefits
|
255,924
|
|
247,914
|
|
228,079
|
|
Increase in 2016 compared to 2015 due to additional personnel to support the increase in TPP&CC revenue and the acquisition of Allo on December 31, 2015, partially offset by a decrease in personnel in the LSS operating segment as a result of the loss of guaranty servicing clients and improved operational efficiencies, and a decrease in personnel due to the sale of Sparkroom during the first quarter of 2016. Increase in 2015 compared to 2014 due to additional personnel to support increased LSS servicing volume and TPP&CC revenue, as well as increased headcount as a result of a TPP&CC acquisition during 2014.
|
||||
|
Depreciation and amortization
|
33,933
|
|
26,343
|
|
21,134
|
|
Increases due to investments in information technology infrastructure, additional investments in TPP&CC systems and products, and due to the acquisition of Allo on December 31, 2015 and a TPP&CC acquisition on June 3, 2014. Allo's capital expenditures during 2016 were $38.8 million. Intangible amortization expense for 2016, 2015, and 2014 was $11.6 million, $9.8 million, and $6.5 million, respectively.
|
||||
|
Loan servicing fees
|
25,750
|
|
30,213
|
|
27,009
|
|
Third-party servicing fees decreased in 2016 due to a declining loan portfolio. Additionally, the Company pays higher third-party servicing fees on delinquent loans, and the Company's third-party serviced loan portfolio had fewer delinquent loans in 2016 compared to 2015 and thus, third-party fees decreased. The increase in 2015 compared to 2014 was due to purchases of a significant amount of loans serviced at third parties.
|
||||
|
Cost to provide communication services
|
6,866
|
|
—
|
|
—
|
|
Represents cost of services primarily composed of television programming costs in the Communications operating segment.
|
||||
|
Cost to provide enrollment services
|
3,623
|
|
41,733
|
|
49,985
|
|
See table below for additional analysis.
|
||||
|
Other
|
115,419
|
|
123,014
|
|
126,303
|
|
Decrease due to a decrease in collection costs associated with the decrease in FFELP guaranty collection revenue, partially offset by increases as a result of the acquisition of Allo on December 31, 2015, and a TPP&CC acquisition on June 3, 2014, and an increase to support the increase in tuition payment plans and campus commerce activity and continued investments in and enhancements of payment plan and campus commerce systems and products.
|
||||
|
Total operating expenses
|
441,515
|
|
469,217
|
|
452,510
|
|
|||||
|
Income before income taxes
|
398,814
|
|
420,644
|
|
469,519
|
|
|||||
|
Income tax expense
|
141,313
|
|
152,380
|
|
160,238
|
|
Effective tax rate: 2016 - 35.50%, 2015 - 36.25%, 2014 - 34.25%. During 2014, income tax expense was reduced by $5.9 million due to a tax capital loss resulting from certain asset sales. The Company currently expects its effective tax rate to range between 35.50% and 37.50% in future periods.
|
||||
|
Net income
|
257,501
|
|
268,264
|
|
309,281
|
|
|||||
|
Net income attributable to noncontrolling interest
|
750
|
|
285
|
|
1,671
|
|
|||||
|
Net income attributable to Nelnet, Inc.
|
$
|
256,751
|
|
267,979
|
|
307,610
|
|
||||
40
|
Additional information:
|
|||||||||||
|
Net income attributable to Nelnet, Inc.
|
$
|
256,751
|
|
267,979
|
|
307,610
|
|
See "Overview - GAAP Net Income and Non-GAAP Net Income, Excluding Adjustments" above for additional information about non-GAAP net income, excluding derivative market value and foreign currency adjustments.
|
|||
|
Derivative market value and foreign currency adjustments
|
(71,744
|
)
|
(28,651
|
)
|
(37,703
|
)
|
|||||
|
Tax effect
|
27,263
|
|
10,887
|
|
14,327
|
|
|||||
|
Net income attributable to Nelnet, Inc., excluding derivative market value and foreign currency adjustments
|
$
|
212,270
|
|
250,215
|
|
284,234
|
|
||||
The following table summarizes the components of "net interest income" and "derivative settlements, net."
|
|
Year ended December 31,
|
||||||||||
|
|
2016
|
2015
|
2014
|
Additional information
|
|||||||
|
Variable student loan interest margin, net of settlements on derivatives
|
$
|
195,823
|
|
222,479
|
|
234,814
|
|
Represents the yield the Company receives on its student loan portfolio less the cost of funding these loans. Variable student loan spread is also impacted by the amortization/accretion of loan premiums and discounts, the 1.05% per year consolidation loan rebate fee paid to the Department, and yield adjustments from borrower benefit programs. See AGM operating segment - results of operations.
|
|||
|
Fixed rate floor income, net of settlements on derivatives
|
152,336
|
|
184,746
|
|
179,870
|
|
The Company has a portfolio of student loans that are earning interest at a fixed borrower rate which exceeds the statutorily defined variable lender rates, generating fixed rate floor income. See Item 7A, "Quantitative and Qualitative Disclosures About Market Risk - Interest Rate Risk" for additional information.
|
||||
|
Investment interest
|
9,466
|
|
7,851
|
|
6,793
|
|
|||||
|
Non-portfolio related derivative settlements
|
(915
|
)
|
(1,014
|
)
|
(1,026
|
)
|
|||||
|
Corporate debt interest expense
|
(6,096
|
)
|
(6,413
|
)
|
(5,731
|
)
|
Includes interest expense on the Junior Subordinated Hybrid Securities and unsecured and secured lines of credit.
|
||||
|
Net interest income (net of settlements on derivatives)
|
$
|
350,614
|
|
407,649
|
|
414,720
|
|
||||
The following tables summarize the components of "Enrollment services revenue" and "cost to provide enrollment services."
|
Inquiry management (marketing) (a)
|
Inquiry management (software) (a)
|
Total (a)
|
|||||||
|
Year ended December 31, 2016
|
|||||||||
|
Enrollment services revenue
|
$
|
4,005
|
|
321
|
|
4,326
|
|
||
|
Cost to provide enrollment services
|
3,623
|
|
—
|
|
3,623
|
|
|||
|
Gross profit
|
$
|
382
|
|
321
|
|
703
|
|
||
|
Gross profit %
|
9.5%
|
||||||||
|
Year ended December 31, 2015
|
|||||||||
|
Enrollment services revenue
|
$
|
47,277
|
|
3,796
|
|
51,073
|
|
||
|
Cost to provide enrollment services
|
41,733
|
|
—
|
|
41,733
|
|
|||
|
Gross profit
|
$
|
5,544
|
|
3,796
|
|
9,340
|
|
||
|
Gross profit %
|
11.7%
|
||||||||
|
Year ended December 31, 2014
|
|||||||||
|
Enrollment services revenue
|
$
|
58,341
|
|
4,608
|
|
62,949
|
|
||
|
Cost to provide enrollment services
|
49,985
|
|
—
|
|
49,985
|
|
|||
|
Gross profit
|
$
|
8,356
|
|
4,608
|
|
12,964
|
|
||
|
Gross profit %
|
14.3%
|
||||||||
|
(a)
|
On February 1, 2016, the Company sold 100 percent of the membership interests in Sparkroom LLC, which includes the majority of the Company's inquiry management products and services within Nelnet Enrollment Services. After the sale of Sparkroom LLC, the Company no longer earns inquiry management revenue.
|
41
The following table summarizes the components of "other income."
|
|
Year ended December 31,
|
||||||||
|
|
2016
|
2015
|
2014
|
||||||
|
Peterson's revenue (a)
|
$
|
14,254
|
|
19,632
|
|
19,934
|
|
||
|
Borrower late fee income
|
12,838
|
|
14,693
|
|
14,760
|
|
|||
|
Investment advisory fees (b)
|
6,129
|
|
4,302
|
|
17,653
|
|
|||
|
Realized and unrealized gains/(losses) on investments classified as available-for-sale and trading, net
|
2,773
|
|
143
|
|
7,289
|
|
|||
|
Remeasurement of business acquisition contingent consideration
|
—
|
|
(925
|
)
|
1,268
|
|
|||
|
Reduction of repurchase obligation (c)
|
—
|
|
—
|
|
4,235
|
|
|||
|
Other (d)
|
17,935
|
|
9,417
|
|
8,797
|
|
|||
|
Other income
|
$
|
53,929
|
|
|
47,262
|
|
|
73,936
|
|
|
(a)
|
The decrease in revenue in 2016 compared to 2015 and 2014 was due to the loss of rights to a certain publication.
|
|
(b)
|
The Company provides investment advisory services under various arrangements and earns annual fees of 25 basis points on the outstanding balance of investments and up to 50 percent of the gains from the sale of securities or securities being called prior to the full contractual maturity for which it provides advisory services. Due to improvements in the capital markets, the opportunities to earn performance fees on the sale of student loan asset-backed securities were more limited in 2016 and 2015 as compared to 2014. As of December 31, 2016, the outstanding balance of investments subject to these arrangements was $907.0 million.
|
|
(c)
|
During 2014, the Company recognized income related to the modification of certain servicing agreements in which the Company's loan repurchase obligation was reduced.
|
|
(d)
|
The operating results for the year ended December 31, 2016 include a gain of approximately $3.0 million related to the Company's sale of Sparkroom, LLC in February 2016. In addition, during 2016 the Company recognized net gains of $5.1 million related to the sale of various real estate, venture capital, and other investments.
|
42
LOAN SYSTEMS AND SERVICING OPERATING SEGMENT – RESULTS OF OPERATIONS
Student Loan Servicing Volumes (dollars in millions)

|
Company owned
|
$21,237
|
$21,397
|
$19,742
|
$19,369
|
$18,934
|
$18,593
|
$18,886
|
$18,433
|
$18,079
|
$17,429
|
$16,962
|
||||||||||||||||||||||
|
% of total
|
21.8%
|
15.5%
|
12.2%
|
11.5%
|
11.1%
|
10.6%
|
10.7%
|
10.1%
|
9.8%
|
9.0%
|
8.7%
|
||||||||||||||||||||||
|
Number of servicing borrowers:
|
|||||||||||||||||||||||||||||||||
|
Government servicing
|
3,892,929
|
|
5,305,498
|
|
5,915,449
|
|
5,882,446
|
|
5,817,078
|
|
5,886,266
|
|
5,842,163
|
|
5,786,545
|
|
5,726,828
|
|
6,009,433
|
5,972,619
|
|||||||||||||
|
FFELP servicing
|
1,626,146
|
|
1,462,122
|
|
1,397,295
|
|
1,358,551
|
|
1,353,785
|
|
1,339,307
|
|
1,335,538
|
|
1,298,407
|
|
1,296,198
|
|
1,357,412
|
1,312,192
|
|||||||||||||
|
Private servicing
|
173,948
|
|
195,580
|
|
202,529
|
|
205,926
|
|
209,854
|
|
230,403
|
|
245,737
|
|
250,666
|
|
267,073
|
|
292,989
|
355,096
|
|||||||||||||
|
Total:
|
5,693,023
|
|
6,963,200
|
|
7,515,273
|
|
7,446,923
|
|
7,380,717
|
|
7,455,976
|
|
7,423,438
|
|
7,335,618
|
|
7,290,099
|
|
7,659,834
|
7,639,907
|
|||||||||||||
|
Number of remote hosted borrowers
|
6,912,204
|
|
1,915,203
|
|
1,611,654
|
|
1,592,813
|
|
1,559,573
|
|
1,710,577
|
|
1,755,341
|
|
1,796,783
|
|
1,842,961
|
|
2,103,989
|
|
2,230,019
|
|
|||||||||||
43
Summary and Comparison of Operating Results
|
|
Year ended December 31,
|
||||||||||
|
|
2016
|
2015
|
2014
|
Additional information
|
|||||||
|
Net interest income
|
$
|
111
|
|
49
|
|
30
|
|
||||
|
Loan systems and servicing revenue
|
214,846
|
|
239,858
|
|
240,414
|
|
See table below for additional analysis.
|
||||
|
Intersegment servicing revenue
|
45,381
|
|
50,354
|
|
55,139
|
|
Represents revenue earned by the LSS operating segment as a result of servicing loans for the AGM operating segment. Year over year decrease was due to portfolio run-off.
|
||||
|
Total other income
|
260,227
|
|
|
290,212
|
|
295,553
|
|
||||
|
Salaries and benefits
|
132,072
|
|
134,635
|
|
125,844
|
|
Decrease in 2016 compared to 2015 due primarily to a decrease in personnel as a result of the loss of guaranty servicing and collection clients discussed below and improved operational efficiencies, partially offset by additional personnel to support the increase in volume of loans serviced for the government entering repayment status and the increase in private loan servicing volume. Increase in 2015 compared to 2014 due to additional personnel to support the increase in volume of loans serviced under the government servicing contract and the increase in private loan servicing volume.
|
||||
|
Depreciation and amortization
|
1,980
|
|
1,931
|
|
1,734
|
|
|||||
|
Other expenses
|
40,715
|
|
57,799
|
|
59,521
|
|
Collection costs associated with FFELP guaranty collection revenue were $3.5 million, $19.2 million, and $24.3 million in 2016, 2015, and 2014, respectively. Excluding collection costs, other expenses were $37.2 million, $38.6 million, and $35.2 million in 2016, 2015, and 2014, respectively. See additional information below regarding the decrease in FFELP guaranty collection revenue.
|
||||
|
Intersegment expenses, net
|
24,204
|
|
29,706
|
|
31,956
|
|
Intersegment expenses represent costs for certain corporate activities and services that are allocated to each operating segment based on estimated use of such activities and services.
|
||||
|
Total operating expenses
|
198,971
|
|
224,071
|
|
219,055
|
|
|||||
|
Income before income taxes
|
61,367
|
|
66,190
|
|
76,528
|
|
|||||
|
Income tax expense
|
(23,319
|
)
|
(25,153
|
)
|
(29,081
|
)
|
|||||
|
Net income
|
38,048
|
|
|
41,037
|
|
47,447
|
|
||||
|
Net loss attributable to noncontrolling interest
|
—
|
|
20
|
|
—
|
|
|||||
|
Net income attributable to Nelnet, Inc.
|
$
|
38,048
|
|
41,057
|
|
47,447
|
|
||||
|
Before tax operating margin
|
23.6
|
%
|
22.8
|
%
|
25.9
|
%
|
|||||
44
Loan systems and servicing revenue
|
|
Year ended December 31,
|
||||||||||
|
2016
|
2015
|
2014
|
Additional information
|
||||||||
|
Government servicing
|
$
|
151,728
|
|
133,189
|
|
124,378
|
|
Increase in 2016 compared to 2015 due to a shift in the portfolio of loans serviced to a greater portion of loans in higher paying repayment statuses, an increase in billable applications for TPD borrowers due to a new change request matching eligible borrowers to the social security administration database, and the transfer of borrowers from a not-for-profit servicer who exited the loan servicing business in August 2016. Increase in 2015 compared to 2014 was due to an increase in the number of borrowers serviced under the government servicing contract.
|
|||
|
FFELP servicing
|
15,948
|
|
14,248
|
|
13,334
|
|
Year over year increases due to an increase in third-party servicing volume as a result of conversions to the Company's servicing platform. Over time, FFELP servicing revenue will decrease as third-party customers' FFELP portfolios run off.
|
||||
|
Private servicing
|
15,600
|
|
12,040
|
|
10,497
|
|
Increase due to growth in private loan servicing volume from existing and new clients.
|
||||
|
FFELP guaranty servicing
|
2,349
|
|
9,318
|
|
11,284
|
|
The Company’s guaranty servicing revenue was earned from two guaranty servicing clients. A contract with one client expired on October 31, 2015, and was not renewed. Guaranty servicing revenue from this customer was $4.9 million and $6.4 million in 2015 and 2014, respectively. The remaining guaranty servicing client exited the FFELP guaranty business at the end of their contract term on June 30, 2016. Guaranty servicing revenue from this customer was $2.3 million, $4.4 million, and $4.9 million in 2016, 2015, and 2014, respectively. Effective June 30, 2016, the Company has no remaining guaranty servicing revenue.
|
||||
|
FFELP guaranty collection
|
7,211
|
|
47,597
|
|
55,369
|
|
The Company’s guaranty collection revenue was earned from two guaranty collection clients. A contract with one client expired on October 31, 2015, and was not renewed. Guaranty collection revenue from this customer was $32.5 million and $42.4 million in 2015 and 2014, respectively. The remaining guaranty servicing client exited the FFELP guaranty business at the end of their contract term on June 30, 2016. Guaranty collection revenue from this customer was $7.2 million, $15.1 million, and $13.0 million in 2016, 2015, and 2014, respectively. The Company incurred collection costs that were directly related to guaranty collection revenue. Effective June 30, 2016, the Company has no remaining guaranty collection revenue.
|
||||
|
Software services
|
18,132
|
|
19,492
|
|
22,349
|
|
The majority of software services revenue relates to providing hosted student loan servicing. Year over year decreases were due to a decrease in the average number of remote hosted borrowers. In addition, in August 2016, a not-for-profit servicer exited the business and their servicing volume was transferred to the Company and is included in the Company's government servicing volume.
|
||||
|
Other
|
3,878
|
|
3,974
|
|
3,203
|
|
The majority of this revenue relates to providing contact center outsourcing activities.
|
||||
|
Loan systems and servicing revenue
|
$
|
214,846
|
|
239,858
|
|
240,414
|
|
||||
45
TUITION PAYMENT PROCESSING AND CAMPUS COMMERCE OPERATING SEGMENT – RESULTS OF OPERATIONS
This segment of the Company’s business is subject to seasonal fluctuations which correspond, or are related to, the traditional school year. Tuition management revenue is recognized over the course of the academic term, but the peak operational activities take place in summer and early fall. Higher amounts of revenue are typically recognized during the first quarter due to fees related to grant and aid applications as well as online applications and enrollment services. The Company’s operating expenses do not follow the seasonality of the revenues. This is primarily due to generally fixed year-round personnel costs and seasonal marketing costs. Based on the timing of revenue recognition and when expenses are incurred, revenue and pre-tax operating margin are higher in the first quarter as compared to the remainder of the year.
The Company purchased RenWeb on June 3, 2014. The results of RenWeb's operations are reported in the Company's consolidated financial statements from the date of acquisition. RenWeb's revenue from the date of acquisition through December 31, 2014 and for the years ended December 31, 2015 and 2016 was $8.8 million, $19.9 million, and $23.2 million, respectively.
Summary and Comparison of Operating Results
|
|
Year ended December 31,
|
||||||||||
|
|
2016
|
2015
|
2014
|
Additional information
|
|||||||
|
Net interest income
|
$
|
9
|
|
3
|
|
6
|
|
||||
|
Tuition payment processing, school information, and campus commerce revenue
|
132,730
|
|
120,365
|
|
98,156
|
|
In addition to the acquisition of RenWeb referred to above, the remaining increase was due to an increase in the number of managed tuition payment plans, campus commerce customer transaction volume, and new school customers.
|
||||
|
Other income (expense)
|
—
|
|
(925
|
)
|
1,268
|
|
Amount represents the remeasurement of contingent consideration to fair value related to the acquisition of RenWeb.
|
||||
|
Total other income
|
132,730
|
|
119,440
|
|
99,424
|
|
|||||
|
Salaries and benefits
|
62,329
|
|
55,523
|
|
48,453
|
|
In addition to the acquisition of RenWeb referred to above, the remaining increase was due to additional personnel to support the increase in payment plans and school information system customers and continued system maintenance and enhancements.
|
||||
|
Depreciation and amortization
|
10,595
|
|
8,992
|
|
8,169
|
|
Amortization of intangible assets for 2016, 2015, and 2014 was $9.2 million, $8.9 million, and $6.5 million, respectively. As a result of the acquisition of RenWeb, the Company recorded $37.2 million of intangible assets.
|
||||
|
Other expenses
|
18,486
|
|
15,161
|
|
13,006
|
|
In addition to the acquisition of RenWeb referred to above, the remaining increase was due to additional expenses to support the increase in payment plans and school information system customers and continued system maintenance and enhancements.
|
||||
|
Intersegment expenses, net
|
6,615
|
|
8,617
|
|
4,769
|
|
Intersegment expenses represent costs for certain corporate activities and services that are allocated to each operating segment based on estimated use of such activities and services.
|
||||
|
Total operating expenses
|
98,025
|
|
88,293
|
|
74,397
|
|
|||||
|
Income before income taxes
|
34,714
|
|
31,150
|
|
25,033
|
|
|||||
|
Income tax expense
|
(13,191
|
)
|
(11,838
|
)
|
(9,513
|
)
|
|||||
|
Net income
|
$
|
21,523
|
|
19,312
|
|
15,520
|
|
||||
|
Before tax operating margin
|
26.2
|
%
|
26.1
|
%
|
25.2
|
%
|
|||||
46
COMMUNICATIONS OPERATING SEGMENT - RESULTS OF OPERATIONS
The acquisition of privately held Allo was completed on December 31, 2015. The fair value of Allo's assets acquired and liabilities assumed are included in the Company's consolidated balance sheet as of December 31, 2015. However, no operating results of Allo are included in the consolidated income statement of the Company for the year ended December 31, 2015. See note 7 of the notes to consolidated financial statements included in this report for additional information related to the acquisition of Allo.
Summary of Operating Results - Year ended December 31, 2016
During 2016, Allo began providing services in Lincoln, Nebraska, as part of a multi-year project to pass substantially all commercial and residential properties in the community. Due to the substantial increase of activity within this segment throughout 2016 as a result of the Lincoln network build-out, the Company has provided the 2016 quarterly results for the Communications segment below.
|
Three months ended
|
Year ended
|
||||||||||||||||
|
|
March 31, 2016
|
June 30, 2016
|
September 30, 2016
|
December 31, 2016
|
December 31, 2016
|
Additional information
|
|||||||||||
|
Net interest expense
|
$
|
(147
|
)
|
(205
|
)
|
(318
|
)
|
(600
|
)
|
(1,270
|
)
|
Allo has a line of credit with Nelnet, Inc. (parent company). The interest expense incurred by Allo and related interest income earned by Nelnet, Inc. is eliminated for the Company's consolidated financial statements. The outstanding balance on this line of credit as of December 31, 2015 and 2016 was $13.9 million and $58.0 million, respectively.
|
|||||
|
Communications revenue
|
4,346
|
|
4,478
|
|
4,343
|
|
4,492
|
|
17,659
|
|
Communications revenue is derived primarily from the sale of pure fiber optic services to residential and business customers in Nebraska, including internet, television, and telephone services.
|
||||||
|
Salaries and benefits
|
1,089
|
|
1,377
|
|
2,325
|
|
2,857
|
|
7,649
|
|
At December 31, 2015 and December 31, 2016, Allo had 97 and 318 employees, respectively, including part-time employees. Allo also uses temporary employees in the normal course of business. Certain costs qualify for capitalization as Allo builds its network.
|
||||||
|
Depreciation and amortization
|
1,129
|
|
1,378
|
|
1,630
|
|
1,923
|
|
6,060
|
|
Depreciation reflects the allocation of the costs of Allo's property and equipment over the period in which such assets are used. The gross property and equipment balances related to this segment as of December 31, 2015 and 2016 were $34.4 million and $71.3 million, respectively. Amortization reflects the allocation of costs related to intangible assets recorded at fair value as of the date the Company acquired Allo over their estimated useful lives.
|
||||||
|
Cost to provide communications services
|
1,703
|
|
1,681
|
|
1,784
|
|
1,697
|
|
6,866
|
|
Cost of services is primarily composed of television programming costs.
|
||||||
|
Other expenses
|
753
|
|
813
|
|
1,545
|
|
1,260
|
|
4,370
|
|
Other operating expenses include selling, general, and administrative expenses necessary for operations, such as advertising, occupancy, professional services, construction materials, personal property taxes, and provision for losses on accounts receivable.
|
||||||
|
Intersegment expenses, net
|
144
|
|
187
|
|
279
|
|
347
|
|
958
|
|
Intersegment expenses represent costs for certain corporate activities and services that are allocated to each operating segment based on estimated use of such activities and services.
|
||||||
|
Total operating expenses
|
4,818
|
|
5,436
|
|
7,563
|
|
8,084
|
|
25,903
|
|
|||||||
|
Loss before income taxes
|
(619
|
)
|
(1,163
|
)
|
(3,538
|
)
|
(4,192
|
)
|
(9,514
|
)
|
|||||||
|
Income tax benefit
|
235
|
|
442
|
|
1,344
|
|
1,593
|
|
3,615
|
|
|||||||
|
Net loss
|
$
|
(384
|
)
|
(721
|
)
|
(2,194
|
)
|
(2,599
|
)
|
(5,899
|
)
|
||||||
47
|
Additional Information:
|
|||||||||||||||||
|
Net loss
|
$
|
(384
|
)
|
(721
|
)
|
(2,194
|
)
|
(2,599
|
)
|
(5,899
|
)
|
||||||
|
Net interest expense
|
147
|
|
205
|
|
318
|
|
600
|
|
1,270
|
|
|||||||
|
Income tax benefit
|
(235
|
)
|
(442
|
)
|
(1,344
|
)
|
(1,593
|
)
|
(3,615
|
)
|
|||||||
|
Depreciation and amortization
|
1,129
|
|
1,378
|
|
1,630
|
|
1,923
|
|
6,060
|
|
|||||||
|
Earnings (loss) before interest, income taxes, depreciation, and amortization (EBITDA)
|
$
|
657
|
|
420
|
|
(1,590
|
)
|
(1,669
|
)
|
(2,184
|
)
|
For additional information regarding this non-GAAP measure, see the table immediately below.
|
|||||
Certain financial and operating data for Allo is summarized in the tables below.
|
Year ended December 31,
|
||||||||||||
|
2016
|
2015 (a)
|
2014 (a)
|
2013 (a)
|
|||||||||
|
Residential revenue
|
$
|
10,480
|
|
8,665
|
|
6,155
|
|
3,988
|
|
|||
|
Business revenue
|
6,362
|
|
6,940
|
|
6,163
|
|
5,541
|
|
||||
|
Other revenue
|
817
|
|
—
|
|
—
|
|
—
|
|
||||
|
Total revenue
|
$
|
17,659
|
|
15,605
|
|
12,318
|
|
9,529
|
|
|||
|
Net (loss) income
|
$
|
(5,899
|
)
|
600
|
|
(499
|
)
|
(1,034
|
)
|
|||
|
EBITDA (b)
|
(2,184
|
)
|
4,274
|
|
3,000
|
|
1,715
|
|
||||
|
Capital expenditures
|
38,817
|
|
6,678
|
|
4,522
|
|
6,775
|
|
||||
|
Revenue contribution:
|
||||||||||||
|
Internet
|
38.8
|
%
|
36.1
|
%
|
33.3
|
%
|
31.8
|
%
|
||||
|
Telephone
|
26.5
|
|
29.9
|
|
34.9
|
|
42.1
|
|
||||
|
Television
|
32.1
|
|
32.6
|
|
29.4
|
|
24.7
|
|
||||
|
Other
|
2.6
|
|
1.4
|
|
2.4
|
|
1.4
|
|
||||
|
100.0
|
%
|
100.0
|
%
|
100.0
|
%
|
100.0
|
%
|
|||||
|
Residential customer information:
|
||||||||||||
|
Households served
|
9,814
|
|
7,600
|
|
5,794
|
|
3,905
|
|
||||
|
Households passed (c)
|
30,962
|
|
21,274
|
|
16,433
|
|
16,054
|
|
||||
|
Total households in current markets
|
137,500
|
|
28,874
|
|
19,592
|
|
19,592
|
|
||||
|
Total households in current markets and new markets announced (d)
|
137,500
|
|
137,500
|
|
23,389
|
|
19,592
|
|
||||
|
(a)
|
Represents unaudited historical financial and operating data of Allo prior to the Company's acquisition.
|
|
(b)
|
Earnings (loss) before interest, income taxes, depreciation, and amortization ("EBITDA") is a supplemental non-GAAP performance measure that is frequently used in capital-intensive industries such as telecommunications. Allo's management uses EBITDA to compare Allo's performance to that of its competitors and to eliminate certain non-cash and non-operating items in order to consistently measure performance from period to period. EBITDA excludes interest and income taxes because these items are associated with a company's particular capitalization and tax structures. EBITDA also excludes depreciation and amortization expense because these non-cash expenses primarily reflect the impact of historical capital investments, as opposed to the cash impacts of capital expenditures made in recent periods, which may be evaluated through cash flow measures. The Company reports EBITDA for Allo because the Company believes that it provides useful additional information for investors regarding a key metric used by management to assess Allo's performance. There are limitations to using EBITDA as a performance measure, including the difficulty associated with comparing companies that use similar performance measures whose calculations may differ from Allo's calculations. In addition, EBITDA should not be considered a substitute for other measures of financial performance, such as net income or any other performance measures derived in accordance with GAAP. A reconciliation of EBITDA from net income
|
48
(loss) under GAAP for 2016 is presented in the table, "Summary of Operating Results - Year Ended December 31, 2016," above, and for the years 2015, 2014, and 2013 is presented in the table immediately below.
|
Year ended December 31,
|
|||||||||||
|
2015
|
2014
|
2013
|
|||||||||
|
Net income (loss)
|
$
|
600
|
|
(499
|
)
|
(1,034
|
)
|
||||
|
Net interest expense
|
623
|
|
614
|
|
555
|
|
|||||
|
Income taxes
|
—
|
|
—
|
|
—
|
|
|||||
|
Depreciation and amortization
|
3,051
|
|
2,885
|
|
2,194
|
|
|||||
|
Earnings before interest, income taxes, depreciation, and amortization (EBITDA)
|
$
|
4,274
|
|
3,000
|
|
1,715
|
|
||||
|
(c)
|
Represents the estimated number of single residence homes, apartments, and condominiums that Allo already serves and those in which Allo has the capacity to connect to its network distribution system without further material extensions to the transmission lines, but have not been connected.
|
|
(d)
|
In November 2015, Allo announced plans to expand its network to make services available to substantially all commercial and residential premises in Lincoln, Nebraska, and currently plans to expand to additional communities in Nebraska and surrounding states over the next several years.
|
49
ASSET GENERATION AND MANAGEMENT OPERATING SEGMENT – RESULTS OF OPERATIONS
Student Loan Portfolio
As of
December 31, 2016
, the Company had a
$24.9 billion
student loan portfolio that will amortize over the next approximately 25 years. For a summary of the Company's student loan portfolio as of
December 31, 2016
and
2015
, see note 3 of the notes to consolidated financial statements included in this report.
Loan Activity
The following table sets forth the activity of loans:
|
|
Year ended December 31,
|
||||||||
|
|
2016
|
2015
|
2014
|
||||||
|
Beginning balance
|
$
|
28,555,749
|
|
28,223,908
|
|
26,121,306
|
|
||
|
Loan acquisitions
|
356,110
|
|
4,036,333
|
|
6,099,249
|
|
|||
|
Repayments, claims, capitalized interest, and other
|
(2,520,835
|
)
|
(2,466,378
|
)
|
(2,745,341
|
)
|
|||
|
Consolidation loans lost to external parties
|
(1,242,621
|
)
|
(1,234,118
|
)
|
(990,960
|
)
|
|||
|
Loans sold
|
(44,760
|
)
|
(3,996
|
)
|
(260,346
|
)
|
|||
|
Ending balance
|
$
|
25,103,643
|
|
28,555,749
|
|
28,223,908
|
|
||
Allowance for Loan Losses and Loan Delinquencies
The Company maintains an allowance appropriate to absorb losses, net of recoveries, inherent in the portfolio of student loans, which results in periodic expense provisions for loan losses. Delinquencies have the potential to adversely impact the Company’s earnings through increased servicing and collection costs and account charge-offs.
For a summary of the activity in the allowance for loan losses for
2016
,
2015
, and
2014
, and a summary of the Company's student loan delinquency amounts as of
December 31, 2016
,
2015
, and
2014
, see note 3 of the notes to consolidated financial statements included in this report.
Provision for loan losses for federally insured loans was $14.0 million in 2016 compared to $8.0 million in 2015. During the third quarter of 2016, the Company determined an additional allowance was necessary related to a $1.2 billion (principal balance as of September 30, 2016) portfolio of federally insured rehabilitated loans that were purchased in 2012 and 2013 and recognized $5.0 million (pre-tax) in provision expense related to these loans. For loans purchased where there is evidence of credit deterioration since the origination of the loan, the Company records a credit discount, separate from the allowance for loan losses, which is non-accretable to interest income. Remaining discounts and premiums for purchased loans are recognized in interest income over the remaining estimated lives of the loans. The Company continues to evaluate credit losses associated with purchased loans based on current information and changes in expectations to determine the need for any additional allowance for loan losses. As of the date of acquisition of the $1.2 billion federally insured rehabilitated loan portfolio, which had a balance of $2.9 billion as of the date of acquisition, the Company recognized a non-accretable credit discount of $33.2 million and an accretable discount of $37.1 million.
The Company's provision for loan losses for private education loans decreased during 2016 compared to 2015 as a result of the Company purchasing more private education loans in 2015 as compared to 2016.
The Company currently expects the credit performance of its overall student loan portfolio to improve as loans continue to season with the length of time they are in active repayment.
50
Student Loan Spread Analysis
The following table analyzes the student loan spread on the Company’s portfolio of student loans, which represents the spread between the yield earned on student loan assets and the costs of the liabilities and derivative instruments used to fund the assets.
|
|
Year ended December 31,
|
||||||||
|
2016
|
2015
|
2014
|
|||||||
|
Variable student loan yield, gross
|
2.90
|
%
|
2.59
|
%
|
2.55
|
%
|
|||
|
Consolidation rebate fees
|
(0.83
|
)
|
(0.83
|
)
|
(0.82
|
)
|
|||
|
Discount accretion, net of premium and deferred origination costs amortization (a)
|
0.06
|
|
0.05
|
|
0.05
|
|
|||
|
Variable student loan yield, net
|
2.13
|
|
1.81
|
|
1.78
|
|
|||
|
Student loan cost of funds - interest expense (b)
|
(1.41
|
)
|
(1.02
|
)
|
(0.95
|
)
|
|||
|
Student loan cost of funds - derivative settlements
|
(0.01
|
)
|
—
|
|
0.01
|
|
|||
|
Variable student loan spread
|
0.71
|
|
0.79
|
|
0.84
|
|
|||
|
Fixed rate floor income, net of settlements on derivatives
|
0.57
|
|
0.64
|
|
0.64
|
|
|||
|
Core student loan spread
|
1.28
|
%
|
1.43
|
%
|
1.48
|
%
|
|||
|
Average balance of student loans
|
$
|
26,863,526
|
|
28,647,108
|
|
28,036,577
|
|
||
|
Average balance of debt outstanding
|
26,729,196
|
|
28,687,086
|
|
28,116,989
|
|
|||
(a) In the third quarter of 2016, the Company revised its policy to correct for an error in its method of applying the interest method used to amortize premiums and accrete discounts on its student loan portfolio. Under the Company's revised policy, as of September 30, 2016, the constant prepayment rate used by the Company to amortize/accrete student loan premiums/discounts was decreased. During the third quarter of 2016, the Company recorded an adjustment to reflect the net impact on prior periods for the correction of this error that resulted in an $8.2 million reduction to the Company's net loan discount balance and a corresponding increase in interest income. The impact of this adjustment was excluded from the above table.
(b) In the fourth quarter of 2016, the Company redeemed certain debt securities prior to their legal maturity and recognized $7.4 million in interest expense to write off the remaining debt discount associated with these bonds. The impact of this expense was excluded from the above table.
51
A trend analysis of the Company's core and variable student loan spreads is summarized below.

(a) The interest earned on a large portion of the Company's FFELP student loan assets is indexed to the one-month LIBOR rate. The Company funds the majority of its assets with three-month LIBOR indexed floating rate securities. The relationship between the indices in which the Company earns interest on its loans and funds such loans has a significant impact on student loan spread. This table (the right axis) shows the difference between the Company's liability base rate and the one-month LIBOR rate by quarter. See Item 7A, “Quantitative and Qualitative Disclosures About Market Risk - Interest Rate Risk,” which provides additional detail on the Company’s FFELP student loan assets and related funding for those assets.
Variable student loan spread decreased in 2016 compared to 2015 due to a widening in the basis between the asset and debt indices in which the Company earns interest on its loans and funds such loans (as reflec
ted in the table above), and decreased in 2015 as compared to 2014 as a result of earning a lower yield on the student loans included in securitizations of which residual interests were acquired relative to the yield earned on the rest of the student loan portfolio.
The primary difference between variable student loan spread and core student loan spread is fixed rate floor income. A summary of fixed rate floor income and its contribution to core student loan spread follows:
|
|
Year ended December 31,
|
||||||||
|
2016
|
2015
|
2014
|
|||||||
|
Fixed rate floor income, gross
|
$
|
169,979
|
|
207,787
|
|
204,250
|
|
||
|
Derivative settlements (a)
|
(17,643
|
)
|
(23,041
|
)
|
(24,380
|
)
|
|||
|
Fixed rate floor income, net
|
$
|
152,336
|
|
184,746
|
|
179,870
|
|
||
|
Fixed rate floor income contribution to spread, net
|
0.57
|
%
|
0.64
|
%
|
0.64
|
%
|
|||
|
(a)
|
Includes settlement payments on derivatives used to hedge student loans earning fixed rate floor income.
|
The high levels of fixed rate floor income earned during
2016
,
2015
, and
2014
were due to historically low interest rates. If interest rates remain low, the Company anticipates continuing to earn significant fixed rate floor income in future periods. The decrease in fixed rate floor income in 2016 compared to 2015 was due to an increase in interest rates. See Item 7A, “Quantitative and Qualitative Disclosures about Market Risk - Interest Rate Risk,” which provides additional detail on the Company’s portfolio earning fixed rate floor income and the derivatives used by the Company to hedge these loans.
52
Summary and Comparison of Operating Results
|
|
Year ended December 31,
|
||||||||||
|
|
2016
|
2015
|
2014
|
Additional information
|
|||||||
|
Net interest income after provision for loan losses
|
$
|
355,375
|
|
420,424
|
|
424,140
|
|
See table below for additional analysis.
|
|||
|
Other income
|
15,709
|
|
15,939
|
|
21,532
|
|
The primary component of other income is borrower late fees, which were $12.8 million, $14.7 million, and $14.8 million in 2016, 2015, and 2014, respectively. In 2014, $4.2 million in income was recognized related to the modification of certain servicing agreements in which the Company's loan repurchase obligation was reduced.
|
||||
|
Gain (loss) on sale of loans and debt repurchases, net
|
5,846
|
|
2,034
|
|
(1,357
|
)
|
Gains were primarily from the Company repurchasing its own asset-backed debt securities. In 2014, the Company recognized a loss from the sale of loans, which was partially offset by gains from debt repurchases.
|
||||
|
Derivative market value and foreign currency adjustments, net
|
70,368
|
|
27,216
|
|
42,936
|
|
Includes (i) the unrealized gains and losses that are caused by changes in fair values of derivatives which do not qualify for "hedge treatment" under GAAP; and (ii) the foreign currency transaction gains or losses caused by the re-measurement of the Company's Euro-denominated bonds to U.S. dollars.
|
||||
|
Derivative settlements, net
|
(21,034
|
)
|
(23,238
|
)
|
(20,818
|
)
|
The Company maintains an overall risk management strategy that incorporates the use of derivative instruments to reduce the economic effect of interest rate volatility. Derivative settlements for each applicable period should be evaluated with the Company’s net interest income as reflected in the table below.
|
||||
|
Total other income
|
70,889
|
|
21,951
|
|
42,293
|
|
|||||
|
Salaries and benefits
|
1,985
|
|
2,172
|
|
2,316
|
|
|||||
|
Loan servicing fees
|
25,750
|
|
30,213
|
|
27,009
|
|
Third-party servicing fees decreased in 2016 due to a declining loan portfolio. Additionally, the Company pays higher third-party servicing fees on delinquent loans, and the Company's third-party serviced loan portfolio had fewer delinquent loans in 2016 compared to 2015 and thus, third-party fees decreased. The increase in 2015 compared to 2014 was due to purchases of a significant amount of loans serviced at third parties.
|
||||
|
Other expenses
|
6,005
|
|
5,083
|
|
6,602
|
|
|||||
|
Intersegment expenses, net
|
46,494
|
|
50,899
|
|
56,325
|
|
Amount includes fees paid to the LSS operating segment for the servicing of the Company's student loan portfolio. Decrease due to the run off of the portfolio serviced by LSS. In addition, intersegment expenses represent costs for certain corporate activities and services that are allocated to each operating segment based on estimated use of such activities and services.
|
||||
|
Total operating expenses
|
80,234
|
|
88,367
|
|
92,252
|
|
|||||
|
Income before income taxes
|
346,030
|
|
354,008
|
|
374,181
|
|
|||||
|
Income tax expense
|
(131,492
|
)
|
(134,522
|
)
|
(142,189
|
)
|
|||||
|
Net income
|
$
|
214,538
|
|
219,486
|
|
231,992
|
|
||||
|
Additional information:
|
|||||||||||
|
Net income
|
$
|
214,538
|
|
219,486
|
|
231,992
|
|
See "Overview - GAAP Net Income and Non-GAAP Net Income, Excluding Adjustments" above for additional information about non-GAAP net income, excluding derivative market value and foreign currency adjustments. Net income, excluding derivative market value and foreign currency adjustments, decreased in 2016 as compared to 2015 due to a decrease in the Company's student loan portfolio and a decrease in variable student loan spread and fixed rate floor income.
|
|||
|
Derivative market value and foreign currency adjustments, net
|
(70,368
|
)
|
(27,216
|
)
|
(42,936
|
)
|
|||||
|
Tax effect
|
26,740
|
|
10,342
|
|
16,316
|
|
|||||
|
Net income, excluding derivative market value and foreign currency adjustments
|
$
|
170,910
|
|
202,612
|
|
205,372
|
|
||||
53
The following table summarizes the components of "net interest income after provision for loan losses" and "derivative settlements, net."
|
|
Year ended December 31,
|
||||||||||
|
|
2016
|
2015
|
2014
|
Additional Information
|
|||||||
|
Variable interest income, net of settlements on derivatives
|
$
|
776,922
|
|
740,778
|
|
718,274
|
|
Increase in 2016 compared to 2015 due to an increase in the gross yield earned on student loans, net of settlements on derivatives, partially offset by a decrease in the average balance of student loans. Increase in 2015 compared to 2014 due to an increase in gross yield earned on student loans and an increase in the average balance of student loans.
|
|||
|
Consolidation rebate fees
|
(223,911
|
)
|
(237,233
|
)
|
(230,956
|
)
|
Decrease in 2016 compared to 2015 due to a decrease in the average consolidation loan balance. Increase in 2015 compared to 2014 due to an increase in the average consolidation loan balance.
|
||||
|
Discount accretion, net of premium and deferred origination costs amortization
|
24,900
|
|
14,731
|
|
15,002
|
|
Net discount accretion is due to the Company's purchases of loans at a net discount over the last several years. In the third quarter of 2016, the Company revised its policy to correct for an error in its method of applying the interest method used to amortize premiums and accrete discounts on its student loan portfolio. Under the Company's revised policy, as of September 30, 2016, the constant prepayment rate used by the Company to amortize/accrete student loan premiums/discounts was decreased. During the third quarter of 2016, the Company recorded an adjustment to reflect the net impact on prior periods for the correction of this error that resulted in an $8.2 million reduction to the Company's net loan discount balance and a corresponding increase in discount accretion (interest income).
|
||||
|
Interest on bonds and notes payable
|
(382,088
|
)
|
(295,797
|
)
|
(267,506
|
)
|
Increase in 2016 compared to 2015 due to an increase in cost of funds. In addition, during 2016, the Company redeemed certain debt securities prior to their legal maturity and recognized interest expense to write off the remaining debt discount associated with these bonds. These increases were partially offset by a decrease in the average balance of debt outstanding. Increase in 2015 compared to 2014 due to an increase in cost of funds and an increase in the average balance of debt outstanding.
|
||||
|
Variable student loan interest margin, net of settlements on derivatives
|
195,823
|
|
222,479
|
|
234,814
|
|
|||||
|
Fixed rate floor income, net of settlements on derivatives
|
152,336
|
|
184,746
|
|
179,870
|
|
The high levels of fixed rate floor income earned are due to historically low interest rates. Fixed rate floor income decreased in 2016 compared to 2015 due to the rising interest rate environment.
|
||||
|
Investment interest
|
3,507
|
|
1,939
|
|
374
|
|
|||||
|
Intercompany interest
|
(3,825
|
)
|
(1,828
|
)
|
(2,236
|
)
|
|||||
|
Provision for loan losses - federally insured loans
|
(14,000
|
)
|
(8,000
|
)
|
(11,000
|
)
|
See "Allowance for Loan Losses and Loan Delinquencies" included above under "Asset Generation and Management Operating Segment - Results of Operations."
|
||||
|
Recovery of (provision for) loan losses - private education loans
|
500
|
|
(2,150
|
)
|
1,500
|
|
|||||
|
Net interest income after provision for loan losses (net of settlements on derivatives)
|
$
|
334,341
|
|
397,186
|
|
403,322
|
|
||||
54
LIQUIDITY AND CAPITAL RESOURCES
The Company’s Loan Systems and Servicing and Tuition Payment Processing and Campus Commerce operating segments are non-capital intensive and both produce positive operating cash flows. As such, a minimal amount of debt and equity capital is allocated to these segments and any liquidity or capital needs are satisfied using cash flow from operations. Therefore, the Liquidity and Capital Resources discussion is concentrated on the Company’s liquidity and capital needs to meet existing debt obligations in the Asset Generation and Management operating segment and capital needs to expand Allo's communications network in the Company's Communications operating segment.
The Company may issue equity and debt securities in the future in order to improve capital, increase liquidity, refinance upcoming maturities, or provide for general corporate purposes. Moreover, the Company may from time-to-time repurchase certain amounts of its outstanding secured and unsecured debt securities, including debt securities which the Company may issue in the future, for cash and/or through exchanges for other securities. Such repurchases or exchanges may be made in open market transactions, privately negotiated transactions, or otherwise. Any such repurchases or exchanges will depend on prevailing market conditions, the Company’s liquidity requirements, contractual restrictions, compliance with securities laws, and other factors. The amounts involved in any such transactions may be material.
The Company has historically utilized operating cash flow, secured financing transactions (which include warehouse facilities, asset-backed securitizations, and liquidity programs offered by the Department), operating lines of credit, and other borrowing arrangements to fund its Asset Generation and Management operations and student loan acquisitions. In addition, the Company has used operating cash flow, borrowings on its unsecured line of credit, and unsecured debt offerings to fund corporate activities, business acquisitions, repurchases of common stock, repurchases of its own debt, and expansion of Allo's fiber network. The Company has also used its common stock to partially fund certain business acquisitions.
Sources of Liquidity
The Company has historically generated positive cash flow from operations. For the years ended December 31, 2016 and 2015, the Company's net cash provided by operating activities was
$325.3 million
and $391.4 million, respectively.
As of
December 31, 2016
, the Company had cash and cash equivalents of
$69.7 million
. The Company also had a portfolio of available-for-sale and trading investments, consisting primarily of student loan asset-backed securities, with a fair value of
$106.6 million
as of
December 31, 2016
.
The Company also has a
$350.0 million
unsecured line of credit that matures on December 12, 2021.
As of December 31, 2016
, no amounts were outstanding on the unsecured line of credit and
$350.0 million
was available for future use.
In addition, the Company has repurchased certain of its own asset-backed securities (bonds and notes payable) in the secondary market. For accounting purposes, these notes are effectively retired and are not included on the Company’s consolidated balance sheet. However, these securities are legally outstanding at the trust level and the Company could sell these notes to third parties or redeem the notes at par as cash is generated by the trust estate. Upon a sale of these notes to third parties, the Company would obtain cash proceeds equal to the market value of the notes on the date of such sale. As of
December 31, 2016
, the Company holds $73.8 million (par value) of its own asset-backed securities that are not included in the consolidated financial statements.
The Company intends to use its liquidity position to capitalize on market opportunities, including FFELP and private education loan acquisitions; strategic acquisitions and investments; expansion of Allo's telecommunications network; and capital management initiatives, including stock repurchases, debt repurchases, and dividend distributions. The timing and size of these opportunities will vary and will have a direct impact on the Company's cash and investment balances.
55
Cash Flows
During the year ended
December 31, 2016
, the Company generated
$325.3 million
from operating activities, compared to
$391.4 million
for the same period in
2015
. The decrease in cash provided by operating activities reflects a decrease in net income, changes in the adjustments to net income for derivative market value adjustments and a decrease in proceeds from terminating certain derivative instrument contracts in 2016 as compared to 2015. These factors were partially offset by changes in non-cash adjustments for foreign currency transaction adjustments and increases in deferred income tax expense, accrued interest payable, and other liabilities in 2016 as compared to 2015. Accrued interest on loans purchased is included in cash flows from operating activities in the respective period of the purchase. Net purchased accrued interest was $71.4 million in 2015. Net purchased accrued interest for 2016 was not significant.
The primary items included in the statement of cash flows for investing activities are the purchase and repayment of student loans. The primary items included in financing activities are the proceeds from the issuance of and payments on bonds and notes payable used to fund student loans. Cash provided by investing activities and cash used in financing activities for the year ended
December 31, 2016
was
$3.3 billion
and
$3.6 billion
, respectively, and for the year ended
December 31, 2015
was
$1.4 billion
and
$1.9 billion
, respectively. Investing and financing activities are further addressed in the discussion that follows.
Liquidity Needs and Sources of Liquidity Available to Satisfy Debt Obligations Secured by Student Loan Assets and Related Collateral
The following table shows the Company's debt obligations outstanding that are secured by student loan assets and related collateral:
|
|
As of December 31, 2016
|
||||
|
Carrying
amount
|
Final maturity
|
||||
|
Bonds and notes issued in asset-backed securitizations
|
$
|
23,354,438
|
|
6/25/21 - 9/25/65
|
|
|
FFELP warehouse facilities
|
1,677,443
|
|
9/7/18 - 12/13/19
|
||
|
|
$
|
25,031,881
|
|
||
Bonds and Notes Issued in Asset-backed Securitizations
The majority of the Company’s portfolio of student loans is funded in asset-backed securitizations that are structured to substantially match the maturity of the funded assets, thereby minimizing liquidity risk. In addition, due to (i) the difference between the yield the Company receives on the loans and cost of financing within these transactions, and (ii) the servicing and administration fees the Company earns from these transactions, the Company has created a portfolio that will generate earnings and significant cash flow over the life of these transactions.
As of
December 31, 2016
, based on cash flow models developed to reflect management’s current estimate of, among other factors, prepayments, defaults, deferment, forbearance, and interest rates, the Company currently expects future undiscounted cash flows from its portfolio to be approximately
$2.07 billion
as detailed below. The
$2.07 billion
includes approximately
$774.7 million
(as of
December 31, 2016
) of overcollateralization included in the asset-backed securitizations. These excess net asset positions are reflected variously in the following balances on the consolidated balance sheet: "student loans receivable," "restricted cash," and "accrued interest receivable."
56
The forecasted cash flow presented below includes all loans funded in asset-backed securitizations as of
December 31, 2016
. As of
December 31, 2016
, the Company had
$23.3 billion
of loans included in asset-backed securitizations, which represented 93.0 percent of its total FFELP and private education student loan portfolio. The forecasted cash flow does not include cash flows that the Company expects to receive related to loans funded in its warehouse facilities as of
December 31, 2016
, private education loans funded with cash on the balance sheet, or loans acquired subsequent to
December 31, 2016
.

The Company uses various assumptions, including prepayments and future interest rates, when preparing its cash flow forecast. These assumptions are further discussed below.
Prepayments
: The primary variable in establishing a life of loan estimate is the level and timing of prepayments. Prepayment rates equal the amount of loans that prepay annually as a percentage of the beginning of period balance, net of scheduled principal payments. A number of factors can affect estimated prepayment rates, including the level of consolidation activity, borrower default rates, and utilization of FFEL Program debt management options such as income-based repayment, deferments, and forbearance. Should any of these factors change, management may revise its assumptions, which in turn would impact the projected future cash flow. The Company’s cash flow forecast above assumes prepayment rates that are generally consistent with those utilized in the Company’s recent asset-backed securitization transactions. If management used a prepayment rate assumption two times greater than what was used to forecast the cash flow, the cash flow forecast would be reduced by approximately
$190 million
to
$250 million
.
Interest rates
: The Company funds the majority of its student loans with three-month LIBOR indexed floating rate securities. Meanwhile, the interest earned on the Company’s student loan assets is indexed primarily to a one-month LIBOR rate. The different interest rate characteristics of the Company’s loan assets and liabilities funding these assets result in basis risk. The Company’s cash flow forecast assumes three-month LIBOR will exceed one-month LIBOR by 12 basis points for the life of the portfolio, which approximates the historical relationship between these indices. If the forecast is computed assuming a spread of 24 basis points between three-month and one-month LIBOR for the life of the portfolio, the cash flow forecast would be reduced by approximately
$90 million
to
$130 million
.
The Company uses the current forward interest rate yield curve to forecast cash flows. A change in the forward interest rate curve would impact the future cash flows generated from the portfolio. An increase in future interest rates will reduce the amount of fixed rate floor income the Company is currently receiving. The Company attempts to mitigate the impact of a rise in short-term rates by hedging interest rate risks. As of
December 31, 2016
, the net fair value of the Company’s interest rate derivatives used to hedge loans earning fixed rate floor income was a net
asset
of
$80.9 million
. See Item 7A, "Quantitative and Qualitative Disclosures about Market Risk — Interest Rate Risk."
57
FFELP Warehouse Facilities
The Company funds a portion of its FFELP loan acquisitions using its FFELP warehouse facilities. Student loan warehousing allows the Company to buy and manage student loans prior to transferring them into more permanent financing arrangements. As of
December 31, 2016
, the Company had three FFELP warehouse facilities with an aggregate maximum financing amount available of $
2.1 billion
, of which $
1.7 billion
was outstanding and $
447.6 million
was available for additional funding. Of the three facilities, one facility provides for formula-based advance rates, depending on FFELP loan type, up to a maximum of the principal and interest of loans financed. The advance rates for collateral may increase or decrease based on market conditions. The other two FFELP warehouse facilities have static advance rates that require initial equity for loan funding, but do not require increased equity based on market movements. As of
December 31, 2016
, the Company had $
83.8 million
advanced as equity support on these facilities. For further discussion of the Company's FFELP warehouse facilities outstanding at
December 31, 2016
, see note 4 of the notes to consolidated financial statements included in this report.
Upon termination or expiration of the warehouse facilities, the Company would expect to access the securitization market, obtain replacement warehouse facilities, use operating cash, consider the sale of assets, or transfer collateral to satisfy any remaining obligations.
Other Uses of Liquidity
Effective July 1, 2010, no new loan originations can be made under the FFEL Program and all new federal loan originations must be made through the Federal Direct Loan Program. As a result, the Company no longer originates new FFELP loans, but continues to acquire FFELP loan portfolios from third parties and believes additional loan purchase opportunities exist.
The Company plans to fund additional FFELP student loan acquisitions using current cash and investments; using its Union Bank participation agreement (as described below); using its FFELP warehouse facilities (as described above); and continuing to access the asset-backed securities market.
Union Bank Participation Agreement
The Company maintains an agreement with Union Bank, as trustee for various grantor trusts, under which Union Bank has agreed to purchase from the Company participation interests in student loans. As of
December 31, 2016
,
$496.8 million
of loans were subject to outstanding participation interests held by Union Bank, as trustee, under this agreement. The agreement automatically renews annually and is terminable by either party upon five business days' notice. This agreement provides beneficiaries of Union Bank’s grantor trusts with access to investments in interests in student loans, while providing liquidity to the Company. The Company can participate loans to Union Bank to the extent of availability under the grantor trusts, up to
$750 million
or an amount in excess of
$750 million
if mutually agreed to by both parties. Loans participated under this agreement have been accounted for by the Company as loan sales. Accordingly, the participation interests sold are not included on the Company’s consolidated balance sheets.
Asset-backed Securities Transactions
The Company, through its subsidiaries, has historically funded student loans by completing asset-backed securitizations. Beginning in 2015, Fitch Ratings and Moody’s Investors Service placed numerous tranches of FFELP securitizations by various issuers, including certain tranches of prior FFELP securitizations issued by subsidiaries of the Company, on review for potential downgrade due to principal payments and prepayments on the underlying student loans coming in slower than initial expectations, and the resulting risk that certain principal maturities on those FFELP securitizations may not be met by the final maturity dates, which could result in an event of default under the underlying securitization agreements. Such rating actions have caused the spreads on FFELP securitizations in general to widen and have reduced the liquidity in the secondary market for FFELP securitizations.
In July 2016, Fitch published revised criteria for its ratings of FFELP securitizations, and in August 2016, Moody’s published an updated methodology for its ratings of FFELP securitizations. In September and October 2016, Fitch downgraded, under its revised criteria, its rating of one tranche from a prior Company-sponsored securitization, and Moody’s downgraded, under its updated methodology, its ratings of six tranches from prior Company-sponsored securitizations and four tranches from securitizations acquired by the Company from third parties.
On June 15, 2016, the Company announced the launch of an online investor communication forum to facilitate the amendment of securitizations to extend the legal final maturity dates. During 2016, the Company received investor consent to extend by five
58
years the legal final maturity on 11 securitizations, which represent a total of approximately $6.0 billion in original par value. Depending on future investor consent, the Company may seek to extend the legal final maturity dates on additional securitizations.
The ultimate impact of these developments on the Company’s current and future securitizations is uncertain. Depending on future rating agency actions and market conditions, the Company currently anticipates continuing to access the asset-backed securitization market. Such asset-backed securitization transactions would be used to refinance student loans included in its warehouse facilities, student loans purchased from third parties, and/or student loans in its existing asset-backed securitizations.
On October 12, 2016, the Company completed a FFELP asset-backed securitization totaling $426.0 million (par value). The proceeds from this transaction were used primarily to refinance student loans included in the Company's FFELP warehouse facilities. In addition, on December 21, 2016, the Company completed a private education loan asset-backed securitization totaling $226.0 million (par value). The proceeds from this transaction were used to refinance private education loans included in the Company's private loan warehouse, which was terminated upon completion of this transaction.
Liquidity Impact Related to Hedging Activities
The Company utilizes derivative instruments to manage interest rate sensitivity. By using derivative instruments, the Company is exposed to market risk which could impact its liquidity. Based on the derivative portfolio outstanding as of
December 31, 2016
, the Company does not currently anticipate any movement in interest rates having a material impact on its capital or liquidity profile, nor does the Company expect that any movement in interest rates would have a material impact on its ability to meet potential collateral deposits with its counterparties. However, if interest rates move materially and negatively impact the fair value of the Company's derivative portfolio or if the Company enters into additional derivatives for which the fair value becomes negative, the Company could be required to deposit additional collateral with its derivative instrument counterparties and/or a third-party clearinghouse. The collateral deposits, if significant, could negatively impact the Company's liquidity and capital resources. As of
December 31, 2016
, the fair value of the Company's derivatives subject to collateral deposits with counterparties or a third-party clearinghouse which had a negative fair value (a liability in the Company's balance sheet), was
$10.2 million
. As of December 31, 2016, the Company had $7.8 million of collateral deposited with counterparties or a clearinghouse related to these derivatives.
Liquidity Impact Related to the Communications Operating Segment
Allo has made significant investments in its communications network and currently provides fiber directly to homes and businesses in seven Nebraska communities. In November 2015, Allo announced plans to expand its network to make its services available to substantially all commercial and residential premises in Lincoln, Nebraska, and currently plans to expand to additional communities in Nebraska and surrounding states over the next several years. The Company anticipates total capital expenditures of approximately $80 million in 2017. However, such amounts could change based on customer demand for Allo's services. For the year ended December 31, 2016, the Company's capital expenditures were
$38.8 million
. Allo has a line of credit with Nelnet, Inc. (parent company) that Allo uses for its operating activities and capital expenditures. This note and the related interest expense incurred by Allo and the interest income recognized by Nelnet, Inc. is eliminated in the Company's consolidated financial statements. The Company currently plans to use cash from operating activities and its third-party unsecured line of credit to fund Allo's operating activities and capital expenditures.
As discussed above, the Company has a
$350.0 million
unsecured line of credit with a maturity date of December 12, 2021. As of
December 31, 2016
, the unsecured line of credit had no amounts outstanding and
$350.0 million
was available for future use. Upon the maturity date in 2021 there can be no assurance that the Company will be able to maintain this line of credit, increase the amount outstanding under the line, or find alternative funding if necessary.
The Company has issued Junior Subordinated Hybrid Securities (the "Hybrid Securities") that have a final maturity of September 15, 2061. The Hybrid Securities are unsecured obligations of the Company. As of
December 31, 2016
,
$50.2 million
of Hybrid Securities were outstanding. On January 23, 2017, the Company initiated a cash tender offer to purchase any and all of its outstanding Hybrid Securities, including a related consent solicitation to effect certain amendments to the indenture governing the notes to eliminate a provision requiring a minimum principal amount of the notes to remain outstanding after a partial redemption. The aggregate principal amount of notes tendered to the Company was $29.2 million. The Company paid $24.6 million in February 2017 to redeem these notes, and the amendments described above were made to the indenture. After the completion of this tender offer, the Company has $21.0 million of Hybrid Securities that remain outstanding.
59
The Company also has two notes payable, which were each issued by TDP Phase Three, LLC ("TDP") on December 30, 2015 in connection with the development of a commercial building in Lincoln, Nebraska that is to be the new corporate headquarters for Hudl, a related party. TDP is an entity established during 2015 for the sole purpose of developing and operating this building. The Company owns 25 percent of TDP. However, because the Company plans to be a tenant in this building once the development is complete, the operating results of TDP are included in the Company's consolidated financial statements. As of December 31, 2016, one of the TDP notes has $12.0 million outstanding with a maturity date of March 31, 2023; the other TDP note has $6.4 million outstanding with a maturity date of December 15, 2045. Recourse to the Company on the outstanding balance of these notes is equal to its ownership percentage of TDP.
For further discussion of these debt obligations of the Company, see note 4 of the notes to consolidated financial statements included in this report.
Debt Repurchases
Due to the Company's positive liquidity position and opportunities in the capital markets, the Company has repurchased its own debt over the last several years, and may continue to do so in the future. See note 4 of the notes to consolidated financial statements included in this report for information on debt repurchased by the Company during the years ended December 31, 2016, 2015, and 2014.
Stock Repurchases
The Board of Directors has authorized a stock repurchase program to repurchase up to a total of five million shares of the Company's Class A common stock during the three-year period ending May 25, 2019. Shares may be repurchased from time to time depending on various factors, including share prices and other potential uses of liquidity. Shares repurchased by the Company during
2016
,
2015
, and
2014
are shown in the table below.
|
Total shares repurchased
|
Purchase price (in thousands)
|
Average price of shares repurchased (per share)
|
||||||||
|
Year ended December 31, 2016
|
2,038,368
|
|
$
|
69,091
|
|
$
|
33.90
|
|
||
|
Year ended December 31, 2015
|
2,449,159
|
|
96,169
|
|
39.27
|
|
||||
|
Year ended December 31, 2014
|
381,689
|
|
15,713
|
|
41.17
|
|
||||
As of December 31, 2016, 4,571,094 shares remain authorized for purchase under the Company's repurchase program.
Dividends
Dividends of
$0.12
per share on the Company’s Class A and Class B common stock were paid on
March 15, 2016
,
June 15, 2016
, and
September 15, 2016
, respectively, and a dividend of $0.14 per share was paid on
December 15, 2016
.
The Company's Board of Directors declared a first quarter 2017 cash dividend on the Company's Class A and Class B common stock of $0.14 per share. The dividend will be paid on March 15, 2017, to shareholders of record at the close of business on March 1, 2017.
The Company currently plans to continue making regular quarterly dividend payments, subject to future earnings, capital requirements, financial condition, and other factors. In addition, the payment of dividends is subject to the terms of the Company’s outstanding Hybrid Securities, which generally provide that if the Company defers interest payments on those securities it cannot pay dividends on its capital stock.
Off-Balance Sheet Arrangements
The Company does not have any off-balance sheet arrangements that have or are reasonably likely to have a current or future effect on its financial condition, revenues or expenses, results of operations, liquidity, capital expenditures, or capital resources that are material to investors.
60
Contractual Obligations
The Company’s contractual obligations were as follows:
|
|
As of December 31, 2016
|
||||||||||||||
|
|
Total
|
Less than 1 year
|
1 to 3 years
|
3 to 5 years
|
More than 5 years
|
||||||||||
|
Bonds and notes payable (a)
|
$
|
25,100,420
|
|
—
|
|
1,677,443
|
|
163,267
|
|
23,259,710
|
|
||||
|
Operating lease obligations
|
26,411
|
|
5,316
|
|
9,110
|
|
5,370
|
|
6,615
|
|
|||||
|
Total
|
$
|
25,126,831
|
|
5,316
|
|
1,686,553
|
|
168,637
|
|
23,266,325
|
|
||||
|
(a)
|
Amounts exclude interest as substantially all bonds and notes payable carry variable rates of interest.
|
As of
December 31, 2016
, the Company had a reserve of
$18.2 million
for uncertain income tax positions (including the federal benefit received from state positions). This obligation is not included in the above table as the timing and resolution of the income tax positions cannot be reasonably estimated at this time.
In September 2016, Allo began providing telecommunications services in Lincoln, Nebraska, as part of a commitment under franchise agreements with the city for Allo to use commercially reasonable best efforts to pass substantially all commercial and residential properties in the community within the first four years of the agreements. During 2016, Allo’s capital expenditures were $38.8 million, and Allo anticipates capital expenditures of approximately $80 million in 2017. The majority of these capital expenditures are for the network build-out in Lincoln. The currently anticipated capital expenditures for 2017 and beyond to build out the Lincoln network are not included in the above table, since there are no fixed and/or determinable minimum amounts which Allo must incur, and the amounts and timing thereof could change based on customer demand for Allo’s services.
CRITICAL ACCOUNTING POLICIES AND ESTIMATES
This Management’s Discussion and Analysis of Financial Condition and Results of Operations discusses the Company’s consolidated financial statements, which have been prepared in accordance with accounting principles generally accepted in the United States. The preparation of these financial statements requires management to make estimates and assumptions that affect the reported amounts of assets and liabilities and the reported amounts of income and expenses during the reporting periods. The Company bases its estimates and judgments on historical experience and on various other factors that the Company believes are reasonable under the circumstances. Actual results may differ from these estimates under varying assumptions or conditions. Note 2 of the notes to consolidated financial statements included in this report includes a summary of the significant accounting policies and methods used in the preparation of the consolidated financial statements.
On an on-going basis, management evaluates its estimates and judgments, particularly as they relate to accounting policies that management believes are most "critical" — that is, they are most important to the portrayal of the Company’s financial condition and results of operations and they require management’s most difficult, subjective, or complex judgments, often as a result of the need to make estimates about the effect of matters that are inherently uncertain. Management has identified the following critical accounting policies and estimates that are discussed in more detail below: allowance for loan losses, revenue recognition, consolidation of Variable Interest Entities ("VIEs"), income taxes, and accounting for derivatives.
Allowance for Loan Losses
The allowance for loan losses represents management’s estimate of probable losses on student loans. This evaluation process is subject to numerous estimates and judgments. The Company evaluates the appropriateness of the allowance for loan losses on its federally insured loan portfolio separately from its private education loan portfolio.
The allowance for the federally insured loan portfolio is based on periodic evaluations of the Company’s loan portfolios considering loans in repayment versus those in a nonpaying status, delinquency status, trends in defaults in the portfolio based on Company and industry data, past experience, trends in student loan claims rejected for payment by guarantors, changes to federal student loan programs, current economic conditions, and other relevant factors. Should any of these factors change, the estimates made by management would also change, which in turn would impact the level of the Company’s future provision for loan losses.
In determining the appropriateness of the allowance for loan losses on the private education loans, the Company considers several factors including: loans in repayment versus those in a nonpaying status, delinquency status, type of program, trends in defaults in the portfolio based on Company and industry data, past experience, current economic conditions, and other relevant factors.
61
Should any of these factors change, the estimates made by management would also change, which in turn would impact the level of the Company’s future provision for loan losses. The Company places a private education loan on nonaccrual status when the collection of principal and interest is 90 days past due and charges off the loan and accrued interest when the collection of principal and interest is 120 days past due.
The allowance for federally insured and private education loans and the repurchase obligation related to loans sold are maintained at a level management believes is appropriate to provide for estimated probable credit losses inherent in the loan portfolios. This evaluation is inherently subjective because it requires estimates that may be susceptible to significant changes.
Revenue Recognition
The Company recognizes student loan interest income as earned, net of amortization of loan premiums and deferred origination costs and the accretion of loan discounts. Loan interest income is recognized based upon the expected yield of the loan after giving effect to interest rate reductions resulting from borrower utilization of incentives such as timely payments ("borrower benefits") and other yield adjustments. Loan premiums or discounts, deferred origination costs, and borrower benefits are amortized/accreted over the estimated life of the loans, which includes an estimate of forecasted payments in excess of contractually required payments. The Company periodically evaluates the assumptions used to estimate the life of the loans and prepayment rates. The most sensitive estimate related to the amortization/accretion of loan premiums/discounts, deferred origination costs, and borrower benefits is the estimate of the constant prepayment rate (“CPR”). CPR is a variable in the life of loan estimate that measures the rate at which loans in a portfolio pay before their stated maturity. The CPR is directly correlated to the average life of the portfolio. CPR equals the percentage of loans that prepay annually as a percentage of the beginning of period balance, net of scheduled principal payments. A number of factors can affect the CPR estimate, including the level of loan consolidation activity (an event that causes a loan balance to decline faster than contractually required) and utilization of FFEL Program debt management options such as income-based repayment (an event that causes a loan balance to decline slower than contractually required). Other factors that can affect the Company's CPR estimate include changes in the Company's and its competitors' business strategies, legislative changes, interest rate changes, changes to the current economic and credit environment, and which historic period to start with in arriving at the Company's prepayment assumptions and whether additional adjustments may be needed to those historical periods. Should any of these factors change, the estimates made by management would also change, which in turn would impact the amount of loan premium/discount and deferred origination cost amortization recognized by the Company in a particular period.
In the third quarter of 2016, the Company revised its policy to correct for an error in its method of applying the interest method used to amortize premiums and accrete discounts on its student loan portfolio. Previously, the Company amortized premiums and accreted discounts by including in its prepayment assumption forecasted payments in excess of contractually required payments as well as forecasted defaults. The Company has determined that only payments in excess of contractually required payments should be included in the prepayment assumption. Under the Company's revised policy, as of September 30, 2016, the constant prepayment rate used by the Company to amortize/accrete student loan premiums/discounts was decreased. During the third quarter of 2016, the Company recorded an adjustment to reflect the net impact on prior periods for the correction of this error that resulted in an $8.2 million reduction to the Company's net loan discount balance and a corresponding increase in interest income (a $5.1 million after tax increase to net income). The Company concluded this error had an immaterial impact on 2016 results as well as the results for prior periods.
The Company also earns revenue from its service and product offerings in its fee-based operating segments, including Loan Systems and Servicing, Tuition Payment Processing and Campus Commerce, Communications, and Enrollment Services. The revenue recognition policy for these services and products can be found in note 2 of the notes to consolidated financial statements included in this report.
Fees associated with the majority of the services included in the fee-based operating segments are recognized in the period services are rendered and earned under service arrangements with clients where service fees are fixed or determinable and collectability is reasonably assured. The Company’s service fees are determined based on written price quotations or service agreements having stipulated terms and conditions that do not require management to make any significant judgments or assumptions regarding any potential uncertainties.
The Company assesses collectability of revenues and its allowance for doubtful accounts based on a number of factors, including past transaction history with the customer and the credit-worthiness of the customer. An allowance for doubtful accounts is established to record accounts receivable at estimated net realizable value. If the Company determines that collection of revenues is not reasonably assured at or prior to delivery of the Company’s services, revenue is recognized upon the receipt of cash.
62
Consolidation of VIEs
The Company has determined that its education lending subsidiaries and Allo Communications LLC are VIEs of which the Company is the primary beneficiary. The primary beneficiary is the entity which has both: (1) the power to direct the activities of the VIE that most significantly impact the VIE's economic performance, and (2) the obligation to absorb losses or receive benefits of the entity that could potentially be significant to the VIE. There can be considerable judgment required in determining the primary beneficiary of the VIEs with which the Company is associated, and there are no "bright line" tests. Rather, the assessment of who has the power to direct the activities of the VIE that most significantly affect the VIE's economic performance and who has the obligation to absorb losses or receive benefits of the entity that could potentially be significant to the VIE can be very qualitative and judgmental in nature.
The Company's education lending subsidiaries are engaged in the securitization of education finance assets. These education lending subsidiaries hold beneficial interests in eligible loans, subject to creditors with specific interests. The Company is generally the administrator and master servicer of the securitized assets held in its education lending subsidiaries and owns the residual interest of the securitization trusts. As a result, for accounting purposes, the transfers of student loans to the securitization trusts do not qualify as sales. Accordingly, all the financial activities and related assets and liabilities, including debt, of the securitizations are reflected in the Company's consolidated financial statements and are summarized as supplemental information on the balance sheet.
The Company owns 91.5 percent of Allo Communications LLC, which provides pure fiber optic services to residential and business customers in Nebraska. In addition to the Company's variable interest of an equity investment, Nelnet, Inc. (parent company) issued a line of credit to Allo to fund Allo’s operating activities and capital expenditures. The amounts owed by Allo to Nelnet, Inc., as well as the interest expense incurred by Allo and interest income earned by Nelnet, Inc., are not reflected in the Company’s consolidated financial statements as they are eliminated in consolidation. All of Allo's financial activities and related assets and liabilities, excluding the line of credit, are reflected in the Company’s consolidated financial statements.
Income Taxes
The Company is subject to the income tax laws of the U.S., Canada, Australia, and the states and municipalities in which the Company operates. These tax laws are complex and subject to different interpretations by the taxpayer and the relevant government taxing authorities. In establishing a provision for income tax expense, the Company must make judgments and interpretations about the application of these inherently complex tax laws. The Company must also make estimates about when in the future certain items will affect taxable income in the various tax jurisdictions. Disputes over interpretations of the tax laws may be subject to review/adjudication by the court systems of the various tax jurisdictions or may be settled with the taxing authority upon examination or audit. The Company reviews these balances quarterly and as new information becomes available, the balances are adjusted, as appropriate.
Derivative Accounting
The Company records derivative instruments at fair value on the balance sheet as either an asset or liability. The Company determines the fair value for its derivative contracts using either (i) pricing models that consider current market conditions and the contractual terms of the derivative contract or (ii) counterparty valuations. These factors include interest rates, time value, forward interest rate curve, and volatility factors, as well as foreign exchange rates. Pricing models and their underlying assumptions impact the amount and timing of unrealized gains and losses recognized, and the use of different pricing models or assumptions could produce different financial results. Management has structured the majority of the Company’s derivative transactions with the intent that each is economically effective. However, the Company’s derivative instruments do not qualify for hedge accounting. Accordingly, changes in the fair value of derivative instruments are reported in current period earnings.
RECENT ACCOUNTING PRONOUNCEMENTS
Revenue Recognition
In May 2014, the Financial Accounting Standards Board ("FASB") issued accounting guidance regarding the recognition of revenue from contracts with customers, which requires an entity to recognize the amount of revenue to which it expects to be entitled for the transfer of promised goods or services to customers. This guidance will replace most existing revenue recognition guidance once it becomes effective on January 1, 2018 and the standard allows the use of either the retrospective or cumulative effect transition method. The Company currently plans to use the cumulative effect transition method. The Company is continuing to evaluate the impact this standard will have on its ongoing financial reporting. However, it does not currently believe the implementation will have a material impact to its financial statements. The majority of the Company's revenue earned in its Asset
63
Generation and Management segment, including loan interest and derivative activity, is explicitly excluded from the scope of the new guidance. The Company continues to evaluate the impact to revenue earned from its fee-based operating segments and the presentation and disclosures.
Classification and Measurement
In January 2016, the FASB issued accounting guidance regarding the recognition and measurement of financial assets and financial liabilities, which will change the income statement impact of equity investments, and the recognition of changes in fair value of financial liabilities when the fair value option is elected. The new guidance requires all equity investments to be measured at fair value, with changes in the fair value recognized through net income (other than those accounted for under the equity method of accounting or those that result in consolidation of the investee) and requires an entity to present separately in other comprehensive income the portion of the total change in the fair value of a liability resulting from a change in the instrument-specific credit risk when the entity has elected to measure the liability at fair value in accordance with the fair value option for financial instruments. This guidance is effective for the Company beginning January 1, 2018. Early adoption is permitted for the provisions related to the recognition of changes in fair value of financial liabilities when the fair value option is elected. The Company is evaluating the impact this pronouncement will have on its ongoing financial reporting.
Leases
In February 2016, the FASB issued accounting guidance regarding the accounting for leases. The new standard will require the identification of arrangements that should be accounted for as leases by lessees. In general, for lease arrangements exceeding a twelve-month term, these arrangements must be recognized as assets and liabilities on the balance sheet of the lessee. A right-of-use asset and lease obligation will be recorded for all leases, whether operating or financing, while the income statement will reflect lease expense for operating leases and amortization/interest expense for financing leases. The balance sheet amount recorded for existing leases at the date of adoption must be calculated using the applicable incremental borrowing rate at the date of adoption. The standard requires the use of the modified retrospective transition method, which will require adjustment to all comparative periods presented. It will be effective for the Company as of January 1, 2019. Early adoption is permitted. The Company is evaluating the impact this standard will have on its ongoing financial reporting.
Allowance for Loan Losses
In June 2016, the FASB issued accounting guidance regarding the measurement of credit losses on financial instruments, which will change the way entities recognize impairment of many financial assets by requiring immediate recognition of estimated credit losses expected to occur over the asset's remaining life. This guidance is effective for the Company beginning January 1, 2020. Early application is permitted beginning January 1, 2019. The Company is evaluating the impact this standard will have on its ongoing financial reporting.
(All dollars are in thousands, except share amounts, unless otherwise noted)
Interest Rate Risk
The Company’s primary market risk exposure arises from fluctuations in its borrowing and lending rates, the spread between which could impact the Company due to shifts in market interest rates.
The following table sets forth the Company’s loan assets and debt instruments by rate characteristics:
|
|
As of December 31, 2016
|
As of December 31, 2015
|
|||||||||||
|
|
Dollars
|
Percent
|
Dollars
|
Percent
|
|||||||||
|
Fixed-rate loan assets
|
$
|
8,585,283
|
|
34.2
|
%
|
$
|
11,229,584
|
|
39.3
|
%
|
|||
|
Variable-rate loan assets
|
16,518,360
|
|
65.8
|
|
17,326,165
|
|
60.7
|
|
|||||
|
Total
|
$
|
25,103,643
|
|
100.0
|
%
|
$
|
28,555,749
|
|
100.0
|
%
|
|||
|
Fixed-rate debt instruments
|
$
|
131,733
|
|
0.5
|
%
|
$
|
18,355
|
|
0.1
|
%
|
|||
|
Variable-rate debt instruments
|
24,968,687
|
|
99.5
|
|
28,584,976
|
|
99.9
|
|
|||||
|
Total
|
$
|
25,100,420
|
|
100.0
|
%
|
$
|
28,603,331
|
|
100.0
|
%
|
|||
64
FFELP loans originated prior to April 1, 2006 generally earn interest at the higher of the borrower rate, which is fixed over a period of time, or a floating rate based on the SAP formula set by the Department. The SAP rate is based on an applicable index plus a fixed spread that depends on loan type, origination date, and repayment status. The Company generally finances its student loan portfolio with variable rate debt. In low and/or declining interest rate environments, when the fixed borrower rate is higher than the SAP rate, the Company’s student loans earn at a fixed rate while the interest on the variable rate debt typically continues to reflect the low and/or declining interest rates. In these interest rate environments, the Company may earn additional spread income that it refers to as floor income.
Depending on the type of loan and when it was originated, the borrower rate is either fixed to term or is reset to an annual rate each July 1. As a result, for loans where the borrower rate is fixed to term, the Company may earn floor income for an extended period of time, which the Company refers to as fixed rate floor income, and for those loans where the borrower rate is reset annually on July 1, the Company may earn floor income to the next reset date, which the Company refers to as variable rate floor income. All FFELP loans first originated on or after April 1, 2006 effectively earn at the SAP rate, since lenders are required to rebate fixed rate floor income and variable rate floor income for those loans to the Department.
No variable-rate floor income was earned by the Company during the years ended
December 31, 2016
,
2015
, and
2014
. A summary of fixed rate floor income earned by the Company during these years follows.
|
|
Year ended December 31,
|
||||||||
|
|
2016
|
2015
|
2014
|
||||||
|
Fixed rate floor income, gross
|
$
|
169,979
|
|
207,787
|
|
204,250
|
|
||
|
Derivative settlements (a)
|
(17,643
|
)
|
(23,041
|
)
|
(24,380
|
)
|
|||
|
Fixed rate floor income, net
|
$
|
152,336
|
|
184,746
|
|
179,870
|
|
||
|
(a)
|
Includes settlement payments on derivatives used to hedge student loans earning fixed rate floor income.
|
The high levels of fixed rate floor income earned during
2016
,
2015
, and
2014
were due to historically low interest rates. If interest rates remain low, the Company anticipates continuing to earn significant fixed rate floor income in future periods. The decrease in gross fixed rate floor income in 2016 compared to 2015 was due to an increase in interest rates.
Absent the use of derivative instruments, a rise in interest rates may reduce the amount of floor income received and this may have an impact on earnings due to interest margin compression caused by increasing financing costs, until such time as the federally insured loans earn interest at a variable rate in accordance with their special allowance payment formulas. In higher interest rate environments, where the interest rate rises above the borrower rate and fixed rate loans effectively become variable rate loans, the impact of the rate fluctuations is reduced.
65
The following graph depicts fixed rate floor income for a borrower with a fixed rate of 6.75% and a SAP rate of 2.64%:
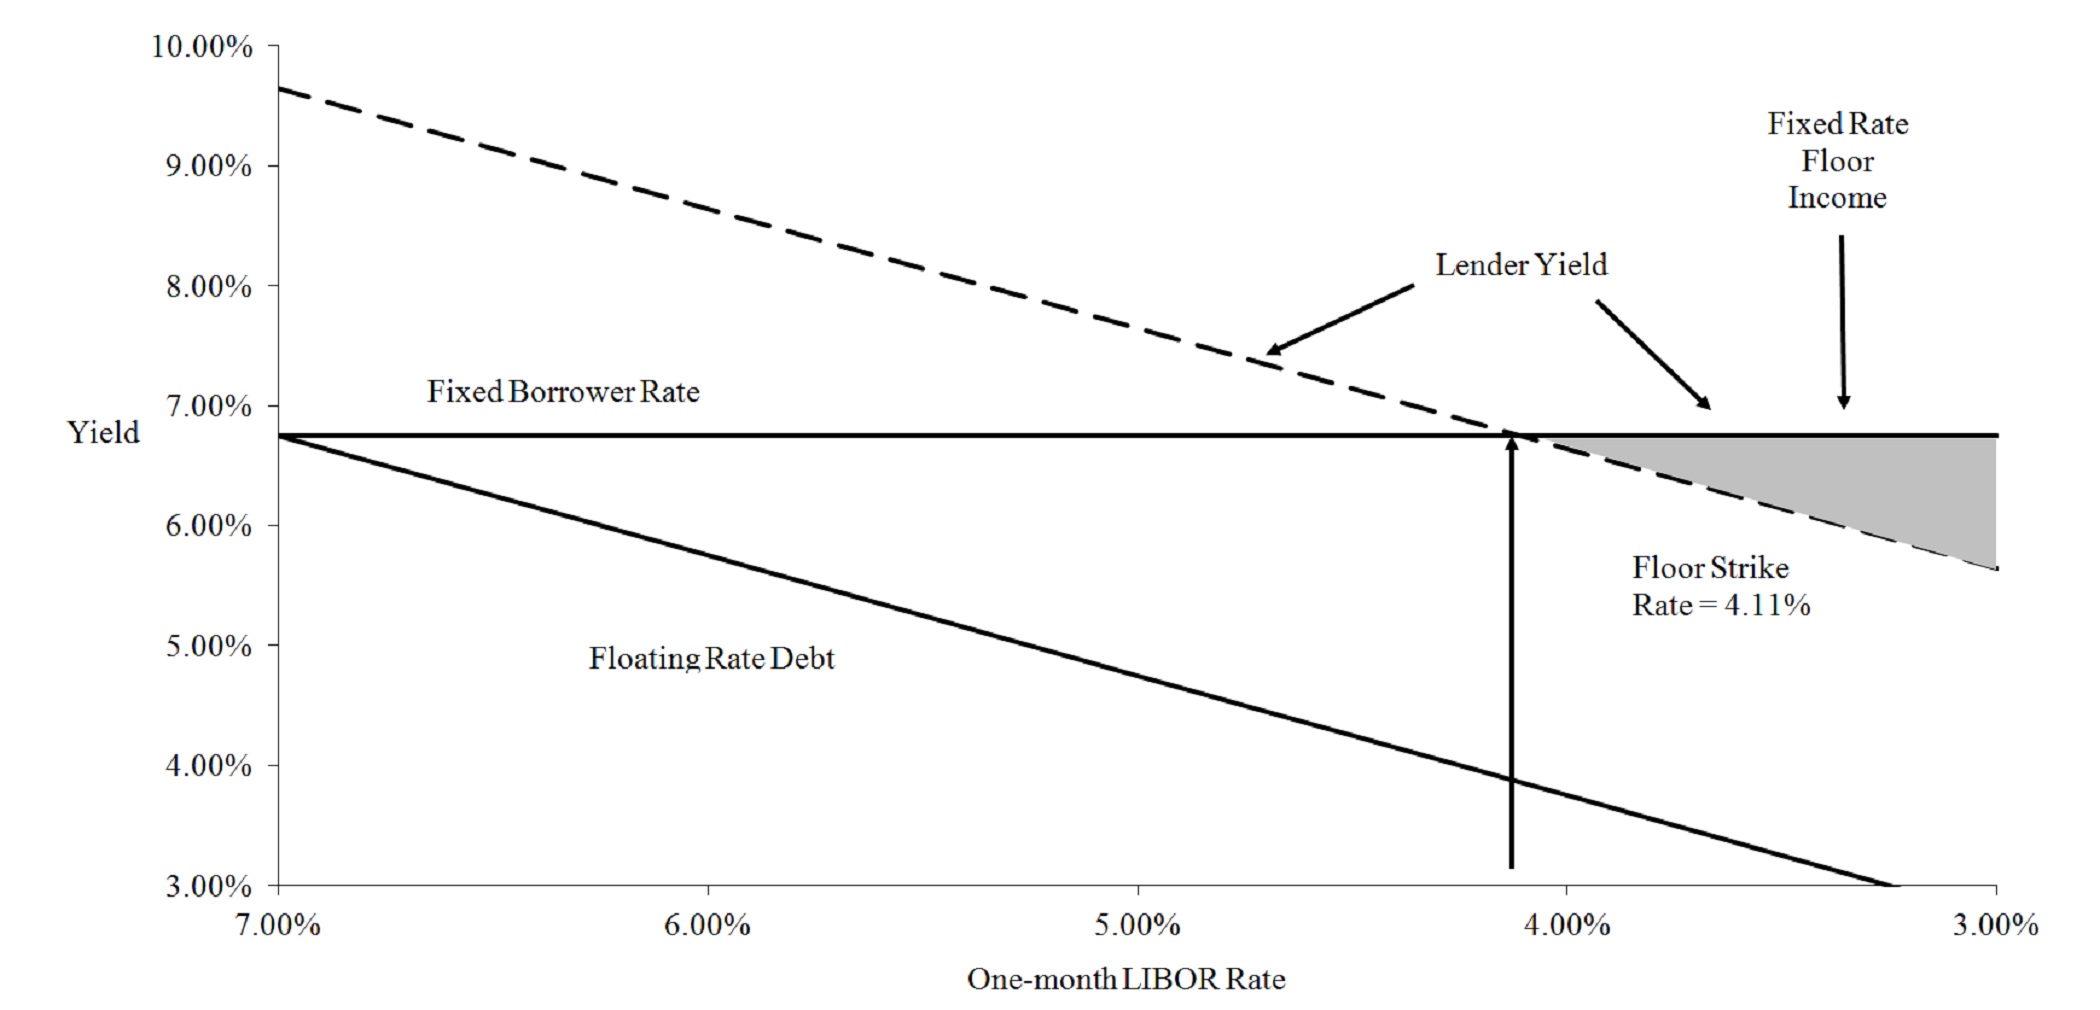
The following table shows the Company’s federally insured student loan assets that are earning fixed rate floor income as of
December 31, 2016
:
|
Fixed interest rate range
|
Borrower/lender weighted average yield
|
Estimated variable conversion rate (a)
|
Loan balance
|
|||||
|
3.0 - 3.49%
|
3.37%
|
0.73%
|
$
|
618,437
|
|
|||
|
3.5 - 3.99%
|
3.65%
|
1.01%
|
2,068,884
|
|
||||
|
4.0 - 4.49%
|
4.20%
|
1.56%
|
1,554,758
|
|
||||
|
4.5 - 4.99%
|
4.72%
|
2.08%
|
936,646
|
|
||||
|
5.0 - 5.49%
|
5.22%
|
2.58%
|
591,452
|
|
||||
|
5.5 - 5.99%
|
5.67%
|
3.03%
|
416,122
|
|
||||
|
6.0 - 6.49%
|
6.19%
|
3.55%
|
480,089
|
|
||||
|
6.5 - 6.99%
|
6.70%
|
4.06%
|
468,555
|
|
||||
|
7.0 - 7.49%
|
7.17%
|
4.53%
|
163,681
|
|
||||
|
7.5 - 7.99%
|
7.71%
|
5.07%
|
279,873
|
|
||||
|
8.0 - 8.99%
|
8.18%
|
5.54%
|
645,611
|
|
||||
|
> 9.0%
|
9.05%
|
6.41%
|
225,746
|
|
||||
|
|
|
|
$
|
8,449,854
|
|
|||
|
(a)
|
The estimated variable conversion rate is the estimated short-term interest rate at which loans would convert to a variable rate. As of
December 31, 2016
, the weighted average estimated variable conversion rate was
2.42%
and the short-term interest rate was
61
basis points.
|
66
The following table summarizes the outstanding derivative instruments as of
December 31, 2016
used by the Company to economically hedge loans earning fixed rate floor income.
|
Notional amount
|
Weighted average fixed rate paid by the Company (a)
|
|||||||
|
Maturity
|
||||||||
|
2017
|
$
|
750,000
|
|
0.99
|
%
|
|||
|
2018
|
1,350,000
|
|
1.07
|
|
||||
|
2019
|
3,250,000
|
|
0.97
|
|
||||
|
2020
|
1,500,000
|
|
1.01
|
|
||||
|
2025
|
100,000
|
|
2.32
|
|
||||
|
|
$
|
6,950,000
|
|
1.02
|
%
|
|||
|
(a)
|
For all interest rate derivatives, the Company receives discrete three-month LIBOR.
|
In addition, on August 20, 2014, the Company paid
$9.1 million
for an interest rate swap option to economically hedge loans earning fixed rate floor income. The interest rate swap option gives the Company the right, but not the obligation, to enter into a
$250 million
notional interest rate swap in which the Company would pay a fixed amount of
3.30%
and receive discrete one-month LIBOR. If the interest rate swap option is exercised, the swap would become effective in 2019 and mature in 2024.
The Company is also exposed to interest rate risk in the form of basis risk and repricing risk because the interest rate characteristics of the Company’s assets do not match the interest rate characteristics of the funding for those assets. The following table presents the Company’s FFELP student loan assets and related funding for those assets arranged by underlying indices as of
December 31, 2016
:
|
Index
|
Frequency of variable resets
|
Assets
|
Funding of student loan assets
|
||||||
|
1 month LIBOR (a)
|
Daily
|
$
|
22,840,482
|
|
—
|
|
|||
|
3 month H15 financial commercial paper
|
Daily
|
1,261,717
|
|
—
|
|
||||
|
3 month Treasury bill
|
Daily
|
727,785
|
|
—
|
|
||||
|
3 month LIBOR (a) (b)
|
Quarterly
|
—
|
|
13,683,024
|
|
||||
|
1 month LIBOR
|
Monthly
|
—
|
|
9,052,459
|
|
||||
|
Auction-rate (c)
|
Varies
|
—
|
|
998,415
|
|
||||
|
Asset-backed commercial paper (d)
|
Varies
|
—
|
|
1,072,023
|
|
||||
|
Other (e)
|
1,349,387
|
|
1,373,450
|
|
|||||
|
|
|
$
|
26,179,371
|
|
26,179,371
|
|
|||
|
(a)
|
The Company has certain basis swaps outstanding in which the Company receives three-month LIBOR and pays one-month LIBOR plus or minus a spread as defined in the agreements (the "1:3 Basis Swaps"). The Company entered into these derivative instruments to better match the interest rate characteristics on its student loan assets and the debt funding such assets. The following table summarizes the 1:3 Basis Swaps outstanding as of December 31, 2016.
|
|
Maturity
|
Notional amount
|
|||
|
2026
|
$
|
1,150,000
|
|
|
|
2028
|
325,000
|
|
||
|
2031
|
300,000
|
|
||
|
$
|
1,775,000
|
|
||
The weighted average rate paid by the Company on the 1:3 Basis Swaps as of December 31, 2016 was one-month LIBOR plus 10.1 basis points.
|
(b)
|
The Company has Euro-denominated notes that reprice on the EURIBOR index. The Company has entered into a cross-currency interest rate swap that converts the EURIBOR index to three-month LIBOR. As a result, these notes are reflected in the three-month LIBOR category in the above table. See “Foreign Currency Exchange Risk” below.
|
67
|
(c)
|
The interest rates on certain of the Company's asset-backed securities are set and periodically reset via a "dutch auction" (“Auction Rate Securities”). As of
December 31, 2016
, the Company was sponsor for
$998.4 million
of Auction Rate Securities. Since February 2008, problems in the auction rate securities market as a whole have led to failures of the auctions pursuant to which the Company's Auction Rate Securities' interest rates are set. As a result, the Auction Rate Securities generally pay interest to the holder at a maximum rate as defined by the indenture. While these rates will vary, they will generally be based on a spread to LIBOR or Treasury Securities, or the Net Loan Rate as defined in the financing documents.
|
|
(d)
|
The interest rates on certain of the Company's warehouse facilities are indexed to asset-backed commercial paper rates.
|
|
(e)
|
Assets include accrued interest receivable and restricted cash. Funding represents overcollateralization (equity) included in FFELP asset-backed securitizations and warehouse facilities.
|
Sensitivity Analysis
The following tables summarize the effect on the Company’s earnings, based upon a sensitivity analysis performed by the Company assuming hypothetical increases in interest rates of 100 basis points and 300 basis points while funding spreads remain constant. In addition, a sensitivity analysis was performed assuming the funding index increases 10 basis points and 30 basis points while holding the asset index constant, if the funding index is different than the asset index. The sensitivity analysis was performed on the Company’s variable rate assets (including loans earning fixed rate floor income) and liabilities. The analysis includes the effects of the Company’s interest rate and basis swaps in existence during these periods.
|
|
Interest rates
|
Asset and funding index mismatches
|
|||||||||||||||||||||||||
|
Change from increase of 100 basis points
|
Change from increase of 300 basis points
|
Increase of 10 basis points
|
Increase of 30 basis points
|
||||||||||||||||||||||||
|
|
|||||||||||||||||||||||||||
|
|
Dollars
|
Percent
|
Dollars
|
Percent
|
Dollars
|
Percent
|
Dollars
|
Percent
|
|||||||||||||||||||
|
|
Year ended December 31, 2016
|
||||||||||||||||||||||||||
|
Effect on earnings:
|
|
|
|
||||||||||||||||||||||||
|
Decrease in pre-tax net income before impact of derivative settlements
|
$
|
(67,877
|
)
|
(17.0
|
)%
|
$
|
(124,818
|
)
|
(31.3
|
)%
|
$
|
(16,033
|
)
|
(4.1
|
)%
|
$
|
(48,098
|
)
|
(12.1
|
)%
|
|||||||
|
Impact of derivative settlements
|
59,847
|
|
15.0
|
|
179,541
|
|
45.0
|
|
3,052
|
|
0.8
|
|
9,155
|
|
2.3
|
|
|||||||||||
|
Increase (decrease) in net income before taxes
|
$
|
(8,030
|
)
|
(2.0
|
)%
|
$
|
54,723
|
|
13.7
|
%
|
$
|
(12,981
|
)
|
(3.3
|
)%
|
$
|
(38,943
|
)
|
(9.8
|
)%
|
|||||||
|
Increase (decrease) in basic and diluted earnings per share
|
$
|
(0.12
|
)
|
$
|
0.80
|
|
$
|
(0.19
|
)
|
$
|
(0.57
|
)
|
|||||||||||||||
|
|
Year ended December 31, 2015
|
||||||||||||||||||||||||||
|
Effect on earnings:
|
|
|
|
|
|
||||||||||||||||||||||
|
Decrease in pre-tax net income before impact of derivative settlements
|
$
|
(83,412
|
)
|
(19.8
|
)%
|
$
|
(151,492
|
)
|
(36.0
|
)%
|
$
|
(17,079
|
)
|
(4.1
|
)%
|
$
|
(51,238
|
)
|
(12.2
|
)%
|
|||||||
|
Impact of derivative settlements
|
38,439
|
|
9.1
|
|
115,315
|
|
27.4
|
|
6,161
|
|
1.5
|
|
18,484
|
|
4.4
|
|
|||||||||||
|
Increase (decrease) in net income before taxes
|
$
|
(44,973
|
)
|
(10.7
|
)%
|
$
|
(36,177
|
)
|
(8.6
|
)%
|
$
|
(10,918
|
)
|
(2.6
|
)%
|
$
|
(32,754
|
)
|
(7.8
|
)%
|
|||||||
|
Increase (decrease) in basic and diluted earnings per share
|
$
|
(0.61
|
)
|
$
|
(0.49
|
)
|
$
|
(0.16
|
)
|
$
|
(0.46
|
)
|
|||||||||||||||
|
|
Year ended December 31, 2014
|
||||||||||||||||||||||||||
|
Effect on earnings:
|
|
|
|
|
|
||||||||||||||||||||||
|
Decrease in pre-tax net income before impact of derivative settlements
|
$
|
(81,669
|
)
|
(17.4
|
)%
|
$
|
(144,648
|
)
|
(30.8
|
)%
|
$
|
(17,231
|
)
|
(3.6
|
)%
|
$
|
(51,697
|
)
|
(11.0
|
)%
|
|||||||
|
Impact of derivative settlements
|
40,267
|
|
8.6
|
|
120,801
|
|
25.7
|
|
7,649
|
|
1.6
|
|
22,951
|
|
4.9
|
|
|||||||||||
|
Increase (decrease) in net income before taxes
|
$
|
(41,402
|
)
|
(8.8
|
)%
|
$
|
(23,847
|
)
|
(5.1
|
)%
|
$
|
(9,582
|
)
|
(2.0
|
)%
|
$
|
(28,746
|
)
|
(6.1
|
)%
|
|||||||
|
Increase (decrease) in basic and diluted earnings per share
|
$
|
(0.55
|
)
|
$
|
(0.32
|
)
|
$
|
(0.12
|
)
|
$
|
(0.38
|
)
|
|||||||||||||||
68
Foreign Currency Exchange Risk
The Company has issued
€352.7 million
of student loan asset-backed Euro Notes (the "Euro Notes") with an interest rate based on a spread to the EURIBOR index. As a result, the Company is exposed to market risk related to fluctuations in foreign currency exchange rates between the U.S. dollar and Euro. The Company has entered into a cross-currency interest rate swap in connection with the issuance of the Euro Notes. See note 5 of the notes to consolidated financial statements included in this report for additional information, including a summary of the terms of the cross-currency interest rate swap associated with the Euro Notes and the related financial statement impact.
Financial Statement Impact – Derivatives and Foreign Currency Transaction Adjustments
For a table summarizing the effect of derivative instruments in the consolidated statements of income, including the components of "derivative market value and foreign currency adjustments and derivative settlements, net" included in the consolidated statements of income, see note 5 of the notes to consolidated financial statements.
Reference is made to the consolidated financial statements listed under the heading “(a) 1. Consolidated Financial Statements” of Item 15 of this report, which consolidated financial statements are incorporated into this report by reference in response to this Item 8.
DISCLOSURE
None.
Disclosure Controls and Procedures
Under supervision and with the participation of certain members of the Company’s management, including the chief executive and chief financial officers, the Company completed an evaluation of the effectiveness of the design and operation of its disclosure controls and procedures (as defined in SEC Rules 13a-15(e) and 15d-15(e) under the Securities Exchange Act of 1934). Based on this evaluation, the Company’s principal executive and principal financial officers concluded that the disclosure controls and procedures were effective as of the end of the period covered by this report to provide reasonable assurance that information required to be disclosed in reports the Company files or submits under the Securities Exchange Act of 1934 is recorded, processed, summarized, and reported, within the time periods specified in the SEC's rules and forms, and is accumulated and communicated to the Company's management, including the chief executive and chief financial officers, as appropriate to allow timely decisions regarding required disclosure.
Changes in Internal Control over Financial Reporting
There was no change in the Company’s internal control over financial reporting during the Company’s last fiscal quarter that has materially affected, or is reasonably likely to materially affect, the Company’s internal control over financial reporting.
Management's Report on Internal Control over Financial Reporting
Management is responsible for establishing and maintaining adequate internal control over financial reporting (as defined in Rule 13a-15(f) under the Securities Exchange Act of 1934) for the Company. The Company's internal control system was designed to provide reasonable assurance to the Company's management and board of directors regarding the preparation and fair presentation of published financial statements in accordance with U.S. generally accepted accounting principles. All internal control systems, no matter how well designed, have inherent limitations. Therefore, even those systems determined to be effective can provide only reasonable assurance with respect to financial statement preparation and presentation.
Management maintains a comprehensive system of controls intended to ensure that transactions are executed in accordance with management's authorization, assets are safeguarded, and financial records are reliable. Management also takes steps to ensure that information and communication flows are effective and to monitor performance, including performance of internal control procedures.
69
Management assessed the effectiveness of the Company's internal control over financial reporting as of
December 31, 2016
based on the criteria for effective internal control described in
Internal Control - Integrated Framework (2013)
issued by the Committee of Sponsoring Organizations of the Treadway Commission. Based on this assessment, management believes that, as of
December 31, 2016
, the Company's internal control over financial reporting is effective.
The effectiveness of the Company's internal control over financial reporting as of
December 31, 2016
has been audited by KPMG LLP, the Company's independent registered public accounting firm, as stated in their report included herein, which expressed an unqualified opinion on the effectiveness of the Company's internal control over financial reporting as of
December 31, 2016
.
Inherent Limitations on Effectiveness of Internal Controls
The Company's management, including the chief executive and chief financial officers, understands that the disclosure controls and procedures and internal control over financial reporting are subject to certain limitations, including the exercise of judgment in designing, implementing, and evaluating the controls and procedures, the assumptions used in identifying the likelihood of future events, and the inability to eliminate misconduct completely. The design of a control system must reflect the fact that there are resource constraints, and the benefits of a control system must be considered relative to their costs. These inherent limitations include the realities that judgments in decision-making can be faulty and that breakdowns can occur because of simple error or mistake. Controls can also be circumvented by the individual acts of some persons, by collusion of two or more people, or by management override of the controls. The design of any system of controls is based in part on certain assumptions about the likelihood of future events, and there can be no assurance that any design will succeed in achieving its stated goals under all potential future conditions. Projections of any evaluation of controls effectiveness to future periods are subject to risks. Over time, controls may become inadequate because of changes in conditions or deterioration in the degree of compliance with policies or procedures.
As a result, there can be no assurance that the Company's disclosure controls and procedures or internal control over financial reporting will prevent all errors or fraud or ensure that all material information will be made known to management in a timely fashion. By their nature, the Company's or any system of disclosure controls and procedures or internal control over financial reporting, no matter how well designed and operated, can provide only reasonable assurance regarding management's control objectives.
Report of Independent Registered Public Accounting Firm
The Board of Directors and Shareholders
Nelnet, Inc.:
We have audited Nelnet, Inc.'s internal control over financial reporting as of
December 31, 2016
, based on criteria established in
Internal Control - Integrated Framework (2013)
issued by the Committee of Sponsoring Organizations of the Treadway Commission (COSO). Nelnet, Inc.'s (the Company) management is responsible for maintaining effective internal control over financial reporting and for its assessment of the effectiveness of internal control over financial reporting, included in the accompanying
Management's Report on Internal Control over Financial Reporting
. Our responsibility is to express an opinion on the Company's internal control over financial reporting based on our audit.
We conducted our audit in accordance with the standards of the Public Company Accounting Oversight Board (United States). Those standards require that we plan and perform the audit to obtain reasonable assurance about whether effective internal control over financial reporting was maintained in all material respects. Our audit included obtaining an understanding of internal control over financial reporting, assessing the risk that a material weakness exists, and testing and evaluating the design and operating effectiveness of internal control based on the assessed risk. Our audit also included performing such other procedures as we considered necessary in the circumstances. We believe that our audit provides a reasonable basis for our opinion.
A company's internal control over financial reporting is a process designed to provide reasonable assurance regarding the reliability of financial reporting and the preparation of financial statements for external purposes in accordance with generally accepted accounting principles. A company's internal control over financial reporting includes those policies and procedures that (1) pertain to the maintenance of records that, in reasonable detail, accurately and fairly reflect the transactions and dispositions of the assets of the company; (2) provide reasonable assurance that transactions are recorded as necessary to permit preparation of financial statements in accordance with generally accepted accounting principles, and that receipts and expenditures of the company are being made only in accordance with authorizations of management and directors of the company; and (3) provide reasonable
70
assurance regarding prevention or timely detection of unauthorized acquisition, use, or disposition of the company's assets that could have a material effect on the financial statements.
Because of its inherent limitations, internal control over financial reporting may not prevent or detect misstatements. Also, projections of any evaluation of effectiveness to future periods are subject to the risk that controls may become inadequate because of changes in conditions, or that the degree of compliance with the policies or procedures may deteriorate.
In our opinion, Nelnet, Inc. maintained, in all material respects, effective internal control over financial reporting as of
December 31, 2016
, based on criteria established in
Internal Control - Integrated Framework (2013)
issued by the Committee of Sponsoring Organizations of the Treadway Commission.
We also have audited, in accordance with the standards of the Public Company Accounting Oversight Board (United States), the consolidated balance sheets of Nelnet, Inc. and subsidiaries as of
December 31, 2016
and 2015, and the related consolidated statements of income, comprehensive income, shareholders' equity, and cash flows for each of the years in the three-year period ended
December 31, 2016
, and our report dated
February 27, 2017
expressed an unqualified opinion on those consolidated financial statements.
/s/ KPMG LLP
Lincoln, Nebraska
February 27, 2017
During the fourth quarter of
2016
, no information was required to be disclosed in a report on Form 8-K, but not reported.
The information as to the directors, executive officers, corporate governance, and Section 16(a) beneficial ownership reporting compliance of the Company set forth under the captions “PROPOSAL 1 - ELECTION OF DIRECTORS - Nominees,” “EXECUTIVE OFFICERS,” “CORPORATE GOVERNANCE,” and “SECURITY OWNERSHIP OF DIRECTORS, EXECUTIVE OFFICERS, AND PRINCIPAL SHAREHOLDERS - Section 16(a) Beneficial Ownership Reporting Compliance” in the definitive Proxy Statement to be filed on Schedule 14A with the SEC, no later than 120 days after the end of the Company's fiscal year, relating to the Company's Annual Meeting of Shareholders scheduled to be held on May 25, 2017 (the “Proxy Statement”), is incorporated herein by reference.
The information set forth under the captions “CORPORATE GOVERNANCE” and “EXECUTIVE COMPENSATION” in the Proxy Statement is incorporated herein by reference.
The information set forth under the caption “SECURITY OWNERSHIP OF DIRECTORS, EXECUTIVE OFFICERS, AND PRINCIPAL SHAREHOLDERS - Stock Ownership” in the Proxy Statement is incorporated herein by reference. There are no arrangements known to the Company, the operation of which may at a subsequent date result in a change in the control of the Company.
71
The following table summarizes information about compensation plans under which equity securities are authorized for issuance.
Equity Compensation Plan Information
|
As of December 31, 2016
|
||||||||||
|
Plan category
|
Number of shares to be issued upon exercise of outstanding options, warrants, and rights (a)
|
Weighted-average exercise price of outstanding options, warrants, and rights (b)
|
Number of shares remaining available for future issuance under equity compensation plans (excluding securities reflected in column (a)) (c)
|
|||||||
|
Equity compensation plans approved by shareholders
|
—
|
|
—
|
|
2,466,519
|
|
(1)
|
|||
|
Equity compensation plans not approved by shareholders
|
—
|
|
—
|
|
—
|
|
||||
|
Total
|
—
|
|
—
|
|
2,466,519
|
|
||||
|
(1)
|
Includes
1,902,872
,
55,036
, and
508,611
shares of Class A Common Stock remaining available for future issuance under the Nelnet, Inc. Restricted Stock Plan, Nelnet, Inc. Directors Stock Compensation Plan, and Nelnet, Inc. Employee Share Purchase Plan, respectively.
|
The information set forth under the captions “CERTAIN RELATIONSHIPS AND RELATED TRANSACTIONS,” “CORPORATE GOVERNANCE - Board Composition and Director Independence,” and “CORPORATE GOVERNANCE - Board Committees” in the Proxy Statement is incorporated herein by reference.
The information set forth under the caption “PROPOSAL 2 - RATIFICATION OF APPOINTMENT OF INDEPENDENT REGISTERED PUBLIC ACCOUNTING FIRM - Independent Accountant Fees and Services” in the Proxy Statement is incorporated herein by reference.
|
(a)
|
1. Consolidated Financial Statements
|
The following consolidated financial statements of Nelnet, Inc. and its subsidiaries and the Report of Independent Registered Public Accounting Firm thereon are included in Item 8 above:
|
Page
|
||
|
Report of Independent Registered Public Accounting Firm
|
F-2
|
|
|
F-3
|
||
|
F-4
|
||
|
F-5
|
||
|
F-6
|
||
|
F-7
|
||
|
Notes to Consolidated Financial Statements
|
F-8
|
|
2. Financial Statement Schedules
All schedules are omitted because they are not applicable or the required information is shown in the consolidated financial statements or notes thereto.
72
3. Exhibits
The exhibits listed in the accompanying index to exhibits are filed, furnished, or incorporated by reference as part of this report.
|
(b)
|
Exhibits
|
|
Exhibit Index
|
|
|
Exhibit No.
|
Description
|
|
3.1
|
Second Amended and Restated Articles of Incorporation of Nelnet, Inc., and Articles of Amendment thereto, filed as Exhibit 3.1 to the registrant’s Quarterly Report on Form 10-Q for the quarter ended September 30, 2006 and incorporated by reference herein.
|
|
3.2
|
Articles of Amendment to Second Amended and Restated Articles of Incorporation of Nelnet, Inc., filed as Exhibit 3.1 to the registrant’s Quarterly Report on Form 10-Q for the quarter ended June 30, 2007 and incorporated by reference herein.
|
|
3.3
|
Articles of Amendment to Second Amended and Restated Articles of Incorporation of Nelnet, Inc., filed as Exhibit 3.1 to the registrant's Current Report on Form 8-K filed on May 31, 2016 and incorporated by reference herein.
|
|
3.4
|
Composite Second Amended and Restated Articles of Incorporation of Nelnet, Inc., as amended, filed as Exhibit 3.2 (appearing as Exhibit 32 on the electronic filing listing) to the registrant's Quarterly Report on Form 10-Q for the quarter ended June 30, 2016 and incorporated by reference herein.
|
|
3.5
|
Seventh Amended and Restated Bylaws of Nelnet, Inc., as amended as of February 6, 2014, filed as Exhibit 3.1 to the registrant's Current Report on Form 8-K filed on February 11, 2014 and incorporated by reference herein.
|
|
4.1
|
Form of Class A Common Stock Certificate of Nelnet, Inc., filed on November 24, 2003 as Exhibit 4.1 to the registrant’s Registration Statement on Form S-1 (Registration No. 333-108070) and incorporated by reference herein.
|
|
4.2
|
Certain instruments, including indentures of trust, defining the rights of holders of long-term debt of the registrant and its consolidated subsidiaries, none of which instruments authorizes a total amount of indebtedness thereunder in excess of 10 percent of the total assets of the registrant and its subsidiaries on a consolidated basis, are omitted from this Exhibit Index pursuant to Item 601(b)(4)(iii)(A) of Regulation S-K. Many of such instruments have been previously filed with the Securities and Exchange Commission, and the registrant hereby agrees to furnish a copy of any such instrument to the Commission upon request.
|
|
4.3
|
Registration Rights Agreement, dated as of December 16, 2003, by and among Nelnet, Inc. and the shareholders of Nelnet, Inc. signatory thereto, filed on November 24, 2003 as Exhibit 4.11 to the registrant’s Registration Statement on Form S-1 (Registration No. 333-108070) and incorporated by reference herein.
|
|
10.1
|
Composite Form of Amended and Restated Participation Agreement, dated as of June 1, 2001, between NELnet, Inc. (subsequently renamed National Education Loan Network, Inc.) and Union Bank and Trust Company, as amended by the First Amendment thereto dated as of December 19, 2001 through the Cancellation of the Fifteenth Amendment thereto dated as of March 16, 2011 (such Participation Agreement and each amendment through the Cancellation of the Fifteenth Amendment thereto have been previously filed as set forth in the Exhibit Index for the registrant’s Annual Report on Form 10-K for the year ended December 31, 2012, and are incorporated by reference herein), filed as Exhibit 10.1 to the registrant's Annual Report on Form 10-K for the year ended December 31, 2013 and incorporated by reference herein.
|
|
10.2
|
Sixteenth Amendment of Amended and Restated Participation Agreement, dated as of March 23, 2012, by and between Union Bank and Trust Company and National Education Loan Network, Inc., filed as Exhibit 10.3 to the registrant's Quarterly Report on Form 10-Q for the quarter ended March 31, 2012 and incorporated by reference herein.
|
|
10.3
|
Guaranteed Purchase Agreement, dated as of March 19, 2001, by and between NELnet, Inc. (subsequently renamed National Education Loan Network, Inc.) and Union Bank and Trust Company, filed on September 25, 2003 as Exhibit 10.36 to the registrant’s Registration Statement on Form S-1 (Registration No. 333-108070) and incorporated by reference herein.
|
|
10.4
|
First Amendment of Guaranteed Purchase Agreement, dated as of February 1, 2002, by and between NELnet, Inc. (subsequently renamed National Education Loan Network, Inc.) and Union Bank and Trust Company, filed on September 25, 2003 as Exhibit 10.37 to the registrant’s Registration Statement on Form S-1 (Registration No. 333-108070) and incorporated by reference herein.
|
73
|
Exhibit Index
|
|
|
10.5
|
Second Amendment of Guaranteed Purchase Agreement, dated as of December 1, 2002, by and between Nelnet, Inc. (f/k/a/ NELnet, Inc.) (subsequently renamed National Education Loan Network, Inc.) and Union Bank and Trust Company, filed on September 25, 2003 as Exhibit 10.38 to the registrant’s Registration Statement on Form S-1 (Registration No. 333-108070) and incorporated by reference herein.
|
|
10.6
|
Guaranteed Purchase Agreement, dated as of September 1, 2010, by and between Nelnet, Inc. and Union Bank and Trust Company, filed as Exhibit 10.3 to the registrant's Quarterly Report on Form 10-Q for the quarter ended September 30, 2010 and incorporated by reference herein.
|
|
10.7
|
First Amendment of Guaranteed Purchase Agreement, dated as of March 22, 2011, by and between Nelnet, Inc. and Union Bank and Trust Company, filed as Exhibit 10.2 to the registrant's Quarterly Report on Form 10-Q for the quarter ended March 31, 2011 and incorporated by reference herein.
|
|
10.8
|
Amendment of Agreements dated as of February 4, 2005, by and between National Education Loan Network, Inc. and Union Bank and Trust Company, filed as Exhibit 10.1 to the registrant’s Current Report on Form 8-K filed on February 10, 2005 and incorporated by reference herein.
|
|
10.9+
|
Nelnet, Inc. Employee Share Purchase Plan, as amended through March 17, 2011, filed as Exhibit 10.4 to the registrant's Quarterly Report on Form 10-Q for the quarter ended March 31, 2011 and incorporated by reference herein.
|
|
10.10
|
Office Building Lease dated June 21, 1996 between Miller & Paine and Union Bank and Trust Company, filed as Exhibit 10.3 to the registrant's Current Report on Form 8-K filed on October 16, 2006 and incorporated by reference herein.
|
|
10.11
|
Amendment to Office Building Lease dated June 11, 1997 between Miller & Paine and Union Bank and Trust Company, filed as Exhibit 10.4 to the registrant's Current Report on Form 8-K filed on October 16, 2006 and incorporated by reference herein.
|
|
10.12
|
Lease Amendment Number Two dated February 8, 2001 between Miller & Paine and Union Bank and Trust Company, filed as Exhibit 10.5 to the registrant's Current Report on Form 8-K filed on October 16, 2006 and incorporated by reference herein.
|
|
10.13
|
Lease Amendment Number Three dated May 23, 2005 between Miller & Paine, LLC and Union Bank and Trust Company, filed as Exhibit 10.6 to the registrant's Current Report on Form 8-K filed on October 16, 2006 and incorporated by reference herein.
|
|
10.14
|
Lease Agreement dated May 20, 2005 between Miller & Paine, LLC and Union Bank and Trust Company, filed as Exhibit 10.7 to the registrant's Current Report on Form 8-K filed on October 16, 2006 and incorporated by reference herein.
|
|
10.15
|
Office Sublease dated April 30, 2001 between Union Bank and Trust Company and Nelnet, Inc., filed as Exhibit 10.8 to the registrant's Current Report on Form 8-K filed on October 16, 2006 and incorporated by reference herein.
|
|
10.16+
|
Nelnet, Inc. Restricted Stock Plan, as amended through May 22, 2014, filed as Exhibit 10.1 to the registrant's Current Report on Form 8-K filed on May 28, 2014 and incorporated by reference herein.
|
|
10.17+
|
Nelnet, Inc. Directors Stock Compensation Plan, as amended through April 18, 2008, filed on June 27, 2008 as Exhibit 99.1 to the registrant’s Registration Statement on Form S-8 (Registration No. 333-151911) and incorporated herein by reference.
|
|
10.18+
|
Nelnet, Inc. Executive Officers Incentive Compensation Plan, filed as Exhibit 10.2 to the registrant's Current Report on Form 8-K filed on May 28, 2014 and incorporated by reference herein.
|
|
10.19
|
Loan Purchase Agreement, dated as of November 25, 2008, by and between Nelnet Education Loan Funding, Inc., f/k/a NEBHELP, INC., acting, where applicable, by and through Wells Fargo Bank, National Association, not individually but as Eligible Lender Trustee for the Seller under the Warehouse Agreement or Eligible Lender Trust Agreement, and Union Bank and Trust Company, acting in its individual capacity and as trustee, filed as Exhibit 10.71 to the registrant's Annual Report on Form 10-K for the year ended December 31, 2008 and incorporated herein by reference.
|
|
10.20
|
Student Loan Servicing Contract between the United States Department of Education and Nelnet Servicing, LLC, filed as Exhibit 10.1 to the registrant's Quarterly Report on Form 10-Q for the quarter ended June 30, 2010 and incorporated herein by reference.
|
|
10.21
|
Modification of Contract dated effective as of June 17, 2014 for Student Loan Servicing Contract between the United States Department of Education and Nelnet Servicing, LLC, filed as Exhibit 10.1 to the registrant's Current Report on Form 8-K filed on June 18, 2014 and incorporated by reference herein.
|
74
|
Exhibit Index
|
|
|
10.22
|
Modification of Contract dated effective as of September 1, 2014 for Student Loan Servicing Contract between the United States Department of Education and Nelnet Servicing, LLC, filed as Exhibit 10.1 to the registrant's Current Report on Form 8-K filed on September 2, 2014 and incorporated herein by reference.
|
|
10.23
|
Management Agreement, dated effective as of May 1, 2011, by Whitetail Rock Capital Management, LLC and Union Bank and Trust Company, filed as Exhibit 10.3 to the registrant's Quarterly Report on Form 10-Q for the quarter ended March 31, 2011 and incorporated herein by reference.
|
|
10.24
|
Management Agreement, dated effective as of January 20, 2012, by and between Union Bank and Trust Company and Whitetail Rock Capital Management, LLC, filed as Exhibit 10.58 to the registrant's Annual Report on Form 10-K for the year ended December 31, 2011 and incorporated herein by reference.
|
|
10.25
|
Management Agreement, dated effective as of October 27, 2015, by and between Union Bank and Trust Company and Whitetail Rock Capital Management, LLC, filed as Exhibit 10.25 to the registrant's Annual Report on Form 10-K for the year ended December 31, 2015 and incorporated herein by reference.
|
|
10.26
|
Management Agreement, dated effective as of January 4, 2016, by and between Union Bank and Trust Company and Whitetail Rock Capital Management, LLC, filed as Exhibit 10.1 to the registrant's Quarterly Report on Form 10-Q for the quarter ended March 31, 2016 and incorporated herein by reference.
|
|
10.27
|
Investment Management Agreement, dated effective as of February 10, 2012, by and among Whitetail Rock SLAB Fund I, LLC, Whitetail Rock Fund Management, LLC, and Whitetail Rock Capital Management, LLC, filed as Exhibit 10.4 to the registrant's Quarterly Report on Form 10-Q for the quarter ended March 31, 2012 and incorporated herein by reference.
|
|
10.28
|
Investment Management Agreement, dated effective as of February 14, 2013, by and among Whitetail Rock SLAB Fund III, LLC, Whitetail Rock Fund Management, LLC, and Whitetail Rock Capital Management, LLC, filed as Exhibit 10.31 to the registrant's Annual Report on Form 10-K for the year ended December 31, 2013 and incorporated herein by reference.
|
|
10.29
|
Form of Custodian Agreement for Whitetail Rock SLAB Funds by and among the Fund, Whitetail Rock Fund Management, LLC, and Union Bank and Trust Company, filed as Exhibit 10.27 to the registrant's Annual Report on Form 10-K for the year ended December 31, 2014 and incorporated herein by reference.
|
|
10.30
|
Form of Administrative Services Agreement for Whitetail Rock SLAB Funds by and among the Fund, Whitetail Rock Fund Management, LLC, Adminisystems, Inc., and Union Bank and Trust Company, filed as Exhibit 10.28 to the registrant's Annual Report on Form 10-K for the year ended December 31, 2014 and incorporated herein by reference.
|
|
10.31
|
Amended and Restated Credit Agreement dated as of October 30, 2015, among Nelnet, Inc., U.S. Bank National Association, as Administrative Agent, Lead Arranger and Book Runner, Wells Fargo Bank, National Association, as Syndication Agent, and Citibank, N.A. and Royal Bank of Canada, as Co-Documentation Agents, and various lender parties thereto, filed as Exhibit 10.1 to the registrant's Quarterly Report on Form 10-Q for the quarter ended September 30, 2015 and incorporated herein by reference.
|
|
10.32
|
Amendment No. 1 dated as of December 12, 2016 to the Amended and Restated Credit Agreement dated as of October 30, 2015, by and among Nelnet, Inc., U.S. Bank National Association, as Administrative Agent, and various lender parties thereto, filed as Exhibit 10.1 to the registrant's Current Report on Form 8-K filed on December 14, 2016 and incorporated herein by reference.
|
|
10.33
|
Amended and Restated Guaranty dated as of October 30, 2015, by each of the subsidiaries of Nelnet, Inc. signatories thereto, in favor of U.S. Bank National Association, as Administrative Agent, filed as Exhibit 10.2 to the registrant's Quarterly Report on Form 10-Q for the quarter ended September 30, 2015 and incorporated herein by reference.
|
|
10.34
|
Annex I to Guaranty dated as of December 12, 2016 to the Amended and Restated Guaranty dated as of October 30, 2015 by Allo Communications LLC, a subsidiary of Nelnet, Inc., in favor of U.S. Bank National Association, as Administrative Agent, filed as Exhibit 10.2 to the registrant's Current Report on Form 8-K filed on December 14, 2016 and incorporated herein by reference.
|
|
10.35
|
Aircraft Purchase Agreement dated as of May 20, 2013, by and between Galena Air Services Company and National Education Loan Network, Inc., filed as Exhibit 10.1 to the registrant's Quarterly Report on Form 10-Q for the quarter ended June 30, 2013 and incorporated by reference herein.
|
|
10.36
|
First Amendment of Aircraft Purchase Agreement dated as of June 11, 2013, by and between Galena Air Services Company and National Education Loan Network, Inc., filed as Exhibit 10.2 to the registrant's Quarterly Report on Form 10-Q for the quarter ended June 30, 2013 and incorporated by reference herein.
|
75
|
Exhibit Index
|
|
|
10.37
|
Agreement for Purchase and Sale of Interest in Aircraft dated as of June 25, 2013, by and between National Education Loan Network, Inc. and Union Financial Services, Inc., filed as Exhibit 10.3 to the registrant's Quarterly Report on Form 10-Q for the quarter ended June 30, 2013 and incorporated by reference herein.
|
|
10.38
|
Aircraft Joint Ownership Agreement dated as of June 25, 2013, by and between National Education Loan Network, Inc. and Union Financial Services, Inc., filed as Exhibit 10.4 to the registrant's Quarterly Report on Form 10-Q for the quarter ended June 30, 2013 and incorporated by reference herein.
|
|
10.39
|
Aircraft Management Agreement, dated as of June 25, 2013, by and between Duncan Aviation, Inc. and National Education Loan Network, Inc. and Union Financial Services, Inc., filed as Exhibit 10.5 to the registrant's Quarterly Report on Form 10-Q for the quarter ended June 30, 2013 and incorporated by reference herein.
|
|
10.40
|
Consulting and Services Agreement made and entered into as of May 1, 2013, by and between Nelnet, Inc., and Union Bank and Trust Company, filed as Exhibit 10.1 to the registrant's Quarterly Report on Form 10-Q for the quarter ended September 30, 2013 and incorporated by reference herein.
|
|
10.41
|
Amended and Restated Consulting and Services Agreement made and entered into as of October 1, 2013, by and between Nelnet, Inc. and Union Bank and Trust Company, filed as Exhibit 10.2 to the registrant's Quarterly Report on Form 10-Q for the quarter ended September 30, 2013 and incorporated by reference herein.
|
|
10.42±
|
Master Private Loan Program Agreement dated as of December 22, 2014, by and between Union Bank and Trust Company and Nelnet, Inc., filed as Exhibit 10.43 to the registrant's Annual Report on Form 10-K for the year ended December 31, 2014 and incorporated herein by reference.
|
|
10.43±
|
Education Loan Marketing and Referral Agreement dated as of December 22, 2014, by and between Nelnet Consumer Finance, Inc. and Union Bank and Trust Company, filed as Exhibit 10.44 to the registrant's Annual Report on Form 10-K for the year ended December 31, 2014 and incorporated herein by reference.
|
|
10.44±
|
Private Student Loan Origination and Servicing Agreement dated as of December 22, 2014, by and between Nelnet Servicing, LLC and Union bank and Trust Company, filed as Exhibit 10.45 to the registrant's Annual Report on Form 10-K for the year ended December 31, 2014 and incorporated herein by reference.
|
|
10.45±
|
Guaranteed Purchase Agreement dated as of December 22, 2014, by and between Nelnet, Inc. and Union Bank and Trust Company, filed as Exhibit 10.46 to the registrant's Annual Report on Form 10-K for the year ended December 31, 2014 and incorporated herein by reference.
|
|
10.46
|
Private Loan Sale Agreement dated as of October 9, 2014, by and between Nelnet, Inc. and Union Bank and Trust Company, filed as Exhibit 10.47 to the registrant's Annual Report on Form 10-K for the year ended December 31, 2014 and incorporated herein by reference.
|
|
10.47
|
Private Student Loan Servicing Agreement dated as of October 9, 2014, by and between Nelnet Servicing, LLC and Union Bank and Trust Company, filed as Exhibit 10.48 to the registrant's Annual Report on Form 10-K for the year ended December 31, 2014 and incorporated herein by reference.
|
|
10.48
|
First Amendment of Loan Servicing Agreement dated as of September 27, 2013, by and between Nelnet, Inc. and Union Bank and Trust Company, filed as Exhibit 10.49 to the registrant's Annual Report on Form 10-K for the year ended December 31, 2014 and incorporated herein by reference.
|
|
21.1*
|
Subsidiaries of Nelnet, Inc.
|
|
23.1*
|
Consent of KPMG LLP, Independent Registered Public Accounting Firm.
|
|
31.1*
|
Certification Pursuant to Section 302 of the Sarbanes-Oxley Act of 2002 of Chief Executive Officer Jeffrey R. Noordhoek.
|
|
31.2*
|
Certification Pursuant to Section 302 of the Sarbanes-Oxley Act of 2002 of Chief Financial Officer James D. Kruger.
|
|
32**
|
Certification Pursuant to 18 U.S.C. Section 1350, as Adopted Pursuant to Section 906 of the Sarbanes-Oxley Act of 2002.
|
|
101.INS*
|
XBRL Instance Document
|
|
101.SCH*
|
XBRL Taxonomy Extension Schema Document
|
|
101.CAL*
|
XBRL Taxonomy Extension Calculation Linkbase Document
|
|
101.DEF*
|
XBRL Taxonomy Extension Definition Linkbase Document
|
|
101.LAB*
|
XBRL Taxonomy Extension Label Linkbase Document
|
76
|
Exhibit Index
|
|
|
101.PRE*
|
XBRL Taxonomy Extension Presentation Linkbase Document
|
|
* Filed herewith
|
|
|
** Furnished herewith
|
|
|
+ Indicates a management contract or compensatory plan or arrangement contemplated by Item 15(a)(3) on Form 10-K.
|
|
|
± Certain portions of this exhibit have been redacted and are subject to a confidential treatment order granted by the U.S. Securities and Exchange Commission pursuant to Rule 24b-2 under the Securities Exchange Act of 1934.
|
|
The Company has elected not to include an optional summary of information required by Form 10-K.
77
SIGNATURES
Pursuant to the requirements of Section 13 or 15(d) of the Securities Exchange Act of 1934, the registrant has duly caused this report to be signed on its behalf by the undersigned, thereunto duly authorized.
|
Dated:
|
February 27, 2017
|
||
|
NELNET, INC
|
|||
|
By:
|
/s/ JEFFREY R. NOORDHOEK
|
||
|
Name: Jeffrey R. Noordhoek
|
|||
|
Title: Chief Executive Officer
|
|||
|
(Principal Executive Officer)
|
|||
Pursuant to the requirements of the Securities Exchange Act of 1934, this report has been signed below by the following persons on behalf of the registrant and in the capacities and on the dates indicated.
|
Signature
|
Title
|
Date
|
||
|
/s/ JEFFREY R. NOORDHOEK
|
Chief Executive Officer (Principal Executive Officer)
|
February 27, 2017
|
||
|
Jeffrey R. Noordhoek
|
||||
|
/s/ JAMES D. KRUGER
|
Chief Financial Officer (Principal Financial Officer and Principal Accounting Officer)
|
February 27, 2017
|
||
|
James D. Kruger
|
||||
|
/s/ MICHAEL S. DUNLAP
|
Executive Chairman
|
February 27, 2017
|
||
|
Michael S. Dunlap
|
||||
|
/s/ STEPHEN F. BUTTERFIELD
|
Vice Chairman
|
February 27, 2017
|
||
|
Stephen F. Butterfield
|
||||
|
/s/ JAMES P. ABEL
|
Director
|
February 27, 2017
|
||
|
James P. Abel
|
||||
|
/s/ WILLIAM R. CINTANI
|
Director
|
February 27, 2017
|
||
|
William R. Cintani
|
||||
|
/s/ KATHLEEN A. FARRELL
|
Director
|
February 27, 2017
|
||
|
Kathleen A. Farrell
|
||||
|
/s/ DAVID S. GRAFF
|
Director
|
February 27, 2017
|
||
|
David S. Graff
|
||||
|
/s/ THOMAS E. HENNING
|
Director
|
February 27, 2017
|
||
|
Thomas E. Henning
|
||||
|
/s/ KIMBERLY K. RATH
|
Director
|
February 27, 2017
|
||
|
Kimberly K. Rath
|
||||
|
/s/ MICHAEL D. REARDON
|
Director
|
February 27, 2017
|
||
|
Michael D. Reardon
|
||||
78
NELNET, INC. AND SUBSIDIARIES
Index to Consolidated Financial Statements
|
Page
|
|
|
F-2
|
|
|
F-3
|
|
|
F-4
|
|
|
F-5
|
|
|
F-6
|
|
|
F-7
|
|
|
F-8
|
|
Report of Independent Registered Public Accounting Firm
The Board of Directors and Shareholders
Nelnet, Inc.:
We have audited the accompanying consolidated balance sheets of Nelnet, Inc. and subsidiaries (the Company) as of
December 31, 2016
and
2015
, and the related consolidated statements of income, comprehensive income, shareholders' equity, and cash flows for each of the years in the three-year period ended
December 31, 2016
. These consolidated financial statements are the responsibility of the Company's management. Our responsibility is to express an opinion on these consolidated financial statements based on our audits.
We conducted our audits in accordance with the standards of the Public Company Accounting Oversight Board (United States). Those standards require that we plan and perform the audit to obtain reasonable assurance about whether the financial statements are free of material misstatement. An audit includes examining, on a test basis, evidence supporting the amounts and disclosures in the financial statements. An audit also includes assessing the accounting principles used and significant estimates made by management, as well as evaluating the overall financial statement presentation. We believe that our audits provide a reasonable basis for our opinion.
In our opinion, the consolidated financial statements referred to above present fairly, in all material respects, the financial position of Nelnet, Inc. and subsidiaries as of
December 31, 2016
and
2015
, and the results of their operations and their cash flows for each of the years in the three-year period ended
December 31, 2016
, in conformity with U.S. generally accepted accounting principles.
We also have audited, in accordance with the standards of the Public Company Accounting Oversight Board (United States), Nelnet, Inc.'s internal control over financial reporting as of
December 31, 2016
, based on criteria established in
Internal Control - Integrated Framework (2013)
issued by the Committee of Sponsoring Organizations of the Treadway Commission (COSO), and our report dated
February 27, 2017
expressed an unqualified opinion on the effectiveness of the Company's internal control over financial reporting.
/s/ KPMG LLP
Lincoln, Nebraska
February 27, 2017
F-2
|
NELNET, INC. AND SUBSIDIARIES
|
||||||
|
|
||||||
|
December 31, 2016 and 2015
|
||||||
|
|
2016
|
2015
|
||||
|
|
(Dollars in thousands, except share data)
|
|||||
|
Assets:
|
|
|
||||
|
Student loans receivable (net of allowance for loan losses of $51,842 and $50,498, respectively)
|
$
|
24,903,724
|
|
28,324,552
|
|
|
|
Cash and cash equivalents:
|
|
|
|
|
||
|
Cash and cash equivalents - not held at a related party
|
7,841
|
|
11,379
|
|
||
|
Cash and cash equivalents - held at a related party
|
61,813
|
|
52,150
|
|
||
|
Total cash and cash equivalents
|
69,654
|
|
63,529
|
|
||
|
Investments and notes receivable
|
254,144
|
|
303,681
|
|
||
|
Restricted cash
|
980,961
|
|
832,624
|
|
||
|
Restricted cash - due to customers
|
119,702
|
|
144,771
|
|
||
|
Accrued interest receivable
|
391,264
|
|
383,825
|
|
||
|
Accounts receivable (net of allowance for doubtful accounts of $1,549 and $2,003, respectively)
|
43,972
|
|
51,345
|
|
||
|
Goodwill
|
147,312
|
|
146,000
|
|
||
|
Intangible assets, net
|
47,813
|
|
51,062
|
|
||
|
Property and equipment, net
|
123,786
|
|
80,482
|
|
||
|
Other assets
|
10,245
|
|
8,583
|
|
||
|
Fair value of derivative instruments
|
87,531
|
|
28,690
|
|
||
|
Total assets
|
$
|
27,180,108
|
|
30,419,144
|
|
|
|
Liabilities:
|
|
|
|
|
||
|
Bonds and notes payable
|
$
|
24,668,490
|
|
28,105,921
|
|
|
|
Accrued interest payable
|
45,677
|
|
31,507
|
|
||
|
Other liabilities
|
197,488
|
|
169,906
|
|
||
|
Due to customers
|
119,702
|
|
144,771
|
|
||
|
Fair value of derivative instruments
|
77,826
|
|
74,881
|
|
||
|
Total liabilities
|
25,109,183
|
|
28,526,986
|
|
||
|
Commitments and contingencies
|
||||||
|
Equity:
|
||||||
|
Nelnet, Inc. shareholders' equity:
|
|
|
|
|
||
|
Preferred stock, $0.01 par value. Authorized 50,000,000 shares; no shares issued or outstanding
|
—
|
|
—
|
|
||
|
Common stock:
|
||||||
|
Class A, $0.01 par value. Authorized 600,000,000 shares; issued and outstanding 30,628,112 shares and 32,476,528 shares, respectively
|
306
|
|
325
|
|
||
|
Class B, convertible, $0.01 par value. Authorized 60,000,000 shares; issued and outstanding 11,476,932 shares
|
115
|
|
115
|
|
||
|
Additional paid-in capital
|
420
|
|
—
|
|
||
|
Retained earnings
|
2,056,084
|
|
1,881,708
|
|
||
|
Accumulated other comprehensive earnings
|
4,730
|
|
2,284
|
|
||
|
Total Nelnet, Inc. shareholders' equity
|
2,061,655
|
|
1,884,432
|
|
||
|
Noncontrolling interests
|
9,270
|
|
7,726
|
|
||
|
Total equity
|
2,070,925
|
|
1,892,158
|
|
||
|
Total liabilities and equity
|
$
|
27,180,108
|
|
30,419,144
|
|
|
|
Supplemental information - assets and liabilities of consolidated education lending variable interest entities:
|
||||||
|
Student loans receivable
|
$
|
25,090,530
|
|
28,499,180
|
|
|
|
Restricted cash
|
970,306
|
|
814,294
|
|
||
|
Accrued interest receivable and other assets
|
390,504
|
|
384,230
|
|
||
|
Bonds and notes payable
|
(25,105,704
|
)
|
(28,405,133
|
)
|
||
|
Other liabilities
|
(290,996
|
)
|
(353,607
|
)
|
||
|
Fair value of derivative instruments, net
|
(66,453
|
)
|
(64,080
|
)
|
||
|
Net assets of consolidated education lending variable interest entities
|
$
|
988,187
|
|
874,884
|
|
|
See accompanying notes to consolidated financial statements.
F-3
|
NELNET, INC. AND SUBSIDIARIES
|
|||||||||
|
|
|||||||||
|
Years ended December 31, 2016, 2015, and 2014
|
|||||||||
|
|
|||||||||
|
|
2016
|
2015
|
2014
|
||||||
|
(Dollars in thousands, except share data)
|
|||||||||
|
Interest income:
|
|
|
|
||||||
|
Loan interest
|
$
|
751,280
|
|
726,258
|
|
703,007
|
|
||
|
Investment interest
|
9,466
|
|
7,851
|
|
6,793
|
|
|||
|
Total interest income
|
760,746
|
|
734,109
|
|
709,800
|
|
|||
|
Interest expense:
|
|
|
|
|
|
|
|||
|
Interest on bonds and notes payable
|
388,183
|
|
302,210
|
|
273,237
|
|
|||
|
Net interest income
|
372,563
|
|
431,899
|
|
436,563
|
|
|||
|
Less provision for loan losses
|
13,500
|
|
10,150
|
|
9,500
|
|
|||
|
Net interest income after provision for loan losses
|
359,063
|
|
421,749
|
|
427,063
|
|
|||
|
Other income:
|
|
|
|
|
|
|
|||
|
Loan systems and servicing revenue
|
214,846
|
|
239,858
|
|
240,414
|
|
|||
|
Tuition payment processing, school information, and campus commerce revenue
|
132,730
|
|
120,365
|
|
98,156
|
|
|||
|
Communications revenue
|
17,659
|
|
—
|
|
—
|
|
|||
|
Enrollment services revenue
|
4,326
|
|
51,073
|
|
62,949
|
|
|||
|
Other income
|
53,929
|
|
47,262
|
|
73,936
|
|
|||
|
Gain on sale of loans and debt repurchases, net
|
7,981
|
|
5,153
|
|
3,651
|
|
|||
|
Derivative market value and foreign currency adjustments and derivative settlements, net
|
49,795
|
|
4,401
|
|
15,860
|
|
|||
|
Total other income
|
481,266
|
|
468,112
|
|
494,966
|
|
|||
|
Operating expenses:
|
|
|
|
|
|
|
|||
|
Salaries and benefits
|
255,924
|
|
247,914
|
|
228,079
|
|
|||
|
Depreciation and amortization
|
33,933
|
|
26,343
|
|
21,134
|
|
|||
|
Loan servicing fees
|
25,750
|
|
30,213
|
|
27,009
|
|
|||
|
Cost to provide communications services
|
6,866
|
|
—
|
|
—
|
|
|||
|
Cost to provide enrollment services
|
3,623
|
|
41,733
|
|
49,985
|
|
|||
|
Other expenses
|
115,419
|
|
123,014
|
|
126,303
|
|
|||
|
Total operating expenses
|
441,515
|
|
469,217
|
|
452,510
|
|
|||
|
Income before income taxes
|
398,814
|
|
420,644
|
|
469,519
|
|
|||
|
Income tax expense
|
141,313
|
|
152,380
|
|
160,238
|
|
|||
|
Net income
|
257,501
|
|
268,264
|
|
309,281
|
|
|||
|
Net income attributable to noncontrolling interests
|
750
|
|
285
|
|
1,671
|
|
|||
|
Net income attributable to Nelnet, Inc.
|
$
|
256,751
|
|
267,979
|
|
307,610
|
|
||
|
Earnings per common share:
|
|||||||||
|
Net income attributable to Nelnet, Inc. shareholders - basic and diluted
|
$
|
6.02
|
|
5.89
|
|
6.62
|
|
||
|
Weighted average common shares outstanding - basic and diluted
|
42,669,070
|
|
45,529,340
|
|
46,469,615
|
|
|||
See accompanying notes to consolidated financial statements.
F-4
|
NELNET, INC. AND SUBSIDIARIES
|
|||||||||
|
Consolidated Statements of Comprehensive Income
|
|||||||||
|
Years ended December 31, 2016, 2015, and 2014
|
|||||||||
|
2016
|
2015
|
2014
|
|||||||
|
(Dollars in thousands)
|
|||||||||
|
Net income
|
$
|
257,501
|
|
268,264
|
|
309,281
|
|
||
|
Other comprehensive income (loss):
|
|||||||||
|
Available-for-sale securities:
|
|||||||||
|
Unrealized holding gains (losses) arising during period, net
|
5,789
|
|
(1,570
|
)
|
9,006
|
|
|||
|
Reclassification adjustment for gains recognized in net income, net of losses
|
(1,907
|
)
|
(2,955
|
)
|
(8,506
|
)
|
|||
|
Income tax effect
|
(1,436
|
)
|
1,674
|
|
(184
|
)
|
|||
|
Total other comprehensive income (loss)
|
2,446
|
|
(2,851
|
)
|
316
|
|
|||
|
Comprehensive income
|
259,947
|
|
265,413
|
|
309,597
|
|
|||
|
Comprehensive income attributable to noncontrolling interest
|
750
|
|
285
|
|
1,671
|
|
|||
|
Comprehensive income attributable to Nelnet, Inc.
|
$
|
259,197
|
|
265,128
|
|
307,926
|
|
||
See accompanying notes to consolidated financial statements.
F-5
|
NELNET, INC. AND SUBSIDIARIES
|
|||||||||||||||||||||||||||||||||
|
Consolidated Statements of Shareholders' Equity
|
|||||||||||||||||||||||||||||||||
|
Years ended December 31, 2016, 2015, and 2014
|
|||||||||||||||||||||||||||||||||
|
Nelnet, Inc. Shareholders
|
|||||||||||||||||||||||||||||||||
|
Preferred stock shares
|
Common stock shares
|
Preferred stock
|
Class A common stock
|
Class B common stock
|
Additional paid-in capital
|
Retained earnings
|
Accumulated other comprehensive earnings
|
Noncontrolling interests
|
Total equity
|
||||||||||||||||||||||||
|
Class A
|
Class B
|
||||||||||||||||||||||||||||||||
|
(Dollars in thousands, except share data)
|
|||||||||||||||||||||||||||||||||
|
Balance as of December 31, 2013
|
—
|
|
34,881,338
|
|
11,495,377
|
|
$
|
—
|
|
349
|
|
115
|
|
24,887
|
|
1,413,492
|
|
4,819
|
|
328
|
|
1,443,990
|
|
||||||||||
|
Issuance of noncontrolling interest
|
—
|
|
—
|
|
—
|
|
—
|
|
—
|
|
—
|
|
—
|
|
—
|
|
—
|
|
201
|
|
201
|
|
|||||||||||
|
Net income
|
—
|
|
—
|
|
—
|
|
—
|
|
—
|
|
—
|
|
—
|
|
307,610
|
|
—
|
|
1,671
|
|
309,281
|
|
|||||||||||
|
Other comprehensive income
|
—
|
|
—
|
|
—
|
|
—
|
|
—
|
|
—
|
|
—
|
|
—
|
|
316
|
|
—
|
|
316
|
|
|||||||||||
|
Distribution to noncontrolling interest
|
—
|
|
—
|
|
—
|
|
—
|
|
—
|
|
—
|
|
—
|
|
—
|
|
—
|
|
(1,970
|
)
|
(1,970
|
)
|
|||||||||||
|
Cash dividends on Class A and Class B common stock - $0.40 per share
|
—
|
|
—
|
|
—
|
|
—
|
|
—
|
|
—
|
|
—
|
|
(18,542
|
)
|
—
|
|
—
|
|
(18,542
|
)
|
|||||||||||
|
Issuance of common stock, net of forfeitures
|
—
|
|
248,290
|
|
—
|
|
—
|
|
3
|
|
—
|
|
3,551
|
|
—
|
|
—
|
|
—
|
|
3,554
|
|
|||||||||||
|
Compensation expense for stock based awards
|
—
|
|
—
|
|
—
|
|
—
|
|
—
|
|
—
|
|
4,561
|
|
—
|
|
—
|
|
—
|
|
4,561
|
|
|||||||||||
|
Repurchase of common stock
|
—
|
|
(381,689
|
)
|
—
|
|
—
|
|
(4
|
)
|
—
|
|
(15,709
|
)
|
—
|
|
—
|
|
—
|
|
(15,713
|
)
|
|||||||||||
|
Conversion of common stock
|
—
|
|
8,445
|
|
(8,445
|
)
|
—
|
|
—
|
|
—
|
|
—
|
|
—
|
|
—
|
|
—
|
|
—
|
|
|||||||||||
|
Balance as of December 31, 2014
|
—
|
|
34,756,384
|
|
11,486,932
|
|
—
|
|
348
|
|
115
|
|
17,290
|
|
1,702,560
|
|
5,135
|
|
230
|
|
1,725,678
|
|
|||||||||||
|
Issuance of noncontrolling interest
|
—
|
|
—
|
|
—
|
|
—
|
|
—
|
|
—
|
|
—
|
|
—
|
|
—
|
|
7,443
|
|
7,443
|
|
|||||||||||
|
Net income
|
—
|
|
—
|
|
—
|
|
—
|
|
—
|
|
—
|
|
—
|
|
267,979
|
|
—
|
|
285
|
|
268,264
|
|
|||||||||||
|
Other comprehensive loss
|
—
|
|
—
|
|
—
|
|
—
|
|
—
|
|
—
|
|
—
|
|
—
|
|
(2,851
|
)
|
—
|
|
(2,851
|
)
|
|||||||||||
|
Distribution to noncontrolling interest
|
—
|
|
—
|
|
—
|
|
—
|
|
—
|
|
—
|
|
—
|
|
—
|
|
—
|
|
(232
|
)
|
(232
|
)
|
|||||||||||
|
Cash dividends on Class A and Class B common stock - $0.42 per share
|
—
|
|
—
|
|
—
|
|
—
|
|
—
|
|
—
|
|
—
|
|
(19,025
|
)
|
—
|
|
—
|
|
(19,025
|
)
|
|||||||||||
|
Issuance of common stock, net of forfeitures
|
—
|
|
159,303
|
|
—
|
|
—
|
|
2
|
|
—
|
|
3,860
|
|
—
|
|
—
|
|
—
|
|
3,862
|
|
|||||||||||
|
Compensation expense for stock based awards
|
—
|
|
—
|
|
—
|
|
—
|
|
—
|
|
—
|
|
5,188
|
|
—
|
|
—
|
|
—
|
|
5,188
|
|
|||||||||||
|
Repurchase of common stock
|
—
|
|
(2,449,159
|
)
|
—
|
|
—
|
|
(25
|
)
|
—
|
|
(26,338
|
)
|
(69,806
|
)
|
—
|
|
—
|
|
(96,169
|
)
|
|||||||||||
|
Conversion of common stock
|
—
|
|
10,000
|
|
(10,000
|
)
|
—
|
|
—
|
|
—
|
|
—
|
|
—
|
|
—
|
|
—
|
|
—
|
|
|||||||||||
|
Balance as of December 31, 2015
|
—
|
|
32,476,528
|
|
11,476,932
|
|
—
|
|
325
|
|
115
|
|
—
|
|
1,881,708
|
|
2,284
|
|
7,726
|
|
1,892,158
|
|
|||||||||||
|
Issuance of noncontrolling interests
|
—
|
|
—
|
|
—
|
|
—
|
|
—
|
|
—
|
|
—
|
|
—
|
|
—
|
|
1,366
|
|
1,366
|
|
|||||||||||
|
Net income
|
—
|
|
—
|
|
—
|
|
—
|
|
—
|
|
—
|
|
—
|
|
256,751
|
|
—
|
|
750
|
|
257,501
|
|
|||||||||||
|
Other comprehensive income
|
—
|
|
—
|
|
—
|
|
—
|
|
—
|
|
—
|
|
—
|
|
—
|
|
2,446
|
|
—
|
|
2,446
|
|
|||||||||||
|
Distribution to noncontrolling interest
|
—
|
|
—
|
|
—
|
|
—
|
|
—
|
|
—
|
|
—
|
|
—
|
|
—
|
|
(572
|
)
|
(572
|
)
|
|||||||||||
|
Cash dividends on Class A and Class B common stock - $0.50 per share
|
—
|
|
—
|
|
—
|
|
—
|
|
—
|
|
—
|
|
—
|
|
(21,188
|
)
|
—
|
|
—
|
|
(21,188
|
)
|
|||||||||||
|
Issuance of common stock, net of forfeitures
|
—
|
|
189,952
|
|
—
|
|
—
|
|
1
|
|
—
|
|
4,218
|
|
—
|
|
—
|
|
—
|
|
4,219
|
|
|||||||||||
|
Compensation expense for stock based awards
|
—
|
|
—
|
|
—
|
|
—
|
|
—
|
|
—
|
|
4,086
|
|
—
|
|
—
|
|
—
|
|
4,086
|
|
|||||||||||
|
Repurchase of common stock
|
—
|
|
(2,038,368
|
)
|
—
|
|
—
|
|
(20
|
)
|
—
|
|
(7,884
|
)
|
(61,187
|
)
|
—
|
|
—
|
|
(69,091
|
)
|
|||||||||||
|
Balance as of December 31, 2016
|
—
|
|
30,628,112
|
|
11,476,932
|
|
$
|
—
|
|
306
|
|
115
|
|
420
|
|
2,056,084
|
|
4,730
|
|
9,270
|
|
2,070,925
|
|
||||||||||
See accompanying notes to consolidated financial statements.
F-6
|
NELNET, INC. AND SUBSIDIARIES
|
||||||||||
|
|
||||||||||
|
Years ended December 31, 2016, 2015, and 2014
|
||||||||||
|
|
2016
|
2015
|
2014
|
|||||||
|
(Dollars in thousands)
|
||||||||||
|
Net income attributable to Nelnet, Inc.
|
$
|
256,751
|
|
267,979
|
|
307,610
|
|
|||
|
Net income attributable to noncontrolling interest
|
750
|
|
285
|
|
1,671
|
|
||||
|
Net income
|
257,501
|
|
268,264
|
|
309,281
|
|
||||
|
Adjustments to reconcile net income to net cash provided by operating activities, net of acquisitions:
|
|
|
|
|
||||||
|
Depreciation and amortization, including debt discounts and student loan premiums and deferred origination costs
|
122,547
|
|
123,736
|
|
107,969
|
|
||||
|
Student loan discount accretion
|
(40,617
|
)
|
(43,766
|
)
|
(43,479
|
)
|
||||
|
Provision for loan losses
|
13,500
|
|
10,150
|
|
9,500
|
|
||||
|
Derivative market value adjustment
|
(59,895
|
)
|
15,150
|
|
20,310
|
|
||||
|
Foreign currency transaction adjustment
|
(11,849
|
)
|
(43,801
|
)
|
(58,013
|
)
|
||||
|
Payments to enter into derivative instruments
|
—
|
|
(2,936
|
)
|
(9,087
|
)
|
||||
|
Proceeds to terminate/amend derivative instruments, net of payments
|
3,999
|
|
65,527
|
|
1,765
|
|
||||
|
(Gain) loss on sale of loans, net
|
—
|
|
(351
|
)
|
2,964
|
|
||||
|
Gain from debt repurchases
|
(7,981
|
)
|
(4,802
|
)
|
(6,615
|
)
|
||||
|
Gain from sales of available-for-sale securities, net
|
(1,907
|
)
|
(2,955
|
)
|
(8,506
|
)
|
||||
|
Proceeds (purchases) related to trading securities, net
|
1,339
|
|
(3,120
|
)
|
3,128
|
|
||||
|
Deferred income tax expense
|
27,005
|
|
7,049
|
|
19,659
|
|
||||
|
Non-cash compensation expense
|
4,348
|
|
5,347
|
|
4,699
|
|
||||
|
Other
|
2,876
|
|
3,875
|
|
7,127
|
|
||||
|
(Increase) decrease in accrued interest receivable
|
(7,439
|
)
|
(3,819
|
)
|
5,205
|
|
||||
|
Decrease in accounts receivable
|
7,454
|
|
1,061
|
|
6,690
|
|
||||
|
(Increase) decrease in other assets
|
(2,203
|
)
|
375
|
|
2,372
|
|
||||
|
Increase in accrued interest payable
|
14,170
|
|
5,117
|
|
3,009
|
|
||||
|
Increase (decrease) in other liabilities
|
2,409
|
|
(8,736
|
)
|
(20,529
|
)
|
||||
|
Net cash provided by operating activities
|
325,257
|
|
391,365
|
|
357,449
|
|
||||
|
Cash flows from investing activities, net of acquisitions:
|
|
|
|
|
||||||
|
Purchases of student loans and student loan residual interests
|
(349,144
|
)
|
(2,189,450
|
)
|
(3,753,936
|
)
|
||||
|
Net proceeds from student loan repayments, claims, capitalized interest, and other
|
3,735,772
|
|
3,668,302
|
|
3,700,005
|
|
||||
|
Proceeds from sale of student loans
|
44,760
|
|
3,996
|
|
50,190
|
|
||||
|
Purchases of available-for-sale securities
|
(94,673
|
)
|
(100,476
|
)
|
(192,998
|
)
|
||||
|
Proceeds from sales of available-for-sale securities
|
144,252
|
|
95,758
|
|
241,793
|
|
||||
|
Purchases of investments and issuance of notes receivable
|
(22,361
|
)
|
(93,948
|
)
|
(45,925
|
)
|
||||
|
Proceeds from investments and notes receivable
|
15,898
|
|
29,799
|
|
15,819
|
|
||||
|
Purchases of property and equipment
|
(67,602
|
)
|
(16,761
|
)
|
(26,488
|
)
|
||||
|
(Increase) decrease in restricted cash, net
|
(147,487
|
)
|
67,108
|
|
(51,135
|
)
|
||||
|
Business and asset acquisitions, net of cash acquired
|
—
|
|
(46,966
|
)
|
(46,833
|
)
|
||||
|
Net cash provided by (used in) investing activities
|
3,259,415
|
|
1,417,362
|
|
(109,508
|
)
|
||||
|
Cash flows from financing activities, net of borrowings assumed:
|
|
|
|
|
||||||
|
Payments on bonds and notes payable
|
(4,134,890
|
)
|
(4,368,180
|
)
|
(3,632,741
|
)
|
||||
|
Proceeds from issuance of bonds and notes payable
|
650,909
|
|
2,614,595
|
|
3,502,316
|
|
||||
|
Payments of debt issuance costs
|
(5,845
|
)
|
(11,162
|
)
|
(14,934
|
)
|
||||
|
Dividends paid
|
(21,188
|
)
|
(19,025
|
)
|
(18,542
|
)
|
||||
|
Repurchases of common stock
|
(69,091
|
)
|
(96,169
|
)
|
(15,713
|
)
|
||||
|
Proceeds from issuance of common stock
|
889
|
|
801
|
|
656
|
|
||||
|
Issuance of noncontrolling interest
|
1,241
|
|
3,693
|
|
201
|
|
||||
|
Distribution to noncontrolling interest
|
(572
|
)
|
(232
|
)
|
(1,970
|
)
|
||||
|
Net cash used in financing activities
|
(3,578,547
|
)
|
(1,875,679
|
)
|
(180,727
|
)
|
||||
|
Net increase (decrease) in cash and cash equivalents
|
6,125
|
|
(66,952
|
)
|
67,214
|
|
||||
|
Cash and cash equivalents, beginning of year
|
63,529
|
|
130,481
|
|
63,267
|
|
||||
|
Cash and cash equivalents, end of year
|
$
|
69,654
|
|
63,529
|
|
130,481
|
|
|||
|
Cash disbursements made for:
|
|
|
|
|
||||||
|
Interest
|
$
|
301,118
|
|
228,248
|
|
210,700
|
|
|||
|
Income taxes, net of refunds
|
$
|
115,415
|
|
147,235
|
|
155,828
|
|
|||
|
Noncash investing and financing activities:
|
||||||||||
|
Student loans and other assets acquired
|
$
|
—
|
|
2,025,453
|
|
2,571,997
|
|
|||
|
Sale of education lending subsidiary, including student loans and other assets
|
$
|
—
|
|
—
|
|
246,376
|
|
|||
|
Note receivable obtained in connection with sale of education lending subsidiary
|
$
|
—
|
|
—
|
|
20,737
|
|
|||
|
Borrowings and other liabilities transferred in sale of education lending subsidiary
|
$
|
—
|
|
—
|
|
225,139
|
|
|||
|
Borrowings and other liabilities assumed in acquisition of student loans
|
$
|
—
|
|
1,885,453
|
|
2,444,874
|
|
|||
|
Issuance of noncontrolling interest
|
$
|
125
|
|
3,750
|
|
—
|
|
|||
Supplemental disclosures of noncash operating and investing activities regarding the Company's business acquisitions are contained in note 7.
See accompanying notes to consolidated financial statements.
F-7
NELNET, INC. AND SUBSIDIARIES
Notes to Consolidated Financial Statements
(Dollars in thousands, except share amounts, unless otherwise noted)
|
1.
|
Description of Business
|
Nelnet, Inc. and its subsidiaries (“Nelnet” or the “Company”) is a diverse company with a focus on delivering education-related products and services and student loan asset management. The largest operating businesses engage in student loan servicing, tuition payment processing and school information systems, and communications. A significant portion of the Company's revenue is net interest income earned on a portfolio of federally insured student loans. The Company also makes investments to further diversify the Company both within and outside of its historical core education-related businesses, including, but not limited to, investments in real estate and start-up ventures. Substantially all revenue from external customers is earned, and all long-lived assets are located, in the United States.
The Company was formed as a Nebraska corporation in 1978 to service federal student loans for two local banks. The Company built on this initial foundation as a servicer to become a leading originator, holder, and servicer of federal student loans, principally consisting of loans originated under the Federal Family Education Loan Program (“FFELP” or “FFEL Program”) of the U.S. Department of Education (the “Department”).
Effective July 1, 2010, the Health Care and Education Reconciliation Act of 2010 (the "Reconciliation Act of 2010”) prohibits new loan originations under the FFEL Program and requires that all new federal student loan originations be made through the Federal Direct Loan Program. This law does not alter or affect the terms and conditions of existing FFELP loans. As a result of this law, the Company no longer originates new FFELP loans. However, the Company believes there may be continued opportunities to purchase FFELP loan portfolios from current FFELP loan holders as the program winds down. To reduce its reliance on interest income on student loans, the Company has expanded its services and products. This expansion has been accomplished through internal growth and innovation as well as business acquisitions.
The Company has four reportable operating segments. The Company's reportable operating segments include:
•
Loan Systems and Servicing
•
Tuition Payment Processing and Campus Commerce
•
Communications
•
Asset Generation and Management
A description of each reportable operating segment is included below. See note 14 for additional information on the Company's segment reporting.
Loan Systems and Servicing
The following are the primary products and services the Company offers as part of its Loan Systems and Servicing operating segment:
|
•
|
Servicing federally-owned student loans for the Department
|
|
•
|
Servicing FFELP loans
|
|
•
|
Originating and servicing private education and consumer loans
|
|
•
|
Providing student loan servicing software and other information technology products and services
|
|
•
|
Providing outsourced services including call center, processing, and marketing services
|
In addition, this segment provided servicing and outsourcing services for FFELP guaranty agencies, including FFELP guaranty collection services, through June 30, 2016.
The Loan Systems and Servicing operating segment provides for the servicing of the Company's student loan portfolio and the portfolios of third parties. The loan servicing activities include loan conversion activities, application processing, borrower updates, customer service, payment processing, due diligence procedures, funds management reconciliations, and claim processing. These activities are performed internally for the Company's portfolio in addition to generating external fee revenue when performed for third-party clients.
The Company is one of four private sector companies awarded a student loan servicing contract by the Department to provide additional servicing capacity for loans owned by the Department.
F-8
NELNET, INC. AND SUBSIDIARIES
Notes to Consolidated Financial Statements – (continued)
(Dollars in thousands, except share amounts, unless otherwise noted)
This operating segment also provides student loan servicing software, which is used internally by the Company and licensed to third-party student loan holders and servicers. These software systems have been adapted so that they can be offered as hosted servicing software solutions usable by third parties to service various types of student loans, including Federal Direct Loan Program and FFEL Program loans.
This segment also provides business process outsourcing specializing in contact center management. The contact center solutions and services include taking inbound calls, helping with outreach campaigns and sales, and interacting with customers through multi-channels.
In addition, this operating segment provided servicing activities for guaranty agencies, which serve as intermediaries between the Department and FFELP lenders, and are responsible for paying the claims made on defaulted loans. The services provided by the Company included providing software and data center services, borrower and loan updates, default aversion tracking services, claim processing services, and post-default collection services. The Company's guaranty servicing and collection revenue was earned from two guaranty servicing clients. A contract with one client expired on October 31, 2015, and was not renewed. The remaining guaranty servicing client exited the FFELP guaranty business at the end of their contract term on June 30, 2016, and after this date the Company has no remaining guaranty servicing and collection revenue.
Tuition Payment Processing and Campus Commerce
The Company's Tuition Payment Processing and Campus Commerce operating segment provides products and services to help students and families manage the payment of education costs at all levels (K-12 and higher education). In addition, this operating segment provides school information system software for private and faith-based schools that help schools automate administrative processes such as admissions, scheduling, student billing, attendance, and grade book management. This segment also provides innovative education-focused technologies, services, and support solutions to help schools with the everyday challenges of collecting and processing commerce data.
In the K-12 market, the Company offers actively managed tuition payment plans and billing services, school information system software, and assistance with financial needs assessment and donor management. In the higher education market, the Company primarily offers actively managed tuition payment plans and campus commerce technologies and payment processing.
Communications
On December 31, 2015, the Company purchased the majority of the ownership interests of Allo Communications LLC (“Allo”). Allo provides pure fiber optic service to homes and businesses for internet, broadband, television, and telephone services. The acquisition of Allo provides additional diversification of the Company's revenues and cash flows outside of education. In addition, the acquisition leverages the Company's existing infrastructure, customer service capabilities and call centers, and financial strength and liquidity for continued growth. For financial reporting purposes, the Company provides the operating results of Allo as a separate reportable operating segment. The Allo assets acquired and liabilities assumed were recorded by the Company at their respective estimated fair values at the date of acquisition. As such, Allo’s assets and liabilities as of December 31, 2015 are included in the Company’s consolidated balance sheet. However, Allo had no impact on the consolidated statement of income for 2015. Beginning January 1, 2016, the Company began to reflect the operations of Allo in the consolidated statements of income.
Allo derives its revenue primarily from the sale of advanced communication services to residential and business customers in Nebraska. Internet, broadband, and television services include revenue from residential and business customers for subscriptions to Allo's video and data products. Allo data services provide high-speed internet access over Allo's all-fiber network at various symmetrical speeds of up to 1 gigabit per second. Local calling services include fiber telephone service and other basic services. Long-distance services include traditional domestic and international long distance which enables customers to make calls that terminate outside their local calling area.
F-9
NELNET, INC. AND SUBSIDIARIES
Notes to Consolidated Financial Statements – (continued)
(Dollars in thousands, except share amounts, unless otherwise noted)
Asset Generation and Management
The Company's Asset Generation and Management operating segment includes the acquisition, management, and ownership of the Company's student loan assets. Nearly all student loan assets included in this segment are loans originated under the FFEL Program, including the Stafford Loan Program, the PLUS Loan program, and loans that reflect the consolidation into a single loan of certain previously separate borrower obligations (“Consolidation”). The Company generates a substantial portion of its earnings from the spread, referred to as the Company's student loan spread, between the yield it receives on its student loan portfolio and the associated costs to finance such portfolio. The student loan assets are held in a series of education lending subsidiaries and associated securitization trusts designed specifically for this purpose. In addition to the student loan spread earned on its portfolio, all costs and activity associated with managing the portfolio, such as servicing of the assets and debt maintenance, are included in this segment.
Corporate and Other Activities
Other business activities and operating segments that are not reportable are combined and included in Corporate and Other Activities. Corporate and Other Activities include the following items:
|
•
|
The operating results of Whitetail Rock Capital Management, LLC ("WRCM"), the Company's SEC-registered investment advisory subsidiary
|
|
•
|
The operating results of the Enrollment Services business
|
|
•
|
Income earned on certain investment activities
|
|
•
|
Interest expense incurred on unsecured debt transactions
|
|
•
|
Other product and service offerings that are not considered reportable operating segments
|
Corporate and Other Activities also include certain corporate activities and overhead functions related to executive management, human resources, accounting, legal, enterprise risk management, information technology, occupancy, and marketing. These costs are allocated to each operating segment based on estimated use of such activities and services.
|
2.
|
Summary of Significant Accounting Policies and Practices
|
Consolidation
The consolidated financial statements include the accounts of Nelnet, Inc. and its consolidated subsidiaries. In addition, the accounts of all variable interest entities (“VIEs”) of which the Company has determined that it is the primary beneficiary are included in the consolidated financial statements. All significant intercompany balances and transactions have been eliminated in consolidation.
Variable Interest Entities
The following entities are VIEs of which the Company has determined that it is the primary beneficiary. The primary beneficiary is the entity which has both: (1) the power to direct the activities of the VIE that most significantly impact the VIE's economic performance, and (2) the obligation to absorb losses or receive benefits of the entity that could potentially be significant to the VIE.
The Company's education lending subsidiaries are engaged in the securitization of education finance assets. These education lending subsidiaries hold beneficial interests in eligible loans, subject to creditors with specific interests. The liabilities of the Company's education lending subsidiaries are not the direct obligations of Nelnet, Inc. or any of its other subsidiaries. Each education lending subsidiary is structured to be bankruptcy remote, meaning that it should not be consolidated in the event of bankruptcy of the parent company or any other subsidiary. The Company is generally the administrator and master servicer of the securitized assets held in its education lending subsidiaries and owns the residual interest of the securitization trusts. As a result, for accounting purposes, the transfers of student loans to the securitization trusts do not qualify as sales. Accordingly, all the financial activities and related assets and liabilities, including debt, of the securitizations are reflected in the Company's consolidated financial statements and are summarized as supplemental information on the balance sheet.
The Company owns 91.5 percent of Allo Communications LLC. See note 1, “Description of Business,” for a description of Allo, including the primary services offered. In addition to the Company’s equity investment, Nelnet, Inc. (the parent) issued a $200.0 million line of credit to Allo on December 30, 2015. The line of credit had $58.0 million and $13.9 million outstanding as of December 31 2016 and 2015, respectively. Nelnet, Inc.’s maximum exposure to loss as a result of its involvement with Allo is
F-10
NELNET, INC. AND SUBSIDIARIES
Notes to Consolidated Financial Statements – (continued)
(Dollars in thousands, except share amounts, unless otherwise noted)
equal to its equity investment and the balance of the line of credit. The amounts owed by Allo to Nelnet, Inc., including the interest costs incurred by Allo and interest earnings recognized by Nelnet, Inc., are not reflected in the Company’s consolidated balance sheet as they were eliminated in consolidation. All of Allo’s financial activities and related assets and liabilities, excluding the line of credit, are reflected in the Company’s consolidated financial statements. See note 14, “Segment Reporting,” for disclosure of Allo’s total assets, note 9, "Goodwill," for disclosure of Allo's goodwill, and note 10, “Property and Equipment,” for disclosure of Allo’s fixed assets. Allo's goodwill and property and equipment comprise the majority of its assets. The assets recognized as a result of consolidating Allo are the property of Allo and are not available for any other purpose, other than to Nelnet, Inc. as a secured lender under Allo's line of credit.
Reclassifications
Certain amounts previously reported within the Company's consolidated balance sheet and statements of income have been reclassified to conform to the current period presentation. These reclassifications are summarized below:
|
•
|
In April 2015, the Financial Accounting Standards Board ("FASB") issued accounting guidance regarding the presentation of debt issuance costs. The new guidance requires that entities present debt issuance costs related to a debt liability as a direct deduction from that liability on the balance sheet. This guidance became effective for the Company beginning January 1, 2016. As a result of this standard, the Company reclassified its debt issuance costs, which were previously included in "other assets" on the consolidated balance sheet, to "bonds and notes payable."
|
|
•
|
On February 1, 2016, the Company sold
100 percent
of the membership interests in Sparkroom LLC, which includes the majority of the Company's inquiry management products and services within Nelnet Enrollment Services. The Company retained the digital marketing and content solution products and services under the brand name Peterson's within the Nelnet Enrollment Services business, which include test preparation study guides, school directories and databases, career exploration guides, on-line courses, scholarship search and selection data, career planning information and guides, and on-line information about colleges and universities. The Company reclassified the revenue and cost of goods sold attributable to the Peterson's products and services from "enrollment services revenue" and "cost to provide enrollment services" to "other income" and "other expenses," respectively, on the consolidated statements of income. After this reclassification, "enrollment services revenue" and "cost to provide enrollment services" include the operating results of the products and services sold as part of the Sparkroom disposition for all periods presented. These reclassifications had no effect on consolidated net income.
|
Noncontrolling Interest
Noncontrolling interest reflects the proportionate share of membership interest (equity) and net income attributable to the holders of minority membership interests in the following entities:
|
•
|
Whitetail Rock Capital Management, LLC - WRCM is the Company’s SEC-registered investment advisory subsidiary. WRCM issued
10 percent
minority membership interests on January 1, 2012.
|
|
•
|
Allo Communications LLC - On December 31, 2015, the Company purchased
92.5 percent
of the ownership interests of Allo. On January 1, 2016, the Company sold a 1.0 percent ownership interest in Allo to a non-related third-party. The remaining
7.5 percent
of the ownership interests of Allo is owned by Allo management, who has the opportunity to earn an additional
11.5 percent
(up to
19 percent
) of the total ownership interests based on the financial performance of Allo.
|
|
•
|
401 Building, LLC (“401 Building”) - 401 Building is an entity established on October 19, 2015 for the sole purpose of acquiring, developing, and operating a commercial building. The Company owns
50 percent
of 401 Building.
|
|
•
|
TDP Phase Three, LLC (“TDP”) and TDP Phase Three-NMTC ("TDP-NMTC") - TDP and TDP-NMTC are entities that were established in October 2015 for the sole purpose of developing and operating a commercial building. The Company owns
25 percent
of each TDP and TDP-NMTC.
|
|
•
|
330-333 Building, LLC ("330-333 Building") - 330-333 Building is an entity established on January 14, 2016 for the sole purpose of acquiring, developing, and operating a commercial building. The Company owns
50 percent
of 330-333 Building.
|
F-11
NELNET, INC. AND SUBSIDIARIES
Notes to Consolidated Financial Statements – (continued)
(Dollars in thousands, except share amounts, unless otherwise noted)
The Company is a tenant in the 330-333 Building and plans to be a tenant in the buildings being developed by 401 Building and TDP/TDP-NMTC once development is complete. Because the Company, as lessee, is involved in the asset construction, 330-333 Building, 401 Building, TDP, and TDP-NMTC are included in the Company's consolidated financial statements.
Use of Estimates
The preparation of the consolidated financial statements in conformity with U.S. generally accepted accounting principles (“GAAP”) requires management to make a number of estimates and assumptions that affect the reported amounts of assets and liabilities, reported amounts of revenues and expenses, and other disclosures. Actual results may differ from those estimates.
Student Loans Receivable
Student loans consist of federally insured student loans and private education loans. If the Company has the ability and intent to hold loans for the foreseeable future, such loans are held for investment and carried at amortized cost. Amortized cost includes the unamortized premium or discount and capitalized origination costs and fees, all of which are amortized to interest income. Loans which are held-for-investment also have an allowance for loan loss as needed. Any loans the Company has the ability and intent to sell are classified as held for sale and are carried at the lower of cost or fair value. Loans which are held for sale do not have the associated premium or discount and origination costs and fees amortized into interest income and there is also no related allowance for loan losses. There were no loans classified as held for sale as of December 31, 2016 and 2015.
Federally insured loans were originated under the FFEL Program by certain eligible lenders as defined by the Higher Education Act of 1965, as amended (the “Higher Education Act”). These loans, including related accrued interest, are guaranteed at their maximum level permitted under the Higher Education Act by an authorized guaranty agency, which has a contract of reinsurance with the Department. The terms of the loans, which vary on an individual basis, generally provide for repayment in monthly installments of principal and interest. Generally, Stafford and PLUS loans have repayment periods between five and ten years. Consolidation loans have repayment periods of twelve to thirty years. FFELP loans do not require repayment while the borrower is in-school, and during the grace period immediately upon leaving school. The borrower may also be granted a deferment or forbearance for a period of time based on need, during which time the borrower is not considered to be in repayment. Interest continues to accrue on loans in the in-school, deferment, and forbearance program periods. In addition, eligible borrowers may qualify for income-driven repayment plans offered by the Department. These plans determine the borrower's payment amount based on their discretionary income and may extend their repayment period. Interest continues to accrue on the loans under the FFEL Program guidelines based on the interest rates disclosed in the terms of the original loan agreement. Interest rates on loans may be fixed or variable, dependent upon the type of loan, terms of the loan agreements, and date of origination.
Substantially all FFELP loan principal and related accrued interest is guaranteed as provided by the Higher Education Act. These guarantees are subject to the performance of certain loan servicing due diligence procedures stipulated by applicable Department regulations. If these due diligence requirements are not met, affected student loans may not be covered by the guarantees in the event of borrower default. Such student loans are subject to “cure” procedures and reinstatement of the guarantee under certain circumstances.
Student loans receivable also includes private education loans. Private education loans are loans to students or their families that are non-federal loans and loans not insured or guaranteed under the FFELP. These loans are used primarily to bridge the gap between the cost of higher education and the amount funded through financial aid, federal loans, or borrowers' personal resources. The terms of the private education loans, which vary on an individual basis, generally provide for repayment in monthly installments of principal and interest over a period of up to 30 years. The private education loans are not covered by a guarantee or collateral in the event of borrower default.
Allowance for Loan Losses
The allowance for loan losses represents management's estimate of probable losses on student loans. The provision for loan losses reflects the activity for the applicable period and provides an allowance at a level that the Company's management believes is appropriate to cover probable losses inherent in the loan portfolio. The Company evaluates the adequacy of the allowance for loan losses on its federally insured loan portfolio separately from its private education loan portfolio. These evaluation processes are subject to numerous judgments and uncertainties.
F-12
NELNET, INC. AND SUBSIDIARIES
Notes to Consolidated Financial Statements – (continued)
(Dollars in thousands, except share amounts, unless otherwise noted)
The allowance for the federally insured loan portfolio is based on periodic evaluations of the Company's loan portfolios considering loans in repayment versus those in a nonpaying status, delinquency status, trends in defaults in the portfolio based on Company and industry data, past experience, trends in student loan claims rejected for payment by guarantors, changes to federal student loan programs, current economic conditions, and other relevant factors. The federal government guarantees
97 percent
of the principal of and the interest on federally insured student loans disbursed on and after July 1, 2006 (and
98 percent
for those loans disbursed on and after October 1, 1993 and prior to July 1, 2006), which limits the Company's loss exposure on the outstanding balance of the Company's federally insured portfolio. Student loans disbursed prior to October 1, 1993 are fully insured.
In determining the appropriate allowance for loan losses on the private education loans, the Company considers several factors, including: loans in repayment versus those in a nonpaying status, delinquency status, type of program, trends in defaults in the portfolio based on Company and industry data, past experience, current economic conditions, and other relevant factors. The Company places a private education loan on nonaccrual status when the collection of principal and interest is
90
days past due, and charges off the loan when the collection of principal and interest is
120
days past due. Collections, if any, are reflected as a recovery through the allowance for loan losses.
Management has determined that each of the federally insured loan portfolio and the private education loan portfolio meets the definition of a portfolio segment, which is defined as the level at which an entity develops and documents a systematic method for determining its allowance for credit losses. Accordingly, the portfolio segment disclosures are presented on this basis in note 3 for each of these portfolios. The Company does not disaggregate its portfolio segment student loan portfolios into classes of financing receivables. The Company collectively evaluates loans for impairment and as of
December 31, 2016
and
2015
, the Company did not have any impaired loans as defined in the Receivables Topic of the FASB Accounting Standards Codification.
For loans purchased where there is evidence of credit deterioration since the origination of the loan, the Company records a credit discount, separate from the allowance for loan losses, which is non-accretable to interest income. Remaining discounts and premiums for purchased loans are recognized in interest income over the remaining estimated lives of the loans. The Company continues to evaluate credit losses associated with purchased loans based on current information and changes in expectations to determine the need for any additional allowance for loan losses.
Cash and Cash Equivalents and Statement of Cash Flows
For purposes of the consolidated statements of cash flows, the Company considers all investments with maturities when purchased of three months or less to be cash equivalents.
Accrued interest on loans purchased and sold is included in cash flows from operating activities in the respective period. Net purchased accrued interest was
$0.6 million
,
$71.4 million
, and
$55.0 million
in
2016
,
2015
, and
2014
, respectively.
Investments
The Company's available-for-sale investment portfolio consists of student loan asset-backed securities and equity and debt securities. These securities are carried at fair value, with the temporary changes in fair value, net of taxes, carried as a separate component of shareholders’ equity. The amortized cost of debt securities in this category (including the student loan asset-backed securities) is adjusted for amortization of premiums and accretion of discounts, which are amortized using the effective interest rate method. Other-than-temporary impairment is evaluated by considering several factors, including the length of time and extent to which the fair value has been less than the amortized cost basis, the financial condition and near-term prospects of the issuer of the security (considering factors such as adverse conditions specific to the security and ratings agency actions), and the intent and ability of the Company to retain the investment to allow for any anticipated recovery in fair value. The entire fair value loss on a security that has experienced an other-than-temporary impairment is recorded in earnings if the Company intends to sell the security or if it is more likely than not that the Company will be required to sell the security before the expected recovery of the loss. However, if the impairment is other-than-temporary, and either of those two conditions does not exist, the portion of the impairment related to credit losses is recorded in earnings and the impairment related to other factors is recorded in other comprehensive income.
Securities classified as trading are accounted for at fair value, with unrealized gains and losses included in "other income" in the consolidated statements of income.
When an investment is sold, the cost basis is determined through specific identification of the security sold.
F-13
NELNET, INC. AND SUBSIDIARIES
Notes to Consolidated Financial Statements – (continued)
(Dollars in thousands, except share amounts, unless otherwise noted)
The Company accounts for investments in which it does not have significant influence or a controlling financial interest using the cost method of accounting. Cost method investments are recorded at cost. Cost method investments are evaluated for other-than-temporary impairment in the same manner as described above for available-for-sale investments.
The Company accounts for investments over which it has significant influence but not a controlling financial interest using the equity method of accounting. Equity method investments are recorded at cost and subsequently increased or decreased by the amount of the Company’s proportionate share of the net earnings or losses and other comprehensive income of the investee. Equity method investments are evaluated for other-than-temporary impairment using certain impairment indicators such as a series of operating losses of an investee or other factors. These factors may indicate that a decrease in value of the investment has occurred that is other-than-temporary and shall be recognized.
Restricted Cash
Restricted cash primarily includes amounts for student loan securitizations and other secured borrowings. This cash must be used to make payments related to trust obligations. Amounts on deposit in these accounts are primarily the result of timing differences between when principal and interest is collected on the student loans held as trust assets and when principal and interest is paid on the trust's asset-backed debt securities. Restricted cash also includes collateral deposits with derivative counterparties and third-party clearinghouses.
Restricted Cash - Due to Customers
As a servicer of student loans, the Company collects student loan remittances and subsequently disburses these remittances to the appropriate lending entities. In addition, as part of the Company's Tuition Payment Processing and Campus Commerce operating segment, the Company collects tuition payments and subsequently remits these payments to the appropriate schools. Cash collected for customers and the related liability are included in the accompanying consolidated balance sheets.
Accounts Receivable
Accounts receivable are presented at their net realizable values, which include allowances for doubtful accounts. Allowance estimates are based upon individual customer experience, as well as the age of receivables and likelihood of collection.
Business Combinations
The Company uses the acquisition method in accounting for acquired businesses. Under the acquisition method, the financial statements reflect the operations of an acquired business starting from the completion of the acquisition. The assets acquired and liabilities assumed are recorded at their respective estimated fair values at the date of acquisition. Any excess of the purchase price over the estimated fair values of the identifiable net assets acquired is recorded as goodwill. All contingent consideration is measured at fair value on the acquisition date and included in the consideration transferred in the acquisition. Contingent consideration classified as a liability is remeasured to fair value at each reporting date until the contingency is resolved, and changes in fair value are recognized in earnings.
Goodwill
The Company reviews goodwill for impairment annually (in the fourth quarter) and whenever triggering events or changes in circumstances indicate its carrying value may not be recoverable. Goodwill is tested for impairment using a fair value approach at the reporting unit level. A reporting unit is the operating segment, or a business one level below that operating segment if discrete financial information is prepared and regularly reviewed by segment management. However, components are aggregated as a single reporting unit if they have similar economic characteristics.
The Company tests goodwill for impairment in accordance with applicable accounting guidance. The guidance provides an entity the option to first assess qualitative factors to determine whether the existence of events or circumstances leads to a determination that it is more likely than not (more than 50%) that the estimated fair value of a reporting unit is less than its carrying amount. If an entity elects to perform a qualitative assessment and determines that an impairment is more likely than not, the entity is then required to perform a two-step quantitative impairment test (described below), otherwise no further analysis is required. An entity also may elect not to perform the qualitative assessment and, instead, proceed directly to the two-step quantitative impairment test.
F-14
NELNET, INC. AND SUBSIDIARIES
Notes to Consolidated Financial Statements – (continued)
(Dollars in thousands, except share amounts, unless otherwise noted)
If the Company elects to not perform a qualitative assessment or if the Company determines it is more likely than not that the fair value of a reporting unit is less than the carrying amount, then the Company performs a two-step impairment test on goodwill. In the first step, the Company compares the fair value of each reporting unit to its carrying value. If the fair value of the reporting unit exceeds the carrying value of the net assets assigned to that unit, goodwill is considered not impaired and the Company is not required to perform further testing. If the carrying value of the net assets assigned to the reporting unit exceeds the fair value of the reporting unit, then the Company must perform the second step of the impairment test in order to determine the implied fair value of the reporting unit's goodwill. If the carrying value of a reporting unit's goodwill exceeds its implied fair value, then the Company would record an impairment loss equal to the difference.
Determining the fair value of a reporting unit involves the use of significant estimates and assumptions. These estimates and assumptions include revenue growth rates and operating margins used to calculate projected future cash flows, risk-adjusted discount rates, future economic and market conditions, and determination of appropriate market comparables. Actual future results may differ from those estimates.
See note 9 for information regarding the Company's annual goodwill impairment review.
Intangible Assets
Intangible assets with finite lives are amortized over their estimated lives. Such assets are amortized using a method of amortization that reflects the pattern in which the economic benefits of the intangible asset are consumed or otherwise used up. If that pattern cannot be reliably determined, the Company uses a straight-line amortization method.
The Company evaluates the estimated remaining useful lives of purchased intangible assets and whether events or changes in circumstances warrant a revision to the remaining periods of amortization.
Property and Equipment
Property and equipment are carried at cost, net of accumulated depreciation. Maintenance and repairs are charged to expense as incurred, and major improvements, including leasehold improvements, are capitalized. Gains and losses from the sale of property and equipment are included in determining net income. The Company uses the straight-line method for recording depreciation and amortization. Leasehold improvements are amortized straight-line over the shorter of the lease term or estimated useful life of the asset.
Impairment of Long‑Lived Assets
The Company reviews its long-lived assets, such as property and equipment and purchased intangibles subject to amortization, for impairment whenever events or changes in circumstances indicate that the carrying amount of an asset may not be recoverable. Recoverability of assets to be held and used is measured by a comparison of the carrying amount of an asset to estimated undiscounted future cash flows expected to be generated by the asset. If the carrying amount of an asset exceeds its estimated future cash flows, an impairment charge is recognized by the amount by which the carrying amount of the asset exceeds the fair value of the asset. The Company uses estimates to determine the fair value of long-lived assets. Such estimates are generally based on estimated future cash flows or cost savings associated with particular assets and are discounted to present value using an appropriate discount rate. The estimates of future cash flows associated with assets are generally prepared using a cost savings method, a lost income method, or an excess return method, as appropriate. In utilizing such methods, management must make certain assumptions about the amount and timing of estimated future cash flows and other economic benefits from the assets, the remaining economic useful life of the assets, and general economic factors concerning the selection of an appropriate discount rate. The Company may also use replacement cost or market comparison approaches to estimating fair value if such methods are determined to be more appropriate.
Assumptions and estimates about future values and remaining useful lives of the Company's intangible and other long-lived assets are complex and subjective. They can be affected by a variety of factors, including external factors such as industry and economic trends, and internal factors such as changes in the Company's business strategy and internal forecasts. Although the Company believes the historical assumptions and estimates used are reasonable and appropriate, different assumptions and estimates could materially impact the reported financial results.
F-15
NELNET, INC. AND SUBSIDIARIES
Notes to Consolidated Financial Statements – (continued)
(Dollars in thousands, except share amounts, unless otherwise noted)
Fair Value Measurements
The Company uses estimates of fair value in applying various accounting standards for its financial statements.
Fair value is defined as the price to sell an asset or transfer a liability in an orderly transaction between willing and able market participants. In general, the Company's policy in estimating fair values is to first look at observable market prices for identical assets and liabilities in active markets, where available. When these are not available, other inputs are used to model fair value, such as prices of similar instruments, yield curves, volatilities, prepayment speeds, default rates, and credit spreads, relying first on observable data from active markets. Depending on current market conditions, additional adjustments to fair value may be based on factors such as liquidity, credit, and bid/offer spreads. In some cases fair values are based on estimates using present value or other valuation techniques. Those techniques are significantly affected by the assumptions used, including the discount rate and estimates of future cash flows. Transaction costs are not included in the determination of fair value. When possible, the Company seeks to validate the model's output to market transactions. Depending on the availability of observable inputs and prices, different valuation models could produce materially different fair value estimates. The values presented may not represent future fair values and may not be realizable. Additionally, there may be inherent weaknesses in any calculation technique, and changes in the underlying assumptions used, including discount rates and estimates of future cash flows, could significantly affect the estimates of current or future values.
The Company categorizes its fair value estimates based on a hierarchical framework associated with three levels of price transparency utilized in measuring assets and liabilities at fair value. Classification is based on the lowest level of input that is significant to the fair value of the instrument. The three levels include:
|
•
|
Level 1: Quoted prices for
identical
instruments in active markets. The types of financial instruments included in Level 1 are highly liquid instruments with quoted prices.
|
|
•
|
Level 2: Quoted prices for
similar
instruments in active markets; quoted prices for identical or similar instruments in markets that are not active; and model-derived valuations whose inputs are observable or whose primary value drivers are observable.
|
|
•
|
Level 3: Instruments whose primary value drivers are
unobservable
. Inputs are developed based on the best information available; however, significant judgment is required by management in developing the inputs.
|
The Company's accounting policy is to recognize transfers between levels of the fair value hierarchy at the end of the reporting period.
Revenue Recognition
The Company recognizes revenue when (i) persuasive evidence of an arrangement exists between the Company and the customer, (ii) delivery of the product to the customer has occurred or service has been provided to the customer, (iii) the price to the customer is fixed or determinable, and (iv) collectability of the sales price is reasonably assured. Additional information related to the Company's revenue recognition of specific items is further provided below.
Loan interest income
- Loan interest is paid by the Department or the borrower, depending on the status of the loan at the time of the accrual. In addition, the Department makes quarterly interest subsidy payments on certain qualified FFELP loans until the student is required under the provisions of the Higher Education Act to begin repayment. Borrower repayment of FFELP loans normally begins within six months after completion of the borrower's course of study, leaving school, or ceasing to carry at least one-half the normal full-time academic load, as determined by the educational institution. Borrower repayment of PLUS and Consolidation loans normally begins within 60 days from the date of loan disbursement. Borrower repayment of private education loans typically begins six months following the borrower's graduation from a qualified institution, and the interest is either paid by the borrower or capitalized annually or at repayment.
The Department provides a special allowance to lenders participating in the FFEL Program. The special allowance is accrued based upon the fiscal quarter average rate of
13-week Treasury Bill
auctions (for loans originated prior to January 1, 2000), the fiscal quarter average rate of the
daily three-month financial commercial paper rates
(for loans originated on and after January 1, 2000) or the fiscal quarter average rate of
daily one-month LIBOR rates
(for loans originated on and after January 1, 2000, and for lenders which elected to change the special allowance index to one-month LIBOR effective April 1, 2012) relative to the yield of the student loan.
F-16
NELNET, INC. AND SUBSIDIARIES
Notes to Consolidated Financial Statements – (continued)
(Dollars in thousands, except share amounts, unless otherwise noted)
The Company recognizes student loan interest income as earned, net of amortization of loan premiums and deferred origination costs and the accretion of loan discounts. Loan interest income is recognized based upon the expected yield of the loan after giving effect to interest rate reductions resulting from borrower utilization of incentives such as timely payments ("borrower benefits") and other yield adjustments. Loan premiums or discounts, deferred origination costs, and borrower benefits are amortized/accreted over the estimated life of the loans, which includes an estimate of forecasted payments in excess of contractually required payments. The Company periodically evaluates the assumptions used to estimate the life of the loans and prepayment rates.
In the third quarter of 2016, the Company revised its policy to correct for an error in its method of applying the interest method used to amortize premiums and accrete discounts on its student loan portfolio. Previously, the Company amortized premiums and accreted discounts by including in its prepayment assumption forecasted payments in excess of contractually required payments as well as forecasted defaults. The Company has determined that only payments in excess of contractually required payments should be included in the prepayment assumption. Under the Company's revised policy, as of September 30, 2016, the constant prepayment rate used by the Company to amortize/accrete student loan premiums/discounts was decreased. During the third quarter of 2016, the Company recorded an adjustment to reflect the net impact on prior periods for the correction of this error that resulted in an
$8.2 million
reduction to the Company's net loan discount balance and a corresponding pre-tax increase to interest income. The Company concluded this error had an immaterial impact on 2016 results as well as the results for prior periods.
The Company also pays the Department an annual 105 basis point rebate fee on Consolidation loans. These rebate fees are netted against loan interest income.
Loan systems and servicing revenue
– Loan systems and servicing revenue consists of the following items:
|
•
|
Loan and guaranty servicing fees
– Loan servicing fees are determined according to individual agreements with customers and are calculated based on the dollar value of loans, number of loans, or number of borrowers serviced for each customer. Guaranty servicing fees are generally calculated based on the number of loans serviced, volume of loans serviced, or amounts collected. Revenue is recognized over the period in which services are provided to customers, and when ultimate collection is assured.
|
|
•
|
Software services revenue
– Software services revenue is determined from individual agreements with customers and includes license and maintenance fees associated with student loan software products. Computer and software consulting and remote hosting revenues are recognized over the period in which services are provided to customers.
|
|
•
|
Outsourced services revenue
- Outsourced services revenue is determined from individual agreements with customers and generally recognized over the period in which services are provided to customers.
|
|
•
|
Guaranty collections revenue
– Guaranty collections revenue is earned when collected. Collection costs paid to third parties associated with this revenue is expensed upon successful collection.
|
Tuition payment processing, school information, and campus commerce revenue -
Tuition payment processing, school information, and campus commerce revenue includes actively managed tuition payment solutions, remote hosted school information systems software, and online payment processing. Fees for these services are recognized over the period in which services are provided to customers. Cash received in advance of the delivery of services is included in deferred revenue.
Communications revenue -
Communications revenue based on a flat fee, derived principally from internet, television, and telephone services are billed in advance and recognized in subsequent periods when the services are provided. Revenues for usage-based services, such as access charges billed to other telephone carriers for originating and terminating long-distance calls on the Company's network, are billed in arrears. The Company recognizes revenue from these services in the period the services are rendered rather than billed. Earned but unbilled usage-based services are recorded in accounts receivable.
Costs to provide communication services is primarily associated with television programming costs. The Company has various contracts to obtain video programming from programming vendors whose compensation is typically based on a flat fee per customer. The cost of the right to exhibit network programming under such arrangements is recorded in the month the programming is available for exhibition. Programming costs are paid each month based on calculations performed by the Company and are subject to periodic audits performed by the programmers. Other costs included in costs to provide communication services include connectivity, franchise, and other regulatory costs directly related to providing internet and voice services.
F-17
NELNET, INC. AND SUBSIDIARIES
Notes to Consolidated Financial Statements – (continued)
(Dollars in thousands, except share amounts, unless otherwise noted)
Enrollment services revenue -
Enrollment services revenue was derived from fees which were earned through the delivery of qualified inquiries or clicks. Delivery was deemed to have occurred at the time a qualified inquiry or click was delivered to the customer, provided that no significant obligations remained.
For a portion of this revenue, the Company had agreements with providers of online media or traffic ("inquiry generation vendors") used in the generation of inquiries or clicks. The Company received a fee from its customers and paid a fee to the inquiry generation vendors either on a cost per inquiry, cost per click, or cost per number of impressions basis. The Company was the primary obligor in the transaction. As a result, the fees paid by the Company's customers were recognized as revenue and the fees paid to its inquiry generation vendors are included in "cost to provide enrollment services" in the Company's consolidated statements of income.
On February 1, 2016, the Company sold 100 percent of the membership interests in Sparkroom LLC, which included the Company's inquiry management products and services.
Other income -
Other income consists primarily of the following items:
|
•
|
Realized and unrealized gains and losses on investments
|
|
•
|
Borrower late fee income
- Late fee income is earned by the education lending subsidiaries and is recognized when payments are collected from the borrower.
|
|
•
|
Investment advisory income
- Investment advisory services are provided by the Company through an SEC-registered investment advisor subsidiary under various arrangements. The Company earns annual fees on the outstanding balance of investments and certain performance measures, which are recognized monthly as earned.
|
|
•
|
Digital marketing and content solutions
- The Company earns revenue related to digital marketing and content solution products and services under the brand name Peterson's. These products and services include test preparation study guides, school directories and databases, career exploration guides, on-line courses and test preparation, scholarship search and selection data, career planning information and guides, and on-line information about colleges and universities. Several content solutions services, including services to connect students to colleges and universities, are sold based on subscriptions. Revenue from sales of subscription services is recognized ratably over the term of the contract as earned. Subscription revenue received or receivable in advance of the delivery of services is included in deferred revenue. Revenue from the sale of print products is generally earned and recognized, net of estimated returns, upon shipment or delivery. All other digital marketing and content solutions revenue is recognized over the period in which services are provided to customers.
|
Interest Expense
Interest expense is based upon contractual interest rates, adjusted for the amortization of debt issuance costs and the accretion of discounts. The amortization of debt issuance costs and accretion of discounts are recognized using the effective interest method.
Transfer of Financial Assets and Extinguishments of Liabilities
The Company accounts for loan sales and debt repurchases in accordance with applicable accounting guidance. If a transfer of loans qualifies as a sale, the Company derecognizes the loan and recognizes a gain or loss as the difference between the carrying basis of the loan sold and the consideration received. The Company from time to time repurchases its outstanding debt and records a gain or loss on the early extinguishment of debt based upon the difference between the carrying amount of the debt and the amount paid to the third party. The Company recognizes the results of a transfer of loans and the extinguishment of debt based upon the settlement date of the transaction.
Derivative Accounting
The Company records derivative instruments in the consolidated balance sheets on a gross basis as either an asset or liability measured at its fair value. Certain of the Company's derivative instruments are subject to right of offset provisions with counterparties. The Company determines the fair value for its derivative instruments using either (i) pricing models that consider current market conditions and the contractual terms of the derivative instrument or (ii) counterparty valuations. The Company does not offset fair value amounts recognized for derivative instruments and fair value amounts recognized for the right to reclaim
F-18
NELNET, INC. AND SUBSIDIARIES
Notes to Consolidated Financial Statements – (continued)
(Dollars in thousands, except share amounts, unless otherwise noted)
cash collateral (a receivable) or the obligation to return cash collateral (a payable) arising from derivative instruments that are recognized at fair value and executed with the same counterparty under a master netting arrangement. The factors that impact the fair value of the Company's derivatives include interest rates, time value, forward interest rate curve, and volatility factors, as well as foreign exchange rates. Pricing models and their underlying assumptions impact the amount and timing of unrealized gains and losses recognized, and the use of different pricing models or assumptions could produce different financial results. Management has structured all of the Company's derivative transactions with the intent that each is economically effective; however, the Company's derivative instruments do not qualify for hedge accounting. As a result, the change in fair value of derivative instruments is reported in current period earnings. Changes or shifts in the forward yield curve and fluctuations in currency rates can significantly impact the valuation of the Company’s derivatives, and therefore impact the financial position and results of operations of the Company. Any proceeds received or payments made by the Company to terminate a derivative in advance of its expiration date, or to amend the terms of an existing derivative, are included in the Company's consolidated statements of income and are accounted for as a change in fair value of such derivative. The changes in fair value of derivative instruments, as well as the settlement payments made on such derivatives, are included in “derivative market value and foreign currency adjustments and derivative settlements, net” on the consolidated statements of income.
Foreign Currency
During 2006, the Company issued Euro-denominated bonds, which are included in “bonds and notes payable” on the consolidated balance sheets. Transaction gains and losses resulting from exchange rate changes when re-measuring these bonds to U.S. dollars at the balance sheet date are included in “derivative market value and foreign currency adjustments and derivative settlements, net” on the consolidated statements of income.
Income Taxes
Income taxes are accounted for under the asset and liability method. Deferred tax assets and liabilities are recognized for the future tax consequences attributable to differences between the financial statement carrying amounts of existing assets and liabilities and their respective tax bases and operating loss and tax credit carry forwards. Deferred tax assets and liabilities are measured using enacted tax rates expected to apply to taxable income in the years in which those temporary differences are expected to be recovered or settled. The effect on deferred tax assets and liabilities of a change in tax rates is recognized in income in the period that includes the enactment date.
Income tax expense includes deferred tax expense, which represents the net change in the deferred tax asset or liability balance during the year, plus any change made in the valuation allowance, and current tax expense, which represents the amount of tax currently payable to or receivable from a tax authority plus amounts for expected tax deficiencies (including both tax and interest).
Compensation Expense for Stock Based Awards
The Company has a restricted stock plan that is intended to provide incentives to attract, retain, and motivate employees in order to achieve long term growth and profitability objectives. The restricted stock plan provides for the grant to eligible employees of awards of restricted shares of Class A common stock. The fair value of restricted stock awards is determined on the grant date based on the Company's stock price and is amortized to compensation cost over the related vesting periods, which range up to ten years. For those awards with only service conditions that have graded vesting schedules, the Company recognizes compensation expense on a straight-line basis over the requisite service period for each separately vesting portion of the award, as if the award was, in substance, multiple awards. Holders of restricted stock are entitled to receive dividends from the date of grant whether or not vested.
The Company also has a directors stock compensation plan pursuant to which non-employee directors can elect to receive their annual retainer fees in the form of fully vested shares of Class A common stock, and also elect to defer receipt of such shares until the termination of their service on the board of directors. The fair value of grants under this plan is determined on the grant date based on the Company's stock price, and is expensed over the board member's annual service period.
Stock Repurchases
In accordance with the corporate laws of the state in which the Company is incorporated, all shares repurchased by the Company are legally retired upon acquisition by the Company.
F-19
NELNET, INC. AND SUBSIDIARIES
Notes to Consolidated Financial Statements – (continued)
(Dollars in thousands, except share amounts, unless otherwise noted)
3. Student Loans Receivable and Allowance for Loan Losses
Student loans receivable consisted of the following:
|
As of December 31,
|
||||||
|
|
2016
|
2015
|
||||
|
Federally insured loans
|
||||||
|
Stafford and other
|
$
|
5,186,047
|
|
6,202,064
|
|
|
|
Consolidation
|
19,643,937
|
|
22,086,043
|
|
||
|
Total
|
24,829,984
|
|
28,288,107
|
|
||
|
Private education loans
|
273,659
|
|
267,642
|
|
||
|
|
25,103,643
|
|
28,555,749
|
|
||
|
Loan discount, net of unamortized loan premiums and deferred origination costs (a)
|
(148,077
|
)
|
(180,699
|
)
|
||
|
Allowance for loan losses – federally insured loans
|
(37,268
|
)
|
(35,490
|
)
|
||
|
Allowance for loan losses – private education loans
|
(14,574
|
)
|
(15,008
|
)
|
||
|
|
$
|
24,903,724
|
|
28,324,552
|
|
|
(a) At December 31, 2016 and 2015, "loan discount, net of unamortized loan premiums and deferred origination costs" included
$18.6 million
and
$33.0 million
, respectively, of non-accretable discount associated with purchased loan portfolios of
$8.3 billion
and
$10.8 billion
, respectively.
Acquisition of Student Loan Residual Interests
On May 26, 2015, the Company acquired the ownership interest in a federally insured student loan securitization trust, giving the Company rights to the residual interest in
$504.2 million
of securitized federally insured loans. The trust includes loans funded to term with
$448.9 million
(par value) of bonds and notes payable.
On August 3, 2015, the Company acquired the ownership interest in two federally insured student loan securitization trusts, giving the Company rights to the residual interest in
$1.5 billion
of securitized federally insured loans. The two trusts include loans funded to term with
$1.5 billion
(par value) of bonds and notes payable.
The Company has consolidated the previously disclosed trusts on its consolidated balance sheet because management has determined the Company is the primary beneficiary of the trusts. Upon acquisition, the Company recorded all assets and liabilities of the trusts at fair value, resulting in the Company recognizing a student loan and bonds and notes payable fair value discount of
$40.9 million
and
$84.5 million
, respectively. These discounts will be accreted using the effective interest method over the lives of the underlying assets and liabilities. All other assets acquired and liabilities assumed (restricted cash, accrued interest receivable/payable, and other assets/liabilities) were recorded at cost, which approximates fair value.
Private Education Loans
In February 2015, the Company entered into an agreement with CommonBond, Inc. ("CommonBond"), a student lending company that provides private education loans to graduate students, under which the Company committed to purchase private education loans for a period of
18 months
, with the total purchase obligation limited to
$200.0 million
. As of
December 31, 2016
, the Company had purchased
$190.1 million
, of which
$160.1 million
was purchased in 2015, in private education loans from CommonBond and has satisfied its commitment under this agreement.
F-20
NELNET, INC. AND SUBSIDIARIES
Notes to Consolidated Financial Statements – (continued)
(Dollars in thousands, except share amounts, unless otherwise noted)
Activity in the Allowance for Loan Losses
The provision for loan losses represents the periodic expense of maintaining an allowance sufficient to absorb losses, net of recoveries, inherent in the portfolio of student loans. Activity in the allowance for loan losses is shown below.
|
|
Year ended December 31,
|
||||||||
|
|
2016
|
2015
|
2014
|
||||||
|
Balance at beginning of period
|
$
|
50,498
|
|
48,900
|
|
55,122
|
|
||
|
Provision for loan losses:
|
|||||||||
|
Federally insured loans
|
14,000
|
|
8,000
|
|
11,000
|
|
|||
|
Private education loans
|
(500
|
)
|
2,150
|
|
(1,500
|
)
|
|||
|
Total provision for loan losses
|
13,500
|
|
10,150
|
|
9,500
|
|
|||
|
Charge-offs:
|
|
|
|
|
|||||
|
Federally insured loans
|
(12,292
|
)
|
(11,730
|
)
|
(15,260
|
)
|
|||
|
Private education loans
|
(1,728
|
)
|
(2,414
|
)
|
(2,332
|
)
|
|||
|
Total charge-offs
|
(14,020
|
)
|
(14,144
|
)
|
(17,592
|
)
|
|||
|
Recoveries - private education loans
|
954
|
|
1,050
|
|
1,315
|
|
|||
|
Purchase (sale) of federally insured loans, net
|
70
|
|
50
|
|
(10
|
)
|
|||
|
Purchase (sale) of private education loans, net
|
480
|
|
(140
|
)
|
(1,620
|
)
|
|||
|
Transfer from repurchase obligation related to private education loans repurchased, net
|
360
|
|
4,632
|
|
2,185
|
|
|||
|
Balance at end of period
|
$
|
51,842
|
|
50,498
|
|
48,900
|
|
||
|
Allocation of the allowance for loan losses:
|
|
|
|
|
|||||
|
Federally insured loans
|
$
|
37,268
|
|
35,490
|
|
39,170
|
|
||
|
Private education loans
|
14,574
|
|
15,008
|
|
9,730
|
|
|||
|
Total allowance for loan losses
|
$
|
51,842
|
|
50,498
|
|
48,900
|
|
||
Repurchase Obligation
The Company has sold various portfolios of private education loans to third-parties. Per the terms of the servicing agreements, the Company’s servicing operations are obligated to repurchase loans subject to the sale agreements in the event such loans become
60
or
90
days delinquent. As of December 31, 2016 and 2015, the balance of loans subject to these repurchase obligations was
$39.5 million
and
$46.8 million
, respectively. The Company's estimate related to its obligation to repurchase these loans is included in "other liabilities" in the Company's consolidated balance sheets and was
$2.3 million
and
$2.7 million
, as of
December 31, 2016
and 2015, respectively.
F-21
NELNET, INC. AND SUBSIDIARIES
Notes to Consolidated Financial Statements – (continued)
(Dollars in thousands, except share amounts, unless otherwise noted)
Student Loan Status and Delinquencies
Delinquencies have the potential to adversely impact the Company’s earnings through increased servicing and collection costs and account charge-offs. The table below shows the Company’s loan delinquency amounts.
|
As of December 31,
|
||||||||||||||||||||
|
|
2016
|
2015
|
2014
|
|||||||||||||||||
|
Federally insured loans:
|
|
|
|
|
||||||||||||||||
|
Loans in-school/grace/deferment (a)
|
$
|
1,606,468
|
|
|
$
|
2,292,941
|
|
|
$
|
2,805,228
|
|
|||||||||
|
Loans in forbearance (b)
|
2,295,367
|
|
|
2,979,357
|
|
|
3,288,412
|
|
||||||||||||
|
Loans in repayment status:
|
|
|
||||||||||||||||||
|
Loans current
|
18,125,768
|
|
86.6
|
%
|
19,447,541
|
|
84.4
|
%
|
18,460,279
|
|
83.5
|
%
|
||||||||
|
Loans delinquent 31-60 days (c)
|
818,976
|
|
3.9
|
|
1,028,396
|
|
4.5
|
|
1,043,119
|
|
4.8
|
|
||||||||
|
Loans delinquent 61-90 days (c)
|
487,647
|
|
2.3
|
|
566,953
|
|
2.5
|
|
588,777
|
|
2.7
|
|
||||||||
|
Loans delinquent 91-120 days (c)
|
335,291
|
|
1.6
|
|
415,747
|
|
1.8
|
|
404,905
|
|
1.8
|
|
||||||||
|
Loans delinquent 121-270 days (c)
|
854,432
|
|
4.1
|
|
1,166,940
|
|
5.1
|
|
1,204,405
|
|
5.4
|
|
||||||||
|
Loans delinquent 271 days or greater (c)(d)
|
306,035
|
|
1.5
|
|
390,232
|
|
1.7
|
|
401,305
|
|
1.8
|
|
||||||||
|
Total loans in repayment
|
20,928,149
|
|
100.0
|
%
|
23,015,809
|
|
100.0
|
%
|
22,102,790
|
|
100.0
|
%
|
||||||||
|
Total federally insured loans
|
$
|
24,829,984
|
|
|
|
$
|
28,288,107
|
|
|
|
$
|
28,196,430
|
|
|||||||
|
Private education loans:
|
||||||||||||||||||||
|
Loans in-school/grace/deferment (a)
|
$
|
35,146
|
|
$
|
30,795
|
|
$
|
905
|
|
|||||||||||
|
Loans in forbearance (b)
|
3,448
|
|
350
|
|
—
|
|
||||||||||||||
|
Loans in repayment status:
|
||||||||||||||||||||
|
Loans current
|
228,612
|
|
97.2
|
%
|
228,464
|
|
96.7
|
%
|
18,390
|
|
69.2
|
%
|
||||||||
|
Loans delinquent 31-60 days (c)
|
1,677
|
|
0.7
|
|
1,771
|
|
0.7
|
|
1,078
|
|
4.1
|
|
||||||||
|
Loans delinquent 61-90 days (c)
|
1,110
|
|
0.5
|
|
1,283
|
|
0.5
|
|
1,035
|
|
3.9
|
|
||||||||
|
Loans delinquent 91 days or greater (c)
|
3,666
|
|
1.6
|
|
4,979
|
|
2.1
|
|
6,070
|
|
22.8
|
|
||||||||
|
Total loans in repayment
|
235,065
|
|
100.0
|
%
|
236,497
|
|
100.0
|
%
|
26,573
|
|
100.0
|
%
|
||||||||
|
Total private education loans
|
$
|
273,659
|
|
|
|
$
|
267,642
|
|
|
|
$
|
27,478
|
|
|||||||
|
(a)
|
Loans for borrowers who still may be attending school or engaging in other permitted educational activities and are not yet required to make payments on the loans,
e.g.
, residency periods for medical students or a grace period for bar exam preparation for law students.
|
|
(b)
|
Loans for borrowers who have temporarily ceased making full payments due to hardship or other factors, according to a schedule approved by the servicer consistent with the established loan program servicing procedures and policies.
|
|
(c)
|
The period of delinquency is based on the number of days scheduled payments are contractually past due and relate to repayment loans, that is, receivables not charged off, and not in school, grace, deferment, or forbearance.
|
|
(d)
|
A portion of loans included in loans delinquent 271 days or greater includes loans in claim status, which are loans that have gone into default and have been submitted to the guaranty agency.
|
F-22
NELNET, INC. AND SUBSIDIARIES
Notes to Consolidated Financial Statements – (continued)
(Dollars in thousands, except share amounts, unless otherwise noted)
4. Bonds and Notes Payable
The following tables summarize the Company’s outstanding debt obligations by type of instrument:
|
|
As of December 31, 2016
|
||||||
|
Carrying
amount
|
Interest rate
range
|
Final maturity
|
|||||
|
Variable-rate bonds and notes issued in FFELP loan asset-backed securitizations:
|
|
|
|
||||
|
Bonds and notes based on indices
|
$
|
22,130,063
|
|
0.24% - 6.90%
|
6/25/21 - 9/25/65
|
||
|
Bonds and notes based on auction
|
998,415
|
|
1.61% - 2.28%
|
3/22/32 - 11/26/46
|
|||
|
Total variable-rate bonds and notes
|
23,128,478
|
|
|||||
|
FFELP warehouse facilities
|
1,677,443
|
|
0.63% - 1.09%
|
9/7/18 - 12/13/19
|
|||
|
Variable-rate bonds and notes issued in private education loan asset-backed securitization
|
112,582
|
|
2.60%
|
12/26/40
|
|||
|
Fixed-rate bonds and notes issued in private education loan asset-backed securitization
|
113,378
|
|
3.60% / 5.35%
|
12/26/40 / 12/28/43
|
|||
|
Unsecured line of credit
|
—
|
|
—
|
12/12/21
|
|||
|
Unsecured debt - Junior Subordinated Hybrid Securities
|
50,184
|
|
4.37%
|
9/15/61
|
|||
|
Other borrowings
|
18,355
|
|
3.38%
|
3/31/23 / 12/15/45
|
|||
|
|
25,100,420
|
|
|
|
|||
|
Discount on bonds and notes payable and debt issuance costs
|
(431,930
|
)
|
|||||
|
Total
|
$
|
24,668,490
|
|
||||
|
|
As of December 31, 2015
|
||||||
|
Carrying
amount
|
Interest rate
range
|
Final maturity
|
|||||
|
Variable-rate bonds and notes issued in FFELP loan asset-backed securitizations:
|
|
|
|
||||
|
Bonds and notes based on indices
|
$
|
25,155,336
|
|
0.05% - 6.90%
|
8/26/19 - 8/26/52
|
||
|
Bonds and notes based on auction
|
1,160,365
|
|
0.88% - 2.17%
|
3/22/32 - 11/26/46
|
|||
|
Total variable-rate bonds and notes
|
26,315,701
|
|
|||||
|
FFELP warehouse facilities
|
1,855,907
|
|
0.27% - 0.56%
|
4/29/18 - 12/14/18
|
|||
|
Private education loan warehouse facility
|
181,184
|
|
0.57%
|
12/26/16
|
|||
|
Unsecured line of credit
|
100,000
|
|
1.79% - 1.92%
|
10/30/20
|
|||
|
Unsecured debt - Junior Subordinated Hybrid Securities
|
57,184
|
|
3.99%
|
9/15/61
|
|||
|
Other borrowings
|
93,355
|
|
1.93% / 3.38%
|
10/31/16 - 12/15/45
|
|||
|
|
28,603,331
|
|
|
|
|||
|
Discount on bonds and notes payable and debt issuance costs
|
(497,410
|
)
|
|||||
|
Total
|
$
|
28,105,921
|
|
||||
F-23
NELNET, INC. AND SUBSIDIARIES
Notes to Consolidated Financial Statements – (continued)
(Dollars in thousands, except share amounts, unless otherwise noted)
Secured Financing Transactions
The Company has historically relied upon secured financing vehicles as its most significant source of funding for student loans. The net cash flow the Company receives from the securitized student loans generally represents the excess amounts, if any, generated by the underlying student loans over the amounts required to be paid to the bondholders, after deducting servicing fees and any other expenses relating to the securitizations. The Company’s rights to cash flow from securitized student loans are subordinate to bondholder interests, and the securitized student loans may fail to generate any cash flow beyond what is due to bondholders. The Company’s secured financing vehicles during the periods presented include loan warehouse facilities and asset-backed securitizations.
The majority of the bonds and notes payable are primarily secured by the student loans receivable, related accrued interest, and by the amounts on deposit in the accounts established under the respective bond resolutions or financing agreements.
FFELP warehouse facilities
The Company funds a portion of its FFELP loan acquisitions using its FFELP warehouse facilities. Student loan warehousing allows the Company to buy and manage student loans prior to transferring them into more permanent financing arrangements.
As of
December 31, 2016
, the Company had three FFELP warehouse facilities as summarized below.
|
NFSLW-I
|
NHELP-III
|
NHELP-II
|
Total
|
|||||||||
|
Maximum financing amount
|
$
|
875,000
|
|
750,000
|
|
500,000
|
|
2,125,000
|
|
|||
|
Amount outstanding
|
656,253
|
|
605,420
|
|
415,770
|
|
1,677,443
|
|
||||
|
Amount available
|
$
|
218,747
|
|
144,580
|
|
84,230
|
|
447,557
|
|
|||
|
Expiration of liquidity provisions
|
July 10, 2018
|
|
April 28, 2017
|
|
December 15, 2017
|
|
||||||
|
Final maturity date
|
September 7, 2018
|
|
April 26, 2019
|
|
December 13, 2019
|
|
||||||
|
Maximum advance rates
|
92.0 - 98.0%
|
|
92.2 - 95.0%
|
|
85.0 - 95.0%
|
|
||||||
|
Minimum advance rates
|
84.0 - 90.0%
|
|
92.2 - 95.0%
|
|
85.0 - 95.0%
|
|
||||||
|
Advanced as equity support
|
$
|
20,256
|
|
32,521
|
|
31,014
|
|
83,791
|
|
|||
Each FFELP warehouse facility is supported by 364-day liquidity provisions, which are subject to the respective expiration date shown in the previous table. In the event the Company is unable to renew the liquidity provisions by such date, the facility would become a term facility at a stepped-up cost, with no additional student loans being eligible for financing, and the Company would be required to refinance the existing loans in the facility by the facility's final maturity date. The NFSLW-I warehouse facility provides for formula-based advance rates, depending on FFELP loan type, up to a maximum of the principal and interest of loans financed as shown in the table above. The advance rates for collateral may increase or decrease based on market conditions, but they are subject to minimums as disclosed above. The NHELP-III and NHELP-II warehouse facilities have static advance rates that require initial equity for loan funding, but do not require increased equity based on market movements.
The FFELP warehouse facilities contain financial covenants relating to levels of the Company’s consolidated net worth, ratio of recourse indebtedness to adjusted EBITDA, and unencumbered cash. Any noncompliance with these covenants could result in a requirement for the immediate repayment of any outstanding borrowings under the facilities.
Private education loan warehouse facility
On June 26, 2015, the Company entered into a
$275.0 million
private education loan warehouse facility. The Company completed a private education loan asset-backed securitization on December 21, 2016 and funded all of the loans that were included in the private education loan warehouse. After completing this securitization, the Company terminated the private education loan warehouse facility on December 21, 2016.
F-24
NELNET, INC. AND SUBSIDIARIES
Notes to Consolidated Financial Statements – (continued)
(Dollars in thousands, except share amounts, unless otherwise noted)
Asset-backed securitizations
The following tables summarize the asset-backed securitization transactions completed in
2016
and
2015
.
|
Securitizations completed during the year ended December 31, 2016
|
||||||||||||||||||
|
FFELP 2016-1
|
Private education loan 2016-A
|
Total
|
||||||||||||||||
|
Class A-1A notes
|
Class A-1B notes
|
2016-A total
|
||||||||||||||||
|
Date securities issued
|
10/12/16
|
12/21/16
|
12/21/16
|
12/21/16
|
||||||||||||||
|
Total original principal amount
|
$
|
426,000
|
|
112,582
|
|
91,378
|
|
225,960
|
|
$
|
651,960
|
|
||||||
|
Class A senior notes:
|
||||||||||||||||||
|
Total original principal amount
|
$
|
426,000
|
|
112,582
|
|
91,378
|
|
203,960
|
|
629,960
|
|
|||||||
|
Bond discount
|
—
|
|
—
|
|
(609
|
)
|
(609
|
)
|
(609
|
)
|
||||||||
|
Issue price
|
$
|
426,000
|
|
112,582
|
|
90,769
|
|
203,351
|
|
629,351
|
|
|||||||
|
Cost of funds:
|
1-month LIBOR plus 0.80%
|
1-month LIBOR plus 1.75%
|
3.60%
|
|||||||||||||||
|
Final maturity date
|
9/25/65
|
12/26/40
|
12/26/40
|
|||||||||||||||
|
Class B subordinated notes:
|
||||||||||||||||||
|
Total original principal amount
|
$
|
22,000
|
|
22,000
|
|
|||||||||||||
|
Bond discount
|
(285
|
)
|
(285
|
)
|
||||||||||||||
|
Issue price
|
$
|
21,715
|
|
21,715
|
|
|||||||||||||
|
Cost of funds:
|
5.35
|
%
|
||||||||||||||||
|
Final maturity date
|
12/28/43
|
|
||||||||||||||||
|
Securitizations completed during the year ended December 31, 2015
|
|||||||||||||||||||||||||||||
|
FFELP 2015-1
|
FFELP 2015-2
|
FFELP 2015-3
|
Total
|
||||||||||||||||||||||||||
|
Class A-1 notes
|
Class A-2 notes
|
2015-2 total
|
Class A-1 notes
|
Class A-2 notes
|
Class A-3 notes
|
2015-3 total
|
|||||||||||||||||||||||
|
Date securities issued
|
2/27/15
|
3/26/15
|
3/26/15
|
3/26/15
|
5/21/15
|
5/21/15
|
5/21/15
|
5/21/15
|
|||||||||||||||||||||
|
Total original principal amount
|
$
|
566,346
|
|
122,500
|
|
584,500
|
|
722,000
|
|
82,500
|
|
270,000
|
|
41,400
|
|
401,400
|
|
$
|
1,689,746
|
|
|||||||||
|
Class A senior notes:
|
|||||||||||||||||||||||||||||
|
Total original principal amount
|
$
|
553,232
|
|
122,500
|
|
584,500
|
|
707,000
|
|
82,500
|
|
270,000
|
|
41,400
|
|
393,900
|
|
1,654,132
|
|
||||||||||
|
Bond discount
|
—
|
|
—
|
|
—
|
|
—
|
|
—
|
|
(380
|
)
|
(1,095
|
)
|
(1,475
|
)
|
(1,475
|
)
|
|||||||||||
|
Issue price
|
$
|
553,232
|
|
122,500
|
|
584,500
|
|
707,000
|
|
82,500
|
|
269,620
|
|
40,305
|
|
392,425
|
|
1,652,657
|
|
||||||||||
|
Cost of funds (1-month LIBOR plus):
|
0.59
|
%
|
0.27
|
%
|
0.60
|
%
|
0.30
|
%
|
0.60
|
%
|
0.90
|
%
|
|||||||||||||||||
|
Final maturity date
|
4/25/41
|
|
3/25/20
|
|
9/25/42
|
|
1/27/25
|
|
2/26/46
|
|
6/25/49
|
|
|||||||||||||||||
|
Class B subordinated notes:
|
|||||||||||||||||||||||||||||
|
Total original principal amount
|
$
|
13,114
|
|
15,000
|
|
7,500
|
|
35,614
|
|
||||||||||||||||||||
|
Bond discount
|
(1,157
|
)
|
(1,793
|
)
|
(968
|
)
|
(3,918
|
)
|
|||||||||||||||||||||
|
Issue price
|
$
|
11,957
|
|
13,207
|
|
6,532
|
|
31,696
|
|
||||||||||||||||||||
|
Cost of funds (1-month LIBOR plus):
|
1.50
|
%
|
1.50
|
%
|
1.50
|
%
|
|||||||||||||||||||||||
|
Final maturity date
|
6/25/46
|
|
5/25/49
|
|
6/27/50
|
|
|||||||||||||||||||||||
F-25
NELNET, INC. AND SUBSIDIARIES
Notes to Consolidated Financial Statements – (continued)
(Dollars in thousands, except share amounts, unless otherwise noted)
Auction Rate Securities
The interest rates on certain of the Company's FFELP asset-backed securities are set and periodically reset via a "dutch auction" ("Auction Rate Securities"). As of
December 31, 2016
, the Company is currently the sponsor on
$998.4 million
of Auction Rate Securities.
Since February 2008, problems in the auction rate securities market as a whole have led to failures of the auctions pursuant to which the Company's Auction Rate Securities' interest rates are set. As a result, the Auction Rate Securities generally pay interest to the holder at a maximum rate as defined by the indenture. While these rates will vary, they will generally be based on a spread to LIBOR or Treasury Securities, or the Net Loan Rate as defined in the financing documents. Based on the relative levels of these indices as of
December 31, 2016
, the rates expected to be paid by the Company range from
LIBOR
plus 100 basis points, on the low end, to
LIBOR
plus 250 basis points, on the high end. These maximum rates are subject to increase if the credit ratings on the bonds are downgraded.
Unsecured Line of Credit
The Company has a
$350.0 million
unsecured line of credit that has a maturity date of
December 12, 2021
. As of
December 31, 2016
, the unsecured line of credit had no amounts outstanding and
$350.0 million
was available for future use. Interest on amounts borrowed under the line of credit is payable, at the Company's election, at an alternate base rate or a Eurodollar rate, plus a variable rate (LIBOR), in each case as defined in the credit agreement. The initial margin applicable to Eurodollar borrowings is 150 basis points and may vary from 100 to 200 basis points depending on the Company's credit rating.
The line of credit agreement contains certain financial covenants that, if not met, lead to an event of default under the agreement. The covenants include maintaining:
|
•
|
A minimum consolidated net worth
|
|
•
|
A minimum adjusted EBITDA to corporate debt interest (over the last four rolling quarters)
|
|
•
|
A limitation on recourse indebtedness
|
|
•
|
A limitation on the amount of unsecuritized private education loans in the Company’s portfolio
|
|
•
|
A limitation on permitted investments, including business acquisitions that are not in one of the Company's existing lines of business
|
As of
December 31, 2016
, the Company was in compliance with all of these requirements. Many of these covenants are duplicated in the Company's other lending facilities, including its warehouse facilities.
The Company's operating line of credit does not have any covenants related to unsecured debt ratings. However, changes in the Company's ratings (as well as the amounts the Company borrows) have modest implications on the pricing level at which the Company obtains funds
A default on the Company's warehouse facilities would result in an event of default on the Company's unsecured line of credit that would result in the outstanding balance on the line of credit becoming immediately due and payable.
Junior Subordinated Hybrid Securities
On September 27, 2006, the Company issued
$200.0 million
aggregate principal amount of Junior Subordinated Hybrid Securities ("Hybrid Securities"). The Hybrid Securities are unsecured obligations of the Company. The interest rate on the Hybrid Securities through September 29, 2036 ("the scheduled maturity date") is equal to
three-month LIBOR
plus
3.375%
, payable quarterly, which was
4.37%
at
December 31, 2016
. The principal amount of the Hybrid Securities will become due on the scheduled maturity date only to the extent that prior to such date the Company has received proceeds from the sale of certain qualifying capital securities (as defined in the Hybrid Securities' indenture). If any amount is not paid on the scheduled maturity date, it will remain outstanding and bear interest at a floating rate as defined in the indenture, payable monthly. On September 15, 2061, the Company must pay any remaining principal and interest on the Hybrid Securities in full whether or not the Company has sold qualifying capital securities. At the Company's option, the Hybrid Securities are redeemable in whole or in part at their principal amount plus accrued and unpaid interest, provided in the case of a redemption in part that the principal amount outstanding after such redemption is at
F-26
NELNET, INC. AND SUBSIDIARIES
Notes to Consolidated Financial Statements – (continued)
(Dollars in thousands, except share amounts, unless otherwise noted)
least
$50.0 million
. However, if the holders of a majority in principal amount of the notes outstanding agree, the Company can redeem the Hybrid Securities below the $50 million threshold. As of
December 31, 2016
, the outstanding balance on the Hybrid Securities was
$50.2 million
.
Other Borrowings
The Company had a $75.0 million line of credit, which was collateralized by asset-backed security investments, that expired on October 31, 2016.
The Company also has two notes payable, which were each issued by TDP Phase Three, LLC ("TDP") on December 30, 2015 in connection with the development of a commercial building in Lincoln, Nebraska that is to be the new corporate headquarters for Hudl, a related party. TDP is an entity established during 2015 for the sole purpose of developing and operating this building. The Company owns 25 percent of TDP. However, because the Company plans to be a tenant in this building once the development is complete, the operating results of TDP are included in the Company's consolidated financial statements. As of December 31, 2016, one of the TDP notes has
$12.0 million
outstanding with a maturity date of
March 31, 2023
; the other TDP note has
$6.4 million
outstanding with a maturity date of
December 15, 2045
. Both of these notes have a fixed interest rate of 3.38%. Recourse to the Company on the outstanding balance of these notes is equal to its ownership percentage of TDP.
Debt Covenants
Certain bond resolutions and related credit agreements contain, among other requirements, covenants relating to restrictions on additional indebtedness, limits as to direct and indirect administrative expenses, and maintaining certain financial ratios. Management believes the Company is in compliance with all covenants of the bond indentures and related credit agreements as of
December 31, 2016
.
Maturity Schedule
Bonds and notes outstanding as of
December 31, 2016
are due in varying amounts as shown below.
|
2017
|
$
|
—
|
|
|
|
2018
|
656,254
|
|
||
|
2019
|
1,021,189
|
|
||
|
2020
|
—
|
|
||
|
2021
|
163,267
|
|
||
|
2022 and thereafter
|
23,259,710
|
|
||
|
$
|
25,100,420
|
|
||
Generally, the Company's secured financing instruments can be redeemed on any interest payment date at par plus accrued interest. Subject to certain provisions, all bonds and notes are subject to redemption prior to maturity at the option of certain education lending subsidiaries.
F-27
NELNET, INC. AND SUBSIDIARIES
Notes to Consolidated Financial Statements – (continued)
(Dollars in thousands, except share amounts, unless otherwise noted)
Debt Repurchases
The following table summarizes the Company's repurchases of its own debt. Gains recorded by the Company from the repurchase of debt are included in "gain on sale of loans and debt repurchases, net" on the Company’s consolidated statements of income.
|
|
Par value
|
Purchase price
|
Gain
|
Par value
|
Purchase price
|
Gain
|
Par value
|
Purchase price
|
Gain
|
||||||||||||||||||
|
Year ended December 31,
|
|||||||||||||||||||||||||||
|
2016
|
2015
|
2014
|
|||||||||||||||||||||||||
|
Unsecured debt - Hybrid Securities
|
$
|
7,000
|
|
4,865
|
|
2,135
|
|
14,504
|
|
11,374
|
|
3,130
|
|
24,769
|
|
19,761
|
|
5,008
|
|
||||||||
|
Asset-backed securities
|
78,412
|
|
72,566
|
|
5,846
|
|
32,026
|
|
30,354
|
|
1,672
|
|
29,243
|
|
27,636
|
|
1,607
|
|
|||||||||
|
$
|
85,412
|
|
77,431
|
|
7,981
|
|
46,530
|
|
41,728
|
|
4,802
|
|
54,012
|
|
47,397
|
|
6,615
|
|
|||||||||
5. Derivative Financial Instruments
The Company uses derivative financial instruments primarily to manage interest rate risk and foreign currency exchange risk.
Interest Rate Risk
The Company is exposed to interest rate risk in the form of basis risk and repricing risk because the interest rate characteristics of the Company's assets do not match the interest rate characteristics of the funding for those assets. The Company has adopted a policy of periodically reviewing the mismatch related to the interest rate characteristics of its assets and liabilities together with the Company's outlook as to current and future market conditions. Based on those factors, the Company uses derivative instruments as part of its overall risk management strategy. Derivative instruments used as part of the Company's interest rate risk management strategy currently include basis swaps and interest rate swaps.
Basis Swaps
Interest earned on the majority of the Company's FFELP student loan assets is indexed to the one-month LIBOR rate. Meanwhile, the Company funds a majority of its FFELP loan assets with three-month LIBOR indexed floating rate securities. The different interest rate characteristics of the Company's loan assets and liabilities funding these assets results in basis risk.
The Company also faces repricing risk due to the timing of the interest rate resets on its liabilities, which may occur as infrequently as once a quarter, in contrast to the timing of the interest rate resets on its assets, which generally occur daily.
As of December 31, 2016
, the Company had
$22.8 billion
,
$1.3 billion
, and
$0.7 billion
of FFELP loans indexed to the
one-month LIBOR
rate,
three-month commercial paper rate
, and the
three-month treasury bill rate
, respectively, the indices for which reset daily, and
$13.7 billion
of debt indexed to
three-month LIBOR
, the indices for which reset quarterly, and
$9.1 billion
of debt indexed to
one-month LIBOR
, the indices for which reset monthly.
The Company has used derivative instruments to hedge its basis risk and repricing risk. The Company has entered into basis swaps in which the Company receives three-month LIBOR set discretely in advance and pays one-month LIBOR plus or minus a spread as defined in the agreements (the 1:3 Basis Swaps).
The following table summarizes the Company’s 1:3 Basis Swaps outstanding:
|
As of December 31,
|
|||||||||
|
2016
|
2015
|
||||||||
|
Maturity
|
Notional amount
|
Notional amount
|
|||||||
|
2016
|
$
|
—
|
|
7,500,000
|
|
||||
|
2026
|
1,150,000
|
|
—
|
|
|||||
|
2028
|
325,000
|
|
—
|
|
|||||
|
2031
|
300,000
|
|
—
|
|
|||||
|
$
|
1,775,000
|
|
7,500,000
|
|
|||||
F-28
NELNET, INC. AND SUBSIDIARIES
Notes to Consolidated Financial Statements – (continued)
(Dollars in thousands, except share amounts, unless otherwise noted)
The weighted average rate paid by the Company on the 1:3 Basis Swaps as of
December 31, 2016 and 2015
, was
one-month LIBOR
plus
10.1
basis points and 10.0 basis points, respectively.
Interest rate swaps – floor income hedges
FFELP loans originated prior to April 1, 2006 generally earn interest at the higher of the borrower rate, which is fixed over a period of time, or a floating rate based on the Special Allowance Payments ("SAP") formula set by the Department. The SAP rate is based on an applicable index plus a fixed spread that depends on loan type, origination date, and repayment status. The Company generally finances its student loan portfolio with variable rate debt. In low and/or certain declining interest rate environments, when the fixed borrower rate is higher than the SAP rate, these student loans earn at a fixed rate while the interest on the variable rate debt typically continues to reflect the low and/or declining interest rates. In these interest rate environments, the Company may earn additional spread income that it refers to as floor income.
Depending on the type of loan and when it was originated, the borrower rate is either fixed to term or is reset to an annual rate each July 1. As a result, for loans where the borrower rate is fixed to term, the Company may earn floor income for an extended period of time, which the Company refers to as fixed rate floor income, and for those loans where the borrower rate is reset annually on July 1, the Company may earn floor income to the next reset date, which the Company refers to as variable rate floor income. All FFELP loans first originated on or after April 1, 2006 effectively earn at the SAP rate, since lenders are required to rebate fixed rate floor income and variable rate floor income for these loans to the Department.
Absent the use of derivative instruments, a rise in interest rates may reduce the amount of floor income received and this may have an impact on earnings due to interest margin compression caused by increasing financing costs, until such time as the federally insured loans earn interest at a variable rate in accordance with their SAP formulas. In higher interest rate environments, where the interest rate rises above the borrower rate and fixed rate loans effectively become variable rate loans, the impact of the rate fluctuations is reduced.
As of
December 31, 2016
and 2015, the Company had
$8.4 billion
and
$11.1 billion
, respectively, of FFELP student loan assets that were earning fixed rate floor income, of which the weighted average estimated variable conversion rate for these loans, which is the estimated short-term interest rate at which loans would convert to a variable rate, was
2.42%
and
2.15%
, respectively.
The following tables summarize the outstanding derivative instruments used by the Company to economically hedge loans earning fixed rate floor income.
|
As of December 31, 2016
|
As of December 31, 2015
|
||||||||||||||
|
Maturity
|
Notional amount
|
Weighted average fixed rate paid by the Company (a)
|
Notional amount
|
Weighted average fixed rate paid by the Company (a)
|
|||||||||||
|
2016
|
$
|
—
|
|
—
|
%
|
$
|
1,000,000
|
|
0.76
|
%
|
|||||
|
2017
|
750,000
|
|
0.99
|
|
2,100,000
|
|
0.84
|
|
|||||||
|
2018
|
1,350,000
|
|
1.07
|
|
1,600,000
|
|
1.08
|
|
|||||||
|
2019
|
3,250,000
|
|
0.97
|
|
500,000
|
|
1.12
|
|
|||||||
|
2020
|
1,500,000
|
|
1.01
|
|
—
|
|
—
|
|
|||||||
|
2025
|
100,000
|
|
2.32
|
|
100,000
|
|
2.32
|
|
|||||||
|
|
$
|
6,950,000
|
|
1.02
|
%
|
$
|
5,300,000
|
|
0.95
|
%
|
|||||
|
(a)
|
For all interest rate derivatives, the Company receives discrete three-month LIBOR.
|
On August 20, 2014, the Company paid
$9.1 million
for an interest rate swap option to economically hedge loans earning fixed rate floor income. The interest rate swap option gives the Company the right, but not the obligation, to enter into a
$250 million
notional interest rate swap in which the Company would pay a fixed amount of
3.30%
and receive discrete
one-month LIBOR
. If the interest rate swap option is exercised, the swap would become effective in 2019 and mature in 2024.
F-29
NELNET, INC. AND SUBSIDIARIES
Notes to Consolidated Financial Statements – (continued)
(Dollars in thousands, except share amounts, unless otherwise noted)
Interest rate swaps – unsecured debt hedges
As of
December 31, 2016
and
2015
, the Company had
$50.2 million
and
$57.2 million
, respectively, of unsecured Hybrid Securities outstanding. The interest rate on the Hybrid Securities through
September 29, 2036
is equal to
three-month LIBOR
plus
3.375%
, payable quarterly. As of
December 31, 2016
and
2015
, the Company had the following derivatives outstanding that are used to effectively convert the variable interest rate on a portion of the Hybrid Securities to a fixed rate of
7.66%
.
|
Maturity
|
Notional amount
|
Weighted average fixed rate paid by the Company (a)
|
||||
|
2036
|
$
|
25,000
|
|
4.28%
|
||
|
(a)
|
For all interest rate derivatives, the Company receives discrete three-month LIBOR.
|
Interest Rate Caps
In June 2015, in conjunction with the entry into the
$275.0 million
private education loan warehouse facility, the Company paid
$2.9 million
for two interest rate cap contracts with a total notional amount of
$275.0 million
. The first interest rate cap has a notional amount of
$125.0 million
and a
one-month LIBOR
strike rate of
2.50%
, and the second interest rate cap has a notional amount of
$150.0 million
and a
one-month LIBOR
strike rate of
4.99%
. In the event that the one-month LIBOR rate rises above the applicable strike rate, the Company would receive monthly payments related to the spread difference. Both interest rate cap contracts have a maturity date of July 15, 2020. Although the private education loan warehouse facility terminated on December 21, 2016, the Company currently intends to keep these derivatives outstanding to partially mitigate a rise in interest rates and its impact on earnings related to its student loan portfolio earning a fixed rate.
Foreign Currency Exchange Risk
In 2006, the Company issued
€352.7 million
of student loan asset-backed Euro Notes (the "Euro Notes") with an interest rate based on a spread to the EURIBOR index. As a result of the Euro Notes, the Company is exposed to market risk related to fluctuations in foreign currency exchange rates between the U.S. dollar and Euro. The principal and accrued interest on these notes are re-measured at each reporting period and recorded in the Company’s consolidated balance sheet in U.S. dollars based on the foreign currency exchange rate on that date. Changes in the principal and accrued interest amounts as a result of foreign currency exchange rate fluctuations are included in the Company’s consolidated statements of income.
The Company entered into a cross-currency interest rate swap in connection with the issuance of the Euro Notes. Under the terms of the cross-currency interest rate swap, the Company receives from the counterparty a spread to the EURIBOR index based on a notional amount of
€352.7 million
and pays a spread to the LIBOR index based on a notional amount of
$450.0 million
. In addition, under the terms of this agreement, all principal payments on the Euro Notes will effectively be paid at the exchange rate in effect between the U.S. dollar and Euro as of the issuance of the notes.
The following table shows the income statement impact as a result of the re-measurement of the Euro Notes and the change in the fair value of the related derivative instruments.
|
|
Year ended December 31,
|
||||||||
|
|
2016
|
2015
|
2014
|
||||||
|
Re-measurement of Euro Notes
|
$
|
11,849
|
|
43,801
|
|
58,013
|
|
||
|
Change in fair value of cross currency interest rate swaps
|
(1,954
|
)
|
(45,195
|
)
|
(57,289
|
)
|
|||
|
Total impact to consolidated statements of income - (expense) income (a)
|
$
|
9,895
|
|
(1,394
|
)
|
724
|
|
||
|
(a)
|
The financial statement impact of the above items is included in "Derivative market value and foreign currency adjustments and derivative settlements, net" in the Company's consolidated statements of income.
|
F-30
NELNET, INC. AND SUBSIDIARIES
Notes to Consolidated Financial Statements – (continued)
(Dollars in thousands, except share amounts, unless otherwise noted)
Management has structured the cross-currency interest rate swap to economically hedge the Euro Notes to effectively convert the Euro Notes to U.S. dollars and pay a spread on these notes based on the LIBOR index. However, the cross-currency interest rate swap does not qualify for hedge accounting. The re-measurement of the Euro-denominated bonds generally correlates with the change in the fair value of the corresponding cross-currency interest rate swap. However, the Company will experience unrealized gains and losses between these financial instruments due to the principal and accrued interest on the Euro Notes being re-measured to U.S. dollars at each reporting date based on the foreign currency exchange rate on that date, while the cross-currency interest rate swap is measured at fair value at each reporting date with the change in fair value recognized in the current period earnings.
Consolidated Financial Statement Impact Related to Derivatives
The following table summarizes the fair value of the Company’s derivatives as reflected on the consolidated balance sheets.
|
|
Fair value of asset derivatives
|
Fair value of liability derivatives
|
||||||||||
|
|
As of
|
As of
|
As of
|
As of
|
||||||||
|
December 31, 2016
|
December 31, 2015
|
December 31, 2016
|
December 31, 2015
|
|||||||||
|
1:3 basis swaps
|
$
|
—
|
|
724
|
|
2,624
|
|
410
|
|
|||
|
Interest rate swaps - floor income hedges
|
81,159
|
|
21,408
|
|
256
|
|
1,175
|
|
||||
|
Interest rate swap option - floor income hedge
|
2,977
|
|
3,257
|
|
—
|
|
—
|
|
||||
|
Interest rate swaps - hybrid debt hedges
|
—
|
|
—
|
|
7,341
|
|
7,646
|
|
||||
|
Interest rate caps
|
1,152
|
|
1,570
|
|
—
|
|
—
|
|
||||
|
Cross-currency interest rate swap
|
—
|
|
—
|
|
67,605
|
|
65,650
|
|
||||
|
Other
|
2,243
|
|
1,731
|
|
—
|
|
—
|
|
||||
|
Total
|
$
|
87,531
|
|
28,690
|
|
77,826
|
|
74,881
|
|
|||
During the years ended
December 31, 2016
and 2015, the Company terminated certain derivatives for net proceeds of
$4.0 million
and
$65.5 million
, respectively.
Offsetting of Derivative Assets/Liabilities
The Company records derivative instruments in the consolidated balance sheets on a gross basis as either an asset or liability measured at its fair value. Certain of the Company's derivative instruments are subject to right of offset provisions with counterparties. The following tables include the gross amounts related to the Company's derivative portfolio recognized in the consolidated balance sheets, reconciled to the net amount when excluding derivatives subject to enforceable master netting arrangements and cash collateral received/pledged:
|
Gross amounts not offset in the consolidated balance sheets
|
|||||||||||||
|
Derivative assets
|
Gross amounts of recognized assets presented in the consolidated balance sheets
|
Derivatives subject to enforceable master netting arrangement
|
Cash collateral pledged
|
Net asset (liability)
|
|||||||||
|
Balance as of December 31, 2016
|
$
|
87,531
|
|
(2,880
|
)
|
475
|
|
85,126
|
|
||||
|
Balance as of December 31, 2015
|
28,690
|
|
(851
|
)
|
1,632
|
|
29,471
|
|
|||||
F-31
NELNET, INC. AND SUBSIDIARIES
Notes to Consolidated Financial Statements – (continued)
(Dollars in thousands, except share amounts, unless otherwise noted)
|
Gross amounts not offset in the consolidated balance sheets
|
|||||||||||||
|
Derivative liabilities
|
Gross amounts of recognized liabilities presented in the consolidated balance sheets
|
Derivatives subject to enforceable master netting arrangement
|
Cash collateral pledged
|
Net asset (liability)
|
|||||||||
|
Balance as of December 31, 2016
|
$
|
(77,826
|
)
|
2,880
|
|
7,292
|
|
(67,654
|
)
|
||||
|
Balance as of December 31, 2015
|
(74,881
|
)
|
851
|
|
13,168
|
|
(60,862
|
)
|
|||||
The following table summarizes the effect of derivative instruments in the consolidated statements of income.
|
Year ended December 31,
|
||||||||||
|
2016
|
2015
|
2014
|
||||||||
|
Settlements:
|
|
|
|
|
||||||
|
1:3 basis swaps
|
$
|
1,493
|
|
1,058
|
|
3,389
|
|
|||
|
Interest rate swaps - floor income hedges
|
(17,643
|
)
|
(23,041
|
)
|
(24,380
|
)
|
||||
|
Interest rate swaps - hybrid debt hedges
|
(915
|
)
|
(1,012
|
)
|
(1,025
|
)
|
||||
|
Cross-currency interest rate swaps
|
(4,884
|
)
|
(1,255
|
)
|
173
|
|
||||
|
Total settlements - (expense) income
|
(21,949
|
)
|
(24,250
|
)
|
(21,843
|
)
|
||||
|
Change in fair value:
|
|
|
|
|
|
|
||||
|
1:3 basis swaps
|
(2,938
|
)
|
12,292
|
|
36,824
|
|
||||
|
Interest rate swaps - floor income hedges
|
64,111
|
|
20,103
|
|
8,797
|
|
||||
|
Interest rate swap option - floor income hedge
|
(281
|
)
|
(2,420
|
)
|
(3,409
|
)
|
||||
|
Interest rate swaps - hybrid debt hedges
|
304
|
|
(295
|
)
|
(5,233
|
)
|
||||
|
Interest rate caps
|
(419
|
)
|
(1,365
|
)
|
—
|
|
||||
|
Cross-currency interest rate swaps
|
(1,954
|
)
|
(45,195
|
)
|
(57,289
|
)
|
||||
|
Other
|
1,072
|
|
1,730
|
|
—
|
|
||||
|
Total change in fair value - income (expense)
|
59,895
|
|
(15,150
|
)
|
(20,310
|
)
|
||||
|
Re-measurement of Euro Notes (foreign currency transaction adjustment) - income (expense)
|
11,849
|
|
43,801
|
|
58,013
|
|
||||
|
Derivative market value and foreign currency adjustments and derivative settlements, net - income (expense)
|
$
|
49,795
|
|
4,401
|
|
15,860
|
|
|||
Derivative Instruments - Credit and Market Risk
By using derivative instruments, the Company is exposed to credit and market risk. The Company manages credit and market risks associated with interest rates by establishing and monitoring limits as to the types and degree of risk that may be undertaken and by entering into transactions with high-quality counterparties that are reviewed periodically by the Company's risk committee. As of
December 31, 2016
, all of the Company's derivative counterparties had investment grade credit ratings. The Company also has a policy of requiring that all derivative contracts be governed by an International Swaps and Derivatives Association, Inc. Master Agreement.
F-32
NELNET, INC. AND SUBSIDIARIES
Notes to Consolidated Financial Statements – (continued)
(Dollars in thousands, except share amounts, unless otherwise noted)
Credit Risk
When the fair value of a derivative contract is positive (an asset in the Company's consolidated balance sheet), this generally indicates that the counterparty would owe the Company if the derivative was settled. If the counterparty fails to perform, credit risk with such counterparty is equal to the extent of the fair value gain in the derivative less any collateral held by the Company. If the Company was unable to collect from a counterparty, it would have a loss equal to the amount the derivative is recorded in the consolidated balance sheet.
The Company considers counterparties' credit risk when determining the fair value of derivative positions on its exposure net of collateral. However, the Company does not use the collateral to offset fair value amounts recognized for derivative instruments in the financial statements.
Market Risk
When the fair value of a derivative instrument is negative (a liability in the Company's consolidated balance sheet), the Company would owe the counterparty if the derivative was settled and, therefore, has no immediate credit risk. If the negative fair value of derivatives with a counterparty exceeds a specified threshold, the Company may have to make a collateral deposit with the counterparty. The threshold at which the Company may be required to post collateral is dependent upon the Company's unsecured credit rating. The Company believes any downgrades from its current unsecured credit rating (Standard & Poor's: BBB- (stable outlook) and Moody's: Ba1 (stable outlook)), would not result in additional collateral requirements of a material nature. In addition, no counterparty has the right to terminate its contracts in the event of downgrades from the current rating. However, some derivative contracts have mutual optional termination provisions that can be exercised during 2022. As of
December 31, 2016
, the fair value of derivatives with early termination provisions was a
negative
$2.7 million
(a
liability
on the Company's balance sheet).
Interest rate movements have an impact on the amount of collateral the Company is required to deposit with its derivative instrument counterparties. With the Company's current derivative portfolio, the Company does not currently anticipate any movement in interest rates having a material impact on its liquidity or capital resources, nor expects future movements in interest rates to have a material impact on its ability to meet potential collateral deposits with its counterparties. Due to the existing low interest rate environment, the Company's exposure to downward movements in interest rates on its interest rate swaps is limited. In addition, the historical high correlation between one-month and three-month LIBOR limits the Company's exposure to interest rate movements on the 1:3 Basis Swaps.
The Company's cross-currency interest rate swap was entered into as a result of an asset-backed security financing and was entered into at the securitization trust level with the counterparty. Trust related derivatives do not contain credit contingent features related to the Company or the trust's credit ratings. As such, there are no collateral requirements and as a result the impact of changes to foreign currency rates has no impact on the amount of collateral the Company would be required to deposit with the counterparty on this derivative.
F-33
NELNET, INC. AND SUBSIDIARIES
Notes to Consolidated Financial Statements – (continued)
(Dollars in thousands, except share amounts, unless otherwise noted)
6. Investments and Notes Receivable
A summary of the Company's investments and notes receivable follows:
|
As of December 31, 2016
|
As of December 31, 2015
|
||||||||||||||||||||||||
|
Amortized cost
|
Gross unrealized gains
|
Gross unrealized losses (a)
|
Fair value
|
Amortized cost
|
Gross unrealized gains
|
Gross unrealized losses
|
Fair value
|
||||||||||||||||||
|
Investments (at fair value):
|
|||||||||||||||||||||||||
|
Available-for-sale investments:
|
|||||||||||||||||||||||||
|
Student loan asset-backed and other debt securities (b)
|
$
|
98,260
|
|
6,280
|
|
(641
|
)
|
103,899
|
|
139,970
|
|
3,402
|
|
(1,362
|
)
|
142,010
|
|
||||||||
|
Equity securities
|
720
|
|
1,930
|
|
(61
|
)
|
2,589
|
|
846
|
|
1,686
|
|
(100
|
)
|
2,432
|
|
|||||||||
|
Total available-for-sale investments
|
$
|
98,980
|
|
8,210
|
|
(702
|
)
|
106,488
|
|
140,816
|
|
5,088
|
|
(1,462
|
)
|
144,442
|
|
||||||||
|
Trading investments:
|
|||||||||||||||||||||||||
|
Student loan asset-backed securities
|
—
|
|
6,045
|
|
|||||||||||||||||||||
|
Equity securities
|
105
|
|
4,905
|
|
|||||||||||||||||||||
|
Total trading investments
|
105
|
|
10,950
|
|
|||||||||||||||||||||
|
Total available-for-sale and trading investments
|
106,593
|
|
155,392
|
|
|||||||||||||||||||||
|
Other Investments and Notes Receivable (not measured at fair value):
|
|||||||||||||||||||||||||
|
Venture capital and funds (c)
|
69,789
|
|
63,323
|
|
|||||||||||||||||||||
|
Real estate
|
48,379
|
|
50,463
|
|
|||||||||||||||||||||
|
Notes receivable
|
17,031
|
|
18,473
|
|
|||||||||||||||||||||
|
Tax liens and affordable housing
|
12,352
|
|
16,030
|
|
|||||||||||||||||||||
|
Total investments and notes receivable
|
$
|
254,144
|
|
303,681
|
|
||||||||||||||||||||
|
(a)
|
As of December 31, 2016, the aggregate fair value of available-for-sale investments with unrealized losses was
$11.0 million
of which substantially all had been in a continuous unrealized loss position for greater than 12 months. Because the Company currently has the intent and ability to retain these investments for an anticipated recovery in fair value, as of
December 31, 2016
, the Company considered the decline in market value of its available-for-sale investments to be temporary in nature and did not consider any of its investments other-than-temporarily impaired.
|
|
(b)
|
As of
December 31, 2016
, the stated maturities of substantially all of the Company's student loan asset-backed securities and other debt securities classified as available-for-sale were greater than 10 years.
|
|
(c)
|
As of December 31, 2016 and 2015, "Venture capital and funds" included
$41.4 million
of the Company's equity investment in Hudl. See note 19 for further information.
|
The following table summarizes the amount included in "other income" in the consolidated statements of income related to the Company's investments classified as available-for-sale and trading.
|
Year ended December 31,
|
||||||||||
|
2016
|
2015
|
2014
|
||||||||
|
Available-for-sale securities:
|
||||||||||
|
Gross realized gains
|
$
|
3,099
|
|
3,402
|
|
8,581
|
|
|||
|
Gross realized losses
|
(1,192
|
)
|
(447
|
)
|
(75
|
)
|
||||
|
Trading securities:
|
||||||||||
|
Unrealized gains (losses), net
|
525
|
|
(715
|
)
|
(135
|
)
|
||||
|
Realized gains (losses), net
|
341
|
|
(2,097
|
)
|
(1,082
|
)
|
||||
|
$
|
2,773
|
|
143
|
|
7,289
|
|
||||
F-34
NELNET, INC. AND SUBSIDIARIES
Notes to Consolidated Financial Statements – (continued)
(Dollars in thousands, except share amounts, unless otherwise noted)
7. Business Combination
Wilcomp Software, L.P. (d.b.a. RenWeb School Management Software) (“RenWeb”)
On
June 3, 2014
, the Company purchased
100 percent
of the ownership interests of RenWeb. RenWeb provides school information systems for private and faith-based schools that help schools automate administrative processes such as admissions, scheduling, student billing, attendance, and grade book management. The combination of RenWeb’s school administration software and the Company’s tuition management and financial needs assessment services is expected to significantly increase the value of the Company’s offerings in this area, allowing the Company to deliver a comprehensive suite of solutions to schools.
The initial consideration paid by the Company for RenWeb was
$44.0 million
. In addition to the initial purchase price, additional payments were paid by the Company to the former owners of RenWeb based on certain operating results and other performance measures of RenWeb as defined in the purchase agreement. As of the acquisition date, the Company accrued
$2.3 million
as additional consideration, which represented the estimated fair value of the contingent consideration arrangement. During 2014, the Company reduced the estimated fair value of the contingent consideration by
$1.3 million
. During 2015, the Company increased the estimated fair value of the contingent consideration by
$0.9 million
and paid
$1.0 million
of contingent consideration to the former owners. In January 2017, the Company paid an additional
$1.0 million
to the former owners that satisfied all contingent obligations under this agreement.
The following table summarizes the estimated fair values of the assets acquired and liabilities assumed at the acquisition date.
|
Cash and cash equivalents
|
$
|
326
|
|
|
|
Accounts receivable
|
961
|
|
||
|
Property and equipment
|
105
|
|
||
|
Other assets
|
22
|
|
||
|
Intangible assets
|
37,188
|
|
||
|
Excess cost over fair value of net assets acquired (goodwill)
|
9,082
|
|
||
|
Other liabilities
|
(1,341
|
)
|
||
|
Net assets acquired
|
$
|
46,343
|
|
|
The
$37.2 million
of acquired intangible assets on the date of acquisition had a weighted-average useful life of approximately
18 years
. The intangible assets that made up this amount included customer relationships of
$25.5 million
(
20
-year useful life), trade name of
$6.4 million
(
20
-year useful life), computer software of
$4.9 million
(
5
-year useful life), and non-competition agreements of
$0.4 million
(
10
-year useful life).
The
$9.1 million
of goodwill was assigned to the Tuition Payment Processing and Campus Commerce operating segment and is expected to be deductible for tax purposes. The amount allocated to goodwill was primarily attributable to anticipated synergies as discussed previously.
The proforma impacts of the acquisition on the Company's historical results prior to the acquisition were not material.
Allo
On December 31, 2015, the Company purchased
92.5 percent
of the ownership interests of Allo for total cash consideration of
$46.25 million
. On January 1, 2016, the Company sold a 1.0 percent ownership interest in Allo to a non-related third-party for $0.5 million. The remaining
7.5 percent
of the ownership interests of Allo is owned by Allo management, who has the opportunity to earn an additional
11.5 percent
(up to
19 percent
) of the total ownership interests based on the financial performance of Allo. The additional ownership interests that Allo management has the opportunity to earn are based on their continued employment with Allo. Accordingly, the value associated with the ownership interests issued to these employees of $1.0 million will be recognized by Allo as compensation expense over the performance period.
Allo provides pure fiber optic service to homes and businesses for internet, television, and telephone services. The acquisition of Allo provides additional diversification of the Company's revenues and cash flows outside of education. In addition, the acquisition leverages the Company's existing infrastructure, customer service capabilities and call centers, and financial strength and liquidity for continued growth.
F-35
NELNET, INC. AND SUBSIDIARIES
Notes to Consolidated Financial Statements – (continued)
(Dollars in thousands, except share amounts, unless otherwise noted)
The following table summarizes the estimated fair values of the assets acquired and liabilities assumed at the acquisition date. During the first quarter of 2016, the Company recognized certain adjustments to the provisional amounts recorded at December 31, 2015 that were needed to reflect new information obtained about facts and circumstances that existed as of the acquisition date. The net impact of these adjustments was an increase to goodwill, and the adjustments had no impact on operating results.
|
Cash and cash equivalents
|
$
|
334
|
|
|
|
Restricted cash
|
850
|
|
||
|
Accounts receivable
|
1,935
|
|
||
|
Property and equipment
|
32,479
|
|
||
|
Other assets
|
371
|
|
||
|
Intangible assets
|
11,410
|
|
||
|
Excess cost over fair value of net assets acquired (goodwill)
|
21,112
|
|
||
|
Other liabilities
|
(4,587
|
)
|
||
|
Bonds and notes payable
|
(13,904
|
)
|
||
|
Net assets acquired
|
50,000
|
|
||
|
Minority interest
|
(3,750
|
)
|
||
|
Total consideration paid by the Company
|
$
|
46,250
|
|
|
The
$11.4 million
of acquired intangible assets on the date of acquisition had a weighted-average useful life of approximately
12
years. The intangible assets that made up this amount included customer relationships of
$6.3 million
(
10
-year useful life) and a trade name of
$5.1 million
(
15
-year useful life).
The
$21.1 million
of goodwill was assigned to the Communications operating segment and is expected to be deductible for tax purposes. The amount allocated to goodwill was primarily attributable to future customers to be generated through the continued expansion of Allo's services in rural markets.
The proforma impacts of the acquisition on the Company's historical results prior to the acquisition were not material.
8. Intangible Assets
Intangible assets consist of the following:
|
Weighted average remaining useful life as of December 31, 2016 (months)
|
As of December 31, 2016
|
As of December 31, 2015
|
|||||||
|
Amortizable intangible assets:
|
|
|
|||||||
|
Customer relationships (net of accumulated amortization of $8,548 and $23,195, respectively)
|
168
|
|
$
|
28,335
|
|
27,576
|
|
||
|
Computer software (net of accumulated amortization of $9,652 and $4,397, respectively)
|
26
|
|
9,296
|
|
11,601
|
|
|||
|
Trade names (net of accumulated amortization of $1,653 and $795, respectively)
|
189
|
|
9,919
|
|
10,687
|
|
|||
|
Content (net of accumulated amortization of $1,800 and $900, respectively)
|
—
|
|
—
|
|
900
|
|
|||
|
Covenants not to compete (net of accumulated amortization of $91 and $56, respectively)
|
89
|
|
263
|
|
298
|
|
|||
|
Total - amortizable intangible assets
|
144
|
|
$
|
47,813
|
|
51,062
|
|
||
F-36
NELNET, INC. AND SUBSIDIARIES
Notes to Consolidated Financial Statements – (continued)
(Dollars in thousands, except share amounts, unless otherwise noted)
The Company recorded amortization expense on its intangible assets of
$11.6 million
,
$9.8 million
, and
$6.5 million
during the years ended
December 31, 2016, 2015, and 2014
, respectively. The Company will continue to amortize intangible assets over their remaining useful lives.
As of December 31, 2016
, the Company estimates it will record amortization expense as follows:
|
2017
|
$
|
9,386
|
|
|
2018
|
8,605
|
|
|
|
2019
|
5,147
|
|
|
|
2020
|
4,231
|
|
|
|
2021
|
3,480
|
|
|
|
2022 and thereafter
|
16,964
|
|
|
|
|
$
|
47,813
|
|
9. Goodwill
The change in the carrying amount of goodwill by reportable operating segment was as follows:
|
Loan Systems and Servicing
|
Tuition Payment Processing and Campus Commerce
|
Communications
|
Asset Generation and Management (a)
|
Corporate and Other Activities
|
Total
|
|||||||||||||
|
Balance as of December 31, 2014
|
$
|
8,596
|
|
67,168
|
|
—
|
|
41,883
|
|
8,553
|
|
126,200
|
|
|||||
|
Goodwill acquired during the period
|
—
|
|
—
|
|
19,800
|
|
—
|
|
—
|
|
19,800
|
|
||||||
|
Balance as of December 31, 2015
|
8,596
|
|
67,168
|
|
19,800
|
|
41,883
|
|
8,553
|
|
146,000
|
|
||||||
|
Allo purchase price adjustment
|
—
|
|
—
|
|
1,312
|
|
—
|
|
—
|
|
1,312
|
|
||||||
|
Balance as of December 31, 2016
|
$
|
8,596
|
|
67,168
|
|
21,112
|
|
41,883
|
|
8,553
|
|
147,312
|
|
|||||
|
(a)
|
As a result of the Reconciliation Act of 2010, the Company no longer originates new FFELP loans, and net interest income from the Company's existing FFELP loan portfolio will decline over time as the Company's portfolio pays down. As a result, as this revenue stream winds down, goodwill impairment will be triggered for the Asset Generation and Management reporting unit due to the passage of time and depletion of projected cash flows stemming from its FFELP student loan portfolio. Management believes the elimination of new FFELP loan originations will not have an adverse impact on the fair value of the Company's other reporting units.
|
The Company reviews goodwill for impairment annually. This annual review is completed by the Company as of November 30 of each year and whenever triggering events or changes in circumstances indicate its carrying value may not be recoverable.
For the
2014
,
2015
, and
2016
annual review of goodwill, the Company assessed qualitative factors and concluded it was not more likely than not that the fair value of its reporting units were less than their carrying amount. As such, the Company was not required to perform the two-step impairment test and concluded there was no impairment of goodwill.
F-37
NELNET, INC. AND SUBSIDIARIES
Notes to Consolidated Financial Statements – (continued)
(Dollars in thousands, except share amounts, unless otherwise noted)
10. Property and Equipment
Property and equipment consisted of the following:
|
As of December 31,
|
||||||||
|
Useful life
|
2016
|
2015
|
||||||
|
Non-communications:
|
||||||||
|
Computer equipment and software
|
1-5 years
|
$
|
97,317
|
|
89,093
|
|
||
|
Office furniture and equipment
|
3-7 years
|
12,344
|
|
12,638
|
|
|||
|
Building and building improvements
|
5-39 years
|
13,363
|
|
12,239
|
|
|||
|
Transportation equipment
|
4-10 years
|
3,809
|
|
3,868
|
|
|||
|
Leasehold improvements
|
5-20 years
|
3,579
|
|
3,545
|
|
|||
|
Land
|
—
|
1,682
|
|
700
|
|
|||
|
Construction in progress
|
—
|
16,346
|
|
1,210
|
|
|||
|
148,440
|
|
123,293
|
|
|||||
|
Accumulated depreciation - non-communications
|
91,285
|
|
77,188
|
|
||||
|
Non-communications, net property and equipment
|
57,155
|
|
46,105
|
|
||||
|
Communications:
|
||||||||
|
Network plant and fiber
|
5-15 years
|
40,844
|
|
25,669
|
|
|||
|
Central office
|
5-15 years
|
6,448
|
|
909
|
|
|||
|
Customer located property
|
5-10 years
|
5,138
|
|
6,912
|
|
|||
|
Transportation equipment
|
4-10 years
|
2,966
|
|
470
|
|
|||
|
Computer equipment and software
|
1-5 years
|
2,026
|
|
74
|
|
|||
|
Other
|
1-39 years
|
1,268
|
|
343
|
|
|||
|
Land
|
—
|
70
|
|
—
|
|
|||
|
Construction in progress
|
—
|
12,537
|
|
—
|
|
|||
|
71,297
|
|
34,377
|
|
|||||
|
Accumulated depreciation - communications
|
4,666
|
|
—
|
|
||||
|
Communications, net property and equipment
|
66,631
|
|
34,377
|
|
||||
|
Total property and equipment, net
|
$
|
123,786
|
|
80,482
|
|
|||
Depreciation expense for the years ended
December 31, 2016
,
2015
, and
2014
related to property and equipment was
$22.4 million
,
$16.5 million
, and
$14.6 million
, respectively.
11. Shareholders’ Equity
Classes of Common Stock
The Company's common stock is divided into two classes. The Class B common stock has
ten
votes per share and the Class A common stock has
one
vote per share on all matters to be voted on by the Company's shareholders. Each Class B share is convertible at any time at the holder's option into one Class A share. With the exception of the voting rights and the conversion feature, the Class A and Class B shares are identical in terms of other rights, including dividend and liquidation rights.
Stock Repurchases
The Company has a stock repurchase program that expires on May 25, 2019 in which it can repurchase up to
five million
shares of its Class A common stock on the open market, through private transactions, or otherwise. As of
December 31, 2016
,
4.6 million
shares may still be purchased under the Company's stock repurchase program. Shares repurchased by the Company during
2016
,
2015
, and
2014
are shown in the table below.
F-38
NELNET, INC. AND SUBSIDIARIES
Notes to Consolidated Financial Statements – (continued)
(Dollars in thousands, except share amounts, unless otherwise noted)
|
Total shares repurchased
|
Purchase price (in thousands)
|
Average price of shares repurchased (per share)
|
|||||||||
|
Year ended December 31, 2016
|
2,038,368
|
|
$
|
69,091
|
|
$
|
33.90
|
|
|||
|
Year ended December 31, 2015
|
2,449,159
|
|
96,169
|
|
39.27
|
|
|||||
|
Year ended December 31, 2014
|
381,689
|
|
15,713
|
|
41.17
|
|
|||||
12. Earnings per Common Share
Presented below is a summary of the components used to calculate basic and diluted earnings per share. The Company applies the two-class method in computing both basic and diluted earnings per share, which requires the calculation of separate earnings per share amounts for common stock and unvested share-based awards. Unvested share-based awards that contain nonforfeitable rights to dividends are considered securities which participate in undistributed earnings with common stock.
|
|
Year ended December 31,
|
||||||||||||||||||||||||||
|
2016
|
2015
|
2014
|
|||||||||||||||||||||||||
|
Common shareholders
|
Unvested restricted stock shareholders
|
Total
|
Common shareholders
|
Unvested restricted stock shareholders
|
Total
|
Common shareholders
|
Unvested restricted stock shareholders
|
Total
|
|||||||||||||||||||
|
Numerator:
|
|||||||||||||||||||||||||||
|
Net income attributable to Nelnet, Inc.
|
$
|
254,063
|
|
2,688
|
|
256,751
|
|
265,129
|
|
2,850
|
|
267,979
|
|
304,540
|
|
3,070
|
|
307,610
|
|
||||||||
|
Denominator:
|
|||||||||||||||||||||||||||
|
Weighted-average common shares outstanding - basic and diluted
|
42,222,335
|
|
446,735
|
|
42,669,070
|
|
45,045,199
|
|
484,141
|
|
45,529,340
|
|
46,005,915
|
|
463,700
|
|
46,469,615
|
|
|||||||||
|
Earnings per share - basic and diluted
|
$
|
6.02
|
|
6.02
|
|
6.02
|
|
5.89
|
|
5.89
|
|
5.89
|
|
6.62
|
|
6.62
|
|
6.62
|
|
||||||||
Unvested restricted stock awards are the Company's only potential common shares and, accordingly, there were no awards that were antidilutive and not included in average shares outstanding for the diluted earnings per share calculation.
As of
December 31, 2016
, a cumulative amount of
160,545
shares have been deferred by non-employee directors under the Directors Stock Compensation Plan and will become issuable upon the termination of service by the respective non-employee director on the board of directors. These shares are included in the Company's weighted average shares outstanding calculation.
13. Income Taxes
The Company is subject to income taxes in the United States, Canada, and Australia. Significant judgment is required in evaluating the Company's tax positions and determining the provision for income taxes. During the ordinary course of business, there are many transactions and calculations for which the ultimate tax determination is uncertain.
As required by the Income Taxes Topic of the FASB Accounting Standards Codification, the Company recognizes in the consolidated financial statements only those tax positions determined to be more likely than not of being sustained upon examination, based on the technical merits of the positions. It further requires that a change in judgment related to the expected ultimate resolution of uncertain tax positions be recognized in earnings in the period of such change.
F-39
NELNET, INC. AND SUBSIDIARIES
Notes to Consolidated Financial Statements – (continued)
(Dollars in thousands, except share amounts, unless otherwise noted)
As of
December 31, 2016
, the total amount of gross unrecognized tax benefits (excluding the federal benefit received from state positions) was
$28.0 million
, which is included in “other liabilities” on the consolidated balance sheet. Of this total,
$18.2 million
(net of the federal benefit on state issues) represents the amount of unrecognized tax benefits that, if recognized, would favorably affect the effective tax rate in future periods.
The Company currently anticipates uncertain tax positions will decrease by
$5.7 million
prior to December 31, 2017 as a result of a lapse of applicable statutes of limitations, settlements, correspondence with examining authorities, and recognition or measurement considerations with federal and state jurisdictions; however, actual developments in this area could differ from those currently expected. Of the anticipated
$5.7 million
decrease,
$3.7 million
, if recognized, would favorably affect the Company's effective tax rate. A reconciliation of the beginning and ending amount of gross unrecognized tax benefits follows:
|
Year ended December 31,
|
||||||
|
2016
|
2015
|
|||||
|
Gross balance - beginning of year
|
$
|
27,688
|
|
21,336
|
|
|
|
Additions based on tax positions of prior years
|
904
|
|
4,749
|
|
||
|
Additions based on tax positions related to the current year
|
4,347
|
|
5,096
|
|
||
|
Settlements with taxing authorities
|
—
|
|
—
|
|
||
|
Reductions for tax positions of prior years
|
(3,088
|
)
|
(1,327
|
)
|
||
|
Reductions based on tax positions related to the current year
|
—
|
|
—
|
|
||
|
Reductions due to lapse of applicable statutes of limitations
|
(1,847
|
)
|
(2,166
|
)
|
||
|
Gross balance - end of year
|
$
|
28,004
|
|
27,688
|
|
|
All the reductions shown in the table above that are due to prior year tax positions and the lapse of statutes of limitations impacted the effective tax rate.
The Company's policy is to recognize interest and penalties accrued on uncertain tax positions as part of interest expense and other expense, respectively. As of
December 31, 2016
and
2015
,
$3.5 million
and
$3.2 million
in accrued interest and penalties, respectively, were included in “other liabilities” on the consolidated balance sheets. The Company recognized interest expense of
$0.3 million
,
$1.2 million
, and
$0.1 million
related to uncertain tax positions for the years ended
December 31, 2016
,
2015
, and 2014, respectively. The impact to the consolidated statements of income related to penalties for uncertain tax positions was not significant for the years 2016, 2015, and 2014. The impact of timing differences and tax attributes are considered when calculating interest and penalty accruals associated with the unrecognized tax benefits.
The Company and its subsidiaries file a consolidated federal income tax return in the U.S. and the Company or one of its subsidiaries files income tax returns in various state, local, and foreign jurisdictions. The Company is no longer subject to U.S. federal income tax examinations for years prior to 2013. The Company is no longer subject to U.S. state and local income tax examinations by tax authorities prior to 2007. As of
December 31, 2016
, the Company has significant tax uncertainties that remain unsettled in the following jurisdictions:
California 2010 through 2012
New York 2008 through 2012
Texas 2007 through 2009
F-40
NELNET, INC. AND SUBSIDIARIES
Notes to Consolidated Financial Statements – (continued)
(Dollars in thousands, except share amounts, unless otherwise noted)
The provision for income taxes consists of the following components:
|
Year ended December 31,
|
|||||||||
|
2016
|
2015
|
2014
|
|||||||
|
Current:
|
|||||||||
|
Federal
|
$
|
111,302
|
|
140,778
|
|
138,269
|
|
||
|
State
|
3,019
|
|
4,530
|
|
2,545
|
|
|||
|
Foreign
|
(13
|
)
|
23
|
|
(235
|
)
|
|||
|
Total current provision
|
114,308
|
|
145,331
|
|
140,579
|
|
|||
|
Deferred:
|
|||||||||
|
Federal
|
25,423
|
|
3,572
|
|
16,598
|
|
|||
|
State
|
1,976
|
|
3,875
|
|
3,464
|
|
|||
|
Foreign
|
(394
|
)
|
(398
|
)
|
(403
|
)
|
|||
|
Total deferred provision
|
27,005
|
|
7,049
|
|
19,659
|
|
|||
|
Provision for income tax expense
|
$
|
141,313
|
|
152,380
|
|
160,238
|
|
||
The differences between the income tax provision computed at the statutory federal corporate tax rate and the financial statement provision for income taxes are shown below:
|
Year ended December 31,
|
||||||||
|
2016
|
2015
|
2014
|
||||||
|
Tax expense at federal rate
|
35.0
|
%
|
35.0
|
%
|
35.0
|
%
|
||
|
Increase (decrease) resulting from:
|
||||||||
|
State tax, net of federal income tax benefit
|
1.1
|
|
1.0
|
|
0.7
|
|
||
|
Provision for uncertain federal and state tax matters
|
—
|
|
0.9
|
|
0.4
|
|
||
|
Tax credits
|
(0.6)
|
|
(0.5)
|
|
(0.4)
|
|
||
|
Other
|
—
|
|
(0.1)
|
|
(1.4)
|
|
||
|
Effective tax rate
|
35.5
|
%
|
36.3
|
%
|
34.3
|
%
|
||
F-41
NELNET, INC. AND SUBSIDIARIES
Notes to Consolidated Financial Statements – (continued)
(Dollars in thousands, except share amounts, unless otherwise noted)
The tax effect of temporary differences that give rise to deferred tax assets and liabilities include the following:
|
As of December 31,
|
||||||
|
2016
|
2015
|
|||||
|
Deferred tax assets:
|
||||||
|
Student loans
|
$
|
20,980
|
|
20,711
|
|
|
|
Securitizations
|
5,675
|
|
6,684
|
|
||
|
Intangible assets
|
4,821
|
|
10,482
|
|
||
|
Accrued expenses
|
3,533
|
|
3,034
|
|
||
|
Stock compensation
|
2,948
|
|
2,882
|
|
||
|
Deferred revenue
|
2,699
|
|
2,220
|
|
||
|
Capital loss carry-back
|
—
|
|
4,169
|
|
||
|
Total gross deferred tax assets
|
40,656
|
|
50,182
|
|
||
|
Less valuation allowance
|
(264
|
)
|
(222
|
)
|
||
|
Net deferred tax assets
|
40,392
|
|
49,960
|
|
||
|
Deferred tax liabilities:
|
||||||
|
Basis in certain derivative contracts
|
46,636
|
|
24,101
|
|
||
|
Loan origination services
|
13,019
|
|
15,695
|
|
||
|
Debt repurchases
|
12,457
|
|
18,759
|
|
||
|
Depreciation
|
5,128
|
|
5,514
|
|
||
|
Partnership basis
|
4,976
|
|
1,748
|
|
||
|
Unrealized gain on debt and equity securities
|
3,246
|
|
1,400
|
|
||
|
Other
|
360
|
|
47
|
|
||
|
Total gross deferred tax liabilities
|
85,822
|
|
67,264
|
|
||
|
Net deferred tax (liability) asset
|
$
|
(45,430
|
)
|
(17,304
|
)
|
|
The Company has performed an evaluation of the recoverability of deferred tax assets. In assessing the realizability of the Company's deferred tax assets, management considers whether it is more likely than not that some portion or all of the deferred tax assets will be realized. The ultimate realization of deferred tax assets is dependent upon the generation of future taxable income during the period in which those temporary differences become deductible. Management considers the scheduled reversals of deferred tax liabilities, projected taxable income, carry back opportunities, and tax planning strategies in making the assessment of the amount of the valuation allowance. With the exception of a portion of the Company's state net operating loss, it is management's opinion that it is more likely than not that the deferred tax assets will be realized and should not be reduced by a valuation allowance. The amount of deferred tax assets considered realizable could be reduced in the near term if estimates of future taxable income during the carry forward period are reduced.
Included on the balance sheet at
December 31, 2016
and
2015
was a current income tax receivable of
$13.0 million
and
$12.0 million
, respectively.
F-42
NELNET, INC. AND SUBSIDIARIES
Notes to Consolidated Financial Statements – (continued)
(Dollars in thousands, except share amounts, unless otherwise noted)
14. Segment Reporting
The Company has four reportable operating segments. The Company's reportable operating segments include:
•
Loan Systems and Servicing
•
Tuition Payment Processing and Campus Commerce
•
Communications
•
Asset Generation and Management
The Company earns fee-based revenue through its Loan Systems and Servicing, Tuition Payment Processing, and Communications operating segments. In addition, the Company earns interest income on its student loan portfolio in its Asset Generation and Management operating segment.
The Company’s operating segments are defined by the products and services they offer and the types of customers they serve, and they reflect the manner in which financial information is currently evaluated by management. See note 1, "Description of Business," for a description of each operating segment, including the primary products and services offered.
Prior to January 1, 2016, the Company allocated certain corporate overhead expenses that are incurred within the Corporate and Other Activities segment to the other operating segments. These expenses included certain corporate activities related to executive management, internal audit, enterprise risk management, and other costs incurred by the Company due to corporate-wide initiatives. Effective January 1, 2016, internal reporting to executive management (the "chief operating decision maker") changed to eliminate the allocation of these expenses to the other segments. Management believes the change in its allocation methodology results in a better reflection of the operating results of each of the reportable segments as if they each operated as a standalone business entity, which also reflects how management evaluates the performance of the segments. Prior period segment operating results have been restated to conform to the current period presentation.
The management reporting process measures the performance of the Company’s operating segments based on the management structure of the Company, as well as the methodology used by management to evaluate performance and allocate resources. Executive management (the "chief operating decision maker") evaluates the performance of the Company’s operating segments based on their financial results prepared in conformity with U.S. GAAP.
The accounting policies of the Company’s operating segments are the same as those described in the summary of significant accounting policies. Intersegment revenues are charged by a segment that provides a product or service to another segment. Intersegment revenues and expenses are included within each segment consistent with the income statement presentation provided to management. Income taxes are allocated based on 38% of income before taxes for each individual operating segment. The difference between the consolidated income tax expense and the sum of taxes calculated for each operating segment is included in income taxes in Corporate and Other Activities.
Corporate and Other Activities
Other business activities and operating segments that are not reportable are combined and included in Corporate and Other Activities. Corporate and Other Activities includes the following items:
|
•
|
Income earned on certain investment activities
|
|
•
|
Interest expense incurred on unsecured debt transactions
|
|
•
|
Other product and service offerings that are not considered reportable operating segments including, but not limited to, WRCM, the SEC-registered investment advisory subsidiary, and the Enrollment Services business
|
Corporate and Other Activities also includes certain corporate activities and overhead functions related to executive management, internal audit, human resources, accounting, legal, enterprise risk management, information technology, occupancy, and marketing. These costs are allocated to each operating segment based on estimated use of such activities and services.
Segment Results
The following tables include the results of each of the Company's reportable operating segments reconciled to the consolidated financial statements.
F-43
NELNET, INC. AND SUBSIDIARIES
Notes to Consolidated Financial Statements – (continued)
(Dollars in thousands, except share amounts, unless otherwise noted)
|
|
Year ended December 31, 2016
|
||||||||||||||||||||
|
Loan Systems and Servicing
|
Tuition Payment Processing and Campus Commerce
|
Communications
|
Asset
Generation and Management |
Corporate and Other Activities
|
Eliminations
|
Total
|
|||||||||||||||
|
Total interest income
|
$
|
111
|
|
9
|
|
1
|
|
754,788
|
|
10,913
|
|
(5,076
|
)
|
760,746
|
|
||||||
|
Interest expense
|
—
|
|
—
|
|
1,271
|
|
385,913
|
|
6,076
|
|
(5,076
|
)
|
388,183
|
|
|||||||
|
Net interest income
|
111
|
|
9
|
|
(1,270
|
)
|
368,875
|
|
4,837
|
|
—
|
|
372,563
|
|
|||||||
|
Less provision for loan losses
|
—
|
|
—
|
|
—
|
|
13,500
|
|
—
|
|
—
|
|
13,500
|
|
|||||||
|
Net interest income (loss) after provision for loan losses
|
111
|
|
9
|
|
(1,270
|
)
|
355,375
|
|
4,837
|
|
—
|
|
359,063
|
|
|||||||
|
Other income:
|
|
|
|
|
|
|
|
|
|
|
|
|
|||||||||
|
Loan systems and servicing revenue
|
214,846
|
|
—
|
|
—
|
|
—
|
|
—
|
|
—
|
|
214,846
|
|
|||||||
|
Intersegment servicing revenue
|
45,381
|
|
—
|
|
—
|
|
—
|
|
—
|
|
(45,381
|
)
|
—
|
|
|||||||
|
Tuition payment processing, school information, and campus commerce revenue
|
—
|
|
132,730
|
|
—
|
|
—
|
|
—
|
|
—
|
|
132,730
|
|
|||||||
|
Communications revenue
|
—
|
|
—
|
|
17,659
|
|
—
|
|
—
|
|
—
|
|
17,659
|
|
|||||||
|
Enrollment services revenue
|
—
|
|
—
|
|
—
|
|
—
|
|
4,326
|
|
—
|
|
4,326
|
|
|||||||
|
Other income
|
—
|
|
—
|
|
—
|
|
15,709
|
|
38,221
|
|
—
|
|
53,929
|
|
|||||||
|
Gain on sale of loans and debt repurchases, net
|
—
|
|
—
|
|
—
|
|
5,846
|
|
2,135
|
|
—
|
|
7,981
|
|
|||||||
|
Derivative market value and foreign currency adjustments, net
|
—
|
|
—
|
|
—
|
|
70,368
|
|
1,376
|
|
—
|
|
71,744
|
|
|||||||
|
Derivative settlements, net
|
—
|
|
—
|
|
—
|
|
(21,034
|
)
|
(915
|
)
|
—
|
|
(21,949
|
)
|
|||||||
|
Total other income
|
260,227
|
|
132,730
|
|
17,659
|
|
70,889
|
|
45,143
|
|
(45,381
|
)
|
481,266
|
|
|||||||
|
Operating expenses:
|
|
|
|
|
|
|
|
|
|
|
|
|
|||||||||
|
Salaries and benefits
|
132,072
|
|
62,329
|
|
7,649
|
|
1,985
|
|
51,889
|
|
—
|
|
255,924
|
|
|||||||
|
Depreciation and amortization
|
1,980
|
|
10,595
|
|
6,060
|
|
—
|
|
15,298
|
|
—
|
|
33,933
|
|
|||||||
|
Loan servicing fees
|
—
|
|
—
|
|
—
|
|
25,750
|
|
—
|
|
—
|
|
25,750
|
|
|||||||
|
Cost to provide communications services
|
—
|
|
—
|
|
6,866
|
|
—
|
|
—
|
|
—
|
|
6,866
|
|
|||||||
|
Cost to provide enrollment services
|
—
|
|
—
|
|
—
|
|
—
|
|
3,623
|
|
—
|
|
3,623
|
|
|||||||
|
Other expenses
|
40,715
|
|
18,486
|
|
4,370
|
|
6,005
|
|
45,843
|
|
—
|
|
115,419
|
|
|||||||
|
Intersegment expenses, net
|
24,204
|
|
6,615
|
|
958
|
|
46,494
|
|
(32,889
|
)
|
(45,381
|
)
|
—
|
|
|||||||
|
Total operating expenses
|
198,971
|
|
98,025
|
|
25,903
|
|
80,234
|
|
83,764
|
|
(45,381
|
)
|
441,515
|
|
|||||||
|
Income (loss) before income taxes
|
61,367
|
|
34,714
|
|
(9,514
|
)
|
346,030
|
|
(33,784
|
)
|
—
|
|
398,814
|
|
|||||||
|
Income tax (expense) benefit
|
(23,319
|
)
|
(13,191
|
)
|
3,615
|
|
(131,492
|
)
|
23,074
|
|
—
|
|
(141,313
|
)
|
|||||||
|
Net income (loss)
|
38,048
|
|
21,523
|
|
(5,899
|
)
|
214,538
|
|
(10,710
|
)
|
—
|
|
257,501
|
|
|||||||
|
Net loss (income) attributable to noncontrolling interests
|
—
|
|
—
|
|
—
|
|
—
|
|
(750
|
)
|
—
|
|
(750
|
)
|
|||||||
|
Net income (loss) attributable to Nelnet, Inc.
|
$
|
38,048
|
|
21,523
|
|
(5,899
|
)
|
214,538
|
|
(11,460
|
)
|
—
|
|
256,751
|
|
||||||
|
Total assets
|
$
|
55,469
|
|
230,283
|
|
103,104
|
|
26,378,467
|
|
669,472
|
|
(256,687
|
)
|
27,180,108
|
|
||||||
F-44
NELNET, INC. AND SUBSIDIARIES
Notes to Consolidated Financial Statements – (continued)
(Dollars in thousands, except share amounts, unless otherwise noted)
|
|
Year ended December 31, 2015 (a)
|
||||||||||||||||||||
|
Loan Systems and Servicing
|
Tuition Payment Processing and Campus Commerce
|
Communications
|
Asset
Generation and Management |
Corporate and Other Activities
|
Eliminations
|
Total
|
|||||||||||||||
|
Total interest income
|
$
|
49
|
|
3
|
|
—
|
|
728,199
|
|
7,686
|
|
(1,828
|
)
|
734,109
|
|
||||||
|
Interest expense
|
—
|
|
—
|
|
—
|
|
297,625
|
|
6,413
|
|
(1,828
|
)
|
302,210
|
|
|||||||
|
Net interest income
|
49
|
|
3
|
|
—
|
|
430,574
|
|
1,273
|
|
—
|
|
431,899
|
|
|||||||
|
Less provision for loan losses
|
—
|
|
—
|
|
—
|
|
10,150
|
|
—
|
|
—
|
|
10,150
|
|
|||||||
|
Net interest income (loss) after provision for loan losses
|
49
|
|
3
|
|
—
|
|
420,424
|
|
1,273
|
|
—
|
|
421,749
|
|
|||||||
|
Other income:
|
|
|
|
|
|
|
|
|
|
|
|
|
|||||||||
|
Loan systems and servicing revenue
|
239,858
|
|
—
|
|
—
|
|
—
|
|
—
|
|
—
|
|
239,858
|
|
|||||||
|
Intersegment servicing revenue
|
50,354
|
|
—
|
|
—
|
|
—
|
|
—
|
|
(50,354
|
)
|
—
|
|
|||||||
|
Tuition payment processing, school information, and campus commerce revenue
|
—
|
|
120,365
|
|
—
|
|
—
|
|
—
|
|
—
|
|
120,365
|
|
|||||||
|
Enrollment services revenue
|
—
|
|
—
|
|
—
|
|
—
|
|
51,073
|
|
—
|
|
51,073
|
|
|||||||
|
Other income
|
—
|
|
(925
|
)
|
—
|
|
15,939
|
|
32,248
|
|
—
|
|
47,262
|
|
|||||||
|
Gain on sale of loans and debt repurchases, net
|
—
|
|
—
|
|
—
|
|
2,034
|
|
3,119
|
|
—
|
|
5,153
|
|
|||||||
|
Derivative market value and foreign currency adjustments, net
|
—
|
|
—
|
|
—
|
|
27,216
|
|
1,435
|
|
—
|
|
28,651
|
|
|||||||
|
Derivative settlements, net
|
—
|
|
—
|
|
—
|
|
(23,238
|
)
|
(1,012
|
)
|
—
|
|
(24,250
|
)
|
|||||||
|
Total other income
|
290,212
|
|
119,440
|
|
—
|
|
21,951
|
|
86,863
|
|
(50,354
|
)
|
468,112
|
|
|||||||
|
Operating expenses:
|
|
|
|
|
|
|
|
|
|
|
|
|
|||||||||
|
Salaries and benefits
|
134,635
|
|
55,523
|
|
—
|
|
2,172
|
|
55,585
|
|
—
|
|
247,914
|
|
|||||||
|
Depreciation and amortization
|
1,931
|
|
8,992
|
|
—
|
|
—
|
|
15,420
|
|
—
|
|
26,343
|
|
|||||||
|
Loan servicing fees
|
—
|
|
—
|
|
—
|
|
30,213
|
|
—
|
|
—
|
|
30,213
|
|
|||||||
|
Cost to provide enrollment services
|
—
|
|
—
|
|
—
|
|
—
|
|
41,733
|
|
—
|
|
41,733
|
|
|||||||
|
Other expenses
|
57,799
|
|
15,161
|
|
—
|
|
5,083
|
|
44,971
|
|
—
|
|
123,014
|
|
|||||||
|
Intersegment expenses, net
|
29,706
|
|
8,617
|
|
—
|
|
50,899
|
|
(38,868
|
)
|
(50,354
|
)
|
—
|
|
|||||||
|
Total operating expenses
|
224,071
|
|
88,293
|
|
—
|
|
88,367
|
|
118,841
|
|
(50,354
|
)
|
469,217
|
|
|||||||
|
Income (loss) before income taxes
|
66,190
|
|
31,150
|
|
—
|
|
354,008
|
|
(30,705
|
)
|
—
|
|
420,644
|
|
|||||||
|
Income tax (expense) benefit
|
(25,153
|
)
|
(11,838
|
)
|
—
|
|
(134,522
|
)
|
19,132
|
|
—
|
|
(152,380
|
)
|
|||||||
|
Net income (loss)
|
41,037
|
|
19,312
|
|
—
|
|
219,486
|
|
(11,573
|
)
|
—
|
|
268,264
|
|
|||||||
|
Net loss (income) attributable to noncontrolling interests
|
20
|
|
—
|
|
—
|
|
—
|
|
(305
|
)
|
—
|
|
(285
|
)
|
|||||||
|
Net income (loss) attributable to Nelnet, Inc.
|
$
|
41,057
|
|
19,312
|
|
—
|
|
219,486
|
|
(11,878
|
)
|
—
|
|
267,979
|
|
||||||
|
Total assets
|
$
|
80,459
|
|
229,615
|
|
68,760
|
|
29,634,280
|
|
624,953
|
|
(218,923
|
)
|
30,419,144
|
|
||||||
(a) On December 31, 2015, the Company purchased Allo. The Allo assets acquired and liabilities assumed were recorded by the Company at their respective fair values at the date of acquisition. As such, Allo's assets and liabilities as of December 31, 2015 are included in the Company's consolidated balance sheet. However, Allo had no impact on the consolidated statement of income during 2015.
F-45
NELNET, INC. AND SUBSIDIARIES
Notes to Consolidated Financial Statements – (continued)
(Dollars in thousands, except share amounts, unless otherwise noted)
|
|
Year ended December 31, 2014 (a)
|
|||||||||||||||||
|
Loan Systems and Servicing
|
Tuition Payment Processing and Campus Commerce
|
Asset
Generation and Management |
Corporate and Other Activities
|
Eliminations
|
Total
|
|||||||||||||
|
Total interest income
|
$
|
30
|
|
6
|
|
703,382
|
|
8,618
|
|
(2,236
|
)
|
709,800
|
|
|||||
|
Interest expense
|
—
|
|
—
|
|
269,742
|
|
5,731
|
|
(2,236
|
)
|
273,237
|
|
||||||
|
Net interest income
|
30
|
|
6
|
|
433,640
|
|
2,887
|
|
—
|
|
436,563
|
|
||||||
|
Less provision for loan losses
|
—
|
|
—
|
|
9,500
|
|
—
|
|
—
|
|
9,500
|
|
||||||
|
Net interest income (loss) after provision for loan losses
|
30
|
|
6
|
|
424,140
|
|
2,887
|
|
—
|
|
427,063
|
|
||||||
|
Other income:
|
|
|
|
|
|
|
|
|
|
|
|
|
||||||
|
Loan systems and servicing revenue
|
240,414
|
|
—
|
|
—
|
|
—
|
|
—
|
|
240,414
|
|
||||||
|
Intersegment servicing revenue
|
55,139
|
|
—
|
|
—
|
|
—
|
|
(55,139
|
)
|
—
|
|
||||||
|
Tuition payment processing, school information, and campus commerce revenue
|
—
|
|
98,156
|
|
—
|
|
—
|
|
—
|
|
98,156
|
|
||||||
|
Enrollment services revenue
|
—
|
|
—
|
|
—
|
|
62,949
|
|
—
|
|
62,949
|
|
||||||
|
Other income
|
—
|
|
1,268
|
|
21,532
|
|
51,136
|
|
—
|
|
73,936
|
|
||||||
|
Gain on sale of loans and debt repurchases, net
|
—
|
|
—
|
|
(1,357
|
)
|
5,008
|
|
—
|
|
3,651
|
|
||||||
|
Derivative market value and foreign currency adjustments, net
|
—
|
|
—
|
|
42,936
|
|
(5,233
|
)
|
—
|
|
37,703
|
|
||||||
|
Derivative settlements, net
|
—
|
|
—
|
|
(20,818
|
)
|
(1,025
|
)
|
—
|
|
(21,843
|
)
|
||||||
|
Total other income
|
295,553
|
|
99,424
|
|
42,293
|
|
112,835
|
|
(55,139
|
)
|
494,966
|
|
||||||
|
Operating expenses:
|
|
|
|
|
|
|
|
|
|
|
|
|
||||||
|
Salaries and benefits
|
125,844
|
|
48,453
|
|
2,316
|
|
51,466
|
|
—
|
|
228,079
|
|
||||||
|
Depreciation and amortization
|
1,734
|
|
8,169
|
|
—
|
|
11,231
|
|
—
|
|
21,134
|
|
||||||
|
Loan servicing fees
|
—
|
|
—
|
|
27,009
|
|
—
|
|
—
|
|
27,009
|
|
||||||
|
Cost to provide enrollment services
|
—
|
|
—
|
|
—
|
|
49,985
|
|
—
|
|
49,985
|
|
||||||
|
Other expenses
|
59,521
|
|
13,006
|
|
6,602
|
|
47,174
|
|
—
|
|
126,303
|
|
||||||
|
Intersegment expenses, net
|
31,956
|
|
4,769
|
|
56,325
|
|
(37,912
|
)
|
(55,139
|
)
|
—
|
|
||||||
|
Total operating expenses
|
219,055
|
|
74,397
|
|
92,252
|
|
121,944
|
|
(55,139
|
)
|
452,510
|
|
||||||
|
Income (loss) before income taxes
|
76,528
|
|
25,033
|
|
374,181
|
|
(6,222
|
)
|
—
|
|
469,519
|
|
||||||
|
Income tax (expense) benefit
|
(29,081
|
)
|
(9,513
|
)
|
(142,189
|
)
|
20,544
|
|
—
|
|
(160,238
|
)
|
||||||
|
Net income (loss)
|
47,447
|
|
15,520
|
|
231,992
|
|
14,322
|
|
—
|
|
309,281
|
|
||||||
|
Net loss (income) attributable to noncontrolling interest
|
—
|
|
—
|
|
—
|
|
(1,671
|
)
|
—
|
|
(1,671
|
)
|
||||||
|
Net income (loss) attributable to Nelnet, Inc.
|
$
|
47,447
|
|
15,520
|
|
231,992
|
|
12,651
|
|
—
|
|
307,610
|
|
|||||
|
Total assets
|
$
|
84,495
|
|
231,991
|
|
29,436,466
|
|
495,716
|
|
(220,929
|
)
|
30,027,739
|
|
|||||
(a) Does not include the Communications segment, which was initiated as a result of the acquisition of Allo on December 31, 2015.
15. Major Customer
The Company earns loan servicing revenue from a servicing contract with the Department that currently expires on June 16, 2019. Revenue earned by the Company's Loan Systems and Servicing operating segment related to this contract was
$151.7 million
,
$133.2 million
, and
$124.4 million
for the years ended
December 31, 2016, 2015, and 2014
, respectively. In April 2016, the Department's Office of Federal Student Aid released information regarding a new contract procurement process for the Department to acquire a single servicing system platform with multiple customer service providers to manage all student loans owned by the Department. The contract solicitation process is divided into two phases. Responses for Phase I were due on May 9, 2016.
On May 6, 2016, the Company and Great Lakes Educational Loan Services, Inc. ("Great Lakes") submitted a joint response to Phase I as part of a newly created joint venture to respond to the contract solicitation process and to provide services under the
F-46
NELNET, INC. AND SUBSIDIARIES
Notes to Consolidated Financial Statements – (continued)
(Dollars in thousands, except share amounts, unless otherwise noted)
new contract in the event that the Department selects it to be awarded with the contract. The joint venture will operate as a new legal entity called GreatNet Solutions, LLC ("GreatNet"). The Company and Great Lakes each own
50 percent
of the ownership interests of GreatNet. In addition to the Company, Great Lakes is currently one of four private sector companies (referred to as Title IV Additional Servicers, or "TIVAS") that has a student loan servicing contract with the Department to provide servicing for loans owned by the Department.
On June 30, 2016, the Department announced which entities were selected to respond to Phase II of the procurement selection process. GreatNet was one of three entities selected. On October 26, 2016, the Department released the Phase II solicitation for its new single servicer contract. On January 6, 2017, GreatNet submitted its Phase II response to the Department and is currently awaiting announcement from the new administration on the next steps in the procurement process.
16. Leases
The Company leases certain office space and equipment under operating leases. As operating leases expire, it is expected that they will be replaced with similar leases. Future minimum lease payments under these leases are shown below:
|
2017
|
$
|
5,316
|
|
|
2018
|
4,967
|
|
|
|
2019
|
4,143
|
|
|
|
2020
|
3,472
|
|
|
|
2021
|
1,898
|
|
|
|
2022 and thereafter
|
6,615
|
|
|
|
Total minimum lease payments
|
$
|
26,411
|
|
Total rental expense incurred by the Company for the years ended
December 31, 2016
,
2015
, and
2014
was
$6.0 million
,
$5.5 million
, and
$6.3 million
, respectively.
17. Defined Contribution Benefit Plan
The Company has a 401(k) savings plan that covers substantially all of its employees. Employees may contribute up to
100 percent
of their pre-tax salary, subject to IRS limitations. The Company matches up to
100 percent
on the first
3 percent
of contributions and
50 percent
on the next
2 percent
. The Company made contributions to the plan of
$5.1 million
,
$4.6 million
, and
$4.2 million
during the years ended
December 31, 2016
,
2015
, and
2014
, respectively.
18. Stock Based Compensation Plans
Restricted Stock Plan
The following table summarizes restricted stock activity:
|
Year ended December 31,
|
||||||||
|
2016
|
2015
|
2014
|
||||||
|
Non-vested shares at beginning of year
|
471,597
|
|
499,463
|
|
407,051
|
|
||
|
Granted
|
123,181
|
|
126,946
|
|
189,716
|
|
||
|
Vested
|
(113,507
|
)
|
(108,424
|
)
|
(77,219
|
)
|
||
|
Canceled
|
(33,891
|
)
|
(46,388
|
)
|
(20,085
|
)
|
||
|
Non-vested shares at end of year
|
447,380
|
|
471,597
|
|
499,463
|
|
||
As of
December 31, 2016
, there was
$8.2 million
of unrecognized compensation cost included in equity on the consolidated balance sheet related to restricted stock, which is expected to be recognized as compensation expense as shown in the table below.
F-47
NELNET, INC. AND SUBSIDIARIES
Notes to Consolidated Financial Statements – (continued)
(Dollars in thousands, except share amounts, unless otherwise noted)
|
2017
|
$
|
3,265
|
|
|
2018
|
1,989
|
|
|
|
2019
|
1,218
|
|
|
|
2020
|
720
|
|
|
|
2021
|
431
|
|
|
|
2022 and thereafter
|
623
|
|
|
|
$
|
8,246
|
|
|
For the years ended
December 31, 2016
,
2015
, and
2014
, the Company recognized compensation expense of
$4.1 million
,
$5.2 million
, and
$4.6 million
, respectively, related to shares issued under the restricted stock plan, which is included in "salaries and benefits" on the consolidated statements of income.
Employee Share Purchase Plan
The Company has an employee share purchase plan pursuant to which employees are entitled to purchase Class A common stock from payroll deductions at a
15 percent
discount from market value. During the years ended
December 31, 2016
,
2015
, and
2014
, the Company recognized compensation expense of approximately
$287,000
,
$147,000
, and
$131,000
, respectively, in connection with issuing
25,551
shares,
23,912
shares, and
18,140
shares, respectively, under this plan.
Non-employee Directors Compensation Plan
The Company has a compensation plan for non-employee directors pursuant to which non-employee directors can elect to receive their annual retainer fees in the form of cash or Class A common stock. If a non-employee director elects to receive Class A common stock, the number of shares of Class A common stock that are awarded is equal to the amount of the annual retainer fee otherwise payable in cash divided by
85 percent
of the fair market value of a share of Class A common stock on the date the fee is payable. Non-employee directors who choose to receive Class A common stock may also elect to defer receipt of the Class A common stock until termination of their service on the board of directors.
For the years ended
December 31, 2016
,
2015
, and
2014
, the Company recognized approximately
$922,000
,
$905,000
, and
$777,000
, respectively, of expense related to this plan. The following table provides the number of shares awarded under this plan for the years ended
December 31, 2016
,
2015
, and
2014
.
|
Shares issued - not deferred
|
Shares- deferred
|
Total
|
||||||
|
Year ended December 31, 2016
|
10,799
|
|
13,644
|
|
24,443
|
|
||
|
Year ended December 31, 2015
|
8,164
|
|
10,406
|
|
18,570
|
|
||
|
Year ended December 31, 2014
|
8,067
|
|
10,175
|
|
18,242
|
|
||
As of December 31, 2016
, a cumulative amount of
160,545
shares have been deferred by directors and will be issued upon the termination of their service on the board of directors. These shares are included in the Company's weighted average shares outstanding calculation.
|
19.
|
Related Parties
|
Transactions with Union Financial Services
Union Financial Services, Inc. ("UFS") is owned
50 percent
by Michael S. Dunlap, Executive Chairman and a member of the board of directors and a significant shareholder of the Company, and
50 percent
by Stephen F. Butterfield, Vice Chairman and a member of the board of directors of the Company. During 2013, the Company purchased an aircraft for total consideration of
$5.8 million
and sold an interest in such aircraft to UFS for
$2.0 million
. After the completion of this transaction, the Company and UFS own
65 percent
and
35 percent
of the aircraft, respectively.
F-48
NELNET, INC. AND SUBSIDIARIES
Notes to Consolidated Financial Statements – (continued)
(Dollars in thousands, except share amounts, unless otherwise noted)
Transactions with Union Bank and Trust Company
Union Bank and Trust Company ("Union Bank") is controlled by Farmers & Merchants Investment Inc. (“F&M”), which owns a majority of Union Bank's common stock and a minority share of Union Bank's non-voting preferred stock. Mr. Dunlap, along with his spouse and children, owns or controls a significant portion of the stock of F&M, and Mr. Dunlap's sister, Angela L. Muhleisen, along with her spouse and children, also owns or controls a significant portion of F&M stock. Mr. Dunlap serves as a Director and Chairman of F&M. Ms. Muhleisen serves as Director and Chief Executive Officer of F&M and as a Director, Chairperson, President, and Chief Executive Officer of Union Bank. Union Bank is deemed to have beneficial ownership of a significant number of shares of the Company because it serves in a capacity of trustee or account manager for various trusts and accounts holding shares of the Company, and may share voting and/or investment power with respect to such shares. Mr. Dunlap and Ms. Muhleisen beneficially own a significant percent of the voting rights of the Company's outstanding common stock.
The Company has entered into certain contractual arrangements with Union Bank. These transactions are summarized below.
Loan Purchases and Sales
On December 22, 2014, the Company entered into an agreement with Union Bank in which the Company provided marketing, origination, and loan servicing services to Union Bank related to private education loans. The Company committed to purchase, or arrange for a designee to purchase, all volume originated by Union Bank under this agreement. During 2016 and 2015, the Company purchased
$29.6 million
(par value) and
$4.4 million
(par value), respectively, of private education loans from Union Bank, pursuant to this agreement. As of December 31, 2016 and 2015, the balance of private education loans held by Union Bank pursuant to this agreement was
$0.4 million
and
$17.6 million
, respectively. No loans were originated under this agreement in 2014. Subsequent to 2016, no additional loans will be originated under this agreement.
In addition to the loan activity under the agreement described above, during 2014, the Company sold
$16.5 million
(par value) of private education loans to Union Bank.
No
discount or premium was received. In addition, during 2014, the Company purchased private education loans from Union Bank of
$0.2 million
(par value).
Loan Servicing
The Company serviced
$483.8 million
,
$563.1 million
, and
$581.4 million
of FFELP and private education loans for Union Bank as of
December 31, 2016
,
2015
, and
2014
, respectively Servicing revenue earned by the Company from servicing loans for Union Bank was
$0.6 million
,
$0.5 million
, and
$0.4 million
for the years ended
December 31, 2016
,
2015
, and
2014
, respectively. As of
December 31, 2016
and
2015
, accounts receivable includes approximately
$36,000
and
$59,000
, respectively, due from Union Bank for loan servicing.
Funding - Participation Agreement
The Company maintains an agreement with Union Bank, as trustee for various grantor trusts, under which Union Bank has agreed to purchase from the Company participation interests in student loans (the “FFELP Participation Agreement”). The Company uses this facility as a source to fund FFELP student loans. As of
December 31, 2016 and 2015
,
$496.8 million
and
$471.6 million
, respectively, of loans were subject to outstanding participation interests held by Union Bank, as trustee, under this agreement. The agreement automatically renews annually and is terminable by either party upon five business days' notice. This agreement provides beneficiaries of Union Bank's grantor trusts with access to investments in interests in student loans, while providing liquidity to the Company on a short-term basis. The Company can participate loans to Union Bank to the extent of availability under the grantor trusts, up to
$750 million
or an amount in excess of
$750 million
if mutually agreed to by both parties. Loans participated under this agreement have been accounted for by the Company as loan sales. Accordingly, the participation interests sold are not included on the Company's consolidated balance sheets.
F-49
NELNET, INC. AND SUBSIDIARIES
Notes to Consolidated Financial Statements – (continued)
(Dollars in thousands, except share amounts, unless otherwise noted)
Operating Cash Accounts
The majority of the Company's cash operating accounts are maintained at Union Bank. The Company also invests amounts in the Short term Federal Investment Trust (“STFIT”) of the Student Loan Trust Division of Union Bank, which are included in “cash and cash equivalents - held at a related party” and “restricted cash - due to customers” on the accompanying consolidated balance sheets. As of
December 31, 2016 and 2015
, the Company had
$74.3 million
and
$88.4 million
, respectively, invested in the STFIT or deposited at Union Bank in operating accounts, of which
$12.5 million
and
$36.3 million
as of
December 31, 2016 and 2015
, respectively, represented cash collected for customers. Interest income earned by the Company on the amounts invested in the STFIT for the years ended
December 31, 2016
,
2015
, and
2014
, was
$0.4 million
,
$0.2 million
, and
$0.2 million
, respectively.
529 Plan Administration Services
The Company provides certain 529 Plan administration services to certain college savings plans (the “College Savings Plans”) through a contract with Union Bank, as the program manager. Union Bank is entitled to a fee as program manager pursuant to its program management agreement with the College Savings Plans. For the years ended
December 31, 2016
,
2015
, and
2014
, the Company has received fees of
$1.6 million
,
$3.5 million
, and
$3.4 million
, respectively, from Union Bank related to the administration services provided to the College Savings Plans.
Lease Arrangements
Union Bank leases approximately
4,000
square feet in the Company's corporate headquarters building. Union Bank paid the Company approximately
$73,000
,
$73,000
, and
$76,000
for commercial rent and storage income during
2016
,
2015
, and
2014
, respectively. The lease agreement expires on June 30, 2018.
The Company had a lease agreement with Union Bank under which the Company leased office space. The Company paid Union Bank approximately
$71,000
during
2014
. The lease agreement expired in May 2014.
Other Fees Paid to Union Bank
During the years ended
December 31, 2016
,
2015
, and
2014
, the Company paid Union Bank approximately
$13,000
,
$47,000
, and
$57,000
, respectively, in commissions, and approximately
$126,000
,
$111,000
, and
$117,000
, respectively, in cash management fees. During the years ended December 31, 2015 and 2014, the Company paid Union Bank approximately
$205,000
and
$311,000
, respectively, in connection with servicing opportunities for various asset classes. In addition, for both the years ended December 31, 2015 and 2014, the Company paid Union Bank $36,000 for administrative services. The administrative agreement expired in 2015 and no fees were paid by the Company to Union Bank in 2016.
Other Fees Received from Union Bank
During the years ended
December 31, 2016
,
2015
, and
2014
, Union Bank paid the Company approximately
$209,000
,
$201,000
, and
$178,000
, respectively, under an employee sharing arrangement and approximately
$10,000
,
$19,000
, and
$14,000
, respectively, for health and productivity services.
401(k) Plan Administration
Union Bank administers the Company's 401(k) defined contribution plan. Fees paid to Union Bank to administer the plan are paid by the plan participants and were approximately
$280,000
,
$469,000
, and
$450,000
during the years ended
December 31, 2016
,
2015
, and
2014
, respectively.
Investment Services
Union Bank has established various trusts whereby Union Bank serves as trustee for the purpose of purchasing, holding, managing, and selling investments in student loan asset-backed securities. On May 9, 2011, WRCM, an SEC-registered investment advisor and a subsidiary of the Company, entered into a management agreement with Union Bank, effective as of May 1, 2011, under which WRCM performs various advisory and management services on behalf of Union Bank with respect to investments in securities by the trusts, including identifying securities for purchase or sale by the trusts. The agreement provides that Union Bank will pay to WRCM annual fees of
25 basis points
on the outstanding balance of the investments in the trusts. As of
December 31,
F-50
NELNET, INC. AND SUBSIDIARIES
Notes to Consolidated Financial Statements – (continued)
(Dollars in thousands, except share amounts, unless otherwise noted)
2016
, the outstanding balance of investments in the trusts was
$756.9 million
. In addition, Union Bank will pay additional fees to WRCM of up to
50 percent
of the gains from the sale of securities from the trusts or securities being called prior to the full contractual maturity. For the years ended
December 31, 2016
,
2015
, and
2014
, the Company earned
$4.5 million
,
$2.7 million
, and
$13.4 million
, respectively, of fees under this agreement.
In January 2012 and October 2015, WRCM entered into management agreements with Union Bank under which it was designated to serve as investment advisor with respect to the assets within several trusts established by Mr. Dunlap and his spouse. In January 2016, WRCM entered into a similar management agreement with Union Bank with respect to several trusts established in December 2015 by Mr. Butterfield and his spouse. Union Bank serves as trustee for the trusts. Per the terms of the agreements, Union Bank pays WRCM
five
basis points of the aggregate value of the assets of the trusts as of the last day of each calendar quarter. Mr. Dunlap and his spouse contributed a total of
3,375,000
and
3,000,000
shares of the Company's Class B common stock to the trusts upon the establishment of the trusts in 2011 and 2015, respectively, and Mr. Butterfield and his spouse contributed a total of
1,200,000
shares of the Company's Class B common stock upon the establishment of the trusts in 2016. For the years ended
December 31, 2016
,
2015
, and
2014
, the Company earned approximately
$142,000
,
$71,000
, and
$66,000
, respectively, of fees under these agreements.
As of
December 31, 2016
and
2015
, accounts receivable included
$0.8 million
and
$1.1 million
, respectively, due from Union Bank related to fees earned by WRCM from the investment services described above.
WRCM has established private investment funds for the primary purpose of purchasing, selling, investing, and trading, directly or indirectly, in student loan asset-backed securities, and to engage in financial transactions related thereto. Mr. Dunlap, UFS, Jeffrey R. Noordhoek (an executive officer of the Company), Ms. Muhleisen and her spouse, and WRCM have invested in certain of these funds. Based upon the current level of holdings by non-affiliated limited partners, the management agreements provide non-affiliated limited partners the ability to remove WRCM as manager without cause. WRCM earns
50 basis points
(annually) on the outstanding balance of the investments in these funds, of which WRCM pays approximately
50 percent
of such amount to Union Bank as custodian. As of
December 31, 2016
, the outstanding balance of investments in these funds was
$150.1 million
. For the years ended
December 31, 2016
,
2015
, and
2014
, the Company paid Union Bank
$0.4 million
,
$0.4 million
, and
$0.3 million
, respectively, as custodian.
Transactions with Agile Sports Technologies, Inc. (doing business as "Hudl")
On March 17, 2015, the Company made a
$40.5 million
equity investment in Hudl. David Graff, who has served on the Company's Board of Directors since May 2014, is CEO, co-founder, and a director of Hudl. Prior to the 2015 investment, the Company and Michael Dunlap, the Company's Executive Chairman and a principal shareholder, made separate equity investments in Hudl. Subsequent to the Company's March 2015 investment, the Company and Mr. Dunlap currently hold combined direct and indirect equity ownership interests in Hudl of
18.6%
and
3.4%
, respectively. The Company's and Mr. Dunlap's direct and indirect equity ownership interests in Hudl consist of preferred stock with certain liquidation preferences that are considered substantive. Accordingly, for accounting purposes, the Company's and Mr. Dunlap's equity ownership interests are not considered in-substance common stock and the Company is accounting for its equity investment in Hudl under the cost method. The Company's investment in Hudl is included in "investments and notes receivable" in the Company's consolidated balance sheet.
The Company makes investments to further diversify the Company both within and outside of its historical core education-related businesses, including investments in real estate. Recent real estate investments have been focused on the development of commercial properties in the Midwest, and particularly in Lincoln, Nebraska, where the Company's headquarters are located. One investment includes the development of a building in Lincoln's Haymarket District that will be the new headquarters of Hudl. Upon completion of the building in late 2017, Hudl will be the primary tenant in this building.
F-51
NELNET, INC. AND SUBSIDIARIES
Notes to Consolidated Financial Statements – (continued)
(Dollars in thousands, except share amounts, unless otherwise noted)
20. Fair Value
The following tables present the Company’s financial assets and liabilities that are measured at fair value on a recurring basis. There were no transfers into or out of level 1, level 2, or level 3 for the year ended
December 31, 2016
.
|
|
As of December 31, 2016
|
As of December 31, 2015
|
||||||||||||||||
|
|
Level 1
|
Level 2
|
Total
|
Level 1
|
Level 2
|
Total
|
||||||||||||
|
Assets:
|
|
|
|
|||||||||||||||
|
Investments (available-for-sale and trading): (a)
|
||||||||||||||||||
|
Student loan asset-backed securities
|
$
|
—
|
|
103,780
|
|
103,780
|
|
—
|
|
147,925
|
|
147,925
|
|
|||||
|
Equity securities
|
2,694
|
|
—
|
|
2,694
|
|
7,337
|
|
—
|
|
7,337
|
|
||||||
|
Debt securities
|
119
|
|
—
|
|
119
|
|
130
|
|
—
|
|
130
|
|
||||||
|
Total investments (available-for-sale and trading)
|
2,813
|
|
103,780
|
|
106,593
|
|
7,467
|
|
147,925
|
|
155,392
|
|
||||||
|
Derivative instruments (b)
|
—
|
|
87,531
|
|
87,531
|
|
—
|
|
28,690
|
|
28,690
|
|
||||||
|
Total assets
|
$
|
2,813
|
|
191,311
|
|
194,124
|
|
7,467
|
|
176,615
|
|
184,082
|
|
|||||
|
Liabilities:
|
||||||||||||||||||
|
Derivative instruments (b):
|
$
|
—
|
|
77,826
|
|
77,826
|
|
—
|
|
74,881
|
|
74,881
|
|
|||||
|
Total liabilities
|
$
|
—
|
|
77,826
|
|
77,826
|
|
—
|
|
74,881
|
|
74,881
|
|
|||||
|
(a)
|
Investments represent investments recorded at fair value on a recurring basis. Level 1 investments are measured based upon quoted prices and include investments traded on an active exchange, such as the New York Stock Exchange, and corporate bonds, mortgage-backed securities, U.S. government bonds, and U.S. Treasury securities that trade in active markets. Level 2 investments include student loan asset-backed securities. The fair value for the student loan asset-backed securities is determined using indicative quotes from broker-dealers or an income approach valuation technique (present value using the discount rate adjustment technique) that considers, among other things, rates currently observed in publicly traded debt markets for debt of similar terms issued by companies with comparable credit risk.
|
|
(b)
|
All derivatives are accounted for at fair value on a recurring basis. The fair value of derivative financial instruments is determined using a market approach in which derivative pricing models use the stated terms of the contracts and observable yield curves, forward foreign currency exchange rates, and volatilities from active markets.
|
When determining the fair value of derivatives, the Company takes into account counterparty credit risk for positions where it is exposed to the counterparty on a net basis by assessing exposure net of collateral held. The net exposures for each counterparty are adjusted based on market information available for the specific counterparty.
F-52
NELNET, INC. AND SUBSIDIARIES
Notes to Consolidated Financial Statements – (continued)
(Dollars in thousands, except share amounts, unless otherwise noted)
The following table summarizes the fair values of all of the Company’s financial instruments on the consolidated balance sheets:
|
|
As of December 31, 2016
|
||||||||||||||
|
|
Fair value
|
Carrying value
|
Level 1
|
Level 2
|
Level 3
|
||||||||||
|
Financial assets:
|
|
|
|
|
|||||||||||
|
Student loans receivable
|
$
|
25,653,581
|
|
24,903,724
|
|
—
|
|
—
|
|
25,653,581
|
|
||||
|
Cash and cash equivalents
|
69,654
|
|
69,654
|
|
69,654
|
|
—
|
|
—
|
|
|||||
|
Investments (available-for-sale and trading)
|
106,593
|
|
106,593
|
|
2,813
|
|
103,780
|
|
—
|
|
|||||
|
Notes receivable
|
17,031
|
|
17,031
|
|
—
|
|
17,031
|
|
—
|
|
|||||
|
Restricted cash
|
980,961
|
|
980,961
|
|
980,961
|
|
—
|
|
—
|
|
|||||
|
Restricted cash – due to customers
|
119,702
|
|
119,702
|
|
119,702
|
|
—
|
|
—
|
|
|||||
|
Accrued interest receivable
|
391,264
|
|
391,264
|
|
—
|
|
391,264
|
|
—
|
|
|||||
|
Derivative instruments
|
87,531
|
|
87,531
|
|
—
|
|
87,531
|
|
—
|
|
|||||
|
Financial liabilities:
|
|
|
|
|
|||||||||||
|
Bonds and notes payable
|
24,220,996
|
|
24,668,490
|
|
—
|
|
24,220,996
|
|
—
|
|
|||||
|
Accrued interest payable
|
45,677
|
|
45,677
|
|
—
|
|
45,677
|
|
—
|
|
|||||
|
Due to customers
|
119,702
|
|
119,702
|
|
119,702
|
|
—
|
|
—
|
|
|||||
|
Derivative instruments
|
77,826
|
|
77,826
|
|
—
|
|
77,826
|
|
—
|
|
|||||
|
|
As of December 31, 2015
|
||||||||||||||
|
|
Fair value
|
Carrying value
|
Level 1
|
Level 2
|
Level 3
|
||||||||||
|
Financial assets:
|
|
|
|
|
|||||||||||
|
Student loans receivable
|
$
|
28,611,350
|
|
28,324,552
|
|
—
|
|
—
|
|
28,611,350
|
|
||||
|
Cash and cash equivalents
|
63,529
|
|
63,529
|
|
63,529
|
|
—
|
|
—
|
|
|||||
|
Investments (available-for-sale and trading)
|
155,392
|
|
155,392
|
|
7,467
|
|
147,925
|
|
—
|
|
|||||
|
Notes receivable
|
18,067
|
|
18,473
|
|
—
|
|
18,067
|
|
—
|
|
|||||
|
Restricted cash
|
832,624
|
|
832,624
|
|
832,624
|
|
—
|
|
—
|
|
|||||
|
Restricted cash – due to customers
|
144,771
|
|
144,771
|
|
144,771
|
|
—
|
|
—
|
|
|||||
|
Accrued interest receivable
|
383,825
|
|
383,825
|
|
—
|
|
383,825
|
|
—
|
|
|||||
|
Derivative instruments
|
28,690
|
|
28,690
|
|
—
|
|
28,690
|
|
—
|
|
|||||
|
Financial liabilities:
|
|
|
|
|
|||||||||||
|
Bonds and notes payable
|
27,150,775
|
|
28,105,921
|
|
—
|
|
27,150,775
|
|
—
|
|
|||||
|
Accrued interest payable
|
31,507
|
|
31,507
|
|
—
|
|
31,507
|
|
—
|
|
|||||
|
Due to customers
|
144,771
|
|
144,771
|
|
144,771
|
|
—
|
|
—
|
|
|||||
|
Derivative instruments
|
74,881
|
|
74,881
|
|
—
|
|
74,881
|
|
—
|
|
|||||
The methodologies for estimating the fair value of financial assets and liabilities that are measured at fair value on a recurring basis are previously discussed. The remaining financial assets and liabilities were estimated using the following methods and assumptions:
Student Loans Receivable
If the Company has the ability and intent to hold loans for the foreseeable future, such loans are held for investment and carried at amortized cost. Fair values for student loans receivable were determined by modeling loan cash flows using stated terms of the assets and internally-developed assumptions to determine aggregate portfolio yield, net present value, and average life. The significant assumptions used to project cash flows are prepayment speeds, default rates, cost of funds, required return on equity, and future interest rate and index relationships. A number of significant inputs into the models are internally derived and not observable to market participants.
Notes Receivable
Fair values for notes receivable were determined by using model-derived valuations with observable inputs, including current market rates.
F-53
NELNET, INC. AND SUBSIDIARIES
Notes to Consolidated Financial Statements – (continued)
(Dollars in thousands, except share amounts, unless otherwise noted)
Cash and Cash Equivalents, Restricted Cash, Restricted Cash – Due to Customers, Accrued Interest Receivable/Payable, and Due to Customers
The carrying amount approximates fair value due to the variable rate of interest and/or the short maturities of these instruments.
Bonds and Notes Payable
Bonds and notes payable are accounted for at cost in the financial statements except when denominated in a foreign currency. Foreign currency-denominated borrowings are re-measured at current spot rates in the financial statements. The fair value of bonds and notes payable was determined from quotes from broker-dealers or through standard bond pricing models using the stated terms of the borrowings, observable yield curves, market credit spreads, and weighted average life of underlying collateral. Fair value adjustments for unsecured corporate debt are made based on indicative quotes from observable trades.
Limitations
The fair value estimates are made at a specific point in time based on relevant market information and information about the financial instruments. Because no market exists for a significant portion of the Company's financial instruments, fair value estimates are based on judgments regarding future expected loss experience, current economic conditions, risk characteristics of various financial instruments, and other factors. These estimates are subjective in nature and involve uncertainties and matters of significant judgment and therefore cannot be determined with precision. Therefore, the calculated fair value estimates in many instances cannot be substantiated by comparison to independent markets and, in many cases, may not be realizable in a current sale of the instrument. Changes in assumptions could significantly affect the estimates.
21. Legal Proceedings
The Company is subject to various claims, lawsuits, and proceedings that arise in the normal course of business. These matters frequently involve claims by student loan borrowers disputing the manner in which their student loans have been serviced or the accuracy of reports to credit bureaus, claims by student loan borrowers or other consumers alleging that state or Federal consumer protection laws have been violated in the process of collecting loans or conducting other business activities, and disputes with other business entities. In addition, from time to time the Company receives information and document requests from state or federal regulators concerning its business practices. The Company cooperates with these inquiries and responds to the requests. While the Company cannot predict the ultimate outcome of any regulatory examination, inquiry, or investigation, the Company believes its activities have materially complied with applicable law, including the Higher Education Act, the rules and regulations adopted by the Department thereunder, and the Department's guidance regarding those rules and regulations. On the basis of present information, anticipated insurance coverage, and advice received from counsel, it is the opinion of the Company's management that the disposition or ultimate determination of these claims, lawsuits, and proceedings will not have a material adverse effect on the Company's business, financial position, or results of operations.
F-54
NELNET, INC. AND SUBSIDIARIES
Notes to Consolidated Financial Statements – (continued)
(Dollars in thousands, except share amounts, unless otherwise noted)
22. Quarterly Financial Information (Unaudited)
|
2016
|
||||||||||||
|
First quarter
|
Second quarter
|
Third quarter
|
Fourth quarter
|
|||||||||
|
Net interest income
|
$
|
101,609
|
|
92,200
|
|
99,795
|
|
78,960
|
|
|||
|
Less provision for loan losses
|
2,500
|
|
2,000
|
|
6,000
|
|
3,000
|
|
||||
|
Net interest income after provision for loan losses
|
99,109
|
|
90,200
|
|
93,795
|
|
75,960
|
|
||||
|
Loan systems and servicing revenue
|
52,330
|
|
54,402
|
|
54,350
|
|
53,764
|
|
||||
|
Tuition payment processing, school information, and campus commerce revenue
|
38,657
|
|
30,483
|
|
33,071
|
|
30,519
|
|
||||
|
Communications revenue
|
4,346
|
|
4,478
|
|
4,343
|
|
4,492
|
|
||||
|
Enrollment services revenue
|
4,326
|
|
—
|
|
—
|
|
—
|
|
||||
|
Other income
|
13,796
|
|
9,765
|
|
15,150
|
|
15,218
|
|
||||
|
Gain on sale of loans and debt repurchases, net
|
101
|
|
—
|
|
2,160
|
|
5,720
|
|
||||
|
Derivative market value and foreign currency adjustments and derivative settlements, net
|
(28,691
|
)
|
(40,702
|
)
|
36,001
|
|
83,187
|
|
||||
|
Salaries and benefits
|
(63,242
|
)
|
(60,923
|
)
|
(63,743
|
)
|
(68,017
|
)
|
||||
|
Depreciation and amortization
|
(7,640
|
)
|
(8,183
|
)
|
(8,994
|
)
|
(9,116
|
)
|
||||
|
Loan servicing fees
|
(6,928
|
)
|
(7,216
|
)
|
(5,880
|
)
|
(5,726
|
)
|
||||
|
Cost to provide communications services
|
(1,703
|
)
|
(1,681
|
)
|
(1,784
|
)
|
(1,697
|
)
|
||||
|
Cost to provide enrollment services
|
(3,623
|
)
|
—
|
|
—
|
|
—
|
|
||||
|
Operating expenses
|
(28,376
|
)
|
(29,409
|
)
|
(26,391
|
)
|
(31,245
|
)
|
||||
|
Income tax expense
|
(24,433
|
)
|
(15,036
|
)
|
(47,715
|
)
|
(54,128
|
)
|
||||
|
Net income
|
48,029
|
|
26,178
|
|
84,363
|
|
98,931
|
|
||||
|
Net income attributable to noncontrolling interest
|
68
|
|
28
|
|
69
|
|
585
|
|
||||
|
Net income attributable to Nelnet, Inc.
|
$
|
47,961
|
|
26,150
|
|
84,294
|
|
98,346
|
|
|||
|
Earnings per common share:
|
||||||||||||
|
Net income attributable to Nelnet, Inc. shareholders - basic and diluted
|
$
|
1.11
|
|
0.61
|
|
1.98
|
|
2.32
|
|
|||
F-55
NELNET, INC. AND SUBSIDIARIES
Notes to Consolidated Financial Statements – (continued)
(Dollars in thousands, except share amounts, unless otherwise noted)
|
2015
|
||||||||||||
|
First quarter
|
Second quarter
|
Third quarter
|
Fourth quarter
|
|||||||||
|
Net interest income
|
$
|
102,595
|
|
105,096
|
|
111,993
|
|
112,215
|
|
|||
|
Less provision for loan losses
|
2,000
|
|
2,150
|
|
3,000
|
|
3,000
|
|
||||
|
Net interest income after provision for loan losses
|
100,595
|
|
102,946
|
|
108,993
|
|
109,215
|
|
||||
|
Loan systems and servicing revenue
|
57,811
|
|
63,833
|
|
61,520
|
|
56,694
|
|
||||
|
Tuition payment processing, school information, and campus commerce revenue
|
34,680
|
|
27,686
|
|
30,439
|
|
27,560
|
|
||||
|
Enrollment services revenue
|
13,373
|
|
12,680
|
|
13,741
|
|
11,279
|
|
||||
|
Other income
|
11,408
|
|
11,985
|
|
12,282
|
|
11,587
|
|
||||
|
Gain on sale of loans and debt repurchases, net
|
2,875
|
|
1,515
|
|
597
|
|
166
|
|
||||
|
Derivative market value and foreign currency adjustments and derivative settlements, net
|
(3,078
|
)
|
6,502
|
|
(30,658
|
)
|
31,635
|
|
||||
|
Salaries and benefits
|
(61,050
|
)
|
(58,787
|
)
|
(63,215
|
)
|
(64,862
|
)
|
||||
|
Depreciation and amortization
|
(5,662
|
)
|
(6,501
|
)
|
(6,977
|
)
|
(7,203
|
)
|
||||
|
Loan servicing fees
|
(7,616
|
)
|
(7,420
|
)
|
(7,793
|
)
|
(7,384
|
)
|
||||
|
Cost to provide enrollment services
|
(10,799
|
)
|
(10,395
|
)
|
(11,349
|
)
|
(9,190
|
)
|
||||
|
Operating expenses
|
(30,101
|
)
|
(32,725
|
)
|
(31,604
|
)
|
(28,584
|
)
|
||||
|
Income tax expense
|
(37,630
|
)
|
(40,356
|
)
|
(26,999
|
)
|
(47,395
|
)
|
||||
|
Net income
|
64,806
|
|
70,963
|
|
48,977
|
|
83,518
|
|
||||
|
Net income attributable to noncontrolling interest
|
41
|
|
54
|
|
22
|
|
168
|
|
||||
|
Net income attributable to Nelnet, Inc.
|
$
|
64,765
|
|
70,909
|
|
48,955
|
|
83,350
|
|
|||
|
Earnings per common share:
|
||||||||||||
|
Net income attributable to Nelnet, Inc. shareholders - basic and diluted
|
$
|
1.40
|
|
1.54
|
|
1.09
|
|
1.86
|
|
|||
F-56
NELNET, INC. AND SUBSIDIARIES
Notes to Consolidated Financial Statements – (continued)
(Dollars in thousands, except share amounts, unless otherwise noted)
23. Condensed Parent Company Financial Statements
The following represents the condensed balance sheets as of
December 31, 2016
and
2015
and condensed statements of income, comprehensive income, and cash flows for each of the years in the three-year period ended
December 31, 2016
for Nelnet, Inc.
The Company is limited in the amount of funds that can be transferred to it by its subsidiaries through intercompany loans, advances, or cash dividends. These limitations relate to the restrictions by trust indentures under the education lending subsidiaries debt financing arrangements. The amounts of cash and investments restricted in the respective reserve accounts of the education lending subsidiaries are shown on the consolidated balance sheets as restricted cash and investments.
|
Balance Sheets
|
||||||
|
(Parent Company Only)
|
||||||
|
As of December 31, 2016 and 2015
|
||||||
|
2016
|
2015
|
|||||
|
Assets:
|
||||||
|
Cash and cash equivalents
|
$
|
29,734
|
|
19,419
|
|
|
|
Investments and notes receivable
|
167,711
|
|
214,786
|
|
||
|
Investment in subsidiary debt
|
71,815
|
|
49,932
|
|
||
|
Restricted cash
|
7,805
|
|
14,802
|
|
||
|
Investment in subsidiaries
|
1,537,507
|
|
1,519,103
|
|
||
|
Notes receivable from subsidiaries
|
161,284
|
|
169,845
|
|
||
|
Other assets
|
136,685
|
|
168,947
|
|
||
|
Fair value of derivative instruments
|
86,379
|
|
27,120
|
|
||
|
Total assets
|
$
|
2,198,920
|
|
2,183,954
|
|
|
|
Liabilities:
|
||||||
|
Notes payable
|
$
|
48,085
|
|
230,307
|
|
|
|
Other liabilities
|
74,706
|
|
56,234
|
|
||
|
Fair value of derivative instruments
|
10,221
|
|
9,231
|
|
||
|
Total liabilities
|
133,012
|
|
295,772
|
|
||
|
Equity:
|
||||||
|
Nelnet, Inc. shareholders' equity:
|
||||||
|
Common stock
|
421
|
|
440
|
|
||
|
Additional paid-in capital
|
420
|
|
—
|
|
||
|
Retained earnings
|
2,056,084
|
|
1,881,708
|
|
||
|
Accumulated other comprehensive earnings
|
4,730
|
|
2,284
|
|
||
|
Total Nelnet, Inc. shareholders' equity
|
2,061,655
|
|
1,884,432
|
|
||
|
Noncontrolling interest
|
4,253
|
|
3,750
|
|
||
|
Total equity
|
2,065,908
|
|
1,888,182
|
|
||
|
Total liabilities and shareholders' equity
|
$
|
2,198,920
|
|
2,183,954
|
|
|
F-57
NELNET, INC. AND SUBSIDIARIES
Notes to Consolidated Financial Statements – (continued)
(Dollars in thousands, except share amounts, unless otherwise noted)
|
Statements of Income
|
|||||||||
|
(Parent Company Only)
|
|||||||||
|
Years ended December 31, 2016, 2015, and 2014
|
|||||||||
|
|
2016
|
2015
|
2014
|
||||||
|
Investment interest income
|
$
|
9,794
|
|
5,776
|
|
6,863
|
|
||
|
Interest expense on bonds and notes payable
|
6,049
|
|
6,242
|
|
5,492
|
|
|||
|
Net interest (expense) income
|
3,745
|
|
(466
|
)
|
1,371
|
|
|||
|
Other income:
|
|
|
|
|
|
|
|||
|
Other income
|
7,037
|
|
4,012
|
|
8,943
|
|
|||
|
Gain from debt repurchases
|
8,083
|
|
4,904
|
|
6,685
|
|
|||
|
Equity in subsidiaries income
|
239,405
|
|
276,825
|
|
316,934
|
|
|||
|
Derivative market value adjustments and derivative settlements, net
|
45,203
|
|
8,416
|
|
14,963
|
|
|||
|
Total other income
|
299,728
|
|
294,157
|
|
347,525
|
|
|||
|
Operating expenses
|
8,183
|
|
5,057
|
|
5,598
|
|
|||
|
Income before income taxes
|
295,290
|
|
288,634
|
|
343,298
|
|
|||
|
Income tax expense
|
38,642
|
|
20,655
|
|
34,017
|
|
|||
|
Net income
|
256,648
|
|
267,979
|
|
309,281
|
|
|||
|
Net (loss) income attributable to noncontrolling interest
|
(103
|
)
|
—
|
|
1,671
|
|
|||
|
Net income attributable to Nelnet, Inc.
|
$
|
256,751
|
|
267,979
|
|
307,610
|
|
||
|
Statements of Comprehensive Income
|
|||||||||
|
(Parent Company Only)
|
|||||||||
|
Years ended December 31, 2016, 2015, and 2014
|
|||||||||
|
2016
|
2015
|
2014
|
|||||||
|
Net income
|
$
|
256,648
|
|
267,979
|
|
309,281
|
|
||
|
Other comprehensive income (loss):
|
|||||||||
|
Available-for-sale securities:
|
|||||||||
|
Unrealized holding gains (losses) arising during period, net
|
5,789
|
|
(1,570
|
)
|
9,006
|
|
|||
|
Less reclassification adjustment for gains recognized in net income, net of losses
|
(1,907
|
)
|
(2,955
|
)
|
(8,506
|
)
|
|||
|
Income tax effect
|
(1,436
|
)
|
1,674
|
|
(184
|
)
|
|||
|
Total other comprehensive income (loss)
|
2,446
|
|
(2,851
|
)
|
316
|
|
|||
|
Comprehensive income
|
259,094
|
|
265,128
|
|
309,597
|
|
|||
|
Comprehensive (loss) income attributable to noncontrolling interest
|
(103
|
)
|
—
|
|
1,671
|
|
|||
|
Comprehensive income attributable to Nelnet, Inc.
|
$
|
259,197
|
|
265,128
|
|
307,926
|
|
||
F-58
NELNET, INC. AND SUBSIDIARIES
Notes to Consolidated Financial Statements – (continued)
(Dollars in thousands, except share amounts, unless otherwise noted)
|
Statements of Cash Flows
|
|||||||||
|
(Parent Company Only)
|
|||||||||
|
Years ended December 31, 2016, 2015, and 2014
|
|||||||||
|
2016
|
2015
|
2014
|
|||||||
|
Net income attributable to Nelnet, Inc.
|
$
|
256,751
|
|
267,979
|
|
307,610
|
|
||
|
Net (loss) income attributable to noncontrolling interest
|
(103
|
)
|
—
|
|
1,671
|
|
|||
|
Net income
|
256,648
|
|
267,979
|
|
309,281
|
|
|||
|
Adjustments to reconcile net income to net cash provided by (used in) operating activities:
|
|||||||||
|
Depreciation and amortization
|
391
|
|
327
|
|
303
|
|
|||
|
Derivative market value adjustment
|
(62,268
|
)
|
(31,411
|
)
|
(36,979
|
)
|
|||
|
Proceeds to terminate and/or amend derivative instruments, net of payments
|
3,999
|
|
65,527
|
|
1,765
|
|
|||
|
Payment to enter into derivative instrument
|
—
|
|
—
|
|
(9,087
|
)
|
|||
|
Equity in earnings of subsidiaries
|
(239,405
|
)
|
(276,825
|
)
|
(316,934
|
)
|
|||
|
Gain from sales of available-for-sale securities, net
|
(1,907
|
)
|
(2,955
|
)
|
(8,506
|
)
|
|||
|
Gain from debt repurchases
|
(8,083
|
)
|
(4,904
|
)
|
(6,685
|
)
|
|||
|
Proceeds (purchases) related to trading securities, net
|
62
|
|
(167
|
)
|
—
|
|
|||
|
Deferred income tax expense
|
20,071
|
|
3,228
|
|
12,397
|
|
|||
|
Non-cash compensation expense
|
4,348
|
|
5,347
|
|
4,699
|
|
|||
|
Other
|
1,055
|
|
2,113
|
|
2,576
|
|
|||
|
Decrease (increase) in other assets
|
32,262
|
|
(8,541
|
)
|
(2,211
|
)
|
|||
|
(Decrease) increase in other liabilities
|
(594
|
)
|
6,597
|
|
115
|
|
|||
|
Net cash provided by (used in) operating activities
|
6,579
|
|
26,315
|
|
(49,266
|
)
|
|||
|
Cash flows from investing activities:
|
|||||||||
|
Decrease (increase) in restricted cash
|
6,997
|
|
(13,825
|
)
|
3,636
|
|
|||
|
Purchases of available-for-sale securities
|
(94,920
|
)
|
(98,332
|
)
|
(192,315
|
)
|
|||
|
Proceeds from sales of available-for-sale securities
|
139,427
|
|
94,722
|
|
240,371
|
|
|||
|
Capital contributions/distributions to/from subsidiaries, net
|
223,386
|
|
120,291
|
|
(25,017
|
)
|
|||
|
Decrease (increase) in notes receivable from subsidiaries
|
8,561
|
|
(84,061
|
)
|
12,623
|
|
|||
|
Proceeds from investments and notes receivable
|
9,952
|
|
12,253
|
|
4,163
|
|
|||
|
(Purchases of) proceeds from subsidiary debt, net
|
(13,800
|
)
|
72,125
|
|
111,038
|
|
|||
|
Purchases of investments and issuances of notes receivable
|
(4,365
|
)
|
(53,388
|
)
|
(27,166
|
)
|
|||
|
Business acquisition, net of cash acquired
|
—
|
|
(45,916
|
)
|
—
|
|
|||
|
Net cash provided by investing activities
|
275,238
|
|
3,869
|
|
127,333
|
|
|||
|
Cash flows from financing activities:
|
|||||||||
|
Payments on notes payable
|
(412,000
|
)
|
(42,541
|
)
|
(63,084
|
)
|
|||
|
Proceeds from issuance of notes payable
|
230,000
|
|
116,460
|
|
27,577
|
|
|||
|
Payments of debt issuance costs
|
(613
|
)
|
(773
|
)
|
(512
|
)
|
|||
|
Dividends paid
|
(21,188
|
)
|
(19,025
|
)
|
(18,542
|
)
|
|||
|
Repurchases of common stock
|
(69,091
|
)
|
(96,169
|
)
|
(15,713
|
)
|
|||
|
Proceeds from issuance of common stock
|
889
|
|
801
|
|
656
|
|
|||
|
Issuance of noncontrolling interest
|
501
|
|
—
|
|
201
|
|
|||
|
Distribution to noncontrolling interest
|
—
|
|
(230
|
)
|
(1,970
|
)
|
|||
|
Net cash used in financing activities
|
(271,502
|
)
|
(41,477
|
)
|
(71,387
|
)
|
|||
|
Net increase (decrease) in cash and cash equivalents
|
10,315
|
|
(11,293
|
)
|
6,680
|
|
|||
|
Cash and cash equivalents, beginning of period
|
19,419
|
|
30,712
|
|
24,032
|
|
|||
|
Cash and cash equivalents, end of period
|
$
|
29,734
|
|
19,419
|
|
30,712
|
|
||
|
Cash disbursements made for:
|
|||||||||
|
Interest
|
$
|
5,533
|
|
5,914
|
|
5,189
|
|
||
|
Income taxes, net of refunds
|
$
|
115,415
|
|
147,130
|
|
155,715
|
|
||
|
Non-cash investing and financing activities:
|
|||||||||
|
Issuance of noncontrolling interest
|
$
|
—
|
|
3,750
|
|
—
|
|
||
|
Contributions of investments to subsidiaries, net
|
$
|
(1,884
|
)
|
—
|
|
—
|
|
||
F-59
APPENDIX A
Description of
The Federal Family Education Loan Program
The Federal Family Education Loan Program
The Higher Education Act provided for a program of federal insurance for student loans as well as reinsurance of student loans guaranteed or insured by state agencies or private non-profit corporations.
The Higher Education Act authorized certain student loans to be insured and reinsured under the Federal Family Education Loan Program (“FFELP”). The Student Aid and Fiscal Responsibility Act, enacted into law on March 30, 2010, as part of the Health Care and Education Reconciliation Act of 2010, terminated the authority to make FFELP loans. As of July 1, 2010, no new FFELP loans have been made.
Generally, a student was eligible for loans made under the Federal Family Education Loan Program only if he or she:
|
•
|
Had been accepted for enrollment or was enrolled in good standing at an eligible institution of higher education;
|
|
•
|
Was carrying or planning to carry at least one-half the normal full-time workload, as determined by the institution, for the course of study the student was pursuing;
|
|
•
|
Was not in default on any federal education loans;
|
|
•
|
Had not committed a crime involving fraud in obtaining funds under the Higher Education Act which funds had not been fully repaid; and
|
|
•
|
Met other applicable eligibility requirements.
|
Eligible institutions included higher educational institutions and vocational schools that complied with specific federal regulations. Each loan is evidenced by an unsecured note.
The Higher Education Act also establishes maximum interest rates for each of the various types of loans. These rates vary not only among loan types, but also within loan types depending upon when the loan was made or when the borrower first obtained a loan under the Federal Family Education Loan Program. The Higher Education Act allows lesser rates of interest to be charged.
Types of loans
Four types of loans were available under the Federal Family Education Loan Program:
|
•
|
Subsidized Stafford Loans
|
|
•
|
Unsubsidized Stafford Loans
|
|
•
|
PLUS Loans
|
|
•
|
Consolidation Loans
|
These loan types vary as to eligibility requirements, interest rates, repayment periods, loan limits, eligibility for interest subsidies, and special allowance payments. Some of these loan types have had other names in the past. References to these various loan types include, where appropriate, their predecessors.
The primary loan under the Federal Family Education Loan Program is the Subsidized Stafford Loan. Students who were not eligible for Subsidized Stafford Loans based on their economic circumstances might have obtained Unsubsidized Stafford Loans. Graduate or professional students and parents of dependent undergraduate students might have obtained PLUS Loans. Consolidation Loans were available to borrowers with existing loans made under the Federal Family Education Loan Program and other federal programs to consolidate repayment of the borrower's existing loans. Prior to July 1, 1994, the Federal Family Education Loan Program also offered Supplemental Loans for Students (“SLS Loans”) to graduate and professional students and independent undergraduate students and, under certain circumstances, dependent undergraduate students, to supplement their Stafford Loans.
A-1
Subsidized Stafford Loans
General.
Subsidized Stafford Loans were eligible for insurance and reinsurance under the Higher Education Act if the eligible student to whom the loan was made was accepted or was enrolled in good standing at an eligible institution of higher education or vocational school and carried at least one-half the normal full-time workload at that institution. Subsidized Stafford Loans had limits as to the maximum amount which could be borrowed for an academic year and in the aggregate for both undergraduate and graduate or professional study. Both annual and aggregate limitations excluded loans made under the PLUS Loan Program. The Secretary of Education had discretion to raise these limits to accommodate students undertaking specialized training requiring exceptionally high costs of education.
Subsidized Stafford Loans were made only to student borrowers who met the needs tests provided in the Higher Education Act. Provisions addressing the implementation of needs analysis and the relationship between unmet need for financing and the availability of Subsidized Stafford Loan Program funding have been the subject of frequent and extensive amendments.
Interest rates for Subsidized Stafford Loans.
For Stafford Loans first disbursed to a “new” borrower (a “new” borrower is defined for purposes of this section as one who had no outstanding balance on a FFELP loan on the date the new promissory note was signed) for a period of enrollment beginning before January 1, 1981, the applicable interest rate is fixed at 7%.
For Stafford Loans first disbursed to a “new” borrower, for a period of enrollment beginning on or after January 1, 1981, but before September 13, 1983, the applicable interest rate is fixed at 9%.
For Stafford Loans first disbursed to a “new” borrower, for a period of enrollment beginning on or after September 13, 1983, but before July 1, 1988, the applicable interest rate is fixed at 8%.
For Stafford Loans first disbursed to a borrower with an outstanding balance on a PLUS, SLS, or Consolidation Loan, but not on a Stafford Loan, where the new loan is intended for a period of enrollment beginning before July 1, 1988, the applicable interest rate is fixed at 8%.
For Stafford Loans first disbursed before October 1, 1992, to a “new” borrower or to a borrower with an outstanding balance on a PLUS, SLS, or Consolidation Loan, but not a Stafford Loan, where the new loan is intended for a period of enrollment beginning on or after July 1, 1988, the applicable interest rate is as follows:
|
•
|
Original fixed interest rate of 8% for the first 48 months of repayment. Beginning on the first day of the 49
th
month of repayment, the interest rate increased to a fixed rate of 10% thereafter. Loans in this category were subject to excess interest rebates and have been converted to a variable interest rate based on the bond equivalent rate of the 91-day Treasury bill auctioned at the final auction before the preceding June 1, plus 3.25%. The variable interest rate is adjusted annually on July 1. The maximum interest rate for loans in this category is 10%.
|
For Stafford Loans first disbursed on or after July 23, 1992, but before July 1, 1994, to a borrower with an outstanding Stafford Loan made with a 7%, 8%, 9%, or 8%/10% fixed interest rate, the original, applicable interest rate is the same as the rate provided on the borrower's previous Stafford Loan (i.e., a fixed rate of 7%, 8%, 9%, or 8%/10%). Loans in this category were subject to excess interest rebates and have been converted to a variable interest rate based on the bond equivalent rate of the 91-day Treasury bill auctioned at the final auction before the preceding June 1, plus 3.1%. The variable interest rate is adjusted annually on July 1. The maximum interest rate for a loan in this category is equal to the loan's previous fixed rate (i.e., 7%, 8%, 9%, or 10%).
For Stafford Loans first disbursed on or after October 1, 1992, but before December 20, 1993, to a borrower with an outstanding balance on a PLUS, SLS, or Consolidation Loan, but not on a Stafford Loan, the original, applicable interest rate is fixed at 8%. Loans in this category were subject to excess interest rebates and have been converted to a variable interest rate based on the bond equivalent rate of the 91-day Treasury bill auctioned at the final auction before the preceding June 1, plus 3.1%. The variable interest rate is adjusted annually on July 1. The maximum interest rate for a loan in this category is 8%.
For Stafford Loans first disbursed on or after October 1, 1992, but before July 1, 1994, to a “new” borrower, the applicable interest rate is variable and is based on the bond equivalent rate of the 91-day Treasury bill auctioned at the final auction before the preceding June 1, plus 3.1%. The variable interest rate is adjusted annually on July 1. The maximum interest rate for a loan in this category is 9%.
For Stafford Loans first disbursed on or after December 20, 1993, but before July 1, 1994, to a borrower with an outstanding balance on a PLUS, SLS, or Consolidation Loan, but not on a Stafford Loan, the applicable interest rate is variable and is based
A-2
on the bond equivalent rate of the 91-day Treasury bill auctioned at the final auction before the preceding June 1, plus 3.1%. The variable interest rate is adjusted annually on July 1. The maximum interest rate for a loan in this category is 9%.
For Stafford Loans first disbursed on or after July 1, 1994, but before July 1, 1995, where the loan is intended for a period of enrollment that includes or begins on or after July 1, 1994, the applicable interest rate is variable and is based on the bond equivalent rate of the 91-day Treasury bill auctioned at the final auction before the preceding June 1, plus 3.1%. The variable interest rate is adjusted annually on July 1. The maximum interest rate for a loan in this category is 8.25%.
For Stafford Loans first disbursed on or after July 1, 1995, but before July 1, 1998, the applicable interest rate is as follows:
|
•
|
When the borrower is in school, in grace, or in an authorized period of deferment, the applicable interest rate is variable and is based on the bond equivalent rate of the 91-day Treasury bill auctioned at the final auction before the preceding June 1, plus 2.5%. The variable interest rate is adjusted annually on July 1. The maximum interest rate is 8.25%.
|
|
•
|
When the borrower is in repayment or in a period of forbearance, the applicable interest rate is variable and is based on the bond equivalent rate of the 91-day Treasury bill auctioned at the final auction before the preceding June 1, plus 3.1%. The variable interest rate is adjusted annually on July 1. The maximum interest rate is 8.25%.
|
For Stafford Loans first disbursed on or after July 1, 1998, but before July 1, 2006, the applicable interest rate is as follows:
|
•
|
When the borrower is in school, in grace, or in an authorized period of deferment, the applicable interest rate is variable and is based on the bond equivalent rate of the 91-day Treasury bill auctioned at the final auction before the preceding June 1, plus 1.7%. The variable interest rate is adjusted annually on July 1. The maximum interest rate is 8.25%.
|
|
•
|
When the borrower is in repayment or in a period of forbearance, the applicable interest rate is variable and is based on the bond equivalent rate of the 91-day Treasury bill auctioned at the final auction before the preceding June 1, plus 2.3%. The variable interest rate is adjusted annually on July 1. The maximum interest rate is 8.25%.
|
For Stafford Loans first disbursed on or after July 1, 2006, the applicable interest rate is fixed at 6.80%. However, for Stafford Loans for undergraduates, the applicable interest rate was reduced in phases for which the first disbursement was made on or after:
|
•
|
July 1, 2008 and before July 1, 2009, the applicable interest rate is fixed at 6.00%,
|
|
•
|
July 1, 2009 and before July 1, 2010, the applicable interest rate is fixed at 5.60%.
|
Unsubsidized Stafford Loans
General.
The Unsubsidized Stafford Loan program was created by Congress in 1992 for students who did not qualify for Subsidized Stafford Loans due to parental and/or student income and assets in excess of permitted amounts. These students were entitled to borrow the difference between the Stafford Loan maximum for their status (dependent or independent) and their Subsidized Stafford Loan eligibility through the Unsubsidized Stafford Loan Program. The general requirements for Unsubsidized Stafford Loans, including special allowance payments, are essentially the same as those for Subsidized Stafford Loans. However, the terms of the Unsubsidized Stafford Loans differ materially from Subsidized Stafford Loans in that the federal government will not make interest subsidy payments and the loan limitations were determined without respect to the expected family contribution. The borrower is required to either pay interest from the time the loan is disbursed or the accruing interest is capitalized when repayment begins at the end of a deferment or forbearance, when the borrower is determined to no longer have a partial financial hardship under the Income-Based Repayment plan or when the borrower leaves the plan. Unsubsidized Stafford Loans were not available before October 1, 1992. A student meeting the general eligibility requirements for a loan under the Federal Family Education Loan Program was eligible for an Unsubsidized Stafford Loan without regard to need.
Interest rates for Unsubsidized Stafford Loans.
Unsubsidized Stafford Loans are subject to the same interest rate provisions as Subsidized Stafford Loans, with the exception of Unsubsidized Stafford Loans first disbursed on or after July 1, 2008, which retain a fixed interest rate of 6.80%.
A-3
PLUS Loans
General.
PLUS Loans were made to parents, and under certain circumstances spouses of remarried parents, of dependent undergraduate students. Effective July 1, 2006, graduate and professional students were eligible borrowers under the PLUS Loan program. For PLUS Loans made on or after July 1, 1993, the borrower could not have an adverse credit history as determined by criteria established by the Secretary of Education. The basic provisions applicable to PLUS Loans are similar to those of Stafford Loans with respect to the involvement of guarantee agencies and the Secretary of Education in providing federal insurance and reinsurance on the loans. However, PLUS Loans differ significantly, particularly from the Subsidized Stafford Loans, in that federal interest subsidy payments are not available under the PLUS Loan Program and special allowance payments are more restricted.
Interest rates for PLUS Loans.
For PLUS Loans first disbursed on or after January 1, 1981, but before October 1, 1981, the applicable interest rate is fixed at 9%.
For PLUS Loans first disbursed on or after October 1, 1981, but before November 1, 1982, the applicable interest rate is fixed at 14%.
For PLUS Loans first disbursed on or after November 1, 1982, but before July 1, 1987, the applicable interest rate is fixed at 12%.
Beginning July 1, 2001, for PLUS Loans first disbursed on or after July 1, 1987, but before October 1, 1992, the applicable interest rate is variable and is based on the weekly average one-year constant maturity Treasury bill yield for the last calendar week ending on or before June 26 preceding July 1 of each year, plus 3.25%. The variable interest rate is adjusted annually on July 1. The maximum interest rate is 12%. Prior to July 1, 2001, PLUS Loans in this category had interest rates which were based on the 52-week Treasury bill auctioned at the final auction held prior to the preceding June 1, plus 3.25%. The annual (July 1) variable interest rate adjustment was applicable prior to July 1, 2001, as was the maximum interest rate of 12%. PLUS Loans originally made at a fixed interest rate, which have been refinanced for purposes of securing a variable interest rate, are subject to the variable interest rate calculation described in this paragraph.
Beginning July 1, 2001, for PLUS Loans first disbursed on or after October 1, 1992, but before July 1, 1994, the applicable interest rate is variable and is based on the weekly average one-year constant maturity Treasury yield for the last calendar week ending on or before June 26 preceding July 1 of each year, plus 3.1%. The variable interest rate is adjusted annually on July 1. The maximum interest rate is 10%. Prior to July 1, 2001, PLUS Loans in this category had interest rates which were based on the 52-week Treasury bill auctioned at the final auction held prior to the preceding June 1, plus 3.1%. The annual (July 1) variable interest rate adjustment was applicable prior to July 1, 2001, as was the maximum interest rate of 10%.
Beginning July 1, 2001, for PLUS Loans first disbursed on or after July 1, 1994, but before July 1, 1998, the applicable interest rate is variable and is based on the weekly average one-year constant maturity Treasury yield for the last calendar week ending on or before June 26 preceding July 1 of each year, plus 3.1%. The variable interest rate is adjusted annually on July 1. The maximum interest rate is 9%. Prior to July 1, 2001, PLUS Loans in this category had interest rates which were based on the 52-week Treasury bill auctioned at the final auction held prior to the preceding June 1, plus 3.1%. The annual (July 1) variable interest rate adjustment was applicable prior to July 1, 2001, as was the maximum interest rate of 9%.
For PLUS Loans first disbursed on or after July 1, 1998, but before July 1, 2006, the applicable interest rate is variable and is based on the bond equivalent rate of the 91-day Treasury bill auctioned at the final auction before the preceding June 1 of each year, plus 3.1%. The variable interest rate is adjusted annually on July 1. The maximum interest rate is 9%.
For PLUS Loans first disbursed on or after July 1, 2006, the applicable interest rate is fixed at 8.5%.
SLS Loans
General.
SLS Loans were limited to graduate or professional students, independent undergraduate students, and dependent undergraduate students, if the students' parents were unable to obtain a PLUS Loan. Except for dependent undergraduate students, eligibility for SLS Loans was determined without regard to need. SLS Loans were similar to Stafford Loans with respect to the involvement of guarantee agencies and the Secretary of Education in providing federal insurance and reinsurance on the loans. However, SLS Loans differed significantly, particularly from Subsidized Stafford Loans, because federal interest subsidy payments were not available under the SLS Loan Program and special allowance payments were more restricted. The SLS Loan Program was discontinued on July 1, 1994.
A-4
Interest rates for SLS Loans.
The applicable interest rates on SLS Loans made before October 1, 1992, and on SLS Loans originally made at a fixed interest rate, which have been refinanced for purposes of securing a variable interest rate, are identical to the applicable interest rates described for PLUS Loans made before October 1, 1992.
For SLS Loans first disbursed on or after October 1, 1992, but before July 1, 1994, the applicable interest rate is as follows:
|
•
|
Beginning July 1, 2001, the applicable interest rate is variable and is based on the weekly average one-year constant maturity Treasury yield for the last calendar week ending on or before June 26 preceding July 1 of each year, plus 3.1%. The variable interest rate is adjusted annually on July 1. The maximum interest rate is 11%. Prior to July 1, 2001, SLS Loans in this category had interest rates which were based on the 52-week Treasury bill auctioned at the final auction held prior to the preceding June 1, plus 3.1%. The annual (July 1) variable interest rate adjustment was applicable prior to July 1, 2001, as was the maximum interest rate of 11%.
|
Consolidation Loans
General.
The Higher Education Act authorized a program under which certain borrowers could consolidate their various federally insured education loans into a single loan insured and reinsured on a basis similar to Stafford Loans. Consolidation Loans could be obtained in an amount sufficient to pay outstanding principal, unpaid interest, late charges, and collection costs on federally insured or reinsured student loans incurred under the Federal Family Education Loan and Direct Loan Programs, including PLUS Loans made to the consolidating borrower, as well as loans made under the Perkins Loan (formally National Direct Student Loan Program), Federally Insured Student Loan (FISL), Nursing Student Loan (NSL), Health Education Assistance Loan (HEAL), and Health Professions Student Loan (HPSL) Programs. To be eligible for a FFELP Consolidation Loan, a borrower had to:
|
•
|
Have outstanding indebtedness on student loans made under the Federal Family Education Loan Program and/or certain other federal student loan programs; and
|
|
•
|
Be in repayment status or in a grace period on loans to be consolidated.
|
Borrowers who were in default on loans to be consolidated had to first make satisfactory arrangements to repay the loans to the respective holder(s) or had to agree to repay the consolidating lender under an income-based repayment arrangement in order to include the defaulted loans in the Consolidation Loan. For applications received on or after January 1, 1993, borrowers could add additional loans to a Consolidation Loan during the 180-day period following the origination of the Consolidation Loan.
A married couple who agreed to be jointly liable on a Consolidation Loan for which the application was received on or after January 1, 1993, but before July 1, 2006, was treated as an individual for purposes of obtaining a Consolidation Loan.
Interest rates for Consolidation Loans.
For Consolidation Loans disbursed before July 1, 1994, the applicable interest rate is fixed at the greater of:
|
•
|
9%, or
|
|
•
|
The weighted average of the interest rates on the loans consolidated, rounded to the nearest whole percent.
|
For Consolidation Loans disbursed on or after July 1, 1994, based on applications received by the lender before November 13, 1997, the applicable interest rate is fixed and is based on the weighted average of the interest rates on the loans consolidated, rounded up to the nearest whole percent.
For Consolidation Loans on which the application was received by the lender between November 13, 1997, and September 30, 1998, inclusive, the applicable interest rate is variable according to the following:
|
•
|
For the portion of the Consolidation Loan which is comprised of FFELP, Direct, FISL, Perkins, HPSL, or NSL loans, the variable interest rate is based on the bond equivalent rate of the 91-day Treasury bills auctioned at the final auction before the preceding June 1, plus 3.1%. The variable interest rate for this portion of the Consolidation Loan is adjusted annually on July 1. The maximum interest rate for this portion of the Consolidation Loan is 8.25%.
|
|
•
|
For the portion of the Consolidation Loan which is attributable to HEAL Loans (if applicable), the variable interest rate is based on the average of the bond equivalent rates of the 91-day Treasury bills auctioned for the quarter ending
|
A-5
June 30, plus 3.0%. The variable interest rate for this portion of the Consolidation Loan is adjusted annually on July 1. There is no maximum interest rate for the portion of a Consolidation Loan that is represented by HEAL Loans.
For Consolidation Loans on which the application was received by the lender on or after October 1, 1998, the applicable interest rate is determined according to the following:
|
•
|
For the portion of the Consolidation Loan which is comprised of FFELP, Direct, FISL, Perkins, HPSL, or NSL loans, the applicable interest rate is fixed and is based on the weighted average of the interest rates on the non-HEAL loans being consolidated, rounded up to the nearest one-eighth of one percent. The maximum interest rate for this portion of the Consolidation Loan is 8.25%.
|
|
•
|
For the portion of the Consolidation Loan which is attributable to HEAL Loans (if applicable), the applicable interest rate is variable and is based on the average of the bond equivalent rates of the 91-day Treasury bills auctioned for the quarter ending June 30, plus 3.0%. The variable interest rate for this portion of the Consolidation Loan is adjusted annually on July 1. There is no maximum interest rate for the portion of the Consolidation Loan that is represented by HEAL Loans.
|
For a discussion of required payments that reduce the return on Consolidation Loans, see “Fees - Rebate fee on Consolidation Loans” in this Appendix.
Interest rate during active duty
The Higher Education Opportunity Act of 2008 revised the Servicemembers Civil Relief Act to include FFEL Program loans. Interest charges on FFEL Program loans are capped at 6% during a period of time on or after August 14, 2008, in which a borrower has served or is serving on active duty in the Armed Forces, National Oceanic and Atmospheric Administration, Public Health Services, or National Guard. The interest charge cap includes the interest rate in addition to any fees, service charges, and other charges related to the loan. The cap is applicable to loans made prior to the date the borrower was called to active duty.
Maximum loan amounts
Each type of loan was subject to certain limits on the maximum principal amount, with respect to a given academic year and in the aggregate. Consolidation Loans were limited only by the amount of eligible loans to be consolidated. PLUS Loans were limited to the difference between the cost of attendance and the other aid available to the student. Stafford Loans, subsidized and unsubsidized, were subject to both annual and aggregate limits according to the provisions of the Higher Education Act.
Loan limits for Subsidized Stafford and Unsubsidized Stafford Loans.
Dependent and independent undergraduate students were subject to the same annual loan limits on Subsidized Stafford Loans; independent students were allowed greater annual loan limits on Unsubsidized Stafford Loans. A student who had not successfully completed the first year of a program of undergraduate education could borrow up to $3,500 in Subsidized Stafford Loans in an academic year. A student who had successfully completed the first year, but who had not successfully completed the second year, could borrow up to $4,500 in Subsidized Stafford Loans per academic year. An undergraduate student who had successfully completed the first and second years, but who had not successfully completed the remainder of a program of undergraduate education, could borrow up to $5,500 in Subsidized Stafford Loans per academic year.
Dependent students could borrow an additional $2,000 in Unsubsidized Stafford Loans for each year of undergraduate study. Independent students could borrow an additional $6,000 of Unsubsidized Stafford Loans for each of the first two years and an additional $7,000 for the third, fourth, and fifth years of undergraduate study. For students enrolled in programs of less than an academic year in length, the limits were generally reduced in proportion to the amount by which the programs were less than one year in length. A graduate or professional student could borrow up to $20,500 in an academic year where no more than $8,500 was representative of Subsidized Stafford Loan amounts.
The maximum aggregate amount of Subsidized Stafford and Unsubsidized Stafford Loans, including that portion of a Consolidation Loan used to repay such loans, which a dependent undergraduate student may have outstanding is $31,000 (of which only $23,000 may be Subsidized Stafford Loans). An independent undergraduate student may have an aggregate maximum of $57,500 (of which only $23,000 may be Subsidized Stafford Loans). The maximum aggregate amount of Subsidized Stafford and Unsubsidized Stafford Loans, including the portion of a Consolidation Loan used to repay such loans, for a graduate or professional student, including loans for undergraduate education, is $138,500, of which only $65,500 may be Subsidized Stafford Loans. In some instances, schools could certify loan amounts in excess of the limits, such as for certain health profession students.
A-6
Loan limits for PLUS Loans.
For PLUS Loans made on or after July 1, 1993, the annual amounts of PLUS Loans were limited only by the student's unmet need. There was no aggregate limit for PLUS Loans.
Repayment
Repayment periods.
Loans made under the Federal Family Education Loan Program, other than Consolidation Loans and loans being repaid under an income-based or extended repayment schedule, must provide for repayment of principal in periodic installments over a period of not less than five, nor more than ten years. A borrower may request, with concurrence of the lender, to repay the loan in less than five years with the right to subsequently extend the minimum repayment period to five years. Since the 1998 Amendments, lenders have been required to offer extended repayment schedules to new borrowers disbursed on or after October 7, 1998 who accumulate outstanding FFELP Loans of more than $30,000, in which case the repayment period may extend up to 25 years, subject to certain minimum repayment amounts. Consolidation Loans must be repaid within maximum repayment periods which vary depending upon the principal amount of the borrower's outstanding student loans, but may not exceed 30 years. For Consolidation Loans for which the application was received prior to January 1, 1993, the repayment period cannot exceed 25 years. Periods of authorized deferment and forbearance are excluded from the maximum repayment period. In addition, if the repayment schedule on a loan with a variable interest rate does not provide for adjustments to the amount of the monthly installment payment, the maximum repayment period may be extended for up to three years.
Repayment of principal on a Stafford Loan does not begin until a student drops below at least a half-time course of study. For Stafford Loans for which the applicable rate of interest is fixed at 7%, the repayment period begins between nine and twelve months after the borrower ceases to pursue at least a half-time course of study, as indicated in the promissory note. For other Stafford Loans, the repayment period begins six months after the borrower ceases to pursue at least a half-time course of study. These periods during which payments of principal are not due are the “grace periods.”
In the case of SLS, PLUS, and Consolidation Loans, the repayment period begins on the date of final disbursement of the loan, except that the borrower of a SLS Loan who also has a Stafford Loan may postpone repayment of the SLS Loan to coincide with the commencement of repayment of the Stafford Loan.
During periods in which repayment of principal is required, unless the borrower is repaying under an income-based repayment schedule, payments of principal and interest must in general be made at a rate of at least $600 per year, except that a borrower and lender may agree to a lesser rate at any time before or during the repayment period. However, at a minimum, the payments must satisfy the interest that accrues during the year. Borrowers may make accelerated payments at any time without penalty.
Income-sensitive repayment schedule.
Since 1993, lenders have been required to offer income-sensitive repayment schedules, in addition to standard and graduated repayment schedules, for Stafford, SLS, and Consolidation Loans. Beginning in 2000, lenders have been required to offer income-sensitive repayment schedules to PLUS borrowers as well. Use of income-sensitive repayment schedules may extend the maximum repayment period for up to five years if the payment amount established from the borrower's income will not repay the loan within the maximum applicable repayment period.
Income-based repayment schedule.
Effective July 1, 2009,
a borrower in the Federal Family Education Loan Program or Federal Direct Loan Program, other than a PLUS Loan made to a parent borrower or any Consolidation Loan that repaid one or more parent PLUS loans, may qualify for an income-based repayment schedule regardless of the disbursement dates of the loans if he or she has a partial financial hardship. A borrower has a financial hardship if the annual loan payment amount based on a 10-year repayment schedule exceeds 15% of the borrower's adjusted gross income, minus 150% of the poverty line for the borrower's actual family size. Interest will be paid by the Secretary of Education for subsidized loans for the first three years for any borrower whose scheduled monthly payment is not sufficient to cover the accrued interest. Interest will capitalize at the end of the partial financial hardship period, or when the borrower begins making payments under a standard repayment schedule. The Secretary of Education will cancel any outstanding balance after 25 years if a borrower who has made payments under this schedule meets certain criteria.
Deferment periods.
No principal payments need be made during certain periods of deferment prescribed by the Higher Education Act. For a borrower who first obtained a Stafford or SLS loan which was disbursed before July 1, 1993, deferments are available:
|
•
|
During a period not exceeding three years while the borrower is a member of the Armed Forces, an officer in the Commissioned Corps of the Public Health Service or, with respect to a borrower who first obtained a student loan disbursed on or after July 1, 1987, or a student loan for a period of enrollment beginning on or after July 1, 1987, an active duty member of the National Oceanic and Atmospheric Administration Corps;
|
A-7
|
•
|
During a period not exceeding three years while the borrower is a volunteer under the Peace Corps Act;
|
|
•
|
During a period not exceeding three years while the borrower is a full-time paid volunteer under the Domestic Volunteer Act of 1973;
|
|
•
|
During a period not exceeding three years while the borrower is a full-time volunteer in service which the Secretary of Education has determined is comparable to service in the Peace Corp or under the Domestic Volunteer Act of 1970 with an organization which is exempt from taxation under Section 501(c)(3) of the Internal Revenue Code;
|
|
•
|
During a period not exceeding two years while the borrower is serving an internship necessary to receive professional recognition required to begin professional practice or service, or a qualified internship or residency program;
|
|
•
|
During a period not exceeding three years while the borrower is temporarily totally disabled, as established by sworn affidavit of a qualified physician, or while the borrower is unable to secure employment because of caring for a dependent who is so disabled;
|
|
•
|
During a period not exceeding two years while the borrower is seeking and unable to find full-time employment;
|
|
•
|
During any period that the borrower is pursuing a full-time course of study at an eligible institution (or, with respect to a borrower who first obtained a student loan disbursed on or after July 1, 1987, or a student loan for a period of enrollment beginning on or after July 1, 1987, is pursuing at least a half-time course of study);
|
|
•
|
During any period that the borrower is pursuing a course of study in a graduate fellowship program;
|
|
•
|
During any period the borrower is receiving rehabilitation training services for qualified individuals, as defined by the Secretary of Education;
|
|
•
|
During a period not exceeding six months per request while the borrower is on parental leave; and
|
|
•
|
Only with respect to a borrower who first obtained a student loan disbursed on or after July 1, 1987, or a student loan for a period of enrollment beginning on or after July 1, 1987, during a period not exceeding three years while the borrower is a full-time teacher in a public or nonprofit private elementary or secondary school in a “teacher shortage area” (as prescribed by the Secretary of Education), and during a period not exceeding one year for mothers, with preschool age children, who are entering or re-entering the work force and who are paid at a rate of no more than $1 per hour more than the federal minimum wage.
|
For a borrower who first obtained a loan on or after July 1, 1993, deferments are available:
|
•
|
During any period that the borrower is pursuing at least a half-time course of study at an eligible institution;
|
|
•
|
During any period that the borrower is pursuing a course of study in a graduate fellowship program;
|
|
•
|
During any period the borrower is receiving rehabilitation training services for qualified individuals, as defined by the Secretary of Education;
|
|
•
|
During a period not exceeding three years while the borrower is seeking and unable to find full-time employment; and
|
|
•
|
During a period not exceeding three years for any reason which has caused or will cause the borrower economic hardship. Economic hardship includes working full-time and earning an amount that does not exceed the greater of the federal minimum wage or 150% of the poverty line applicable to a borrower's family size and state of residence. Additional categories of economic hardship are based on the receipt of payments from a state or federal public assistance program, service in the Peace Corps, or until July 1, 2009, the relationship between a borrower's educational debt burden and his or her income.
|
Effective October 1, 2007, a borrower serving on active duty during a war or other military operation or national emergency, or performing qualifying National Guard duty during a war or other military operation or national emergency may obtain a military
A-8
deferment for all outstanding Title IV loans in repayment. For all periods of active duty service that include October 1, 2007 or begin on or after that date, the deferment period includes the borrower's service period and 180 days following the demobilization date.
A borrower serving on or after October 1, 2007, may receive up to 13 months of active duty student deferment after the completion of military service if he or she meets the following conditions:
|
•
|
Is a National Guard member, Armed Forces reserves member, or retired member of the Armed Forces;
|
|
•
|
Is called or ordered to active duty; and
|
|
•
|
Is enrolled at the time of, or was enrolled within six months prior to, the activation in a program at an eligible institution.
|
The active duty student deferment ends the earlier of when the borrower returns to an enrolled status, or at the end of 13 months.
PLUS Loans first disbursed on or after July 1, 2008, are eligible for the following deferment options:
|
•
|
A parent PLUS borrower, upon request, may defer the repayment of the loan during any period during which the student for whom the loan was borrowed is enrolled at least half time. Also upon request, the borrower can defer the loan for the six-month period immediately following the date on which the student for whom the loan was borrowed ceases to be enrolled at least half time, or if the parent borrower is also a student, the date after he or she ceases to be enrolled at least half time.
|
|
•
|
A graduate or professional student PLUS borrower may defer the loan for the six-month period immediately following the date on which he or she ceases to be enrolled at least half time. This option does not require a request and may be granted each time the borrower ceases to be enrolled at least half time.
|
Prior to the 1992 Amendments, only some of the deferments described above were available to PLUS and Consolidation Loan borrowers. Prior to the 1986 Amendments, PLUS Loan borrowers were not entitled to certain deferments.
Forbearance periods.
The Higher Education Act also provides for periods of forbearance during which the lender, in case of a borrower's temporary financial hardship, may postpone any payments. A borrower is entitled to forbearance for a period not exceeding three years while the borrower's debt burden under Title IV of the Higher Education Act (which includes the Federal Family Education Loan Program) equals or exceeds 20% of the borrower's gross income. A borrower is also entitled to forbearance while he or she is serving in a qualifying internship or residency program, a “national service position” under the National and Community Service Trust Act of 1993, a qualifying position for loan forgiveness under the Teacher Loan Forgiveness Program, or a position that qualifies him or her for loan repayment under the Student Loan Repayment Program administered by the Department of Defense. In addition, administrative forbearances are provided in circumstances such as, but not limited to, a local or national emergency, a military mobilization, or when the geographical area in which the borrower or endorser resides has been designated a disaster area by the President of the United States or Mexico, the Prime Minister of Canada, or by the governor of a state.
Interest payments during grace, deferment, forbearance, and applicable income-based repayment ("IBR") periods.
The Secretary of Education makes interest payments on behalf of the borrower for Subsidized loans while the borrower is in school, grace, deferment, and during the first 3 years of the IBR plan for any remaining interest that is not satisfied by the IBR payment amount. Interest that accrues during forbearance periods, and, if the loan is not eligible for interest subsidy payments during school, grace, deferment, and IBR periods, may be paid monthly or quarterly by the borrower. Any unpaid accrued interest may be capitalized by the lender.
Fees
Guarantee fee and Federal default fee.
For loans for which the date of guarantee of principal was on or after July 1, 2006, a guarantee agency was required to collect and deposit into the Federal Student Loan Reserve Fund a Federal default fee in an amount equal to 1% of the principal amount of the loan. The fee was collected either by deduction from the proceeds of the loan or by payment from other non-Federal sources. Federal default fees could not be charged to borrowers of Consolidation Loans.
A-9
Origination fee
. Beginning with loans first disbursed on or after July 1, 2006, the maximum origination fee which could be charged to a Stafford Loan borrower decreased according to the following schedule:
|
•
|
1.5% with respect to loans for which the first disbursement was made on or after July 1, 2007, and before July 1, 2008;
|
|
•
|
1.0% with respect to loans for which the first disbursement was made on or after July 1, 2008, and before July 1, 2009; and
|
|
•
|
0.5% with respect to loans for which the first disbursement was made on or after July 1, 2009, and before July 1, 2010.
|
A lender could charge a lesser origination fee to Stafford Loan borrowers as long as the lender did so consistently with respect to all borrowers who resided in or attended school in a particular state. Regardless of whether the lender passed all or a portion of the origination fee on to the borrower, the lender had to pay the origination fee owed on each loan it made to the Secretary of Education.
An eligible lender was required to charge the borrower of a PLUS Loan an origination fee equal to 3% of the principal amount of the loan. This fee had to be deducted proportionately from each disbursement of the PLUS Loan and had to be remitted to the Secretary of Education.
Lender fee.
The lender of any loan made under the Federal Family Education Loan Program was required to pay a fee to the Secretary of Education. For loans made on or after October 1, 2007, the fee was equal to 1.0% of the principal amount of such loan. This fee could not be charged to the borrower.
Rebate fee on Consolidation Loans.
The holder of any Consolidation Loan made on or after October 1, 1993, was required to pay to the Secretary of Education a monthly rebate fee. For loans made on or after October 1, 1993, from applications received prior to October 1, 1998, and after January 31, 1999, the fee is equal to 0.0875% (1.05% per annum) of the principal and accrued interest on the Consolidation Loan. For loans made from applications received during the period beginning on or after October 1, 1998, through January 31, 1999, the fee is 0.0517% (0.62% per annum).
Interest subsidy payments
Interest subsidy payments are interest payments paid on the outstanding principal balance of an eligible loan before the time the loan enters repayment and during deferment periods. The Secretary of Education and the guarantee agencies enter into interest subsidy agreements whereby the Secretary of Education agrees to pay interest subsidy payments on a quarterly basis to the holders of eligible guaranteed loans for the benefit of students meeting certain requirements, subject to the holders' compliance with all requirements of the Higher Education Act. Subsidized Stafford Loans are eligible for interest payments. Consolidation Loans for which the application was received on or after January 1, 1993, are eligible for interest subsidy payments. Consolidation Loans made from applications received on or after August 10, 1993, are eligible for interest subsidy payments only if all underlying loans consolidated were Subsidized Stafford Loans. Consolidation Loans for which the application is received by an eligible lender on or after November 13, 1997, are eligible for interest subsidy payments on that portion of the Consolidation Loan that repaid subsidized FFELP Loans or similar subsidized loans made under the Direct Loan Program. The portion of the Consolidation Loan that repaid HEAL Loans is not eligible for interest subsidy, regardless of the date the Consolidation Loan was made.
Special allowance payments
The Higher Education Act provides for special allowance payments (SAP) to be made by the Secretary of Education to eligible lenders. The rates for special allowance payments are based on formulas that differ according to the type of loan, the date the loan was originally made or insured, and the type of funds used to finance the loan (taxable or tax-exempt).
Stafford Loans.
The effective formulas for special allowance payment rates for Subsidized Stafford and Unsubsidized Stafford Loans are summarized in the following chart. The T-Bill Rate mentioned in the chart refers to the average of the bond equivalent yield of the 91-day Treasury bills auctioned during the preceding quarter.
A-10
|
Date of Loans
|
Annualized SAP Rate
|
|
On or after October 1, 1981
|
T-Bill Rate less Applicable Interest Rate + 3.5%
|
|
On or after November 16, 1986
|
T-Bill Rate less Applicable Interest Rate + 3.25%
|
|
On or after October 1, 1992
|
T-Bill Rate less Applicable Interest Rate + 3.1%
|
|
On or after July 1, 1995
|
T-Bill Rate less Applicable Interest Rate + 3.1%
(1)
|
|
On or after July 1, 1998
|
T-Bill Rate less Applicable Interest Rate + 2.8%
(2)
|
|
On or after January 1, 2000
|
3 Month Commercial Paper Rate less Applicable Interest Rate + 2.34%
(3)(6)
|
|
On or after October 1, 2007 and held by a Department of Education certified not-for-profit holder or Eligible Lender Trustee holding on behalf of a Department of Education certified not-for-profit entity
|
3 Month Commercial Paper Rate less Applicable Interest Rate + 1.94%
(4)(6)
|
|
All other loans on or after October 1, 2007
|
3 Month Commercial Paper Rate less Applicable Interest Rate + 1.79%
(5)(6)
|
(1)
Substitute 2.5% in this formula while such loans are in-school, grace, or deferment status
(2)
Substitute 2.2% in this formula while such loans are in-school, grace, or deferment status.
(3)
Substitute 1.74% in this formula while such loans are in-school, grace, or deferment status.
(4)
Substitute 1.34% in this formula while such loans are in-school, grace, or deferment status.
(5)
Substitute 1.19% in this formula while such loans are in-school, grace, or deferment status.
(6)
The Military Construction and Veterans Affairs and Related Agencies Appropriations Act of 2012 provides an alternate calculation method that substitutes for 3 Month Commercial Paper Rate “1 Month London Inter Bank Offered Rate (LIBOR) for United States dollars in effect for each of the days in such quarter as compiled and released by the British Banker's Association." This method has to be selected by each lender or beneficial holder before April 1, 2012 and applies to all loans held under the same lender identification number for the quarter beginning April 1, 2012 and all succeeding 3-month periods.
PLUS, SLS, and Consolidation Loans.
The formula for special allowance payments on PLUS, SLS, and Consolidation Loans are as follows:
|
Date of Loans
|
Annualized SAP Rate
|
|
On or after October 1, 1992
|
T-Bill Rate less Applicable Interest Rate + 3.1%
|
|
On or after January 1, 2000
|
3 Month Commercial Paper Rate less Applicable Interest Rate + 2.64%
(1)
|
|
PLUS loans on or after October 1, 2007 and held by a Department of Education certified not-for-profit holder or Eligible Lender Trustee holding on behalf of a Department of Education certified not-for-profit entity
|
3 Month Commercial Paper Rate less Applicable Interest Rate + 1.94%
(1)
|
|
All other PLUS loans on or after October 1, 2007
|
3 Month Commercial Paper Rate less Applicable Interest Rate + 1.79%
(1)
|
|
Consolidation loans on or after October 1, 2007 and held by a Department of Education certified not-for-profit holder or Eligible Lender Trustee holding on behalf of a Department of Education certified not-for-profit entity
|
3 Month Commercial Paper Rate less Applicable Interest Rate + 2.24%
(1)
|
|
All other Consolidation loans on or after October 1, 2007
|
3 Month Commercial Paper Rate less Applicable Interest Rate + 2.09%
(1)
|
(1)
The Military Construction and Veterans Affairs and Related Agencies Appropriations Act of 2012 provides an alternate calculation method that substitutes for 3 Month Commercial Paper Rate “1 Month London Inter Bank Offered Rate (LIBOR) for United States dollars in effect for each of the days in such quarter as compiled and released by the British Banker's Association." This method has to be selected by each lender or beneficial holder before April 1, 2012 and applies to all loans held under the same lender identification number for the quarter beginning April 1, 2012 and all succeeding 3-month periods.
A-11
For PLUS and SLS Loans made prior to July 1, 1994, and PLUS loans made on or after July 1, 1998, which bear interest at rates adjusted annually, special allowance payments are made only in quarters during which the interest rate ceiling on such loans operates to reduce the rate that would otherwise apply based upon the applicable formula. See “Interest Rates for PLUS Loans” and “Interest Rates for SLS Loans.” Special allowance payments are available on variable rate PLUS Loans and SLS Loans made on or after July 1, 1987, and before July 1, 1994, and on any PLUS Loans made on or after July 1, 1998, and before January 1, 2000, only if the variable rate, which is reset annually, based on the weekly average one-year constant maturity Treasury yield for loans made before July 1, 1998, and based on the 91-day or 52-week Treasury bill, as applicable for loans made on or after July 1, 1998, exceeds the applicable maximum borrower rate. The maximum borrower rate is between 9% and 12% per annum. The portion, if any, of a Consolidation Loan that repaid a HEAL Loan is ineligible for special allowance payments.
Recapture of excess interest
. The Higher Education Reconciliation Act of 2005 provides that, with respect to a loan for which the first disbursement of principal was made on or after April 1, 2006, if the applicable interest rate for any three-month period exceeds the special allowance support level applicable to the loan for that period, an adjustment must be made by calculating the excess interest and crediting such amounts to the Secretary of Education not less often than annually. The amount of any adjustment of interest for any quarter will be equal to:
|
•
|
The applicable interest rate minus the special allowance support level for the loan, multiplied by
|
|
•
|
The average daily principal balance of the loan during the quarter, divided by
|
|
•
|
Four.
|
Special allowance payments for loans financed by tax-exempt bonds
. The effective formulas for special allowance payment rates for Stafford Loans and Unsubsidized Stafford Loans differ depending on whether loans to borrowers were acquired or originated with the proceeds of tax-exempt obligations. The formula for special allowance payments for loans financed with the proceeds of tax-exempt obligations originally issued prior to October 1, 1993 is:
T-Bill Rate less Applicable Interest Rate + 3.5%
2
provided
that the special allowance applicable to the loans may not be less than 9.5% less the Applicable Interest Rate. Special rules apply with respect to special allowance payments made on loans
|
•
|
Originated or acquired with funds obtained from the refunding of tax-exempt obligations issued prior to October 1, 1993, or
|
|
•
|
Originated or acquired with funds obtained from collections on other loans made or purchased with funds obtained from tax-exempt obligations initially issued prior to October 1, 1993.
|
Amounts derived from recoveries of principal on loans eligible to receive a minimum 9.5% special allowance payment may only be used to originate or acquire additional loans by a unit of a state or local government, or non-profit entity not owned or controlled by or under common ownership of a for-profit entity and held directly or through any subsidiary, affiliate or trustee, which entity has a total unpaid balance of principal equal to or less than $100,000,000 on loans for which special allowances were paid in the most recent quarterly payment prior to September 30, 2005. Such entities may originate or acquire additional loans with amounts derived from recoveries of principal until December 31, 2010. Loans acquired with the proceeds of tax-exempt obligations originally issued after October 1, 1993, receive special allowance payments made on other loans. Beginning October 1, 2006, in order to receive 9.5% special allowance payments, a lender must undergo an audit arranged by the Secretary of Education attesting to proper billing for 9.5% payments on only eligible “first generation” and “second generation” loans. First generation loans include those loans acquired using funds directly from the issuance of the tax-exempt obligation. Second-generation loans include only those loans acquired using funds obtained directly from first-generation loans. Furthermore, the lender must certify compliance of its 9.5% billing on such loans with each request for payment.
Adjustments to special allowance payments
.
Special allowance payments and interest subsidy payments are reduced by the amount which the lender is authorized or required to charge as an origination fee. In addition, the amount of the lender origination fee is collected by offset to special allowance payments and interest subsidy payments. The Higher Education Act provides that if special allowance payments or interest subsidy payments have not been made within 30 days after the Secretary of Education receives an accurate, timely, and complete request, the special allowance payable to the lender must be increased by an amount equal to the daily interest accruing on the special allowance and interest subsidy payments due the lender.
A-12
TABLE OF CONTENTS
Part IItem 1. BusinessItem 1A. Risk FactorsItem 1B. Unresolved Staff CommentsItem 2. PropertiesItem 3. Legal ProceedingsItem 4. Mine Safety DisclosuresPart IIItem 5. Market For Registrant's Common Equity, Related Stockholder Matters, and Issuer Purchases Of Equity SecuritiesItem 6. Selected Financial DataItem 7. Management S Discussion and Analysis Of Financial Condition and Results Of OperationsItem 7A. Quantitative and Qualitative Disclosures About Market RiskItem 8. Financial Statements and Supplementary DataItem 9. Changes in and Disagreements with Accountants on Accounting and FinancialItem 9A. Controls and ProceduresItem 9B. Other InformationPart IIIItem 10. Directors, Executive Officers, and Corporate GovernanceItem 11. Executive CompensationItem 12. Security Ownership Of Certain Beneficial Owners and Management and Related Stockholder MattersItem 13. Certain Relationships and Related Transactions, and Director IndependenceItem 14. Principal Accounting Fees and ServicesPart IVItem 15. Exhibits and Financial Statement SchedulesItem 16. Form 10-k Summary