NELNET INC
10-Ks and 10-Qs
|
|
|
|
|
|
|
|
|
|
|
|
|
|
|
|
|
|
|
|
|
|
|
|
|
|
|
|
|
|
|
|
|
|
|
|
|
|
|
|
|
|
|
|
|
|
|
|
|
|
|
|
|
|
|
|
UNITED STATES
SECURITIES AND EXCHANGE COMMISSION
WASHINGTON, D.C. 20549
FORM
10-Q
(Mark One)
|
|
QUARTERLY REPORT PURSUANT TO SECTION 13 OR 15(d) OF THE SECURITIES EXCHANGE ACT OF 1934 | ||||
For the quarterly period ended
September 30, 2022
or
|
|
TRANSITION REPORT PURSUANT TO SECTION 13 OR 15(d) OF THE SECURITIES EXCHANGE ACT OF 1934 | ||||
For the transition period from
to
.
Commission File Number:
001-31924

(Exact name of registrant as specified in its charter)
|
|
|
||||||||||
|
(State or other jurisdiction of incorporation or organization)
|
(I.R.S. Employer Identification No.)
|
||||||||||
|
|
|||||||||||
|
|
|
|
|||||||||
|
(Address of principal executive offices)
|
(Zip Code)
|
||||||||||
(
402
)
458-2370
(Registrant’s telephone number, including area code)
Securities registered pursuant to Section 12(b) of the Act:
| Title of each class | Trading Symbol | Name of each exchange on which registered | ||||||
|
|
|
|
||||||
Indicate by check mark whether the registrant (1) has filed all reports required to be filed by Section 13 or 15(d) of the Securities Exchange Act of 1934 during the preceding 12 months (or for such shorter period that the registrant was required to file such reports), and (2) has been subject to such filing requirements for the past 90 days.
Yes
☒
No
☐
Indicate by check mark whether the registrant has submitted electronically every Interactive Data File required to be submitted pursuant to Rule 405 of Regulation S-T (§232.405 of this chapter) during the preceding 12 months (or for such shorter period that the registrant was required to submit such files).
Yes
☒
No
☐
Indicate by check mark whether the registrant is a large accelerated filer, an accelerated filer, a non-accelerated filer, a smaller reporting company, or an emerging growth company. See the definitions of “large accelerated filer,” “accelerated filer,” “smaller reporting company,” and "emerging growth company" in Rule 12b-2 of the Exchange Act.
Non-accelerated filer
☐
Smaller reporting company
☐
Emerging growth company
☐
If an emerging growth company, indicate by check mark if the registrant has elected not to use the extended transition period for complying with any new or revised financial accounting standards provided pursuant to Section 13(a) of the Exchange Act.
☐
Indicate by check mark whether the registrant is a shell company (as defined in Rule 12b-2 of the Exchange Act). Yes
☐
No
☒
As of October 31, 2022, there were
26,437,070
and
10,673,659
shares of Class A Common Stock and Class B Common Stock, par value $0.01 per share, outstanding, respectively (excluding a total of 11,305,731 shares of Class A Common Stock held by wholly owned subsidiaries).
NELNET, INC.
FORM 10-Q
INDEX
September 30, 2022
| Item 1. | |||||||||||
| Item 2. | |||||||||||
| Item 3. | |||||||||||
| Item 4. | |||||||||||
| Item 1. | |||||||||||
| Item 1A. | |||||||||||
| Item 2. | |||||||||||
| Item 6. | |||||||||||
PART I. FINANCIAL INFORMATION
ITEM 1. FINANCIAL STATEMENTS
| NELNET, INC. AND SUBSIDIARIES | |||||||||||
| CONSOLIDATED BALANCE SHEETS | |||||||||||
| (Dollars in thousands, except share data) | |||||||||||
| (unaudited) | |||||||||||
|
As of
|
As of
|
||||||||||
| September 30, 2022 | December 31, 2021 | ||||||||||
| Assets: | |||||||||||
|
Loans and accrued interest receivable (net of allowance for loan losses of $
$
|
$ |
|
|
||||||||
| Cash and cash equivalents: | |||||||||||
| Cash and cash equivalents - not held at a related party |
|
|
|||||||||
| Cash and cash equivalents - held at a related party |
|
|
|||||||||
| Total cash and cash equivalents |
|
|
|||||||||
| Investments and notes receivable |
|
|
|||||||||
| Restricted cash |
|
|
|||||||||
| Restricted cash - due to customers |
|
|
|||||||||
|
Accounts receivable (net of allowance for doubtful accounts of $
|
|
|
|||||||||
| Goodwill |
|
|
|||||||||
| Intangible assets, net |
|
|
|||||||||
| Property and equipment, net |
|
|
|||||||||
| Other assets |
|
|
|||||||||
| Total assets | $ |
|
|
||||||||
| Liabilities: | |||||||||||
| Bonds and notes payable | $ |
|
|
||||||||
| Accrued interest payable |
|
|
|||||||||
| Bank deposits |
|
|
|||||||||
| Other liabilities |
|
|
|||||||||
| Due to customers |
|
|
|||||||||
| Total liabilities |
|
|
|||||||||
| Commitments and contingencies |
|
|
|||||||||
| Equity: | |||||||||||
| Nelnet, Inc. shareholders' equity: | |||||||||||
|
Preferred stock, $
|
|
|
|||||||||
| Common stock: | |||||||||||
|
Class A, $
shares and
|
|
|
|||||||||
|
Class B, convertible, $
|
|
|
|||||||||
| Additional paid-in capital |
|
|
|||||||||
| Retained earnings |
|
|
|||||||||
| Accumulated other comprehensive (loss) earnings, net |
(
|
|
|||||||||
| Total Nelnet, Inc. shareholders' equity |
|
|
|||||||||
| Noncontrolling interests |
(
|
|
|||||||||
| Total equity |
|
|
|||||||||
| Total liabilities and equity | $ |
|
|
||||||||
|
Supplemental information - assets and liabilities of consolidated education lending
variable interest entities: |
|||||||||||
| Loans and accrued interest receivable | $ |
|
|
||||||||
| Restricted cash |
|
|
|||||||||
| Bonds and notes payable |
(
|
(
|
|||||||||
| Accrued interest payable and other liabilities |
(
|
(
|
|||||||||
| Net assets of consolidated education lending variable interest entities | $ |
|
|
||||||||
See accompanying notes to consolidated financial statements.
2
| NELNET, INC. AND SUBSIDIARIES | |||||||||||||||||||||||
| CONSOLIDATED STATEMENTS OF INCOME | |||||||||||||||||||||||
| (Dollars in thousands, except share data) | |||||||||||||||||||||||
| (unaudited) | |||||||||||||||||||||||
| Three months ended | Nine months ended | ||||||||||||||||||||||
| September 30, | September 30, | ||||||||||||||||||||||
| 2022 | 2021 | 2022 | 2021 | ||||||||||||||||||||
| Interest income: | |||||||||||||||||||||||
| Loan interest | $ |
|
|
|
|
||||||||||||||||||
| Investment interest |
|
|
|
|
|||||||||||||||||||
| Total interest income |
|
|
|
|
|||||||||||||||||||
| Interest expense on bonds and notes payable and bank deposits |
|
|
|
|
|||||||||||||||||||
| Net interest income |
|
|
|
|
|||||||||||||||||||
| Less provision (negative provision) for loan losses |
|
|
|
(
|
|||||||||||||||||||
| Net interest income after provision for loan losses |
|
|
|
|
|||||||||||||||||||
| Other income/expense: | |||||||||||||||||||||||
| Loan servicing and systems revenue |
|
|
|
|
|||||||||||||||||||
| Education technology, services, and payment processing revenue |
|
|
|
|
|||||||||||||||||||
| Solar construction revenue |
|
|
|
|
|||||||||||||||||||
| Other |
|
|
|
|
|||||||||||||||||||
| Gain on sale of loans |
|
|
|
|
|||||||||||||||||||
| Impairment expense and provision for beneficial interests, net |
|
(
|
(
|
(
|
|||||||||||||||||||
| Derivative market value adjustments and derivative settlements, net |
|
|
|
|
|||||||||||||||||||
| Total other income/expense |
|
|
|
|
|||||||||||||||||||
| Cost of services: | |||||||||||||||||||||||
| Cost to provide education technology, services, and payment processing services |
|
|
|
|
|||||||||||||||||||
| Cost to provide solar construction services |
|
|
|
|
|||||||||||||||||||
| Total cost of services |
|
|
|
|
|||||||||||||||||||
| Operating expenses: | |||||||||||||||||||||||
| Salaries and benefits |
|
|
|
|
|||||||||||||||||||
| Depreciation and amortization |
|
|
|
|
|||||||||||||||||||
| Other expenses |
|
|
|
|
|||||||||||||||||||
| Total operating expenses |
|
|
|
|
|||||||||||||||||||
| Income before income taxes |
|
|
|
|
|||||||||||||||||||
| Income tax expense |
|
|
|
|
|||||||||||||||||||
| Net income |
|
|
|
|
|||||||||||||||||||
| Net loss attributable to noncontrolling interests |
|
|
|
|
|||||||||||||||||||
| Net income attributable to Nelnet, Inc. | $ |
|
|
|
|
||||||||||||||||||
| Earnings per common share: | |||||||||||||||||||||||
|
Net income attributable to Nelnet, Inc. shareholders - basic and diluted
|
$ |
|
|
|
|
||||||||||||||||||
|
Weighted average common shares outstanding - basic and diluted
|
|
|
|
|
|||||||||||||||||||
See accompanying notes to consolidated financial statements.
3
| NELNET, INC. AND SUBSIDIARIES | |||||||||||||||||||||||||||||||||||||||||||||||
| CONSOLIDATED STATEMENTS OF COMPREHENSIVE INCOME | |||||||||||||||||||||||||||||||||||||||||||||||
| (Dollars in thousands) | |||||||||||||||||||||||||||||||||||||||||||||||
| (unaudited) | |||||||||||||||||||||||||||||||||||||||||||||||
| Three months ended September 30, | Nine months ended September 30, | ||||||||||||||||||||||||||||||||||||||||||||||
| 2022 | 2021 | 2022 | 2021 | ||||||||||||||||||||||||||||||||||||||||||||
| Net income | $ |
|
|
|
|
||||||||||||||||||||||||||||||||||||||||||
| Other comprehensive income (loss): | |||||||||||||||||||||||||||||||||||||||||||||||
| Net changes related to foreign currency translation adjustments | $ |
|
(
|
|
(
|
||||||||||||||||||||||||||||||||||||||||||
| Net changes related to available-for-sale debt securities: | |||||||||||||||||||||||||||||||||||||||||||||||
| Unrealized holding gains (losses) arising during period, net |
|
|
(
|
|
|||||||||||||||||||||||||||||||||||||||||||
| Reclassification of gains recognized in net income, net of losses |
(
|
(
|
(
|
(
|
|||||||||||||||||||||||||||||||||||||||||||
| Income tax effect |
(
|
|
(
|
|
|
(
|
(
|
|
|||||||||||||||||||||||||||||||||||||||
| Other comprehensive income (loss) |
|
|
(
|
|
|||||||||||||||||||||||||||||||||||||||||||
| Comprehensive income |
|
|
|
|
|||||||||||||||||||||||||||||||||||||||||||
| Comprehensive loss attributable to noncontrolling interests |
|
|
|
|
|||||||||||||||||||||||||||||||||||||||||||
| Comprehensive income attributable to Nelnet, Inc. | $ |
|
|
|
|
||||||||||||||||||||||||||||||||||||||||||
See accompanying notes to consolidated financial statements.
4
|
NELNET, INC. AND SUBSIDIARIES
|
|||||||||||||||||||||||||||||||||||||||||||||||||||||||||||||||||
|
CONSOLIDATED STATEMENTS OF SHAREHOLDERS' EQUITY
|
|||||||||||||||||||||||||||||||||||||||||||||||||||||||||||||||||
|
(Dollars in thousands, except share data)
|
|||||||||||||||||||||||||||||||||||||||||||||||||||||||||||||||||
|
(unaudited)
|
|||||||||||||||||||||||||||||||||||||||||||||||||||||||||||||||||
|
Nelnet, Inc. Shareholders
|
|||||||||||||||||||||||||||||||||||||||||||||||||||||||||||||||||
| Preferred stock shares | Common stock shares | Preferred stock | Class A common stock | Class B common stock | Additional paid-in capital | Retained earnings | Accumulated other comprehensive (loss) earnings | Noncontrolling interests | Total equity | ||||||||||||||||||||||||||||||||||||||||||||||||||||||||
| Class A | Class B | ||||||||||||||||||||||||||||||||||||||||||||||||||||||||||||||||
| Balance as of June 30, 2021 |
|
|
|
$ |
|
|
|
|
|
|
(
|
|
|||||||||||||||||||||||||||||||||||||||||||||||||||||
| Issuance of noncontrolling interests | — | — | — | — | — | — | — | — | — |
|
|
||||||||||||||||||||||||||||||||||||||||||||||||||||||
| Net income (loss) | — | — | — | — | — | — | — |
|
— |
(
|
|
||||||||||||||||||||||||||||||||||||||||||||||||||||||
| Other comprehensive income | — | — | — | — | — | — | — | — |
|
— |
|
||||||||||||||||||||||||||||||||||||||||||||||||||||||
| Distribution to noncontrolling interests | — | — | — | — | — | — | — | — | — |
(
|
(
|
||||||||||||||||||||||||||||||||||||||||||||||||||||||
|
Cash dividends on Class A and Class B common stock - $
|
— | — | — | — | — | — | — |
(
|
— | — |
(
|
||||||||||||||||||||||||||||||||||||||||||||||||||||||
| Issuance of common stock, net of forfeitures | — |
|
— | — | — | — |
|
— | — | — |
|
||||||||||||||||||||||||||||||||||||||||||||||||||||||
| Compensation expense for stock based awards | — | — | — | — | — | — |
|
— | — | — |
|
||||||||||||||||||||||||||||||||||||||||||||||||||||||
| Repurchase of common stock | — |
(
|
— | — |
(
|
— |
(
|
(
|
— | — |
(
|
||||||||||||||||||||||||||||||||||||||||||||||||||||||
| Conversion of common stock | — |
|
(
|
— |
|
(
|
— | — | — | — |
|
||||||||||||||||||||||||||||||||||||||||||||||||||||||
| Balance as of September 30, 2021 |
|
|
|
$ |
|
|
|
|
|
|
(
|
|
|||||||||||||||||||||||||||||||||||||||||||||||||||||
| Balance as of June 30, 2022 |
|
|
|
$ |
|
|
|
|
|
(
|
(
|
|
|||||||||||||||||||||||||||||||||||||||||||||||||||||
| Issuance of noncontrolling interests | — | — | — | — | — | — | — | — | — |
|
|
||||||||||||||||||||||||||||||||||||||||||||||||||||||
| Net income (loss) | — | — | — | — | — | — | — |
|
— |
(
|
|
||||||||||||||||||||||||||||||||||||||||||||||||||||||
| Other comprehensive income | — | — | — | — | — | — | — | — |
|
— |
|
||||||||||||||||||||||||||||||||||||||||||||||||||||||
| Distribution to noncontrolling interests | — | — | — | — | — | — | — | — | — |
(
|
(
|
||||||||||||||||||||||||||||||||||||||||||||||||||||||
|
Cash dividends on Class A and Class B common stock - $
|
— | — | — | — | — | — | — |
(
|
— | — |
(
|
||||||||||||||||||||||||||||||||||||||||||||||||||||||
| Issuance of common stock, net of forfeitures | — |
|
— | — |
|
— |
|
— | — | — |
|
||||||||||||||||||||||||||||||||||||||||||||||||||||||
| Compensation expense for stock based awards | — | — | — | — | — | — |
|
— | — | — |
|
||||||||||||||||||||||||||||||||||||||||||||||||||||||
| Repurchase of common stock | — |
(
|
— | — |
(
|
— |
(
|
(
|
— | — |
(
|
||||||||||||||||||||||||||||||||||||||||||||||||||||||
| Conversion of common stock | — |
|
(
|
— | — | — | — | — | — | — |
|
||||||||||||||||||||||||||||||||||||||||||||||||||||||
| Other | — | — | — | — | — | — | — |
(
|
— | — |
(
|
||||||||||||||||||||||||||||||||||||||||||||||||||||||
| Balance as of September 30, 2022 |
|
|
|
$ |
|
|
|
|
|
(
|
(
|
|
|||||||||||||||||||||||||||||||||||||||||||||||||||||
See accompanying notes to consolidated financial statements.
5
|
NELNET, INC. AND SUBSIDIARIES
|
|||||||||||||||||||||||||||||||||||||||||||||||||||||||||||||||||
|
CONSOLIDATED STATEMENTS OF SHAREHOLDERS' EQUITY
|
|||||||||||||||||||||||||||||||||||||||||||||||||||||||||||||||||
|
(Dollars in thousands, except share data)
|
|||||||||||||||||||||||||||||||||||||||||||||||||||||||||||||||||
|
(unaudited)
|
|||||||||||||||||||||||||||||||||||||||||||||||||||||||||||||||||
|
Nelnet, Inc. Shareholders
|
|||||||||||||||||||||||||||||||||||||||||||||||||||||||||||||||||
| Preferred stock shares | Common stock shares | Preferred stock | Class A common stock | Class B common stock | Additional paid-in capital | Retained earnings | Accumulated other comprehensive (loss) earnings | Noncontrolling interests | Total equity | ||||||||||||||||||||||||||||||||||||||||||||||||||||||||
| Class A | Class B | ||||||||||||||||||||||||||||||||||||||||||||||||||||||||||||||||
| Balance as of December 31, 2020 |
|
|
|
$ |
|
|
|
|
|
|
(
|
|
|||||||||||||||||||||||||||||||||||||||||||||||||||||
| Issuance of noncontrolling interests | — | — | — | — | — | — | — | — | — |
|
|
||||||||||||||||||||||||||||||||||||||||||||||||||||||
| Net income (loss) | — | — | — | — | — | — | — |
|
— |
(
|
|
||||||||||||||||||||||||||||||||||||||||||||||||||||||
| Other comprehensive income | — | — | — | — | — | — | — | — |
|
— |
|
||||||||||||||||||||||||||||||||||||||||||||||||||||||
| Distribution to noncontrolling interests | — | — | — | — | — | — | — | — | — |
(
|
(
|
||||||||||||||||||||||||||||||||||||||||||||||||||||||
|
Cash dividends on Class A and Class B common stock - $
|
— | — | — | — | — | — | — |
(
|
— | — |
(
|
||||||||||||||||||||||||||||||||||||||||||||||||||||||
| Issuance of common stock, net of forfeitures | — |
|
— | — |
|
— |
|
— | — | — |
|
||||||||||||||||||||||||||||||||||||||||||||||||||||||
| Compensation expense for stock based awards | — | — | — | — | — | — |
|
— | — | — |
|
||||||||||||||||||||||||||||||||||||||||||||||||||||||
| Repurchase of common stock | — |
(
|
— | — |
(
|
— |
(
|
(
|
— | — |
(
|
||||||||||||||||||||||||||||||||||||||||||||||||||||||
| Conversion of common stock | — |
|
(
|
— |
|
(
|
— | — | — | — |
|
||||||||||||||||||||||||||||||||||||||||||||||||||||||
| Balance as of September 30, 2021 |
|
|
|
$ |
|
|
|
|
|
|
(
|
|
|||||||||||||||||||||||||||||||||||||||||||||||||||||
| Balance as of December 31, 2021 |
|
|
|
$ |
|
|
|
|
|
|
|
|
|||||||||||||||||||||||||||||||||||||||||||||||||||||
| Issuance of noncontrolling interests | — | — | — | — | — | — | — | — | — |
|
|
||||||||||||||||||||||||||||||||||||||||||||||||||||||
| Net income (loss) | — | — | — | — | — | — | — |
|
— |
(
|
|
||||||||||||||||||||||||||||||||||||||||||||||||||||||
| Other comprehensive loss | — | — | — | — | — | — | — | — |
(
|
— |
(
|
||||||||||||||||||||||||||||||||||||||||||||||||||||||
| Distribution to noncontrolling interests | — | — | — | — | — | — | — | — | — |
(
|
(
|
||||||||||||||||||||||||||||||||||||||||||||||||||||||
|
Cash dividends on Class A and Class B common stock - $
|
— | — | — | — | — | — | — |
(
|
— | — |
(
|
||||||||||||||||||||||||||||||||||||||||||||||||||||||
| Issuance of common stock, net of forfeitures | — |
|
— | — |
|
— |
|
— | — | — |
|
||||||||||||||||||||||||||||||||||||||||||||||||||||||
| Compensation expense for stock based awards | — | — | — | — | — |
|
— | — | — |
|
|||||||||||||||||||||||||||||||||||||||||||||||||||||||
| Repurchase of common stock | — |
(
|
— | — |
(
|
— |
(
|
(
|
— | — |
(
|
||||||||||||||||||||||||||||||||||||||||||||||||||||||
| Conversion of common stock | — |
|
(
|
— | — | — | — | — | — | — |
|
||||||||||||||||||||||||||||||||||||||||||||||||||||||
| Other | — | — | — | — | — | — | — |
(
|
— | — |
(
|
||||||||||||||||||||||||||||||||||||||||||||||||||||||
| Balance as of September 30, 2022 |
|
|
|
$ |
|
|
|
|
|
(
|
(
|
|
|||||||||||||||||||||||||||||||||||||||||||||||||||||
See accompanying notes to consolidated financial statements.
6
| NELNET, INC. AND SUBSIDIARIES | |||||||||||
| CONSOLIDATED STATEMENTS OF CASH FLOWS | |||||||||||
| (Dollars in thousands) | |||||||||||
| (unaudited) | |||||||||||
| Nine months ended | |||||||||||
| September 30, | |||||||||||
| 2022 | 2021 | ||||||||||
| Net income attributable to Nelnet, Inc. | $ |
|
|
||||||||
| Net loss attributable to noncontrolling interests |
(
|
(
|
|||||||||
| Net income |
|
|
|||||||||
| Adjustments to reconcile net income to net cash provided by operating activities, net of business acquisitions: | |||||||||||
| Depreciation and amortization, including debt discounts and loan premiums and deferred origination costs |
|
|
|||||||||
| Loan discount accretion |
(
|
(
|
|||||||||
| Provision (negative provision) for loan losses |
|
(
|
|||||||||
| Derivative market value adjustments |
(
|
(
|
|||||||||
| Proceeds from termination of derivative instruments, net |
|
|
|||||||||
| Proceeds from clearinghouse - initial and variation margin, net of payments |
|
|
|||||||||
| Gain on sale of loans |
(
|
(
|
|||||||||
| Loss (gain) on investments, net |
|
(
|
|||||||||
| (Gain) loss from repurchases of debt, net |
(
|
|
|||||||||
| Proceeds from sale (purchases) of equity securities, net |
|
(
|
|||||||||
| Deferred income tax expense |
|
|
|||||||||
| Non-cash compensation expense |
|
|
|||||||||
| Provision for beneficial interests and impairment expense, net |
|
|
|||||||||
| Increase in loan and investment accrued interest receivable |
(
|
(
|
|||||||||
| Decrease (increase) in accounts receivable |
|
(
|
|||||||||
| (Increase) decrease in other assets, net |
(
|
|
|||||||||
| Decrease in the carrying amount of ROU asset, net |
|
|
|||||||||
| Increase (decrease) in accrued interest payable |
|
(
|
|||||||||
| Increase in other liabilities, net |
|
|
|||||||||
| Decrease in the carrying amount of lease liability |
(
|
(
|
|||||||||
| Net cash provided by operating activities |
|
|
|||||||||
| Cash flows from investing activities, net of business acquisitions: |
|
|
|||||||||
| Purchases and originations of loans |
(
|
(
|
|||||||||
| Purchases of loans from a related party |
(
|
(
|
|||||||||
| Net proceeds from loan repayments, claims, and capitalized interest |
|
|
|||||||||
| Proceeds from sale of loans |
|
|
|||||||||
| Purchases of available-for-sale securities |
(
|
(
|
|||||||||
| Proceeds from sales of available-for-sale securities |
|
|
|||||||||
| Proceeds from beneficial interest in loan securitizations |
|
|
|||||||||
| Purchases of other investments and issuance of notes receivable |
(
|
(
|
|||||||||
| Proceeds from other investments |
|
|
|||||||||
| Purchases of property and equipment |
(
|
(
|
|||||||||
| Business acquisitions, net of cash acquired |
(
|
|
|||||||||
| Net cash provided by investing activities |
|
|
|||||||||
7
| NELNET, INC. AND SUBSIDIARIES | |||||||||||
| CONSOLIDATED STATEMENTS OF CASH FLOWS (Continued) | |||||||||||
| Nine months ended | |||||||||||
| September 30, | |||||||||||
| 2022 | 2021 | ||||||||||
| Cash flows from financing activities, net of business acquisitions: | |||||||||||
| Payments on bonds and notes payable | $ |
(
|
(
|
||||||||
| Proceeds from issuance of bonds and notes payable |
|
|
|||||||||
| Payments of debt issuance costs |
(
|
(
|
|||||||||
| Increase in bank deposits, net |
|
|
|||||||||
| (Decrease) increase in due to customers |
(
|
|
|||||||||
| Dividends paid |
(
|
(
|
|||||||||
| Repurchases of common stock |
(
|
(
|
|||||||||
| Proceeds from issuance of common stock |
|
|
|||||||||
| Issuance of noncontrolling interests |
|
|
|||||||||
| Distribution to noncontrolling interests |
(
|
(
|
|||||||||
| Net cash used in financing activities |
(
|
(
|
|||||||||
| Effect of exchange rate changes on cash |
(
|
(
|
|||||||||
| Net (decrease) increase in cash, cash equivalents, and restricted cash |
(
|
|
|||||||||
| Cash, cash equivalents, and restricted cash, beginning of period |
|
|
|||||||||
| Cash, cash equivalents, and restricted cash, end of period | $ |
|
|
||||||||
| Supplemental disclosures of cash flow information: | |||||||||||
| Cash disbursements made for interest | $ |
|
|
||||||||
| Cash disbursements made for income taxes, net of refunds and credits received (a) | $ |
|
|
||||||||
| Cash disbursements made for operating leases | $ |
|
|
||||||||
| Non-cash operating, investing, and financing activity: | |||||||||||
| ROU assets obtained in exchange for lease obligations | $ |
|
|
||||||||
| Receipt of beneficial interest in consumer loan securitizations | $ |
|
|
||||||||
| Distribution to noncontrolling interests | $ |
|
|
||||||||
| Issuance of noncontrolling interests | $ |
|
|
||||||||
(a)
The Company utilized $
9.4
million and $
22.2
million of federal and state tax credits related primarily to renewable energy during the nine months ended September 30, 2022 and 2021, respectively.
Supplemental disclosures of noncash activities regarding the Company's business acquisitions are contained in note 6.
The following table provides a reconciliation of cash, cash equivalents, and restricted cash reported in the consolidated balance sheets to the total of the amounts reported in the consolidated statements of cash flows.
| As of | As of | As of | As of | ||||||||||||||||||||
| September 30, 2022 | December 31, 2021 | September 30, 2021 | December 31, 2020 | ||||||||||||||||||||
| Total cash and cash equivalents | $ |
|
|
|
|
||||||||||||||||||
| Restricted cash |
|
|
|
|
|||||||||||||||||||
| Restricted cash - due to customers |
|
|
|
|
|||||||||||||||||||
|
Cash, cash equivalents, and restricted cash
|
$ |
|
|
|
|
||||||||||||||||||
See accompanying notes to consolidated financial statements.
8
NELNET, INC. AND SUBSIDIARIES
NOTES TO CONSOLIDATED FINANCIAL STATEMENTS
(Dollars in thousands, except per share amounts, unless otherwise noted)
(unaudited)
1.
Basis of Financial Reporting
Reclassification of Prior Period Cash Flows Presentation
Prior to June 30, 2022, the line item in the Company's consolidated statements of cash flows for changes during a period in amounts "due to customers" was presented in cash flows from operating activities. Beginning in the Company's Quarterly Report on Form 10-Q for the quarter ended June 30, 2022, the Company corrected this presentation in its statements of cash flows to show this activity as a financing activity. This correction had no impact on the Company's previously reported consolidated net income, total assets (including cash and cash equivalents), liabilities, and equity, and while the correction had a corresponding impact on the amounts of cash flows from operating and financing activities, it had no impact on the net increase or decrease in cash for previously reported periods. The Company has concluded that the correction was not material from a combined quantitative and qualitative perspective to its previously issued interim financial statements, or its previously issued financial statements for 2021, 2020, and 2019.
9
2.
Loans and Accrued Interest Receivable and Allowance for Loan Losses
Loans and accrued interest receivable consisted of the following:
| As of | As of | ||||||||||
| September 30, 2022 | December 31, 2021 | ||||||||||
| Non-Nelnet Bank: | |||||||||||
| Federally insured student loans: | |||||||||||
| Stafford and other | $ |
|
|
||||||||
| Consolidation |
|
|
|||||||||
| Total |
|
|
|||||||||
| Private education loans |
|
|
|||||||||
| Consumer and other loans |
|
|
|||||||||
| Non-Nelnet Bank loans |
|
|
|||||||||
| Nelnet Bank: | |||||||||||
| Federally insured student loans |
|
|
|||||||||
| Private education loans |
|
|
|||||||||
| Nelnet Bank loans |
|
|
|||||||||
| Accrued interest receivable |
|
|
|||||||||
| Loan discount, net of unamortized loan premiums and deferred origination costs |
(
|
(
|
|||||||||
| Allowance for loan losses: | |||||||||||
| Non-Nelnet Bank: | |||||||||||
| Federally insured loans |
(
|
(
|
|||||||||
| Private education loans |
(
|
(
|
|||||||||
| Consumer and other loans |
(
|
(
|
|||||||||
| Non-Nelnet Bank allowance for loan losses |
(
|
(
|
|||||||||
| Nelnet Bank: | |||||||||||
| Federally insured loans |
(
|
(
|
|||||||||
| Private education loans |
(
|
(
|
|||||||||
| Nelnet Bank allowance for loan losses |
(
|
(
|
|||||||||
| $ |
|
|
|||||||||
The following table summarizes the allowance for loan losses as a percentage of the ending loan balance for each of the Company's loan portfolios.
| As of | As of | ||||||||||
| September 30, 2022 | December 31, 2021 | ||||||||||
| Non-Nelnet Bank: | |||||||||||
| Federally insured student loans (a) |
|
% |
|
% | |||||||
| Private education loans |
|
% |
|
% | |||||||
| Consumer and other loans (b) |
|
% |
|
% | |||||||
| Nelnet Bank: | |||||||||||
| Federally insured student loans (a) |
|
% |
|
% | |||||||
| Private education loans |
|
% |
|
% | |||||||
(a) As of September 30, 2022 and December 31, 2021, the allowance for loan losses as a percent of the risk sharing component of federally insured student loans not covered by the federal guaranty for non-Nelnet Bank was
22.3
% and
22.2
%, respectively, and for Nelnet Bank was
8.9
% and
12.1
%, respectively.
(b) During 2022, the Company purchased home equity loans that generally have lower default rates than unsecured consumer loans. As such, the allowance for loan losses as a percentage of the ending loan balance has decreased as of September 30, 2022 as compared to December 31, 2021.
Gain on Sale of Loans
On January 26, 2022 and July 7, 2022, the Company sold $
18.1
million (par value) and $
28.9
million (par value) of consumer loans, respectively, to an unrelated third party who securitized such loans. The Company recognized a gain of $
3.0
million (pre-tax) and $
2.6
million (pre-tax), respectively, as part of these transactions. As partial consideration received for the consumer loans sold, the Company received a
6.6
percent and
7.6
percent residual interest, respectively, in the consumer loan securitizations that are included in "investments and notes receivable" on the Company's consolidated balance sheet.
10
Activity in the Allowance for Loan Losses
The following table presents the activity in the allowance for loan losses by portfolio segment.
| Balance at beginning of period | Provision (negative provision) for loan losses | Charge-offs | Recoveries | Initial allowance on loans purchased with credit deterioration (a) | Loan sales | Balance at end of period | |||||||||||||||||||||||||||||||||||
| Three months ended September 30, 2022 | |||||||||||||||||||||||||||||||||||||||||
| Non-Nelnet Bank: | |||||||||||||||||||||||||||||||||||||||||
| Federally insured loans | $ |
|
|
(
|
|
|
|
|
|||||||||||||||||||||||||||||||||
| Private education loans |
|
|
(
|
|
|
|
|
||||||||||||||||||||||||||||||||||
| Consumer and other loans |
|
|
(
|
|
|
(
|
|
||||||||||||||||||||||||||||||||||
| Nelnet Bank: | |||||||||||||||||||||||||||||||||||||||||
| Federally insured loans |
|
(
|
|
|
|
|
|
||||||||||||||||||||||||||||||||||
| Private education loans |
|
|
|
|
|
|
|
||||||||||||||||||||||||||||||||||
| $ |
|
|
(
|
|
|
(
|
|
||||||||||||||||||||||||||||||||||
| Three months ended September 30, 2021 | |||||||||||||||||||||||||||||||||||||||||
| Non-Nelnet Bank: | |||||||||||||||||||||||||||||||||||||||||
| Federally insured loans | $ |
|
|
(
|
|
|
|
|
|||||||||||||||||||||||||||||||||
| Private education loans |
|
(
|
(
|
|
|
(
|
|
||||||||||||||||||||||||||||||||||
| Consumer and other loans |
|
|
(
|
|
|
(
|
|
||||||||||||||||||||||||||||||||||
| Nelnet Bank: | |||||||||||||||||||||||||||||||||||||||||
| Federally insured loans |
|
|
|
|
|
|
|
||||||||||||||||||||||||||||||||||
| Private education loans |
|
(
|
|
|
|
|
|
||||||||||||||||||||||||||||||||||
| $ |
|
|
(
|
|
|
(
|
|
||||||||||||||||||||||||||||||||||
| Nine months ended September 30, 2022 | |||||||||||||||||||||||||||||||||||||||||
| Non-Nelnet Bank | |||||||||||||||||||||||||||||||||||||||||
| Federally insured loans | $ |
|
|
(
|
|
|
|
|
|||||||||||||||||||||||||||||||||
| Private education loans |
|
|
(
|
|
|
|
|
||||||||||||||||||||||||||||||||||
| Consumer and other loans |
|
|
(
|
|
|
(
|
|
||||||||||||||||||||||||||||||||||
| Nelnet Bank | |||||||||||||||||||||||||||||||||||||||||
| Federally insured loans |
|
(
|
(
|
|
|
|
|
||||||||||||||||||||||||||||||||||
| Private education loans |
|
|
(
|
|
|
(
|
|
||||||||||||||||||||||||||||||||||
| $ |
|
|
(
|
|
|
(
|
|
||||||||||||||||||||||||||||||||||
| Nine months ended September 30, 2021 | |||||||||||||||||||||||||||||||||||||||||
| Non-Nelnet Bank | |||||||||||||||||||||||||||||||||||||||||
| Federally insured loans | $ |
|
(
|
(
|
|
|
|
|
|||||||||||||||||||||||||||||||||
| Private education loans |
|
(
|
(
|
|
|
(
|
|
||||||||||||||||||||||||||||||||||
| Consumer and other loans |
|
(
|
(
|
|
|
(
|
|
||||||||||||||||||||||||||||||||||
| Nelnet Bank | |||||||||||||||||||||||||||||||||||||||||
| Federally insured loans |
|
|
|
|
|
|
|
||||||||||||||||||||||||||||||||||
| Private education loans |
|
|
|
|
|
(
|
|
||||||||||||||||||||||||||||||||||
| $ |
|
(
|
(
|
|
|
(
|
|
||||||||||||||||||||||||||||||||||
(a) During the three months ended September 30, 2022 and 2021, and nine months ended September 30, 2022 and 2021, the Company acquired $
0.9
million (par value), $
64.6
million (par value), $
11.6
million (par value), and $
153.3
million (par value), respectively, of federally insured rehabilitation loans that met the definition of purchased loans with credit deterioration ("PCD loans") when they were purchased by the Company.
The Company recorded a negative provision for loan losses for its federally insured loan portfolio during the first quarter of 2022 due to the amortization of the portfolio and an increase in expected prepayments as a result of an initiative offered by the Department of Education (the “Department”) for Federal Family Education Loan Program ("FFELP" or "FFEL Program") borrowers to consolidate their loans into Federal Direct Loan Program loans with the Department by October 31, 2022 to qualify for loan forgiveness under the Public Service Loan Forgiveness program. The Company recorded a provision for loan losses on its consumer loan portfolio during the first quarter of 2022 as a result of loans acquired during the period.
11
The Company recorded a provision for loan losses for its federally insured, private education, consumer, and other loan portfolios during the second and third quarters of 2022 due to management's estimate of declining economic conditions. In addition, the Company recorded provision for loan losses on its consumer and other loan and Nelnet Bank private education loan portfolios during these periods as a result of loans acquired and originated during the period. The provision for loan losses recognized by the Company for its federally insured loan portfolio during these periods was partially offset due to the continued amortization of the portfolio.
Unfunded Private Education Loan Commitments
As of September 30, 2022, Nelnet Bank has a liability of approximately $
76,000
related to $
4.3
million of unfunded private education loan commitments. The liability for unfunded loan commitments is included in "other liabilities" on the consolidated balance sheet. During the nine months ended September 30, 2022, Nelnet Bank recognized provision for loan losses of approximately $
65,000
related to unfunded loan commitments.
Key Credit Quality Indicators
Loan Status and Delinquencies
Key credit quality indicators for the Company's federally insured, private education, consumer, and other loan portfolios are loan status, including delinquencies. The impact of changes in loan status is incorporated into the allowance for loan losses calculation. Delinquencies have the potential to adversely impact the Company’s earnings through increased servicing and collection costs and account charge-offs.
The table below shows the Company’s loan status and delinquency amounts.
| As of September 30, 2022 | As of December 31, 2021 | As of September 30, 2021 | |||||||||||||||||||||||||||||||||||||||||||||||||||
| Federally insured loans - Non-Nelnet Bank: | |||||||||||||||||||||||||||||||||||||||||||||||||||||
| Loans in-school/grace/deferment | $ |
|
|
% | $ |
|
|
% | $ |
|
|
% | |||||||||||||||||||||||||||||||||||||||||
| Loans in forbearance |
|
|
|
|
|
|
|||||||||||||||||||||||||||||||||||||||||||||||
| Loans in repayment status: | |||||||||||||||||||||||||||||||||||||||||||||||||||||
| Loans current |
|
|
% |
|
|
% |
|
|
% | ||||||||||||||||||||||||||||||||||||||||||||
| Loans delinquent 31-60 days |
|
|
|
|
|
|
|||||||||||||||||||||||||||||||||||||||||||||||
| Loans delinquent 61-90 days |
|
|
|
|
|
|
|||||||||||||||||||||||||||||||||||||||||||||||
| Loans delinquent 91-120 days |
|
|
|
|
|
|
|||||||||||||||||||||||||||||||||||||||||||||||
| Loans delinquent 121-270 days |
|
|
|
|
|
|
|||||||||||||||||||||||||||||||||||||||||||||||
| Loans delinquent 271 days or greater |
|
|
|
|
|
|
|||||||||||||||||||||||||||||||||||||||||||||||
| Total loans in repayment |
|
|
|
% |
|
|
|
% |
|
|
|
% | |||||||||||||||||||||||||||||||||||||||||
| Total federally insured loans |
|
|
% |
|
|
% |
|
|
% | ||||||||||||||||||||||||||||||||||||||||||||
| Accrued interest receivable |
|
|
|
||||||||||||||||||||||||||||||||||||||||||||||||||
| Loan discount, net of unamortized premiums and deferred origination costs |
(
|
(
|
(
|
||||||||||||||||||||||||||||||||||||||||||||||||||
| Allowance for loan losses |
(
|
(
|
(
|
||||||||||||||||||||||||||||||||||||||||||||||||||
| Total federally insured loans and accrued interest receivable, net of allowance for loan losses | $ |
|
$ |
|
$ |
|
|||||||||||||||||||||||||||||||||||||||||||||||
| Private education loans - Non-Nelnet Bank: | |||||||||||||||||||||||||||||||||||||||||||||||||||||
| Loans in-school/grace/deferment | $ |
|
|
% | $ |
|
|
% | $ |
|
|
% | |||||||||||||||||||||||||||||||||||||||||
| Loans in forbearance |
|
|
|
|
|
|
|||||||||||||||||||||||||||||||||||||||||||||||
| Loans in repayment status: | |||||||||||||||||||||||||||||||||||||||||||||||||||||
| Loans current |
|
|
% |
|
|
% |
|
|
% | ||||||||||||||||||||||||||||||||||||||||||||
| Loans delinquent 31-60 days |
|
|
|
|
|
|
|||||||||||||||||||||||||||||||||||||||||||||||
| Loans delinquent 61-90 days |
|
|
|
|
|
|
|||||||||||||||||||||||||||||||||||||||||||||||
| Loans delinquent 91 days or greater |
|
|
|
|
|
|
|||||||||||||||||||||||||||||||||||||||||||||||
| Total loans in repayment |
|
|
|
% |
|
|
|
% |
|
|
|
% | |||||||||||||||||||||||||||||||||||||||||
| Total private education loans |
|
|
% |
|
|
% |
|
|
% | ||||||||||||||||||||||||||||||||||||||||||||
| Accrued interest receivable |
|
|
|
||||||||||||||||||||||||||||||||||||||||||||||||||
| Loan discount, net of unamortized premiums |
(
|
(
|
(
|
||||||||||||||||||||||||||||||||||||||||||||||||||
| Allowance for loan losses |
(
|
(
|
(
|
||||||||||||||||||||||||||||||||||||||||||||||||||
| Total private education loans and accrued interest receivable, net of allowance for loan losses | $ |
|
$ |
|
$ |
|
|||||||||||||||||||||||||||||||||||||||||||||||
12
| As of September 30, 2022 | As of December 31, 2021 | As of September 30, 2021 | |||||||||||||||||||||||||||||||||||||||||||||||||||
| Consumer and other loans - Non-Nelnet Bank: | |||||||||||||||||||||||||||||||||||||||||||||||||||||
| Loans in deferment | $ |
|
|
% | $ |
|
|
% | $ |
|
|
% | |||||||||||||||||||||||||||||||||||||||||
| Loans in repayment status: | |||||||||||||||||||||||||||||||||||||||||||||||||||||
| Loans current |
|
|
% |
|
|
% |
|
|
% | ||||||||||||||||||||||||||||||||||||||||||||
| Loans delinquent 31-60 days |
|
|
|
|
|
|
|||||||||||||||||||||||||||||||||||||||||||||||
| Loans delinquent 61-90 days |
|
|
|
|
|
|
|||||||||||||||||||||||||||||||||||||||||||||||
| Loans delinquent 91 days or greater |
|
|
|
|
|
|
|||||||||||||||||||||||||||||||||||||||||||||||
| Total loans in repayment |
|
|
|
% |
|
|
|
% |
|
|
|
% | |||||||||||||||||||||||||||||||||||||||||
| Total consumer and other loans |
|
|
% |
|
|
% |
|
|
% | ||||||||||||||||||||||||||||||||||||||||||||
| Accrued interest receivable |
|
|
|
||||||||||||||||||||||||||||||||||||||||||||||||||
| Loan discount, net of unamortized premiums |
(
|
|
|
||||||||||||||||||||||||||||||||||||||||||||||||||
| Allowance for loan losses |
(
|
(
|
(
|
||||||||||||||||||||||||||||||||||||||||||||||||||
| Total consumer and other loans and accrued interest receivable, net of allowance for loan losses | $ |
|
$ |
|
$ |
|
|||||||||||||||||||||||||||||||||||||||||||||||
| Federally insured loans - Nelnet Bank (a): | |||||||||||||||||||||||||||||||||||||||||||||||||||||
| Loans in-school/grace/deferment | $ |
|
|
% | $ |
|
|
% | $ |
|
|
% | |||||||||||||||||||||||||||||||||||||||||
| Loans in forbearance |
|
|
|
|
|
|
|||||||||||||||||||||||||||||||||||||||||||||||
| Loans in repayment status: | |||||||||||||||||||||||||||||||||||||||||||||||||||||
| Loans current |
|
|
% |
|
|
% |
|
|
% | ||||||||||||||||||||||||||||||||||||||||||||
| Loans delinquent 30-59 days |
|
|
|
|
|
|
|||||||||||||||||||||||||||||||||||||||||||||||
| Loans delinquent 60-89 days |
|
|
|
|
|
|
|||||||||||||||||||||||||||||||||||||||||||||||
| Loans delinquent 90-119 days |
|
|
|
|
|
|
|||||||||||||||||||||||||||||||||||||||||||||||
| Loans delinquent 120-270 days |
|
|
|
|
|
|
|||||||||||||||||||||||||||||||||||||||||||||||
| Loans delinquent 271 days or greater |
|
|
|
|
|
|
|||||||||||||||||||||||||||||||||||||||||||||||
| Total loans in repayment |
|
|
|
% |
|
|
|
% |
|
|
|
% | |||||||||||||||||||||||||||||||||||||||||
| Total federally insured loans |
|
|
% |
|
|
% |
|
|
% | ||||||||||||||||||||||||||||||||||||||||||||
| Accrued interest receivable |
|
|
|
||||||||||||||||||||||||||||||||||||||||||||||||||
| Loan premium |
|
|
|
||||||||||||||||||||||||||||||||||||||||||||||||||
| Allowance for loan losses |
(
|
(
|
(
|
||||||||||||||||||||||||||||||||||||||||||||||||||
| Total federally insured loans and accrued interest receivable, net of allowance for loan losses | $ |
|
$ |
|
$ |
|
|||||||||||||||||||||||||||||||||||||||||||||||
| Private education loans - Nelnet Bank (a): | |||||||||||||||||||||||||||||||||||||||||||||||||||||
| Loans in-school/grace/deferment | $ |
|
|
% | $ |
|
|
% | $ |
|
|
% | |||||||||||||||||||||||||||||||||||||||||
| Loans in forbearance |
|
|
|
|
|
|
|||||||||||||||||||||||||||||||||||||||||||||||
| Loans in repayment status: | |||||||||||||||||||||||||||||||||||||||||||||||||||||
| Loans current |
|
|
% |
|
|
% |
|
|
% | ||||||||||||||||||||||||||||||||||||||||||||
| Loans delinquent 30-59 days |
|
|
|
|
|
|
|||||||||||||||||||||||||||||||||||||||||||||||
| Loans delinquent 60-89 days |
|
|
|
|
|
|
|||||||||||||||||||||||||||||||||||||||||||||||
| Loans delinquent 90 days or greater |
|
|
|
|
|
|
|||||||||||||||||||||||||||||||||||||||||||||||
| Total loans in repayment |
|
|
|
% |
|
|
|
% |
|
|
|
% | |||||||||||||||||||||||||||||||||||||||||
| Total private education loans |
|
|
% |
|
|
% |
|
|
% | ||||||||||||||||||||||||||||||||||||||||||||
| Accrued interest receivable |
|
|
|
||||||||||||||||||||||||||||||||||||||||||||||||||
| Deferred origination costs, net of unaccreted discount |
|
|
|
||||||||||||||||||||||||||||||||||||||||||||||||||
| Allowance for loan losses |
(
|
(
|
(
|
||||||||||||||||||||||||||||||||||||||||||||||||||
| Total private education loans and accrued interest receivable, net of allowance for loan losses | $ |
|
$ |
|
$ |
|
|||||||||||||||||||||||||||||||||||||||||||||||
(a) For the periods presented for Nelnet Bank, the delinquency bucket periods conform with the delinquency bucket periods reflected in Nelnet Bank's Call Reports filed with the Federal Deposit Insurance Corporation.
13
FICO Scores - Nelnet Bank Private Education Loans
An additional key credit quality indicator for Nelnet Bank private education loans is FICO scores at the time of origination.
The following tables highlight the gross principal balance of Nelnet Bank's private education loan portfolio, by year of origination, stratified by FICO score at the time of origination.
| Loan balance as of September 30, 2022 | |||||||||||||||||||||||
| Nine months ended September 30, 2022 | 2021 | 2020 | Total | ||||||||||||||||||||
| FICO at origination: | |||||||||||||||||||||||
| Less than 705 | $ |
|
|
|
|
||||||||||||||||||
| 705 - 734 |
|
|
|
|
|||||||||||||||||||
| 735 - 764 |
|
|
|
|
|||||||||||||||||||
| 765 - 794 |
|
|
|
|
|||||||||||||||||||
| Greater than 794 |
|
|
|
|
|||||||||||||||||||
| $ |
|
|
|
|
|||||||||||||||||||
| Loan balance as of December 31, 2021 | |||||||||||||||||
| 2021 | 2020 | Total | |||||||||||||||
| FICO at origination: | |||||||||||||||||
| Less than 705 | $ |
|
|
|
|||||||||||||
| 705 - 734 |
|
|
|
||||||||||||||
| 735 - 764 |
|
|
|
||||||||||||||
| 765 - 794 |
|
|
|
||||||||||||||
| Greater than 794 |
|
|
|
||||||||||||||
| $ |
|
|
|
||||||||||||||
Nonaccrual Status
The Company does not place federally insured loans on nonaccrual status due to the government guaranty. The amortized cost of private education, consumer, and other loans on nonaccrual status, as well as the allowance for loan losses related to such loans, as of December 31, 2021 and September 30, 2022, was not material.
14
Amortized Cost Basis by Origination Year
The following table presents the amortized cost of the Company's private education, consumer, and other loans by loan status and delinquency amount as of September 30, 2022 based on year of origination. Effective July 1, 2010, no new loan originations can be made under the FFEL Program and all new federal loan originations must be made under the Federal Direct Loan Program. As such, all the Company’s federally insured loans were originated prior to July 1, 2010.
| Nine months ended September 30, 2022 | 2021 | 2020 | 2019 | 2018 | Prior years | Total | |||||||||||||||||||||||||||||||||||
| Private education loans - Non-Nelnet Bank: | |||||||||||||||||||||||||||||||||||||||||
| Loans in school/grace/deferment | $ |
|
|
|
|
|
|
|
|||||||||||||||||||||||||||||||||
| Loans in forbearance |
|
|
|
|
|
|
|
||||||||||||||||||||||||||||||||||
| Loans in repayment status: | |||||||||||||||||||||||||||||||||||||||||
| Loans current |
|
|
|
|
|
|
|
||||||||||||||||||||||||||||||||||
| Loans delinquent 31-60 days |
|
|
|
|
|
|
|
||||||||||||||||||||||||||||||||||
| Loans delinquent 61-90 days |
|
|
|
|
|
|
|
||||||||||||||||||||||||||||||||||
| Loans delinquent 91 days or greater |
|
|
|
|
|
|
|
||||||||||||||||||||||||||||||||||
| Total loans in repayment |
|
|
|
|
|
|
|
||||||||||||||||||||||||||||||||||
| Total private education loans | $ |
|
|
|
|
|
|
|
|||||||||||||||||||||||||||||||||
| Accrued interest receivable |
|
||||||||||||||||||||||||||||||||||||||||
| Loan discount, net of unamortized premiums |
(
|
||||||||||||||||||||||||||||||||||||||||
| Allowance for loan losses |
(
|
||||||||||||||||||||||||||||||||||||||||
| Total private education loans and accrued interest receivable, net of allowance for loan losses | $ |
|
|||||||||||||||||||||||||||||||||||||||
| Consumer and other loans - Non-Nelnet Bank: | |||||||||||||||||||||||||||||||||||||||||
| Loans in deferment | $ |
|
|
|
|
|
|
|
|||||||||||||||||||||||||||||||||
| Loans in repayment status: | |||||||||||||||||||||||||||||||||||||||||
| Loans current |
|
|
|
|
|
|
|
||||||||||||||||||||||||||||||||||
| Loans delinquent 31-60 days |
|
|
|
|
|
|
|
||||||||||||||||||||||||||||||||||
| Loans delinquent 61-90 days |
|
|
|
|
|
|
|
||||||||||||||||||||||||||||||||||
| Loans delinquent 91 days or greater |
|
|
|
|
|
|
|
||||||||||||||||||||||||||||||||||
| Total loans in repayment |
|
|
|
|
|
|
|
||||||||||||||||||||||||||||||||||
| Total consumer and other loans | $ |
|
|
|
|
|
|
|
|||||||||||||||||||||||||||||||||
| Accrued interest receivable |
|
||||||||||||||||||||||||||||||||||||||||
| Loan discount, net of unamortized premiums |
(
|
||||||||||||||||||||||||||||||||||||||||
| Allowance for loan losses |
(
|
||||||||||||||||||||||||||||||||||||||||
| Total consumer and other loans and accrued interest receivable, net of allowance for loan losses | $ |
|
|||||||||||||||||||||||||||||||||||||||
| Private education loans - Nelnet Bank (a): | |||||||||||||||||||||||||||||||||||||||||
| Loans in school/grace/deferment | $ |
|
|
|
|
|
|
|
|||||||||||||||||||||||||||||||||
| Loans in forbearance |
|
|
|
|
|
|
|
||||||||||||||||||||||||||||||||||
| Loans in repayment status: | |||||||||||||||||||||||||||||||||||||||||
| Loans current |
|
|
|
|
|
|
|
||||||||||||||||||||||||||||||||||
| Loans delinquent 30-59 days |
|
|
|
|
|
|
|
||||||||||||||||||||||||||||||||||
| Loans delinquent 60-89 days |
|
|
|
|
|
|
|
||||||||||||||||||||||||||||||||||
| Loans delinquent 90 days or greater |
|
|
|
|
|
|
|
||||||||||||||||||||||||||||||||||
| Total loans in repayment |
|
|
|
|
|
|
|
||||||||||||||||||||||||||||||||||
| Total private education loans | $ |
|
|
|
|
|
|
|
|||||||||||||||||||||||||||||||||
| Accrued interest receivable |
|
||||||||||||||||||||||||||||||||||||||||
| Deferred origination costs, net of unaccreted discount |
|
||||||||||||||||||||||||||||||||||||||||
| Allowance for loan losses |
(
|
||||||||||||||||||||||||||||||||||||||||
| Total private education loans and accrued interest receivable, net of allowance for loan losses | $ |
|
|||||||||||||||||||||||||||||||||||||||
(a) For the periods presented for Nelnet Bank, the delinquency bucket periods conform with the delinquency bucket periods reflected in Nelnet Bank's Call Reports filed with the Federal Deposit Insurance Corporation.
15
3.
Bonds and Notes Payable
The following tables summarize the Company’s outstanding debt obligations by type of instrument:
| As of September 30, 2022 | |||||||||||||||||
|
Carrying
amount
|
Interest rate
range
|
Final maturity | |||||||||||||||
|
Variable-rate bonds and notes issued in FFELP loan asset-backed securitizations:
|
|||||||||||||||||
| Bonds and notes based on indices | $ |
|
|
8/26/30 - 9/25/69 | |||||||||||||
| Bonds and notes based on auction |
|
|
3/22/32 - 8/27/46 | ||||||||||||||
| Total FFELP variable-rate bonds and notes |
|
||||||||||||||||
|
Fixed-rate bonds and notes issued in FFELP loan asset-backed securitizations
|
|
|
10/25/67 - 8/27/68 | ||||||||||||||
| FFELP loan warehouse facility |
|
|
11/22/23 | ||||||||||||||
| Private education loan warehouse facility |
|
|
10/31/23 | ||||||||||||||
|
Variable-rate bonds and notes issued in private education loan asset-backed securitizations
|
|
|
12/26/40 / 6/25/49 | ||||||||||||||
|
Fixed-rate bonds and notes issued in private education loan asset-backed securitization
|
|
|
12/26/40 / 12/28/43 | ||||||||||||||
| Unsecured line of credit |
|
|
9/22/26 | ||||||||||||||
| Participation agreement |
|
|
5/4/23 | ||||||||||||||
| Repurchase agreements |
|
|
10/7/22 - 11/27/24 | ||||||||||||||
| Other - due to related party |
|
|
11/22/22 - 10/14/28 | ||||||||||||||
|
|
|||||||||||||||||
| Discount on bonds and notes payable and debt issuance costs |
(
|
||||||||||||||||
| Total | $ |
|
|||||||||||||||
| As of December 31, 2021 | |||||||||||||||||
|
Carrying
amount
|
Interest rate
range
|
Final maturity | |||||||||||||||
| Variable-rate bonds and notes issued in FFELP loan asset-backed securitizations: | |||||||||||||||||
| Bonds and notes based on indices | $ |
|
|
5/27/25 - 9/25/69 | |||||||||||||
| Bonds and notes based on auction |
|
|
3/22/32 - 8/27/46 | ||||||||||||||
| Total FFELP variable-rate bonds and notes |
|
||||||||||||||||
| Fixed-rate bonds and notes issued in FFELP loan asset-backed securitizations |
|
|
10/25/67 - 8/27/68 | ||||||||||||||
| FFELP loan warehouse facility |
|
|
5/22/23 | ||||||||||||||
| Private education loan warehouse facility |
|
|
2/13/23 | ||||||||||||||
| Variable-rate bonds and notes issued in private education loan asset-backed securitizations |
|
|
12/26/40 / 6/25/49 | ||||||||||||||
| Fixed-rate bonds and notes issued in private education loan asset-backed securitization |
|
|
12/26/40 / 12/28/43 | ||||||||||||||
| Unsecured line of credit |
|
|
9/22/26 | ||||||||||||||
| Participation agreement |
|
|
5/4/22 | ||||||||||||||
| Repurchase agreements |
|
|
5/27/22 - 12/20/23 | ||||||||||||||
| Secured line of credit |
|
|
5/30/22 | ||||||||||||||
|
|
|||||||||||||||||
| Discount on bonds and notes payable and debt issuance costs |
(
|
||||||||||||||||
| Total | $ |
|
|||||||||||||||
16
Warehouse Facilities
The Company funds a portion of its loan acquisitions using warehouse facilities. Loan warehousing allows the Company to buy and manage loans prior to transferring them into more permanent financing arrangements.
FFELP loan warehouse facility
As of September 30, 2022, the Company’s FFELP warehouse facility had an aggregate maximum financing amount available of $
300.0
million that was increased from $
25.0
million per a July 29, 2022 amendment to the facility. A May 2022 amendment extended the liquidity provisions and final maturity to November 22, 2022 and November 22, 2023, respectively. As of September 30, 2022, $
249.5
million was outstanding under this facility, $
50.5
million was available for future funding, and the Company had $
20.3
million advanced as equity support.
Private education loan warehouse facility
As of September 30, 2022, the Company's private education warehouse facility had an aggregate maximum financing amount available of $
175.0
million and an advance rate of
80
to
90
percent. On June 30, 2022, the Company amended the facility to extend the liquidity provisions through October 31, 2022 and final maturity date to October 31, 2023. As of September 30, 2022, $
86.2
million was outstanding under this warehouse facility, $
88.8
million was available for future funding, and the Company had $
9.8
million advanced as equity support.
Unsecured Line of Credit
The Company has a $
495.0
million unsecured line of credit that has a maturity date of September 22, 2026. As of September 30, 2022,
no
amount was outstanding on the line of credit and $
495.0
million was available for future use. The line of credit provides that the Company may increase the aggregate financing commitments, through the existing lenders and/or through new lenders, up to a total of $
737.5
million, subject to certain conditions.
Participation Agreement
The Company has an agreement with Union Bank and Trust Company ("Union Bank"), a related party, as trustee for various grantor trusts, under which Union Bank has agreed to purchase from the Company participation interests in FFELP loan asset-backed securities. As of September 30, 2022, $
399.7
million of FFELP loan asset-backed securities were subject to outstanding participation interests held by Union Bank, as trustee, under this agreement. The agreement automatically renews annually and is terminable by either party upon
business days' notice. On May 4, 2022, the agreement automatically renewed for another year through May 4, 2023. The Company can participate FFELP loan asset-backed securities to Union Bank to the extent of availability under the grantor trusts, up to $
400.0
million or an amount in excess of $
400.0
million if mutually agreed to by both parties. The Company maintains legal ownership of the FFELP loan asset-backed securities and, in its discretion, approves and accomplishes any sale, assignment, transfer, encumbrance, or other disposition of the securities. As such, the FFELP loan asset-backed securities subject to this agreement are included on the Company's consolidated balance sheet as "investments and notes receivable" and the participation interests outstanding have been accounted for by the Company as a secured borrowing.
See note 5 for additional information about the FFELP loan asset-backed securities investments serving as collateral under this participation agreement.
Repurchase Agreements
On May 3, 2021 and June 23, 2021, the Company entered into repurchase agreements with non-affiliated third parties, the proceeds of which are collateralized by certain private education and FFELP loan asset-backed securities. The first agreement has various maturity dates through November 27, 2024 or earlier if either party provides
180
days’ prior written notice, and the second agreement has various maturity dates through January 13, 2023. Included in “bonds and notes payable” as of September 30, 2022 was $
218.0
million subject to the first agreement and $
289.0
million subject to the second agreement.
See note 5 and below under "Debt Repurchases" for additional information about the private education and FFELP loan asset-backed securities investments, respectively, serving as collateral for these repurchase agreements.
Accrued Interest Liability
During the first quarter of 2021, the Company reversed a historical accrued interest liability of $
23.8
million on certain bonds, which liability the Company determined was no longer probable of being required to be paid. The liability was initially recorded when certain asset-backed securitizations were acquired in 2011 and 2013. The reduction of this liability is reflected in (a reduction of) "interest expense on bonds and notes payable and bank deposits" in the consolidated statements of income.
17
Debt Repurchases
The following table summarizes the Company's repurchases of its own debt. Gains/losses recorded by the Company from the repurchase of debt are included in "other" in "other income/expense" on the Company's consolidated statements of income.
| Three months ended September 30, | Nine months ended September 30, | ||||||||||||||||||||||
| 2022 | 2021 | 2022 | 2021 | ||||||||||||||||||||
| Purchase price | $ |
(
|
(
|
(
|
(
|
||||||||||||||||||
| Par value |
|
|
|
|
|||||||||||||||||||
| Remaining unamortized cost of issuance |
(
|
(
|
(
|
(
|
|||||||||||||||||||
| Gain (loss) | $ |
|
(
|
|
(
|
||||||||||||||||||
The Company has repurchased certain of its own asset-backed securities (bonds and notes payable) in the secondary market. For accounting purposes, these notes are eliminated in consolidation and are not included in the Company's consolidated financial statements. However, these securities remain legally outstanding at the trust level and the Company could sell these notes to third parties or redeem the notes at par as cash is generated by the trust estate. Upon a sale of these notes to third parties, the Company would obtain cash proceeds equal to the market value of the notes on the date of such sale. As of September 30, 2022, the Company holds $
431.5
million (par value) of its own FFELP asset-backed securities. As of September 30, 2022, $
230.6
million (par value) of the Company's repurchased FFELP loan asset-backed securities were serving as collateral on amounts outstanding under the Company's repurchase agreements (as discussed above).
4.
Derivative Financial Instruments
The Company uses derivative financial instruments to manage interest rate risk. Derivative instruments used as part of the Company's interest rate risk management strategy are further described in note 6 of the notes to consolidated financial statements included in the 2021 Annual Report. A tabular presentation of such derivatives outstanding as of September 30, 2022 and December 31, 2021 is presented below.
Basis Swaps
The following table summarizes the Company’s outstanding basis swaps as of September 30, 2022 and December 31, 2021, in which the Company receives three-month LIBOR set discretely in advance and pays one-month LIBOR plus or minus a spread as defined in the agreements (the "1:3 Basis Swaps").
| Maturity | Notional amount | |||||||||||||
| As of | As of | |||||||||||||
| September 30, 2022 | December 31, 2021 | |||||||||||||
| 2022 | $ |
|
|
|||||||||||
| 2023 |
|
|
||||||||||||
| 2024 |
|
|
||||||||||||
| 2026 |
|
|
||||||||||||
| 2027 |
|
|
||||||||||||
| $ |
|
|
||||||||||||
The weighted average rate paid by the Company on the 1:3 Basis Swaps as of September 30, 2022 and December 31, 2021 was one-month LIBOR plus
9.4
basis points and
9.1
basis points, respectively.
18
Interest Rate Swaps – Floor Income Hedges
The following table summarizes the outstanding derivative instruments used by the Company to economically hedge loans earning fixed rate floor income.
| As of September 30, 2022 | As of December 31, 2021 | |||||||||||||||||||||||||
| Maturity | Notional amount | Weighted average fixed rate paid by the Company (a) | Notional amount | Weighted average fixed rate paid by the Company (a) | ||||||||||||||||||||||
| 2022 | $ |
|
|
% | $ |
|
|
% | ||||||||||||||||||
| 2023 |
|
|
|
|
||||||||||||||||||||||
| 2024 |
|
|
|
|
||||||||||||||||||||||
| 2025 |
|
|
|
|
||||||||||||||||||||||
| 2026 |
|
|
|
|
||||||||||||||||||||||
| 2031 |
|
|
|
|
||||||||||||||||||||||
| $ |
|
|
% | $ |
|
|
% | |||||||||||||||||||
(a) For all interest rate derivatives, the Company receives discrete three-month LIBOR.
In March 2022, the Company terminated $
650
million in notional amount of derivatives ($
500
million and $
150
million that had maturity dates in 2022 and 2023, respectively) for net payments of $
0.1
million. On April 29, 2022, the Company terminated $
1.25
billion in notional amount of derivatives ($
500
million, $
250
million, and $
500
million that had maturity dates in 2023, 2024, and 2025, respectively) for total proceeds of $
68.1
million. On August 26, 2022, the Company terminated $
500
million in notional amount of derivatives ($
250
million that had maturity dates in each of 2023 and 2024) for total proceeds of $
23.8
million.
Consolidated Financial Statement Impact Related to Derivatives - Statements of Income
The following table summarizes the components of "derivative market value adjustments and derivative settlements, net" included in the consolidated statements of income.
| Three months ended September 30, | Nine months ended September 30, | ||||||||||||||||||||||
| 2022 | 2021 | 2022 | 2021 | ||||||||||||||||||||
| Settlements: | |||||||||||||||||||||||
| 1:3 basis swaps | $ |
(
|
(
|
|
(
|
||||||||||||||||||
| Interest rate swaps - floor income hedges |
|
(
|
|
(
|
|||||||||||||||||||
| Total settlements - income (expense) |
|
(
|
|
(
|
|||||||||||||||||||
| Change in fair value: | |||||||||||||||||||||||
|
|
|
|
|
||||||||||||||||||||
|
|
|
|
|
||||||||||||||||||||
|
|
|
|
|
||||||||||||||||||||
| Derivative market value adjustments and derivative settlements, net - income | $ |
|
|
|
|
||||||||||||||||||
19
5.
Investments and Notes Receivable
A summary of the Company's investments and notes receivable follows:
| As of September 30, 2022 | As of December 31, 2021 | ||||||||||||||||||||||||||||||||||||||||||||||
| Amortized cost | Gross unrealized gains | Gross unrealized losses (a) | Fair value | Amortized cost | Gross unrealized gains | Gross unrealized losses | Fair value | ||||||||||||||||||||||||||||||||||||||||
| Investments (at fair value): | |||||||||||||||||||||||||||||||||||||||||||||||
| FFELP loan asset-backed securities- available-for-sale (b) | $ |
|
|
(
|
|
|
|
(
|
|
||||||||||||||||||||||||||||||||||||||
| Private education loan asset-backed securities - available-for-sale (c) |
|
|
(
|
|
|
|
(
|
|
|||||||||||||||||||||||||||||||||||||||
| Other debt securities - available-for-sale |
|
|
(
|
|
|
|
|
|
|||||||||||||||||||||||||||||||||||||||
| Total available-for-sale debt securities | $ |
|
|
(
|
|
|
|
(
|
|
||||||||||||||||||||||||||||||||||||||
| Equity securities |
|
|
|||||||||||||||||||||||||||||||||||||||||||||
| Total investments (at fair value) |
|
|
|||||||||||||||||||||||||||||||||||||||||||||
| Other Investments and Notes Receivable (not measured at fair value): | |||||||||||||||||||||||||||||||||||||||||||||||
| Other debt securities - held-to-maturity |
|
|
|||||||||||||||||||||||||||||||||||||||||||||
| Venture capital and funds: | |||||||||||||||||||||||||||||||||||||||||||||||
| Measurement alternative |
|
|
|||||||||||||||||||||||||||||||||||||||||||||
| Equity method |
|
|
|||||||||||||||||||||||||||||||||||||||||||||
| Total venture capital and funds |
|
|
|||||||||||||||||||||||||||||||||||||||||||||
| Real estate: | |||||||||||||||||||||||||||||||||||||||||||||||
| Equity method |
|
|
|||||||||||||||||||||||||||||||||||||||||||||
| Investment in ALLO: | |||||||||||||||||||||||||||||||||||||||||||||||
| Voting interest/equity method (d) |
|
|
|||||||||||||||||||||||||||||||||||||||||||||
| Preferred membership interest and accrued and unpaid preferred return (e) |
|
|
|||||||||||||||||||||||||||||||||||||||||||||
| Total investment in ALLO |
|
|
|||||||||||||||||||||||||||||||||||||||||||||
| Beneficial interest in loan securitizations (f): | |||||||||||||||||||||||||||||||||||||||||||||||
| Private education loans, including accrued interest |
|
|
|||||||||||||||||||||||||||||||||||||||||||||
| Consumer loans |
|
|
|||||||||||||||||||||||||||||||||||||||||||||
| Federally insured student loans |
|
|
|||||||||||||||||||||||||||||||||||||||||||||
| Total beneficial interest in loan securitizations |
|
|
|||||||||||||||||||||||||||||||||||||||||||||
| Solar (g) |
(
|
(
|
|||||||||||||||||||||||||||||||||||||||||||||
| Notes receivable |
|
|
|||||||||||||||||||||||||||||||||||||||||||||
| Tax liens, affordable housing, and other |
|
|
|||||||||||||||||||||||||||||||||||||||||||||
| Total investments (not measured at fair value) |
|
|
|||||||||||||||||||||||||||||||||||||||||||||
| Total investments and notes receivable | $ |
|
$ |
|
|||||||||||||||||||||||||||||||||||||||||||
(a) As of September 30, 2022, the aggregate fair value of available-for-sale debt securities with unrealized losses was $
1.0
billion. The Company currently has the intent and ability to retain these investments, and
none
of the unrealized losses were due to credit losses.
(b) As of September 30, 2022, $
399.7
million (par value) of FFELP loan asset-backed securities were subject to participation interests held by Union Bank, as discussed in note 3 under "Participation Agreement."
(c) As of September 30, 2022, $
350.9
million (par value) of private education loan asset-backed securities are subject to repurchase agreements with third parties, as discussed in note 3 under “Repurchase Agreements.”
(d) On February 25, 2022, the Company contributed $
34.7
million of additional equity to ALLO Holdings LLC, a holding company for ALLO Communications LLC (collectively referred to as "ALLO"). As a result of this equity contribution, the Company's voting membership interests percentage in ALLO did not materially change.
The Company accounts for its voting membership interests in ALLO under the Hypothetical Liquidation at Book Value ("HLBV") method of accounting. During the three months ended September 30, 2022 and 2021, the Company recognized pre-tax losses of $
17.6
million and $
10.5
million, respectively, under the HLBV method of accounting on its ALLO voting membership interests investment, and during the nine months ended September 30, 2022 and 2021, the Company recognized pre-tax losses of $
47.6
million and $
31.6
million, respectively. Income and losses from the Company's investment in ALLO are included in "other" in "other income/expense" on the consolidated statements of income.
20
(e) As of September 30, 2022, the outstanding preferred membership interests and accrued and unpaid preferred return of ALLO held by the Company was $
137.3
million and $
6.4
million, respectively. The preferred membership interests of ALLO held by the Company earn a preferred annual return of
6.25
percent. The Company recognized pre-tax income on its ALLO preferred membership interests of $
2.2
million and $
2.0
million during the three months ended September 30, 2022 and 2021, respectively, and $
6.4
million during each of the nine months ended September 30, 2022 and 2021. This income is included in "other" in "other income/expense" on the consolidated statements of income.
(f) The Company has partial ownership in certain private education, consumer, and federally insured student loan securitizations. As of the latest remittance reports filed by the various trusts prior to or as of September 30, 2022, the Company's ownership correlates to approximately $
630
million, $
150
million, and $
420
million of private education, consumer, and federally insured student loans, respectively, included in these securitizations.
(g) As of September 30, 2022, the Company has funded a total of $
252.1
million in solar investments, which includes $
81.3
million funded by syndication partners. The carrying value of the Company’s investment in a solar project is reduced by tax credits earned when the solar project is placed in service. The solar investment balance at September 30, 2022 represents the sum of total tax credits earned on solar projects placed in service through September 30, 2022 and the calculated HLBV net losses being larger than total payments made by the Company on such projects. As of September 30, 2022, the Company is committed to fund an additional $
42.8
million on these projects, of which $
35.1
million will be provided by syndication partners.
The Company accounts for its solar investments using the HLBV method of accounting. For the majority of the Company’s solar investments, the HLBV method of accounting results in accelerated losses in the initial years of investment. The Company recognized pre-tax losses on its solar investments of $
4.2
million and $
3.4
million during the three months ended September 30, 2022 and 2021, respectively, and $
7.1
million and $
7.4
million during the nine months ended September 30, 2022 and 2021, respectively. These losses are included in “other” in "other income/expense" on the consolidated statements of income. Losses from solar investments include losses attributable to third-party minority interest investors (syndication partners) that are included in “net loss attributable to noncontrolling interests” in the consolidated statements of income. Solar losses attributed to minority interest investors was $
4.1
million and $
2.1
million for the three months ended September 30, 2022 and 2021, respectively, and $
8.0
million and $
4.0
million for the nine months ended September 30, 2022 and 2021, respectively.
Impairment Expense
During the second quarter of 2022, the Company recorded an impairment charge of $
5.4
million related primarily to one of its venture capital investments accounted for under the measurement alternative method. The impairment expense is included in "impairment expense and provision for beneficial interests, net" on the consolidated statements of income.
6.
Business Combinations
NGWeb Solutions, LLC
On April 30, 2022, the Company acquired
30
percent of the ownership interests of NGWeb Solutions, LLC ("NextGen") for total cash consideration of $
9.2
million. NextGen provides software solutions primarily to higher education institutions to enable administrators to efficiently manage online forms, scholarships, employment, online timesheets, and other specialized processes that require signed authorizations and interactions with student information.
Prior to the acquisition, the Company owned
50
percent of the ownership interests of NextGen and accounted for this investment under the equity method. As a result of the acquisition, the previously held
50
percent ownership interests was remeasured to its fair value as of the April 30, 2022 date of acquisition of the additional
30
percent of the ownership interests, resulting in a $
15.2
million revaluation gain, which is included in "other" in "other income/expense" on the consolidated statements of income. For segment reporting, this gain is included in Corporate and Other Activities. Subsequent to the acquisition, the Company has consolidated the operating results of NextGen and such results are included in the Education Technology, Services, and Payment Processing reportable segment.
21
| Cash and cash equivalents | $ |
|
|||
| Accounts receivable |
|
||||
| Property and equipment |
|
||||
| Other assets |
|
||||
| Intangible assets |
|
||||
| Excess cost over fair value of net assets acquired (goodwill) |
|
||||
| Other liabilities |
(
|
||||
| Net assets acquired |
|
||||
| Minority interest |
(
|
||||
| Remeasurement of previously held investment |
(
|
||||
| Total consideration paid by the Company | $ |
|
|||
The $
15.3
million of acquired intangible assets on the date of acquisition had a weighted-average useful life of approximately
14
years. The intangible assets that made up this amount include customer relationships of $
12.8
million (
15
-year useful life), computer software of $
1.7
million (
5
-year useful life) and a trade name of $
0.8
million (
10
-year useful life).
The $
15.9
million of goodwill is not expected to be deductible for tax purposes. The amount allocated to goodwill was primarily attributed to the synergies and economies of scale expected from combining the operations of the Company and NextGen.
The pro forma impacts of the NextGen acquisition on the Company's historical results prior to the acquisition were not material.
GRNE Solar
On July 1, 2022, the Company acquired
80
percent of the ownership interests of
two
subsidiaries of GRNE Solutions, LLC named GRNE-Nelnet, LLC ("GRNE") and ENRG-Nelnet, LLC ("ENRG") (collectively referred to as "GRNE Solar") for total cash consideration of $
30.4
million. GRNE designs and installs residential, commercial, and utility-scale solar systems in the Midwest. ENRG owns certain assets that generate and sell solar energy. The acquisition diversifies the Company's position in the renewable energy space to include solar construction. For segment reporting, the operating results of GRNE Solar are included in Corporate and Other Activities.
The following table summarizes the estimated fair values of the assets acquired and liabilities assumed at the acquisition date.
| Cash and cash equivalents | $ |
|
|||
| Accounts receivable |
|
||||
| Property and equipment |
|
||||
| Other assets |
|
||||
| Intangible assets |
|
||||
| Excess cost over fair value of net assets acquired (goodwill) |
|
||||
| Bonds and notes payable |
(
|
||||
| Other liabilities |
(
|
||||
| Net assets acquired |
|
||||
| Minority interest |
(
|
||||
| Total consideration paid by the Company | $ |
|
|||
The $
11.7
million of acquired intangible assets on the date of acquisition had a weighted-average useful life of approximately
8
years. The intangible assets that made up this amount include a trade name of $
8.1
million (
10
-year useful life), customer relationships of $
1.1
million (
3
-year useful life), and other separably identified intangibles of $
2.4
million (
5
-year useful life).
The $
14.0
million of goodwill is expected to be deductible for tax purposes. The amount allocated to goodwill was attributed to synergies from combining the operations of the Company and GRNE Solar and intangible assets that do not qualify for separate recognition.
The pro forma impacts of the GRNE Solar acquisition on the Company's historical results prior to the acquisition were not material.
22
7.
Intangible Assets
Intangible assets consisted of the following:
|
Weighted average remaining useful life as of
September 30, 2022 (months)
|
|||||||||||||||||
| As of | As of | ||||||||||||||||
| September 30, 2022 | December 31, 2021 | ||||||||||||||||
| Amortizable intangible assets, net: | |||||||||||||||||
|
Customer relationships (net of accumulated amortization of $
|
|
$ |
|
|
|||||||||||||
|
Trade names (net of accumulated amortization of $
|
|
|
|
||||||||||||||
|
Computer software (net of accumulated amortization of $
|
|
|
|
||||||||||||||
|
Other (net of accumulated amortization of $
|
|
|
|
||||||||||||||
| Total - amortizable intangible assets, net |
|
$ |
|
|
|||||||||||||
The Company recorded amortization expense on its intangible assets of $
3.3
million for the three months ended September 30, 2022 and 2021, and $
8.6
million and $
19.9
million during the nine months ended September 30, 2022 and 2021, respectively.
The Company will continue to amortize intangible assets over their remaining useful lives. As of September 30, 2022, the Company estimates it will record amortization expense as follows:
| 2022 (October 1 - December 31) | $ |
|
|||
| 2023 |
|
||||
| 2024 |
|
||||
| 2025 |
|
||||
| 2026 |
|
||||
| 2027 and thereafter |
|
||||
| $ |
|
||||
8.
Goodwill
The carrying amount of goodwill by reportable operating segment was as follows:
| Loan Servicing and Systems | Education Technology, Services, and Payment Processing | Asset Generation and Management | Nelnet Bank | Corporate and Other Activities | Total | ||||||||||||||||||||||||||||||
| Balance as of December 31, 2021 and March 31, 2022 | $ |
|
|
|
|
|
|
||||||||||||||||||||||||||||
| Goodwill acquired during the period (NextGen) |
|
|
|
|
|
|
|||||||||||||||||||||||||||||
| Balance as of June 30, 2022 |
|
|
|
|
|
|
|||||||||||||||||||||||||||||
| Goodwill acquired during the period (GRNE Solar) |
|
|
|
|
|
|
|||||||||||||||||||||||||||||
| NextGen purchase price allocation adjustment |
|
|
|
|
|
|
|||||||||||||||||||||||||||||
| Balance as of September 30, 2022 | $ |
|
|
|
|
|
|
||||||||||||||||||||||||||||
23
9.
Earnings per Common Share
Presented below is a summary of the components used to calculate basic and diluted earnings per share. The Company applies the two-class method in computing both basic and diluted earnings per share, which requires the calculation of separate earnings per share amounts for common stock and unvested share-based awards. Unvested share-based awards that contain nonforfeitable rights to dividends are considered securities which participate in undistributed earnings with common stock.
| Three months ended September 30, | |||||||||||||||||||||||||||||||||||
| 2022 | 2021 | ||||||||||||||||||||||||||||||||||
| Common shareholders | Unvested restricted stock shareholders | Total | Common shareholders | Unvested restricted stock shareholders | Total | ||||||||||||||||||||||||||||||
| Numerator: | |||||||||||||||||||||||||||||||||||
| Net income attributable to Nelnet, Inc. | $ |
|
|
|
|
|
|
||||||||||||||||||||||||||||
| Denominator: | |||||||||||||||||||||||||||||||||||
| Weighted-average common shares outstanding - basic and diluted |
|
|
|
|
|
|
|||||||||||||||||||||||||||||
| Earnings per share - basic and diluted | $ |
|
|
|
|
|
|
||||||||||||||||||||||||||||
| Nine months ended September 30, | |||||||||||||||||||||||||||||||||||
| 2022 | 2021 | ||||||||||||||||||||||||||||||||||
| Common shareholders | Unvested restricted stock shareholders | Total | Common shareholders | Unvested restricted stock shareholders | Total | ||||||||||||||||||||||||||||||
| Numerator: | |||||||||||||||||||||||||||||||||||
| Net income attributable to Nelnet, Inc. | $ |
|
|
|
|
|
|
||||||||||||||||||||||||||||
| Denominator: | |||||||||||||||||||||||||||||||||||
| Weighted-average common shares outstanding - basic and diluted |
|
|
|
|
|
|
|||||||||||||||||||||||||||||
| Earnings per share - basic and diluted | $ |
|
|
|
|
|
|
||||||||||||||||||||||||||||
24
10.
Segment Reporting
See note 15 of the notes to consolidated financial statements included in the 2021 Annual Report for a description of the Company's operating segments.
The following tables include the results of each of the Company's operating segments reconciled to the consolidated financial statements.
| Three months ended September 30, 2022 | |||||||||||||||||||||||||||||||||||||||||
| Loan Servicing and Systems | Education Technology, Services, and Payment Processing |
Asset
Generation and Management |
Nelnet Bank | Corporate and Other Activities | Eliminations | Total | |||||||||||||||||||||||||||||||||||
| Total interest income | $ |
|
|
|
|
|
(
|
|
|||||||||||||||||||||||||||||||||
| Interest expense |
|
|
|
|
|
(
|
|
||||||||||||||||||||||||||||||||||
| Net interest income |
|
|
|
|
|
|
|
||||||||||||||||||||||||||||||||||
| Less provision (negative provision) for loan losses |
|
|
|
|
|
|
|
||||||||||||||||||||||||||||||||||
| Net interest income after provision for loan losses |
|
|
|
|
|
|
|
||||||||||||||||||||||||||||||||||
| Other income/expense: | |||||||||||||||||||||||||||||||||||||||||
| Loan servicing and systems revenue |
|
|
|
|
|
|
|
||||||||||||||||||||||||||||||||||
| Intersegment revenue |
|
|
|
|
|
(
|
|
||||||||||||||||||||||||||||||||||
| Education technology, services, and payment processing revenue |
|
|
|
|
|
|
|
||||||||||||||||||||||||||||||||||
| Solar construction revenue |
|
|
|
|
|
|
|
||||||||||||||||||||||||||||||||||
| Other |
|
|
|
|
(
|
|
|
||||||||||||||||||||||||||||||||||
| Gain on sale of loans |
|
|
|
|
|
|
|
||||||||||||||||||||||||||||||||||
| Impairment expense and provision for beneficial interests, net |
|
|
|
|
|
|
|
||||||||||||||||||||||||||||||||||
| Derivative settlements, net |
|
|
|
|
|
|
|
||||||||||||||||||||||||||||||||||
| Derivative market value adjustments, net |
|
|
|
|
|
|
|
||||||||||||||||||||||||||||||||||
| Total other income/expense |
|
|
|
|
|
(
|
|
||||||||||||||||||||||||||||||||||
| Cost of services: | |||||||||||||||||||||||||||||||||||||||||
| Cost to provide education technology, services, and payment processing services |
|
|
|
|
|
|
|
||||||||||||||||||||||||||||||||||
| Cost to provide solar construction services |
|
|
|
|
|
|
|
||||||||||||||||||||||||||||||||||
| Total cost of services |
|
|
|
|
|
|
|
||||||||||||||||||||||||||||||||||
| Operating expenses: | |||||||||||||||||||||||||||||||||||||||||
| Salaries and benefits |
|
|
|
|
|
|
|
||||||||||||||||||||||||||||||||||
| Depreciation and amortization |
|
|
|
|
|
|
|
||||||||||||||||||||||||||||||||||
| Other expenses |
|
|
|
|
|
|
|
||||||||||||||||||||||||||||||||||
| Intersegment expenses, net |
|
|
|
|
(
|
(
|
|
||||||||||||||||||||||||||||||||||
| Total operating expenses |
|
|
|
|
|
(
|
|
||||||||||||||||||||||||||||||||||
| Income (loss) before income taxes |
|
|
|
|
(
|
|
|
||||||||||||||||||||||||||||||||||
| Income tax (expense) benefit |
(
|
(
|
(
|
(
|
|
|
(
|
||||||||||||||||||||||||||||||||||
| Net income (loss) |
|
|
|
|
(
|
|
|
||||||||||||||||||||||||||||||||||
| Net (income) loss attributable to noncontrolling interests |
|
(
|
|
|
|
|
|
||||||||||||||||||||||||||||||||||
| Net income (loss) attributable to Nelnet, Inc. | $ |
|
|
|
|
(
|
|
|
|||||||||||||||||||||||||||||||||
| Total assets as of September 30, 2022 | $ |
|
|
|
|
|
(
|
|
|||||||||||||||||||||||||||||||||
25
| Three months ended September 30, 2021 | |||||||||||||||||||||||||||||||||||||||||
| Loan Servicing and Systems | Education Technology, Services, and Payment Processing |
Asset
Generation and Management |
Nelnet Bank | Corporate and Other Activities | Eliminations | Total | |||||||||||||||||||||||||||||||||||
| Total interest income | $ |
|
|
|
|
|
(
|
|
|||||||||||||||||||||||||||||||||
| Interest expense |
|
|
|
|
|
(
|
|
||||||||||||||||||||||||||||||||||
| Net interest income |
|
|
|
|
|
|
|
||||||||||||||||||||||||||||||||||
| Less provision (negative provision) for loan losses |
|
|
|
(
|
|
|
|
||||||||||||||||||||||||||||||||||
| Net interest income after provision for loan losses |
|
|
|
|
|
|
|
||||||||||||||||||||||||||||||||||
| Other income/expense: | |||||||||||||||||||||||||||||||||||||||||
| Loan servicing and systems revenue |
|
|
|
|
|
|
|
||||||||||||||||||||||||||||||||||
| Intersegment revenue |
|
|
|
|
|
(
|
|
||||||||||||||||||||||||||||||||||
| Education technology, services, and payment processing revenue |
|
|
|
|
|
|
|
||||||||||||||||||||||||||||||||||
| Solar construction revenue |
|
|
|
|
|
|
|
||||||||||||||||||||||||||||||||||
| Other |
|
|
(
|
|
|
|
|
||||||||||||||||||||||||||||||||||
| Gain on sale of loans |
|
|
|
|
|
|
|
||||||||||||||||||||||||||||||||||
| Impairment expense and provision for beneficial interests, net |
(
|
|
|
|
(
|
|
(
|
||||||||||||||||||||||||||||||||||
| Derivative settlements, net |
|
|
(
|
|
|
|
(
|
||||||||||||||||||||||||||||||||||
| Derivative market value adjustments, net |
|
|
|
|
|
|
|
||||||||||||||||||||||||||||||||||
| Total other income/expense |
|
|
(
|
|
|
(
|
|
||||||||||||||||||||||||||||||||||
| Cost of services: | |||||||||||||||||||||||||||||||||||||||||
| Cost to provide education technology, services, and payment processing services |
|
|
|
|
|
|
|
||||||||||||||||||||||||||||||||||
| Cost to provide solar construction services |
|
|
|
|
|
|
|
||||||||||||||||||||||||||||||||||
| Total cost of services |
|
|
|
|
|
|
|
||||||||||||||||||||||||||||||||||
| Operating expenses: | |||||||||||||||||||||||||||||||||||||||||
| Salaries and benefits |
|
|
|
|
|
|
|
||||||||||||||||||||||||||||||||||
| Depreciation and amortization |
|
|
|
|
|
|
|
||||||||||||||||||||||||||||||||||
| Other expenses |
|
|
|
|
|
|
|
||||||||||||||||||||||||||||||||||
| Intersegment expenses, net |
|
|
|
|
(
|
(
|
|
||||||||||||||||||||||||||||||||||
| Total operating expenses |
|
|
|
|
|
(
|
|
||||||||||||||||||||||||||||||||||
| Income (loss) before income taxes |
(
|
|
|
|
(
|
|
|
||||||||||||||||||||||||||||||||||
| Income tax (expense) benefit |
|
(
|
(
|
(
|
|
|
(
|
||||||||||||||||||||||||||||||||||
| Net income (loss) |
(
|
|
|
|
(
|
|
|
||||||||||||||||||||||||||||||||||
| Net (income) loss attributable to noncontrolling interests |
|
|
|
|
|
|
|
||||||||||||||||||||||||||||||||||
| Net income (loss) attributable to Nelnet, Inc. | $ |
(
|
|
|
|
(
|
|
|
|||||||||||||||||||||||||||||||||
| Total assets as of September 30, 2021 | $ |
|
|
|
|
|
(
|
|
|||||||||||||||||||||||||||||||||
26
| Nine months ended September 30, 2022 | |||||||||||||||||||||||||||||||||||||||||
| Loan Servicing and Systems | Education Technology, Services, and Payment Processing |
Asset
Generation and Management |
Nelnet Bank | Corporate and Other Activities | Eliminations | Total | |||||||||||||||||||||||||||||||||||
| Total interest income | $ |
|
|
|
|
|
(
|
|
|||||||||||||||||||||||||||||||||
| Interest expense |
|
|
|
|
|
(
|
|
||||||||||||||||||||||||||||||||||
| Net interest income |
|
|
|
|
|
|
|
||||||||||||||||||||||||||||||||||
| Less provision (negative provision) for loan losses |
|
|
|
|
|
|
|
||||||||||||||||||||||||||||||||||
| Net interest income after provision for loan losses |
|
|
|
|
|
|
|
||||||||||||||||||||||||||||||||||
| Other income/expense: | |||||||||||||||||||||||||||||||||||||||||
| Loan servicing and systems revenue |
|
|
|
|
|
|
|
||||||||||||||||||||||||||||||||||
| Intersegment revenue |
|
|
|
|
|
(
|
|
||||||||||||||||||||||||||||||||||
| Education technology, services, and payment processing revenue |
|
|
|
|
|
|
|
||||||||||||||||||||||||||||||||||
| Solar construction revenue |
|
|
|
|
|
|
|
||||||||||||||||||||||||||||||||||
| Other |
|
|
|
|
|
|
|
||||||||||||||||||||||||||||||||||
| Gain on sale of loans |
|
|
|
|
|
|
|
||||||||||||||||||||||||||||||||||
| Impairment expense and provision for beneficial interests, net |
|
|
|
|
(
|
|
(
|
||||||||||||||||||||||||||||||||||
| Derivative settlements, net |
|
|
|
|
|
|
|
||||||||||||||||||||||||||||||||||
| Derivative market value adjustments, net |
|
|
|
|
|
|
|
||||||||||||||||||||||||||||||||||
| Total other income/expense |
|
|
|
|
|
(
|
|
||||||||||||||||||||||||||||||||||
| Cost of services: | |||||||||||||||||||||||||||||||||||||||||
| Cost to provide education technology, services, and payment processing services |
|
|
|
|
|
|
|
||||||||||||||||||||||||||||||||||
| Cost to provide solar construction services |
|
|
|
|
|
|
|
||||||||||||||||||||||||||||||||||
| Total cost of services |
|
|
|
|
|
|
|
||||||||||||||||||||||||||||||||||
| Operating expenses: | |||||||||||||||||||||||||||||||||||||||||
| Salaries and benefits |
|
|
|
|
|
|
|
||||||||||||||||||||||||||||||||||
| Depreciation and amortization |
|
|
|
|
|
|
|
||||||||||||||||||||||||||||||||||
| Other expenses |
|
|
|
|
|
|
|
||||||||||||||||||||||||||||||||||
| Intersegment expenses, net |
|
|
|
|
(
|
(
|
|
||||||||||||||||||||||||||||||||||
| Total operating expenses |
|
|
|
|
|
(
|
|
||||||||||||||||||||||||||||||||||
| Income (loss) before income taxes |
|
|
|
|
(
|
|
|
||||||||||||||||||||||||||||||||||
| Income tax (expense) benefit |
(
|
(
|
(
|
(
|
|
|
(
|
||||||||||||||||||||||||||||||||||
| Net income (loss) |
|
|
|
|
(
|
|
|
||||||||||||||||||||||||||||||||||
| Net (income) loss attributable to noncontrolling interests |
|
(
|
|
|
|
|
|
||||||||||||||||||||||||||||||||||
| Net income (loss) attributable to Nelnet, Inc. | $ |
|
|
|
|
(
|
|
|
|||||||||||||||||||||||||||||||||
| Total assets as of September 30, 2022 | $ |
|
|
|
|
|
(
|
|
|||||||||||||||||||||||||||||||||
27
| Nine months ended September 30, 2021 | |||||||||||||||||||||||||||||||||||||||||
| Loan Servicing and Systems | Education Technology, Services, and Payment Processing |
Asset
Generation and Management |
Nelnet Bank | Corporate and Other Activities | Eliminations | Total | |||||||||||||||||||||||||||||||||||
| Total interest income | $ |
|
|
|
|
|
(
|
|
|||||||||||||||||||||||||||||||||
| Interest expense |
|
|
|
|
|
(
|
|
||||||||||||||||||||||||||||||||||
| Net interest income |
|
|
|
|
|
|
|
||||||||||||||||||||||||||||||||||
| Less provision (negative provision) for loan losses |
|
|
(
|
|
|
|
(
|
||||||||||||||||||||||||||||||||||
| Net interest income after provision for loan losses |
|
|
|
|
|
|
|
||||||||||||||||||||||||||||||||||
| Other income/expense: | |||||||||||||||||||||||||||||||||||||||||
| Loan servicing and systems revenue |
|
|
|
|
|
|
|
||||||||||||||||||||||||||||||||||
| Intersegment revenue |
|
|
|
|
|
(
|
|
||||||||||||||||||||||||||||||||||
| Education technology, services, and payment processing revenue |
|
|
|
|
|
|
|
||||||||||||||||||||||||||||||||||
| Solar construction revenue |
|
|
|
|
|
|
|
||||||||||||||||||||||||||||||||||
| Other |
|
|
(
|
|
|
|
|
||||||||||||||||||||||||||||||||||
| Gain on sale of loans |
|
|
|
|
|
|
|
||||||||||||||||||||||||||||||||||
| Impairment expense and provision for beneficial interests, net |
(
|
|
|
|
(
|
|
(
|
||||||||||||||||||||||||||||||||||
| Derivative settlements, net |
|
|
(
|
|
|
|
(
|
||||||||||||||||||||||||||||||||||
| Derivative market value adjustments, net |
|
|
|
|
|
|
|
||||||||||||||||||||||||||||||||||
| Total other income/expense |
|
|
|
|
|
(
|
|
||||||||||||||||||||||||||||||||||
| Cost of services: | |||||||||||||||||||||||||||||||||||||||||
| Cost to provide education technology, services, and payment processing services |
|
|
|
|
|
|
|
||||||||||||||||||||||||||||||||||
| Cost to provide solar construction services |
|
|
|
|
|
|
|
||||||||||||||||||||||||||||||||||
| Total cost of services |
|
|
|
|
|
|
|
||||||||||||||||||||||||||||||||||
| Operating expenses: | |||||||||||||||||||||||||||||||||||||||||
| Salaries and benefits |
|
|
|
|
|
|
|
||||||||||||||||||||||||||||||||||
| Depreciation and amortization |
|
|
|
|
|
|
|
||||||||||||||||||||||||||||||||||
| Other expenses |
|
|
|
|
|
|
|
||||||||||||||||||||||||||||||||||
| Intersegment expenses, net |
|
|
|
|
(
|
(
|
|
||||||||||||||||||||||||||||||||||
| Total operating expenses |
|
|
|
|
|
(
|
|
||||||||||||||||||||||||||||||||||
| Income (loss) before income taxes |
|
|
|
(
|
(
|
|
|
||||||||||||||||||||||||||||||||||
| Income tax (expense) benefit |
(
|
(
|
(
|
|
|
|
(
|
||||||||||||||||||||||||||||||||||
| Net income (loss) |
|
|
|
(
|
(
|
|
|
||||||||||||||||||||||||||||||||||
| Net (income) loss attributable to noncontrolling interests |
|
|
|
|
|
|
|
||||||||||||||||||||||||||||||||||
| Net income (loss) attributable to Nelnet, Inc. | $ |
|
|
|
(
|
(
|
|
|
|||||||||||||||||||||||||||||||||
| Total assets as of September 30, 2021 | $ |
|
|
|
|
|
(
|
|
|||||||||||||||||||||||||||||||||
28
11.
Disaggregated Revenue
The following tables provide disaggregated revenue by service offering and/or customer type for the Company's fee-based reportable operating segments.
Loan Servicing and Systems
| Three months ended September 30, | Nine months ended September 30, | ||||||||||||||||||||||
| 2022 | 2021 | 2022 | 2021 | ||||||||||||||||||||
| Government servicing | $ |
|
|
|
|
||||||||||||||||||
| Private education and consumer loan servicing |
|
|
|
|
|||||||||||||||||||
| FFELP servicing |
|
|
|
|
|||||||||||||||||||
| Software services |
|
|
|
|
|||||||||||||||||||
| Outsourced services and other |
|
|
|
|
|||||||||||||||||||
| Loan servicing and systems revenue | $ |
|
|
|
|
||||||||||||||||||
Education Technology, Services, and Payment Processing
| Three months ended September 30, | Nine months ended September 30, | ||||||||||||||||||||||
| 2022 | 2021 | 2022 | 2021 | ||||||||||||||||||||
| Tuition payment plan services | $ |
|
|
|
|
||||||||||||||||||
| Payment processing |
|
|
|
|
|||||||||||||||||||
| Education technology and services |
|
|
|
|
|||||||||||||||||||
| Other |
|
|
|
|
|||||||||||||||||||
| Education technology, services, and payment processing revenue | $ |
|
|
|
|
||||||||||||||||||
Other Income/Expense
The following table provides the components of "other" in "other income/expense" on the consolidated statements of income:
| Three months ended September 30, | Nine months ended September 30, | ||||||||||||||||||||||
| 2022 | 2021 | 2022 | 2021 | ||||||||||||||||||||
| Income/gains from investments, net | $ |
|
|
|
|
||||||||||||||||||
| Borrower late fee income |
|
|
|
|
|||||||||||||||||||
| ALLO preferred return |
|
|
|
|
|||||||||||||||||||
| Administration/sponsor fee income |
|
|
|
|
|||||||||||||||||||
| Investment advisory services |
|
|
|
|
|||||||||||||||||||
| Loss from ALLO voting membership interest investment |
(
|
(
|
(
|
(
|
|||||||||||||||||||
| Loss from solar investments |
(
|
(
|
(
|
(
|
|||||||||||||||||||
| Other |
|
|
|
|
|||||||||||||||||||
| $ |
|
|
|
|
|||||||||||||||||||
12.
Major Customer
The Company earns loan servicing revenue from servicing contracts with the Department. Revenues earned by the Company related to these contracts are set forth in the "Government servicing" line item of the "Loan Servicing and Systems" table in note 11.
The Company's student loan servicing contracts with the Department are scheduled to expire on December 14, 2023. In 2017, the Department initiated a contract procurement process referred to as the Next Generation Financial Services Environment for a new framework for the servicing of all student loans owned by the Department. The Consolidated Appropriations Act, 2021 contains provisions directing certain aspects of the process, including that any new federal student loan servicing environment is required to provide for the participation of multiple student loan servicers and the allocation of borrower accounts to eligible student loan servicers based on performance. In the second quarter of 2022, the Department released a solicitation entitled Unified Servicing and Data Solution ("USDS") for the new servicing framework. The Company responded to the USDS
29
solicitation. The Company cannot predict the timing, nature, or ultimate outcome of this or any other contract procurement process by the Department.
On August 24, 2022, the Department issued a bulletin titled “Biden-Harris Administration Announces Final Student Loan Pause Extension Through December 31 and Targeted Debt Cancellation to Smooth Transition to Repayment” (the “August 24, 2022 Bulletin”). The August 24, 2022 Bulletin indicates the Department will provide targeted student debt cancellation to borrowers with loans held by the Department, and that borrowers whose annual income for either 2020 or 2021 was under $125,000 (for single or married, filing separately) or under $250,000 (for married couples, filing jointly or heads of household) will be eligible for otherwise unconditional loan cancellation in amounts of up to $20,000 for eligible borrowers who received a Pell Grant, or of up to $10,000 for eligible borrowers who did not receive a Pell Grant. On October 21, 2022, the U.S. Court of Appeals for the Eighth Circuit issued a temporary administrative stay of implementation of the Department's student debt relief plan in response to a legal challenge that was initiated by other parties (not the Company).
As of September 30, 2022, the Company was servicing
15.7
million borrowers under its government servicing contracts. The Company cannot currently estimate how many borrowers meet the eligibility requirements and other terms and conditions for one-time debt relief under the August 24, 2022 Bulletin and subsequent publicly available guidance provided by the Department. However, revenue earned by the Company under its contracts will be negatively impacted if the Department’s student debt relief plan or other broad based loan forgiveness is implemented.
30
13.
Fair Value
The following tables present the Company’s financial assets and liabilities that are measured at fair value on a recurring basis.
| As of September 30, 2022 | As of December 31, 2021 | ||||||||||||||||||||||||||||||||||
| Level 1 | Level 2 | Total | Level 1 | Level 2 | Total | ||||||||||||||||||||||||||||||
| Assets: | |||||||||||||||||||||||||||||||||||
| Investments: | |||||||||||||||||||||||||||||||||||
| FFELP loan asset-backed debt securities - available-for-sale | $ |
|
|
|
|
|
|
||||||||||||||||||||||||||||
| Private education loan asset-backed debt securities - available-for-sale |
|
|
|
|
|
|
|||||||||||||||||||||||||||||
| Other debt securities - available-for-sale |
|
|
|
|
|
|
|||||||||||||||||||||||||||||
| Equity securities |
|
|
|
|
|
|
|||||||||||||||||||||||||||||
| Equity securities measured at net asset value (a) |
|
|
|||||||||||||||||||||||||||||||||
| Total investments |
|
|
|
|
|
|
|||||||||||||||||||||||||||||
| Total assets | $ |
|
|
|
|
|
|
||||||||||||||||||||||||||||
(a) In accordance with the Fair Value Measurements Topic of the FASB Accounting Standards Codification, certain investments that are measured at fair value using the net asset value per share (or its equivalent) practical expedient have not been classified in the fair value hierarchy.
The following table summarizes the fair values of all of the Company’s financial instruments on the consolidated balance sheets:
| As of September 30, 2022 | |||||||||||||||||||||||||||||
| Fair value | Carrying value | Level 1 | Level 2 | Level 3 | |||||||||||||||||||||||||
| Financial assets: | |||||||||||||||||||||||||||||
| Loans receivable | $ |
|
|
|
|
|
|||||||||||||||||||||||
| Accrued loan interest receivable |
|
|
|
|
|
||||||||||||||||||||||||
| Cash and cash equivalents |
|
|
|
|
|
||||||||||||||||||||||||
| Investments (at fair value) |
|
|
|
|
|
||||||||||||||||||||||||
| Beneficial interest in loan securitizations |
|
|
|
|
|
||||||||||||||||||||||||
| Restricted cash |
|
|
|
|
|
||||||||||||||||||||||||
| Restricted cash – due to customers |
|
|
|
|
|
||||||||||||||||||||||||
| Financial liabilities: | |||||||||||||||||||||||||||||
| Bonds and notes payable |
|
|
|
|
|
||||||||||||||||||||||||
| Accrued interest payable |
|
|
|
|
|
||||||||||||||||||||||||
| Bank deposits |
|
|
|
|
|
||||||||||||||||||||||||
| Due to customers |
|
|
|
|
|
||||||||||||||||||||||||
| As of December 31, 2021 | |||||||||||||||||||||||||||||
| Fair value | Carrying value | Level 1 | Level 2 | Level 3 | |||||||||||||||||||||||||
| Financial assets: | |||||||||||||||||||||||||||||
| Loans receivable | $ |
|
|
|
|
|
|||||||||||||||||||||||
| Accrued loan interest receivable |
|
|
|
|
|
||||||||||||||||||||||||
| Cash and cash equivalents |
|
|
|
|
|
||||||||||||||||||||||||
| Investments (at fair value) |
|
|
|
|
|
||||||||||||||||||||||||
| Beneficial interest in loan securitizations |
|
|
|
|
|
||||||||||||||||||||||||
| Restricted cash |
|
|
|
|
|
||||||||||||||||||||||||
| Restricted cash – due to customers |
|
|
|
|
|
||||||||||||||||||||||||
| Financial liabilities: | |||||||||||||||||||||||||||||
| Bonds and notes payable |
|
|
|
|
|
||||||||||||||||||||||||
| Accrued interest payable |
|
|
|
|
|
||||||||||||||||||||||||
| Bank deposits |
|
|
|
|
|
||||||||||||||||||||||||
| Due to customers |
|
|
|
|
|
||||||||||||||||||||||||
The methodologies for estimating the fair value of financial assets and liabilities are described in note 22 of the notes to consolidated financial statements included in the 2021 Annual Report.
31
ITEM 2. MANAGEMENT’S DISCUSSION AND ANALYSIS OF FINANCIAL CONDITION AND RESULTS OF OPERATIONS
(Management’s Discussion and Analysis of Financial Condition and Results of Operations is for the three and nine months ended September 30, 2022 and 2021. All dollars are in thousands, except per share amounts, unless otherwise noted.)
The following discussion and analysis provides information that the Company’s management believes is relevant to an assessment and understanding of the consolidated results of operations and financial condition of the Company. The discussion should be read in conjunction with the Company’s consolidated financial statements included in the 2021 Annual Report.
Forward-looking and cautionary statements
This report contains forward-looking statements and information that are based on management's current expectations as of the date of this document. Statements that are not historical facts, including statements about the Company's plans and expectations for future financial condition, results of operations or economic performance, or that address management's plans and objectives for future operations, and statements that assume or are dependent upon future events, are forward-looking statements. The words “anticipate,” “assume,” “believe,” “continue,” “could,” “estimate,” “expect,” “forecast,” “future,” “intend,” “may,” “plan,” “potential,” “predict,” “scheduled,” “should,” “will,” “would,” and similar expressions, as well as statements in future tense, are intended to identify forward-looking statements.
The forward-looking statements are based on assumptions and analyses made by management in light of management's experience and its perception of historical trends, current conditions, expected future developments, and other factors that management believes are appropriate under the circumstances. These statements are subject to known and unknown risks, uncertainties, assumptions, and other factors that may cause the actual results and performance to be materially different from any future results or performance expressed or implied by such forward-looking statements. These factors include, among others, the risks and uncertainties set forth in the “Risk Factors” section of the 2021 Annual Report, the "Risk Factors" section of this report, and elsewhere in this report, and include such risks and uncertainties as:
•
risks and uncertainties related to the duration, ultimate severity, and continuing impacts of the coronavirus disease 2019 (“COVID-19”) pandemic, including changes in the macroeconomic environment and consumer behavior, restrictions on various activities intended to combat the pandemic, and volatility in market conditions resulting from the pandemic, including interest rates, the value of equities, and other financial assets;
•
risks related to the ability to successfully maintain and increase allocated volumes of student loans serviced by the Company under existing and any future servicing contracts with the U.S. Department of Education (the "Department"), which current contracts accounted for 29 percent of the Company's revenue in 2021, risks to the Company related to the Biden-Harris Administration's student debt relief plan announced on August 24, 2022 that may significantly decrease the number of borrowers serviced and revenue earned by the Company under such contracts, risks to the Company related to the Department's initiatives to procure new contracts for federal student loan servicing, including the pending and uncertain nature of the Department's procurement process, risks that the Company may not be successful in obtaining any of such potential new contracts, and risks related to the Company's ability to comply with agreements with third-party customers for the servicing of Federal Direct Loan Program, Federal Family Education Loan Program (the "FFEL Program" or "FFELP"), private education, and consumer loans;
•
loan portfolio risks such as interest rate basis and repricing risk resulting from the fact that the interest rate characteristics of the student loan assets do not match the interest rate characteristics of the funding for those assets, the risk of loss of floor income on certain student loans originated under the FFEL Program, risks related to the use of derivatives to manage exposure to interest rate fluctuations, uncertainties regarding the expected benefits from purchased securitized and unsecuritized FFELP, private education, consumer, and other loans, or investment interests therein, and initiatives to purchase additional FFELP, private education, consumer, and other loans, and risks from changes in levels of loan prepayment or default rates;
•
financing and liquidity risks, including risks of changes in the interest rate environment, such as risks from the recent increases in interest rates resulting from inflationary pressures and the transition from LIBOR to an alternative reference rate, and changes in the securitization and other financing markets for loans, including adverse changes resulting from recent market volatility resulting from rising interest rates and other economic pressures and from unanticipated repayment trends on student loans in the Company's securitization trusts that could accelerate or delay repayment of the associated bonds, which may increase the costs or limit the availability of financings necessary to purchase, refinance, or continue to hold student loans;
32
•
risks from changes in the terms of education loans and in the educational credit and services markets resulting from changes in applicable laws, regulations, and government programs and budgets, such as changes resulting from the Coronavirus Aid, Relief, and Economic Security Act (the "CARES Act") and the expected decline over time in FFELP loan interest income due to the discontinuation of new FFELP loan originations in 2010 and government initiatives or proposals to consolidate existing FFELP loans to Federal Direct Loan Program loans, otherwise encourage or allow FFELP loans to be refinanced with Federal Direct Loan Program loans, and/or create additional loan forgiveness or broad debt cancellation programs;
•
risks related to a breach of or failure in the Company's operational or information systems or infrastructure, or those of third-party vendors, including cybersecurity risks related to a disclosure of confidential loan borrower and other customer information, the potential disruption of the Company's systems or those of third-party vendors or customers, and/or the potential damage to the Company's reputation resulting from cyber-breaches;
•
uncertainties inherent in forecasting future cash flows from student loan assets and related asset-backed securitizations;
•
risks and uncertainties of the expected benefits from the November 2020 launch of Nelnet Bank operations, including the ability to successfully conduct banking operations and achieve expected market penetration;
•
risks related to the expected benefits to the Company from its continuing investment in ALLO Holdings, LLC (referred to collectively with its subsidiary ALLO Communications LLC as "ALLO"), and risks related to investments in solar projects, including risks of not being able to realize tax credits which remain subject to recapture by taxing authorities;
•
risks and uncertainties related to other initiatives to pursue additional strategic investments (and anticipated income therefrom), acquisitions, and other activities, including activities that are intended to diversify the Company both within and outside of its historical core education-related businesses;
•
risks and uncertainties associated with climate change, including extreme weather events and related natural disasters, which could result in increased loan portfolio credit risks and other asset and operational risks, as well as risks and uncertainties associated with efforts to address climate change; and
•
risks and uncertainties associated with litigation matters and with maintaining compliance with the extensive regulatory requirements applicable to the Company's businesses, reputational and other risks, including the risk of increased regulatory costs resulting from the politicization of student loan servicing, and uncertainties inherent in the estimates and assumptions about future events that management is required to make in the preparation of the Company's consolidated financial statements.
All forward-looking statements contained in this report are qualified by these cautionary statements and are made only as of the date of this document. Although the Company may from time to time voluntarily update or revise its prior forward-looking statements to reflect actual results or changes in the Company's expectations, the Company disclaims any commitment to do so except as required by law.
33
OVERVIEW
The Company is a diverse, innovative company with a purpose to serve others and a vision to make dreams possible. The largest operating businesses engage in loan servicing and education technology, services, and payment processing, and the Company also has a significant investment in communications. A significant portion of the Company's revenue is net interest income earned on a portfolio of federally insured student loans. The Company also makes investments to further diversify both within and outside of its historical core education-related businesses including, but not limited to, investments in early-stage and emerging growth companies, real estate, and renewable energy (solar). The Company is also actively expanding its private education, consumer, and other loan portfolios, and in November 2020 launched Nelnet Bank.
GAAP Net Income and Non-GAAP Net Income, Excluding Adjustments
The Company prepares its financial statements and presents its financial results in accordance with GAAP. However, it also provides additional non-GAAP financial information related to specific items management believes to be important in the evaluation of its operating results and performance. A reconciliation of the Company's GAAP net income to net income, excluding derivative market value adjustments, and a discussion of why the Company believes providing this additional information is useful to investors, is provided below.
| Three months ended September 30, | Nine months ended September 30, | ||||||||||||||||||||||
| 2022 | 2021 | 2022 | 2021 | ||||||||||||||||||||
|
GAAP net income attributable to Nelnet, Inc.
|
$ | 104,798 | 53,138 | 376,573 | 260,603 | ||||||||||||||||||
|
Realized and unrealized derivative market value adjustments
|
(52,991) | (7,260) | (239,125) | (44,455) | |||||||||||||||||||
|
Tax effect (a)
|
12,718 | 1,742 | 57,390 | 10,669 | |||||||||||||||||||
|
Net income attributable to Nelnet, Inc., excluding derivative market value adjustments (b)
|
$ | 64,525 | 47,620 | 194,838 | 226,817 | ||||||||||||||||||
|
Earnings per share:
|
|||||||||||||||||||||||
|
GAAP net income attributable to Nelnet, Inc.
|
$ | 2.80 | 1.38 | 9.99 | 6.74 | ||||||||||||||||||
|
Realized and unrealized derivative market value adjustments
|
(1.42) | (0.19) | (6.34) | (1.15) | |||||||||||||||||||
|
Tax effect (a)
|
0.35 | 0.04 | 1.52 | 0.28 | |||||||||||||||||||
|
Net income attributable to Nelnet, Inc., excluding derivative market value adjustments (b)
|
$ | 1.73 | 1.23 | 5.17 | 5.87 | ||||||||||||||||||
(a) The tax effects are calculated by multiplying the realized and unrealized derivative market value adjustments by the applicable statutory income tax rate.
(b) "Derivative market value adjustments" includes both the realized portion of gains and losses (corresponding to variation margin received or paid on derivative instruments that are settled daily at a central clearinghouse) and the unrealized portion of gains and losses that are caused by changes in fair values of derivatives which do not qualify for "hedge treatment" under GAAP. "Derivative market value adjustments" does not include "derivative settlements" that represent the cash paid or received during the current period to settle with derivative instrument counterparties the economic effect of the Company's derivative instruments based on their contractual terms.
The accounting for derivatives requires that changes in the fair value of derivative instruments be recognized currently in earnings, with no fair value adjustment of the hedged item, unless specific hedge accounting criteria is met. Management has structured all of the Company’s derivative transactions with the intent that each is economically effective; however, the Company’s derivative instruments do not qualify for hedge accounting. As a result, the change in fair value of derivative instruments is reported in current period earnings with no consideration for the corresponding change in fair value of the hedged item. Under GAAP, the cumulative net realized and unrealized gain or loss caused by changes in fair values of derivatives in which the Company plans to hold to maturity will equal zero over the life of the contract. However, the net realized and unrealized gain or loss during any given reporting period fluctuates significantly from period to period.
The
Comp
any believes these point-in-time estimates of asset and liability values related to its derivative instruments that are subject to interest rate fluctuations are subject to volatility mostly due to timing and market factors beyond the control of management, and affect the period-to-period comparability of the results of operations. Accordingly, the Company’s management utilizes operating results excluding these items for comparability purposes when making decisions regarding the Company’s performance and in presentations with credit rating agencies, lenders, and investors. Consequently, the Company reports this non-GAAP information because the Company believes that it provides additional information regarding operational and performance indicators that are closely assessed by management. There is no comprehensive, authoritative guidance for the presentation of such non-GAAP information, which is only meant to supplement GAAP results by providing additional information that management utilizes to assess performance.
34
Operating Segments
The Company's reportable operating segments are described in note 1 of the notes to consolidated financial statements included in the 2021 Annual Report. They include:
•
Loan Servicing and Systems ("LSS") - referred to as Nelnet Diversified Services ("NDS")
•
Education Technology, Services, and Payment Processing ("ETS&PP") - referred to as Nelnet Business Services ("NBS")
•
Asset Generation and Management ("AGM")
•
Nelnet Bank
The Company earns fee-based revenue through its NDS and NBS operating segments. The Company earns net interest income on its loan portfolio, consisting primarily of FFELP loans, in its AGM operating segment. This segment is expected to generate significant amounts of cash as the FFELP portfolio amortizes. The Company actively works to maximize the amount and timing of cash flows generated by its FFELP portfolio and seeks to acquire additional loan assets to leverage its servicing scale and expertise to generate incremental earnings and cash flow.
On November 2, 2020, the Company obtained final approval for federal deposit insurance from the Federal Deposit Insurance Corporation ("FDIC") and for a bank charter from the Utah Department of Financial Institutions ("UDFI") in connection with the establishment of Nelnet Bank, and Nelnet Bank launched operations. Nelnet Bank operates as an internet industrial bank franchise focused on the private education loan marketplace, with a home office in Salt Lake City, Utah.
Other business activities and operating segments that are not reportable are combined and included in Corporate and Other Activities ("Corporate"). Corporate and Other Activities also includes income earned on certain investments and interest expense incurred on unsecured and other corporate related debt transactions. On July 1, 2022, the Company purchased 80 percent of the ownership interests of GRNE Solar. See note 6 of the notes to consolidated financial statements included under Part I, Item 1 of this report. The operating results from this acquisition are also included in Corporate.
The information below provides the operating results (income (loss) before income taxes) for each reportable operating segment and Corporate and Other Activities for the three and nine months ended September 30, 2022 and 2021. See "Results of Operations" for each reportable operating segment under this Item 2 for additional detail.
| Three months ended September 30, | |||||||||||||||||
| 2022 | 2021 |
Certain Items Impacting Comparability
(All dollar amounts below are pre-tax) |
|||||||||||||||
| NDS | $ | 21,914 | (3,042) |
•
The recognition of an impairment charge of $13.2 million in the third quarter of 2021 related primarily to building and building improvement assets due to an evaluation of the use of office space as a large number of employees continued to work from home as a result of the COVID-19 pandemic
|
|||||||||||||
| NBS | 18,655 | 13,992 |
•
The recognition of $3.7 million of interest income in the third quarter of 2022 as compared to $0.3 million in the same period of 2021 due to higher interest rates
|
||||||||||||||
| AGM | 111,872 | 60,085 |
•
A net gain of $53.0 million related to changes in the fair values of derivative instruments that do not qualify for hedge accounting in the third quarter of 2022 as compared to a net gain of $7.3 million for the same period in 2021
•
An increase of $6.2 million in net interest income due to an increase in FFELP core loan spread in 2022 as compared to 2021
•
A decrease of $14.3 million in net interest income due to the decrease in the average balance of FFELP loans in the third quarter of 2022 as compared to 2021
•
The recognition of a $6.3 million investment loss during the third quarter of 2021
|
||||||||||||||
| Nelnet Bank | 1,055 | 836 | |||||||||||||||
| Corporate | (26,442) | (5,003) |
•
The recognition of a net loss of $17.6 million in the third quarter of 2022 related to the Company’s investment in ALLO, as compared to a net loss of $10.5 million for the same period in 2021
•
Investment income of $10.5 million in the third quarter of 2022 as compared to $21.9 million for the same period in 2021. In 2022, the Company recognized $5.9 million in gains from the sale of real estate investments, as compared to $11.2 million in 2021. In addition, the Company recognized $5.8 million in net realized and unrealized gains from marketable securities in 2021.
|
||||||||||||||
| Income before income taxes | 127,055 | 66,868 | |||||||||||||||
| Income tax expense | (26,586) | (15,649) | |||||||||||||||
| Net loss attributable to noncontrolling interests | 4,329 | 1,919 | |||||||||||||||
| Net income | $ | 104,798 | 53,138 | ||||||||||||||
35
| Nine months ended September 30, | |||||||||||||||||
| 2022 | 2021 |
Certain Items Impacting Comparability
(All dollar amounts below are pre-tax) |
|||||||||||||||
| NDS | $ | 47,494 | 28,554 |
•
The recognition of an impairment charge of $13.2 million in the third quarter of 2021 related primarily to building and building improvement assets due to an evaluation of the use of office space as a large number of employees continued to work from home as a result of the COVID-19 pandemic
|
|||||||||||||
| NBS | 66,454 | 62,199 |
•
The recognition of $4.9 million of interest income in the first three quarters of 2022 as compared to $0.8 million in the same period of 2021 due to higher interest rates
|
||||||||||||||
| AGM | 424,647 | 280,613 |
•
A net gain of $239.1 million related to changes in the fair values of derivative instruments that do not qualify for hedge accounting in the first three quarters of 2022 as compared to a net gain of $44.5 million for the same period in 2021
•
A decrease of $23.8 million in interest expense during the first quarter of 2021 as a result of the Company reversing a historical accrued interest liability on certain bonds, which liability the Company determined is no longer probable of being required to be paid
•
The recognition of provision for loan losses of $17.2 million in the first three quarters of 2022 as compared to negative provision of $11.2 million for the same period in 2021
•
The recognition of $18.7 million of gains from the sale of loans during the first three quarters of 2021 compared to $5.6 million for the same period in 2022
•
An increase of $13.5 million in net interest income due to an increase in FFELP core loan spread in 2022 as compared to 2021
•
A decrease of $32.4 million in net interest income due to the decrease in the average balance of FFELP loans in the first three quarters of 2022 as compared to 2021
|
||||||||||||||
| Nelnet Bank | 2,489 | (686) | |||||||||||||||
| Corporate | (65,061) | (36,796) |
•
The recognition of a net loss of $47.6 million for the first three quarters of 2022 related to the Company’s investment in ALLO, as compared to a net loss of $31.6 million for the same period in 2021
•
Investment income of $37.2 million for the first three quarters of 2022 as compared to $43.7 million for the same period in 2021. Investment income in 2022 included $13.5 million in gains from the sale of real estate investments and a $15.2 million gain as a result of the revaluation of the Company's previously held 50 percent ownership interests in NextGen. In 2021, the Company recognized $22.2 million from the sale of real estate investments and $6.3 million in net realized and unrealized gains from marketable securities.
•
The recognition of an impairment charge of $6.3 million in the second quarter of 2022 related primarily to a venture capital investment and certain real estate leases (as the Company continues to downsize its facility footprint as a result of associates working from home)
|
||||||||||||||
| Income before income taxes | 476,023 | 333,883 | |||||||||||||||
| Income tax expense | (107,765) | (76,747) | |||||||||||||||
| Net loss attributable to noncontrolling interests | 8,315 | 3,467 | |||||||||||||||
| Net income | $ | 376,573 | 260,603 | ||||||||||||||
Recent Developments
On August 24, 2022, the Department issued a bulletin titled “Biden-Harris Administration Announces Final Student Loan Pause Extension Through December 31 and Targeted Debt Cancellation to Smooth Transition to Repayment” (the “August 24, 2022 Bulletin”). The August 24, 2022 Bulletin extends the CARES Act repayment pause on Department held student loans through December 31, 2022 and indicates the Department will provide targeted student debt cancellation to borrowers with loans held by the Department, and that borrowers whose annual income for either 2020 or 2021 was under $125,000 (for single or married, filing separately) or under $250,000 (for married couples, filing jointly or heads of household) will be eligible for otherwise unconditional loan cancellation in amounts of up to $20,000 for eligible borrowers who received a Pell Grant, or of up to $10,000 for eligible borrowers who did not receive a Pell Grant.
Following the initial announcement, the Department provided more specific publicly available guidance on the student debt relief plan through the website of the Department’s Office of Federal Student Aid (“FSA”) on September 29, 2022, which guidance was subsequently revised and published in the Federal Register on October 12, 2022. As of November 7, 2022, the following guidance on loan forgiveness was provided on the FSA website (information on the FSA website is not incorporated by reference in this report):
•
All loans eligible for the CARES Act student loan payment pause are also eligible for debt relief, including loans held by the Department and guaranty agencies
36
•
As of September 29, 2022, borrowers with federal student loans not held by the Department cannot obtain one-time debt relief by consolidating those loans into Federal Direct Loan Program loans by the Department
•
Borrowers with FFEL Program loans not held by the Department and who applied to consolidate into the Federal Direct Loan Program prior to September 29, 2022, are eligible for one-time debt relief through the Federal Direct Loan Program, subject to meeting the other terms and conditions
•
The Department has indicated it is assessing whether there are alternative pathways to provide relief to borrowers with federal student loans not held by the Department, including FFEL Program loans
On October 21, 2022, the U.S. Court of Appeals for the Eighth Circuit issued a temporary administrative stay of implementation of the Department's student debt relief plan in response to a legal challenge that was initiated by other parties (not the Company).
In view of this recent announcement and guidance by the Department, the Company does not currently expect there to be significant FFELP loan consolidation activity specifically as a result of the one-time student debt relief plan announced in the August 24, 2022 Bulletin. However, since late 2021, the Company has experienced accelerated run-off of its FFELP portfolio due to FFELP borrowers consolidating their loans into Federal Direct Loan Program loans as a result of the continued extension of the CARES Act payment pause on Department held loans and the initiatives offered by the Department for FFELP borrowers to consolidate their loans to qualify for loan forgiveness under the Public Service Loan Forgiveness and other programs. Sustained higher FFELP loan prepayments will impact net interest income in the Company’s AGM operating segment, FFELP servicing revenue in the Company’s LSS operating segment, investment advisory services revenue earned by the Company’s SEC-registered investment advisor subsidiary (Whitetail Rock Capital Management, LLC) on FFELP loan asset-backed securities under management, and interest income earned on the Company’s FFELP loan asset-backed securities investments in future periods.
In addition, as of September 30, 2022, the Company was servicing 15.7 million borrowers under its government servicing contracts. The Company cannot currently estimate how many borrowers meet the eligibility requirements and other terms and conditions for one-time debt relief under the August 24, 2022 Bulletin and subsequent guidance provided by the Department. However, revenue earned by the Company under its contracts will be negatively impacted if the Department’s student debt relief plan or other broad based loan forgiveness is implemented.
See Part II, Item 1A, “Risk Factors - Our largest fee-based customer, the Department of Education, represented 29 percent of our revenue in 2021. Failure to extend the Department contracts or obtain new Department contracts in the Department's current or other procurement processes, our inability to consistently surpass competitor performance metrics, unfavorable contract modifications or interpretations, or the loss of servicing borrower volume due to broad based debt cancellation by the Department, could significantly lower servicing revenue and hinder future service opportunities.” and “- Our loan portfolio is subject to prepayment risk, which could reduce the expected cash flows and earnings on our portfolio.” in this report for additional information.
Impact of COVID-19
The COVID-19 pandemic has had a significant impact on the economic environment globally and in the U.S. There is uncertainty as to the length and breadth of the impact to the U.S. economy and, consequently, on the Company. As a related matter, on August 24, 2022, the Department announced that the suspension under the CARES Act on federal student loan payments and interest accruals on all loans owned by the Department was extended through December 31, 2022.
For a further overview discussion of the impact of the COVID-19 pandemic on the Company, see Part II, Item 7. "Management's Discussion and Analysis of Financial Condition and Results of Operations - Overview - Recent Transactions/Developments - COVID-19" in the 2021 Annual Report. In addition, for an additional discussion regarding the risks associated with COVID-19, see Part I, Item 1A. "Risk Factors - Operations - The COVID-19 pandemic has adversely impacted our results of operations, and either directly or indirectly through impacts on economic conditions or government policy could adversely impact our results of operations, businesses, financial condition, and/or cash flows going forward." in the 2021 Annual Report.
37
CONSOLIDATED RESULTS OF OPERATIONS
An analysis of the Company's consolidated operating results for the three and nine months ended September 30, 2022 compared to the same periods in 2021 is provided below.
The Company’s operating results are primarily driven by the performance of its existing loan portfolio and the revenues generated by its fee-based businesses and the costs to provide such services. The performance of the Company’s portfolio is driven by net interest income (which includes financing costs) and losses related to credit quality of the assets, along with the cost to administer and service the assets and related debt.
The Company operates as distinct reportable operating segments as described above. For a reconciliation of the reportable segment operating results to the consolidated results of operations, see note 10 of the notes to consolidated financial statements included under Part I, Item 1 of this report. Since the Company monitors and assesses its operations and results based on these segments, the discussion following the consolidated results of operations is presented on a reportable segment basis.
| Three months ended | Nine months ended | ||||||||||||||||||||||||||||
| September 30, | September 30, | ||||||||||||||||||||||||||||
| 2022 | 2021 | 2022 | 2021 | Additional information | |||||||||||||||||||||||||
| Loan interest | $ | 176,244 | 124,096 | 422,327 | 370,219 | Increase was due to an increase in the gross yield earned on loans, partially offset by a decrease in the average balance of loans and in gross fixed rate floor income. | |||||||||||||||||||||||
| Investment interest | 26,889 | 12,558 | 57,589 | 29,122 | Includes income from interest-earning deposits and investments and funds in asset-backed securitizations. Increase was due to an increase in interest earning investments and an increase in interest rates in 2022 as compared to 2021. | ||||||||||||||||||||||||
| Total interest income | 203,133 | 136,654 | 479,916 | 399,341 | |||||||||||||||||||||||||
| Interest expense | 126,625 | 50,176 | 248,347 | 127,939 |
Increase was due to an increase in cost of funds, partially offset by a decrease in the average balance of debt outstanding. In addition, during the first quarter of 2021, the Company reduced interest expense by $23.8 million as a result of reversing a historical accrued interest liability on certain bonds, which liability the Company determined is no longer probable of being required to be paid. The liability was initially recorded when certain asset-backed securitizations were acquired in 2011 and 2013.
|
||||||||||||||||||||||||
| Net interest income | 76,508 | 86,478 | 231,569 | 271,402 | |||||||||||||||||||||||||
| Less provision (negative provision) for loan losses | 9,665 | 5,827 | 18,640 | (10,847) |
Represents the current period provision (negative provision) to reflect the lifetime expected credit losses related to the Company's loan portfolio. See note 2 of the notes to consolidated financial statements included under Part I, Item 1 of this report for the activity in the Company's allowance for loan losses.
|
||||||||||||||||||||||||
| Net interest income after provision for loan losses | 66,843 | 80,651 | 212,929 | 282,249 | |||||||||||||||||||||||||
| Other income/expense: | |||||||||||||||||||||||||||||
| LSS revenue | 134,197 | 112,351 | 395,438 | 335,961 | See LSS operating segment - results of operations. | ||||||||||||||||||||||||
| ETS&PP revenue | 106,894 | 85,324 | 310,211 | 257,284 | See ETS&PP operating segment - results of operations. | ||||||||||||||||||||||||
| Solar construction revenue | 9,358 | — | 9,358 | — |
On July 1, 2022, the Company acquired 80 percent of the ownership interests of GRNE Solar. GRNE Solar designs and installs residential, commercial, and utility-scale solar systems. The acquisition diversifies the Company's position in the renewable energy space to include solar construction.
|
||||||||||||||||||||||||
| Other | 2,225 | 11,867 | 24,750 | 30,183 | See table below for the components of "other." | ||||||||||||||||||||||||
| Gain on sale of loans | 2,627 | 3,444 | 5,616 | 18,715 |
The Company sold $18.1 million (par value) and $28.9 million (par value) of consumer loans in January 2022 and July 2022, respectively, and recognized a gain of $3.0 million and $2.6 million, respectively. The Company also sold $77.4 million (par value) and $18.4 million (par value) of consumer loans in May 2021 and September 2021, respectively, and recognized gains of $15.3 million and $3.2 million, respectively.
|
||||||||||||||||||||||||
| Impairment expense and provision for beneficial interests, net | 121 | (14,159) | (6,163) | (12,223) | During the third quarter of 2021, the Company evaluated the use of office space as a large number of employees continued to work from home due to COVID-19. As a result of this evaluation, the Company recorded an impairment charge during the third quarter of 2021 of $14.2 million. The impairment charge related primarily to building and operating lease assets. During the second quarter of 2022, the Company recorded impairment expense of $6.3 million related primarily to a venture capital investment and certain real estate leases. | ||||||||||||||||||||||||
| Derivative settlements, net | 10,271 | (5,909) | 12,085 | (15,587) | The Company maintains an overall risk management strategy that incorporates the use of derivative instruments to reduce the economic effect of interest rate volatility. Derivative settlements for each applicable period should be evaluated with the Company's net interest income. See AGM operating segment - results of operations. | ||||||||||||||||||||||||
| Derivative market value adjustments, net | 52,991 | 7,260 | 239,125 | 44,455 | Includes the realized and unrealized gains and losses that are caused by changes in fair values of derivatives which do not qualify for "hedge treatment" under GAAP. The majority of the derivative market value adjustments related to the changes in fair value of the Company's floor income interest rate swaps. Such changes reflect that a decrease in the forward yield curve during a reporting period results in a decrease in the fair value of the Company's floor income interest rate swaps, and an increase in the forward yield curve during a reporting period results in an increase in the fair value of such swaps. | ||||||||||||||||||||||||
| Total other income/expense | 318,684 | 200,178 | 990,420 | 658,788 | |||||||||||||||||||||||||
38
| Cost of services: | |||||||||||||||||||||||||||||
| Cost to provide education technology, services, and payment processing services | 42,676 | 31,335 | 109,073 | 80,063 |
Represents primarily direct costs to provide payment processing and instructional services in the ETS&PP operating segment. Increase in 2022 compared to 2021 was primarily due to additional instructional services costs. See ETS&PP operating segment - results of operations.
|
||||||||||||||||||||||||
| Cost to provide solar construction services | 5,968 | — | 5,968 | — | As noted above, the Company acquired GRNE Solar on July 1, 2022. These amounts represent direct costs related to GRNE providing solar construction services. | ||||||||||||||||||||||||
| Total cost of services | 48,644 | 31,335 | 115,041 | 80,063 | |||||||||||||||||||||||||
| Operating expenses: | |||||||||||||||||||||||||||||
| Salaries and benefits | 147,198 | 128,592 | 438,010 | 363,351 | Increase was due to an increase in headcount in the (i) LSS operating segment as the Company has been required to prepare for the resumption of federal student loan payments upon the expiration of the CARES Act borrower relief provisions, which have been extended several times; and (ii) ETS&PP operating segment to support the growth of its customer base and the investment in the development of new technologies. | ||||||||||||||||||||||||
| Depreciation and amortization | 18,772 | 15,710 | 53,978 | 56,129 | Includes depreciation of property and equipment and the amortization of intangibles from prior business acquisitions. | ||||||||||||||||||||||||
| Other expenses | 43,858 | 38,324 | 120,297 | 107,611 | Other expenses includes expenses necessary for operations, such as postage and distribution, consulting and professional fees, occupancy, communications, and certain information technology-related costs. Increase was due to (i) an increase in expenses in the LSS operating segment due to growth of borrowers under the government servicing contracts; and (ii) an increase in expenses in the ETS&PP operating segment due to higher costs for consulting, professional fees, and technology services resulting from investments in new technologies, and an increase in costs for travel and in-person hosted conferences that subsided in 2021 due to the COVID-19 pandemic. | ||||||||||||||||||||||||
| Total operating expenses | 209,828 | 182,626 | 612,285 | 527,091 | |||||||||||||||||||||||||
| Income before income taxes | 127,055 | 66,868 | 476,023 | 333,883 | |||||||||||||||||||||||||
| Income tax expense | 26,586 | 15,649 | 107,765 | 76,747 |
The effective tax rate was 20.2% and 22.7% for the three months ended September 30, 2022 and 2021, respectively, and 22.2% and 22.7% for the nine months ended September 30, 2022 and 2021, respectively.
|
||||||||||||||||||||||||
| Net income | 100,469 | 51,219 | 368,258 | 257,136 | |||||||||||||||||||||||||
| Net loss attributable to noncontrolling interests | 4,329 | 1,919 | 8,315 | 3,467 | Amounts for noncontrolling interests primarily reflect the net income/loss attributable to the holders of minority membership interests in Whitetail Rock Capital Management, LLC and multiple solar entities. | ||||||||||||||||||||||||
| Net income attributable to Nelnet, Inc. | $ | 104,798 | 53,138 | 376,573 | 260,603 | ||||||||||||||||||||||||
The following table summarizes the components of "other" in "other income/expense" on the consolidated statements of income.
| Three months ended September 30, | Nine months ended September 30, | ||||||||||||||||||||||
| 2022 | 2021 | 2022 | 2021 | ||||||||||||||||||||
| Income/gains from investments, net (a) | $ | 10,701 | 16,050 | 40,685 | 40,141 | ||||||||||||||||||
| Borrower late fee income (b) | 2,824 | 514 | 7,693 | 1,698 | |||||||||||||||||||
| ALLO preferred return (c) | 2,164 | 2,043 | 6,420 | 6,384 | |||||||||||||||||||
| Administration/sponsor fee income (d) | 1,920 | 1,670 | 6,055 | 1,670 | |||||||||||||||||||
| Investment advisory services (e) | 1,612 | 2,400 | 4,375 | 6,242 | |||||||||||||||||||
| Loss from ALLO voting membership interest investment (f) | (17,562) | (10,495) | (47,633) | (31,620) | |||||||||||||||||||
| Loss from solar investments (g) | (4,216) | (3,393) | (7,100) | (7,375) | |||||||||||||||||||
| Other | 4,782 | 3,078 | 14,255 | 13,043 | |||||||||||||||||||
| Other income | $ | 2,225 | 11,867 | 24,750 | 30,183 | ||||||||||||||||||
(a) The Company recognized net income/gains from its real estate and venture capital investment portfolios of $9.7 million during both the three months ended September 30, 2022 and 2021, respectively, and $26.6 million and $32.3 million during the nine months ended September 30, 2022 and 2021, respectively. The majority of these gains were from the sale of investments, and thus are not recurring.
In addition, during the second quarter of 2022, the Company recognized a $15.2 million (pre-tax) gain as a result of the revaluation of its previously held 50 percent ownership interests in NextGen (previously accounted for under the equity method) as a result of the Company purchasing an additional 30 percent ownership interests in NextGen on April 30, 2022.
The remaining amount of income/gains from investments recognized by the Company and included in the table above relate to gains/losses from sales of debt and equity securities and the remeasurement of certain equity securities measured at fair value.
39
(b) Represents borrower late fees earned primarily by the AGM operating segment. The increase in borrower late fees for the three and nine months ended September 30, 2022 as compared to the same periods in 2021 was due to the Company suspending substantially all borrower late fees effective March 13, 2020 to provide borrowers relief as a result of the COVID-19 pandemic. The Company began to recognize borrower late fees again in May 2021 (for private education loans) and October 2021 (for federally insured student loans).
(c) Represents the Company's income on its preferred membership interests in ALLO, which was deconsolidated from the Company's financial statements in December 2020. As of September 30, 2022 and 2021, the amount of preferred membership interests held by the Company was $137.3 million and $129.7 million, respectively, which earns a preferred annual return of 6.25 percent.
(d) Represents fee income earned by the AGM operating segment as administrator and sponsor for the securitizations completed during 2021 by the joint venture to purchase and securitize private education loans sold by Wells Fargo.
(e) The Company provides investment advisory services through Whitetail Rock Capital Management, LLC ("WRCM"), the Company's SEC-registered investment advisor subsidiary, under various arrangements. WRCM earns annual fees of 10 basis points to 25 basis points on the majority of the outstanding balance of asset-backed securities under management and a share of the gains from the sale of asset-backed securities or asset-backed securities being called prior to the full contractual maturity for which it provides advisory services. As of September 30, 2022, the outstanding balance of asset-backed securities under management subject to these arrangements was $3.0 billion, of which all of such securities were FFELP student loan asset-backed securities. In addition, WRCM earns annual management fees of five basis points for Nelnet stock under management (with the Nelnet stock primarily shares of Class B common stock held in various trust estates).
(f) Represents the Company's share of loss on its voting membership interests in ALLO. Assuming ALLO continues its planned growth in existing and new communities, it will continue to invest substantial amounts in property and equipment to build the network and connect customers. The resulting recognition of depreciation and development costs could result in continuing net operating losses by ALLO under GAAP. Applying the Hypothetical Liquidation at Book Value ("HLBV") method of accounting, the Company will continue to recognize a significant portion of ALLO’s anticipated losses over the next several years.
(g) Represents the Company's share of income or loss from solar investments under the HLBV method of accounting. For the majority of the Company's solar investments, the HLBV method of accounting results in accelerated losses in the initial years of investment. Losses from solar investments include losses attributable to third-party minority interest investors of $4.1 million and $2.1 million for the three months ended September 30, 2022 and 2021, respectively, and $8.0 million and $4.0 million for the nine months ended September 30, 2022 and 2021, respectively, that are included in "net loss attributable to noncontrolling interests" in the consolidated statements of income.
40
LOAN SERVICING AND SYSTEMS OPERATING SEGMENT – RESULTS OF OPERATIONS
Loan Servicing Volumes
| As of | |||||||||||||||||||||||||||||||||||||||||||||||
|
December 31,
2020 |
March 31,
2021 |
June 30,
2021 |
September 30,
2021 |
December 31,
2021 |
March 31,
2022 |
June 30,
2022 |
September 30,
2022 |
||||||||||||||||||||||||||||||||||||||||
| Servicing volume (dollars in millions): | |||||||||||||||||||||||||||||||||||||||||||||||
| Government | $ | 443,248 | 453,681 | 452,450 | 461,054 | 478,402 | 507,653 | 542,398 | 545,546 | ||||||||||||||||||||||||||||||||||||||
| FFELP | 30,763 | 30,084 | 29,361 | 28,244 | 26,916 | 25,646 | 24,224 | 22,412 | |||||||||||||||||||||||||||||||||||||||
| Private and consumer | 16,226 | 21,397 | 24,758 | 24,229 | 23,702 | 23,433 | 22,838 | 22,461 | |||||||||||||||||||||||||||||||||||||||
| Total | $ | 490,237 | 505,162 | 506,569 | 513,527 | 529,020 | 556,732 | 589,460 | 590,419 | ||||||||||||||||||||||||||||||||||||||
| Number of servicing borrowers: | |||||||||||||||||||||||||||||||||||||||||||||||
| Government | 13,251,930 | 13,301,364 | 13,253,051 | 13,570,056 | 14,196,520 | 14,727,860 | 15,426,607 | 15,657,942 | |||||||||||||||||||||||||||||||||||||||
| FFELP | 1,300,677 | 1,233,461 | 1,198,863 | 1,150,214 | 1,092,066 | 1,034,913 | 977,785 | 910,188 | |||||||||||||||||||||||||||||||||||||||
| Private and consumer | 636,136 | 882,477 | 1,039,537 | 1,097,252 | 1,065,439 | 1,030,863 | 998,454 | 979,816 | |||||||||||||||||||||||||||||||||||||||
| Total | 15,188,743 | 15,417,302 | 15,491,451 | 15,817,522 | 16,354,025 | 16,793,636 | 17,402,846 | 17,547,946 | |||||||||||||||||||||||||||||||||||||||
| Number of remote hosted borrowers: | 6,555,841 | 4,307,342 | 4,338,570 | 4,548,541 | 4,799,368 | 5,487,943 | 5,738,381 | 6,025,377 | |||||||||||||||||||||||||||||||||||||||
Government Loan Servicing
The Company's student loan servicing contracts with the Department are scheduled to expire on December 14, 2023. In 2017, the Department initiated a contract procurement process referred to as the Next Generation Financial Services Environment for a new framework for the servicing of all student loans owned by the Department. The Consolidated Appropriations Act, 2021 contains provisions directing certain aspects of the process, including that any new federal student loan servicing environment is required to provide for the participation of multiple student loan servicers and the allocation of borrower accounts to eligible student loan servicers based on performance. In the second quarter of 2022, the Department released a solicitation entitled Unified Servicing and Data Solution ("USDS") for the new servicing framework. The Company responded to the USDS solicitation. The Company cannot predict the timing, nature, or ultimate outcome of this or any other contract procurement process by the Department.
In July 2021, the Pennsylvania Higher Education Assistance Agency ("PHEAA"), a servicer for the Department, announced that it will exit the federal student loan servicing business. All applicable student loans serviced for the Department by PHEAA will be transferred to successor servicers by December 2022. At the time of this announcement, PHEAA serviced approximately 8.5 million borrowers under its contract. As of December 31, 2021, March 31, 2022, June 30, 2022, and September 30, 2022, approximately 603,000, 1,175,000, 1,905,000, and 1,909,000 PHEAA borrowers, respectively, have been transitioned to the Company's platform. In addition, over this same time period, PHEAA borrowers were transferred to other servicers that the Company provides its servicing system (remote hosted servicing customers). This has increased the number of remote hosted borrowers as reflected in the table above.
Under the CARES Act, beginning in March 2020, federal student loan payments and interest accruals were suspended for all borrowers that had loans owned by the Department. As a result of the CARES Act, the Company receives less servicing revenue per borrower from the Department based on the borrower forbearance status than what was earned on such accounts prior to these provisions. On April 6, 2022, the Department extended the student loans payment pause under the CARES Act from May 1, 2022 to August 31, 2022, and on August 24, 2022, the Department extended such payment pause from August 31, 2022 to December 31, 2022. Prior to the April 2022 extension (during the fourth quarter of 2021 and first quarter of 2022), the Company earned additional revenue from the Department based on incremental work, including outbound engagement, being performed by the Company to support the anticipated Department borrowers coming out of forbearance. Effective May 1, 2022, the Department increased the monthly per borrower CARES Act forbearance rate paid to its servicers to compensate them for supplemental outreach to certain borrowers and to support the transition of borrowers back to repayment. Once borrowers transition back to repayment, the Company anticipates revenue per borrower from the Department will increase to pre-CARES Act levels.
Department of Education Loan Forgiveness
The Department's August 24, 2022 Bulletin announcing a broad based student debt relief plan indicates the Department will provide targeted student debt cancellation to borrowers with loans held by the Department, and that borrowers whose annual income for either 2020 or 2021 was under $125,000 (for single or married, filing separately) or under $250,000 (for married
41
couples, filing jointly or heads of household) will be eligible for otherwise unconditional loan cancellation in amounts of up to $20,000 for eligible borrowers who received a Pell Grant, or of up to $10,000 for eligible borrowers who did not receive a Pell Grant. On October 21, 2022, the U.S. Court of Appeals for the Eighth Circuit issued a temporary administrative stay of implementation of the Department's student debt relief plan in response to a legal challenge that was initiated by other parties (not the Company).
The Company cannot currently estimate how many borrowers meet the eligibility requirements and other terms and conditions for one-time debt relief under the Department's announcement. If there was a broad $10,000 or $20,000 per borrower forgiveness on all government owned loans, the Company estimates it would decrease the number of borrowers serviced (based on the borrower loan information as of September 30, 2022) by approximately 4.4 million borrowers and 7.5 million borrowers, respectively. The actual impact to the number of borrowers serviced is expected to be less than these amounts due to annual income ceilings for borrowers to qualify for forgiveness and the impact of whether a Pell Grant was received on the amount of forgiveness for a borrower.
Revenue earned under the current Department servicing contracts, and software services revenue earned in providing remote hosted services to other Department servicers, will decrease in future periods if the Department's student debt relief plan or other broad based loan forgiveness is implemented.
Private Education Loan Servicing
In December 2020, Wells Fargo announced the sale of its approximately $10.0 billion portfolio of private education student loans representing approximately 445,000 borrowers. In conjunction with the sale, the Company was selected as servicer of the portfolio. During March 2021, approximately 261,000 borrowers were converted to the Company's servicing platform, with the vast majority of the remaining borrowers converted in the second quarter of 2021.
Summary and Comparison of Operating Results
| Three months ended September 30, | Nine months ended September 30, | ||||||||||||||||||||||||||||
| 2022 | 2021 | 2022 | 2021 | Additional information | |||||||||||||||||||||||||
| Net interest income | $ | 831 | 7 | 1,100 | 25 | Increase was due to higher interest rates in 2022 as compared to 2021. | |||||||||||||||||||||||
| Loan servicing and systems revenue | 134,197 | 112,351 | 395,438 | 335,961 | See table below for additional information. | ||||||||||||||||||||||||
| Intersegment servicing revenue | 8,281 | 8,621 | 25,142 | 25,369 |
Represents revenue earned by the LSS operating segment from servicing loans for the AGM and Nelnet Bank operating segments. Decrease in 2022 compared to 2021 was due to the continued amortization of AGM's FFELP portfolio. Decrease was partially offset by ending COVID-19 pandemic borrower relief policies, which increased servicing activities performed for AGM. FFELP intersegment servicing revenue will continue to decrease as AGM's FFELP portfolio pays off.
|
||||||||||||||||||||||||
| Other income | 596 | 727 | 1,946 | 2,541 |
Represents revenue earned from providing administrative support and marketing services.
|
||||||||||||||||||||||||
| Impairment expense | — | (13,243) | — | (13,243) | During the third quarter of 2021, the Company evaluated use of office space as a large number of employees continued to work from home due to COVID-19. As a result of this evaluation, the Company recorded a non-cash impairment charge to certain building and building improvement assets during the third quarter of 2021. | ||||||||||||||||||||||||
| Total other income | 143,074 | 108,456 | 422,526 | 350,628 | |||||||||||||||||||||||||
| Salaries and benefits | 82,067 | 75,305 | 257,259 | 210,151 |
Increase in 2022 compared to 2021 was due to the Company hiring contact center operations and support associates to prepare for the resumption of federal student loan payments and other activities after the CARES Act suspension expires. The CARES Act suspension was expected to expire on January 31, 2022 and has been extended three additional times to May 1, 2022, August 31, 2022, and again to December 31, 2022.
|
||||||||||||||||||||||||
| Depreciation and amortization | 5,784 | 4,245 | 16,056 | 20,411 | Includes amortization of intangible assets from the Great Lakes acquisition in February 2018 of which the majority of such assets became fully amortized as of June 30, 2021. Amortization of intangible assets for the nine months ended September 30, 2022 and 2021 was $1.1 million and $11.6 million, respectively. Excluding amortization of intangible assets, the increase in 2022 compared to 2021 was due to scaling of the Company's servicing platform for the PHEAA loan volume transferred to its platform. | ||||||||||||||||||||||||
| Other expenses | 16,654 | 12,738 | 46,375 | 39,296 |
Increase in 2022 compared to 2021 was due to additional costs associated with the growth of borrowers under the government servicing contracts.
|
||||||||||||||||||||||||
| Intersegment expenses | 17,486 | 19,217 | 56,442 | 52,241 |
Intersegment expenses represent costs for certain corporate activities and services that are allocated to each operating segment based on estimated use of such activities and services.
|
||||||||||||||||||||||||
| Total operating expenses | 121,991 | 111,505 | 376,132 | 322,099 | |||||||||||||||||||||||||
| Income (loss) before income taxes | 21,914 | (3,042) | 47,494 | 28,554 | |||||||||||||||||||||||||
| Income tax (expense) benefit | (5,259) | 730 | (11,399) | (6,853) | Represents income tax (expense) benefit at an effective tax rate of 24%. | ||||||||||||||||||||||||
| Net income (loss) | $ | 16,655 | (2,312) | 36,095 | 21,701 |
|
|||||||||||||||||||||||
42
| GAAP before tax operating margin | 15.3 | % | (2.5) | % | 11.2 | % | 7.9 | % |
Before tax operating margin, excluding impairment and amortization expense, is a non-GAAP measure of before tax operating profitability as a percentage of revenue, and for the LSS segment is calculated as income before income taxes (excluding impairment and amortization expense) divided by the total of loan servicing and systems revenue, intersegment servicing revenue, and other income revenue. The Company uses this metric to monitor and assess the segment’s performance, manage operating costs, identify and evaluate business trends affecting the segment, and make strategic decisions, and believes that it provides additional information to facilitate an understanding of the operating performance of the segment and provides a meaningful comparison of the results of operations between periods.
Before tax operating margin, excluding impairment and amortization expense, decreased in the nine months ended September 30, 2022 compared to the same period in 2021 due to increased operating expenses, primarily salaries and benefits, as the Company prepared for a January 31, 2022 expiration of the federal student loan payment pause under the CARES Act, which has been extended three additional times to May 1, 2022, August 31, 2022, and again to December 31, 2022.
|
||||||||||||||||||||
| Impairment expense | — | 10.9 | % | — | 3.6 | % | |||||||||||||||||||||||
| Amortization expense | 0.3 | % | 0.5 | % | 0.3 | % | 3.2 | % | |||||||||||||||||||||
| Non-GAAP before tax operating margin, excluding impairment and amortization expense | 15.6 | % | 8.9 | % | 11.5 | % | 14.7 | % | |||||||||||||||||||||
Loan servicing and systems revenue
| Three months ended September 30, | Nine months ended September 30, | ||||||||||||||||||||||||||||
| 2022 | 2021 | 2022 | 2021 | Additional information | |||||||||||||||||||||||||
| Government servicing | $ | 104,428 | 84,084 | 312,368 | 241,497 |
Represents revenue from the Company's Department servicing contracts. Increase in 2022 compared to 2021 was due to (i) an increase in the number of borrowers serviced, including PHEAA borrowers transferred to the Company's servicing platform; (ii) a per borrower rate increase beginning September 1, 2021 to reflect the increase in the cost of labor (Employment Cost Index) per the provisions of the contract; and (iii) a CARES Act forbearance rate increase effective May 1, 2022. Increase in the nine months ended September 30, 2022 compared to the same period in 2021 was also due to (i) the recognition of $9.1 million of revenue in the first quarter of 2022 for incremental work related primarily to CARES Act forbearance exit outreach activities to borrowers; and (ii) the recognition of $10.5 million of revenue in the first quarter of 2022 related to the discharge of borrowers under the Total and Permanent Disability ("TPD") discharge program. The Company earns revenue per each borrower that satisfies the requirements for their loan to be discharged under the TPD discharge program.
|
|||||||||||||||||||||||
| Private education and consumer loan servicing | 12,198 | 13,198 | 37,194 | 34,563 |
Increase for the nine months ended September 30, 2022 compared to the same period in 2021 was due to the addition of the former Wells Fargo private education loan borrowers converted to the Company's servicing platform during March and the second quarter of 2021. Excluding revenue earned on the former Wells Fargo portfolio, revenue for 2022 decreased compared to 2021. The decrease in revenue was due to a decrease in servicing volume and client requested enhanced delinquency services.
|
||||||||||||||||||||||||
| FFELP servicing | 4,127 | 4,557 | 12,386 | 13,930 |
Decrease in 2022 compared to 2021 was due to a decrease in the number of borrowers serviced. Over time, FFELP servicing revenue will continue to decrease as third-party customers' FFELP portfolios pay off. Since late 2021, the Company has experienced accelerated run-off of its FFELP servicing portfolio due to FFELP borrowers consolidating their loans into Federal Direct Loan Program loans as a result of the continued extension of borrower relief under the CARES Act and an initiative offered by the Department for FFELP borrowers to consolidate their loans to qualify for loan forgiveness under the Public Service Loan Forgiveness and other programs.
|
||||||||||||||||||||||||
| Software services | 8,229 | 6,952 | 23,536 | 22,779 | Increase in 2022 compared to 2021 is due to an increase in the number of remote hosted servicing borrowers primarily from the transfer of PHEAA borrowers to these servicing customers. This increase was partially offset during the nine months ended September 30, 2022 compared to the same period in 2021 due to many of the services provided under the Company's remote hosted servicing and system support contract with Great Lakes' former parent, representing 2.3 million borrowers, expiring on January 31, 2021. | ||||||||||||||||||||||||
| Outsourced services and other | 5,215 | 3,560 | 9,954 | 23,192 |
The majority of this revenue relates to providing contact center and back office operational outsourcing services. In 2021, these services included assisting state agencies with COVID-19 specific activities. Revenue from providing COVID-19 related services to state agencies was $1.3 million and $16.3 million during the three and nine months ended September 30, 2021. Excluding COVID-19 specific activities, outsourced services revenue has increased in 2022 as compared to 2021 due to additional outsourced opportunities, including assisting existing Department servicers as they wind down their operations.
|
||||||||||||||||||||||||
| Loan servicing and systems revenue | $ | 134,197 | 112,351 | 395,438 | 335,961 | ||||||||||||||||||||||||
43
EDUCATION TECHNOLOGY, SERVICES, AND PAYMENT PROCESSING OPERATING SEGMENT – RESULTS OF OPERATIONS
As discussed further in the Company's 2021 Annual Report, this segment of the Company’s business is subject to seasonal fluctuations which correspond, or are related to, the traditional school year. Based on the timing of revenue recognition and when expenses are incurred, revenue and pre-tax operating margin are higher in the first quarter as compared to the remainder of the year.
Summary and Comparison of Operating Results
| Three months ended September 30, | Nine months ended September 30, | ||||||||||||||||||||||||||||
| 2022 | 2021 | 2022 | 2021 | Additional information | |||||||||||||||||||||||||
| Interest income | $ | 3,707 | 344 | 4,920 | 818 |
Represents interest income on tuition funds held in custody for schools. Increase was due to higher interest rates in 2022 as compared to 2021.
|
|||||||||||||||||||||||
| Education technology, services, and payment processing revenue | 106,894 | 85,324 | 310,211 | 257,284 | See table below for additional information. | ||||||||||||||||||||||||
| Intersegment revenue | 8 | 3 | 16 | 9 | |||||||||||||||||||||||||
| Other | — | 13 | — | 13 | |||||||||||||||||||||||||
| Total other income | 106,902 | 85,340 | 310,227 | 257,306 | |||||||||||||||||||||||||
| Cost of services | 42,676 | 31,335 | 109,073 | 80,063 | See table below for additional information. | ||||||||||||||||||||||||
| Salaries and benefits | 34,950 | 29,119 | 98,356 | 82,154 |
Increase in 2022 compared to 2021 was due to an increase in headcount to support the growth of the customer base, and the investment in the development of new technologies.
|
||||||||||||||||||||||||
| Depreciation and amortization | 2,532 | 2,762 | 7,544 | 8,789 |
Represents primarily amortization of intangible assets from prior business acquisitions. Amortization of intangible assets related to business acquisitions was $2.2 million and $2.6 million for the three months ended September 30, 2022 and 2021, respectively, and $6.8 million and $8.3 million for the nine months ended September 30, 2022 and 2021, respectively. Amortization of intangible assets is expected to increase in future periods as a result of the recent business acquisition of NextGen. See note 6 of the notes to the consolidated financial statements included under Part I, Item 1 of this report.
|
||||||||||||||||||||||||
| Other expenses | 7,034 | 4,804 | 19,549 | 14,063 |
Increase was due to higher costs for consulting, professional fees, and technology services resulting from investments in new technologies. Increase was also due to an increase in costs for travel and in-person hosted conferences that subsided in 2021 due to the COVID pandemic.
|
||||||||||||||||||||||||
| Intersegment expenses, net | 4,762 | 3,672 | 14,171 | 10,856 | Intersegment expenses represent costs for certain corporate activities and services that are allocated to each operating segment based on estimated use of such activities and services. | ||||||||||||||||||||||||
| Total operating expenses | 49,278 | 40,357 | 139,620 | 115,862 | |||||||||||||||||||||||||
| Income before income taxes | 18,655 | 13,992 | 66,454 | 62,199 | |||||||||||||||||||||||||
| Income tax expense | (4,475) | (3,358) | (15,947) | (14,928) | Represents income tax expense at an effective tax rate of 24%. | ||||||||||||||||||||||||
| Net income | 14,180 | 10,634 | 50,507 | 47,271 | |||||||||||||||||||||||||
| Net income attributable to noncontrolling interests | (61) | — | (8) | — | Amounts for noncontrolling interests reflect the net income attributable to the holders of minority membership interests in NextGen, of which the Company became the majority owner on April 30, 2022. See note 6 of the notes to consolidated financial statements included under Part I, Item 1 of this report for additional information. | ||||||||||||||||||||||||
| Net income attributable to Nelnet, Inc. | $ | 14,119 | 10,634 | 50,499 | 47,271 | ||||||||||||||||||||||||
44
Education technology, services, and payment processing revenue
The following table provides disaggregated revenue by service offering and before tax operating margin for each reporting period.
| Three months ended September 30, | Nine months ended September 30, | ||||||||||||||||||||||||||||
| 2022 | 2021 | 2022 | 2021 | Additional information | |||||||||||||||||||||||||
| Tuition payment plan services | $ | 25,779 | 23,618 | 84,131 | 79,706 |
Revenue increased for the three and nine months ended September 30, 2022 as compared to the same periods in 2021 due to a higher number of payment plans in the K-12 market. In addition, revenue for the three months ended September 30, 2022 increased compared to the same period in 2021 due to a higher number of payment plans for institutions of higher education.
|
|||||||||||||||||||||||
| Payment processing | 47,957 | 39,852 | 113,996 | 97,898 |
Payment volumes in 2022 increased as compared to 2021 for both the K-12 and higher education markets due to new customers and an increase in volume from existing customers.
|
||||||||||||||||||||||||
| Education technology and services | 32,548 | 21,295 | 110,755 | 78,752 |
Increase in 2022 compared to 2021 was due to an increase in revenues from the Company’s school information system software, enrollment and communication products, revenue from the NextGen acquisition, and FACTS Education Solutions instructional and professional development services. FACTS Education Solutions instructional services revenue was the largest component of this increase, driven by the Emergency Assistance to Non-Public Schools (“EANS”) program which provides funds to non-public schools through September 2024 to address the impact the COVID-19 pandemic has had or continues to have on school students and teachers.
|
||||||||||||||||||||||||
| Other | 610 | 559 | 1,329 | 928 | |||||||||||||||||||||||||
| Education technology, services, and payment processing revenue | 106,894 | 85,324 | 310,211 | 257,284 | |||||||||||||||||||||||||
| Cost of services | 42,676 | 31,335 | 109,073 | 80,063 |
Costs primarily relate to payment processing revenue and such costs decrease/increase in relationship to payment volumes. Costs to provide instructional services are also included as a component of this expense and were the primary driver of the increase in 2022 compared to 2021 due to the increase in instructional services resulting from the EANS program as noted for Education technology and services revenue above.
|
||||||||||||||||||||||||
| Net revenue | $ | 64,218 | 53,989 | 201,138 | 177,221 | ||||||||||||||||||||||||
| Before tax operating margin | 23.3 | % | 25.3 | % | 30.6% | 34.6% |
Before tax operating margin is a measure of before tax operating profitability as a percentage of revenue, and for the ETS&PP segment is calculated as income before income taxes less interest income divided by net revenue. The Company uses this metric to monitor and assess the segment’s performance, manage operating costs, identify and evaluate business trends affecting the segment, and make strategic decisions, and believes that it facilitates an understanding of the operating performance of the segment and provides a meaningful comparison of the results of operations between periods.
The decrease in margin for 2022 as compared to 2021 was due to investments in (i) the development of new services and technologies; and (ii) superior customer experiences to align with the Company’s strategies to grow, retain, and diversify revenues.
|
||||||||||||||||||||||
45
ASSET GENERATION AND MANAGEMENT OPERATING SEGMENT – RESULTS OF OPERATIONS
Loan Portfolio
As of September 30, 2022, the AGM operating segment had a $14.8 billion loan portfolio, consisting primarily of federally insured loans. For a summary of the Company’s loan portfolio as of September 30, 2022 and December 31, 2021, see note 2 of the notes to consolidated financial statements included under Part I, Item 1 of this report.
Loan Activity
The following table sets forth the activity of loans in the AGM operating segment:
| Three months ended September 30, | Nine months ended September 30, | ||||||||||||||||||||||
| 2022 | 2021 | 2022 | 2021 | ||||||||||||||||||||
| Beginning balance | $ | 15,855,137 | 19,331,725 | 17,441,790 | 19,559,108 | ||||||||||||||||||
| Loan acquisitions: | |||||||||||||||||||||||
| Federally insured student loans | 896 | 70,844 | 54,845 | 833,313 | |||||||||||||||||||
| Private education loans | 667 | 1,680 | 8,177 | 88,131 | |||||||||||||||||||
| Consumer and other loans | 120,465 | 20,939 | 256,998 | 61,319 | |||||||||||||||||||
| Total loan acquisitions | 122,028 | 93,463 | 320,020 | 982,763 | |||||||||||||||||||
| Repayments, claims, capitalized interest, participations, and other, net | (385,312) | (818,554) | (1,310,913) | (1,415,249) | |||||||||||||||||||
| Loans lost to external parties | (768,923) | (145,270) | (1,609,728) | (587,841) | |||||||||||||||||||
| Loans sold | (28,915) | (23,670) | (47,154) | (101,087) | |||||||||||||||||||
| Ending balance | $ | 14,794,015 | 18,437,694 | 14,794,015 | 18,437,694 | ||||||||||||||||||
The Company has also purchased partial ownership in certain private education, consumer, and federally insured student loan securitizations that are accounted for as held-to-maturity beneficial interest investments and included in "investments and notes receivable" in the Company's consolidated financial statements. As of the latest remittance reports filed by the various trusts prior to or as of September 30, 2022, the Company’s ownership correlates to approximately $630 million, $150 million, and $420 million of private education, consumer, and federally insured student loans, respectively, included in these securitizations. The loans held in these securitizations are not included in the above table.
Since late 2021, the Company has experienced accelerated run-off of its FFELP portfolio due to FFELP borrowers consolidating their loans into Federal Direct Loan Program loans as a result of the continued extension of the CARES Act payment pause on Department held loans and the initiatives offered by the Department for FFELP borrowers to consolidate their loans to qualify for loan forgiveness under the Public Service Loan Forgiveness and other programs.
Allowance for Loan Losses and Loan Delinquencies
For a summary of the allowance as a percentage of the ending balance for each of AGM's loan portfolios as of September 30, 2022 and December 31, 2021, the activity in AGM's allowance for loan losses for the three and nine months ended September 30, 2022 and 2021, and a summary of AGM's loan status and delinquency amounts as of September 30, 2022, December 31, 2021, and September 30, 2021, see note 2 of the notes to consolidated financial statements included under Part I, Item 1 of this report.
46
Loan Spread Analysis
The following table analyzes the loan spread on AGM’s portfolio of loans, which represents the spread between the yield earned on loan assets and the costs of the liabilities and derivative instruments used to fund the assets. The spread amounts included in the following table are calculated by using the notional dollar values found in the table under the caption "Net interest income after provision for loan losses, net of settlements on derivatives" below, divided by the average balance of loans or debt outstanding.
| Three months ended September 30, | Nine months ended September 30, | ||||||||||||||||||||||
| 2022 | 2021 | 2022 | 2021 | ||||||||||||||||||||
| Variable loan yield, gross | 5.05 | % | 2.61 | % | 3.76 | % | 2.65 | % | |||||||||||||||
| Consolidation rebate fees | (0.84) | (0.85) | (0.85) | (0.84) | |||||||||||||||||||
| Discount accretion, net of premium and deferred origination costs amortization | 0.02 | 0.03 | 0.03 | 0.01 | |||||||||||||||||||
| Variable loan yield, net | 4.23 | 1.79 | 2.94 | 1.82 | |||||||||||||||||||
| Loan cost of funds - interest expense (a) (b) | (3.11) | (0.99) | (1.95) | (1.03) | |||||||||||||||||||
| Loan cost of funds - derivative settlements (c) (d) | (0.03) | (0.02) | 0.00 | (0.01) | |||||||||||||||||||
| Variable loan spread | 1.09 | 0.78 | 0.99 | 0.78 | |||||||||||||||||||
| Fixed rate floor income, gross | 0.19 | 0.75 | 0.45 | 0.75 | |||||||||||||||||||
| Fixed rate floor income - derivative settlements (c) (e) | 0.30 | (0.11) | 0.10 | (0.10) | |||||||||||||||||||
| Fixed rate floor income, net of settlements on derivatives | 0.49 | 0.64 | 0.55 | 0.65 | |||||||||||||||||||
| Core loan spread | 1.58 | % | 1.42 | % | 1.54 | % | 1.43 | % | |||||||||||||||
| Average balance of AGM's loans | $ | 15,466,505 | 19,084,320 | 16,371,092 | 19,178,788 | ||||||||||||||||||
| Average balance of AGM's debt outstanding | 15,060,823 | 18,863,730 | 15,905,170 | 18,890,832 | |||||||||||||||||||
(a) In the first quarter of 2021, the Company reversed a historical accrued interest liability of $23.8 million on certain bonds, which liability the Company determined is no longer probable of being required to be paid. The liability was initially recorded when certain asset-backed securitizations were acquired in 2011 and 2013. The reduction of this liability is reflected in (a reduction of) "interest expense on bonds and notes payable and bank deposits" in the consolidated statements of income and the impact of this reduction to interest expense was excluded from the table above.
(b) In the third quarter of 2021, the Company redeemed certain asset-backed debt securities prior to their legal maturity, resulting in the recognition of $1.5 million in interest expense from the write-off of all remaining debt issuance costs related to the initial issuance of such bonds. This expense was excluded from the table above.
(c) Derivative settlements represent the cash paid or received during the current period to settle with derivative instrument counterparties the economic effect of the Company's derivative instruments based on their contractual terms. Derivative accounting requires that net settlements with respect to derivatives that do not qualify for "hedge treatment" under GAAP be recorded in a separate income statement line item below net interest income. The Company maintains an overall risk management strategy that incorporates the use of derivative instruments to reduce the economic effect of interest rate volatility. As such, management believes derivative settlements for each applicable period should be evaluated with the Company’s net interest income (loan spread) as presented in this table. The Company reports this non-GAAP information because the Company believes that it provides additional information regarding operational and performance indicators that are closely assessed by management. There is no comprehensive, authoritative guidance for the presentation of such non-GAAP information, which is only meant to supplement GAAP results by providing additional information that management utilizes to assess performance. See note 4 of the notes to consolidated financial statements included under Part I, Item 1 of this report for additional information on the Company's derivative instruments, including the net settlement activity recognized by the Company for each type of derivative for the 2022 and 2021 periods presented in the table under the caption "Consolidated Financial Statement Impact Related to Derivatives - Statements of Income" in note 4 and in this table.
A reconciliation of core loan spread, which includes the impact of derivative settlements on loan spread, to loan spread without
derivative settlements follows.
| Three months ended September 30, | Nine months ended September 30, | ||||||||||||||||||||||
| 2022 | 2021 | 2022 | 2021 | ||||||||||||||||||||
| Core loan spread | 1.58 | % | 1.42 | % | 1.54 | % | 1.43 | % | |||||||||||||||
| Derivative settlements (1:3 basis swaps) | 0.03 | 0.02 | (0.00 | ) | 0.01 | ||||||||||||||||||
| Derivative settlements (fixed rate floor income) | (0.30) | 0.11 | (0.10) | 0.10 | |||||||||||||||||||
| Loan spread | 1.31 | % | 1.55 | % | 1.44 | % | 1.54 | % | |||||||||||||||
(d) Derivative settlements consist of net settlements (paid) received related to the Company’s 1:3 basis swaps.
(e) Derivative settlements consist of net settlements received (paid) related to the Company’s floor income interest rate swaps.
47
A trend analysis of AGM's core and variable loan spreads is summarized below.
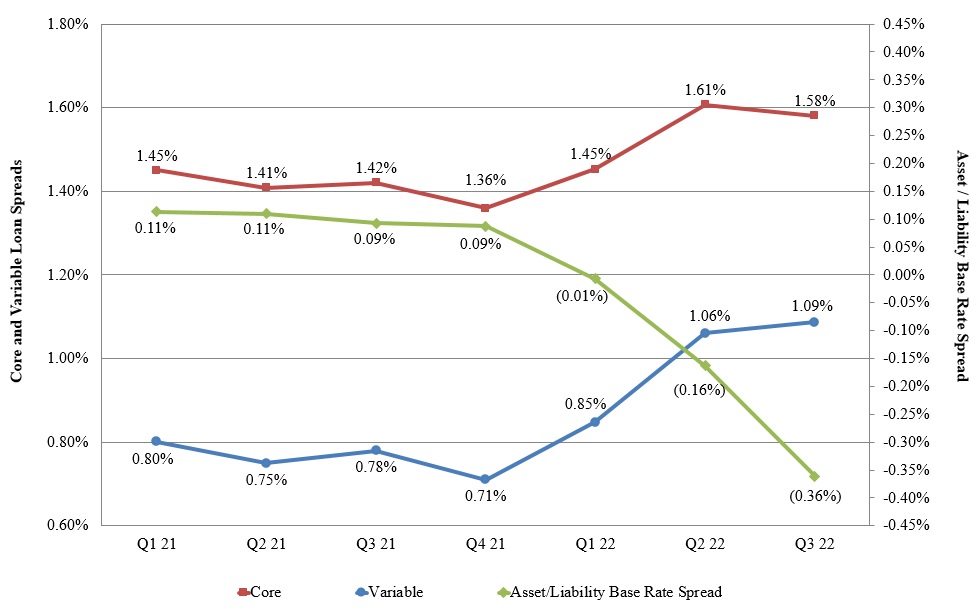
The interest earned on a large portion of AGM's FFELP student loan assets is indexed to the one-month LIBOR rate. AGM funds a portion of its assets with three-month LIBOR indexed floating rate securities. The relationship between the indices in which AGM earns interest on its loans and funds such loans has a significant impact on loan spread. The table above (the right axis) shows the difference between AGM's liability base rate and the one-month LIBOR rate by quarter.
Variable loan spread increased during the three and nine months ended September 30, 2022 compared to the same periods in 2021 due to a significant increase in short-term interest rates during each of the first three quarters of 2022. In an increasing interest rate environment, student loan spread increases due to the timing of interest rate resets on the Company's assets occurring daily in contrast to the timing of the interest resets on the Company's debt that occurs either monthly or quarterly.
See Item 3, “Quantitative and Qualitative Disclosures About Market Risk - Interest Rate Risk - AGM Operating Segment,” which provides additional detail on AGM’s FFELP student loan assets and related funding for those assets.
The difference between variable loan spread and core loan spread is fixed rate floor income earned on a portion of AGM's federally insured student loan portfolio. A summary of fixed rate floor income and its contribution to core loan spread follows:
| Three months ended September 30, | Nine months ended September 30, | ||||||||||||||||||||||
| 2022 | 2021 | 2022 | 2021 | ||||||||||||||||||||
| Fixed rate floor income, gross | $ | 7,585 | 35,850 | 54,870 | 108,029 | ||||||||||||||||||
| Derivative settlements (a) | 11,356 | (5,209) | 11,843 | (14,648) | |||||||||||||||||||
| Fixed rate floor income, net | $ | 18,941 | 30,641 | 66,713 | 93,381 | ||||||||||||||||||
| Fixed rate floor income contribution to spread, net | 0.49 | % | 0.64 | % | 0.55 | % | 0.65 | % | |||||||||||||||
(a) Derivative settlements consist of net settlements received (paid) related to the Company's derivatives used to hedge student loans earning fixed rate floor income.
The decrease in gross fixed rate floor income for the three and nine months ended September 30, 2022 compared to the same periods in 2021 was due to higher interest rates in 2022 as compared to 2021. Subsequent to September 30, 2022 (on November 2, 2022), the Federal Reserve again increased interest rates, and it is currently anticipated that interest rates may continue to rise
48
as a result of inflationary pressures in the U.S. economy; increases in interest rates will reduce the amount of gross fixed rate floor income the Company is currently receiving.
The Company has a portfolio of derivative instruments in which the Company pays a fixed rate and receives a floating rate to economically hedge loans earning fixed rate floor income. The increase in net derivative settlements received by the Company during the three and nine months ended September 30, 2022, as compared to net derivative settlements paid during the same periods in 2021, was due to an increase in interest rates, partially offset by a decrease in the notional amount of derivatives outstanding.
See Item 3, “Quantitative and Qualitative Disclosures About Market Risk - Interest Rate Risk - AGM Operating Segment,” which provides additional detail on the Company’s portfolio earning fixed rate floor income and the derivatives used by the Company to hedge these loans.
Interest Rate Risk - Replacement of LIBOR as a Benchmark Rate
As of September 30, 2022, the interest earned on a principal amount of $13.3 billion of AGM's FFELP student loan asset portfolio was indexed to one-month LIBOR, and the interest paid on a principal amount of $13.1 billion of AGM’s FFELP student loan asset-backed debt securities was indexed to one-month or three-month LIBOR. In addition, the Company’s derivative financial instrument transactions used to manage LIBOR interest rate risks are indexed to LIBOR. The market transition away from the LIBOR framework could result in significant changes to the interest rate characteristics of the Company's LIBOR-indexed assets and funding for those assets, as well as the Company’s LIBOR-indexed derivative instruments. See Item 1A, "Risk Factors - Loan Portfolio - Interest rate risk - replacement of LIBOR as a benchmark rate" in the Company's 2021 Annual Report for additional information.
On March 15, 2022, the President signed into law, as part of the Consolidated Appropriations Act, 2022, the Adjustable Interest Rate (LIBOR) Act (the "LIBOR Act"), which provides a framework for addressing the discontinuation of LIBOR under federal law. The LIBOR Act provides a statutory mechanism to automatically replace LIBOR with a benchmark rate based on the Secured Overnight Financing Rate ("SOFR"), including any applicable tenor adjustment, for certain contracts that reference LIBOR and do not contain sufficient fallback provisions. Parties remain free to agree on a different benchmark replacement rate, and the Company has worked and will continue to work with its asset-backed securitization investors to amend transaction documents to address the discontinuation of LIBOR. On July 19, 2022, the Federal Reserve issued a notice of proposed rulemaking for proposed regulations to implement the LIBOR Act, as required by its terms.
The LIBOR Act also amends the Higher Education Act to substitute the current special allowance payment rate-setting mechanism for FFELP loans from the one-month LIBOR to the 30-day average SOFR in effect for each of the days in an applicable quarter, adjusted daily by adding a tenor spread adjustment. Transition of the rate-setting mechanism for special allowance payments from LIBOR to SOFR is expected to occur prior to June 30, 2023.
49
Summary and Comparison of Operating Results
| Three months ended September 30, | Nine months ended September 30, | ||||||||||||||||||||||||||||
| 2022 | 2021 | 2022 | 2021 | Additional information | |||||||||||||||||||||||||
| Net interest income after provision for loan losses | $ | 53,708 | 77,179 | 189,028 | 275,092 | See table below for additional analysis. | |||||||||||||||||||||||
| Other income (expense) | 4,627 | (7,275) | 16,270 | (4,514) |
Other income includes primarily borrower late fees, income from providing administration activities for third-parties, and income from AGM's investment in a joint venture. Borrower late fees for the three months ended September 30, 2022 and 2021 were $2.8 million and $0.5 million, respectively, and for the nine months ended September 30, 2022 and 2021 were $7.7 million and $1.7 million, respectively. The Company suspended borrower late fees in March 2020 to provide borrowers relief as a result of the COVID-19 pandemic. The Company began to recognize borrower late fees again in May 2021 (for private education loans) and October 2021 (for federally insured student loans). The Company recognized revenue of $1.9 million and $1.7 million for the three months ended September 30, 2022 and 2021, respectively, and $6.1 million and $1.7 million for the nine months ended September 30, 2022 and 2021, respectively, as administrator and sponsor for the securitizations completed during 2021 by the joint venture to purchase and securitize private education loans sold by Wells Fargo. The Company also recognized losses of $0.3 million and $6.3 million for the three months ended September 30, 2022 and 2021, respectively, and income of $1.3 million and a loss of $5.0 million for the nine months ended September 30, 2022 and 2021, respectively, related to its investment in the joint venture.
|
||||||||||||||||||||||||
| Gain on sale of loans | 2,627 | 3,444 | 5,616 | 18,715 |
The Company sold $18.1 million (par value) and $28.9 million (par value) of consumer loans in January 2022 and July 2022, respectively, and recognized a gain of $3.0 million and $2.6 million, respectively. The Company also sold $77.4 million (par value) and $18.4 million (par value) of consumer loans in May 2021 and September 2021, respectively, and recognized gains of $15.3 million and $3.2 million, respectively.
|
||||||||||||||||||||||||
| Impairment expense and provision for beneficial interests, net | — | — | — | 2,436 |
In the first quarter of 2021, due to improved economic conditions, the Company recorded a negative provision of $2.4 million related to its remaining allowance on a consumer loan securitization beneficial interest investment. Such allowance was initially recorded in March 2020 as a result of the COVID-19 pandemic.
|
||||||||||||||||||||||||
| Derivative settlements, net | 10,271 | (5,909) | 12,085 | (15,587) | The Company maintains an overall risk management strategy that incorporates the use of derivative instruments to reduce the economic effect of interest rate volatility. Derivative settlements for each applicable period should be evaluated with the Company's net interest income as reflected in the table below. | ||||||||||||||||||||||||
| Derivative market value adjustments, net | 52,991 | 7,260 | 239,125 | 44,455 | Includes the realized and unrealized gains and losses that are caused by changes in fair values of derivatives which do not qualify for "hedge treatment" under GAAP. The majority of the derivative market value adjustments during 2022 and 2021 related to the changes in fair value of the Company's floor income interest rate swaps. Such changes reflect that a decrease in the forward yield curve during a reporting period results in a decrease in the fair value of the Company's floor income interest rate swaps, and an increase in the forward yield curve during a reporting period results in an increase in the fair value of such swaps. | ||||||||||||||||||||||||
| Total other income/expense | 70,516 | (2,480) | 273,096 | 45,505 | |||||||||||||||||||||||||
| Salaries and benefits | 653 | 542 | 1,858 | 1,594 | |||||||||||||||||||||||||
| Other expenses | 3,349 | 5,420 | 9,925 | 12,763 | The primary component of other expenses is servicing fees paid to third parties. The decrease in 2022 as compared to 2021 was due to a decrease in AGM's loan portfolio. These decreases were partially offset by increased costs due to ending COVID-19 pandemic borrower relief policies which increased servicing activities in 2022 as compared to 2021. | ||||||||||||||||||||||||
| Intersegment expenses | 8,350 | 8,652 | 25,694 | 25,627 |
Amounts include fees paid to the LSS operating segment for the servicing of AGM’s loan portfolio. These amounts exceed the actual cost of servicing the loans. The increase in servicing fees for the nine months ended September 30, 2022 as compared to the same period in 2021 was due to ending COVID-19 pandemic borrower relief policies which increased servicing activities in 2022 as compared to 2021. These increases were partially offset by the expected amortization of AGM's FFELP portfolio. Intersegment expenses also include costs for certain corporate activities and services that are allocated to each operating segment based on estimated use of such activities and services.
|
||||||||||||||||||||||||
| Total operating expenses | 12,352 | 14,614 | 37,477 | 39,984 |
Total operating expenses were 32 basis points and 31 basis points of the average balance of loans for the three months ended September 30, 2022 and 2021, respectively, and 31 basis points and 28 basis points for the nine months ended September 30, 2022 and 2021, respectively. The increase in operating expenses as a percent of the average balance of loans in 2022 as compared to 2021 was due to ending COVID-19 pandemic borrower relief policies which increased servicing activities in 2022 as compared to 2021.
|
||||||||||||||||||||||||
| Income before income taxes | 111,872 | 60,085 | 424,647 | 280,613 | |||||||||||||||||||||||||
| Income tax expense | (26,849) | (14,421) | (101,915) | (67,347) | Represents income tax expense at an effective tax rate of 24%. | ||||||||||||||||||||||||
| Net income | $ | 85,023 | 45,664 | 322,732 | 213,266 | ||||||||||||||||||||||||
| Additional information: | |||||||||||||||||||||||||||||
| Net income | $ | 85,023 | 45,664 | 322,732 | 213,266 | See "Overview - GAAP Net Income and Non-GAAP Net Income, Excluding Adjustments" above for additional information about non-GAAP net income, excluding derivative market value adjustments. | |||||||||||||||||||||||
| Derivative market value adjustments, net | (52,991) | (7,260) | (239,125) | (44,455) | |||||||||||||||||||||||||
| Tax effect | 12,718 | 1,742 | 57,390 | 10,669 | |||||||||||||||||||||||||
| Net income, excluding derivative market value adjustments | $ | 44,750 | 40,146 | 140,997 | 179,480 | ||||||||||||||||||||||||
50
Net interest income after provision for loan losses, net of settlements on derivatives
The following table summarizes the components of "net interest income after provision for loan losses" and "derivative settlements, net."
| Three months ended September 30, | Nine months ended September 30, | ||||||||||||||||||||||||||||
| 2022 | 2021 | 2022 | 2021 | Additional information | |||||||||||||||||||||||||
| Variable interest income, gross | $ | 196,910 | 126,270 | 459,575 | 379,705 | Increase in 2022 compared to 2021 was due to an increase in the gross yield earned on loans, partially offset by a decrease in the average balance of loans. | |||||||||||||||||||||||
| Consolidation rebate fees | (32,612) | (40,340) | (104,335) | (121,662) | Decrease in 2022 compared to 2021 was due to a decrease in the average consolidation loan balance. | ||||||||||||||||||||||||
|
Discount accretion, net of
premium and deferred origination costs amortization |
737 | 1,230 | 3,669 | 1,776 | Net discount accretion is due to the Company's purchases of loans at a net discount over the last several years. | ||||||||||||||||||||||||
| Variable interest income, net | 165,035 | 87,160 | 358,909 | 259,819 | |||||||||||||||||||||||||
|
Interest on bonds and notes
payable |
(118,135) | (48,549) | (231,960) | (123,861) |
Increase in 2022 compared to 2021 was due to an increase in cost of funds, partially offset by a decrease in the average balance of debt outstanding. In addition, during the first quarter of 2021, the Company reduced interest expense by $23.8 million as a result of reversing a historical accrued interest liability on certain bonds.
|
||||||||||||||||||||||||
| Derivative settlements, net (a) | (1,085) | (700) | 242 | (939) | Derivative settlements include the net settlements (paid) received related to the Company’s 1:3 basis swaps. | ||||||||||||||||||||||||
| Variable loan interest margin, net of settlements on derivatives (a) | 45,815 | 37,911 | 127,191 | 135,019 | |||||||||||||||||||||||||
| Fixed rate floor income, gross | 7,585 | 35,850 | 54,870 | 108,029 |
Decrease in 2022 compared to 2021 was due to higher interest rates in 2022 as compared to 2021. Subsequent to September 30, 2022 (on November 2, 2022), the Federal Reserve again increased interest rates, and it is currently anticipated that interest rates may continue to rise as a result of inflationary pressures in the U.S. economy; increases in interest rates will reduce the amount of fixed rate floor income the Company is currently receiving.
|
||||||||||||||||||||||||
| Derivative settlements, net (a) | 11,356 | (5,209) | 11,843 | (14,648) |
Derivative settlements include the settlements received (paid) related to the Company's floor income interest rate swaps. The increase in net derivative settlements received by the Company during 2022, as compared to net derivative settlements paid during 2021, was due to an increase in interest rates, partially offset by a decrease in the notional amount of derivatives outstanding.
|
||||||||||||||||||||||||
| Fixed rate floor income, net of settlements on derivatives | 18,941 | 30,641 | 66,713 | 93,381 | |||||||||||||||||||||||||
| Core loan interest income (a) | 64,756 | 68,552 | 193,904 | 228,400 | |||||||||||||||||||||||||
| Investment interest | 10,312 | 8,771 | 28,147 | 20,301 | Increase in 2022 compared to 2021 was due to an increase in the Company's loan beneficial interest investments throughout 2021. | ||||||||||||||||||||||||
| Intercompany interest | (1,874) | (113) | (3,760) | (421) | |||||||||||||||||||||||||
| (Provision) negative provision for loan losses - federally insured loans | (888) | (4,452) | (505) | 3,428 |
The Company has recognized provision for loan losses during the three and nine months ended September 30, 2022 due to management's estimate of declining economic conditions, as well as establishing an initial allowance for loans acquired and originated during the period.
See "Allowance for Loan Losses and Loan Delinquencies" included above under "Asset Generation and Management Operating Segment - Results of Operations" and note 2 of the notes to consolidated financial statements included under Part I, Item 1 of this report. |
||||||||||||||||||||||||
| (Provision) negative provision for loan losses - private education loans | (1,154) | 1,208 | (1,971) | 781 | |||||||||||||||||||||||||
| (Provision) negative provision for loan losses - consumer and other loans | (7,173) | (2,696) | (14,702) | 7,016 | |||||||||||||||||||||||||
| Net interest income after provision for loan losses (net of settlements on derivatives) (a) | $ | 63,979 | 71,270 | 201,113 | 259,505 | Decrease for the three and nine months ended September 30, 2022 as compared to the same periods in 2021 was due to (i) a decrease in the average balance of loans; and (ii) an increase in provision for loan losses. These items were partially offset by (i) an increase in core loan spread; (ii) an increase in interest income as a result of an increase in the Company's loan beneficial interest investments; and (iii) for the year to date comparison, the reversal of a historical accrued interest liability on certain bonds in the first quarter of 2021. | |||||||||||||||||||||||
(a) Core loan interest income and net interest income after provision for loan losses (net of settlements on derivatives) are non-GAAP financial measures. For an explanation of GAAP accounting for derivative settlements and the reasons why the Company reports these non-GAAP measures (and the limitations thereof), see footnote (c) to the table immediately under the caption “Loan Spread Analysis” above. See note 4 of the notes to consolidated financial statements included under Part I, Item 1 of this report for additional information on the Company's derivative instruments, including the net settlement activity recognized by the Company for each type of derivative referred to in the "Additional information" column of this table, for the 2022 and 2021 periods presented in the table under the caption "Consolidated Financial Statement Impact Related to Derivatives - Statements of Income" in note 4 and in this table.
51
NELNET BANK OPERATING SEGMENT – RESULTS OF OPERATIONS
Loan Portfolio
As of September 30, 2022, Nelnet Bank had a $429.5 million loan portfolio, consisting of $356.6 million of private education loans and $72.9 million of FFELP loans.
For a summary of the allowance as a percentage of the ending balance of each of Nelnet Bank's loan portfolios as of September 30, 2022 and December 31, 2021, the activity in Nelnet Bank's allowance for loan losses for the three and nine months ended September 30, 2022 and 2021, and a summary of Nelnet Bank's loan status, delinquency amounts, and other key credit quality indicators as of September 30, 2022, December 31, 2021, and September 30, 2021, see note 2 of the notes to consolidated financial statements included under Part I, Item 1 of this report.
The following table sets forth the activity in Nelnet Bank's loan portfolio:
| Three months ended September 30, | Nine months ended September 30, | ||||||||||||||||||||||
| 2022 | 2021 | 2022 | 2021 | ||||||||||||||||||||
| Beginning balance | $ | 423,553 | 190,571 | 257,901 | 17,543 | ||||||||||||||||||
| Federally insured student loan acquisitions | — | — | — | 99,973 | |||||||||||||||||||
| Private education loan acquisitions | 6,856 | — | 6,856 | — | |||||||||||||||||||
| Private education loan originations | 14,311 | 13,006 | 219,857 | 99,161 | |||||||||||||||||||
| Repayments | (15,244) | (10,865) | (51,011) | (21,863) | |||||||||||||||||||
| Sales to AGM segment | — | (387) | (4,127) | (2,489) | |||||||||||||||||||
| Ending balance | $ | 429,476 | 192,325 | 429,476 | 192,325 | ||||||||||||||||||
Deposits
As of September 30, 2022, Nelnet Bank had $751.4 million of deposits, of which $170.5 million were deposits from Nelnet, Inc. (the parent company) and its subsidiaries (intercompany), and thus eliminated for consolidated financial reporting purposes. All of Nelnet Bank’s deposits are interest-bearing deposits and consist of brokered certificates of deposit (CDs) and retail and other savings deposits and CDs. Retail and other deposits include savings deposits from Educational 529 College Savings and Health Savings plans and commercial and institutional CDs. Union Bank, a related party, is the program manager for the College Savings plans. The intercompany deposits include a pledged deposit of $40.0 million from Nelnet, Inc. as required under the Capital and Liquidity Maintenance Agreement with the FDIC, deposits required for intercompany transactions, operating and savings deposits, and Nelnet Business Services custodial deposits consisting of collected tuition payments which are subsequently remitted to the appropriate school.
52
Average Balance Sheet
The following table reflects the rates earned on interest-earning assets and paid on interest-bearing liabilities.
| Three months ended September 30, | Nine months ended September 30, | ||||||||||||||||||||||||||||||||||||||||||||||
| 2022 | 2021 | 2022 | 2021 | ||||||||||||||||||||||||||||||||||||||||||||
| Balance | Rate | Balance | Rate | Balance | Rate | Balance | Rate | ||||||||||||||||||||||||||||||||||||||||
| Average assets | |||||||||||||||||||||||||||||||||||||||||||||||
| Federally insured student loans | $ | 75,124 | 3.69 | % | $ | 95,510 | 1.36 | % | $ | 80,234 | 2.39 | % | $ | 56,000 | 1.36 | % | |||||||||||||||||||||||||||||||
| Private education loans | 350,668 | 3.31 | 95,752 | 3.14 | 304,174 | 3.13 | 75,522 | 3.19 | |||||||||||||||||||||||||||||||||||||||
| Cash and investments | 424,899 | 3.67 | 206,802 | 1.87 | 348,697 | 2.78 | 215,213 | 1.93 | |||||||||||||||||||||||||||||||||||||||
| Total interest-earning assets | 850,691 | 3.52 | % | 398,064 | 2.05 | % | 733,105 | 2.88 | % | 346,735 | 2.11 | % | |||||||||||||||||||||||||||||||||||
| Non-interest-earning assets | 8,914 | 10,452 | 13,754 | 8,758 | |||||||||||||||||||||||||||||||||||||||||||
| Total assets | $ | 859,605 | $ | 408,516 | $ | 746,859 | $ | 355,493 | |||||||||||||||||||||||||||||||||||||||
| Average liabilities and equity | |||||||||||||||||||||||||||||||||||||||||||||||
| Brokered deposits | $ | 296,257 | 1.42 | % | $ | 84,175 | 0.84 | % | $ | 230,968 | 1.33 | % | $ | 53,459 | 0.84 | % | |||||||||||||||||||||||||||||||
| Intercompany deposits | 155,350 | 2.24 | 98,436 | 0.24 | 121,557 | 1.32 | 83,004 | 0.25 | |||||||||||||||||||||||||||||||||||||||
| Retail and other deposits | 293,209 | 1.84 | 117,360 | 0.62 | 283,386 | 1.08 | 112,255 | 0.61 | |||||||||||||||||||||||||||||||||||||||
| Total interest-bearing liabilities | 744,816 | 1.76 | % | 299,971 | 0.56 | % | 635,911 | 1.22 | % | 248,718 | 0.54 | % | |||||||||||||||||||||||||||||||||||
| Non-interest-bearing liabilities | 4,106 | 5,340 | 5,037 | 4,178 | |||||||||||||||||||||||||||||||||||||||||||
| Equity | 110,683 | 103,205 | 105,911 | 102,597 | |||||||||||||||||||||||||||||||||||||||||||
| Total liabilities and equity | $ | 859,605 | $ | 408,516 | $ | 746,859 | $ | 355,493 | |||||||||||||||||||||||||||||||||||||||
Summary and Comparison of Operating Results
| Three months ended September 30, | Nine months ended September 30, | ||||||||||||||||||||||||||||
| 2022 | 2021 | 2022 | 2021 | Additional information | |||||||||||||||||||||||||
| Total interest income | $ | 7,551 | 2,061 | 15,792 | 5,479 | Represents interest earned on Nelnet Bank's FFELP and private education student loans, cash, and investments. Increase was due to an increase of these balances and interest rates in 2022 as compared to 2021. | |||||||||||||||||||||||
| Interest expense | 3,298 | 421 | 5,792 | 1,007 | Represents interest expense on deposits. Increase was due to an increase of deposits and interest rates in 2022 as compared to 2021. | ||||||||||||||||||||||||
| Net interest income | 4,253 | 1,640 | 10,000 | 4,472 | |||||||||||||||||||||||||
| Provision (negative provision) for loan losses | 450 | (113) | 1,462 | 378 | Represents the current period provision expense to reflect the current lifetime expected credit losses related to Nelnet Bank's loan portfolio. Increase was due to an increase in loans originated in 2022 as compared to 2021 as well as management's estimate of declining economic conditions. | ||||||||||||||||||||||||
| Net interest income after provision for loan losses | 3,803 | 1,753 | 8,538 | 4,094 | |||||||||||||||||||||||||
| Other income | 566 | 450 | 2,224 | 475 |
Represents primarily income and gains from investments.
|
||||||||||||||||||||||||
| Salaries and benefits | 1,814 | 890 | 5,082 | 3,956 | Represents salaries and benefits of Nelnet Bank associates and third-party contract labor. | ||||||||||||||||||||||||
| Depreciation | 4 | — | 11 | — | |||||||||||||||||||||||||
| Other expenses | 1,427 | 445 | 3,009 | 1,227 | Represents various expenses such as consulting and professional fees, Nelnet Bank director fees, occupancy, certain information technology-related costs, insurance, marketing, and other operating expenses. Increase was due to the overall growth of Nelnet Bank activities. | ||||||||||||||||||||||||
| Intersegment expenses | 69 | 32 | 171 | 72 |
Represents primarily servicing costs paid to the LSS operating segment. Certain shared service and support costs incurred by the Company to support Nelnet Bank are not and will not be reflected as part of the Nelnet Bank operating segment through 2023 (when the bank's de novo period will end). The shared service and support costs incurred by the Company related to Nelnet Bank and not reflected in the bank's operating segment were $1.6 million and $0.8 million for the three months ended September 30, 2022 and 2021, respectively, and $4.4 million and $2.5 million for the nine months ended September 30, 2022 and 2021, respectively.
|
||||||||||||||||||||||||
| Total operating expenses | 3,314 | 1,367 | 8,273 | 5,255 | |||||||||||||||||||||||||
| Income (loss) before income taxes | 1,055 | 836 | 2,489 | (686) | |||||||||||||||||||||||||
| Income tax (expense) benefit | (246) | (200) | (574) | 151 |
Represents income tax (expense) benefit at an effective tax rate of 23.3% and 24.0% for the three months ended September 30, 2022 and 2021, respectively, and 23.1% and 22.0% for the nine months ended September 30, 2022 and 2021, respectively.
|
||||||||||||||||||||||||
| Net income (loss) | $ | 809 | 636 | 1,915 | (535) | ||||||||||||||||||||||||
53
LIQUIDITY AND CAPITAL RESOURCES
The Company’s Loan Servicing and Systems, and Education Technology, Services, and Payment Processing operating segments are non-capital intensive and both produce positive operating cash flows. As such, a minimal amount of debt and equity capital is allocated to these segments and any liquidity or capital needs are satisfied using cash flow from operations. Therefore, the Liquidity and Capital Resources discussion is concentrated on the Company’s liquidity and capital needs to meet existing debt obligations in the Asset Generation and Management operating segment and the Company's other initiatives to pursue additional strategic investments.
Sources of Liquidity
As of September 30, 2022, the Company's sources of liquidity included:
| Cash and cash equivalents | $ | 63,198 | ||||||
| Less: Cash and cash equivalents held at Nelnet Bank (1) | (11,806) | |||||||
| Net cash and cash equivalents | 51,392 | |||||||
| Available-for-sale (AFS) debt securities (investments) - at fair value | 1,378,071 | |||||||
| Less: AFS debt securities held at Nelnet Bank - at fair value (1) | (428,360) | |||||||
| AFS debt securities serving as collateral on participation agreement - at fair value (2) | (383,340) | |||||||
| AFS debt securities serving as collateral on repurchase agreements - at fair value (3) | (315,903) | |||||||
| Net AFS debt securities (investments) - at fair value | 250,468 | |||||||
| Unencumbered private, consumer, and other loans (Non-Nelnet Bank) - at par | 319,997 | |||||||
| Repurchased Nelnet issued asset-backed debt securities - at par (not included on consolidated financial statements) (4) | 431,460 | |||||||
| Less: Repurchased Nelnet issued asset-backed debt securities serving as collateral on repurchase agreements - at par | (230,600) | |||||||
| 200,860 | ||||||||
| Unused capacity on unsecured line of credit (5) | 495,000 | |||||||
|
Sources of liquidity as of September 30, 2022
|
$ | 1,317,717 | ||||||
(1) Cash and investments held at Nelnet Bank are generally not available for Company activities outside of Nelnet Bank.
(2) See the caption "Other Debt Facilities" below.
(3) See the caption "Repurchase Agreements" below.
(4) The Company has repurchased certain of its own asset-backed securities (bonds and notes payable) in the secondary market. For accounting purposes, these notes are eliminated in consolidation and are not included in the Company's consolidated financial statements. However, these securities remain legally outstanding at the trust level and the Company could sell these notes to third parties or redeem the notes at par as cash is generated by the trust estate. Upon a sale of these notes to third parties, the Company would obtain cash proceeds equal to the market value of the notes on the date of such sale. Certain of these securities serve as collateral on amounts outstanding under the Company's repurchase agreements as reflected in the table above.
(5) The Company has a $495.0 million unsecured line of credit that matures on September 22, 2026. As of September 30, 2022, there was no amount outstanding on the unsecured line of credit and $495.0 million was available for future use. The line of credit provides that the Company may increase the aggregate financing commitments, through the existing lenders and/or through new lenders, up to a total of $737.5 million, subject to certain conditions.
The Company intends to use its liquidity position to capitalize on market opportunities, including FFELP, private education, consumer, and other loan acquisitions (or investment interests therein); strategic acquisitions and investments; and capital management initiatives, including stock repurchases, debt repurchases, and dividend distributions. The timing and size of these opportunities will vary and will have a direct impact on the Company's cash and investment balances.
54
Cash Flows
The Company has historically generated positive cash flow from operations. During the nine months ended September 30, 2022 and 2021, the Company generated $656.9 million and $336.5 million, respectively, in cash from operating activities. See the caption "Reclassification of Prior Period Cash Flows Presentation" in note 1 of the notes to the consolidated financial statements under Part I, Item 1 of this report for additional information. The increase in 2022 as compared to 2021 was due to:
•
An increase in net income;
•
An increase in proceeds from the Company's clearinghouse for margin payments on derivatives for the nine months ended September 30, 2022 compared to the same period in 2021;
•
Proceeds from termination of derivative instruments for the nine months ended September 30, 2022 compared to no proceeds from terminations in the same period in 2021;
•
Net proceeds from the sale of equity securities for the nine months ended September 30, 2022 compared to net purchases in the same period in 2021;
•
Adjustments to net income for the impact of provision for loan losses, gain on sale of loans, gain/loss on investments, and the non-cash change in deferred income taxes; and
•
The impact of changes to accounts receivable and accrued interest receivable and payable during the nine months ended September 30, 2022 as compared to the same period in 2021.
These factors were partially offset by:
•
The adjustments to net income for derivative market value adjustments; and
•
The impact of changes to other assets and other liabilities during the nine months ended September 30, 2022 as compared to the same period in 2021.
The primary items included in the statement of cash flows for investing activities are the purchase, origination, and repayment of loans and the purchase and sale of available-for-sale securities. The primary items included in financing activities are the proceeds from the issuance of and payments on bonds and notes payable and Nelnet Bank deposits used to fund loans. Cash provided by investing activities and used in financing activities for the nine months ended September 30, 2022 was $1.7 billion and $2.5 billion, respectively. Cash provided by investing activities and used in financing activities for the nine months ended September 30, 2021 was $543.4 million and $587.1 million, respectively. Investing and financing activities are further addressed in the discussion that follows.
Liquidity Needs and Sources of Liquidity Available to Satisfy Debt Obligations Secured by Loan Assets and Related Collateral
The following table shows AGM's debt obligations outstanding that are secured by loan assets and related collateral.
| As of September 30, 2022 | |||||||||||
|
Carrying amount
|
Final maturity | ||||||||||
| Bonds and notes issued in asset-backed securitizations | $ | 13,957,942 | 8/26/30 - 9/25/69 | ||||||||
| FFELP and private education loan warehouse facilities | 335,697 | 10/31/23 / 11/22/23 | |||||||||
| $ | 14,293,639 | ||||||||||
Bonds and Notes Issued in Asset-backed Securitizations
The majority of AGM’s portfolio of student loans is funded in asset-backed securitizations that are structured to substantially match the maturity of the funded assets, thereby minimizing liquidity risk. Cash generated from student loans funded in asset-backed securitizations provide the sources of liquidity to satisfy all obligations related to the outstanding bonds and notes issued in such securitizations. In addition, due to (i) the difference between the yield AGM receives on the loans and cost of financing within these transactions, and (ii) the servicing and administration fees AGM earns from these transactions, AGM has created a portfolio that will generate earnings and significant cash flow over the life of these transactions.
As of September 30, 2022, based on cash flow models developed to reflect management’s current estimate of, among other factors, prepayments, defaults, deferment, forbearance, and interest rates, AGM currently expects future undiscounted cash flows from its portfolio to be approximately $1.66 billion as detailed below.
The forecasted cash flow presented below includes all loans funded in asset-backed securitizations as of September 30, 2022. As of September 30, 2022, AGM had $14.1 billion of loans included in asset-backed securitizations, which represented
55
95.3 percent of its total loan portfolio. The forecasted cash flow does not include cash flows that the Company expects to receive related to loans funded in its warehouse facilities, unencumbered private education and consumer loans funded with operating cash, loans acquired subsequent to September 30, 2022, loans owned by Nelnet Bank, and cash flows relating to the Company's ownership of beneficial interest in loan securitizations (such beneficial interest investments are classified as "investments and notes receivable" on the Company's consolidated balance sheets).
Asset-backed Securitization Cash Flow Forecast
$1.66 billion
(dollars in millions)
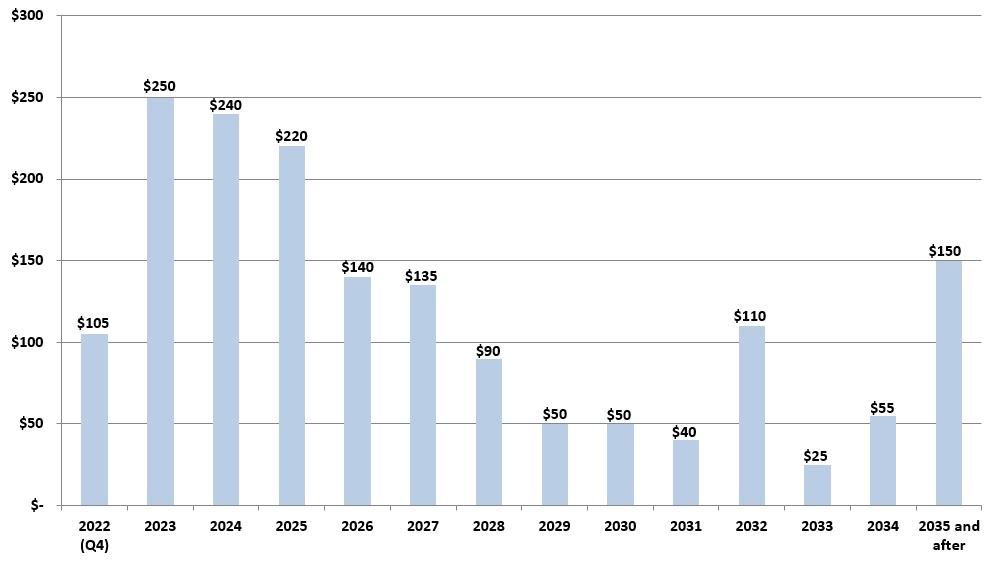
The forecasted future undiscounted cash flows of approximately $1.66 billion include approximately $1.01 billion (as of September 30, 2022) of overcollateralization included in the asset-backed securitizations. These excess net asset positions are included in the consolidated balance sheets and included in the balances of "loans and accrued interest receivable" and "restricted cash." The difference between the total estimated future undiscounted cash flows and the overcollateralization of approximately $0.65 billion, or approximately $0.49 billion after income taxes based on the estimated effective tax rate, represents estimated future net interest income (earnings) from the portfolio and is expected to be accretive to the Company's September 30, 2022 balance of consolidated shareholders' equity.
The Company uses various assumptions, including prepayments and future interest rates, when preparing its cash flow forecast. These assumptions are further discussed below.
Prepayments
: The primary variable in establishing a life of loan estimate is the level and timing of prepayments. Prepayment rates equal the amount of loans that prepay annually as a percentage of the beginning of period balance, net of scheduled principal payments. A number of factors can affect estimated prepayment rates, including the level of consolidation activity, borrower default rates, and utilization of debt management options such as income-based repayment, deferments, and forbearance. Should any of these factors change, management may revise its assumptions, which in turn would impact the projected future cash flow. The Company’s cash flow forecast above assumes prepayment rates of 4 percent for consolidation loans and 5 percent for all other loan types. These prepayment rates are generally consistent with those utilized in the Company’s most recent asset-backed securitization transactions.
On April 19, 2022, the Department issued a press release, and the Department's Office of Federal Student Aid ("FSA") posted a related public announcement, which together announced, among other things, several adjustments, updates, and other changes under income-driven repayment ("IDR") plans for federal student loans. In the announcements, the Department and FSA indicated that as part of these changes, any borrower with loans that have accumulated time in repayment, including time in certain forbearances and deferments, of at least 20 or 25 years will see automatic forgiveness, even if the borrower is not
56
currently in an IDR plan, and that if a borrower has a commercially held FFEL Program loan, the borrower can only benefit from these changes if they consolidate their FFEL Program loan to a Federal Direct Loan Program loan. These changes were reflected in executive actions announced by the Department on October 25, 2022 and final regulations announced by the Department on October 31, 2022. The final regulations are to become effective on July 1, 2023, and the fact sheet accompanying the October 25, 2022 announcement indicates that if a borrower has a commercially held FFEL Program loan, the borrower must apply for consolidation to a Federal Direct Loan Program loan by May 1, 2023 to receive the IDR plan and other benefits set forth in the announcement. These announced changes have increased, and the Company currently believes these announced changes may continue to increase, FFEL Program loan prepayments. In addition, if the federal government and the Department initiate additional loan forgiveness or cancellation, other repayment options or plans, consolidation loan programs, or further extend the suspension of borrower payments under the CARES Act, such initiatives could also significantly increase prepayments. For example, since late 2021, the Company has experienced accelerated run-off of its FFELP portfolio due to FFELP borrowers consolidating their loans into Federal Direct Loan Program loans as a result of the continued extension of the CARES Act and an initiative offered by the Department for FFELP borrowers to consolidate their loans to qualify for loan forgiveness under the Public Service Loan Forgiveness and other programs. See Part II, Item 1A, "Risk Factors" in this report for additional information related to these announcements and other risks associated with loan prepayments.
The following table summarizes the estimated impact to the above forecasted cash flows if prepayments were greater than the prepayment rate assumptions used to calculate the forecasted cash flows.
|
Increase in prepayment rate
|
Reduction in forecasted cash flow from table above
|
Forecasted cash flow using increased prepayment rate | ||||||||||||
| 2x | $0.12 billion | $1.54 billion | ||||||||||||
| 4x | $0.31 billion | $1.35 billion | ||||||||||||
| 10x | $0.56 billion | $1.10 billion | ||||||||||||
If the entire AGM student loan portfolio prepaid, the Company would receive the full amount of overcollateralization included in the asset-backed securitizations of approximately $1.01 billion (as of September 30, 2022); however, the Company would not receive the $0.65 billion ($0.49 billion after tax) of estimated future earnings from the portfolio.
Interest rates
: The Company funds a large portion of its student loans with three-month LIBOR indexed floating rate securities. Meanwhile, the interest earned on the Company’s student loan assets is indexed primarily to a one-month LIBOR rate. The different interest rate characteristics of the Company’s loan assets and liabilities funding these assets result in basis risk. The Company’s cash flow forecast assumes three-month LIBOR will exceed one-month LIBOR by 12 basis points for the life of the portfolio, which approximates the historical relationship between these indices. If the forecast is computed assuming a spread of 24 basis points between three-month and one-month LIBOR for the life of the portfolio, the cash flow forecast would be reduced by approximately $60 million to $80 million. As the percentage of the Company's outstanding debt financed by three-month LIBOR declines, the Company's basis risk will be reduced. In addition, the Company attempts to mitigate the impact of this basis risk by entering into certain derivative instruments.
The Company uses the current forward interest rate yield curve to forecast cash flows. A change in the forward interest rate curve would impact the future cash flows generated from the portfolio. An increase in future interest rates will reduce the amount of fixed rate floor income the Company is currently receiving. The Company attempts to mitigate the impact of a rise in short-term rates by entering into certain derivative instruments.
The forecasted cash flow does not include cash flows the Company expects to pay/receive related to derivative instruments used by the Company to manage interest rate risk.
See Item 3, "Quantitative and Qualitative Disclosures About Market Risk - Interest Rate Risk - AGM Operating Segment" for additional information about various interest rate risks which may impact future cash flows from AGM's loan assets.
In addition, LIBOR is in the process of being discontinued as a benchmark rate, and the market transition away from the current LIBOR framework could result in significant changes to the forecasted cash flows from the Company's asset-backed securitizations. See "Interest Rate Risk - Replacement of LIBOR as a Benchmark Rate" above and Item 1A, "Risk Factors - Loan Portfolio - Interest rate risk - replacement of LIBOR as a benchmark rate" in the Company's 2021 Annual Report for additional information.
57
Warehouse Facilities
The Company funds a portion of its FFELP loan acquisitions using its FFELP warehouse facility. Student loan warehousing allows the Company to buy and manage student loans prior to transferring them into more permanent financing arrangements. As of September 30, 2022, the Company's warehouse facility had a maximum financing amount available of $300.0 million, of which $249.5 million was outstanding and $50.5 million was available for additional funding.
On November 1, 2022, the Company amended its FFELP warehouse facility and inc
reased the maximum financing amount available to $1.2 billion and extended the liquidity provisions and final maturity to May 22, 2023 and May 22, 2024, respectively. The increased capacity was used to fund a FFELP loan portfolio of approximately $670 million that was acquired by the Company on November 1, 2022. In the event the liquidity provisions are not extended on the FFELP warehouse facility, the valuation agent has the right to perform a one-time mark to market on the underlying loans funded in this facility, subject to a floor. The loans would then be funded at this new advance rate until the final maturity date of the facility.
The Company has a private education loan warehouse facility that, as of September 30, 2022, had an aggregate maximum financing amount available of $175.0 million, an advance rate of 80 to 90 percent, liquidity provisions through October 31, 2022, and a final maturity date of October 31, 2023. As of September 30, 2022, $86.2 million was outstanding under this warehouse facility, $88.8 million was available for future funding, and $9.8 million was advanced as equity support.
Upon termination or expiration of the warehouse facilities, the Company would expect to access the securitization market, obtain replacement warehouse facilities, use operating cash, consider the sale of assets, or transfer collateral to satisfy any remaining obligations.
Other Uses of Liquidity
The Company no longer originates FFELP loans, but continues to acquire FFELP loan portfolios from third parties and believes additional loan purchase opportunities exist, including opportunities to purchase private education, consumer, and other loans (or investment interests therein).
The Company plans to fund additional loan acquisitions and related investments using current cash; using proceeds from the sale of certain investments; using its unsecured line of credit, Union Bank student loan participation agreement, Union Bank student loan asset-backed securities participation agreement, and third-party repurchase agreements (each as described below), and/or establishing similar secured and unsecured borrowing facilities; using its existing warehouse facilities (as described above); increasing the capacity under existing and/or establishing new warehouse facilities; and continuing to access the asset-backed securities market.
Repurchase Agreements
In December 2020, Wells Fargo announced the sale of its approximately $10.0 billion portfolio of private education loans representing approximately 445,000 borrowers. The Company entered into a joint venture with other investors to acquire the loans, and under the joint venture, the Company had an approximately 8 percent interest in the loans and has a corresponding 8 percent interest in residual interests in the 2021 securitizations of the loans discussed below. The joint venture established a limited partnership that purchased the private education loans and funded such loans with a temporary warehouse facility.
During 2021, the Company sponsored four asset-backed securitization transactions to permanently finance a total of $8.7 billion of private education loans sold by Wells Fargo (which represented the total remaining loans originally purchased from Wells Fargo, factoring in borrower payments from the date of purchase). As sponsor, the Company is required to provide a certain level of risk retention, and has purchased bonds issued in such securitizations to satisfy this requirement. The bonds purchased to satisfy the risk retention requirement are reflected on the Company's consolidated balance sheet as "investments and notes receivable" and as of September 30, 2022, the fair value of these bonds was $315.9 million. The Company must retain these investment securities until the latest of (i) two years from the closing date of the securitization, (ii) the date the aggregate outstanding principal balance of the loans in the securitization is 33% or less of the initial loan balance, and (iii) the date the aggregate outstanding principal balance of the bonds is 33% or less of the aggregate initial outstanding principal balance of the bonds, at which time the Company can sell its investment securities (bonds) to a third party. The Company entered into repurchase agreements with third parties, of which a portion of the proceeds from such agreements were used to purchase the asset-backed investments, and such investments serve as collateral on the repurchase obligations.
In addition, as discussed above, the Company has repurchased certain of its own asset-backed securities in the secondary market that serve as collateral on amounts outstanding under the Company's repurchase agreements.
As of September 30, 2022, $507.0 million was outstanding on the Company's repurchase agreements, of which $304.1 million was borrowed to fund private education loan securitization bonds subject to the Company’s risk retention requirement and
58
$202.9 million was borrowed to fund repurchased FFELP loan asset-backed securities. The repurchase agreements have various maturity dates (as of September 30, 2022) between October 7, 2022 and November 27, 2024, but one of the agreements is subject to early termination upon required notice provided by the Company or the applicable counterparty prior to the maturity dates. The Company is required to pay additional cash in the event the fair value of the securities subject to a repurchase agreement becomes less than the original purchase price of such securities.
Upon termination or expiration of the repurchase agreements, the Company would use cash and/or cash proceeds from its unsecured line of credit, consider the sale of assets (subject to any restrictions described above), or transfer collateral to satisfy any outstanding obligations subject to the repurchase agreements.
Union Bank Participation Agreement
The Company maintains an agreement with Union Bank, a related party, as trustee for various grantor trusts, under which Union Bank has agreed to purchase from the Company participation interests in student loans. As of September 30, 2022, $859.3 million of loans were subject to outstanding participation interests held by Union Bank, as trustee, under this agreement. The agreement automatically renews annually and is terminable by either party upon five business days' notice. This agreement provides beneficiaries of Union Bank’s grantor trusts with access to investments in interests in student loans, while providing liquidity to the Company. The Company can participate loans to Union Bank to the extent of availability under the grantor trusts, up to $900.0 million or an amount in excess of $900.0 million if mutually agreed to by both parties. Loans participated under this agreement have been accounted for by the Company as loan sales. Accordingly, the participation interests sold are not included on the Company’s consolidated balance sheets.
Asset-backed Securities Transactions
The Company, through its subsidiaries, has historically funded student loans by completing asset-backed securitizations. Depending on market conditions, the Company currently anticipates continuing to access the asset-backed securitization market. Such asset-backed securitization transactions would be used to refinance student loans included in its warehouse facilities, loans purchased from third parties, and/or student loans in its existing asset-backed securitizations.
There were no asset-backed securitization transactions completed during the nine months ended September 30, 2022.
Liquidity Impact Related to Nelnet Bank
Nelnet Bank launched operations in November 2020. Nelnet Bank was funded by the Company with an initial capital contribution of $100.0 million, consisting of $55.9 million of cash and $44.1 million of student loan asset-backed securities. In addition, the Company made a pledged deposit of $40.0 million with Nelnet Bank, as required under an agreement with the FDIC discussed below.
Prior to Nelnet Bank’s launch of operations, Nelnet Bank, Nelnet, Inc. (the parent), and Michael S. Dunlap (Nelnet, Inc.’s controlling shareholder) entered into a Capital and Liquidity Maintenance Agreement and a Parent Company Agreement with the FDIC in connection with Nelnet, Inc.’s role as a source of financial strength for Nelnet Bank. As part of the Capital and Liquidity Maintenance Agreement, Nelnet, Inc. is obligated to (i) contribute capital to Nelnet Bank for it to maintain capital levels that meet FDIC requirements for a “well capitalized” bank, including a leverage ratio of capital to total assets of at least 12 percent; (ii) provide and maintain an irrevocable asset liquidity takeout commitment for the benefit of Nelnet Bank in an amount equal to the greater of either 10 percent of Nelnet Bank’s total assets or such additional amount as agreed to by Nelnet Bank and Nelnet, Inc.; (iii) provide additional liquidity to Nelnet Bank in such amount and duration as may be necessary for Nelnet Bank to meet its ongoing liquidity obligations; and (iv) establish and maintain a pledged deposit of $40.0 million with Nelnet Bank.
Under the regulatory framework for prompt corrective action, Nelnet Bank is subject to various regulatory capital requirements administered by the FDIC and the UDFI and must meet specific capital standards. Failure to meet minimum capital requirements can initiate certain mandatory and possibly additional discretionary actions by regulators that, if undertaken, could have a direct material adverse effect on Nelnet Bank's business, results of operations, and financial condition. On January 1, 2020, the Community Bank Leverage Ratio ("CBLR") framework, as issued jointly by the Office of the Comptroller of the Currency, the Federal Reserve Board, and the FDIC, became effective. Any banking organization with total consolidated assets of less than $10 billion, limited amounts of certain types of assets and off-balance sheet exposures, and a community bank leverage ratio greater than 9% may opt into the CBLR framework quarterly. The CBLR framework allows banks to satisfy capital standards and be considered "well capitalized" under the prompt corrective action framework if their leverage ratio is greater than 9%, unless the banking organization's federal banking agency determines that the banking organization's risk profile warrants a more stringent leverage ratio. The FDIC has ordered Nelnet Bank to maintain at least a 12% leverage ratio. Nelnet Bank has opted into the CBLR framework for the quarter ended September 30, 2022 with a leverage ratio of 14.7%.
59
Nelnet Bank intends to maintain at all times regulatory capital levels that meet both the minimum level necessary to be considered “well capitalized” under the FDIC’s prompt corrective action framework and the minimum level required by the FDIC.
Nelnet, Inc. made additional capital contributions to Nelnet Bank in each the second and third quarters of 2022 of $15.0 million.
Liquidity Impact Related to ALLO
Upon the deconsolidation of ALLO on December 21, 2020, the Company recorded its 45 percent voting membership interests in ALLO at fair value, and accounts for such investment under the HLBV method of accounting. In addition, the Company recorded its remaining non-voting preferred membership units of ALLO at fair value, and accounts for such investment as a separate equity investment. As of September 30, 2022, the outstanding preferred membership interests of ALLO held by the Company was $137.3 million that earns a preferred annual return of 6.25 percent.
Agreements among the Company, SDC (a third party global digital infrastructure investor), and ALLO provide that they will use commercially reasonable efforts (which excludes requiring ALLO to raise any additional equity financing or sell any assets) to cause the redemption, on or before April 2024, of the remaining non-voting preferred membership interests in ALLO held by the Company, plus the amount of accrued and unpaid preferred return on such interests. However, if the non-voting preferred membership interests are not redeemed on or before April 2024, the preferred annual return is increased from 6.25 percent to 10.00 percent.
If ALLO needs additional capital to support its growth in existing or new markets, the Company has the option to contribute additional capital to maintain its voting equity interest. Although ALLO has obtained third-party debt financing to fund a large portion of its current growth plans, the Company contributed $34.7 million of additional equity to ALLO on February 25, 2022. As a result of this equity contribution, the Company’s voting membership interests percentage did not materially change. Based on ALLO's business plan for growth and current financial condition, the Company currently believes it may make additional capital contributions to ALLO during the fourth quarter of 2022 and during 2023 and 2024.
Liquidity Impact Related to Hedging Activities
The Company utilizes derivative instruments to manage interest rate sensitivity. By using derivative instruments, the Company is exposed to market risk which could impact its liquidity. Based on the derivative portfolio outstanding as of September 30, 2022, the Company does not currently anticipate any movement in interest rates having a material impact on its capital or liquidity profile, nor does the Company expect that any movement in interest rates would have a material impact on its ability to make variation margin payments to its third-party clearinghouse. However, if interest rates move materially and negatively impact the fair value of the Company's derivative portfolio, the replacement of LIBOR as a benchmark rate has significant adverse impacts on the Company's derivatives, or if the Company enters into additional derivatives for which the fair value becomes negative, the Company could be required to make variation margin payments to its third-party clearinghouse. The variation margin, if significant, could negatively impact the Company's liquidity and capital resources. In addition, clearing rules require the Company to post amounts of liquid collateral when executing new derivative instruments, which could prevent or limit the Company from utilizing additional derivative instruments to manage interest rate sensitivity and risks. See note 4 of the notes to consolidated financial statements included in this report for additional information on the Company's derivative portfolio.
Other Debt Facilities
As discussed above, the Company has a $495.0 million unsecured line of credit with a maturity date of September 22, 2026. As of September 30, 2022, the unsecured line of credit had no amount outstanding and $495.0 million was available for future use. Upon the maturity date of this facility, there can be no assurance that the Company will be able to maintain this line of credit, increase or maintain the amount outstanding under the line, or find alternative funding if necessary.
During 2020, the Company entered into an agreement with Union Bank, as trustee for various grantor trusts, under which Union Bank has agreed to purchase from the Company participation interests in federally insured student loan asset-backed securities. As of September 30, 2022, $399.7 million (par value) of student loan asset-backed securities were subject to outstanding participation interests held by Union Bank, as trustee, under this agreement. This participation agreement has been accounted for by the Company as a secured borrowing. Upon termination or expiration of this agreement, the Company would expect to use operating cash, consider the sale of assets, or transfer collateral to satisfy any remaining obligations.
Stock Repurchases
In 2019, the Board of Directors authorized a stock repurchase program to repurchase up to a total of five million shares of the Company's Class A common stock during the three-year period ended May 7, 2022. On May 9, 2022, the Board of Directors
60
authorized a new stock repurchase program to repurchase up to a total of five million shares of the Company's Class A common stock during the three-year period ending May 8, 2025. The five million shares authorized under the new program include the remaining unpurchased shares from the prior program, which the new program replaced. As of September 30, 2022, 4,517,936 shares remained authorized for repurchase under the Company's stock repurchase program. Shares may be repurchased from time to time on the open market, in private transactions (including with related parties), or otherwise, depending on various factors, including share prices and other potential uses of liquidity.
Shares repurchased by the Company during the three months ended March 31, 2022, June 30, 2022, and September 30, 2022 are shown below. For additional information on stock repurchases during the third quarter of 2022, see "Stock Repurchases" under Part II, Item 2 of this report.
| Total shares repurchased |
Purchase price
(in thousands) |
Average price of shares repurchased (per share) | |||||||||||||||
| Quarter ended March 31, 2022 | 380,053 | $ | 32,899 | 86.56 | |||||||||||||
| Quarter ended June 30, 2022 | 558,257 | 46,032 | 82.46 | ||||||||||||||
| Quarter ended September 30, 2022 | 169,860 | 14,293 | 84.14 | ||||||||||||||
| Total | 1,108,170 | $ | 93,224 | 84.12 | |||||||||||||
Dividends
On September 15, 2022, the Company paid a third quarter 2022 cash dividend on the Company's Class A and Class B common stock of $0.24 per share. In addition, the Company's Board of Directors has declared a fourth quarter 2022 cash dividend on the Company's outstanding shares of Class A and Class B common stock of $0.26 per share. The fourth quarter cash dividend will be paid on December 15, 2022 to shareholders of record at the close of business on December 1, 2022.
The Company currently plans to continue making regular quarterly dividend payments, subject to future earnings, capital requirements, financial condition, and other factors.
CRITICAL ACCOUNTING POLICIES AND ESTIMATES
This Management’s Discussion and Analysis of Financial Condition and Results of Operations discusses the Company’s consolidated financial statements, which have been prepared in accordance with accounting principles generally accepted in the United States. The preparation of these financial statements requires management to make estimates and assumptions that affect the reported amounts of assets and liabilities and the reported amounts of income and expenses during the reporting periods. The Company bases its estimates and judgments on historical experience and on various other factors that the Company believes are reasonable under the circumstances. Actual results may differ from these estimates under varying assumptions or conditions. Note 3 of the notes to consolidated financial statements included in the Company’s 2021 Annual Report includes a summary of the significant accounting policies and methods used in the preparation of the consolidated financial statements.
On an on-going basis, management evaluates its estimates and judgments, particularly as they relate to accounting policies that management believes are most “critical” — that is, they are most important to the portrayal of the Company’s financial condition and results of operations and they require management’s most difficult, subjective, or complex judgments, often as a result of the need to make estimates about the effect of matters that are inherently uncertain. Management has identified the allowance for loan losses as a critical accounting policy and estimate, as discussed further under Part II, Item 7, “Management’s Discussion and Analysis of Financial Condition and Results of Operations – Critical Accounting Policies and Estimates – Allowance for Loan Losses” in the Company’s 2021 Annual Report. For additional information regarding changes in the Company’s allowance for loan losses for the three and nine months ended September 30, 2022 and 2021, see the caption “Activity in the Allowance for Loan Losses” in note 2 of the notes to consolidated financial statements included under Part I, Item 1 of this report. There have been no material changes to the Company’s critical accounting policy and estimate since December 31, 2021.
RECENT ACCOUNTING PRONOUNCEMENTS
Financial Instruments - Credit Losses
In March 2022, the FASB issued accounting guidance which eliminates the troubled debt restructurings recognition and measurement guidance and instead requires an entity to evaluate whether the modification represents a new loan or a continuation of an existing loan. The guidance also enhances the disclosure requirements for certain modifications of receivables made to borrowers experiencing financial difficulty. This guidance will be effective for the Company beginning January 1, 2023 with early adoption permitted. The Company is evaluating the impact this pronouncement will have on its ongoing financial reporting.
61
ITEM 3. QUANTITATIVE AND QUALITATIVE DISCLOSURES ABOUT MARKET RISK
(All dollars are in thousands, except share amounts, unless otherwise noted)
Interest Rate Risk - AGM Operating Segment
AGM’s primary market risk exposure arises from fluctuations in its borrowing and lending rates, the spread between which could impact AGM due to shifts in market interest rates.
The following table sets forth AGM’s loan assets and debt instruments by rate characteristics:
| As of September 30, 2022 | As of December 31, 2021 | ||||||||||||||||||||||
| Dollars | Percent | Dollars | Percent | ||||||||||||||||||||
| Fixed-rate loan assets | $ | 2,015,443 | 13.6 | % | $ | 7,434,068 | 42.6 | % | |||||||||||||||
| Variable-rate loan assets | 12,778,572 | 86.4 | 10,007,722 | 57.4 | |||||||||||||||||||
| Total | $ | 14,794,015 | 100.0 | % | $ | 17,441,790 | 100.0 | % | |||||||||||||||
| Fixed-rate debt instruments | $ | 671,012 | 4.7 | % | $ | 801,548 | 4.7 | % | |||||||||||||||
| Variable-rate debt instruments | 13,622,627 | 95.3 | 16,279,722 | 95.3 | |||||||||||||||||||
| Total | $ | 14,293,639 | 100.0 | % | $ | 17,081,270 | 100.0 | % | |||||||||||||||
FFELP loans originated prior to April 1, 2006 generally earn interest at the higher of the borrower rate, which is fixed over a period of time, or a floating rate based on the special allowance payment ("SAP") formula set by the Department. The SAP rate is based on an applicable index plus a fixed spread that depends on loan type, origination date, and repayment status. The Company generally finances its FFELP student loan portfolio with variable rate debt. In low and/or declining interest rate environments, when the fixed borrower rate is higher than the SAP rate, the Company’s FFELP student loans earn at a fixed rate while the interest on the variable rate debt typically continues to reflect the low and/or declining interest rates. In these interest rate environments, the Company may earn additional spread income that it refers to as floor income.
Depending on the type of loan and when it was originated, the borrower rate is either fixed to term or is reset to an annual rate each July 1. As a result, for loans where the borrower rate is fixed to term, the Company may earn floor income for an extended period of time, which the Company refers to as fixed rate floor income, and for those loans where the borrower rate is reset annually on July 1, the Company may earn floor income to the next reset date, which the Company refers to as variable rate floor income. All FFELP loans first originated on or after April 1, 2006 effectively earn at the SAP rate, since lenders are required to rebate fixed rate floor income and variable rate floor income for those loans to the Department.
No variable-rate floor income was earned by the Company in 2022 or 2021.
A summary of fixed rate floor income earned by the AGM operating segment follows.
| Three months ended September 30, | Nine months ended September 30, | ||||||||||||||||||||||
| 2022 | 2021 | 2022 | 2021 | ||||||||||||||||||||
| Fixed rate floor income, gross | $ | 7,585 | 35,850 | 54,870 | 108,029 | ||||||||||||||||||
| Derivative settlements (a) | 11,356 | (5,209) | 11,843 | (14,648) | |||||||||||||||||||
| Fixed rate floor income, net | $ | 18,941 | 30,641 | 66,713 | 93,381 | ||||||||||||||||||
(a) Derivative settlements consist of settlements received (paid) related to the Company's derivatives used to hedge student loans earning fixed rate floor income.
Gross fixed rate floor income decreased for the three and nine months ended September 30, 2022 as compared to the same periods in 2021 due to higher interest rates in 2022 as compared to 2021.
Absent the use of derivative instruments, a rise in interest rates will reduce the amount of floor income received and has an impact on earnings due to interest margin compression caused by increasing financing costs, until such time as the federally insured loans earn interest at a variable rate in accordance with their SAP formulas. In higher interest rate environments, where the interest rate rises above the borrower rate and fixed rate loans effectively become variable rate loans, the impact of the rate fluctuations is reduced.
The Company enters into derivative instruments to hedge student loans earning fixed rate floor income. The increase in net derivative settlements received by the Company during the three and nine months ended September 30, 2022, as compared to net derivative settlements paid during the same periods in 2021, was due to an increase in interest rates, partially offset by a decrease in the notional amount of derivatives outstanding.
62
The following graph depicts fixed rate floor income for a borrower with a fixed rate of 6.75% and a SAP rate of 2.64%:
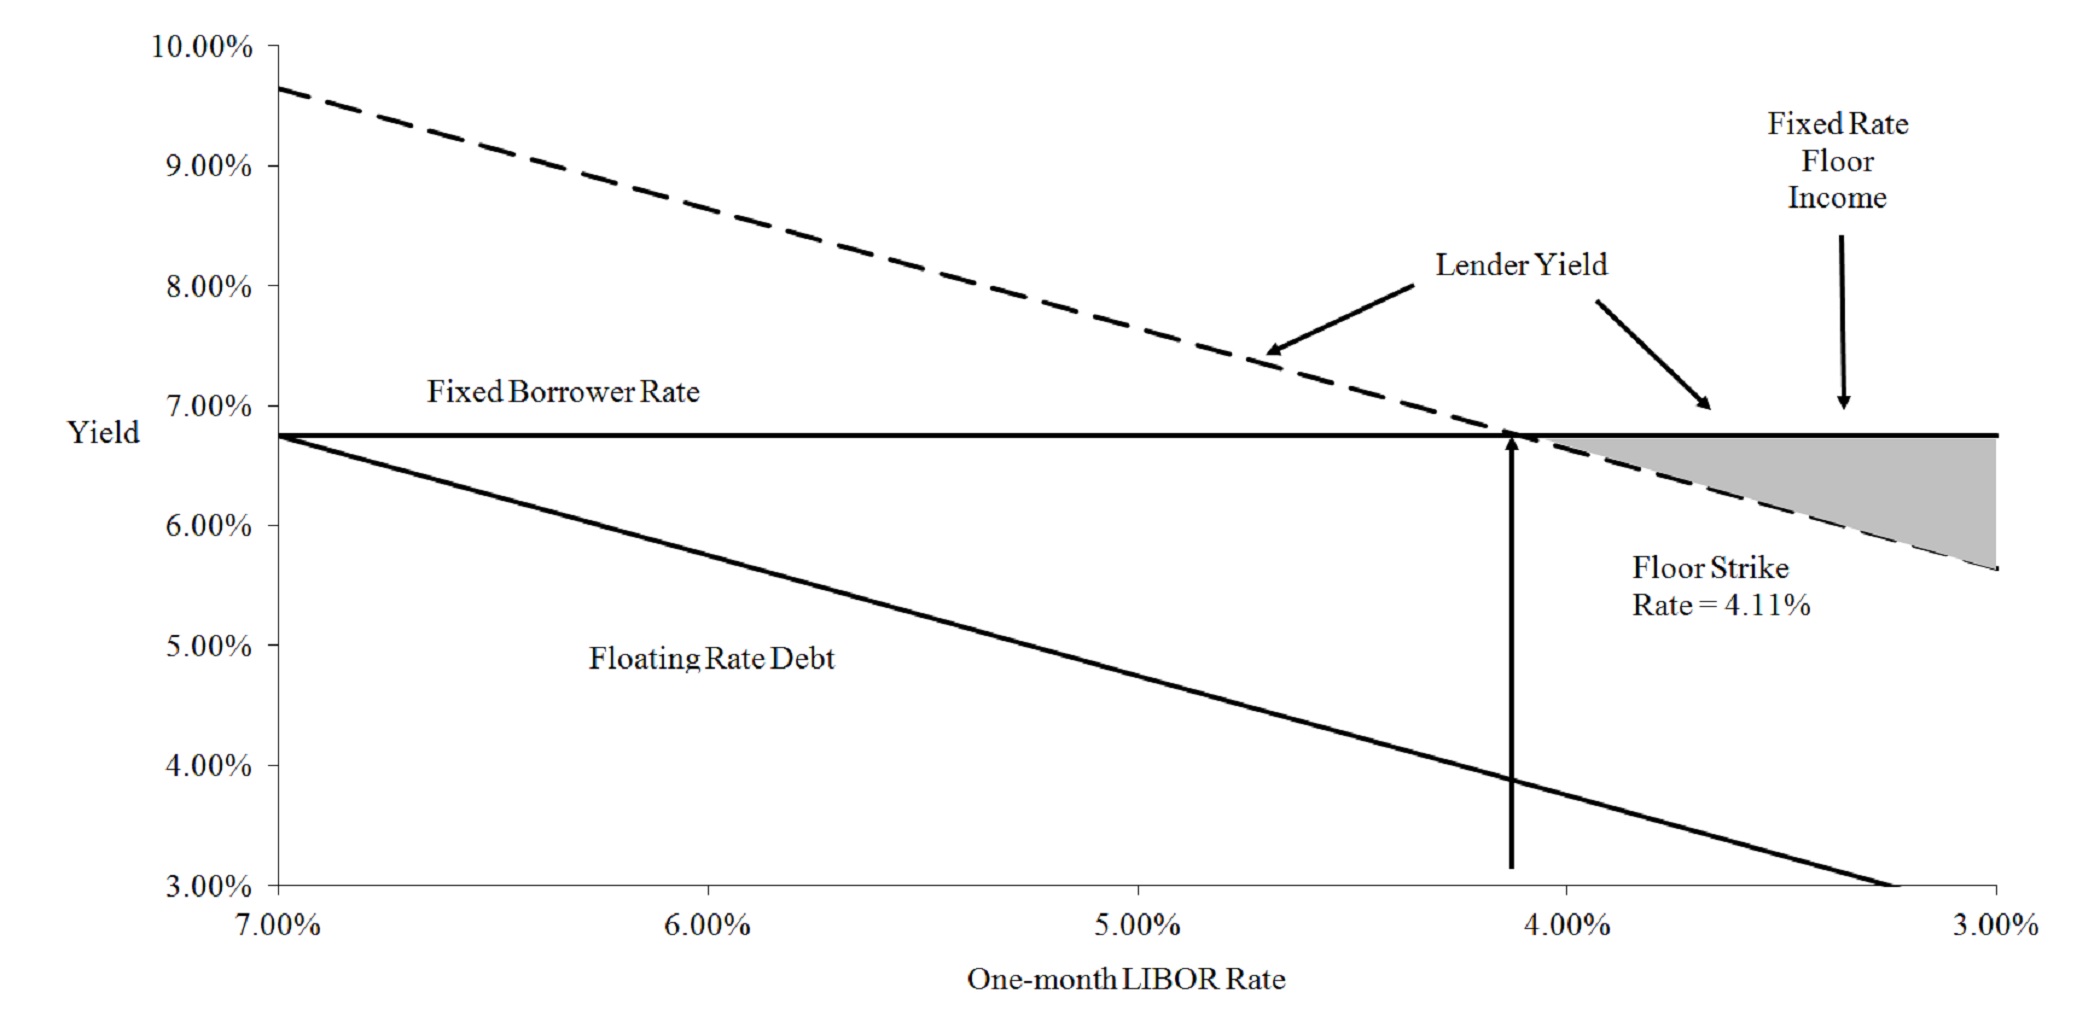
The following table shows AGM’s federally insured student loan assets that were earning fixed rate floor income as of September 30, 2022.
| Fixed interest rate range | Borrower/lender weighted average yield | Estimated variable conversion rate (a) | Loan balance | |||||||||||||||||
| 5.0 - 5.49% | 5.35% | 2.71% | $ | 177,056 | ||||||||||||||||
| 5.5 - 5.99% | 5.68% | 3.04% | 199,123 | |||||||||||||||||
| 6.0 - 6.49% | 6.19% | 3.55% | 245,508 | |||||||||||||||||
| 6.5 - 6.99% | 6.70% | 4.06% | 238,899 | |||||||||||||||||
| 7.0 - 7.49% | 7.17% | 4.53% | 87,432 | |||||||||||||||||
| 7.5 - 7.99% | 7.72% | 5.08% | 167,776 | |||||||||||||||||
| 8.0 - 8.99% | 8.18% | 5.54% | 390,549 | |||||||||||||||||
|
>
9.0%
|
9.05% | 6.41% | 150,258 | |||||||||||||||||
| $ | 1,656,601 | |||||||||||||||||||
(a) The estimated variable conversion rate is the estimated short-term interest rate at which loans would convert to a variable rate. As of September 30, 2022, the weighted average estimated variable conversion rate was 4.41% and the short-term interest rate was 251 basis points.
The following table summarizes the outstanding derivative instruments as of September 30, 2022 used by AGM to economically hedge loans earning fixed rate floor income.
| Maturity | Notional amount | Weighted average fixed rate paid by the Company (a) | ||||||||||||
| 2024 | $ | 2,000,000 | 0.35 | % | ||||||||||
| 2026 | 500,000 | 1.02 | ||||||||||||
| 2031 | 100,000 | 1.53 | ||||||||||||
| $ | 2,600,000 | 0.52 | % | |||||||||||
(a) For all interest rate derivatives, the Company receives discrete three-month LIBOR.
63
AGM is also exposed to interest rate risk in the form of basis risk and repricing risk because the interest rate characteristics of AGM’s assets do not match the interest rate characteristics of the funding for those assets. The following table presents AGM’s FFELP student loan assets and related funding for those assets arranged by underlying indices as of September 30, 2022.
| Index | Frequency of variable resets | Assets | Funding of student loan assets | |||||||||||||||||
| 1 month LIBOR (a) | Daily | $ | 13,345,170 | — | ||||||||||||||||
| 3 month H15 financial commercial paper | Daily | 509,155 | — | |||||||||||||||||
| 3 month Treasury bill | Daily | 446,066 | — | |||||||||||||||||
| 1 month LIBOR | Monthly | — | 8,933,130 | |||||||||||||||||
| 3 month LIBOR (a) | Quarterly | — | 4,122,979 | |||||||||||||||||
| Fixed rate | — | — | 646,956 | |||||||||||||||||
| Asset-backed commercial paper (b) | Varies | — | 249,543 | |||||||||||||||||
| Auction-rate (c) | Varies | — | 208,660 | |||||||||||||||||
| Other (d) | — | 1,493,406 | 1,632,529 | |||||||||||||||||
| $ | 15,793,797 | 15,793,797 | ||||||||||||||||||
(a) The Company has certain basis swaps outstanding in which the Company receives three-month LIBOR and pays one-month LIBOR plus or minus a spread as defined in the agreements (the "1:3 Basis Swaps"). The Company entered into these derivative instruments to better match the interest rate characteristics on its student loan assets and the debt funding such assets. The following table summarizes the 1:3 Basis Swaps outstanding as of September 30, 2022.
| Maturity | Notional amount (i) | |||||||
| 2022 | $ | 1,000,000 | ||||||
| 2023 | 750,000 | |||||||
| 2024 | 1,750,000 | |||||||
| 2026 | 1,150,000 | |||||||
| 2027 | 250,000 | |||||||
| $ | 4,900,000 | |||||||
(i) The weighted average rate paid by the Company on the 1:3 Basis Swaps as of September 30, 2022 was one-month LIBOR plus 9.4 basis points.
(b) The interest rate on the Company's FFELP warehouse facility is indexed to asset-backed commercial paper rates.
(c) As of September 30, 2022, the Company was sponsor for $208.7 million of outstanding asset-backed securities that were set and provide for interest rates to be periodically reset via a "dutch auction" (“Auction Rate Securities”). Since the auction feature has essentially been inoperable for substantially all auction rate securities since 2008, the Auction Rate Securities generally pay interest to the holder at a maximum rate as defined by the indenture. While these rates will vary, they will generally be based on a spread to LIBOR or Treasury Securities, or the Net Loan Rate as defined in the financing documents.
(d) Assets include accrued interest receivable and restricted cash. Funding represents overcollateralization (equity) and other liabilities included in FFELP asset-backed securitizations and warehouse facilities.
LIBOR is in the process of being discontinued as a benchmark rate, and the market transition away from the current LIBOR framework could result in significant changes to the interest rate characteristics of the Company's LIBOR-indexed assets and funding for those assets. See "Interest Rate Risk - Repayment of LIBOR as a Benchmark Rate" under Item 2 above and Item 1A, "Risk Factors - Loan Portfolio - Interest rate risk - replacement of LIBOR as a benchmark rate" in the Company's 2021 Annual Report for additional information.
64
Sensitivity Analysis
The following tables summarize the effect on the Company’s consolidated earnings, based upon a sensitivity analysis performed on AGM's assets and liabilities assuming hypothetical increases in interest rates of 100 basis points and 300 basis points while funding spreads remain constant. In addition, a sensitivity analysis was performed assuming the funding index increases 10 basis points and 30 basis points while holding the asset index constant, if the funding index is different than the asset index. The sensitivity analysis was performed on AGM’s variable rate assets (including loans earning fixed rate floor income) and liabilities. The analysis includes the effects of AGM’s derivative instruments in existence during these periods.
| Interest rates | Asset and funding index mismatches | ||||||||||||||||||||||||||||||||||||||||||||||
|
Change from increase of
100 basis points |
Change from increase of
300 basis points |
Increase of
10 basis points |
Increase of
30 basis points |
||||||||||||||||||||||||||||||||||||||||||||
| Dollars | Percent | Dollars | Percent | Dollars | Percent | Dollars | Percent | ||||||||||||||||||||||||||||||||||||||||
| Three months ended September 30, 2022 | |||||||||||||||||||||||||||||||||||||||||||||||
| Effect on earnings: | |||||||||||||||||||||||||||||||||||||||||||||||
| Decrease in pre-tax net income before impact of derivative settlements | $ | (2,396) | (1.9) | % | $ | (3,702) | (2.9) | % | $ | (1,148) | (0.9) | % | $ | (3,445) | (2.7) | % | |||||||||||||||||||||||||||||||
| Impact of derivative settlements | 6,553 | 5.2 | 19,660 | 15.5 | 1,235 | 1.0 | 3,705 | 2.9 | |||||||||||||||||||||||||||||||||||||||
| Increase (decrease) in net income before taxes | $ | 4,157 | 3.3 | % | $ | 15,958 | 12.6 | % | $ | 87 | 0.1 | % | $ | 260 | 0.2 | % | |||||||||||||||||||||||||||||||
| Increase (decrease) in basic and diluted earnings per share | $ | 0.08 | $ | 0.32 | $ | 0.00 | $ | 0.01 | |||||||||||||||||||||||||||||||||||||||
| Three months ended September 30, 2021 | |||||||||||||||||||||||||||||||||||||||||||||||
| Effect on earnings: | |||||||||||||||||||||||||||||||||||||||||||||||
|
Decrease in pre-tax net income before
impact of derivative settlements |
$ | (14,394) | (21.5) | % | $ | (27,280) | (40.8) | % | $ | (1,484) | (2.2) | % | $ | (4,453) | (6.7) | % | |||||||||||||||||||||||||||||||
| Impact of derivative settlements | 12,252 | 18.3 | 36,756 | 55.0 | 1,487 | 2.2 | 4,461 | 6.7 | |||||||||||||||||||||||||||||||||||||||
|
Increase (decrease) in net income
before taxes |
$ | (2,142) | (3.2) | % | $ | 9,476 | 14.2 | % | $ | 3 | 0.0 | % | $ | 8 | 0.0 | % | |||||||||||||||||||||||||||||||
|
Increase (decrease) in basic and
diluted earnings per share |
$ | (0.04) | $ | 0.19 | $ | 0.00 | $ | 0.00 | |||||||||||||||||||||||||||||||||||||||
| Nine months ended September 30, 2022 | |||||||||||||||||||||||||||||||||||||||||||||||
| Effect on earnings: | |||||||||||||||||||||||||||||||||||||||||||||||
|
Decrease in pre-tax net income before
impact of derivative settlements |
$ | (18,464) | (3.9) | % | $ | (31,854) | (6.7) | % | $ | (3,609) | (0.8) | % | $ | (10,828) | (2.3) | % | |||||||||||||||||||||||||||||||
| Impact of derivative settlements | 25,008 | 5.3 | 75,025 | 15.8 | 3,912 | 0.8 | 11,733 | 2.5 | |||||||||||||||||||||||||||||||||||||||
|
Increase (decrease) in net income
before taxes |
$ | 6,544 | 1.4 | % | $ | 43,171 | 9.1 | % | $ | 303 | 0.0 | % | $ | 905 | 0.2 | % | |||||||||||||||||||||||||||||||
|
Increase (decrease) in basic and
diluted earnings per share |
$ | 0.13 | $ | 0.87 | $ | 0.00 | $ | 0.02 | |||||||||||||||||||||||||||||||||||||||
| Nine months ended September 30, 2021 | |||||||||||||||||||||||||||||||||||||||||||||||
| Effect on earnings: | |||||||||||||||||||||||||||||||||||||||||||||||
|
Decrease in pre-tax net income before
impact of derivative settlements |
$ | (42,749) | (12.8) | % | $ | (79,285) | (23.7) | % | $ | (4,659) | (1.4) | % | $ | (13,980) | (4.2) | % | |||||||||||||||||||||||||||||||
| Impact of derivative settlements | 30,944 | 9.3 | 92,831 | 27.8 | 4,474 | 1.3 | 13,423 | 4.0 | |||||||||||||||||||||||||||||||||||||||
|
Increase (decrease) in net income
before taxes |
$ | (11,805) | (3.5) | % | $ | 13,546 | 4.1 | % | $ | (185) | (0.1) | % | $ | (557) | (0.2) | % | |||||||||||||||||||||||||||||||
|
Increase (decrease) in basic and
diluted earnings per share |
$ | (0.23) | $ | 0.27 | $ | 0.00 | $ | (0.01) | |||||||||||||||||||||||||||||||||||||||
65
Interest Rate Risk - Nelnet Bank
To manage Nelnet Bank's risk from fluctuations in market interest rates, the Company actively monitors interest rates and other interest sensitive components to minimize the impact that changes in interest rates have on the fair value of assets, net income, and cash flow. To achieve this objective, the Company manages and mitigates Nelnet Bank's exposure to fluctuations in market interest rates through several techniques, including managing the maturity, repricing, and mix of fixed and variable rate assets and liabilities.
The following table presents Nelnet Bank's loan assets and deposits by rate characteristics:
| As of September 30, 2022 | As of December 31, 2021 | ||||||||||||||||||||||
| Dollars | Percent | Dollars | Percent | ||||||||||||||||||||
| Fixed-rate loan assets | $ | 343,653 | 80.0 | % | $ | 191,410 | 74.2 | % | |||||||||||||||
| Variable-rate loan assets | 85,823 | 20.0 | 66,491 | 25.8 | |||||||||||||||||||
| Total | $ | 429,476 | 100.0 | % | $ | 257,901 | 100.0 | % | |||||||||||||||
| Fixed-rate deposits | $ | 372,015 | 49.5 | % | $ | 344,315 | 80.9 | % | |||||||||||||||
| Variable-rate deposits | 379,355 | 50.5 | 81,085 | 19.1 | |||||||||||||||||||
| Total | $ | 751,370 | 100.0 | % | $ | 425,400 | 100.0 | % | |||||||||||||||
ITEM 4. CONTROLS AND PROCEDURES
Disclosure Controls and Procedures
The Company’s management, with the participation of the Company's principal executive and principal financial officers, evaluated the effectiveness of the Company’s disclosure controls and procedures (as defined in Rules 13a-15(e) and 15d-15(e) under the Securities Exchange Act of 1934) as of September 30, 2022. Based on this evaluation, the Company’s principal executive and principal financial officers concluded that the Company's disclosure controls and procedures were effective as of September 30, 2022.
Changes in Internal Control over Financial Reporting
There were no changes in the Company’s internal control over financial reporting during the fiscal quarter ended September 30, 2022 that have materially affected, or are reasonably likely to materially affect, the Company’s internal control over financial reporting.
PART II. OTHER INFORMATION
ITEM 1. LEGAL PROCEEDINGS
There have been no material changes from the information referred to in the Legal Proceedings section of the Company's Annual Report on Form 10-K for the year ended December 31, 2021 under Item 3 of Part I of such Form 10-K.
ITEM 1A. RISK FACTORS
The following risk factors provide supplements and updates to the risk factors described in the Company's Annual Report on Form 10-K for the year ended December 31, 2021 in response to Item 1A of Part I of such Form 10-K and the Company's Quarterly Reports on Form 10-Q for the quarters ended March 31, 2022 and June 30, 2022 in response to Item 1A of Part II of such Form 10-Qs, in order to provide information regarding (i) the Company's servicing volume and loan portfolio prepayment risks associated with recent announcements and guidance by the Department and FSA related to broad based, income-driven, and other repayment forgiveness or discharge of student loans; and (ii) a recent cybersecurity incident.
Our largest fee-based customer, the Department of Education, represented 29 percent of our revenue in 2021. Failure to extend the Department contracts or obtain new Department contracts in the Department's current or other procurement processes, our inability to consistently surpass competitor performance metrics, unfavorable contract modifications or interpretations, or the loss of servicing borrower volume due to broad based debt cancellation by the Department, could significantly lower servicing revenue and hinder future service opportunities.
Our subsidiaries Nelnet Servicing, LLC ("Nelnet Servicing") and Great Lakes Educational Loan Services, Inc. ("Great Lakes") are two of the current seven private sector entities that have student loan servicing contracts with the Department to service loans that include Federal Direct Loan Program loans originated directly by the Department and FFEL Program loans purchased by the Department. As of September 30, 2022, Nelnet Servicing and Great Lakes were servicing $545.5 billion of
66
government owned student loans for 15.7 million borrowers. For the year ended December 31, 2021, we recognized $360.8 million in revenue from the Department under these contracts, which represented 29 percent of our revenue, and for the nine months ended September 30, 2022, we recognized $312.4 million in revenue under these contracts.
Nelnet Servicing's and Great Lakes' student loan servicing contracts with the Department are scheduled to expire on December 14, 2023. In 2017, the Department initiated a contract procurement process referred to as the Next Generation Financial Services Environment for a new framework for the servicing of all student loans owned by the Department. The Consolidated Appropriations Act, 2021 contains provisions directing certain aspects of the process, including that any new federal student loan servicing environment is required to provide for the participation of multiple student loan servicers and the allocation of borrower accounts to eligible student loan servicers based on performance. In the second quarter of 2022, the Department released a solicitation entitled Unified Servicing and Data Solution ("USDS") for the new servicing framework. We responded to the USDS solicitation.
In the event that our servicing contracts are not extended beyond the current expiration date, or we are not chosen as a subsequent servicer, loan servicing revenue would decrease significantly. There are significant risks to us and uncertainties regarding the current Department contracts and potential future Department contracts, including the pending and uncertain nature of the current contract procurement process and the Department's prior awards of new contracts to other service providers; risks that we may not be successful in obtaining any new contracts with the Department; and risks and uncertainties as to the terms and requirements under a potential new contract or contracts with the Department. We cannot predict the timing, nature, or ultimate outcome of the current or any other contract procurement process by the Department.
New loan volume is currently allocated among the Department servicers based on certain service level and portfolio performance metrics established by the Department and compared among all loan servicers. The amount of future allocations of new loan volume could be negatively impacted if we are unable to consistently surpass comparable competitor and/or other performance metrics.
In the event the current or any future Department servicing contracts become subject to unfavorable modifications or interpretations by the Department, loan servicing revenue could decrease significantly, performance penalties could be assessed, and/or operating costs to perform the contracts could increase significantly.
Additionally, we are partially dependent on the existing Department contracts to broaden servicing operations with the Department, other federal and state agencies, and commercial clients. The size and importance of these contracts provide us the scale and infrastructure needed to profitably expand into new business opportunities. Failure to extend the Department contracts beyond the current expiration date, or obtain new Department contracts, could significantly hinder future opportunities, as well as result in potential restructuring charges that may be necessary to re-align our cost structure with our servicing operations.
The Department's August 24, 2022 Bulletin announcing a broad based student debt relief plan indicates the Department will provide targeted student debt cancellation to borrowers with loans held by the Department, and that borrowers whose annual income for either 2020 or 2021 was under $125,000 (for single or married, filing separately) or under $250,000 (for married couples, filing jointly or heads of household) will be eligible for otherwise unconditional loan cancellation in amounts of up to $20,000 for eligible borrowers who received a Pell Grant, or of up to $10,000 for eligible borrowers who did not receive a Pell Grant.
As noted above, as of September 30, 2022, we were servicing 15.7 million borrowers under our government servicing contracts. We cannot currently estimate how many borrowers meet the eligibility requirements and other terms and conditions for one-time debt relief under the Department's announcement. If there was a broad $10,000 or $20,000 per borrower forgiveness on all government owned loans, we estimate it would decrease the number of borrowers serviced by us (based on the borrower loan information as of September 30, 2022) by approximately 4.4 million borrowers and 7.5 million borrowers, respectively. The actual impact to the number of borrowers serviced is expected to be less than these amounts due to annual income ceilings for borrowers to qualify for forgiveness and the impact of whether a Pell Grant was received on the amount of forgiveness for a borrower.
On October 21, 2022, the U.S. Court of Appeals for the Eighth Circuit issued a temporary administrative stay of implementation of the Department's student debt relief plan in response to a legal challenge that was initiated by other parties (not us). Revenue earned by us under the current Department servicing contracts, and software services revenue earned by us in providing remote hosted services to other government servicers, will decrease in future periods if the Department's student debt relief program or other broad based loan forgiveness is implemented.
67
Our loan portfolio is subject to prepayment risk, which could reduce the expected cash flows and earnings on our portfolio.
Higher rates of prepayments of student loans, including consolidations by the Department through the Federal Direct Loan Program or private refinancing programs, would reduce our interest income.
Pursuant to the Higher Education Act, borrowers may prepay loans made under the FFEL Program at any time without penalty. Prepayments may result from consolidations of student loans by the Department through the Federal Direct Loan Program or by a lending institution through a private education or unsecured consumer loan, which historically tend to occur more frequently in low interest rate environments; from borrower defaults on federally insured loans, which will result in the receipt of a guaranty payment; and from voluntary full or partial prepayments; among other things.
Legislative and executive action risk exists as Congress and the President evaluate economic stimulus packages and proposals to reauthorize the Higher Education Act. If the federal government and the Department initiate additional loan forgiveness or cancellation, other repayment options or plans, consolidation loan programs, or further extend the suspension of borrower payments under the CARES Act, such initiatives could further increase prepayments and reduce interest income. Future laws, regulations, executive actions, or other policy statements may encourage or force consolidation, create additional income-based repayment or debt forgiveness programs, create broad debt cancellation programs, or establish other policies and programs that impact prepayments on education loans. Even if a broad debt cancellation program only applied to student loans held by the Department, such program could result in a significant increase in consolidations of FFELP loans to Federal Direct Loan Program loans and a corresponding increase in prepayments with respect to our FFELP loan portfolio.
For example, in October 2021, the Department announced a set of policy changes and released proposed negotiated rulemaking materials relating to the Public Service Loan Forgiveness program under its Federal Direct Loan Program, which we believe resulted in an increase in consolidations of FFELP loans into Federal Direct Loan Program loans held by the Department (which results in the loans no longer being on our balance sheet). In addition, on April 19, 2022, the Department issued a press release, and FSA posted a related public announcement, which together announced, among other things, several adjustments, updates, and other changes under income-driven repayment (“IDR”) plans for federal student loans. In the April 2022 announcements, the Department and FSA indicated that as part of these changes, any borrower with loans that have accumulated time in repayment, including time in certain forbearances and deferments, of at least 20 or 25 years will see automatic forgiveness, even if the borrower is not currently in an IDR plan, and that if a borrower has a commercially held FFEL Program loan, the borrower can only benefit from these changes if they consolidate their FFEL Program loan to a Federal Direct Loan Program loan. Further, on July 6, 2022, the Department announced the issuance of proposed regulations that would expand major student loan discharge programs under the Higher Education Act through changes related to borrower defense to repayment where there is a dispute with the higher education institution, the Public Service Loan Forgiveness program, the interest capitalization rules, and closed school discharges, as well as other matters. These changes and proposals were reflected in executive actions announced by the Department on October 25, 2022 and final regulations announced by the Department on October 31, 2022. The final regulations are to become effective on July 1, 2023, and the fact sheet accompanying the October 25, 2022 announcement indicates that if a borrower has a commercially held FFEL Program loan, the borrower must apply for consolidation to a Federal Direct Loan Program loan by May 1, 2023 to receive the IDR plan and other benefits set forth in the announcement. The fact sheet further indicated that the Department will begin forgiving loans in November 2022 for borrowers with Federal Direct Loan Program loans or FFEL Program loans held by the Department that have reached the required 20 or 25 years of payments for forgiveness under IDR plans, which may also have the effect of significantly decreasing the borrower volume under our Department servicing contracts (see the risk factor immediately above).
In addition, the Department's August 24, 2022 Bulletin announced a broad based student debt relief plan for borrowers with loans held by the Department. Following the initial announcement, the Department provided more specific publicly available guidance through the FSA website on September 29, 2022, which guidance was subsequently revised and published in the Federal Register on October 12, 2022. As of November 7, 2022, the following guidance on loan forgiveness was provided on the FSA website (information on the FSA website is not incorporated by reference in this report):
•
All loans eligible for the CARES Act student loan payment pause are also eligible for debt relief, including loans held by the Department and guaranty agencies
•
As of September 29, 2022, borrowers with federal student loans not held by the Department cannot obtain one-time debt relief by consolidating those loans into Federal Direct Loan Program loans by the Department
•
Borrowers with FFEL Program loans not held by the Department and who applied to consolidate into the Federal Direct Loan Program prior to September 29, 2022, are eligible for one-time debt relief through the Federal Direct Loan Program, subject to meeting the other terms and conditions
•
The Department has indicated it is assessing whether there are alternative pathways to provide relief to borrowers with federal student loans not held by the Department, including FFEL Program loans
68
In view of this recent announcement and guidance by the Department, we do not currently expect there to be significant FFELP loan consolidation activity specifically as a result of the one-time student debt relief plan announced in the August 24, 2022 Bulletin. However, as outlined above, the Department continues to assess whether there are alternative pathways to provide relief to borrowers with student loans not held by the Department, including FFEL Program loans.
Since late 2021, we have experienced accelerated run-off of our FFELP portfolio due to FFELP borrowers consolidating their loans into Federal Direct Loan Program loans as a result of the continued extension of the CARES Act payment pause on Department held loans and the initiatives offered by the Department for FFELP borrowers to consolidate their loans to qualify for loan forgiveness under the Public Service Loan Forgiveness and other programs. We currently believe the recently announced policy changes, executive actions, guidance, and other changes by the Department, other than with respect to the broad based student debt relief plan under the August 24, 2022 Bulletin for borrowers with loans held by the Department, may continue to increase FFEL Program loan prepayments.
Sustained higher FFEL Program loan prepayments and/or a significant increase in FFEL Program loan prepayments could have a materially adverse impact in future periods on net interest income in our AGM operating segment, FFELP servicing revenue in our LSS operating segment, investment advisory services revenue earned by our SEC-registered investment advisor subsidiary (Whitetail Rock Capital Management, LLC) on FFELP loan asset-backed securities under management, and interest income earned on our FFELP loan asset-backed securities investments.
Some variability in prepayment levels is expected, although extraordinary or extended increases in prepayment rates could have a materially adverse effect on our revenues, cash flows, profitability, and business outlook, and, as a result, could materially, adversely affect our business, financial condition, and results of operations.
We cannot otherwise predict how or what programs or policies will be impacted by any actions that the Administration, Congress, or the federal government may take, the timing of when such programs or policies may be implemented, and/or the ultimate outcome thereof. In addition, any changes to government programs or policies may be legally challenged, which may impact the extent and timing these changes may have to the Company's business, financial condition, and results of operations.
A cybersecurity incident we recently experienced could result in negative impacts to our business.
In late July 2022, we determined the customer website portal for the primary loan servicing platform used by our remote hosted servicing clients had
experienced a cybersecurity incident. We took immediate and extensive steps to secure the system, block the unauthorized activity, address the issue via additional technical and security measures, notify our insurance carriers, and launch a forensic investigation. In August 2022 our investigation confirmed unauthorized access to confidential consumer information of federal student loan borrowers serviced on our platform by Edfinancial Services and Oklahoma Student Loan Authority. Borrower name, address, email address, phone number, and Social Security number information was impacted, but no financial account or payment information was impacted. Loans serviced directly by Nelnet were not impacted by the event. The applicable regulators and affected consumers were notified and identity theft monitoring has been and continues to be offered to those affected. This event could
result in liability or expense, decreased revenue, as well as risk and damage to our reputation. Any of these could have a material adverse effect on our business.
69
ITEM 2. UNREGISTERED SALES OF EQUITY SECURITIES AND USE OF PROCEEDS
Stock Repurchases
The following table summarizes the repurchases of Class A common stock during the third quarter of 2022 by the Company or any “affiliated purchaser” of the Company, as defined in Rule 10b-18(a)(3) under the Securities Exchange Act of 1934. Certain share repurchases included in the table below were made pursuant to a trading plan adopted by the Company in accordance with Rule 10b5-1 under the Securities Exchange Act of 1934.
| Period | Total number of shares purchased (a) | Average price paid per share | Total number of shares purchased as part of publicly announced plans or programs (b) | Maximum number of shares that may yet be purchased under the plans or programs (b) | ||||||||||||||||||||||
| July 1 - July 31, 2022 | 76,211 | $ | 85.79 | 76,211 | 4,607,626 | |||||||||||||||||||||
| August 1 - August 31, 2022 | 23,058 | 85.74 | 23,058 | 4,584,568 | ||||||||||||||||||||||
| September 1 - September 30, 2022 | 70,591 | 81.84 | 66,632 | 4,517,936 | ||||||||||||||||||||||
| Total | 169,860 | $ | 84.14 | 165,901 | ||||||||||||||||||||||
(a) The total number of shares includes: (i) shares repurchased pursuant to the stock repurchase program discussed in footnote (b) below; and (ii) shares owned and tendered by employees to satisfy tax withholding obligations upon the vesting of restricted shares. Shares of Class A common stock tendered by employees to satisfy tax withholding obligations included 3,959 shares in September 2022. Unless otherwise indicated, shares owned and tendered by employees to satisfy tax withholding obligations were purchased at the closing price of the Company's shares on the date of vesting.
(b) On May 9, 2022, the Company announced that its Board of Directors authorized a stock repurchase program to repurchase up to a total of five million shares of the Company's Class A common stock during the three-year period ending May 8, 2025.
Working capital and dividend restrictions/limitations
The Company's $495.0 million unsecured line of credit, which is available through September 22, 2026, imposes restrictions on the payment of dividends through covenants requiring a minimum consolidated net worth and a minimum level of unencumbered cash, cash equivalent investments, and available borrowing capacity under the line of credit. In addition, trust indentures and other financing agreements governing debt issued by the Company's lending subsidiaries generally have limitations on the amounts of funds that can be transferred to the Company by its subsidiaries through cash dividends at certain times. Further, Nelnet Bank is subject to laws and regulations that restrict the ability of Nelnet Bank to pay dividends to the Company, and authorize regulatory authorities to prohibit or limit the payment of dividends by Nelnet Bank to the Company. These provisions do not currently materially limit the Company's ability to pay dividends, and, based on the Company's current financial condition and recent results of operations, the Company does not currently anticipate that these provisions will materially limit the future payment of dividends.
ITEM 6. EXHIBITS
| 31.1* | |||||
| 31.2* | |||||
| 32** | |||||
| 101.INS* | Inline XBRL Instance Document - the instance document does not appear in the Interactive Data File because its XBRL tags are embedded within the Inline XBRL document. | ||||
| 101.SCH* | Inline XBRL Taxonomy Extension Schema Document. | ||||
| 101.CAL* | Inline XBRL Taxonomy Extension Calculation Linkbase Document. | ||||
| 101.DEF* | Inline XBRL Taxonomy Extension Definition Linkbase Document. | ||||
| 101.LAB* | Inline XBRL Taxonomy Extension Label Linkbase Document. | ||||
| 101.PRE* | Inline XBRL Taxonomy Extension Presentation Linkbase Document. | ||||
| 104* | Cover Page Interactive Data File (formatted as Inline XBRL and contained in Exhibit 101). | ||||
| * | Filed herewith | ||||
| ** | Furnished herewith | ||||
70
SIGNATURES
Pursuant to the requirements of the Securities Exchange Act of 1934, the registrant has duly caused this report to be signed on its behalf by the undersigned thereunto duly authorized.
| NELNET, INC. | ||||||||||||||
| Date: | November 7, 2022 | By: | /s/ JEFFREY R. NOORDHOEK | |||||||||||
| Name: | Jeffrey R. Noordhoek | |||||||||||||
| Title: |
Chief Executive Officer
Principal Executive Officer
|
|||||||||||||
| Date: | November 7, 2022 | By: | /s/ JAMES D. KRUGER | |||||||||||
| Name: | James D. Kruger | |||||||||||||
| Title: |
Chief Financial Officer
Principal Financial Officer and Principal Accounting Officer
|
|||||||||||||
71
TABLE OF CONTENTS
Part I. Financial InformationItem 1. Financial StatementsItem 2. Management S Discussion and Analysis Of Financial Condition and Results Of OperationsItem 3. Quantitative and Qualitative Disclosures About Market RiskItem 4. Controls and ProceduresPart II. Other InformationItem 1. Legal ProceedingsItem 1A. Risk FactorsItem 2. Unregistered Sales Of Equity Securities and Use Of ProceedsItem 6. Exhibits