NATIONAL RETAIL PROPERTIES, INC.
10-Ks and 10-Qs
|
|
|
|
|
|
|
|
|
|
|
|
|
|
|
|
|
|
|
|
|
|
|
|
|
|
|
|
|
|
|
|
|
|
|
|
|
|
|
|
|
|
|
|
|
|
|
|
|
|
|
|
|
|
|
|
UNITED STATES
SECURITIES AND EXCHANGE COMMISSION
Washington, D. C. 20549
FORM 10-K
(Mark One)
x
ANNUAL REPORT PURSUANT TO SECTION 13 OR 15 (d) OF THE SECURITIES EXCHANGE ACT OF 1934.
For the fiscal year ended
December 31, 2014
OR
¨
TRANSITION REPORT PURSUANT TO SECTION 13 OR 15 (d) OF THE SECURITIES EXCHANGE ACT OF 1934.
For the transition period from to .
Commission file number 001-11290
NATIONAL RETAIL PROPERTIES, INC.
(Exact name of registrant as specified in its charter)
|
Maryland
(State or other jurisdiction of
incorporation or organization)
|
56-1431377
(I.R.S. Employer Identification No.)
|
450 South Orange Avenue, Suite 900
Orlando, Florida 32801
(Address of principal executive offices, including zip code)
Registrant’s telephone number, including area code: (407) 265-7348
Securities registered pursuant to Section 12(b) of the Act:
|
Title of each class:
Common Stock, $0.01 par value
6.625% Series D Preferred Stock, $0.01 par value
5.700% Series E Preferred Stock, $0.01 par value
|
Name of exchange on which registered:
New York Stock Exchange
New York Stock Exchange
New York Stock Exchange
|
Securities registered pursuant to section 12(g) of the Act:
None
(Title of class)
Indicate by check mark if the registrant is a well-known seasoned issuer, as defined in Rule 405 of the Securities Act. Yes
x
No
¨
Indicate by check mark if the registrant is not required to file reports pursuant to Section 13 or Section 15(d) of the Act Yes
¨
No
x
Indicate by check mark whether the registrant (1) has filed all reports required to be filed by Section 13 or 15(d) of the Securities Exchange Act of 1934 during the preceding 12 months (or such shorter period that the registrant was required to file such reports), and (2) has been subject to such filing requirements for the past 90 days. Yes
x
No
¨
Indicate by check mark whether the registrant has submitted electronically and posted on its corporate website, if any, every Interactive Data File required to be submitted and posted pursuant to Rule 405 of Regulation S-T (§ 232.405 of this chapter) during the preceding 12 months (or for such shorter period that the registrant was required to submit and post such files). Yes
x
No
¨
Indicate by check mark if disclosure of delinquent filers pursuant to Item 405 of Regulation S-K is not contained herein, and will not be contained, to the best of registrant’s knowledge, in definitive proxy or information statements incorporated by reference in Part III of this Form 10-K or any amendment to this Form 10-K.
x
Indicate by check mark whether the registrant is a large accelerated filer, an accelerated filer, a non-accelerated filer or a smaller reporting company. See definition of “large accelerated filer,” “accelerated filer” and “smaller reporting company” in Rule 12b-2 of the Exchange Act. (Check one):
|
Large accelerated filer
x
|
|
Accelerated filer
¨
|
|
Non-accelerated filer
¨
|
|
Smaller reporting company
¨
|
Indicate by check mark whether the registrant is a shell company (as defined in Rule 12b-2 of the Act). Yes
¨
No
x
The aggregate market value of voting common stock held by non-affiliates of the registrant as of June 30,
2014
was $4,578,105,000.
The number of shares of common stock outstanding as of February 12, 2015 was 132,216,969.
DOCUMENTS INCORPORATED BY REFERENCE:
Registrant incorporates by reference into Part III (Items 10, 11, 12, 13 and 14) of this Annual Report on Form 10-K portions of National Retail Properties, Inc.’s definitive Proxy Statement for the 2015 Annual Meeting of Stockholders to be filed with the Securities and Exchange Commission (the “Commission”) pursuant to Regulation 14A. The definitive Proxy Statement will be filed with the Commission not later than 120 days after the end of the fiscal year covered by this Annual Report on Form 10-K.
TABLE OF CONTENTS
|
|
|
PAGE
REFERENCE
|
|
Part I
|
||
|
Item 1.
|
||
|
Item 1A.
|
||
|
Item 1B.
|
||
|
Item 2.
|
||
|
Item 3.
|
||
|
Item 4.
|
||
|
Part II
|
||
|
Item 5.
|
||
|
Item 6.
|
||
|
Item 7.
|
||
|
Item 7A.
|
||
|
Item 8.
|
||
|
Item 9.
|
||
|
Item 9A.
|
||
|
Item 9B.
|
||
|
Part III
|
||
|
Item 10.
|
||
|
Item 11.
|
||
|
Item 12.
|
||
|
Item 13.
|
||
|
Item 14.
|
||
|
Part IV
|
||
|
Item 15.
|
||
Unless the context otherwise requires, references in this Annual Report on Form 10-K to the terms “registrant” or “NNN” or the “Company” refer to National Retail Properties, Inc. and all of its consolidated subsidiaries. NNN has elected to treat certain subsidiaries as taxable real estate investment trust subsidiaries. These subsidiaries and their majority owned and controlled subsidiaries are collectively referred to as the “TRS.”
Statements contained in this annual report on Form 10-K, including the documents that are incorporated by reference, that are not historical facts are forward-looking statements within the meaning of Section 27A of the Securities Act of 1933 and Section 21E of the Securities Exchange Act of 1934 (the “Exchange Act”). Also, when NNN uses any of the words “anticipate,” “assume,” “believe,” “estimate,” “expect,” “intend,” or similar expressions, NNN is making forward-looking statements. Although management believes that the expectations reflected in such forward-looking statements are based upon present expectations and reasonable assumptions, NNN’s actual results could differ materially from those set forth in the forward-looking statements. Certain factors that could cause actual results or events to differ materially from those NNN anticipates or projects are described in “Item 1A. Risk Factors” of this Annual Report on Form 10-K.
Given these uncertainties, readers are cautioned not to place undue reliance on such statements, which speak only as of the date of this Annual Report on Form 10-K or any document incorporated herein by reference. NNN undertakes no obligation to publicly release any revisions to these forward-looking statements that may be made to reflect events or circumstances after the date of this Annual Report on Form 10-K.
|
Item 1.
|
Business
|
The Company
NNN, a Maryland corporation, is a fully integrated real estate investment trust (“REIT”) formed in 1984. NNN's assets include: real estate assets, mortgages and notes receivable, and commercial mortgage residual interests.
Real Estate Assets
NNN acquires, owns, invests in and develops properties that are leased primarily to retail tenants under long-term net leases and are primarily held for investment (“Properties” or “Property Portfolio,” and each individually, a "Property"). As of
December 31, 2014
, NNN owned
2,054
Properties with an aggregate gross leasable area of approximately
22,479,000
square feet, located in
47
states, with a weighted average remaining lease term of 12 years. Approximately
99
percent of the Properties were leased as of
December 31, 2014
.
Competition
NNN generally competes with numerous other REITs, commercial developers, real estate limited partnerships and other investors including but not limited to insurance companies, pension funds and financial institutions that own, manage, finance or develop retail and net leased properties.
Employees
As of January 30, 2015
, NNN employed
64
associates.
Other Information
NNN’s executive offices are located at 450 S. Orange Avenue, Suite 900, Orlando, Florida 32801, and its telephone number is (407) 265-7348. NNN has a website at
www.nnnreit.com
where NNN’s filings with the Securities and Exchange Commission (the “Commission”) can be downloaded free of charge.
The common shares of National Retail Properties, Inc. are traded on the New York Stock Exchange (the “NYSE”) under the ticker symbol “NNN.” The depositary shares, each representing a 1/100
th
of a share of 6.625% Series D Cumulative Redeemable Preferred Stock, par value $0.01 per share (“Series D Preferred Stock”), of NNN are traded on the NYSE under the ticker symbol “NNNPRD.” The depositary shares, each representing a 1/100
th
of a share of 5.700% Series E Cumulative Redeemable Preferred Stock, par value $0.01 per share (“Series E Preferred Stock”), of NNN are traded on the NYSE under the ticker symbol “NNNPRE.”
1
Business Strategies and Policies
The following is a discussion of NNN’s operating strategy and certain of its investment, financing and other policies. These strategies and policies have been set by management and the Board of Directors and, in general, may be amended or revised from time to time by management and the Board of Directors without a vote of NNN’s stockholders.
Operating Strategies
NNN’s strategy is to invest primarily in retail real estate that is typically well located within each local market for its tenants’ retail lines of trade. Management believes that these types of properties, generally leased pursuant to triple-net leases, provide attractive opportunities for a stable current return and the potential for increased returns and capital appreciation. Triple-net leases typically require the tenant to pay property operating expenses such as insurance, utilities, repairs, maintenance, capital expenditures and real estate taxes and assessments. Initial lease terms are generally 15 to 20 years.
NNN holds real estate assets until it determines that the sale of such an asset is advantageous in view of NNN’s investment objectives. In deciding whether to sell a real estate asset, NNN may consider factors such as potential capital appreciation, net cash flow, tenant credit quality, tenant's line of trade, market lease rates, local market conditions, potential use of sale proceeds and federal income tax considerations.
NNN’s management team focuses on certain key indicators to evaluate the financial condition and operating performance of NNN. These key indicators include the composition of the Property Portfolio (such as tenant, geographic and line of trade diversification), the occupancy rate of the Property Portfolio, certain financial performance ratios and profitability measures, industry trends and NNN's performance compared to that of the REIT industry.
The operating strategies employed by NNN have allowed NNN to increase the annual dividend (paid quarterly) per common share for
25
consecutive years, one of only four publicly traded REIT's to do so.
Investment in Real Estate or Interests in Real Estate
NNN’s management believes that single tenant, freestanding net lease retail properties will continue to provide attractive investment opportunities and that NNN is well suited to take advantage of these opportunities because of its experience in accessing capital markets, and its ability to source, underwrite and acquire properties.
In evaluating a particular acquisition, management may consider a variety of factors, including:
|
•
|
the location, visibility and accessibility of the property,
|
|
•
|
the geographic area and demographic characteristics of the community, as well as the local real estate market, including potential for growth, market rents, and existing or potential competing properties or retailers,
|
|
•
|
the size, age and title status of the property,
|
|
•
|
the purchase price,
|
|
•
|
the non-financial terms of the proposed acquisition,
|
|
•
|
the availability of funds or other consideration for the proposed acquisition and the cost thereof,
|
|
•
|
the compatibility of the property with NNN’s existing portfolio,
|
|
•
|
the quality of construction and design and the current physical condition of the property,
|
|
•
|
the property-level operating history,
|
|
•
|
the financial and other characteristics of the existing tenant,
|
|
•
|
the tenant’s business plan, operating history and management team,
|
|
•
|
the tenant’s industry,
|
|
•
|
the terms of any existing leases,
|
|
•
|
the rent to be paid by the tenant,
|
|
•
|
the potential for, and current extent of, any environmental problems, and
|
|
•
|
any existing indebtedness encumbering the property which may be assumed or incurred in connection with acquiring or refinancing these investments.
|
NNN intends to engage in future investment activities in a manner that is consistent with the maintenance of its status as a REIT for federal income tax purposes. Additionally, NNN does not intend to engage in activities that will make NNN an investment company under the Investment Company Act of 1940, as amended.
2
Investments in Real Estate Mortgages, Commercial Mortgage Residual Interests, and Securities of or Interests in Persons Engaged in Real Estate Activities
While NNN’s primary business objectives emphasize retail properties, NNN may invest in (i) a wide variety of property and tenant types, (ii) leases, mortgages, commercial mortgage residual interests and other types of real estate interests, (iii) loans secured by personal property, (iv) loans secured by partnerships or membership interests in partnerships or limited liability companies, respectively, or (v) securities of other REITs, or other issuers, including for the purpose of exercising control over such entities.
Financing Strategy
NNN’s financing objective is to manage its capital structure effectively in order to provide sufficient capital to execute its operating strategies while servicing its debt requirements and providing value to its stockholders. NNN generally utilizes debt and equity security offerings, bank borrowings, the sale of properties, and to a lesser extent, internally generated funds to meet its capital needs.
NNN typically funds its short-term liquidity requirements including investments in additional retail properties with cash from its
$650,000,000
unsecured revolving credit facility (“Credit Facility”). As of
December 31, 2014
, there was
no
outstanding balance and
$650,000,000
was available for future borrowings under the Credit Facility.
As of
December 31, 2014
, NNN’s ratio of total debt to total gross assets (before accumulated depreciation and amortization) was approximately
33
percent and the ratio of secured indebtedness to total gross assets was less than
one
-percent. The ratio of total debt to total market capitalization was approximately
24
percent. Certain financial agreements contain covenants that limit NNN’s ability to incur debt under certain circumstances.
NNN anticipates it will be able to obtain additional financing for short-term and long-term liquidity requirements as further described in “Item 7. Management’s Discussion and Analysis of Financial Condition and Results of Operations – Liquidity.” However, there can be no assurance that additional financing or capital will be available, or that the terms will be acceptable or advantageous to NNN.
The organizational documents of NNN do not limit the absolute amount or percentage of indebtedness that NNN may incur. Additionally, NNN may change its financing strategy at any time.
Strategies and Policy Changes
Any of NNN’s strategies or policies described above may be changed at any time by NNN without notice to or a vote of NNN’s stockholders.
Property Portfolio
As of
December 31, 2014
, NNN owned
2,054
Properties with an aggregate gross leasable area of approximately
22,479,000
square feet, located in
47
states, with a weighted average remaining lease term of
12
years. Approximately
99
percent of total Properties were leased as of
December 31, 2014
.
The following table summarizes the Property Portfolio as of
December 31, 2014
(in thousands):
|
|
Size
(1)
|
Acquisition Cost
(2)
|
|||||||||||||||||
|
High
|
Low
|
Average
|
High
|
Low
|
Average
|
||||||||||||||
|
Land
|
2,223
|
|
2
|
98
|
|
$
|
8,882
|
|
$
|
5
|
|
$
|
894
|
|
|||||
|
Building
|
142
|
|
1
|
11
|
|
29,373
|
|
19
|
|
1,717
|
|
||||||||
|
(1)
|
Approximate square feet.
|
|
(2)
|
Costs vary depending upon size, local market conditions and other factors.
|
3
As of
December 31, 2014
, NNN has agreed to fund construction commitments on leased Properties. The improvements are estimated to be completed within 12 months. These construction commitments are outlined in the table below (dollars in thousands):
|
Number of properties
|
26
|
|
||
|
Total commitment
(1)
|
$
|
110,081
|
|
|
|
Amount funded
|
$
|
57,465
|
|
|
|
Remaining commitment
|
$
|
52,616
|
|
|
|
(1)
|
Includes land, construction costs, tenant improvements and lease costs.
|
Leases
The following is a summary of the general structure of the leases in the Property Portfolio, although the specific terms of each lease can vary. Generally, the Property leases provide for initial terms of 15 to 20 years. As of
December 31, 2014
, the weighted average remaining lease term of the Property Portfolio was approximately
12
years. The Properties are generally leased under net leases, pursuant to which the tenant typically bears responsibility for substantially all property costs and expenses associated with ongoing maintenance and operation, including utilities, property taxes and insurance. NNN's leases provide for annual base rental payments (payable in monthly installments) ranging from $1,000 to $2,656,000 (average of $211,000), and generally provide for limited increases in rent as a result of fixed increases, increases in the Consumer Price Index (“CPI”), and/or, to a lesser extent, increases in the tenant’s sales volume.
Generally, NNN's leases provide the tenant with one or more multi-year renewal options subject to generally the same terms and conditions provided under the initial lease term. Some of the leases also provide that in the event NNN wishes to sell the Property subject to that lease, NNN first must offer the lessee the right to purchase the Property on the same terms and conditions as any offer which NNN intends to accept for the sale of the Property.
The following table summarizes the lease expirations, assuming none of the tenants exercise renewal options, of the Property Portfolio for each of the next 10 years and then thereafter in the aggregate as of
December 31, 2014
:
|
% of
Annual
Base
Rent
(1)
|
# of
Properties
|
Gross
Leasable
Area
(2)
|
% of
Annual
Base
Rent
(1)
|
# of
Properties
|
Gross
Leasable
Area
(2)
|
||||||||||
|
2015
|
1.2%
|
30
|
384,000
|
|
2021
|
4.4%
|
102
|
1,005,000
|
|
||||||
|
2016
|
1.5%
|
31
|
558,000
|
|
2022
|
6.4%
|
95
|
1,171,000
|
|
||||||
|
2017
|
3.2%
|
49
|
1,074,000
|
|
2023
|
3.0%
|
55
|
946,000
|
|
||||||
|
2018
|
6.9%
|
182
|
1,643,000
|
|
2024
|
2.9%
|
50
|
771,000
|
|
||||||
|
2019
|
3.4%
|
74
|
1,030,000
|
|
Thereafter
|
63.2%
|
1,236
|
11,950,000
|
|
||||||
|
2020
|
3.9%
|
112
|
1,406,000
|
|
|||||||||||
|
(1)
|
Based on annualized base rent for all leases in place as of
December 31, 2014
.
|
|
(2)
|
Approximate square feet.
|
4
The following table summarizes the diversification of the Property Portfolio based on the top 10 lines of trade:
|
|
|
% of Annual Base Rent
(1)
|
||||||
|
|
Top 10 Lines of Trade
|
2014
|
2013
|
2012
|
||||
|
1.
|
Convenience stores
|
18.0%
|
19.7%
|
19.8%
|
||||
|
2.
|
Restaurants - full service
|
9.1%
|
9.7%
|
10.7%
|
||||
|
3.
|
Automotive service
|
7.2%
|
7.6%
|
7.6%
|
||||
|
4.
|
Restaurants - limited service
|
6.5%
|
5.5%
|
5.2%
|
||||
|
5.
|
Theaters
|
5.2%
|
4.5%
|
4.7%
|
||||
|
6.
|
Family entertainment centers
|
5.1%
|
2.3%
|
2.1%
|
||||
|
7.
|
Automotive parts
|
4.7%
|
5.1%
|
5.6%
|
||||
|
8.
|
Health and fitness
|
3.9%
|
4.3%
|
3.7%
|
||||
|
9.
|
Banks
|
3.7%
|
4.1%
|
0.2%
|
||||
|
10.
|
Sporting goods
|
3.5%
|
3.7%
|
4.0%
|
||||
|
Other
|
33.1%
|
33.5%
|
36.4%
|
|||||
|
100.0%
|
100.0%
|
100.0%
|
||||||
|
(1)
|
Based on annualized base rent for all leases in place as of December 31 of the respective year.
|
The following table summarizes the diversification of the Property Portfolio by state as of
December 31, 2014
:
|
State
|
# of
Properties
|
% of
Annual
Base Rent
(1)
|
||||
|
1.
|
Texas
|
419
|
20.4%
|
|||
|
2.
|
Florida
|
168
|
9.7%
|
|||
|
3.
|
North Carolina
|
130
|
5.5%
|
|||
|
4.
|
Illinois
|
71
|
5.0%
|
|||
|
5.
|
Georgia
|
109
|
4.9%
|
|||
|
6.
|
Virginia
|
87
|
4.2%
|
|||
|
7.
|
Indiana
|
84
|
4.0%
|
|||
|
8.
|
Ohio
|
60
|
3.3%
|
|||
|
9.
|
Pennsylvania
|
99
|
3.3%
|
|||
|
10.
|
California
|
40
|
3.1%
|
|||
|
Other
|
787
|
36.6%
|
||||
|
2,054
|
100.0%
|
|||||
|
(1)
|
Based on annualized base rent for all leases in place as of
December 31, 2014
.
|
As of
December 31, 2014
, NNN did not have any tenant that accounted for ten percent or more of its rental income.
Mortgages and Notes Receivable
Mortgages and notes receivable consisted of the following at December 31 (dollars in thousands):
|
2014
|
2013
|
||||||
|
Mortgages and notes receivable
|
$
|
10,974
|
|
$
|
16,942
|
|
|
|
Accrued interest receivable
|
101
|
|
177
|
|
|||
|
$
|
11,075
|
|
$
|
17,119
|
|
||
5
Commercial Mortgage Residual Interests
NNN holds the commercial mortgage residual interests (“Residuals”) from seven securitizations. Each of the Residuals is reported at fair value; unrealized gains or losses are reported as other comprehensive income in stockholders’ equity, and other than temporary losses as a result of a change in timing or amount of estimated cash flows are recorded as an other than temporary valuation impairment. The Residuals had an estimated fair value of
$11,626,000
and
$11,721,000
at
December 31, 2014
and
2013
, respectively.
Governmental Regulations Affecting Properties
Property Environmental Considerations.
Subject to a determination of the level of risk and potential cost of remediation, NNN may acquire a property where some level of environmental contamination may exist. Investments in real property create a potential for substantial environmental liability for the owner of such property from the presence or discharge of hazardous materials on the property or the improper disposal of hazardous materials emanating from the property, regardless of fault. In order to mitigate exposure to environmental liability, NNN maintains an environmental insurance policy that covers substantially all of the properties which expires in August 2018. As a part of its acquisition due diligence process, NNN obtains an environmental site assessment for each property. In such cases where NNN intends to acquire real estate where some level of contamination may exist, NNN generally requires the seller or tenant to (i) remediate the problem, (ii) indemnify NNN for environmental liabilities, and/or (iii) agree to other arrangements deemed appropriate by NNN, including, under certain circumstances, the purchase of environmental insurance to address environmental conditions at the property.
As of
February 13, 2015
, NNN has
69
Properties currently under some level of environmental remediation and/or monitoring. In general, the seller, a previous owner, the tenant or an adjacent land owner is responsible for the cost of the environmental remediation for each of these Properties.
Americans with Disabilities Act of 1990.
The Properties, as commercial facilities, are required to comply with Title III of the Americans with Disabilities Act of 1990 and similar state and local laws and regulations (collectively, the “ADA”). Investigation of a property may reveal non-compliance with the ADA. The tenants will typically have primary responsibility for complying with the ADA, but NNN may incur costs if the tenant does not comply. As of
February 13, 2015
, NNN has not been notified by any governmental authority of, nor is NNN’s management aware of, any non-compliance with the ADA that NNN’s management believes would have a material adverse effect on its business, financial position or results of operations.
Other Regulations.
State and local fire, life-safety and similar entities regulate the use of the Properties. NNN’s leases generally require each tenant to undertake primary responsibility for complying with regulations, but failure to comply could result in fines by governmental authorities, awards of damages to private litigants, or restrictions on the ability to conduct business on such properties.
|
Item 1A.
|
Risk Factors
|
Carefully consider the following risks and all of the other information set forth in this Annual Report on Form 10-K, including the consolidated financial statements and the notes thereto. If any of the events or developments described below were actually to occur, NNN’s business, financial condition or results of operations could be adversely affected.
Financial and economic conditions may have an adverse impact on NNN, its tenants, and commercial real estate in general.
Financial and economic conditions continue to be challenging and volatile and any worsening of such conditions, including any disruption in the capital markets, could adversely affect NNN’s business and results of operations and the financial condition of NNN’s tenants, developers, borrowers, lenders or the institutions that hold NNN’s cash balances and short-term investments, which may expose NNN to increased risks of default by these parties.
There can be no assurance that actions of the United States Government, the Federal Reserve or other government and regulatory bodies intended to stabilize the economy or financial markets will achieve their intended effect. Additionally, some of these actions may adversely affect financial institutions, capital providers, retailers, consumers, NNN’s financial condition, NNN's results of operations or the trading price of NNN’s shares.
6
Potential consequences of challenging and volatile financial and economic conditions include:
|
•
|
the financial condition of NNN’s tenants may be adversely affected, which may result in tenant defaults under the leases due to bankruptcy, lack of liquidity, operational failures or for other reasons;
|
|
•
|
the ability to borrow on terms and conditions that NNN finds acceptable may be limited or unavailable, which could reduce NNN’s ability to pursue acquisition and development opportunities and refinance existing debt, reduce NNN’s returns from acquisition and development activities, reduce NNN’s ability to make cash distributions to its shareholders and increase NNN’s future interest expense;
|
|
•
|
the recognition of impairment charges on or reduced values of NNN’s Properties, which may adversely affect NNN's results of operations;
|
|
•
|
reduced values of the Properties may limit NNN's ability to dispose of assets at attractive prices and reduce the availability of buyer financing; and
|
|
•
|
the value and liquidity of NNN’s short-term investments and cash deposits could be reduced as a result of a deterioration of the financial condition of the institutions that hold NNN’s cash deposits or the institutions or assets in which NNN has made short-term investments, the dislocation of the markets for NNN’s short-term investments, increased volatility in market rates for such investments or other factors.
|
NNN may be unable to obtain debt or equity capital on favorable terms, if at all.
NNN may be unable to obtain capital on favorable terms, if at all, to further its business objectives or meet its existing obligations. Nearly all of NNN’s debt, including the Credit Facility, is subject to balloon principal payments due at maturity. These maturities range between 2015 and 2024. NNN's ability to make these scheduled principal payments may be adversely impacted by NNN’s inability to extend or refinance the Credit Facility, the inability to dispose of assets at an attractive price or the inability to obtain additional debt or equity capital. Capital that may be available may be materially more expensive or available under terms that are materially more restrictive which would have an adverse impact on NNN’s business, financial condition or results of operations.
Tenants loss of revenues could reduce NNN’s cash flow.
NNN's tenants encounter significant macroeconomic, governmental and competitive forces. Adverse changes in consumer spending or consumer preferences for particular goods, services or store based retailing or the expansion of e-commerce could severely impact their ability to pay rent. The default, financial distress, bankruptcy or liquidation of one or more of NNN’s tenants could cause substantial vacancies in the Property Portfolio. Vacancies reduce NNN’s revenues, increase property expenses and could decrease the value of each such vacant Property. Upon the expiration of a lease, the tenant may choose not to renew the lease and/or NNN may not be able to re-lease the vacant Property at a comparable lease rate or without incurring additional expenditures in connection with such renewal or re-leasing.
A significant portion of the source of the Property Portfolio annual base rent is concentrated in specific industry classifications, tenants and in specific geographic locations.
As of
December 31, 2014
, approximately,
|
•
|
46.0% of the Property Portfolio annual base rent is generated from five retail lines of trade, including convenience stores (18.0%) and full-service restaurants (9.1%),
|
|
•
|
22.8% of the Property Portfolio annual base rent is generated from five tenants, including Energy Transfer Partners (Sunoco) (6.5%), Mister Car Wash (4.6%), Pantry (4.0%), 7-Eleven (3.9%) and LA Fitness (3.8%), and
|
|
•
|
45.5% of the Property Portfolio annual base rent is generated from five states, including Texas (20.4%) and Florida (9.7%).
|
Any financial hardship and/or economic changes in these lines of trade, tenants or states could have an adverse effect on NNN’s results of operations.
7
Owning real estate and indirect interests in real estate carries inherent risks.
NNN’s economic performance and the value of its real estate assets are subject to the risk that if the Properties do not generate revenues sufficient to meet its operating expenses, including debt service, NNN’s cash flow and ability to pay distributions to its shareholders will be adversely affected. As a real estate company, NNN is susceptible to the following real estate industry risks, which are beyond its control:
|
•
|
changes in national, regional and local economic conditions and outlook,
|
|
•
|
decreases in consumer spending and retail sales or adverse changes in consumer preferences for particular goods, services or store based retailing,
|
|
•
|
economic downturns in the areas where the Properties are located,
|
|
•
|
adverse changes in local real estate market conditions, such as an oversupply of space, reduction in demand for space, intense competition for tenants, or a demographic change,
|
|
•
|
changes in tenant or consumer preferences that reduce the attractiveness of the Properties to tenants,
|
|
•
|
changes in zoning, regulatory restrictions, or tax laws, and
|
|
•
|
changes in interest rates or availability of financing.
|
All of these factors could result in decreases in market rental rates and increases in vacancy rates, which could adversely affect NNN’s results of operations.
NNN’s real estate investments are illiquid.
Because real estate investments are relatively illiquid, NNN’s ability to adjust the portfolio promptly in response to economic or other conditions is limited. Certain significant expenditures generally do not change in response to economic or other conditions, including: (i) debt service (if any), (ii) real estate taxes, and (iii) operating and maintenance costs. This combination of variable revenue and relatively fixed expenditures may result, under certain market conditions, in reduced earnings and could have an adverse effect on NNN’s financial condition.
Costs of complying with changes in governmental laws and regulations may adversely affect NNN’s results of operations.
NNN cannot predict what other laws or regulations will be enacted in the future, how future laws or regulations will be administered or interpreted, or how future laws or regulations will affect NNN or its Properties, including, but not limited to environmental laws and regulations. Compliance with new laws or regulations, or stricter interpretation of existing laws, may require NNN, its retail tenants, or consumers to incur significant expenditures, impose significant liability, restrict or prohibit business activities and could cause a material adverse effect on NNN’s results of operation.
NNN may be subject to known or unknown environmental liabilities and hazardous materials on Properties owned by NNN.
There may be known or unknown environmental liabilities associated with properties owned or acquired in the future by NNN. Certain particular uses of some properties may also have a heightened risk of environmental liability because of the hazardous materials used in performing services on those properties, such as convenience stores with underground petroleum storage tanks or auto parts and auto service businesses using petroleum products, paint and machine solvents. Some of the Properties may contain asbestos or asbestos-containing materials, or may contain or may develop mold or other bio-contaminants. Asbestos-containing materials must be handled, managed and removed in accordance with applicable governmental laws, rules and regulations. Mold and other bio-contaminants can produce airborne toxins, may cause a variety of health issues in individuals and must be remediated in accordance with applicable governmental laws, rules and regulations.
As part of its due diligence process, NNN generally obtains an environmental site assessment for each Property it acquires. In cases where NNN intends to acquire real estate where some level of contamination may exist, NNN generally requires the seller or tenant to (i) remediate the contamination in accordance with applicable laws, rules and regulations, (ii) indemnify NNN for environmental liabilities, and/or (iii) agree to other arrangements deemed appropriate by NNN, including, under certain circumstances, the purchase of environmental insurance. Although sellers or tenants may be contractually responsible for remediating hazardous materials on a property and may be responsible for indemnifying NNN for any liability resulting from the use of a property and for any failure to comply with any applicable environmental laws, rules or regulations, NNN has no assurance that sellers or tenants shall be able to meet their remediation and indemnity obligations to NNN. A tenant or seller may not have the financial ability to meet its remediation and indemnity obligations to NNN when required. Furthermore, NNN may have strict liability to governmental agencies or third parties as a result of the existence of hazardous materials on Properties, whether or not NNN knew about or caused such hazardous materials to exist.
8
As of
February 13, 2015
, NNN has
69
Properties currently under some level of environmental remediation and/or monitoring. In general, the seller, a previous owner, the tenant or an adjacent land owner is responsible for the cost of the environmental remediation for each of these Properties.
If NNN is responsible for hazardous materials located on its properties, NNN’s liability may include investigation and remediation costs, property damage to third parties, personal injury to third parties, and governmental fines and penalties. Furthermore, the presence of hazardous materials on a property may adversely impact the property value or NNN’s ability to sell the property. Significant environmental liability could impact NNN’s results of operations, ability to make distributions to shareholders, and its ability to meet its debt obligations.
In order to mitigate exposure to environmental liability, NNN maintains an environmental insurance policy that covers substantially all of its Properties which expires in August 2018. However, the policy is subject to exclusions and limitations and does not cover all of the Properties owned by NNN, and for those Properties covered under the policy, insurance may not fully compensate NNN for any environmental liability. NNN has no assurance that the insurer on its environmental insurance policy will be able to meet its obligations under the policy. NNN may not desire to renew the environmental insurance policy in place upon expiration or a replacement policy may not be available at a reasonable cost, if at all.
NNN may not be able to successfully execute its acquisition or development strategies.
NNN may not be able to implement its investment strategies successfully. Additionally, NNN cannot assure that its Property Portfolio will expand at all, or if it will expand at any specified rate or to any specified size. In addition, investment in additional real estate assets is subject to a number of risks. Because NNN expects to invest in markets other than the ones in which its current Properties are located or properties which may be leased to tenants other than those to which NNN has historically leased properties, NNN will also be subject to the risks associated with investment in new markets or with new tenants that may be relatively unfamiliar to NNN’s management team.
NNN’s development activities are subject to, without limitation, risks relating to the availability and timely receipt of zoning and other regulatory approvals, the cost and timely completion of construction (including risks from factors beyond NNN’s control, such as weather or labor conditions or material shortages), the risk of finding tenants for the properties and the ability to obtain both construction and permanent financing on favorable terms. These risks could result in substantial unanticipated delays or expenses and, under certain circumstances, could prevent completion of development activities once undertaken or provide a tenant the opportunity to reduce rent or terminate a lease. Any of these situations may delay or eliminate proceeds or cash flows NNN expects from these projects, which could have an adverse effect on NNN’s financial condition.
NNN may not be able to dispose of properties consistent with its operating strategy.
NNN may be unable to sell properties targeted for disposition due to adverse market conditions. This may adversely affect, among other things, NNN’s ability to sell under favorable terms, execute its operating strategy, achieve target earnings or returns, retire or repay debt or pay dividends.
A change in the assumptions used to determine the value of commercial mortgage residual interests could adversely affect NNN’s financial position.
As of
December 31, 2014
, the Residuals had a carrying value of
$11,626,000
. The value of these Residuals is based on assumptions to determine their fair value. These assumptions include, but are not limited to, discount rate, loan loss, prepayment speed and interest rate assumptions to determine their fair value. If actual experience differs materially from these assumptions, the actual future cash flow could be less than expected and the value of the Residuals, as well as NNN’s earnings, could decline.
NNN may suffer a loss in the event of a default or bankruptcy of a borrower.
As of
December 31, 2014
, mortgages and notes receivables had an outstanding principal balance of $10,974,000. If a borrower defaults on a mortgage or other loan made by NNN, and does not have sufficient assets to satisfy the loan, NNN may suffer a loss of principal and interest. In the event of the bankruptcy of a borrower, NNN may not be able to recover against all or any of the assets of the borrower, or the collateral may not be sufficient to satisfy the balance due on the loan. In addition, certain of NNN’s loans may be subordinate to other debt of a borrower. These investments are typically loans secured by a borrower’s pledge of its ownership interests in the entity that owns the real estate or other assets and are typically subordinated to senior loans encumbering the underlying real estate or assets. Subordinated positions are generally subject to a higher risk of nonpayment of principal and interest than the more senior loans. If a borrower defaults on the debt senior to NNN’s loan, or in the event of the bankruptcy of a borrower, NNN’s loan will be satisfied only after the borrower’s senior creditors’ claims are satisfied. Where debt senior to NNN’s loans exists, the presence of intercreditor arrangements may limit NNN’s ability to
9
amend loan documents, assign the loans, accept prepayments, exercise remedies and control decisions made in bankruptcy proceedings relating to borrowers. Bankruptcy proceedings and litigation can significantly increase the time needed for NNN to acquire underlying collateral, if any, in the event of a default, during which time the collateral may decline in value. In addition, there are significant costs and delays associated with the foreclosure process.
Certain provisions of NNN’s leases or loan agreements may be unenforceable.
NNN’s rights and obligations with respect to its leases, mortgage loans or other loans are governed by written agreements. A court could determine that one or more provisions of such an agreement are unenforceable, such as a particular remedy, a loan prepayment provision or a provision governing NNN’s security interest in the underlying collateral of a borrower or lessee. NNN could be adversely impacted if this were to happen with respect to an asset or group of assets.
Property ownership through joint ventures and partnerships could limit NNN’s control of those investments.
Joint ventures or partnerships involve risks not otherwise present for direct investments by NNN. It is possible that NNN’s co-venturers or partners may have different interests or goals than NNN at any time and they may take actions contrary to NNN’s requests, policies or objectives, including NNN’s policy with respect to maintaining its qualification as a REIT. Other risks of joint venture or partnership investments include impasses on decisions because in some instances no single co-venturer or partner has full control over the joint venture or partnership, respectively, or the co-venturer or partner may become insolvent, bankrupt or otherwise unable to contribute to the joint venture or partnership, respectively. Further, disputes may develop with a co-venturer or partner over decisions affecting the property, joint venture or partnership that may result in litigation, arbitration or some other form of dispute resolution.
Competition from numerous other REITs, commercial developers, real estate limited partnerships and other investors may impede NNN’s ability to grow.
NNN may not complete suitable property acquisitions or developments on advantageous terms, if at all, due to competition for such properties with others engaged in real estate investment activities or lack of properties for sale on terms deemed acceptable to NNN. NNN’s inability to successfully acquire or develop new properties may affect NNN’s ability to achieve anticipated return on investment or realize its investment strategy, which could have an adverse effect on its results of operations.
NNN's loss of key management personnel could adversely affect performance and the value of its common stock.
NNN is dependent on the efforts of its key management. Competition for senior management personnel can be intense and NNN may not be able to retain its key management. Although NNN believes qualified replacements could be found for any departures of key management, the loss of their services could adversely affect NNN's performance and the value of its common stock.
Uninsured losses may adversely affect NNN’s operating results and asset values.
The Properties are generally covered by comprehensive liability, fire, and extended insurance coverage. NNN believes that the insurance carried on its properties is adequate and in accordance with industry standards. There are, however, types of losses (such as from hurricanes, earthquakes or other types of natural disasters or wars or other acts of violence) which may be uninsurable, or the cost of insuring against these losses may not be economically justifiable. If an uninsured loss occurs or a loss exceeds policy limits, NNN could lose both its invested capital and anticipated revenues from the property, thereby reducing NNN’s cash flow and asset value.
10
Acts of violence, terrorist attacks or war may affect the markets in which NNN operates and NNN’s results of operations.
Terrorist attacks or other acts of violence may negatively affect NNN’s operations. There can be no assurance that there will not be terrorist attacks against businesses within the United States. These attacks may directly or indirectly impact NNN’s physical facilities or the businesses or the financial condition of its tenants, developers, borrowers, lenders or financial institutions with which NNN has a relationship. The United States is engaged in armed conflict, which could have an impact on these parties. The consequences of armed conflict are unpredictable, and NNN may not be able to foresee events that could have an adverse effect on its business or be insured for such.
More generally, any of these events or threats of these events could cause consumer confidence and spending to decrease or result in increased volatility in the United States and worldwide financial markets and economies. They also could result in, or cause a deepening of, economic recession in the United States or abroad. Any of these occurrences could have an adverse impact on NNN’s financial condition or results of operations.
Vacant properties or bankrupt tenants could adversely affect NNN’s business or financial condition.
As of
December 31, 2014
, NNN owned
29
vacant, un-leased Properties, which accounted for approximately
one
percent of total Properties. NNN is actively marketing these properties for sale or lease but may not be able to sell or lease these properties on favorable terms or at all. The lost revenues and increased property expenses resulting from the rejection by any bankrupt tenant of any of their respective leases with NNN could have a material adverse effect on the liquidity and results of operations of NNN if NNN is unable to re-lease the Properties at comparable rental rates and in a timely manner. As of
February 13, 2015
, less than
one
percent of the total gross leasable area of the Property Portfolio was leased to tenants that have filed a voluntary petition for bankruptcy under Chapter 11 of the U.S. Bankruptcy Code and have the right to reject or affirm their leases with NNN.
The amount of debt NNN has and the restrictions imposed by that debt could adversely affect NNN’s business and financial condition.
As of
December 31, 2014
, NNN had outstanding debt including mortgages payable of
$26,339,000
, total unsecured notes payable of
$1,714,715,000
and
zero
outstanding on the Credit Facility. NNN’s organizational documents do not limit the level or amount of debt that it may incur. If NNN incurs additional indebtedness and permits a higher degree of leverage, debt service requirements would increase and could adversely affect NNN’s financial condition and results of operations, as well as NNN’s ability to pay principal and interest on the outstanding indebtedness or cash dividends to its stockholders. In addition, increased leverage could increase the risk that NNN may default on its debt obligations.
The amount of debt outstanding at any time could have important consequences to NNN’s stockholders. For example, it could:
|
•
|
require NNN to dedicate a substantial portion of its cash flow from operations to payments on its debt, thereby reducing funds available for operations, real estate investments and other business opportunities that may arise in the future,
|
|
•
|
increase NNN’s vulnerability to general adverse economic and industry conditions,
|
|
•
|
limit NNN’s ability to obtain any additional financing it may need in the future for working capital, debt refinancing, capital expenditures, real estate investments, development or other general corporate purposes,
|
|
•
|
make it difficult to satisfy NNN’s debt service requirements,
|
|
•
|
limit NNN’s ability to pay dividends in cash on its outstanding common and preferred stock,
|
|
•
|
limit NNN’s flexibility in planning for, or reacting to, changes in its business and the factors that affect the profitability of its business, and
|
|
•
|
limit NNN’s flexibility in conducting its business, which may place NNN at a disadvantage compared to competitors with less debt or debt with less restrictive terms.
|
NNN’s ability to make scheduled payments of principal or interest on its debt, or to retire or refinance such debt will depend primarily on its future performance, which to a certain extent is subject to the creditworthiness of its tenants, competition, and economic, financial, and other factors beyond its control. There can be no assurance that NNN’s business will continue to generate sufficient cash flow from operations in the future to service its debt or meet its other cash needs. If NNN is unable to generate sufficient cash flow from its business, it may be required to refinance all or a portion of its existing debt, sell assets or obtain additional financing to meet its debt obligations and other cash needs.
NNN cannot assure stockholders that any such refinancing, sale of assets or additional financing would be possible or, if possible, on terms and conditions, including but not limited to the interest rate, which NNN would find acceptable or would not result in a material decline in earnings.
11
NNN is obligated to comply with financial and other covenants in its debt instruments that could restrict its operating activities, and the failure to comply with such covenants could result in defaults that accelerate the payment of such debt.
As of
December 31, 2014
, NNN had approximately
$1,741,054,000
of outstanding indebtedness, of which approximately
$26,339,000
was secured indebtedness. NNN’s unsecured debt instruments contain various restrictive covenants which include, among others, provisions restricting NNN’s ability to:
|
•
|
incur or guarantee additional debt,
|
|
•
|
make certain distributions, investments and other restricted payments,
|
|
•
|
enter into transactions with certain affiliates,
|
|
•
|
create certain liens,
|
|
•
|
consolidate, merge or sell NNN’s assets, and
|
|
•
|
pre-pay debt.
|
NNN’s secured debt instruments generally contain customary covenants, including, among others, provisions:
|
•
|
requiring the maintenance of the property securing the debt,
|
|
•
|
restricting its ability to sell, assign or further encumber the properties securing the debt,
|
|
•
|
restricting its ability to incur additional debt on the property securing the debt,
|
|
•
|
restricting its ability to amend or modify existing leases on the property securing the debt, and
|
|
•
|
establishing certain prepayment restrictions.
|
In addition, NNN’s debt instruments may contain cross-default provisions, in which case a default of NNN under one debt instrument will be a default of NNN under multiple or all debt instruments of NNN.
NNN’s ability to meet some of its debt covenants, including covenants related to the condition of the property or payment of real estate taxes, may be dependent on the performance by NNN’s tenants under their leases.
In addition, certain covenants in NNN’s debt instruments, including its Credit Facility, require NNN, among other things, to:
|
•
|
limit certain leverage ratios,
|
|
•
|
maintain certain minimum interest and debt service coverage ratios, and
|
|
•
|
limit investments in certain types of assets.
|
NNN’s failure to comply with certain of its debt covenants could result in defaults that accelerate the payment under such debt and limit the dividends paid to NNN’s common and preferred stockholders which would likely have a material adverse impact on NNN’s financial condition and results of operations. In addition, these defaults could impair its access to the debt and equity markets.
The market value of NNN’s equity and debt securities is subject to various factors that may cause significant fluctuations or volatility.
As with other publicly traded securities, the market price of NNN’s equity and debt securities depends on various factors, which may change from time-to-time and/or may be unrelated to NNN’s financial condition, operating performance or prospects that may cause significant fluctuations or volatility in such prices. These factors, among others, include:
|
•
|
general economic and financial market conditions,
|
|
•
|
level and trend of interest rates,
|
|
•
|
NNN’s ability to access the capital markets to raise additional capital,
|
|
•
|
the issuance of additional equity or debt securities,
|
|
•
|
changes in NNN’s funds from operations or earnings estimates,
|
|
•
|
changes in NNN’s debt ratings or analyst ratings,
|
|
•
|
NNN’s financial condition and performance,
|
|
•
|
market perception of NNN compared to other REITs, and
|
|
•
|
market perception of REITs compared to other investment sectors.
|
12
NNN’s failure to qualify as a REIT for federal income tax purposes could result in significant tax liability.
NNN intends to operate in a manner that will allow NNN to continue to qualify as a REIT. NNN believes it has been organized as, and its past and present operations qualify NNN as a REIT. However, the Internal Revenue Service (“IRS”) could successfully assert that NNN is not qualified as such. In addition, NNN may not remain qualified as a REIT in the future. Qualification as a REIT involves the application of highly technical and complex provisions of the Internal Revenue Code of 1986, as amended (the “Code”) for which there are only limited judicial or administrative interpretations and involves the determination of various factual matters and circumstances not entirely within NNN’s control. Furthermore, new tax legislation, administrative guidance or court decisions, in each instance potentially with retroactive effect, could make it more difficult or impossible for NNN to qualify as a REIT or avoid significant tax liability.
If NNN fails to qualify as a REIT, it would not be allowed a deduction for dividends paid to stockholders in computing taxable income and would become subject to federal income tax at regular corporate rates. In this event, NNN could be subject to potentially significant tax liabilities and penalties. Unless entitled to relief under certain statutory provisions, NNN would also be disqualified from treatment as a REIT for the four taxable years following the year during which the qualification was lost.
Even if NNN remains qualified as a REIT, NNN faces other tax liabilities that reduce operating results and cash flow.
Even if NNN remains qualified for taxation as a REIT, NNN is subject to certain federal, state and local taxes on its income and assets, including taxes on any undistributed income, tax on income from some activities conducted as a result of a foreclosure, and state or local income, property and transfer taxes. Any of these taxes would decrease earnings and cash available for distribution to stockholders. In addition, in order to meet the REIT qualification requirements, NNN holds some of its assets through the TRS.
Adverse legislative or regulatory tax changes could reduce NNN’s earnings, cash flow and market price of NNN’s common stock.
At any time, the federal and state income tax laws governing REITs or the administrative interpretations of those laws may change. Any such changes may have retroactive effect, and could adversely affect NNN or its stockholders. Legislation could cause shares in non-REIT corporations to be a more attractive investment to individual investors than shares in REITs, and could have an adverse effect on the value of NNN’s common stock.
Compliance with REIT requirements, including distribution requirements, may limit NNN’s flexibility and negatively affect NNN’s operating decisions.
To maintain its status as a REIT for U.S. federal income tax purposes, NNN must meet certain requirements on an on-going basis, including requirements regarding its sources of income, the nature and diversification of its assets, the amounts NNN distributes to its stockholders and the ownership of its shares. NNN may also be required to make distributions to its stockholders when it does not have funds readily available for distribution or at times when NNN’s funds are otherwise needed to fund expenditures or debt service requirements. NNN generally will not be subject to federal income taxes on amounts distributed to stockholders, so long as it distributes 100 percent of its REIT taxable income and meets certain other requirements for qualifying as a REIT. For each of the years in the three-year period ended
December 31, 2014
, NNN believes it has qualified as a REIT. Notwithstanding NNN’s qualification for taxation as a REIT, NNN is subject to certain state taxes on its income and real estate.
Changes in accounting pronouncements could adversely impact NNN’s or NNN’s tenants’ reported financial performance.
Accounting policies and methods are fundamental to how NNN records and reports its financial condition and results of operations. From time to time the Financial Accounting Standards Board (“FASB”) and the Commission, who create and interpret appropriate accounting standards, may change the financial accounting and reporting standards or their interpretation and application of these standards that govern the preparation of NNN’s financial statements. These changes could have a material impact on NNN’s reported financial condition and results of operations. In some cases, NNN could be required to apply a new or revised standard retroactively, resulting in restating prior period financial statements. Similarly, these changes could have a material impact on NNN’s tenants’ reported financial condition or results of operations and affect their preferences regarding leasing real estate.
13
NNN’s failure to maintain effective internal control over financial reporting could have a material adverse effect on its business, operating results and share price.
Section 404 of the Sarbanes-Oxley Act of 2002 requires annual management assessments of the effectiveness of the Company’s internal control over financial reporting. If NNN fails to maintain the adequacy of its internal control over financial reporting, as such standards may be modified, supplemented or amended from time to time, NNN may not be able to ensure that it can conclude on an ongoing basis that it has effective internal control over financial reporting in accordance with Section 404 of the Sarbanes-Oxley Act of 2002. Moreover, effective internal control over financial reporting, particularly those related to revenue recognition, are necessary for NNN to produce reliable financial reports and to maintain its qualification as a REIT and are important in helping to prevent financial fraud. If NNN cannot provide reliable financial reports or prevent fraud, its business and operating results could be harmed, REIT qualification could be jeopardized, investors could lose confidence in the Company’s reported financial information, impair the company's access to capital, and the trading price of NNN’s shares could drop significantly.
NNN’s ability to pay dividends in the future is subject to many factors.
NNN’s ability to pay dividends may be impaired if any of the risks described in this section were to occur. In addition, payment of NNN’s dividends depends upon NNN’s earnings, financial condition, maintenance of NNN’s REIT status and other factors as NNN’s Board of Directors may deem relevant from time to time.
Cybersecurity risks and cyber incidents could adversely affect NNN's business and disrupt operations and expose NNN to liabilities to tenants, employees, capital providers, and other third parties.
Cyber incidents can result from deliberate attacks or unintentional events. These incidents can include, but are not limited to, gaining unauthorized access to digital systems for purposes of misappropriating assets or sensitive information, corrupting data, or causing operational disruption. The result of these incidents could include, but are not limited to, disrupted operations, misstated financial data, liability for stolen assets or information, increased cybersecurity protection costs, litigation and reputational damage adversely affecting customer or investor confidence. These cyber incidents could negatively impact NNN, NNN's tenants and/or the capital markets.
Future investment in international markets could subject NNN to additional risks.
If NNN expands its operating strategy to include investment in international markets, NNN could face additional risks, including foreign currency exchange rate fluctuations, operational risks due to local economic and political conditions and laws and policies of the U.S. affecting foreign investment.
|
Item 1B.
|
Unresolved Staff Comments
|
None.
|
Item 2.
|
Properties
|
Please refer to Item 1. “Business.”
|
Item 3.
|
Legal Proceedings
|
In the ordinary course of its business, NNN is a party to various legal actions that management believes are routine in nature and incidental to the operation of the business of NNN. Management believes that the outcome of these proceedings will not have a material adverse effect upon its operations, financial condition or liquidity.
|
Item 4.
|
Mine Safety Disclosures
|
None.
14
|
Item 5.
|
Market for Registrant’s Common Equity, Related Stockholder Matters and Issuer Purchases of Equity Securities
|
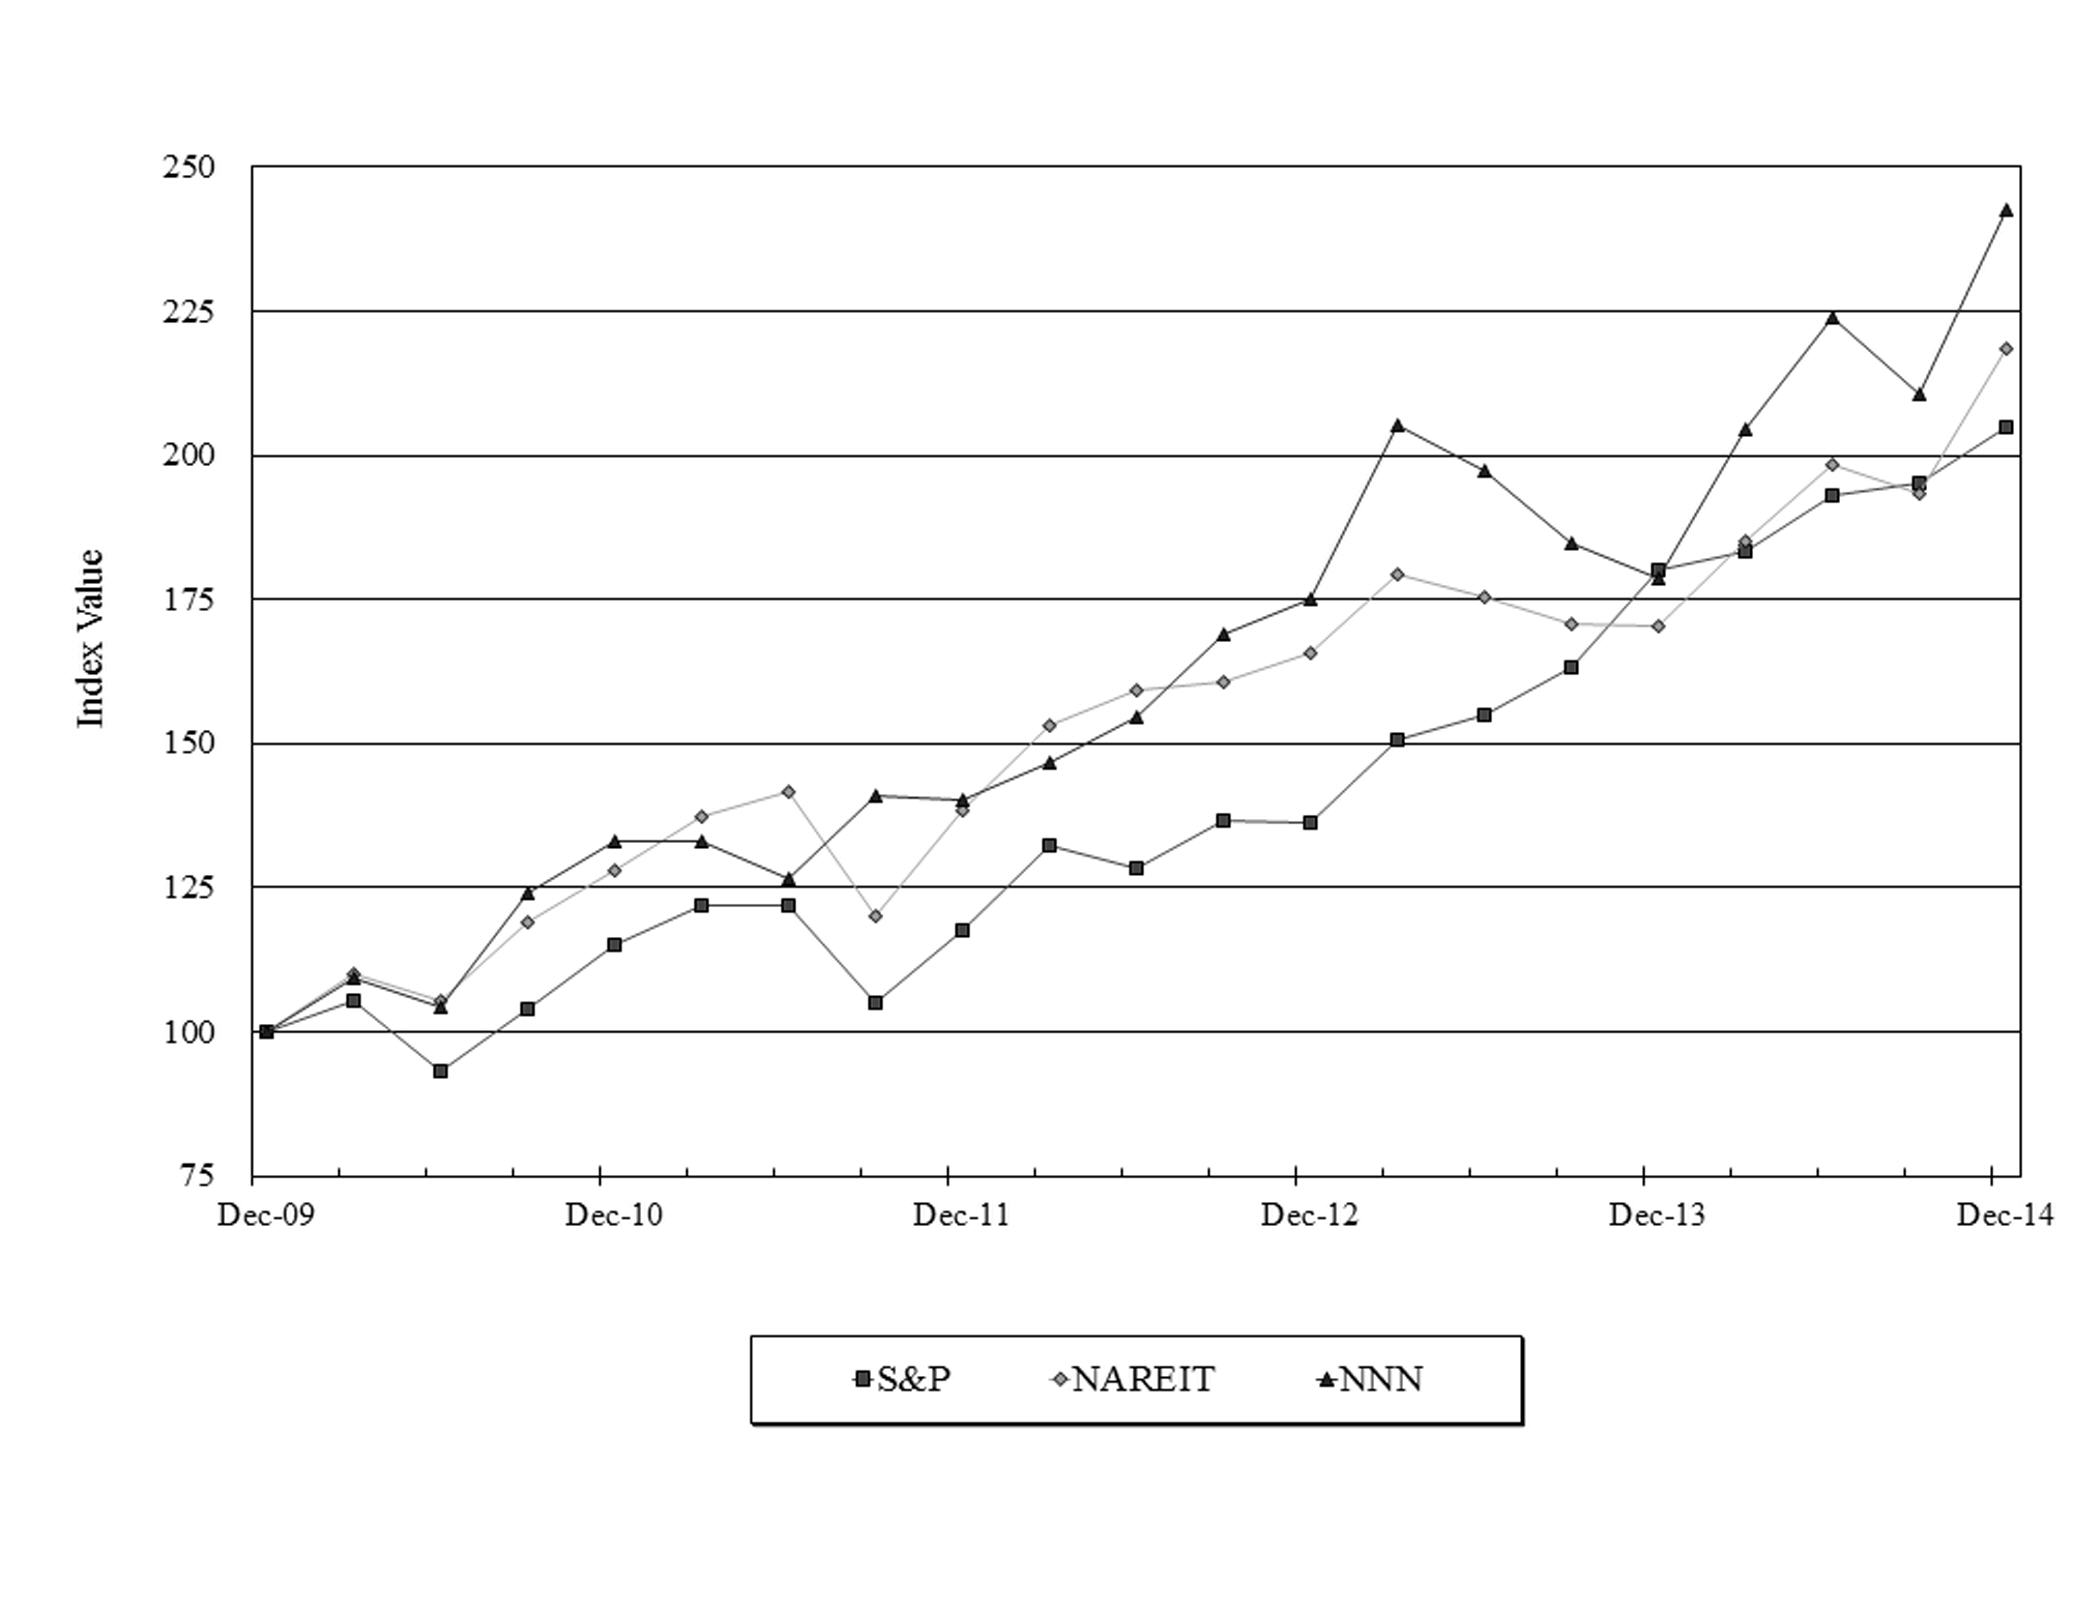
The common stock of NNN currently is traded on the NYSE under the symbol “NNN.” Set forth below is a line graph comparing the cumulative total stockholder return on NNN’s common stock, based on the market price of the common stock and assuming reinvestment of dividends, with the FTSE National Association of Real Estate Investment Trusts Equity Index (“NAREIT”) and the S&P 500 Index (“S&P”) for the five year period commencing
December 31, 2009
and ending
December 31, 2014
. The graph assumes an investment of $100 on
December 31, 2009
.
Comparison to Five-Year Cumulative Total Return
Indexed Total Return
(As of December 31, 2014)
15
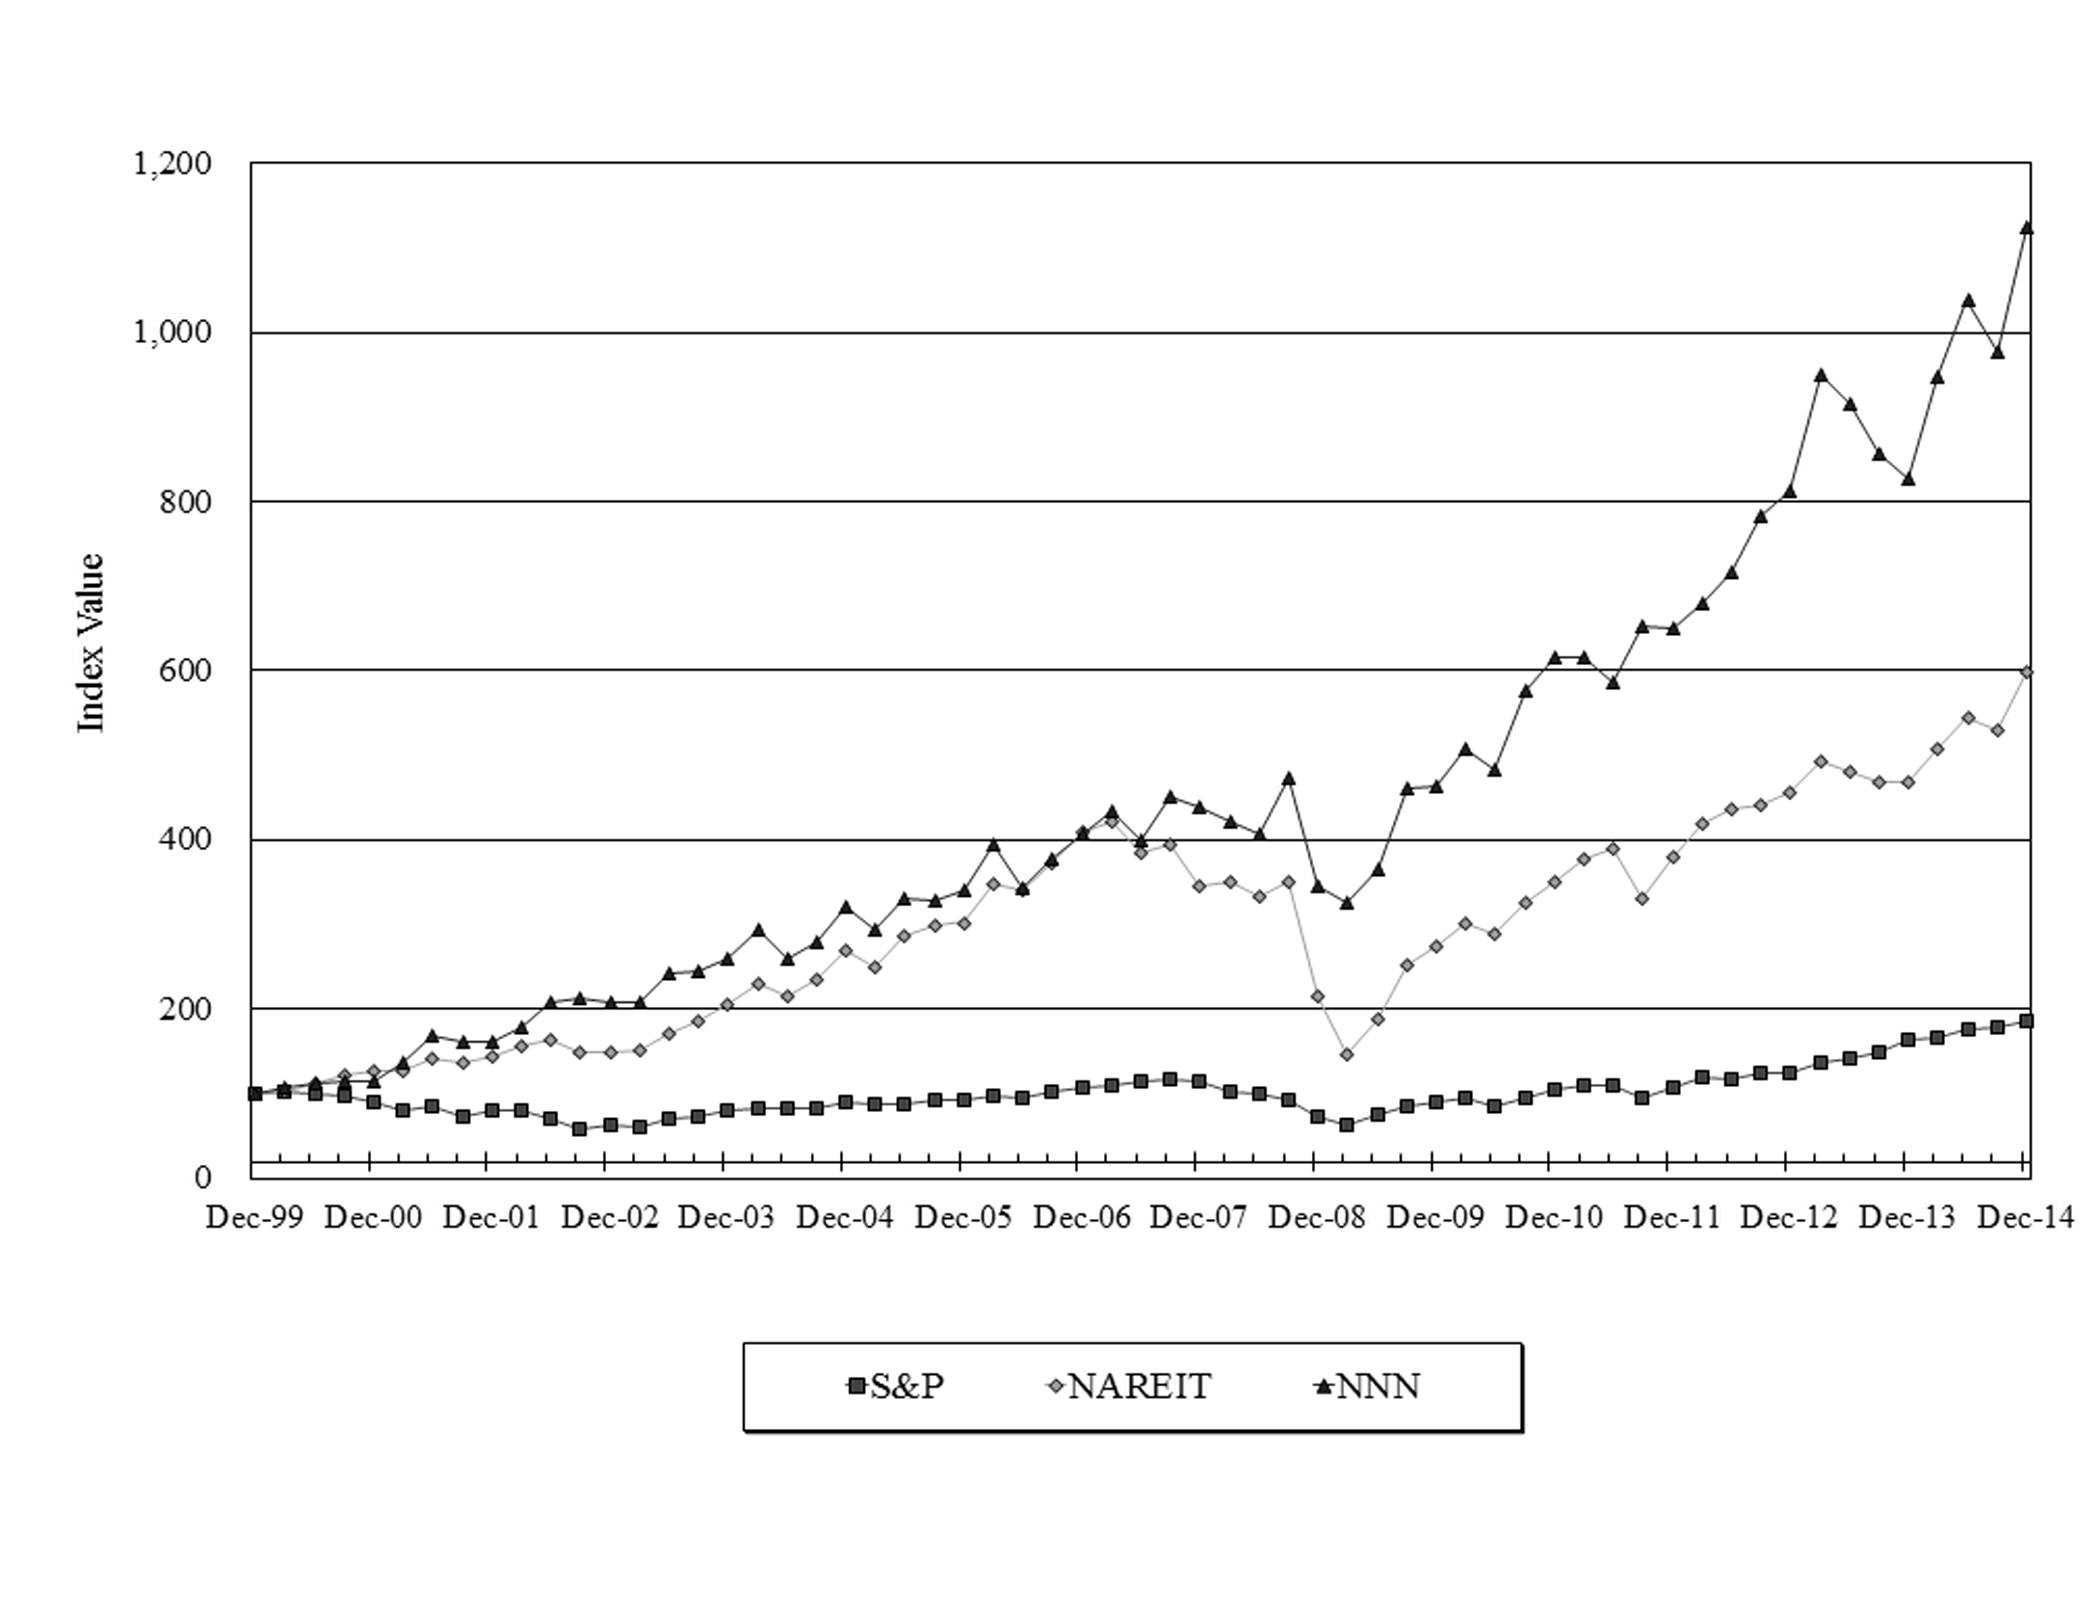
Set forth below is a line graph comparing the cumulative total stockholder return on NNN’s common stock, based on the market price of the common stock and assuming reinvestment of dividends, with the FTSE National Association of Real Estate Investment Trusts Equity Index (“NAREIT”) and the S&P 500 Index (“S&P”) for the fifteen year period commencing December 31, 1999 and ending
December 31, 2014
. The graph assumes an investment of $100 on December 31, 1999.
Comparison to Fifteen-Year Cumulative Total Return
Indexed Total Return
(As of December 31, 2014)
16
For each calendar quarter and year indicated, the following table reflects respective high, low and closing sales prices for the common stock as quoted by the NYSE and the dividends paid per share in each such period.
|
2014
|
First
Quarter
|
Second
Quarter
|
Third
Quarter
|
Fourth
Quarter
|
Year
|
|||||||||||||||
|
High
|
$
|
36.35
|
|
$
|
37.65
|
|
$
|
38.04
|
|
$
|
40.49
|
|
$
|
40.49
|
|
|||||
|
Low
|
30.08
|
|
32.94
|
|
34.34
|
|
34.42
|
|
30.08
|
|
||||||||||
|
Close
|
34.32
|
|
37.19
|
|
34.57
|
|
39.37
|
|
39.37
|
|
||||||||||
|
Dividends paid per share
|
0.405
|
|
0.405
|
|
0.420
|
|
0.420
|
|
1.650
|
|
||||||||||
|
2013
|
|
|
|
|
|
|||||||||||||||
|
High
|
$
|
36.18
|
|
$
|
41.98
|
|
$
|
37.74
|
|
$
|
35.51
|
|
$
|
41.98
|
|
|||||
|
Low
|
31.43
|
|
31.31
|
|
30.06
|
|
30.01
|
|
30.01
|
|
||||||||||
|
Close
|
36.17
|
|
34.40
|
|
31.82
|
|
30.33
|
|
30.33
|
|
||||||||||
|
Dividends paid per share
|
0.395
|
|
0.395
|
|
0.405
|
|
0.405
|
|
1.600
|
|
||||||||||
The following table presents the characterizations for tax purposes of such common stock dividends for the years ended December 31:
|
|
2014
|
2013
|
|||||||||||
|
Ordinary dividends
|
$
|
1.306992
|
|
79.2116
|
%
|
$
|
1.224568
|
|
76.5355
|
%
|
|||
|
Qualified dividends
|
0.006212
|
|
0.3765
|
%
|
0.056784
|
|
3.5490
|
%
|
|||||
|
Capital gain
|
0.008603
|
|
0.5214
|
%
|
—
|
|
—
|
|
|||||
|
Unrecaptured Section 1250 Gain
|
0.015362
|
|
0.9310
|
%
|
0.000650
|
|
0.0406
|
%
|
|||||
|
Nontaxable distributions
|
0.312831
|
|
18.9595
|
%
|
0.317998
|
|
19.8749
|
%
|
|||||
|
$
|
1.650000
|
|
100.0000
|
%
|
$
|
1.600000
|
|
100.0000
|
%
|
||||
NNN intends to pay regular quarterly dividends to its stockholders, although all future distributions will be declared and paid at the discretion of the Board of Directors and will depend upon cash generated by operating activities, NNN’s financial condition, capital requirements, annual distribution requirements under the REIT provisions of the Code and such other factors as the Board of Directors deems relevant.
In February 2015
, NNN paid dividends to its stockholders of
$55,314,000
, or
$0.42
per share, of common stock.
On January 30, 2015, there were 1,852 stockholders of record of NNN's common stock.
In February 2015, NNN declared a dividend on its Series D and E Preferred Stock of
41.40625
and
35.62500
cents per depositary share, respectively, payable March 16, 2015.
17
|
Item 6.
|
Selected Financial Data
|
Historical Financial Highlights
(dollars in thousands, except per share data)
|
2014
|
2013
|
2012
|
2011
|
2010
|
|||||||||||||||
|
Gross revenues
(1)
|
$
|
435,248
|
|
$
|
397,006
|
|
$
|
342,059
|
|
$
|
271,696
|
|
$
|
237,062
|
|
||||
|
Earnings from continuing operations
|
179,777
|
|
154,006
|
|
132,388
|
|
84,463
|
|
64,231
|
|
|||||||||
|
Earnings including noncontrolling interests
|
191,170
|
|
160,085
|
|
141,937
|
|
92,416
|
|
73,353
|
|
|||||||||
|
Net earnings attributable to NNN
|
190,601
|
|
160,145
|
|
142,015
|
|
92,325
|
|
72,997
|
|
|||||||||
|
Total assets
|
4,926,714
|
|
4,454,523
|
|
3,988,026
|
|
3,435,043
|
|
2,713,575
|
|
|||||||||
|
Total debt
|
1,741,054
|
|
1,570,059
|
|
1,586,964
|
|
1,339,109
|
|
1,133,685
|
|
|||||||||
|
Total stockholders’ equity
|
3,082,515
|
|
2,777,045
|
|
2,296,285
|
|
2,002,498
|
|
1,527,483
|
|
|||||||||
|
Cash dividends declared to:
|
|||||||||||||||||||
|
Common stockholders
|
204,157
|
|
189,107
|
|
167,495
|
|
133,720
|
|
125,391
|
|
|||||||||
|
Series C preferred stockholders
|
—
|
|
—
|
|
1,979
|
|
6,785
|
|
6,785
|
|
|||||||||
|
Series D preferred stockholders
|
19,047
|
|
19,047
|
|
15,449
|
|
—
|
|
—
|
|
|||||||||
|
Series E preferred stockholders
|
16,387
|
|
8,876
|
|
—
|
|
—
|
|
—
|
|
|||||||||
|
Weighted average common shares:
|
|||||||||||||||||||
|
Basic
|
124,257,558
|
|
118,204,148
|
|
106,965,156
|
|
88,100,076
|
|
82,715,645
|
|
|||||||||
|
Diluted
|
124,710,226
|
|
119,864,824
|
|
109,117,515
|
|
88,837,057
|
|
82,849,362
|
|
|||||||||
|
Per share information:
|
|||||||||||||||||||
|
Earnings from continuing operations:
|
|||||||||||||||||||
|
Basic
|
$
|
1.24
|
|
$
|
1.06
|
|
$
|
1.04
|
|
$
|
0.88
|
|
$
|
0.69
|
|
||||
|
Diluted
|
1.24
|
|
1.05
|
|
1.02
|
|
0.87
|
|
0.69
|
|
|||||||||
|
Net earnings:
|
|||||||||||||||||||
|
Basic
|
1.24
|
|
1.11
|
|
1.13
|
|
0.96
|
|
0.80
|
|
|||||||||
|
Diluted
|
1.24
|
|
1.10
|
|
1.11
|
|
0.96
|
|
0.80
|
|
|||||||||
|
Cash dividends declared to:
|
|||||||||||||||||||
|
Common stockholders
|
1.65
|
|
1.60
|
|
1.56
|
|
1.53
|
|
1.51
|
|
|||||||||
|
Series C preferred depositary stockholders
|
—
|
|
—
|
|
0.537760
|
|
1.843750
|
|
1.843750
|
|
|||||||||
|
Series D preferred depositary stockholders
|
1.656250
|
|
1.656250
|
|
1.343403
|
|
—
|
|
—
|
|
|||||||||
|
Series E preferred depositary stockholders
|
1.425000
|
|
0.771875
|
|
—
|
|
—
|
|
—
|
|
|||||||||
|
Other data:
|
|||||||||||||||||||
|
Cash flows provided by (used in):
|
|||||||||||||||||||
|
Operating activities
|
$
|
296,733
|
|
$
|
274,421
|
|
$
|
228,130
|
|
$
|
177,728
|
|
$
|
187,914
|
|
||||
|
Investing activities
|
(541,558
|
)
|
(568,040
|
)
|
(601,759
|
)
|
(752,068
|
)
|
(220,260
|
)
|
|||||||||
|
Financing activities
|
253,944
|
|
293,028
|
|
373,623
|
|
574,374
|
|
19,169
|
|
|||||||||
|
Funds from operations – available to common stockholders
(2)
|
260,977
|
|
229,518
|
|
193,682
|
|
139,834
|
|
108,625
|
|
|||||||||
|
(1)
|
Gross revenues include revenues from NNN’s continuing and discontinued operations. Prior to January 1, 2014, in accordance with FASB guidance on Accounting for the Impairment or Disposal of Long-Lived Assets, NNN classified the revenues related to (i) all Properties which generated revenue that were sold and a leasehold interest which expired and (ii) all Properties which generated revenue and were held for sale at December 31, 2013, as discontinued operations. Effective January 1, 2014, NNN has early adopted ASU 2014-08. Therefore, only disposals representing a strategic shift in operations are to be presented as discontinued operations. This requires the Company to continue to classify any Property disposal or Property classified as held for sale as of December 31, 2013, as discontinued operations prospectively.
|
|
(2)
|
The National Association of Real Estate Investment Trusts (“NAREIT”) developed Funds from Operations (“FFO”) as a relative non-GAAP financial measure of performance of a REIT in order to recognize that income-producing real estate historically has not depreciated on the basis determined under U.S. generally accepted accounting principles (“GAAP”). FFO is defined by NAREIT and is used by NNN as follows: net earnings (computed in accordance with GAAP) plus depreciation and amortization of real estate assets,
|
18
excluding gains (or including losses) on the disposition of certain assets, any impairment charges on a depreciable real estate asset and NNN’s share of these items from NNN’s unconsolidated partnerships and joint ventures.
Funds From Operations (FFO) Reconciliation
FFO is generally considered by industry analysts to be an appropriate measure of operating performance of real estate companies. FFO does not necessarily represent cash provided by operating activities in accordance with GAAP and should not be considered an alternative to net income as an indication of NNN’s operating performance or to cash flow as a measure of liquidity or ability to make distributions. Management considers FFO an appropriate measure of operating performance of an equity REIT because it primarily excludes the assumption that the value of the real estate assets diminishes
predictably over time, and because industry analysts have accepted it as an operating performance measure. NNN’s computation of FFO may differ from the methodology for calculating FFO used by other equity REITs, and therefore, may not be comparable to such other REITs.
The following table reconciles FFO to the most directly comparable GAAP measure, net earnings for the years ended December 31:
|
2014
|
2013
|
2012
|
2011
|
2010
|
|||||||||||||||
|
Reconciliation of funds from operations:
|
|||||||||||||||||||
|
Net earnings attributable to NNN’s stockholders
|
$
|
190,601
|
|
$
|
160,145
|
|
$
|
142,015
|
|
$
|
92,325
|
|
$
|
72,997
|
|
||||
|
Series C preferred stock dividends
|
—
|
|
—
|
|
(1,979
|
)
|
(6,785
|
)
|
(6,785
|
)
|
|||||||||
|
Series D preferred stock dividends
|
(19,047
|
)
|
(19,047
|
)
|
(15,449
|
)
|
—
|
|
—
|
|
|||||||||
|
Series E preferred stock dividends
|
(16,387
|
)
|
(8,876
|
)
|
—
|
|
—
|
|
—
|
|
|||||||||
|
Excess of redemption value over carrying value of Series C preferred shares redeemed
|
—
|
|
—
|
|
(3,098
|
)
|
—
|
|
—
|
|
|||||||||
|
Net earnings available to common stockholders
|
155,167
|
|
132,222
|
|
121,489
|
|
85,540
|
|
66,212
|
|
|||||||||
|
Real estate depreciation and amortization:
|
|||||||||||||||||||
|
Continuing operations
|
115,888
|
|
99,048
|
|
73,685
|
|
52,270
|
|
41,680
|
|
|||||||||
|
Discontinued operations
|
3
|
|
343
|
|
1,381
|
|
1,866
|
|
2,129
|
|
|||||||||
|
Joint venture real estate depreciation
|
—
|
|
—
|
|
112
|
|
176
|
|
178
|
|
|||||||||
|
Joint venture gain on disposition of real estate
|
—
|
|
—
|
|
(2,341
|
)
|
—
|
|
—
|
|
|||||||||
|
Gain on disposition of real estate, net of tax and noncontrolling interest
|
(10,904
|
)
|
(5,442
|
)
|
(10,956
|
)
|
(449
|
)
|
(1,574
|
)
|
|||||||||
|
Impairment losses – real estate
|
823
|
|
3,347
|
|
10,312
|
|
431
|
|
—
|
|
|||||||||
|
FFO available to common stockholders
|
$
|
260,977
|
|
$
|
229,518
|
|
$
|
193,682
|
|
$
|
139,834
|
|
$
|
108,625
|
|
||||
For a discussion of material events affecting the comparability of the information reflected in the selected financial data, refer to “Item 7. Management’s Discussion and Analysis of Financial Condition and Results of Operations.”
19
|
Item 7.
|
Management’s Discussion and Analysis of Financial Condition and Results of Operations
|
The following discussion and analysis should be read in conjunction with “Item 6. Selected Financial Data,” and the consolidated financial statements and related notes included elsewhere in this Annual Report on Form 10-K, and the forward-looking disclaimer language in italics before “Item 1. Business.”
The term “NNN” or the “Company” refers to National Retail Properties, Inc. and all of its consolidated subsidiaries. NNN has elected to treat certain subsidiaries as taxable real estate investment trust subsidiaries. These subsidiaries and their majority owned and controlled subsidiaries are collectively referred to as the “TRS.”
Overview
NNN, a Maryland corporation, is a fully integrated real estate investment trust (“REIT”) formed in 1984. NNN's assets include: real estate assets, mortgages and notes receivable, and commercial mortgage residual interests. NNN acquires, owns, invests in and develops properties that are leased primarily to retail tenants under long-term net leases and primarily held for investment (“Properties” or “Property Portfolio,” or each individually, a "Property").
As of
December 31, 2014
, NNN owned
2,054
Properties, with an aggregate gross leasable area of approximately
22,479,000
square feet, located in
47
states, with a weighted average remaining lease term of
12
years. Approximately
99
percent of the Properties were leased as of
December 31, 2014
.
NNN’s management team focuses on certain key indicators to evaluate the financial condition and operating performance of NNN. The key indicators for NNN include items such as: the composition of the Property Portfolio (such as tenant, geographic and line of trade diversification), the occupancy rate of the Property Portfolio, certain financial performance ratios and profitability measures, and industry trends and performance compared to that of NNN.
NNN reviews the creditworthiness of its current and prospective tenants. This evaluation includes reviewing available financial statements, press releases, public credit ratings from major credit rating agencies, industry news publications, financial market data (debt and equity pricing), and developing a thorough understanding of the tenant's business and operations, including periodically meeting with senior management of certain tenants.
NNN continues to maintain its diversification by tenant, geography and tenant’s line of trade. NNN’s highest lines of trade concentrations are the convenience store and restaurant (including full and limited service) sectors. These sectors represent a large part of the freestanding retail property marketplace and NNN’s management believes these sectors present attractive investment opportunities. The Property Portfolio is geographically concentrated in the south and southeast United States, which are regions of historically above-average population growth. Given these concentrations, any financial hardship within these sectors or geographic locations, respectively, could have a material adverse effect on the financial condition and operating performance of NNN.
As of the years ended December 31,
2014
,
2013
and
2012
, the Property Portfolio has remained at least
98
percent leased. The average remaining lease term of the Property Portfolio was
12
years, and has remained fairly constant over the past three years which, coupled with its net lease structure, provides enhanced probability of maintaining occupancy and operating earnings.
Critical Accounting Policies and Estimates
The preparation of NNN’s consolidated financial statements in conformance with accounting principles generally accepted in the United States of America requires management to make estimates on assumptions that affect the reported amounts of assets, liabilities, revenues and expenses as well as other disclosures in the financial statements. On an ongoing basis, management evaluates its estimates and assumptions; however, actual results may differ from these estimates and assumptions, which in turn could have a material impact on NNN’s financial statements. A summary of NNN’s accounting policies and procedures are included in Note 1 of NNN’s consolidated financial statements. Management believes the following critical accounting policies, among others, affect its more significant estimates and assumptions used in the preparation of NNN’s consolidated financial statements.
Real Estate Portfolio.
NNN records the acquisition of real estate at cost, including acquisition and closing costs. The cost of properties developed or funded by NNN includes direct and indirect costs of construction, property taxes, interest and other miscellaneous costs incurred during the development period until the project is substantially complete and available for occupancy.
Purchase Accounting for Acquisition of Real Estate Subject to a Lease
. In accordance with the Financial Accounting Standards Board ("FASB") guidance on business combinations, the fair value of the real estate acquired with in-place leases is allocated
20
to the acquired tangible assets, consisting of land, building and tenant improvements, and identified intangible assets and liabilities, consisting of the value of above-market and below-market leases, value of in-place leases, and based in each case on their fair values. Acquisition and closing costs incurred on the acquisition of real estate with an in-place lease is expensed as incurred and recorded as real estate acquisition costs.
Impairment – Real Estate.
Based upon certain events or changes in circumstances, management periodically assesses its Properties for possible impairment whenever the carrying value of the asset, including accrued rental income, may not be recoverable through operations. Events or circumstances that may occur include significant changes in real estate market conditions or the ability of NNN to re-lease or sell properties that are vacant or become vacant. Management determines whether an impairment in value has occurred by comparing the estimated future cash flows (undiscounted and without interest charges), including the residual value of the real estate, with the carrying value of the individual asset. If an impairment is indicated, a loss will be recorded for the amount by which the carrying value of the asset exceeds its estimated fair value. Real estate held for sale is not depreciated and is recorded at the lower of cost or fair value, less costs to sell.
Commercial Mortgage Residual Interests, at Fair Value
. Commercial mortgage residual interests, classified as available for sale, are reported at their market values with unrealized gains and losses reported as other comprehensive income in stockholders’ equity. NNN recognizes the excess of all cash flows attributable to the commercial mortgage residual interests estimated at the acquisition/transaction date over the initial investment (the accretable yield) as interest income over the life of the beneficial interest using the effective yield method. Losses are considered other than temporary valuation impairments if and when there has been a change in the timing or amount of estimated cash flows, exclusive of changes in interest rates, that leads to a loss in value.
Revenue Recognition
. Rental revenues for properties under construction commence upon completion of construction of the leased asset and delivery of the leased asset to the tenant. Rental revenues for non-development real estate assets are recognized when earned in accordance with the FASB guidance on accounting for leases, based on the terms of the lease of the leased asset.
NNN's real estate is generally leased to tenants on a net lease basis, whereby the tenant is responsible for all operating expenses relating to the Property, generally including property taxes, insurance, maintenance, utilities, repairs and capital expenditures. The leases are accounted for using either the operating or the direct financing method. Such methods are described below:
Operating method
– Properties with leases accounted for using the operating method are recorded at the cost of the real estate. Revenue is recognized as rentals are earned and expenses (including depreciation) are charged to operations as incurred. Buildings are depreciated on the straight-line method over their estimated useful lives. Leasehold interests are amortized on the straight-line method over the terms of their respective leases. When scheduled rental revenue varies during the lease term, income is recognized on a straight-line basis so as to produce a constant periodic rent over the term of the lease. Accrued rental income is the aggregate difference between the scheduled rents which vary during the lease term and the income recognized on a straight-line basis.
Direct financing method
– Properties with leases accounted for using the direct financing method are recorded at their net investment (which at the inception of the lease generally represents the cost of the Property). Unearned income is deferred and amortized into income over the lease terms so as to produce a constant periodic rate of return on NNN’s net investment in the leases.
New Accounting Pronouncements.
Refer to Note 1 of the
December 31, 2014
, Consolidated Financial Statements.
Use of Estimates.
Additional critical accounting policies of NNN include management’s estimates and assumptions relating to the reporting of assets and liabilities, revenues and expenses and the disclosure of contingent assets and liabilities to prepare the consolidated financial statements in conformity with accounting principles generally accepted in the United States of America. Additional critical accounting policies include management’s estimates of the useful lives used in calculating depreciation expense relating to real estate assets, the recoverability of the carrying value of long-lived assets, including the commercial mortgage residual interests, the recoverability of the income tax benefit, and the collectibility of receivables from tenants, including accrued rental income. Actual results could differ from those estimates.
21
Results of Operations
Property Analysis
General.
The following table summarizes the Property Portfolio as of December 31:
|
2014
|
2013
|
2012
|
||||||
|
Properties Owned:
|
||||||||
|
Number
|
2,054
|
|
1,860
|
|
1,622
|
|
||
|
Total gross leasable area (square feet)
|
22,479,000
|
|
20,402,000
|
|
19,168,000
|
|
||
|
Properties:
|
||||||||
|
Leased or operated, and unimproved land
|
2,025
|
|
1,827
|
|
1,588
|
|
||
|
Percent of Properties – leased or operated, and unimproved land
|
99
|
%
|
98
|
%
|
98
|
%
|
||
|
Weighted average remaining lease term (years)
|
12
|
|
12
|
|
12
|
|
||
|
Total gross leasable area (square feet) – leased or operated
|
21,938,000
|
|
19,872,000
|
|
18,524,000
|
|
||
The following table summarizes the lease expirations, assuming none of the tenants exercise renewal options, of the Property Portfolio for each of the next 10 years and then thereafter in the aggregate as of
December 31, 2014
:
|
% of
Annual
Base Rent
(1)
|
# of
Properties
|
Gross
Leasable
Area
(2)
|
% of
Annual
Base Rent
(1)
|
# of
Properties
|
Gross
Leasable
Area
(2)
|
|||||||||||
|
2015
|
1.2%
|
30
|
384,000
|
|
2021
|
4.4%
|
102
|
1,005,000
|
|
|||||||
|
2016
|
1.5%
|
31
|
558,000
|
|
2022
|
6.4%
|
95
|
1,171,000
|
|
|||||||
|
2017
|
3.2%
|
49
|
1,074,000
|
|
2023
|
3.0%
|
55
|
946,000
|
|
|||||||
|
2018
|
6.9%
|
182
|
1,643,000
|
|
2024
|
2.9%
|
50
|
771,000
|
|
|||||||
|
2019
|
3.4%
|
74
|
1,030,000
|
|
Thereafter
|
63.2%
|
1,236
|
11,950,000
|
|
|||||||
|
2020
|
3.9%
|
112
|
1,406,000
|
|
||||||||||||
|
(1)
|
Based on the annualized base rent for all leases in place as of
December 31, 2014
.
|
|
(2)
|
Approximate square feet.
|
The following table summarizes the diversification of the Property Portfolio based on the top 10 lines of trade:
|
% of Annual Base Rent
(1)
|
||||||||
|
Top 10 Lines of Trade
|
2014
|
2013
|
2012
|
|||||
|
1.
|
Convenience stores
|
18.0%
|
19.7%
|
19.8%
|
||||
|
2.
|
Restaurants - full service
|
9.1%
|
9.7%
|
10.7%
|
||||
|
3.
|
Automotive service
|
7.2%
|
7.6%
|
7.6%
|
||||
|
4.
|
Restaurants - limited service
|
6.5%
|
5.5%
|
5.2%
|
||||
|
5.
|
Theaters
|
5.2%
|
4.5%
|
4.7%
|
||||
|
6.
|
Family entertainment centers
|
5.1%
|
2.3%
|
2.1%
|
||||
|
7.
|
Automotive parts
|
4.7%
|
5.1%
|
5.6%
|
||||
|
8.
|
Health and fitness
|
3.9%
|
4.3%
|
3.7%
|
||||
|
9.
|
Banks
|
3.7%
|
4.1%
|
0.2%
|
||||
|
10.
|
Sporting goods
|
3.5%
|
3.7%
|
4.0%
|
||||
|
Other
|
33.1%
|
33.5%
|
36.4%
|
|||||
|
100.0%
|
100.0%
|
100.0%
|
||||||
|
(1)
|
Based on annualized base rent for all leases in place as of December 31 of the respective year.
|
22
The following table summarizes the diversification of the Property Portfolio by state as of
December 31, 2014
:
|
State
|
# of Properties
|
% of Annual Base Rent
(1)
|
||||
|
1.
|
Texas
|
419
|
20.4%
|
|||
|
2.
|
Florida
|
168
|
9.7%
|
|||
|
3.
|
North Carolina
|
130
|
5.5%
|
|||
|
4.
|
Illinois
|
71
|
5.0%
|
|||
|
5.
|
Georgia
|
109
|
4.9%
|
|||
|
6.
|
Virginia
|
87
|
4.2%
|
|||
|
7.
|
Indiana
|
84
|
4.0%
|
|||
|
8.
|
Ohio
|
60
|
3.3%
|
|||
|
9.
|
Pennsylvania
|
99
|
3.3%
|
|||
|
10.
|
California
|
40
|
3.1%
|
|||
|
Other
|
787
|
36.6%
|
||||
|
2,054
|
100.0%
|
|||||
|
(1)
|
Based on annualized base rent for all leases in place as of
December 31, 2014
.
|
Property Acquisitions.
The following table summarizes the Property acquisitions for each of the years ended December 31 (dollars in thousands):
|
2014
|
2013
|
2012
|
|||||||||
|
Acquisitions:
|
|||||||||||
|
Number of Properties
|
221
|
|
275
|
|
232
|
|
|||||
|
Gross leasable area (square feet)
|
2,417,000
|
|
1,652,000
|
|
2,955,000
|
|
|||||
|
Initial cash yield
|
7.5
|
%
|
7.8
|
%
|
8.3
|
%
|
|||||
|
Total dollars invested
(1)
|
$
|
618,145
|
|
$
|
629,896
|
|
$
|
707,233
|
|
||
|
(1)
|
Includes dollars invested in projects under construction or tenant improvements for each respective year.
|
NNN typically funds Property acquisitions either through borrowings under NNN's unsecured revolving credit facility (the "Credit Facility") or by issuing its debt or equity securities in the capital markets.
Property Dispositions.
The following table summarizes the Properties sold by NNN for each of the years ended December 31 (dollars in thousands):
|
2014
|
2013
|
2012
|
|||||||||
|
Number of properties
|
27
|
|
35
|
|
34
|
|
|||||
|
Gross leasable area (square feet)
|
317,000
|
|
360,000
|
|
211,000
|
|
|||||
|
Net sales proceeds
|
$
|
55,378
|
|
$
|
61,000
|
|
$
|
81,120
|
|
||
|
Gain, net of income tax expense
(1)
|
$
|
11,424
|
|
$
|
5,595
|
|
$
|
10,956
|
|
||
|
Cap rate
|
7.2
|
%
|
7.5
|
%
|
8.2
|
%
|
|||||
(1)
Amounts include deferred gains on previously sold properties.
NNN typically uses the proceeds from Property sales either to pay down the Credit Facility or reinvest in real estate.
23
Analysis of Revenue from Continuing Operations
General.
During the year ended
December 31, 2014
, NNN’s rental income increased primarily due to the increase in rental income from Property acquisitions (See “Results of Operations – Property Analysis – Property Acquisitions”). NNN anticipates increases in rental income will continue to come from additional Property acquisitions and increases in rents pursuant to existing lease terms.
The following summarizes NNN’s revenues from continuing operations (dollars in thousands):
|
|
2014
|
2013
|
2012
|
Percent of Total
|
2014
Versus 2013 Percent |
2013
Versus 2012 Percent |
||||||||||||||||||||||
|
2014
|
2013
|
2012
|
||||||||||||||||||||||||||
|
Rental Income
(1)
|
$
|
416,842
|
|
$
|
376,424
|
|
$
|
315,913
|
|
95.9
|
%
|
95.6
|
%
|
95.0
|
%
|
10.7
|
%
|
19.2
|
%
|
|||||||||
|
Real estate expense reimbursement from tenants
|
13,875
|
|
13,340
|
|
11,817
|
|
3.2
|
%
|
3.4
|
%
|
3.5
|
%
|
4.0
|
%
|
12.9
|
%
|
||||||||||||
|
Interest and other income from real estate transactions
|
2,296
|
|
1,471
|
|
2,243
|
|
0.5
|
%
|
0.4
|
%
|
0.7
|
%
|
56.1
|
%
|
(34.4
|
)%
|
||||||||||||
|
Interest income on commercial mortgage residual interests
|
1,834
|
|
2,290
|
|
2,673
|
|
0.4
|
%
|
0.6
|
%
|
0.8
|
%
|
(19.9
|
)%
|
(14.3
|
)%
|
||||||||||||
|
Total revenues from continuing operations
|
$
|
434,847
|
|
$
|
393,525
|
|
$
|
332,646
|
|
100.0
|
%
|
100.0
|
%
|
100.0
|
%
|
10.5
|
%
|
18.3
|
%
|
|||||||||
|
(1)
|
Includes rental income from operating leases, earned income from direct financing leases and percentage rent from continuing operations (“Rental Income”).
|
Comparison of Revenues from Continuing Operations – 2014 versus 2013
Rental Income.
Rental Income increased in amount and as a percent of the total revenues from continuing operations for the year ended December 31, 2014 as compared to the same period in 2013. The increase for the year ended December 31, 2014, is primarily due to a partial year of Rental Income received as a result of the acquisition of 221 properties with aggregate gross leasable area of approximately 2,417,000 during 2014 and a full year of Rental Income received as a result of the acquisition of 275 properties with a gross leasable area of approximately 1,652,000 square feet in 2013. In addition, the increase was partially offset by a $613,000 decrease in lease termination fees for the year ended December 31, 2014, as compared to December 31, 2013.
Real Estate Expense Reimbursement from Tenants.
Real estate expense reimbursements from tenants increased for the year ended December 31, 2014, as compared to the same period in 2013, but decreased as a percentage of total revenues from continuing operations for the same period. The increase is primarily attributable to a full year of reimbursements from properties acquired in 2013 and a partial year of reimbursements from certain newly acquired properties in 2014.
Comparison of Revenues from Continuing Operations – 2013 versus 2012
Rental Income.
Rental Income increased in amount and as a percent of the total revenues from continuing operations for the year ended December 31, 2013 as compared to the same period in 2012. The increase for the year ended December 31, 2013, is primarily due to a partial year of Rental Income received as a result of the acquisition of 275 properties with aggregate gross leasable area of approximately 1,652,000 square feet during 2013 and a full year of Rental Income received as a result of the acquisition of 232 properties with a gross leasable area of approximately 2,955,000 square feet in 2012. In addition, lease termination fees increased $597,000 for the year ended December 31, 2013, as compared to December 31, 2012.
Real Estate Expense Reimbursement from Tenants.
Real estate expense reimbursements from tenants increased for the year ended December 31, 2013, as compared to the same period in 2012, but decreased as a percentage of total revenues from continuing operations. The increase is primarily attributable to a full year of reimbursements from properties acquired in 2012 and a partial year of reimbursements from certain newly acquired properties in 2013.
24
Analysis of Expenses from Continuing Operations
General.
Operating expenses from continuing operations increased primarily due to an increase in depreciation expense and an increase in general and administrative expense, but was partially offset by a decrease in impairments during the year ended December 31, 2014, as compared to the same period in 2013. The following summarizes NNN’s expenses from continuing operations (dollars in thousands):
|
2014
|
2013
|
2012
|
|||||||||
|
General and administrative
|
$
|
32,518
|
|
$
|
31,095
|
|
$
|
31,828
|
|
||
|
Real estate
|
18,905
|
|
18,497
|
|
17,425
|
|
|||||
|
Depreciation and amortization
|
116,162
|
|
99,274
|
|
73,806
|
|
|||||
|
Impairment – commercial mortgage residual interests valuation
|
256
|
|
1,185
|
|
2,812
|
|
|||||
|
Impairment losses and other charges, net of recoveries
|
760
|
|
3,580
|
|
3,899
|
|
|||||
|
Total operating expenses
|
$
|
168,601
|
|
$
|
153,631
|
|
$
|
129,770
|
|
||
|
Interest and other income
|
$
|
(357
|
)
|
$
|
(1,493
|
)
|
$
|
(2,232
|
)
|
||
|
Interest expense
|
85,510
|
|
85,822
|
|
83,787
|
|
|||||
|
Real estate acquisition costs
|
1,391
|
|
1,485
|
|
364
|
|
|||||
|
Total other expenses (revenues)
|
$
|
86,544
|
|
$
|
85,814
|
|
$
|
81,919
|
|
||
|
|
Percentage of Total
Operating Expenses
|
Percentage of
Revenues from
Continuing Operations
|
2014
Versus 2013 Percent |
2013
Versus 2012 Percent |
|||||||||||||||||||||
|
|
2014
|
2013
|
2012
|
2014
|
2013
|
2012
|
|||||||||||||||||||
|
General and administrative
|
19.3
|
%
|
20.3
|
%
|
24.5
|
%
|
7.5
|
%
|
7.9
|
%
|
9.6
|
%
|
4.6
|
%
|
(2.3
|
)%
|
|||||||||
|
Real estate
|
11.2
|
%
|
12.0
|
%
|
13.4
|
%
|
4.3
|
%
|
4.7
|
%
|
5.2
|
%
|
2.2
|
%
|
6.2
|
%
|
|||||||||
|
Depreciation and amortization
|
68.9
|
%
|
64.6
|
%
|
56.9
|
%
|
26.7
|
%
|
25.2
|
%
|
22.2
|
%
|
17.0
|
%
|
34.5
|
%
|
|||||||||
|
Impairment – commercial mortgage
residual interests valuation
|
0.2
|
%
|
0.8
|
%
|
2.2
|
%
|
0.1
|
%
|
0.3
|
%
|
0.8
|
%
|
(78.4
|
)%
|
(57.9
|
)%
|
|||||||||
|
Impairment losses and other
charges, net of recoveries
|
0.4
|
%
|
2.3
|
%
|
3.0
|
%
|
0.2
|
%
|
0.9
|
%
|
1.2
|
%
|
(78.8
|
)%
|
(8.2
|
)%
|
|||||||||
|
Total operating expenses
|
100.0
|
%
|
100.0
|
%
|
100.0
|
%
|
38.8
|
%
|
39.0
|
%
|
39.0
|
%
|
9.7
|
%
|
18.4
|
%
|
|||||||||
|
Interest and other income
|
(0.4
|
)%
|
(1.7
|
)%
|
(2.7
|
)%
|
(0.1
|
)%
|
(0.4
|
)%
|
(0.7
|
)%
|
(76.1
|
)%
|
(33.1
|
)%
|
|||||||||
|
Interest expense
|
98.8
|
%
|
100.0
|
%
|
102.3
|
%
|
19.7
|
%
|
21.8
|
%
|
25.2
|
%
|
(0.4
|
)%
|
2.4
|
%
|
|||||||||
|
Real estate acquisition costs
|
1.6
|
%
|
1.7
|
%
|
0.4
|
%
|
0.3
|
%
|
0.4
|
%
|
0.1
|
%
|
(6.3
|
)%
|
308.0
|
%
|
|||||||||
|
Total other expenses (revenues)
|
100.0
|
%
|
100.0
|
%
|
100.0
|
%
|
19.9
|
%
|
21.8
|
%
|
24.6
|
%
|
0.9
|
%
|
4.8
|
%
|
|||||||||
Comparison of Expenses from Continuing Operations – 2014 versus 2013
General and Administrative Expenses.
General and administrative expenses increased for the year ended December 31, 2014, as compared to the same period in 2013, but decreased both as a percentage of total operating expenses and as a percentage of revenues from continuing operations. The increase in general and administrative expenses for the year ended December 31, 2014, is primarily attributable to an increase in incentive compensation.
Real Estate.
Real estate expenses increased for the year ended December 31, 2014, as compared to the same period in 2013, but decreased both as a percentage of total operating expenses and as a percentage of revenues from continuing operations. The increase is primarily due to the increase in tenant reimbursable expenses related to a partial year of reimbursable expenses from certain properties acquired in 2014 and a full year of reimbursable expenses from certain properties acquired in 2013. Additionally, real estate expenses incurred on vacant properties increased for the year ended December 31, 2014. The increase was partially offset by a decrease in real estate expenses that are not reimbursable by the tenant for the year ended December 31, 2014, as compared to the same period in 2013.
25
Depreciation and Amortization.
Depreciation and amortization expenses increased in amount and as a percentage of total operating expenses and as a percentage of revenues from continuing operations for the year ended December 31, 2014, as compared to the year ended December 31, 2013. The increase in expenses is primarily due to the acquisition of 221 properties with an aggregate gross leasable area of approximately 2,417,000 square feet in 2014 and 275 properties with an aggregate gross leasable area of approximately 1,652,000 square feet during 2013.
Interest Expense.
Interest expense decreased for the year ended December 31, 2014, as compared to the same period in 2013, and decreased as a percentage of revenues from continuing operations and as a percentage of total operating expenses.
The following represents the primary changes in debt that have impacted interest expense:
|
(i)
|
the issuance in April 2013 of $350,000,000 principal amount of notes payable with a maturity of April 2023, and stated interest rate of 3.300%;
|
|
(ii)
|
the settlement of $223,035,000 principal amount of 5.125% convertible notes payable in 2013;
|
|
(iii)
|
the issuance in May 2014 of $350,000,000 principal amount of notes payable with a maturity of June 2024, and stated interest rate of 3.900%;
|
|
(iv)
|
the repayment in June 2014 of $150,000,000 principal amount of notes payable with a stated interest rate of 6.250%;
|
|
(v)
|
the assumption of a mortgage in September 2014 of $2,824,000 in connection with a Property acquisition with an interest rate of 6.400%;
|
|
(vi)
|
the assumption of a mortgage in November 2014 of $14,430,000 in connection with a Property acquisition with an interest rate of 5.230%; and
|
|
(vii)
|
the increase of $15,188,000 in the weighted average debt outstanding on the Credit Facility for the year ended December 31, 2014, as compared to the same period in 2013.
|
Comparison of Expenses from Continuing Operations – 2013 versus 2012
General and Administrative Expenses.
General and administrative expenses decreased for the year ended December 31, 2013, as compared to the same period in 2012, and decreased both as a percentage of total operating expenses and as a percentage of revenues from continuing operations. The decrease in general and administrative expenses for the year ended December 31, 2013, is primarily attributable to a decrease in incentive compensation.
Real Estate.
Real estate expenses increased for the year ended December 31, 2013, as compared to the same period in 2012, but decreased both as a percentage of total operating expenses and as a percentage of revenues from continuing operations. The increase is primarily due to the increase in tenant reimbursable expenses related to a partial year of reimbursable expenses from certain properties acquired in 2013 and a full year of reimbursable expenses from certain properties acquired in 2012. The increase was partially offset by a decrease in real estate expenses that are not reimbursable by the tenant and a decrease in real estate expenses incurred on vacant properties for the year ended December 31, 2013, as compared to the same period in 2012.
Depreciation and Amortization.
Depreciation and amortization expenses increased as a percentage of total operating expenses and increased as a percentage of revenues from continuing operations for the year ended December 31, 2013, as compared to the year ended December 31, 2012. The increase in expenses is primarily due to the acquisition of 275 properties with an aggregate gross leasable area of approximately 1,652,000 square feet in 2013 and 232 properties with an aggregate gross leasable area of approximately 2,955,000 square feet during 2012.
Interest Expense.
Interest expense increased for the year ended December 31, 2013, as compared to the same period in 2012, but decreased as a percentage of revenues from continuing operations and as a percentage of total operating expenses.
The following represents the primary changes in debt that have impacted interest expense:
|
(i)
|
the issuance in August 2012 of $325,000,000 principal amount of notes payable with a maturity of October 2022, and stated interest rate of 3.800%;
|
|
(ii)
|
the repayment in June 2012 of $50,000,000 principal amount of notes payable with a stated interest rate of 7.750%;
|
|
(iii)
|
the repayment in July 2012 of a mortgage, with a balance of $18,488,000 at December 31, 2011 and an interest rate of 6.900%;
|
26
|
(iv)
|
the settlement of $138,700,000 principal amount of 3.950% convertible notes payable, of which $123,163,000 was settled in the fourth quarter 2012 and the remaining $15,537,000 was settled in the first quarter 2013;
|
|
(v)
|
the issuance in April 2013 of $350,000,000 principal amount of notes payable with a maturity of April 2023, and stated interest rate of 3.300%;
|
|
(vi)
|
the settlement of $223,035,000 principal amount of 5.125% convertible notes payable in 2013; and
|
|
(vii)
|
the decrease of $12,017,000 in the weighted average debt outstanding on the Credit Facility for the year ended December 31, 2013, as compared to the same period in 2012.
|
Discontinued Operations
Earnings.
Effective January 1, 2014, NNN has early adopted the FASB issued Accounting Standards Update ("ASU") 2014-08. Under ASU 2014-08, only disposals representing a strategic shift in operations are to be presented as discontinued operations. ASU 2014-08 requires the Company to continue to classify any Property disposal or Property classified as held for sale as of December 31, 2013, as discontinued operations prospectively. Therefore, the revenues and expenses related to these properties are presented as discontinued operations as of December 31, 2014. The Company did not classify any additional properties as discontinued operations subsequent to December 31, 2013.
The following table summarizes the earnings before income tax expense from discontinued operations for the years ended December 31 (dollars in thousands):
|
|
2014
|
2013
|
2012
|
||||||||||||||||||||||||||
|
# of Sold
Properties
|
Gain
|
Earnings
|
# of Sold
Properties
|
Gain
|
Earnings
|
# of Sold
Properties
|
Gain
|
Earnings
|
|||||||||||||||||||||
|
Properties
|
2
|
$
|
155
|
|
(1)
|
$
|
124
|
|
35
|
$
|
6,272
|
|
(1)
|
$
|
5,972
|
|
34
|
$
|
10,956
|
|
(1)
|
$
|
9,549
|
|
|||||
|
Noncontrolling interests
|
—
|
—
|
|
—
|
|
—
|
(152
|
)
|
(163
|
)
|
—
|
—
|
|
(24
|
)
|
||||||||||||||
|
2
|
$
|
155
|
|
$
|
124
|
|
35
|
$
|
6,120
|
|
$
|
5,809
|
|
34
|
$
|
10,956
|
|
$
|
9,525
|
|
|||||||||
(1)
Amount includes deferred gains on previously sold properties.
NNN periodically sells Properties and may reinvest the sales proceeds to purchase additional properties or pay down debt. NNN evaluates its ability to pay dividends to stockholders by considering the combined effect of income from continuing and discontinued operations.
Impairment Losses and Other Charges.
NNN periodically assesses its real estate for possible impairment whenever certain events or changes in circumstances indicate that the carrying amount of the asset, including accrued rental income, may not be recoverable through operations. Events or circumstances that may occur include significant changes in real estate market conditions and the ability of NNN to re-lease or sell properties that are vacant or become vacant. Management evaluates whether an impairment in value has occurred by comparing the estimated future cash flows (undiscounted and without interest charges), including the residual value of the real estate, with the carrying cost of the individual asset. If an impairment is indicated, a loss will be recorded for the amount by which the carrying value of the asset exceeds its fair value. During the years ended December 31, 2014, 2013 and 2012, NNN recognized real estate impairments on discontinued operations of $63,000, $541,000 and $6,242,000, respectively.
Impact of Inflation
NNN’s leases typically contain provisions to mitigate the adverse impact of inflation on NNN’s results of operations. Tenant leases generally provide for limited increases in rent as a result of fixed increases, increases in the consumer price index, and/or, to a lesser extent, increases in the tenant’s sales volume. During times when inflation is greater than increases in rent, rent increases will not keep up with the rate of inflation.
Properties are leased to tenants under long-term, net leases which typically require the tenant to pay certain operating expenses for a Property, thus, NNN’s exposure to inflation is reduced with respect to these expenses. Inflation may have an adverse impact on NNN’s tenants.
27
Liquidity
General
. NNN’s demand for funds has been and will continue to be primarily for (i) payment of operating expenses and cash dividends; (ii) Property acquisitions and development; (iii) origination of mortgages and notes receivable; (iv) capital expenditures; (v) payment of principal and interest on its outstanding indebtedness; and (vi) other investments.
NNN expects to meet short term liquidity requirements through cash provided from operations and NNN’s Credit Facility. As of
December 31, 2014
, there was
no
outstanding balance and
$650,000,000
was available for future borrowings under the Credit Facility. NNN anticipates its long-term capital needs will be funded by the Credit Facility, cash provided from operations, the issuance of long-term debt or the issuance of common or preferred equity or other instruments convertible into or exchangeable for common or preferred equity. However, there can be no assurance that additional financing or capital will be available, or that the terms will be acceptable or advantageous to NNN.
Cash and Cash Equivalents.
The table below summarizes NNN’s cash flows for each of the years ended December 31 (in thousands):
|
2014
|
2013
|
2012
|
|||||||||
|
Cash and cash equivalents:
|
|||||||||||
|
Provided by operating activities
|
$
|
296,733
|
|
$
|
274,421
|
|
$
|
228,130
|
|
||
|
Used in investing activities
|
(541,558
|
)
|
(568,040
|
)
|
(601,759
|
)
|
|||||
|
Provided by financing activities
|
253,944
|
|
293,028
|
|
373,623
|
|
|||||
|
Increase (decrease)
|
9,119
|
|
(591
|
)
|
(6
|
)
|
|||||
|
Net cash at beginning of period
|
1,485
|
|
2,076
|
|
2,082
|
|
|||||
|
Net cash at end of period
|
$
|
10,604
|
|
$
|
1,485
|
|
$
|
2,076
|
|
||
Cash provided by operating activities represents cash received primarily from rental income from tenants, proceeds from the disposition of certain properties and interest income less cash used for general and administrative expenses, interest expense and acquisition of certain properties. NNN’s cash flow from operating activities, net of cash used in and provided by the acquisition and disposition of certain properties, has been sufficient to pay the distributions for each period presented. NNN typically uses proceeds from its Credit Facility to fund the acquisition of its properties. The change in cash provided by operations for the
years ended December 31, 2014, 2013 and 2012
, is primarily the result of changes in revenues and expenses as discussed in “Results of Operations.” Cash generated from operations is expected to fluctuate in the future.
Changes in cash for investing activities are primarily attributable to acquisitions and dispositions of Properties.
NNN’s financing activities for the year ended December 31,
2014
, included the following significant transactions:
|
•
|
$46,400,000 in net payments to NNN's Credit Facility,
|
|
•
|
$346,068,000 in net proceeds from the issuance of the 3.90% notes payable in May,
|
|
•
|
$150,000,000 in repayment of the 6.25% notes payable in June,
|
|
•
|
$199,961,000 in net proceeds from the issuance of 5,462,500 shares of common stock in November,
|
|
•
|
$14,817,000
in net proceeds from the issuance of
422,406
shares of common stock in connection with the Dividend Reinvestment and Stock Purchase Plan (“DRIP”),
|
|
•
|
$134,919,000 in net proceeds from the issuance of 3,758,362 shares of common stock in connection with the at-the-market ("ATM") equity program,
|
|
•
|
$19,047,000
in dividends paid to holders of the depositary shares of NNN’s Series D Preferred Stock,
|
|
•
|
$
16,387,000
in dividends paid to holders of the depositary shares of NNN’s Series E Preferred Stock, and
|
|
•
|
$204,157,000
in dividends paid to common stockholders.
|
Financing Strategy.
NNN’s financing objective is to manage its capital structure effectively in order to provide sufficient capital to execute its operating strategy while servicing its debt requirements, maintaining investment grade credit rating, staggering debt maturities and providing value to NNN’s stockholders. NNN generally utilizes debt and equity security offerings, bank borrowings, proceeds from the disposition of certain properties, and to a lesser extent, internally generated funds to meet its capital needs.
28
NNN typically funds its short-term liquidity requirements, including investments in additional Properties, with cash from its Credit Facility. As of December 31,
2014
, there was
no
outstanding balance and
$650,000,000
was available for future borrowings under the Credit Facility.
As of December 31,
2014
, NNN’s ratio of total debt to total gross assets (before accumulated depreciation and amortization) was approximately
33
percent and the ratio of secured indebtedness to total gross assets was less than
one
percent. The ratio of total debt to total market capitalization was approximately
24
percent. Certain financial agreements to which NNN is a party contain covenants that limit NNN’s ability to incur debt under certain circumstances. The organizational documents of NNN do not limit the absolute amount or percentage of indebtedness that NNN may incur. Additionally, NNN may change its financing strategy.
Contractual Obligations and Commercial Commitments
. The information in the following table summarizes NNN’s contractual obligations and commercial commitments outstanding as of December 31,
2014
. The table presents principal cash flows by year-end of the expected maturity for debt obligations and commercial commitments outstanding as of December 31,
2014
.
|
|
Expected Maturity Date (dollars in thousands)
|
||||||||||||||||||||||||||
|
|
Total
|
2015
|
2016
|
2017
|
2018
|
2019
|
Thereafter
|
||||||||||||||||||||
|
Long-term debt
(1)
|
$
|
1,750,448
|
|
$
|
151,663
|
|
$
|
7,367
|
|
$
|
253,355
|
|
$
|
624
|
|
$
|
602
|
|
$
|
1,336,837
|
|
||||||
|
Operating lease
|
7,704
|
|
528
|
|
714
|
|
728
|
|
743
|
|
758
|
|
4,233
|
|
|||||||||||||
|
Total contractual cash obligations
(2)
|
$
|
1,758,152
|
|
$
|
152,191
|
|
$
|
8,081
|
|
$
|
254,083
|
|
$
|
1,367
|
|
$
|
1,360
|
|
$
|
1,341,070
|
|
||||||
|
(1)
|
Includes amounts outstanding under mortgages payable and notes payable and excludes unamortized mortgage premiums and note discounts.
|
|
(2)
|
Excludes $17,396 of accrued interest payable.
|
In addition to the contractual obligations outlined above, NNN has agreed to fund construction commitments on leased Properties. The improvements are estimated to be completed within 12 months. These construction commitments, as of December 31,
2014
, are outlined in the table below (dollars in thousands):
|
Number of properties
|
26
|
|
||
|
Total commitment
(1)
|
$
|
110,081
|
|
|
|
Amount funded
|
$
|
57,465
|
|
|
|
Remaining commitment
|
$
|
52,616
|
|
|
|
(1)
|
Includes land, construction costs, tenant improvements and lease costs.
|
As of December 31,
2014
, NNN did not have any other material contractual cash obligations, such as purchase obligations, financing lease obligations or other long-term liabilities other than those reflected in the table. In addition to items reflected in the table, NNN has issued preferred stock with cumulative preferential cash distributions, as described below under “Dividends.”
Management anticipates satisfying these obligations with a combination of NNN’s cash provided from operations, current capital resources on hand, its Credit Facility, debt or equity financings and asset dispositions.
Generally the Properties are leased under long-term net leases. Therefore, management anticipates that capital demands to meet obligations with respect to these Properties will be modest for the foreseeable future and can be met with funds from operations and working capital. Certain of the Properties are subject to leases under which NNN retains responsibility for specific costs and expenses associated with the Property. Management anticipates the costs associated with the vacant Properties or those Properties that become vacant will also be met with funds from operations and working capital. NNN may be required to borrow under its Credit Facility or use other sources of capital in the event of significant capital expenditures.
The lost revenues and increased property expenses resulting from vacant Properties or uncollectibility of lease revenues could have a material adverse effect on the liquidity and results of operations if NNN is unable to release the Properties at comparable rental rates and in a timely manner. As of December 31,
2014
, NNN owned
29
vacant, un-leased Properties which accounted for approximately
one
percent of total Properties. Additionally, as of
February 13, 2015
, less than
one
percent of the total gross leasable area of the Property Portfolio was leased to tenants that have filed a voluntary petition for bankruptcy under Chapter 11 of the U.S. Bankruptcy Code. As a result, these tenants have the right to reject or affirm their leases with NNN.
29
Dividends.
NNN has made an election to be taxed as a REIT under Sections 856 through 860 of the Code, as amended, and related regulations and intends to continue to operate so as to remain qualified as a REIT for federal income tax purposes. NNN generally will not be subject to federal income tax on income that it distributes to its stockholders, provided that it distributes 100 percent of its REIT taxable income and meets certain other requirements for qualifying as a REIT. If NNN fails to qualify as a REIT in any taxable year, it will be subject to federal income tax on its taxable income at regular corporate rates and will not be permitted to qualify for treatment as a REIT for federal income tax purposes for four years following the year during which qualification is lost. Such an event could materially adversely affect NNN’s income and ability to pay dividends.
One of NNN’s primary objectives, consistent with its policy of retaining sufficient cash for reserves and working capital purposes and maintaining its status as a REIT, is to distribute a substantial portion of its funds available from operations to its stockholders in the form of dividends.
The following table outlines the dividends declared and paid for NNN's common stock for the years ended December 31 (in thousands, except per share data):
|
2014
|
2013
|
2012
|
||||||||||
|
Dividends
|
$
|
204,157
|
|
$
|
189,107
|
|
$
|
167,495
|
|
|||
|
Per share
|
1.650
|
|
1.600
|
|
1.560
|
|
||||||
The following presents the characterizations for tax purposes of such common stock dividends for the years ended December 31:
|
|
2014
|
2013
|
2012
|
|||||||||||||||||
|
Ordinary dividends
|
$
|
1.306992
|
|
79.2116
|
%
|
$
|
1.224568
|
|
76.5355
|
%
|
$
|
1.199003
|
|
76.8592
|
%
|
|||||
|
Qualified dividends
|
0.006212
|
|
0.3765
|
%
|
0.056784
|
|
3.5490
|
%
|
0.013346
|
|
0.8555
|
%
|
||||||||
|
Capital gain
|
0.008603
|
|
0.5214
|
%
|
—
|
|
—
|
|
0.021358
|
|
1.3691
|
%
|
||||||||
|
Unrecaptured Section 1250 Gain
|
0.015362
|
|
0.9310
|
%
|
0.000650
|
|
0.0406
|
%
|
0.048890
|
|
3.1340
|
%
|
||||||||
|
Nontaxable distributions
|
0.312831
|
|
18.9595
|
%
|
0.317998
|
|
19.8749
|
%
|
0.277403
|
|
17.7822
|
%
|
||||||||
|
$
|
1.650000
|
|
100.0000
|
%
|
$
|
1.600000
|
|
100.0000
|
%
|
$
|
1.560000
|
|
100.0000
|
%
|
||||||
In February 2015
, NNN paid dividends to its common stockholders of
$55,314,000
, or
$0.42
per share of common stock.
Holders of NNN’s preferred stock issuances are entitled to receive, when and as authorized by the Board of Directors, cumulative preferential cash distributions based on the stated rate and liquidation preference per annum. The following table outlines the dividends declared and paid for NNN's preferred stock for the years ended December 31(in thousands, except per share data):
|
2014
|
2013
|
2012
|
||||||||||
|
Series C Preferred Stock
(1)
:
|
||||||||||||
|
Dividends
|
$
|
—
|
|
$
|
—
|
|
$
|
1,979
|
|
|||
|
Per share
|
—
|
|
—
|
|
0.537760
|
|
||||||
|
Series D Preferred Stock
(2)
:
|
||||||||||||
|
Dividends
|
19,047
|
|
19,047
|
|
15,449
|
|
||||||
|
Per share
|
1.656250
|
|
1.656250
|
|
1.343403
|
|
||||||
|
Series E Preferred Stock
(3)
:
|
||||||||||||
|
Dividends
|
16,387
|
|
8,876
|
|
—
|
|
||||||
|
Per share
|
1.425000
|
|
0.771875
|
|
—
|
|
||||||
(1)
The Series C Preferred Stock was redeemed in March 2012. The dividends paid during the quarter ended March 31, 2012 include accumulated and unpaid dividends through the redemption date.
(2)
The Series D Preferred Stock dividends paid during the quarter ended June 30, 2012 include accumulated and unpaid dividends from the issuance date through the declaration date. The Series D Preferred Stock has no maturity date and will remain outstanding unless redeemed.
30
(3)
The Series E Preferred Stock dividends paid during the quarter ended September 30, 2013 include accumulated and unpaid dividends from the issuance date through the declaration date. The Series E Preferred Stock has no maturity date and will remain outstanding unless redeemed.
The following presents the characterizations for tax purposes of such preferred stock dividends for the years ended December 31:
|
|
2014
|
2013
|
2012
|
|||||||||||||||||||||||||||||
|
Series E
|
Series D
|
Percentage of Total
|
Series E
(3)
|
Series D
|
Percentage of Total
|
Series D
(2)
|
Series C
(1)
|
Percentage of Total
|
||||||||||||||||||||||||
|
Ordinary dividends
|
$
|
1.393700
|
|
$
|
1.619870
|
|
97.8035
|
%
|
$
|
0.741150
|
|
$
|
1.590323
|
|
96.0195
|
%
|
$
|
1.255844
|
|
$
|
0.502710
|
|
93.4823
|
%
|
||||||||
|
Qualified dividends
|
0.005738
|
|
0.006670
|
|
0.4027
|
%
|
0.030332
|
|
0.065084
|
|
3.9296
|
%
|
0.013979
|
|
0.005596
|
|
1.0406
|
%
|
||||||||||||||
|
Capital gain
|
0.009177
|
|
0.010666
|
|
0.6440
|
%
|
—
|
|
—
|
|
—
|
|
0.022371
|
|
0.008956
|
|
1.6652
|
%
|
||||||||||||||
|
Unrecaptured Section 1250 Gain
|
0.016385
|
|
0.019044
|
|
1.1498
|
%
|
0.000393
|
|
0.000843
|
|
0.0509
|
%
|
0.051209
|
|
0.020498
|
|
3.8119
|
%
|
||||||||||||||
|
$
|
1.425000
|
|
$
|
1.656250
|
|
100.0000
|
%
|
$
|
0.771875
|
|
$
|
1.656250
|
|
100.0000
|
%
|
$
|
1.343403
|
|
$
|
0.537760
|
|
100.0000
|
%
|
|||||||||
(1)
The Series C preferred stock was redeemed in March 2012.
(2)
The Series D preferred stock was issued in February 2012.
(3)
The Series E preferred stock was issued in May 2013.
In February
2015
, NNN declared a dividend on its Series D and E Preferred Stock of
41.40625
and
35.62500
cents per depositary share, respectively, payable March 16,
2015
.
Capital Resources
Generally, cash needs for Property acquisitions, mortgages and notes receivable investments, debt payments, capital expenditures, development and other investments have been funded by equity and debt offerings, bank borrowings, the sale of properties and, to a lesser extent, by internally generated funds. Cash needs for operating and interest expenses and dividends have generally been funded by internally generated funds. If available, future sources of capital include proceeds from the public or private offering of NNN’s debt or equity securities, secured or unsecured borrowings from banks or other lenders, proceeds from the sale of properties, as well as undistributed funds from operations.
The following is a summary of NNN’s total outstanding debt as of December 31 (dollars in thousands):
|
2014
|
Percentage
of Total
|
2013
|
Percentage
of Total
|
||||||||||
|
Line of credit payable
|
$
|
—
|
|
—
|
|
$
|
46,400
|
|
3.0
|
%
|
|||
|
Mortgages payable
|
26,339
|
|
1.5
|
%
|
9,475
|
|
0.6
|
%
|
|||||
|
Notes payable
|
1,714,715
|
|
98.5
|
%
|
1,514,184
|
|
96.4
|
%
|
|||||
|
Total outstanding debt
|
$
|
1,741,054
|
|
100.0
|
%
|
$
|
1,570,059
|
|
100.0
|
%
|
|||
Indebtedness.
NNN expects to use indebtedness primarily for property acquisitions and development of single-tenant retail properties, either directly or through investment interests, and mortgages and notes receivable. Additionally indebtedness may be used to refinance existing indebtedness.
Line of Credit Payable.
In October 2014, NNN amended and restated its credit agreement increasing the borrowing capacity under its unsecured revolving credit facility from $
500,000,000
to
$650,000,000
and amended certain other terms under the former revolving credit facility (as the context requires, the previous and new revolving credit facility, the “Credit Facility”). The Credit Facility had a weighted average outstanding balance of
$56,590,000
and a weighted average interest rate of
1.2%
for the year ended
December 31, 2014
. The Credit Facility matures
January 2019
, with an option to extend maturity to
January 2020
. As of
December 31, 2014
, the Credit Facility bears interest at
LIBOR plus 92.5
basis points; however, such interest rate may change pursuant to a tiered interest rate structure based on NNN's debt rating. The Credit Facility also includes an
31
accordion feature to increase the facility size up to
$1,000,000,000
. As of
December 31, 2014
, there was
no
outstanding balance and
$650,000,000
was available for future borrowings under the Credit Facility.
In accordance with the terms of the Credit Facility, NNN is required to meet certain restrictive financial covenants, which, among other things, require NNN to maintain certain (i) leverage ratios, (ii) debt service coverage, (iii) cash flow coverage, and (iv) investment limitations. At
December 31, 2014
, NNN was in compliance with those covenants. In the event that NNN violates any of these restrictive financial covenants, it could cause the indebtedness under the Credit Facility to be accelerated and may impair NNN’s access to the debt and equity markets and limit NNN’s ability to pay dividends to its common and preferred stockholders, each of which would likely have a material adverse impact on NNN’s financial condition and results of operations.
Mortgages Payable.
The following table outlines the mortgages payable included in NNN’s consolidated financial statements (dollars in thousands):
|
Entered
(1)
|
Initial Balance
|
Interest
Rate
|
Maturity
(2)
|
Carrying
Value of
Encumbered
Asset(s)
(3)
|
Outstanding Principal
Balance at December 31,
|
|||||||||||||||
|
2014
|
2013
|
|||||||||||||||||||
|
December 2001
|
$
|
623
|
|
9.00%
|
April 2014
|
$
|
—
|
|
$
|
—
|
|
$
|
27
|
|
||||||
|
December 2001
|
698
|
|
9.00%
|
April 2019
|
868
|
|
223
|
|
263
|
|
||||||||||
|
December 2001
|
485
|
|
9.00%
|
April 2019
|
841
|
|
116
|
|
136
|
|
||||||||||
|
February 2004
|
6,952
|
|
6.90%
|
January 2017
|
10,554
|
|
1,577
|
|
2,257
|
|
||||||||||
|
March 2005
|
1,015
|
|
8.14%
|
September 2016
|
1,245
|
|
222
|
|
335
|
|
||||||||||
|
June 2012
(4)
|
6,850
|
|
5.75%
|
April 2016
|
8,529
|
|
6,180
|
|
6,457
|
|
||||||||||
|
September 2014
(4)
|
2,957
|
|
6.40%
|
February 2017
|
3,797
|
|
2,922
|
|
—
|
|
||||||||||
|
November 2014
(4)
|
15,151
|
|
5.23%
|
July 2023
|
22,376
|
|
15,099
|
|
—
|
|
||||||||||
|
$
|
48,210
|
|
$
|
26,339
|
|
$
|
9,475
|
|
||||||||||||
|
(1)
|
Date entered represents the date that NNN acquired real estate subject to a mortgage securing a loan.
|
|
(2)
|
Monthly payments include interest and principal, if any; the balance is due at maturity.
|
|
(3)
|
Each loan is secured by a first mortgage lien on certain of the Properties. The carrying values of the assets are as of
December 31, 2014
.
|
|
(4)
|
Initial balance and outstanding principal balance includes unamortized premium.
|
32
Notes Payable.
Each of NNN’s outstanding series of non-convertible notes is summarized in the table below (dollars in thousands):
|
Notes
(1)
|
Issue Date
|
Principal
|
Discount
(2)
|
Net
Price
|
Stated
Rate
|
Effective
Rate
(3)
|
Maturity
Date
|
|||||||||||||
|
2015
(7)
|
November 2005
|
$
|
150,000
|
|
$
|
390
|
|
$
|
149,610
|
|
6.150%
|
6.185%
|
December 2015
|
|||||||
|
2017
(4)
|
September 2007
|
250,000
|
|
877
|
|
249,123
|
|
6.875%
|
6.924%
|
October 2017
|
||||||||||
|
2021
(5)
|
July 2011
|
300,000
|
|
4,269
|
|
295,731
|
|
5.500%
|
5.690%
|
July 2021
|
||||||||||
|
2022
|
August 2012
|
325,000
|
|
4,989
|
|
320,011
|
|
3.800%
|
3.984%
|
October 2022
|
||||||||||
|
2023
(6)
|
April 2013
|
350,000
|
|
2,594
|
|
347,406
|
|
3.300%
|
3.388%
|
April 2023
|
||||||||||
|
2024
(8)
|
May 2014
|
350,000
|
|
707
|
|
349,293
|
|
3.900%
|
3.924%
|
June 2024
|
||||||||||
|
(1)
|
The proceeds from the note issuance were used to pay down outstanding indebtedness of NNN’s Credit Facility.
|
|
(2)
|
The note discounts are amortized to interest expense over the respective term of each debt obligation using the effective interest method.
|
|
(3)
|
Includes the effects of the discount, treasury lock gain/loss and swap gain/loss, as applicable.
|
|
(4)
|
NNN entered into an interest rate hedge with a notional amount of $100,000. Upon issuance of the 2017 Notes, NNN terminated the interest rate hedge agreement resulting in a liability of $3,260, of which $3,228 was recorded to other comprehensive income. The liability has been deferred and is being amortized as an adjustment to interest expense over the term of the 2017 Notes using the effective interest method.
|
|
(5)
|
NNN entered into two interest rate hedges with a total notional amount of $150,000. Upon issuance of the 2021 Notes, NNN terminated the interest rate hedge agreements resulting in a liability of $5,300, of which $5,218 was deferred in other comprehensive income. The deferred liability is being amortized over the term of the 2021 Notes using the effective interest method.
|
|
(6)
|
NNN entered into four forward starting swaps with an aggregate notional amount of
$240,000
. Upon issuance of the 2023 Notes, NNN terminated the forward starting swaps resulting in a liability of
$3,156
, of which
$3,141
was deferred in other comprehensive income. The deferred liability is being amortized over the term of the note using the effective interest method.
|
|
(7)
|
NNN plans to use proceeds from the Credit Facility and/or potential debt or equity offerings to repay the outstanding indebtedness.
|
|
(8)
|
NNN entered into three forward starting swaps with an aggregate notional amount of
$225,000
. Upon issuance of the 2024 Notes, NNN terminated the forward starting swaps resulting in a liability of
$6,312
, which was deferred in other comprehensive income. The deferred liability is being amortized over the term of the note using the effective interest method.
|
Each series of notes represents senior, unsecured obligations of NNN and is subordinated to all secured indebtedness of NNN. The notes are redeemable at the option of NNN, in whole or in part, at a redemption price equal to the sum of (i) the principal amount of the notes being redeemed plus accrued and unpaid interest thereon through the redemption date, and (ii) the make-whole amount, if any, as defined in the applicable supplemental indenture relating to the notes.
In connection with the note offerings, NNN incurred debt issuance costs totaling
$15,500,000
consisting primarily of underwriting discounts and commissions, legal and accounting fees, rating agency fees and printing expenses. Debt issuance costs for all note issuances have been deferred and are being amortized over the term of the respective notes using the effective interest method.
In accordance with the terms of the indentures, pursuant to which NNN’s notes have been issued, NNN is required to meet certain restrictive financial covenants, which, among other things, require NNN to maintain (i) certain leverage ratios, and (ii) certain interest coverage. At
December 31, 2014
, NNN was in compliance with those covenants. NNN’s failure to comply with certain of its debt covenants could result in defaults that accelerate the payment under such debt and limit the dividends paid to NNN’s common and preferred stockholders which would likely have a material adverse impact on NNN’s financial condition and results of operations. In addition, these defaults could impair its access to the debt and equity markets.
In
June 2014
, NNN repaid the
$150,000,000
6.250%
notes payable that were due in
June 2014
.
Debt and Equity Securities
NNN has used, and expects to use in the future, issuances of debt and equity securities primarily to pay down its outstanding indebtedness and to finance investment acquisitions. In February 2012, NNN filed a shelf registration statement with the Securities and Exchange Commission (the “Commission”) which was automatically effective and permits the issuance by NNN of an indeterminate amount of debt and equity securities.
A description of NNN’s outstanding series of publicly held notes is found under “Debt – Notes Payable” above.
33
NNN completed the following underwritten public offerings of cumulative redeemable preferred stock that are still outstanding ("Preferred Stock Shares") (dollars in thousands, except per share data):
|
Series
|
Dividend Rate
(1)
|
Issued
|
Depositary Shares Outstanding
(2)
|
Gross Proceeds
|
Stock Issuance Costs
(3)
|
Dividend Per Depositary Share
|
Earliest Redemption Date
(4)
|
|||||||||||||||
|
Series D
(5)
|
6.625
|
%
|
February 2012
|
11,500,000
|
|
$
|
287,500
|
|
$
|
9,855
|
|
$
|
1.656250
|
|
February 2017
|
|||||||
|
Series E
(6)
|
5.700
|
%
|
May 2013
|
11,500,000
|
|
287,500
|
|
9,856
|
|
1.425000
|
|
May 2018
|
||||||||||
|
(1)
|
Holders are entitled to receive, when and as authorized by the Board of Directors, cumulative preferential cash dividends.
|
|
(2)
|
Representing 1/100th of a preferred share. Each issuance included 1,500,000 depositary shares in connection with the underwriters' over-allotment.
|
|
(3)
|
Consisting primarily of underwriting commissions and fees, rating agency fees, legal and accounting fees and printing expenses.
|
|
(4)
|
NNN may redeem the preferred stock underlying the depositary shares at a redemption price of $2,500.00 per share (or $25.00 per depositary share), plus all accumulated and unpaid dividends.
|
|
(5)
|
NNN used the net proceeds to redeem the 7.375% Series C Cumulative Redeemable Preferred Stock for an aggregate redemption price of $92,000, excluding accumulated dividends of $283. NNN used the remainder of the net proceeds for general corporate purposes, including repaying outstanding indebtedness under its Credit Facility.
|
|
(6)
|
NNN used the net proceeds from the offering for general corporate purposes and funding property acquisitions.
|
The Preferred Stock Shares underlying the depositary shares rank senior to NNN’s common stock with respect to dividend rights and rights upon liquidation, dissolution or winding up of NNN. The Preferred Stock Shares have no maturity date and will remain outstanding unless redeemed. In addition, upon a change of control, as defined in the articles supplementary fixing the rights and preferences of the Preferred Stock Shares, NNN may redeem the Preferred Stock Shares underlying the depositary shares at a redemption price of
$2,500.00
per share (or
$25.00
per depositary share), plus all accumulated and unpaid dividends, and in limited circumstances the holders of depositary shares may convert some or all of their Preferred Stock Shares into shares of NNN's common stock at conversion rates provided in the related articles supplementary. As of
February 20, 2015
, the Preferred Stock Shares were not redeemable or convertible.
Common Stock Issuances.
In November 2014, NNN filed a prospectus supplement to the prospectus contained in its February 2012 shelf registration statement and issued
5,462,500
shares (including
712,500
shares in connection with the underwriters' over-allotment) of common stock at a price of
$38.16
per share and received net proceeds of
$199,961,000
. In connection with this offering, NNN incurred stock issuance costs totaling approximately
$8,488,000
, consisting primarily of underwriters' fees and commissions, legal and accounting fees and printing expenses. The Company used the net proceeds from this offering to repay outstanding indebtedness under the Credit Facility, to fund property acquisitions and for general corporate purposes.
In May 2012, NNN established an ATM equity program ("2012 ATM") which allows NNN to sell up to an aggregate of 9,000,000 shares of common stock from time to time through May 2015, of which 8,958,840 have been issued as of December 31, 2014. The 2012 ATM will expire in accordance with its terms in May 2015. NNN used the net proceeds from the 2012 ATM to repay outstanding indebtedness under the Credit Facility, to finance NNN's potential development and acquisition activities and for other general corporate purposes. The following table outlines the common stock issuances pursuant to the 2012 ATM for the year ended December 31 (dollars in thousands, except per share data):
|
2013
|
2012
|
||||||
|
Shares of common stock
|
4,676,542
|
|
4,282,298
|
|
|||
|
Average price per share (net)
|
$
|
32.60
|
|
$
|
29.64
|
|
|
|
Net proceeds
|
152,435
|
|
126,947
|
|
|||
|
Stock issuance costs
(1)
|
2,161
|
|
2,145
|
|
|||
(1)
Stock issuance costs consist primarily of underwriters' fees and commissions, and legal and accounting fees.
34
There were no common stock issuances pursuant to the 2012 ATM for the year ended December 31, 2014.
In March 2013, NNN established a second ATM equity program ("2013 ATM") which allows NNN to sell up to an aggregate of 9,000,000 shares of common stock from time to time through March 2015, of which
6,038,812
have been issued as of December 31, 2014. The 2013 ATM will expire in accordance with its terms in March 2015. NNN used the net proceeds from the 2013 ATM to repay outstanding indebtedness under the Credit Facility, to finance NNN's potential development and acquisition activities and for other general corporate purposes. The following table outlines the common stock issuances pursuant to the 2013 ATM for the year ended December 31 (dollars in thousands, except per share data):
|
2014
|
2013
|
||||||
|
Shares of common stock
|
3,758,362
|
|
2,280,450
|
|
|||
|
Average price per share (net)
|
$
|
35.90
|
|
$
|
37.80
|
|
|
|
Net proceeds
|
134,919
|
|
86,208
|
|
|||
|
Stock issuance costs
(1)
|
2,195
|
|
1,613
|
|
|||
(1)
Stock issuance costs consist primarily of underwriters' fees and commissions, and legal and accounting fees.
Dividend Reinvestment and Stock Purchase Plan.
In February 2012, NNN filed a shelf registration statement which was automatically effective, with the Commission for its DRIP, which permits the issuance by NNN of 16,000,000 shares of common stock. NNN’s DRIP provides an economical and convenient way for current stockholders and other interested new investors to invest in NNN’s common stock. The following outlines the common stock issuances pursuant to NNN’s DRIP for the year ended December 31 (dollars in thousands):
|
2014
|
2013
|
2012
|
|||||||||
|
Shares of common stock
|
422,406
|
|
764,891
|
|
2,101,644
|
|
|||||
|
Net proceeds
|
$
|
14,817
|
|
$
|
25,407
|
|
$
|
56,102
|
|
||
The proceeds from the issuances were used to pay down outstanding indebtedness under NNN’s Credit Facility.
Mortgages and Notes Receivable
Mortgage notes are secured by real estate, real estate securities or other assets. Mortgages and notes receivable consisted of the following at December 31 (dollars in thousands):
|
2014
|
2013
|
||||||
|
Mortgages and notes receivable
|
$
|
10,974
|
|
$
|
16,942
|
|
|
|
Accrued interest receivable
|
101
|
|
177
|
|
|||
|
$
|
11,075
|
|
$
|
17,119
|
|
||
Commercial Mortgage Residual Interests
NNN holds the commercial mortgage residual interests (“Residuals”) from
seven
securitizations. Each of the Residuals is recorded at fair value. Unrealized gains and losses are reported as other comprehensive income in stockholders’ equity and other than temporary losses as a result of a change in the timing or amount of estimated cash flows are recorded as an other than temporary valuation impairment.
The following table summarizes the recognition of unrealized gains and/or losses recorded as other comprehensive income as well as other than temporary valuation impairment as of
December 31
(dollars in thousands):
|
2014
|
2013
|
2012
|
|||||||||
|
Unrealized gains
|
$
|
875
|
|
$
|
511
|
|
$
|
1,132
|
|
||
|
Other than temporary valuation impairment
|
256
|
|
1,185
|
|
2,812
|
|
|||||
35
Based on the expected timing of future cash flows relating to the Residuals certain valuation assumptions are made. During the years ended December 31,
2014
,
2013
and
2012
, NNN recorded an other than temporary valuation adjustment as a reduction of earnings from operations. The following table summarizes the key assumptions used in determining the value of the Residuals as of
December 31
:
|
2014
|
2013
|
||||
|
Discount rate
|
20
|
%
|
20
|
%
|
|
|
Average life equivalent CPR
(1)
speeds range
|
0.87% to 26.30% CPR
|
|
0.80% to 20.76% CPR
|
|
|
|
Foreclosures:
|
|||||
|
Frequency curve default model
|
0.70% - 2.45% range
|
|
0.07% - 2.43% range
|
|
|
|
Loss severity of loans in foreclosure
|
20
|
%
|
20
|
%
|
|
|
Yield:
|
|||||
|
LIBOR
|
Forward 3-month curve
|
|
Forward 3-month curve
|
|
|
|
Prime
|
Forward curve
|
|
Forward curve
|
|
|
|
(1)
|
Conditional prepayment rate
|
36
Item7A.
Quantitative and Qualitative Disclosures About Market Risk
NNN is exposed to interest rate risk primarily as a result of its variable rate Credit Facility and its fixed rate debt which is used to finance NNN’s development and acquisition activities, as well as for general corporate purposes. NNN’s interest rate risk management objective is to limit the impact of interest rate changes on earnings and cash flows and to lower its overall borrowing costs. To achieve its objectives, NNN borrows at both fixed and variable rates on its long-term debt. As of
December 31, 2014
, NNN had no outstanding derivatives.
The information in the table below summarizes NNN’s market risks associated with its debt obligations outstanding as of
December 31, 2014
and
2013
. The table presents principal payments and related interest rates by year for debt obligations outstanding as of
December 31, 2014
. NNN has a variable interest rate risk on its Credit Facility which had no outstanding balance as of December 31, 2014. The weighted average rate for the Credit Facility for the year ended December 31, 2014, was
1.2%
. The fair value of the Credit Facility as of December 31, 2014 and 2013 was $0 and $46,400,000, respectively. The table incorporates only those debt obligations that existed as of
December 31, 2014
, and it does not consider those debt obligations or positions which could arise after this date. Moreover, because firm commitments are not presented in the table below, the information presented therein has limited predictive value. As a result, NNN’s ultimate realized gain or loss with respect to interest rate fluctuations will depend on the exposures that arise during the period, NNN’s hedging strategies at that time and interest rates. If interest rates on NNN’s variable rate debt increased by one percent, NNN’s interest expense would have increased by less than one percent for the year ended
December 31, 2014
.
|
Debt Obligations (dollars in thousands)
|
|||||||||||
|
|
Fixed Rate Debt
|
||||||||||
|
|
Mortgages
(1)
|
Unsecured Debt
(2)
|
|||||||||
|
|
Debt
Obligation
|
Weighted
Average
Interest Rate
|
Debt
Obligation
|
Effective
Interest
Rate
(3)
|
|||||||
|
2015
|
$
|
1,870
|
|
6.36%
|
$
|
149,952
|
|
6.19%
|
|||
|
2016
|
7,514
|
|
5.90%
|
—
|
|
—
|
|||||
|
2017
|
3,441
|
|
6.27%
|
249,693
|
|
6.92%
|
|||||
|
2018
|
710
|
|
5.69%
|
—
|
|
—
|
|||||
|
2019
|
688
|
|
5.42%
|
—
|
|
—
|
|||||
|
Thereafter
|
12,116
|
|
5.23%
|
1,315,070
|
|
4.20%
|
|||||
|
Total
|
$
|
26,339
|
|
5.47%
|
$
|
1,714,715
|
|
4.77%
|
|||
|
Fair Value:
|
|||||||||||
|
December 31, 2014
|
$
|
26,339
|
|
$
|
1,813,439
|
|
|||||
|
December 31, 2013
|
$
|
9,475
|
|
$
|
1,555,672
|
|
|||||
|
(1)
|
NNN's mortgages payable include unamortized premiums.
|
|
(2)
|
Includes NNN’s notes payable net of unamortized discounts. NNN uses market prices quoted from Bloomberg, a third party, which is a Level 1 input, to determine the fair value.
|
|
(3)
|
Weighted average effective interest rate for periods after 2019.
|
NNN is also exposed to market risks related to NNN’s Residuals. Factors that may impact the market value of the Residuals include delinquencies, loan losses, prepayment speeds and interest rates. The Residuals, which are reported at market value, had a carrying value of
$11,626,000
and
$11,721,000
as of
December 31, 2014
and
2013
, respectively. Unrealized gains and losses are reported as other comprehensive income in stockholders’ equity. Losses are considered other than temporary and reported as a valuation impairment in earnings from operations if and when there has been a change in the timing or amount of estimated cash flows that leads to a loss in value.
37
Report of Independent Registered Public Accounting Firm
The Board of Directors and Stockholders of National Retail Properties, Inc. and Subsidiaries
We have audited National Retail Properties, Inc. and Subsidiaries’ internal control over financial reporting as of
December 31, 2014
, based on criteria established in Internal Control-Integrated Framework issued by the Committee of Sponsoring Organizations of the Treadway Commission (2013 framework). National Retail Properties, Inc. and Subsidiaries’ management is responsible for maintaining effective internal control over financial reporting, and for its assessment of the effectiveness of internal control over financial reporting included in the accompanying Management’s Report on Internal Control over Financial Reporting. Our responsibility is to express an opinion on the company’s internal control over financial reporting based on our audit.
We conducted our audit in accordance with the standards of the Public Company Accounting Oversight Board (United States). Those standards require that we plan and perform the audit to obtain reasonable assurance about whether effective internal control over financial reporting was maintained in all material respects. Our audit included obtaining an understanding of internal control over financial reporting, assessing the risk that a material weakness exists, testing and evaluating the design and operating effectiveness of internal control based on the assessed risk, and performing such other procedures as we considered necessary in the circumstances. We believe that our audit provides a reasonable basis for our opinion.
A company’s internal control over financial reporting is a process designed to provide reasonable assurance regarding the reliability of financial reporting and the preparation of financial statements for external purposes in accordance with generally accepted accounting principles. A company’s internal control over financial reporting includes those policies and procedures that (1) pertain to the maintenance of records that, in reasonable detail, accurately and fairly reflect the transactions and dispositions of the assets of the company; (2) provide reasonable assurance that transactions are recorded as necessary to permit preparation of financial statements in accordance with generally accepted accounting principles, and that receipts and expenditures of the company are being made only in accordance with authorizations of management and directors of the company; and (3) provide reasonable assurance regarding prevention or timely detection of unauthorized acquisition, use, or disposition of the company’s assets that could have a material effect on the financial statements.
Because of its inherent limitations, internal control over financial reporting may not prevent or detect misstatements. Also, projections of any evaluation of effectiveness to future periods are subject to the risk that controls may become inadequate because of changes in conditions, or that the degree of compliance with the policies or procedures may deteriorate.
In our opinion, National Retail Properties, Inc. and Subsidiaries maintained, in all material respects, effective internal control over financial reporting as of
December 31, 2014
, based on the COSO criteria.
We also have audited, in accordance with the standards of the Public Company Accounting Oversight Board (United States), the consolidated balance sheets of National Retail Properties, Inc. and Subsidiaries as of
December 31, 2014
and
2013
, and the related consolidated statements of income and comprehensive income, equity, and cash flows for each of the three years in the period ended
December 31, 2014
and our report dated
February 20, 2015
expressed an unqualified opinion thereon.
/s/ Ernst & Young LLP
Certified Public Accountants
Orlando, Florida
February 20, 2015
38
Report of Independent Registered Public Accounting Firm
The Board of Directors and Stockholders of National Retail Properties, Inc. and Subsidiaries
We have audited the accompanying consolidated balance sheets of National Retail Properties, Inc. and Subsidiaries as of
December 31, 2014
and
2013
, and the related consolidated statements of income and comprehensive income, equity, and cash flows for each of the three years in the period ended
December 31, 2014
. Our audits also included the financial statement schedules listed in the Index at Item 15(a). These financial statements and schedules are the responsibility of the Company's management. Our responsibility is to express an opinion on these financial statements and schedules based on our audits.
We conducted our audits in accordance with the standards of the Public Company Accounting Oversight Board (United States). Those standards require that we plan and perform the audit to obtain reasonable assurance about whether the financial statements are free of material misstatement. An audit includes examining, on a test basis, evidence supporting the amounts and disclosures in the financial statements. An audit also includes assessing the accounting principles used and significant estimates made by management, as well as evaluating the overall financial statement presentation. We believe that our audits provide a reasonable basis for our opinion.
In our opinion, the financial statements referred to above present fairly, in all material respects, the consolidated financial position of National Retail Properties, Inc. and Subsidiaries at
December 31, 2014
and
2013
, and the consolidated results of their operations and their cash flows for each of the three years in the period ended
December 31, 2014
, in conformity with U.S. generally accepted accounting principles. Also, in our opinion, the related financial statement schedules, when considered in relation to the basic financial statements taken as a whole, present fairly in all material respects the information set forth therein.
As discussed in Note 1 of the consolidated financial statements, the Company changed its method for reporting discontinued operations effective January 1, 2014.
We also have audited, in accordance with the standards of the Public Company Accounting Oversight Board (United States), National Retail Properties, Inc.’s internal control over financial reporting as of
December 31, 2014
, based on criteria established in Internal Control-Integrated Framework issued by the Committee of Sponsoring Organizations of the Treadway Commission (2013 framework) and our report dated
February 20, 2015
expressed an unqualified opinion thereon.
/s/ Ernst & Young LLP
Certified Public Accountants
Orlando, Florida
February 20, 2015
39
NATIONAL RETAIL PROPERTIES, INC.
and SUBSIDIARIES
CONSOLIDATED BALANCE SHEETS
(dollars in thousands, except per share data)
|
ASSETS
|
December 31, 2014
|
December 31, 2013
|
|||||
|
Real estate portfolio:
|
|||||||
|
Accounted for using the operating method, net of accumulated depreciation and amortization
|
$
|
4,717,680
|
|
$
|
4,259,384
|
|
|
|
Accounted for using the direct financing method
|
16,974
|
|
18,342
|
|
|||
|
Real estate held for sale
|
5,395
|
|
9,324
|
|
|||
|
Mortgages, notes and accrued interest receivable
|
11,075
|
|
17,119
|
|
|||
|
Commercial mortgage residual interests
|
11,626
|
|
11,721
|
|
|||
|
Cash and cash equivalents
|
10,604
|
|
1,485
|
|
|||
|
Receivables, net of allowance of $1,784 and $2,822, respectively
|
3,013
|
|
4,107
|
|
|||
|
Accrued rental income, net of allowance of $3,086 and $3,181, respectively
|
25,659
|
|
24,797
|
|
|||
|
Debt costs, net of accumulated amortization of $14,353 and $20,213, respectively
|
16,453
|
|
12,877
|
|
|||
|
Other assets
|
108,235
|
|
95,367
|
|
|||
|
Total assets
|
$
|
4,926,714
|
|
$
|
4,454,523
|
|
|
|
LIABILITIES AND EQUITY
|
|||||||
|
Liabilities:
|
|||||||
|
Line of credit payable
|
$
|
—
|
|
$
|
46,400
|
|
|
|
Mortgages payable, including unamortized premium of $890 and $130, respectively
|
26,339
|
|
9,475
|
|
|||
|
Notes payable, net of unamortized discount of $10,285 and $10,816, respectively
|
1,714,715
|
|
1,514,184
|
|
|||
|
Accrued interest payable
|
17,396
|
|
17,142
|
|
|||
|
Other liabilities
|
85,172
|
|
89,037
|
|
|||
|
Total liabilities
|
1,843,622
|
|
1,676,238
|
|
|||
|
Commitments and contingencies
|
|
|
|
|
|||
|
Equity:
|
|||||||
|
Stockholders’ equity:
|
|||||||
|
Preferred stock, $0.01 par value. Authorized 15,000,000 shares
|
|||||||
|
6.625% Series D, 115,000 shares issued and outstanding, at stated liquidation value of $2,500 per share
|
287,500
|
|
287,500
|
|
|||
|
5.700% Series E, 115,000 shares issued and outstanding, at stated liquidation value of $2,500 per share
|
287,500
|
|
287,500
|
|
|||
|
Common stock, $0.01 par value. Authorized 375,000,000 shares; 132,010,104 and 121,991,677
shares issued and outstanding, respectively
|
1,322
|
|
1,221
|
|
|||
|
Capital in excess of par value
|
2,711,678
|
|
2,353,166
|
|
|||
|
Retained earnings (loss)
|
(196,827
|
)
|
(147,837
|
)
|
|||
|
Accumulated other comprehensive income (loss)
|
(8,658
|
)
|
(4,505
|
)
|
|||
|
Total stockholders’ equity of NNN
|
3,082,515
|
|
2,777,045
|
|
|||
|
Noncontrolling interests
|
577
|
|
1,240
|
|
|||
|
Total equity
|
3,083,092
|
|
2,778,285
|
|
|||
|
Total liabilities and equity
|
$
|
4,926,714
|
|
$
|
4,454,523
|
|
|
See accompanying notes to consolidated financial statements.
40
NATIONAL RETAIL PROPERTIES, INC.
and SUBSIDIARIES
CONSOLIDATED STATEMENTS OF INCOME AND COMPREHENSIVE INCOME
(dollars in thousands, except per share data)
|
|
Year Ended December 31,
|
||||||||||
|
|
2014
|
2013
|
2012
|
||||||||
|
Revenues:
|
|||||||||||
|
Rental income from operating leases
|
$
|
414,043
|
|
$
|
372,913
|
|
$
|
312,629
|
|
||
|
Earned income from direct financing leases
|
1,725
|
|
1,955
|
|
2,119
|
|
|||||
|
Percentage rent
|
1,074
|
|
1,556
|
|
1,165
|
|
|||||
|
Real estate expense reimbursement from tenants
|
13,875
|
|
13,340
|
|
11,817
|
|
|||||
|
Interest and other income from real estate transactions
|
2,296
|
|
1,471
|
|
2,243
|
|
|||||
|
Interest income on commercial mortgage residual interests
|
1,834
|
|
2,290
|
|
2,673
|
|
|||||
|
434,847
|
|
393,525
|
|
332,646
|
|
||||||
|
Retail operations:
|
|||||||||||
|
Revenues
|
—
|
|
—
|
|
19,008
|
|
|||||
|
Operating expenses
|
—
|
|
—
|
|
(18,542
|
)
|
|||||
|
Net
|
—
|
|
—
|
|
466
|
|
|||||
|
Operating expenses:
|
|||||||||||
|
General and administrative
|
32,518
|
|
31,095
|
|
31,828
|
|
|||||
|
Real estate
|
18,905
|
|
18,497
|
|
17,425
|
|
|||||
|
Depreciation and amortization
|
116,162
|
|
99,274
|
|
73,806
|
|
|||||
|
Impairment – commercial mortgage residual interests valuation
|
256
|
|
1,185
|
|
2,812
|
|
|||||
|
Impairment losses and other charges, net of recoveries
|
760
|
|
3,580
|
|
3,899
|
|
|||||
|
168,601
|
|
153,631
|
|
129,770
|
|
||||||
|
Earnings from operations
|
266,246
|
|
239,894
|
|
203,342
|
|
|||||
|
Other expenses (revenues):
|
|||||||||||
|
Interest and other income
|
(357
|
)
|
(1,493
|
)
|
(2,232
|
)
|
|||||
|
Interest expense
|
85,510
|
|
85,822
|
|
83,787
|
|
|||||
|
Real estate acquisition costs
|
1,391
|
|
1,485
|
|
364
|
|
|||||
|
86,544
|
|
85,814
|
|
81,919
|
|
||||||
|
Earnings from continuing operations before income tax benefit (expense) and equity in earnings of unconsolidated affiliate
|
179,702
|
|
154,080
|
|
121,423
|
|
|||||
|
Income tax benefit (expense)
|
75
|
|
(74
|
)
|
6,891
|
|
|||||
|
Equity in earnings of unconsolidated affiliate
|
—
|
|
—
|
|
4,074
|
|
|||||
|
Earnings from continuing operations
|
179,777
|
|
154,006
|
|
132,388
|
|
|||||
|
Earnings from discontinued operations, net of income tax expense
|
124
|
|
5,972
|
|
9,549
|
|
|||||
|
Earnings before gain on disposition of real estate, net of income tax expense
|
179,901
|
|
159,978
|
|
141,937
|
|
|||||
|
Gain on disposition of real estate, net of income tax expense
|
11,269
|
|
107
|
|
—
|
|
|||||
|
Earnings including noncontrolling interests
|
191,170
|
|
160,085
|
|
141,937
|
|
|||||
|
Loss (earnings) attributable to noncontrolling interests:
|
|||||||||||
|
Continuing operations
|
(569
|
)
|
223
|
|
102
|
|
|||||
|
Discontinued operations
|
—
|
|
(163
|
)
|
(24
|
)
|
|||||
|
(569
|
)
|
60
|
|
78
|
|
||||||
|
Net earnings attributable to NNN
|
$
|
190,601
|
|
$
|
160,145
|
|
$
|
142,015
|
|
||
See accompanying notes to consolidated financial statements.
41
NATIONAL RETAIL PROPERTIES, INC.
and SUBSIDIARIES
CONSOLIDATED STATEMENTS OF INCOME AND COMPREHENSIVE INCOME
(dollars in thousands, except per share data)
|
|
Year Ended December 31,
|
||||||||||
|
|
2014
|
2013
|
2012
|
||||||||
|
Net earnings attributable to NNN
|
$
|
190,601
|
|
$
|
160,145
|
|
$
|
142,015
|
|
||
|
Series C preferred stock dividends
|
—
|
|
—
|
|
(1,979
|
)
|
|||||
|
Series D preferred stock dividends
|
(19,047
|
)
|
(19,047
|
)
|
(15,449
|
)
|
|||||
|
Series E preferred stock dividends
|
(16,387
|
)
|
(8,876
|
)
|
—
|
|
|||||
|
Excess of redemption value over carrying value of Series C preferred shares redeemed
|
—
|
|
—
|
|
(3,098
|
)
|
|||||
|
Net earnings attributable to common stockholders
|
$
|
155,167
|
|
$
|
132,222
|
|
$
|
121,489
|
|
||
|
Net earnings per share of common stock:
|
|||||||||||
|
Basic:
|
|||||||||||
|
Continuing operations
|
$
|
1.24
|
|
$
|
1.06
|
|
$
|
1.04
|
|
||
|
Discontinued operations
|
—
|
|
0.05
|
|
0.09
|
|
|||||
|
Net earnings
|
$
|
1.24
|
|
$
|
1.11
|
|
$
|
1.13
|
|
||
|
Diluted:
|
|||||||||||
|
Continuing operations
|
$
|
1.24
|
|
$
|
1.05
|
|
$
|
1.02
|
|
||
|
Discontinued operations
|
—
|
|
0.05
|
|
0.09
|
|
|||||
|
Net earnings
|
$
|
1.24
|
|
$
|
1.10
|
|
$
|
1.11
|
|
||
|
Weighted average number of common shares outstanding:
|
|||||||||||
|
Basic
|
124,257,558
|
|
118,204,148
|
|
106,965,156
|
|
|||||
|
Diluted
|
124,710,226
|
|
119,864,824
|
|
109,117,515
|
|
|||||
|
Other comprehensive income:
|
|||||||||||
|
Net earnings attributable to NNN
|
$
|
190,601
|
|
$
|
160,145
|
|
$
|
142,015
|
|
||
|
Amortization of interest rate hedges
|
1,129
|
|
438
|
|
231
|
|
|||||
|
Fair value forward starting swaps
|
(6,312
|
)
|
(3,141
|
)
|
—
|
|
|||||
|
Net gain (loss) – commercial mortgage residual interests
|
1,038
|
|
(438
|
)
|
1,132
|
|
|||||
|
Net gain (loss) – available-for-sale securities
|
(8
|
)
|
69
|
|
85
|
|
|||||
|
Reclassification of noncontrolling interests
|
—
|
|
949
|
|
—
|
|
|||||
|
Comprehensive income attributable to NNN
|
$
|
186,448
|
|
$
|
158,022
|
|
$
|
143,463
|
|
||
See accompanying notes to consolidated financial statements.
42
NATIONAL RETAIL PROPERTIES, INC.
and SUBSIDIARIES
CONSOLIDATED STATEMENTS OF EQUITY
Years Ended December 31, 2014, 2013 and 2012
(dollars in thousands, except per share data)
|
Series C
Preferred
Stock
|
Series D
Preferred
Stock
|
Series E
Preferred Stock |
Common
Stock
|
Capital in
Excess of
Par Value
|
Retained
Earnings (Loss)
|
Accumulated
Other
Comprehensive
Income (Loss)
|
Total
Stockholders’
Equity
|
Noncontrolling
Interests
|
Total
Equity
|
||||||||||||||||||||||||||||||
|
Balances at December 31, 2011
|
$
|
92,000
|
|
$
|
—
|
|
—
|
|
$
|
1,049
|
|
$
|
1,958,225
|
|
$
|
(44,946
|
)
|
$
|
(3,830
|
)
|
$
|
2,002,498
|
|
$
|
1,378
|
|
$
|
2,003,876
|
|
||||||||||
|
Net earnings
|
—
|
|
—
|
|
—
|
|
—
|
|
—
|
|
142,015
|
|
—
|
|
142,015
|
|
(78
|
)
|
141,937
|
|
|||||||||||||||||||
|
Dividends declared and paid:
|
|
|
|
|
|||||||||||||||||||||||||||||||||||
|
$0.53776 per depositary share of Series C preferred stock
|
—
|
|
—
|
|
—
|
|
—
|
|
—
|
|
(1,979
|
)
|
—
|
|
(1,979
|
)
|
—
|
|
(1,979
|
)
|
|||||||||||||||||||
|
$1.34340 per depositary share of Series D preferred stock
|
—
|
|
—
|
|
—
|
|
—
|
|
—
|
|
(15,449
|
)
|
—
|
|
(15,449
|
)
|
—
|
|
(15,449
|
)
|
|||||||||||||||||||
|
$1.56 per share of common stock
|
—
|
|
—
|
|
—
|
|
4
|
|
11,758
|
|
(167,495
|
)
|
—
|
|
(155,733
|
)
|
—
|
|
(155,733
|
)
|
|||||||||||||||||||
|
Redemption of 3,680,000 depositary shares of Series C Preferred Stock
|
(92,000
|
)
|
—
|
|
—
|
|
—
|
|
3,098
|
|
(3,098
|
)
|
—
|
|
(92,000
|
)
|
—
|
|
(92,000
|
)
|
|||||||||||||||||||
|
Issuance of 11,500,000 depositary shares of Series D Preferred Stock
|
—
|
|
287,500
|
|
—
|
|
—
|
|
(9,855
|
)
|
—
|
|
—
|
|
277,645
|
|
—
|
|
277,645
|
|
|||||||||||||||||||
|
Issuance of common stock:
|
|
|
|
|
|||||||||||||||||||||||||||||||||||
|
40,460 shares
|
—
|
|
—
|
|
—
|
|
—
|
|
833
|
|
—
|
|
—
|
|
833
|
|
—
|
|
833
|
|
|||||||||||||||||||
|
1,689,160 shares – stock purchase program
|
—
|
|
—
|
|
—
|
|
17
|
|
44,395
|
|
—
|
|
—
|
|
44,412
|
|
—
|
|
44,412
|
|
|||||||||||||||||||
|
4,282,298 shares – ATM equity program
|
—
|
|
—
|
|
—
|
|
43
|
|
129,049
|
|
—
|
|
—
|
|
129,092
|
|
—
|
|
129,092
|
|
|||||||||||||||||||
|
Issuance of 373,913 shares of restricted common stock
|
—
|
|
—
|
|
—
|
|
4
|
|
331
|
|
—
|
|
—
|
|
335
|
|
—
|
|
335
|
|
|||||||||||||||||||
|
Equity component of convertible debt
|
—
|
|
—
|
|
—
|
|
—
|
|
(41,486
|
)
|
—
|
|
—
|
|
(41,486
|
)
|
—
|
|
(41,486
|
)
|
|||||||||||||||||||
|
Stock issuance costs
|
—
|
|
—
|
|
—
|
|
—
|
|
(2,265
|
)
|
—
|
|
—
|
|
(2,265
|
)
|
—
|
|
(2,265
|
)
|
|||||||||||||||||||
|
Performance incentive plan
|
—
|
|
—
|
|
—
|
|
—
|
|
(451
|
)
|
—
|
|
—
|
|
(451
|
)
|
—
|
|
(451
|
)
|
|||||||||||||||||||
|
Amortization of deferred compensation
|
—
|
|
—
|
|
—
|
|
—
|
|
7,370
|
|
—
|
|
—
|
|
7,370
|
|
—
|
|
7,370
|
|
|||||||||||||||||||
|
Amortization of interest rate hedges
|
—
|
|
—
|
|
—
|
|
—
|
|
—
|
|
—
|
|
231
|
|
231
|
|
—
|
|
231
|
|
|||||||||||||||||||
|
Unrealized gain – commercial mortgage residual interests
|
—
|
|
—
|
|
—
|
|
—
|
|
—
|
|
—
|
|
1,132
|
|
1,132
|
|
—
|
|
1,132
|
|
|||||||||||||||||||
|
Valuation adjustments – available-for-sale securities
|
—
|
|
—
|
|
—
|
|
—
|
|
—
|
|
—
|
|
85
|
|
85
|
|
—
|
|
85
|
|
|||||||||||||||||||
|
Balances at December 31, 2012
|
$
|
—
|
|
$
|
287,500
|
|
$
|
—
|
|
$
|
1,117
|
|
$
|
2,101,002
|
|
$
|
(90,952
|
)
|
$
|
(2,382
|
)
|
$
|
2,296,285
|
|
$
|
1,300
|
|
$
|
2,297,585
|
|
|||||||||
See accompanying notes to consolidated financial statements.
43
NATIONAL RETAIL PROPERTIES, INC.
and SUBSIDIARIES
CONSOLIDATED STATEMENTS OF EQUITY
Years Ended December 31, 2014, 2013 and 2012
(dollars in thousands, except per share data)
|
Series C
Preferred
Stock
|
Series D
Preferred
Stock
|
Series E
Preferred Stock |
Common
Stock
|
Capital in
Excess of
Par Value
|
Retained
Earnings (Loss)
|
Accumulated
Other
Comprehensive
Income (Loss)
|
Total
Stockholders’
Equity
|
Noncontrolling
Interests
|
Total
Equity
|
||||||||||||||||||||||||||||||
|
Balances at December 31, 2012
|
$
|
—
|
|
$
|
287,500
|
|
$
|
—
|
|
$
|
1,117
|
|
$
|
2,101,002
|
|
$
|
(90,952
|
)
|
$
|
(2,382
|
)
|
$
|
2,296,285
|
|
$
|
1,300
|
|
$
|
2,297,585
|
|
|||||||||
|
Net earnings
|
—
|
|
—
|
|
—
|
|
—
|
|
—
|
|
160,145
|
|
—
|
|
160,145
|
|
(60
|
)
|
160,085
|
|
|||||||||||||||||||
|
Dividends declared and paid:
|
|
|
|
|
|||||||||||||||||||||||||||||||||||
|
$1.65625 per depositary share of Series D preferred stock
|
—
|
|
—
|
|
—
|
|
—
|
|
—
|
|
(19,047
|
)
|
—
|
|
(19,047
|
)
|
—
|
|
(19,047
|
)
|
|||||||||||||||||||
|
$0.77188 per depositary share of Series E preferred stock
|
—
|
|
—
|
|
—
|
|
—
|
|
—
|
|
(8,876
|
)
|
—
|
|
(8,876
|
)
|
—
|
|
(8,876
|
)
|
|||||||||||||||||||
|
$1.60 per share of common stock
|
—
|
|
—
|
|
—
|
|
4
|
|
14,941
|
|
(189,107
|
)
|
—
|
|
(174,162
|
)
|
—
|
|
(174,162
|
)
|
|||||||||||||||||||
|
Issuance of 11,500,000 depositary shares of Series E Preferred Stock
|
—
|
|
—
|
|
287,500
|
|
—
|
|
(9,856
|
)
|
—
|
|
—
|
|
277,644
|
|
—
|
|
277,644
|
|
|||||||||||||||||||
|
Issuance of common stock:
|
|
|
|
|
|||||||||||||||||||||||||||||||||||
|
29,013 shares
|
—
|
|
—
|
|
—
|
|
—
|
|
744
|
|
—
|
|
—
|
|
744
|
|
—
|
|
744
|
|
|||||||||||||||||||
|
322,084 shares – stock purchase program
|
—
|
|
—
|
|
—
|
|
3
|
|
10,458
|
|
—
|
|
—
|
|
10,461
|
|
—
|
|
10,461
|
|
|||||||||||||||||||
|
6,956,992 shares – ATM equity program
|
—
|
|
—
|
|
—
|
|
70
|
|
242,348
|
|
—
|
|
—
|
|
242,418
|
|
—
|
|
242,418
|
|
|||||||||||||||||||
|
2,407,911 shares – conversion of 2028 Notes
|
—
|
|
—
|
|
—
|
|
24
|
|
85,200
|
|
—
|
|
—
|
|
85,224
|
|
—
|
|
85,224
|
|
|||||||||||||||||||
|
Issuance of 290,181 shares of restricted common stock
|
—
|
|
—
|
|
—
|
|
3
|
|
(213
|
)
|
—
|
|
—
|
|
(210
|
)
|
—
|
|
(210
|
)
|
|||||||||||||||||||
|
Equity component of convertible debt
|
—
|
|
—
|
|
—
|
|
—
|
|
(93,450
|
)
|
—
|
|
—
|
|
(93,450
|
)
|
—
|
|
(93,450
|
)
|
|||||||||||||||||||
|
Stock issuance costs
|
—
|
|
—
|
|
—
|
|
—
|
|
(3,774
|
)
|
—
|
|
—
|
|
(3,774
|
)
|
—
|
|
(3,774
|
)
|
|||||||||||||||||||
|
Amortization of deferred compensation
|
—
|
|
—
|
|
—
|
|
—
|
|
6,715
|
|
—
|
|
—
|
|
6,715
|
|
—
|
|
6,715
|
|
|||||||||||||||||||
|
Amortization of interest rate hedges
|
—
|
|
—
|
|
—
|
|
—
|
|
—
|
|
—
|
|
438
|
|
438
|
|
—
|
|
438
|
|
|||||||||||||||||||
|
Fair value forward swaps
|
—
|
|
—
|
|
—
|
|
—
|
|
—
|
|
—
|
|
(3,141
|
)
|
(3,141
|
)
|
—
|
|
(3,141
|
)
|
|||||||||||||||||||
|
Unrealized loss – commercial mortgage residual interests
|
—
|
|
—
|
|
—
|
|
—
|
|
—
|
|
—
|
|
(438
|
)
|
(438
|
)
|
—
|
|
(438
|
)
|
|||||||||||||||||||
|
Valuation adjustments – available-for-sale securities
|
—
|
|
—
|
|
—
|
|
—
|
|
—
|
|
—
|
|
69
|
|
69
|
|
—
|
|
69
|
|
|||||||||||||||||||
|
Noncontrolling interests
|
—
|
|
—
|
|
—
|
|
—
|
|
(949
|
)
|
—
|
|
949
|
|
—
|
|
—
|
|
—
|
|
|||||||||||||||||||
|
Balances at December 31, 2013
|
$
|
—
|
|
$
|
287,500
|
|
$
|
287,500
|
|
$
|
1,221
|
|
$
|
2,353,166
|
|
$
|
(147,837
|
)
|
$
|
(4,505
|
)
|
$
|
2,777,045
|
|
$
|
1,240
|
|
$
|
2,778,285
|
|
|||||||||
See accompanying notes to consolidated financial statements.
44
NATIONAL RETAIL PROPERTIES, INC.
and SUBSIDIARIES
CONSOLIDATED STATEMENTS OF EQUITY
Years Ended December 31, 2014, 2013 and 2012
(dollars in thousands, except per share data)
|
Series C
Preferred
Stock
|
Series D
Preferred
Stock
|
Series E
Preferred Stock |
Common
Stock
|
Capital in
Excess of
Par Value
|
Retained
Earnings (Loss)
|
Accumulated
Other
Comprehensive
Income (Loss)
|
Total
Stockholders’
Equity
|
Noncontrolling
Interests
|
Total
Equity
|
||||||||||||||||||||||||||||||
|
Balances at December 31, 2013
|
$
|
—
|
|
$
|
287,500
|
|
$
|
287,500
|
|
$
|
1,221
|
|
$
|
2,353,166
|
|
$
|
(147,837
|
)
|
$
|
(4,505
|
)
|
$
|
2,777,045
|
|
$
|
1,240
|
|
$
|
2,778,285
|
|
|||||||||
|
Net earnings
|
—
|
|
—
|
|
—
|
|
—
|
|
—
|
|
190,601
|
|
—
|
|
190,601
|
|
569
|
|
191,170
|
|
|||||||||||||||||||
|
Dividends declared and paid:
|
|||||||||||||||||||||||||||||||||||||||
|
$1.65625 per depositary share of Series D preferred stock
|
—
|
|
—
|
|
—
|
|
—
|
|
—
|
|
(19,047
|
)
|
—
|
|
(19,047
|
)
|
—
|
|
(19,047
|
)
|
|||||||||||||||||||
|
$1.42500 per depositary share of Series E preferred stock
|
—
|
|
—
|
|
—
|
|
—
|
|
—
|
|
(16,387
|
)
|
—
|
|
(16,387
|
)
|
—
|
|
(16,387
|
)
|
|||||||||||||||||||
|
$1.65 per share of common stock
|
—
|
|
—
|
|
—
|
|
3
|
|
11,443
|
|
(204,157
|
)
|
—
|
|
(192,711
|
)
|
—
|
|
(192,711
|
)
|
|||||||||||||||||||
|
Issuance of common stock:
|
|||||||||||||||||||||||||||||||||||||||
|
5,493,595 shares
|
—
|
|
—
|
|
—
|
|
55
|
|
209,185
|
|
—
|
|
—
|
|
209,240
|
|
—
|
|
209,240
|
|
|||||||||||||||||||
|
100,161 shares – stock purchase program
|
—
|
|
—
|
|
—
|
|
1
|
|
3,370
|
|
—
|
|
—
|
|
3,371
|
|
—
|
|
3,371
|
|
|||||||||||||||||||
|
3,758,362 shares – ATM equity program
|
—
|
|
—
|
|
—
|
|
38
|
|
137,077
|
|
—
|
|
—
|
|
137,115
|
|
—
|
|
137,115
|
|
|||||||||||||||||||
|
Issuance of 360,080 shares of restricted common stock
|
—
|
|
—
|
|
—
|
|
4
|
|
(313
|
)
|
—
|
|
—
|
|
(309
|
)
|
—
|
|
(309
|
)
|
|||||||||||||||||||
|
Stock issuance costs
|
—
|
|
—
|
|
—
|
|
—
|
|
(10,683
|
)
|
—
|
|
—
|
|
(10,683
|
)
|
—
|
|
(10,683
|
)
|
|||||||||||||||||||
|
Amortization of deferred compensation
|
—
|
|
—
|
|
—
|
|
—
|
|
8,433
|
|
—
|
|
—
|
|
8,433
|
|
—
|
|
8,433
|
|
|||||||||||||||||||
|
Amortization of interest rate hedges
|
—
|
|
—
|
|
—
|
|
—
|
|
—
|
|
—
|
|
1,129
|
|
1,129
|
|
—
|
|
1,129
|
|
|||||||||||||||||||
|
Fair value forward swaps
|
—
|
|
—
|
|
—
|
|
—
|
|
—
|
|
—
|
|
(6,312
|
)
|
(6,312
|
)
|
—
|
|
(6,312
|
)
|
|||||||||||||||||||
|
Unrealized gain – commercial mortgage residual interests
|
—
|
|
—
|
|
—
|
|
—
|
|
—
|
|
—
|
|
875
|
|
875
|
|
—
|
|
875
|
|
|||||||||||||||||||
|
Realized gain – commercial mortgage residual interests
|
—
|
|
—
|
|
—
|
|
—
|
|
—
|
|
—
|
|
163
|
|
163
|
|
—
|
|
163
|
|
|||||||||||||||||||
|
Valuation adjustments – available-for-sale securities
|
—
|
|
—
|
|
—
|
|
—
|
|
—
|
|
—
|
|
111
|
|
111
|
|
—
|
|
111
|
|
|||||||||||||||||||
|
Realized gain – available-for-sale securities
|
—
|
|
—
|
|
—
|
|
—
|
|
—
|
|
—
|
|
(119
|
)
|
(119
|
)
|
—
|
|
(119
|
)
|
|||||||||||||||||||
|
Distributions to noncontrolling interests
|
—
|
|
—
|
|
—
|
|
—
|
|
—
|
|
—
|
|
—
|
|
—
|
|
(1,232
|
)
|
(1,232
|
)
|
|||||||||||||||||||
|
Balances at December 31, 2014
|
$
|
—
|
|
$
|
287,500
|
|
$
|
287,500
|
|
$
|
1,322
|
|
$
|
2,711,678
|
|
$
|
(196,827
|
)
|
$
|
(8,658
|
)
|
$
|
3,082,515
|
|
$
|
577
|
|
$
|
3,083,092
|
|
|||||||||
See accompanying notes to consolidated financial statements.
45
NATIONAL RETAIL PROPERTIES, INC.
and SUBSIDIARIES
CONSOLIDATED STATEMENTS OF CASH FLOWS
(dollars in thousands)
|
|
Year Ended December 31,
|
||||||||||
|
|
2014
|
2013
|
2012
|
||||||||
|
Cash flows from operating activities:
|
|||||||||||
|
Earnings including noncontrolling interests
|
$
|
191,170
|
|
$
|
160,085
|
|
$
|
141,937
|
|
||
|
Adjustments to reconcile net earnings to net cash provided by operating activities:
|
|||||||||||
|
Depreciation and amortization
|
116,165
|
|
99,617
|
|
75,334
|
|
|||||
|
Impairment losses and other charges
|
823
|
|
4,106
|
|
10,114
|
|
|||||
|
Impairment – commercial mortgage residual interests valuation
|
256
|
|
1,185
|
|
2,812
|
|
|||||
|
Amortization of notes payable discount
|
1,238
|
|
3,188
|
|
4,976
|
|
|||||
|
Amortization of debt costs
|
2,782
|
|
3,118
|
|
2,584
|
|
|||||
|
Amortization of mortgages payable premium
|
(93
|
)
|
(57
|
)
|
(29
|
)
|
|||||
|
Amortization of deferred interest rate hedges
|
1,129
|
|
438
|
|
231
|
|
|||||
|
Interest rate hedge payment
|
(6,312
|
)
|
(3,141
|
)
|
—
|
|
|||||
|
Equity in earnings of unconsolidated affiliate
|
—
|
|
—
|
|
(4,074
|
)
|
|||||
|
Distributions received from unconsolidated affiliate
|
—
|
|
—
|
|
7,019
|
|
|||||
|
Gain on disposition of real estate
|
(11,742
|
)
|
(6,445
|
)
|
(10,956
|
)
|
|||||
|
Deferred income taxes
|
58
|
|
800
|
|
(7,034
|
)
|
|||||
|
Performance incentive plan expense
|
9,841
|
|
8,518
|
|
10,136
|
|
|||||
|
Performance incentive plan payment
|
(2,808
|
)
|
(2,138
|
)
|
—
|
|
|||||
|
Change in operating assets and liabilities, net of assets acquired and liabilities assumed in business combinations:
|
|||||||||||
|
Additions to held for sale real estate
|
—
|
|
(1,029
|
)
|
(6,616
|
)
|
|||||
|
Decrease in real estate leased to others using the direct financing method
|
1,368
|
|
1,573
|
|
1,624
|
|
|||||
|
Decrease (increase) in mortgages, notes and accrued interest receivable
|
76
|
|
641
|
|
(187
|
)
|
|||||
|
Decrease (increase) in receivables
|
16
|
|
62
|
|
(264
|
)
|
|||||
|
Decrease (increase) in accrued rental income
|
(1,490
|
)
|
368
|
|
(456
|
)
|
|||||
|
Decrease (increase) in other assets
|
(2,256
|
)
|
400
|
|
1,657
|
|
|||||
|
Increase (decrease) in accrued interest payable
|
254
|
|
(385
|
)
|
2,419
|
|
|||||
|
Increase (decrease) in other liabilities
|
(4,746
|
)
|
3,841
|
|
(2,002
|
)
|
|||||
|
Other
|
1,004
|
|
(324
|
)
|
(1,095
|
)
|
|||||
|
Net cash provided by operating activities
|
296,733
|
|
274,421
|
|
228,130
|
|
|||||
|
Cash flows from investing activities:
|
|||||||||||
|
Proceeds from the disposition of real estate
|
58,853
|
|
60,626
|
|
81,402
|
|
|||||
|
Additions to real estate:
|
|||||||||||
|
Accounted for using the operating method
|
(602,780
|
)
|
(637,417
|
)
|
(684,925
|
)
|
|||||
|
Increase in mortgages and notes receivable
|
(7,246
|
)
|
(3,857
|
)
|
(8,768
|
)
|
|||||
|
Principal payments on mortgages and notes receivable
|
13,346
|
|
14,617
|
|
12,804
|
|
|||||
|
Return of investment from unconsolidated affiliate
|
—
|
|
—
|
|
1,220
|
|
|||||
|
Other
|
(3,731
|
)
|
(2,009
|
)
|
(3,492
|
)
|
|||||
|
Net cash used in investing activities
|
(541,558
|
)
|
(568,040
|
)
|
(601,759
|
)
|
|||||
See accompanying notes to consolidated financial statements.
46
NATIONAL RETAIL PROPERTIES, INC.
and SUBSIDIARIES
CONSOLIDATED STATEMENTS OF CASH FLOWS
(dollars in thousands)
|
|
Year Ended December 31,
|
||||||||||
|
|
2014
|
2013
|
2012
|
||||||||
|
Cash flows from financing activities:
|
|||||||||||
|
Proceeds from line of credit payable
|
$
|
678,500
|
|
$
|
601,800
|
|
$
|
1,184,900
|
|
||
|
Repayment of line of credit payable
|
(724,900
|
)
|
(729,600
|
)
|
(1,076,300
|
)
|
|||||
|
Repayment of mortgages payable
|
(1,151
|
)
|
(1,070
|
)
|
(19,390
|
)
|
|||||
|
Proceeds from notes payable
|
349,293
|
|
347,406
|
|
320,011
|
|
|||||
|
Repayment of notes payable
|
(150,000
|
)
|
—
|
|
(50,000
|
)
|
|||||
|
Repayment of notes payable – convertible
|
—
|
|
(246,797
|
)
|
(164,649
|
)
|
|||||
|
Payment of debt costs
|
(6,321
|
)
|
(3,265
|
)
|
(4,512
|
)
|
|||||
|
Proceeds from issuance of common stock
|
360,072
|
|
267,613
|
|
185,223
|
|
|||||
|
Proceeds from issuance of Series D preferred stock
|
—
|
|
—
|
|
287,500
|
|
|||||
|
Proceeds from issuance of Series E preferred stock
|
—
|
|
287,500
|
|
—
|
|
|||||
|
Redemption of Series C preferred stock
|
—
|
|
—
|
|
(92,000
|
)
|
|||||
|
Payment of Series C Preferred Stock dividends
|
—
|
|
—
|
|
(1,979
|
)
|
|||||
|
Payment of Series D Preferred Stock dividends
|
(19,047
|
)
|
(19,047
|
)
|
(15,449
|
)
|
|||||
|
Payment of Series E Preferred Stock dividends
|
(16,387
|
)
|
(8,876
|
)
|
—
|
|
|||||
|
Stock issuance costs
|
(10,726
|
)
|
(13,529
|
)
|
(12,237
|
)
|
|||||
|
Payment of common stock dividends
|
(204,157
|
)
|
(189,107
|
)
|
(167,495
|
)
|
|||||
|
Noncontrolling interest distributions
|
(1,232
|
)
|
—
|
|
—
|
|
|||||
|
Net cash provided by financing activities
|
253,944
|
|
293,028
|
|
373,623
|
|
|||||
|
Net increase (decrease) in cash and cash equivalents
|
9,119
|
|
(591
|
)
|
(6
|
)
|
|||||
|
Cash and cash equivalents at beginning of year
|
1,485
|
|
2,076
|
|
2,082
|
|
|||||
|
Cash and cash equivalents at end of year
|
$
|
10,604
|
|
$
|
1,485
|
|
$
|
2,076
|
|
||
|
Supplemental disclosure of cash flow information:
|
|||||||||||
|
Interest paid, net of amount capitalized
|
$
|
81,829
|
|
$
|
80,930
|
|
$
|
75,283
|
|
||
|
Taxes paid
|
$
|
59
|
|
$
|
360
|
|
$
|
201
|
|
||
|
Supplemental disclosure of noncash investing and financing activities:
|
|||||||||||
|
Issued 2,407,911 shares of common stock for conversion premium on 2028 Notes
|
$
|
—
|
|
$
|
85,224
|
|
$
|
—
|
|
||
|
Issued 371,434, 298,896 and 398,578 shares of restricted and unrestricted common stock in 2014, 2013 and 2012, respectively, pursuant to NNN’s performance incentive plan
|
$
|
10,357
|
|
$
|
8,218
|
|
$
|
8,638
|
|
||
|
Issued 14,999, 16,605 and 16,078 shares of common stock in 2014, 2013 and 2012, respectively, to directors pursuant to NNN’s performance incentive plan
|
$
|
527
|
|
$
|
582
|
|
$
|
463
|
|
||
|
Issued 16,016, 12,308 and 19,212 shares of common stock in 2014, 2013 and
2012, respectively, pursuant to NNN’s Deferred Director Fee Plan |
$
|
263
|
|
$
|
162
|
|
$
|
298
|
|
||
|
Surrender of 241 and 15,286 shares of restricted common stock in 2013 and 2012, respectively
|
$
|
—
|
|
$
|
7
|
|
$
|
357
|
|
||
|
Change in other comprehensive income
|
$
|
4,153
|
|
$
|
2,123
|
|
$
|
1,448
|
|
||
|
Change in lease classification (direct financing lease to operating lease)
|
$
|
—
|
|
$
|
1,156
|
|
$
|
1,678
|
|
||
|
Mortgages payable assumed in connection with real estate transactions
|
$
|
17,254
|
|
$
|
—
|
|
$
|
6,634
|
|
||
|
Mortgage receivable accepted in connection with real estate transactions
|
$
|
62
|
|
$
|
750
|
|
$
|
—
|
|
||
|
Note receivable accepted in connection with real estate transactions
|
$
|
70
|
|
$
|
—
|
|
$
|
—
|
|
||
|
Real estate acquired in connection with mortgage receivable foreclosure
|
$
|
—
|
|
$
|
—
|
|
$
|
490
|
|
||
|
Real estate received in note receivable foreclosure
|
$
|
—
|
|
$
|
—
|
|
$
|
1,595
|
|
||
See accompanying notes to consolidated financial statements.
47
NATIONAL RETAIL PROPERTIES, INC.
and SUBSIDIARIES
NOTES TO CONSOLIDATED FINANCIAL STATEMENTS
Years Ended December 31, 2014, 2013 and 2012
Organization and Nature of Business
– National Retail Properties, Inc., a Maryland corporation, is a fully integrated real estate investment trust (“REIT”) formed in 1984. The term “NNN” or the “Company” refers to National Retail Properties, Inc. and all of its consolidated subsidiaries. NNN has elected to treat certain subsidiaries as taxable REIT subsidiaries. These taxable subsidiaries and their majority owned and controlled subsidiaries are collectively referred to as the “TRS.”
NNN assets include: real estate assets, mortgages and notes receivable, and commercial mortgage residual interests. NNN acquires, owns, invests in and develops properties that are leased primarily to retail tenants under long-term net leases and primarily held for investment (“Properties” or “Property Portfolio” or individually a "Property").
|
|
December 31, 2014
|
|
|
Property Portfolio:
|
||
|
Total properties
|
2,054
|
|
|
Gross leasable area (square feet)
|
22,479,000
|
|
|
States
|
47
|
|
|
Weighted average remaining lease term (years)
|
12
|
|
NNN's operations are reported within
one
business segment in the financial statements and all properties are considered part of the Properties or Property Portfolio. As such, property counts and calculations involving property counts reflect all NNN properties.
Principles of Consolidation
– NNN’s consolidated financial statements include the accounts of each of the respective majority owned and controlled affiliates, including transactions whereby NNN has been determined to be the primary beneficiary in accordance with the Financial Accounting Standards Board (“FASB”) guidance included in
Consolidation.
All significant intercompany account balances and transactions have been eliminated. NNN applies the equity method of accounting to investments in partnerships and joint ventures that are not subject to control by NNN due to the significance of rights held by other parties.
NNN consolidates certain joint venture development entities based upon either NNN being the primary beneficiary of the respective variable interest entity or NNN having a controlling interest over the respective entity. NNN eliminates significant intercompany balances and transactions and records a noncontrolling interest for its other partners’ ownership percentage.
Real Estate Portfolio
– NNN records the acquisition of real estate at cost, including acquisition and closing costs. The cost of properties developed by NNN includes direct and indirect costs of construction, property taxes, interest and other miscellaneous costs incurred during the development period until the project is substantially complete and available for occupancy. For the years ended December 31, 2014, 2013 and 2012, NNN recorded
$1,629,000
,
$1,369,000
and
$1,540,000
, respectively, in capitalized interest during development.
Purchase Accounting for Acquisition of Real Estate Subject to a Lease
– In accordance with the FASB guidance on business combinations, the fair value of the real estate acquired with in-place leases is allocated to the acquired tangible assets, consisting of land, building and tenant improvements, and identified intangible assets and liabilities, consisting of the value of above-market and below-market leases and the value of in-place leases, based in each case on their fair values. Acquisition and closing costs incurred on the acquisition of real estate with an in-place lease is expensed as incurred and recorded as real estate acquisition costs.
The fair value of the tangible assets of an acquired leased property is determined by valuing the property as if it were vacant, and the “as-if-vacant” value is then allocated to land, building and tenant improvements based on the determination of the fair values of these assets.
In allocating the fair value of the identified intangible assets and liabilities of an acquired property, above-market and below-market in-place lease values are recorded as other assets or liabilities based on the present value (using an interest rate which reflects the risks associated with the leases acquired) of the difference between (i) the contractual amounts to be paid pursuant to the in-place leases, and (ii) management’s estimate of fair market lease rates for the corresponding in-place leases, measured
48
over a period equal to the remaining term of the lease, including the probability of renewal periods. The capitalized above-market lease values are amortized as a reduction of rental income over the remaining terms of the respective leases. The capitalized below-market lease values are amortized as an increase to rental income over the initial term unless the Company believes that it is likely that the tenant will renew the option whereby the Company amortizes the value attributable to the renewal over the renewal period.
The aggregate value of other acquired intangible assets, consisting of in-place leases, is measured by the excess of (i) the purchase price paid for a property after adjusting existing in-place leases to market rental rates over (ii) the estimated fair value of the property as-if-vacant, determined as set forth above. The value of in-place leases exclusive of the value of above-market and below-market in-place leases is amortized to expense over the remaining non-cancelable periods of the respective leases. If a lease were to be terminated prior to its stated expiration, all unamortized amounts relating to that lease would be written off. The value of tenant relationships is reviewed on individual transactions to determine if future value was derived from the acquisition.
Intangible assets and liabilities consisted of the following as of December 31 (in thousands):
|
2014
|
2013
|
|||||||
|
Intangible lease assets (included in Other assets):
|
||||||||
|
Value of above market in-place leases, net
|
$
|
11,751
|
|
$
|
11,803
|
|
||
|
Value of in-place leases, net
|
65,770
|
|
58,456
|
|
||||
|
Intangible lease liabilities (included in Other liabilities):
|
||||||||
|
Value of below market in-place leases, net
|
29,162
|
|
28,708
|
|
||||
NNN's real estate is generally leased to tenants on a net lease basis, whereby the tenant is responsible for all operating expenses relating to the Property, including property taxes, insurance, maintenance, repairs and capital expenditures. The leases are accounted for using either the operating or the direct financing method. Such methods are described below:
Operating method
– Properties with leases accounted for using the operating method are recorded at the cost of the real estate. Revenue is recognized as rentals are earned and expenses (including depreciation) are charged to operations as incurred. Buildings are depreciated on the straight-line method over their estimated useful lives. Leasehold interests are amortized on the straight-line method over the terms of their respective leases. When scheduled rentals vary during the lease term, income is recognized on a straight-line basis so as to produce a constant periodic rent over the term of the lease. Accrued rental income is the aggregate difference between the scheduled rents which vary during the lease term and the income recognized on a straight-line basis.
Direct financing method
– Properties with leases accounted for using the direct financing method are recorded at their net investment (which at the inception of the lease generally represents the cost of the Property). Unearned income is deferred and amortized into income over the lease terms so as to produce a constant periodic rate of return on NNN’s net investment in the leases.
Real Estate – Held For Sale
– Real estate held for sale is not depreciated and is recorded at the lower of cost or fair value, less cost to sell.
Impairment – Real Estate
– Based upon certain events or changes in circumstances, management periodically assesses its Property Portfolio for possible impairment whenever the carrying value of the asset, including accrued rental income, may not be recoverable through operations. Events or circumstances that may occur include significant changes in real estate market conditions and the ability of NNN to re-lease or sell properties that are currently vacant or become vacant. Management evaluates whether an impairment in carrying value has occurred by comparing the estimated future cash flows (undiscounted and without interest charges), including the residual value of the real estate, with the carrying value of the individual asset. If an impairment is indicated, a loss will be recorded for the amount by which the carrying value of the asset exceeds its estimated fair value.
Real Estate Dispositions
– When real estate is disposed of, the related cost, accumulated depreciation or amortization and any accrued rental income for operating leases and the net investment for direct financing leases are removed from the accounts, and gains and losses from the dispositions are reflected in income. Gains from the disposition of real estate are generally recognized using the full accrual method in accordance with the FASB guidance included in
Real Estate Sales
, provided that various criteria relating to the terms of the sale and any subsequent involvement by NNN with the real estate sold are met. Lease termination fees are recognized when the related leases are cancelled and NNN no longer has a continuing involvement with the former tenant.
49
Valuation of Mortgages, Notes and Accrued Interest
– The reserve allowance related to the mortgages, notes and accrued interest is NNN’s best estimate of the amount of probable credit losses. The reserve allowance is determined on an individual note basis in reviewing any payment past due for over 90 days. Any outstanding amounts are written off against the reserve allowance when all possible means of collection have been exhausted.
Investment in an Unconsolidated Affiliate
– NNN accounted for its investment in an unconsolidated affiliate under the equity method of accounting. In September 2007, NNN entered into a joint venture, NNN Retail Properties Fund I LLC (the “NNN Crow JV”) with an affiliate of Crow Holdings Realty Partners IV, L.P., which is accounted for under the equity method of accounting. During September 2012, NNN Crow JV sold all of its assets and paid off its bank term loan as of December 31, 2012. NNN Crow JV was formally dissolved in April 2013.
Commercial Mortgage Residual Interests, at Fair Value
– Commercial mortgage residual interests, classified as available for sale, are reported at their estimated market values with unrealized gains and losses reported as other comprehensive income in stockholders’ equity. NNN recognizes the excess of all cash flows attributable to the commercial mortgage residual interests estimated at the acquisition/transaction date over the initial investment (the accretable yield) as interest income over the life of the beneficial interest using the effective yield method. Losses are considered other than temporary valuation impairments if and when there has been a change in the timing or amount of estimated cash flows, exclusive of changes in interest rates, that leads to a loss in value.
Cash and Cash Equivalents
– NNN considers all highly liquid investments with a maturity of three months or less when purchased to be cash equivalents. Cash and cash equivalents consist of cash and money market accounts. Cash equivalents are stated at cost plus accrued interest, which approximates fair value.
Cash accounts maintained on behalf of NNN in demand deposits at commercial banks and money market funds may exceed federally insured levels or may be held in accounts without any federal insurance or any other insurance or guarantee. However, NNN has not experienced any losses in such accounts.
Valuation of Receivables
– NNN estimates the collectibility of its accounts receivable related to rents, expense reimbursements and other revenues. NNN analyzes accounts receivable and historical bad debt levels, tenant credit-worthiness and current economic trends when evaluating the adequacy of the allowance for doubtful accounts. In addition, tenants in bankruptcy are analyzed and estimates are made in connection with the expected recovery of pre-petition and post-petition claims.
Debt Costs
– Debt costs incurred in connection with NNN’s
$650,000,000
line of credit and mortgages payable have been deferred and are being amortized over the term of the respective loan commitment using the straight-line method, which approximates the effective interest method. Debt costs incurred in connection with the issuance of NNN’s notes payable have been deferred and are being amortized to interest expense over the term of the respective debt obligation using the effective interest method.
Revenue Recognition
– Rental revenues for properties under construction commence upon completion of construction of the leased asset and delivery of the leased asset to the tenant. Rental revenues for non-development real estate assets are recognized when earned in accordance with the FASB guidance included in
Leases,
based on the terms of the lease of the leased asset.
50
Earnings Per Share
– Earnings per share have been computed pursuant to the FASB guidance included in
Earnings Per Share
. The guidance requires classification of the Company’s unvested restricted share units which contain rights to receive nonforfeitable dividends, as participating securities requiring the two-class method of computing earnings per share. Under the two-class method, earnings per common share are computed by dividing the sum of distributed earnings to common stockholders and undistributed earnings allocated to common stockholders by the weighted average number of common shares outstanding for the period. In applying the two-class method, undistributed earnings are allocated to both common shares and participating securities based on the weighted average shares outstanding during the period. The following table is a reconciliation of the numerator and denominator used in the computation of basic and diluted earnings per common share using the two-class method for the years ended
December 31
(dollars in thousands):
|
2014
|
2013
|
2012
|
|||||||||
|
Basic and Diluted Earnings:
|
|||||||||||
|
Net earnings attributable to NNN
|
$
|
190,601
|
|
$
|
160,145
|
|
$
|
142,015
|
|
||
|
Less: Series C preferred stock dividends
|
—
|
|
—
|
|
(1,979
|
)
|
|||||
|
Less: Series D preferred stock dividends
|
(19,047
|
)
|
(19,047
|
)
|
(15,449
|
)
|
|||||
|
Less: Series E preferred stock dividends
|
(16,387
|
)
|
(8,876
|
)
|
—
|
|
|||||
|
Less: Excess of redemption value over carrying value of Series C preferred shares redeemed
|
—
|
|
—
|
|
(3,098
|
)
|
|||||
|
Net earnings attributable to common stockholders
|
155,167
|
|
132,222
|
|
121,489
|
|
|||||
|
Less: Earnings attributable to unvested restricted shares
|
(773
|
)
|
(718
|
)
|
(741
|
)
|
|||||
|
Net earnings used in basic and diluted earnings per share
|
$
|
154,394
|
|
$
|
131,504
|
|
$
|
120,748
|
|
||
|
Basic and Diluted Weighted Average Shares Outstanding:
|
|||||||||||
|
Weighted average number of shares outstanding
|
125,221,358
|
|
118,969,771
|
|
107,873,577
|
|
|||||
|
Less: Unvested restricted shares
|
(467,968
|
)
|
(448,590
|
)
|
(654,127
|
)
|
|||||
|
Less: Unvested contingent shares
|
(495,832
|
)
|
(317,033
|
)
|
(254,294
|
)
|
|||||
|
Weighted average number of shares outstanding used in basic earnings per share
|
124,257,558
|
|
118,204,148
|
|
106,965,156
|
|
|||||
|
Effects of dilutive securities:
|
|||||||||||
|
Convertible debt
|
—
|
|
1,468,559
|
|
1,987,842
|
|
|||||
|
Other
|
452,668
|
|
192,117
|
|
164,517
|
|
|||||
|
Weighted average number of shares outstanding used in diluted earnings per share
|
124,710,226
|
|
119,864,824
|
|
109,117,515
|
|
|||||
Income Taxes
– NNN has made an election to be taxed as a REIT under Sections 856 through 860 of the Internal Revenue Code of 1986, as amended (the “Code”), and related regulations. NNN generally will not be subject to federal income taxes on amounts distributed to stockholders, providing it distributes 100 percent of its REIT taxable income and meets certain other requirements for qualifying as a REIT. For each of the years in the
three
-year period ended
December 31, 2014
, NNN believes it has qualified as a REIT. Notwithstanding NNN’s qualification for taxation as a REIT, NNN is subject to certain state taxes on its income and real estate.
NNN and its taxable REIT subsidiaries have made timely TRS elections pursuant to the provisions of the REIT Modernization Act. A taxable REIT subsidiary is able to engage in activities resulting in income that previously would have been disqualified from being eligible REIT income under the federal income tax regulations. As a result, certain activities of NNN which occur within its TRS entities are subject to federal and state income taxes (See Note 13). All provisions for federal income taxes in the accompanying consolidated financial statements are attributable to NNN’s taxable REIT subsidiaries and to the Orange Avenue Mortgage Investments, Inc. ("OAMI"), a majority owned and controlled subsidiary, built-in-gain tax liability.
Income taxes are accounted for under the asset and liability method as required by the FASB guidance included in
Income Taxes
. Deferred tax assets and liabilities are recognized for the temporary differences based on estimated future tax consequences attributable to differences between the financial statement carrying amounts of existing assets and liabilities and their respective tax bases and operating loss and tax credit carryforwards. Deferred tax assets and liabilities are measured using enacted tax rates in effect for the year in which those temporary differences are expected to be recovered or settled. The effect on deferred tax assets and liabilities of a change in tax rates is recognized in income in the period that includes the enactment date.
51
Fair Value Measurement
– NNN’s estimates of fair value of financial and non-financial assets and liabilities are based on the framework established in the fair value accounting guidance. The framework specifies a hierarchy of valuation inputs which was established to increase consistency, clarity and comparability in fair value measurements and related disclosures. The guidance describes a fair value hierarchy based upon three levels of inputs that may be used to measure fair value, two of which are considered observable and one that is considered unobservable. The following describes the three levels:
|
•
|
Level 1 – Valuation is based upon quoted prices in active markets for identical assets or liabilities.
|
|
•
|
Level 2 – Valuation is based upon inputs other than Level 1 that are observable, either directly or indirectly, such as quoted prices for similar assets or liabilities, quoted prices in markets that are not active or other inputs that are observable or can be corroborated by observable market data for substantially the full term of the assets or liabilities.
|
|
•
|
Level 3 – Valuation is generated from model-based techniques that use at least one significant assumption not observable in the market. These unobservable assumptions reflect estimates of assumptions that market participants would use in pricing the asset or liability. Valuation techniques include option pricing models, discounted cash flow models and similar techniques.
|
Accumulated Other Comprehensive Income (Loss)
– The following table outlines the changes in accumulated other comprehensive income (dollars in thousands):
|
Gain or Loss on Cash Flow Hedges
(1)
|
Gains and Losses on Commercial Mortgage Residual Interests
(2)
|
Gains and Losses on Available-for-Sale Securities
|
Total
|
|||||||||||||||
|
Beginning balance, December 31, 2012
|
$
|
(5,693
|
)
|
$
|
3,244
|
|
$
|
67
|
|
$
|
(2,382
|
)
|
||||||
|
Other comprehensive income (loss)
|
(3,141
|
)
|
511
|
|
69
|
|
(2,561
|
)
|
||||||||||
|
Reclassifications from accumulated other comprehensive income to net earnings
|
438
|
|
(3)
|
—
|
|
(4
|
)
|
—
|
|
(5
|
)
|
438
|
|
|||||
|
Net current period other comprehensive income (loss)
|
(2,703
|
)
|
511
|
|
69
|
|
(2,123
|
)
|
||||||||||
|
Ending balance, December 31, 2013
|
(8,396
|
)
|
3,755
|
|
136
|
|
(4,505
|
)
|
||||||||||
|
Other comprehensive income (loss)
|
(6,312
|
)
|
875
|
|
111
|
|
(5,326
|
)
|
||||||||||
|
Reclassifications from accumulated other comprehensive income to net earnings
|
1,129
|
|
(3)
|
163
|
|
(4
|
)
|
(119
|
)
|
(5
|
)
|
1,173
|
|
|||||
|
Net current period other comprehensive income (loss)
|
(5,183
|
)
|
1,038
|
|
(8
|
)
|
(4,153
|
)
|
||||||||||
|
Ending balance, December 31, 2014
|
$
|
(13,579
|
)
|
$
|
4,793
|
|
$
|
128
|
|
$
|
(8,658
|
)
|
||||||
(1)
Additional disclosure is included in Note 15 – Derivatives.
(2)
Additional disclosure is included in Note 20 – Fair Value Measurements.
(3)
Reclassifications out of other comprehensive income are recorded in Interest Expense on the Consolidated Statements of Income and Comprehensive Income. There is no income tax expense (benefit) resulting from this reclassification.
(4)
Reclassifications out of other comprehensive income are recorded in Impairment on the Consolidated Statements of Income and Comprehensive Income. There is no income tax expense (benefit) resulting from this reclassification.
(5)
Reclassifications out of other comprehensive income are recorded in Other Income on the Consolidated Statements of Comprehensive Income. There is no income tax expense (benefit) resulting from this reclassification.
New Accounting Pronouncements
– In July 2013, the FASB issued Accounting Standards Update ("ASU") 2013-11, "Income Taxes (Topic 740): Presentation of an Unrecognized Tax Benefit When a Net Operating Loss Carryforward, a Similar Tax Loss, or a Tax Credit Carryforward Exists." The objective of the amendments in this update is to eliminate the diversity in practice of financial statement presentation of an unrecognized tax benefit when a net operating loss carryforward, a similar tax loss, or a tax credit carryforward exists. The provisions of the update are that an unrecognized tax benefit, or a portion of an unrecognized tax benefit, should be presented, with certain exceptions, in the financial statements as a reduction to a deferred tax asset for a net operating loss carryforward, a similar tax loss, or a tax credit carryforward. The amendments in this update are effective for fiscal years, and interim periods within those years, beginning after December 15, 2013. The adoption of ASU 2013-11 did not have a significant impact on NNN's financial position or results of operations.
52
In April 2014, the FASB issued ASU 2014-08, “Presentation of Financial Statements (Topic 205) and Property, Plant, and Equipment (Topic 360): Reporting Discontinued Operations and Disclosures of Disposal of Components of an Entity,” effective for fiscal years beginning on or after December 15, 2014, with early adoption permitted beginning January 1, 2014. Under ASU 2014-08, only disposals representing a strategic shift in operations are to be presented as discontinued operations. NNN has elected early adoption of ASU 2014-08. This requires the Company to continue to classify any Property disposal or Property classified as held for sale as of December 31, 2013 as discontinued operations prospectively. Therefore, the revenues and expenses related to these properties are presented as discontinued operations as of December 31, 2014. The Company did not classify any additional properties as discontinued operations subsequent to December 31, 2013. The adoption of ASU 2014-08 did not have a significant impact on NNN’s financial position or results of operations. The adoption of this standard resulted in the operations of certain current year dispositions were no longer classified as discontinued operations.
In May 2014, the FASB issued ASU 2014-09, “Revenue from Contracts with Customers (Topic 606),” effective for annual reporting periods beginning after December 15, 2016, and interim periods within that reporting period. The core principle of ASU 2014-09, is that an entity should recognize revenue to depict the transfer of promised goods or services to customers in an amount that reflects the consideration to which the entity expects to be entitled in exchange for those goods or services. Certain contracts are excluded from ASU 2014-09, including lease contracts within the scope of the FASB guidance included in
Leases
. NNN is currently evaluating to determine the potential impact, if any, the adoption of ASU 2014-09 will have on its financial position and results of operations.
In June 2014, the FASB issued ASU 2014-12, "Compensation – Stock Compensation (Topic 718)," effective for annual periods and interim periods within those periods beginning after December 15, 2015. The amendments require that a performance target that affects vesting and that could be achieved after the requisite service period be treated as a performance condition. NNN is currently evaluating to determine the potential impact, if any, the adoption of ASU 2014-12 will have on its financial position and results of operations.
In August 2014, the FASB issued ASU 2014-15, "Presentation of Financial Statements – Going Concern (Subtopic 205-40), effective for the annual period ending after December 15, 2016, and for annual periods and interim periods thereafter. Early application is permitted. The amendments in this update provide guidance in GAAP about management's responsibility to evaluate whether there is substantial doubt about an entity's ability to continue as a going concern and to provide related footnote disclosures. NNN is currently evaluating to determine the potential impact, if any, the adoption of ASU 2014-15 will have on footnote disclosures.
In November 2014, the FASB issued ASU 2014-16, "Derivatives and Hedging (Topic 815)." Entities commonly raise capital by issuing different classes of shares, including preferred stock, that entitle the holders to certain preferences and rights over the other shareholders. The specific terms of those shares may include conversion rights, redemption rights, voting rights, and liquidation and dividend payment preferences, among other features. One or more of those features may meet the definition of a derivative under GAAP. Shares that include such embedded derivative features are referred to as hybrid financial instruments. The objective of this update is to eliminate the use of different methods in practice and thereby reduce existing diversity under GAAP in the accounting for hybrid financial instruments issued in the form of a share. The amendments are effective for fiscal years, and interim periods within those fiscal years, beginning after December 15, 2015. NNN is currently evaluating to determine the potential impact, if any, the adoption of ASU 2014-16 will have on its financial position and results of operations.
Use of Estimates
– Additional critical accounting policies of NNN include management’s estimates and assumptions relating to the reporting of assets and liabilities, revenues and expenses and the disclosure of contingent assets and liabilities to prepare the consolidated financial statements in conformity with accounting principles generally accepted in the United States of America. Additional critical accounting policies include management’s estimates of the useful lives used in calculating depreciation expense relating to real estate assets, purchase price allocation, the recoverability of the carrying value of long-lived assets, including the commercial mortgage residual interests, the recoverability of the deferred income taxes, and the collectibility of receivables from tenants, including accrued rental income. Actual results could differ from those estimates.
Correction of Immaterial Errors
– During the year ended December 31, 2012, NNN identified certain immaterial errors related to deferred tax assets and the related valuation allowance. In 2009, NNN incurred a loss on foreclosure and impairment charges associated with acquiring the operations of one of its lessees. The properties and operations were transferred to taxable REIT subsidiaries upon foreclosure. Certain charges associated with the acquisition and impaired properties should have been recorded in NNN’s qualified REIT subsidiaries prior to the properties’ transfer to the taxable REIT subsidiary group. Deferred tax assets associated with the book charges of
$10,350,000
in 2009 were inappropriately recorded in the taxable REIT subsidiary group. A valuation allowance for the full amount of the deferred tax assets was also recorded in 2009. In the year ended December 31, 2012, NNN decreased deferred tax assets and the related valuation allowance by
$10,350,000
each to correct the error.
53
NNN further reviewed its conclusions in previous periods, commencing in 2009, with respect to the realizability of the remaining deferred tax assets. Upon further review, NNN determined that its available sources of income supported realizability of all but
$3,104,000
of its gross deferred tax assets as of December 31, 2009, 2010 and 2011. As a result, NNN determined that it had previously understated its deferred income tax benefit in the years ended December 31, 2010 and 2009 by
$3,121,000
and
$3,372,000
, respectively, and understated its net deferred tax assets by
$6,493,000
as of December 31, 2011 and 2010, in its financial statements. NNN corrected this in the year ended December 31, 2012 by reversing the valuation allowance and recording an income tax benefit of
$6,493,000
. NNN reviewed the impact of correcting the prior period errors in 2012 as well as its impact on prior periods in accordance with SAB Topics 1.M and 1.N and determined that the misstatements did not have a material effect on the Company’s financial position, results of operations, trends in earnings, or cash flows for any of the periods presented.
Furthermore, NNN determined in the year ended December 31, 2012 that its available sources of income supported realizability of all of its gross deferred tax assets. In 2012, NNN reversed the remaining valuation allowance and recorded an income tax benefit of
$1,178,000
.
Reclassification
– Certain items in the prior year’s consolidated financial statements and notes to consolidated financial statements have been reclassified to conform to the
2014
presentation.
Real Estate – Portfolio
Leases
– The following outlines key information for NNN’s leases at
December 31, 2014
:
|
Lease classification:
|
||
|
Operating
|
2,083
|
|
|
Direct financing
|
12
|
|
|
Building portion – direct financing/land portion – operating
|
1
|
|
|
Weighted average remaining lease term
|
12 years
|
|
The leases generally provide for limited increases in rent as a result of fixed increases, increases in the consumer price index, and/or increases in the tenant’s sales volume. Generally, the tenant is also required to pay all property taxes and assessments, substantially maintain the Property and carry property and liability insurance coverage. Certain of the Properties are subject to leases under which NNN retains responsibility for specific costs and expenses of the Property. Generally, the leases provide the tenant with one or more multi-year renewal options, subject to generally the same terms and conditions of the base term of the lease, including rent increases.
Real Estate Portfolio – Accounted for Using the Operating Method
– Real estate subject to operating leases consisted of the following as of
December 31
(dollars in thousands):
|
2014
|
2013
|
||||||
|
Land and improvements
|
$
|
1,784,494
|
|
$
|
1,652,304
|
|
|
|
Buildings and improvements
|
3,414,691
|
|
2,960,845
|
|
|||
|
Leasehold interests
|
1,290
|
|
1,290
|
|
|||
|
5,200,475
|
|
4,614,439
|
|
||||
|
Less accumulated depreciation and amortization
|
(511,703
|
)
|
(415,774
|
)
|
|||
|
4,688,772
|
|
4,198,665
|
|
||||
|
Work in progress
|
28,908
|
|
60,719
|
|
|||
|
$
|
4,717,680
|
|
$
|
4,259,384
|
|
||
Some leases provide for scheduled rent increases throughout the lease term. Such amounts are recognized on a straight-line basis over the terms of the leases. For the years ended
December 31
,
2014
,
2013
and
2012
, NNN recognized collectively in continuing and discontinued operations,
$1,521,000
,
($338,000)
and
$487,000
, respectively, of such income, net of reserves. At
December 31
,
2014
and
2013
, the balance of accrued rental income, net of allowances of
$3,086,000
and
$3,181,000
, respectively, was
$25,659,000
and
$24,797,000
, respectively.
54
The following is a schedule of future minimum lease payments to be received on noncancellable operating leases at
December 31, 2014
(dollars in thousands):
|
2015
|
$
|
432,369
|
|
|
2016
|
427,152
|
|
|
|
2017
|
417,412
|
|
|
|
2018
|
392,925
|
|
|
|
2019
|
375,013
|
|
|
|
Thereafter
|
3,025,217
|
|
|
|
$
|
5,070,088
|
|
|
Since lease renewal periods are exercisable at the option of the tenant, the above table only presents future minimum lease payments due during the current lease terms. In addition, this table does not include amounts for potential variable rent increases that are based on the CPI or future contingent rents which may be received on the leases based on a percentage of the tenant’s gross sales.
Real Estate Portfolio – Accounted for Using the Direct Financing Method
– The following lists the components of net investment in direct financing leases at
December 31
(dollars in thousands):
|
2014
|
2013
|
||||||
|
Minimum lease payments to be received
|
$
|
17,376
|
|
$
|
20,469
|
|
|
|
Estimated unguaranteed residual values
|
8,274
|
|
8,274
|
|
|||
|
Less unearned income
|
(8,676
|
)
|
(10,401
|
)
|
|||
|
Net investment in direct financing leases
|
$
|
16,974
|
|
$
|
18,342
|
|
|
The following is a schedule of future minimum lease payments to be received on direct financing leases held for investment at
December 31, 2014
(dollars in thousands):
|
2015
|
$
|
2,956
|
|
|
2016
|
2,873
|
|
|
|
2017
|
2,035
|
|
|
|
2018
|
2,007
|
|
|
|
2019
|
1,513
|
|
|
|
Thereafter
|
5,992
|
|
|
|
$
|
17,376
|
|
|
The above table does not include future minimum lease payments for renewal periods, potential variable CPI rent increases or contingent rental payments that may become due in future periods (see Real Estate Portfolio – Accounted for Using the Operating Method).
55
Real Estate – Held For Sale
On a quarterly basis, the Company evaluates its Properties for held for sale classification based on specific criteria as outlined in ASC 360,
Property, Plant & Equipment,
including management’s intent to commit to a plan to sell the asset. In January 2014, NNN completed a strategic review of its Properties held for sale and reclassified one Property that was previously held for sale to held for investment, included in Real Estate – Portfolio. As of
December 31, 2014
, NNN had
seven
of its Properties categorized as held for sale. NNN anticipates the disposition of these Properties to occur within 12 months. NNN's real estate held for sale at
December 31, 2013
, included
eight
properties,
two
of which were subsequently sold in
2014
. Real estate held for sale consisted of the following as of (dollars in thousands):
|
2014
|
2013
|
||||||
|
Land and improvements
|
$
|
3,246
|
|
$
|
5,751
|
|
|
|
Building and improvements
|
4,644
|
|
8,067
|
|
|||
|
7,890
|
|
13,818
|
|
||||
|
Less accumulated depreciation and amortization
|
(1,473
|
)
|
(2,362
|
)
|
|||
|
Less impairment
|
(1,022
|
)
|
(2,132
|
)
|
|||
|
$
|
5,395
|
|
$
|
9,324
|
|
||
Real Estate – Dispositions
The following table summarizes the Properties sold and the corresponding gain recognized on the disposition of Properties for the years ended
December 31
(dollars in thousands):
|
|
2014
|
2013
|
2012
|
|||||||||||||||
|
# of Sold
Properties
|
Gain
|
# of Sold
Properties
|
Gain
|
# of Sold
Properties
|
Gain
|
|||||||||||||
|
Gain on disposition of real estate
|
25
|
$
|
11,587
|
|
—
|
$
|
173
|
|
—
|
$
|
—
|
|
||||||
|
Income tax expense
|
(318
|
)
|
(66
|
)
|
—
|
|
||||||||||||
|
11,269
|
|
107
|
|
—
|
|
|||||||||||||
|
Gain on disposition of real estate included in discontinued operations
|
2
|
155
|
|
(1)
|
35
|
6,272
|
|
(1)
|
34
|
10,956
|
|
(1)
|
||||||
|
Income tax expense
|
—
|
|
(784
|
)
|
—
|
|
||||||||||||
|
$
|
11,424
|
|
$
|
5,595
|
|
$
|
10,956
|
|
||||||||||
(1)
Amount includes the recognition of deferred gains on previously sold properties.
Real Estate – Commitments
NNN has agreed to fund construction commitments on leased Properties. The improvements are estimated to be completed within 12 months. These construction commitments, as of
December 31, 2014
, are outlined in the table below (dollars in thousands):
|
Number of properties
|
26
|
|
||
|
Total commitment
(1)
|
$
|
110,081
|
|
|
|
Amount funded
|
$
|
57,465
|
|
|
|
Remaining commitment
|
$
|
52,616
|
|
|
|
(1)
|
Includes land, construction costs, tenant improvements and lease costs.
|
56
Real Estate – Impairments
Management periodically assesses its real estate for possible impairment whenever certain events or changes in circumstances indicate that the carrying amount of the asset, including accrued rental income, may not be recoverable through operations. Events or circumstances that may occur include significant changes in real estate market conditions and the ability of NNN to re-lease or sell properties that are vacant or become vacant. Impairments are measured as the amount by which the current book value of the asset exceeds the estimated fair value of the asset. As a result of the Company’s review of long lived assets, including identifiable intangible assets, NNN recognized the following real estate impairments for the years ended
December 31
(dollars in thousands):
|
2014
|
2013
|
2012
|
|||||||||
|
Continuing operations
|
$
|
760
|
|
$
|
3,565
|
|
$
|
4,070
|
|
||
|
Discontinued operations
|
63
|
|
541
|
|
6,242
|
|
|||||
|
$
|
823
|
|
$
|
4,106
|
|
$
|
10,312
|
|
|||
The valuation of impaired assets is determined using widely accepted valuation techniques including discounted cash flow analysis, income capitalization, analysis of recent comparable sales transactions, actual sales negotiations and bona fide purchase offers received from third parties, which are Level 3 inputs. NNN may consider a single valuation technique or multiple valuation techniques, as appropriate, when estimating the fair value of its real estate.
Mortgage notes are secured by real estate, real estate securities or other assets. Mortgages and notes receivable consisted of the following at
December 31
(dollars in thousands):
|
2014
|
2013
|
||||||
|
Mortgages and notes receivable
|
$
|
10,974
|
|
$
|
16,942
|
|
|
|
Accrued interest receivables
|
101
|
|
177
|
|
|||
|
$
|
11,075
|
|
$
|
17,119
|
|
||
NNN holds the commercial mortgage residual interests (“Residuals”) from
seven
securitizations. Each of the Residuals is recorded at fair value. Unrealized gains and losses are reported as other comprehensive income in stockholders’ equity and other than temporary losses as a result of a change in the timing or amount of estimated cash flows are recorded as an other than temporary valuation impairment.
The following table summarizes the recognition of unrealized gains and/or losses recorded as other comprehensive income as well as other than temporary valuation impairment as of
December 31
(dollars in thousands):
|
2014
|
2013
|
2012
|
|||||||||
|
Unrealized gains
|
$
|
875
|
|
$
|
511
|
|
$
|
1,132
|
|
||
|
Other than temporary valuation impairment
|
256
|
|
1,185
|
|
2,812
|
|
|||||
57
Based on the expected timing of future cash flows relating to the Residuals certain valuation assumptions are made. During the years ended December 31,
2014
,
2013
and
2012
, NNN recorded an other than temporary valuation adjustment as a reduction of earnings from operations. The following table summarizes the key assumptions used in determining the value of the Residuals as of
December 31
:
|
2014
|
2013
|
||||
|
Discount rate
|
20
|
%
|
20
|
%
|
|
|
Average life equivalent CPR
(1)
speeds range
|
0.87% to 26.30% CPR
|
|
0.80% to 20.76% CPR
|
|
|
|
Foreclosures:
|
|||||
|
Frequency curve default model
|
0.70% - 2.45% range
|
|
0.07% - 2.43% range
|
|
|
|
Loss severity of loans in foreclosure
|
20
|
%
|
20
|
%
|
|
|
Yield:
|
|||||
|
LIBOR
|
Forward 3-month curve
|
|
Forward 3-month curve
|
|
|
|
Prime
|
Forward curve
|
|
Forward curve
|
|
|
|
(1)
|
Conditional prepayment rate
|
The following table shows the effects on the key assumptions affecting the fair value of the Residuals at
December 31, 2014
(dollars in thousands):
|
|
Residuals
|
||
|
Carrying amount of retained interests
|
$
|
11,626
|
|
|
Discount rate assumption:
|
|||
|
Fair value at 25% discount rate
|
$
|
9,824
|
|
|
Fair value at 27% discount rate
|
$
|
9,194
|
|
|
Prepayment speed assumption:
|
|||
|
Fair value of 1% increases above the CPR Index
|
$
|
11,624
|
|
|
Fair value of 2% increases above the CPR Index
|
$
|
11,623
|
|
|
Expected credit losses:
|
|||
|
Fair value 2% adverse change
|
$
|
11,509
|
|
|
Fair value 3% adverse change
|
$
|
11,450
|
|
|
Yield Assumptions:
|
|||
|
Fair value of Prime/LIBOR spread contracting 25 basis points
|
$
|
11,849
|
|
|
Fair value of Prime/LIBOR spread contracting 50 basis points
|
$
|
12,073
|
|
These sensitivities are hypothetical and should be used with caution. As the figures indicate, changes in fair value based on variations in assumptions generally cannot be extrapolated because the relationship of the change in assumption to the change in fair value may not be linear. Also, in this table, the effect of a variation of a particular assumption on the fair value of the retained interest is calculated without changing any other assumptions; in reality, changes in one factor may result in changes in another, which might magnify or counteract the sensitivities.
58
In October 2014, NNN amended and restated its credit agreement increasing the borrowing capacity under its unsecured revolving credit facility from
$500,000,000
to
$650,000,000
and amended certain other terms under the former revolving credit facility (as the context requires, the previous and new revolving credit facility, the “Credit Facility”). The Credit Facility had a weighted average outstanding balance of
$56,590,000
and a weighted average interest rate of
1.2%
for the year ended
December 31, 2014
. The Credit Facility matures
January 2019
, with an option to extend maturity to
January 2020
. As of
December 31, 2014
, the Credit Facility bears interest at
LIBOR plus 92.5
basis points; however, such interest rate may change pursuant to a tiered interest rate structure based on NNN's debt rating. The Credit Facility also includes an accordion feature to increase the facility size up to
$1,000,000,000
. As of
December 31, 2014
, there was
no
outstanding balance and
$650,000,000
was available for future borrowings under the Credit Facility.
In accordance with the terms of the Credit Facility, NNN is required to meet certain restrictive financial covenants which, among other things, require NNN to maintain certain (i) leverage ratios, (ii) debt service coverage, (iii) cash flow coverage and (iv) investment and dividend limitations. At
December 31, 2014
, NNN was in compliance with those covenants.
The following table outlines the mortgages payable included in NNN’s consolidated financial statements (dollars in thousands):
|
Entered
(1)
|
Initial
Balance
|
Interest
Rate
|
Maturity
(2)
|
Carrying
Value of
Encumbered
Asset(s)
(3)
|
Outstanding Principal
Balance at December 31,
|
|||||||||||||||
|
2014
|
2013
|
|||||||||||||||||||
|
December 2001
|
$
|
623
|
|
9.00%
|
April 2014
|
$
|
—
|
|
$
|
—
|
|
$
|
27
|
|
||||||
|
December 2001
|
$
|
698
|
|
9.00%
|
April 2019
|
868
|
|
223
|
|
263
|
|
|||||||||
|
December 2001
|
485
|
|
9.00%
|
April 2019
|
841
|
|
116
|
|
136
|
|
||||||||||
|
February 2004
|
6,952
|
|
6.90%
|
January 2017
|
10,554
|
|
1,577
|
|
2,257
|
|
||||||||||
|
March 2005
|
1,015
|
|
8.14%
|
September 2016
|
1,245
|
|
222
|
|
335
|
|
||||||||||
|
June 2012
(4)
|
6,850
|
|
5.75%
|
April 2016
|
8,529
|
|
6,180
|
|
6,457
|
|
||||||||||
|
September 2014
(4)
|
2,957
|
|
6.40%
|
February 2017
|
3,797
|
|
2,922
|
|
—
|
|
||||||||||
|
November 2014
(4)
|
15,151
|
|
5.23%
|
July 2023
|
22,376
|
|
15,099
|
|
—
|
|
||||||||||
|
$
|
48,210
|
|
$
|
26,339
|
|
$
|
9,475
|
|
||||||||||||
|
(1)
|
Date entered represents the date that NNN acquired real estate subject to a mortgage securing a loan.
|
|
(2)
|
Monthly payments include interest and principal, if any; the balance is due at maturity.
|
|
(3)
|
Each loan is secured by a first mortgage lien on certain of the Properties. The carrying values of the assets are as of
December 31, 2014
.
|
|
(4)
|
Initial balance and outstanding principal balance includes unamortized premium.
|
The following is a schedule of the scheduled principal payments, net of premium amortization of NNN’s mortgages payable at
December 31, 2014
(dollars in thousands):
|
2015
|
$
|
1,870
|
|
|
2016
|
7,514
|
|
|
|
2017
|
3,441
|
|
|
|
2018
|
710
|
|
|
|
2019
|
688
|
|
|
|
Thereafter
|
12,116
|
|
|
|
$
|
26,339
|
|
|
59
On September 28, 2012, NNN announced that the market price condition on its
3.950%
convertible senior notes due 2026 (the "2026 Notes") has been satisfied, and that the 2026 Notes would be convertible during the calendar quarter beginning October 1, 2012.
All note holders elected to exercise the conversion feature of the 2026 Notes prior to their redemption. Pursuant to the terms of the 2026 Notes, the Company elected to pay the full settlement value in cash. The settlement value of a note was based on an average of the daily closing price of the Company's common stock over an averaging period that commenced after the Company received a conversion notice from a note holder. The Company paid approximately
$164,649,000
in aggregate settlement value for the
$123,163,000
of settled 2026 Notes at the end of the applicable averaging periods. The difference between the amount paid and the principal amount of the settled 2026 Notes of
$41,486,000
was recognized as a decrease to additional paid-in capital.
As of December 31, 2012,
$15,537,000
of the principal amount of 2026 Notes were outstanding. In January 2013, the Company paid approximately
$20,702,000
in aggregate settlement value for the remaining
$15,537,000
of outstanding 2026 Notes. The difference between the amount paid and the principal amount of the settled 2026 Notes of
$5,028,000
was recognized as a decrease to additional paid-in capital and
$137,000
was recorded as interest expense.
As of December 31, 2012,
$223,035,000
of the principal amount of the
5.125%
convertible senior notes due 2028 (the "2028 Notes") were outstanding. In June 2013, NNN called all of the outstanding 2028 Notes for redemption on July 11, 2013. On July 11, 2013,
$130,000
principal amount of the 2028 Notes was settled at par plus accrued interest. The holders of the remaining balance of
$222,905,000
principal amount of 2028 Notes elected to convert into cash and shares of the Company's common stock in accordance with the conversion formula which is based on the average daily closing price of NNN's common stock price over a period of
20 days
commencing after receipt of a note holder's conversion notice. In 2013, the Company issued
2,407,911
shares of common stock and paid approximately
$226,427,000
in aggregate settlement value for the
$223,035,000
aggregate principal amount of 2028 Notes outstanding. The difference between the amount paid and the principal amount of the settled notes of
$3,197,000
was recognized as a decrease to additional paid-in capital and
$195,000
was recorded as interest expense.
NNN recorded the following in interest expense relating to the 2028 Notes and the 2026 Notes for the years ended
December 31
(dollars in thousands):
|
2013
|
2012
|
||||||
|
Noncash interest charges
|
$
|
2,072
|
|
$
|
4,291
|
|
|
|
Contractual interest expense
|
5,400
|
|
15,744
|
|
|||
|
Amortization of debt costs
|
566
|
|
1,149
|
|
|||
|
$
|
8,038
|
|
$
|
21,184
|
|
||
There was
no
interest expense related to the 2028 Notes and the 2026 Notes for the year ended
December 31
,
2014
.
Each of NNN’s outstanding series of non-convertible notes is summarized in the table below (dollars in thousands):
|
Notes
(1)
|
Issue Date
|
Principal
|
Discount
(1)
|
Net
Price
|
Stated
Rate
|
Effective
Rate
(2)
|
Maturity
Date
|
|||||||||||||
|
2015
(6)
|
November 2005
|
$
|
150,000
|
|
$
|
390
|
|
$
|
149,610
|
|
6.150%
|
6.185%
|
December 2015
|
|||||||
|
2017
(3)
|
September 2007
|
250,000
|
|
877
|
|
249,123
|
|
6.875%
|
6.924%
|
October 2017
|
||||||||||
|
2021
(4)
|
July 2011
|
300,000
|
|
4,269
|
|
295,731
|
|
5.500%
|
5.690%
|
July 2021
|
||||||||||
|
2022
|
August 2012
|
325,000
|
|
4,989
|
|
320,011
|
|
3.800%
|
3.984%
|
October 2022
|
||||||||||
|
2023
(5)
|
April 2013
|
350,000
|
|
2,594
|
|
347,406
|
|
3.300%
|
3.388%
|
April 2023
|
||||||||||
|
2024
(7)
|
May 2014
|
350,000
|
|
707
|
|
349,293
|
|
3.900%
|
3.924%
|
June 2024
|
||||||||||
|
(1)
|
The note discounts are amortized to interest expense over the respective term of each debt obligation using the effective interest method.
|
|
(2)
|
Includes the effects of the discount, treasury lock gain/loss and swap gain/loss, as applicable.
|
60
|
(3)
|
NNN entered into an interest rate hedge with a notional amount of
$100,000
. Upon issuance of the 2017 Notes, NNN terminated the interest rate hedge agreement resulting in a liability of
$3,260
, of which
$3,228
was recorded to other comprehensive income. The liability has been deferred and is being amortized as an adjustment to interest expense over the term of the 2017 Notes using the effective interest method.
|
|
(4)
|
NNN entered into
two
interest rate hedges with a total notional amount of
$150,000
. Upon issuance of the 2021 Notes, NNN terminated the interest rate hedge agreements resulting in a liability of
$5,300
, of which
$5,218
was deferred in other comprehensive income. The deferred liability is being amortized over the term of the note using the effective interest method.
|
|
(5)
|
NNN entered into
four
forward starting swaps with an aggregate notional amount of
$240,000
. Upon issuance of the 2023 Notes, NNN terminated the forward starting swaps resulting in a liability of
$3,156
, of which
$3,141
was deferred in other comprehensive income. The deferred liability is being amortized over the term of the note using the effective interest method.
|
|
(6)
|
NNN plans to use proceeds from the Credit Facility and/or potential debt or equity offerings to repay the outstanding indebtedness.
|
|
(7)
|
NNN entered into
three
forward starting swaps with an aggregate notional amount of
$225,000
. Upon issuance of the 2024 Notes, NNN terminated the forward starting swaps resulting in a liability of
$6,312
, which was deferred in other comprehensive income. The deferred liability is being amortized over the term of the note using the effective interest method.
|
Each series of the notes represents senior, unsecured obligations of NNN and is subordinated to all secured indebtedness of NNN. Each of the notes is redeemable at the option of NNN, in whole or in part, at a redemption price equal to the sum of (i) the principal amount of the notes being redeemed plus accrued and unpaid interest thereon through the redemption date and (ii) the make-whole amount, if any, as defined in the applicable supplemental indenture relating to the notes.
In connection with the debt offerings, NNN incurred debt issuance costs totaling
$15,500,000
consisting primarily of underwriting discounts and commissions, legal and accounting fees, rating agency fees and printing expenses. Debt issuance costs for all note issuances have been deferred and are being amortized over the term of the respective notes using the effective interest method.
In
June 2014
, NNN repaid the
$150,000,000
6.250%
notes payable that were due in
June 2014
.
In accordance with the terms of the indenture, pursuant to which NNN’s notes have been issued, NNN is required to meet certain restrictive financial covenants, which, among other things, require NNN to maintain (i) certain leverage ratios and (ii) certain interest coverage. At
December 31, 2014
, NNN was in compliance with those covenants.
7.375%
Series C Cumulative Redeemable Preferred Stock.
In October 2006, NNN issued
3,680,000
depositary shares, each representing
1/100
th
of a share of Series C Preferred Stock.
In March 2012, NNN redeemed all
3,680,000
outstanding depositary shares representing interests in its Series C Preferred Stock. The Series C Preferred Stock was redeemed at
$25.00
per depositary share, plus accumulated and unpaid distributions through the redemption date, for an aggregate redemption price of
$25.0768229
per depositary share. The excess carrying amount of preferred stock redeemed over the cash paid to redeem the preferred stock was
$3,098,000
of Series C Preferred Stock issuance costs.
NNN completed the following underwritten public offerings of cumulative redeemable preferred stock and are still outstanding ("Preferred Stock Shares") (dollars in thousands, except per share data):
|
Series
|
Dividend Rate
(1)
|
Issued
|
Depositary Shares Outstanding
(2)
|
Gross Proceeds
|
Stock Issuance Costs
(3)
|
Dividend Per Depositary Share
|
Earliest Redemption Date
(4)
|
|||||||||||||||
|
Series D
|
6.625
|
%
|
February 2012
|
11,500,000
|
|
$
|
287,500
|
|
$
|
9,855
|
|
$
|
1.656250
|
|
February 2017
|
|||||||
|
Series E
|
5.700
|
%
|
May 2013
|
11,500,000
|
|
287,500
|
|
9,856
|
|
1.425000
|
|
May 2018
|
||||||||||
|
(1)
|
Holders are entitled to receive, when and as authorized by the Board of Directors, cumulative preferential cash dividends.
|
|
(2)
|
Representing
1/100
th of a preferred share. Each issuance included
1,500,000
depositary shares in connection with the underwriters' over-allotment.
|
|
(3)
|
Consisting primarily of underwriting commissions and fees, rating agency fees, legal and accounting fees and printing expenses.
|
|
(4)
|
NNN may redeem the preferred stock underlying the depositary shares at a redemption price of
$2,500.00
per share (or
$25.00
per depositary share), plus all accumulated and unpaid dividends.
|
The Preferred Stock Shares underlying the depositary shares rank senior to NNN’s common stock with respect to dividend rights and rights upon liquidation, dissolution or winding up of NNN. The Preferred Stock Shares have no maturity date and will remain outstanding unless redeemed. In addition, upon a change of control, as defined in the articles supplementary fixing the rights and preferences of the Preferred Stock Shares, NNN may redeem the Preferred Stock Shares underlying the
61
depositary shares at a redemption price of
$2,500.00
per share (or
$25.00
per depositary share), plus all accumulated and unpaid dividends, and in limited circumstances the holders of depositary shares may convert some or all of their Preferred Stock Shares into shares of NNN's common stock at conversion rates provided in the related articles supplementary. As of
February 20, 2015
, the Preferred Stock Shares were not redeemable or convertible.
In February 2012, NNN filed a shelf registration statement with the Commission which permits the issuance by NNN of an indeterminate amount of debt and equity securities.
In November 2014, NNN filed a prospectus supplement to the prospectus contained in its February 2012 shelf registration statement and issued
5,462,500
shares (including
712,500
shares in connection with the underwriters' over-allotment) of common stock at a price of
$38.16
per share and received net proceeds of
$199,961,000
. In connection with this offering, NNN incurred stock issuance costs totaling approximately
$8,488,000
, consisting primarily of underwriters' fees and commissions, legal and accounting fees and printing expenses.
In May 2012, NNN established an at-the-market ("ATM") equity program (“2012 ATM”) which allows NNN to sell up to an aggregate of
9,000,000
shares of common stock from time to time through May 2015, of which
8,958,840
shares had been issued as of
December 31, 2014
. The 2012 ATM will expire in accordance with its terms in May 2015. The following outlines the common stock issuances pursuant to the 2012 ATM for the year ended December 31 (dollars in thousands, except per share data):
|
2013
|
2012
|
||||||
|
Shares of common stock
|
4,676,542
|
|
4,282,298
|
|
|||
|
Average price per share (net)
|
$
|
32.60
|
|
$
|
29.64
|
|
|
|
Net proceeds
|
152,435
|
|
126,947
|
|
|||
|
Stock issuance costs
(1)
|
2,161
|
|
2,145
|
|
|||
(1)
Stock issuance costs consist primarily of underwriters' fees and commissions, and legal and accounting fees.
There were
no
common stock issuances pursuant to the 2012 ATM for the year ended
December 31, 2014
.
In March 2013, NNN established a second ATM equity program ("2013 ATM") which allows NNN to sell up to an aggregate of
9,000,000
shares of common stock from time to time through March 2015, of which
6,038,812
shares had been issued as of
December 31, 2014
. The 2013 ATM will expire in accordance with its terms in March 2015. The following table outlines the common stock issuances pursuant to the 2013 ATM for the year ended December 31 (dollars in thousands, except per share data):
|
2014
|
2013
|
||||||
|
Shares of common stock
|
3,758,362
|
|
2,280,450
|
|
|||
|
Average price per share (net)
|
$
|
35.90
|
|
$
|
37.80
|
|
|
|
Net proceeds
|
134,919
|
|
86,208
|
|
|||
|
Stock issuance costs
(1)
|
2,195
|
|
1,613
|
|
|||
(1)
Stock issuance costs consist primarily of underwriters' fees and commissions, and legal and accounting fees.
Dividend Reinvestment and Stock Purchase Plan.
In
February 2012
, NNN filed a shelf registration statement with the Commission for its Dividend Reinvestment and Stock Purchase Plan (“DRIP”) which permits the issuance by NNN of
16,000,000
shares of common stock. The following outlines the common stock issuances pursuant to the DRIP for the year ended December 31 (dollars in thousands):
|
2014
|
2013
|
2012
|
|||||||||
|
Shares of common stock
|
422,406
|
|
764,891
|
|
2,101,644
|
|
|||||
|
Net proceeds
|
$
|
14,817
|
|
$
|
25,407
|
|
$
|
56,102
|
|
||
62
Effective January 1, 1998, NNN adopted a defined contribution retirement plan (the “Retirement Plan”) covering substantially all of the employees of NNN. The Retirement Plan permits participants to defer a portion of their compensation, as defined in the Retirement Plan, subject to limits established by the Code. NNN generally matches
60
percent of the first
eight
percent of a participant’s contributions. Additionally, NNN may make discretionary contributions. NNN’s contributions to the Retirement Plan for the years ended
December 31, 2014
,
2013
and
2012
totaled
$453,000
,
$342,000
and
$378,000
, respectively.
The following presents the characterization for tax purposes of common stock dividends per share paid to stockholders for the years ended
December 31
:
|
2014
|
2013
|
2012
|
|||||||||
|
Ordinary dividends
|
$
|
1.306992
|
|
$
|
1.224568
|
|
$
|
1.199003
|
|
||
|
Qualified dividends
|
0.006212
|
|
0.056784
|
|
0.013346
|
|
|||||
|
Capital gain
|
0.008603
|
|
—
|
|
0.021358
|
|
|||||
|
Unrecaptured Section 1250 Gain
|
0.015362
|
|
0.000650
|
|
0.048890
|
|
|||||
|
Nontaxable distributions
|
0.312831
|
|
0.317998
|
|
0.277403
|
|
|||||
|
$
|
1.650000
|
|
$
|
1.600000
|
|
$
|
1.560000
|
|
|||
The following table outlines the dividends declared and paid for NNN's common stock for the years ended December 31 (in thousands, except per share data):
|
2014
|
2013
|
2012
|
|||||||||
|
Dividends
|
$
|
204,157
|
|
$
|
189,107
|
|
$
|
167,495
|
|
||
|
Per share
|
1.650
|
|
1.600
|
|
1.560
|
|
|||||
On
January 15, 2015
, NNN declared a dividend of
$0.420
per share, which was paid
February 17, 2015
to its common stockholders of record as of
January 30, 2015
.
The following presents the characterization for tax purposes of Series C, D and E Preferred Stock dividends per share paid to stockholders for the year ended December 31:
|
Series E
|
Series D
|
Series C
|
|||||||||||||||||||||
|
2014
|
2013
|
2014
|
2013
|
2012
|
2012
|
||||||||||||||||||
|
Ordinary dividends
|
$
|
1.393700
|
|
$
|
0.741150
|
|
$
|
1.619870
|
|
$
|
1.590323
|
|
$
|
1.255844
|
|
$
|
0.502710
|
|
|||||
|
Qualified dividends
|
0.005738
|
|
0.030332
|
|
0.006670
|
|
0.065084
|
|
0.013979
|
|
0.005596
|
|
|||||||||||
|
Capital gain
|
0.009177
|
|
—
|
|
0.010666
|
|
—
|
|
0.022371
|
|
0.008956
|
|
|||||||||||
|
Unrecaptured Section 1250 Gain
|
0.016385
|
|
0.000393
|
|
0.019044
|
|
0.000843
|
|
0.051209
|
|
0.020498
|
|
|||||||||||
|
$
|
1.425000
|
|
$
|
0.771875
|
|
$
|
1.656250
|
|
$
|
1.656250
|
|
$
|
1.343403
|
|
$
|
0.537760
|
|
||||||
63
The following table outlines the dividends declared and paid for NNN's preferred stock for the years ended December 31(in thousands, except per share data):
|
2014
|
2013
|
2012
|
||||||||||
|
Series C Preferred Stock
(1)
:
|
||||||||||||
|
Dividends
|
$
|
—
|
|
$
|
—
|
|
$
|
1,979
|
|
|||
|
Per share
|
—
|
|
—
|
|
0.537760
|
|
||||||
|
Series D Preferred Stock
(2)
:
|
||||||||||||
|
Dividends
|
19,047
|
|
19,047
|
|
15,449
|
|
||||||
|
Per share
|
1.656250
|
|
1.656250
|
|
1.343403
|
|
||||||
|
Series E Preferred Stock
(3)
:
|
||||||||||||
|
Dividends
|
16,387
|
|
8,876
|
|
—
|
|
||||||
|
Per share
|
1.425000
|
|
0.771875
|
|
—
|
|
||||||
(1)
The Series C Preferred Stock was redeemed in March 2012. The dividends paid during the quarter ended March 31, 2012 include accumulated and unpaid dividends through the redemption date.
(2)
The Series D Preferred Stock dividends paid during the quarter ended June 30, 2012 include accumulated and unpaid dividends from the issuance date through the declaration date. The Series D Preferred Stock has no maturity date and will remain outstanding unless redeemed.
(3)
The Series E Preferred Stock dividends paid during the quarter ended September 30, 2013 include accumulated and unpaid dividends from the issuance date through the declaration date. The Series E Preferred Stock has no maturity date and will remain outstanding unless redeemed.
In February
2015
, NNN declared a dividend on its Series D and E Preferred Stock of
41.40625
and
35.62500
cents per depositary share, respectively, payable March 16,
2015
.
For income tax purposes, NNN has taxable REIT subsidiaries in which certain real estate activities are conducted.
NNN treats some depreciation expense and certain other items differently for tax than for financial reporting purposes. The principal differences between NNN’s effective tax rates for the years ended
December 31,
2014
,
2013
and
2012
, and the statutory rates relate to state taxes and nondeductible expenses.
In
2010
, NNN acquired the
21.1%
non-controlling interest in its majority owned and controlled subsidiary, OAMI, pursuant to which OAMI became a wholly owned subsidiary of NNN. As of
December 31,
2014
, OAMI has
no
remaining tax liabilities relating to the built-in gain of its assets.
64
The significant components of the net income tax asset consist of the following at
December 31
(dollars in thousands):
|
2014
|
2013
|
||||||
|
Deferred tax assets:
|
|||||||
|
Cost basis
|
$
|
1,233
|
|
$
|
994
|
|
|
|
Deferred income
|
113
|
|
155
|
|
|||
|
Reserves
|
2,756
|
|
4,728
|
|
|||
|
Credits
|
434
|
|
393
|
|
|||
|
Excess interest expense carryforward
|
1,689
|
|
2,706
|
|
|||
|
Net operating loss carryforward
|
5,196
|
|
5,212
|
|
|||
|
11,421
|
|
14,188
|
|
||||
|
Valuation allowance
|
(619
|
)
|
—
|
|
|||
|
Total deferred tax assets
|
10,802
|
|
14,188
|
|
|||
|
Deferred tax liabilities:
|
|||||||
|
Built-in gain
|
—
|
|
(2,163
|
)
|
|||
|
Depreciation
|
(204
|
)
|
(618
|
)
|
|||
|
Other
|
(110
|
)
|
(779
|
)
|
|||
|
Total deferred tax liabilities
|
(314
|
)
|
(3,560
|
)
|
|||
|
Net deferred tax asset
|
$
|
10,488
|
|
$
|
10,628
|
|
|
In assessing the ability to realize a deferred tax asset, management considers whether it is more likely than not that some portion or the entire deferred tax asset will not be realized. The ultimate realization of deferred tax assets is dependent upon the generation of future taxable income during the periods in which those temporary differences become deductible. Management considers the scheduled reversal of deferred tax liabilities, projected future taxable income, and tax planning strategies in making this assessment. The net operating loss carryforwards were generated by NNN’s taxable REIT subsidiaries. The net operating loss carryforwards begin to expire in 2028. Based upon the level of historical taxable income and projections for future taxable income management believes it is more likely than not that NNN will realize all of the benefits of these deductible differences that existed as of
December 31, 2014
and
2013
, with the exception of a
2014
capital loss carryover.
As disclosed in Note 1, during the year ended December 31, 2012, NNN identified certain immaterial errors related to deferred tax assets and the related valuation allowance. NNN decreased deferred tax assets and the related valuation allowance by
$10,350,000
each to correct a gross-up error and reversed its valuation allowance by
$6,493,000
to reflect an overstatement of its valuation allowance recorded in the years ended December 31, 2010 and 2009.
Furthermore, NNN determined in the year ended December 31, 2012 that its available sources of income supported realizability of all of its gross deferred tax assets. In 2012, NNN reversed the remaining valuation allowance and recorded an income tax benefit of
$1,178,000
.
The increase in the valuation allowance for the year ended
December 31,
2014
was
$619,000
. There was
no
valuation allowance as of
December 31,
2013
.
65
The income tax benefit (expense) consists of the following components for the years ended
December 31,
(as adjusted) (dollars in thousands):
|
2014
|
2013
|
2012
|
|||||||||
|
Net earnings before income taxes
|
$
|
190,844
|
|
$
|
161,230
|
|
$
|
135,124
|
|
||
|
Provision for income tax benefit (expense):
|
|||||||||||
|
Current:
|
|||||||||||
|
Federal
|
(190
|
)
|
(195
|
)
|
(136
|
)
|
|||||
|
State and local
|
5
|
|
(90
|
)
|
(7
|
)
|
|||||
|
Deferred:
|
|||||||||||
|
Federal
|
(166
|
)
|
(790
|
)
|
5,871
|
|
|||||
|
State and local
|
108
|
|
(10
|
)
|
1,163
|
|
|||||
|
Total benefit (expense) for income taxes
|
(243
|
)
|
(1,085
|
)
|
6,891
|
|
|||||
|
Net earnings attributable to NNN’s stockholders
|
$
|
190,601
|
|
$
|
160,145
|
|
$
|
142,015
|
|
||
The total income tax benefit (expense) differs from the amount computed by applying the statutory federal tax rate to net earnings before taxes as follows for the years ended December 31 (dollars in thousands):
|
2014
|
2013
|
2012
|
|||||||||
|
Federal expense at statutory tax rate
|
$
|
(64,887
|
)
|
$
|
(54,818
|
)
|
$
|
(45,942
|
)
|
||
|
Nontaxable income of NNN
|
63,353
|
|
53,178
|
|
44,746
|
|
|||||
|
State taxes, net of federal benefit
|
(196
|
)
|
(200
|
)
|
(139
|
)
|
|||||
|
Amortization of built-in gain tax
|
372
|
|
761
|
|
613
|
|
|||||
|
Expiration of built-in gain tax
|
1,792
|
|
—
|
|
—
|
|
|||||
|
Other
|
(58
|
)
|
(6
|
)
|
(58
|
)
|
|||||
|
Valuation allowance (increase) decrease
|
(619
|
)
|
—
|
|
7,671
|
|
|||||
|
Total tax benefit (expense)
|
$
|
(243
|
)
|
$
|
(1,085
|
)
|
$
|
6,891
|
|
||
In June 2006, the FASB issued additional guidance, which clarifies the accounting for uncertainty in income taxes recognized in a company’s financial statements included in
Income Taxes
. The interpretation prescribes a recognition threshold and measurement attribute for the financial statement recognition and measurement of a tax position taken or expected to be taken in a tax return. The interpretation also provides guidance on derecognition, classification, interest and penalties, accounting in interim periods, disclosure and transition.
NNN, in accordance with FASB guidance included in
Income Taxes
, has analyzed its various federal and state filing positions. NNN believes that its income tax filing positions and deductions are well documented and supported. Additionally, NNN believes that its accruals for tax liabilities are adequate. Therefore, no reserves for uncertain income tax positions have been recorded pursuant to the FASB guidance. In addition, NNN did not record a cumulative effect adjustment related to the adoption of the FASB guidance.
NNN has had no increases or decreases in unrecognized tax benefits for current or prior years since the date of adoption. Further, no interest or penalties have been included since no reserves were recorded and no significant increases or decreases are expected to occur within the next
12
months. When applicable, such interest and penalties will be recorded in non-operating expenses. The periods that remain open under federal statute are 2011 through 2014. NNN also files in many states with varying open years under statute.
66
Effective January 1, 2014, NNN has early adopted ASU 2014-08. Under ASU 2014-08, only disposals representing a strategic shift in operations are to be presented as discontinued operations. This requires the Company to continue to classify any Property disposal or Property classified as held for sale as of
December 31, 2014
, as discontinued operations prospectively. Therefore, the revenues and expenses related to these properties are presented as discontinued operations as of
December 31, 2014
. The Company did not classify any additional properties as discontinued operations subsequent to December 31, 2013.
The following is a summary of the earnings from discontinued operations for each of the years ended
December 31
(dollars in thousands):
|
2014
|
2013
|
2012
|
|||||||||
|
Revenues:
|
|||||||||||
|
Rental income from operating leases
|
$
|
—
|
|
$
|
1,666
|
|
$
|
6,466
|
|
||
|
Earned income from direct financing leases
|
—
|
|
190
|
|
324
|
|
|||||
|
Percentage rent
|
—
|
|
2
|
|
27
|
|
|||||
|
Real estate expense reimbursement from tenants
|
23
|
|
97
|
|
153
|
|
|||||
|
Interest and other income from real estate transactions
|
21
|
|
33
|
|
13
|
|
|||||
|
44
|
|
1,988
|
|
6,983
|
|
||||||
|
Operating expenses:
|
|||||||||||
|
General and administrative
|
—
|
|
6
|
|
5
|
|
|||||
|
Real estate
|
9
|
|
203
|
|
642
|
|
|||||
|
Depreciation and amortization
|
3
|
|
343
|
|
1,381
|
|
|||||
|
Impairment losses and other charges
|
63
|
|
541
|
|
6,215
|
|
|||||
|
75
|
|
1,093
|
|
8,243
|
|
||||||
|
Other expenses (revenues):
|
|||||||||||
|
Interest expense
|
—
|
|
41
|
|
137
|
|
|||||
|
Real estate acquisition costs
|
—
|
|
209
|
|
10
|
|
|||||
|
—
|
|
250
|
|
147
|
|
||||||
|
Earnings (loss) before gain on disposition of real estate and income tax expense
|
(31
|
)
|
645
|
|
(1,407
|
)
|
|||||
|
Gain on disposition of real estate
|
155
|
|
6,272
|
|
10,956
|
|
|||||
|
Income tax expense
|
—
|
|
(945
|
)
|
—
|
|
|||||
|
Earnings from discontinued operations attributable to NNN, including noncontrolling interests
|
124
|
|
5,972
|
|
9,549
|
|
|||||
|
Earnings attributable to noncontrolling interests
|
—
|
|
(163
|
)
|
(24
|
)
|
|||||
|
Earnings from discontinued operations attributable to NNN
|
$
|
124
|
|
$
|
5,809
|
|
$
|
9,525
|
|
||
In accordance with the guidance on derivatives and hedging, NNN records all derivatives on the balance sheet at fair value. The accounting for changes in the fair value of derivatives depends on the intended use of the derivative and the resulting designation. Derivatives used to hedge the exposure to changes in the fair value of an asset, liability, or firm commitment attributable to a particular risk, such as interest rate risk, are considered fair value hedges. Derivatives used to hedge the exposure to variability in expected future cash flows, or other types of forecasted transactions, are considered cash flow hedges.
NNN’s objective in using derivatives is to add stability to interest expense and to manage its exposure to interest rate movements or other identified risks. To accomplish this objective, NNN primarily uses treasury locks, forward swaps (“forward hedges”) and interest rate swaps as part of its cash flow hedging strategy. Treasury locks and forward starting swaps are used to hedge forecasted debt issuances. Treasury locks designated as cash flow hedges lock in the yield/price of a treasury security. Forward swaps also lock the associated swap spread. Interest rate swaps designated as cash flow hedges hedging the variable cash flows associated with floating rate debt involve the receipt of variable rate amounts in exchange for fixed-rate payments over the life of the agreements without exchange of the underlying principal amount.
67
For derivatives designated as cash flow hedges, the effective portion of changes in the fair value of the derivative is initially reported in other comprehensive income (outside of earnings) and subsequently reclassified to earnings when the hedged transaction affects earnings, and the ineffective portion of changes in the fair value of the derivative is recognized directly in earnings.
NNN discontinues hedge accounting prospectively when it is determined that the derivative is no longer effective in offsetting changes in the cash flows of the hedged item, the derivative expires or is sold, terminated, or exercised, the derivative is re-designated as a hedging instrument or management determines that designation of the derivative as a hedging instrument is no longer appropriate. When hedge accounting is discontinued, NNN continues to carry the derivative at its fair value on the balance sheet, and recognizes any changes in its fair value in earnings or may choose to cash settle the derivative at that time.
The following table outlines NNN's derivatives which were hedging the risk of changes in forecasted interest payments on forecasted issuance of long-term debt (dollars in thousands):
|
Terminated
|
Description
|
Aggregate Notional Amount
|
Fair Value When Terminated
(1)
|
Fair Value Deferred In Other Comprehensive Income
(2)
|
||||||
|
September 2007
|
Two interest rate hedges
|
$
|
100,000
|
|
$
|
3,260
|
|
$
|
3,228
|
|
|
June 2011
|
Two treasury locks
|
150,000
|
|
5,300
|
|
5,218
|
|
|||
|
April 2013
|
Four forward starting swaps
|
240,000
|
|
3,156
|
|
3,141
|
|
|||
|
May 2014
|
Three forward starting swaps
|
225,000
|
|
6,312
|
|
6,312
|
|
|||
(1)
Liability
(2)
The amount reported in accumulated other comprehensive income will be reclassified to interest expense as interest payments are made on the related notes payable.
As of
December 31, 2014
,
$13,579,000
remains in other comprehensive income related to the effective portion of NNN’s previous interest rate hedges. During the years ended
December 31,
2014
,
2013
and
2012
, NNN reclassified
$1,129,000
,
$438,000
and
$231,000
out of other comprehensive income as an increase to interest expense. Over the next
12
months, NNN estimates that an additional
$1,685,000
will be reclassified as an increase in interest expense. Amounts reported in accumulated other comprehensive income related to derivatives will be reclassified to interest expense as interest payments are made on NNN’s long-term debt.
NNN does not use derivatives for trading or speculative purposes or currently have any derivatives that are not designated as hedges. NNN had
no
derivative financial instruments outstanding at
December 31, 2014
.
In June 2007, NNN filed a registration statement on Form S-8 with the Commission which permits the issuance of up to
5,900,000
shares of common stock pursuant to NNN’s 2007 Performance Incentive Plan (the “2007 Plan”). The 2007 Plan replaced NNN’s previous Performance Incentive Plan. The 2007 Plan allows NNN to award or grant to key employees, directors and persons performing consulting or advisory services for NNN or its affiliates, stock options, stock awards, stock appreciation rights, Phantom Stock Awards, Performance Awards and Leveraged Stock Purchase Awards, each as defined in the 2007 Plan.
There were no stock options outstanding or exercisable at
December 31, 2014
.
68
Pursuant to the 2007 Plan, NNN has granted and issued shares of restricted stock to certain officers and key associates of NNN. The following summarizes the restricted stock activity for the year ended
December 31, 2014
:
|
Number
of
Shares
|
Weighted
Average
Share Price
|
|||||
|
Non-vested restricted shares, January 1
|
808,186
|
|
$
|
28.18
|
|
|
|
Restricted shares granted
|
371,434
|
|
33.38
|
|
||
|
Restricted shares vested
|
(162,622
|
)
|
23.77
|
|
||
|
Restricted shares forfeited
|
—
|
|
—
|
|
||
|
Restricted shares repurchased
|
(11,354
|
)
|
26.69
|
|
||
|
Non-vested restricted shares, December 31
|
1,005,644
|
|
$
|
30.93
|
|
|
Compensation expense for the restricted stock which is not contingent upon NNN’s performance goals is determined based upon the fair value at the date of grant and is recognized as the greater of the amount amortized over a straight lined basis or the amount vested over the vesting periods. Vesting periods for officers and key associates of NNN range from
three
to
five
years and generally vest yearly. NNN recognizes compensation expense on a straight-line basis for awards with only service conditions.
During the years ended
December 31
,
2014
and
2013
, NNN granted
177,433
and
152,901
, respectively, performance based shares subject to its total shareholder return growth after a
three years
period relative to its peers. The shares were granted to certain executive officers and had weighted average grant price of
$33.42
and
$33.73
, respectively, per share. Once the performance criteria are met and the actual number of shares earned is determined, the shares vest immediately. For the
2014
and
2013
grants, the conditions are based on market conditions, and the fair value was determined at the grant date (for a fair value share price of
$21.92
and
$21.54
, respectively). Compensation expense is recognized over the requisite service period for both grants.
The following summarizes other grants made during the year ended
December 31, 2014
, pursuant to the 2007 Plan.
|
Shares
|
Weighted
Average
Share Price
|
|||||
|
Other share grants under the 2007 Plan:
|
||||||
|
Directors’ fees
|
14,999
|
|
$
|
35.17
|
|
|
|
Deferred directors’ fees
|
16,061
|
|
35.20
|
|
||
|
31,060
|
|
$
|
35.19
|
|
||
|
Shares available under the 2007 Plan for grant, end of period
|
3,588,241
|
|
||||
The total compensation cost for share-based payments for the years ended
December 31
,
2014
,
2013
and
2012
, totaled
$9,224,000
,
$7,459,000
and
$8,131,000
, respectively, of such compensation expense. At
December 31, 2014
, NNN had
$12,852,000
of unrecognized compensation cost related to non-vested share-based compensation arrangements under the 2007 Plan. This cost is expected to be recognized over a weighted average period of
2.4
years. In addition, NNN recognized performance based long-term incentive cash compensation expense of
$729,000
and
$1,684,000
for the years ended December 31,
2013
and
2012
respectively. There was
no
long-term incentive cash recognized in
2014
.
NNN believes the carrying value of its Credit Facility approximates fair value based upon its nature, terms and variable interest rate. NNN believes that the carrying value of its cash and cash equivalents, mortgages, notes and other receivables, mortgages payable and other liabilities at
December 31,
2014
and
2013
, approximate fair value based upon current market prices of similar issues. At
December 31,
2014
and
2013
, the carrying value and fair value of NNN’s notes payable, collectively, was
$1,813,439,000
and
$1,555,672,000
, respectively, based upon quoted market prices, which are a Level 1 input.
69
The following table outlines NNN’s quarterly financial data (dollars in thousands, except per share data):
|
2014
|
First
Quarter
|
Second
Quarter
|
Third
Quarter
|
Fourth
Quarter
|
||||||||||||
|
Revenues as originally reported
(1)
|
$
|
104,064
|
|
$
|
105,613
|
|
$
|
109,856
|
|
$
|
115,315
|
|
||||
|
Net earnings attributable to NNN’s stockholders
|
$
|
43,333
|
|
$
|
45,571
|
|
$
|
47,940
|
|
$
|
53,757
|
|
||||
|
Net earnings per share
(2)
:
|
||||||||||||||||
|
Basic
|
$
|
0.28
|
|
$
|
0.30
|
|
$
|
0.31
|
|
$
|
0.35
|
|
||||
|
Diluted
|
0.28
|
|
0.30
|
|
0.31
|
|
0.35
|
|
||||||||
|
2013
|
|
|
|
|
||||||||||||
|
Revenues as originally reported
|
$
|
92,565
|
|
$
|
96,121
|
|
$
|
100,621
|
|
$
|
103,648
|
|
||||
|
Reclassified to discontinued operations
|
(100
|
)
|
173
|
|
155
|
|
344
|
|
||||||||
|
Adjusted revenue
|
$
|
92,465
|
|
$
|
96,294
|
|
$
|
100,776
|
|
$
|
103,992
|
|
||||
|
Net earnings attributable to NNN’s stockholders
|
$
|
34,066
|
|
$
|
37,486
|
|
$
|
44,352
|
|
$
|
44,241
|
|
||||
|
Net earnings per share
(2)
:
|
||||||||||||||||
|
Basic
|
$
|
0.26
|
|
$
|
0.28
|
|
$
|
0.29
|
|
$
|
0.29
|
|
||||
|
Diluted
|
0.25
|
|
0.27
|
|
0.29
|
|
0.29
|
|
||||||||
|
(1)
|
No revenues were reclassified to discontinued operations.
|
|
(2)
|
Calculated independently for each period and consequently, the sum of the quarters may differ from the annual amount.
|
For the years ended December 31, 2014, 2013 and 2012, NNN’s operations are reported within
one
business segment in the consolidated financial statements and all properties are part of the Properties or Property Portfolio.
NNN currently values its Residuals based upon a valuation which provides a discounted cash flow analysis based upon prepayment speeds, expected loan losses and yield curves. These valuation inputs are generally considered unobservable; therefore, the Residuals are considered Level 3 financial assets. The table below presents a rollforward of the Residuals during the
year ended
December 31, 2014
(dollars in thousands):
|
Balance at beginning of period
|
$
|
11,721
|
|
|
Total gains (losses) – realized/unrealized:
|
|||
|
Included in earnings
|
(256
|
)
|
|
|
Included in other comprehensive income
|
1,038
|
|
|
|
Interest income on Residuals
|
1,834
|
|
|
|
Cash received from Residuals
|
(2,711
|
)
|
|
|
Purchases, sales, issuances and settlements, net
|
—
|
|
|
|
Transfers in and/or out of Level 3
|
—
|
|
|
|
Balance at end of period
|
$
|
11,626
|
|
|
Changes in gains (losses) included in earnings attributable to a change
in unrealized gains (losses) relating to assets still held at the end of
period
|
$
|
163
|
|
As of
December 31, 2014
, NNN had
no
tenants that accounted for ten percent or more of its rental and earned income.
70
In the ordinary course of its business, NNN is a party to various other legal actions which management believes are routine in nature and incidental to the operation of the business of NNN. Management believes that the outcome of the proceedings will not have a material adverse effect upon its operations, financial condition or liquidity.
NNN reviewed all subsequent events and transactions that have occurred after
December 31, 2014
, the date of the consolidated balance sheet. There were no reportable subsequent events or transactions.
71
|
Item 9.
|
Changes in and Disagreements with Accountants on Accounting and Financial Disclosure
|
None.
|
Item 9A.
|
Controls and Procedures
|
Process for Assessment and Evaluation of Disclosure Controls and Procedures and Internal Control over Financing Reporting.
NNN carried out an assessment as of
December 31, 2014
, of the effectiveness of the design and operation of its disclosure controls and procedures and its internal control over financial reporting. This assessment was done under the supervision and with the participation of management, including NNN’s Chief Executive Officer and Chief Financial Officer. Rules adopted by the Securities and Exchange Commission (the “Commission”) require NNN to present the conclusions of the Chief Executive Officer and Chief Financial Officer about the effectiveness of NNN’s disclosure controls and procedures and the conclusions of NNN’s management about the effectiveness of NNN’s internal control over financial reporting as of the end of the period covered by this annual report.
CEO and CFO Certifications.
Included as Exhibits 31.1 and 31.2 to this Annual Report on Form 10-K are forms of “Certification” of NNN’s Chief Executive Officer and Chief Financial Officer. The forms of Certification are required in accordance with Section 302 of the Sarbanes-Oxley Act of 2002. This section of the Annual Report on Form 10-K that stockholders are currently reading is the information concerning the assessment referred to in the Section 302 certifications and this information should be read in conjunction with the Section 302 certifications for a more complete understanding of the topics presented.
Disclosure Controls and Procedures and Internal Control over Financial Reporting.
Disclosure controls and procedures are designed with the objective of providing reasonable assurance that information required to be disclosed in NNN’s reports filed or submitted under the Exchange Act, such as this Annual Report on Form 10-K, is recorded, processed, summarized and reported within the time periods specified in the Commission’s rules and forms. Disclosure controls and procedures are also designed with the objective of providing reasonable assurance that such information is accumulated and communicated to NNN’s management, including the Chief Executive Officer and Chief Financial Officer, as appropriate, to allow timely decisions regarding required disclosure.
Internal control over financial reporting is a process designed by, or under the supervision of, NNN’s Chief Executive Officer and Chief Financial Officer, and affected by NNN’s Board of Directors, management and other personnel, to provide reasonable assurance regarding the reliability of financial reporting and the preparation of financial statements for external purposes in accordance with generally accepted accounting principles (“GAAP”) and includes those policies and procedures that:
|
•
|
pertain to the maintenance of records that in reasonable detail accurately and fairly reflect the transactions and dispositions of NNN’s assets;
|
|
•
|
provide reasonable assurance that transactions are recorded as necessary to permit preparation of financial statements in accordance with generally accepted accounting principles, and that NNN’s receipts and expenditures are being made in accordance with authorizations of management or the Board of Directors; and
|
|
•
|
provide reasonable assurance regarding prevention or timely detection of unauthorized acquisition, use or disposition of NNN’s assets that could have a material adverse effect on NNN’s financial statements.
|
Scope of the Assessments.
The assessment by NNN’s Chief Executive Officer and Chief Financial Officer of NNN’s disclosure controls and procedures and the assessment by NNN’s management, including NNN’s Chief Executive Officer and Chief Financial Officer, of NNN’s internal control over financial reporting included a review of procedures and discussions with NNN’s management and others at NNN. In the course of the assessments, NNN sought to identify data errors, control problems or acts of fraud and to confirm that appropriate corrective action, including process improvements, were being undertaken.
NNN’s internal control over financial reporting is also assessed on an ongoing basis by personnel in NNN’s Accounting department and by NNN’s internal auditors in connection with their internal audit activities. The overall goals of these various assessment activities are to monitor NNN’s disclosure controls and procedures and NNN’s internal control over financial reporting and to make modifications as necessary. NNN’s intent in this regard is that the disclosure controls and procedures and the internal control over financial reporting will be maintained and updated (including with improvements and corrections) as conditions warrant. Management also sought to deal with other control matters in the assessment, and in each case if a problem was identified, management considered what revision, improvement and/or correction was necessary to be made in accordance with NNN’s on-going procedures. The assessments of NNN’s disclosure controls and procedures and NNN’s internal control
72
over financial reporting is done on a quarterly basis so that the conclusions concerning effectiveness of those controls can be reported in NNN’s Quarterly Reports on Form 10-Q and Annual Report on Form 10-K.
Assessment of Effectiveness of Disclosure Controls and Procedures.
Based upon the assessments, NNN’s Chief Executive Officer and Chief Financial Officer have concluded that, as of
December 31, 2014
, NNN’s disclosure controls and procedures were effective.
Management’s Report on Internal Control over Financial Reporting.
Management, including NNN’s Chief Executive Officer and Chief Financial Officer, are responsible for establishing and maintaining adequate internal control over financial reporting for NNN. Management used the criteria issued by the Committee of Sponsoring Organizations of the Treadway Commission in Internal Control – 2013 Integrated Framework to assess the effectiveness of NNN’s internal control over financial reporting. Based upon the assessments, NNN’s Chief Executive Officer and Chief Financial Officer have concluded that, as of
December 31, 2014
, NNN’s internal control over financial reporting was effective.
Attestation Report of the Registered Public Accounting Firm.
Ernst & Young LLP, NNN’s independent registered public accounting firm, audited the financial statements included in this Annual Report on Form 10-K and in connection therewith has issued an attestation report on NNN’s effectiveness of internal control over financial reporting, which appears in this Annual Report on Form 10-K.
Changes in Internal Control over Financial Reporting.
During the three months ended
December 31, 2014
, there were no changes in NNN’s internal control over financial reporting that materially affected, or are reasonably likely to materially affect, NNN’s internal control over financial reporting.
Limitations on the Effectiveness of Controls.
Management, including NNN’s Chief Executive Officer and Chief Financial Officer, do not expect that NNN’s disclosure controls and procedures or NNN’s internal control over financial reporting will prevent all errors and all fraud. A control system, no matter how well conceived and operated, can provide only reasonable, not absolute, assurance that the objectives of the control system are met. Further, the design of a control system must reflect the fact that there are resource constraints, and the benefits of controls must be considered relative to their costs. Because of the inherent limitations in all control systems, no evaluation of controls can provide absolute assurance that all control issues and instances of fraud, if any, within NNN have been detected. These inherent limitations include the realities that judgments in decision-making can be faulty, and that breakdowns can occur because of simple error or mistake. Additionally, controls can be circumvented by the individual acts of some persons, by collusion of two or more people, or by management’s override of the control. The design of any system of controls also is based in part upon certain assumptions about the likelihood of future events, and there can be no assurance that any design will succeed in achieving its stated goals under all potential future conditions; over time, controls may become inadequate because of changes in conditions, or the degree of compliance with the policies or procedures may deteriorate. Because of the inherent limitations in a cost-effective control system, misstatements due to error or fraud may occur and not be detected.
|
Item 9B.
|
Other Information
|
None.
73
|
Item 10.
|
Directors, Executive Officers and Corporate Governance
|
Reference is made to the Registrant’s definitive proxy statement to be filed with the Commission pursuant to Regulation 14(a); information responsive to this Item is included in the Registrant's proxy statement including the information, without limitation, contained in the sections thereof captioned “Proposal I: Election of Directors – Nominees,” “Proposal I: Election of Directors – Executive Officers,” “Proposal I: Election of Directors – Code of Business Conduct” and “Security Ownership ”, and such information in such sections is incorporated herein by reference.
|
Item 11.
|
Executive Compensation
|
Reference is made to the Registrant’s definitive proxy statement to be filed with the Commission pursuant to Regulation 14(a); information responsive to this Item is included in the Registrant's proxy statement including the information, without limitation, contained in the sections thereof captioned “Proposal I: Election of Directors – Compensation of Directors,” “Executive Compensation” and “Compensation Committee Report”, and such information is incorporated herein by reference.
|
Item 12.
|
Security Ownership of Certain Beneficial Owners and Management and Related Stockholder Matters
|
Reference is made to the Registrant’s definitive proxy statement to be filed with the Commission pursuant to Regulation 14(a); information responsive to this Item is included in the Registrant's proxy statement including the information, without limitation, contained in the section thereof captioned “Executive Compensation – Equity Compensation Plan Information,” and “Security Ownership”, and such information is incorporated herein by reference.
|
Item 13.
|
Certain Relationships and Related Transactions, and Director Independence
|
Reference is made to the Registrant’s definitive proxy statement to be filed with the Commission pursuant to Regulation 14(a); information responsive to this Item is included in the Registrant's proxy statement including the information, without limitation, contained in the section thereof captioned “Certain Relationships and Related Transactions” and such information is incorporated herein by reference.
|
Item 14.
|
Principal Accountant Fees and Services
|
Reference is made to the Registrant’s definitive proxy statement to be filed with the Commission pursuant to Regulation 14(a); information responsive to this Item is included in the Registrant's proxy statement including the information, without limitation, contained in the section thereof captioned “Audit Committee Report” and “Proposal II: Proposal to Ratify Independent Registered Public Accounting Firm”, and such information is incorporated herein by reference.
74
|
Item 15.
|
Exhibits and Financial Statement Schedules
|
|
(a)
|
The following documents are filed as part of this report
|
||||
|
(1)
|
Financial Statements
|
|
|||
|
(2)
|
Financial Statement Schedules
|
||||
|
Schedule III – Real Estate and Accumulated Depreciation and Amortization and Notes as of December 31, 2014
|
|||||
|
Schedule IV – Mortgage Loans on Real Estate and Notes as of December 31, 2014
|
|||||
|
All other schedules are omitted because they are not applicable or because the required information is shown in the financial statements or the notes thereto.
|
|||||
|
(3)
|
Exhibits
|
||||
The following exhibits are filed as a part of this report.
|
3.
|
Articles of Incorporation and Bylaws
|
|||
|
3.1
|
First Amended and Restated Articles of Incorporation of the Registrant, as amended (filed as Exhibit 3.1 to the Registrant’s Quarterly Report on Form 10-Q filed with the Securities and Exchange Commission on August 3, 2012, and incorporated herein by reference).
|
|||
|
3.2
|
Articles Supplementary Establishing and Fixing the Rights and Preferences of 6.625% Series D Cumulative Preferred Stock, par value $0.01 per share, dated February 21, 2012 (filed as Exhibit 3.1 to the Registrant’s Current Report on Form 8-K dated February 23, 2012, incorporated herein by reference).
|
|||
|
3.3
|
Articles Supplementary Establishing and Fixing the Rights and Preferences of 5.700% Series E Cumulative Preferred Stock, par value $0.01 per share, dated May 29, 2013 (filed as Exhibit 3.1 to the Registrant’s Current Report on Form 8-K dated May 30, 2013, incorporated herein by reference).
|
|||
|
3.4
|
Third Amended and Restated Bylaws of the Registrant, dated May 1, 2006, as amended (filed as Exhibit 3.4 to the Registrant’s Annual Report on Form 10-K filed with the Securities and Exchange Commission on February 19, 2014, and incorporated herein by reference).
|
|||
|
3.5
|
Second Amendment to the Third Amended and Restated Bylaws of the Registrant, dated December 13, 2007 (filed as Exhibit 3.5 to the Registrant’s Annual Report on Form 10-K filed with the Securities and Exchange Commission on February 19, 2014, and incorporated herein by reference).
|
|||
|
3.6
|
Third Amendment to the Third Amended and Restated Bylaws of the Registrant, dated February 13, 2014 (filed as Exhibit 3.6 to the Registrant’s Annual Report on Form 10-K filed with the Securities and Exchange Commission on February 19, 2014, and incorporated herein by reference).
|
|||
|
4.
|
Instruments Defining the Rights of Security Holders, Including Indentures
|
|||
|
4.1
|
Specimen Certificate of Common Stock, par value $0.01 per share, of the Registrant (filed as Exhibit 3.4 to the Registrant’s Registration Statement No. 1-11290 on Form 8-B filed with the Securities and Exchange Commission and incorporated herein by reference).
|
|||
75
|
4.2
|
Indenture, dated as of March 25, 1998, between the Registrant and First Union National Bank, as trustee (filed as Exhibit 4.4 to the Registrant’s Registration Statement on Form S-3 (Registration No. 333-132095) filed with the Securities and Exchange Commission on February 28, 2006, and incorporated herein by reference).
|
|||
|
4.3
|
Form of Supplemental Indenture No. 6 dated as of November 17, 2005, by and among Registrant and Wachovia Bank, National Association, Trustee, relating to $150,000,000 of 6.15% Notes due 2015 (filed as Exhibit 4.1 to the Registrant’s Current Report on Form 8-K dated November 14, 2005 and filed with the Securities and Exchange Commission on November 17, 2005, and incorporated herein by reference).
|
|||
|
4.4
|
Form of 6.15% Notes due 2015 (filed as Exhibit 4.2 to the Registrant’s Current Report on Form 8-K dated November 14, 2005 and filed with the Securities and Exchange Commission on November 17, 2005, and incorporated herein by reference).
|
|||
|
4.5
|
Specimen certificate representing the 6.625% Series D Cumulative Redeemable Preferred Stock, par value $.01 per share, of the Registrant (filed as Exhibit 4.4 to the Registrant’s Registration Statement on Form 8-A dated February 22, 2012 and filed with the Securities and Exchange Commission on February 22, 2012, and incorporated herein by reference).
|
|||
|
4.6
|
Deposit Agreement, among the Registrant, American Stock Transfer & Trust Company, as Depositary, and the holders of depositary receipts (filed as Exhibit 4.20 to the Registrant’s Quarterly Report on Form 10-Q filed with the Securities and Exchange Commission on May 4, 2012, and incorporated herein by reference).
|
|||
|
4.7
|
Form of Supplemental Indenture No. 8 between National Retail Properties, Inc. and U.S. Bank National Association relating to 6.875% Notes due 2017 (filed as Exhibit 4.1 to Registrant’s Current Report on Form 8-K dated and filed with the Securities and Exchange Commission on September 4, 2007, and incorporated herein by reference).
|
|||
|
4.8
|
Form of 6.875% Notes due 2017 (filed as Exhibit 4.2 to the Registrant’s Current Report on Form 8-K dated and filed with the Securities and Exchange Commission on September 4, 2007, and incorporated herein by reference).
|
|||
|
4.9
|
Form of Tenth Supplemental Indenture between National Retail Properties, Inc. and U.S. Bank National Association relating to 5.500% Notes due 2021 (filed as Exhibit 4.1 to Registrant's Current Report on Form 8-K dated July 6, 2011 and filed with the Securities and Exchange Commission on July 6, 2011, and incorporated herein by reference).
|
|||
|
4.10
|
Form of 5.500% Notes due 2021 (filed as Exhibit 4.2 to the Registrant's Current Report on Form 8-K dated July 6, 2011 and filed with the Securities and Exchange Commission on July 6, 2011, and incorporated herein by reference).
|
|||
|
4.11
|
Form of Eleventh Supplemental Indenture between National Retail Properties, Inc. and U.S. Bank National Association relating to 3.80% Notes due 2022 (filed as Exhibit 4.1 to Registrant's Current Report on Form 8-K dated August 14, 2012, filed with the Securities and Exchange Commission on August 14, 2012 and incorporated herein by reference).
|
|||
|
4.12
|
Form of 3.800% Notes due 2022 (filed as Exhibit 4.2 to Registrant's Current Report on Form 8-K dated August 14, 2012, filed with the Securities and Exchange Commission on August 14, 2012 and incorporated herein by reference).
|
|||
|
4.13
|
Form of Twelfth Supplemental Indenture between National Retail Properties, Inc. and U.S. Bank National Association relating to 3.300% Notes due 2023 (filed as Exhibit 4.1 to Registrant's Current Report on Form 8-K dated April 9, 2013, filed with the Securities and Exchange Commission on April 15, 2013 and incorporated herein by reference).
|
|||
|
4.14
|
Form of 3.300% Notes due 2023 (filed as Exhibit 4.2 to Registrant's Current Report on Form 8-K dated April 9, 2013, filed with the Securities and Exchange Commission on April 15, 2013 and incorporated herein by reference).
|
|||
|
4.15
|
Specimen certificate representing the 5.700% Series E Cumulative Redeemable Preferred Stock, par value $.01 per share, of the Registrant (filed as Exhibit 4.3 to the Registrant’s Registration Statement on Form 8-A filed with the Securities and Exchange Commission on May 30, 2013 and incorporated herein by reference).
|
|||
|
4.16
|
Deposit Agreement, among the Registrant, American Stock Transfer & Trust Company, as Depositary, and the holders of depositary receipts (filed as Exhibit 4.1 to the Registrant’s Registration Statement on Form 8-A filed with the Securities and Exchange Commission on May 30, 2013 and incorporated herein by reference).
|
|||
76
|
4.17
|
Form of Thirteenth Supplemental Indenture between National Retail Properties, Inc. and U.S. Bank National Association relating to 3.900% Notes due 2024 (filed as Exhibit 4.1 to Registrant's Current Report on Form 8-K and filed with the Securities and Exchange Commission on May 14, 2014, and incorporated herein by reference).
|
|||
|
4.18
|
Form of 3.900% Notes due 2024 (filed as Exhibit 4.2 to Registrant's Current Report on Form 8-K and filed with the Securities and Exchange Commission on May 14, 2014, and incorporated herein by reference).
|
|||
|
10.
|
Material Contracts
|
|||
|
10.1
|
2007 Performance Incentive Plan (filed as Annex A to the Registrant’s 2007 Annual Proxy Statement on Schedule 14A filed with the Securities and Exchange Commission on April 3, 2007, and incorporated herein by reference).
|
|||
|
10.2
|
Form of Restricted Stock Agreement between NNN and the Participant of NNN (filed as Exhibit 10.2 to the Registrant’s Annual Report on Form 10-K filed with the Securities and Exchange Commission on March 15, 2005, and incorporated herein by reference).
|
|||
|
10.3
|
Employment Agreement dated as of December 1, 2008, between the Registrant and Craig Macnab (filed as Exhibit 10.1 to the Registrant’s Current Report on Form 8-K filed with the Securities and Exchange Commission on December 3, 2008, and incorporated herein by reference).
|
|||
|
10.4
|
Employment Agreement dated as of December 1, 2008, between the Registrant and Julian E. Whitehurst (filed as Exhibit 10.2 to the Registrant’s Current Report on Form 8-K filed with the Securities and Exchange Commission on December 3, 2008, and incorporated herein by reference).
|
|||
|
10.5
|
Employment Agreement dated as of December 1, 2008, between the Registrant and Kevin B. Habicht (filed as Exhibit 10.3 to the Registrant’s Current Report on Form 8-K filed with the Securities and Exchange Commission on December 3, 2008, and incorporated herein by reference).
|
|||
|
10.6
|
Employment Agreement dated as of December 1, 2008, between the Registrant and Paul E. Bayer (filed as Exhibit 10.5 to the Registrant’s Current Report on Form 8-K filed with the Securities and Exchange Commission on December 3, 2008, and incorporated herein by reference).
|
|||
|
10.7
|
Employment Agreement dated as of December 1, 2008, between the Registrant and Christopher P. Tessitore (filed as Exhibit 10.4 to the Registrant’s Current Report on Form 8-K filed with the Securities and Exchange Commission on December 3, 2008, and incorporated herein by reference).
|
|||
|
10.8
|
Form of Indemnification Agreement (as entered into between the Registrant and each of its directors and executive officers) (filed as Exhibit 10.1 to the Registrant’s Current Report on Form 8-K dated and filed with the Securities and Exchange Commission on June 12, 2009, and incorporated herein by reference).
|
|||
|
10.9
|
Amendment to Employment Agreement dated as of November 8, 2010, between the Registrant and Craig Macnab (filed as Exhibit 10.10 to the Registrant’s Annual Report on Form 10-K filed with the Securities and Exchange Commission on February 24, 2011, and incorporated herein by reference).
|
|||
|
10.10
|
Amendment to Employment Agreement dated as of November 8, 2010, between the Registrant and Julian E. Whitehurst (filed as Exhibit 10.11 to the Registrant’s Annual Report on Form 10-K filed with the Securities and Exchange Commission on February 24, 2011, and incorporated herein by reference).
|
|||
|
10.11
|
Amendment to Employment Agreement dated as of November 8, 2010, between the Registrant and Kevin B. Habicht (filed as Exhibit 10.12 to the Registrant’s Annual Report on Form 10-K filed with the Securities and Exchange Commission on February 24, 2011, and incorporated herein by reference).
|
|||
|
10.12
|
Amendment to Employment Agreement dated as of November 8, 2010, between the Registrant and Paul E. Bayer (filed as Exhibit 10.13 to the Registrant’s Annual Report on Form 10-K filed with the Securities and Exchange Commission on February 24, 2011, and incorporated herein by reference).
|
|||
|
10.13
|
Amendment to Employment Agreement dated as of November 8, 2010, between the Registrant and Christopher P. Tessitore (filed as Exhibit 10.14 to the Registrant’s Annual Report on Form 10-K filed with the Securities and Exchange Commission on February 24, 2011, and incorporated herein by reference).
|
|||
77
|
10.14
|
Amended and Restated Credit Agreement, dated as of May 25, 2011, by and among the Registrant, certain lenders and Wells Fargo Bank, National Association, as the Administrative Agent (filed as Exhibit 10.1 to the Registrant's Current Report on Form 8-K filed with the Securities and Exchange Commission on June 6, 2011, and incorporated herein by reference).
|
|||
|
10.15
|
Form of Restricted Award Agreement - Performance between NNN and the Participant of NNN (filed as Exhibit 10.15 to the Registrant’s Quarterly Report on Form 10-Q filed with the Securities and Exchange Commission on May 4, 2012, and incorporated herein by reference).
|
|||
|
10.16
|
Form of Restricted Award Agreement - Service between NNN and the Participant of NNN (filed as Exhibit 10.16 to the Registrant’s Quarterly Report on Form 10-Q filed with the Securities and Exchange Commission on May 4, 2012, and incorporated herein by reference).
|
|||
|
10.17
|
Form of Restricted Award Agreement - Special Grant between NNN and the Participant of NNN (filed as Exhibit 10.17 to the Registrant’s Quarterly Report on Form 10-Q filed with the Securities and Exchange Commission on May 4, 2012, and incorporated herein by reference).
|
|||
|
10.18
|
First Amendment to Amended and Restated Credit Agreement, dated as of October 31, 2012, by and among the Registrant, certain lenders and Wells Fargo Bank, National Association, as the Administrative Agent (filed as Exhibit 10.1 to the Registrant's Current Report on Form 8-K filed with the Securities and Exchange Commission on November 1, 2012, and incorporated herein by reference).
|
|||
|
10.19
|
Employment Agreement dated as of January 2, 2014, between the Registrant and Stephen A. Horn, Jr. (filed as Exhibit 10.19 to the Registrant’s Annual Report on Form 10-K filed with the Securities and Exchange Commission on February 19, 2014, and incorporated herein by reference).
|
|||
|
10.20
|
Second Amendment to Amended and Restated Credit Agreement, dated as of October 27, 2014, by and among the Registrant, certain lenders and Wells Fargo Bank, National Association, as the Administrative Agent (filed as Exhibit 10.1 to the Registrant's Current Report on Form 8-K filed with the Securities and Exchange Commission on October 28, 2014, and incorporated herein by reference).
|
|||
|
12.
|
Statement of Computation of Ratios of Earnings to Fixed Charges (filed herewith).
|
|||
|
21.
|
Subsidiaries of the Registrant (filed herewith).
|
|||
|
23.
|
Consent of Independent Accountants
|
|||
|
23.1
|
Ernst & Young LLP dated February 20, 2015 (filed herewith).
|
|||
|
24.
|
Power of Attorney (included on signature page).
|
|||
|
31.
|
Section 302 Certifications
|
|||
|
31.1
|
Certification of Chief Executive Officer pursuant to Rule 13a-14(a) of the Securities Exchange Act of 1934, as adopted pursuant to Section 302 of the Sarbanes-Oxley Act of 2002 (filed herewith).
|
|||
|
31.2
|
Certification of Chief Financial Officer pursuant to Rule 13a-14(a) of the Securities Exchange Act of 1934, as adopted pursuant to Section 302 of the Sarbanes-Oxley Act of 2002 (filed herewith).
|
|||
|
32.
|
Section 906 Certifications
|
|||
|
32.1
|
Certification of Chief Executive Officer pursuant to 18 U.S.C. Section 1350, as adopted pursuant to Section 906 of the Sarbanes-Oxley Act of 2002 (filed herewith).
|
|||
|
32.2
|
Certification of Chief Financial Officer pursuant to 18 U.S.C. Section 1350, as adopted pursuant to Section 906 of the Sarbanes-Oxley Act of 2002 (filed herewith).
|
|||
|
99.
|
Additional Exhibits
|
|||
|
99.1
|
Certification of Chief Executive Officer pursuant to Section 303A.12(a) of the New York Stock Exchange Listed Company Manual (filed herewith).
|
|||
78
|
101.
|
Interactive Data File
|
|||
|
101.1
|
The following materials from National Retail Properties, Inc. Annual Report on Form 10-K for the period ended December 31, 2014, are formatted in Extensible Business Reporting Language: (i) consolidated balance sheets, (ii) consolidated statements of comprehensive income, (iii) consolidated statements of cash flows, and (iv) notes to consolidated financial statements.
|
|||
79
SIGNATURES
Pursuant to the requirements of Section 13 or 15(d) of the Securities Exchange Act of 1934, the Registrant has duly caused this report to be signed on its behalf by the undersigned, thereunto duly authorized, on the
20th day of February, 2015
.
|
NATIONAL RETAIL PROPERTIES, INC.
|
||
|
By:
|
/s/ Craig Macnab
|
|
|
|
Craig Macnab
|
|
|
|
Chairman of the Board and Chief Executive Officer
|
|
Pursuant to the requirements of the Securities Exchange Act of 1934, this report has been signed below by the following persons on behalf of the Registrant and in the capacities and on the dates indicated.
80
POWER OF ATTORNEY
Each person whose signature appears below hereby constitutes and appoints each of Craig Macnab and Kevin B. Habicht as his attorney-in-fact and agent, with full power of substitution and resubstitution for him in any and all capacities, to sign any or all amendments to this report and to file same, with exhibits thereto and other documents in connection therewith, granting unto such attorney-in-fact and agent full power and authority to do and perform each and every act and thing requisite and necessary in connection with such matters and hereby ratifying and confirming all that such attorney-in-fact and agent or his substitutes may do or cause to be done by virtue hereof.
|
Signature
|
Title
|
Date
|
||
|
/s/ Craig Macnab
|
Chairman of the Board and Chief Executive
Officer (Principal Executive Officer)
|
February 20, 2015
|
||
|
Craig Macnab
|
||||
|
/s/ Ted B. Lanier
|
Lead Director
|
February 20, 2015
|
||
|
Ted B. Lanier
|
||||
|
/s/ Don DeFosset
|
Director
|
February 20, 2015
|
||
|
Don DeFosset
|
||||
|
/s/ David M. Fick
|
Director
|
February 20, 2015
|
||
|
David M. Fick
|
||||
|
/s/ Edward J. Fritsch
|
Director
|
February 20, 2015
|
||
|
Edward J. Fritsch
|
||||
|
/s/ Richard B. Jennings
|
Director
|
February 20, 2015
|
||
|
Richard B. Jennings
|
||||
|
/s/ Robert C. Legler
|
Director
|
February 20, 2015
|
||
|
Robert C. Legler
|
||||
|
/s/ Robert Martinez
|
Director
|
February 20, 2015
|
||
|
Robert Martinez
|
||||
|
/s/ Kevin B. Habicht
|
Director, Chief Financial Officer
(Principal Financial and Accounting Officer),
Executive Vice President, Assistant Secretary and Treasurer
|
February 20, 2015
|
||
|
Kevin B. Habicht
|
||||
81
Exhibit Index
|
3.
|
Articles of Incorporation and Bylaws
|
||
|
3.1
|
First Amended and Restated Articles of Incorporation of the Registrant, as amended (filed as Exhibit 3.1 to the Registrant’s Quarterly Report on Form 10-Q filed with the Securities and Exchange Commission on August 3, 2012, and incorporated herein by reference).
|
||
|
3.2
|
Articles Supplementary Establishing and Fixing the Rights and Preferences of 6.625% Series D Cumulative Preferred Stock, par value $0.01 per share, dated February 21, 2012 (filed as Exhibit 3.1 to the Registrant’s Current Report on Form 8-K dated February 23, 2012, incorporated herein by reference).
|
||
|
3.3
|
|
Articles Supplementary Establishing and Fixing the Rights and Preferences of 5.700% Series E Cumulative Preferred Stock, par value $0.01 per share, dated May 29, 2013 (filed as Exhibit 3.1 to the Registrant’s Current Report on Form 8-K dated May 30, 2013, incorporated herein by reference).
|
|
|
3.4
|
|
Third Amended and Restated Bylaws of the Registrant, dated May 1, 2006, as amended (filed as Exhibit 3.4 to the Registrant’s Annual Report on Form 10-K filed with the Securities and Exchange Commission on February 19, 2014, and incorporated herein by reference).
|
|
|
3.5
|
|
Second Amendment to the Third Amended and Restated Bylaws of the Registrant, dated December 13, 2007 (filed as Exhibit 3.5 to the Registrant’s Annual Report on Form 10-K filed with the Securities and Exchange Commission on February 19, 2014, and incorporated herein by reference).
|
|
|
3.6
|
|
Third Amendment to the Third Amended and Restated Bylaws of the Registrant, dated February 13, 2014 (filed as Exhibit 3.6 to the Registrant’s Annual Report on Form 10-K filed with the Securities and Exchange Commission on February 19, 2014, and incorporated herein by reference).
|
|
|
4.
|
Instruments Defining the Rights of Security Holders, Including Indentures
|
||
|
4.1
|
|
Specimen Certificate of Common Stock, par value $0.01 per share, of the Registrant (filed as Exhibit 3.4 to the Registrant’s Registration Statement No. 1-11290 on Form 8-B filed with the Securities and Exchange Commission and incorporated herein by reference).
|
|
|
4.2
|
|
Indenture, dated as of March 25, 1998, between the Registrant and First Union National Bank, as trustee (filed as Exhibit 4.4 to the Registrant’s Registration Statement on Form S-3 (Registration No. 333-132095) filed with the Securities and Exchange Commission on February 28, 2006, and incorporated herein by reference).
|
|
|
4.3
|
|
Form of Supplemental Indenture No. 6 dated as of November 17, 2005, by and among Registrant and Wachovia Bank, National Association, Trustee, relating to $150,000,000 of 6.15% Notes due 2015 (filed as Exhibit 4.1 to the Registrant’s Current Report on Form 8-K dated November 14, 2005 and filed with the Securities and Exchange Commission on November 17, 2005, and incorporated herein by reference).
|
|
|
4.4
|
|
Form of 6.15% Notes due 2015 (filed as Exhibit 4.2 to the Registrant’s Current Report on Form 8-K dated November 14, 2005 and filed with the Securities and Exchange Commission on November 17, 2005, and incorporated herein by reference).
|
|
|
4.5
|
|
Specimen certificate representing the 6.625% Series D Cumulative Redeemable Preferred Stock, par value $.01 per share, of the Registrant (filed as Exhibit 4.4 to the Registrant’s Registration Statement on Form 8-A dated February 22, 2012 and filed with the Securities and Exchange Commission on February 22, 2012, and incorporated herein by reference).
|
|
|
4.6
|
|
Deposit Agreement, among the Registrant, American Stock Transfer & Trust Company, as Depositary, and the holders of depositary receipts (filed as Exhibit 4.20 to the Registrant’s Quarterly Report on Form 10-Q filed with the Securities and Exchange Commission on May 4, 2012, and incorporated herein by reference).
|
|
|
4.7
|
|
Form of Supplemental Indenture No. 8 between National Retail Properties, Inc. and U.S. Bank National Association relating to 6.875% Notes due 2017 (filed as Exhibit 4.1 to Registrant’s Current Report on Form 8-K dated and filed with the Securities and Exchange Commission on September 4, 2007, and incorporated herein by reference).
|
|
|
4.8
|
|
Form of 6.875% Notes due 2017 (filed as Exhibit 4.2 to the Registrant’s Current Report on Form 8-K dated and filed with the Securities and Exchange Commission on September 4, 2007, and incorporated herein by reference).
|
|
82
|
4.9
|
|
Form of Tenth Supplemental Indenture between National Retail Properties, Inc. and U.S. Bank National Association relating to 5.500% Notes due 2021 (filed as Exhibit 4.1 to Registrant's Current Report on Form 8-K dated July 6, 2011 and filed with the Securities and Exchange Commission on July 6, 2011, and incorporated herein by reference).
|
|
|
4.1
|
|
Form of 5.500% Notes due 2021 (filed as Exhibit 4.2 to the Registrant's Current Report on Form 8-K dated July 6, 2011 and filed with the Securities and Exchange Commission on July 6, 2011, and incorporated herein by reference).
|
|
|
4.11
|
|
Form of Eleventh Supplemental Indenture between National Retail Properties, Inc. and U.S. Bank National Association relating to 3.80% Notes due 2022 (filed as Exhibit 4.1 to Registrant's Current Report on Form 8-K dated August 14, 2012, filed with the Securities and Exchange Commission on August 14, 2012 and incorporated herein by reference).
|
|
|
4.12
|
|
Form of 3.800% Notes due 2022 (filed as Exhibit 4.2 to Registrant's Current Report on Form 8-K dated August 14, 2012, filed with the Securities and Exchange Commission on August 14, 2012 and incorporated herein by reference).
|
|
|
4.13
|
|
Form of Twelfth Supplemental Indenture between National Retail Properties, Inc. and U.S. Bank National Association relating to 3.300% Notes due 2023 (filed as Exhibit 4.1 to Registrant's Current Report on Form 8-K dated April 9, 2013, filed with the Securities and Exchange Commission on April 15, 2013 and incorporated herein by reference).
|
|
|
4.14
|
|
Form of 3.300% Notes due 2023 (filed as Exhibit 4.2 to Registrant's Current Report on Form 8-K dated April 9, 2013, filed with the Securities and Exchange Commission on April 15, 2013 and incorporated herein by reference).
|
|
|
4.15
|
|
Specimen certificate representing the 5.700% Series E Cumulative Redeemable Preferred Stock, par value $.01 per share, of the Registrant (filed as Exhibit 4.3 to the Registrant’s Registration Statement on Form 8-A filed with the Securities and Exchange Commission on May 30, 2013 and incorporated herein by reference).
|
|
|
4.16
|
|
Deposit Agreement, among the Registrant, American Stock Transfer & Trust Company, as Depositary, and the holders of depositary receipts (filed as Exhibit 4.1 to the Registrant’s Registration Statement on Form 8-A filed with the Securities and Exchange Commission on May 30, 2013 and incorporated herein by reference).
|
|
|
4.17
|
|
Form of Thirteenth Supplemental Indenture between National Retail Properties, Inc. and U.S. Bank National Association relating to 3.900% Notes due 2024 (filed as Exhibit 4.1 to Registrant's Current Report on Form 8-K and filed with the Securities and Exchange Commission on May 14, 2014, and incorporated herein by reference).
|
|
|
4.18
|
|
Form of 3.900% Notes due 2024 (filed as Exhibit 4.2 to Registrant's Current Report on Form 8-K and filed with the Securities and Exchange Commission on May 14, 2014, and incorporated herein by reference).
|
|
|
10.
|
Material Contracts
|
||
|
10.1
|
|
2007 Performance Incentive Plan (filed as Annex A to the Registrant’s 2007 Annual Proxy Statement on Schedule 14A filed with the Securities and Exchange Commission on April 3, 2007, and incorporated herein by reference).
|
|
|
10.2
|
|
Form of Restricted Stock Agreement between NNN and the Participant of NNN (filed as Exhibit 10.2 to the Registrant’s Annual Report on Form 10-K filed with the Securities and Exchange Commission on March 15, 2005, and incorporated herein by reference).
|
|
|
10.3
|
|
Employment Agreement dated as of December 1, 2008, between the Registrant and Craig Macnab (filed as Exhibit 10.1 to the Registrant’s Current Report on Form 8-K filed with the Securities and Exchange Commission on December 3, 2008, and incorporated herein by reference).
|
|
|
10.4
|
|
Employment Agreement dated as of December 1, 2008, between the Registrant and Julian E. Whitehurst (filed as Exhibit 10.2 to the Registrant’s Current Report on Form 8-K filed with the Securities and Exchange Commission on December 3, 2008, and incorporated herein by reference).
|
|
|
10.5
|
|
Employment Agreement dated as of December 1, 2008, between the Registrant and Kevin B. Habicht (filed as Exhibit 10.3 to the Registrant’s Current Report on Form 8-K filed with the Securities and Exchange Commission on December 3, 2008, and incorporated herein by reference).
|
|
|
10.6
|
|
Employment Agreement dated as of December 1, 2008, between the Registrant and Paul E. Bayer (filed as Exhibit 10.5 to the Registrant’s Current Report on Form 8-K filed with the Securities and Exchange Commission on December 3, 2008, and incorporated herein by reference).
|
|
83
|
10.7
|
|
Employment Agreement dated as of December 1, 2008, between the Registrant and Christopher P. Tessitore (filed as Exhibit 10.4 to the Registrant’s Current Report on Form 8-K filed with the Securities and Exchange Commission on December 3, 2008, and incorporated herein by reference).
|
|
|
10.8
|
|
Form of Indemnification Agreement (as entered into between the Registrant and each of its directors and executive officers) (filed as Exhibit 10.1 to the Registrant’s Current Report on Form 8-K dated and filed with the Securities and Exchange Commission on June 12, 2009, and incorporated herein by reference).
|
|
|
10.9
|
|
Amendment to Employment Agreement, dated as of November 8, 2010, between the Registrant and Craig Macnab (filed as Exhibit 10.10 to the Registrant’s Annual Report on Form 10-K filed with the Securities and Exchange Commission on February 24, 2011, and incorporated herein by reference).
|
|
|
10.10
|
|
Amendment to Employment Agreement dated as of November 8, 2010, between the Registrant and Julian E. Whitehurst (filed as Exhibit 10.11 to the Registrant’s Annual Report on Form 10-K filed with the Securities and Exchange Commission on February 24, 2011, and incorporated herein by reference).
|
|
|
10.11
|
|
Amendment to Employment Agreement dated as of November 8, 2010, between the Registrant and Kevin B. Habicht (filed as Exhibit 10.12 to the Registrant’s Annual Report on Form 10-K filed with the Securities and Exchange Commission on February 24, 2011, and incorporated herein by reference).
|
|
|
10.12
|
|
Amendment to Employment Agreement dated as of November 8, 2010, between the Registrant and Paul E. Bayer (filed as Exhibit 10.13 to the Registrant’s Annual Report on Form 10-K filed with the Securities and Exchange Commission on February 24, 2011, and incorporated herein by reference).
|
|
|
10.13
|
|
Amendment to Employment Agreement dated as of November 8, 2010, between the Registrant and Christopher P. Tessitore (filed as Exhibit 10.14 to the Registrant’s Annual Report on Form 10-K filed with the Securities and Exchange Commission on February 24, 2011, and incorporated herein by reference).
|
|
|
10.14
|
|
Amended and Restated Credit Agreement, dated as of May 25, 2011, by and among the Registrant, certain lenders and Wells Fargo Bank, National Association, as the Administrative Agent (filed as Exhibit 10.1 to the Registrant's Current Report on Form 8-K filed with the Securities and Exchange Commission on June 6, 2011, and incorporated herein by reference).
|
|
|
10.15
|
|
Form of Restricted Award Agreement - Performance between NNN and the Participant of NNN (filed as Exhibit 10.15 to the Registrant’s Quarterly Report on Form 10-Q filed with the Securities and Exchange Commission on May 4, 2012, and incorporated herein by reference).
|
|
|
10.16
|
|
Form of Restricted Award Agreement - Service between NNN and the Participant of NNN (filed as Exhibit 10.16 to the Registrant’s Quarterly Report on Form 10-Q filed with the Securities and Exchange Commission on May 4, 2012, and incorporated herein by reference).
|
|
|
10.17
|
|
Form of Restricted Award Agreement - Service between NNN and the Participant of NNN (filed as Exhibit 10.17 to the Registrant’s Quarterly Report on Form 10-Q filed with the Securities and Exchange Commission on May 4, 2012, and incorporated herein by reference).
|
|
|
10.18
|
|
First Amendment to Amended and Restated Credit Agreement, dated as of October 31, 2012, by and among the Registrant, certain lenders and Wells Fargo Bank, National Association, as the Administrative Agent (filed as Exhibit 10.1 to the Registrant's Current Report on Form 8-K filed with the Securities and Exchange Commission on November 1, 2012, and incorporated herein by reference).
|
|
|
10.19
|
|
Employment Agreement dated as of January 2, 2014, between the Registrant and Stephen A. Horn, Jr. (filed as Exhibit 10.19 to the Registrant’s Annual Report on Form 10-K filed with the Securities and Exchange Commission on February 19, 2014, and incorporated herein by reference).
|
|
|
10.20
|
|
Second Amendment to Amended and Restated Credit Agreement, dated as of October 27, 2014, by and among the Registrant, certain lenders and Wells Fargo Bank, National Association, as the Administrative Agent (filed as Exhibit 10.1 to the Registrant's Current Report on Form 8-K filed with the Securities and Exchange Commission on October 28, 2014, and incorporated herein by reference).
|
|
|
12.
|
Statement of Computation of Ratios of Earnings to Fixed Charges (filed herewith).
|
||
|
21.
|
Subsidiaries of the Registrant (filed herewith).
|
||
|
23.
|
Consent of Independent Accountants
|
||
|
23.1
|
|
Ernst & Young LLP dated February 20, 2015 (filed herewith).
|
|
|
24.
|
Power of Attorney (included on signature page).
|
||
84
|
31.
|
Section 302 Certifications
|
||
|
31.1
|
|
Certification of Chief Executive Officer pursuant to Rule 13a-14(a) of the Securities Exchange Act of 1934, as adopted pursuant to Section 302 of the Sarbanes-Oxley Act of 2002 (filed herewith).
|
|
|
31.2
|
|
Certification of Chief Financial Officer pursuant to Rule 13a-14(a) of the Securities Exchange Act of 1934, as adopted pursuant to Section 302 of the Sarbanes-Oxley Act of 2002 (filed herewith).
|
|
|
32.
|
Section 906 Certifications
|
||
|
32.1
|
|
Certification of Chief Executive Officer pursuant to 18 U.S.C. Section 1350, as adopted pursuant to Section 906 of the Sarbanes-Oxley Act of 2002 (filed herewith).
|
|
|
32.2
|
|
Certification of Chief Financial Officer pursuant to 18 U.S.C. Section 1350, as adopted pursuant to Section 906 of the Sarbanes-Oxley Act of 2002 (filed herewith).
|
|
|
99.
|
Additional Exhibits
|
||
|
99.1
|
|
Certification of Chief Executive Officer pursuant to Section 303A.12(a) of the New York Stock Exchange Listed Company Manual (filed herewith).
|
|
|
101.
|
Interactive Data File
|
||
|
101.1
|
|
The following materials from National Retail Properties, Inc. Annual Report on Form 10-K for the period ended December 31, 2014, are formatted in Extensible Business Reporting Language: (i) consolidated balance sheets, (ii) consolidated statements of comprehensive income, (iii) consolidated statements of cash flows, and (iv) notes to consolidated financial statements.
|
|
85
NATIONAL RETAIL PROPERTIES, INC. AND SUBSIDIARIES
SCHEDULE III - REAL ESTATE AND ACCUMULATED DEPRECIATION AND AMORTIZATION
December 31, 2014
(Dollars in thousands)
|
Initial Cost to
Company
|
Costs Capitalized
Subsequent to
Acquisition
|
Gross Amount at Which
Carried at Close of Period (a) (b)
|
Life on Which
Depreciation &
Amortization in Latest Income
Statement is
Computed (Years)
|
|||||||||||||||||||||||||||||
|
Encumbrances
|
Land
|
Building,
Improvements &
Leasehold
Interests
|
Improvements
|
Carrying
Costs
|
Land
|
Building,
Improvements &
Leasehold
Interests
|
Total
|
Accumulated
Depreciation
and
Amortization
|
Date of
Construction
|
Date
Acquired
|
||||||||||||||||||||||
|
Real Estate Held for Investment the Company has Invested in Under Operating Leases:
|
||||||||||||||||||||||||||||||||
|
7-Eleven:
|
|
|
|
|
|
|||||||||||||||||||||||||||
|
Tampa, FL
|
—
|
|
1,081
|
|
917
|
|
—
|
|
—
|
|
1,070
|
|
917
|
|
1,987
|
|
362
|
|
1999
|
12/98
|
(g)
|
40
|
||||||||||
|
Austin, TX
|
—
|
|
|
259
|
|
1,361
|
|
—
|
|
|
—
|
|
|
259
|
|
1,361
|
|
1,620
|
|
170
|
|
1985
|
11/11
|
|
25
|
|||||||
|
Austin, TX
|
—
|
|
|
900
|
|
3,571
|
|
—
|
|
|
—
|
|
|
900
|
|
3,571
|
|
4,471
|
|
319
|
|
2004
|
11/11
|
|
35
|
|||||||
|
Austin, TX
|
—
|
|
|
1,101
|
|
2,987
|
|
—
|
|
|
—
|
|
|
1,101
|
|
2,987
|
|
4,088
|
|
267
|
|
2006
|
11/11
|
|
35
|
|||||||
|
Beaumont, TX
|
—
|
|
|
115
|
|
1,543
|
|
—
|
|
|
—
|
|
|
115
|
|
1,543
|
|
1,658
|
|
161
|
|
1996
|
11/11
|
|
30
|
|||||||
|
Beaumont, TX
|
—
|
|
|
124
|
|
2,968
|
|
—
|
|
|
—
|
|
|
124
|
|
2,968
|
|
3,092
|
|
309
|
|
1996
|
11/11
|
|
30
|
|||||||
|
Beaumont, TX
|
—
|
|
|
239
|
|
2,031
|
|
—
|
|
|
—
|
|
|
239
|
|
2,031
|
|
2,270
|
|
181
|
|
2002
|
11/11
|
|
35
|
|||||||
|
Bloomington, TX
|
—
|
|
|
38
|
|
3,093
|
|
—
|
|
|
—
|
|
|
38
|
|
3,093
|
|
3,131
|
|
387
|
|
1985
|
11/11
|
|
25
|
|||||||
|
Bryan, TX
|
—
|
|
|
479
|
|
3,561
|
|
—
|
|
|
—
|
|
|
479
|
|
3,561
|
|
4,040
|
|
371
|
|
2000
|
11/11
|
|
30
|
|||||||
|
Canyon Lake, TX
|
—
|
|
|
144
|
|
1,830
|
|
—
|
|
|
—
|
|
|
144
|
|
1,830
|
|
1,974
|
|
229
|
|
1977
|
11/11
|
|
25
|
|||||||
|
Cedar Park, TX
|
—
|
|
|
833
|
|
1,705
|
|
—
|
|
|
—
|
|
|
833
|
|
1,705
|
|
2,538
|
|
152
|
|
2002
|
11/11
|
|
35
|
|||||||
|
College Station, TX
|
—
|
|
|
393
|
|
3,342
|
|
—
|
|
|
—
|
|
|
393
|
|
3,342
|
|
3,735
|
|
348
|
|
2000
|
11/11
|
|
30
|
|||||||
|
Corpus Christi, TX
|
—
|
|
|
661
|
|
2,624
|
|
—
|
|
|
—
|
|
|
661
|
|
2,624
|
|
3,285
|
|
273
|
|
1999
|
11/11
|
|
30
|
|||||||
|
Corpus Christi, TX
|
—
|
|
|
412
|
|
2,356
|
|
—
|
|
|
—
|
|
|
412
|
|
2,356
|
|
2,768
|
|
245
|
|
1999
|
11/11
|
|
30
|
|||||||
|
Corpus Christi, TX
|
—
|
|
|
450
|
|
1,370
|
|
—
|
|
|
—
|
|
|
450
|
|
1,370
|
|
1,820
|
|
143
|
|
1996
|
11/11
|
|
30
|
|||||||
|
Corpus Christi, TX
|
—
|
|
|
383
|
|
3,093
|
|
—
|
|
|
—
|
|
|
383
|
|
3,093
|
|
3,476
|
|
276
|
|
2006
|
11/11
|
|
35
|
|||||||
|
Edinburg, TX
|
—
|
|
|
431
|
|
2,193
|
|
—
|
|
|
—
|
|
|
431
|
|
2,193
|
|
2,624
|
|
228
|
|
1999
|
11/11
|
|
30
|
|||||||
|
Edna, TX
|
—
|
|
|
67
|
|
1,897
|
|
—
|
|
|
—
|
|
|
67
|
|
1,897
|
|
1,964
|
|
237
|
|
1976
|
11/11
|
|
25
|
|||||||
|
Harlingen, TX
|
—
|
|
|
230
|
|
2,356
|
|
—
|
|
|
—
|
|
|
230
|
|
2,356
|
|
2,586
|
|
245
|
|
2000
|
11/11
|
|
30
|
|||||||
|
Kingsland, TX
|
—
|
|
|
153
|
|
2,691
|
|
—
|
|
|
—
|
|
|
153
|
|
2,691
|
|
2,844
|
|
336
|
|
1972
|
11/11
|
|
25
|
|||||||
|
Kingsville, TX
|
—
|
|
|
163
|
|
1,485
|
|
—
|
|
|
—
|
|
|
163
|
|
1,485
|
|
1,648
|
|
186
|
|
1990
|
11/11
|
|
25
|
|||||||
|
Laredo, TX
|
—
|
|
|
335
|
|
2,509
|
|
—
|
|
|
—
|
|
|
335
|
|
2,509
|
|
2,844
|
|
261
|
|
1999
|
11/11
|
|
30
|
|||||||
|
Laredo, TX
|
—
|
|
|
421
|
|
3,016
|
|
—
|
|
|
—
|
|
|
421
|
|
3,016
|
|
3,437
|
|
314
|
|
1998
|
11/11
|
|
30
|
|||||||
|
Laredo, TX
|
—
|
|
|
412
|
|
1,476
|
|
—
|
|
|
—
|
|
|
412
|
|
1,476
|
|
1,888
|
|
154
|
|
2001
|
11/11
|
|
30
|
|||||||
|
Laredo, TX
|
—
|
|
|
441
|
|
1,935
|
|
—
|
|
|
—
|
|
|
441
|
|
1,935
|
|
2,376
|
|
173
|
|
2002
|
11/11
|
|
35
|
|||||||
|
Laredo, TX
|
—
|
|
|
938
|
|
5,829
|
|
—
|
|
|
—
|
|
|
938
|
|
5,829
|
|
6,767
|
|
607
|
|
1995
|
11/11
|
|
30
|
|||||||
|
Mercedes, TX
|
—
|
|
|
556
|
|
1,523
|
|
—
|
|
|
—
|
|
|
556
|
|
1,523
|
|
2,079
|
|
159
|
|
1998
|
11/11
|
|
30
|
|||||||
|
Palacios, TX
|
—
|
|
|
29
|
|
1,667
|
|
—
|
|
|
—
|
|
|
29
|
|
1,667
|
|
1,696
|
|
208
|
|
1984
|
11/11
|
|
25
|
|||||||
|
Pflugerville, TX
|
—
|
|
|
996
|
|
2,336
|
|
—
|
|
|
—
|
|
|
996
|
|
2,336
|
|
3,332
|
|
209
|
|
2002
|
11/11
|
|
35
|
|||||||
|
Portland, TX
|
—
|
|
|
488
|
|
4,710
|
|
—
|
|
|
—
|
|
|
488
|
|
4,710
|
|
5,198
|
|
491
|
|
1999
|
11/11
|
|
30
|
|||||||
|
Rio Bravo, TX
|
—
|
|
|
355
|
|
1,351
|
|
—
|
|
|
—
|
|
|
355
|
|
1,351
|
|
1,706
|
|
121
|
|
2002
|
11/11
|
|
35
|
|||||||
|
Rockport, TX
|
—
|
|
|
660
|
|
4,269
|
|
—
|
|
|
—
|
|
|
660
|
|
4,269
|
|
4,929
|
|
381
|
|
2008
|
11/11
|
|
35
|
|||||||
|
Round Rock, TX
|
—
|
|
|
661
|
|
1,140
|
|
—
|
|
|
—
|
|
|
661
|
|
1,140
|
|
1,801
|
|
119
|
|
2000
|
11/11
|
|
30
|
|||||||
|
San Antonio, TX
|
—
|
|
|
441
|
|
1,313
|
|
—
|
|
|
—
|
|
|
441
|
|
1,313
|
|
1,754
|
|
137
|
|
1999
|
11/11
|
|
30
|
|||||||
|
San Juan, TX
|
—
|
|
|
565
|
|
1,179
|
|
—
|
|
|
—
|
|
|
565
|
|
1,179
|
|
1,744
|
|
123
|
|
1999
|
11/11
|
|
30
|
|||||||
|
Victoria, TX
|
—
|
|
|
431
|
|
2,298
|
|
—
|
|
|
—
|
|
|
431
|
|
2,298
|
|
2,729
|
|
239
|
|
1986
|
11/11
|
|
30
|
|||||||
|
Victoria, TX
|
—
|
|
|
259
|
|
2,346
|
|
—
|
|
|
—
|
|
|
259
|
|
2,346
|
|
2,605
|
|
244
|
|
1984
|
11/11
|
|
30
|
|||||||
|
West Orange, TX
|
—
|
|
|
220
|
|
2,088
|
|
—
|
|
|
—
|
|
|
220
|
|
2,088
|
|
2,308
|
|
217
|
|
1993
|
11/11
|
|
30
|
|||||||
|
Winnie, TX
|
—
|
|
|
115
|
|
4,566
|
|
—
|
|
|
—
|
|
|
115
|
|
4,566
|
|
4,681
|
|
408
|
|
2002
|
11/11
|
|
35
|
|||||||
|
Austin, TX
|
—
|
|
|
1,215
|
|
4,524
|
|
—
|
|
|
—
|
|
|
1,215
|
|
4,524
|
|
5,739
|
|
393
|
|
2004
|
12/11
|
|
35
|
|||||||
|
Austin, TX
|
—
|
|
|
488
|
|
2,163
|
|
—
|
|
|
—
|
|
|
488
|
|
2,163
|
|
2,651
|
|
219
|
|
2000
|
12/11
|
|
30
|
|||||||
|
Austin, TX
|
—
|
|
|
938
|
|
1,436
|
|
—
|
|
|
—
|
|
|
938
|
|
1,436
|
|
2,374
|
|
146
|
|
1998
|
12/11
|
|
30
|
|||||||
|
Austin, TX
|
—
|
|
|
756
|
|
2,870
|
|
—
|
|
|
—
|
|
|
756
|
|
2,870
|
|
3,626
|
|
291
|
|
1999
|
12/11
|
|
30
|
|||||||
|
Austin, TX
|
—
|
|
|
679
|
|
1,905
|
|
—
|
|
|
—
|
|
|
679
|
|
1,905
|
|
2,584
|
|
193
|
|
1999
|
12/11
|
|
30
|
|||||||
|
Austin, TX
|
—
|
|
|
775
|
|
4,677
|
|
—
|
|
|
—
|
|
|
775
|
|
4,677
|
|
5,452
|
|
474
|
|
1996
|
12/11
|
|
30
|
|||||||
|
Austin, TX
|
—
|
|
|
861
|
|
3,004
|
|
—
|
|
|
—
|
|
|
861
|
|
3,004
|
|
3,865
|
|
305
|
|
2001
|
12/11
|
|
30
|
|||||||
|
Austin, TX
|
—
|
|
|
880
|
|
1,790
|
|
—
|
|
|
—
|
|
|
880
|
|
1,790
|
|
2,670
|
|
181
|
|
1998
|
12/11
|
|
30
|
|||||||
|
Austin, TX
|
—
|
|
|
689
|
|
1,732
|
|
—
|
|
|
—
|
|
|
689
|
|
1,732
|
|
2,421
|
|
176
|
|
1999
|
12/11
|
|
30
|
|||||||
|
Austin, TX
|
—
|
|
|
612
|
|
3,061
|
|
—
|
|
|
—
|
|
|
612
|
|
3,061
|
|
3,673
|
|
310
|
|
1999
|
12/11
|
|
30
|
|||||||
|
Austin, TX
|
—
|
|
|
612
|
|
2,775
|
|
—
|
|
|
—
|
|
|
612
|
|
2,775
|
|
3,387
|
|
281
|
|
1999
|
12/11
|
|
30
|
|||||||
|
Cedar Park, TX
|
—
|
|
|
536
|
|
1,914
|
|
—
|
|
|
—
|
|
|
536
|
|
1,914
|
|
2,450
|
|
194
|
|
1999
|
12/11
|
|
30
|
|||||||
|
San Antonio, TX
|
—
|
|
|
411
|
|
2,555
|
|
—
|
|
|
—
|
|
|
411
|
|
2,555
|
|
2,966
|
|
259
|
|
1999
|
12/11
|
|
30
|
|||||||
|
San Antonio, TX
|
—
|
|
|
603
|
|
2,048
|
|
—
|
|
|
—
|
|
|
603
|
|
2,048
|
|
2,651
|
|
208
|
|
1999
|
12/11
|
|
30
|
|||||||
|
San Antonio, TX
|
—
|
|
|
517
|
|
2,670
|
|
—
|
|
|
—
|
|
|
517
|
|
2,670
|
|
3,187
|
|
271
|
|
1999
|
12/11
|
|
30
|
|||||||
|
San Antonio, TX
|
—
|
|
|
632
|
|
1,991
|
|
—
|
|
|
—
|
|
|
632
|
|
1,991
|
|
2,623
|
|
202
|
|
2001
|
12/11
|
|
30
|
|||||||
|
San Antonio, TX
|
—
|
|
|
469
|
|
2,727
|
|
—
|
|
|
—
|
|
|
469
|
|
2,727
|
|
3,196
|
|
276
|
|
1998
|
12/11
|
|
30
|
|||||||
|
San Antonio, TX
|
—
|
|
|
947
|
|
2,535
|
|
—
|
|
|
—
|
|
|
947
|
|
2,535
|
|
3,482
|
|
257
|
|
1999
|
12/11
|
|
30
|
|||||||
|
San Antonio, TX
|
—
|
|
|
909
|
|
1,359
|
|
—
|
|
|
—
|
|
|
909
|
|
1,359
|
|
2,268
|
|
138
|
|
1999
|
12/11
|
|
30
|
|||||||
|
San Antonio, TX
|
—
|
|
|
631
|
|
2,851
|
|
—
|
|
|
—
|
|
|
631
|
|
2,851
|
|
3,482
|
|
289
|
|
1999
|
12/11
|
|
30
|
|||||||
|
San Antonio, TX
|
—
|
|
|
766
|
|
1,474
|
|
—
|
|
|
—
|
|
|
766
|
|
1,474
|
|
2,240
|
|
149
|
|
1999
|
12/11
|
|
30
|
|||||||
|
San Antonio, TX
|
—
|
|
|
412
|
|
2,010
|
|
—
|
|
|
—
|
|
|
412
|
|
2,010
|
|
2,422
|
|
204
|
|
1999
|
12/11
|
|
30
|
|||||||
|
San Antonio, TX
|
—
|
|
|
985
|
|
3,253
|
|
—
|
|
|
—
|
|
|
985
|
|
3,253
|
|
4,238
|
|
330
|
|
1999
|
12/11
|
|
30
|
|||||||
|
San Antonio, TX
|
—
|
|
|
679
|
|
2,937
|
|
—
|
|
|
—
|
|
|
679
|
|
2,937
|
|
3,616
|
|
298
|
|
1999
|
12/11
|
|
30
|
|||||||
|
San Antonio, TX
|
—
|
|
|
919
|
|
2,344
|
|
—
|
|
|
—
|
|
|
919
|
|
2,344
|
|
3,263
|
|
204
|
|
2002
|
12/11
|
|
35
|
|||||||
|
San Antonio, TX
|
—
|
|
|
545
|
|
3,148
|
|
—
|
|
|
—
|
|
|
545
|
|
3,148
|
|
3,693
|
|
319
|
|
1999
|
12/11
|
|
30
|
|||||||
|
San Antonio, TX
|
—
|
|
|
899
|
|
2,593
|
|
—
|
|
|
—
|
|
|
899
|
|
2,593
|
|
3,492
|
|
225
|
|
2002
|
12/11
|
|
35
|
|||||||
|
Universal City, TX
|
—
|
|
|
699
|
|
1,675
|
|
—
|
|
|
—
|
|
|
699
|
|
1,675
|
|
2,374
|
|
170
|
|
2001
|
12/11
|
|
30
|
|||||||
|
Belpre, OH
|
—
|
|
|
408
|
|
759
|
|
—
|
|
|
—
|
|
|
408
|
|
759
|
|
1,167
|
|
14
|
|
1990
|
07/14
|
|
25
|
|||||||
|
Charleston, WV
|
—
|
|
|
549
|
|
729
|
|
—
|
|
|
—
|
|
|
549
|
|
729
|
|
1,278
|
|
11
|
|
1995
|
07/14
|
|
30
|
|||||||
|
Charleston, WV
|
—
|
|
|
689
|
|
974
|
|
—
|
|
|
—
|
|
|
689
|
|
974
|
|
1,663
|
|
15
|
|
1970
|
07/14
|
|
30
|
|||||||
|
Clarksburg, WV
|
—
|
|
|
390
|
|
613
|
|
—
|
|
|
—
|
|
|
390
|
|
613
|
|
1,003
|
|
11
|
|
1978
|
07/14
|
|
25
|
|||||||
|
Mannington, WV
|
—
|
|
|
218
|
|
745
|
|
—
|
|
|
—
|
|
|
218
|
|
745
|
|
963
|
|
11
|
|
1996
|
07/14
|
|
30
|
|||||||
|
N. Belle Vernon, PA
|
—
|
|
|
438
|
|
1,165
|
|
—
|
|
|
—
|
|
|
438
|
|
1,165
|
|
1,603
|
|
21
|
|
1996
|
07/14
|
|
25
|
|||||||
|
New Castle, PA
|
—
|
|
292
|
|
617
|
|
—
|
|
—
|
|
292
|
|
617
|
|
909
|
|
9
|
|
1983
|
07/14
|
|
30
|
||||||||||
|
Parkersburg, WV
|
—
|
|
298
|
|
782
|
|
—
|
|
—
|
|
298
|
|
782
|
|
1,080
|
|
14
|
|
1988
|
07/14
|
|
25
|
||||||||||
|
Parkersburg, WV
|
—
|
|
|
422
|
|
739
|
|
—
|
|
|
—
|
|
|
422
|
|
739
|
|
1,161
|
|
11
|
|
1985
|
07/14
|
|
30
|
|||||||
|
Weston, WV
|
—
|
|
|
114
|
|
583
|
|
—
|
|
|
—
|
|
|
114
|
|
583
|
|
697
|
|
9
|
|
1995
|
07/14
|
|
30
|
|||||||
|
|
|
|
|
|
|
|||||||||||||||||||||||||||
|
Academy:
|
|
|
|
|
|
|||||||||||||||||||||||||||
|
Beaumont, TX (n)
|
—
|
|
|
1,424
|
|
2,449
|
|
—
|
|
|
—
|
|
|
1,424
|
|
2,449
|
|
3,873
|
|
967
|
|
1992
|
03/99
|
|
40
|
|||||||
|
Houston, TX
|
—
|
|
|
2,311
|
|
1,628
|
|
—
|
|
|
—
|
|
|
2,311
|
|
1,628
|
|
3,939
|
|
643
|
|
1976
|
03/99
|
|
40
|
|||||||
|
Franklin, TN
|
—
|
|
|
1,807
|
|
2,108
|
|
—
|
|
|
—
|
|
|
1,589
|
|
2,108
|
|
3,697
|
|
671
|
|
1999
|
06/05
|
|
30
|
|||||||
|
|
|
|
|
|
|
|||||||||||||||||||||||||||
|
Ace Hardware and Lighting:
|
|
|
|
|
|
|||||||||||||||||||||||||||
|
Bourbonnais, IL
|
—
|
|
|
298
|
|
1,329
|
|
—
|
|
|
—
|
|
|
298
|
|
1,329
|
|
1,627
|
|
478
|
|
1997
|
11/98
|
|
37
|
|||||||
|
|
|
|
|
|
|
|||||||||||||||||||||||||||
|
Advance Auto Parts:
|
|
|
|
|
|
|||||||||||||||||||||||||||
|
Miami, FL
|
—
|
|
|
867
|
|
—
|
|
1,035
|
|
|
—
|
|
|
867
|
|
1,035
|
|
1,902
|
|
247
|
|
2005
|
12/04
|
(g)
|
40
|
|||||||
|
Richmond, VA
|
—
|
|
|
193
|
|
1,268
|
|
—
|
|
|
—
|
|
|
193
|
|
1,268
|
|
1,461
|
|
37
|
|
2008
|
02/14
|
|
30
|
|||||||
|
|
|
|
|
|
|
|||||||||||||||||||||||||||
|
Adventure Landing:
|
|
|
|
|
|
|||||||||||||||||||||||||||
|
Jacksonville Beach, FL
|
—
|
|
|
3,615
|
|
5,636
|
|
—
|
|
|
—
|
|
|
3,615
|
|
5,636
|
|
9,251
|
|
1,212
|
|
1995
|
04/11
|
|
30
|
|||||||
|
Jacksonville, FL
|
—
|
|
|
721
|
|
861
|
|
—
|
|
|
—
|
|
|
721
|
|
861
|
|
1,582
|
|
265
|
|
1983
|
04/11
|
|
25
|
|||||||
See accompanying report of independent registered public accounting firm.
F-1
|
Initial Cost to
Company
|
Costs Capitalized
Subsequent to
Acquisition
|
Gross Amount at Which
Carried at Close of Period (a) (b)
|
Life on Which
Depreciation &
Amortization in Latest Income
Statement is
Computed (Years)
|
|||||||||||||||||||||||||||||
|
Encumbrances
|
Land
|
Building,
Improvements &
Leasehold
Interests
|
Improvements
|
Carrying
Costs
|
Land
|
Building,
Improvements &
Leasehold
Interests
|
Total
|
Accumulated
Depreciation
and
Amortization
|
Date of
Construction
|
Date
Acquired
|
||||||||||||||||||||||
|
Real Estate Held for Investment the Company has Invested in Under Operating Leases:
|
||||||||||||||||||||||||||||||||
|
Raleigh, NC
|
—
|
|
|
1,841
|
|
3,124
|
|
—
|
|
|
—
|
|
|
1,841
|
|
3,124
|
|
4,965
|
|
645
|
|
1989
|
04/11
|
|
25
|
|||||||
|
St. Augustine, FL
|
—
|
|
|
797
|
|
289
|
|
—
|
|
|
—
|
|
|
797
|
|
289
|
|
1,086
|
|
130
|
|
1999
|
04/11
|
|
30
|
|||||||
|
Tonawanda, NY
|
—
|
|
|
205
|
|
927
|
|
—
|
|
|
—
|
|
|
205
|
|
927
|
|
1,132
|
|
279
|
|
1991
|
04/11
|
|
25
|
|||||||
|
|
|
|
|
|
|
|||||||||||||||||||||||||||
|
Affordable Care:
|
|
|
|
|
|
|||||||||||||||||||||||||||
|
Asheville, NC
|
—
|
|
|
467
|
|
576
|
|
—
|
|
|
—
|
|
|
467
|
|
576
|
|
1,043
|
|
9
|
|
2005
|
07/14
|
|
30
|
|||||||
|
Conover, NC
|
—
|
|
|
187
|
|
623
|
|
—
|
|
|
—
|
|
|
187
|
|
623
|
|
810
|
|
10
|
|
2002
|
07/14
|
|
30
|
|||||||
|
Poland, OH
|
—
|
|
|
231
|
|
650
|
|
—
|
|
|
—
|
|
|
231
|
|
650
|
|
881
|
|
12
|
|
2001
|
07/14
|
|
25
|
|||||||
|
Wilmington, NC
|
—
|
|
|
398
|
|
565
|
|
—
|
|
|
—
|
|
|
398
|
|
565
|
|
963
|
|
9
|
|
2002
|
07/14
|
|
30
|
|||||||
|
|
|
|
|
|
|
|||||||||||||||||||||||||||
|
Aldi:
|
|
|
|
|
|
|||||||||||||||||||||||||||
|
Cutler Bay, FL
|
—
|
|
|
989
|
|
1,479
|
|
205
|
|
|
—
|
|
|
989
|
|
1,684
|
|
2,673
|
|
709
|
|
1995
|
06/96
|
|
40
|
|||||||
|
|
|
|
|
|
|
|||||||||||||||||||||||||||
|
All Star Sports:
|
|
|
|
|
|
|||||||||||||||||||||||||||
|
Wichita, KS
|
—
|
|
|
1,551
|
|
965
|
|
152
|
|
|
—
|
|
|
1,551
|
|
1,117
|
|
2,668
|
|
194
|
|
1987
|
05/07
|
|
40
|
|||||||
|
Wichita, KS
|
—
|
|
|
3,275
|
|
1,631
|
|
167
|
|
|
—
|
|
|
3,275
|
|
1,798
|
|
5,073
|
|
322
|
|
1988
|
05/07
|
|
40
|
|||||||
|
|
|
|
|
|
|
|||||||||||||||||||||||||||
|
Amazing Jake's:
|
|
|
|
|
|
|||||||||||||||||||||||||||
|
Plano, TX
|
—
|
|
|
5,705
|
|
17,049
|
|
18
|
|
|
—
|
|
|
5,705
|
|
17,067
|
|
22,772
|
|
3,147
|
|
1982
|
07/08
|
|
35
|
|||||||
|
|
|
|
|
|
|
|||||||||||||||||||||||||||
|
AMC Theatre:
|
|
|
|
|
|
|
||||||||||||||||||||||||||
|
Bloomington, IN
|
—
|
|
|
2,338
|
|
4,000
|
|
—
|
|
|
—
|
|
|
2,338
|
|
4,000
|
|
6,338
|
|
1,167
|
|
1987
|
09/07
|
|
25
|
|||||||
|
Brighton, CO
|
—
|
|
|
1,070
|
|
5,491
|
|
—
|
|
|
—
|
|
|
1,070
|
|
5,491
|
|
6,561
|
|
1,001
|
|
2005
|
09/07
|
|
40
|
|||||||
|
Castle Rock, CO
|
—
|
|
|
2,905
|
|
5,002
|
|
—
|
|
|
—
|
|
|
2,905
|
|
5,002
|
|
7,907
|
|
912
|
|
2005
|
09/07
|
|
40
|
|||||||
|
Evansville, IN
|
—
|
|
|
1,300
|
|
4,269
|
|
—
|
|
|
—
|
|
|
1,300
|
|
4,269
|
|
5,569
|
|
889
|
|
1999
|
09/07
|
|
35
|
|||||||
|
Galesburg, IL
|
—
|
|
|
1,205
|
|
2,441
|
|
—
|
|
|
—
|
|
|
1,205
|
|
2,441
|
|
3,646
|
|
445
|
|
2003
|
09/07
|
|
40
|
|||||||
|
Machesney Park, IL
|
—
|
|
|
3,018
|
|
8,770
|
|
—
|
|
|
—
|
|
|
3,018
|
|
8,770
|
|
11,788
|
|
1,599
|
|
2005
|
09/07
|
|
40
|
|||||||
|
Michigan City, IN
|
—
|
|
|
1,996
|
|
8,422
|
|
—
|
|
|
—
|
|
|
1,996
|
|
8,422
|
|
10,418
|
|
1,535
|
|
2005
|
09/07
|
|
40
|
|||||||
|
Muncie, IN
|
—
|
|
|
1,243
|
|
5,512
|
|
—
|
|
|
—
|
|
|
1,243
|
|
5,512
|
|
6,755
|
|
1,005
|
|
2005
|
09/07
|
|
40
|
|||||||
|
Naperville, IL
|
—
|
|
|
6,141
|
|
11,624
|
|
—
|
|
|
—
|
|
|
6,141
|
|
11,624
|
|
17,765
|
|
2,119
|
|
2006
|
09/07
|
|
40
|
|||||||
|
New Lenox, IL
|
—
|
|
|
6,778
|
|
10,980
|
|
—
|
|
|
—
|
|
|
6,778
|
|
10,980
|
|
17,758
|
|
2,002
|
|
2004
|
09/07
|
|
40
|
|||||||
|
Chicago, IL
|
—
|
|
|
7,257
|
|
10,955
|
|
—
|
|
|
—
|
|
|
7,257
|
|
10,955
|
|
18,212
|
|
1,906
|
|
2007
|
01/08
|
|
40
|
|||||||
|
Johnson Creek, WI
|
—
|
|
|
1,433
|
|
3,932
|
|
—
|
|
|
—
|
|
|
1,433
|
|
3,932
|
|
5,365
|
|
782
|
|
1997
|
01/08
|
|
35
|
|||||||
|
Lake Delton, WI
|
—
|
|
|
2,063
|
|
8,366
|
|
—
|
|
|
—
|
|
|
2,063
|
|
8,366
|
|
10,429
|
|
1,663
|
|
1999
|
01/08
|
|
35
|
|||||||
See accompanying report of independent registered public accounting firm.
F-2
|
Initial Cost to
Company
|
Costs Capitalized
Subsequent to
Acquisition
|
Gross Amount at Which
Carried at Close of Period (a) (b)
|
Life on Which
Depreciation &
Amortization in Latest Income
Statement is
Computed (Years)
|
|||||||||||||||||||||||||||||
|
Encumbrances
|
Land
|
Building,
Improvements &
Leasehold
Interests
|
Improvements
|
Carrying
Costs
|
Land
|
Building,
Improvements &
Leasehold
Interests
|
Total
|
Accumulated
Depreciation
and
Amortization
|
Date of
Construction
|
Date
Acquired
|
||||||||||||||||||||||
|
Real Estate Held for Investment the Company has Invested in Under Operating Leases:
|
||||||||||||||||||||||||||||||||
|
Quincy, IL
|
—
|
|
|
1,297
|
|
2,850
|
|
—
|
|
|
—
|
|
|
1,297
|
|
2,850
|
|
4,147
|
|
567
|
|
1982
|
01/08
|
|
35
|
|||||||
|
Schererville, IN
|
—
|
|
|
6,619
|
|
14,225
|
|
—
|
|
|
—
|
|
|
6,619
|
|
14,225
|
|
20,844
|
|
3,299
|
|
1996
|
01/08
|
|
30
|
|||||||
|
|
|
|
|
|
|
|||||||||||||||||||||||||||
|
American Family Care:
|
|
|
|
|
|
|||||||||||||||||||||||||||
|
Mobile, AL
|
—
|
|
|
843
|
|
562
|
|
348
|
|
|
—
|
|
|
843
|
|
910
|
|
1,753
|
|
218
|
|
1997
|
12/01
|
|
40
|
|||||||
|
Alcoa, TN
|
—
|
|
|
1,221
|
|
—
|
|
1,730
|
|
|
—
|
|
|
1,221
|
|
1,730
|
|
2,951
|
|
56
|
|
2013
|
12/12
|
(m)
|
40
|
|||||||
|
Cullman, AL
|
—
|
|
|
541
|
|
—
|
|
1,517
|
|
|
—
|
|
|
541
|
|
1,517
|
|
2,058
|
|
46
|
|
2013
|
12/12
|
(m)
|
40
|
|||||||
|
Decatur, AL
|
—
|
|
|
460
|
|
1,283
|
|
—
|
|
|
—
|
|
|
460
|
|
1,283
|
|
1,743
|
|
75
|
|
2010
|
12/12
|
|
35
|
|||||||
|
Nashville, TN
|
—
|
|
|
377
|
|
—
|
|
1,403
|
|
|
—
|
|
|
377
|
|
1,403
|
|
1,780
|
|
37
|
|
2013
|
12/12
|
(m)
|
40
|
|||||||
|
Pace, FL
|
—
|
|
|
738
|
|
—
|
|
1,459
|
|
|
—
|
|
|
738
|
|
1,459
|
|
2,197
|
|
44
|
|
2013
|
12/12
|
(m)
|
40
|
|||||||
|
Woodstock, GA
|
—
|
|
|
563
|
|
—
|
|
1,653
|
|
|
—
|
|
|
563
|
|
1,653
|
|
2,216
|
|
36
|
|
2014
|
12/12
|
(m)
|
40
|
|||||||
|
Fairhope, AL
|
—
|
|
|
(1
|
)
|
1,929
|
|
—
|
|
|
—
|
|
|
(1
|
)
|
1,929
|
|
1,929
|
|
90
|
|
2012
|
02/13
|
|
40
|
|||||||
|
Dothan, AL
|
—
|
|
|
667
|
|
—
|
|
1,400
|
|
|
—
|
|
|
667
|
|
1,400
|
|
2,067
|
|
45
|
|
2013
|
02/13
|
(m)
|
40
|
|||||||
|
Auburn, AL
|
—
|
|
|
663
|
|
—
|
|
1,835
|
|
|
—
|
|
|
663
|
|
1,835
|
|
2,498
|
|
48
|
|
2013
|
03/13
|
(m)
|
40
|
|||||||
|
Milton, GA
|
—
|
|
|
577
|
|
1,526
|
|
—
|
|
|
—
|
|
|
577
|
|
1,526
|
|
2,103
|
|
68
|
|
2012
|
03/13
|
|
40
|
|||||||
|
Roswell, GA
|
—
|
|
|
814
|
|
—
|
|
1,851
|
|
|
—
|
|
|
816
|
|
1,851
|
|
2,667
|
|
17
|
|
2014
|
04/13
|
(m)
|
40
|
|||||||
|
Marietta, GA
|
—
|
|
|
432
|
|
—
|
|
1,846
|
|
|
—
|
|
|
432
|
|
1,846
|
|
2,278
|
|
40
|
|
2014
|
04/13
|
(m)
|
40
|
|||||||
|
Mt. Juliet, TN
|
—
|
|
|
875
|
|
1,566
|
|
—
|
|
|
—
|
|
|
875
|
|
1,566
|
|
2,441
|
|
57
|
|
2013
|
07/13
|
|
40
|
|||||||
|
Chattanooga, TN
|
—
|
|
|
469
|
|
—
|
|
1,626
|
|
|
—
|
|
|
469
|
|
1,626
|
|
2,095
|
|
36
|
|
2014
|
07/13
|
(m)
|
40
|
|||||||
|
Columbus, GA
|
—
|
|
|
550
|
|
—
|
|
1,520
|
|
|
—
|
|
|
550
|
|
1,520
|
|
2,070
|
|
33
|
|
2014
|
07/13
|
(m)
|
40
|
|||||||
|
Birmingham, AL
|
—
|
|
|
445
|
|
—
|
|
1,640
|
|
|
—
|
|
|
445
|
|
1,640
|
|
2,085
|
|
39
|
|
2005
|
08/13
|
(m)
|
40
|
|||||||
|
Hendersonville, TN
|
—
|
|
|
660
|
|
1,640
|
|
—
|
|
|
—
|
|
|
660
|
|
1,640
|
|
2,300
|
|
46
|
|
2013
|
11/13
|
|
40
|
|||||||
|
Calera, AL
|
—
|
|
|
606
|
|
—
|
|
1,673
|
|
|
—
|
|
|
606
|
|
1,673
|
|
2,279
|
|
19
|
|
2014
|
12/13
|
(m)
|
40
|
|||||||
|
Spring Hill, TN
|
—
|
|
|
589
|
|
—
|
|
1,509
|
|
|
—
|
|
|
589
|
|
1,509
|
|
2,098
|
|
(q)
|
|
2014
|
02/14
|
(m)
|
(q)
|
|||||||
|
Athens, AL
|
—
|
|
|
497
|
|
—
|
|
1,527
|
|
|
—
|
|
|
497
|
|
1,527
|
|
2,024
|
|
(q)
|
|
2014
|
03/14
|
(m)
|
(q)
|
|||||||
|
Panama City Beach, FL
|
—
|
|
|
995
|
|
—
|
|
1,455
|
|
|
—
|
|
|
995
|
|
1,455
|
|
2,450
|
|
(q)
|
|
2014
|
04/14
|
(m)
|
(q)
|
|||||||
|
Gadsden, AL
|
—
|
|
|
527
|
|
—
|
|
1,265
|
|
|
—
|
|
|
527
|
|
1,265
|
|
1,792
|
|
(q)
|
|
2014
|
05/14
|
(m)
|
(q)
|
|||||||
|
Knoxville, TN
|
—
|
|
|
2,021
|
|
—
|
|
—
|
|
|
—
|
|
|
2,021
|
|
(e)
|
|
2,021
|
|
(e)
|
|
(e)
|
08/14
|
(m)
|
(e)
|
|||||||
|
Fort Oglethorpe, GA
|
—
|
|
|
736
|
|
—
|
|
—
|
|
|
—
|
|
|
736
|
|
(e)
|
|
736
|
|
(e)
|
|
(e)
|
08/14
|
(m)
|
(e)
|
|||||||
|
|
|
|
|
|
|
|||||||||||||||||||||||||||
|
American Freight:
|
|
|
|
|
|
|||||||||||||||||||||||||||
|
Glen Allen, VA
|
—
|
|
|
889
|
|
1,948
|
|
—
|
|
|
—
|
|
|
889
|
|
1,948
|
|
2,837
|
|
905
|
|
1996
|
05/96
|
|
40
|
|||||||
|
|
|
|
|
|
|
|||||||||||||||||||||||||||
See accompanying report of independent registered public accounting firm.
F-3
|
Initial Cost to
Company
|
Costs Capitalized
Subsequent to
Acquisition
|
Gross Amount at Which
Carried at Close of Period (a) (b)
|
Life on Which
Depreciation &
Amortization in Latest Income
Statement is
Computed (Years)
|
|||||||||||||||||||||||||||||
|
Encumbrances
|
Land
|
Building,
Improvements &
Leasehold
Interests
|
Improvements
|
Carrying
Costs
|
Land
|
Building,
Improvements &
Leasehold
Interests
|
Total
|
Accumulated
Depreciation
and
Amortization
|
Date of
Construction
|
Date
Acquired
|
||||||||||||||||||||||
|
Real Estate Held for Investment the Company has Invested in Under Operating Leases:
|
||||||||||||||||||||||||||||||||
|
American Retail Service:
|
|
|
|
|
|
|||||||||||||||||||||||||||
|
Lincoln City, OR
|
—
|
|
|
1,099
|
|
1,560
|
|
—
|
|
|
—
|
|
|
1,099
|
|
1,560
|
|
2,659
|
|
127
|
|
1973
|
12/12
|
|
25
|
|||||||
|
Salem, OR
|
—
|
|
|
433
|
|
1,627
|
|
735
|
|
|
—
|
|
|
433
|
|
2,362
|
|
2,795
|
|
131
|
|
1999
|
12/12
|
|
40
|
|||||||
|
Yuma, AZ
|
—
|
|
|
1,118
|
|
1,878
|
|
—
|
|
|
—
|
|
|
1,118
|
|
1,878
|
|
2,996
|
|
153
|
|
1987
|
12/12
|
|
25
|
|||||||
|
|
|
|
|
|
|
|||||||||||||||||||||||||||
|
Amoco:
|
|
|
|
|
|
|||||||||||||||||||||||||||
|
Miami, FL
|
—
|
|
|
969
|
|
—
|
|
—
|
|
|
—
|
|
|
969
|
|
(i)
|
|
969
|
|
(i)
|
|
(i)
|
05/03
|
|
(i)
|
|||||||
|
Sunrise, FL
|
—
|
|
|
949
|
|
—
|
|
—
|
|
|
—
|
|
|
949
|
|
(i)
|
|
949
|
|
(i)
|
|
(i)
|
06/03
|
|
(i)
|
|||||||
|
Deerfield Beach, FL
|
—
|
|
|
770
|
|
274
|
|
26
|
|
|
—
|
|
|
770
|
|
300
|
|
1,070
|
|
63
|
|
1980
|
12/05
|
|
40
|
|||||||
|
|
|
|
|
|
|
|||||||||||||||||||||||||||
|
Amscot:
|
|
|
|
|
|
|||||||||||||||||||||||||||
|
Tampa, FL
|
—
|
|
|
1,160
|
|
352
|
|
—
|
|
|
—
|
|
|
1,160
|
|
352
|
|
1,512
|
|
81
|
|
1981
|
10/05
|
|
40
|
|||||||
|
Orlando, FL
|
—
|
|
|
764
|
|
—
|
|
891
|
|
|
—
|
|
|
764
|
|
891
|
|
1,655
|
|
189
|
|
2006
|
12/05
|
|
40
|
|||||||
|
Orlando, FL
|
—
|
|
|
664
|
|
1,011
|
|
—
|
|
|
—
|
|
|
664
|
|
983
|
|
1,647
|
|
205
|
|
2006
|
12/05
|
(g)
|
40
|
|||||||
|
Orlando, FL
|
—
|
|
|
358
|
|
—
|
|
900
|
|
|
—
|
|
|
358
|
|
900
|
|
1,258
|
|
193
|
|
2006
|
02/06
|
(g)
|
40
|
|||||||
|
Orlando, FL
|
—
|
|
|
546
|
|
—
|
|
872
|
|
|
—
|
|
|
546
|
|
872
|
|
1,418
|
|
191
|
|
2006
|
02/06
|
(g)
|
40
|
|||||||
|
Clearwater, FL
|
—
|
|
|
456
|
|
332
|
|
—
|
|
|
—
|
|
|
456
|
|
332
|
|
788
|
|
69
|
|
1967
|
09/06
|
|
40
|
|||||||
|
|
|
|
|
|
|
|||||||||||||||||||||||||||
|
Applebee's:
|
|
|
|
|
|
|||||||||||||||||||||||||||
|
Ballwin, MO
|
—
|
|
|
1,496
|
|
1,404
|
|
—
|
|
|
—
|
|
|
1,496
|
|
1,404
|
|
2,900
|
|
458
|
|
1995
|
12/01
|
|
40
|
|||||||
|
Cincinnati, OH
|
—
|
|
|
312
|
|
898
|
|
—
|
|
|
—
|
|
|
312
|
|
898
|
|
1,210
|
|
131
|
|
2002
|
08/10
|
|
30
|
|||||||
|
Crestview Hills, KY
|
—
|
|
|
1,069
|
|
1,367
|
|
—
|
|
|
—
|
|
|
1,069
|
|
1,367
|
|
2,436
|
|
239
|
|
1993
|
08/10
|
|
25
|
|||||||
|
Danville, KY
|
—
|
|
|
641
|
|
1,645
|
|
—
|
|
|
—
|
|
|
641
|
|
1,645
|
|
2,286
|
|
240
|
|
2003
|
08/10
|
|
30
|
|||||||
|
Florence, KY
|
—
|
|
|
1,075
|
|
1,488
|
|
—
|
|
|
—
|
|
|
1,075
|
|
1,488
|
|
2,563
|
|
260
|
|
1988
|
08/10
|
|
25
|
|||||||
|
Frankfort, KY
|
—
|
|
|
862
|
|
1,610
|
|
—
|
|
|
—
|
|
|
862
|
|
1,610
|
|
2,472
|
|
235
|
|
1993
|
08/10
|
|
30
|
|||||||
|
Georgetown, KY
|
—
|
|
|
809
|
|
1,437
|
|
—
|
|
|
—
|
|
|
809
|
|
1,437
|
|
2,246
|
|
210
|
|
2001
|
08/10
|
|
30
|
|||||||
|
Hilliard, OH
|
—
|
|
|
808
|
|
1,846
|
|
—
|
|
|
—
|
|
|
808
|
|
1,846
|
|
2,654
|
|
269
|
|
1998
|
08/10
|
|
30
|
|||||||
|
Mason, OH
|
—
|
|
|
545
|
|
941
|
|
—
|
|
|
—
|
|
|
545
|
|
941
|
|
1,486
|
|
137
|
|
1997
|
08/10
|
|
30
|
|||||||
|
Maysville, KY
|
—
|
|
|
513
|
|
1,387
|
|
—
|
|
|
—
|
|
|
513
|
|
1,387
|
|
1,900
|
|
173
|
|
2005
|
08/10
|
|
35
|
|||||||
|
Nicholasville, KY
|
—
|
|
|
454
|
|
1,077
|
|
—
|
|
|
—
|
|
|
454
|
|
1,077
|
|
1,531
|
|
157
|
|
2000
|
08/10
|
|
30
|
|||||||
|
Troy, OH
|
—
|
|
|
645
|
|
862
|
|
—
|
|
|
—
|
|
|
645
|
|
862
|
|
1,507
|
|
151
|
|
1996
|
08/10
|
|
25
|
|||||||
|
Grove City, OH
|
—
|
|
|
511
|
|
1,415
|
|
—
|
|
|
—
|
|
|
511
|
|
1,415
|
|
1,926
|
|
198
|
|
1990
|
10/10
|
|
30
|
|||||||
|
Kettering, OH
|
—
|
|
|
359
|
|
1,043
|
|
—
|
|
|
—
|
|
|
359
|
|
1,043
|
|
1,402
|
|
125
|
|
2005
|
10/10
|
|
35
|
|||||||
|
Mesa, AZ
|
—
|
|
|
974
|
|
1,514
|
|
—
|
|
|
—
|
|
|
974
|
|
1,514
|
|
2,488
|
|
212
|
|
1992
|
10/10
|
|
30
|
|||||||
See accompanying report of independent registered public accounting firm.
F-4
|
Initial Cost to
Company
|
Costs Capitalized
Subsequent to
Acquisition
|
Gross Amount at Which
Carried at Close of Period (a) (b)
|
Life on Which
Depreciation &
Amortization in Latest Income
Statement is
Computed (Years)
|
||||||||||||||||||||||||||||||
|
Encumbrances
|
Land
|
Building,
Improvements &
Leasehold
Interests
|
Improvements
|
Carrying
Costs
|
Land
|
Building,
Improvements &
Leasehold
Interests
|
Total
|
Accumulated
Depreciation
and
Amortization
|
Date of
Construction
|
Date
Acquired
|
|||||||||||||||||||||||
|
Real Estate Held for Investment the Company has Invested in Under Operating Leases:
|
|||||||||||||||||||||||||||||||||
|
Mesa, AZ
|
—
|
|
|
748
|
|
1,734
|
|
—
|
|
|
—
|
|
|
748
|
|
1,734
|
|
2,482
|
|
243
|
|
1998
|
|
10/10
|
|
30
|
|||||||
|
Mt. Sterling, KY
|
—
|
|
|
510
|
|
1,392
|
|
—
|
|
|
—
|
|
|
510
|
|
1,392
|
|
1,902
|
|
167
|
|
2000
|
|
10/10
|
|
35
|
|||||||
|
Phoenix, AZ
|
—
|
|
781
|
|
1,456
|
|
—
|
|
—
|
|
781
|
|
1,456
|
|
2,237
|
|
204
|
|
1,995
|
|
10/10
|
30
|
|||||||||||
|
Phoenix, AZ
|
—
|
|
|
458
|
|
1,099
|
|
—
|
|
|
—
|
|
|
458
|
|
1,099
|
|
1,557
|
|
132
|
|
2004
|
|
10/10
|
|
35
|
|||||||
|
Angola, IN
|
—
|
|
|
478
|
|
1,533
|
|
—
|
|
|
—
|
|
|
478
|
|
1,533
|
|
2,011
|
|
20
|
|
2002
|
|
07/14
|
|
35
|
|||||||
|
|
|
|
|
|
|||||||||||||||||||||||||||||
|
Arby's:
|
|||||||||||||||||||||||||||||||||
|
Colorado Springs, CO
|
—
|
|
|
206
|
|
534
|
|
—
|
|
|
—
|
|
|
206
|
|
534
|
|
740
|
|
174
|
|
1998
|
|
12/01
|
|
40
|
|||||||
|
Thomson, GA
|
—
|
|
|
268
|
|
504
|
|
—
|
|
|
—
|
|
|
268
|
|
504
|
|
772
|
|
164
|
|
1997
|
|
12/01
|
|
40
|
|||||||
|
Washington Courthouse, OH
|
—
|
|
|
157
|
|
546
|
|
—
|
|
|
—
|
|
|
157
|
|
546
|
|
703
|
|
178
|
|
1998
|
|
12/01
|
|
40
|
|||||||
|
Whitmore Lake, MI
|
—
|
|
|
171
|
|
469
|
|
—
|
|
|
—
|
|
|
171
|
|
469
|
|
640
|
|
153
|
|
1993
|
|
12/01
|
|
40
|
|||||||
|
Indianapolis, IN
|
—
|
|
|
285
|
|
686
|
|
—
|
|
|
—
|
|
|
285
|
|
686
|
|
971
|
|
10
|
|
1998
|
|
07/14
|
|
30
|
|||||||
|
Indianapolis, IN
|
—
|
|
|
456
|
|
830
|
|
—
|
|
|
—
|
|
|
456
|
|
830
|
|
1,286
|
|
11
|
|
2005
|
|
07/14
|
|
35
|
|||||||
|
|
|
|
|
|
|
||||||||||||||||||||||||||||
|
ARCO ampm:
|
|
|
|
|
|
||||||||||||||||||||||||||||
|
Casa Grande, AZ
|
—
|
|
|
2,340
|
|
1,894
|
|
83
|
|
|
—
|
|
|
2,340
|
|
1,905
|
|
4,245
|
|
366
|
|
1993
|
|
05/08
|
|
35
|
|||||||
|
Gilbert, AZ
|
—
|
|
|
1,317
|
|
1,304
|
|
85
|
|
|
—
|
|
|
1,166
|
|
1,325
|
|
2,491
|
|
262
|
|
1996
|
|
05/08
|
|
35
|
|||||||
|
Globe, AZ
|
—
|
|
|
762
|
|
2,148
|
|
114
|
|
|
—
|
|
|
762
|
|
2,180
|
|
2,942
|
|
429
|
|
1998
|
|
05/08
|
|
35
|
|||||||
|
Mesa, AZ
|
—
|
|
|
1,332
|
|
1,367
|
|
92
|
|
|
—
|
|
|
1,156
|
|
1,385
|
|
2,541
|
|
315
|
|
1986
|
|
05/08
|
|
30
|
|||||||
|
Mesa, AZ
|
—
|
|
|
2,219
|
|
2,140
|
|
89
|
|
|
—
|
|
|
2,219
|
|
2,170
|
|
4,389
|
|
375
|
|
2000
|
|
05/08
|
|
40
|
|||||||
|
Prescott, AZ
|
—
|
|
|
1,266
|
|
1,261
|
|
118
|
|
|
—
|
|
|
1,266
|
|
1,294
|
|
2,560
|
|
262
|
|
1997
|
|
05/08
|
|
35
|
|||||||
|
Scottsdale, AZ
|
—
|
|
|
1,529
|
|
1,373
|
|
240
|
|
|
—
|
|
|
1,529
|
|
1,451
|
|
2,980
|
|
315
|
|
1999
|
|
05/08
|
|
35
|
|||||||
|
Sedona, AZ
|
—
|
|
|
1,281
|
|
1,324
|
|
107
|
|
|
—
|
|
|
1,281
|
|
1,345
|
|
2,626
|
|
234
|
|
2000
|
|
05/08
|
|
40
|
|||||||
|
Tucson, AZ
|
—
|
|
|
1,105
|
|
1,336
|
|
111
|
|
|
—
|
|
|
1,105
|
|
1,358
|
|
2,463
|
|
269
|
|
1992
|
|
05/08
|
|
35
|
|||||||
|
Tucson, AZ
|
—
|
|
|
1,457
|
|
1,619
|
|
125
|
|
|
—
|
|
|
1,457
|
|
1,651
|
|
3,108
|
|
329
|
|
1995
|
|
05/08
|
|
35
|
|||||||
|
Tucson, AZ
|
—
|
|
|
1,083
|
|
1,599
|
|
86
|
|
|
—
|
|
|
1,083
|
|
1,620
|
|
2,703
|
|
318
|
|
1992
|
|
05/08
|
|
35
|
|||||||
|
Tucson, AZ
|
—
|
|
|
1,223
|
|
1,911
|
|
102
|
|
|
—
|
|
|
1,223
|
|
1,932
|
|
3,155
|
|
377
|
|
1996
|
|
05/08
|
|
35
|
|||||||
|
Soldotna, AK
|
—
|
|
|
180
|
|
891
|
|
—
|
|
|
—
|
|
|
180
|
|
891
|
|
1,071
|
|
16
|
|
1985
|
|
07/14
|
|
25
|
|||||||
|
|
|
|
|
|
|
||||||||||||||||||||||||||||
|
Ashley Furniture:
|
|
|
|
|
|
||||||||||||||||||||||||||||
|
Altamonte Springs, FL
|
—
|
|
|
2,906
|
|
4,877
|
|
315
|
|
|
—
|
|
|
2,906
|
|
5,192
|
|
8,098
|
|
2,219
|
|
1997
|
|
09/97
|
|
40
|
|||||||
|
Florissant, MO
|
—
|
|
|
896
|
|
1,057
|
|
3,058
|
|
|
—
|
|
|
899
|
|
4,113
|
|
5,012
|
|
507
|
|
1996
|
|
04/03
|
(g)
|
40
|
|||||||
|
Louisville, KY
|
—
|
|
|
1,667
|
|
4,989
|
|
—
|
|
|
—
|
|
|
1,667
|
|
4,989
|
|
6,656
|
|
1,221
|
|
2005
|
|
03/05
|
|
40
|
|||||||
|
|
|
|
|
|
|
||||||||||||||||||||||||||||
See accompanying report of independent registered public accounting firm.
F-5
|
Initial Cost to
Company
|
Costs Capitalized
Subsequent to
Acquisition
|
Gross Amount at Which
Carried at Close of Period (a) (b)
|
Life on Which
Depreciation &
Amortization in Latest Income
Statement is
Computed (Years)
|
||||||||||||||||||||||||||||||
|
Encumbrances
|
Land
|
Building,
Improvements &
Leasehold
Interests
|
Improvements
|
Carrying
Costs
|
Land
|
Building,
Improvements &
Leasehold
Interests
|
Total
|
Accumulated
Depreciation
and
Amortization
|
Date of
Construction
|
Date
Acquired
|
|||||||||||||||||||||||
|
Real Estate Held for Investment the Company has Invested in Under Operating Leases:
|
|||||||||||||||||||||||||||||||||
|
At Home:
|
|
|
|
|
|
||||||||||||||||||||||||||||
|
Douglasville, GA
|
—
|
|
|
1,588
|
|
3,916
|
|
—
|
|
|
—
|
|
|
1,588
|
|
3,916
|
|
5,504
|
|
498
|
|
1987
|
|
06/12
|
|
20
|
|||||||
|
Humble, TX
|
—
|
|
|
3,559
|
|
5,046
|
|
—
|
|
|
—
|
|
|
3,559
|
|
5,046
|
|
8,605
|
|
513
|
|
2001
|
|
06/12
|
|
25
|
|||||||
|
Noblesville, IN
|
—
|
|
|
1,870
|
|
4,241
|
|
—
|
|
|
—
|
|
|
1,870
|
|
4,241
|
|
6,111
|
|
539
|
|
1995
|
|
06/12
|
|
20
|
|||||||
|
Sandston, VA
|
—
|
|
|
1,972
|
|
6,599
|
|
—
|
|
|
—
|
|
|
1,972
|
|
6,599
|
|
8,571
|
|
671
|
|
1996
|
|
06/12
|
|
25
|
|||||||
|
Greensboro, NC
|
—
|
|
|
2,121
|
|
6,460
|
|
—
|
|
|
—
|
|
|
2,121
|
|
6,460
|
|
8,581
|
|
440
|
|
1998
|
|
12/12
|
|
30
|
|||||||
|
Greenville, SC
|
—
|
|
|
1,892
|
|
5,404
|
|
—
|
|
|
—
|
|
|
1,892
|
|
5,404
|
|
7,296
|
|
81
|
|
1996
|
|
08/14
|
|
25
|
|||||||
|
Hilliard, OH
|
—
|
|
|
1,747
|
|
4,642
|
|
—
|
|
|
—
|
|
|
1,747
|
|
4,642
|
|
6,389
|
|
48
|
|
1994
|
|
10/14
|
|
20
|
|||||||
|
|
|
|
|
|
|
||||||||||||||||||||||||||||
|
AT&T:
|
|
|
|
|
|
||||||||||||||||||||||||||||
|
Cincinnati, OH
|
—
|
|
|
297
|
|
443
|
|
347
|
|
|
—
|
|
|
312
|
|
775
|
|
1,087
|
|
225
|
|
1999
|
|
06/98
|
|
40
|
|||||||
|
|
|
|
|
|
|
||||||||||||||||||||||||||||
|
Babies R Us:
|
|
|
|
|
|
||||||||||||||||||||||||||||
|
Arlington, TX
|
—
|
|
|
831
|
|
2,612
|
|
—
|
|
|
—
|
|
|
831
|
|
2,612
|
|
3,443
|
|
1,209
|
|
1996
|
|
06/96
|
|
40
|
|||||||
|
Independence, MO
|
—
|
|
|
1,679
|
|
2,302
|
|
115
|
|
|
—
|
|
|
1,679
|
|
2,417
|
|
4,096
|
|
776
|
|
1996
|
|
12/01
|
|
40
|
|||||||
|
|
|
|
|
|
|
||||||||||||||||||||||||||||
|
BankUnited:
|
|
|
|
|
|
||||||||||||||||||||||||||||
|
Orlando, FL
|
—
|
|
|
257
|
|
287
|
|
—
|
|
|
—
|
|
|
257
|
|
72
|
|
329
|
|
9
|
|
1988
|
|
07/92
|
|
30
|
|||||||
|
|
|
|
|
|
|
||||||||||||||||||||||||||||
|
Barnes & Noble:
|
|
|
|
|
|
||||||||||||||||||||||||||||
|
Brandon, FL
|
—
|
|
|
1,476
|
|
1,527
|
|
—
|
|
|
—
|
|
|
1,476
|
|
1,527
|
|
3,003
|
|
763
|
|
1995
|
|
08/94
|
(f)
|
40
|
|||||||
|
Glendale, CO
|
—
|
|
|
3,245
|
|
2,722
|
|
—
|
|
|
—
|
|
|
3,245
|
|
2,722
|
|
5,967
|
|
1,378
|
|
1994
|
|
09/94
|
|
40
|
|||||||
|
Houston, TX
|
—
|
|
|
3,308
|
|
2,396
|
|
—
|
|
|
—
|
|
|
3,308
|
|
2,396
|
|
5,704
|
|
1,153
|
|
1995
|
|
10/94
|
(f)
|
40
|
|||||||
|
Plantation, FL
|
—
|
|
|
3,616
|
|
3,498
|
|
—
|
|
|
—
|
|
|
3,616
|
|
960
|
|
4,576
|
|
39
|
|
1996
|
|
05/95
|
(f)
|
30
|
|||||||
|
Freehold, NJ (n)
|
—
|
|
|
2,917
|
|
2,261
|
|
—
|
|
|
—
|
|
|
2,917
|
|
2,261
|
|
5,178
|
|
1,069
|
|
1995
|
|
01/96
|
|
40
|
|||||||
|
Dayton, OH
|
—
|
|
|
1,413
|
|
3,325
|
|
—
|
|
|
—
|
|
|
1,413
|
|
3,325
|
|
4,738
|
|
1,446
|
|
1996
|
|
05/97
|
|
40
|
|||||||
|
Redding, CA
|
—
|
|
|
497
|
|
1,626
|
|
—
|
|
|
—
|
|
|
497
|
|
1,626
|
|
2,123
|
|
713
|
|
1997
|
|
06/97
|
|
40
|
|||||||
|
Memphis, TN
|
—
|
|
|
1,574
|
|
2,242
|
|
—
|
|
|
—
|
|
|
1,574
|
|
2,242
|
|
3,816
|
|
612
|
|
1997
|
|
09/97
|
|
40
|
|||||||
|
Marlton, NJ
|
—
|
|
|
2,831
|
|
4,319
|
|
—
|
|
|
—
|
|
|
2,709
|
|
4,319
|
|
7,028
|
|
1,741
|
|
1995
|
|
11/98
|
|
40
|
|||||||
|
|
|
|
|
|
|
||||||||||||||||||||||||||||
|
Batteries Plus Bulbs:
|
|
|
|
|
|
||||||||||||||||||||||||||||
|
Sunrise, FL
|
—
|
|
|
287
|
|
424
|
|
—
|
|
|
—
|
|
|
287
|
|
424
|
|
711
|
|
112
|
|
1979
|
|
05/04
|
|
40
|
|||||||
|
|
|
|
|
|
|
||||||||||||||||||||||||||||
See accompanying report of independent registered public accounting firm.
F-6
|
Initial Cost to
Company
|
Costs Capitalized
Subsequent to
Acquisition
|
Gross Amount at Which
Carried at Close of Period (a) (b)
|
Life on Which
Depreciation &
Amortization in Latest Income
Statement is
Computed (Years)
|
||||||||||||||||||||||||||||||
|
Encumbrances
|
Land
|
Building,
Improvements &
Leasehold
Interests
|
Improvements
|
Carrying
Costs
|
Land
|
Building,
Improvements &
Leasehold
Interests
|
Total
|
Accumulated
Depreciation
and
Amortization
|
Date of
Construction
|
Date
Acquired
|
|||||||||||||||||||||||
|
Real Estate Held for Investment the Company has Invested in Under Operating Leases:
|
|||||||||||||||||||||||||||||||||
|
Bealls:
|
|
|
|
|
|
||||||||||||||||||||||||||||
|
Sarasota, FL
|
—
|
|
|
1,078
|
|
1,795
|
|
—
|
|
|
—
|
|
|
1,078
|
|
1,795
|
|
2,873
|
|
513
|
|
1996
|
|
09/97
|
|
40
|
|||||||
|
|
|
|
|
|
|
||||||||||||||||||||||||||||
|
Beautiful America Dry Cleaners:
|
|
|
|
|
|
||||||||||||||||||||||||||||
|
Orlando, FL
|
19
|
|
(h)
|
40
|
|
111
|
|
—
|
|
|
—
|
|
|
40
|
|
111
|
|
151
|
|
30
|
|
2001
|
|
02/04
|
|
40
|
|||||||
|
|
|
|
|
|
|
||||||||||||||||||||||||||||
|
Bed Bath & Beyond:
|
|
|
|
|
|
||||||||||||||||||||||||||||
|
Glen Allen, VA
|
—
|
|
|
1,184
|
|
2,843
|
|
179
|
|
|
—
|
|
|
1,184
|
|
3,021
|
|
4,205
|
|
920
|
|
1997
|
|
06/98
|
|
40
|
|||||||
|
Glendale, AZ
|
—
|
|
|
1,082
|
|
—
|
|
2,758
|
|
|
—
|
|
|
1,082
|
|
2,758
|
|
3,840
|
|
1,066
|
|
1999
|
|
12/98
|
(g)
|
40
|
|||||||
|
Midland, MI
|
—
|
|
|
231
|
|
—
|
|
2,705
|
|
|
—
|
|
|
231
|
|
2,705
|
|
2,936
|
|
550
|
|
2006
|
|
07/03
|
|
40
|
|||||||
|
Colonie, NY
|
—
|
|
|
3,119
|
|
4,130
|
|
—
|
|
|
—
|
|
|
3,119
|
|
4,130
|
|
7,249
|
|
52
|
|
1967
|
|
08/14
|
|
30
|
|||||||
|
|
|
|
|
|
|
||||||||||||||||||||||||||||
|
Bell Carolina (Taco Bell):
|
|
|
|
|
|
||||||||||||||||||||||||||||
|
Fayetteville, NC
|
—
|
|
|
289
|
|
1,205
|
|
—
|
|
|
—
|
|
|
289
|
|
1,205
|
|
1,494
|
|
22
|
|
1998
|
|
06/14
|
|
30
|
|||||||
|
Fayetteville, NC
|
—
|
|
|
607
|
|
1,135
|
|
—
|
|
|
—
|
|
|
607
|
|
1,135
|
|
1,742
|
|
25
|
|
1982
|
|
06/14
|
|
25
|
|||||||
|
Fayetteville, NC
|
—
|
|
|
686
|
|
1,631
|
|
—
|
|
|
—
|
|
|
686
|
|
1,631
|
|
2,317
|
|
35
|
|
1992
|
|
06/14
|
|
25
|
|||||||
|
Fayetteville, NC
|
—
|
|
|
269
|
|
1,771
|
|
—
|
|
|
—
|
|
|
269
|
|
1,771
|
|
2,040
|
|
38
|
|
1993
|
|
06/14
|
|
25
|
|||||||
|
Fayetteville, NC
|
—
|
|
|
388
|
|
1,552
|
|
—
|
|
|
—
|
|
|
388
|
|
1,552
|
|
1,940
|
|
28
|
|
1996
|
|
06/14
|
|
30
|
|||||||
|
Fayetteville, NC
|
—
|
|
|
448
|
|
1,334
|
|
—
|
|
|
—
|
|
|
448
|
|
1,334
|
|
1,782
|
|
24
|
|
1998
|
|
06/14
|
|
30
|
|||||||
|
Fayetteville, NC
|
—
|
|
|
149
|
|
1,652
|
|
—
|
|
|
—
|
|
|
149
|
|
1,652
|
|
1,801
|
|
36
|
|
1988
|
|
06/14
|
|
25
|
|||||||
|
Fayetteville, NC
|
—
|
|
|
497
|
|
1,691
|
|
—
|
|
|
—
|
|
|
497
|
|
1,691
|
|
2,188
|
|
31
|
|
2008
|
|
06/14
|
|
30
|
|||||||
|
Fayetteville, NC
|
—
|
|
|
298
|
|
1,989
|
|
—
|
|
|
—
|
|
|
298
|
|
1,989
|
|
2,287
|
|
36
|
|
2005
|
|
06/14
|
|
30
|
|||||||
|
Holly Ridge, NC
|
—
|
|
|
189
|
|
1,791
|
|
—
|
|
|
—
|
|
|
189
|
|
1,791
|
|
1,980
|
|
28
|
|
2012
|
|
06/14
|
|
35
|
|||||||
|
Hope Mills, NC
|
—
|
|
|
438
|
|
2,138
|
|
—
|
|
|
—
|
|
|
438
|
|
2,138
|
|
2,576
|
|
46
|
|
1990
|
|
06/14
|
|
25
|
|||||||
|
Jacksonville, NC
|
—
|
|
|
398
|
|
2,069
|
|
—
|
|
|
—
|
|
|
398
|
|
2,069
|
|
2,467
|
|
37
|
|
1994
|
|
06/14
|
|
30
|
|||||||
|
Jacksonville, NC
|
—
|
|
|
428
|
|
2,327
|
|
—
|
|
|
—
|
|
|
428
|
|
2,327
|
|
2,755
|
|
50
|
|
1993
|
|
06/14
|
|
25
|
|||||||
|
Jacksonville, NC
|
—
|
|
|
388
|
|
2,347
|
|
—
|
|
|
—
|
|
|
388
|
|
2,347
|
|
2,735
|
|
36
|
|
2007
|
|
06/14
|
|
35
|
|||||||
|
Jacksonville, NC
|
—
|
|
|
577
|
|
1,304
|
|
—
|
|
|
—
|
|
|
577
|
|
1,304
|
|
1,881
|
|
20
|
|
2013
|
|
06/14
|
|
35
|
|||||||
|
Leland, NC
|
—
|
|
|
289
|
|
1,205
|
|
—
|
|
|
—
|
|
|
289
|
|
1,205
|
|
1,494
|
|
19
|
|
2008
|
|
06/14
|
|
35
|
|||||||
|
Lumberton, NC
|
—
|
|
|
368
|
|
2,208
|
|
—
|
|
|
—
|
|
|
368
|
|
2,208
|
|
2,576
|
|
40
|
|
2003
|
|
06/14
|
|
30
|
|||||||
|
Midway Park, NC
|
—
|
|
|
467
|
|
2,069
|
|
—
|
|
|
—
|
|
|
467
|
|
2,069
|
|
2,536
|
|
45
|
|
1993
|
|
06/14
|
|
25
|
|||||||
|
Pembroke, NC
|
—
|
|
|
438
|
|
1,095
|
|
—
|
|
|
—
|
|
|
438
|
|
1,095
|
|
1,533
|
|
20
|
|
2008
|
|
06/14
|
|
30
|
|||||||
|
Saint Pauls, NC
|
—
|
|
|
419
|
|
767
|
|
—
|
|
|
—
|
|
|
419
|
|
767
|
|
1,186
|
|
14
|
|
2008
|
|
06/14
|
|
30
|
|||||||
See accompanying report of independent registered public accounting firm.
F-7
|
Initial Cost to
Company
|
Costs Capitalized
Subsequent to
Acquisition
|
Gross Amount at Which
Carried at Close of Period (a) (b)
|
Life on Which
Depreciation &
Amortization in Latest Income
Statement is
Computed (Years)
|
|||||||||||||||||||||||||||||
|
Encumbrances
|
Land
|
Building,
Improvements &
Leasehold
Interests
|
Improvements
|
Carrying
Costs
|
Land
|
Building,
Improvements &
Leasehold
Interests
|
Total
|
Accumulated
Depreciation
and
Amortization
|
Date of
Construction
|
Date
Acquired
|
||||||||||||||||||||||
|
Real Estate Held for Investment the Company has Invested in Under Operating Leases:
|
||||||||||||||||||||||||||||||||
|
Shallotte, NC
|
—
|
|
|
329
|
|
827
|
|
—
|
|
|
—
|
|
|
329
|
|
827
|
|
1,156
|
|
13
|
|
2011
|
06/14
|
|
35
|
|||||||
|
Spring Lake, NC
|
—
|
|
|
408
|
|
2,009
|
|
—
|
|
|
—
|
|
|
408
|
|
2,009
|
|
2,417
|
|
31
|
|
2009
|
06/14
|
|
35
|
|||||||
|
Whiteville, NC
|
—
|
|
|
179
|
|
1,315
|
|
—
|
|
|
—
|
|
|
179
|
|
1,315
|
|
1,494
|
|
20
|
|
2010
|
06/14
|
|
35
|
|||||||
|
Wilmington, NC
|
—
|
|
|
547
|
|
1,423
|
|
—
|
|
|
—
|
|
|
547
|
|
1,423
|
|
1,970
|
|
22
|
|
2013
|
06/14
|
|
35
|
|||||||
|
Wilmington, NC
|
—
|
|
|
239
|
|
1,463
|
|
—
|
|
|
—
|
|
|
239
|
|
1,463
|
|
1,702
|
|
23
|
|
2013
|
06/14
|
|
35
|
|||||||
|
Wilmington, NC
|
—
|
|
|
587
|
|
2,277
|
|
—
|
|
|
—
|
|
|
587
|
|
2,277
|
|
2,864
|
|
35
|
|
2006
|
06/14
|
|
35
|
|||||||
|
|
|
|
|
|
|
|||||||||||||||||||||||||||
|
Best Buy:
|
|
|
|
|
|
|||||||||||||||||||||||||||
|
Brandon, FL
|
—
|
|
|
2,985
|
|
2,772
|
|
—
|
|
|
—
|
|
|
2,985
|
|
2,772
|
|
5,757
|
|
1,239
|
|
1996
|
02/97
|
|
40
|
|||||||
|
Cuyahoga Falls, OH
|
—
|
|
|
3,709
|
|
2,359
|
|
—
|
|
|
—
|
|
|
3,709
|
|
2,359
|
|
6,068
|
|
1,035
|
|
1970
|
06/97
|
|
40
|
|||||||
|
Rockville, MD
|
—
|
|
|
6,233
|
|
3,419
|
|
—
|
|
|
—
|
|
|
6,233
|
|
3,419
|
|
9,652
|
|
1,492
|
|
1995
|
07/97
|
|
40
|
|||||||
|
Fairfax, VA
|
—
|
|
|
3,052
|
|
3,218
|
|
—
|
|
|
—
|
|
|
3,052
|
|
3,218
|
|
6,270
|
|
1,398
|
|
1995
|
08/97
|
|
40
|
|||||||
|
St. Petersburg, FL
|
—
|
|
|
4,032
|
|
2,611
|
|
—
|
|
|
—
|
|
|
4,032
|
|
2,611
|
|
6,643
|
|
939
|
|
1997
|
09/97
|
|
35
|
|||||||
|
North Fayette, PA
|
—
|
|
|
2,331
|
|
2,293
|
|
—
|
|
|
—
|
|
|
2,331
|
|
2,293
|
|
4,624
|
|
948
|
|
1997
|
06/98
|
|
40
|
|||||||
|
Denver, CO
|
—
|
|
|
8,882
|
|
4,373
|
|
—
|
|
|
—
|
|
|
8,882
|
|
4,373
|
|
13,255
|
|
1,480
|
|
1991
|
06/01
|
|
40
|
|||||||
|
Albuquerque, NM
|
—
|
|
|
2,157
|
|
3,132
|
|
—
|
|
|
—
|
|
|
2,157
|
|
3,132
|
|
5,289
|
|
412
|
|
1992
|
09/11
|
|
25
|
|||||||
|
Arlington, TX
|
—
|
|
|
1,372
|
|
3,890
|
|
—
|
|
|
—
|
|
|
1,372
|
|
3,890
|
|
5,262
|
|
512
|
|
1991
|
09/11
|
|
25
|
|||||||
|
Beaumont, TX
|
—
|
|
|
614
|
|
2,177
|
|
—
|
|
|
—
|
|
|
614
|
|
2,177
|
|
2,791
|
|
358
|
|
1992
|
09/11
|
|
20
|
|||||||
|
Dallas, TX
|
—
|
|
|
906
|
|
—
|
|
—
|
|
|
—
|
|
|
906
|
|
(e)
|
|
906
|
|
(e)
|
|
1990
|
09/11
|
|
(e)
|
|||||||
|
Fort Collins, CO
|
—
|
|
|
2,054
|
|
3,346
|
|
—
|
|
|
—
|
|
|
2,054
|
|
3,346
|
|
5,400
|
|
441
|
|
1992
|
09/11
|
|
25
|
|||||||
|
Fort Worth, TX
|
—
|
|
|
687
|
|
2,177
|
|
—
|
|
|
—
|
|
|
687
|
|
2,177
|
|
2,864
|
|
239
|
|
1992
|
09/11
|
|
30
|
|||||||
|
Houston, TX
|
—
|
|
|
1,409
|
|
3,095
|
|
—
|
|
|
—
|
|
|
1,409
|
|
3,095
|
|
4,504
|
|
340
|
|
1992
|
09/11
|
|
30
|
|||||||
|
Matteson, IL
|
—
|
|
|
384
|
|
2,089
|
|
—
|
|
|
—
|
|
|
384
|
|
2,089
|
|
2,473
|
|
344
|
|
1992
|
09/11
|
|
20
|
|||||||
|
Nashua, NH
|
—
|
|
|
1,028
|
|
7,052
|
|
—
|
|
|
—
|
|
|
1,028
|
|
7,052
|
|
8,080
|
|
774
|
|
1999
|
09/11
|
|
30
|
|||||||
|
North Attleborough, MA
|
—
|
|
|
2,761
|
|
4,165
|
|
—
|
|
|
—
|
|
|
2,761
|
|
4,165
|
|
6,926
|
|
457
|
|
1999
|
09/11
|
|
30
|
|||||||
|
Schaumburg, IL
|
—
|
|
|
3,170
|
|
4,784
|
|
—
|
|
|
—
|
|
|
3,170
|
|
4,784
|
|
7,954
|
|
787
|
|
1965
|
09/11
|
|
20
|
|||||||
|
Virginia Beach, VA
|
—
|
|
|
3,140
|
|
4,276
|
|
—
|
|
|
—
|
|
|
3,140
|
|
4,276
|
|
7,416
|
|
469
|
|
1999
|
09/11
|
|
30
|
|||||||
|
|
|
|
|
|
|
|||||||||||||||||||||||||||
|
Big Lots:
|
|
|
|
|
|
|||||||||||||||||||||||||||
|
Dover, NJ
|
—
|
|
|
1,138
|
|
3,238
|
|
732
|
|
|
—
|
|
|
1,138
|
|
3,970
|
|
5,108
|
|
1,377
|
|
1995
|
11/98
|
|
40
|
|||||||
|
|
|
|
|
|
|
|||||||||||||||||||||||||||
|
BJ's Wholesale Club:
|
|
|
|
|
|
|||||||||||||||||||||||||||
|
Orlando, FL
|
1,466
|
|
(h)
|
3,271
|
|
8,627
|
|
367
|
|
|
—
|
|
|
3,271
|
|
8,979
|
|
12,250
|
|
2,443
|
|
2001
|
02/04
|
|
40
|
|||||||
|
Attleboro, MA
|
—
|
|
|
4,988
|
|
26,364
|
|
—
|
|
|
—
|
|
|
4,988
|
|
26,364
|
|
31,352
|
|
2,893
|
|
1993
|
09/11
|
|
30
|
|||||||
|
Fairfax, VA
|
—
|
|
|
6,792
|
|
14,941
|
|
—
|
|
|
—
|
|
|
6,792
|
|
14,941
|
|
21,733
|
|
1,639
|
|
1992
|
09/11
|
|
30
|
|||||||
|
Hamilton, NJ
|
—
|
|
|
3,166
|
|
29,373
|
|
—
|
|
|
—
|
|
|
3,166
|
|
29,373
|
|
32,539
|
|
2,762
|
|
2002
|
09/11
|
|
35
|
|||||||
|
Hialeah, FL
|
—
|
|
|
4,792
|
|
14,067
|
|
—
|
|
|
—
|
|
|
4,792
|
|
14,067
|
|
18,859
|
|
1,543
|
|
2000
|
09/11
|
|
30
|
|||||||
|
Roxbury, NJ
|
—
|
|
|
3,040
|
|
16,168
|
|
—
|
|
|
—
|
|
|
3,040
|
|
16,168
|
|
19,208
|
|
2,129
|
|
1993
|
09/11
|
|
25
|
|||||||
|
W. Hartford, CT
|
—
|
|
|
2,846
|
|
14,299
|
|
—
|
|
|
—
|
|
|
2,846
|
|
14,299
|
|
17,145
|
|
1,569
|
|
1996
|
09/11
|
|
30
|
|||||||
|
|
|
|
|
|
|
|||||||||||||||||||||||||||
|
Black Fox Beauty Supply:
|
|
|
|
|
|
|||||||||||||||||||||||||||
|
Corpus Christi, TX
|
—
|
|
|
125
|
|
137
|
|
195
|
|
|
—
|
|
|
125
|
|
332
|
|
457
|
|
115
|
|
1967
|
11/93
|
|
40
|
|||||||
|
|
|
|
|
|
|
|||||||||||||||||||||||||||
|
Blend Frozen Yogurt:
|
|
|
|
|
|
|||||||||||||||||||||||||||
|
Lapeer, MI
|
—
|
|
|
63
|
|
457
|
|
—
|
|
|
—
|
|
|
63
|
|
436
|
|
499
|
|
83
|
|
2007
|
10/05
|
|
40
|
|||||||
|
|
|
|
|
|
|
|||||||||||||||||||||||||||
|
BMW:
|
|
|
|
|
|
|||||||||||||||||||||||||||
|
Duluth, GA
|
—
|
|
|
4,434
|
|
4,080
|
|
6,559
|
|
|
—
|
|
|
4,504
|
|
10,639
|
|
15,143
|
|
2,499
|
|
1984
|
12/01
|
|
40
|
|||||||
|
|
|
|
|
|
|
|||||||||||||||||||||||||||
|
Bombones Sports Bar:
|
|
|
|
|
|
|||||||||||||||||||||||||||
|
Dallas, TX
|
—
|
|
|
1,138
|
|
1,025
|
|
—
|
|
|
—
|
|
|
1,138
|
|
1,025
|
|
2,163
|
|
334
|
|
1994
|
12/01
|
|
40
|
|||||||
|
|
|
|
|
|
|
|||||||||||||||||||||||||||
|
Bonefish:
|
|
|
|
|
|
|||||||||||||||||||||||||||
|
Mobile, AL
|
—
|
|
|
801
|
|
2,137
|
|
—
|
|
|
—
|
|
|
801
|
|
2,137
|
|
2,938
|
|
170
|
|
2006
|
03/12
|
|
35
|
|||||||
|
Pensacola, FL
|
—
|
|
|
734
|
|
2,003
|
|
—
|
|
|
—
|
|
|
734
|
|
2,003
|
|
2,737
|
|
160
|
|
2004
|
03/12
|
|
35
|
|||||||
|
|
|
|
|
|
|
|||||||||||||||||||||||||||
|
Books-A-Million:
|
|
|
|
|
|
|||||||||||||||||||||||||||
|
Newark, DE
|
—
|
|
|
2,394
|
|
4,789
|
|
—
|
|
|
—
|
|
|
2,366
|
|
4,789
|
|
7,155
|
|
2,398
|
|
1994
|
12/94
|
|
40
|
|||||||
|
Bangor, ME
|
—
|
|
|
1,547
|
|
2,487
|
|
—
|
|
|
—
|
|
|
1,547
|
|
2,487
|
|
4,034
|
|
1,152
|
|
1996
|
06/96
|
|
40
|
|||||||
|
|
|
|
|
|
|
|||||||||||||||||||||||||||
|
Borough of Abbottstown:
|
|
|
|
|
|
|||||||||||||||||||||||||||
|
Abbottstown, PA
|
—
|
|
|
55
|
|
200
|
|
—
|
|
|
—
|
|
|
55
|
|
200
|
|
255
|
|
45
|
|
2000
|
01/06
|
|
40
|
|||||||
|
|
|
|
|
|
|
|||||||||||||||||||||||||||
|
Boston Market:
|
|
|
|
|
|
|||||||||||||||||||||||||||
|
Geneva, IL
|
—
|
|
|
653
|
|
601
|
|
—
|
|
|
—
|
|
|
669
|
|
518
|
|
1,187
|
|
174
|
|
1996
|
12/01
|
|
40
|
|||||||
|
N. Olmsted, OH
|
—
|
|
|
602
|
|
461
|
|
—
|
|
|
—
|
|
|
602
|
|
389
|
|
991
|
|
128
|
|
1996
|
12/01
|
|
40
|
|||||||
|
Novi, MI
|
—
|
|
|
836
|
|
651
|
|
—
|
|
|
—
|
|
|
836
|
|
298
|
|
1,134
|
|
101
|
|
1995
|
12/01
|
|
40
|
|||||||
|
|
|
|
|
|
|
|||||||||||||||||||||||||||
|
BP:
|
|
|
|
|
|
|||||||||||||||||||||||||||
|
Jeannette, PA
|
—
|
|
|
79
|
|
235
|
|
—
|
|
|
—
|
|
|
79
|
|
235
|
|
314
|
|
4
|
|
1995
|
07/14
|
|
25
|
|||||||
|
|
|
|
|
|
|
|||||||||||||||||||||||||||
|
Buck's:
|
|
|
|
|
|
|||||||||||||||||||||||||||
|
St. Louis, MO
|
—
|
|
|
776
|
|
—
|
|
3,822
|
|
|
—
|
|
|
776
|
|
3,822
|
|
4,598
|
|
545
|
|
2009
|
12/07
|
(m)
|
40
|
|||||||
|
Glendale Heights, IL
|
—
|
|
|
1,662
|
|
—
|
|
—
|
|
|
—
|
|
|
1,662
|
|
(e)
|
|
1,662
|
|
(e)
|
|
(e)
|
03/14
|
(m)
|
(e)
|
|||||||
|
|
|
|
|
|
|
|||||||||||||||||||||||||||
|
Buffalo Wild Wings:
|
|
|
|
|
|
|||||||||||||||||||||||||||
|
Michigan City, IN
|
—
|
|
|
163
|
|
492
|
|
—
|
|
|
—
|
|
|
163
|
|
492
|
|
655
|
|
160
|
|
1996
|
12/01
|
|
40
|
|||||||
|
|
|
|
|
|
|
|||||||||||||||||||||||||||
|
Bugaboo Creek:
|
|
|
|
|
|
|||||||||||||||||||||||||||
|
Rochester, NY
|
—
|
|
|
792
|
|
1,535
|
|
—
|
|
|
—
|
|
|
792
|
|
1,535
|
|
2,327
|
|
289
|
|
1995
|
06/07
|
|
40
|
|||||||
|
|
|
|
|
|
|
|||||||||||||||||||||||||||
|
Burger King:
|
|
|
|
|
|
|||||||||||||||||||||||||||
|
Colonial Heights, VA
|
—
|
|
|
662
|
|
610
|
|
—
|
|
|
—
|
|
|
662
|
|
610
|
|
1,272
|
|
199
|
|
1997
|
12/01
|
|
40
|
|||||||
|
|
|
|
|
|
|
|||||||||||||||||||||||||||
|
Burlington Coat Factory:
|
|
|
|
|
|
|||||||||||||||||||||||||||
|
Lacey, WA
|
—
|
|
|
2,777
|
|
7,082
|
|
3,388
|
|
|
—
|
|
|
2,777
|
|
10,471
|
|
13,248
|
|
3,165
|
|
1992
|
02/97
|
|
40
|
|||||||
|
|
|
|
|
|
|
|||||||||||||||||||||||||||
|
Buybacks Entertainment:
|
|
|
|
|
|
|||||||||||||||||||||||||||
|
Lafayette, LA
|
—
|
|
|
603
|
|
1,149
|
|
30
|
|
|
—
|
|
|
603
|
|
1,179
|
|
1,782
|
|
263
|
|
1999
|
12/05
|
|
40
|
|||||||
|
|
|
|
|
|
|
|||||||||||||||||||||||||||
|
C&C Gymnastics:
|
|
|
|
|
|
|||||||||||||||||||||||||||
|
Augusta, GA
|
—
|
|
|
177
|
|
674
|
|
—
|
|
|
—
|
|
|
177
|
|
674
|
|
851
|
|
220
|
|
1998
|
12/01
|
|
40
|
|||||||
|
|
|
|
|
|
|
|||||||||||||||||||||||||||
|
Caliber Collision:
|
|
|
|
|
|
|||||||||||||||||||||||||||
|
Alvin, TX
|
—
|
|
|
400
|
|
712
|
|
—
|
|
|
—
|
|
|
400
|
|
712
|
|
1,112
|
|
138
|
|
1984
|
02/11
|
|
20
|
|||||||
|
Galveston, TX
|
—
|
|
|
361
|
|
789
|
|
—
|
|
|
—
|
|
|
361
|
|
789
|
|
1,150
|
|
153
|
|
1965
|
02/11
|
|
20
|
|||||||
|
Houston, TX
|
—
|
|
|
348
|
|
1,731
|
|
—
|
|
|
—
|
|
|
348
|
|
1,731
|
|
2,079
|
|
268
|
|
1987
|
02/11
|
|
25
|
|||||||
|
Copperas Cove, TX
|
—
|
|
|
269
|
|
1,436
|
|
—
|
|
|
—
|
|
|
269
|
|
1,436
|
|
1,705
|
|
121
|
|
1972
|
01/12
|
|
35
|
|||||||
|
Killeen, TX
|
—
|
|
|
408
|
|
2,171
|
|
—
|
|
|
—
|
|
|
408
|
|
2,171
|
|
2,579
|
|
257
|
|
1986
|
01/12
|
|
25
|
|||||||
|
Austin, TX
|
—
|
|
|
1,071
|
|
3,412
|
|
—
|
|
|
—
|
|
|
1,071
|
|
3,412
|
|
4,483
|
|
392
|
|
1975
|
02/12
|
|
25
|
|||||||
|
Gilbert, AZ
|
—
|
|
|
474
|
|
1,543
|
|
—
|
|
|
—
|
|
|
474
|
|
1,543
|
|
2,017
|
|
135
|
|
2003
|
05/12
|
|
30
|
|||||||
|
Spring, TX
|
—
|
|
|
913
|
|
2,307
|
|
—
|
|
|
—
|
|
|
913
|
|
2,307
|
|
3,220
|
|
195
|
|
2006
|
06/12
|
|
30
|
|||||||
See accompanying report of independent registered public accounting firm.
F-8
|
Initial Cost to
Company
|
Costs Capitalized
Subsequent to
Acquisition
|
Gross Amount at Which
Carried at Close of Period (a) (b)
|
Life on Which
Depreciation &
Amortization in Latest Income
Statement is
Computed (Years)
|
|||||||||||||||||||||||||||||
|
Encumbrances
|
Land
|
Building,
Improvements &
Leasehold
Interests
|
Improvements
|
Carrying
Costs
|
Land
|
Building,
Improvements &
Leasehold
Interests
|
Total
|
Accumulated
Depreciation
and
Amortization
|
Date of
Construction
|
Date
Acquired
|
||||||||||||||||||||||
|
Real Estate Held for Investment the Company has Invested in Under Operating Leases:
|
||||||||||||||||||||||||||||||||
|
Tomball, TX
|
—
|
|
|
414
|
|
1,281
|
|
—
|
|
|
—
|
|
|
414
|
|
1,281
|
|
1,695
|
|
93
|
|
2009
|
06/12
|
|
35
|
|||||||
|
Edmond, OK
|
—
|
|
|
472
|
|
1,437
|
|
—
|
|
|
—
|
|
|
472
|
|
1,437
|
|
1,909
|
|
86
|
|
1964
|
03/13
|
|
30
|
|||||||
|
|
|
|
|
|
|
|||||||||||||||||||||||||||
|
Camping World:
|
|
|
|
|
|
|||||||||||||||||||||||||||
|
Vacaville, CA
|
—
|
|
|
2,467
|
|
6,575
|
|
—
|
|
|
—
|
|
|
2,467
|
|
6,575
|
|
9,042
|
|
838
|
|
2008
|
07/10
|
|
35
|
|||||||
|
North Little Rock, AR
|
—
|
|
|
1,198
|
|
3,348
|
|
2,237
|
|
|
—
|
|
|
1,280
|
|
5,513
|
|
6,793
|
|
465
|
|
2007
|
09/10
|
(o)
|
35
|
|||||||
|
Strafford, MO
|
—
|
|
|
1,278
|
|
3,694
|
|
1,614
|
|
|
—
|
|
|
1,846
|
|
5,308
|
|
7,154
|
|
453
|
|
2007
|
09/10
|
(o)
|
35
|
|||||||
|
Avondale, AZ
|
—
|
|
|
1,976
|
|
3,040
|
|
3,200
|
|
|
—
|
|
|
1,976
|
|
6,239
|
|
8,215
|
|
465
|
|
2009
|
05/11
|
(o)
|
35
|
|||||||
|
Mesa, AZ
|
—
|
|
|
3,972
|
|
2,046
|
|
981
|
|
|
—
|
|
|
3,975
|
|
3,027
|
|
7,002
|
|
340
|
|
1983
|
05/11
|
|
25
|
|||||||
|
Bowling Green, KY
|
—
|
|
|
584
|
|
2,481
|
|
—
|
|
|
—
|
|
|
584
|
|
2,481
|
|
3,065
|
|
245
|
|
2007
|
07/11
|
|
35
|
|||||||
|
Council Bluffs, IA
|
—
|
|
|
2,013
|
|
2,806
|
|
—
|
|
|
—
|
|
|
2,013
|
|
2,806
|
|
4,819
|
|
277
|
|
2008
|
07/11
|
|
35
|
|||||||
|
Roanoke, VA
|
—
|
|
|
2,046
|
|
5,050
|
|
—
|
|
|
—
|
|
|
2,046
|
|
5,050
|
|
7,096
|
|
499
|
|
2008
|
07/11
|
|
35
|
|||||||
|
Golden, CO
|
—
|
|
|
5,516
|
|
—
|
|
6,544
|
|
|
—
|
|
|
6,446
|
|
6,544
|
|
12,990
|
|
443
|
|
2012
|
10/11
|
(m)
|
40
|
|||||||
|
Belleville, MI
|
—
|
|
|
1,156
|
|
2,071
|
|
—
|
|
|
—
|
|
|
1,156
|
|
2,071
|
|
3,227
|
|
252
|
|
1986
|
12/11
|
|
25
|
|||||||
|
Kissimmee, FL
|
—
|
|
|
1,578
|
|
2,783
|
|
—
|
|
|
—
|
|
|
1,578
|
|
2,783
|
|
4,361
|
|
339
|
|
1979
|
12/11
|
|
25
|
|||||||
|
La Mirada, CA
|
—
|
|
|
3,593
|
|
911
|
|
—
|
|
|
—
|
|
|
3,577
|
|
907
|
|
4,484
|
|
92
|
|
1996
|
12/11
|
|
30
|
|||||||
|
Myrtle Beach, SC
|
—
|
|
|
540
|
|
61
|
|
—
|
|
|
—
|
|
|
540
|
|
61
|
|
601
|
|
7
|
|
1976
|
12/11
|
|
25
|
|||||||
|
Nashville, TN
|
—
|
|
|
1,155
|
|
1,034
|
|
5,665
|
|
|
—
|
|
|
3,626
|
|
4,235
|
|
7,861
|
|
309
|
|
1985
|
12/11
|
(o)
|
40
|
|||||||
|
Valencia, CA
|
—
|
|
|
4,788
|
|
4,191
|
|
—
|
|
|
—
|
|
|
4,766
|
|
4,179
|
|
8,945
|
|
508
|
|
1980
|
12/11
|
|
25
|
|||||||
|
Calera, AL
|
—
|
|
|
1,204
|
|
3,075
|
|
—
|
|
|
—
|
|
|
1,204
|
|
3,075
|
|
4,279
|
|
245
|
|
2008
|
03/12
|
|
35
|
|||||||
|
Jacksonville, FL
|
—
|
|
|
2,343
|
|
2,679
|
|
—
|
|
|
—
|
|
|
1,289
|
|
2,679
|
|
3,968
|
|
299
|
|
1973
|
03/12
|
|
25
|
|||||||
|
Louisville, TN
|
—
|
|
|
990
|
|
554
|
|
1,194
|
|
|
—
|
|
|
990
|
|
1,748
|
|
2,738
|
|
86
|
|
1977
|
03/12
|
(o)
|
40
|
|||||||
|
Winter Garden, FL
|
—
|
|
|
1,173
|
|
3,178
|
|
—
|
|
|
—
|
|
|
1,173
|
|
3,178
|
|
4,351
|
|
296
|
|
1973
|
03/12
|
|
30
|
|||||||
|
Cocoa, FL
|
—
|
|
|
1,194
|
|
1,876
|
|
—
|
|
|
—
|
|
|
1,194
|
|
1,876
|
|
3,070
|
|
154
|
|
1981
|
07/12
|
|
30
|
|||||||
|
Dover, FL
|
—
|
|
|
2,431
|
|
9,658
|
|
—
|
|
|
—
|
|
|
2,431
|
|
9,658
|
|
12,089
|
|
447
|
|
2007
|
01/13
|
|
35
|
|||||||
|
Grain Valley, MO
|
—
|
|
|
1,210
|
|
2,908
|
|
—
|
|
|
—
|
|
|
1,210
|
|
2,908
|
|
4,118
|
|
107
|
|
2003
|
09/13
|
(m)
|
35
|
|||||||
|
Lubbock, TX
|
—
|
|
|
775
|
|
3,998
|
|
—
|
|
|
—
|
|
|
775
|
|
3,998
|
|
4,773
|
|
172
|
|
1997
|
09/13
|
|
30
|
|||||||
|
Olive Branch, MS
|
—
|
|
|
3,163
|
|
—
|
|
3,907
|
|
|
—
|
|
|
3,163
|
|
3,907
|
|
7,070
|
|
(q)
|
|
2014
|
11/13
|
(m)
|
(q)
|
|||||||
|
Cedar Falls, IA
|
—
|
|
|
1,924
|
|
3,810
|
|
—
|
|
|
—
|
|
|
1,924
|
|
3,810
|
|
5,734
|
|
101
|
|
2004
|
03/14
|
(m)
|
30
|
|||||||
|
|
|
|
|
|
|
|||||||||||||||||||||||||||
|
Carl's Jr.:
|
|
|
|
|
|
|||||||||||||||||||||||||||
|
Spokane, WA
|
—
|
|
|
471
|
|
530
|
|
—
|
|
|
—
|
|
|
471
|
|
530
|
|
1,001
|
|
173
|
|
1996
|
12/01
|
|
40
|
|||||||
|
Chandler, AZ
|
—
|
|
|
729
|
|
644
|
|
—
|
|
|
—
|
|
|
729
|
|
644
|
|
1,373
|
|
307
|
|
1984
|
06/05
|
|
20
|
|||||||
|
Tucson, AZ
|
—
|
|
|
681
|
|
536
|
|
103
|
|
|
—
|
|
|
681
|
|
639
|
|
1,320
|
|
609
|
|
1988
|
06/05
|
|
10
|
|||||||
See accompanying report of independent registered public accounting firm.
F-9
|
Initial Cost to
Company
|
Costs Capitalized
Subsequent to
Acquisition
|
Gross Amount at Which
Carried at Close of Period (a) (b)
|
Life on Which
Depreciation &
Amortization in Latest Income
Statement is
Computed (Years)
|
|||||||||||||||||||||||||||||
|
Encumbrances
|
Land
|
Building,
Improvements &
Leasehold
Interests
|
Improvements
|
Carrying
Costs
|
Land
|
Building,
Improvements &
Leasehold
Interests
|
Total
|
Accumulated
Depreciation
and
Amortization
|
Date of
Construction
|
Date
Acquired
|
||||||||||||||||||||||
|
Real Estate Held for Investment the Company has Invested in Under Operating Leases:
|
||||||||||||||||||||||||||||||||
|
Carmike Cinemas:
|
|
|
|
|
|
|||||||||||||||||||||||||||
|
Fayetteville, NC
|
—
|
|
|
2,409
|
|
—
|
|
13,750
|
|
|
—
|
|
|
2,409
|
|
13,750
|
|
16,159
|
|
43
|
|
2014
|
11/13
|
|
40
|
|||||||
|
Montgomery, AL
|
—
|
|
|
1,686
|
|
11,156
|
|
—
|
|
|
—
|
|
|
1,686
|
|
11,156
|
|
12,842
|
|
81
|
|
2014
|
09/14
|
|
40
|
|||||||
|
Albuquerque, NM
|
—
|
|
|
1,474
|
|
—
|
|
—
|
|
|
—
|
|
|
1,474
|
|
(e)
|
|
1,474
|
|
(e)
|
|
(e)
|
11/14
|
(m)
|
(e)
|
|||||||
|
|
|
|
|
|
|
|||||||||||||||||||||||||||
|
CarQuest:
|
|
|
|
|
|
|||||||||||||||||||||||||||
|
Abbeville, LA
|
—
|
|
|
23
|
|
148
|
|
—
|
|
|
—
|
|
|
23
|
|
148
|
|
171
|
|
30
|
|
1970
|
12/10
|
|
20
|
|||||||
|
Abbotsford, WI
|
—
|
|
|
56
|
|
163
|
|
—
|
|
|
—
|
|
|
56
|
|
163
|
|
219
|
|
26
|
|
1984
|
12/10
|
|
25
|
|||||||
|
Aberdeen, SD (n)
|
—
|
|
|
71
|
|
329
|
|
—
|
|
|
—
|
|
|
71
|
|
329
|
|
400
|
|
66
|
|
1961
|
12/10
|
|
20
|
|||||||
|
Addison, IL
|
—
|
|
|
76
|
|
314
|
|
—
|
|
|
—
|
|
|
76
|
|
314
|
|
390
|
|
51
|
|
1971
|
12/10
|
|
25
|
|||||||
|
Alsip, IL
|
—
|
|
|
57
|
|
323
|
|
—
|
|
|
—
|
|
|
57
|
|
323
|
|
380
|
|
65
|
|
1972
|
12/10
|
|
20
|
|||||||
|
Anaconda, MT
|
—
|
|
|
35
|
|
307
|
|
—
|
|
|
—
|
|
|
35
|
|
307
|
|
342
|
|
62
|
|
1965
|
12/10
|
|
20
|
|||||||
|
Ann Arbor, MI
|
—
|
|
|
25
|
|
241
|
|
—
|
|
|
—
|
|
|
25
|
|
241
|
|
266
|
|
49
|
|
1970
|
12/10
|
|
20
|
|||||||
|
Antigo, WI
|
—
|
|
|
96
|
|
294
|
|
—
|
|
|
—
|
|
|
96
|
|
294
|
|
390
|
|
40
|
|
1998
|
12/10
|
|
30
|
|||||||
|
Appleton, WI (n)
|
—
|
|
|
85
|
|
438
|
|
—
|
|
|
—
|
|
|
85
|
|
438
|
|
523
|
|
59
|
|
1995
|
12/10
|
|
30
|
|||||||
|
Arden, NC
|
—
|
|
|
42
|
|
281
|
|
—
|
|
|
—
|
|
|
42
|
|
281
|
|
323
|
|
45
|
|
1989
|
12/10
|
|
25
|
|||||||
|
Baker, MT
|
—
|
|
|
12
|
|
140
|
|
—
|
|
|
—
|
|
|
12
|
|
140
|
|
152
|
|
28
|
|
1965
|
12/10
|
|
20
|
|||||||
|
Bakersfield, CA
|
—
|
|
|
77
|
|
484
|
|
—
|
|
|
—
|
|
|
77
|
|
484
|
|
561
|
|
98
|
|
1945
|
12/10
|
|
20
|
|||||||
|
Bangor, ME
|
—
|
|
|
51
|
|
339
|
|
—
|
|
|
—
|
|
|
51
|
|
339
|
|
390
|
|
55
|
|
1985
|
12/10
|
|
25
|
|||||||
|
Bangor, ME (n)
|
—
|
|
|
53
|
|
356
|
|
—
|
|
|
—
|
|
|
53
|
|
356
|
|
409
|
|
96
|
|
1945
|
12/10
|
|
15
|
|||||||
|
Bartlett, TN
|
—
|
|
|
40
|
|
293
|
|
—
|
|
|
—
|
|
|
40
|
|
293
|
|
333
|
|
47
|
|
1989
|
12/10
|
|
25
|
|||||||
|
Bay City, MI
|
—
|
|
|
41
|
|
282
|
|
—
|
|
|
—
|
|
|
41
|
|
282
|
|
323
|
|
46
|
|
1989
|
12/10
|
|
25
|
|||||||
|
Bay City, MI
|
—
|
|
|
106
|
|
521
|
|
—
|
|
|
—
|
|
|
106
|
|
521
|
|
627
|
|
140
|
|
1920
|
12/10
|
|
15
|
|||||||
|
Bay City, MI
|
—
|
|
|
14
|
|
100
|
|
—
|
|
|
—
|
|
|
14
|
|
100
|
|
114
|
|
27
|
|
1942
|
12/10
|
|
15
|
|||||||
|
Bellevue, NE
|
—
|
|
|
29
|
|
142
|
|
—
|
|
|
—
|
|
|
29
|
|
142
|
|
171
|
|
29
|
|
1965
|
12/10
|
|
20
|
|||||||
|
Bend, OR
|
—
|
|
|
125
|
|
245
|
|
—
|
|
|
—
|
|
|
125
|
|
245
|
|
370
|
|
66
|
|
1935
|
12/10
|
|
15
|
|||||||
|
Biddeford, ME
|
—
|
|
|
60
|
|
320
|
|
—
|
|
|
—
|
|
|
60
|
|
320
|
|
380
|
|
65
|
|
1968
|
12/10
|
|
20
|
|||||||
|
Billings, MT
|
—
|
|
|
31
|
|
188
|
|
—
|
|
|
—
|
|
|
31
|
|
188
|
|
219
|
|
30
|
|
1970
|
12/10
|
|
25
|
|||||||
|
Bismarck, ND
|
—
|
|
|
25
|
|
136
|
|
—
|
|
|
—
|
|
|
25
|
|
136
|
|
161
|
|
22
|
|
1985
|
12/10
|
|
25
|
|||||||
|
Bozeman, MT
|
—
|
|
|
28
|
|
257
|
|
—
|
|
|
—
|
|
|
28
|
|
257
|
|
285
|
|
52
|
|
1964
|
12/10
|
|
20
|
|||||||
|
Brunswick, ME
|
—
|
|
|
41
|
|
254
|
|
—
|
|
|
—
|
|
|
41
|
|
254
|
|
295
|
|
41
|
|
1985
|
12/10
|
|
25
|
|||||||
|
Bucksport, ME
|
—
|
|
|
19
|
|
114
|
|
—
|
|
|
—
|
|
|
19
|
|
114
|
|
133
|
|
23
|
|
1976
|
12/10
|
|
20
|
|||||||
|
Burlington, NC
|
—
|
|
|
47
|
|
229
|
|
—
|
|
|
—
|
|
|
47
|
|
229
|
|
276
|
|
31
|
|
1994
|
12/10
|
|
30
|
|||||||
|
Carol Stream, IL
|
—
|
|
|
103
|
|
515
|
|
—
|
|
|
—
|
|
|
103
|
|
515
|
|
618
|
|
104
|
|
1960
|
12/10
|
|
20
|
|||||||
See accompanying report of independent registered public accounting firm.
F-10
|
Initial Cost to
Company
|
Costs Capitalized
Subsequent to
Acquisition
|
Gross Amount at Which
Carried at Close of Period (a) (b)
|
Life on Which
Depreciation &
Amortization in Latest Income
Statement is
Computed (Years)
|
|||||||||||||||||||||||||||||
|
Encumbrances
|
Land
|
Building,
Improvements &
Leasehold
Interests
|
Improvements
|
Carrying
Costs
|
Land
|
Building,
Improvements &
Leasehold
Interests
|
Total
|
Accumulated
Depreciation
and
Amortization
|
Date of
Construction
|
Date
Acquired
|
||||||||||||||||||||||
|
Real Estate Held for Investment the Company has Invested in Under Operating Leases:
|
||||||||||||||||||||||||||||||||
|
Chicago, IL
|
—
|
|
|
83
|
|
383
|
|
—
|
|
|
—
|
|
|
83
|
|
383
|
|
466
|
|
62
|
|
1987
|
12/10
|
|
25
|
|||||||
|
Chippewa Falls, WI
|
—
|
|
|
33
|
|
328
|
|
—
|
|
|
—
|
|
|
33
|
|
328
|
|
361
|
|
44
|
|
1996
|
12/10
|
|
30
|
|||||||
|
Cody, WY (n)
|
—
|
|
|
146
|
|
253
|
|
—
|
|
|
—
|
|
|
96
|
|
253
|
|
349
|
|
34
|
|
1999
|
12/10
|
|
30
|
|||||||
|
Colstrip, MT
|
—
|
|
|
39
|
|
275
|
|
—
|
|
|
—
|
|
|
39
|
|
275
|
|
314
|
|
44
|
|
1981
|
12/10
|
|
25
|
|||||||
|
Connersville, IN
|
—
|
|
|
28
|
|
171
|
|
—
|
|
|
—
|
|
|
28
|
|
171
|
|
199
|
|
46
|
|
1920
|
12/10
|
|
15
|
|||||||
|
Corapolis, PA (n)
|
—
|
|
|
74
|
|
316
|
|
—
|
|
|
—
|
|
|
74
|
|
316
|
|
390
|
|
64
|
|
1980
|
12/10
|
|
20
|
|||||||
|
Cut Bank, MT
|
—
|
|
|
9
|
|
115
|
|
—
|
|
|
—
|
|
|
9
|
|
115
|
|
124
|
|
23
|
|
1937
|
12/10
|
|
20
|
|||||||
|
Devils Lake, ND
|
—
|
|
|
38
|
|
276
|
|
—
|
|
|
—
|
|
|
38
|
|
276
|
|
314
|
|
37
|
|
1999
|
12/10
|
|
30
|
|||||||
|
Dillon, MT
|
—
|
|
|
24
|
|
204
|
|
—
|
|
|
—
|
|
|
24
|
|
204
|
|
228
|
|
41
|
|
1973
|
12/10
|
|
20
|
|||||||
|
Dodge City, KS (n)
|
—
|
|
|
43
|
|
166
|
|
—
|
|
|
—
|
|
|
43
|
|
166
|
|
209
|
|
45
|
|
1948
|
12/10
|
|
15
|
|||||||
|
Eau Claire, WI
|
—
|
|
|
33
|
|
204
|
|
—
|
|
|
—
|
|
|
33
|
|
204
|
|
237
|
|
41
|
|
1956
|
12/10
|
|
20
|
|||||||
|
Elgin, IL
|
—
|
|
|
88
|
|
311
|
|
—
|
|
|
—
|
|
|
88
|
|
311
|
|
399
|
|
63
|
|
1965
|
12/10
|
|
20
|
|||||||
|
Enterprise, AL
|
—
|
|
|
25
|
|
184
|
|
—
|
|
|
—
|
|
|
25
|
|
184
|
|
209
|
|
30
|
|
1988
|
12/10
|
|
25
|
|||||||
|
Escanaba, MI
|
—
|
|
|
40
|
|
283
|
|
—
|
|
|
—
|
|
|
40
|
|
283
|
|
323
|
|
46
|
|
1982
|
12/10
|
|
25
|
|||||||
|
Evansville, IN
|
—
|
|
|
60
|
|
301
|
|
—
|
|
|
—
|
|
|
60
|
|
301
|
|
361
|
|
49
|
|
1980
|
12/10
|
|
25
|
|||||||
|
Fairbanks, AK
|
—
|
|
|
292
|
|
545
|
|
—
|
|
|
—
|
|
|
292
|
|
545
|
|
837
|
|
63
|
|
2003
|
12/10
|
|
35
|
|||||||
|
Gainesville, FL (n)
|
—
|
|
|
47
|
|
362
|
|
—
|
|
|
—
|
|
|
47
|
|
362
|
|
409
|
|
97
|
|
1957
|
12/10
|
|
15
|
|||||||
|
Glasgow, MT
|
—
|
|
|
48
|
|
275
|
|
—
|
|
|
—
|
|
|
48
|
|
275
|
|
323
|
|
56
|
|
1972
|
12/10
|
|
20
|
|||||||
|
Great Falls, MT
|
—
|
|
|
17
|
|
173
|
|
—
|
|
|
—
|
|
|
17
|
|
173
|
|
190
|
|
35
|
|
1967
|
12/10
|
|
20
|
|||||||
|
Greenville, OH
|
—
|
|
|
63
|
|
193
|
|
—
|
|
|
—
|
|
|
63
|
|
193
|
|
256
|
|
52
|
|
1910
|
12/10
|
|
15
|
|||||||
|
Hamilton, MT
|
—
|
|
|
24
|
|
242
|
|
—
|
|
|
—
|
|
|
24
|
|
242
|
|
266
|
|
39
|
|
1991
|
12/10
|
|
25
|
|||||||
|
Harlem, MT
|
—
|
|
|
17
|
|
116
|
|
—
|
|
|
—
|
|
|
17
|
|
116
|
|
133
|
|
19
|
|
1983
|
12/10
|
|
25
|
|||||||
|
Hayward, WI
|
—
|
|
|
57
|
|
333
|
|
—
|
|
|
—
|
|
|
57
|
|
333
|
|
390
|
|
54
|
|
1980
|
12/10
|
|
25
|
|||||||
|
Helena, MT
|
—
|
|
|
31
|
|
282
|
|
—
|
|
|
—
|
|
|
31
|
|
282
|
|
313
|
|
46
|
|
1987
|
12/10
|
|
25
|
|||||||
|
Houlton, ME
|
—
|
|
|
38
|
|
219
|
|
—
|
|
|
—
|
|
|
38
|
|
219
|
|
257
|
|
89
|
|
1915
|
12/10
|
|
10
|
|||||||
|
Irving, TX
|
—
|
|
|
182
|
|
208
|
|
—
|
|
|
—
|
|
|
182
|
|
208
|
|
390
|
|
42
|
|
1984
|
12/10
|
|
20
|
|||||||
|
Kalispell, MT (n)
|
—
|
|
|
59
|
|
645
|
|
—
|
|
|
—
|
|
|
59
|
|
645
|
|
704
|
|
87
|
|
1998
|
12/10
|
|
30
|
|||||||
|
Kennedale, TX
|
—
|
|
|
88
|
|
283
|
|
—
|
|
|
—
|
|
|
88
|
|
283
|
|
371
|
|
57
|
|
1959
|
12/10
|
|
20
|
|||||||
|
Lafayette, LA
|
—
|
|
|
51
|
|
357
|
|
—
|
|
|
—
|
|
|
51
|
|
357
|
|
408
|
|
48
|
|
1996
|
12/10
|
|
30
|
|||||||
|
Laurel, MS
|
—
|
|
|
74
|
|
202
|
|
—
|
|
|
—
|
|
|
74
|
|
202
|
|
276
|
|
54
|
|
1959
|
12/10
|
|
15
|
|||||||
|
Lewistown, MT
|
—
|
|
|
19
|
|
180
|
|
—
|
|
|
—
|
|
|
19
|
|
180
|
|
199
|
|
29
|
|
1964
|
12/10
|
|
25
|
|||||||
|
Livingston, MT
|
—
|
|
|
34
|
|
261
|
|
—
|
|
|
—
|
|
|
34
|
|
261
|
|
295
|
|
53
|
|
1976
|
12/10
|
|
20
|
|||||||
See accompanying report of independent registered public accounting firm.
F-11
|
Initial Cost to
Company
|
Costs Capitalized
Subsequent to
Acquisition
|
Gross Amount at Which
Carried at Close of Period (a) (b)
|
Life on Which
Depreciation &
Amortization in Latest Income
Statement is
Computed (Years)
|
|||||||||||||||||||||||||||||
|
Encumbrances
|
Land
|
Building,
Improvements &
Leasehold
Interests
|
Improvements
|
Carrying
Costs
|
Land
|
Building,
Improvements &
Leasehold
Interests
|
Total
|
Accumulated
Depreciation
and
Amortization
|
Date of
Construction
|
Date
Acquired
|
||||||||||||||||||||||
|
Real Estate Held for Investment the Company has Invested in Under Operating Leases:
|
||||||||||||||||||||||||||||||||
|
Lufkin, TX (n)
|
—
|
|
|
94
|
|
229
|
|
—
|
|
|
—
|
|
|
94
|
|
229
|
|
323
|
|
46
|
|
1986
|
12/10
|
|
20
|
|||||||
|
Madison, TN
|
—
|
|
|
78
|
|
179
|
|
—
|
|
|
—
|
|
|
78
|
|
179
|
|
257
|
|
29
|
|
1988
|
12/10
|
|
25
|
|||||||
|
Madison, WI
|
—
|
|
|
57
|
|
409
|
|
—
|
|
|
—
|
|
|
57
|
|
409
|
|
466
|
|
66
|
|
1973
|
12/10
|
|
25
|
|||||||
|
Malta, MT
|
—
|
|
|
19
|
|
181
|
|
—
|
|
|
—
|
|
|
19
|
|
181
|
|
200
|
|
29
|
|
1976
|
12/10
|
|
25
|
|||||||
|
Marshfield, WI
|
—
|
|
|
60
|
|
282
|
|
—
|
|
|
—
|
|
|
60
|
|
282
|
|
342
|
|
57
|
|
1940
|
12/10
|
|
20
|
|||||||
|
Medford, WI
|
—
|
|
|
37
|
|
229
|
|
—
|
|
|
—
|
|
|
37
|
|
229
|
|
266
|
|
37
|
|
1988
|
12/10
|
|
25
|
|||||||
|
Memphis, TN
|
—
|
|
|
38
|
|
199
|
|
—
|
|
|
—
|
|
|
38
|
|
199
|
|
237
|
|
32
|
|
1987
|
12/10
|
|
25
|
|||||||
|
Metamora, IL
|
—
|
|
|
69
|
|
292
|
|
—
|
|
|
—
|
|
|
69
|
|
292
|
|
361
|
|
39
|
|
1996
|
12/10
|
|
30
|
|||||||
|
Midland, MI
|
—
|
|
|
44
|
|
336
|
|
—
|
|
|
—
|
|
|
44
|
|
336
|
|
380
|
|
45
|
|
1986
|
12/10
|
|
30
|
|||||||
|
Midland, TX
|
—
|
|
|
36
|
|
212
|
|
—
|
|
|
—
|
|
|
36
|
|
212
|
|
248
|
|
57
|
|
1960
|
12/10
|
|
15
|
|||||||
|
Montello, WI
|
—
|
|
|
26
|
|
173
|
|
—
|
|
|
—
|
|
|
26
|
|
173
|
|
199
|
|
23
|
|
1997
|
12/10
|
|
30
|
|||||||
|
Muskegon, MI
|
—
|
|
|
38
|
|
257
|
|
—
|
|
|
—
|
|
|
38
|
|
257
|
|
295
|
|
35
|
|
1990
|
12/10
|
|
30
|
|||||||
|
Neillsville, WI
|
—
|
|
|
26
|
|
145
|
|
—
|
|
|
—
|
|
|
26
|
|
145
|
|
171
|
|
23
|
|
1979
|
12/10
|
|
25
|
|||||||
|
Nicholasville, KY
|
—
|
|
|
54
|
|
241
|
|
—
|
|
|
—
|
|
|
54
|
|
241
|
|
295
|
|
39
|
|
1988
|
12/10
|
|
25
|
|||||||
|
Ocala, FL
|
—
|
|
|
78
|
|
416
|
|
—
|
|
|
—
|
|
|
78
|
|
416
|
|
494
|
|
112
|
|
1971
|
12/10
|
|
15
|
|||||||
|
Olathe, KS
|
—
|
|
|
78
|
|
235
|
|
—
|
|
|
—
|
|
|
78
|
|
235
|
|
313
|
|
63
|
|
1950
|
12/10
|
|
15
|
|||||||
|
Oshkosh, WI
|
—
|
|
|
99
|
|
224
|
|
—
|
|
|
—
|
|
|
99
|
|
224
|
|
323
|
|
30
|
|
1999
|
12/10
|
|
30
|
|||||||
|
Overland, MO
|
—
|
|
|
68
|
|
370
|
|
—
|
|
|
—
|
|
|
68
|
|
370
|
|
438
|
|
75
|
|
1961
|
12/10
|
|
20
|
|||||||
|
Owosso, MI
|
—
|
|
|
50
|
|
264
|
|
—
|
|
|
—
|
|
|
50
|
|
264
|
|
314
|
|
43
|
|
1986
|
12/10
|
|
25
|
|||||||
|
Pearl, MS
|
—
|
|
|
43
|
|
195
|
|
—
|
|
|
—
|
|
|
43
|
|
195
|
|
238
|
|
26
|
|
1989
|
12/10
|
|
30
|
|||||||
|
Phillips, WI
|
—
|
|
|
23
|
|
177
|
|
—
|
|
|
—
|
|
|
23
|
|
177
|
|
200
|
|
24
|
|
1992
|
12/10
|
|
30
|
|||||||
|
Powell, WY
|
—
|
|
|
37
|
|
182
|
|
—
|
|
|
—
|
|
|
37
|
|
182
|
|
219
|
|
29
|
|
1978
|
12/10
|
|
25
|
|||||||
|
Rhinelander, WI
|
—
|
|
|
28
|
|
115
|
|
—
|
|
|
—
|
|
|
28
|
|
115
|
|
143
|
|
23
|
|
1958
|
12/10
|
|
20
|
|||||||
|
River Falls, WI
|
—
|
|
|
42
|
|
234
|
|
—
|
|
|
—
|
|
|
42
|
|
234
|
|
276
|
|
47
|
|
1976
|
12/10
|
|
20
|
|||||||
|
Riverton, WY
|
—
|
|
|
99
|
|
300
|
|
—
|
|
|
—
|
|
|
99
|
|
300
|
|
399
|
|
49
|
|
1978
|
12/10
|
|
25
|
|||||||
|
Rockford, IL
|
—
|
|
|
61
|
|
376
|
|
—
|
|
|
—
|
|
|
61
|
|
376
|
|
437
|
|
61
|
|
1962
|
12/10
|
|
25
|
|||||||
|
Roundup, MT
|
—
|
|
|
23
|
|
205
|
|
—
|
|
|
—
|
|
|
23
|
|
205
|
|
228
|
|
41
|
|
1972
|
12/10
|
|
20
|
|||||||
|
Schofield, WI
|
—
|
|
|
41
|
|
425
|
|
—
|
|
|
—
|
|
|
41
|
|
425
|
|
466
|
|
86
|
|
1968
|
12/10
|
|
20
|
|||||||
|
Sheboygan, WI
|
—
|
|
|
77
|
|
370
|
|
—
|
|
|
—
|
|
|
77
|
|
370
|
|
447
|
|
43
|
|
2007
|
12/10
|
|
35
|
|||||||
|
Shelby, MT
|
—
|
|
|
20
|
|
208
|
|
—
|
|
|
—
|
|
|
20
|
|
208
|
|
228
|
|
42
|
|
1976
|
12/10
|
|
20
|
|||||||
|
Shelbyville, KY
|
—
|
|
|
52
|
|
224
|
|
—
|
|
|
—
|
|
|
52
|
|
224
|
|
276
|
|
36
|
|
1982
|
12/10
|
|
25
|
|||||||
|
Sidney, MT (n)
|
—
|
|
|
42
|
|
395
|
|
—
|
|
|
—
|
|
|
42
|
|
395
|
|
437
|
|
80
|
|
1962
|
12/10
|
|
20
|
|||||||
|
Spartanburg, SC
|
—
|
|
|
53
|
|
252
|
|
—
|
|
|
—
|
|
|
53
|
|
252
|
|
305
|
|
41
|
|
1972
|
12/10
|
|
25
|
|||||||
|
Spokane, WA
|
—
|
|
|
66
|
|
201
|
|
—
|
|
|
—
|
|
|
66
|
|
201
|
|
267
|
|
41
|
|
1965
|
12/10
|
|
20
|
|||||||
|
Spokane, WA
|
—
|
|
|
93
|
|
373
|
|
—
|
|
|
—
|
|
|
93
|
|
373
|
|
466
|
|
75
|
|
1972
|
12/10
|
|
20
|
|||||||
|
St. Peter, MN
|
—
|
|
|
17
|
|
259
|
|
—
|
|
|
—
|
|
|
17
|
|
259
|
|
276
|
|
35
|
|
1999
|
12/10
|
|
30
|
|||||||
|
Stayton, OR
|
—
|
|
|
88
|
|
312
|
|
—
|
|
|
—
|
|
|
88
|
|
312
|
|
400
|
|
42
|
|
1994
|
12/10
|
|
30
|
|||||||
|
Stevens Point, WI (n)
|
—
|
|
|
61
|
|
405
|
|
—
|
|
|
—
|
|
|
61
|
|
405
|
|
466
|
|
65
|
|
1975
|
12/10
|
|
25
|
|||||||
|
Sulphur, LA
|
—
|
|
|
31
|
|
216
|
|
—
|
|
|
—
|
|
|
31
|
|
216
|
|
247
|
|
44
|
|
1984
|
12/10
|
|
20
|
|||||||
|
Thornton, CO
|
—
|
|
|
414
|
|
536
|
|
—
|
|
|
—
|
|
|
414
|
|
536
|
|
950
|
|
72
|
|
1996
|
12/10
|
|
30
|
|||||||
|
Troy, AL
|
—
|
|
|
15
|
|
52
|
|
—
|
|
|
—
|
|
|
15
|
|
52
|
|
67
|
|
14
|
|
1966
|
12/10
|
|
15
|
|||||||
|
Wasilla, AK
|
—
|
|
|
227
|
|
504
|
|
—
|
|
|
—
|
|
|
227
|
|
504
|
|
731
|
|
58
|
|
2002
|
12/10
|
|
35
|
|||||||
|
Wausau, WI
|
—
|
|
|
52
|
|
300
|
|
—
|
|
|
—
|
|
|
52
|
|
300
|
|
352
|
|
48
|
|
1989
|
12/10
|
|
25
|
|||||||
|
Wautoma, WI
|
—
|
|
|
18
|
|
106
|
|
—
|
|
|
—
|
|
|
18
|
|
106
|
|
124
|
|
21
|
|
1959
|
12/10
|
|
20
|
|||||||
|
Waynesboro, MS
|
—
|
|
|
15
|
|
71
|
|
—
|
|
|
—
|
|
|
15
|
|
71
|
|
86
|
|
19
|
|
1962
|
12/10
|
|
15
|
|||||||
|
West Columbia, SC
|
—
|
|
|
41
|
|
159
|
|
—
|
|
|
—
|
|
|
41
|
|
159
|
|
200
|
|
32
|
|
1962
|
12/10
|
|
20
|
|||||||
|
West Memphis, AR
|
—
|
|
|
58
|
|
294
|
|
—
|
|
|
—
|
|
|
58
|
|
294
|
|
352
|
|
48
|
|
1987
|
12/10
|
|
25
|
|||||||
|
Whitefish, MT
|
—
|
|
|
30
|
|
227
|
|
—
|
|
|
—
|
|
|
30
|
|
227
|
|
257
|
|
31
|
|
1993
|
12/10
|
|
30
|
|||||||
|
Williston, ND
|
—
|
|
|
35
|
|
297
|
|
—
|
|
|
—
|
|
|
35
|
|
297
|
|
332
|
|
40
|
|
1999
|
12/10
|
|
30
|
|||||||
|
Windom, MN
|
—
|
|
|
5
|
|
137
|
|
—
|
|
|
—
|
|
|
5
|
|
137
|
|
142
|
|
28
|
|
1950
|
12/10
|
|
20
|
|||||||
|
Wisconsin Rapids, WI
|
—
|
|
|
41
|
|
215
|
|
—
|
|
|
—
|
|
|
41
|
|
215
|
|
256
|
|
43
|
|
1975
|
12/10
|
|
20
|
|||||||
|
Yakima, WA
|
—
|
|
|
50
|
|
321
|
|
—
|
|
|
—
|
|
|
50
|
|
321
|
|
371
|
|
65
|
|
1965
|
12/10
|
|
20
|
|||||||
|
Aurora, IL
|
—
|
|
|
641
|
|
226
|
|
—
|
|
|
—
|
|
|
641
|
|
226
|
|
867
|
|
44
|
|
1971
|
02/11
|
|
20
|
|||||||
|
Benton Harbor, MI
|
—
|
|
|
207
|
|
160
|
|
—
|
|
|
—
|
|
|
207
|
|
160
|
|
367
|
|
31
|
|
1978
|
02/11
|
|
20
|
|||||||
|
Caro, MI
|
—
|
|
|
85
|
|
132
|
|
—
|
|
|
—
|
|
|
85
|
|
132
|
|
217
|
|
51
|
|
1941
|
02/11
|
|
10
|
|||||||
|
Eagle River, WI
|
—
|
|
|
99
|
|
52
|
|
—
|
|
|
—
|
|
|
99
|
|
52
|
|
151
|
|
10
|
|
1978
|
02/11
|
|
20
|
|||||||
|
Essexville, MI
|
—
|
|
|
113
|
|
113
|
|
—
|
|
|
—
|
|
|
113
|
|
113
|
|
226
|
|
22
|
|
1974
|
02/11
|
|
20
|
|||||||
|
Lexington, KY
|
—
|
|
|
85
|
|
226
|
|
—
|
|
|
—
|
|
|
85
|
|
226
|
|
311
|
|
29
|
|
1991
|
02/11
|
|
30
|
|||||||
|
Mt. Pleasant, MI
|
—
|
|
|
85
|
|
207
|
|
—
|
|
|
—
|
|
|
85
|
|
207
|
|
292
|
|
32
|
|
1984
|
02/11
|
|
25
|
|||||||
|
Portland, ME
|
—
|
|
|
123
|
|
264
|
|
—
|
|
|
—
|
|
|
123
|
|
264
|
|
387
|
|
68
|
|
1951
|
02/11
|
|
15
|
|||||||
|
Saginaw, MI
|
—
|
|
|
179
|
|
75
|
|
—
|
|
|
—
|
|
|
179
|
|
75
|
|
254
|
|
29
|
|
1955
|
02/11
|
|
10
|
|||||||
|
Warrenton, VA
|
—
|
|
|
123
|
|
66
|
|
—
|
|
|
—
|
|
|
123
|
|
66
|
|
189
|
|
26
|
|
1939
|
02/11
|
|
10
|
|||||||
|
Billings, MT
|
—
|
|
|
66
|
|
291
|
|
—
|
|
|
—
|
|
|
66
|
|
291
|
|
357
|
|
40
|
|
1994
|
07/11
|
|
25
|
|||||||
|
Mobile, AL
|
—
|
|
|
75
|
|
197
|
|
—
|
|
|
—
|
|
|
75
|
|
197
|
|
272
|
|
34
|
|
1975
|
07/11
|
|
20
|
|||||||
|
New Castle, IN
|
—
|
|
|
113
|
|
19
|
|
—
|
|
|
—
|
|
|
113
|
|
19
|
|
132
|
|
3
|
|
1991
|
07/11
|
|
25
|
|||||||
|
Spokane, WA
|
—
|
|
|
75
|
|
56
|
|
—
|
|
|
—
|
|
|
75
|
|
56
|
|
131
|
|
10
|
|
1955
|
07/11
|
|
20
|
|||||||
|
Chicago, IL
|
—
|
|
|
90
|
|
239
|
|
—
|
|
|
—
|
|
|
90
|
|
239
|
|
329
|
|
50
|
|
1949
|
11/11
|
|
15
|
|||||||
|
Missoula, MT
|
—
|
|
|
99
|
|
367
|
|
—
|
|
|
—
|
|
|
99
|
|
367
|
|
466
|
|
57
|
|
1965
|
11/11
|
|
20
|
|||||||
|
Sheridan, WY
|
—
|
|
|
198
|
|
385
|
|
—
|
|
|
—
|
|
|
198
|
|
385
|
|
583
|
|
60
|
|
1980
|
11/11
|
|
20
|
|||||||
|
Sauk Centre, MN
|
—
|
|
|
64
|
|
85
|
|
—
|
|
|
—
|
|
|
64
|
|
85
|
|
149
|
|
11
|
|
1958
|
11/11
|
|
25
|
|||||||
|
Watford City, ND
|
—
|
|
|
31
|
|
124
|
|
—
|
|
|
—
|
|
|
31
|
|
124
|
|
155
|
|
15
|
|
1974
|
11/11
|
|
25
|
|||||||
|
Fairmont, MN
|
—
|
|
|
98
|
|
166
|
|
—
|
|
|
—
|
|
|
98
|
|
166
|
|
264
|
|
25
|
|
1978
|
01/12
|
|
20
|
|||||||
|
Sycamore, IL
|
—
|
|
|
49
|
|
476
|
|
—
|
|
|
—
|
|
|
49
|
|
476
|
|
525
|
|
70
|
|
1924
|
01/12
|
|
20
|
|||||||
|
Worland, WY
|
—
|
|
|
48
|
|
193
|
|
—
|
|
|
—
|
|
|
48
|
|
193
|
|
241
|
|
26
|
|
1949
|
04/12
|
|
20
|
|||||||
|
Anchorage, AK
|
—
|
|
|
315
|
|
92
|
|
—
|
|
|
—
|
|
|
315
|
|
92
|
|
407
|
|
12
|
|
1971
|
06/12
|
|
20
|
|||||||
|
Havre, MT
|
—
|
|
|
29
|
|
305
|
|
—
|
|
|
—
|
|
|
29
|
|
305
|
|
334
|
|
39
|
|
1964
|
06/12
|
|
20
|
|||||||
|
Orchard Park, NY
|
—
|
|
|
353
|
|
—
|
|
725
|
|
|
—
|
|
|
267
|
|
725
|
|
992
|
|
22
|
|
2013
|
05/13
|
(m)
|
40
|
|||||||
|
Morrisville, NC
|
—
|
|
|
127
|
|
332
|
|
—
|
|
|
—
|
|
|
127
|
|
332
|
|
459
|
|
22
|
|
1992
|
05/13
|
|
25
|
|||||||
|
Salt Lake City, UT
|
—
|
|
|
571
|
|
697
|
|
—
|
|
|
—
|
|
|
571
|
|
697
|
|
1,268
|
|
57
|
|
1951
|
05/13
|
|
20
|
|||||||
|
San Antonio, TX
|
—
|
|
|
137
|
|
361
|
|
—
|
|
|
—
|
|
|
137
|
|
361
|
|
498
|
|
29
|
|
1980
|
05/13
|
|
20
|
|||||||
|
San Antonio, TX
|
—
|
|
|
87
|
|
719
|
|
—
|
|
|
—
|
|
|
87
|
|
719
|
|
806
|
|
47
|
|
1973
|
05/13
|
|
25
|
|||||||
|
Jackson, MS
|
—
|
|
|
253
|
|
—
|
|
595
|
|
|
—
|
|
|
253
|
|
595
|
|
848
|
|
(q)
|
|
2013
|
06/13
|
(m)
|
(q)
|
|||||||
|
Crestview, FL
|
—
|
|
|
158
|
|
463
|
|
—
|
|
|
—
|
|
|
158
|
|
463
|
|
621
|
|
20
|
|
2003
|
09/13
|
|
30
|
|||||||
|
Depew, NY
|
—
|
|
|
309
|
|
—
|
|
846
|
|
|
—
|
|
|
309
|
|
846
|
|
1,155
|
|
(q)
|
|
2014
|
10/13
|
(m)
|
(q)
|
|||||||
|
Sherman, TX
|
—
|
|
|
183
|
|
—
|
|
657
|
|
|
—
|
|
|
183
|
|
657
|
|
840
|
|
12
|
|
2005
|
01/14
|
(m)
|
35
|
|||||||
|
|
|
|
|
|
|
|||||||||||||||||||||||||||
|
Carrabba's:
|
|
|
|
|
|
|||||||||||||||||||||||||||
|
Canton, MI
|
—
|
|
|
685
|
|
1,687
|
|
—
|
|
|
—
|
|
|
685
|
|
1,687
|
|
2,372
|
|
157
|
|
2002
|
03/12
|
|
30
|
|||||||
|
Cape Coral, FL
|
—
|
|
|
645
|
|
2,965
|
|
—
|
|
|
—
|
|
|
645
|
|
2,965
|
|
3,610
|
|
237
|
|
2005
|
03/12
|
|
35
|
|||||||
|
Dallas, TX
|
—
|
|
|
672
|
|
1,078
|
|
—
|
|
|
—
|
|
|
672
|
|
1,078
|
|
1,750
|
|
100
|
|
2000
|
03/12
|
|
30
|
|||||||
|
Gainesville, FL
|
—
|
|
|
922
|
|
1,944
|
|
—
|
|
|
—
|
|
|
922
|
|
1,944
|
|
2,866
|
|
181
|
|
2001
|
03/12
|
|
30
|
|||||||
|
Jacksonville, FL
|
—
|
|
|
1,140
|
|
1,428
|
|
—
|
|
|
—
|
|
|
1,140
|
|
1,428
|
|
2,568
|
|
133
|
|
2001
|
03/12
|
|
30
|
|||||||
|
Mason, OH
|
—
|
|
|
653
|
|
2,267
|
|
—
|
|
|
—
|
|
|
653
|
|
2,267
|
|
2,920
|
|
211
|
|
2000
|
03/12
|
|
30
|
|||||||
|
Maumee, OH
|
—
|
|
|
525
|
|
2,684
|
|
—
|
|
|
—
|
|
|
525
|
|
2,684
|
|
3,209
|
|
250
|
|
2002
|
03/12
|
|
30
|
|||||||
|
Mobile, AL
|
—
|
|
|
633
|
|
1,909
|
|
—
|
|
|
—
|
|
|
633
|
|
1,909
|
|
2,542
|
|
178
|
|
2001
|
03/12
|
|
30
|
|||||||
|
Pensacola, FL
|
—
|
|
|
734
|
|
1,854
|
|
—
|
|
|
—
|
|
|
734
|
|
1,854
|
|
2,588
|
|
148
|
|
2003
|
03/12
|
|
35
|
|||||||
|
Waldorf, MD
|
—
|
|
|
1,473
|
|
2,199
|
|
—
|
|
|
—
|
|
|
1,473
|
|
2,199
|
|
3,672
|
|
175
|
|
2007
|
03/12
|
|
35
|
|||||||
|
|
|
|
|
|
|
|||||||||||||||||||||||||||
|
Carvers:
|
|
|
|
|
|
|||||||||||||||||||||||||||
|
Centerville, OH
|
—
|
|
|
851
|
|
1,059
|
|
—
|
|
|
—
|
|
|
851
|
|
1,059
|
|
1,910
|
|
345
|
|
1986
|
12/01
|
|
40
|
|||||||
|
|
|
|
|
|
|
|||||||||||||||||||||||||||
See accompanying report of independent registered public accounting firm.
F-12
|
Initial Cost to
Company
|
Costs Capitalized
Subsequent to
Acquisition
|
Gross Amount at Which
Carried at Close of Period (a) (b)
|
Life on Which
Depreciation &
Amortization in Latest Income
Statement is
Computed (Years)
|
|||||||||||||||||||||||||||||
|
Encumbrances
|
Land
|
Building,
Improvements &
Leasehold
Interests
|
Improvements
|
Carrying
Costs
|
Land
|
Building,
Improvements &
Leasehold
Interests
|
Total
|
Accumulated
Depreciation
and
Amortization
|
Date of
Construction
|
Date
Acquired
|
||||||||||||||||||||||
|
Real Estate Held for Investment the Company has Invested in Under Operating Leases:
|
||||||||||||||||||||||||||||||||
|
Certified Auto Sales:
|
|
|
|
|
|
|||||||||||||||||||||||||||
|
Albuquerque, NM
|
—
|
|
|
1,113
|
|
—
|
|
1,443
|
|
|
—
|
|
|
1,113
|
|
1,443
|
|
2,556
|
|
338
|
|
2005
|
04/04
|
(f)
|
40
|
|||||||
|
Chair King:
|
|
|
|
|
|
|||||||||||||||||||||||||||
|
Grapevine, TX
|
—
|
|
|
1,018
|
|
2,067
|
|
273
|
|
|
—
|
|
|
1,018
|
|
2,340
|
|
3,358
|
|
873
|
|
1998
|
06/98
|
|
40
|
|||||||
|
|
|
|
|
|
|
|||||||||||||||||||||||||||
|
Champps:
|
|
|
|
|
|
|||||||||||||||||||||||||||
|
Irving, TX
|
—
|
|
|
1,760
|
|
1,724
|
|
—
|
|
|
—
|
|
|
1,760
|
|
1,724
|
|
3,484
|
|
562
|
|
2000
|
12/01
|
|
40
|
|||||||
|
|
|
|
|
|
|
|||||||||||||||||||||||||||
|
Cheddar's Cafe:
|
|
|
|
|
|
|||||||||||||||||||||||||||
|
Baytown, TX
|
—
|
|
|
858
|
|
2,251
|
|
—
|
|
|
—
|
|
|
858
|
|
2,251
|
|
3,109
|
|
227
|
|
2010
|
12/10
|
|
40
|
|||||||
|
West Monroe, LA
|
—
|
|
|
907
|
|
2,301
|
|
—
|
|
|
—
|
|
|
907
|
|
2,301
|
|
3,208
|
|
228
|
|
2010
|
01/11
|
|
40
|
|||||||
|
Selma, TX
|
—
|
|
|
1,446
|
|
—
|
|
2,439
|
|
|
—
|
|
|
1,446
|
|
2,439
|
|
3,885
|
|
201
|
|
2011
|
03/11
|
(m)
|
40
|
|||||||
|
Jonesboro, AR
|
—
|
|
|
1,206
|
|
—
|
|
2,459
|
|
|
—
|
|
|
1,206
|
|
2,459
|
|
3,665
|
|
192
|
|
2011
|
05/11
|
(m)
|
40
|
|||||||
|
Hattiesburg, MS
|
—
|
|
|
1,203
|
|
—
|
|
—
|
|
|
—
|
|
|
1,196
|
|
(i)
|
|
1,196
|
|
(i)
|
|
(i)
|
11/11
|
(m)
|
(i)
|
|||||||
|
Pleasant Prairie, WI
|
—
|
|
|
1,310
|
|
—
|
|
2,779
|
|
|
—
|
|
|
1,310
|
|
2,779
|
|
4,089
|
|
84
|
|
2013
|
04/13
|
(m)
|
40
|
|||||||
|
Liberty, MO
|
—
|
|
|
1,313
|
|
—
|
|
3,140
|
|
|
—
|
|
|
1,313
|
|
3,140
|
|
4,453
|
|
75
|
|
2014
|
07/13
|
(m)
|
40
|
|||||||
|
|
|
|
|
|
|
|||||||||||||||||||||||||||
|
Chick-Fil-A:
|
|
|
|
|
|
|||||||||||||||||||||||||||
|
Ankeny, IA
|
—
|
|
|
662
|
|
—
|
|
—
|
|
|
—
|
|
|
662
|
|
(i)
|
|
662
|
|
(i)
|
|
(i)
|
06/05
|
|
(i)
|
|||||||
|
|
|
|
|
|
|
|||||||||||||||||||||||||||
|
Chili's:
|
|
|
|
|
|
|||||||||||||||||||||||||||
|
Camden, SC
|
—
|
|
|
627
|
|
1,888
|
|
—
|
|
|
—
|
|
|
627
|
|
1,888
|
|
2,515
|
|
439
|
|
2005
|
09/05
|
|
40
|
|||||||
|
Milledgeville, GA
|
—
|
|
|
516
|
|
1,997
|
|
—
|
|
|
—
|
|
|
516
|
|
1,997
|
|
2,513
|
|
464
|
|
2005
|
09/05
|
|
40
|
|||||||
|
Sumter, SC
|
—
|
|
|
800
|
|
1,717
|
|
—
|
|
|
—
|
|
|
800
|
|
1,717
|
|
2,517
|
|
388
|
|
2004
|
12/05
|
|
40
|
|||||||
|
Hinesville, GA
|
—
|
|
|
921
|
|
1,898
|
|
—
|
|
|
—
|
|
|
921
|
|
1,898
|
|
2,819
|
|
374
|
|
2006
|
02/07
|
|
40
|
|||||||
|
Albany, GA
|
—
|
|
|
615
|
|
—
|
|
1,984
|
|
|
—
|
|
|
615
|
|
1,984
|
|
2,599
|
|
358
|
|
2007
|
06/07
|
(m)
|
40
|
|||||||
|
Statesboro, GA
|
—
|
|
|
703
|
|
—
|
|
1,888
|
|
|
—
|
|
|
703
|
|
1,888
|
|
2,591
|
|
336
|
|
2007
|
06/07
|
(m)
|
40
|
|||||||
|
Florence, SC
|
—
|
|
|
889
|
|
1,715
|
|
—
|
|
|
—
|
|
|
889
|
|
1,715
|
|
2,604
|
|
323
|
|
2007
|
06/07
|
|
40
|
|||||||
|
Valdosta, GA
|
—
|
|
|
716
|
|
—
|
|
1,871
|
|
|
—
|
|
|
716
|
|
1,871
|
|
2,587
|
|
329
|
|
2007
|
07/07
|
(m)
|
40
|
|||||||
|
Tifton, GA
|
—
|
|
|
454
|
|
1,550
|
|
—
|
|
|
—
|
|
|
454
|
|
1,550
|
|
2,004
|
|
241
|
|
2008
|
06/08
|
|
40
|
|||||||
|
Evans, GA
|
—
|
|
|
700
|
|
—
|
|
1,511
|
|
|
—
|
|
|
685
|
|
1,511
|
|
2,196
|
|
222
|
|
2009
|
10/08
|
(m)
|
40
|
|||||||
|
Jefferson City, MO
|
—
|
|
|
305
|
|
898
|
|
—
|
|
|
—
|
|
|
305
|
|
898
|
|
1,203
|
|
129
|
|
2003
|
12/09
|
|
35
|
|||||||
|
Merriam, KS
|
—
|
|
|
853
|
|
981
|
|
—
|
|
|
—
|
|
|
853
|
|
981
|
|
1,834
|
|
165
|
|
1998
|
12/09
|
|
30
|
|||||||
See accompanying report of independent registered public accounting firm.
F-13
|
Initial Cost to
Company
|
Costs Capitalized
Subsequent to
Acquisition
|
Gross Amount at Which
Carried at Close of Period (a) (b)
|
Life on Which
Depreciation &
Amortization in Latest Income
Statement is
Computed (Years)
|
|||||||||||||||||||||||||||||
|
Encumbrances
|
Land
|
Building,
Improvements &
Leasehold
Interests
|
Improvements
|
Carrying
Costs
|
Land
|
Building,
Improvements &
Leasehold
Interests
|
Total
|
Accumulated
Depreciation
and
Amortization
|
Date of
Construction
|
Date
Acquired
|
||||||||||||||||||||||
|
Real Estate Held for Investment the Company has Invested in Under Operating Leases:
|
||||||||||||||||||||||||||||||||
|
Wichita, KS
|
—
|
|
|
420
|
|
623
|
|
—
|
|
|
—
|
|
|
420
|
|
623
|
|
1,043
|
|
105
|
|
1995
|
12/09
|
|
30
|
|||||||
|
Hutchinson, KS
|
—
|
|
|
456
|
|
1,794
|
|
—
|
|
|
—
|
|
|
456
|
|
1,794
|
|
2,250
|
|
112
|
|
2004
|
02/13
|
|
30
|
|||||||
|
Lexington, SC
|
—
|
|
|
630
|
|
1,620
|
|
—
|
|
|
—
|
|
|
630
|
|
1,620
|
|
2,250
|
|
87
|
|
2008
|
02/13
|
|
35
|
|||||||
|
China 1:
|
|
|
|
|
|
|||||||||||||||||||||||||||
|
Cohoes, NY
|
—
|
|
|
16
|
|
87
|
|
6
|
|
|
—
|
|
|
16
|
|
93
|
|
109
|
|
25
|
|
1994
|
09/04
|
|
40
|
|||||||
|
|
|
|
|
|
|
|||||||||||||||||||||||||||
|
China Wok:
|
|
|
|
|
|
|||||||||||||||||||||||||||
|
Carlisle, PA
|
—
|
|
|
90
|
|
107
|
|
—
|
|
|
—
|
|
|
90
|
|
107
|
|
197
|
|
22
|
|
1988
|
01/06
|
|
40
|
|||||||
|
|
|
|
|
|
|
|||||||||||||||||||||||||||
|
Chipotle:
|
|
|
|
|
|
|||||||||||||||||||||||||||
|
Florissant, MO
|
—
|
|
|
50
|
|
59
|
|
170
|
|
|
—
|
|
|
50
|
|
228
|
|
278
|
|
28
|
|
2013
|
04/03
|
(g)
|
40
|
|||||||
|
|
|
|
|
|
|
|||||||||||||||||||||||||||
|
Chuck E. Cheese's:
|
|
|
|
|
|
|||||||||||||||||||||||||||
|
Mobile, AL
|
—
|
|
|
340
|
|
951
|
|
—
|
|
|
—
|
|
|
340
|
|
951
|
|
1,291
|
|
149
|
|
1981
|
11/11
|
|
20
|
|||||||
|
Antioch, TN
|
—
|
|
|
459
|
|
1,738
|
|
—
|
|
|
—
|
|
|
459
|
|
1,738
|
|
2,197
|
|
53
|
|
1982
|
07/14
|
|
15
|
|||||||
|
Huntsville, AL
|
—
|
|
|
382
|
|
1,182
|
|
—
|
|
|
—
|
|
|
382
|
|
1,182
|
|
1,564
|
|
27
|
|
1960
|
07/14
|
|
20
|
|||||||
|
Saginaw, MI
|
—
|
|
|
489
|
|
1,203
|
|
—
|
|
|
—
|
|
|
489
|
|
1,203
|
|
1,692
|
|
28
|
|
1981
|
07/14
|
|
20
|
|||||||
|
Albuquerque, NM
|
—
|
|
|
794
|
|
2,126
|
|
—
|
|
|
—
|
|
|
794
|
|
2,126
|
|
2,920
|
|
23
|
|
2003
|
08/14
|
|
35
|
|||||||
|
Alexandria, LA
|
—
|
|
|
872
|
|
3,291
|
|
—
|
|
|
—
|
|
|
872
|
|
3,291
|
|
4,163
|
|
49
|
|
1983
|
08/14
|
|
25
|
|||||||
|
Alpharetta, GA
|
—
|
|
|
2,027
|
|
1,743
|
|
—
|
|
|
—
|
|
|
2,027
|
|
1,743
|
|
3,770
|
|
22
|
|
2001
|
08/14
|
|
30
|
|||||||
|
Atlanta, GA
|
—
|
|
|
1,313
|
|
1,656
|
|
—
|
|
|
—
|
|
|
1,313
|
|
1,656
|
|
2,969
|
|
25
|
|
1982
|
08/14
|
|
25
|
|||||||
|
Austin, TX
|
—
|
|
|
852
|
|
4,024
|
|
—
|
|
|
—
|
|
|
852
|
|
4,024
|
|
4,876
|
|
50
|
|
2001
|
08/14
|
|
30
|
|||||||
|
Batavia, IL
|
—
|
|
|
1,214
|
|
2,664
|
|
—
|
|
|
—
|
|
|
1,214
|
|
2,664
|
|
3,878
|
|
33
|
|
1999
|
08/14
|
|
30
|
|||||||
|
Birmingham, AL
|
—
|
|
|
627
|
|
3,662
|
|
—
|
|
|
—
|
|
|
627
|
|
3,662
|
|
4,289
|
|
55
|
|
1982
|
08/14
|
|
25
|
|||||||
|
Columbia, SC
|
—
|
|
|
509
|
|
2,655
|
|
—
|
|
|
—
|
|
|
509
|
|
2,655
|
|
3,164
|
|
33
|
|
1983
|
08/14
|
|
30
|
|||||||
|
Conroe, TX
|
—
|
|
|
793
|
|
3,388
|
|
—
|
|
|
—
|
|
|
793
|
|
3,388
|
|
4,181
|
|
42
|
|
2001
|
08/14
|
|
30
|
|||||||
|
Cordova, TN
|
—
|
|
|
1,195
|
|
3,055
|
|
—
|
|
|
—
|
|
|
1,195
|
|
3,055
|
|
4,250
|
|
38
|
|
2002
|
08/14
|
|
30
|
|||||||
|
Denton, TX
|
—
|
|
|
833
|
|
1,245
|
|
—
|
|
|
—
|
|
|
833
|
|
1,245
|
|
2,078
|
|
13
|
|
2003
|
08/14
|
|
35
|
|||||||
|
El Centro, CA
|
—
|
|
|
470
|
|
2,811
|
|
—
|
|
|
—
|
|
|
470
|
|
2,811
|
|
3,281
|
|
30
|
|
2005
|
08/14
|
|
35
|
|||||||
|
Englewood, CO
|
—
|
|
|
911
|
|
3,056
|
|
—
|
|
|
—
|
|
|
911
|
|
3,056
|
|
3,967
|
|
38
|
|
1970
|
08/14
|
|
30
|
|||||||
|
Foothill Ranch, CA
|
—
|
|
|
1,088
|
|
1,391
|
|
—
|
|
|
—
|
|
|
1,088
|
|
1,391
|
|
2,479
|
|
17
|
|
2003
|
08/14
|
|
30
|
|||||||
|
Ft. Wayne, IN
|
—
|
|
|
686
|
|
3,232
|
|
—
|
|
|
—
|
|
|
686
|
|
3,232
|
|
3,918
|
|
40
|
|
1985
|
08/14
|
|
30
|
|||||||
|
Garland, TX
|
—
|
|
|
1,224
|
|
2,302
|
|
—
|
|
|
—
|
|
|
1,224
|
|
2,302
|
|
3,526
|
|
25
|
|
2006
|
08/14
|
|
35
|
|||||||
|
Grand Prairie, TX
|
—
|
|
|
1,380
|
|
4,983
|
|
—
|
|
|
—
|
|
|
1,380
|
|
4,983
|
|
6,363
|
|
62
|
|
2001
|
08/14
|
|
30
|
|||||||
See accompanying report of independent registered public accounting firm.
F-14
|
Initial Cost to
Company
|
Costs Capitalized
Subsequent to
Acquisition
|
Gross Amount at Which
Carried at Close of Period (a) (b)
|
Life on Which
Depreciation &
Amortization in Latest Income
Statement is
Computed (Years)
|
|||||||||||||||||||||||||||||
|
Encumbrances
|
Land
|
Building,
Improvements &
Leasehold
Interests
|
Improvements
|
Carrying
Costs
|
Land
|
Building,
Improvements &
Leasehold
Interests
|
Total
|
Accumulated
Depreciation
and
Amortization
|
Date of
Construction
|
Date
Acquired
|
||||||||||||||||||||||
|
Real Estate Held for Investment the Company has Invested in Under Operating Leases:
|
||||||||||||||||||||||||||||||||
|
Grapevine, TX
|
—
|
|
|
1,303
|
|
2,135
|
|
—
|
|
|
—
|
|
|
1,303
|
|
2,135
|
|
3,438
|
|
27
|
|
2002
|
08/14
|
|
30
|
|||||||
|
Greenville, SC
|
—
|
|
|
764
|
|
3,554
|
|
—
|
|
|
—
|
|
|
764
|
|
3,554
|
|
4,318
|
|
53
|
|
1983
|
08/14
|
|
25
|
|||||||
|
Hickory, NC
|
—
|
|
|
647
|
|
1,686
|
|
—
|
|
|
—
|
|
|
647
|
|
1,686
|
|
2,333
|
|
18
|
|
2002
|
08/14
|
|
35
|
|||||||
|
Horn Lake, MS
|
—
|
|
|
960
|
|
3,388
|
|
—
|
|
|
—
|
|
|
960
|
|
3,388
|
|
4,348
|
|
36
|
|
2002
|
08/14
|
|
35
|
|||||||
|
Jacksonville, FL
|
—
|
|
|
1,038
|
|
4,220
|
|
—
|
|
|
—
|
|
|
1,038
|
|
4,220
|
|
5,258
|
|
63
|
|
1981
|
08/14
|
|
25
|
|||||||
|
Katy, TX
|
—
|
|
|
960
|
|
4,171
|
|
—
|
|
|
—
|
|
|
960
|
|
4,171
|
|
5,131
|
|
52
|
|
2002
|
08/14
|
|
30
|
|||||||
|
Kennesaw, GA
|
—
|
|
|
1,332
|
|
3,818
|
|
—
|
|
|
—
|
|
|
1,332
|
|
3,818
|
|
5,150
|
|
48
|
|
1999
|
08/14
|
|
30
|
|||||||
|
Killeen, TX
|
—
|
|
|
832
|
|
4,876
|
|
—
|
|
|
—
|
|
|
832
|
|
4,876
|
|
5,708
|
|
52
|
|
2004
|
08/14
|
|
35
|
|||||||
|
Lake Charles, LA
|
—
|
|
|
853
|
|
1,539
|
|
—
|
|
|
—
|
|
|
853
|
|
1,539
|
|
2,392
|
|
19
|
|
2001
|
08/14
|
|
30
|
|||||||
|
Littleton, CO
|
—
|
|
|
1,234
|
|
4,288
|
|
—
|
|
|
—
|
|
|
1,234
|
|
4,288
|
|
5,522
|
|
54
|
|
1994
|
08/14
|
|
30
|
|||||||
|
Longview, TX
|
—
|
|
|
314
|
|
1,931
|
|
—
|
|
|
—
|
|
|
314
|
|
1,931
|
|
2,245
|
|
21
|
|
2004
|
08/14
|
|
35
|
|||||||
|
Madison, WI
|
—
|
|
|
999
|
|
1,989
|
|
—
|
|
|
—
|
|
|
999
|
|
1,989
|
|
2,988
|
|
30
|
|
1982
|
08/14
|
|
25
|
|||||||
|
Miamisburg, OH
|
—
|
|
|
607
|
|
4,416
|
|
—
|
|
|
—
|
|
|
607
|
|
4,416
|
|
5,023
|
|
66
|
|
1986
|
08/14
|
|
25
|
|||||||
|
Midland, TX
|
—
|
|
|
588
|
|
2,537
|
|
—
|
|
|
—
|
|
|
588
|
|
2,537
|
|
3,125
|
|
32
|
|
2000
|
08/14
|
|
30
|
|||||||
|
N. Richland Hills, TX
|
—
|
|
|
588
|
|
4,064
|
|
—
|
|
|
—
|
|
|
588
|
|
4,064
|
|
4,652
|
|
61
|
|
1982
|
08/14
|
|
25
|
|||||||
|
Norcross, GA
|
—
|
|
|
1,077
|
|
2,703
|
|
—
|
|
|
—
|
|
|
1,077
|
|
2,703
|
|
3,780
|
|
41
|
|
1982
|
08/14
|
|
25
|
|||||||
|
North Charleston, SC
|
—
|
|
|
1,449
|
|
3,319
|
|
—
|
|
|
—
|
|
|
1,449
|
|
3,319
|
|
4,768
|
|
41
|
|
2003
|
08/14
|
|
30
|
|||||||
|
Oklahoma City, OK
|
—
|
|
|
499
|
|
3,203
|
|
—
|
|
|
—
|
|
|
499
|
|
3,203
|
|
3,702
|
|
48
|
|
1982
|
08/14
|
|
25
|
|||||||
|
Olathe, KS
|
—
|
|
|
843
|
|
736
|
|
—
|
|
|
—
|
|
|
843
|
|
736
|
|
1,579
|
|
9
|
|
2002
|
08/14
|
|
30
|
|||||||
|
Racine, WI
|
—
|
|
|
765
|
|
834
|
|
—
|
|
|
—
|
|
|
765
|
|
834
|
|
1,599
|
|
10
|
|
2000
|
08/14
|
|
30
|
|||||||
|
Roanoke, TX
|
—
|
|
|
617
|
|
4,787
|
|
—
|
|
|
—
|
|
|
617
|
|
4,787
|
|
5,404
|
|
72
|
|
1983
|
08/14
|
|
25
|
|||||||
|
San Antonio, TX
|
—
|
|
|
1,371
|
|
2,703
|
|
—
|
|
|
—
|
|
|
1,371
|
|
2,703
|
|
4,074
|
|
34
|
|
2001
|
08/14
|
|
30
|
|||||||
|
San Antonio, TX
|
—
|
|
|
793
|
|
4,670
|
|
—
|
|
|
—
|
|
|
793
|
|
4,670
|
|
5,463
|
|
70
|
|
1990
|
08/14
|
|
25
|
|||||||
|
Savannah, GA
|
—
|
|
|
1,469
|
|
2,634
|
|
—
|
|
|
—
|
|
|
1,469
|
|
2,634
|
|
4,103
|
|
40
|
|
1982
|
08/14
|
|
25
|
|||||||
|
Sharonville, OH
|
—
|
|
|
696
|
|
1,597
|
|
—
|
|
|
—
|
|
|
696
|
|
1,597
|
|
2,293
|
|
24
|
|
1982
|
08/14
|
|
25
|
|||||||
|
Sterling Heights, MI
|
—
|
|
|
725
|
|
2,322
|
|
—
|
|
|
—
|
|
|
725
|
|
2,322
|
|
3,047
|
|
29
|
|
1994
|
08/14
|
|
30
|
|||||||
|
Sugarland, TX
|
—
|
|
|
1,107
|
|
3,134
|
|
—
|
|
|
—
|
|
|
1,107
|
|
3,134
|
|
4,241
|
|
39
|
|
2002
|
08/14
|
|
30
|
|||||||
|
Topeka, KS
|
—
|
|
|
373
|
|
619
|
|
—
|
|
|
—
|
|
|
373
|
|
619
|
|
992
|
|
8
|
|
1990
|
08/14
|
|
30
|
|||||||
|
Virginia Beach, VA
|
—
|
|
|
1,018
|
|
3,848
|
|
—
|
|
|
—
|
|
|
1,018
|
|
3,848
|
|
4,866
|
|
58
|
|
1984
|
08/14
|
|
25
|
|||||||
|
Wichita Falls, TX
|
—
|
|
|
323
|
|
3,105
|
|
—
|
|
|
—
|
|
|
323
|
|
3,105
|
|
3,428
|
|
47
|
|
1982
|
08/14
|
|
25
|
|||||||
|
Wichita, KS
|
—
|
|
|
862
|
|
2,850
|
|
—
|
|
|
—
|
|
|
862
|
|
2,850
|
|
3,712
|
|
36
|
|
1991
|
08/14
|
|
30
|
|||||||
|
Yuma, AZ
|
—
|
|
|
471
|
|
668
|
|
—
|
|
|
—
|
|
|
471
|
|
668
|
|
1,139
|
|
7
|
|
2004
|
08/14
|
|
35
|
|||||||
|
|
|
|
|
|
|
|||||||||||||||||||||||||||
See accompanying report of independent registered public accounting firm.
F-15
|
Initial Cost to
Company
|
Costs Capitalized
Subsequent to
Acquisition
|
Gross Amount at Which
Carried at Close of Period (a) (b)
|
Life on Which
Depreciation &
Amortization in Latest Income
Statement is
Computed (Years)
|
|||||||||||||||||||||||||||||
|
Encumbrances
|
Land
|
Building,
Improvements &
Leasehold
Interests
|
Improvements
|
Carrying
Costs
|
Land
|
Building,
Improvements &
Leasehold
Interests
|
Total
|
Accumulated
Depreciation
and
Amortization
|
Date of
Construction
|
Date
Acquired
|
||||||||||||||||||||||
|
Real Estate Held for Investment the Company has Invested in Under Operating Leases:
|
||||||||||||||||||||||||||||||||
|
Chuy's:
|
|
|
|
|
|
|||||||||||||||||||||||||||
|
Cincinnati, OH
|
—
|
|
|
1,165
|
|
1,322
|
|
—
|
|
|
—
|
|
|
1,165
|
|
1,322
|
|
2,487
|
|
61
|
|
1996
|
05/13
|
|
30
|
|||||||
|
Cinemark:
|
|
|
|
|
|
|||||||||||||||||||||||||||
|
Draper, UT
|
—
|
|
|
1,523
|
|
—
|
|
4,487
|
|
|
—
|
|
|
1,523
|
|
4,487
|
|
6,010
|
|
407
|
|
2011
|
08/10
|
(m)
|
40
|
|||||||
|
Fort Worth, TX
|
—
|
|
|
2,140
|
|
—
|
|
7,660
|
|
|
—
|
|
|
2,140
|
|
7,660
|
|
9,800
|
|
487
|
|
2012
|
08/11
|
(m)
|
40
|
|||||||
|
Cincinnati, OH
|
—
|
|
|
1,334
|
|
—
|
|
10,206
|
|
|
—
|
|
|
1,334
|
|
10,206
|
|
11,540
|
|
351
|
|
2013
|
09/12
|
(m)
|
40
|
|||||||
|
McCandless, PA
|
—
|
|
|
3,094
|
|
—
|
|
6,389
|
|
|
—
|
|
|
3,094
|
|
6,389
|
|
9,483
|
|
47
|
|
2014
|
09/13
|
(m)
|
40
|
|||||||
|
Marina, CA
|
—
|
|
|
15
|
|
—
|
|
—
|
|
|
—
|
|
|
15
|
|
(e)
|
|
15
|
|
(e)
|
|
(e)
|
08/14
|
(m)
|
(e)
|
|||||||
|
|
|
|
|
|
|
|||||||||||||||||||||||||||
|
Claim Jumper:
|
|
|
|
|
|
|||||||||||||||||||||||||||
|
Roseville, CA
|
—
|
|
|
1,557
|
|
2,014
|
|
—
|
|
|
—
|
|
|
1,557
|
|
2,014
|
|
3,571
|
|
657
|
|
2000
|
12/01
|
|
40
|
|||||||
|
Tempe, AZ
|
—
|
|
|
2,531
|
|
2,921
|
|
—
|
|
|
—
|
|
|
2,531
|
|
2,921
|
|
5,452
|
|
952
|
|
2000
|
12/01
|
|
40
|
|||||||
|
|
|
|
|
|
|
|||||||||||||||||||||||||||
|
Clairton Mini Mart:
|
|
|
|
|
|
|||||||||||||||||||||||||||
|
Clairton, PA
|
—
|
|
|
215
|
|
701
|
|
—
|
|
|
—
|
|
|
215
|
|
701
|
|
916
|
|
251
|
|
1986
|
01/06
|
|
25
|
|||||||
|
|
|
|
|
|
|
|||||||||||||||||||||||||||
|
Continental Rental:
|
|
|
|
|
|
|||||||||||||||||||||||||||
|
Lapeer, MI
|
—
|
|
|
88
|
|
633
|
|
—
|
|
|
—
|
|
|
88
|
|
603
|
|
691
|
|
115
|
|
2007
|
10/05
|
|
40
|
|||||||
|
|
|
|
|
|
|
|||||||||||||||||||||||||||
|
Cool Crest:
|
|
|
|
|
|
|||||||||||||||||||||||||||
|
Independence, MO
|
—
|
|
|
1,838
|
|
1,534
|
|
75
|
|
|
—
|
|
|
1,838
|
|
1,609
|
|
3,447
|
|
297
|
|
1988
|
05/07
|
|
40
|
|||||||
|
|
|
|
|
|
|
|||||||||||||||||||||||||||
|
CORA Rehabilitation Clinics:
|
|
|
|
|
|
|||||||||||||||||||||||||||
|
Orlando, FL
|
38
|
|
(h)
|
80
|
|
221
|
|
—
|
|
|
—
|
|
|
80
|
|
221
|
|
301
|
|
60
|
|
2001
|
02/04
|
|
40
|
|||||||
|
|
|
|
|
|
|
|||||||||||||||||||||||||||
|
CTD Outdoor Adventures:
|
|
|
|
|
|
|||||||||||||||||||||||||||
|
Fort Worth, TX
|
—
|
|
|
1,652
|
|
2,018
|
|
—
|
|
|
—
|
|
|
1,652
|
|
2,018
|
|
3,670
|
|
498
|
|
2000
|
02/05
|
|
40
|
|||||||
|
|
|
|
|
|
|
|||||||||||||||||||||||||||
|
CVS:
|
|
|
|
|
|
|||||||||||||||||||||||||||
|
Lafayette, LA
|
—
|
|
|
968
|
|
—
|
|
—
|
|
|
—
|
|
|
968
|
|
(c)
|
|
968
|
|
(c)
|
|
1995
|
01/96
|
|
(c)
|
|||||||
|
Fort Lauderdale, FL
|
—
|
|
|
3,165
|
|
3,319
|
|
190
|
|
|
—
|
|
|
3,165
|
|
3,509
|
|
6,674
|
|
1,275
|
|
1995
|
02/96
|
|
33
|
|||||||
|
Midwest City, OK
|
—
|
|
|
673
|
|
1,103
|
|
—
|
|
|
—
|
|
|
673
|
|
1,103
|
|
1,776
|
|
519
|
|
1996
|
03/96
|
|
40
|
|||||||
|
Pantego, TX
|
—
|
|
|
1,016
|
|
1,449
|
|
—
|
|
|
—
|
|
|
1,016
|
|
1,449
|
|
2,465
|
|
635
|
|
1997
|
06/97
|
|
40
|
|||||||
See accompanying report of independent registered public accounting firm.
F-16
|
Initial Cost to
Company
|
Costs Capitalized
Subsequent to
Acquisition
|
Gross Amount at Which
Carried at Close of Period (a) (b)
|
Life on Which
Depreciation &
Amortization in Latest Income
Statement is
Computed (Years)
|
|||||||||||||||||||||||||||||
|
Encumbrances
|
Land
|
Building,
Improvements &
Leasehold
Interests
|
Improvements
|
Carrying
Costs
|
Land
|
Building,
Improvements &
Leasehold
Interests
|
Total
|
Accumulated
Depreciation
and
Amortization
|
Date of
Construction
|
Date
Acquired
|
||||||||||||||||||||||
|
Real Estate Held for Investment the Company has Invested in Under Operating Leases:
|
||||||||||||||||||||||||||||||||
|
Arlington, TX
|
—
|
|
|
2,079
|
|
—
|
|
1,397
|
|
|
—
|
|
|
2,079
|
|
1,397
|
|
3,476
|
|
572
|
|
1998
|
11/97
|
(g)
|
40
|
|||||||
|
Leavenworth, KS
|
—
|
|
|
726
|
|
—
|
|
1,331
|
|
|
—
|
|
|
726
|
|
1,331
|
|
2,057
|
|
550
|
|
1998
|
11/97
|
(g)
|
40
|
|||||||
|
Lewisville, TX
|
—
|
|
|
789
|
|
—
|
|
1,335
|
|
|
—
|
|
|
789
|
|
1,335
|
|
2,124
|
|
544
|
|
1998
|
04/98
|
(g)
|
40
|
|||||||
|
Forest Hill, TX
|
—
|
|
|
692
|
|
—
|
|
1,175
|
|
|
—
|
|
|
692
|
|
1,175
|
|
1,867
|
|
481
|
|
1998
|
04/98
|
(g)
|
40
|
|||||||
|
Garland, TX
|
—
|
|
|
1,477
|
|
—
|
|
1,400
|
|
|
—
|
|
|
1,477
|
|
1,400
|
|
2,877
|
|
564
|
|
1998
|
06/98
|
(g)
|
40
|
|||||||
|
Oklahoma City, OK
|
—
|
|
|
1,581
|
|
—
|
|
1,471
|
|
|
—
|
|
|
1,581
|
|
1,471
|
|
3,052
|
|
587
|
|
1999
|
08/98
|
(g)
|
40
|
|||||||
|
Dallas, TX
|
—
|
|
|
2,618
|
|
—
|
|
2,571
|
|
|
—
|
|
|
2,618
|
|
2,571
|
|
5,189
|
|
720
|
|
2003
|
06/99
|
(g)
|
40
|
|||||||
|
Gladstone, MO
|
—
|
|
|
1,851
|
|
—
|
|
1,740
|
|
|
—
|
|
|
1,851
|
|
1,740
|
|
3,591
|
|
625
|
|
2000
|
12/99
|
(g)
|
40
|
|||||||
|
|
|
|
|
|
|
|||||||||||||||||||||||||||
|
Dave & Buster's:
|
|
|
|
|
|
|||||||||||||||||||||||||||
|
Hilliard, OH
|
—
|
|
|
934
|
|
4,689
|
|
—
|
|
|
—
|
|
|
934
|
|
4,689
|
|
5,623
|
|
952
|
|
1998
|
11/06
|
|
40
|
|||||||
|
Tulsa, OK
|
—
|
|
|
1,862
|
|
—
|
|
2,105
|
|
|
—
|
|
|
1,862
|
|
2,105
|
|
3,967
|
|
314
|
|
2009
|
04/08
|
(m)
|
40
|
|||||||
|
Wauwatosa, WI
|
—
|
|
|
5,694
|
|
—
|
|
5,638
|
|
|
—
|
|
|
5,694
|
|
5,638
|
|
11,332
|
|
675
|
|
2010
|
12/08
|
(m)
|
40
|
|||||||
|
Orlando, FL
|
—
|
|
|
8,114
|
|
—
|
|
4,224
|
|
|
—
|
|
|
8,114
|
|
4,224
|
|
12,338
|
|
365
|
|
2011
|
06/10
|
(m)
|
40
|
|||||||
|
Oklahoma City, OK
|
—
|
|
|
3,156
|
|
—
|
|
4,870
|
|
|
—
|
|
|
3,156
|
|
4,870
|
|
8,026
|
|
360
|
|
2012
|
02/11
|
(m)
|
40
|
|||||||
|
Dallas, TX
|
—
|
|
|
5,052
|
|
—
|
|
8,808
|
|
|
—
|
|
|
5,052
|
|
8,808
|
|
13,860
|
|
450
|
|
2012
|
03/12
|
(m)
|
40
|
|||||||
|
Livonia, MI
|
—
|
|
|
2,116
|
|
—
|
|
7,758
|
|
|
—
|
|
|
2,116
|
|
7,758
|
|
9,874
|
|
202
|
|
2013
|
04/13
|
(m)
|
40
|
|||||||
|
Euless, TX
|
—
|
|
|
2,592
|
|
—
|
|
—
|
|
|
—
|
|
|
2,592
|
|
(e)
|
|
2,592
|
|
(e)
|
|
(e)
|
08/14
|
(m)
|
(e)
|
|||||||
|
|
|
|
|
|
|
|||||||||||||||||||||||||||
|
DaVita Dialysis:
|
|
|
|
|
|
|||||||||||||||||||||||||||
|
Columbus, OH
|
—
|
|
|
527
|
|
1,426
|
|
—
|
|
|
—
|
|
|
527
|
|
1,426
|
|
1,953
|
|
22
|
|
2000
|
07/14
|
|
30
|
|||||||
|
|
|
|
|
|
|
|||||||||||||||||||||||||||
|
Del Frisco's:
|
|
|
|
|
|
|||||||||||||||||||||||||||
|
Fort Worth, TX
|
—
|
|
|
351
|
|
5,874
|
|
—
|
|
|
—
|
|
|
351
|
|
5,874
|
|
6,225
|
|
1,163
|
|
1890
|
01/11
|
|
20
|
|||||||
|
Greenwood Village, CO
|
—
|
|
|
1,863
|
|
5,649
|
|
—
|
|
|
—
|
|
|
1,863
|
|
5,649
|
|
7,512
|
|
1,118
|
|
1979
|
01/11
|
|
20
|
|||||||
|
|
|
|
|
|
|
|||||||||||||||||||||||||||
|
Denny's:
|
|
|
|
|
|
|||||||||||||||||||||||||||
|
Clifton, CO
|
—
|
|
|
245
|
|
732
|
|
375
|
|
|
—
|
|
|
245
|
|
1,107
|
|
1,352
|
|
279
|
|
1998
|
12/01
|
|
40
|
|||||||
|
Columbus, TX
|
—
|
|
|
428
|
|
817
|
|
—
|
|
|
—
|
|
|
428
|
|
817
|
|
1,245
|
|
266
|
|
1997
|
12/01
|
|
40
|
|||||||
|
Alexandria, VA
|
—
|
|
|
604
|
|
196
|
|
—
|
|
|
—
|
|
|
604
|
|
196
|
|
800
|
|
81
|
|
1981
|
09/06
|
|
20
|
|||||||
|
Amarillo, TX
|
—
|
|
|
590
|
|
632
|
|
—
|
|
|
—
|
|
|
590
|
|
632
|
|
1,222
|
|
262
|
|
1982
|
09/06
|
|
20
|
|||||||
|
Arlington Heights, IL
|
—
|
|
|
470
|
|
228
|
|
—
|
|
|
—
|
|
|
470
|
|
228
|
|
698
|
|
94
|
|
1977
|
09/06
|
|
20
|
|||||||
|
Austintown, OH
|
—
|
|
|
466
|
|
397
|
|
—
|
|
|
—
|
|
|
466
|
|
397
|
|
863
|
|
165
|
|
1980
|
09/06
|
|
20
|
|||||||
|
Boardman Township, OH
|
—
|
|
|
497
|
|
258
|
|
—
|
|
|
—
|
|
|
497
|
|
258
|
|
755
|
|
107
|
|
1977
|
09/06
|
|
20
|
|||||||
See accompanying report of independent registered public accounting firm.
F-17
|
Initial Cost to
Company
|
Costs Capitalized
Subsequent to
Acquisition
|
Gross Amount at Which
Carried at Close of Period (a) (b)
|
Life on Which
Depreciation &
Amortization in Latest Income
Statement is
Computed (Years)
|
|||||||||||||||||||||||||||||
|
Encumbrances
|
Land
|
Building,
Improvements &
Leasehold
Interests
|
Improvements
|
Carrying
Costs
|
Land
|
Building,
Improvements &
Leasehold
Interests
|
Total
|
Accumulated
Depreciation
and
Amortization
|
Date of
Construction
|
Date
Acquired
|
||||||||||||||||||||||
|
Real Estate Held for Investment the Company has Invested in Under Operating Leases:
|
||||||||||||||||||||||||||||||||
|
Campbell, CA
|
—
|
|
|
460
|
|
238
|
|
—
|
|
|
—
|
|
|
460
|
|
238
|
|
698
|
|
99
|
|
1976
|
09/06
|
|
20
|
|||||||
|
Carson, CA
|
—
|
|
|
1,246
|
|
157
|
|
—
|
|
|
—
|
|
|
1,246
|
|
157
|
|
1,403
|
|
65
|
|
1975
|
09/06
|
|
20
|
|||||||
|
Chehalis, WA
|
—
|
|
|
415
|
|
287
|
|
—
|
|
|
—
|
|
|
415
|
|
287
|
|
702
|
|
119
|
|
1977
|
09/06
|
|
20
|
|||||||
|
Chubbuck, ID
|
—
|
|
350
|
|
394
|
|
—
|
|
—
|
|
344
|
|
394
|
|
738
|
|
163
|
|
1983
|
09/06
|
|
20
|
||||||||||
|
Clackamas, OR
|
—
|
|
|
468
|
|
407
|
|
—
|
|
|
—
|
|
|
468
|
|
407
|
|
875
|
|
169
|
|
1993
|
09/06
|
|
20
|
|||||||
|
Collinsville, IL
|
—
|
|
|
676
|
|
283
|
|
—
|
|
|
—
|
|
|
676
|
|
283
|
|
959
|
|
117
|
|
1979
|
09/06
|
|
20
|
|||||||
|
Colorado Springs, CO
|
—
|
|
|
321
|
|
377
|
|
—
|
|
|
—
|
|
|
321
|
|
377
|
|
698
|
|
156
|
|
1984
|
09/06
|
|
20
|
|||||||
|
Colorado Springs, CO
|
—
|
|
|
585
|
|
390
|
|
—
|
|
|
—
|
|
|
585
|
|
390
|
|
975
|
|
162
|
|
1978
|
09/06
|
|
20
|
|||||||
|
Corpus Christi, TX
|
—
|
|
|
345
|
|
776
|
|
300
|
|
|
—
|
|
|
345
|
|
1,076
|
|
1,421
|
|
417
|
|
1980
|
09/06
|
|
20
|
|||||||
|
Dallas, TX
|
—
|
|
|
497
|
|
150
|
|
—
|
|
|
—
|
|
|
497
|
|
150
|
|
647
|
|
62
|
|
1979
|
09/06
|
|
20
|
|||||||
|
Enfield, CT
|
—
|
|
|
684
|
|
229
|
|
—
|
|
|
—
|
|
|
684
|
|
229
|
|
913
|
|
95
|
|
1976
|
09/06
|
|
20
|
|||||||
|
Fairfax, VA
|
—
|
|
|
768
|
|
683
|
|
—
|
|
|
—
|
|
|
768
|
|
683
|
|
1,451
|
|
283
|
|
1979
|
09/06
|
|
20
|
|||||||
|
Federal Way, WA
|
—
|
|
|
543
|
|
193
|
|
—
|
|
|
—
|
|
|
543
|
|
193
|
|
736
|
|
80
|
|
1977
|
09/06
|
|
20
|
|||||||
|
Florissant, MO
|
—
|
|
|
443
|
|
238
|
|
—
|
|
|
—
|
|
|
443
|
|
238
|
|
681
|
|
99
|
|
1977
|
09/06
|
|
20
|
|||||||
|
Fort Worth, TX
|
—
|
|
|
392
|
|
314
|
|
—
|
|
|
—
|
|
|
392
|
|
314
|
|
706
|
|
130
|
|
1974
|
09/06
|
|
20
|
|||||||
|
Hermitage, PA
|
—
|
|
|
321
|
|
420
|
|
—
|
|
|
—
|
|
|
321
|
|
420
|
|
741
|
|
174
|
|
1980
|
09/06
|
|
20
|
|||||||
|
Hialeah, FL
|
—
|
|
|
432
|
|
175
|
|
—
|
|
|
—
|
|
|
432
|
|
175
|
|
607
|
|
73
|
|
1978
|
09/06
|
|
20
|
|||||||
|
Houston, TX
|
—
|
|
|
504
|
|
348
|
|
—
|
|
|
—
|
|
|
504
|
|
348
|
|
852
|
|
144
|
|
1976
|
09/06
|
|
20
|
|||||||
|
Indianapolis, IN
|
—
|
|
|
231
|
|
511
|
|
—
|
|
|
—
|
|
|
231
|
|
511
|
|
742
|
|
212
|
|
1974
|
09/06
|
|
20
|
|||||||
|
Indianapolis, IN
|
—
|
|
|
326
|
|
511
|
|
—
|
|
|
—
|
|
|
326
|
|
511
|
|
837
|
|
212
|
|
1978
|
09/06
|
|
20
|
|||||||
|
Indianapolis, IN
|
—
|
|
|
310
|
|
590
|
|
—
|
|
|
—
|
|
|
310
|
|
590
|
|
900
|
|
244
|
|
1981
|
09/06
|
|
20
|
|||||||
|
Indianapolis, IN
|
—
|
|
|
358
|
|
767
|
|
—
|
|
|
—
|
|
|
358
|
|
767
|
|
1,125
|
|
318
|
|
1978
|
09/06
|
|
20
|
|||||||
|
Kernersville, NC
|
—
|
|
|
407
|
|
557
|
|
—
|
|
|
—
|
|
|
407
|
|
557
|
|
964
|
|
231
|
|
2000
|
09/06
|
|
20
|
|||||||
|
Lafayette, IN
|
—
|
|
|
424
|
|
773
|
|
—
|
|
|
—
|
|
|
416
|
|
773
|
|
1,189
|
|
321
|
|
1978
|
09/06
|
|
20
|
|||||||
|
Laurel, MD
|
—
|
|
|
528
|
|
379
|
|
—
|
|
|
—
|
|
|
528
|
|
379
|
|
907
|
|
157
|
|
1976
|
09/06
|
|
20
|
|||||||
|
Little Rock, AR
|
—
|
|
|
703
|
|
180
|
|
—
|
|
|
—
|
|
|
703
|
|
180
|
|
883
|
|
75
|
|
1979
|
09/06
|
|
20
|
|||||||
|
Maplewood, MN
|
—
|
|
|
630
|
|
271
|
|
—
|
|
|
—
|
|
|
630
|
|
271
|
|
901
|
|
112
|
|
1983
|
09/06
|
|
20
|
|||||||
|
Merriville, IN
|
—
|
|
|
368
|
|
813
|
|
—
|
|
|
—
|
|
|
368
|
|
813
|
|
1,181
|
|
337
|
|
1976
|
09/06
|
|
20
|
|||||||
|
N. Miami, FL
|
—
|
|
|
855
|
|
151
|
|
—
|
|
|
—
|
|
|
855
|
|
151
|
|
1,006
|
|
63
|
|
1977
|
09/06
|
|
20
|
|||||||
|
Nampa, ID
|
—
|
|
|
357
|
|
729
|
|
—
|
|
|
—
|
|
|
357
|
|
729
|
|
1,086
|
|
302
|
|
1979
|
09/06
|
|
20
|
|||||||
|
North Richland Hills, TX
|
—
|
|
|
500
|
|
130
|
|
—
|
|
|
—
|
|
|
500
|
|
130
|
|
630
|
|
54
|
|
1970
|
09/06
|
|
20
|
|||||||
|
Omaha, NE
|
—
|
|
|
496
|
|
314
|
|
—
|
|
|
—
|
|
|
496
|
|
314
|
|
810
|
|
130
|
|
1994
|
09/06
|
|
20
|
|||||||
|
Pompano Beach, FL
|
—
|
|
|
436
|
|
394
|
|
—
|
|
|
—
|
|
|
436
|
|
394
|
|
830
|
|
163
|
|
1976
|
09/06
|
|
20
|
|||||||
|
Portland, OR
|
—
|
|
|
764
|
|
161
|
|
—
|
|
|
—
|
|
|
764
|
|
161
|
|
925
|
|
67
|
|
1977
|
09/06
|
|
20
|
|||||||
See accompanying report of independent registered public accounting firm.
F-18
|
Initial Cost to
Company
|
Costs Capitalized
Subsequent to
Acquisition
|
Gross Amount at Which
Carried at Close of Period (a) (b)
|
Life on Which
Depreciation &
Amortization in Latest Income
Statement is
Computed (Years)
|
|||||||||||||||||||||||||||||
|
Encumbrances
|
Land
|
Building,
Improvements &
Leasehold
Interests
|
Improvements
|
Carrying
Costs
|
Land
|
Building,
Improvements &
Leasehold
Interests
|
Total
|
Accumulated
Depreciation
and
Amortization
|
Date of
Construction
|
Date
Acquired
|
||||||||||||||||||||||
|
Real Estate Held for Investment the Company has Invested in Under Operating Leases:
|
||||||||||||||||||||||||||||||||
|
Provo, UT
|
—
|
|
|
519
|
|
216
|
|
—
|
|
|
—
|
|
|
519
|
|
216
|
|
735
|
|
90
|
|
1978
|
09/06
|
|
20
|
|||||||
|
Pueblo, CO
|
—
|
|
|
475
|
|
302
|
|
—
|
|
|
—
|
|
|
475
|
|
302
|
|
777
|
|
125
|
|
1980
|
09/06
|
|
20
|
|||||||
|
Raleigh, NC
|
—
|
|
|
1,094
|
|
482
|
|
—
|
|
|
—
|
|
|
1,094
|
|
482
|
|
1,576
|
|
200
|
|
1984
|
09/06
|
|
20
|
|||||||
|
St. Louis, MO
|
—
|
|
|
520
|
|
266
|
|
—
|
|
|
—
|
|
|
520
|
|
266
|
|
786
|
|
110
|
|
1973
|
09/06
|
|
20
|
|||||||
|
Sugarland, TX
|
—
|
|
|
315
|
|
334
|
|
—
|
|
|
—
|
|
|
315
|
|
334
|
|
649
|
|
138
|
|
1997
|
09/06
|
|
20
|
|||||||
|
Tacoma, WA
|
—
|
|
|
580
|
|
201
|
|
—
|
|
|
—
|
|
|
575
|
|
201
|
|
776
|
|
83
|
|
1984
|
09/06
|
|
20
|
|||||||
|
Tucson, AZ
|
—
|
|
|
922
|
|
290
|
|
—
|
|
|
—
|
|
|
922
|
|
290
|
|
1,212
|
|
120
|
|
1979
|
09/06
|
|
20
|
|||||||
|
Wethersfield, CT
|
—
|
|
|
884
|
|
176
|
|
—
|
|
|
—
|
|
|
884
|
|
176
|
|
1,060
|
|
73
|
|
1978
|
09/06
|
|
20
|
|||||||
|
Worcester, MA
|
—
|
|
|
383
|
|
493
|
|
—
|
|
|
—
|
|
|
383
|
|
493
|
|
876
|
|
204
|
|
1978
|
09/06
|
|
20
|
|||||||
|
Boise, ID
|
—
|
|
|
514
|
|
477
|
|
—
|
|
|
—
|
|
|
514
|
|
477
|
|
991
|
|
192
|
|
1983
|
12/06
|
|
20
|
|||||||
|
St. Louis, MO
|
—
|
|
|
635
|
|
303
|
|
—
|
|
|
—
|
|
|
635
|
|
303
|
|
938
|
|
121
|
|
1980
|
01/07
|
|
20
|
|||||||
|
Virginia Gardens, FL
|
—
|
|
|
793
|
|
133
|
|
—
|
|
|
—
|
|
|
793
|
|
133
|
|
926
|
|
53
|
|
1977
|
01/07
|
|
20
|
|||||||
|
Akron, OH
|
—
|
|
|
308
|
|
1,062
|
|
—
|
|
|
—
|
|
|
308
|
|
1,062
|
|
1,370
|
|
55
|
|
1992
|
06/13
|
|
30
|
|||||||
|
|
|
|
|
|
|
|||||||||||||||||||||||||||
|
Diamond Communication:
|
|
|
|
|
|
|||||||||||||||||||||||||||
|
Lapeer, MI
|
—
|
|
|
37
|
|
264
|
|
—
|
|
|
—
|
|
|
37
|
|
251
|
|
288
|
|
48
|
|
2007
|
10/05
|
|
40
|
|||||||
|
|
|
|
|
|
|
|||||||||||||||||||||||||||
|
Dickey's Barbeque Pit:
|
|
|
|
|
|
|||||||||||||||||||||||||||
|
Medina, OH
|
—
|
|
|
405
|
|
464
|
|
104
|
|
|
—
|
|
|
405
|
|
568
|
|
973
|
|
161
|
|
1996
|
12/01
|
|
40
|
|||||||
|
|
|
|
|
|
|
|||||||||||||||||||||||||||
|
Dick's Sporting Goods:
|
|
|
|
|
|
|||||||||||||||||||||||||||
|
Taylor, MI
|
—
|
|
|
1,920
|
|
3,527
|
|
—
|
|
|
—
|
|
|
1,920
|
|
3,527
|
|
5,447
|
|
1,613
|
|
1996
|
08/96
|
|
40
|
|||||||
|
White Marsh, MD
|
—
|
|
|
2,681
|
|
3,917
|
|
—
|
|
|
—
|
|
|
2,681
|
|
3,917
|
|
6,598
|
|
1,792
|
|
1996
|
08/96
|
|
40
|
|||||||
|
|
|
|
|
|
|
|||||||||||||||||||||||||||
|
Dollar General:
|
|
|
|
|
|
|||||||||||||||||||||||||||
|
San Antonio, TX
|
—
|
|
|
441
|
|
784
|
|
—
|
|
|
—
|
|
|
441
|
|
196
|
|
637
|
|
7
|
|
1993
|
12/93
|
|
30
|
|||||||
|
Memphis, TN
|
—
|
|
|
266
|
|
1,136
|
|
46
|
|
|
—
|
|
|
266
|
|
1,182
|
|
1,448
|
|
449
|
|
1998
|
12/97
|
|
40
|
|||||||
|
High Springs, FL
|
—
|
|
|
409
|
|
—
|
|
1,072
|
|
|
—
|
|
|
432
|
|
1,072
|
|
1,504
|
|
111
|
|
2010
|
07/10
|
(m)
|
40
|
|||||||
|
Inverness, FL
|
—
|
|
|
459
|
|
—
|
|
1,046
|
|
|
—
|
|
|
471
|
|
1,046
|
|
1,517
|
|
104
|
|
2011
|
08/10
|
(m)
|
40
|
|||||||
|
Cocoa, FL
|
—
|
|
|
385
|
|
—
|
|
935
|
|
|
—
|
|
|
406
|
|
935
|
|
1,341
|
|
96
|
|
2010
|
08/10
|
(m)
|
40
|
|||||||
|
Palm Bay, FL
|
—
|
|
|
355
|
|
—
|
|
1,011
|
|
|
—
|
|
|
365
|
|
1,011
|
|
1,376
|
|
102
|
|
2010
|
08/10
|
(m)
|
40
|
|||||||
|
Deland, FL
|
—
|
|
|
585
|
|
—
|
|
958
|
|
|
—
|
|
|
585
|
|
958
|
|
1,543
|
|
93
|
|
2010
|
11/10
|
(m)
|
40
|
|||||||
|
Seffner, FL
|
—
|
|
|
673
|
|
—
|
|
1,223
|
|
|
—
|
|
|
655
|
|
1,223
|
|
1,878
|
|
118
|
|
2011
|
12/10
|
(m)
|
40
|
|||||||
|
Hernando, FL
|
—
|
|
|
372
|
|
—
|
|
970
|
|
|
—
|
|
|
372
|
|
970
|
|
1,342
|
|
90
|
|
2011
|
01/11
|
(m)
|
40
|
|||||||
|
Titusville, FL
|
—
|
|
|
512
|
|
—
|
|
1,002
|
|
|
—
|
|
|
512
|
|
1,002
|
|
1,514
|
|
85
|
|
2011
|
04/11
|
(m)
|
40
|
|||||||
|
Bunnlevel, NC
|
—
|
|
|
106
|
|
—
|
|
737
|
|
|
—
|
|
|
106
|
|
737
|
|
843
|
|
59
|
|
2011
|
08/11
|
(m)
|
40
|
|||||||
|
Disputanta, VA
|
—
|
|
|
170
|
|
—
|
|
720
|
|
|
—
|
|
|
170
|
|
720
|
|
890
|
|
59
|
|
2011
|
09/11
|
(m)
|
40
|
|||||||
|
Lumberton, NC
|
—
|
|
|
115
|
|
—
|
|
902
|
|
|
—
|
|
|
115
|
|
902
|
|
1,017
|
|
67
|
|
2012
|
10/11
|
(m)
|
40
|
|||||||
|
Newport News, VA
|
—
|
|
|
363
|
|
—
|
|
967
|
|
|
—
|
|
|
363
|
|
967
|
|
1,330
|
|
76
|
|
2011
|
10/11
|
(m)
|
40
|
|||||||
|
Cumberland, VA
|
—
|
|
|
317
|
|
—
|
|
1,147
|
|
|
—
|
|
|
317
|
|
1,147
|
|
1,464
|
|
80
|
|
2012
|
12/11
|
(m)
|
40
|
|||||||
|
Aberdeen, NC
|
—
|
|
|
156
|
|
—
|
|
821
|
|
|
—
|
|
|
156
|
|
821
|
|
977
|
|
56
|
|
2012
|
01/12
|
(m)
|
40
|
|||||||
|
Richmond, VA
|
—
|
|
|
144
|
|
—
|
|
863
|
|
|
—
|
|
|
144
|
|
863
|
|
1,007
|
|
53
|
|
2012
|
02/12
|
(m)
|
40
|
|||||||
|
Danville, VA
|
—
|
|
|
155
|
|
—
|
|
864
|
|
|
—
|
|
|
155
|
|
864
|
|
1,019
|
|
57
|
|
2012
|
03/12
|
(m)
|
40
|
|||||||
|
Cascade, VA
|
—
|
|
|
139
|
|
—
|
|
806
|
|
|
—
|
|
|
139
|
|
806
|
|
945
|
|
51
|
|
2012
|
03/12
|
(m)
|
40
|
|||||||
|
Sanford, NC
|
—
|
|
|
147
|
|
—
|
|
834
|
|
|
—
|
|
|
147
|
|
834
|
|
981
|
|
50
|
|
2012
|
04/12
|
(m)
|
40
|
|||||||
|
Leland, NC
|
—
|
|
|
245
|
|
—
|
|
892
|
|
|
—
|
|
|
245
|
|
892
|
|
1,137
|
|
49
|
|
2012
|
06/12
|
(m)
|
40
|
|||||||
|
Sanford, NC
|
—
|
|
|
206
|
|
—
|
|
829
|
|
|
—
|
|
|
206
|
|
829
|
|
1,035
|
|
46
|
|
2012
|
07/12
|
(m)
|
40
|
|||||||
|
Richmond, VA
|
—
|
|
|
305
|
|
—
|
|
902
|
|
|
—
|
|
|
305
|
|
902
|
|
1,207
|
|
48
|
|
2012
|
08/12
|
(m)
|
40
|
|||||||
|
Stead, NV
|
—
|
|
|
234
|
|
—
|
|
1,464
|
|
|
—
|
|
|
234
|
|
1,464
|
|
1,698
|
|
75
|
|
2012
|
08/12
|
(m)
|
40
|
|||||||
|
Martinsville, VA
|
—
|
|
|
165
|
|
—
|
|
831
|
|
|
—
|
|
|
165
|
|
831
|
|
996
|
|
42
|
|
2012
|
09/12
|
(m)
|
40
|
|||||||
|
Yerington, NV
|
—
|
|
|
313
|
|
—
|
|
1,170
|
|
|
—
|
|
|
313
|
|
1,170
|
|
1,483
|
|
57
|
|
2013
|
09/12
|
(m)
|
40
|
|||||||
|
Ridgeway, VA
|
—
|
|
|
271
|
|
—
|
|
935
|
|
|
—
|
|
|
271
|
|
935
|
|
1,206
|
|
42
|
|
2013
|
11/12
|
(m)
|
40
|
|||||||
|
Hawthorne, NV
|
—
|
|
|
210
|
|
1,069
|
|
—
|
|
|
—
|
|
|
210
|
|
1,069
|
|
1,279
|
|
55
|
|
2012
|
12/12
|
|
40
|
|||||||
|
Sun Valley, NV
|
—
|
|
|
439
|
|
—
|
|
1,438
|
|
|
—
|
|
|
439
|
|
1,438
|
|
1,877
|
|
58
|
|
2013
|
01/13
|
(m)
|
40
|
|||||||
|
Norfolk, VA
|
—
|
|
|
455
|
|
—
|
|
929
|
|
|
—
|
|
|
455
|
|
929
|
|
1,384
|
|
36
|
|
2013
|
03/13
|
(m)
|
40
|
|||||||
|
Suffolk, VA
|
—
|
|
|
186
|
|
—
|
|
958
|
|
|
—
|
|
|
186
|
|
958
|
|
1,144
|
|
37
|
|
2013
|
03/13
|
(m)
|
40
|
|||||||
|
Suffolk, VA
|
—
|
|
|
128
|
|
—
|
|
1,010
|
|
|
—
|
|
|
128
|
|
1,010
|
|
1,138
|
|
35
|
|
2013
|
04/13
|
(m)
|
40
|
|||||||
|
Irving, NY
|
—
|
|
|
210
|
|
—
|
|
961
|
|
|
—
|
|
|
210
|
|
961
|
|
1,171
|
|
29
|
|
2013
|
06/13
|
(m)
|
40
|
|||||||
|
Oakfield, NY
|
—
|
|
|
257
|
|
—
|
|
1,108
|
|
|
—
|
|
|
271
|
|
1,108
|
|
1,379
|
|
20
|
|
2014
|
10/13
|
(m)
|
40
|
|||||||
|
Holland, NY
|
—
|
|
|
176
|
|
—
|
|
1,103
|
|
|
—
|
|
|
176
|
|
1,103
|
|
1,279
|
|
13
|
|
2014
|
12/13
|
(m)
|
40
|
|||||||
|
Jeffersonville, IN
|
—
|
|
|
115
|
|
960
|
|
—
|
|
|
—
|
|
|
115
|
|
960
|
|
1,075
|
|
24
|
|
2010
|
02/14
|
|
35
|
|||||||
|
LaFayette, LA
|
—
|
|
|
157
|
|
378
|
|
—
|
|
|
—
|
|
|
157
|
|
378
|
|
535
|
|
7
|
|
2002
|
07/14
|
|
25
|
|||||||
|
Youngsville, LA
|
—
|
|
|
98
|
|
370
|
|
—
|
|
|
—
|
|
|
98
|
|
370
|
|
468
|
|
7
|
|
2002
|
07/14
|
|
25
|
|||||||
|
|
|
|
|
|
|
|||||||||||||||||||||||||||
|
Dollar Tree:
|
|
|
|
|
|
|||||||||||||||||||||||||||
|
Garland, TX
|
—
|
|
|
239
|
|
626
|
|
—
|
|
|
—
|
|
|
239
|
|
626
|
|
865
|
|
211
|
|
1994
|
02/94
|
|
40
|
|||||||
|
Copperas Cove, TX
|
—
|
|
|
242
|
|
512
|
|
194
|
|
|
—
|
|
|
242
|
|
706
|
|
948
|
|
272
|
|
1972
|
11/98
|
|
40
|
|||||||
|
Marietta, GA
|
—
|
|
|
525
|
|
—
|
|
—
|
|
|
—
|
|
|
525
|
|
(e)
|
|
525
|
|
(e)
|
|
(e)
|
12/14
|
(m)
|
(e)
|
|||||||
|
Don Tello's Tex-Mex Grill:
|
|
|
|
|
|
|||||||||||||||||||||||||||
|
Lithonia, GA
|
—
|
|
|
923
|
|
1,276
|
|
16
|
|
|
—
|
|
|
923
|
|
1,293
|
|
2,216
|
|
241
|
|
2002
|
06/07
|
|
40
|
|||||||
|
Dr. Clean Dry Cleaners:
|
|
|
|
|
|
|||||||||||||||||||||||||||
|
Monticello, NY
|
—
|
|
|
20
|
|
72
|
|
—
|
|
|
—
|
|
|
20
|
|
72
|
|
92
|
|
18
|
|
1996
|
03/05
|
|
40
|
|||||||
|
|
|
|
|
|
|
|||||||||||||||||||||||||||
|
Eagle Tax Center:
|
|
|
|
|
|
|||||||||||||||||||||||||||
|
Hollywood, FL
|
—
|
|
|
203
|
|
46
|
|
19
|
|
|
—
|
|
|
124
|
|
—
|
|
124
|
|
—
|
|
1960
|
12/05
|
|
15
|
|||||||
|
|
|
|
|
|
|
|||||||||||||||||||||||||||
|
Ecotech Institute:
|
|
|
|
|
|
|||||||||||||||||||||||||||
|
Aurora, CO
|
—
|
|
|
5,076
|
|
13,874
|
|
5,663
|
|
|
—
|
|
|
5,041
|
|
19,537
|
|
24,578
|
|
3,292
|
|
1986
|
04/07
|
|
40
|
|||||||
|
Austin, TX
|
—
|
|
|
2,291
|
|
1,770
|
|
4,999
|
|
|
—
|
|
|
2,291
|
|
6,769
|
|
9,060
|
|
460
|
|
1996
|
12/11
|
|
35
|
|||||||
|
|
|
|
|
|
|
|||||||||||||||||||||||||||
|
Empire Buffet:
|
|
|
|
|
|
|||||||||||||||||||||||||||
|
Las Cruces, NM
|
—
|
|
|
947
|
|
—
|
|
2,286
|
|
|
—
|
|
|
947
|
|
2,286
|
|
3,233
|
|
461
|
|
2006
|
01/06
|
(m)
|
40
|
|||||||
|
|
|
|
|
|
|
|||||||||||||||||||||||||||
|
Encore at Crosswoods:
|
|
|
|
|
|
|||||||||||||||||||||||||||
|
Columbus, OH
|
—
|
|
|
1,032
|
|
1,107
|
|
—
|
|
|
—
|
|
|
1,032
|
|
1,107
|
|
2,139
|
|
361
|
|
1998
|
12/01
|
|
40
|
|||||||
|
|
|
|
|
|
|
|||||||||||||||||||||||||||
|
Express Mart:
|
|
|
|
|
|
|||||||||||||||||||||||||||
|
Thomasville, NC
|
—
|
|
|
140
|
|
228
|
|
—
|
|
|
—
|
|
|
140
|
|
228
|
|
368
|
|
5
|
|
1962
|
07/14
|
|
20
|
|||||||
|
|
|
|
|
|
|
|||||||||||||||||||||||||||
|
Express Oil Change:
|
|
|
|
|
|
|||||||||||||||||||||||||||
|
Birmingham, AL
|
—
|
|
|
470
|
|
695
|
|
—
|
|
|
—
|
|
|
470
|
|
695
|
|
1,165
|
|
118
|
|
2008
|
02/08
|
(f)
|
40
|
|||||||
|
Florence, AL
|
—
|
|
|
110
|
|
381
|
|
—
|
|
|
—
|
|
|
110
|
|
381
|
|
491
|
|
87
|
|
1987
|
02/08
|
|
30
|
|||||||
|
Helena, AL
|
—
|
|
|
363
|
|
628
|
|
—
|
|
|
—
|
|
|
363
|
|
628
|
|
991
|
|
108
|
|
1998
|
02/08
|
|
40
|
|||||||
|
Muscle Shoals, AL
|
—
|
|
|
168
|
|
624
|
|
—
|
|
|
—
|
|
|
168
|
|
624
|
|
792
|
|
143
|
|
1985
|
02/08
|
|
30
|
|||||||
|
Opelika, AL
|
—
|
|
|
547
|
|
680
|
|
—
|
|
|
—
|
|
|
547
|
|
680
|
|
1,227
|
|
117
|
|
2006
|
02/08
|
|
40
|
|||||||
|
Cordova, TN
|
—
|
|
|
639
|
|
785
|
|
—
|
|
|
—
|
|
|
639
|
|
785
|
|
1,424
|
|
119
|
|
2000
|
12/08
|
|
40
|
|||||||
|
Horn Lake, MS
|
—
|
|
|
326
|
|
611
|
|
—
|
|
|
—
|
|
|
326
|
|
611
|
|
937
|
|
105
|
|
1998
|
12/08
|
|
35
|
|||||||
|
Lakeland, TN
|
—
|
|
|
186
|
|
489
|
|
—
|
|
|
—
|
|
|
186
|
|
489
|
|
675
|
|
74
|
|
2000
|
12/08
|
|
40
|
|||||||
|
Memphis, TN
|
—
|
|
|
402
|
|
721
|
|
—
|
|
|
—
|
|
|
402
|
|
721
|
|
1,123
|
|
109
|
|
2001
|
12/08
|
|
40
|
|||||||
|
Houston, TX
|
—
|
|
|
651
|
|
—
|
|
648
|
|
|
—
|
|
|
543
|
|
648
|
|
1,191
|
|
40
|
|
2012
|
02/12
|
(m)
|
40
|
|||||||
|
Katy, TX
|
—
|
|
|
539
|
|
—
|
|
830
|
|
|
—
|
|
|
539
|
|
829
|
|
1,368
|
|
42
|
|
2012
|
07/12
|
(m)
|
40
|
|||||||
See accompanying report of independent registered public accounting firm.
F-19
|
Initial Cost to
Company
|
Costs Capitalized
Subsequent to
Acquisition
|
Gross Amount at Which
Carried at Close of Period (a) (b)
|
Life on Which
Depreciation &
Amortization in Latest Income
Statement is
Computed (Years)
|
|||||||||||||||||||||||||||||
|
Encumbrances
|
Land
|
Building,
Improvements &
Leasehold
Interests
|
Improvements
|
Carrying
Costs
|
Land
|
Building,
Improvements &
Leasehold
Interests
|
Total
|
Accumulated
Depreciation
and
Amortization
|
Date of
Construction
|
Date
Acquired
|
||||||||||||||||||||||
|
Real Estate Held for Investment the Company has Invested in Under Operating Leases:
|
||||||||||||||||||||||||||||||||
|
Chattanooga, TN
|
—
|
|
|
224
|
|
173
|
|
—
|
|
|
—
|
|
|
224
|
|
173
|
|
397
|
|
13
|
|
2001
|
10/12
|
|
30
|
|||||||
|
Chattanooga, TN
|
—
|
|
|
239
|
|
1,214
|
|
—
|
|
|
—
|
|
|
239
|
|
1,214
|
|
1,453
|
|
89
|
|
1998
|
10/12
|
|
30
|
|||||||
|
Chattanooga, TN
|
—
|
|
|
238
|
|
1,756
|
|
—
|
|
|
—
|
|
|
238
|
|
1,756
|
|
1,994
|
|
129
|
|
1998
|
10/12
|
|
30
|
|||||||
|
Cleveland, TN
|
—
|
|
|
318
|
|
1,064
|
|
—
|
|
|
—
|
|
|
318
|
|
1,064
|
|
1,382
|
|
67
|
|
2004
|
10/12
|
|
35
|
|||||||
|
Fort Oglethorpe, GA
|
—
|
|
|
241
|
|
331
|
|
—
|
|
|
—
|
|
|
241
|
|
331
|
|
572
|
|
21
|
|
2003
|
10/12
|
|
35
|
|||||||
|
Marietta, GA
|
—
|
|
|
618
|
|
30
|
|
—
|
|
|
—
|
|
|
618
|
|
30
|
|
648
|
|
2
|
|
1988
|
12/12
|
|
30
|
|||||||
|
Smyrna, GA
|
—
|
|
|
295
|
|
1,092
|
|
—
|
|
|
—
|
|
|
295
|
|
1,092
|
|
1,387
|
|
89
|
|
1984
|
12/12
|
|
25
|
|||||||
|
Missouri City, TX
|
—
|
|
|
606
|
|
—
|
|
860
|
|
|
—
|
|
|
606
|
|
860
|
|
1,466
|
|
12
|
|
2014
|
01/14
|
(m)
|
40
|
|||||||
|
Houston, TX
|
—
|
|
|
550
|
|
—
|
|
—
|
|
|
—
|
|
|
550
|
|
(e)
|
|
550
|
|
(e)
|
|
(e)
|
05/14
|
(m)
|
(e)
|
|||||||
|
|
|
|
|
|
|
|||||||||||||||||||||||||||
|
Fallas Paredes:
|
|
|
|
|
|
|||||||||||||||||||||||||||
|
Arlington, TX
|
—
|
|
|
318
|
|
1,680
|
|
242
|
|
|
—
|
|
|
318
|
|
1,923
|
|
2,241
|
|
1,302
|
|
1996
|
06/96
|
|
38
|
|||||||
|
|
|
|
|
|
|
|||||||||||||||||||||||||||
|
Family Dollar:
|
|
|
|
|
|
|||||||||||||||||||||||||||
|
Albany, NY
|
—
|
|
|
34
|
|
824
|
|
—
|
|
|
—
|
|
|
34
|
|
824
|
|
858
|
|
212
|
|
1992
|
09/04
|
|
40
|
|||||||
|
Cohoes, NY
|
—
|
|
|
140
|
|
753
|
|
49
|
|
|
—
|
|
|
140
|
|
802
|
|
942
|
|
219
|
|
1994
|
09/04
|
|
40
|
|||||||
|
Hudson Falls, NY
|
—
|
|
|
51
|
|
380
|
|
625
|
|
|
—
|
|
|
187
|
|
869
|
|
1,056
|
|
112
|
|
1993
|
09/04
|
|
40
|
|||||||
|
Monticello, NY
|
—
|
|
|
96
|
|
352
|
|
—
|
|
|
—
|
|
|
96
|
|
352
|
|
448
|
|
86
|
|
1996
|
03/05
|
|
40
|
|||||||
|
Richmond, TX
|
—
|
|
|
366
|
|
1,059
|
|
—
|
|
|
—
|
|
|
366
|
|
1,059
|
|
1,425
|
|
26
|
|
2012
|
02/14
|
|
35
|
|||||||
|
Spring, TX
|
—
|
|
|
199
|
|
1,152
|
|
—
|
|
|
—
|
|
|
199
|
|
1,152
|
|
1,351
|
|
29
|
|
2012
|
02/14
|
|
35
|
|||||||
|
Bartlesville, OK
|
—
|
|
|
110
|
|
445
|
|
—
|
|
|
—
|
|
|
110
|
|
445
|
|
555
|
|
8
|
|
2001
|
07/14
|
|
25
|
|||||||
|
Huntsville, AL
|
—
|
|
|
141
|
|
596
|
|
—
|
|
|
—
|
|
|
141
|
|
596
|
|
737
|
|
9
|
|
2005
|
07/14
|
|
30
|
|||||||
|
Tulsa, OK
|
—
|
|
|
70
|
|
519
|
|
—
|
|
|
—
|
|
|
70
|
|
519
|
|
589
|
|
10
|
|
2001
|
07/14
|
|
25
|
|||||||
|
|
|
|
|
|
|
|||||||||||||||||||||||||||
|
Famous Footwear:
|
|
|
|
|
|
|||||||||||||||||||||||||||
|
Lapeer, MI
|
—
|
|
|
163
|
|
835
|
|
—
|
|
|
—
|
|
|
163
|
|
812
|
|
975
|
|
150
|
|
2007
|
10/05
|
|
40
|
|||||||
|
|
|
|
|
|
|
|||||||||||||||||||||||||||
|
Fantastic Sams:
|
|
|
|
|
|
|||||||||||||||||||||||||||
|
Eden Prairie, MN
|
—
|
|
|
65
|
|
181
|
|
81
|
|
|
—
|
|
|
65
|
|
261
|
|
326
|
|
83
|
|
1997
|
12/01
|
|
40
|
|||||||
|
|
|
|
|
|
|
|||||||||||||||||||||||||||
|
Ferguson:
|
|
|
|
|
|
|||||||||||||||||||||||||||
|
Destin, FL
|
—
|
|
|
554
|
|
1,012
|
|
253
|
|
|
—
|
|
|
554
|
|
1,265
|
|
1,819
|
|
238
|
|
2006
|
03/07
|
|
40
|
|||||||
|
Union City, GA
|
—
|
|
|
144
|
|
1,260
|
|
—
|
|
|
—
|
|
|
144
|
|
1,260
|
|
1,404
|
|
131
|
|
2010
|
05/11
|
|
35
|
|||||||
|
|
|
|
|
|
|
|||||||||||||||||||||||||||
See accompanying report of independent registered public accounting firm.
F-20
|
Initial Cost to
Company
|
Costs Capitalized
Subsequent to
Acquisition
|
Gross Amount at Which
Carried at Close of Period (a) (b)
|
Life on Which
Depreciation &
Amortization in Latest Income
Statement is
Computed (Years)
|
|||||||||||||||||||||||||||||
|
Encumbrances
|
Land
|
Building,
Improvements &
Leasehold
Interests
|
Improvements
|
Carrying
Costs
|
Land
|
Building,
Improvements &
Leasehold
Interests
|
Total
|
Accumulated
Depreciation
and
Amortization
|
Date of
Construction
|
Date
Acquired
|
||||||||||||||||||||||
|
Real Estate Held for Investment the Company has Invested in Under Operating Leases:
|
||||||||||||||||||||||||||||||||
|
Fikes Wholesale:
|
|
|
|
|
|
|||||||||||||||||||||||||||
|
Belton, TX
|
—
|
|
|
722
|
|
1,814
|
|
—
|
|
|
—
|
|
|
722
|
|
1,814
|
|
2,536
|
|
175
|
|
2007
|
08/11
|
|
35
|
|||||||
|
Godley, TX
|
—
|
|
|
1,453
|
|
2,084
|
|
—
|
|
|
—
|
|
|
1,453
|
|
2,084
|
|
3,537
|
|
201
|
|
2008
|
08/11
|
|
35
|
|||||||
|
Killeen, TX
|
—
|
|
|
1,302
|
|
2,514
|
|
—
|
|
|
—
|
|
|
1,302
|
|
2,514
|
|
3,816
|
|
242
|
|
2008
|
08/11
|
|
35
|
|||||||
|
Killeen, TX
|
—
|
|
|
1,053
|
|
833
|
|
—
|
|
|
—
|
|
|
1,053
|
|
833
|
|
1,886
|
|
80
|
|
2007
|
08/11
|
|
35
|
|||||||
|
McGregor, TX
|
—
|
|
|
511
|
|
1,484
|
|
—
|
|
|
—
|
|
|
511
|
|
1,484
|
|
1,995
|
|
143
|
|
2006
|
08/11
|
|
35
|
|||||||
|
Thorndale, TX
|
—
|
|
|
331
|
|
984
|
|
—
|
|
|
—
|
|
|
331
|
|
984
|
|
1,315
|
|
95
|
|
2007
|
08/11
|
|
35
|
|||||||
|
Valley Mills, TX
|
—
|
|
|
711
|
|
2,114
|
|
—
|
|
|
—
|
|
|
711
|
|
2,114
|
|
2,825
|
|
204
|
|
2006
|
08/11
|
|
35
|
|||||||
|
West, TX
|
—
|
|
|
402
|
|
864
|
|
—
|
|
|
—
|
|
|
402
|
|
864
|
|
1,266
|
|
97
|
|
1999
|
08/11
|
|
30
|
|||||||
|
Gladewater, TX
|
—
|
|
|
145
|
|
2,107
|
|
—
|
|
|
—
|
|
|
145
|
|
2,107
|
|
2,252
|
|
18
|
|
2007
|
09/14
|
|
35
|
|||||||
|
Hearne, TX
|
—
|
|
|
68
|
|
2,184
|
|
—
|
|
|
—
|
|
|
68
|
|
2,184
|
|
2,252
|
|
21
|
|
1996
|
09/14
|
|
30
|
|||||||
|
Jarrell, TX
|
—
|
|
|
541
|
|
2,965
|
|
—
|
|
|
—
|
|
|
541
|
|
2,965
|
|
3,506
|
|
25
|
|
2009
|
09/14
|
|
35
|
|||||||
|
Killeen, TX
|
—
|
|
|
628
|
|
2,878
|
|
—
|
|
|
—
|
|
|
628
|
|
2,878
|
|
3,506
|
|
24
|
|
2013
|
09/14
|
|
35
|
|||||||
|
Liberty Hill, TX
|
—
|
|
|
203
|
|
3,303
|
|
—
|
|
|
—
|
|
|
203
|
|
3,303
|
|
3,506
|
|
28
|
|
2013
|
09/14
|
|
35
|
|||||||
|
Rosebud, TX
|
—
|
|
|
58
|
|
1,847
|
|
—
|
|
|
—
|
|
|
58
|
|
1,847
|
|
1,905
|
|
15
|
|
2012
|
09/14
|
|
35
|
|||||||
|
Temple, TX (n)
|
—
|
|
|
1,052
|
|
3,302
|
|
—
|
|
|
—
|
|
|
1,052
|
|
3,302
|
|
4,354
|
|
28
|
|
2012
|
09/14
|
|
35
|
|||||||
|
Waco, TX
|
—
|
|
|
1,400
|
|
2,106
|
|
—
|
|
|
—
|
|
|
1,400
|
|
2,106
|
|
3,506
|
|
20
|
|
1997
|
09/14
|
|
30
|
|||||||
|
|
|
|
|
|
|
|||||||||||||||||||||||||||
|
First Cash Pawn:
|
|
|
|
|
|
|||||||||||||||||||||||||||
|
Alice, TX
|
—
|
|
|
318
|
|
578
|
|
—
|
|
|
—
|
|
|
318
|
|
578
|
|
896
|
|
189
|
|
1995
|
12/01
|
|
40
|
|||||||
|
|
|
|
|
|
|
|||||||||||||||||||||||||||
|
Five Below:
|
|
|
|
|
|
|||||||||||||||||||||||||||
|
Florissant, MO
|
—
|
|
|
249
|
|
294
|
|
849
|
|
|
—
|
|
|
250
|
|
1,142
|
|
1,392
|
|
141
|
|
1996
|
04/03
|
(g)
|
40
|
|||||||
|
|
|
|
|
|
|
|||||||||||||||||||||||||||
|
Five Guys Burgers and Fries:
|
|
|
|
|
|
|||||||||||||||||||||||||||
|
Middleburg Heights, OH
|
—
|
|
|
497
|
|
260
|
|
250
|
|
|
—
|
|
|
497
|
|
510
|
|
1,007
|
|
137
|
|
1976
|
09/06
|
|
20
|
|||||||
|
|
|
|
|
|
|
|||||||||||||||||||||||||||
|
Flash Markets:
|
|
|
|
|
|
|||||||||||||||||||||||||||
|
Lebanon, TN
|
—
|
|
|
582
|
|
—
|
|
2,063
|
|
|
—
|
|
|
582
|
|
2,063
|
|
2,645
|
|
355
|
|
2007
|
03/07
|
(m)
|
40
|
|||||||
|
|
|
|
|
|
|
|||||||||||||||||||||||||||
|
Fleming's:
|
|
|
|
|
|
|||||||||||||||||||||||||||
|
Akron, OH
|
—
|
|
|
475
|
|
3,140
|
|
—
|
|
|
—
|
|
|
475
|
|
3,140
|
|
3,615
|
|
250
|
|
2005
|
03/12
|
|
35
|
|||||||
|
|
|
|
|
|
|
|||||||||||||||||||||||||||
See accompanying report of independent registered public accounting firm.
F-21
|
Initial Cost to
Company
|
Costs Capitalized
Subsequent to
Acquisition
|
Gross Amount at Which
Carried at Close of Period (a) (b)
|
Life on Which
Depreciation &
Amortization in Latest Income
Statement is
Computed (Years)
|
|||||||||||||||||||||||||||||
|
Encumbrances
|
Land
|
Building,
Improvements &
Leasehold
Interests
|
Improvements
|
Carrying
Costs
|
Land
|
Building,
Improvements &
Leasehold
Interests
|
Total
|
Accumulated
Depreciation
and
Amortization
|
Date of
Construction
|
Date
Acquired
|
||||||||||||||||||||||
|
Real Estate Held for Investment the Company has Invested in Under Operating Leases:
|
||||||||||||||||||||||||||||||||
|
Food 4 Less:
|
|
|
|
|
|
|||||||||||||||||||||||||||
|
Chula Vista, CA
|
—
|
|
|
3,569
|
|
—
|
|
—
|
|
|
—
|
|
|
3,569
|
|
(c)
|
|
3,569
|
|
(c)
|
|
1995
|
11/98
|
|
(c)
|
|||||||
|
|
|
|
|
|
|
|||||||||||||||||||||||||||
|
Food Fast:
|
|
|
|
|
|
|||||||||||||||||||||||||||
|
Bossier City, LA
|
—
|
|
|
883
|
|
658
|
|
—
|
|
|
—
|
|
|
883
|
|
658
|
|
1,541
|
|
331
|
|
1975
|
06/07
|
|
15
|
|||||||
|
Brownsboro, TX
|
—
|
|
|
328
|
|
385
|
|
—
|
|
|
—
|
|
|
328
|
|
385
|
|
713
|
|
97
|
|
1990
|
06/07
|
|
30
|
|||||||
|
Flint, TX
|
—
|
|
|
272
|
|
411
|
|
—
|
|
|
—
|
|
|
272
|
|
411
|
|
683
|
|
124
|
|
1985
|
06/07
|
|
25
|
|||||||
|
Forney, TX
|
—
|
|
|
545
|
|
707
|
|
—
|
|
|
—
|
|
|
545
|
|
707
|
|
1,252
|
|
178
|
|
1989
|
06/07
|
|
30
|
|||||||
|
Forney, TX
|
—
|
|
|
473
|
|
654
|
|
—
|
|
|
—
|
|
|
473
|
|
654
|
|
1,127
|
|
164
|
|
1990
|
06/07
|
|
30
|
|||||||
|
Gun Barrel City, TX
|
—
|
|
|
242
|
|
467
|
|
—
|
|
|
—
|
|
|
242
|
|
467
|
|
709
|
|
141
|
|
1988
|
06/07
|
|
25
|
|||||||
|
Gun Barrel City, TX
|
—
|
|
|
270
|
|
386
|
|
—
|
|
|
—
|
|
|
270
|
|
386
|
|
656
|
|
117
|
|
1986
|
06/07
|
|
25
|
|||||||
|
Jacksonville, TX
|
—
|
|
|
660
|
|
632
|
|
—
|
|
|
—
|
|
|
660
|
|
632
|
|
1,292
|
|
318
|
|
1976
|
06/07
|
|
15
|
|||||||
|
Kemp, TX
|
—
|
|
|
581
|
|
505
|
|
—
|
|
|
—
|
|
|
581
|
|
505
|
|
1,086
|
|
152
|
|
1986
|
06/07
|
|
25
|
|||||||
|
Longview, TX
|
—
|
|
|
252
|
|
304
|
|
—
|
|
|
—
|
|
|
252
|
|
304
|
|
556
|
|
92
|
|
1983
|
06/07
|
|
25
|
|||||||
|
Longview, TX
|
—
|
|
|
403
|
|
572
|
|
—
|
|
|
—
|
|
|
403
|
|
572
|
|
975
|
|
173
|
|
1985
|
06/07
|
|
25
|
|||||||
|
Longview, TX
|
—
|
|
|
271
|
|
431
|
|
—
|
|
|
—
|
|
|
271
|
|
431
|
|
702
|
|
108
|
|
1990
|
06/07
|
|
30
|
|||||||
|
Longview, TX
|
—
|
|
|
426
|
|
382
|
|
—
|
|
|
—
|
|
|
426
|
|
382
|
|
808
|
|
115
|
|
1984
|
06/07
|
|
25
|
|||||||
|
Longview, TX
|
—
|
|
|
360
|
|
535
|
|
—
|
|
|
—
|
|
|
360
|
|
535
|
|
895
|
|
161
|
|
1983
|
06/07
|
|
25
|
|||||||
|
Mabank, TX
|
—
|
|
|
229
|
|
494
|
|
—
|
|
|
—
|
|
|
229
|
|
494
|
|
723
|
|
149
|
|
1986
|
06/07
|
|
25
|
|||||||
|
Mt. Vernon, TX
|
—
|
|
|
292
|
|
666
|
|
2,800
|
|
|
—
|
|
|
292
|
|
2,800
|
|
3,092
|
|
120
|
|
2013
|
06/07
|
(m)
|
40
|
|||||||
|
Tyler, TX
|
—
|
|
|
542
|
|
403
|
|
—
|
|
|
—
|
|
|
481
|
|
403
|
|
884
|
|
122
|
|
1984
|
06/07
|
|
25
|
|||||||
|
Tyler, TX
|
—
|
|
|
316
|
|
545
|
|
—
|
|
|
—
|
|
|
316
|
|
545
|
|
861
|
|
137
|
|
1989
|
06/07
|
|
30
|
|||||||
|
Tyler, TX
|
—
|
|
|
323
|
|
283
|
|
—
|
|
|
—
|
|
|
323
|
|
283
|
|
606
|
|
107
|
|
1978
|
06/07
|
|
20
|
|||||||
|
Tyler, TX
|
—
|
|
|
488
|
|
831
|
|
—
|
|
|
—
|
|
|
488
|
|
831
|
|
1,319
|
|
313
|
|
1980
|
06/07
|
|
20
|
|||||||
|
Tyler, TX
|
—
|
|
|
188
|
|
329
|
|
—
|
|
|
—
|
|
|
188
|
|
329
|
|
517
|
|
99
|
|
1984
|
06/07
|
|
25
|
|||||||
|
Tyler, TX
|
—
|
|
|
742
|
|
546
|
|
—
|
|
|
—
|
|
|
742
|
|
546
|
|
1,288
|
|
165
|
|
1985
|
06/07
|
|
25
|
|||||||
|
|
|
|
|
|
|
|||||||||||||||||||||||||||
|
Fort Ticonderoga:
|
|
|
|
|
|
|||||||||||||||||||||||||||
|
Ticonderoga, NY
|
—
|
|
|
89
|
|
689
|
|
60
|
|
|
—
|
|
|
89
|
|
749
|
|
838
|
|
183
|
|
1993
|
09/04
|
|
40
|
|||||||
|
|
|
|
|
|
|
|||||||||||||||||||||||||||
|
Fresenius Medical Care:
|
|
|
|
|
|
|||||||||||||||||||||||||||
|
Houston, TX
|
—
|
|
|
422
|
|
1,915
|
|
518
|
|
|
—
|
|
|
422
|
|
2,434
|
|
2,856
|
|
500
|
|
1995
|
08/06
|
|
40
|
|||||||
|
Rockford, MI
|
—
|
|
|
226
|
|
1,404
|
|
—
|
|
|
—
|
|
|
226
|
|
1,404
|
|
1,630
|
|
21
|
|
2002
|
07/14
|
|
30
|
|||||||
See accompanying report of independent registered public accounting firm.
F-22
|
Initial Cost to
Company
|
Costs Capitalized
Subsequent to
Acquisition
|
Gross Amount at Which
Carried at Close of Period (a) (b)
|
Life on Which
Depreciation &
Amortization in Latest Income
Statement is
Computed (Years)
|
|||||||||||||||||||||||||||||
|
Encumbrances
|
Land
|
Building,
Improvements &
Leasehold
Interests
|
Improvements
|
Carrying
Costs
|
Land
|
Building,
Improvements &
Leasehold
Interests
|
Total
|
Accumulated
Depreciation
and
Amortization
|
Date of
Construction
|
Date
Acquired
|
||||||||||||||||||||||
|
Real Estate Held for Investment the Company has Invested in Under Operating Leases:
|
||||||||||||||||||||||||||||||||
|
Fresh Market:
|
|
|
|
|
|
|||||||||||||||||||||||||||
|
Gainesville, FL
|
—
|
|
|
317
|
|
1,248
|
|
656
|
|
|
—
|
|
|
317
|
|
1,904
|
|
2,221
|
|
478
|
|
1982
|
03/99
|
|
40
|
|||||||
|
|
|
|
|
|
|
|||||||||||||||||||||||||||
|
Fuel Up:
|
|
|
|
|
|
|||||||||||||||||||||||||||
|
Chambersburg, PA
|
—
|
|
|
76
|
|
197
|
|
—
|
|
|
—
|
|
|
76
|
|
197
|
|
273
|
|
92
|
|
1990
|
08/05
|
|
20
|
|||||||
|
|
|
|
|
|
|
|||||||||||||||||||||||||||
|
Fuel-On:
|
|
|
|
|
|
|||||||||||||||||||||||||||
|
Bloomsburg, PA
|
—
|
|
|
541
|
|
146
|
|
—
|
|
|
—
|
|
|
541
|
|
146
|
|
687
|
|
68
|
|
1967
|
08/05
|
|
20
|
|||||||
|
Dallas, PA
|
—
|
|
|
677
|
|
1,091
|
|
—
|
|
|
—
|
|
|
677
|
|
1,091
|
|
1,768
|
|
511
|
|
1995
|
08/05
|
|
20
|
|||||||
|
Emporium, PA
|
—
|
|
|
380
|
|
569
|
|
—
|
|
|
—
|
|
|
380
|
|
569
|
|
949
|
|
267
|
|
1996
|
08/05
|
|
20
|
|||||||
|
Hazleton, PA
|
—
|
|
|
2,529
|
|
728
|
|
—
|
|
|
—
|
|
|
2,529
|
|
728
|
|
3,257
|
|
341
|
|
2001
|
08/05
|
|
20
|
|||||||
|
Johnsonburg, PA
|
—
|
|
|
781
|
|
504
|
|
—
|
|
|
—
|
|
|
781
|
|
504
|
|
1,285
|
|
236
|
|
1978
|
08/05
|
|
20
|
|||||||
|
Kane, PA
|
—
|
|
|
478
|
|
592
|
|
—
|
|
|
—
|
|
|
356
|
|
—
|
|
356
|
|
—
|
|
1984
|
08/05
|
|
20
|
|||||||
|
Luzerne, PA
|
—
|
|
|
171
|
|
415
|
|
—
|
|
|
—
|
|
|
171
|
|
415
|
|
586
|
|
195
|
|
1989
|
08/05
|
|
20
|
|||||||
|
Ridgway, PA
|
—
|
|
|
382
|
|
259
|
|
—
|
|
|
—
|
|
|
382
|
|
259
|
|
641
|
|
121
|
|
1975
|
08/05
|
|
20
|
|||||||
|
St. Mary's, PA
|
—
|
|
|
274
|
|
261
|
|
—
|
|
|
—
|
|
|
274
|
|
261
|
|
535
|
|
122
|
|
1979
|
08/05
|
|
20
|
|||||||
|
White Haven, PA (n)
|
—
|
|
|
486
|
|
867
|
|
—
|
|
|
—
|
|
|
486
|
|
867
|
|
1,353
|
|
406
|
|
1990
|
08/05
|
|
20
|
|||||||
|
Carlisle, PA
|
—
|
|
|
170
|
|
202
|
|
—
|
|
|
—
|
|
|
170
|
|
202
|
|
372
|
|
48
|
|
1988
|
01/06
|
|
40
|
|||||||
|
Danville, PA
|
—
|
|
|
180
|
|
359
|
|
—
|
|
|
—
|
|
|
180
|
|
359
|
|
539
|
|
80
|
|
1988
|
01/06
|
|
40
|
|||||||
|
Houtzdale, PA
|
—
|
|
|
541
|
|
500
|
|
—
|
|
|
—
|
|
|
356
|
|
—
|
|
356
|
|
—
|
|
1977
|
01/06
|
|
15
|
|||||||
|
Minersville, PA
|
—
|
|
|
680
|
|
582
|
|
—
|
|
|
—
|
|
|
680
|
|
582
|
|
1,262
|
|
130
|
|
1974
|
01/06
|
|
40
|
|||||||
|
Pittsburgh, PA
|
—
|
|
|
905
|
|
1,346
|
|
—
|
|
|
—
|
|
|
905
|
|
1,346
|
|
2,251
|
|
301
|
|
1967
|
01/06
|
|
40
|
|||||||
|
Zelienople, PA
|
—
|
|
|
160
|
|
437
|
|
—
|
|
|
—
|
|
|
160
|
|
437
|
|
597
|
|
98
|
|
1988
|
01/06
|
|
40
|
|||||||
|
|
|
|
|
|
|
|||||||||||||||||||||||||||
|
Furr's Family Dining:
|
|
|
|
|
|
|||||||||||||||||||||||||||
|
Moore, OK
|
—
|
|
|
939
|
|
—
|
|
2,429
|
|
|
—
|
|
|
939
|
|
2,429
|
|
3,368
|
|
438
|
|
2007
|
03/07
|
(m)
|
40
|
|||||||
|
Arlington, TX
|
—
|
|
|
1,061
|
|
—
|
|
1,594
|
|
|
—
|
|
|
1,061
|
|
1,594
|
|
2,655
|
|
168
|
|
2010
|
04/10
|
(m)
|
40
|
|||||||
|
McAllen, TX
|
—
|
|
|
520
|
|
1,700
|
|
—
|
|
|
—
|
|
|
520
|
|
1,700
|
|
2,220
|
|
172
|
|
2004
|
12/11
|
|
30
|
|||||||
|
|
|
|
|
|
|
|||||||||||||||||||||||||||
|
Gander Mountain:
|
|
|
|
|
|
|||||||||||||||||||||||||||
|
Florence, AL
|
—
|
|
|
1,034
|
|
—
|
|
4,315
|
|
|
—
|
|
|
851
|
|
4,315
|
|
5,166
|
|
247
|
|
2012
|
06/04
|
(m)
|
40
|
|||||||
|
Amarillo, TX
|
—
|
|
|
1,514
|
|
5,781
|
|
—
|
|
|
—
|
|
|
1,514
|
|
5,781
|
|
7,295
|
|
1,463
|
|
2004
|
11/04
|
|
40
|
|||||||
|
DeForest, WI
|
—
|
|
|
2,798
|
|
10,953
|
|
2,500
|
|
|
—
|
|
|
2,787
|
|
13,413
|
|
16,200
|
|
1,534
|
|
2008
|
09/10
|
|
35
|
|||||||
See accompanying report of independent registered public accounting firm.
F-23
|
Initial Cost to
Company
|
Costs Capitalized
Subsequent to
Acquisition
|
Gross Amount at Which
Carried at Close of Period (a) (b)
|
Life on Which
Depreciation &
Amortization in Latest Income
Statement is
Computed (Years)
|
|||||||||||||||||||||||||||||
|
Encumbrances
|
Land
|
Building,
Improvements &
Leasehold
Interests
|
Improvements
|
Carrying
Costs
|
Land
|
Building,
Improvements &
Leasehold
Interests
|
Total
|
Accumulated
Depreciation
and
Amortization
|
Date of
Construction
|
Date
Acquired
|
||||||||||||||||||||||
|
Real Estate Held for Investment the Company has Invested in Under Operating Leases:
|
||||||||||||||||||||||||||||||||
|
Springfield, IL
|
—
|
|
|
1,717
|
|
7,622
|
|
—
|
|
|
—
|
|
|
1,717
|
|
7,622
|
|
9,339
|
|
935
|
|
2009
|
09/10
|
|
35
|
|||||||
|
Onalaska, WI
|
—
|
|
|
1,963
|
|
—
|
|
6,817
|
|
|
—
|
|
|
1,733
|
|
6,817
|
|
8,550
|
|
632
|
|
2011
|
10/10
|
(m)
|
40
|
|||||||
|
Ocala, FL
|
—
|
|
|
3,315
|
|
8,908
|
|
—
|
|
|
—
|
|
|
3,315
|
|
8,908
|
|
12,223
|
|
1,071
|
|
2008
|
10/10
|
|
35
|
|||||||
|
Bowling Green, KY
|
—
|
|
|
1,777
|
|
7,319
|
|
—
|
|
|
—
|
|
|
1,777
|
|
7,319
|
|
9,096
|
|
723
|
|
2007
|
07/11
|
|
35
|
|||||||
|
Eau Claire, WI
|
—
|
|
|
2,263
|
|
8,418
|
|
—
|
|
|
—
|
|
|
2,263
|
|
8,418
|
|
10,681
|
|
832
|
|
2008
|
07/11
|
|
35
|
|||||||
|
Roanoke, VA
|
—
|
|
|
1,769
|
|
8,120
|
|
—
|
|
|
—
|
|
|
1,769
|
|
8,120
|
|
9,889
|
|
802
|
|
2008
|
07/11
|
|
35
|
|||||||
|
Greenfield, IN
|
—
|
|
|
878
|
|
—
|
|
6,166
|
|
|
—
|
|
|
878
|
|
6,166
|
|
7,044
|
|
96
|
|
2014
|
12/13
|
(m)
|
40
|
|||||||
|
|
|
|
|
|
|
|||||||||||||||||||||||||||
|
Gate Petroleum:
|
|
|
|
|
|
|||||||||||||||||||||||||||
|
Concord, NC
|
—
|
|
|
852
|
|
1,201
|
|
—
|
|
|
—
|
|
|
852
|
|
1,201
|
|
2,053
|
|
286
|
|
2001
|
06/05
|
|
40
|
|||||||
|
Rocky Mount, NC
|
—
|
|
|
259
|
|
1,164
|
|
—
|
|
|
—
|
|
|
259
|
|
1,164
|
|
1,423
|
|
278
|
|
2000
|
06/05
|
|
40
|
|||||||
|
|
|
|
|
|
|
|||||||||||||||||||||||||||
|
Gerber Collision:
|
|
|
|
|
|
|||||||||||||||||||||||||||
|
Garner, NC
|
—
|
|
|
352
|
|
1,056
|
|
—
|
|
|
—
|
|
|
352
|
|
1,056
|
|
1,408
|
|
95
|
|
1972
|
03/13
|
|
20
|
|||||||
|
Estero, FL
|
—
|
|
|
839
|
|
—
|
|
—
|
|
|
—
|
|
|
839
|
|
(e)
|
|
839
|
|
(e)
|
|
(e)
|
10/14
|
(m)
|
(e)
|
|||||||
|
Woodstock, GA
|
—
|
|
|
328
|
|
1,291
|
|
—
|
|
|
—
|
|
|
328
|
|
1,291
|
|
1,619
|
|
5
|
|
1990
|
11/14
|
|
30
|
|||||||
|
Roswell, GA
|
—
|
|
|
958
|
|
—
|
|
—
|
|
|
—
|
|
|
958
|
|
(e)
|
|
958
|
|
(e)
|
|
(e)
|
12/14
|
(m)
|
(e)
|
|||||||
|
|
|
|
|
|
|
|||||||||||||||||||||||||||
|
Golden Corral:
|
|
|
|
|
|
|||||||||||||||||||||||||||
|
Lake Placid, FL
|
—
|
|
|
115
|
|
305
|
|
54
|
|
|
—
|
|
|
115
|
|
359
|
|
474
|
|
297
|
|
1985
|
05/85
|
|
35
|
|||||||
|
Tampa, FL
|
—
|
|
|
1,188
|
|
1,339
|
|
—
|
|
|
—
|
|
|
1,188
|
|
1,339
|
|
2,527
|
|
437
|
|
1998
|
12/01
|
|
40
|
|||||||
|
Temple Terrace, FL
|
—
|
|
|
1,330
|
|
1,391
|
|
—
|
|
|
—
|
|
|
1,330
|
|
1,391
|
|
2,721
|
|
453
|
|
1997
|
12/01
|
|
40
|
|||||||
|
|
|
|
|
|
|
|||||||||||||||||||||||||||
|
Goodwill:
|
|
|
|
|
|
|||||||||||||||||||||||||||
|
Sealy, TX
|
—
|
|
|
612
|
|
675
|
|
644
|
|
|
—
|
|
|
612
|
|
1,319
|
|
1,931
|
|
310
|
|
1982
|
03/99
|
|
40
|
|||||||
|
|
|
|
|
|
|
|||||||||||||||||||||||||||
|
Gordmans:
|
|
|
|
|
|
|||||||||||||||||||||||||||
|
Avon, IN
|
—
|
|
|
1,302
|
|
—
|
|
4,178
|
|
|
—
|
|
|
1,302
|
|
4,178
|
|
5,480
|
|
257
|
|
2012
|
12/11
|
(m)
|
40
|
|||||||
|
Wyoming, MI
|
—
|
|
|
1,322
|
|
—
|
|
4,505
|
|
|
—
|
|
|
1,322
|
|
4,505
|
|
5,827
|
|
(q)
|
|
2014
|
10/13
|
(m)
|
(q)
|
|||||||
|
Saginaw, MI
|
—
|
|
|
763
|
|
—
|
|
4,082
|
|
|
—
|
|
|
763
|
|
4,082
|
|
4,845
|
|
(q)
|
|
2014
|
02/14
|
(m)
|
(q)
|
|||||||
|
|
|
|
|
|
|
|||||||||||||||||||||||||||
|
Great Clips:
|
|
|
|
|
|
|||||||||||||||||||||||||||
|
Swansea, IL
|
—
|
|
|
46
|
|
132
|
|
157
|
|
|
—
|
|
|
46
|
|
290
|
|
336
|
|
30
|
|
1997
|
12/01
|
(g)
|
40
|
|||||||
See accompanying report of independent registered public accounting firm.
F-24
|
Initial Cost to
Company
|
Costs Capitalized
Subsequent to
Acquisition
|
Gross Amount at Which
Carried at Close of Period (a) (b)
|
Life on Which
Depreciation &
Amortization in Latest Income
Statement is
Computed (Years)
|
|||||||||||||||||||||||||||||
|
Encumbrances
|
Land
|
Building,
Improvements &
Leasehold
Interests
|
Improvements
|
Carrying
Costs
|
Land
|
Building,
Improvements &
Leasehold
Interests
|
Total
|
Accumulated
Depreciation
and
Amortization
|
Date of
Construction
|
Date
Acquired
|
||||||||||||||||||||||
|
Real Estate Held for Investment the Company has Invested in Under Operating Leases:
|
||||||||||||||||||||||||||||||||
|
Lapeer, MI
|
—
|
|
|
27
|
|
194
|
|
—
|
|
|
—
|
|
|
27
|
|
184
|
|
211
|
|
35
|
|
2007
|
10/05
|
|
40
|
|||||||
|
|
|
|
|
|
|
|||||||||||||||||||||||||||
|
Green Light Convenience:
|
|
|
|
|
|
|||||||||||||||||||||||||||
|
Moosic, PA
|
—
|
|
|
323
|
|
309
|
|
—
|
|
|
—
|
|
|
323
|
|
309
|
|
632
|
|
145
|
|
1980
|
08/05
|
|
20
|
|||||||
|
|
|
|
|
|
|
|||||||||||||||||||||||||||
|
Guitar Center:
|
|
|
|
|
|
|||||||||||||||||||||||||||
|
Roseville, MN
|
—
|
|
|
1,599
|
|
1,419
|
|
23
|
|
|
—
|
|
|
1,599
|
|
1,442
|
|
3,041
|
|
322
|
|
1994
|
08/06
|
|
40
|
|||||||
|
|
|
|
|
|
|
|||||||||||||||||||||||||||
|
GymKix:
|
|
|
|
|
|
|||||||||||||||||||||||||||
|
Copperas Cove, TX
|
—
|
|
|
204
|
|
432
|
|
171
|
|
|
—
|
|
|
204
|
|
603
|
|
807
|
|
232
|
|
1972
|
11/98
|
|
40
|
|||||||
|
|
|
|
|
|
|
|||||||||||||||||||||||||||
|
H&R Block:
|
|
|
|
|
|
|||||||||||||||||||||||||||
|
Swansea, IL
|
—
|
|
|
46
|
|
132
|
|
69
|
|
|
—
|
|
|
46
|
|
201
|
|
247
|
|
86
|
|
1997
|
12/01
|
|
40
|
|||||||
|
|
|
|
|
|
|
|||||||||||||||||||||||||||
|
Hancock Fabrics:
|
|
|
|
|
|
|||||||||||||||||||||||||||
|
Buford, GA
|
—
|
|
|
751
|
|
1,979
|
|
329
|
|
|
—
|
|
|
751
|
|
2,308
|
|
3,059
|
|
531
|
|
2003
|
07/04
|
(g)
|
40
|
|||||||
|
|
|
|
|
|
|
|||||||||||||||||||||||||||
|
Harbor Freight Tools:
|
|
|
|
|
|
|||||||||||||||||||||||||||
|
Federal Way, WA
|
—
|
|
|
2,037
|
|
1,662
|
|
438
|
|
|
—
|
|
|
2,037
|
|
2,100
|
|
4,137
|
|
778
|
|
1994
|
06/98
|
|
40
|
|||||||
|
Gastonia, NC
|
—
|
|
|
994
|
|
1,513
|
|
146
|
|
|
—
|
|
|
994
|
|
1,659
|
|
2,653
|
|
394
|
|
2004
|
12/04
|
|
40
|
|||||||
|
Plainfield, IN
|
—
|
|
|
503
|
|
—
|
|
—
|
|
|
—
|
|
|
503
|
|
(e)
|
|
503
|
|
(e)
|
|
(e)
|
12/14
|
(m)
|
(e)
|
|||||||
|
|
|
|
|
|
|
|||||||||||||||||||||||||||
|
Harvey's Bar & Grill:
|
|
|
|
|
|
|||||||||||||||||||||||||||
|
Bay City, MI
|
—
|
|
|
647
|
|
634
|
|
—
|
|
|
—
|
|
|
647
|
|
634
|
|
1,281
|
|
207
|
|
1997
|
12/01
|
|
40
|
|||||||
|
|
|
|
|
|
|
|||||||||||||||||||||||||||
|
Hastings:
|
|
|
|
|
|
|||||||||||||||||||||||||||
|
Nacogdoches, TX
|
—
|
|
|
397
|
|
1,257
|
|
—
|
|
|
—
|
|
|
397
|
|
1,257
|
|
1,654
|
|
507
|
|
1997
|
11/98
|
|
40
|
|||||||
|
|
|
|
|
|
|
|||||||||||||||||||||||||||
|
Havertys Furniture:
|
|
|
|
|
|
|||||||||||||||||||||||||||
|
Pensacola, FL
|
—
|
|
|
633
|
|
1,595
|
|
66
|
|
|
—
|
|
|
603
|
|
1,661
|
|
2,264
|
|
742
|
|
1994
|
06/96
|
|
40
|
|||||||
|
Bowie, MD
|
—
|
|
|
1,966
|
|
4,221
|
|
—
|
|
|
—
|
|
|
1,966
|
|
4,221
|
|
6,187
|
|
1,695
|
|
1997
|
12/97
|
|
39
|
|||||||
See accompanying report of independent registered public accounting firm.
F-25
|
Initial Cost to
Company
|
Costs Capitalized
Subsequent to
Acquisition
|
Gross Amount at Which
Carried at Close of Period (a) (b)
|
Life on Which
Depreciation &
Amortization in Latest Income
Statement is
Computed (Years)
|
|||||||||||||||||||||||||||||
|
Encumbrances
|
Land
|
Building,
Improvements &
Leasehold
Interests
|
Improvements
|
Carrying
Costs
|
Land
|
Building,
Improvements &
Leasehold
Interests
|
Total
|
Accumulated
Depreciation
and
Amortization
|
Date of
Construction
|
Date
Acquired
|
||||||||||||||||||||||
|
Real Estate Held for Investment the Company has Invested in Under Operating Leases:
|
||||||||||||||||||||||||||||||||
|
Health Source Chiropractic:
|
|
|
|
|
|
|||||||||||||||||||||||||||
|
Houston, TX
|
—
|
|
|
112
|
|
509
|
|
302
|
|
|
—
|
|
|
112
|
|
811
|
|
923
|
|
134
|
|
1995
|
08/06
|
|
40
|
|||||||
|
|
|
|
|
|
|
|||||||||||||||||||||||||||
|
Healthy Pet:
|
|
|
|
|
|
|||||||||||||||||||||||||||
|
Suwanee, GA
|
—
|
|
|
175
|
|
1,038
|
|
—
|
|
|
—
|
|
|
175
|
|
1,038
|
|
1,213
|
|
209
|
|
1997
|
12/06
|
|
40
|
|||||||
|
Colonial Heights, VA
|
—
|
|
|
160
|
|
746
|
|
—
|
|
|
—
|
|
|
160
|
|
746
|
|
906
|
|
148
|
|
1996
|
01/07
|
|
40
|
|||||||
|
|
|
|
|
|
|
|||||||||||||||||||||||||||
|
Hear USA:
|
|
|
|
|
|
|||||||||||||||||||||||||||
|
Lapeer, MI
|
—
|
|
|
29
|
|
211
|
|
—
|
|
|
—
|
|
|
29
|
|
201
|
|
230
|
|
38
|
|
2007
|
10/05
|
|
40
|
|||||||
|
|
|
|
|
|
|
|||||||||||||||||||||||||||
|
Hibbett Sports:
|
|
|
|
|
|
|||||||||||||||||||||||||||
|
Sealy, TX
|
—
|
|
|
208
|
|
230
|
|
—
|
|
|
—
|
|
|
208
|
|
230
|
|
438
|
|
95
|
|
1982
|
03/99
|
(g)
|
40
|
|||||||
|
|
|
|
|
|
|
|||||||||||||||||||||||||||
|
Hog Pit:
|
|
|
|
|
|
|||||||||||||||||||||||||||
|
Tucson, AZ
|
—
|
|
|
827
|
|
305
|
|
18
|
|
|
—
|
|
|
845
|
|
305
|
|
1,150
|
|
114
|
|
1974
|
12/01
|
|
40
|
|||||||
|
|
|
|
|
|
|
|||||||||||||||||||||||||||
|
Hollywood Feed:
|
|
|
|
|
|
|||||||||||||||||||||||||||
|
Ridgeland, MS
|
—
|
|
|
343
|
|
411
|
|
362
|
|
|
—
|
|
|
343
|
|
773
|
|
1,116
|
|
135
|
|
1997
|
08/06
|
|
40
|
|||||||
|
|
|
|
|
|
|
|||||||||||||||||||||||||||
|
Home Decor:
|
|
|
|
|
|
|||||||||||||||||||||||||||
|
Memphis, TN
|
—
|
|
|
549
|
|
540
|
|
364
|
|
|
—
|
|
|
549
|
|
904
|
|
1,453
|
|
341
|
|
1998
|
12/97
|
|
40
|
|||||||
|
|
|
|
|
|
|
|||||||||||||||||||||||||||
|
Home Depot:
|
|
|
|
|
|
|||||||||||||||||||||||||||
|
Sunrise, FL
|
—
|
|
|
5,149
|
|
—
|
|
—
|
|
|
—
|
|
|
5,149
|
|
(i)
|
|
5,149
|
|
(i)
|
|
(i)
|
05/03
|
|
(i)
|
|||||||
|
|
|
|
|
|
|
|||||||||||||||||||||||||||
|
Home Zone Furniture:
|
|
|
|
|
|
|||||||||||||||||||||||||||
|
Arlington, TX
|
—
|
|
|
435
|
|
2,300
|
|
334
|
|
|
—
|
|
|
435
|
|
2,634
|
|
3,069
|
|
653
|
|
1996
|
06/96
|
|
38
|
|||||||
|
|
|
|
|
|
|
|||||||||||||||||||||||||||
|
HomeGoods:
|
|
|
|
|
|
|||||||||||||||||||||||||||
|
Fairfax, VA
|
—
|
|
|
523
|
|
756
|
|
1,585
|
|
|
—
|
|
|
971
|
|
2,341
|
|
3,312
|
|
811
|
|
1995
|
12/95
|
|
40
|
|||||||
|
|
|
|
|
|
|
|||||||||||||||||||||||||||
|
Hometown Urgent Care:
|
|
|
|
|
|
|||||||||||||||||||||||||||
|
Warren, OH
|
—
|
|
|
562
|
|
468
|
|
100
|
|
|
—
|
|
|
562
|
|
568
|
|
1,130
|
|
162
|
|
1997
|
12/01
|
|
40
|
|||||||
|
|
|
|
|
|
|
|||||||||||||||||||||||||||
|
Hooters:
|
|
|
|
|
|
|||||||||||||||||||||||||||
|
Tampa, FL
|
—
|
|
|
784
|
|
505
|
|
—
|
|
|
—
|
|
|
784
|
|
505
|
|
1,289
|
|
165
|
|
1993
|
12/01
|
|
40
|
|||||||
|
|
|
|
|
|
|
|||||||||||||||||||||||||||
|
Humana:
|
|
|
|
|
|
|||||||||||||||||||||||||||
|
Sunrise, FL
|
—
|
|
|
800
|
|
253
|
|
—
|
|
|
—
|
|
|
800
|
|
253
|
|
1,053
|
|
67
|
|
1984
|
05/04
|
|
40
|
|||||||
|
|
|
|
|
|
|
|||||||||||||||||||||||||||
|
Hurricane Grill and Wings:
|
|
|
|
|
|
|||||||||||||||||||||||||||
|
Chandler, AZ
|
—
|
|
|
655
|
|
791
|
|
57
|
|
|
—
|
|
|
655
|
|
849
|
|
1,504
|
|
254
|
|
1997
|
12/01
|
|
40
|
|||||||
|
|
|
|
|
|
|
|||||||||||||||||||||||||||
|
Hy-Vee:
|
|
|
|
|
|
|||||||||||||||||||||||||||
|
St. Joseph, MO
|
—
|
|
|
1,580
|
|
2,849
|
|
—
|
|
|
—
|
|
|
1,580
|
|
2,849
|
|
4,429
|
|
876
|
|
1991
|
09/02
|
|
40
|
|||||||
|
|
|
|
|
|
|
|||||||||||||||||||||||||||
|
Insurance Auto Auctions:
|
|
|
|
|
|
|||||||||||||||||||||||||||
|
New Orleans, LA
|
—
|
|
|
1,445
|
|
—
|
|
4,123
|
|
|
—
|
|
|
1,445
|
|
3,987
|
|
5,432
|
|
172
|
|
1993
|
06/13
|
(m)
|
30
|
|||||||
|
E Dundee, IL
|
—
|
|
|
2,772
|
|
—
|
|
—
|
|
|
—
|
|
|
2,772
|
|
(e)
|
|
2,772
|
|
(e)
|
|
(e)
|
01/14
|
(m)
|
(e)
|
|||||||
|
|
|
|
|
|
|
|||||||||||||||||||||||||||
|
Int'l House of Pancakes:
|
|
|
|
|
|
|||||||||||||||||||||||||||
|
Midwest City, OK
|
—
|
|
|
407
|
|
—
|
|
—
|
|
|
—
|
|
|
407
|
|
(i)
|
|
407
|
|
(i)
|
|
(i)
|
11/00
|
|
(i)
|
|||||||
|
Ankeny, IA
|
—
|
|
|
693
|
|
515
|
|
—
|
|
|
—
|
|
|
693
|
|
515
|
|
1,208
|
|
164
|
|
2002
|
06/05
|
|
30
|
|||||||
|
|
|
|
|
|
|
|||||||||||||||||||||||||||
|
ISD Renal:
|
|
|
|
|
|
|||||||||||||||||||||||||||
|
Corpus Christi, TX
|
—
|
|
|
406
|
|
4,036
|
|
—
|
|
|
—
|
|
|
406
|
|
4,036
|
|
4,442
|
|
409
|
|
1978
|
12/11
|
|
30
|
|||||||
|
Kendallville, IN
|
—
|
|
|
66
|
|
2,748
|
|
—
|
|
|
—
|
|
|
66
|
|
2,748
|
|
2,814
|
|
239
|
|
2007
|
12/11
|
|
35
|
|||||||
|
Memphis, TN
|
—
|
|
|
180
|
|
3,223
|
|
—
|
|
|
—
|
|
|
180
|
|
3,223
|
|
3,403
|
|
327
|
|
2002
|
12/11
|
|
30
|
|||||||
|
Memphis, TN
|
—
|
|
|
283
|
|
4,146
|
|
—
|
|
|
—
|
|
|
283
|
|
4,146
|
|
4,429
|
|
420
|
|
2001
|
12/11
|
|
30
|
|||||||
|
|
|
|
|
|
|
|||||||||||||||||||||||||||
|
J & J Insurance:
|
|
|
|
|
|
|||||||||||||||||||||||||||
|
Hollywood, FL
|
—
|
|
|
195
|
|
44
|
|
18
|
|
|
—
|
|
|
119
|
|
—
|
|
119
|
|
—
|
|
1960
|
12/05
|
|
15
|
|||||||
|
|
|
|
|
|
|
|||||||||||||||||||||||||||
|
Jack in the Box:
|
|
|
|
|
|
|||||||||||||||||||||||||||
|
Plano, TX
|
—
|
|
|
1,055
|
|
1,237
|
|
—
|
|
|
—
|
|
|
1,055
|
|
1,237
|
|
2,292
|
|
295
|
|
2001
|
06/05
|
|
40
|
|||||||
|
|
|
|
|
|
|
|||||||||||||||||||||||||||
|
Jacobson Industrial:
|
|
|
|
|
|
|||||||||||||||||||||||||||
|
Des Moines, IA
|
—
|
|
|
61
|
|
112
|
|
—
|
|
|
—
|
|
|
61
|
|
112
|
|
173
|
|
54
|
|
1973
|
06/05
|
|
20
|
|||||||
|
Jared Jewelers:
|
|
|
|
|
|
|||||||||||||||||||||||||||
|
Richmond, VA
|
—
|
|
|
955
|
|
1,336
|
|
—
|
|
|
—
|
|
|
955
|
|
1,336
|
|
2,291
|
|
436
|
|
1998
|
12/01
|
|
40
|
|||||||
|
Brandon, FL
|
—
|
|
|
1,197
|
|
1,182
|
|
—
|
|
|
—
|
|
|
1,197
|
|
1,182
|
|
2,379
|
|
374
|
|
2001
|
05/02
|
|
40
|
|||||||
|
Lithonia, GA
|
—
|
|
|
1,271
|
|
1,216
|
|
—
|
|
|
—
|
|
|
1,271
|
|
1,216
|
|
2,487
|
|
384
|
|
2001
|
05/02
|
|
40
|
|||||||
|
Houston, TX
|
—
|
|
|
1,676
|
|
1,440
|
|
—
|
|
|
—
|
|
|
1,676
|
|
1,440
|
|
3,116
|
|
433
|
|
1999
|
12/02
|
|
40
|
|||||||
|
Oviedo, FL
|
—
|
|
1,328
|
|
—
|
|
—
|
|
|
—
|
|
|
1,328
|
|
(c)
|
|
1,328
|
|
(c)
|
|
1998
|
06/13
|
|
(c)
|
||||||||
|
|
|
|
|
|
|
|||||||||||||||||||||||||||
|
Jazzercise Fitness Center:
|
|
|
|
|
|
|||||||||||||||||||||||||||
|
Orlando, FL
|
17
|
|
(h)
|
37
|
|
101
|
|
—
|
|
|
—
|
|
|
37
|
|
101
|
|
138
|
|
28
|
|
2001
|
02/04
|
|
40
|
|||||||
|
|
|
|
|
|
|
|||||||||||||||||||||||||||
|
Jiffy Lube:
|
|
|
|
|
|
|||||||||||||||||||||||||||
|
Auburn, MA
|
—
|
|
|
455
|
|
856
|
|
—
|
|
|
—
|
|
|
455
|
|
856
|
|
1,311
|
|
11
|
|
1988
|
07/14
|
|
35
|
|||||||
|
Ayer, MA
|
—
|
|
|
326
|
|
792
|
|
—
|
|
|
—
|
|
|
326
|
|
792
|
|
1,118
|
|
12
|
|
1989
|
07/14
|
|
30
|
|||||||
|
Barrington, IL
|
—
|
|
|
371
|
|
612
|
|
—
|
|
|
—
|
|
|
371
|
|
612
|
|
983
|
|
9
|
|
1986
|
07/14
|
|
30
|
|||||||
|
Berwyn, IL
|
—
|
|
|
359
|
|
709
|
|
—
|
|
|
—
|
|
|
359
|
|
709
|
|
1,068
|
|
9
|
|
1985
|
07/14
|
|
35
|
|||||||
|
Bolingbrook, IL
|
—
|
|
|
185
|
|
562
|
|
—
|
|
|
—
|
|
|
185
|
|
562
|
|
747
|
|
9
|
|
1986
|
07/14
|
|
30
|
|||||||
|
Burbank, IL
|
—
|
|
|
156
|
|
418
|
|
—
|
|
|
—
|
|
|
156
|
|
418
|
|
574
|
|
10
|
|
1986
|
07/14
|
|
20
|
|||||||
|
Plattsburgh, NY
|
—
|
|
|
127
|
|
421
|
|
—
|
|
|
—
|
|
|
127
|
|
421
|
|
548
|
|
8
|
|
1993
|
07/14
|
|
25
|
|||||||
|
Romeoville, IL
|
—
|
|
|
158
|
|
557
|
|
—
|
|
|
—
|
|
|
158
|
|
557
|
|
715
|
|
9
|
|
1988
|
07/14
|
|
30
|
|||||||
|
Worcester, MA
|
—
|
|
|
287
|
|
827
|
|
—
|
|
|
—
|
|
|
287
|
|
827
|
|
1,114
|
|
11
|
|
1988
|
07/14
|
|
35
|
|||||||
|
|
|
|
|
|
|
|||||||||||||||||||||||||||
|
Jin's Asian Cafe:
|
|
|
|
|
|
|||||||||||||||||||||||||||
|
Sealy, TX
|
—
|
|
|
67
|
|
74
|
|
—
|
|
|
—
|
|
|
67
|
|
74
|
|
141
|
|
30
|
|
1982
|
03/99
|
|
40
|
|||||||
|
|
|
|
|
|
|
|||||||||||||||||||||||||||
|
Jo-Ann etc:
|
|
|
|
|
|
|||||||||||||||||||||||||||
|
Corpus Christi, TX
|
—
|
|
|
818
|
|
896
|
|
12
|
|
|
—
|
|
|
818
|
|
909
|
|
1,727
|
|
479
|
|
1967
|
11/93
|
|
40
|
|||||||
|
St. Peters, MO
|
—
|
|
|
1,741
|
|
5,406
|
|
1,233
|
|
|
—
|
|
|
1,741
|
|
6,639
|
|
8,380
|
|
1,417
|
|
2005
|
06/05
|
(g)
|
40
|
|||||||
|
|
|
|
|
|
|
|||||||||||||||||||||||||||
|
Johnny Carino's:
|
|
|
|
|
|
|||||||||||||||||||||||||||
|
Lubbock, TX
|
—
|
|
|
1,007
|
|
1,206
|
|
—
|
|
|
—
|
|
|
1,007
|
|
1,206
|
|
2,213
|
|
393
|
|
1995
|
12/01
|
|
40
|
|||||||
See accompanying report of independent registered public accounting firm.
F-26
|
Initial Cost to
Company
|
Costs Capitalized
Subsequent to
Acquisition
|
Gross Amount at Which
Carried at Close of Period (a) (b)
|
Life on Which
Depreciation &
Amortization in Latest Income
Statement is
Computed (Years)
|
|||||||||||||||||||||||||||||
|
Encumbrances
|
Land
|
Building,
Improvements &
Leasehold
Interests
|
Improvements
|
Carrying
Costs
|
Land
|
Building,
Improvements &
Leasehold
Interests
|
Total
|
Accumulated
Depreciation
and
Amortization
|
Date of
Construction
|
Date
Acquired
|
||||||||||||||||||||||
|
Real Estate Held for Investment the Company has Invested in Under Operating Leases:
|
||||||||||||||||||||||||||||||||
|
Kangaroo Express:
|
|
|
|
|
|
|||||||||||||||||||||||||||
|
Carthage, NC
|
—
|
|
|
485
|
|
354
|
|
—
|
|
|
—
|
|
|
485
|
|
354
|
|
839
|
|
74
|
|
1989
|
08/06
|
|
40
|
|||||||
|
Sanford, NC
|
—
|
|
|
666
|
|
661
|
|
—
|
|
|
—
|
|
|
666
|
|
661
|
|
1,327
|
|
138
|
|
2000
|
08/06
|
|
40
|
|||||||
|
Sanford, NC
|
—
|
|
|
1,638
|
|
1,371
|
|
—
|
|
|
—
|
|
|
1,638
|
|
1,371
|
|
3,009
|
|
287
|
|
2003
|
08/06
|
|
40
|
|||||||
|
Siler City, NC
|
—
|
|
|
586
|
|
645
|
|
—
|
|
|
—
|
|
|
586
|
|
645
|
|
1,231
|
|
135
|
|
1998
|
08/06
|
|
40
|
|||||||
|
West End, NC
|
—
|
|
|
426
|
|
516
|
|
—
|
|
|
—
|
|
|
397
|
|
516
|
|
913
|
|
108
|
|
1999
|
08/06
|
|
40
|
|||||||
|
Belleview, FL
|
—
|
|
|
471
|
|
1,451
|
|
—
|
|
|
—
|
|
|
471
|
|
1,451
|
|
1,922
|
|
304
|
|
2006
|
08/06
|
|
40
|
|||||||
|
Jacksonville, FL
|
—
|
|
|
683
|
|
1,362
|
|
—
|
|
|
—
|
|
|
683
|
|
1,362
|
|
2,045
|
|
285
|
|
1969
|
08/06
|
|
40
|
|||||||
|
Jacksonville, FL
|
—
|
|
|
807
|
|
1,239
|
|
—
|
|
|
—
|
|
|
807
|
|
1,239
|
|
2,046
|
|
259
|
|
1975
|
08/06
|
|
40
|
|||||||
|
Destin, FL
|
—
|
|
|
1,366
|
|
1,192
|
|
—
|
|
|
—
|
|
|
1,366
|
|
1,192
|
|
2,558
|
|
247
|
|
2000
|
09/06
|
|
40
|
|||||||
|
Niceville, FL (n)
|
—
|
|
|
1,434
|
|
1,124
|
|
—
|
|
|
—
|
|
|
1,434
|
|
1,124
|
|
2,558
|
|
233
|
|
2000
|
09/06
|
|
40
|
|||||||
|
Kill Devil Hills, NC
|
—
|
|
|
490
|
|
741
|
|
—
|
|
|
—
|
|
|
490
|
|
741
|
|
1,231
|
|
152
|
|
1995
|
10/06
|
|
40
|
|||||||
|
Kill Devil Hills, NC
|
—
|
|
|
679
|
|
552
|
|
—
|
|
|
—
|
|
|
679
|
|
552
|
|
1,231
|
|
113
|
|
1990
|
10/06
|
|
40
|
|||||||
|
Interlachen, FL
|
—
|
|
|
519
|
|
1,500
|
|
—
|
|
|
—
|
|
|
519
|
|
1,500
|
|
2,019
|
|
255
|
|
2007
|
10/06
|
|
40
|
|||||||
|
Clarksville, TN
|
—
|
|
|
276
|
|
955
|
|
—
|
|
|
—
|
|
|
276
|
|
955
|
|
1,231
|
|
192
|
|
1999
|
12/06
|
|
40
|
|||||||
|
Clarksville, TN
|
—
|
|
|
521
|
|
710
|
|
—
|
|
|
—
|
|
|
521
|
|
710
|
|
1,231
|
|
143
|
|
1999
|
12/06
|
|
40
|
|||||||
|
Gallatin, TN
|
—
|
|
|
474
|
|
757
|
|
—
|
|
|
—
|
|
|
474
|
|
757
|
|
1,231
|
|
152
|
|
1999
|
12/06
|
|
40
|
|||||||
|
Midland City, AL
|
—
|
|
|
729
|
|
2,538
|
|
—
|
|
|
—
|
|
|
729
|
|
2,538
|
|
3,267
|
|
510
|
|
2006
|
12/06
|
|
40
|
|||||||
|
Naples, FL
|
—
|
|
|
3,195
|
|
1,403
|
|
—
|
|
|
—
|
|
|
2,985
|
|
1,403
|
|
4,388
|
|
282
|
|
2001
|
12/06
|
|
40
|
|||||||
|
Oxford, MS
|
—
|
|
|
440
|
|
1,097
|
|
—
|
|
|
—
|
|
|
440
|
|
1,097
|
|
1,537
|
|
220
|
|
1998
|
12/06
|
|
40
|
|||||||
|
Columbiana, AL
|
—
|
|
|
771
|
|
989
|
|
—
|
|
|
—
|
|
|
771
|
|
989
|
|
1,760
|
|
197
|
|
1982
|
01/07
|
|
40
|
|||||||
|
Naples, FL
|
—
|
|
|
3,162
|
|
1,597
|
|
—
|
|
|
—
|
|
|
3,162
|
|
1,597
|
|
4,759
|
|
314
|
|
1995
|
02/07
|
|
40
|
|||||||
|
Longs, SC
|
—
|
|
|
745
|
|
758
|
|
—
|
|
|
—
|
|
|
745
|
|
758
|
|
1,503
|
|
148
|
|
2001
|
03/07
|
|
40
|
|||||||
|
Kentwood, LA
|
—
|
|
|
985
|
|
891
|
|
—
|
|
|
—
|
|
|
985
|
|
891
|
|
1,876
|
|
174
|
|
2001
|
03/07
|
|
40
|
|||||||
|
Dothan, AL
|
—
|
|
|
774
|
|
1,886
|
|
—
|
|
|
—
|
|
|
774
|
|
1,886
|
|
2,660
|
|
367
|
|
2007
|
03/07
|
|
40
|
|||||||
|
Naples, FL
|
—
|
|
|
2,412
|
|
1,589
|
|
—
|
|
|
—
|
|
|
2,412
|
|
1,589
|
|
4,001
|
|
303
|
|
2000
|
05/07
|
|
40
|
|||||||
|
Cary, NC
|
—
|
|
|
1,314
|
|
2,125
|
|
—
|
|
|
—
|
|
|
1,314
|
|
2,125
|
|
3,439
|
|
392
|
|
2007
|
08/07
|
|
40
|
|||||||
|
Havelock, NC
|
—
|
|
|
170
|
|
681
|
|
—
|
|
|
—
|
|
|
170
|
|
681
|
|
851
|
|
10
|
|
1962
|
07/14
|
|
30
|
|||||||
|
Statesville, NC
|
—
|
|
|
249
|
|
653
|
|
—
|
|
|
—
|
|
|
249
|
|
653
|
|
902
|
|
9
|
|
1960
|
07/14
|
|
35
|
|||||||
|
|
|
|
|
|
|
|||||||||||||||||||||||||||
|
KARM Home Store:
|
|
|
|
|
|
|||||||||||||||||||||||||||
|
Knoxville, TN
|
—
|
|
|
467
|
|
735
|
|
—
|
|
|
—
|
|
|
467
|
|
735
|
|
1,202
|
|
293
|
|
1999
|
01/98
|
(f)
|
40
|
|||||||
|
|
|
|
|
|
|
|||||||||||||||||||||||||||
See accompanying report of independent registered public accounting firm.
F-27
|
Initial Cost to
Company
|
Costs Capitalized
Subsequent to
Acquisition
|
Gross Amount at Which
Carried at Close of Period (a) (b)
|
Life on Which
Depreciation &
Amortization in Latest Income
Statement is
Computed (Years)
|
|||||||||||||||||||||||||||||
|
Encumbrances
|
Land
|
Building,
Improvements &
Leasehold
Interests
|
Improvements
|
Carrying
Costs
|
Land
|
Building,
Improvements &
Leasehold
Interests
|
Total
|
Accumulated
Depreciation
and
Amortization
|
Date of
Construction
|
Date
Acquired
|
||||||||||||||||||||||
|
Real Estate Held for Investment the Company has Invested in Under Operating Leases:
|
||||||||||||||||||||||||||||||||
|
Kash n' Karry:
|
|
|
|
|
|
|||||||||||||||||||||||||||
|
Seffner, FL
|
—
|
|
|
322
|
|
1,222
|
|
—
|
|
|
—
|
|
|
322
|
|
1,222
|
|
1,544
|
|
342
|
|
1983
|
03/99
|
|
40
|
|||||||
|
|
|
|
|
|
|
|||||||||||||||||||||||||||
|
Keg Steakhouse:
|
|
|
|
|
|
|||||||||||||||||||||||||||
|
Lynnwood, WA
|
—
|
|
|
1,256
|
|
649
|
|
—
|
|
|
—
|
|
|
1,256
|
|
649
|
|
1,905
|
|
212
|
|
1992
|
12/01
|
|
40
|
|||||||
|
|
|
|
|
|
|
|||||||||||||||||||||||||||
|
KFC:
|
|
|
|
|
|
|||||||||||||||||||||||||||
|
Fenton, MO
|
—
|
|
|
307
|
|
496
|
|
—
|
|
|
—
|
|
|
307
|
|
496
|
|
803
|
|
339
|
|
1985
|
07/92
|
|
33
|
|||||||
|
Erie, PA
|
—
|
|
|
517
|
|
496
|
|
—
|
|
|
—
|
|
|
517
|
|
496
|
|
1,013
|
|
162
|
|
1996
|
12/01
|
|
40
|
|||||||
|
Marysville, WA
|
—
|
|
|
647
|
|
546
|
|
—
|
|
|
—
|
|
|
647
|
|
546
|
|
1,193
|
|
178
|
|
1996
|
12/01
|
|
40
|
|||||||
|
Evansville, IN
|
—
|
|
|
370
|
|
767
|
|
—
|
|
|
—
|
|
|
370
|
|
767
|
|
1,137
|
|
165
|
|
2004
|
05/06
|
|
40
|
|||||||
|
Hampton, VA
|
—
|
|
|
251
|
|
1,173
|
|
—
|
|
|
—
|
|
|
251
|
|
1,173
|
|
1,424
|
|
83
|
|
2001
|
11/12
|
|
30
|
|||||||
|
Mechanicsville, VA
|
—
|
|
|
482
|
|
422
|
|
—
|
|
|
—
|
|
|
482
|
|
422
|
|
904
|
|
36
|
|
1989
|
11/12
|
|
25
|
|||||||
|
Newport News, VA
|
—
|
|
|
461
|
|
883
|
|
—
|
|
|
—
|
|
|
461
|
|
883
|
|
1,344
|
|
63
|
|
2001
|
11/12
|
|
30
|
|||||||
|
Newport News, VA
|
—
|
|
|
572
|
|
442
|
|
—
|
|
|
—
|
|
|
572
|
|
442
|
|
1,014
|
|
38
|
|
1986
|
11/12
|
|
25
|
|||||||
|
Newport News, VA
|
—
|
|
|
582
|
|
392
|
|
—
|
|
|
—
|
|
|
582
|
|
392
|
|
974
|
|
33
|
|
1985
|
11/12
|
|
25
|
|||||||
|
Richmond, VA
|
—
|
|
|
532
|
|
472
|
|
—
|
|
|
—
|
|
|
532
|
|
472
|
|
1,004
|
|
40
|
|
1986
|
11/12
|
|
25
|
|||||||
|
Richmond, VA
|
—
|
|
|
452
|
|
452
|
|
—
|
|
|
—
|
|
|
452
|
|
452
|
|
904
|
|
38
|
|
1984
|
11/12
|
|
25
|
|||||||
|
Richmond, VA
|
—
|
|
|
552
|
|
532
|
|
—
|
|
|
—
|
|
|
552
|
|
532
|
|
1,084
|
|
45
|
|
1984
|
11/12
|
|
25
|
|||||||
|
Richmond, VA
|
—
|
|
|
492
|
|
452
|
|
—
|
|
|
—
|
|
|
492
|
|
452
|
|
944
|
|
27
|
|
2003
|
11/12
|
|
35
|
|||||||
|
Richmond, VA
|
—
|
|
|
481
|
|
1,253
|
|
—
|
|
|
—
|
|
|
481
|
|
1,253
|
|
1,734
|
|
106
|
|
1990
|
11/12
|
|
25
|
|||||||
|
Virginia Beach, VA
|
—
|
|
|
402
|
|
482
|
|
—
|
|
|
—
|
|
|
402
|
|
482
|
|
884
|
|
41
|
|
1984
|
11/12
|
|
25
|
|||||||
|
Ahoskie, NC
|
—
|
|
|
393
|
|
1,012
|
|
—
|
|
|
—
|
|
|
393
|
|
1,012
|
|
1,405
|
|
42
|
|
1988
|
12/13
|
|
25
|
|||||||
|
Elizabeth City, NC
|
—
|
|
|
197
|
|
1,209
|
|
—
|
|
|
—
|
|
|
197
|
|
1,209
|
|
1,406
|
|
50
|
|
1988
|
12/13
|
|
25
|
|||||||
|
Brownsville, TX
|
—
|
|
|
404
|
|
374
|
|
—
|
|
|
—
|
|
|
404
|
|
374
|
|
778
|
|
10
|
|
2003
|
01/14
|
|
35
|
|||||||
|
Brownsville, TX
|
—
|
|
|
334
|
|
865
|
|
—
|
|
|
—
|
|
|
334
|
|
865
|
|
1,199
|
|
33
|
|
1990
|
01/14
|
|
25
|
|||||||
|
Copperas Cove, TX
|
—
|
|
|
256
|
|
747
|
|
—
|
|
|
—
|
|
|
256
|
|
747
|
|
1,003
|
|
24
|
|
2001
|
01/14
|
|
30
|
|||||||
|
Del Rio, TX
|
—
|
|
|
453
|
|
246
|
|
—
|
|
|
—
|
|
|
453
|
|
246
|
|
699
|
|
8
|
|
1995
|
01/14
|
|
30
|
|||||||
|
Eagle Pass, TX
|
—
|
|
|
226
|
|
1,071
|
|
—
|
|
|
—
|
|
|
226
|
|
1,071
|
|
1,297
|
|
41
|
|
1992
|
01/14
|
|
25
|
|||||||
|
Edinburg, TX
|
—
|
|
|
452
|
|
1,237
|
|
—
|
|
|
—
|
|
|
452
|
|
1,237
|
|
1,689
|
|
40
|
|
1996
|
01/14
|
|
30
|
|||||||
|
Harker Heights, TX
|
—
|
|
|
275
|
|
1,218
|
|
—
|
|
|
—
|
|
|
275
|
|
1,218
|
|
1,493
|
|
33
|
|
2008
|
01/14
|
|
35
|
|||||||
|
Harlingen, TX
|
—
|
|
|
128
|
|
1,708
|
|
—
|
|
|
—
|
|
|
128
|
|
1,708
|
|
1,836
|
|
65
|
|
1992
|
01/14
|
|
25
|
|||||||
|
Jacksonville, TX
|
—
|
|
|
69
|
|
562
|
|
—
|
|
|
—
|
|
|
69
|
|
562
|
|
631
|
|
22
|
|
1985
|
01/14
|
|
25
|
|||||||
|
Killeen, TX
|
—
|
|
|
226
|
|
1,228
|
|
—
|
|
|
—
|
|
|
226
|
|
1,228
|
|
1,454
|
|
39
|
|
1993
|
01/14
|
|
30
|
|||||||
See accompanying report of independent registered public accounting firm.
F-28
|
Initial Cost to
Company
|
Costs Capitalized
Subsequent to
Acquisition
|
Gross Amount at Which
Carried at Close of Period (a) (b)
|
Life on Which
Depreciation &
Amortization in Latest Income
Statement is
Computed (Years)
|
|||||||||||||||||||||||||||||
|
Encumbrances
|
Land
|
Building,
Improvements &
Leasehold
Interests
|
Improvements
|
Carrying
Costs
|
Land
|
Building,
Improvements &
Leasehold
Interests
|
Total
|
Accumulated
Depreciation
and
Amortization
|
Date of
Construction
|
Date
Acquired
|
||||||||||||||||||||||
|
Real Estate Held for Investment the Company has Invested in Under Operating Leases:
|
||||||||||||||||||||||||||||||||
|
Laredo, TX
|
—
|
|
|
265
|
|
1,580
|
|
—
|
|
|
—
|
|
|
265
|
|
1,580
|
|
1,845
|
|
50
|
|
1996
|
01/14
|
|
30
|
|||||||
|
Marshall, TX
|
—
|
|
|
89
|
|
709
|
|
—
|
|
|
—
|
|
|
89
|
|
709
|
|
798
|
|
27
|
|
1985
|
01/14
|
|
25
|
|||||||
|
McAllen, TX
|
—
|
|
|
491
|
|
1,051
|
|
—
|
|
|
—
|
|
|
491
|
|
1,051
|
|
1,542
|
|
40
|
|
1987
|
01/14
|
|
25
|
|||||||
|
Mission, TX
|
—
|
|
|
137
|
|
1,404
|
|
—
|
|
|
—
|
|
|
137
|
|
1,404
|
|
1,541
|
|
45
|
|
1993
|
01/14
|
|
30
|
|||||||
|
Palestine, TX
|
—
|
|
|
89
|
|
484
|
|
—
|
|
|
—
|
|
|
89
|
|
484
|
|
573
|
|
19
|
|
1996
|
01/14
|
|
25
|
|||||||
|
Pharr, TX
|
—
|
|
|
167
|
|
581
|
|
—
|
|
|
—
|
|
|
167
|
|
581
|
|
748
|
|
19
|
|
1999
|
01/14
|
|
30
|
|||||||
|
Rio Grande City, TX
|
—
|
|
|
256
|
|
394
|
|
—
|
|
|
—
|
|
|
256
|
|
394
|
|
650
|
|
11
|
|
2004
|
01/14
|
|
35
|
|||||||
|
S Padre Island, TX
|
—
|
|
|
856
|
|
30
|
|
—
|
|
|
—
|
|
|
856
|
|
30
|
|
886
|
|
1
|
|
1994
|
01/14
|
|
30
|
|||||||
|
San Benito, TX
|
—
|
|
|
177
|
|
503
|
|
—
|
|
|
—
|
|
|
177
|
|
503
|
|
680
|
|
16
|
|
1994
|
01/14
|
|
30
|
|||||||
|
Temple, TX
|
—
|
|
|
246
|
|
1,188
|
|
—
|
|
|
—
|
|
|
246
|
|
1,188
|
|
1,434
|
|
46
|
|
1985
|
01/14
|
|
25
|
|||||||
|
Tyler, TX
|
—
|
|
|
709
|
|
30
|
|
—
|
|
|
—
|
|
|
709
|
|
30
|
|
739
|
|
1
|
|
1994
|
01/14
|
|
30
|
|||||||
|
Waco, TX
|
—
|
|
|
463
|
|
246
|
|
—
|
|
|
—
|
|
|
463
|
|
246
|
|
709
|
|
8
|
|
1993
|
01/14
|
|
30
|
|||||||
|
Waco, TX
|
—
|
|
|
276
|
|
620
|
|
—
|
|
|
—
|
|
|
276
|
|
620
|
|
896
|
|
24
|
|
1984
|
01/14
|
|
25
|
|||||||
|
Weslaco, TX
|
—
|
|
|
236
|
|
1,561
|
|
—
|
|
|
—
|
|
|
236
|
|
1,561
|
|
1,797
|
|
50
|
|
1995
|
01/14
|
|
30
|
|||||||
|
|
|
|
|
|
|
|||||||||||||||||||||||||||
|
Kohl's:
|
|
|
|
|
|
|||||||||||||||||||||||||||
|
Florence, AL
|
—
|
|
|
818
|
|
1,047
|
|
—
|
|
|
—
|
|
|
818
|
|
698
|
|
1,516
|
|
186
|
|
2006
|
06/04
|
|
40
|
|||||||
|
|
|
|
|
|
|
|||||||||||||||||||||||||||
|
Kroger:
|
|
|
|
|
|
|||||||||||||||||||||||||||
|
Elkhart, IN
|
—
|
|
|
541
|
|
1,550
|
|
—
|
|
|
—
|
|
|
541
|
|
1,550
|
|
2,091
|
|
47
|
|
1979
|
07/14
|
|
15
|
|||||||
|
|
|
|
|
|
|
|||||||||||||||||||||||||||
|
Kum & Go:
|
|
|
|
|
|
|||||||||||||||||||||||||||
|
Omaha, NE
|
—
|
|
|
393
|
|
214
|
|
—
|
|
|
—
|
|
|
393
|
|
214
|
|
607
|
|
102
|
|
1979
|
06/05
|
|
20
|
|||||||
|
|
|
|
|
|
|
|||||||||||||||||||||||||||
|
Kwik Pik:
|
|
|
|
|
|
|||||||||||||||||||||||||||
|
Bear Creek, PA
|
—
|
|
|
191
|
|
230
|
|
—
|
|
|
—
|
|
|
191
|
|
230
|
|
421
|
|
108
|
|
1980
|
08/05
|
|
20
|
|||||||
|
Bradford, PA
|
—
|
|
|
184
|
|
762
|
|
—
|
|
|
—
|
|
|
184
|
|
762
|
|
946
|
|
357
|
|
1983
|
08/05
|
|
20
|
|||||||
|
Coraopolis, PA (n)
|
—
|
|
|
476
|
|
347
|
|
—
|
|
|
—
|
|
|
476
|
|
347
|
|
823
|
|
163
|
|
1983
|
08/05
|
|
20
|
|||||||
|
St Clair, PA
|
—
|
|
|
212
|
|
475
|
|
—
|
|
|
—
|
|
|
212
|
|
475
|
|
687
|
|
223
|
|
1984
|
08/05
|
|
20
|
|||||||
|
Bear Creek Township, PA (n)
|
—
|
|
|
689
|
|
275
|
|
—
|
|
|
—
|
|
|
689
|
|
275
|
|
964
|
|
128
|
|
1980
|
09/05
|
|
20
|
|||||||
|
Beech Creek, PA
|
—
|
|
|
477
|
|
613
|
|
—
|
|
|
—
|
|
|
477
|
|
613
|
|
1,090
|
|
137
|
|
1988
|
01/06
|
|
40
|
|||||||
|
Canisteo, NY
|
—
|
|
|
142
|
|
485
|
|
—
|
|
|
—
|
|
|
142
|
|
485
|
|
627
|
|
109
|
|
1983
|
01/06
|
|
40
|
|||||||
|
Curwensville, PA
|
—
|
|
|
226
|
|
608
|
|
—
|
|
|
—
|
|
|
226
|
|
608
|
|
834
|
|
136
|
|
1983
|
01/06
|
|
40
|
|||||||
|
Ellwood City, PA
|
—
|
|
|
196
|
|
526
|
|
—
|
|
|
—
|
|
|
196
|
|
526
|
|
722
|
|
118
|
|
1987
|
01/06
|
|
40
|
|||||||
See accompanying report of independent registered public accounting firm.
F-29
|
Initial Cost to
Company
|
Costs Capitalized
Subsequent to
Acquisition
|
Gross Amount at Which
Carried at Close of Period (a) (b)
|
Life on Which
Depreciation &
Amortization in Latest Income
Statement is
Computed (Years)
|
|||||||||||||||||||||||||||||
|
Encumbrances
|
Land
|
Building,
Improvements &
Leasehold
Interests
|
Improvements
|
Carrying
Costs
|
Land
|
Building,
Improvements &
Leasehold
Interests
|
Total
|
Accumulated
Depreciation
and
Amortization
|
Date of
Construction
|
Date
Acquired
|
||||||||||||||||||||||
|
Real Estate Held for Investment the Company has Invested in Under Operating Leases:
|
||||||||||||||||||||||||||||||||
|
Hastings, PA
|
—
|
|
|
199
|
|
455
|
|
—
|
|
|
—
|
|
|
199
|
|
455
|
|
654
|
|
102
|
|
1989
|
01/06
|
|
40
|
|||||||
|
Jersey Shore, PA
|
—
|
|
|
515
|
|
381
|
|
—
|
|
|
—
|
|
|
515
|
|
381
|
|
896
|
|
85
|
|
1960
|
01/06
|
|
40
|
|||||||
|
Leeper, PA
|
—
|
|
|
286
|
|
644
|
|
—
|
|
|
—
|
|
|
286
|
|
644
|
|
930
|
|
144
|
|
1987
|
01/06
|
|
40
|
|||||||
|
Lewisberry, PA
|
—
|
|
|
412
|
|
534
|
|
—
|
|
|
—
|
|
|
412
|
|
534
|
|
946
|
|
120
|
|
1988
|
01/06
|
|
40
|
|||||||
|
Mercersburg, PA
|
—
|
|
|
672
|
|
746
|
|
—
|
|
|
—
|
|
|
672
|
|
746
|
|
1,418
|
|
167
|
|
1988
|
01/06
|
|
40
|
|||||||
|
New Florence, PA
|
—
|
|
|
298
|
|
812
|
|
—
|
|
|
—
|
|
|
298
|
|
812
|
|
1,110
|
|
182
|
|
1989
|
01/06
|
|
40
|
|||||||
|
Newstead, NY
|
—
|
|
|
255
|
|
835
|
|
—
|
|
|
—
|
|
|
255
|
|
835
|
|
1,090
|
|
187
|
|
1990
|
01/06
|
|
40
|
|||||||
|
Philipsburg, PA
|
—
|
|
|
428
|
|
269
|
|
—
|
|
|
—
|
|
|
428
|
|
269
|
|
697
|
|
60
|
|
1978
|
01/06
|
|
40
|
|||||||
|
Plainfield, PA
|
—
|
|
|
244
|
|
383
|
|
—
|
|
|
—
|
|
|
244
|
|
383
|
|
627
|
|
86
|
|
1988
|
01/06
|
|
40
|
|||||||
|
Reynoldsville, PA
|
—
|
|
|
113
|
|
328
|
|
—
|
|
|
—
|
|
|
113
|
|
328
|
|
441
|
|
73
|
|
1983
|
01/06
|
|
40
|
|||||||
|
Port Royal, PA
|
—
|
|
|
238
|
|
635
|
|
—
|
|
|
—
|
|
|
238
|
|
635
|
|
873
|
|
269
|
|
1989
|
07/06
|
|
20
|
|||||||
|
|
|
|
|
|
|
|||||||||||||||||||||||||||
|
LA Fitness:
|
|
|
|
|
|
|||||||||||||||||||||||||||
|
Little Rock, AR
|
—
|
|
|
3,113
|
|
2,660
|
|
4,125
|
|
|
—
|
|
|
3,113
|
|
6,785
|
|
9,898
|
|
1,169
|
|
1997
|
09/98
|
|
40
|
|||||||
|
Sarasota, FL
|
—
|
|
|
471
|
|
1,344
|
|
4,450
|
|
|
—
|
|
|
471
|
|
5,794
|
|
6,265
|
|
721
|
|
1983
|
03/99
|
(g)
|
40
|
|||||||
|
Centerville, OH
|
—
|
|
|
2,700
|
|
—
|
|
8,572
|
|
|
—
|
|
|
2,700
|
|
8,572
|
|
11,272
|
|
1,188
|
|
2009
|
06/08
|
(m)
|
40
|
|||||||
|
Warren, MI
|
—
|
|
|
2,360
|
|
—
|
|
6,674
|
|
|
—
|
|
|
2,360
|
|
6,674
|
|
9,034
|
|
966
|
|
2009
|
07/08
|
(m)
|
40
|
|||||||
|
Cincinnati, OH
|
—
|
|
|
5,145
|
|
—
|
|
9,011
|
|
|
—
|
|
|
5,145
|
|
9,011
|
|
14,156
|
|
1,248
|
|
2009
|
08/08
|
(m)
|
40
|
|||||||
|
Lawrence, IN
|
—
|
|
|
1,599
|
|
—
|
|
5,867
|
|
|
—
|
|
|
1,762
|
|
5,870
|
|
7,632
|
|
642
|
|
2010
|
01/10
|
(m)
|
40
|
|||||||
|
Laveen, AZ
|
—
|
|
|
1,665
|
|
—
|
|
5,749
|
|
|
—
|
|
|
1,665
|
|
5,749
|
|
7,414
|
|
605
|
|
2010
|
02/10
|
(m)
|
40
|
|||||||
|
Kennesaw, GA
|
—
|
|
|
3,653
|
|
—
|
|
3,325
|
|
|
—
|
|
|
3,653
|
|
3,325
|
|
6,978
|
|
329
|
|
2011
|
07/10
|
(m)
|
40
|
|||||||
|
Arlington, TX
|
—
|
|
|
1,166
|
|
6,214
|
|
—
|
|
|
—
|
|
|
1,166
|
|
6,214
|
|
7,380
|
|
703
|
|
2007
|
01/11
|
|
35
|
|||||||
|
Hurst, TX
|
—
|
|
|
1,494
|
|
6,187
|
|
—
|
|
|
—
|
|
|
1,494
|
|
6,187
|
|
7,681
|
|
611
|
|
2008
|
07/11
|
|
35
|
|||||||
|
South Plainfield, NJ
|
6,180
|
|
|
2,415
|
|
6,592
|
|
—
|
|
|
—
|
|
|
2,415
|
|
6,592
|
|
9,007
|
|
479
|
|
2006
|
06/12
|
|
35
|
|||||||
|
McDonough, GA
|
—
|
|
|
1,503
|
|
6,727
|
|
—
|
|
|
—
|
|
|
1,503
|
|
6,727
|
|
8,230
|
|
440
|
|
2008
|
09/12
|
|
35
|
|||||||
|
Greensburg, PA
|
—
|
|
|
1,791
|
|
7,015
|
|
—
|
|
|
—
|
|
|
1,791
|
|
7,015
|
|
8,806
|
|
358
|
|
2012
|
12/12
|
|
40
|
|||||||
|
Indianapolis, IN
|
—
|
|
|
1,651
|
|
6,585
|
|
—
|
|
|
—
|
|
|
1,651
|
|
6,585
|
|
8,236
|
|
336
|
|
2012
|
12/12
|
|
40
|
|||||||
|
Phoenix, AZ
|
—
|
|
|
1,601
|
|
6,540
|
|
—
|
|
|
—
|
|
|
1,601
|
|
6,540
|
|
8,141
|
|
334
|
|
2012
|
12/12
|
|
40
|
|||||||
|
Tampa, FL
|
—
|
|
|
4,492
|
|
10,894
|
|
—
|
|
|
—
|
|
|
4,492
|
|
10,894
|
|
15,386
|
|
556
|
|
2012
|
12/12
|
|
40
|
|||||||
|
West Dundee, IL
|
—
|
|
|
1,961
|
|
6,525
|
|
—
|
|
|
—
|
|
|
1,961
|
|
6,525
|
|
8,486
|
|
333
|
|
2012
|
12/12
|
|
40
|
|||||||
|
Irving, TX
|
—
|
|
|
3,636
|
|
7,326
|
|
—
|
|
|
—
|
|
|
3,636
|
|
7,326
|
|
10,962
|
|
340
|
|
2006
|
05/13
|
|
35
|
|||||||
|
Royal Oak, MI
|
—
|
|
|
3,238
|
|
8,998
|
|
—
|
|
|
—
|
|
|
3,238
|
|
8,998
|
|
12,236
|
|
332
|
|
2010
|
09/13
|
|
35
|
|||||||
|
St. Louis Park, MN
|
—
|
|
|
3,436
|
|
8,665
|
|
—
|
|
|
—
|
|
|
3,436
|
|
8,665
|
|
12,101
|
|
258
|
|
2009
|
12/13
|
|
35
|
|||||||
|
Pompano Beach, FL
|
—
|
|
|
7,009
|
|
—
|
|
—
|
|
|
—
|
|
|
7,009
|
|
(e)
|
|
7,009
|
|
(e)
|
|
(e)
|
12/14
|
(m)
|
(e)
|
|||||||
|
LaPetite Academy:
|
|
|
|
|
|
|||||||||||||||||||||||||||
|
Albuquerque, NM
|
—
|
|
|
332
|
|
1,166
|
|
—
|
|
|
—
|
|
|
332
|
|
1,166
|
|
1,498
|
|
18
|
|
1989
|
07/14
|
|
30
|
|||||||
|
Ft. Worth, TX
|
—
|
|
|
140
|
|
383
|
|
—
|
|
|
—
|
|
|
140
|
|
383
|
|
523
|
|
12
|
|
1981
|
07/14
|
|
15
|
|||||||
|
Moore, OK
|
—
|
|
|
119
|
|
412
|
|
—
|
|
|
—
|
|
|
119
|
|
412
|
|
531
|
|
13
|
|
1982
|
07/14
|
|
15
|
|||||||
|
Oklahoma City, OK
|
—
|
|
|
100
|
|
391
|
|
—
|
|
|
—
|
|
|
100
|
|
391
|
|
491
|
|
12
|
|
1982
|
07/14
|
|
15
|
|||||||
|
|
|
|
|
|
|
|||||||||||||||||||||||||||
|
Last Stop West:
|
|
|
|
|
|
|||||||||||||||||||||||||||
|
Azle, TX
|
—
|
|
|
648
|
|
859
|
|
—
|
|
|
—
|
|
|
648
|
|
859
|
|
1,507
|
|
162
|
|
1970
|
06/07
|
|
40
|
|||||||
|
|
|
|
|
|
|
|||||||||||||||||||||||||||
|
Lil' Champ:
|
|
|
|
|
|
|||||||||||||||||||||||||||
|
Gainesville, FL
|
—
|
|
|
900
|
|
—
|
|
1,800
|
|
|
—
|
|
|
900
|
|
1,800
|
|
2,700
|
|
351
|
|
2006
|
07/05
|
(m)
|
40
|
|||||||
|
Jacksonville, FL
|
—
|
|
|
2,225
|
|
3,265
|
|
—
|
|
|
—
|
|
|
2,225
|
|
3,265
|
|
5,490
|
|
538
|
|
2006
|
08/05
|
|
40
|
|||||||
|
Ocala, FL
|
—
|
|
|
846
|
|
—
|
|
1,564
|
|
|
—
|
|
|
846
|
|
1,564
|
|
2,410
|
|
295
|
|
2006
|
02/06
|
(m)
|
40
|
|||||||
|
|
|
|
|
|
|
|||||||||||||||||||||||||||
|
LoanMax:
|
|
|
|
|
|
|||||||||||||||||||||||||||
|
Bridgeview, IL
|
—
|
|
|
673
|
|
744
|
|
—
|
|
|
—
|
|
|
673
|
|
744
|
|
1,417
|
|
243
|
|
1997
|
12/01
|
|
40
|
|||||||
|
|
|
|
|
|
|
|||||||||||||||||||||||||||
|
Logan's Roadhouse:
|
|
|
|
|
|
|||||||||||||||||||||||||||
|
Alexandria, LA
|
—
|
|
|
1,218
|
|
3,049
|
|
—
|
|
|
—
|
|
|
1,218
|
|
3,049
|
|
4,267
|
|
619
|
|
1998
|
11/06
|
|
40
|
|||||||
|
Beckley, WV
|
—
|
|
|
1,396
|
|
2,405
|
|
—
|
|
|
—
|
|
|
1,396
|
|
2,405
|
|
3,801
|
|
488
|
|
2006
|
11/06
|
|
40
|
|||||||
|
Cookeville, TN
|
—
|
|
|
1,262
|
|
2,271
|
|
—
|
|
|
—
|
|
|
1,262
|
|
2,271
|
|
3,533
|
|
461
|
|
1997
|
11/06
|
|
40
|
|||||||
|
Greenwood, IN
|
—
|
|
|
1,341
|
|
2,105
|
|
—
|
|
|
—
|
|
|
1,341
|
|
2,105
|
|
3,446
|
|
428
|
|
2000
|
11/06
|
|
40
|
|||||||
|
Hurst, TX
|
—
|
|
|
1,858
|
|
1,916
|
|
—
|
|
|
—
|
|
|
1,858
|
|
1,916
|
|
3,774
|
|
389
|
|
1999
|
11/06
|
|
40
|
|||||||
|
Jackson, TN
|
—
|
|
|
1,200
|
|
2,246
|
|
—
|
|
|
—
|
|
|
1,200
|
|
2,246
|
|
3,446
|
|
456
|
|
1994
|
11/06
|
|
40
|
|||||||
|
Lake Charles, LA
|
—
|
|
|
1,285
|
|
2,202
|
|
—
|
|
|
—
|
|
|
1,285
|
|
2,202
|
|
3,487
|
|
447
|
|
1998
|
11/06
|
|
40
|
|||||||
|
McAllen, TX
|
—
|
|
|
1,608
|
|
2,178
|
|
—
|
|
|
—
|
|
|
1,608
|
|
2,178
|
|
3,786
|
|
442
|
|
2005
|
11/06
|
|
40
|
|||||||
|
Roanoke, VA
|
—
|
|
|
2,302
|
|
1,947
|
|
—
|
|
|
—
|
|
|
2,302
|
|
1,947
|
|
4,249
|
|
396
|
|
1998
|
11/06
|
|
40
|
|||||||
|
San Marcos, TX
|
—
|
|
|
837
|
|
1,453
|
|
—
|
|
|
—
|
|
|
837
|
|
1,453
|
|
2,290
|
|
295
|
|
2000
|
11/06
|
|
40
|
|||||||
|
Smyrna, TN
|
—
|
|
|
1,335
|
|
2,047
|
|
—
|
|
|
—
|
|
|
1,335
|
|
2,047
|
|
3,382
|
|
416
|
|
2002
|
11/06
|
|
40
|
|||||||
|
Franklin, TN
|
—
|
|
|
2,519
|
|
1,705
|
|
—
|
|
|
—
|
|
|
2,519
|
|
1,705
|
|
4,224
|
|
343
|
|
1995
|
12/06
|
|
40
|
|||||||
|
Southhaven, MS
|
—
|
|
|
1,298
|
|
1,338
|
|
—
|
|
|
—
|
|
|
1,298
|
|
1,338
|
|
2,636
|
|
269
|
|
2005
|
12/06
|
|
40
|
|||||||
|
Columbus, MS
|
—
|
|
|
707
|
|
—
|
|
1,681
|
|
|
—
|
|
|
707
|
|
1,681
|
|
2,388
|
|
142
|
|
2011
|
11/10
|
(m)
|
40
|
|||||||
|
Overland Park, KS
|
—
|
|
|
1,166
|
|
—
|
|
1,741
|
|
|
—
|
|
|
1,166
|
|
1,741
|
|
2,907
|
|
136
|
|
2011
|
04/11
|
(m)
|
40
|
|||||||
|
Nashville, TN
|
—
|
|
|
844
|
|
—
|
|
1,592
|
|
|
—
|
|
|
844
|
|
1,592
|
|
2,436
|
|
124
|
|
2011
|
06/11
|
(m)
|
40
|
|||||||
|
Rogers, AR
|
—
|
|
|
900
|
|
—
|
|
1,545
|
|
|
—
|
|
|
909
|
|
1,536
|
|
2,445
|
|
107
|
|
2012
|
09/11
|
(m)
|
40
|
|||||||
|
Kissimmee, FL
|
—
|
|
|
1,159
|
|
—
|
|
1,908
|
|
|
—
|
|
|
1,159
|
|
1,908
|
|
3,067
|
|
117
|
|
2012
|
01/12
|
(m)
|
40
|
|||||||
|
Marion, IL
|
—
|
|
|
1,016
|
|
—
|
|
1,674
|
|
|
—
|
|
|
1,016
|
|
1,674
|
|
2,690
|
|
96
|
|
2012
|
03/12
|
(m)
|
40
|
|||||||
|
Pooler, GA
|
—
|
|
|
1,159
|
|
—
|
|
1,720
|
|
|
—
|
|
|
1,159
|
|
1,720
|
|
2,879
|
|
81
|
|
2013
|
03/12
|
(m)
|
40
|
|||||||
|
Cullman, AL
|
—
|
|
|
889
|
|
—
|
|
1,585
|
|
|
—
|
|
|
889
|
|
1,585
|
|
2,474
|
|
87
|
|
2012
|
04/12
|
(m)
|
40
|
|||||||
|
Lebanon, TN
|
—
|
|
|
789
|
|
—
|
|
1,725
|
|
|
—
|
|
|
789
|
|
1,725
|
|
2,514
|
|
88
|
|
2012
|
06/12
|
(m)
|
40
|
|||||||
|
Chester, VA
|
—
|
|
|
871
|
|
—
|
|
1,697
|
|
|
—
|
|
|
871
|
|
1,697
|
|
2,568
|
|
83
|
|
2013
|
07/12
|
(m)
|
40
|
|||||||
|
Gonzales, LA
|
—
|
|
|
975
|
|
—
|
|
1,696
|
|
|
—
|
|
|
975
|
|
1,696
|
|
2,671
|
|
76
|
|
2013
|
10/12
|
(m)
|
40
|
|||||||
|
Madison, AL
|
—
|
|
|
689
|
|
—
|
|
1,657
|
|
|
—
|
|
|
689
|
|
1,657
|
|
2,346
|
|
67
|
|
2013
|
11/12
|
(m)
|
40
|
|||||||
|
Hopkinsville, KY
|
—
|
|
|
644
|
|
—
|
|
1,788
|
|
|
—
|
|
|
644
|
|
1,788
|
|
2,432
|
|
32
|
|
2014
|
09/13
|
(m)
|
40
|
|||||||
|
Muscle Shoals, AL
|
—
|
|
|
907
|
|
—
|
|
1,506
|
|
|
—
|
|
|
907
|
|
1,506
|
|
2,413
|
|
(q)
|
|
2014
|
06/14
|
(m)
|
(q)
|
|||||||
|
|
|
|
|
|
|
|||||||||||||||||||||||||||
|
Lowe's:
|
|
|
|
|
|
|||||||||||||||||||||||||||
|
Memphis, TN
|
—
|
|
|
3,215
|
|
9,170
|
|
24
|
|
|
—
|
|
|
3,215
|
|
9,194
|
|
12,409
|
|
2,881
|
|
2001
|
06/02
|
|
40
|
|||||||
|
|
|
|
|
|
|
|||||||||||||||||||||||||||
|
Magic China Café:
|
|
|
|
|
|
|||||||||||||||||||||||||||
|
Orlando, FL
|
19
|
|
(h)
|
40
|
|
111
|
|
—
|
|
|
—
|
|
|
40
|
|
111
|
|
151
|
|
30
|
|
2001
|
02/04
|
|
40
|
|||||||
|
|
|
|
|
|
|
|||||||||||||||||||||||||||
|
Magic Mountain:
|
|
|
|
|
|
|||||||||||||||||||||||||||
|
Columbus, OH
|
—
|
|
|
5,380
|
|
2,693
|
|
25
|
|
|
—
|
|
|
5,380
|
|
2,718
|
|
8,098
|
|
509
|
|
1990
|
06/07
|
|
40
|
|||||||
|
Columbus, OH
|
—
|
|
|
2,076
|
|
1,906
|
|
124
|
|
|
—
|
|
|
2,076
|
|
2,030
|
|
4,106
|
|
368
|
|
1990
|
06/07
|
|
40
|
|||||||
|
|
|
|
|
|
|
|||||||||||||||||||||||||||
|
Manny's Barber Shop:
|
|
|
|
|
|
|||||||||||||||||||||||||||
|
Mesa, AZ
|
—
|
|
|
43
|
|
113
|
|
367
|
|
|
—
|
|
|
43
|
|
480
|
|
523
|
|
105
|
|
1997
|
12/01
|
|
40
|
|||||||
|
|
|
|
|
|
|
|||||||||||||||||||||||||||
|
Mariscos Morales Mexican Restaurant:
|
|
|
|
|
|
|||||||||||||||||||||||||||
|
Gresham, OR
|
—
|
|
|
817
|
|
108
|
|
28
|
|
|
—
|
|
|
817
|
|
136
|
|
953
|
|
37
|
|
1993
|
12/01
|
|
40
|
|||||||
|
|
|
|
|
|
|
|||||||||||||||||||||||||||
|
Mattress Firm:
|
|
|
|
|
|
|||||||||||||||||||||||||||
|
Baton Rouge, LA
|
—
|
|
|
609
|
|
914
|
|
—
|
|
|
—
|
|
|
609
|
|
914
|
|
1,523
|
|
434
|
|
1995
|
12/95
|
(m)
|
40
|
|||||||
|
Buford, GA
|
—
|
|
|
635
|
|
1,635
|
|
465
|
|
|
—
|
|
|
635
|
|
2,100
|
|
2,735
|
|
457
|
|
2003
|
07/04
|
(g)
|
40
|
|||||||
|
Lancaster, OH
|
—
|
|
|
600
|
|
—
|
|
793
|
|
|
—
|
|
|
600
|
|
671
|
|
1,271
|
|
40
|
|
2012
|
01/08
|
(g)
|
40
|
|||||||
See accompanying report of independent registered public accounting firm.
F-30
|
Initial Cost to
Company
|
Costs Capitalized
Subsequent to
Acquisition
|
Gross Amount at Which
Carried at Close of Period (a) (b)
|
Life on Which
Depreciation &
Amortization in Latest Income
Statement is
Computed (Years)
|
|||||||||||||||||||||||||||||
|
Encumbrances
|
Land
|
Building,
Improvements &
Leasehold
Interests
|
Improvements
|
Carrying
Costs
|
Land
|
Building,
Improvements &
Leasehold
Interests
|
Total
|
Accumulated
Depreciation
and
Amortization
|
Date of
Construction
|
Date
Acquired
|
||||||||||||||||||||||
|
Real Estate Held for Investment the Company has Invested in Under Operating Leases:
|
||||||||||||||||||||||||||||||||
|
Plainfield, IN
|
—
|
|
|
379
|
|
—
|
|
1,267
|
|
|
—
|
|
|
379
|
|
1,267
|
|
1,646
|
|
12
|
|
2014
|
01/14
|
(m)
|
40
|
|||||||
|
Fayetteville, AR
|
—
|
|
|
891
|
|
2,229
|
|
—
|
|
|
—
|
|
|
891
|
|
2,229
|
|
3,120
|
|
65
|
|
1998
|
02/14
|
|
30
|
|||||||
|
Pocatello, ID
|
—
|
|
|
268
|
|
—
|
|
—
|
|
|
—
|
|
|
268
|
|
(e)
|
|
268
|
|
(e)
|
|
(e)
|
09/14
|
(m)
|
(e)
|
|||||||
|
South Jordan, UT
|
—
|
|
|
719
|
|
—
|
|
—
|
|
|
—
|
|
|
719
|
|
(e)
|
|
719
|
|
(e)
|
|
(e)
|
11/14
|
(m)
|
(e)
|
|||||||
|
|
|
|
|
|
|
|||||||||||||||||||||||||||
|
MC Sports:
|
|
|
|
|
|
|||||||||||||||||||||||||||
|
Lapeer, MI
|
—
|
|
|
408
|
|
2,086
|
|
—
|
|
|
—
|
|
|
408
|
|
2,031
|
|
2,439
|
|
376
|
|
2007
|
10/05
|
|
40
|
|||||||
|
|
|
|
|
|
|
|||||||||||||||||||||||||||
|
MedExpress Urgent Care:
|
|
|
|
|
|
|||||||||||||||||||||||||||
|
Fairmont, WV
|
—
|
|
|
245
|
|
1,859
|
|
—
|
|
|
—
|
|
|
245
|
|
1,859
|
|
2,104
|
|
139
|
|
2011
|
05/12
|
|
35
|
|||||||
|
Hanover, PA
|
—
|
|
|
533
|
|
1,521
|
|
—
|
|
|
—
|
|
|
533
|
|
1,521
|
|
2,054
|
|
114
|
|
2011
|
05/12
|
|
35
|
|||||||
|
Hermitage, PA
|
—
|
|
|
445
|
|
2,108
|
|
—
|
|
|
—
|
|
|
445
|
|
2,108
|
|
2,553
|
|
158
|
|
2011
|
05/12
|
|
35
|
|||||||
|
Latrobe, PA
|
—
|
|
|
681
|
|
1,511
|
|
—
|
|
|
—
|
|
|
681
|
|
1,511
|
|
2,192
|
|
113
|
|
2011
|
05/12
|
|
35
|
|||||||
|
Mt. Pleasant, PA
|
—
|
|
|
593
|
|
1,482
|
|
—
|
|
|
—
|
|
|
593
|
|
1,482
|
|
2,075
|
|
111
|
|
2011
|
05/12
|
|
35
|
|||||||
|
Pittsburgh, PA
|
—
|
|
|
227
|
|
1,936
|
|
—
|
|
|
—
|
|
|
227
|
|
1,936
|
|
2,163
|
|
169
|
|
1970
|
05/12
|
|
30
|
|||||||
|
Martinsburg, WV
|
—
|
|
|
917
|
|
—
|
|
650
|
|
|
—
|
|
|
917
|
|
650
|
|
1,567
|
|
21
|
|
2013
|
12/12
|
(m)
|
40
|
|||||||
|
Wheeling, WV
|
—
|
|
|
485
|
|
1,232
|
|
—
|
|
|
—
|
|
|
485
|
|
1,232
|
|
1,717
|
|
74
|
|
1989
|
03/13
|
|
30
|
|||||||
|
Huntington, WV
|
—
|
|
|
990
|
|
—
|
|
735
|
|
|
—
|
|
|
1,017
|
|
735
|
|
1,752
|
|
22
|
|
2013
|
08/13
|
(m)
|
40
|
|||||||
|
Anderson, IN
|
—
|
|
|
777
|
|
—
|
|
661
|
|
|
—
|
|
|
777
|
|
661
|
|
1,438
|
|
17
|
|
2013
|
08/13
|
(m)
|
40
|
|||||||
|
Terre Haute, IN
|
—
|
|
|
144
|
|
1,616
|
|
—
|
|
|
—
|
|
|
144
|
|
1,616
|
|
1,760
|
|
74
|
|
1991
|
08/13
|
|
30
|
|||||||
|
|
|
|
|
|
|
|||||||||||||||||||||||||||
|
Merchant's Tires:
|
|
|
|
|
|
|||||||||||||||||||||||||||
|
Hampton, VA
|
—
|
|
|
180
|
|
427
|
|
—
|
|
|
—
|
|
|
180
|
|
427
|
|
607
|
|
105
|
|
1986
|
03/05
|
|
40
|
|||||||
|
Newport News, VA
|
—
|
|
|
234
|
|
259
|
|
—
|
|
|
—
|
|
|
234
|
|
259
|
|
493
|
|
63
|
|
1986
|
03/05
|
|
40
|
|||||||
|
Norfolk, VA
|
—
|
|
|
398
|
|
508
|
|
—
|
|
|
—
|
|
|
398
|
|
508
|
|
906
|
|
124
|
|
1986
|
03/05
|
|
40
|
|||||||
|
Rockville, MD
|
—
|
|
|
1,030
|
|
306
|
|
—
|
|
|
—
|
|
|
1,030
|
|
306
|
|
1,336
|
|
75
|
|
1974
|
03/05
|
|
40
|
|||||||
|
Washington, DC
|
—
|
|
|
624
|
|
578
|
|
—
|
|
|
—
|
|
|
624
|
|
578
|
|
1,202
|
|
141
|
|
1983
|
03/05
|
|
40
|
|||||||
|
|
|
|
|
|
|
|||||||||||||||||||||||||||
|
Mi Pueblo Foods:
|
|
|
|
|
|
|||||||||||||||||||||||||||
|
Palo Alto, CA
|
—
|
|
|
2,272
|
|
3,405
|
|
28
|
|
|
—
|
|
|
2,272
|
|
3,433
|
|
5,705
|
|
1,348
|
|
1998
|
12/98
|
(f)
|
40
|
|||||||
|
|
|
|
|
|
|
|||||||||||||||||||||||||||
|
Michaels:
|
|
|
|
|
|
|||||||||||||||||||||||||||
|
Fairfax, VA
|
—
|
|
|
534
|
|
773
|
|
1,369
|
|
|
—
|
|
|
992
|
|
2,141
|
|
3,133
|
|
761
|
|
1995
|
12/95
|
|
40
|
|||||||
|
Altamonte Springs, FL
|
—
|
|
|
1,947
|
|
3,267
|
|
1,198
|
|
|
—
|
|
|
1,947
|
|
3,370
|
|
5,317
|
|
415
|
|
1997
|
09/97
|
|
26
|
|||||||
See accompanying report of independent registered public accounting firm.
F-31
|
Initial Cost to
Company
|
Costs Capitalized
Subsequent to
Acquisition
|
Gross Amount at Which
Carried at Close of Period (a) (b)
|
Life on Which
Depreciation &
Amortization in Latest Income
Statement is
Computed (Years)
|
|||||||||||||||||||||||||||||
|
Encumbrances
|
Land
|
Building,
Improvements &
Leasehold
Interests
|
Improvements
|
Carrying
Costs
|
Land
|
Building,
Improvements &
Leasehold
Interests
|
Total
|
Accumulated
Depreciation
and
Amortization
|
Date of
Construction
|
Date
Acquired
|
||||||||||||||||||||||
|
Real Estate Held for Investment the Company has Invested in Under Operating Leases:
|
||||||||||||||||||||||||||||||||
|
Plymouth Meeting, PA
|
—
|
|
|
2,911
|
|
2,595
|
|
—
|
|
|
—
|
|
|
2,911
|
|
2,595
|
|
5,506
|
|
964
|
|
1999
|
10/98
|
(g)
|
40
|
|||||||
|
Florissant, MO
|
—
|
|
|
523
|
|
617
|
|
1,784
|
|
|
—
|
|
|
524
|
|
2,399
|
|
2,923
|
|
296
|
|
1996
|
04/03
|
(g)
|
40
|
|||||||
|
|
|
|
|
|
|
|||||||||||||||||||||||||||
|
Miller's Ale House:
|
|
|
|
|
|
|||||||||||||||||||||||||||
|
Pensacola, FL
|
—
|
|
|
1,363
|
|
1,842
|
|
—
|
|
|
—
|
|
|
1,363
|
|
1,842
|
|
3,205
|
|
195
|
|
2008
|
04/11
|
|
35
|
|||||||
|
Oviedo, FL
|
—
|
|
|
113
|
|
—
|
|
3,785
|
|
|
—
|
|
|
113
|
|
3,785
|
|
3,898
|
|
209
|
|
2012
|
10/11
|
|
40
|
|||||||
|
|
|
|
|
|
|
|||||||||||||||||||||||||||
|
Mimi's:
|
|
|
|
|
|
|||||||||||||||||||||||||||
|
Tampa, FL
|
—
|
|
|
688
|
|
2,357
|
|
—
|
|
|
—
|
|
|
688
|
|
2,357
|
|
3,045
|
|
69
|
|
2003
|
02/14
|
|
30
|
|||||||
|
|
|
|
|
|
|
|||||||||||||||||||||||||||
|
Mister Car Wash:
|
|
|
|
|
|
|||||||||||||||||||||||||||
|
Anoka, MN
|
—
|
|
|
212
|
|
214
|
|
—
|
|
|
—
|
|
|
212
|
|
214
|
|
426
|
|
110
|
|
1968
|
04/07
|
|
15
|
|||||||
|
Brooklyn Park, MN
|
—
|
|
|
438
|
|
778
|
|
—
|
|
|
—
|
|
|
438
|
|
778
|
|
1,216
|
|
240
|
|
1985
|
04/07
|
|
25
|
|||||||
|
Cedar Rapids, IA
|
—
|
|
|
391
|
|
816
|
|
—
|
|
|
—
|
|
|
391
|
|
816
|
|
1,207
|
|
252
|
|
1989
|
04/07
|
|
25
|
|||||||
|
Clive, IA
|
—
|
|
|
1,141
|
|
935
|
|
—
|
|
|
—
|
|
|
1,141
|
|
935
|
|
2,076
|
|
360
|
|
1983
|
04/07
|
|
20
|
|||||||
|
Cottage Grove, MN
|
—
|
|
|
274
|
|
485
|
|
—
|
|
|
—
|
|
|
274
|
|
485
|
|
759
|
|
149
|
|
1992
|
04/07
|
|
25
|
|||||||
|
Des Moines, IA
|
—
|
|
|
213
|
|
476
|
|
—
|
|
|
—
|
|
|
213
|
|
476
|
|
689
|
|
183
|
|
1964
|
04/07
|
|
20
|
|||||||
|
Des Moines, IA
|
—
|
|
|
249
|
|
596
|
|
—
|
|
|
—
|
|
|
249
|
|
596
|
|
845
|
|
153
|
|
1990
|
04/07
|
|
30
|
|||||||
|
Eden Prairie, MN
|
—
|
|
|
865
|
|
751
|
|
—
|
|
|
—
|
|
|
865
|
|
751
|
|
1,616
|
|
290
|
|
1984
|
04/07
|
|
20
|
|||||||
|
Edina, MN
|
—
|
|
|
894
|
|
687
|
|
—
|
|
|
—
|
|
|
894
|
|
687
|
|
1,581
|
|
265
|
|
1985
|
04/07
|
|
20
|
|||||||
|
Houston, TX
|
—
|
|
|
1,960
|
|
1,145
|
|
—
|
|
|
—
|
|
|
1,960
|
|
1,145
|
|
3,105
|
|
353
|
|
1983
|
04/07
|
|
25
|
|||||||
|
Houston, TX
|
—
|
|
|
288
|
|
466
|
|
—
|
|
|
—
|
|
|
288
|
|
466
|
|
754
|
|
239
|
|
1970
|
04/07
|
|
15
|
|||||||
|
Houston, TX
|
—
|
|
|
3,193
|
|
1,305
|
|
—
|
|
|
—
|
|
|
3,193
|
|
1,305
|
|
4,498
|
|
287
|
|
1995
|
04/07
|
|
35
|
|||||||
|
Houston, TX
|
—
|
|
|
1,347
|
|
1,702
|
|
—
|
|
|
—
|
|
|
1,347
|
|
1,702
|
|
3,049
|
|
437
|
|
1984
|
04/07
|
|
30
|
|||||||
|
Houston, TX
|
—
|
|
|
796
|
|
678
|
|
—
|
|
|
—
|
|
|
796
|
|
678
|
|
1,474
|
|
209
|
|
1986
|
04/07
|
|
25
|
|||||||
|
Houston, TX
|
—
|
|
|
624
|
|
1,108
|
|
—
|
|
|
—
|
|
|
624
|
|
1,108
|
|
1,732
|
|
285
|
|
1988
|
04/07
|
|
30
|
|||||||
|
Houston, TX
|
—
|
|
|
5,126
|
|
1,267
|
|
—
|
|
|
—
|
|
|
5,126
|
|
1,267
|
|
6,393
|
|
279
|
|
1995
|
04/07
|
|
35
|
|||||||
|
Houston, TX
|
—
|
|
|
2,260
|
|
1,806
|
|
—
|
|
|
—
|
|
|
2,260
|
|
1,806
|
|
4,066
|
|
557
|
|
1975
|
04/07
|
|
25
|
|||||||
|
Houston, TX
|
—
|
|
|
1,846
|
|
1,592
|
|
—
|
|
|
—
|
|
|
1,846
|
|
1,592
|
|
3,438
|
|
491
|
|
1983
|
04/07
|
|
25
|
|||||||
|
Humble, TX
|
—
|
|
|
1,204
|
|
1,517
|
|
—
|
|
|
—
|
|
|
1,204
|
|
1,517
|
|
2,721
|
|
334
|
|
1993
|
04/07
|
|
35
|
|||||||
|
Plymouth, MN
|
—
|
|
|
827
|
|
182
|
|
—
|
|
|
—
|
|
|
827
|
|
182
|
|
1,009
|
|
140
|
|
1955
|
04/07
|
|
10
|
|||||||
|
Roseville, MN
|
—
|
|
|
861
|
|
564
|
|
—
|
|
|
—
|
|
|
861
|
|
564
|
|
1,425
|
|
217
|
|
1963
|
04/07
|
|
20
|
|||||||
|
Spokane, WA
|
—
|
|
|
1,253
|
|
1,146
|
|
—
|
|
|
—
|
|
|
1,253
|
|
1,146
|
|
2,399
|
|
252
|
|
1997
|
04/07
|
|
35
|
|||||||
|
Spokane, WA
|
—
|
|
|
214
|
|
580
|
|
—
|
|
|
—
|
|
|
214
|
|
580
|
|
794
|
|
149
|
|
1990
|
04/07
|
|
30
|
|||||||
See accompanying report of independent registered public accounting firm.
F-32
|
Initial Cost to
Company
|
Costs Capitalized
Subsequent to
Acquisition
|
Gross Amount at Which
Carried at Close of Period (a) (b)
|
Life on Which
Depreciation &
Amortization in Latest Income
Statement is
Computed (Years)
|
|||||||||||||||||||||||||||||
|
Encumbrances
|
Land
|
Building,
Improvements &
Leasehold
Interests
|
Improvements
|
Carrying
Costs
|
Land
|
Building,
Improvements &
Leasehold
Interests
|
Total
|
Accumulated
Depreciation
and
Amortization
|
Date of
Construction
|
Date
Acquired
|
||||||||||||||||||||||
|
Real Estate Held for Investment the Company has Invested in Under Operating Leases:
|
||||||||||||||||||||||||||||||||
|
St. Cloud, MN (n)
|
—
|
|
|
243
|
|
391
|
|
—
|
|
|
—
|
|
|
242
|
|
391
|
|
633
|
|
151
|
|
1986
|
04/07
|
|
20
|
|||||||
|
Stillwater, MN
|
—
|
|
|
289
|
|
214
|
|
—
|
|
|
—
|
|
|
289
|
|
214
|
|
503
|
|
110
|
|
1971
|
04/07
|
|
15
|
|||||||
|
Sugarland, TX
|
—
|
|
|
3,789
|
|
1,972
|
|
—
|
|
|
—
|
|
|
3,789
|
|
1,972
|
|
5,761
|
|
434
|
|
1995
|
04/07
|
|
35
|
|||||||
|
West St Paul, MN
|
—
|
|
|
836
|
|
236
|
|
—
|
|
|
—
|
|
|
836
|
|
236
|
|
1,072
|
|
91
|
|
1972
|
04/07
|
|
20
|
|||||||
|
Rochester, MN
|
—
|
|
|
1,055
|
|
2,327
|
|
—
|
|
|
—
|
|
|
1,055
|
|
2,327
|
|
3,382
|
|
419
|
|
2003
|
10/07
|
|
40
|
|||||||
|
Rochester, MN
|
—
|
|
|
319
|
|
451
|
|
—
|
|
|
—
|
|
|
319
|
|
451
|
|
770
|
|
81
|
|
1994
|
10/07
|
|
40
|
|||||||
|
Birmingham, AL
|
—
|
|
|
2,378
|
|
2,145
|
|
—
|
|
|
—
|
|
|
2,378
|
|
2,145
|
|
4,523
|
|
509
|
|
1985
|
11/07
|
|
30
|
|||||||
|
Clearwater, FL
|
—
|
|
|
825
|
|
765
|
|
—
|
|
|
—
|
|
|
825
|
|
765
|
|
1,590
|
|
218
|
|
1969
|
11/07
|
|
25
|
|||||||
|
Mesquite, TX
|
—
|
|
|
1,596
|
|
2,201
|
|
—
|
|
|
—
|
|
|
1,596
|
|
2,201
|
|
3,797
|
|
627
|
|
1987
|
11/07
|
|
25
|
|||||||
|
Seminole, FL
|
—
|
|
|
2,166
|
|
1,496
|
|
—
|
|
|
—
|
|
|
2,166
|
|
1,496
|
|
3,662
|
|
355
|
|
1985
|
11/07
|
|
30
|
|||||||
|
Tampa, FL
|
—
|
|
|
2,993
|
|
1,669
|
|
—
|
|
|
—
|
|
|
2,993
|
|
1,669
|
|
4,662
|
|
476
|
|
1969
|
11/07
|
|
25
|
|||||||
|
Vestavia Hills, AL
|
—
|
|
|
1,009
|
|
956
|
|
—
|
|
|
—
|
|
|
1,009
|
|
956
|
|
1,965
|
|
272
|
|
1967
|
11/07
|
|
25
|
|||||||
|
El Paso, TX
|
—
|
|
|
1,424
|
|
1,306
|
|
—
|
|
|
—
|
|
|
1,424
|
|
1,306
|
|
2,730
|
|
306
|
|
1986
|
12/07
|
|
30
|
|||||||
|
El Paso, TX
|
—
|
|
|
1,807
|
|
2,287
|
|
—
|
|
|
—
|
|
|
1,807
|
|
2,287
|
|
4,094
|
|
403
|
|
1983
|
12/07
|
|
40
|
|||||||
|
El Paso, TX
|
—
|
|
|
664
|
|
824
|
|
—
|
|
|
—
|
|
|
664
|
|
824
|
|
1,488
|
|
145
|
|
1991
|
12/07
|
|
40
|
|||||||
|
El Paso, TX
|
—
|
|
|
1,399
|
|
1,468
|
|
—
|
|
|
—
|
|
|
1,399
|
|
1,468
|
|
2,867
|
|
259
|
|
1991
|
12/07
|
|
40
|
|||||||
|
El Paso, TX
|
—
|
|
|
988
|
|
1,046
|
|
—
|
|
|
—
|
|
|
988
|
|
1,046
|
|
2,034
|
|
184
|
|
1998
|
12/07
|
|
40
|
|||||||
|
Tampa, FL
|
—
|
|
|
541
|
|
829
|
|
—
|
|
|
—
|
|
|
541
|
|
829
|
|
1,370
|
|
156
|
|
1978
|
04/10
|
|
25
|
|||||||
|
Springfield, MO
|
—
|
|
|
1,064
|
|
2,109
|
|
—
|
|
|
—
|
|
|
1,064
|
|
2,109
|
|
3,173
|
|
243
|
|
1990
|
07/11
|
|
30
|
|||||||
|
Springfield, MO
|
—
|
|
|
1,188
|
|
2,817
|
|
—
|
|
|
—
|
|
|
1,188
|
|
2,817
|
|
4,005
|
|
278
|
|
2000
|
07/11
|
|
35
|
|||||||
|
Springfield, MO
|
—
|
|
|
642
|
|
1,767
|
|
—
|
|
|
—
|
|
|
642
|
|
1,767
|
|
2,409
|
|
203
|
|
1979
|
07/11
|
|
30
|
|||||||
|
Missouri City, TX
|
—
|
|
|
549
|
|
1,553
|
|
—
|
|
|
—
|
|
|
549
|
|
1,553
|
|
2,102
|
|
139
|
|
2004
|
11/11
|
|
35
|
|||||||
|
Bountiful, UT
|
—
|
|
|
484
|
|
292
|
|
—
|
|
|
—
|
|
|
484
|
|
292
|
|
776
|
|
29
|
|
1995
|
01/12
|
|
30
|
|||||||
|
Salt Lake City, UT
|
—
|
|
|
522
|
|
1,806
|
|
—
|
|
|
—
|
|
|
522
|
|
1,806
|
|
2,328
|
|
178
|
|
1993
|
01/12
|
|
30
|
|||||||
|
Tucson, AZ
|
—
|
|
|
742
|
|
2,226
|
|
—
|
|
|
—
|
|
|
742
|
|
2,226
|
|
2,968
|
|
219
|
|
2000
|
01/12
|
|
30
|
|||||||
|
Tucson, AZ
|
—
|
|
|
946
|
|
2,566
|
|
—
|
|
|
—
|
|
|
946
|
|
2,566
|
|
3,512
|
|
253
|
|
2003
|
01/12
|
|
30
|
|||||||
|
Tucson, AZ
|
—
|
|
|
108
|
|
778
|
|
—
|
|
|
—
|
|
|
108
|
|
778
|
|
886
|
|
77
|
|
2004
|
01/12
|
|
30
|
|||||||
|
Tucson, AZ
|
—
|
|
|
493
|
|
345
|
|
—
|
|
|
—
|
|
|
493
|
|
345
|
|
838
|
|
29
|
|
2007
|
01/12
|
|
35
|
|||||||
|
Cedar Park, TX
|
—
|
|
|
794
|
|
1,316
|
|
—
|
|
|
—
|
|
|
794
|
|
1,316
|
|
2,110
|
|
102
|
|
2009
|
04/12
|
|
35
|
|||||||
|
Spokane Valley, WA
|
—
|
|
|
454
|
|
857
|
|
—
|
|
|
—
|
|
|
454
|
|
857
|
|
1,311
|
|
66
|
|
2005
|
04/12
|
|
35
|
|||||||
|
Salt Lake City, UT
|
—
|
|
|
781
|
|
2,303
|
|
—
|
|
|
—
|
|
|
781
|
|
2,303
|
|
3,084
|
|
162
|
|
2009
|
07/12
|
|
35
|
|||||||
|
Charlotte, NC
|
—
|
|
|
693
|
|
1,315
|
|
—
|
|
|
—
|
|
|
693
|
|
1,315
|
|
2,008
|
|
121
|
|
1981
|
09/12
|
|
25
|
|||||||
|
College Park, GA
|
—
|
|
|
322
|
|
1,056
|
|
—
|
|
|
—
|
|
|
322
|
|
1,056
|
|
1,378
|
|
69
|
|
2008
|
09/12
|
|
35
|
|||||||
|
Griffin, GA
|
—
|
|
|
401
|
|
2,897
|
|
—
|
|
|
—
|
|
|
401
|
|
2,897
|
|
3,298
|
|
190
|
|
2007
|
09/12
|
|
35
|
|||||||
See accompanying report of independent registered public accounting firm.
F-33
|
Initial Cost to
Company
|
Costs Capitalized
Subsequent to
Acquisition
|
Gross Amount at Which
Carried at Close of Period (a) (b)
|
Life on Which
Depreciation &
Amortization in Latest Income
Statement is
Computed (Years)
|
|||||||||||||||||||||||||||||
|
Encumbrances
|
Land
|
Building,
Improvements &
Leasehold
Interests
|
Improvements
|
Carrying
Costs
|
Land
|
Building,
Improvements &
Leasehold
Interests
|
Total
|
Accumulated
Depreciation
and
Amortization
|
Date of
Construction
|
Date
Acquired
|
||||||||||||||||||||||
|
Real Estate Held for Investment the Company has Invested in Under Operating Leases:
|
||||||||||||||||||||||||||||||||
|
Hampton, GA
|
—
|
|
|
421
|
|
1,996
|
|
—
|
|
|
—
|
|
|
421
|
|
1,996
|
|
2,417
|
|
131
|
|
2006
|
09/12
|
|
35
|
|||||||
|
Lilburn, GA
|
—
|
|
|
381
|
|
2,426
|
|
—
|
|
|
—
|
|
|
381
|
|
2,426
|
|
2,807
|
|
159
|
|
2007
|
09/12
|
|
35
|
|||||||
|
Matthews, NC
|
—
|
|
|
664
|
|
664
|
|
—
|
|
|
—
|
|
|
664
|
|
664
|
|
1,328
|
|
51
|
|
1990
|
09/12
|
|
30
|
|||||||
|
Oxford, AL
|
—
|
|
|
301
|
|
3,607
|
|
—
|
|
|
—
|
|
|
301
|
|
3,607
|
|
3,908
|
|
236
|
|
2008
|
09/12
|
|
35
|
|||||||
|
Pineville, NC
|
—
|
|
|
723
|
|
1,195
|
|
—
|
|
|
—
|
|
|
723
|
|
1,195
|
|
1,918
|
|
91
|
|
1990
|
09/12
|
|
30
|
|||||||
|
Clermont, FL
|
—
|
|
|
783
|
|
2,328
|
|
—
|
|
|
—
|
|
|
783
|
|
2,328
|
|
3,111
|
|
147
|
|
2006
|
10/12
|
|
35
|
|||||||
|
Springfield, MO
|
—
|
|
|
474
|
|
736
|
|
—
|
|
|
—
|
|
|
474
|
|
736
|
|
1,210
|
|
55
|
|
2006
|
10/12
|
|
30
|
|||||||
|
Abilene, TX
|
—
|
|
|
641
|
|
3,093
|
|
—
|
|
|
—
|
|
|
641
|
|
3,093
|
|
3,734
|
|
188
|
|
2006
|
11/12
|
|
35
|
|||||||
|
Abilene, TX
|
—
|
|
|
101
|
|
426
|
|
—
|
|
|
—
|
|
|
101
|
|
426
|
|
527
|
|
26
|
|
2009
|
11/12
|
|
35
|
|||||||
|
Lubbock, TX
|
—
|
|
|
411
|
|
2,534
|
|
—
|
|
|
—
|
|
|
411
|
|
2,534
|
|
2,945
|
|
179
|
|
2003
|
11/12
|
|
30
|
|||||||
|
Lubbock, TX
|
—
|
|
|
400
|
|
3,403
|
|
—
|
|
|
—
|
|
|
400
|
|
3,403
|
|
3,803
|
|
207
|
|
2004
|
11/12
|
|
35
|
|||||||
|
Lubbock, TX
|
—
|
|
|
350
|
|
2,984
|
|
—
|
|
|
—
|
|
|
350
|
|
2,984
|
|
3,334
|
|
181
|
|
2007
|
11/12
|
|
35
|
|||||||
|
Ephrata, PA
|
—
|
|
|
241
|
|
2,797
|
|
—
|
|
|
—
|
|
|
241
|
|
2,797
|
|
3,038
|
|
228
|
|
1987
|
12/12
|
|
25
|
|||||||
|
Lancaster, PA
|
—
|
|
|
920
|
|
7,894
|
|
—
|
|
|
—
|
|
|
920
|
|
7,894
|
|
8,814
|
|
537
|
|
1999
|
12/12
|
|
30
|
|||||||
|
Sinking Spring, PA
|
—
|
|
|
1,251
|
|
4,735
|
|
—
|
|
|
—
|
|
|
1,251
|
|
4,735
|
|
5,986
|
|
322
|
|
2005
|
12/12
|
|
30
|
|||||||
|
York, PA
|
—
|
|
|
591
|
|
4,605
|
|
—
|
|
|
—
|
|
|
591
|
|
4,605
|
|
5,196
|
|
313
|
|
1995
|
12/12
|
|
30
|
|||||||
|
Atlanta, GA
|
—
|
|
|
1,773
|
|
4,528
|
|
—
|
|
|
—
|
|
|
1,773
|
|
4,528
|
|
6,301
|
|
264
|
|
2003
|
12/12
|
|
35
|
|||||||
|
Atlanta, GA
|
—
|
|
|
1,633
|
|
5,378
|
|
—
|
|
|
—
|
|
|
1,633
|
|
5,378
|
|
7,011
|
|
366
|
|
1998
|
12/12
|
|
30
|
|||||||
|
Urbandale, IA
|
—
|
|
|
485
|
|
374
|
|
—
|
|
|
—
|
|
|
485
|
|
374
|
|
859
|
|
21
|
|
1990
|
04/13
|
|
30
|
|||||||
|
Houston, TX
|
—
|
|
|
752
|
|
1,736
|
|
—
|
|
|
—
|
|
|
752
|
|
1,736
|
|
2,488
|
|
76
|
|
2005
|
06/13
|
|
35
|
|||||||
|
Houston, TX
|
—
|
|
|
1,573
|
|
2,315
|
|
—
|
|
|
—
|
|
|
1,573
|
|
2,315
|
|
3,888
|
|
102
|
|
2006
|
06/13
|
|
35
|
|||||||
|
Houston, TX
|
—
|
|
|
542
|
|
1,876
|
|
—
|
|
|
—
|
|
|
542
|
|
1,876
|
|
2,418
|
|
83
|
|
2012
|
06/13
|
|
35
|
|||||||
|
Houston, TX
|
—
|
|
|
551
|
|
2,967
|
|
—
|
|
|
—
|
|
|
551
|
|
2,967
|
|
3,518
|
|
183
|
|
1980
|
06/13
|
|
25
|
|||||||
|
Houston, TX
|
—
|
|
|
713
|
|
964
|
|
—
|
|
|
—
|
|
|
713
|
|
964
|
|
1,677
|
|
42
|
|
2005
|
06/13
|
|
35
|
|||||||
|
Humble, TX
|
—
|
|
|
611
|
|
3,327
|
|
—
|
|
|
—
|
|
|
611
|
|
3,327
|
|
3,938
|
|
147
|
|
2006
|
06/13
|
|
35
|
|||||||
|
Katy, TX
|
—
|
|
|
421
|
|
2,157
|
|
—
|
|
|
—
|
|
|
421
|
|
2,157
|
|
2,578
|
|
111
|
|
2002
|
06/13
|
|
30
|
|||||||
|
Spring, TX
|
—
|
|
|
652
|
|
2,627
|
|
—
|
|
|
—
|
|
|
652
|
|
2,627
|
|
3,279
|
|
116
|
|
2006
|
06/13
|
|
35
|
|||||||
|
Tucson, AZ
|
—
|
|
|
654
|
|
1,357
|
|
—
|
|
|
—
|
|
|
654
|
|
1,357
|
|
2,011
|
|
58
|
|
1986
|
09/13
|
|
30
|
|||||||
|
Rochester, MN
|
—
|
|
|
396
|
|
264
|
|
—
|
|
|
—
|
|
|
396
|
|
264
|
|
660
|
|
8
|
|
1987
|
02/14
|
|
30
|
|||||||
|
Tucson, AZ
|
—
|
|
|
988
|
|
272
|
|
—
|
|
|
—
|
|
|
988
|
|
272
|
|
1,260
|
|
8
|
|
1987
|
02/14
|
|
30
|
|||||||
|
|
|
|
|
|
|
|||||||||||||||||||||||||||
|
Movie Tavern Theatre:
|
|
|
|
|
|
|||||||||||||||||||||||||||
|
Covington, LA
|
—
|
|
|
1,081
|
|
6,779
|
|
—
|
|
|
—
|
|
|
1,081
|
|
6,779
|
|
7,860
|
|
66
|
|
1993
|
09/14
|
|
30
|
|||||||
|
Baton Rouge, LA
|
—
|
|
|
1,497
|
|
—
|
|
—
|
|
|
—
|
|
|
1,497
|
|
(e)
|
|
1,497
|
|
(e)
|
|
(e)
|
11/14
|
(m)
|
(e)
|
|||||||
See accompanying report of independent registered public accounting firm.
F-34
|
Initial Cost to
Company
|
Costs Capitalized
Subsequent to
Acquisition
|
Gross Amount at Which
Carried at Close of Period (a) (b)
|
Life on Which
Depreciation &
Amortization in Latest Income
Statement is
Computed (Years)
|
|||||||||||||||||||||||||||||
|
Encumbrances
|
Land
|
Building,
Improvements &
Leasehold
Interests
|
Improvements
|
Carrying
Costs
|
Land
|
Building,
Improvements &
Leasehold
Interests
|
Total
|
Accumulated
Depreciation
and
Amortization
|
Date of
Construction
|
Date
Acquired
|
||||||||||||||||||||||
|
Real Estate Held for Investment the Company has Invested in Under Operating Leases:
|
||||||||||||||||||||||||||||||||
|
Muchas Gracias Mexican Restaurant:
|
|
|
|
|
|
|||||||||||||||||||||||||||
|
Salem, OR
|
—
|
|
|
556
|
|
736
|
|
—
|
|
|
—
|
|
|
556
|
|
736
|
|
1,292
|
|
240
|
|
1996
|
12/01
|
|
40
|
|||||||
|
|
|
|
|
|
|
|||||||||||||||||||||||||||
|
My Big Fat Greek Restaurant:
|
|
|
|
|
|
|||||||||||||||||||||||||||
|
Tucson, AZ
|
—
|
|
|
996
|
|
—
|
|
2,742
|
|
|
—
|
|
|
996
|
|
2,742
|
|
3,738
|
|
500
|
|
2007
|
12/06
|
(m)
|
40
|
|||||||
|
|
|
|
|
|
|
|
|
|
|
|||||||||||||||||||||||
|
National Karate Academy:
|
|
|
|
|
|
|
|
|
|
|||||||||||||||||||||||
|
Eden Prairie, MN
|
—
|
|
|
76
|
|
211
|
|
110
|
|
|
—
|
|
|
76
|
|
321
|
|
397
|
|
97
|
|
1997
|
12/01
|
|
40
|
|||||||
|
|
|
|
|
|
|
|
|
|
|
|
|
|
|
|
|
|
|
|
|
|
|
|
|
|||||||||
|
Natural Grocers:
|
|
|
|
|
|
|||||||||||||||||||||||||||
|
Lincoln, NE
|
—
|
|
|
1,482
|
|
2,811
|
|
—
|
|
|
—
|
|
|
1,482
|
|
2,811
|
|
4,293
|
|
137
|
|
2012
|
04/13
|
|
35
|
|||||||
|
Coeur D'Alene, ID
|
—
|
|
|
2,172
|
|
—
|
|
2,778
|
|
|
—
|
|
|
2,172
|
|
2,778
|
|
4,950
|
|
55
|
|
2014
|
08/13
|
|
40
|
|||||||
|
Flagstaff, AZ
|
3,253
|
|
(p)
|
831
|
|
4,079
|
|
—
|
|
|
—
|
|
|
831
|
|
4,079
|
|
4,910
|
|
15
|
|
2012
|
11/14
|
|
35
|
|||||||
|
Helena, MT
|
2,854
|
|
(p)
|
1,079
|
|
3,062
|
|
—
|
|
|
—
|
|
|
1,079
|
|
3,062
|
|
4,141
|
|
11
|
|
2012
|
11/14
|
|
35
|
|||||||
|
Missoula, MT
|
2,541
|
|
(p)
|
929
|
|
3,222
|
|
—
|
|
|
—
|
|
|
929
|
|
3,222
|
|
4,151
|
|
12
|
|
2012
|
11/14
|
|
35
|
|||||||
|
Sedona, AZ
|
2,990
|
|
(p)
|
1,064
|
|
3,211
|
|
—
|
|
|
—
|
|
|
1,064
|
|
3,211
|
|
4,275
|
|
11
|
|
2012
|
11/14
|
|
35
|
|||||||
|
Steamboat Springs, CO
|
3,461
|
|
(p)
|
1,512
|
|
3,447
|
|
—
|
|
|
—
|
|
|
1,512
|
|
3,447
|
|
4,959
|
|
12
|
|
2012
|
11/14
|
|
35
|
|||||||
|
Independence, MO
|
—
|
|
|
912
|
|
5,002
|
|
—
|
|
|
—
|
|
|
912
|
|
5,002
|
|
5,914
|
|
7
|
|
2002
|
12/14
|
|
30
|
|||||||
|
|
|
|
|
|
|
|||||||||||||||||||||||||||
|
Nebraskaland Tire:
|
|
|
|
|
|
|||||||||||||||||||||||||||
|
Park City, KS
|
—
|
|
|
214
|
|
687
|
|
—
|
|
|
—
|
|
|
214
|
|
687
|
|
901
|
|
328
|
|
1989
|
06/05
|
|
20
|
|||||||
|
|
|
|
|
|
|
|||||||||||||||||||||||||||
|
Nitlantika:
|
|
|
|
|
|
|||||||||||||||||||||||||||
|
Hollywood, FL
|
—
|
|
|
383
|
|
88
|
|
37
|
|
|
—
|
|
|
234
|
|
—
|
|
234
|
|
—
|
|
1960
|
12/05
|
|
15
|
|||||||
|
|
|
|
|
|
|
|||||||||||||||||||||||||||
|
Northern Tool:
|
|
|
|
|
|
|||||||||||||||||||||||||||
|
Asheville, NC
|
—
|
|
|
519
|
|
2,998
|
|
—
|
|
|
—
|
|
|
519
|
|
2,998
|
|
3,517
|
|
225
|
|
2007
|
05/12
|
|
35
|
|||||||
|
Spartanburg, SC
|
2,922
|
|
|
654
|
|
3,174
|
|
—
|
|
|
—
|
|
|
654
|
|
3,174
|
|
3,828
|
|
31
|
|
2007
|
09/14
|
|
30
|
|||||||
|
|
|
|
|
|
|
|||||||||||||||||||||||||||
|
Office Depot:
|
|
|
|
|
|
|||||||||||||||||||||||||||
|
Gastonia, NC
|
—
|
|
|
1,554
|
|
2,367
|
|
946
|
|
|
—
|
|
|
1,554
|
|
3,313
|
|
4,867
|
|
681
|
|
2004
|
12/04
|
|
40
|
|||||||
|
|
|
|
|
|
|
|||||||||||||||||||||||||||
|
OfficeMax:
|
|
|
|
|
|
|||||||||||||||||||||||||||
See accompanying report of independent registered public accounting firm.
F-35
|
Initial Cost to
Company
|
Costs Capitalized
Subsequent to
Acquisition
|
Gross Amount at Which
Carried at Close of Period (a) (b)
|
Life on Which
Depreciation &
Amortization in Latest Income
Statement is
Computed (Years)
|
|||||||||||||||||||||||||||||
|
Encumbrances
|
Land
|
Building,
Improvements &
Leasehold
Interests
|
Improvements
|
Carrying
Costs
|
Land
|
Building,
Improvements &
Leasehold
Interests
|
Total
|
Accumulated
Depreciation
and
Amortization
|
Date of
Construction
|
Date
Acquired
|
||||||||||||||||||||||
|
Real Estate Held for Investment the Company has Invested in Under Operating Leases:
|
||||||||||||||||||||||||||||||||
|
Cincinnati, OH
|
—
|
|
|
543
|
|
1,575
|
|
—
|
|
|
—
|
|
|
543
|
|
1,575
|
|
2,118
|
|
806
|
|
1994
|
07/94
|
|
40
|
|||||||
|
Evanston, IL
|
—
|
|
|
1,868
|
|
1,758
|
|
—
|
|
|
—
|
|
|
1,868
|
|
1,758
|
|
3,626
|
|
860
|
|
1995
|
06/95
|
|
40
|
|||||||
|
Altamonte Springs, FL
|
—
|
|
|
1,690
|
|
3,050
|
|
—
|
|
|
—
|
|
|
1,690
|
|
3,050
|
|
4,740
|
|
1,440
|
|
1995
|
01/96
|
|
40
|
|||||||
|
Sacramento, CA
|
—
|
|
|
1,144
|
|
2,961
|
|
—
|
|
|
—
|
|
|
1,144
|
|
2,961
|
|
4,105
|
|
1,333
|
|
1996
|
12/96
|
|
40
|
|||||||
|
Salinas, CA
|
—
|
|
|
1,353
|
|
1,829
|
|
—
|
|
|
—
|
|
|
1,353
|
|
1,829
|
|
3,182
|
|
817
|
|
1995
|
02/97
|
|
40
|
|||||||
|
Redding, CA
|
—
|
|
|
667
|
|
2,182
|
|
—
|
|
|
—
|
|
|
667
|
|
2,182
|
|
2,849
|
|
957
|
|
1997
|
06/97
|
|
40
|
|||||||
|
Kelso, WA
|
—
|
|
|
868
|
|
—
|
|
1,806
|
|
|
—
|
|
|
868
|
|
1,806
|
|
2,674
|
|
765
|
|
1998
|
09/97
|
(g)
|
40
|
|||||||
|
Lynchburg, VA
|
—
|
|
|
562
|
|
—
|
|
1,851
|
|
|
—
|
|
|
562
|
|
1,851
|
|
2,413
|
|
754
|
|
1998
|
02/98
|
(m)
|
40
|
|||||||
|
Tigard, OR
|
—
|
|
|
1,540
|
|
2,247
|
|
—
|
|
|
—
|
|
|
1,540
|
|
2,247
|
|
3,787
|
|
906
|
|
1995
|
11/98
|
|
40
|
|||||||
|
Griffin, GA
|
—
|
|
|
685
|
|
—
|
|
1,802
|
|
|
—
|
|
|
685
|
|
1,802
|
|
2,487
|
|
708
|
|
1999
|
11/98
|
(g)
|
40
|
|||||||
|
Omaha, NE
|
—
|
|
|
664
|
|
1,778
|
|
—
|
|
|
—
|
|
|
664
|
|
1,778
|
|
2,442
|
|
41
|
|
1995
|
07/14
|
|
20
|
|||||||
|
Weatherford, TX
|
—
|
|
|
548
|
|
2,436
|
|
—
|
|
|
—
|
|
|
548
|
|
2,436
|
|
2,984
|
|
24
|
|
1999
|
09/14
|
|
30
|
|||||||
|
|
|
|
|
|
|
|||||||||||||||||||||||||||
|
Orchard Supply Hardware:
|
|
|
|
|
|
|||||||||||||||||||||||||||
|
Pismo Beach, CA
|
—
|
|
|
2,436
|
|
1,997
|
|
2,339
|
|
|
—
|
|
|
2,436
|
|
4,336
|
|
6,772
|
|
442
|
|
1989
|
12/11
|
(o)
|
25
|
|||||||
|
San Jose, CA
|
—
|
|
|
4,092
|
|
4,279
|
|
3,307
|
|
|
—
|
|
|
4,092
|
|
7,586
|
|
11,678
|
|
802
|
|
1982
|
12/11
|
(o)
|
25
|
|||||||
|
San Jose, CA
|
—
|
|
|
6,406
|
|
2,457
|
|
3,374
|
|
|
—
|
|
|
6,406
|
|
5,831
|
|
12,237
|
|
586
|
|
1982
|
12/11
|
(o)
|
25
|
|||||||
|
Chico, CA
|
—
|
|
|
1,782
|
|
4,563
|
|
746
|
|
|
—
|
|
|
1,782
|
|
5,308
|
|
7,090
|
|
407
|
|
2002
|
07/12
|
(o)
|
30
|
|||||||
|
Clovis, CA
|
—
|
|
|
1,226
|
|
1,426
|
|
151
|
|
|
—
|
|
|
1,226
|
|
1,577
|
|
2,803
|
|
150
|
|
1982
|
07/12
|
(o)
|
25
|
|||||||
|
Pinole, CA
|
—
|
|
|
2,784
|
|
5,195
|
|
—
|
|
|
—
|
|
|
2,784
|
|
5,195
|
|
7,979
|
|
511
|
|
1987
|
07/12
|
(o)
|
25
|
|||||||
|
San Jose, CA
|
—
|
|
|
3,370
|
|
2,517
|
|
—
|
|
|
—
|
|
|
3,370
|
|
2,517
|
|
5,887
|
|
248
|
|
1965
|
07/12
|
|
25
|
|||||||
|
San Jose, CA
|
—
|
|
|
5,850
|
|
4,129
|
|
—
|
|
|
—
|
|
|
5,850
|
|
4,129
|
|
9,979
|
|
406
|
|
1946
|
07/12
|
(o)
|
25
|
|||||||
|
Van Nuys, CA
|
—
|
|
|
5,493
|
|
4,133
|
|
2,301
|
|
|
—
|
|
|
5,493
|
|
6,435
|
|
11,928
|
|
531
|
|
1988
|
07/12
|
(o)
|
25
|
|||||||
|
|
|
|
|
|
|
|||||||||||||||||||||||||||
|
Orlando Metro Gymnastics:
|
|
|
|
|
|
|||||||||||||||||||||||||||
|
Orlando, FL
|
—
|
|
|
428
|
|
1,345
|
|
—
|
|
|
—
|
|
|
428
|
|
1,345
|
|
1,773
|
|
335
|
|
2003
|
01/05
|
|
40
|
|||||||
|
|
|
|
|
|
|
|||||||||||||||||||||||||||
|
Outback:
|
|
|
|
|
|
|||||||||||||||||||||||||||
|
Cheyenne, WY
|
—
|
|
|
672
|
|
2,502
|
|
—
|
|
|
—
|
|
|
672
|
|
2,502
|
|
3,174
|
|
233
|
|
2001
|
03/12
|
|
30
|
|||||||
|
Conroe, TX
|
—
|
|
|
524
|
|
583
|
|
—
|
|
|
—
|
|
|
524
|
|
583
|
|
1,107
|
|
65
|
|
1992
|
03/12
|
|
25
|
|||||||
|
Copley Township, OH
|
—
|
|
|
753
|
|
2,407
|
|
—
|
|
|
—
|
|
|
753
|
|
2,407
|
|
3,160
|
|
269
|
|
1993
|
03/12
|
|
25
|
|||||||
|
Coraopolis, PA
|
—
|
|
|
487
|
|
2,326
|
|
—
|
|
|
—
|
|
|
487
|
|
2,326
|
|
2,813
|
|
216
|
|
1998
|
03/12
|
|
30
|
|||||||
|
Denver, CO
|
—
|
|
|
850
|
|
1,305
|
|
—
|
|
|
—
|
|
|
850
|
|
1,305
|
|
2,155
|
|
104
|
|
2003
|
03/12
|
|
35
|
|||||||
|
Knoxville, TN
|
—
|
|
|
753
|
|
1,852
|
|
—
|
|
|
—
|
|
|
753
|
|
1,852
|
|
2,605
|
|
148
|
|
2004
|
03/12
|
|
35
|
|||||||
See accompanying report of independent registered public accounting firm.
F-36
|
Initial Cost to
Company
|
Costs Capitalized
Subsequent to
Acquisition
|
Gross Amount at Which
Carried at Close of Period (a) (b)
|
Life on Which
Depreciation &
Amortization in Latest Income
Statement is
Computed (Years)
|
|||||||||||||||||||||||||||||
|
Encumbrances
|
Land
|
Building,
Improvements &
Leasehold
Interests
|
Improvements
|
Carrying
Costs
|
Land
|
Building,
Improvements &
Leasehold
Interests
|
Total
|
Accumulated
Depreciation
and
Amortization
|
Date of
Construction
|
Date
Acquired
|
||||||||||||||||||||||
|
Real Estate Held for Investment the Company has Invested in Under Operating Leases:
|
||||||||||||||||||||||||||||||||
|
Largo, MD
|
—
|
|
|
1,738
|
|
2,227
|
|
—
|
|
|
—
|
|
|
1,738
|
|
2,227
|
|
3,965
|
|
207
|
|
2001
|
03/12
|
|
30
|
|||||||
|
Lufkin, TX
|
—
|
|
|
850
|
|
1,147
|
|
—
|
|
|
—
|
|
|
850
|
|
1,147
|
|
1,997
|
|
107
|
|
1999
|
03/12
|
|
30
|
|||||||
|
Marrero, LA
|
—
|
|
|
781
|
|
3,144
|
|
—
|
|
|
—
|
|
|
781
|
|
3,144
|
|
3,925
|
|
351
|
|
1995
|
03/12
|
|
25
|
|||||||
|
Mechanicsville, VA
|
—
|
|
|
674
|
|
2,328
|
|
—
|
|
|
—
|
|
|
674
|
|
2,328
|
|
3,002
|
|
217
|
|
2002
|
03/12
|
|
30
|
|||||||
|
Mt. Pleasant, SC
|
—
|
|
|
713
|
|
1,466
|
|
—
|
|
|
—
|
|
|
713
|
|
1,466
|
|
2,179
|
|
136
|
|
1999
|
03/12
|
|
30
|
|||||||
|
Phoenix, AZ
|
—
|
|
|
821
|
|
2,284
|
|
—
|
|
|
—
|
|
|
821
|
|
2,284
|
|
3,105
|
|
213
|
|
2002
|
03/12
|
|
30
|
|||||||
|
Shreveport, LA
|
—
|
|
|
633
|
|
3,105
|
|
—
|
|
|
—
|
|
|
633
|
|
3,105
|
|
3,738
|
|
347
|
|
1994
|
03/12
|
|
25
|
|||||||
|
Smithfield, NC
|
—
|
|
|
772
|
|
2,345
|
|
—
|
|
|
—
|
|
|
772
|
|
2,345
|
|
3,117
|
|
187
|
|
2004
|
03/12
|
|
35
|
|||||||
|
Stockbridge, GA
|
—
|
|
|
910
|
|
1,988
|
|
—
|
|
|
—
|
|
|
910
|
|
1,988
|
|
2,898
|
|
185
|
|
2001
|
03/12
|
|
30
|
|||||||
|
Troy, OH
|
—
|
|
|
456
|
|
1,575
|
|
—
|
|
|
—
|
|
|
456
|
|
1,575
|
|
2,031
|
|
126
|
|
2004
|
03/12
|
|
35
|
|||||||
|
Venice, FL
|
—
|
|
|
833
|
|
2,529
|
|
—
|
|
|
—
|
|
|
833
|
|
2,529
|
|
3,362
|
|
235
|
|
2001
|
03/12
|
|
30
|
|||||||
|
Warrenton, VA
|
—
|
|
|
1,833
|
|
2,021
|
|
—
|
|
|
—
|
|
|
1,833
|
|
2,021
|
|
3,854
|
|
188
|
|
2001
|
03/12
|
|
30
|
|||||||
|
Wheaton, IL
|
—
|
|
|
901
|
|
654
|
|
—
|
|
|
—
|
|
|
901
|
|
654
|
|
1,555
|
|
73
|
|
1994
|
03/12
|
|
25
|
|||||||
|
Fultondale, AL
|
—
|
|
|
765
|
|
2,097
|
|
—
|
|
|
—
|
|
|
765
|
|
2,097
|
|
2,862
|
|
9
|
|
1998
|
11/14
|
|
30
|
|||||||
|
|
|
|
|
|
|
|||||||||||||||||||||||||||
|
Palais Royale:
|
|
|
|
|
|
|||||||||||||||||||||||||||
|
Sealy, TX
|
—
|
|
|
457
|
|
504
|
|
1,769
|
|
|
—
|
|
|
462
|
|
2,273
|
|
2,735
|
|
476
|
|
1982
|
03/99
|
|
40
|
|||||||
|
|
|
|
|
|
|
|||||||||||||||||||||||||||
|
Panda Express:
|
|
|
|
|
|
|||||||||||||||||||||||||||
|
Florissant, MO
|
—
|
|
|
50
|
|
59
|
|
170
|
|
|
—
|
|
|
50
|
|
228
|
|
278
|
|
28
|
|
2012
|
04/03
|
(g)
|
40
|
|||||||
|
|
|
|
|
|
|
|||||||||||||||||||||||||||
|
Pantry I Petroleum:
|
|
|
|
|
|
|||||||||||||||||||||||||||
|
Avis, PA
|
—
|
|
|
392
|
|
326
|
|
—
|
|
|
—
|
|
|
392
|
|
326
|
|
718
|
|
153
|
|
1976
|
08/05
|
|
20
|
|||||||
|
Howard, PA
|
—
|
|
|
136
|
|
375
|
|
—
|
|
|
—
|
|
|
136
|
|
375
|
|
511
|
|
84
|
|
1987
|
01/06
|
|
40
|
|||||||
|
|
|
|
|
|
|
|||||||||||||||||||||||||||
|
Patient First:
|
|
|
|
|
|
|||||||||||||||||||||||||||
|
Richmond, VA
|
—
|
|
|
270
|
|
1,545
|
|
—
|
|
|
—
|
|
|
270
|
|
1,545
|
|
1,815
|
|
187
|
|
1988
|
05/11
|
|
30
|
|||||||
|
York, PA
|
—
|
|
|
772
|
|
2,995
|
|
—
|
|
|
—
|
|
|
772
|
|
2,995
|
|
3,767
|
|
259
|
|
2011
|
07/11
|
|
40
|
|||||||
|
Mechanicsburg, PA
|
—
|
|
|
933
|
|
3,401
|
|
—
|
|
|
—
|
|
|
933
|
|
3,401
|
|
4,334
|
|
244
|
|
2011
|
02/12
|
|
40
|
|||||||
|
|
|
|
|
|
|
|||||||||||||||||||||||||||
|
Patriot Fuels:
|
|
|
|
|
|
|||||||||||||||||||||||||||
|
Vinita, OK
|
—
|
|
|
72
|
|
368
|
|
—
|
|
|
—
|
|
|
72
|
|
368
|
|
440
|
|
98
|
|
1972
|
07/09
|
|
20
|
|||||||
|
|
|
|
|
|
|
|||||||||||||||||||||||||||
|
Pawn America:
|
|
|
|
|
|
|||||||||||||||||||||||||||
|
Fargo, ND
|
—
|
|
|
335
|
|
2,747
|
|
—
|
|
|
—
|
|
|
335
|
|
2,747
|
|
3,082
|
|
160
|
|
2008
|
12/12
|
|
35
|
|||||||
|
Fridley, MN
|
—
|
|
|
1,013
|
|
4,465
|
|
—
|
|
|
—
|
|
|
1,013
|
|
4,465
|
|
5,478
|
|
304
|
|
1978
|
12/12
|
|
30
|
|||||||
|
Sioux Falls, SD
|
—
|
|
|
207
|
|
1,490
|
|
—
|
|
|
—
|
|
|
207
|
|
1,490
|
|
1,697
|
|
101
|
|
1985
|
12/12
|
|
30
|
|||||||
|
Mankato, MN
|
—
|
|
|
449
|
|
—
|
|
1,705
|
|
|
—
|
|
|
449
|
|
1,705
|
|
2,154
|
|
48
|
|
2013
|
03/13
|
(m)
|
40
|
|||||||
|
|
|
|
|
|
|
|||||||||||||||||||||||||||
|
Pep Boys:
|
|
|
|
|
|
|||||||||||||||||||||||||||
|
Chicago, IL
|
—
|
|
|
1,077
|
|
3,756
|
|
—
|
|
|
—
|
|
|
1,077
|
|
3,756
|
|
4,833
|
|
765
|
|
1993
|
11/07
|
|
35
|
|||||||
|
Cicero, IL
|
—
|
|
|
1,341
|
|
3,760
|
|
—
|
|
|
—
|
|
|
1,341
|
|
3,760
|
|
5,101
|
|
765
|
|
1993
|
11/07
|
|
35
|
|||||||
|
Cornwell Heights, PA
|
—
|
|
|
2,058
|
|
3,102
|
|
—
|
|
|
—
|
|
|
2,058
|
|
3,102
|
|
5,160
|
|
884
|
|
1972
|
11/07
|
|
25
|
|||||||
|
East Brunswick, NJ
|
—
|
|
|
2,449
|
|
5,026
|
|
—
|
|
|
—
|
|
|
2,449
|
|
5,026
|
|
7,475
|
|
1,194
|
|
1987
|
11/07
|
|
30
|
|||||||
|
Guayama, PR
|
—
|
|
|
1,729
|
|
2,732
|
|
—
|
|
|
—
|
|
|
1,729
|
|
2,131
|
|
3,860
|
|
329
|
|
1998
|
11/07
|
|
33
|
|||||||
|
Jacksonville, FL
|
—
|
|
|
810
|
|
2,331
|
|
—
|
|
|
—
|
|
|
810
|
|
2,331
|
|
3,141
|
|
475
|
|
1989
|
11/07
|
|
35
|
|||||||
|
Joliet, IL
|
—
|
|
|
1,506
|
|
3,727
|
|
—
|
|
|
—
|
|
|
1,506
|
|
3,727
|
|
5,233
|
|
759
|
|
1993
|
11/07
|
|
35
|
|||||||
|
Lansing, IL
|
—
|
|
|
869
|
|
3,440
|
|
—
|
|
|
—
|
|
|
869
|
|
3,440
|
|
4,309
|
|
700
|
|
1993
|
11/07
|
|
35
|
|||||||
|
Las Vegas, NV
|
—
|
|
|
1,917
|
|
2,530
|
|
—
|
|
|
—
|
|
|
1,917
|
|
2,530
|
|
4,447
|
|
515
|
|
1989
|
11/07
|
|
35
|
|||||||
|
Marietta, GA
|
—
|
|
|
1,311
|
|
3,556
|
|
—
|
|
|
—
|
|
|
1,311
|
|
3,556
|
|
4,867
|
|
845
|
|
1987
|
11/07
|
|
30
|
|||||||
|
Marlton, NJ
|
—
|
|
|
1,608
|
|
4,142
|
|
—
|
|
|
—
|
|
|
1,608
|
|
4,142
|
|
5,750
|
|
984
|
|
1983
|
11/07
|
|
30
|
|||||||
|
Philadelphia, PA
|
—
|
|
|
1,300
|
|
3,830
|
|
—
|
|
|
—
|
|
|
1,300
|
|
3,830
|
|
5,130
|
|
780
|
|
1995
|
11/07
|
|
35
|
|||||||
|
Quakertown, PA
|
—
|
|
|
1,129
|
|
3,252
|
|
—
|
|
|
—
|
|
|
1,129
|
|
3,252
|
|
4,381
|
|
662
|
|
1995
|
11/07
|
|
35
|
|||||||
|
Reading, PA
|
—
|
|
|
1,189
|
|
3,367
|
|
—
|
|
|
—
|
|
|
1,189
|
|
2,819
|
|
4,008
|
|
513
|
|
1989
|
11/07
|
|
28
|
|||||||
|
Roswell, GA
|
—
|
|
|
931
|
|
2,732
|
|
—
|
|
|
—
|
|
|
931
|
|
2,732
|
|
3,663
|
|
649
|
|
2007
|
11/07
|
|
30
|
|||||||
|
Turnersville, NJ
|
—
|
|
|
990
|
|
3,494
|
|
—
|
|
|
—
|
|
|
990
|
|
3,494
|
|
4,484
|
|
830
|
|
1986
|
11/07
|
|
30
|
|||||||
|
Houston, TX
|
—
|
|
|
734
|
|
3,028
|
|
—
|
|
|
—
|
|
|
734
|
|
3,028
|
|
3,762
|
|
475
|
|
1994
|
04/10
|
|
30
|
|||||||
|
|
|
|
|
|
|
|||||||||||||||||||||||||||
|
Perkins Restaurant:
|
|
|
|
|
|
|||||||||||||||||||||||||||
|
Des Moines, IA
|
—
|
|
|
256
|
|
136
|
|
—
|
|
|
—
|
|
|
256
|
|
136
|
|
392
|
|
130
|
|
1976
|
06/05
|
|
10
|
|||||||
|
Des Moines, IA
|
—
|
|
|
270
|
|
218
|
|
—
|
|
|
—
|
|
|
270
|
|
218
|
|
488
|
|
208
|
|
1977
|
06/05
|
|
10
|
|||||||
|
Des Moines, IA
|
—
|
|
|
226
|
|
203
|
|
—
|
|
|
—
|
|
|
226
|
|
203
|
|
429
|
|
194
|
|
1976
|
06/05
|
|
10
|
|||||||
|
Newton, IA
|
—
|
|
|
354
|
|
402
|
|
—
|
|
|
—
|
|
|
354
|
|
402
|
|
756
|
|
383
|
|
1979
|
06/05
|
|
10
|
|||||||
|
Urbandale, IA
|
—
|
|
|
377
|
|
581
|
|
—
|
|
|
—
|
|
|
377
|
|
581
|
|
958
|
|
277
|
|
1979
|
06/05
|
|
20
|
|||||||
|
|
|
|
|
|
|
|||||||||||||||||||||||||||
|
Pet Paradise:
|
|
|
|
|
|
|||||||||||||||||||||||||||
|
Houston, TX
|
—
|
|
|
417
|
|
2,306
|
|
—
|
|
|
—
|
|
|
417
|
|
2,306
|
|
2,723
|
|
392
|
|
2008
|
03/08
|
|
40
|
|||||||
|
Bunnell, FL
|
—
|
|
|
316
|
|
881
|
|
—
|
|
|
—
|
|
|
316
|
|
881
|
|
1,197
|
|
148
|
|
1997
|
04/08
|
|
40
|
|||||||
|
Charlotte, NC
|
—
|
|
|
825
|
|
—
|
|
3,231
|
|
|
—
|
|
|
825
|
|
3,231
|
|
4,056
|
|
441
|
|
2009
|
11/08
|
(m)
|
40
|
|||||||
|
Davie, FL
|
—
|
|
|
1,138
|
|
1,069
|
|
—
|
|
|
—
|
|
|
1,138
|
|
1,069
|
|
2,207
|
|
184
|
|
2003
|
12/08
|
|
35
|
|||||||
|
|
|
|
|
|
|
|||||||||||||||||||||||||||
|
Petco:
|
|
|
|
|
|
|||||||||||||||||||||||||||
|
Grand Forks, ND
|
—
|
|
|
307
|
|
910
|
|
—
|
|
|
—
|
|
|
307
|
|
910
|
|
1,217
|
|
388
|
|
1996
|
12/97
|
|
40
|
|||||||
|
Florissant, MO
|
—
|
|
|
299
|
|
352
|
|
1,019
|
|
|
—
|
|
|
300
|
|
1,371
|
|
1,671
|
|
169
|
|
2012
|
04/03
|
(g)
|
40
|
|||||||
|
|
|
|
|
|
|
|||||||||||||||||||||||||||
|
Petro Express:
|
|
|
|
|
|
|||||||||||||||||||||||||||
|
Belmont, NC
|
—
|
|
|
1,508
|
|
1,622
|
|
—
|
|
|
—
|
|
|
1,508
|
|
1,622
|
|
3,130
|
|
357
|
|
2001
|
04/07
|
|
35
|
|||||||
|
Charlotte, NC
|
—
|
|
|
1,291
|
|
1,839
|
|
—
|
|
|
—
|
|
|
1,291
|
|
1,839
|
|
3,130
|
|
473
|
|
1988
|
04/07
|
|
30
|
|||||||
|
Charlotte, NC
|
—
|
|
|
2,784
|
|
3,720
|
|
—
|
|
|
—
|
|
|
2,784
|
|
3,720
|
|
6,504
|
|
819
|
|
1998
|
04/07
|
|
35
|
|||||||
|
Charlotte, NC
|
—
|
|
|
1,030
|
|
1,725
|
|
—
|
|
|
—
|
|
|
1,030
|
|
1,725
|
|
2,755
|
|
443
|
|
1983
|
04/07
|
|
30
|
|||||||
|
Charlotte, NC
|
—
|
|
|
1,458
|
|
2,047
|
|
—
|
|
|
—
|
|
|
1,458
|
|
2,047
|
|
3,505
|
|
526
|
|
1987
|
04/07
|
|
30
|
|||||||
|
Charlotte, NC
|
—
|
|
|
429
|
|
425
|
|
—
|
|
|
—
|
|
|
429
|
|
425
|
|
854
|
|
109
|
|
1983
|
04/07
|
|
30
|
|||||||
|
Charlotte, NC
|
—
|
|
|
1,778
|
|
1,977
|
|
—
|
|
|
—
|
|
|
1,778
|
|
1,977
|
|
3,755
|
|
508
|
|
1992
|
04/07
|
|
30
|
|||||||
|
Charlotte, NC
|
—
|
|
|
507
|
|
698
|
|
—
|
|
|
—
|
|
|
507
|
|
698
|
|
1,205
|
|
269
|
|
1967
|
04/07
|
|
20
|
|||||||
|
Charlotte, NC
|
—
|
|
|
629
|
|
876
|
|
—
|
|
|
—
|
|
|
623
|
|
876
|
|
1,499
|
|
225
|
|
1986
|
04/07
|
|
30
|
|||||||
|
Charlotte, NC
|
—
|
|
|
1,810
|
|
2,570
|
|
—
|
|
|
—
|
|
|
1,810
|
|
2,570
|
|
4,380
|
|
495
|
|
2004
|
04/07
|
|
40
|
|||||||
|
Charlotte, NC
|
—
|
|
|
1,697
|
|
2,419
|
|
—
|
|
|
—
|
|
|
1,697
|
|
2,419
|
|
4,116
|
|
466
|
|
2005
|
04/07
|
|
40
|
|||||||
|
Charlotte, NC
|
—
|
|
|
1,340
|
|
1,790
|
|
—
|
|
|
—
|
|
|
1,340
|
|
1,790
|
|
3,130
|
|
394
|
|
1998
|
04/07
|
|
35
|
|||||||
|
Charlotte, NC
|
—
|
|
|
2,165
|
|
1,965
|
|
—
|
|
|
—
|
|
|
2,165
|
|
1,965
|
|
4,130
|
|
433
|
|
1997
|
04/07
|
|
35
|
|||||||
|
Charlotte, NC
|
—
|
|
|
2,316
|
|
2,064
|
|
—
|
|
|
—
|
|
|
2,316
|
|
2,064
|
|
4,380
|
|
455
|
|
1996
|
04/07
|
|
35
|
|||||||
|
Charlotte, NC
|
—
|
|
|
1,532
|
|
1,973
|
|
—
|
|
|
—
|
|
|
1,532
|
|
1,973
|
|
3,505
|
|
434
|
|
1998
|
04/07
|
|
35
|
|||||||
|
Concord, NC
|
—
|
|
|
1,828
|
|
1,677
|
|
—
|
|
|
—
|
|
|
1,828
|
|
1,677
|
|
3,505
|
|
369
|
|
2002
|
04/07
|
|
35
|
|||||||
|
Concord, NC
|
—
|
|
|
2,144
|
|
1,986
|
|
—
|
|
|
—
|
|
|
2,144
|
|
1,986
|
|
4,130
|
|
437
|
|
2000
|
04/07
|
|
35
|
|||||||
|
Denver, NC
|
—
|
|
|
2,317
|
|
1,750
|
|
—
|
|
|
—
|
|
|
2,317
|
|
1,750
|
|
4,067
|
|
385
|
|
1999
|
04/07
|
|
35
|
|||||||
|
Fort Mill, SC
|
—
|
|
|
3,825
|
|
2,554
|
|
—
|
|
|
—
|
|
|
3,825
|
|
2,554
|
|
6,379
|
|
563
|
|
1998
|
04/07
|
|
35
|
|||||||
|
Gastonia, NC
|
—
|
|
|
965
|
|
1,228
|
|
—
|
|
|
—
|
|
|
965
|
|
1,228
|
|
2,193
|
|
270
|
|
2001
|
04/07
|
|
35
|
|||||||
|
Gastonia, NC
|
—
|
|
|
745
|
|
760
|
|
—
|
|
|
—
|
|
|
745
|
|
760
|
|
1,505
|
|
147
|
|
2003
|
04/07
|
|
40
|
|||||||
|
Gastonia, NC
|
—
|
|
|
1,070
|
|
1,185
|
|
—
|
|
|
—
|
|
|
1,070
|
|
1,185
|
|
2,255
|
|
261
|
|
1990
|
04/07
|
|
35
|
|||||||
|
Gastonia, NC
|
—
|
|
|
335
|
|
545
|
|
—
|
|
|
—
|
|
|
335
|
|
545
|
|
880
|
|
105
|
|
2000
|
04/07
|
|
40
|
|||||||
|
Hickory, NC
|
—
|
|
|
1,975
|
|
1,530
|
|
—
|
|
|
—
|
|
|
1,975
|
|
1,530
|
|
3,505
|
|
337
|
|
2002
|
04/07
|
|
35
|
|||||||
|
Kings Mountain, NC
|
—
|
|
|
1,210
|
|
982
|
|
—
|
|
|
—
|
|
|
1,210
|
|
982
|
|
2,192
|
|
216
|
|
1988
|
04/07
|
|
35
|
|||||||
See accompanying report of independent registered public accounting firm.
F-37
|
Initial Cost to
Company
|
Costs Capitalized
Subsequent to
Acquisition
|
Gross Amount at Which
Carried at Close of Period (a) (b)
|
Life on Which
Depreciation &
Amortization in Latest Income
Statement is
Computed (Years)
|
|||||||||||||||||||||||||||||
|
Encumbrances
|
Land
|
Building,
Improvements &
Leasehold
Interests
|
Improvements
|
Carrying
Costs
|
Land
|
Building,
Improvements &
Leasehold
Interests
|
Total
|
Accumulated
Depreciation
and
Amortization
|
Date of
Construction
|
Date
Acquired
|
||||||||||||||||||||||
|
Real Estate Held for Investment the Company has Invested in Under Operating Leases:
|
||||||||||||||||||||||||||||||||
|
Lake Wylie, SC
|
—
|
|
|
1,381
|
|
2,061
|
|
—
|
|
|
—
|
|
|
1,381
|
|
2,061
|
|
3,442
|
|
454
|
|
1998
|
04/07
|
|
35
|
|||||||
|
Lake Wylie, SC
|
—
|
|
|
1,972
|
|
1,283
|
|
—
|
|
|
—
|
|
|
1,972
|
|
1,283
|
|
3,255
|
|
283
|
|
2003
|
04/07
|
|
35
|
|||||||
|
Lincolnton, NC
|
—
|
|
|
723
|
|
532
|
|
—
|
|
|
—
|
|
|
723
|
|
532
|
|
1,255
|
|
137
|
|
1989
|
04/07
|
|
30
|
|||||||
|
Mineral Springs, NC
|
—
|
|
|
678
|
|
577
|
|
—
|
|
|
—
|
|
|
678
|
|
577
|
|
1,255
|
|
111
|
|
2002
|
04/07
|
|
40
|
|||||||
|
Monroe, NC
|
—
|
|
|
421
|
|
834
|
|
—
|
|
|
—
|
|
|
421
|
|
834
|
|
1,255
|
|
184
|
|
1997
|
04/07
|
|
35
|
|||||||
|
Monroe, NC
|
—
|
|
|
857
|
|
1,023
|
|
—
|
|
|
—
|
|
|
857
|
|
1,023
|
|
1,880
|
|
197
|
|
2004
|
04/07
|
|
40
|
|||||||
|
Monroe, NC
|
—
|
|
|
709
|
|
796
|
|
—
|
|
|
—
|
|
|
709
|
|
796
|
|
1,505
|
|
175
|
|
1999
|
04/07
|
|
35
|
|||||||
|
Rock Hill, SC
|
—
|
|
|
3,095
|
|
1,910
|
|
—
|
|
|
—
|
|
|
3,095
|
|
1,910
|
|
5,005
|
|
421
|
|
1999
|
04/07
|
|
35
|
|||||||
|
Rock Hill, SC
|
—
|
|
|
2,119
|
|
1,886
|
|
—
|
|
|
—
|
|
|
2,119
|
|
1,886
|
|
4,005
|
|
415
|
|
1998
|
04/07
|
|
35
|
|||||||
|
Rock Hill, SC
|
—
|
|
|
778
|
|
727
|
|
—
|
|
|
—
|
|
|
778
|
|
727
|
|
1,505
|
|
187
|
|
1990
|
04/07
|
|
30
|
|||||||
|
Statesville, NC
|
—
|
|
|
1,886
|
|
2,182
|
|
—
|
|
|
—
|
|
|
1,864
|
|
2,182
|
|
4,046
|
|
480
|
|
1999
|
04/07
|
|
35
|
|||||||
|
Waxhaw, NC
|
—
|
|
|
508
|
|
747
|
|
—
|
|
|
—
|
|
|
508
|
|
747
|
|
1,255
|
|
144
|
|
2002
|
04/07
|
|
40
|
|||||||
|
York, SC
|
—
|
|
|
2,306
|
|
1,449
|
|
—
|
|
|
—
|
|
|
2,306
|
|
1,449
|
|
3,755
|
|
319
|
|
1999
|
04/07
|
|
35
|
|||||||
|
Charlotte, NC
|
—
|
|
|
1,834
|
|
1,214
|
|
—
|
|
|
—
|
|
|
1,834
|
|
1,214
|
|
3,048
|
|
231
|
|
1997
|
05/07
|
|
40
|
|||||||
|
Charlotte, NC
|
—
|
|
|
1,849
|
|
2,280
|
|
—
|
|
|
—
|
|
|
1,849
|
|
2,280
|
|
4,129
|
|
435
|
|
2005
|
05/07
|
|
40
|
|||||||
|
Rock Hill, SC
|
—
|
|
|
3,108
|
|
2,146
|
|
—
|
|
|
—
|
|
|
3,108
|
|
2,146
|
|
5,254
|
|
409
|
|
1999
|
05/07
|
|
40
|
|||||||
|
|
|
|
|
|
|
|||||||||||||||||||||||||||
|
PetSense:
|
|
|
|
|
|
|||||||||||||||||||||||||||
|
Kingsville, TX
|
—
|
|
|
499
|
|
458
|
|
224
|
|
|
—
|
|
|
499
|
|
682
|
|
1,181
|
|
169
|
|
1995
|
12/01
|
|
40
|
|||||||
|
|
|
|
|
|
|
|||||||||||||||||||||||||||
|
PetSmart:
|
|
|
|
|
|
|||||||||||||||||||||||||||
|
Chicago, IL
|
—
|
|
|
2,724
|
|
3,566
|
|
—
|
|
|
—
|
|
|
2,724
|
|
3,566
|
|
6,290
|
|
1,452
|
|
1998
|
09/98
|
|
40
|
|||||||
|
|
|
|
|
|
|
|||||||||||||||||||||||||||
|
Pier I Imports:
|
|
|
|
|
|
|||||||||||||||||||||||||||
|
Anchorage, AK
|
—
|
|
|
928
|
|
1,663
|
|
—
|
|
|
—
|
|
|
928
|
|
1,663
|
|
2,591
|
|
783
|
|
1995
|
02/96
|
|
40
|
|||||||
|
Memphis, TN
|
—
|
|
|
713
|
|
822
|
|
—
|
|
|
—
|
|
|
713
|
|
822
|
|
1,535
|
|
360
|
|
1997
|
09/96
|
(f)
|
40
|
|||||||
|
Sanford, FL
|
—
|
|
|
738
|
|
803
|
|
—
|
|
|
—
|
|
|
738
|
|
803
|
|
1,541
|
|
337
|
|
1998
|
06/97
|
(f)
|
40
|
|||||||
|
Valdosta, GA
|
—
|
|
|
391
|
|
806
|
|
—
|
|
|
—
|
|
|
391
|
|
806
|
|
1,197
|
|
305
|
|
1999
|
01/99
|
(f)
|
40
|
|||||||
|
|
|
|
|
|
|
|||||||||||||||||||||||||||
|
Pizza Hut:
|
|
|
|
|
|
|||||||||||||||||||||||||||
|
Monroeville, AL
|
—
|
|
|
547
|
|
44
|
|
—
|
|
|
—
|
|
|
547
|
|
44
|
|
591
|
|
14
|
|
1976
|
12/01
|
|
40
|
|||||||
|
|
|
|
|
|
|
|||||||||||||||||||||||||||
|
Popeye's:
|
|
|
|
|
|
|||||||||||||||||||||||||||
|
Snellville, GA
|
—
|
|
|
642
|
|
437
|
|
—
|
|
|
—
|
|
|
642
|
|
437
|
|
1,079
|
|
142
|
|
1995
|
12/01
|
|
40
|
|||||||
See accompanying report of independent registered public accounting firm.
F-38
|
Initial Cost to
Company
|
Costs Capitalized
Subsequent to
Acquisition
|
Gross Amount at Which
Carried at Close of Period (a) (b)
|
Life on Which
Depreciation &
Amortization in Latest Income
Statement is
Computed (Years)
|
|||||||||||||||||||||||||||||
|
Encumbrances
|
Land
|
Building,
Improvements &
Leasehold
Interests
|
Improvements
|
Carrying
Costs
|
Land
|
Building,
Improvements &
Leasehold
Interests
|
Total
|
Accumulated
Depreciation
and
Amortization
|
Date of
Construction
|
Date
Acquired
|
||||||||||||||||||||||
|
Real Estate Held for Investment the Company has Invested in Under Operating Leases:
|
||||||||||||||||||||||||||||||||
|
Randallstown, MD
|
—
|
|
|
483
|
|
609
|
|
—
|
|
|
—
|
|
|
483
|
|
609
|
|
1,092
|
|
21
|
|
1958
|
02/14
|
|
25
|
|||||||
|
|
|
|
|
|
|
|||||||||||||||||||||||||||
|
Power Center:
|
|
|
|
|
|
|||||||||||||||||||||||||||
|
Midland, MI
|
—
|
|
|
1,085
|
|
1,635
|
|
220
|
|
|
—
|
|
|
1,085
|
|
1,598
|
|
2,683
|
|
377
|
|
2005
|
05/05
|
(g)
|
40
|
|||||||
|
Big Flats, NY
|
—
|
|
|
2,248
|
|
7,159
|
|
1,258
|
|
|
—
|
|
|
2,248
|
|
5,075
|
|
7,323
|
|
1,206
|
|
2006
|
08/05
|
|
40
|
|||||||
|
Harlingen, TX
|
—
|
|
|
247
|
|
807
|
|
—
|
|
|
—
|
|
|
247
|
|
583
|
|
830
|
|
129
|
|
2008
|
09/06
|
(g)
|
40
|
|||||||
|
Harlingen, TX
|
—
|
|
|
749
|
|
1,238
|
|
195
|
|
|
—
|
|
|
749
|
|
1,043
|
|
1,792
|
|
238
|
|
2008
|
09/06
|
(g)
|
40
|
|||||||
|
Woodstock, GA
|
—
|
|
|
261
|
|
701
|
|
—
|
|
|
—
|
|
|
261
|
|
516
|
|
777
|
|
95
|
|
1997
|
07/08
|
|
40
|
|||||||
|
|
|
|
|
|
|
|||||||||||||||||||||||||||
|
Premium Spas & Billiards:
|
|
|
|
|
|
|||||||||||||||||||||||||||
|
Fairfax, VA
|
—
|
|
|
105
|
|
151
|
|
413
|
|
|
—
|
|
|
194
|
|
564
|
|
758
|
|
107
|
|
1995
|
12/95
|
|
40
|
|||||||
|
|
|
|
|
|
|
|||||||||||||||||||||||||||
|
Pull-A-Part:
|
|
|
|
|
|
|||||||||||||||||||||||||||
|
Augusta, GA
|
—
|
|
|
1,414
|
|
—
|
|
1,449
|
|
|
—
|
|
|
1,414
|
|
1,449
|
|
2,863
|
|
273
|
|
2007
|
08/06
|
(m)
|
40
|
|||||||
|
Birmingham, AL
|
—
|
|
|
1,165
|
|
2,090
|
|
—
|
|
|
—
|
|
|
1,165
|
|
2,090
|
|
3,255
|
|
438
|
|
1964
|
08/06
|
|
40
|
|||||||
|
Charlotte, NC
|
—
|
|
|
2,913
|
|
1,724
|
|
—
|
|
|
—
|
|
|
2,908
|
|
1,724
|
|
4,632
|
|
361
|
|
2006
|
08/06
|
|
40
|
|||||||
|
Conley, GA
|
—
|
|
|
1,686
|
|
1,387
|
|
—
|
|
|
—
|
|
|
1,686
|
|
1,387
|
|
3,073
|
|
290
|
|
1999
|
08/06
|
|
40
|
|||||||
|
Harvey, LA
|
—
|
|
|
1,887
|
|
—
|
|
4,326
|
|
|
—
|
|
|
1,887
|
|
4,326
|
|
6,213
|
|
698
|
|
2008
|
08/06
|
(m)
|
40
|
|||||||
|
Knoxville, TN
|
—
|
|
|
961
|
|
—
|
|
2,384
|
|
|
—
|
|
|
961
|
|
2,384
|
|
3,345
|
|
445
|
|
2007
|
08/06
|
(m)
|
40
|
|||||||
|
Louisville, KY
|
—
|
|
|
3,206
|
|
1,532
|
|
—
|
|
|
—
|
|
|
3,206
|
|
1,532
|
|
4,738
|
|
321
|
|
2006
|
08/06
|
|
40
|
|||||||
|
Nashville, TN
|
—
|
|
|
2,164
|
|
1,414
|
|
—
|
|
|
—
|
|
|
2,164
|
|
1,414
|
|
3,578
|
|
296
|
|
2006
|
08/06
|
|
40
|
|||||||
|
Norcross, GA
|
—
|
|
|
1,831
|
|
1,040
|
|
—
|
|
|
—
|
|
|
1,831
|
|
1,040
|
|
2,871
|
|
218
|
|
1998
|
08/06
|
|
40
|
|||||||
|
Cleveland, OH
|
—
|
|
|
4,556
|
|
—
|
|
2,096
|
|
|
—
|
|
|
4,556
|
|
2,096
|
|
6,652
|
|
373
|
|
2007
|
08/06
|
(m)
|
40
|
|||||||
|
Lafayette, LA
|
—
|
|
|
1,036
|
|
—
|
|
2,226
|
|
|
—
|
|
|
1,036
|
|
2,226
|
|
3,262
|
|
392
|
|
2007
|
08/06
|
(m)
|
40
|
|||||||
|
Montgomery, AL
|
—
|
|
|
934
|
|
—
|
|
2,013
|
|
|
—
|
|
|
934
|
|
2,013
|
|
2,947
|
|
358
|
|
2007
|
11/06
|
(m)
|
40
|
|||||||
|
Jackson, MS
|
—
|
|
|
1,315
|
|
—
|
|
2,471
|
|
|
—
|
|
|
1,315
|
|
2,318
|
|
3,633
|
|
406
|
|
2008
|
12/06
|
(m)
|
40
|
|||||||
|
Baton Rouge, LA
|
—
|
|
|
893
|
|
—
|
|
3,256
|
|
|
—
|
|
|
893
|
|
3,256
|
|
4,149
|
|
471
|
|
2009
|
01/07
|
(m)
|
40
|
|||||||
|
Memphis, TN
|
—
|
|
|
1,779
|
|
—
|
|
2,964
|
|
|
—
|
|
|
1,779
|
|
2,964
|
|
4,743
|
|
491
|
|
2008
|
05/07
|
(m)
|
40
|
|||||||
|
Mobile, AL
|
—
|
|
|
550
|
|
—
|
|
2,772
|
|
|
—
|
|
|
550
|
|
2,772
|
|
3,322
|
|
413
|
|
2009
|
06/07
|
(m)
|
40
|
|||||||
|
Winston-Salem, NC
|
—
|
|
|
846
|
|
—
|
|
2,449
|
|
|
—
|
|
|
836
|
|
2,449
|
|
3,285
|
|
370
|
|
2009
|
08/07
|
(m)
|
40
|
|||||||
|
Lithonia, GA
|
—
|
|
|
2,410
|
|
—
|
|
2,345
|
|
|
—
|
|
|
2,410
|
|
2,345
|
|
4,755
|
|
349
|
|
2009
|
08/07
|
(m)
|
40
|
|||||||
|
Columbia, SC
|
—
|
|
|
935
|
|
—
|
|
2,178
|
|
|
—
|
|
|
935
|
|
2,178
|
|
3,113
|
|
324
|
|
2009
|
09/07
|
(m)
|
40
|
|||||||
|
Akron, OH
|
—
|
|
|
1,065
|
|
—
|
|
1,869
|
|
|
—
|
|
|
1,065
|
|
1,869
|
|
2,934
|
|
239
|
|
2009
|
10/08
|
(m)
|
40
|
|||||||
See accompanying report of independent registered public accounting firm.
F-39
|
Initial Cost to
Company
|
Costs Capitalized
Subsequent to
Acquisition
|
Gross Amount at Which
Carried at Close of Period (a) (b)
|
Life on Which
Depreciation &
Amortization in Latest Income
Statement is
Computed (Years)
|
|||||||||||||||||||||||||||||
|
Encumbrances
|
Land
|
Building,
Improvements &
Leasehold
Interests
|
Improvements
|
Carrying
Costs
|
Land
|
Building,
Improvements &
Leasehold
Interests
|
Total
|
Accumulated
Depreciation
and
Amortization
|
Date of
Construction
|
Date
Acquired
|
||||||||||||||||||||||
|
Real Estate Held for Investment the Company has Invested in Under Operating Leases:
|
||||||||||||||||||||||||||||||||
|
Quaker Steak & Lube:
|
|
|
|
|
|
|||||||||||||||||||||||||||
|
Mentor, OH
|
—
|
|
|
841
|
|
2,452
|
|
—
|
|
|
—
|
|
|
841
|
|
2,452
|
|
3,293
|
|
50
|
|
2009
|
04/14
|
|
35
|
|||||||
|
|
|
|
|
|
|
|||||||||||||||||||||||||||
|
QuikTrip:
|
|
|
|
|
|
|||||||||||||||||||||||||||
|
Alpharetta, GA
|
—
|
|
|
1,048
|
|
607
|
|
—
|
|
|
—
|
|
|
1,048
|
|
607
|
|
1,655
|
|
145
|
|
1996
|
06/05
|
|
40
|
|||||||
|
Clive, IA
|
—
|
|
|
623
|
|
557
|
|
—
|
|
|
—
|
|
|
623
|
|
557
|
|
1,180
|
|
177
|
|
1994
|
06/05
|
|
30
|
|||||||
|
Des Moines, IA
|
—
|
|
|
379
|
|
455
|
|
—
|
|
|
—
|
|
|
379
|
|
455
|
|
834
|
|
145
|
|
1990
|
06/05
|
|
30
|
|||||||
|
Des Moines, IA
|
—
|
|
|
259
|
|
792
|
|
—
|
|
|
—
|
|
|
259
|
|
792
|
|
1,051
|
|
252
|
|
1996
|
06/05
|
|
30
|
|||||||
|
Gainesville, GA
|
—
|
|
|
592
|
|
913
|
|
—
|
|
|
—
|
|
|
592
|
|
913
|
|
1,505
|
|
290
|
|
1989
|
06/05
|
|
30
|
|||||||
|
Herculaneum, MO
|
—
|
|
|
856
|
|
1,613
|
|
—
|
|
|
—
|
|
|
856
|
|
1,613
|
|
2,469
|
|
513
|
|
1991
|
06/05
|
|
30
|
|||||||
|
Johnston, IA
|
—
|
|
|
394
|
|
385
|
|
—
|
|
|
—
|
|
|
394
|
|
385
|
|
779
|
|
122
|
|
1991
|
06/05
|
|
30
|
|||||||
|
Lee's Summit, MO
|
—
|
|
|
374
|
|
1,224
|
|
—
|
|
|
—
|
|
|
374
|
|
1,224
|
|
1,598
|
|
292
|
|
1999
|
06/05
|
|
40
|
|||||||
|
Norcross, GA
|
—
|
|
|
948
|
|
294
|
|
—
|
|
|
—
|
|
|
948
|
|
294
|
|
1,242
|
|
93
|
|
1989
|
06/05
|
|
30
|
|||||||
|
Norcross, GA
|
—
|
|
|
966
|
|
202
|
|
—
|
|
|
—
|
|
|
966
|
|
202
|
|
1,168
|
|
64
|
|
1993
|
06/05
|
|
30
|
|||||||
|
Norcross, GA
|
—
|
|
|
844
|
|
297
|
|
—
|
|
|
—
|
|
|
839
|
|
297
|
|
1,136
|
|
94
|
|
1994
|
06/05
|
|
30
|
|||||||
|
Olathe, KS
|
—
|
|
|
793
|
|
1,392
|
|
—
|
|
|
—
|
|
|
793
|
|
1,392
|
|
2,185
|
|
332
|
|
1999
|
06/05
|
|
40
|
|||||||
|
Tulsa, OK
|
—
|
|
|
1,225
|
|
650
|
|
—
|
|
|
—
|
|
|
1,225
|
|
650
|
|
1,875
|
|
207
|
|
1990
|
06/05
|
|
30
|
|||||||
|
Urbandale, IA
|
—
|
|
|
340
|
|
764
|
|
—
|
|
|
—
|
|
|
340
|
|
764
|
|
1,104
|
|
182
|
|
1993
|
06/05
|
|
40
|
|||||||
|
Wichita, KS
|
—
|
|
|
127
|
|
543
|
|
—
|
|
|
—
|
|
|
127
|
|
543
|
|
670
|
|
173
|
|
1990
|
06/05
|
|
30
|
|||||||
|
Wichita, KS
|
—
|
|
|
118
|
|
454
|
|
—
|
|
|
—
|
|
|
113
|
|
454
|
|
567
|
|
144
|
|
1989
|
06/05
|
|
30
|
|||||||
|
Woodstock , GA
|
—
|
|
|
488
|
|
1,042
|
|
—
|
|
|
—
|
|
|
488
|
|
1,042
|
|
1,530
|
|
249
|
|
1997
|
06/05
|
|
40
|
|||||||
|
|
|
|
|
|
|
|||||||||||||||||||||||||||
|
Qwest Corporation Service Center:
|
|
|
|
|
|
|||||||||||||||||||||||||||
|
Cedar Rapids, IA
|
—
|
|
|
184
|
|
629
|
|
—
|
|
|
—
|
|
|
184
|
|
629
|
|
813
|
|
300
|
|
1976
|
06/05
|
|
20
|
|||||||
|
Decorah, IA
|
—
|
|
|
72
|
|
272
|
|
—
|
|
|
—
|
|
|
72
|
|
272
|
|
344
|
|
259
|
|
1974
|
06/05
|
|
10
|
|||||||
|
|
|
|
|
|
|
|||||||||||||||||||||||||||
|
Rabobank:
|
|
|
|
|
|
|||||||||||||||||||||||||||
|
Chico, CA
|
—
|
|
|
346
|
|
—
|
|
—
|
|
|
—
|
|
|
346
|
|
(e)
|
|
346
|
|
(e)
|
|
(i)(e)
|
07/12
|
|
30
|
|||||||
|
|
|
|
|
|
|
|||||||||||||||||||||||||||
|
Raising Cane's:
|
|
|
|
|
|
|||||||||||||||||||||||||||
|
Lancaster, OH
|
—
|
|
|
600
|
|
—
|
|
1,075
|
|
|
—
|
|
|
600
|
|
1,075
|
|
1,675
|
|
57
|
|
2012
|
01/08
|
(g)
|
40
|
|||||||
|
Sulphur, LA
|
—
|
|
|
326
|
|
1,268
|
|
—
|
|
|
—
|
|
|
326
|
|
1,268
|
|
1,594
|
|
134
|
|
2009
|
04/11
|
|
35
|
|||||||
|
Hurst, TX
|
—
|
|
|
763
|
|
—
|
|
1,309
|
|
|
—
|
|
|
763
|
|
1,309
|
|
2,072
|
|
105
|
|
2011
|
05/11
|
(m)
|
40
|
|||||||
|
Fort Worth, TX
|
—
|
|
|
792
|
|
—
|
|
1,144
|
|
|
—
|
|
|
792
|
|
1,144
|
|
1,936
|
|
92
|
|
2011
|
06/11
|
(m)
|
40
|
|||||||
See accompanying report of independent registered public accounting firm.
F-40
|
Initial Cost to
Company
|
Costs Capitalized
Subsequent to
Acquisition
|
Gross Amount at Which
Carried at Close of Period (a) (b)
|
Life on Which
Depreciation &
Amortization in Latest Income
Statement is
Computed (Years)
|
|||||||||||||||||||||||||||||
|
Encumbrances
|
Land
|
Building,
Improvements &
Leasehold
Interests
|
Improvements
|
Carrying
Costs
|
Land
|
Building,
Improvements &
Leasehold
Interests
|
Total
|
Accumulated
Depreciation
and
Amortization
|
Date of
Construction
|
Date
Acquired
|
||||||||||||||||||||||
|
Real Estate Held for Investment the Company has Invested in Under Operating Leases:
|
||||||||||||||||||||||||||||||||
|
Plano, TX
|
—
|
|
|
1,316
|
|
—
|
|
1,349
|
|
|
—
|
|
|
1,316
|
|
1,349
|
|
2,665
|
|
108
|
|
2011
|
06/11
|
(m)
|
40
|
|||||||
|
Pearland, TX
|
—
|
|
|
774
|
|
—
|
|
1,255
|
|
|
—
|
|
|
774
|
|
1,255
|
|
2,029
|
|
98
|
|
2011
|
07/11
|
(m)
|
40
|
|||||||
|
Addison, TX
|
—
|
|
|
869
|
|
—
|
|
1,343
|
|
|
—
|
|
|
869
|
|
1,343
|
|
2,212
|
|
94
|
|
2012
|
10/11
|
(m)
|
40
|
|||||||
|
Houston, TX
|
—
|
|
|
737
|
|
—
|
|
1,163
|
|
|
—
|
|
|
737
|
|
1,163
|
|
1,900
|
|
84
|
|
2012
|
10/11
|
(m)
|
40
|
|||||||
|
Euless, TX
|
—
|
|
|
1,222
|
|
—
|
|
1,376
|
|
|
—
|
|
|
1,226
|
|
1,376
|
|
2,602
|
|
105
|
|
2011
|
12/11
|
(m)
|
40
|
|||||||
|
Moore, OK
|
—
|
|
|
762
|
|
—
|
|
1,153
|
|
|
—
|
|
|
762
|
|
1,153
|
|
1,915
|
|
78
|
|
2012
|
01/12
|
(m)
|
40
|
|||||||
|
Rowlett, TX
|
—
|
|
|
814
|
|
—
|
|
1,398
|
|
|
—
|
|
|
814
|
|
1,398
|
|
2,212
|
|
86
|
|
2012
|
02/12
|
(m)
|
40
|
|||||||
|
Keller, TX
|
—
|
|
|
833
|
|
—
|
|
1,265
|
|
|
—
|
|
|
833
|
|
1,265
|
|
2,098
|
|
70
|
|
2012
|
06/12
|
(m)
|
40
|
|||||||
|
Omaha, NE
|
—
|
|
|
1,181
|
|
—
|
|
1,676
|
|
|
—
|
|
|
1,181
|
|
1,676
|
|
2,857
|
|
82
|
|
2013
|
08/12
|
(m)
|
40
|
|||||||
|
McKinney, TX
|
—
|
|
|
1,443
|
|
—
|
|
1,255
|
|
|
—
|
|
|
1,443
|
|
1,255
|
|
2,698
|
|
54
|
|
2013
|
11/12
|
(m)
|
40
|
|||||||
|
Tulsa, OK
|
—
|
|
|
1,006
|
|
—
|
|
1,508
|
|
|
—
|
|
|
1,006
|
|
1,508
|
|
2,514
|
|
64
|
|
2013
|
12/12
|
(m)
|
40
|
|||||||
|
Broken Arrow, OK
|
—
|
|
|
1,267
|
|
1,285
|
|
—
|
|
|
—
|
|
|
1,267
|
|
1,285
|
|
2,552
|
|
44
|
|
2013
|
04/13
|
|
40
|
|||||||
|
Oklahoma City, OK
|
—
|
|
|
1,217
|
|
—
|
|
1,312
|
|
|
—
|
|
|
1,217
|
|
1,312
|
|
2,529
|
|
34
|
|
2013
|
06/13
|
(m)
|
40
|
|||||||
|
Oklahoma City, OK
|
—
|
|
|
988
|
|
—
|
|
1,268
|
|
|
—
|
|
|
988
|
|
1,268
|
|
2,256
|
|
38
|
|
2013
|
06/13
|
(m)
|
40
|
|||||||
|
Owasso, OK
|
—
|
|
|
641
|
|
—
|
|
1,313
|
|
|
—
|
|
|
641
|
|
1,313
|
|
1,954
|
|
31
|
|
2014
|
09/13
|
(m)
|
40
|
|||||||
|
Longview, TX
|
—
|
|
|
1,020
|
|
—
|
|
1,488
|
|
|
—
|
|
|
1,020
|
|
1,488
|
|
2,508
|
|
17
|
|
2014
|
02/14
|
(m)
|
40
|
|||||||
|
Georgetown, TX
|
—
|
|
|
1,101
|
|
—
|
|
1,830
|
|
|
—
|
|
|
1,101
|
|
1,830
|
|
2,931
|
|
13
|
|
2014
|
05/14
|
(m)
|
40
|
|||||||
|
|
|
|
|
|
|
|||||||||||||||||||||||||||
|
Rallys:
|
|
|
|
|
|
|||||||||||||||||||||||||||
|
Toledo, OH
|
—
|
|
|
126
|
|
320
|
|
—
|
|
|
—
|
|
|
126
|
|
320
|
|
446
|
|
186
|
|
1989
|
07/92
|
|
39
|
|||||||
|
|
|
|
|
|
|
|||||||||||||||||||||||||||
|
RBC Bank:
|
|
|
|
|
|
|||||||||||||||||||||||||||
|
Altamonte Springs, FL
|
—
|
|
|
1,316
|
|
2,014
|
|
—
|
|
|
—
|
|
|
1,316
|
|
2,014
|
|
3,330
|
|
266
|
|
2007
|
05/10
|
|
35
|
|||||||
|
|
|
|
|
|
|
|||||||||||||||||||||||||||
|
Regal Theatre:
|
|
|
|
|
|
|||||||||||||||||||||||||||
|
Bolingbrook, IL
|
—
|
|
|
2,937
|
|
3,032
|
|
1,500
|
|
|
—
|
|
|
2,937
|
|
4,532
|
|
7,469
|
|
751
|
|
1994
|
09/07
|
|
30
|
|||||||
|
|
|
|
|
|
|
|||||||||||||||||||||||||||
|
Reliable Life Insurance:
|
|
|
|
|
|
|||||||||||||||||||||||||||
|
St. Louis, MO
|
—
|
|
|
1,519
|
|
10,074
|
|
1,466
|
|
|
—
|
|
|
1,519
|
|
11,540
|
|
13,059
|
|
2,637
|
|
1975
|
05/04
|
|
40
|
|||||||
|
|
|
|
|
|
|
|||||||||||||||||||||||||||
|
Rent-A-Center:
|
|
|
|
|
|
|||||||||||||||||||||||||||
|
Cohoes, NY
|
—
|
|
|
64
|
|
348
|
|
242
|
|
|
—
|
|
|
64
|
|
590
|
|
654
|
|
101
|
|
1994
|
09/04
|
|
40
|
|||||||
|
|
|
|
|
|
|
|||||||||||||||||||||||||||
See accompanying report of independent registered public accounting firm.
F-41
|
Initial Cost to
Company
|
Costs Capitalized
Subsequent to
Acquisition
|
Gross Amount at Which
Carried at Close of Period (a) (b)
|
Life on Which
Depreciation &
Amortization in Latest Income
Statement is
Computed (Years)
|
|||||||||||||||||||||||||||||
|
Encumbrances
|
Land
|
Building,
Improvements &
Leasehold
Interests
|
Improvements
|
Carrying
Costs
|
Land
|
Building,
Improvements &
Leasehold
Interests
|
Total
|
Accumulated
Depreciation
and
Amortization
|
Date of
Construction
|
Date
Acquired
|
||||||||||||||||||||||
|
Real Estate Held for Investment the Company has Invested in Under Operating Leases:
|
||||||||||||||||||||||||||||||||
|
Rite Aid:
|
|
|
|
|
|
|||||||||||||||||||||||||||
|
Douglasville, GA
|
—
|
|
|
413
|
|
995
|
|
—
|
|
|
—
|
|
|
413
|
|
995
|
|
1,408
|
|
471
|
|
1996
|
01/96
|
|
40
|
|||||||
|
Conyers, GA
|
—
|
|
|
575
|
|
999
|
|
—
|
|
|
—
|
|
|
575
|
|
999
|
|
1,574
|
|
438
|
|
1997
|
06/97
|
|
40
|
|||||||
|
Riverdale, GA
|
—
|
|
|
1,089
|
|
1,707
|
|
—
|
|
|
—
|
|
|
1,089
|
|
1,707
|
|
2,796
|
|
727
|
|
1997
|
12/97
|
|
40
|
|||||||
|
Warner Robins, GA
|
—
|
|
|
707
|
|
—
|
|
1,227
|
|
|
—
|
|
|
707
|
|
1,227
|
|
1,934
|
|
490
|
|
1999
|
03/98
|
(g)
|
40
|
|||||||
|
Mobile, AL (n)
|
—
|
|
|
1,137
|
|
1,694
|
|
—
|
|
|
—
|
|
|
1,137
|
|
1,694
|
|
2,831
|
|
552
|
|
2000
|
12/01
|
|
40
|
|||||||
|
Orange Beach, AL
|
—
|
|
|
1,410
|
|
1,996
|
|
—
|
|
|
—
|
|
|
1,410
|
|
1,996
|
|
3,406
|
|
651
|
|
2000
|
12/01
|
|
40
|
|||||||
|
Norfolk, VA
|
—
|
|
|
2,742
|
|
1,797
|
|
—
|
|
|
—
|
|
|
2,742
|
|
1,797
|
|
4,539
|
|
578
|
|
2001
|
02/02
|
|
40
|
|||||||
|
Thorndale, PA
|
—
|
|
|
2,261
|
|
2,472
|
|
—
|
|
|
—
|
|
|
2,261
|
|
2,472
|
|
4,733
|
|
796
|
|
2001
|
02/02
|
|
40
|
|||||||
|
West Mifflin, PA
|
—
|
|
|
1,402
|
|
2,044
|
|
—
|
|
|
—
|
|
|
1,402
|
|
2,044
|
|
3,446
|
|
658
|
|
1999
|
02/02
|
|
40
|
|||||||
|
Albany, NY
|
—
|
|
|
25
|
|
867
|
|
—
|
|
|
—
|
|
|
25
|
|
867
|
|
892
|
|
223
|
|
1994
|
09/04
|
|
40
|
|||||||
|
Saratoga Springs, NY
|
—
|
|
|
762
|
|
591
|
|
30
|
|
|
—
|
|
|
762
|
|
621
|
|
1,383
|
|
156
|
|
1993
|
09/04
|
|
40
|
|||||||
|
Monticello, NY
|
221
|
|
|
664
|
|
769
|
|
—
|
|
|
—
|
|
|
664
|
|
769
|
|
1,433
|
|
188
|
|
1996
|
03/05
|
|
40
|
|||||||
|
Clinton Twp, MI
|
—
|
|
|
977
|
|
1,664
|
|
—
|
|
|
—
|
|
|
977
|
|
1,664
|
|
2,641
|
|
44
|
|
1998
|
03/14
|
|
30
|
|||||||
|
Dowagiac, MI
|
—
|
|
|
409
|
|
1,609
|
|
—
|
|
|
—
|
|
|
409
|
|
1,609
|
|
2,018
|
|
42
|
|
1998
|
03/14
|
|
30
|
|||||||
|
|
|
|
|
|
|
|||||||||||||||||||||||||||
|
Rite Care Pharmacy:
|
|
|
|
|
|
|||||||||||||||||||||||||||
|
Dallas, TX
|
—
|
|
|
2,407
|
|
2,299
|
|
320
|
|
|
—
|
|
|
2,407
|
|
2,618
|
|
5,025
|
|
553
|
|
1971
|
06/05
|
|
40
|
|||||||
|
|
|
|
|
|
|
|||||||||||||||||||||||||||
|
Road Ranger:
|
|
|
|
|
|
|||||||||||||||||||||||||||
|
Springfield, IL
|
—
|
|
|
705
|
|
1,500
|
|
—
|
|
|
—
|
|
|
705
|
|
1,500
|
|
2,205
|
|
320
|
|
1997
|
06/06
|
|
40
|
|||||||
|
Belvidere, IL
|
—
|
|
|
1,098
|
|
1,256
|
|
1,257
|
|
|
—
|
|
|
1,098
|
|
2,513
|
|
3,611
|
|
371
|
|
1997
|
06/06
|
|
40
|
|||||||
|
Brazil, IN
|
—
|
|
|
2,199
|
|
907
|
|
—
|
|
|
—
|
|
|
2,199
|
|
907
|
|
3,106
|
|
194
|
|
1990
|
06/06
|
|
40
|
|||||||
|
Cherry Valley, IL
|
—
|
|
|
1,409
|
|
1,897
|
|
—
|
|
|
—
|
|
|
1,409
|
|
1,897
|
|
3,306
|
|
405
|
|
1991
|
06/06
|
|
40
|
|||||||
|
Cottage Grove, WI
|
—
|
|
|
2,175
|
|
1,733
|
|
—
|
|
|
—
|
|
|
2,175
|
|
1,733
|
|
3,908
|
|
370
|
|
1990
|
06/06
|
|
40
|
|||||||
|
Decatur, IL
|
—
|
|
|
815
|
|
1,314
|
|
—
|
|
|
—
|
|
|
815
|
|
1,314
|
|
2,129
|
|
281
|
|
2002
|
06/06
|
|
40
|
|||||||
|
Dekalb, IL
|
—
|
|
|
747
|
|
1,658
|
|
—
|
|
|
—
|
|
|
747
|
|
1,658
|
|
2,405
|
|
354
|
|
2000
|
06/06
|
|
40
|
|||||||
|
Elk Run Heights, IA
|
—
|
|
|
1,538
|
|
2,470
|
|
—
|
|
|
—
|
|
|
1,538
|
|
2,470
|
|
4,008
|
|
527
|
|
1989
|
06/06
|
|
40
|
|||||||
|
Lake Station, IN
|
—
|
|
|
3,172
|
|
1,112
|
|
—
|
|
|
—
|
|
|
3,172
|
|
1,112
|
|
4,284
|
|
237
|
|
1987
|
06/06
|
|
40
|
|||||||
|
Mendota, IL
|
—
|
|
|
1,218
|
|
3,295
|
|
—
|
|
|
—
|
|
|
1,218
|
|
3,295
|
|
4,513
|
|
462
|
|
1996
|
06/06
|
|
40
|
|||||||
|
Oakdale, WI
|
—
|
|
|
1,844
|
|
1,663
|
|
—
|
|
|
—
|
|
|
1,844
|
|
1,663
|
|
3,507
|
|
355
|
|
1998
|
06/06
|
|
40
|
|||||||
|
Rockford, IL
|
—
|
|
|
623
|
|
1,331
|
|
—
|
|
|
—
|
|
|
623
|
|
1,331
|
|
1,954
|
|
284
|
|
2000
|
06/06
|
|
40
|
|||||||
|
Rockford, IL
|
—
|
|
|
1,094
|
|
1,662
|
|
—
|
|
|
—
|
|
|
1,094
|
|
1,662
|
|
2,756
|
|
355
|
|
1996
|
06/06
|
|
40
|
|||||||
|
Springfield, IL
|
—
|
|
|
1,795
|
|
1,863
|
|
—
|
|
|
—
|
|
|
2,211
|
|
1,863
|
|
4,074
|
|
448
|
|
1978
|
06/06
|
|
40
|
|||||||
See accompanying report of independent registered public accounting firm.
F-42
|
Initial Cost to
Company
|
Costs Capitalized
Subsequent to
Acquisition
|
Gross Amount at Which
Carried at Close of Period (a) (b)
|
Life on Which
Depreciation &
Amortization in Latest Income
Statement is
Computed (Years)
|
|||||||||||||||||||||||||||||
|
Encumbrances
|
Land
|
Building,
Improvements &
Leasehold
Interests
|
Improvements
|
Carrying
Costs
|
Land
|
Building,
Improvements &
Leasehold
Interests
|
Total
|
Accumulated
Depreciation
and
Amortization
|
Date of
Construction
|
Date
Acquired
|
||||||||||||||||||||||
|
Real Estate Held for Investment the Company has Invested in Under Operating Leases:
|
||||||||||||||||||||||||||||||||
|
Champaign, IL
|
—
|
|
|
3,241
|
|
2,008
|
|
—
|
|
|
—
|
|
|
3,241
|
|
2,008
|
|
5,249
|
|
395
|
|
2006
|
02/07
|
|
40
|
|||||||
|
DeKalb, IL
|
—
|
|
|
505
|
|
1,503
|
|
—
|
|
|
—
|
|
|
505
|
|
1,503
|
|
2,008
|
|
296
|
|
2004
|
02/07
|
|
40
|
|||||||
|
Fenton, MO
|
—
|
|
|
2,584
|
|
2,622
|
|
—
|
|
|
—
|
|
|
2,584
|
|
2,622
|
|
5,206
|
|
516
|
|
2007
|
02/07
|
|
40
|
|||||||
|
Hampshire, IL
|
—
|
|
|
1,307
|
|
1,501
|
|
1,629
|
|
|
—
|
|
|
1,307
|
|
3,130
|
|
4,437
|
|
588
|
|
1988
|
02/07
|
(f)
|
40
|
|||||||
|
Princeton, IL (n)
|
—
|
|
|
1,141
|
|
3,066
|
|
—
|
|
|
—
|
|
|
1,141
|
|
3,066
|
|
4,207
|
|
604
|
|
2003
|
02/07
|
|
40
|
|||||||
|
South Beloit, IL
|
—
|
|
|
3,824
|
|
2,309
|
|
—
|
|
|
—
|
|
|
3,824
|
|
2,309
|
|
6,133
|
|
455
|
|
2002
|
02/07
|
|
40
|
|||||||
|
Cedar Rapids, IA
|
—
|
|
|
1,025
|
|
984
|
|
—
|
|
|
—
|
|
|
1,025
|
|
984
|
|
2,009
|
|
192
|
|
1990
|
03/07
|
|
40
|
|||||||
|
Marion, IA
|
—
|
|
|
737
|
|
1,071
|
|
—
|
|
|
—
|
|
|
737
|
|
1,071
|
|
1,808
|
|
209
|
|
1974
|
03/07
|
|
40
|
|||||||
|
Okawville, IL
|
—
|
|
|
1,530
|
|
1,147
|
|
1,034
|
|
|
—
|
|
|
1,536
|
|
2,181
|
|
3,717
|
|
275
|
|
1997
|
08/07
|
|
40
|
|||||||
|
Dubuque, IA
|
—
|
|
|
561
|
|
1,941
|
|
—
|
|
|
—
|
|
|
561
|
|
1,941
|
|
2,502
|
|
354
|
|
2000
|
09/07
|
|
40
|
|||||||
|
Belvidere, IL
|
—
|
|
|
521
|
|
1,053
|
|
—
|
|
|
—
|
|
|
521
|
|
1,053
|
|
1,574
|
|
188
|
|
2008
|
09/07
|
(f)
|
40
|
|||||||
|
South Beloit, IL
|
—
|
|
|
1,182
|
|
1,324
|
|
—
|
|
|
—
|
|
|
1,182
|
|
1,324
|
|
2,506
|
|
236
|
|
2008
|
09/07
|
(f)
|
40
|
|||||||
|
Chicago, IL
|
—
|
|
|
1,350
|
|
6,450
|
|
—
|
|
|
—
|
|
|
1,350
|
|
6,450
|
|
7,800
|
|
634
|
|
1970
|
07/12
|
|
25
|
|||||||
|
|
|
|
|
|
|
|||||||||||||||||||||||||||
|
Robbins Diamonds:
|
|
|
|
|
|
|||||||||||||||||||||||||||
|
Newark, DE
|
—
|
|
|
636
|
|
1,273
|
|
29
|
|
|
—
|
|
|
629
|
|
1,302
|
|
1,931
|
|
641
|
|
1994
|
12/94
|
|
40
|
|||||||
|
|
|
|
|
|
|
|||||||||||||||||||||||||||
|
Romancing the Range:
|
|
|
|
|
|
|||||||||||||||||||||||||||
|
Anderson, SC (n)
|
—
|
|
|
140
|
|
815
|
|
—
|
|
|
—
|
|
|
140
|
|
815
|
|
955
|
|
11
|
|
1996
|
07/14
|
|
35
|
|||||||
|
|
|
|
|
|
|
|||||||||||||||||||||||||||
|
Ross Dress for Less:
|
|
|
|
|
|
|||||||||||||||||||||||||||
|
Coral Gables, FL
|
—
|
|
|
1,782
|
|
1,661
|
|
19
|
|
|
—
|
|
|
1,782
|
|
1,680
|
|
3,462
|
|
733
|
|
1994
|
06/96
|
|
38
|
|||||||
|
Lodi, CA
|
—
|
|
|
614
|
|
1,415
|
|
—
|
|
|
—
|
|
|
614
|
|
1,415
|
|
2,029
|
|
396
|
|
1984
|
03/99
|
|
40
|
|||||||
|
|
|
|
|
|
|
|||||||||||||||||||||||||||
|
Rue 21:
|
|
|
|
|
|
|||||||||||||||||||||||||||
|
Lapeer, MI
|
—
|
|
|
126
|
|
645
|
|
—
|
|
|
—
|
|
|
126
|
|
629
|
|
755
|
|
116
|
|
2007
|
10/05
|
|
40
|
|||||||
|
|
|
|
|
|
|
|||||||||||||||||||||||||||
|
Sally Beauty Supply:
|
|
|
|
|
|
|||||||||||||||||||||||||||
|
Lapeer, MI
|
—
|
|
|
33
|
|
167
|
|
—
|
|
|
—
|
|
|
33
|
|
163
|
|
196
|
|
30
|
|
2007
|
10/05
|
|
40
|
|||||||
|
|
|
|
|
|
|
|||||||||||||||||||||||||||
|
Salons by JC:
|
|
|
|
|
|
|||||||||||||||||||||||||||
|
Buford, GA
|
—
|
|
|
539
|
|
1,421
|
|
—
|
|
|
—
|
|
|
539
|
|
1,421
|
|
1,960
|
|
370
|
|
2003
|
07/04
|
(g)
|
40
|
|||||||
|
|
|
|
|
|
|
|||||||||||||||||||||||||||
See accompanying report of independent registered public accounting firm.
F-43
|
Initial Cost to
Company
|
Costs Capitalized
Subsequent to
Acquisition
|
Gross Amount at Which
Carried at Close of Period (a) (b)
|
Life on Which
Depreciation &
Amortization in Latest Income
Statement is
Computed (Years)
|
|||||||||||||||||||||||||||||
|
Encumbrances
|
Land
|
Building,
Improvements &
Leasehold
Interests
|
Improvements
|
Carrying
Costs
|
Land
|
Building,
Improvements &
Leasehold
Interests
|
Total
|
Accumulated
Depreciation
and
Amortization
|
Date of
Construction
|
Date
Acquired
|
||||||||||||||||||||||
|
Real Estate Held for Investment the Company has Invested in Under Operating Leases:
|
||||||||||||||||||||||||||||||||
|
Saltgrass Steakhouse:
|
|
|
|
|
|
|||||||||||||||||||||||||||
|
Beaumont, TX
|
—
|
|
|
558
|
|
—
|
|
1,317
|
|
|
—
|
|
|
901
|
|
1,317
|
|
2,218
|
|
181
|
|
1975
|
09/10
|
(m)
|
30
|
|||||||
|
San Antonio, TX
|
—
|
|
|
1,280
|
|
—
|
|
853
|
|
|
—
|
|
|
1,280
|
|
853
|
|
2,133
|
|
67
|
|
2011
|
08/11
|
(m)
|
40
|
|||||||
|
Cypress, TX
|
—
|
|
|
1,071
|
|
—
|
|
1,886
|
|
|
—
|
|
|
1,071
|
|
1,886
|
|
2,957
|
|
116
|
|
2012
|
03/12
|
(m)
|
40
|
|||||||
|
Midland, TX
|
—
|
|
|
837
|
|
2,073
|
|
—
|
|
|
—
|
|
|
837
|
|
2,073
|
|
2,910
|
|
91
|
|
1998
|
01/13
|
|
35
|
|||||||
|
Port Arthur, TX
|
—
|
|
|
890
|
|
—
|
|
2,049
|
|
|
—
|
|
|
890
|
|
2,049
|
|
2,939
|
|
49
|
|
2014
|
08/13
|
(m)
|
40
|
|||||||
|
McAllen, TX
|
—
|
|
|
1,390
|
|
—
|
|
—
|
|
|
—
|
|
|
1,393
|
|
1,417
|
|
2,810
|
|
(q)
|
|
2007
|
12/13
|
(m)
|
(q)
|
|||||||
|
College Station, TX
|
—
|
|
|
934
|
|
—
|
|
2,031
|
|
|
—
|
|
|
934
|
|
2,031
|
|
2,965
|
|
(q)
|
|
2014
|
04/14
|
(m)
|
(q)
|
|||||||
|
Lewisville, TX
|
—
|
|
|
1,268
|
|
—
|
|
—
|
|
|
—
|
|
|
1,268
|
|
(e)
|
|
1,268
|
|
(e)
|
|
(e)
|
11/14
|
(m)
|
(e)
|
|||||||
|
Waco, TX
|
—
|
|
|
730
|
|
—
|
|
—
|
|
|
—
|
|
|
730
|
|
(e)
|
|
730
|
|
(e)
|
|
(e)
|
12/14
|
(m)
|
(e)
|
|||||||
|
|
|
|
|
|
|
|||||||||||||||||||||||||||
|
Savers Thrift Superstore:
|
|
|
|
|
|
|||||||||||||||||||||||||||
|
Fairview Heights, IL
|
—
|
|
|
1,258
|
|
2,623
|
|
246
|
|
|
—
|
|
|
1,258
|
|
2,869
|
|
4,127
|
|
614
|
|
1980
|
10/05
|
(g)
|
40
|
|||||||
|
|
|
|
|
|
|
|||||||||||||||||||||||||||
|
Schlotzsky's Deli:
|
|
|
|
|
|
|||||||||||||||||||||||||||
|
Phoenix, AZ
|
—
|
|
|
706
|
|
315
|
|
—
|
|
|
—
|
|
|
706
|
|
315
|
|
1,021
|
|
103
|
|
1995
|
12/01
|
|
40
|
|||||||
|
Scottsdale, AZ
|
—
|
|
|
717
|
|
311
|
|
—
|
|
|
—
|
|
|
717
|
|
311
|
|
1,028
|
|
101
|
|
1995
|
12/01
|
|
40
|
|||||||
|
|
|
|
|
|
|
|||||||||||||||||||||||||||
|
Season's 52:
|
|
|
|
|
|
|||||||||||||||||||||||||||
|
Schaumburg, IL
|
—
|
|
|
2,065
|
|
1,311
|
|
—
|
|
|
—
|
|
|
2,065
|
|
(i)
|
|
2,065
|
|
(i)
|
|
(i)
|
12/01
|
|
(i)
|
|||||||
|
|
|
|
|
|
|
|||||||||||||||||||||||||||
|
Select Comfort:
|
|
|
|
|
|
|||||||||||||||||||||||||||
|
Tucson, AZ
|
—
|
|
|
906
|
|
—
|
|
—
|
|
|
—
|
|
|
906
|
|
(e)
|
|
906
|
|
(e)
|
|
(e)
|
11/14
|
(m)
|
(e)
|
|||||||
|
|
|
|
|
|
|
|||||||||||||||||||||||||||
|
Shek's Chinese Express:
|
|
|
|
|
|
|||||||||||||||||||||||||||
|
Eden Prairie, MN
|
—
|
|
|
65
|
|
261
|
|
—
|
|
|
—
|
|
|
65
|
|
261
|
|
326
|
|
83
|
|
1997
|
12/01
|
|
40
|
|||||||
|
|
|
|
|
|
|
|||||||||||||||||||||||||||
|
Shell:
|
|
|
|
|
|
|||||||||||||||||||||||||||
|
Glendale, AZ
|
—
|
|
|
1,817
|
|
2,415
|
|
126
|
|
|
—
|
|
|
1,817
|
|
2,541
|
|
4,358
|
|
490
|
|
2001
|
05/08
|
|
40
|
|||||||
|
Peoria, AZ
|
—
|
|
|
860
|
|
1,117
|
|
114
|
|
|
—
|
|
|
860
|
|
1,231
|
|
2,091
|
|
328
|
|
1987
|
05/08
|
|
30
|
|||||||
|
|
|
|
|
|
|
|||||||||||||||||||||||||||
|
Shop-a-Snak:
|
|
|
|
|
|
|||||||||||||||||||||||||||
|
Bessemer, AL
|
—
|
|
|
564
|
|
742
|
|
—
|
|
|
—
|
|
|
564
|
|
742
|
|
1,306
|
|
160
|
|
2002
|
05/06
|
|
40
|
|||||||
|
Chelsea, AL
|
—
|
|
|
391
|
|
628
|
|
—
|
|
|
—
|
|
|
391
|
|
628
|
|
1,019
|
|
135
|
|
1981
|
05/06
|
|
40
|
|||||||
|
Jasper, AL (n)
|
—
|
|
|
551
|
|
747
|
|
—
|
|
|
—
|
|
|
551
|
|
747
|
|
1,298
|
|
161
|
|
1998
|
05/06
|
|
40
|
|||||||
|
Birmingham, AL
|
—
|
|
|
446
|
|
672
|
|
—
|
|
|
—
|
|
|
446
|
|
672
|
|
1,118
|
|
145
|
|
1989
|
05/06
|
|
40
|
|||||||
|
Birmingham, AL
|
—
|
|
|
439
|
|
704
|
|
—
|
|
|
—
|
|
|
439
|
|
704
|
|
1,143
|
|
152
|
|
1989
|
05/06
|
|
40
|
|||||||
|
Birmingham, AL
|
—
|
|
|
490
|
|
769
|
|
—
|
|
|
—
|
|
|
490
|
|
769
|
|
1,259
|
|
166
|
|
1992
|
05/06
|
|
40
|
|||||||
|
Birmingham, AL
|
—
|
|
|
361
|
|
744
|
|
—
|
|
|
—
|
|
|
361
|
|
744
|
|
1,105
|
|
160
|
|
1989
|
05/06
|
|
40
|
|||||||
|
Homewood, AL
|
—
|
|
|
468
|
|
657
|
|
—
|
|
|
—
|
|
|
468
|
|
657
|
|
1,125
|
|
142
|
|
1990
|
05/06
|
|
40
|
|||||||
|
Hoover, AL
|
—
|
|
|
713
|
|
865
|
|
—
|
|
|
—
|
|
|
713
|
|
865
|
|
1,578
|
|
186
|
|
1998
|
05/06
|
|
40
|
|||||||
|
Hoover, AL
|
—
|
|
|
764
|
|
1,157
|
|
—
|
|
|
—
|
|
|
663
|
|
1,157
|
|
1,820
|
|
249
|
|
2005
|
05/06
|
|
40
|
|||||||
|
Trussville, AL
|
—
|
|
|
272
|
|
542
|
|
—
|
|
|
—
|
|
|
272
|
|
542
|
|
814
|
|
117
|
|
1992
|
05/06
|
|
40
|
|||||||
|
Tuscaloosa, AL
|
—
|
|
|
432
|
|
559
|
|
—
|
|
|
—
|
|
|
432
|
|
559
|
|
991
|
|
121
|
|
1991
|
05/06
|
|
40
|
|||||||
|
Tuscaloosa, AL
|
—
|
|
|
386
|
|
733
|
|
—
|
|
|
—
|
|
|
386
|
|
733
|
|
1,119
|
|
158
|
|
1991
|
05/06
|
|
40
|
|||||||
|
Tuscaloosa, AL
|
—
|
|
|
525
|
|
463
|
|
—
|
|
|
—
|
|
|
525
|
|
463
|
|
988
|
|
100
|
|
1991
|
05/06
|
|
40
|
|||||||
|
|
|
|
|
|
|
|||||||||||||||||||||||||||
|
Silverleaf Resorts:
|
|
|
|
|
|
|||||||||||||||||||||||||||
|
Buford, GA
|
—
|
|
|
1,267
|
|
2,406
|
|
25
|
|
|
—
|
|
|
1,267
|
|
2,430
|
|
3,697
|
|
632
|
|
2004
|
07/04
|
|
40
|
|||||||
|
|
|
|
|
|
|
|||||||||||||||||||||||||||
|
Sonic Automotive:
|
|
|
|
|
|
|||||||||||||||||||||||||||
|
Charlotte, NC
|
—
|
|
|
3,619
|
|
4,854
|
|
—
|
|
|
—
|
|
|
3,619
|
|
4,854
|
|
8,473
|
|
925
|
|
1996
|
05/07
|
|
40
|
|||||||
|
|
|
|
|
|
|
|||||||||||||||||||||||||||
|
Sparkling Image:
|
|
|
|
|
|
|||||||||||||||||||||||||||
|
Bakersfield, CA
|
—
|
|
|
3,363
|
|
3,288
|
|
—
|
|
|
—
|
|
|
3,363
|
|
3,288
|
|
6,651
|
|
558
|
|
2002
|
03/08
|
|
40
|
|||||||
|
Bakersfield, CA
|
—
|
|
|
3,346
|
|
6,016
|
|
—
|
|
|
—
|
|
|
3,346
|
|
6,016
|
|
9,362
|
|
1,164
|
|
1998
|
03/08
|
|
35
|
|||||||
|
Bakersfield, CA
|
—
|
|
|
2,043
|
|
3,520
|
|
40
|
|
|
—
|
|
|
2,043
|
|
719
|
|
2,762
|
|
287
|
|
1988
|
03/08
|
|
30
|
|||||||
|
Bakersfield, CA
|
—
|
|
|
3,664
|
|
3,709
|
|
11
|
|
|
—
|
|
|
3,664
|
|
3,721
|
|
7,385
|
|
721
|
|
1994
|
03/08
|
|
35
|
|||||||
|
Bakersfield, CA
|
—
|
|
|
2,798
|
|
5,260
|
|
22
|
|
|
—
|
|
|
1,781
|
|
284
|
|
2,065
|
|
266
|
|
1997
|
03/08
|
|
35
|
|||||||
|
Bakersfield, CA
|
—
|
|
|
2,564
|
|
4,465
|
|
2,178
|
|
|
—
|
|
|
2,564
|
|
6,643
|
|
9,207
|
|
1,331
|
|
1988
|
03/08
|
|
30
|
|||||||
|
San Fernando, CA
|
—
|
|
|
6,630
|
|
2,706
|
|
47
|
|
|
—
|
|
|
6,630
|
|
2,753
|
|
9,383
|
|
625
|
|
1988
|
03/08
|
|
30
|
|||||||
|
Ventura, CA
|
—
|
|
|
5,590
|
|
4,431
|
|
94
|
|
|
—
|
|
|
5,590
|
|
4,526
|
|
10,116
|
|
764
|
|
2001
|
03/08
|
|
40
|
|||||||
|
Ventura, CA
|
—
|
|
|
6,253
|
|
4,560
|
|
207
|
|
|
—
|
|
|
6,253
|
|
4,767
|
|
11,020
|
|
914
|
|
1994
|
03/08
|
|
35
|
|||||||
|
|
|
|
|
|
|
|||||||||||||||||||||||||||
|
Spec's Liquor and Fine Foods:
|
|
|
|
|
|
|||||||||||||||||||||||||||
|
Corpus Christi, TX
|
—
|
|
|
768
|
|
841
|
|
601
|
|
|
—
|
|
|
768
|
|
1,442
|
|
2,210
|
|
572
|
|
1967
|
11/93
|
|
40
|
|||||||
|
Coffee City, TX
|
—
|
|
|
1,330
|
|
3,858
|
|
—
|
|
|
—
|
|
|
1,330
|
|
3,858
|
|
5,188
|
|
953
|
|
1996
|
02/05
|
|
40
|
|||||||
|
Spencer’s Air Conditioning & Appliance:
|
|
|
|
|
|
|||||||||||||||||||||||||||
|
Glendale, AZ
|
—
|
|
|
342
|
|
982
|
|
—
|
|
|
—
|
|
|
342
|
|
982
|
|
1,324
|
|
379
|
|
1999
|
12/98
|
(g)
|
40
|
|||||||
|
|
|
|
|
|
|
|||||||||||||||||||||||||||
|
Sports Authority:
|
|
|
|
|
|
|||||||||||||||||||||||||||
|
Tampa, FL
|
—
|
|
|
2,128
|
|
1,522
|
|
—
|
|
|
—
|
|
|
2,128
|
|
1,522
|
|
3,650
|
|
704
|
|
1994
|
06/96
|
|
40
|
|||||||
|
Sarasota, FL
|
—
|
|
|
1,428
|
|
1,703
|
|
—
|
|
|
—
|
|
|
1,428
|
|
1,703
|
|
3,131
|
|
465
|
|
1988
|
09/97
|
|
40
|
|||||||
|
Memphis, TN
|
—
|
|
|
820
|
|
—
|
|
2,598
|
|
|
—
|
|
|
820
|
|
2,598
|
|
3,418
|
|
1,046
|
|
1998
|
12/97
|
(g)
|
40
|
|||||||
|
Woodbridge, NJ
|
—
|
|
|
3,750
|
|
5,983
|
|
—
|
|
|
—
|
|
|
3,750
|
|
5,983
|
|
9,733
|
|
1,789
|
|
1994
|
01/03
|
|
40
|
|||||||
|
|
|
|
|
|
|
|||||||||||||||||||||||||||
|
Staples:
|
|
|
|
|
|
|||||||||||||||||||||||||||
|
Memphis, TN
|
—
|
|
|
931
|
|
2,210
|
|
—
|
|
|
—
|
|
|
931
|
|
2,210
|
|
3,141
|
|
55
|
|
2011
|
02/14
|
|
35
|
|||||||
|
|
|
|
|
|
|
|||||||||||||||||||||||||||
|
Starplex Theatre:
|
|
|
|
|
|
|||||||||||||||||||||||||||
|
Southington, CT
|
—
|
|
|
1,346
|
|
—
|
|
3,662
|
|
|
—
|
|
|
1,346
|
|
3,662
|
|
5,008
|
|
76
|
|
1993
|
05/14
|
(m)
|
30
|
|||||||
|
|
|
|
|
|
|
|||||||||||||||||||||||||||
|
Steak N Shake:
|
|
|
|
|
|
|||||||||||||||||||||||||||
|
Munhall, PA
|
—
|
|
|
688
|
|
727
|
|
—
|
|
|
—
|
|
|
688
|
|
727
|
|
1,415
|
|
13
|
|
2002
|
07/14
|
|
25
|
|||||||
|
South Bend, IN
|
—
|
|
|
447
|
|
1,238
|
|
—
|
|
|
—
|
|
|
447
|
|
1,238
|
|
1,685
|
|
19
|
|
2004
|
07/14
|
|
30
|
|||||||
|
|
|
|
|
|
|
|||||||||||||||||||||||||||
|
Sterling Collision:
|
|
|
|
|
|
|||||||||||||||||||||||||||
|
Lombard, IL
|
—
|
|
|
622
|
|
1,714
|
|
—
|
|
|
—
|
|
|
622
|
|
1,714
|
|
2,336
|
|
140
|
|
1997
|
12/12
|
|
25
|
|||||||
|
|
|
|
|
|
|
|||||||||||||||||||||||||||
|
Stone Mountain Chevrolet:
|
|
|
|
|
|
|||||||||||||||||||||||||||
|
Lilburn, GA
|
—
|
|
|
3,027
|
|
4,685
|
|
—
|
|
|
—
|
|
|
3,027
|
|
4,685
|
|
7,712
|
|
1,215
|
|
2004
|
08/04
|
|
40
|
|||||||
|
|
|
|
|
|
|
|||||||||||||||||||||||||||
|
Stop N Go:
|
|
|
|
|
|
|||||||||||||||||||||||||||
|
Grand Prairie, TX
|
—
|
|
|
421
|
|
685
|
|
—
|
|
|
—
|
|
|
421
|
|
685
|
|
1,106
|
|
223
|
|
1986
|
12/01
|
|
40
|
|||||||
|
|
|
|
|
|
|
|||||||||||||||||||||||||||
|
Stripes:
|
|
|
|
|
|
|||||||||||||||||||||||||||
|
Laredo, TX
|
—
|
|
|
841
|
|
739
|
|
—
|
|
|
—
|
|
|
841
|
|
739
|
|
1,580
|
|
167
|
|
2001
|
12/05
|
|
40
|
|||||||
|
Brownsville, TX
|
—
|
|
|
1,015
|
|
1,308
|
|
—
|
|
|
—
|
|
|
1,015
|
|
1,308
|
|
2,323
|
|
296
|
|
2003
|
12/05
|
|
40
|
|||||||
|
Brownsville, TX
|
—
|
|
|
1,392
|
|
1,444
|
|
—
|
|
|
—
|
|
|
1,392
|
|
1,444
|
|
2,836
|
|
326
|
|
2005
|
12/05
|
|
40
|
|||||||
|
Brownsville, TX
|
—
|
|
|
933
|
|
699
|
|
—
|
|
|
—
|
|
|
933
|
|
699
|
|
1,632
|
|
158
|
|
1999
|
12/05
|
|
40
|
|||||||
|
Brownsville, TX
|
—
|
|
|
1,843
|
|
1,419
|
|
—
|
|
|
—
|
|
|
1,843
|
|
1,419
|
|
3,262
|
|
321
|
|
2000
|
12/05
|
|
40
|
|||||||
See accompanying report of independent registered public accounting firm.
F-44
|
Initial Cost to
Company
|
Costs Capitalized
Subsequent to
Acquisition
|
Gross Amount at Which
Carried at Close of Period (a) (b)
|
Life on Which
Depreciation &
Amortization in Latest Income
Statement is
Computed (Years)
|
|||||||||||||||||||||||||||||
|
Encumbrances
|
Land
|
Building,
Improvements &
Leasehold
Interests
|
Improvements
|
Carrying
Costs
|
Land
|
Building,
Improvements &
Leasehold
Interests
|
Total
|
Accumulated
Depreciation
and
Amortization
|
Date of
Construction
|
Date
Acquired
|
||||||||||||||||||||||
|
Real Estate Held for Investment the Company has Invested in Under Operating Leases:
|
||||||||||||||||||||||||||||||||
|
Brownsville, TX
|
—
|
|
|
2,033
|
|
1,288
|
|
—
|
|
|
—
|
|
|
2,033
|
|
1,288
|
|
3,321
|
|
291
|
|
1995
|
12/05
|
|
40
|
|||||||
|
Brownsville, TX
|
—
|
|
|
2,530
|
|
1,125
|
|
—
|
|
|
—
|
|
|
2,530
|
|
1,125
|
|
3,655
|
|
254
|
|
1990
|
12/05
|
|
40
|
|||||||
|
Brownsville, TX
|
—
|
|
|
1,039
|
|
1,145
|
|
—
|
|
|
—
|
|
|
1,039
|
|
1,145
|
|
2,184
|
|
259
|
|
2004
|
12/05
|
|
40
|
|||||||
|
Brownsville, TX
|
—
|
|
|
2,417
|
|
1,828
|
|
—
|
|
|
—
|
|
|
2,417
|
|
1,828
|
|
4,245
|
|
413
|
|
2000
|
12/05
|
|
40
|
|||||||
|
Brownsville, TX
|
—
|
|
|
1,279
|
|
1,015
|
|
—
|
|
|
—
|
|
|
1,279
|
|
1,015
|
|
2,294
|
|
229
|
|
1990
|
12/05
|
|
40
|
|||||||
|
Brownsville, TX
|
—
|
|
|
1,182
|
|
1,105
|
|
—
|
|
|
—
|
|
|
1,182
|
|
1,105
|
|
2,287
|
|
250
|
|
2000
|
12/05
|
|
40
|
|||||||
|
Brownsville, TX
|
—
|
|
|
2,915
|
|
1,800
|
|
—
|
|
|
—
|
|
|
2,915
|
|
1,800
|
|
4,715
|
|
407
|
|
2000
|
12/05
|
|
40
|
|||||||
|
Corpus Christi, TX
|
—
|
|
|
703
|
|
1,037
|
|
—
|
|
|
—
|
|
|
703
|
|
1,037
|
|
1,740
|
|
234
|
|
1986
|
12/05
|
|
40
|
|||||||
|
Corpus Christi, TX
|
—
|
|
|
1,308
|
|
2,151
|
|
—
|
|
|
—
|
|
|
1,308
|
|
2,151
|
|
3,459
|
|
486
|
|
1995
|
12/05
|
|
40
|
|||||||
|
Corpus Christi, TX
|
—
|
|
|
1,400
|
|
1,531
|
|
—
|
|
|
—
|
|
|
1,400
|
|
1,531
|
|
2,931
|
|
346
|
|
1984
|
12/05
|
|
40
|
|||||||
|
Corpus Christi, TX
|
—
|
|
|
1,385
|
|
1,419
|
|
—
|
|
|
—
|
|
|
1,385
|
|
1,419
|
|
2,804
|
|
321
|
|
1982
|
12/05
|
|
40
|
|||||||
|
Corpus Christi, TX
|
—
|
|
|
853
|
|
1,416
|
|
—
|
|
|
—
|
|
|
853
|
|
1,416
|
|
2,269
|
|
320
|
|
2005
|
12/05
|
|
40
|
|||||||
|
Donna, TX
|
—
|
|
|
1,004
|
|
1,127
|
|
—
|
|
|
—
|
|
|
1,004
|
|
1,127
|
|
2,131
|
|
255
|
|
1995
|
12/05
|
|
40
|
|||||||
|
Edinburg, TX
|
—
|
|
|
970
|
|
1,286
|
|
—
|
|
|
—
|
|
|
970
|
|
1,286
|
|
2,256
|
|
291
|
|
2003
|
12/05
|
|
40
|
|||||||
|
Edinburg, TX
|
—
|
|
|
1,317
|
|
1,624
|
|
—
|
|
|
—
|
|
|
1,317
|
|
1,624
|
|
2,941
|
|
367
|
|
1999
|
12/05
|
|
40
|
|||||||
|
Falfurias, TX
|
—
|
|
|
4,244
|
|
4,458
|
|
—
|
|
|
—
|
|
|
4,213
|
|
4,458
|
|
8,671
|
|
1,008
|
|
2002
|
12/05
|
|
40
|
|||||||
|
Freer, TX
|
—
|
|
|
1,151
|
|
1,158
|
|
—
|
|
|
—
|
|
|
1,151
|
|
1,158
|
|
2,309
|
|
262
|
|
1984
|
12/05
|
|
40
|
|||||||
|
George West, TX
|
—
|
|
|
1,243
|
|
695
|
|
—
|
|
|
—
|
|
|
1,243
|
|
695
|
|
1,938
|
|
157
|
|
1996
|
12/05
|
|
40
|
|||||||
|
Harlingen, TX
|
—
|
|
|
755
|
|
601
|
|
—
|
|
|
—
|
|
|
755
|
|
601
|
|
1,356
|
|
136
|
|
1987
|
12/05
|
|
40
|
|||||||
|
Harlingen, TX
|
—
|
|
|
906
|
|
953
|
|
—
|
|
|
—
|
|
|
906
|
|
953
|
|
1,859
|
|
215
|
|
1991
|
12/05
|
|
40
|
|||||||
|
Harlingen, TX
|
—
|
|
|
754
|
|
1,152
|
|
—
|
|
|
—
|
|
|
754
|
|
1,152
|
|
1,906
|
|
260
|
|
1999
|
12/05
|
|
40
|
|||||||
|
La Feria, TX
|
—
|
|
|
900
|
|
1,347
|
|
—
|
|
|
—
|
|
|
900
|
|
1,347
|
|
2,247
|
|
304
|
|
1988
|
12/05
|
|
40
|
|||||||
|
Laredo, TX
|
—
|
|
|
736
|
|
670
|
|
—
|
|
|
—
|
|
|
736
|
|
670
|
|
1,406
|
|
152
|
|
1984
|
12/05
|
|
40
|
|||||||
|
Laredo, TX
|
—
|
|
|
1,553
|
|
1,775
|
|
—
|
|
|
—
|
|
|
1,553
|
|
1,775
|
|
3,328
|
|
401
|
|
2000
|
12/05
|
|
40
|
|||||||
|
Laredo, TX
|
—
|
|
|
1,495
|
|
1,400
|
|
—
|
|
|
—
|
|
|
1,495
|
|
1,400
|
|
2,895
|
|
317
|
|
1993
|
12/05
|
|
40
|
|||||||
|
Laredo, TX
|
—
|
|
|
675
|
|
533
|
|
—
|
|
|
—
|
|
|
675
|
|
533
|
|
1,208
|
|
120
|
|
1993
|
12/05
|
|
40
|
|||||||
|
Laredo, TX
|
—
|
|
|
459
|
|
460
|
|
—
|
|
|
—
|
|
|
459
|
|
460
|
|
919
|
|
104
|
|
1983
|
12/05
|
|
40
|
|||||||
|
Lawton, OK
|
—
|
|
|
697
|
|
964
|
|
—
|
|
|
—
|
|
|
649
|
|
964
|
|
1,613
|
|
218
|
|
1984
|
12/05
|
|
40
|
|||||||
|
Los Indios, TX
|
—
|
|
|
1,387
|
|
1,457
|
|
—
|
|
|
—
|
|
|
1,387
|
|
1,457
|
|
2,844
|
|
329
|
|
2005
|
12/05
|
|
40
|
|||||||
|
McAllen, TX
|
—
|
|
|
987
|
|
893
|
|
—
|
|
|
—
|
|
|
987
|
|
893
|
|
1,880
|
|
202
|
|
1999
|
12/05
|
|
40
|
|||||||
|
McAllen, TX
|
—
|
|
|
975
|
|
1,030
|
|
—
|
|
|
—
|
|
|
975
|
|
1,030
|
|
2,005
|
|
233
|
|
2003
|
12/05
|
|
40
|
|||||||
|
Mission, TX
|
—
|
|
|
880
|
|
1,101
|
|
—
|
|
|
—
|
|
|
880
|
|
1,101
|
|
1,981
|
|
249
|
|
1999
|
12/05
|
|
40
|
|||||||
|
Mission, TX
|
—
|
|
|
1,125
|
|
1,213
|
|
—
|
|
|
—
|
|
|
1,125
|
|
1,213
|
|
2,338
|
|
274
|
|
2003
|
12/05
|
|
40
|
|||||||
|
Olmito, TX
|
—
|
|
|
3,688
|
|
2,880
|
|
—
|
|
|
—
|
|
|
3,688
|
|
2,880
|
|
6,568
|
|
651
|
|
2002
|
12/05
|
|
40
|
|||||||
See accompanying report of independent registered public accounting firm.
F-45
|
Initial Cost to
Company
|
Costs Capitalized
Subsequent to
Acquisition
|
Gross Amount at Which
Carried at Close of Period (a) (b)
|
Life on Which
Depreciation &
Amortization in Latest Income
Statement is
Computed (Years)
|
|||||||||||||||||||||||||||||
|
Encumbrances
|
Land
|
Building,
Improvements &
Leasehold
Interests
|
Improvements
|
Carrying
Costs
|
Land
|
Building,
Improvements &
Leasehold
Interests
|
Total
|
Accumulated
Depreciation
and
Amortization
|
Date of
Construction
|
Date
Acquired
|
||||||||||||||||||||||
|
Real Estate Held for Investment the Company has Invested in Under Operating Leases:
|
||||||||||||||||||||||||||||||||
|
Pharr, TX
|
—
|
|
|
2,426
|
|
1,881
|
|
—
|
|
|
—
|
|
|
2,426
|
|
1,881
|
|
4,307
|
|
425
|
|
2003
|
12/05
|
|
40
|
|||||||
|
Pharr, TX
|
—
|
|
|
784
|
|
805
|
|
—
|
|
|
—
|
|
|
784
|
|
805
|
|
1,589
|
|
182
|
|
2000
|
12/05
|
|
40
|
|||||||
|
Pharr, TX
|
—
|
|
|
982
|
|
1,178
|
|
—
|
|
|
—
|
|
|
982
|
|
1,178
|
|
2,160
|
|
266
|
|
1988
|
12/05
|
|
40
|
|||||||
|
Port Isabel, TX
|
—
|
|
|
2,062
|
|
1,299
|
|
—
|
|
|
—
|
|
|
2,062
|
|
1,299
|
|
3,361
|
|
294
|
|
1994
|
12/05
|
|
40
|
|||||||
|
Portland, TX
|
—
|
|
|
656
|
|
915
|
|
—
|
|
|
—
|
|
|
656
|
|
915
|
|
1,571
|
|
207
|
|
1983
|
12/05
|
|
40
|
|||||||
|
Progreso, TX
|
—
|
|
|
1,769
|
|
1,811
|
|
—
|
|
|
—
|
|
|
1,769
|
|
1,811
|
|
3,580
|
|
409
|
|
1999
|
12/05
|
|
40
|
|||||||
|
Riviera, TX
|
—
|
|
|
2,351
|
|
2,158
|
|
—
|
|
|
—
|
|
|
2,351
|
|
2,158
|
|
4,509
|
|
488
|
|
2005
|
12/05
|
|
40
|
|||||||
|
San Benito, TX
|
—
|
|
|
791
|
|
1,857
|
|
—
|
|
|
—
|
|
|
791
|
|
1,857
|
|
2,648
|
|
420
|
|
1994
|
12/05
|
|
40
|
|||||||
|
San Benito, TX
|
—
|
|
|
1,103
|
|
1,586
|
|
—
|
|
|
—
|
|
|
1,103
|
|
1,586
|
|
2,689
|
|
359
|
|
2005
|
12/05
|
|
40
|
|||||||
|
San Juan, TX
|
—
|
|
|
1,424
|
|
1,546
|
|
—
|
|
|
—
|
|
|
1,424
|
|
1,546
|
|
2,970
|
|
349
|
|
2004
|
12/05
|
|
40
|
|||||||
|
San Juan, TX
|
—
|
|
|
1,124
|
|
1,172
|
|
—
|
|
|
—
|
|
|
1,124
|
|
1,172
|
|
2,296
|
|
265
|
|
1996
|
12/05
|
|
40
|
|||||||
|
South Padre Island, TX
|
—
|
|
|
1,367
|
|
1,389
|
|
—
|
|
|
—
|
|
|
1,367
|
|
1,389
|
|
2,756
|
|
314
|
|
1988
|
12/05
|
|
40
|
|||||||
|
Wichita Falls, TX
|
—
|
|
|
440
|
|
751
|
|
—
|
|
|
—
|
|
|
440
|
|
751
|
|
1,191
|
|
170
|
|
1984
|
12/05
|
|
40
|
|||||||
|
Wichita Falls, TX
|
—
|
|
|
905
|
|
1,351
|
|
—
|
|
|
—
|
|
|
905
|
|
1,351
|
|
2,256
|
|
305
|
|
2000
|
12/05
|
|
40
|
|||||||
|
Wichita Falls, TX
|
—
|
|
|
484
|
|
828
|
|
—
|
|
|
—
|
|
|
484
|
|
828
|
|
1,312
|
|
187
|
|
1983
|
12/05
|
|
40
|
|||||||
|
Palmview, TX
|
—
|
|
|
835
|
|
1,372
|
|
—
|
|
|
—
|
|
|
835
|
|
1,372
|
|
2,207
|
|
282
|
|
2005
|
10/06
|
|
40
|
|||||||
|
Harlingen, TX
|
—
|
|
|
638
|
|
1,807
|
|
—
|
|
|
—
|
|
|
638
|
|
1,807
|
|
2,445
|
|
363
|
|
2006
|
12/06
|
|
40
|
|||||||
|
Rio Grande City, TX
|
—
|
|
|
1,871
|
|
1,612
|
|
—
|
|
|
—
|
|
|
1,871
|
|
1,612
|
|
3,483
|
|
324
|
|
2006
|
12/06
|
|
40
|
|||||||
|
San Juan, TX
|
—
|
|
|
816
|
|
1,434
|
|
—
|
|
|
—
|
|
|
816
|
|
1,434
|
|
2,250
|
|
288
|
|
2006
|
12/06
|
|
40
|
|||||||
|
Zapata, TX
|
—
|
|
|
1,333
|
|
1,773
|
|
—
|
|
|
—
|
|
|
1,333
|
|
1,773
|
|
3,106
|
|
356
|
|
2006
|
12/06
|
|
40
|
|||||||
|
Orange Grove, TX
|
—
|
|
|
1,767
|
|
1,838
|
|
—
|
|
|
—
|
|
|
1,767
|
|
1,838
|
|
3,605
|
|
354
|
|
2007
|
04/07
|
|
40
|
|||||||
|
Harlingen, TX
|
—
|
|
|
408
|
|
826
|
|
—
|
|
|
—
|
|
|
408
|
|
826
|
|
1,234
|
|
196
|
|
1982
|
11/07
|
|
30
|
|||||||
|
Laredo, TX
|
—
|
|
|
584
|
|
958
|
|
—
|
|
|
—
|
|
|
584
|
|
958
|
|
1,542
|
|
228
|
|
1981
|
11/07
|
|
30
|
|||||||
|
Laredo, TX
|
—
|
|
|
448
|
|
734
|
|
—
|
|
|
—
|
|
|
448
|
|
734
|
|
1,182
|
|
174
|
|
1981
|
11/07
|
|
30
|
|||||||
|
Laredo, TX
|
—
|
|
|
698
|
|
1,169
|
|
—
|
|
|
—
|
|
|
698
|
|
1,169
|
|
1,867
|
|
278
|
|
1981
|
11/07
|
|
30
|
|||||||
|
Laredo, TX
|
—
|
|
|
348
|
|
1,168
|
|
—
|
|
|
—
|
|
|
348
|
|
1,168
|
|
1,516
|
|
277
|
|
1983
|
11/07
|
|
30
|
|||||||
|
Laredo, TX
|
—
|
|
|
468
|
|
728
|
|
—
|
|
|
—
|
|
|
468
|
|
728
|
|
1,196
|
|
173
|
|
1973
|
11/07
|
|
30
|
|||||||
|
San Benito, TX
|
—
|
|
|
420
|
|
1,135
|
|
—
|
|
|
—
|
|
|
420
|
|
1,135
|
|
1,555
|
|
270
|
|
1985
|
11/07
|
|
30
|
|||||||
|
Del Rio, TX
|
—
|
|
|
1,565
|
|
758
|
|
—
|
|
|
—
|
|
|
1,565
|
|
758
|
|
2,323
|
|
135
|
|
1996
|
11/07
|
|
40
|
|||||||
|
Kerrville, TX
|
—
|
|
|
640
|
|
1,616
|
|
—
|
|
|
—
|
|
|
640
|
|
1,616
|
|
2,256
|
|
288
|
|
1996
|
11/07
|
|
40
|
|||||||
|
Monahans, TX
|
—
|
|
|
2,628
|
|
2,973
|
|
—
|
|
|
—
|
|
|
2,628
|
|
2,973
|
|
5,601
|
|
530
|
|
1996
|
11/07
|
|
40
|
|||||||
|
Odessa, TX
|
—
|
|
|
2,633
|
|
3,199
|
|
—
|
|
|
—
|
|
|
2,633
|
|
3,199
|
|
5,832
|
|
570
|
|
2006
|
11/07
|
|
40
|
|||||||
|
San Angelo, TX
|
—
|
|
|
194
|
|
471
|
|
—
|
|
|
—
|
|
|
194
|
|
471
|
|
665
|
|
84
|
|
1998
|
11/07
|
|
40
|
|||||||
|
Pharr, TX
|
—
|
|
|
573
|
|
1,229
|
|
—
|
|
|
—
|
|
|
573
|
|
1,229
|
|
1,802
|
|
216
|
|
2000
|
12/07
|
|
40
|
|||||||
See accompanying report of independent registered public accounting firm.
F-46
|
Initial Cost to
Company
|
Costs Capitalized
Subsequent to
Acquisition
|
Gross Amount at Which
Carried at Close of Period (a) (b)
|
Life on Which
Depreciation &
Amortization in Latest Income
Statement is
Computed (Years)
|
|||||||||||||||||||||||||||||
|
Encumbrances
|
Land
|
Building,
Improvements &
Leasehold
Interests
|
Improvements
|
Carrying
Costs
|
Land
|
Building,
Improvements &
Leasehold
Interests
|
Total
|
Accumulated
Depreciation
and
Amortization
|
Date of
Construction
|
Date
Acquired
|
||||||||||||||||||||||
|
Real Estate Held for Investment the Company has Invested in Under Operating Leases:
|
||||||||||||||||||||||||||||||||
|
Harlingen, TX
|
—
|
|
|
329
|
|
935
|
|
—
|
|
|
—
|
|
|
329
|
|
935
|
|
1,264
|
|
217
|
|
1980
|
01/08
|
|
30
|
|||||||
|
Harlingen, TX
|
—
|
|
|
277
|
|
808
|
|
—
|
|
|
—
|
|
|
277
|
|
808
|
|
1,085
|
|
187
|
|
1983
|
01/08
|
|
30
|
|||||||
|
Laredo, TX
|
—
|
|
|
325
|
|
816
|
|
—
|
|
|
—
|
|
|
325
|
|
816
|
|
1,141
|
|
189
|
|
1983
|
01/08
|
|
30
|
|||||||
|
McAllen, TX
|
—
|
|
|
643
|
|
1,776
|
|
—
|
|
|
—
|
|
|
643
|
|
1,776
|
|
2,419
|
|
412
|
|
1980
|
01/08
|
|
30
|
|||||||
|
Port Isabel, TX
|
—
|
|
|
299
|
|
855
|
|
—
|
|
|
—
|
|
|
299
|
|
855
|
|
1,154
|
|
198
|
|
1983
|
01/08
|
|
30
|
|||||||
|
Brownsville, TX
|
—
|
|
|
843
|
|
1,429
|
|
—
|
|
|
—
|
|
|
843
|
|
1,429
|
|
2,272
|
|
237
|
|
2007
|
05/08
|
|
40
|
|||||||
|
Edinburg, TX
|
—
|
|
|
834
|
|
1,787
|
|
—
|
|
|
—
|
|
|
834
|
|
1,787
|
|
2,621
|
|
296
|
|
2007
|
05/08
|
|
40
|
|||||||
|
La Villa, TX
|
—
|
|
|
710
|
|
2,166
|
|
—
|
|
|
—
|
|
|
710
|
|
2,166
|
|
2,876
|
|
359
|
|
2007
|
05/08
|
|
40
|
|||||||
|
Laredo, TX
|
—
|
|
|
1,183
|
|
1,934
|
|
—
|
|
|
—
|
|
|
1,183
|
|
1,934
|
|
3,117
|
|
320
|
|
2007
|
05/08
|
|
40
|
|||||||
|
Laredo, TX
|
—
|
|
|
879
|
|
1,593
|
|
—
|
|
|
—
|
|
|
879
|
|
1,593
|
|
2,472
|
|
264
|
|
2007
|
05/08
|
|
40
|
|||||||
|
McAllen, TX
|
—
|
|
|
1,270
|
|
2,383
|
|
—
|
|
|
—
|
|
|
1,270
|
|
2,383
|
|
3,653
|
|
526
|
|
1986
|
05/08
|
|
30
|
|||||||
|
Houston, TX (n)
|
—
|
|
|
696
|
|
1,458
|
|
—
|
|
|
—
|
|
|
696
|
|
1,458
|
|
2,154
|
|
220
|
|
2008
|
12/08
|
|
40
|
|||||||
|
Lubbock, TX
|
—
|
|
|
671
|
|
1,612
|
|
—
|
|
|
—
|
|
|
671
|
|
1,612
|
|
2,283
|
|
244
|
|
2007
|
12/08
|
|
40
|
|||||||
|
|
|
|
|
|
|
|||||||||||||||||||||||||||
|
Studio Nail and Spa:
|
|
|
|
|
|
|||||||||||||||||||||||||||
|
Cohoes, NY
|
—
|
|
|
27
|
|
145
|
|
59
|
|
|
—
|
|
|
27
|
|
204
|
|
231
|
|
44
|
|
1994
|
09/04
|
|
40
|
|||||||
|
|
|
|
|
|
|
|||||||||||||||||||||||||||
|
Subway:
|
|
|
|
|
|
|||||||||||||||||||||||||||
|
Eden Prairie, MN
|
—
|
|
|
54
|
|
150
|
|
67
|
|
|
—
|
|
|
54
|
|
218
|
|
272
|
|
69
|
|
1997
|
12/01
|
|
40
|
|||||||
|
Albany, NY
|
—
|
|
|
3
|
|
67
|
|
—
|
|
|
—
|
|
|
3
|
|
67
|
|
70
|
|
17
|
|
1992
|
09/04
|
|
40
|
|||||||
|
Cohoes, NY
|
—
|
|
|
21
|
|
116
|
|
8
|
|
|
—
|
|
|
21
|
|
123
|
|
144
|
|
34
|
|
1994
|
09/04
|
|
40
|
|||||||
|
|
|
|
|
|
|
|||||||||||||||||||||||||||
|
Sullivan's Steakhouse:
|
|
|
|
|
|
|||||||||||||||||||||||||||
|
Lincolnshire, IL
|
—
|
|
|
862
|
|
1,574
|
|
—
|
|
|
—
|
|
|
862
|
|
1,574
|
|
2,436
|
|
186
|
|
1999
|
01/12
|
|
25
|
|||||||
|
|
|
|
|
|
|
|||||||||||||||||||||||||||
|
Sunbelt Rentals:
|
|
|
|
|
|
|||||||||||||||||||||||||||
|
Dayton, OH
|
—
|
|
|
391
|
|
1,223
|
|
—
|
|
|
—
|
|
|
391
|
|
1,223
|
|
1,614
|
|
95
|
|
2008
|
04/12
|
|
35
|
|||||||
|
Shepherdsville, KY
|
—
|
|
|
516
|
|
1,577
|
|
—
|
|
|
—
|
|
|
516
|
|
1,577
|
|
2,093
|
|
122
|
|
2009
|
04/12
|
|
35
|
|||||||
|
|
|
|
|
|
|
|||||||||||||||||||||||||||
|
Sunoco:
|
|
|
|
|
|
|||||||||||||||||||||||||||
|
Arnold, MD
|
—
|
|
|
417
|
|
581
|
|
—
|
|
|
—
|
|
|
417
|
|
581
|
|
998
|
|
33
|
|
1993
|
04/13
|
|
30
|
|||||||
|
Baltimore, MD
|
—
|
|
|
271
|
|
1,482
|
|
—
|
|
|
—
|
|
|
271
|
|
1,482
|
|
1,753
|
|
101
|
|
1968
|
04/13
|
|
25
|
|||||||
|
Baltimore, MD
|
—
|
|
|
310
|
|
1,686
|
|
—
|
|
|
—
|
|
|
310
|
|
1,686
|
|
1,996
|
|
82
|
|
2004
|
04/13
|
|
35
|
|||||||
|
Baltimore, MD
|
—
|
|
|
620
|
|
1,279
|
|
—
|
|
|
—
|
|
|
620
|
|
1,279
|
|
1,899
|
|
73
|
|
1989
|
04/13
|
|
30
|
|||||||
See accompanying report of independent registered public accounting firm.
F-47
|
Initial Cost to
Company
|
Costs Capitalized
Subsequent to
Acquisition
|
Gross Amount at Which
Carried at Close of Period (a) (b)
|
Life on Which
Depreciation &
Amortization in Latest Income
Statement is
Computed (Years)
|
|||||||||||||||||||||||||||||
|
Encumbrances
|
Land
|
Building,
Improvements &
Leasehold
Interests
|
Improvements
|
Carrying
Costs
|
Land
|
Building,
Improvements &
Leasehold
Interests
|
Total
|
Accumulated
Depreciation
and
Amortization
|
Date of
Construction
|
Date
Acquired
|
||||||||||||||||||||||
|
Real Estate Held for Investment the Company has Invested in Under Operating Leases:
|
||||||||||||||||||||||||||||||||
|
Baltimore, MD
|
—
|
|
|
368
|
|
1,647
|
|
—
|
|
|
—
|
|
|
368
|
|
1,647
|
|
2,015
|
|
94
|
|
1996
|
04/13
|
|
30
|
|||||||
|
Baltimore, MD
|
—
|
|
|
523
|
|
2,809
|
|
—
|
|
|
—
|
|
|
523
|
|
2,809
|
|
3,332
|
|
192
|
|
1982
|
04/13
|
|
25
|
|||||||
|
Baltimore, MD
|
—
|
|
|
542
|
|
2,054
|
|
—
|
|
|
—
|
|
|
542
|
|
2,054
|
|
2,596
|
|
117
|
|
1998
|
04/13
|
|
30
|
|||||||
|
Baltimore, MD
|
—
|
|
|
455
|
|
2,122
|
|
—
|
|
|
—
|
|
|
455
|
|
2,122
|
|
2,577
|
|
145
|
|
1980
|
04/13
|
|
25
|
|||||||
|
Bel Air, MD
|
—
|
|
|
1,376
|
|
620
|
|
—
|
|
|
—
|
|
|
1,376
|
|
620
|
|
1,996
|
|
35
|
|
1994
|
04/13
|
|
30
|
|||||||
|
Bethesda, MD
|
—
|
|
|
1,414
|
|
1,347
|
|
—
|
|
|
—
|
|
|
1,414
|
|
1,347
|
|
2,761
|
|
92
|
|
1971
|
04/13
|
|
25
|
|||||||
|
Centreville, VA
|
—
|
|
|
1,753
|
|
697
|
|
—
|
|
|
—
|
|
|
1,753
|
|
697
|
|
2,450
|
|
40
|
|
1994
|
04/13
|
|
30
|
|||||||
|
Chantilly, VA
|
—
|
|
|
1,472
|
|
1,831
|
|
—
|
|
|
—
|
|
|
1,472
|
|
1,831
|
|
3,303
|
|
125
|
|
1966
|
04/13
|
|
25
|
|||||||
|
Dale City, VA
|
—
|
|
|
639
|
|
2,461
|
|
—
|
|
|
—
|
|
|
639
|
|
2,461
|
|
3,100
|
|
140
|
|
1992
|
04/13
|
|
30
|
|||||||
|
Dumfries, VA
|
—
|
|
|
387
|
|
2,364
|
|
—
|
|
|
—
|
|
|
387
|
|
2,364
|
|
2,751
|
|
135
|
|
1999
|
04/13
|
|
30
|
|||||||
|
Edgewood, MD
|
—
|
|
|
823
|
|
2,073
|
|
—
|
|
|
—
|
|
|
823
|
|
2,073
|
|
2,896
|
|
142
|
|
1985
|
04/13
|
|
25
|
|||||||
|
Frederick, MD
|
—
|
|
|
940
|
|
1,860
|
|
—
|
|
|
—
|
|
|
940
|
|
1,860
|
|
2,800
|
|
106
|
|
1996
|
04/13
|
|
30
|
|||||||
|
Gaithersburg, MD
|
—
|
|
|
1,027
|
|
2,073
|
|
—
|
|
|
—
|
|
|
1,027
|
|
2,073
|
|
3,100
|
|
142
|
|
1982
|
04/13
|
|
25
|
|||||||
|
Glen Burnie, MD
|
—
|
|
|
804
|
|
1,647
|
|
—
|
|
|
—
|
|
|
804
|
|
1,647
|
|
2,451
|
|
94
|
|
1994
|
04/13
|
|
30
|
|||||||
|
Herndon, VA
|
—
|
|
|
707
|
|
1,792
|
|
—
|
|
|
—
|
|
|
707
|
|
1,792
|
|
2,499
|
|
102
|
|
1989
|
04/13
|
|
30
|
|||||||
|
Joppa, MD
|
—
|
|
|
862
|
|
174
|
|
—
|
|
|
—
|
|
|
862
|
|
174
|
|
1,036
|
|
12
|
|
1987
|
04/13
|
|
25
|
|||||||
|
Manassas, VA
|
—
|
|
|
1,230
|
|
1,521
|
|
—
|
|
|
—
|
|
|
1,230
|
|
1,521
|
|
2,751
|
|
87
|
|
1991
|
04/13
|
|
30
|
|||||||
|
Manassas, VA
|
—
|
|
|
746
|
|
1,434
|
|
—
|
|
|
—
|
|
|
746
|
|
1,434
|
|
2,180
|
|
82
|
|
1993
|
04/13
|
|
30
|
|||||||
|
Odenton, MD
|
—
|
|
|
668
|
|
2,780
|
|
—
|
|
|
—
|
|
|
668
|
|
2,780
|
|
3,448
|
|
158
|
|
2000
|
04/13
|
|
30
|
|||||||
|
Owings Mills, MD
|
—
|
|
|
1,337
|
|
911
|
|
—
|
|
|
—
|
|
|
1,337
|
|
911
|
|
2,248
|
|
52
|
|
1994
|
04/13
|
|
30
|
|||||||
|
Parkton, MD
|
—
|
|
|
397
|
|
2,151
|
|
—
|
|
|
—
|
|
|
397
|
|
2,151
|
|
2,548
|
|
122
|
|
1993
|
04/13
|
|
30
|
|||||||
|
Pasadena, MD
|
—
|
|
|
407
|
|
1,492
|
|
—
|
|
|
—
|
|
|
407
|
|
1,492
|
|
1,899
|
|
85
|
|
1989
|
04/13
|
|
30
|
|||||||
|
Pasadena, MD
|
—
|
|
|
591
|
|
2,509
|
|
—
|
|
|
—
|
|
|
591
|
|
2,509
|
|
3,100
|
|
143
|
|
1997
|
04/13
|
|
30
|
|||||||
|
Perryville, MD
|
—
|
|
|
601
|
|
3,778
|
|
—
|
|
|
—
|
|
|
601
|
|
3,778
|
|
4,379
|
|
215
|
|
1990
|
04/13
|
|
30
|
|||||||
|
Randallstown, MD
|
—
|
|
|
746
|
|
1,715
|
|
—
|
|
|
—
|
|
|
746
|
|
1,715
|
|
2,461
|
|
98
|
|
1995
|
04/13
|
|
30
|
|||||||
|
Reisterstown, MD
|
—
|
|
|
649
|
|
2,354
|
|
—
|
|
|
—
|
|
|
649
|
|
2,354
|
|
3,003
|
|
134
|
|
1995
|
04/13
|
|
30
|
|||||||
|
Rockville, MD
|
—
|
|
|
1,996
|
|
2,054
|
|
—
|
|
|
—
|
|
|
1,996
|
|
2,054
|
|
4,050
|
|
140
|
|
1971
|
04/13
|
|
25
|
|||||||
|
Severn, MD
|
—
|
|
|
765
|
|
3,139
|
|
—
|
|
|
—
|
|
|
765
|
|
3,139
|
|
3,904
|
|
179
|
|
1987
|
04/13
|
|
30
|
|||||||
|
Sterling, VA
|
—
|
|
|
1,540
|
|
2,461
|
|
—
|
|
|
—
|
|
|
1,540
|
|
2,461
|
|
4,001
|
|
140
|
|
1998
|
04/13
|
|
30
|
|||||||
|
Sterling, VA
|
—
|
|
|
1,356
|
|
1,095
|
|
—
|
|
|
—
|
|
|
1,356
|
|
1,095
|
|
2,451
|
|
62
|
|
1997
|
04/13
|
|
30
|
|||||||
|
Timonium, MD
|
—
|
|
|
1,356
|
|
1,598
|
|
—
|
|
|
—
|
|
|
1,356
|
|
1,598
|
|
2,954
|
|
109
|
|
1981
|
04/13
|
|
25
|
|||||||
|
Towson, MD
|
—
|
|
|
630
|
|
2,771
|
|
—
|
|
|
—
|
|
|
630
|
|
2,771
|
|
3,401
|
|
189
|
|
1988
|
04/13
|
|
25
|
|||||||
|
Warrenton, VA
|
—
|
|
|
1,802
|
|
2,703
|
|
—
|
|
|
—
|
|
|
1,802
|
|
2,703
|
|
4,505
|
|
154
|
|
1994
|
04/13
|
|
30
|
|||||||
|
Woodbridge, VA
|
—
|
|
|
678
|
|
2,664
|
|
—
|
|
|
—
|
|
|
678
|
|
2,664
|
|
3,342
|
|
182
|
|
1988
|
04/13
|
|
25
|
|||||||
See accompanying report of independent registered public accounting firm.
F-48
|
Initial Cost to
Company
|
Costs Capitalized
Subsequent to
Acquisition
|
Gross Amount at Which
Carried at Close of Period (a) (b)
|
Life on Which
Depreciation &
Amortization in Latest Income
Statement is
Computed (Years)
|
|||||||||||||||||||||||||||||
|
Encumbrances
|
Land
|
Building,
Improvements &
Leasehold
Interests
|
Improvements
|
Carrying
Costs
|
Land
|
Building,
Improvements &
Leasehold
Interests
|
Total
|
Accumulated
Depreciation
and
Amortization
|
Date of
Construction
|
Date
Acquired
|
||||||||||||||||||||||
|
Real Estate Held for Investment the Company has Invested in Under Operating Leases:
|
||||||||||||||||||||||||||||||||
|
Sunshine Energy:
|
|
|
|
|
|
|||||||||||||||||||||||||||
|
Kansas City, MO
|
—
|
|
|
517
|
|
720
|
|
—
|
|
|
—
|
|
|
517
|
|
720
|
|
1,237
|
|
157
|
|
1993
|
07/09
|
|
25
|
|||||||
|
Neosho, MO
|
—
|
|
|
352
|
|
775
|
|
—
|
|
|
—
|
|
|
352
|
|
754
|
|
1,106
|
|
148
|
|
1992
|
07/09
|
|
18
|
|||||||
|
|
|
|
|
|
|
|||||||||||||||||||||||||||
|
SunTrust:
|
|
|
|
|
|
|||||||||||||||||||||||||||
|
Albany, GA
|
—
|
|
|
287
|
|
890
|
|
—
|
|
|
—
|
|
|
287
|
|
890
|
|
1,177
|
|
91
|
|
1990
|
06/13
|
|
15
|
|||||||
|
Alexandria, VA
|
—
|
|
|
2,735
|
|
732
|
|
—
|
|
|
—
|
|
|
2,735
|
|
732
|
|
3,467
|
|
75
|
|
1969
|
06/13
|
|
15
|
|||||||
|
Alpharetta, GA
|
—
|
|
|
1,625
|
|
1,366
|
|
—
|
|
|
—
|
|
|
1,625
|
|
1,366
|
|
2,991
|
|
105
|
|
1991
|
06/13
|
|
20
|
|||||||
|
Alpharetta, GA
|
—
|
|
|
1,056
|
|
1,425
|
|
—
|
|
|
—
|
|
|
1,056
|
|
1,425
|
|
2,481
|
|
73
|
|
2005
|
06/13
|
|
30
|
|||||||
|
Arlington, VA
|
—
|
|
|
1,998
|
|
638
|
|
—
|
|
|
—
|
|
|
1,998
|
|
638
|
|
2,636
|
|
49
|
|
1993
|
06/13
|
|
20
|
|||||||
|
Atlanta, GA
|
—
|
|
|
296
|
|
748
|
|
—
|
|
|
—
|
|
|
296
|
|
748
|
|
1,044
|
|
77
|
|
1964
|
06/13
|
|
15
|
|||||||
|
Atlanta, GA
|
—
|
|
|
2,130
|
|
1,623
|
|
—
|
|
|
—
|
|
|
2,130
|
|
1,623
|
|
3,753
|
|
125
|
|
1976
|
06/13
|
|
20
|
|||||||
|
Augusta, GA
|
—
|
|
|
472
|
|
443
|
|
—
|
|
|
—
|
|
|
472
|
|
443
|
|
915
|
|
137
|
|
1970
|
06/13
|
|
5
|
|||||||
|
Augusta, GA
|
—
|
|
|
865
|
|
872
|
|
—
|
|
|
—
|
|
|
865
|
|
872
|
|
1,737
|
|
134
|
|
1972
|
06/13
|
|
10
|
|||||||
|
Augusta, GA
|
—
|
|
|
352
|
|
397
|
|
—
|
|
|
—
|
|
|
352
|
|
397
|
|
749
|
|
122
|
|
1949
|
06/13
|
|
5
|
|||||||
|
Avon Park, FL
|
—
|
|
|
360
|
|
1,564
|
|
—
|
|
|
—
|
|
|
360
|
|
1,564
|
|
1,924
|
|
80
|
|
1983
|
06/13
|
|
30
|
|||||||
|
Bartow, FL
|
—
|
|
|
218
|
|
769
|
|
—
|
|
|
—
|
|
|
218
|
|
769
|
|
987
|
|
47
|
|
1980
|
06/13
|
|
25
|
|||||||
|
Beaverdam, VA
|
—
|
|
|
230
|
|
309
|
|
—
|
|
|
—
|
|
|
230
|
|
309
|
|
539
|
|
95
|
|
1964
|
06/13
|
|
5
|
|||||||
|
Belleview, FL
|
—
|
|
|
226
|
|
1,085
|
|
—
|
|
|
—
|
|
|
226
|
|
1,085
|
|
1,311
|
|
56
|
|
1979
|
06/13
|
|
30
|
|||||||
|
Beverly Hills, FL
|
—
|
|
|
376
|
|
1,414
|
|
—
|
|
|
—
|
|
|
376
|
|
1,414
|
|
1,790
|
|
73
|
|
1989
|
06/13
|
|
30
|
|||||||
|
Black Mountain, NC
|
—
|
|
|
780
|
|
655
|
|
—
|
|
|
—
|
|
|
780
|
|
655
|
|
1,435
|
|
202
|
|
1943
|
06/13
|
|
5
|
|||||||
|
Bladensburg, MD
|
—
|
|
|
1,528
|
|
1,538
|
|
—
|
|
|
—
|
|
|
1,528
|
|
1,538
|
|
3,066
|
|
79
|
|
1946
|
06/13
|
|
30
|
|||||||
|
Boca Raton, FL
|
—
|
|
|
1,663
|
|
654
|
|
—
|
|
|
—
|
|
|
1,663
|
|
654
|
|
2,317
|
|
101
|
|
1977
|
06/13
|
|
10
|
|||||||
|
Bradenton, FL
|
—
|
|
|
437
|
|
1,251
|
|
—
|
|
|
—
|
|
|
429
|
|
1,251
|
|
1,680
|
|
64
|
|
1980
|
06/13
|
|
30
|
|||||||
|
Brunswick, GA
|
—
|
|
|
158
|
|
2,169
|
|
—
|
|
|
—
|
|
|
158
|
|
2,169
|
|
2,327
|
|
669
|
|
1957
|
06/13
|
|
5
|
|||||||
|
Butner, NC
|
—
|
|
|
344
|
|
606
|
|
—
|
|
|
—
|
|
|
344
|
|
606
|
|
950
|
|
47
|
|
1957
|
06/13
|
|
20
|
|||||||
|
Cape Coral, FL
|
—
|
|
|
1,065
|
|
1,032
|
|
—
|
|
|
—
|
|
|
1,065
|
|
1,032
|
|
2,097
|
|
80
|
|
1980
|
06/13
|
|
20
|
|||||||
|
Cary, NC
|
—
|
|
|
616
|
|
826
|
|
—
|
|
|
—
|
|
|
616
|
|
826
|
|
1,442
|
|
64
|
|
1987
|
06/13
|
|
20
|
|||||||
|
Chapel Hill, NC
|
—
|
|
|
323
|
|
541
|
|
—
|
|
|
—
|
|
|
323
|
|
541
|
|
864
|
|
56
|
|
1963
|
06/13
|
|
15
|
|||||||
|
Chattanooga, TN
|
—
|
|
|
496
|
|
824
|
|
—
|
|
|
—
|
|
|
496
|
|
824
|
|
1,320
|
|
254
|
|
1948
|
06/13
|
|
5
|
|||||||
|
Chattanooga, TN
|
—
|
|
|
308
|
|
652
|
|
—
|
|
|
—
|
|
|
308
|
|
652
|
|
960
|
|
201
|
|
1972
|
06/13
|
|
5
|
|||||||
|
Chattanooga, TN
|
—
|
|
|
260
|
|
374
|
|
—
|
|
|
—
|
|
|
260
|
|
374
|
|
634
|
|
115
|
|
1981
|
06/13
|
|
5
|
|||||||
|
Chattanooga, TN
|
—
|
|
|
336
|
|
341
|
|
—
|
|
|
—
|
|
|
336
|
|
341
|
|
677
|
|
105
|
|
1974
|
06/13
|
|
5
|
|||||||
|
Chestertown, MD
|
—
|
|
|
856
|
|
290
|
|
—
|
|
|
—
|
|
|
856
|
|
290
|
|
1,146
|
|
89
|
|
1974
|
06/13
|
|
5
|
|||||||
See accompanying report of independent registered public accounting firm.
F-49
|
Initial Cost to
Company
|
Costs Capitalized
Subsequent to
Acquisition
|
Gross Amount at Which
Carried at Close of Period (a) (b)
|
Life on Which
Depreciation &
Amortization in Latest Income
Statement is
Computed (Years)
|
|||||||||||||||||||||||||||||
|
Encumbrances
|
Land
|
Building,
Improvements &
Leasehold
Interests
|
Improvements
|
Carrying
Costs
|
Land
|
Building,
Improvements &
Leasehold
Interests
|
Total
|
Accumulated
Depreciation
and
Amortization
|
Date of
Construction
|
Date
Acquired
|
||||||||||||||||||||||
|
Real Estate Held for Investment the Company has Invested in Under Operating Leases:
|
||||||||||||||||||||||||||||||||
|
Clearwater, FL
|
—
|
|
|
433
|
|
530
|
|
—
|
|
|
—
|
|
|
433
|
|
530
|
|
963
|
|
54
|
|
1983
|
06/13
|
|
15
|
|||||||
|
Conyers, GA
|
—
|
|
|
366
|
|
501
|
|
—
|
|
|
—
|
|
|
366
|
|
501
|
|
867
|
|
77
|
|
1986
|
06/13
|
|
10
|
|||||||
|
Crystal River, FL
|
—
|
|
|
430
|
|
2,971
|
|
—
|
|
|
—
|
|
|
430
|
|
2,971
|
|
3,401
|
|
131
|
|
1983
|
06/13
|
|
35
|
|||||||
|
Daytona Beach Shores, FL
|
—
|
|
|
318
|
|
720
|
|
—
|
|
|
—
|
|
|
318
|
|
720
|
|
1,038
|
|
44
|
|
1982
|
06/13
|
|
25
|
|||||||
|
Deland, FL
|
—
|
|
|
270
|
|
1,296
|
|
—
|
|
|
—
|
|
|
270
|
|
1,296
|
|
1,566
|
|
67
|
|
1993
|
06/13
|
|
30
|
|||||||
|
Denton, NC
|
—
|
|
|
472
|
|
783
|
|
—
|
|
|
—
|
|
|
472
|
|
783
|
|
1,255
|
|
80
|
|
1969
|
06/13
|
|
15
|
|||||||
|
Doral, FL
|
—
|
|
|
1,912
|
|
1,100
|
|
—
|
|
|
—
|
|
|
1,912
|
|
1,100
|
|
3,012
|
|
85
|
|
1988
|
06/13
|
|
20
|
|||||||
|
Douglas, GA
|
—
|
|
|
354
|
|
168
|
|
—
|
|
|
—
|
|
|
354
|
|
168
|
|
522
|
|
52
|
|
1972
|
06/13
|
|
5
|
|||||||
|
Duluth, GA
|
—
|
|
|
851
|
|
845
|
|
—
|
|
|
—
|
|
|
851
|
|
845
|
|
1,696
|
|
65
|
|
1992
|
06/13
|
|
20
|
|||||||
|
Edgewater, FL
|
—
|
|
|
419
|
|
1,417
|
|
—
|
|
|
—
|
|
|
419
|
|
1,417
|
|
1,836
|
|
73
|
|
1986
|
06/13
|
|
30
|
|||||||
|
Erwin, NC
|
—
|
|
|
380
|
|
89
|
|
—
|
|
|
—
|
|
|
380
|
|
89
|
|
469
|
|
27
|
|
1955
|
06/13
|
|
5
|
|||||||
|
Flagler Beach, FL
|
—
|
|
|
366
|
|
1,313
|
|
—
|
|
|
—
|
|
|
366
|
|
1,313
|
|
1,679
|
|
58
|
|
1993
|
06/13
|
|
35
|
|||||||
|
Fort Myers, FL
|
—
|
|
|
543
|
|
758
|
|
—
|
|
|
—
|
|
|
543
|
|
758
|
|
1,301
|
|
47
|
|
1986
|
06/13
|
|
25
|
|||||||
|
Fort Myers, FL
|
—
|
|
|
814
|
|
684
|
|
—
|
|
|
—
|
|
|
814
|
|
684
|
|
1,498
|
|
70
|
|
1986
|
06/13
|
|
15
|
|||||||
|
Franklin, VA
|
—
|
|
|
103
|
|
911
|
|
—
|
|
|
—
|
|
|
103
|
|
911
|
|
1,014
|
|
94
|
|
1967
|
06/13
|
|
15
|
|||||||
|
Gainesville, GA
|
—
|
|
406
|
|
1,830
|
|
—
|
|
—
|
|
406
|
|
1,830
|
|
2,236
|
|
564
|
|
1966
|
06/13
|
|
5
|
||||||||||
|
Greenacres City, FL
|
—
|
|
|
1,395
|
|
1,533
|
|
—
|
|
|
—
|
|
|
1,395
|
|
1,533
|
|
2,928
|
|
79
|
|
1988
|
06/13
|
|
30
|
|||||||
|
Greensboro, NC
|
—
|
|
|
516
|
|
394
|
|
—
|
|
|
—
|
|
|
516
|
|
394
|
|
910
|
|
121
|
|
1980
|
06/13
|
|
5
|
|||||||
|
Gulf Breeze, FL
|
—
|
|
|
1,021
|
|
1,382
|
|
—
|
|
|
—
|
|
|
1,021
|
|
1,382
|
|
2,403
|
|
213
|
|
1960
|
06/13
|
|
10
|
|||||||
|
Haines City, FL
|
—
|
|
|
405
|
|
1,241
|
|
—
|
|
|
—
|
|
|
405
|
|
1,241
|
|
1,646
|
|
64
|
|
1989
|
06/13
|
|
30
|
|||||||
|
Hallandale Beach, FL
|
—
|
|
|
1,735
|
|
2,343
|
|
—
|
|
|
—
|
|
|
1,735
|
|
2,343
|
|
4,078
|
|
181
|
|
1971
|
06/13
|
|
20
|
|||||||
|
Harrisonburg, VA
|
—
|
|
|
245
|
|
438
|
|
—
|
|
|
—
|
|
|
245
|
|
438
|
|
683
|
|
135
|
|
1968
|
06/13
|
|
5
|
|||||||
|
Hialeah, FL
|
—
|
|
|
2,578
|
|
1,149
|
|
—
|
|
|
—
|
|
|
2,578
|
|
1,149
|
|
3,727
|
|
177
|
|
1978
|
06/13
|
|
10
|
|||||||
|
Holly Hill, FL
|
—
|
|
|
509
|
|
699
|
|
—
|
|
|
—
|
|
|
509
|
|
699
|
|
1,208
|
|
216
|
|
1963
|
06/13
|
|
5
|
|||||||
|
Homosassa, FL
|
—
|
|
|
344
|
|
825
|
|
—
|
|
|
—
|
|
|
344
|
|
825
|
|
1,169
|
|
51
|
|
1985
|
06/13
|
|
25
|
|||||||
|
Hudson, NC
|
—
|
|
|
220
|
|
207
|
|
—
|
|
|
—
|
|
|
220
|
|
207
|
|
427
|
|
16
|
|
1994
|
06/13
|
|
20
|
|||||||
|
Huntersville, NC
|
—
|
|
|
177
|
|
830
|
|
—
|
|
|
—
|
|
|
177
|
|
830
|
|
1,007
|
|
51
|
|
1998
|
06/13
|
|
25
|
|||||||
|
Inverness, FL
|
—
|
|
|
471
|
|
755
|
|
—
|
|
|
—
|
|
|
471
|
|
755
|
|
1,226
|
|
78
|
|
1984
|
06/13
|
|
15
|
|||||||
|
Jacksonville, FL
|
—
|
|
|
674
|
|
821
|
|
—
|
|
|
—
|
|
|
674
|
|
821
|
|
1,495
|
|
51
|
|
1987
|
06/13
|
|
25
|
|||||||
|
Jacksonville, FL
|
—
|
|
|
938
|
|
926
|
|
—
|
|
|
—
|
|
|
938
|
|
926
|
|
1,864
|
|
71
|
|
1979
|
06/13
|
|
20
|
|||||||
|
Jonesboro, GA
|
—
|
|
|
591
|
|
1,185
|
|
—
|
|
|
—
|
|
|
591
|
|
1,185
|
|
1,776
|
|
365
|
|
1965
|
06/13
|
|
5
|
|||||||
|
Jonesborough, TN
|
—
|
|
|
95
|
|
285
|
|
—
|
|
|
—
|
|
|
95
|
|
285
|
|
380
|
|
88
|
|
1974
|
06/13
|
|
5
|
|||||||
|
Jupiter, FL
|
—
|
|
|
1,035
|
|
1,327
|
|
—
|
|
|
—
|
|
|
1,035
|
|
1,327
|
|
2,362
|
|
58
|
|
1998
|
06/13
|
|
35
|
|||||||
|
Kannapolis, NC
|
—
|
|
|
850
|
|
834
|
|
—
|
|
|
—
|
|
|
850
|
|
834
|
|
1,684
|
|
257
|
|
1906
|
06/13
|
|
5
|
|||||||
See accompanying report of independent registered public accounting firm.
F-50
|
Initial Cost to
Company
|
Costs Capitalized
Subsequent to
Acquisition
|
Gross Amount at Which
Carried at Close of Period (a) (b)
|
Life on Which
Depreciation &
Amortization in Latest Income
Statement is
Computed (Years)
|
|||||||||||||||||||||||||||||
|
Encumbrances
|
Land
|
Building,
Improvements &
Leasehold
Interests
|
Improvements
|
Carrying
Costs
|
Land
|
Building,
Improvements &
Leasehold
Interests
|
Total
|
Accumulated
Depreciation
and
Amortization
|
Date of
Construction
|
Date
Acquired
|
||||||||||||||||||||||
|
Real Estate Held for Investment the Company has Invested in Under Operating Leases:
|
||||||||||||||||||||||||||||||||
|
Kernersville, NC
|
—
|
|
|
284
|
|
708
|
|
—
|
|
|
—
|
|
|
284
|
|
708
|
|
992
|
|
73
|
|
1990
|
06/13
|
|
15
|
|||||||
|
Lady Lake, FL
|
—
|
|
|
388
|
|
1,537
|
|
—
|
|
|
—
|
|
|
388
|
|
1,537
|
|
1,925
|
|
79
|
|
1996
|
06/13
|
|
30
|
|||||||
|
Lady Lake, FL
|
—
|
|
|
340
|
|
1,355
|
|
—
|
|
|
—
|
|
|
340
|
|
1,355
|
|
1,695
|
|
70
|
|
1996
|
06/13
|
|
30
|
|||||||
|
Lake City, TN
|
—
|
|
|
326
|
|
514
|
|
—
|
|
|
—
|
|
|
326
|
|
514
|
|
840
|
|
159
|
|
1958
|
06/13
|
|
5
|
|||||||
|
Lake Placid, FL
|
—
|
|
|
289
|
|
1,402
|
|
—
|
|
|
—
|
|
|
289
|
|
1,402
|
|
1,691
|
|
72
|
|
1988
|
06/13
|
|
30
|
|||||||
|
Largo, FL
|
—
|
|
|
258
|
|
643
|
|
—
|
|
|
—
|
|
|
258
|
|
643
|
|
901
|
|
50
|
|
1979
|
06/13
|
|
20
|
|||||||
|
Lawrenceburg, TN
|
—
|
|
|
205
|
|
413
|
|
—
|
|
|
—
|
|
|
205
|
|
413
|
|
618
|
|
127
|
|
1975
|
06/13
|
|
5
|
|||||||
|
Lawrenceville, GA
|
—
|
|
|
657
|
|
1,764
|
|
—
|
|
|
—
|
|
|
657
|
|
1,764
|
|
2,421
|
|
272
|
|
1985
|
06/13
|
|
10
|
|||||||
|
Lightfoot, VA
|
—
|
|
|
177
|
|
512
|
|
—
|
|
|
—
|
|
|
177
|
|
512
|
|
689
|
|
79
|
|
1973
|
06/13
|
|
10
|
|||||||
|
Lynn Haven, FL
|
—
|
|
|
797
|
|
865
|
|
—
|
|
|
—
|
|
|
797
|
|
865
|
|
1,662
|
|
133
|
|
1974
|
06/13
|
|
10
|
|||||||
|
Macon, GA
|
—
|
|
|
207
|
|
392
|
|
—
|
|
|
—
|
|
|
207
|
|
392
|
|
599
|
|
40
|
|
1980
|
06/13
|
|
15
|
|||||||
|
Madison Heights, VA
|
—
|
|
|
215
|
|
379
|
|
—
|
|
|
—
|
|
|
215
|
|
379
|
|
594
|
|
117
|
|
1973
|
06/13
|
|
5
|
|||||||
|
Manassas, VA
|
—
|
|
|
1,765
|
|
1,714
|
|
—
|
|
|
—
|
|
|
1,765
|
|
1,714
|
|
3,479
|
|
132
|
|
1967
|
06/13
|
|
20
|
|||||||
|
Marietta, GA
|
—
|
|
|
617
|
|
714
|
|
—
|
|
|
—
|
|
|
617
|
|
714
|
|
1,331
|
|
110
|
|
1974
|
06/13
|
|
10
|
|||||||
|
Mechanicsville, VA
|
—
|
|
|
343
|
|
493
|
|
—
|
|
|
—
|
|
|
343
|
|
493
|
|
836
|
|
152
|
|
1965
|
06/13
|
|
5
|
|||||||
|
Mocksville, NC
|
—
|
|
|
189
|
|
434
|
|
—
|
|
|
—
|
|
|
189
|
|
434
|
|
623
|
|
134
|
|
1967
|
06/13
|
|
5
|
|||||||
|
Monroe, NC
|
—
|
|
|
586
|
|
353
|
|
—
|
|
|
—
|
|
|
586
|
|
353
|
|
939
|
|
109
|
|
1981
|
06/13
|
|
5
|
|||||||
|
Murfreesboro, TN
|
—
|
|
|
276
|
|
554
|
|
—
|
|
|
—
|
|
|
276
|
|
554
|
|
830
|
|
57
|
|
1989
|
06/13
|
|
15
|
|||||||
|
N Miami Beach, FL
|
—
|
|
|
915
|
|
497
|
|
—
|
|
|
—
|
|
|
915
|
|
497
|
|
1,412
|
|
51
|
|
1986
|
06/13
|
|
15
|
|||||||
|
Nashville, TN
|
—
|
|
|
679
|
|
394
|
|
—
|
|
|
—
|
|
|
679
|
|
394
|
|
1,073
|
|
122
|
|
1949
|
06/13
|
|
5
|
|||||||
|
Nashville, TN
|
—
|
|
|
438
|
|
1,295
|
|
—
|
|
|
—
|
|
|
438
|
|
1,295
|
|
1,733
|
|
67
|
|
1994
|
06/13
|
|
30
|
|||||||
|
Nashville, TN
|
—
|
|
|
627
|
|
639
|
|
—
|
|
|
—
|
|
|
627
|
|
639
|
|
1,266
|
|
98
|
|
1972
|
06/13
|
|
10
|
|||||||
|
New Port Richey, FL
|
—
|
|
|
463
|
|
1,178
|
|
—
|
|
|
—
|
|
|
463
|
|
1,178
|
|
1,641
|
|
73
|
|
1998
|
06/13
|
|
25
|
|||||||
|
Norcross, GA
|
—
|
|
|
789
|
|
663
|
|
—
|
|
|
—
|
|
|
789
|
|
663
|
|
1,452
|
|
68
|
|
1986
|
06/13
|
|
15
|
|||||||
|
Norwood, NC
|
—
|
|
|
519
|
|
410
|
|
—
|
|
|
—
|
|
|
519
|
|
410
|
|
929
|
|
126
|
|
1946
|
06/13
|
|
5
|
|||||||
|
Orlando, FL
|
—
|
|
|
637
|
|
1,415
|
|
—
|
|
|
—
|
|
|
637
|
|
1,415
|
|
2,052
|
|
87
|
|
1999
|
06/13
|
|
25
|
|||||||
|
Orlando, FL
|
—
|
|
|
801
|
|
1,135
|
|
—
|
|
|
—
|
|
|
801
|
|
1,135
|
|
1,936
|
|
88
|
|
1993
|
06/13
|
|
20
|
|||||||
|
Palm Harbor, FL
|
—
|
|
|
532
|
|
384
|
|
—
|
|
|
—
|
|
|
532
|
|
384
|
|
916
|
|
59
|
|
1983
|
06/13
|
|
10
|
|||||||
|
Palm Harbor, FL
|
—
|
|
|
836
|
|
1,139
|
|
—
|
|
|
—
|
|
|
836
|
|
1,139
|
|
1,975
|
|
88
|
|
1984
|
06/13
|
|
20
|
|||||||
|
Punta Gorda, FL (n)
|
—
|
|
|
1,483
|
|
1,330
|
|
—
|
|
|
—
|
|
|
1,483
|
|
1,330
|
|
2,813
|
|
103
|
|
1972
|
06/13
|
|
20
|
|||||||
|
Radford, VA
|
—
|
|
|
221
|
|
326
|
|
—
|
|
|
—
|
|
|
221
|
|
326
|
|
547
|
|
100
|
|
1964
|
06/13
|
|
5
|
|||||||
|
Raleigh, NC
|
—
|
|
|
798
|
|
1,286
|
|
—
|
|
|
—
|
|
|
798
|
|
1,286
|
|
2,084
|
|
99
|
|
1974
|
06/13
|
|
20
|
|||||||
|
Richmond, VA
|
—
|
|
|
263
|
|
563
|
|
—
|
|
|
—
|
|
|
263
|
|
563
|
|
826
|
|
87
|
|
1981
|
06/13
|
|
10
|
|||||||
|
Richmond, VA
|
—
|
|
|
398
|
|
673
|
|
—
|
|
|
—
|
|
|
398
|
|
673
|
|
1,071
|
|
207
|
|
1972
|
06/13
|
|
5
|
|||||||
See accompanying report of independent registered public accounting firm.
F-51
|
Initial Cost to
Company
|
Costs Capitalized
Subsequent to
Acquisition
|
Gross Amount at Which
Carried at Close of Period (a) (b)
|
Life on Which
Depreciation &
Amortization in Latest Income
Statement is
Computed (Years)
|
|||||||||||||||||||||||||||||
|
Encumbrances
|
Land
|
Building,
Improvements &
Leasehold
Interests
|
Improvements
|
Carrying
Costs
|
Land
|
Building,
Improvements &
Leasehold
Interests
|
Total
|
Accumulated
Depreciation
and
Amortization
|
Date of
Construction
|
Date
Acquired
|
||||||||||||||||||||||
|
Real Estate Held for Investment the Company has Invested in Under Operating Leases:
|
||||||||||||||||||||||||||||||||
|
Richmond, VA
|
—
|
|
|
283
|
|
245
|
|
—
|
|
|
—
|
|
|
283
|
|
245
|
|
528
|
|
76
|
|
1973
|
06/13
|
|
5
|
|||||||
|
Roanoke, VA
|
—
|
|
|
264
|
|
256
|
|
—
|
|
|
—
|
|
|
264
|
|
256
|
|
520
|
|
79
|
|
1973
|
06/13
|
|
5
|
|||||||
|
Roanoke, VA
|
—
|
|
|
103
|
|
360
|
|
—
|
|
|
—
|
|
|
103
|
|
360
|
|
463
|
|
56
|
|
1957
|
06/13
|
|
10
|
|||||||
|
Roxboro, NC
|
—
|
|
|
452
|
|
918
|
|
—
|
|
|
—
|
|
|
452
|
|
918
|
|
1,370
|
|
94
|
|
1983
|
06/13
|
|
15
|
|||||||
|
Sebastian, FL
|
—
|
|
|
438
|
|
856
|
|
—
|
|
|
—
|
|
|
438
|
|
856
|
|
1,294
|
|
66
|
|
1987
|
06/13
|
|
20
|
|||||||
|
Sebring, FL
|
—
|
|
|
326
|
|
920
|
|
—
|
|
|
—
|
|
|
326
|
|
920
|
|
1,246
|
|
57
|
|
1985
|
06/13
|
|
25
|
|||||||
|
South Boston, VA
|
—
|
|
|
221
|
|
1,441
|
|
—
|
|
|
—
|
|
|
221
|
|
1,441
|
|
1,662
|
|
111
|
|
1975
|
06/13
|
|
20
|
|||||||
|
Spartanburg, SC
|
—
|
|
|
435
|
|
372
|
|
—
|
|
|
—
|
|
|
435
|
|
372
|
|
807
|
|
57
|
|
1921
|
06/13
|
|
10
|
|||||||
|
Spotsylvania, VA
|
—
|
|
|
1,398
|
|
1,158
|
|
—
|
|
|
—
|
|
|
1,398
|
|
1,158
|
|
2,556
|
|
51
|
|
1964
|
06/13
|
|
35
|
|||||||
|
Spring Hill, FL
|
—
|
|
|
460
|
|
1,102
|
|
—
|
|
|
—
|
|
|
460
|
|
1,102
|
|
1,562
|
|
340
|
|
1973
|
06/13
|
|
5
|
|||||||
|
Spring Hill, FL
|
—
|
|
|
631
|
|
1,950
|
|
—
|
|
|
—
|
|
|
631
|
|
1,950
|
|
2,581
|
|
100
|
|
1988
|
06/13
|
|
30
|
|||||||
|
St. Petersburg, FL
|
—
|
|
|
207
|
|
1,150
|
|
—
|
|
|
—
|
|
|
207
|
|
1,150
|
|
1,357
|
|
59
|
|
1974
|
06/13
|
|
30
|
|||||||
|
Stuart, FL (n)
|
—
|
|
|
1,143
|
|
2,570
|
|
—
|
|
|
—
|
|
|
1,143
|
|
2,570
|
|
3,713
|
|
132
|
|
1985
|
06/13
|
|
30
|
|||||||
|
Sun City Center, FL (n)
|
—
|
|
|
568
|
|
3,671
|
|
—
|
|
|
—
|
|
|
568
|
|
3,671
|
|
4,239
|
|
162
|
|
1971
|
06/13
|
|
35
|
|||||||
|
Tamarac, FL
|
—
|
|
|
966
|
|
1,115
|
|
—
|
|
|
—
|
|
|
966
|
|
1,115
|
|
2,081
|
|
172
|
|
1972
|
06/13
|
|
10
|
|||||||
|
Tucker, GA
|
—
|
|
|
395
|
|
1,208
|
|
—
|
|
|
—
|
|
|
395
|
|
1,208
|
|
1,603
|
|
93
|
|
1971
|
06/13
|
|
20
|
|||||||
|
Valrico, FL
|
—
|
|
|
178
|
|
870
|
|
—
|
|
|
—
|
|
|
178
|
|
870
|
|
1,048
|
|
45
|
|
1981
|
06/13
|
|
30
|
|||||||
|
Virginia Beach, VA
|
—
|
|
|
326
|
|
366
|
|
—
|
|
|
—
|
|
|
326
|
|
366
|
|
692
|
|
56
|
|
1985
|
06/13
|
|
10
|
|||||||
|
Warner Robins, GA
|
—
|
|
|
905
|
|
1,276
|
|
—
|
|
|
—
|
|
|
905
|
|
1,276
|
|
2,181
|
|
197
|
|
1973
|
06/13
|
|
10
|
|||||||
|
Washington, DC
|
—
|
|
|
2,095
|
|
945
|
|
—
|
|
|
—
|
|
|
2,095
|
|
945
|
|
3,040
|
|
49
|
|
1950
|
06/13
|
|
30
|
|||||||
|
Wildwood, FL
|
—
|
|
|
308
|
|
953
|
|
—
|
|
|
—
|
|
|
308
|
|
953
|
|
1,261
|
|
59
|
|
1978
|
06/13
|
|
25
|
|||||||
|
Youngsville, NC
|
—
|
|
|
237
|
|
165
|
|
—
|
|
|
—
|
|
|
237
|
|
165
|
|
402
|
|
51
|
|
1946
|
06/13
|
|
5
|
|||||||
|
Zephyrhills, FL
|
—
|
|
|
345
|
|
3,112
|
|
—
|
|
|
—
|
|
|
345
|
|
3,112
|
|
3,457
|
|
320
|
|
1972
|
06/13
|
|
15
|
|||||||
|
Zephyrhills, FL
|
—
|
|
|
267
|
|
1,301
|
|
—
|
|
|
—
|
|
|
267
|
|
1,301
|
|
1,568
|
|
67
|
|
1984
|
06/13
|
|
30
|
|||||||
|
|
|
|
|
|
|
|||||||||||||||||||||||||||
|
Superior Petroleum:
|
|
|
|
|
|
|||||||||||||||||||||||||||
|
Midway, PA
|
—
|
|
|
311
|
|
708
|
|
—
|
|
|
—
|
|
|
311
|
|
708
|
|
1,019
|
|
212
|
|
1990
|
01/06
|
|
30
|
|||||||
|
|
|
|
|
|
|
|||||||||||||||||||||||||||
|
Supervalu:
|
|
|
|
|
|
|||||||||||||||||||||||||||
|
Huntington, WV
|
—
|
|
|
1,254
|
|
761
|
|
—
|
|
|
—
|
|
|
1,254
|
|
761
|
|
2,015
|
|
340
|
|
1971
|
02/97
|
|
40
|
|||||||
|
Maple Heights, OH
|
—
|
|
|
1,035
|
|
2,874
|
|
—
|
|
|
—
|
|
|
1,035
|
|
2,874
|
|
3,909
|
|
1,285
|
|
1985
|
02/97
|
|
40
|
|||||||
|
|
|
|
|
|
|
|||||||||||||||||||||||||||
|
Susser HQ:
|
|
|
|
|
|
|||||||||||||||||||||||||||
|
Corpus Christi, TX
|
—
|
|
|
630
|
|
3,131
|
|
—
|
|
|
—
|
|
|
630
|
|
3,131
|
|
3,761
|
|
1,236
|
|
1982
|
03/99
|
|
40
|
|||||||
See accompanying report of independent registered public accounting firm.
F-52
|
Initial Cost to
Company
|
Costs Capitalized
Subsequent to
Acquisition
|
Gross Amount at Which
Carried at Close of Period (a) (b)
|
Life on Which
Depreciation &
Amortization in Latest Income
Statement is
Computed (Years)
|
|||||||||||||||||||||||||||||
|
Encumbrances
|
Land
|
Building,
Improvements &
Leasehold
Interests
|
Improvements
|
Carrying
Costs
|
Land
|
Building,
Improvements &
Leasehold
Interests
|
Total
|
Accumulated
Depreciation
and
Amortization
|
Date of
Construction
|
Date
Acquired
|
||||||||||||||||||||||
|
Real Estate Held for Investment the Company has Invested in Under Operating Leases:
|
||||||||||||||||||||||||||||||||
|
Swansea Quick Cash:
|
|
|
|
|
|
|||||||||||||||||||||||||||
|
Swansea, IL
|
—
|
|
|
46
|
|
132
|
|
—
|
|
|
—
|
|
|
46
|
|
132
|
|
178
|
|
65
|
|
1997
|
12/01
|
|
40
|
|||||||
|
|
|
|
|
|
|
|||||||||||||||||||||||||||
|
Sweet Berries Cafe:
|
|
|
|
|
|
|||||||||||||||||||||||||||
|
Sherman, TX
|
—
|
|
|
233
|
|
126
|
|
24
|
|
|
—
|
|
|
233
|
|
150
|
|
383
|
|
60
|
|
1969
|
09/06
|
|
20
|
|||||||
|
|
|
|
|
|
|
|||||||||||||||||||||||||||
|
Taco Bell:
|
|
|
|
|
|
|||||||||||||||||||||||||||
|
Ocala, FL
|
—
|
|
|
275
|
|
755
|
|
—
|
|
|
—
|
|
|
275
|
|
755
|
|
1,030
|
|
246
|
|
2001
|
12/01
|
|
40
|
|||||||
|
Ormond Beach, FL
|
—
|
|
|
632
|
|
526
|
|
—
|
|
|
—
|
|
|
632
|
|
526
|
|
1,158
|
|
171
|
|
2001
|
12/01
|
|
40
|
|||||||
|
Phoenix, AZ
|
—
|
|
|
594
|
|
283
|
|
—
|
|
|
—
|
|
|
594
|
|
283
|
|
877
|
|
92
|
|
1995
|
12/01
|
|
40
|
|||||||
|
Bedford, IN
|
—
|
|
|
797
|
|
937
|
|
—
|
|
|
—
|
|
|
797
|
|
937
|
|
1,734
|
|
202
|
|
1989
|
05/06
|
|
40
|
|||||||
|
Columbus, IN
|
—
|
|
|
690
|
|
1,213
|
|
—
|
|
|
—
|
|
|
690
|
|
1,213
|
|
1,903
|
|
261
|
|
2005
|
05/06
|
|
40
|
|||||||
|
Columbus, IN
|
—
|
|
|
1,257
|
|
2,055
|
|
—
|
|
|
—
|
|
|
1,257
|
|
2,055
|
|
3,312
|
|
443
|
|
1990
|
05/06
|
|
40
|
|||||||
|
Evansville, IN
|
—
|
|
|
524
|
|
1,815
|
|
—
|
|
|
—
|
|
|
524
|
|
1,815
|
|
2,339
|
|
391
|
|
2005
|
05/06
|
|
40
|
|||||||
|
Evansville, IN
|
—
|
|
|
308
|
|
1,301
|
|
—
|
|
|
—
|
|
|
308
|
|
1,301
|
|
1,609
|
|
280
|
|
2000
|
05/06
|
|
40
|
|||||||
|
Evansville, IN
|
—
|
|
|
221
|
|
828
|
|
—
|
|
|
—
|
|
|
221
|
|
828
|
|
1,049
|
|
179
|
|
2003
|
05/06
|
|
40
|
|||||||
|
Fishers, IN
|
—
|
|
|
990
|
|
486
|
|
—
|
|
|
—
|
|
|
990
|
|
486
|
|
1,476
|
|
105
|
|
1998
|
05/06
|
|
40
|
|||||||
|
Greensburg, IN
|
—
|
|
|
648
|
|
1,079
|
|
—
|
|
|
—
|
|
|
648
|
|
1,079
|
|
1,727
|
|
233
|
|
1998
|
05/06
|
|
40
|
|||||||
|
Indianapolis, IN
|
—
|
|
|
1,032
|
|
1,650
|
|
—
|
|
|
—
|
|
|
1,032
|
|
1,650
|
|
2,682
|
|
356
|
|
2004
|
05/06
|
|
40
|
|||||||
|
Indianapolis, IN
|
—
|
|
|
547
|
|
703
|
|
—
|
|
|
—
|
|
|
547
|
|
703
|
|
1,250
|
|
152
|
|
2004
|
05/06
|
|
40
|
|||||||
|
Madisonville, KY
|
—
|
|
|
682
|
|
1,193
|
|
—
|
|
|
—
|
|
|
682
|
|
1,193
|
|
1,875
|
|
257
|
|
1999
|
05/06
|
|
40
|
|||||||
|
Ownesboro, KY
|
—
|
|
|
639
|
|
1,326
|
|
—
|
|
|
—
|
|
|
639
|
|
1,326
|
|
1,965
|
|
286
|
|
2005
|
05/06
|
|
40
|
|||||||
|
Shelbyville, IN
|
—
|
|
|
670
|
|
1,756
|
|
—
|
|
|
—
|
|
|
670
|
|
1,756
|
|
2,426
|
|
379
|
|
1998
|
05/06
|
|
40
|
|||||||
|
Speedway, IN
|
—
|
|
|
408
|
|
1,426
|
|
—
|
|
|
—
|
|
|
408
|
|
1,426
|
|
1,834
|
|
308
|
|
2003
|
05/06
|
|
40
|
|||||||
|
Terre Haute, IN
|
—
|
|
|
1,037
|
|
1,656
|
|
—
|
|
|
—
|
|
|
1,037
|
|
1,656
|
|
2,693
|
|
357
|
|
2003
|
05/06
|
|
40
|
|||||||
|
Terre Haute, IN
|
—
|
|
|
1,314
|
|
2,249
|
|
—
|
|
|
—
|
|
|
1,314
|
|
2,249
|
|
3,563
|
|
485
|
|
2003
|
05/06
|
|
40
|
|||||||
|
Vincennes, IN
|
—
|
|
|
502
|
|
880
|
|
—
|
|
|
—
|
|
|
502
|
|
880
|
|
1,382
|
|
190
|
|
2004
|
05/06
|
|
40
|
|||||||
|
Anderson, SC
|
—
|
|
|
176
|
|
436
|
|
—
|
|
|
—
|
|
|
176
|
|
436
|
|
612
|
|
59
|
|
2000
|
12/10
|
|
30
|
|||||||
|
Anderson, SC
|
—
|
|
|
273
|
|
820
|
|
—
|
|
|
—
|
|
|
273
|
|
820
|
|
1,093
|
|
132
|
|
1989
|
12/10
|
|
25
|
|||||||
|
Asheville, NC
|
—
|
|
|
252
|
|
483
|
|
—
|
|
|
—
|
|
|
252
|
|
483
|
|
735
|
|
78
|
|
1993
|
12/10
|
|
25
|
|||||||
|
Asheville, NC
|
—
|
|
|
408
|
|
732
|
|
—
|
|
|
—
|
|
|
408
|
|
732
|
|
1,140
|
|
118
|
|
1992
|
12/10
|
|
25
|
|||||||
|
Black Mountain, NC
|
—
|
|
|
149
|
|
313
|
|
—
|
|
|
—
|
|
|
149
|
|
313
|
|
462
|
|
51
|
|
1992
|
12/10
|
|
25
|
|||||||
|
Blue Ridge, GA
|
—
|
|
|
276
|
|
553
|
|
—
|
|
|
—
|
|
|
276
|
|
553
|
|
829
|
|
89
|
|
1992
|
12/10
|
|
25
|
|||||||
|
Cedartown, GA
|
—
|
|
|
353
|
|
890
|
|
—
|
|
|
—
|
|
|
353
|
|
890
|
|
1,243
|
|
144
|
|
1990
|
12/10
|
|
25
|
|||||||
See accompanying report of independent registered public accounting firm.
F-53
|
Initial Cost to
Company
|
Costs Capitalized
Subsequent to
Acquisition
|
Gross Amount at Which
Carried at Close of Period (a) (b)
|
Life on Which
Depreciation &
Amortization in Latest Income
Statement is
Computed (Years)
|
|||||||||||||||||||||||||||||
|
Encumbrances
|
Land
|
Building,
Improvements &
Leasehold
Interests
|
Improvements
|
Carrying
Costs
|
Land
|
Building,
Improvements &
Leasehold
Interests
|
Total
|
Accumulated
Depreciation
and
Amortization
|
Date of
Construction
|
Date
Acquired
|
||||||||||||||||||||||
|
Real Estate Held for Investment the Company has Invested in Under Operating Leases:
|
||||||||||||||||||||||||||||||||
|
Duncan, SC
|
—
|
|
|
280
|
|
483
|
|
—
|
|
|
—
|
|
|
280
|
|
483
|
|
763
|
|
65
|
|
1999
|
12/10
|
|
30
|
|||||||
|
Easley, SC (n)
|
—
|
|
|
444
|
|
818
|
|
—
|
|
|
—
|
|
|
444
|
|
818
|
|
1,262
|
|
132
|
|
1991
|
12/10
|
|
25
|
|||||||
|
Fort Payne, AL
|
—
|
|
|
362
|
|
533
|
|
—
|
|
|
—
|
|
|
362
|
|
533
|
|
895
|
|
86
|
|
1989
|
12/10
|
|
25
|
|||||||
|
Franklin, NC
|
—
|
|
|
472
|
|
687
|
|
—
|
|
|
—
|
|
|
472
|
|
687
|
|
1,159
|
|
111
|
|
1992
|
12/10
|
|
25
|
|||||||
|
Gaffney, SC
|
—
|
|
|
388
|
|
940
|
|
—
|
|
|
—
|
|
|
388
|
|
940
|
|
1,328
|
|
127
|
|
1998
|
12/10
|
|
30
|
|||||||
|
Greenville, SC
|
—
|
|
|
169
|
|
330
|
|
—
|
|
|
—
|
|
|
169
|
|
330
|
|
499
|
|
53
|
|
1990
|
12/10
|
|
25
|
|||||||
|
Greenville, SC
|
—
|
|
|
414
|
|
810
|
|
—
|
|
|
—
|
|
|
414
|
|
810
|
|
1,224
|
|
109
|
|
1995
|
12/10
|
|
30
|
|||||||
|
Hendersonville, NC
|
—
|
|
|
569
|
|
1,163
|
|
—
|
|
|
—
|
|
|
569
|
|
1,163
|
|
1,732
|
|
188
|
|
1988
|
12/10
|
|
25
|
|||||||
|
Inman, SC
|
—
|
|
|
223
|
|
502
|
|
—
|
|
|
—
|
|
|
223
|
|
502
|
|
725
|
|
68
|
|
1999
|
12/10
|
|
30
|
|||||||
|
Lavonia, GA
|
—
|
|
|
122
|
|
359
|
|
—
|
|
|
—
|
|
|
122
|
|
359
|
|
481
|
|
48
|
|
1999
|
12/10
|
|
30
|
|||||||
|
Madison, AL
|
—
|
|
|
498
|
|
886
|
|
—
|
|
|
—
|
|
|
498
|
|
886
|
|
1,384
|
|
143
|
|
1985
|
12/10
|
|
25
|
|||||||
|
Oneonta, AL
|
—
|
|
|
362
|
|
881
|
|
—
|
|
|
—
|
|
|
362
|
|
881
|
|
1,243
|
|
142
|
|
1992
|
12/10
|
|
25
|
|||||||
|
Piedmont, SC
|
—
|
|
|
249
|
|
702
|
|
—
|
|
|
—
|
|
|
249
|
|
702
|
|
951
|
|
95
|
|
2000
|
12/10
|
|
30
|
|||||||
|
Pisgah Forest, NC
|
—
|
|
|
260
|
|
672
|
|
—
|
|
|
—
|
|
|
260
|
|
672
|
|
932
|
|
91
|
|
1998
|
12/10
|
|
30
|
|||||||
|
Rainsville, AL
|
—
|
|
|
411
|
|
1,077
|
|
—
|
|
|
—
|
|
|
411
|
|
1,077
|
|
1,488
|
|
145
|
|
1998
|
12/10
|
|
30
|
|||||||
|
Seneca, SC
|
—
|
|
|
304
|
|
807
|
|
—
|
|
|
—
|
|
|
304
|
|
807
|
|
1,111
|
|
130
|
|
1993
|
12/10
|
|
25
|
|||||||
|
Simpsonville, SC
|
—
|
|
|
635
|
|
1,022
|
|
—
|
|
|
—
|
|
|
635
|
|
1,022
|
|
1,657
|
|
165
|
|
1991
|
12/10
|
|
25
|
|||||||
|
Spartanburg, SC
|
—
|
|
|
239
|
|
496
|
|
—
|
|
|
—
|
|
|
239
|
|
496
|
|
735
|
|
67
|
|
1992
|
12/10
|
|
30
|
|||||||
|
Spartanburg, SC
|
—
|
|
|
492
|
|
949
|
|
—
|
|
|
—
|
|
|
492
|
|
949
|
|
1,441
|
|
128
|
|
1993
|
12/10
|
|
30
|
|||||||
|
Sylva, NC
|
—
|
|
|
580
|
|
786
|
|
—
|
|
|
—
|
|
|
580
|
|
786
|
|
1,366
|
|
106
|
|
1994
|
12/10
|
|
30
|
|||||||
|
Toccoa, GA
|
—
|
|
|
201
|
|
600
|
|
—
|
|
|
—
|
|
|
201
|
|
600
|
|
801
|
|
81
|
|
1993
|
12/10
|
|
30
|
|||||||
|
Anderson, IN
|
—
|
|
|
313
|
|
1,338
|
|
—
|
|
|
—
|
|
|
313
|
|
1,338
|
|
1,651
|
|
78
|
|
2008
|
12/12
|
|
35
|
|||||||
|
Bloomington, IN
|
—
|
|
|
275
|
|
1,026
|
|
—
|
|
|
—
|
|
|
275
|
|
1,026
|
|
1,301
|
|
84
|
|
1988
|
12/12
|
|
25
|
|||||||
|
Bloomington, IN
|
—
|
|
|
332
|
|
1,234
|
|
—
|
|
|
—
|
|
|
332
|
|
1,234
|
|
1,566
|
|
72
|
|
2009
|
12/12
|
|
35
|
|||||||
|
Carmel, IN
|
—
|
|
|
360
|
|
1,546
|
|
—
|
|
|
—
|
|
|
360
|
|
1,546
|
|
1,906
|
|
105
|
|
1994
|
12/12
|
|
30
|
|||||||
|
Daleville, IN
|
—
|
|
|
209
|
|
893
|
|
—
|
|
|
—
|
|
|
209
|
|
893
|
|
1,102
|
|
61
|
|
1995
|
12/12
|
|
30
|
|||||||
|
Edinburgh, IN
|
—
|
|
|
313
|
|
1,338
|
|
—
|
|
|
—
|
|
|
313
|
|
1,338
|
|
1,651
|
|
78
|
|
2007
|
12/12
|
|
35
|
|||||||
|
Evansville, IN
|
—
|
|
|
209
|
|
1,092
|
|
—
|
|
|
—
|
|
|
209
|
|
1,092
|
|
1,301
|
|
64
|
|
2008
|
12/12
|
|
35
|
|||||||
|
Indianapolis, IN
|
—
|
|
|
256
|
|
1,102
|
|
—
|
|
|
—
|
|
|
256
|
|
1,102
|
|
1,358
|
|
64
|
|
2008
|
12/12
|
|
35
|
|||||||
|
Indianapolis, IN
|
—
|
|
|
209
|
|
799
|
|
—
|
|
|
—
|
|
|
209
|
|
799
|
|
1,008
|
|
54
|
|
1994
|
12/12
|
|
30
|
|||||||
|
Indianapolis, IN
|
—
|
|
|
351
|
|
1,452
|
|
—
|
|
|
—
|
|
|
351
|
|
1,452
|
|
1,803
|
|
99
|
|
2005
|
12/12
|
|
30
|
|||||||
|
Indianapolis, IN
|
—
|
|
|
247
|
|
931
|
|
—
|
|
|
—
|
|
|
247
|
|
931
|
|
1,178
|
|
63
|
|
1995
|
12/12
|
|
30
|
|||||||
|
Indianapolis, IN
|
—
|
|
|
285
|
|
1,225
|
|
—
|
|
|
—
|
|
|
285
|
|
1,225
|
|
1,510
|
|
71
|
|
2008
|
12/12
|
|
35
|
|||||||
|
Indianapolis, IN
|
—
|
|
|
304
|
|
1,206
|
|
—
|
|
|
—
|
|
|
304
|
|
1,206
|
|
1,510
|
|
70
|
|
2010
|
12/12
|
|
35
|
|||||||
See accompanying report of independent registered public accounting firm.
F-54
|
Initial Cost to
Company
|
Costs Capitalized
Subsequent to
Acquisition
|
Gross Amount at Which
Carried at Close of Period (a) (b)
|
Life on Which
Depreciation &
Amortization in Latest Income
Statement is
Computed (Years)
|
|||||||||||||||||||||||||||||
|
Encumbrances
|
Land
|
Building,
Improvements &
Leasehold
Interests
|
Improvements
|
Carrying
Costs
|
Land
|
Building,
Improvements &
Leasehold
Interests
|
Total
|
Accumulated
Depreciation
and
Amortization
|
Date of
Construction
|
Date
Acquired
|
||||||||||||||||||||||
|
Real Estate Held for Investment the Company has Invested in Under Operating Leases:
|
||||||||||||||||||||||||||||||||
|
Jasper, IN
|
—
|
|
|
200
|
|
960
|
|
—
|
|
|
—
|
|
|
200
|
|
960
|
|
1,160
|
|
65
|
|
1992
|
12/12
|
|
30
|
|||||||
|
New Castle, IN
|
—
|
|
|
427
|
|
1,830
|
|
—
|
|
|
—
|
|
|
427
|
|
1,830
|
|
2,257
|
|
125
|
|
2006
|
12/12
|
|
30
|
|||||||
|
Owensboro, KY
|
—
|
|
|
436
|
|
1,119
|
|
—
|
|
|
—
|
|
|
436
|
|
1,119
|
|
1,555
|
|
65
|
|
2010
|
12/12
|
|
35
|
|||||||
|
Connersville, IN
|
—
|
|
|
136
|
|
1,280
|
|
—
|
|
|
—
|
|
|
136
|
|
1,280
|
|
1,416
|
|
62
|
|
1991
|
07/13
|
|
30
|
|||||||
|
Linton, IN
|
—
|
|
|
155
|
|
1,203
|
|
—
|
|
|
—
|
|
|
155
|
|
1,203
|
|
1,358
|
|
58
|
|
1996
|
07/13
|
|
30
|
|||||||
|
Owensboro, KY
|
—
|
|
|
136
|
|
1,549
|
|
—
|
|
|
—
|
|
|
136
|
|
1,549
|
|
1,685
|
|
75
|
|
1998
|
07/13
|
|
30
|
|||||||
|
Arnold, MO
|
—
|
|
|
436
|
|
698
|
|
—
|
|
|
—
|
|
|
436
|
|
698
|
|
1,134
|
|
38
|
|
1991
|
08/13
|
|
25
|
|||||||
|
Collinsville, IL
|
—
|
|
|
368
|
|
1,713
|
|
—
|
|
|
—
|
|
|
368
|
|
1,713
|
|
2,081
|
|
94
|
|
1993
|
08/13
|
|
25
|
|||||||
|
East Alton, IL
|
—
|
|
|
271
|
|
1,008
|
|
—
|
|
|
—
|
|
|
271
|
|
1,008
|
|
1,279
|
|
46
|
|
1991
|
08/13
|
|
30
|
|||||||
|
Edwardsville, IL
|
—
|
|
|
310
|
|
1,549
|
|
—
|
|
|
—
|
|
|
310
|
|
1,549
|
|
1,859
|
|
71
|
|
1987
|
08/13
|
|
30
|
|||||||
|
Eureka, MO
|
—
|
|
|
466
|
|
466
|
|
—
|
|
|
—
|
|
|
466
|
|
466
|
|
932
|
|
26
|
|
1984
|
08/13
|
|
25
|
|||||||
|
Granite City, IL
|
—
|
|
|
707
|
|
852
|
|
—
|
|
|
—
|
|
|
707
|
|
852
|
|
1,559
|
|
33
|
|
2006
|
08/13
|
|
35
|
|||||||
|
Hazelwood, MO
|
—
|
|
|
513
|
|
1,470
|
|
—
|
|
|
—
|
|
|
513
|
|
1,470
|
|
1,983
|
|
67
|
|
1991
|
08/13
|
|
30
|
|||||||
|
Maryland Heights, MO
|
—
|
|
|
407
|
|
862
|
|
—
|
|
|
—
|
|
|
407
|
|
862
|
|
1,269
|
|
40
|
|
1991
|
08/13
|
|
30
|
|||||||
|
O'Fallon, MO
|
—
|
|
|
445
|
|
1,770
|
|
—
|
|
|
—
|
|
|
445
|
|
1,770
|
|
2,215
|
|
81
|
|
1985
|
08/13
|
|
30
|
|||||||
|
O'Fallon, MO
|
—
|
|
|
580
|
|
1,403
|
|
—
|
|
|
—
|
|
|
580
|
|
1,403
|
|
1,983
|
|
55
|
|
2003
|
08/13
|
|
35
|
|||||||
|
St. Charles, MO
|
—
|
|
|
581
|
|
872
|
|
—
|
|
|
—
|
|
|
581
|
|
872
|
|
1,453
|
|
40
|
|
2000
|
08/13
|
|
30
|
|||||||
|
St. Louis, MO
|
—
|
|
|
252
|
|
1,047
|
|
—
|
|
|
—
|
|
|
252
|
|
1,047
|
|
1,299
|
|
58
|
|
1981
|
08/13
|
|
25
|
|||||||
|
St. Louis, MO
|
—
|
|
|
465
|
|
1,171
|
|
—
|
|
|
—
|
|
|
465
|
|
1,171
|
|
1,636
|
|
46
|
|
2009
|
08/13
|
|
35
|
|||||||
|
St. Louis, MO
|
—
|
|
|
252
|
|
785
|
|
—
|
|
|
—
|
|
|
252
|
|
785
|
|
1,037
|
|
36
|
|
1990
|
08/13
|
|
30
|
|||||||
|
|
|
|
|
|
|
|||||||||||||||||||||||||||
|
Taverna Greek Grill:
|
|
|
|
|
|
|||||||||||||||||||||||||||
|
Fort Collins, CO
|
—
|
|
|
390
|
|
895
|
|
—
|
|
|
—
|
|
|
390
|
|
895
|
|
1,285
|
|
116
|
|
1995
|
02/11
|
|
30
|
|||||||
|
|
|
|
|
|
|
|||||||||||||||||||||||||||
|
Texas Roadhouse:
|
|
|
|
|
|
|||||||||||||||||||||||||||
|
Grand Junction, CO
|
—
|
|
|
584
|
|
920
|
|
—
|
|
|
—
|
|
|
584
|
|
920
|
|
1,504
|
|
300
|
|
1997
|
12/01
|
|
40
|
|||||||
|
Thornton, CO
|
—
|
|
|
599
|
|
1,019
|
|
—
|
|
|
—
|
|
|
599
|
|
1,019
|
|
1,618
|
|
332
|
|
1998
|
12/01
|
|
40
|
|||||||
|
Palm Bay, FL
|
—
|
|
|
1,035
|
|
1,512
|
|
—
|
|
|
—
|
|
|
1,035
|
|
1,512
|
|
2,547
|
|
178
|
|
2004
|
06/11
|
|
30
|
|||||||
|
|
|
|
|
|
|
|||||||||||||||||||||||||||
|
TGI Friday's:
|
|
|
|
|
|
|||||||||||||||||||||||||||
|
Corpus Christi, TX
|
—
|
|
|
1,210
|
|
1,532
|
|
—
|
|
|
—
|
|
|
1,157
|
|
1,532
|
|
2,689
|
|
500
|
|
1995
|
12/01
|
|
40
|
|||||||
|
|
|
|
|
|
|
|||||||||||||||||||||||||||
|
The Beach:
|
|
|
|
|
|
|||||||||||||||||||||||||||
|
Mason, OH
|
—
|
|
|
1,707
|
|
1,303
|
|
—
|
|
|
—
|
|
|
1,707
|
|
1,303
|
|
3,010
|
|
93
|
|
1985
|
03/13
|
|
25
|
|||||||
See accompanying report of independent registered public accounting firm.
F-55
|
Initial Cost to
Company
|
Costs Capitalized
Subsequent to
Acquisition
|
Gross Amount at Which
Carried at Close of Period (a) (b)
|
Life on Which
Depreciation &
Amortization in Latest Income
Statement is
Computed (Years)
|
|||||||||||||||||||||||||||||
|
Encumbrances
|
Land
|
Building,
Improvements &
Leasehold
Interests
|
Improvements
|
Carrying
Costs
|
Land
|
Building,
Improvements &
Leasehold
Interests
|
Total
|
Accumulated
Depreciation
and
Amortization
|
Date of
Construction
|
Date
Acquired
|
||||||||||||||||||||||
|
Real Estate Held for Investment the Company has Invested in Under Operating Leases:
|
||||||||||||||||||||||||||||||||
|
The Containter Store:
|
|
|
|
|
|
|||||||||||||||||||||||||||
|
Plano, TX
|
—
|
|
|
1,758
|
|
5,115
|
|
—
|
|
|
—
|
|
|
1,758
|
|
5,115
|
|
6,873
|
|
237
|
|
2009
|
05/13
|
|
35
|
|||||||
|
|
|
|
|
|
|
|||||||||||||||||||||||||||
|
The Snooty Fox:
|
|
|
|
|
|
|||||||||||||||||||||||||||
|
Cincinnati, OH
|
—
|
|
|
282
|
|
521
|
|
403
|
|
|
—
|
|
|
543
|
|
662
|
|
1,205
|
|
186
|
|
1998
|
12/01
|
|
40
|
|||||||
|
|
|
|
|
|
|
|||||||||||||||||||||||||||
|
The Tile Shop:
|
|
|
|
|
|
|||||||||||||||||||||||||||
|
Scarsdale, NY
|
—
|
|
|
4,509
|
|
2,454
|
|
321
|
|
|
—
|
|
|
4,509
|
|
2,775
|
|
7,284
|
|
675
|
|
1996
|
09/97
|
|
40
|
|||||||
|
|
|
|
|
|
|
|||||||||||||||||||||||||||
|
Third Federal Savings:
|
|
|
|
|
|
|||||||||||||||||||||||||||
|
Parma, OH
|
—
|
|
|
370
|
|
238
|
|
1,100
|
|
|
—
|
|
|
370
|
|
1,338
|
|
1,708
|
|
441
|
|
1977
|
09/06
|
|
20
|
|||||||
|
|
|
|
|
|
|
|||||||||||||||||||||||||||
|
Tile Outlets of America:
|
|
|
|
|
|
|||||||||||||||||||||||||||
|
Sarasota, FL
|
—
|
|
|
1,168
|
|
1,904
|
|
735
|
|
|
—
|
|
|
1,170
|
|
2,639
|
|
3,809
|
|
616
|
|
1988
|
09/97
|
|
40
|
|||||||
|
|
|
|
|
|
|
|||||||||||||||||||||||||||
|
TitleMax:
|
|
|
|
|
|
|||||||||||||||||||||||||||
|
Geneva, IL
|
—
|
|
|
473
|
|
436
|
|
—
|
|
|
—
|
|
|
484
|
|
375
|
|
859
|
|
126
|
|
1996
|
12/01
|
|
40
|
|||||||
|
Mobile, AL
|
—
|
|
|
491
|
|
498
|
|
—
|
|
|
—
|
|
|
491
|
|
498
|
|
989
|
|
163
|
|
1997
|
12/01
|
|
40
|
|||||||
|
Dallas, TX
|
—
|
|
|
1,554
|
|
1,229
|
|
46
|
|
|
—
|
|
|
1,554
|
|
1,275
|
|
2,829
|
|
298
|
|
1982
|
06/05
|
|
40
|
|||||||
|
Aiken, SC
|
—
|
|
|
442
|
|
646
|
|
—
|
|
|
—
|
|
|
442
|
|
646
|
|
1,088
|
|
137
|
|
1989
|
08/08
|
|
30
|
|||||||
|
Anniston, AL
|
—
|
|
|
160
|
|
453
|
|
—
|
|
|
—
|
|
|
160
|
|
453
|
|
613
|
|
72
|
|
2008
|
08/08
|
|
40
|
|||||||
|
Berkeley, MO
|
—
|
|
|
237
|
|
282
|
|
—
|
|
|
—
|
|
|
237
|
|
282
|
|
519
|
|
90
|
|
1961
|
08/08
|
|
20
|
|||||||
|
Cheraw, SC
|
—
|
|
|
88
|
|
330
|
|
—
|
|
|
—
|
|
|
88
|
|
330
|
|
418
|
|
84
|
|
1976
|
08/08
|
|
25
|
|||||||
|
Columbia, SC
|
—
|
|
|
212
|
|
319
|
|
—
|
|
|
—
|
|
|
212
|
|
319
|
|
531
|
|
68
|
|
1987
|
08/08
|
|
30
|
|||||||
|
Dalton, GA
|
—
|
|
|
178
|
|
347
|
|
—
|
|
|
—
|
|
|
178
|
|
347
|
|
525
|
|
89
|
|
1972
|
08/08
|
|
25
|
|||||||
|
Darlington, SC
|
—
|
|
|
47
|
|
267
|
|
—
|
|
|
—
|
|
|
47
|
|
267
|
|
314
|
|
68
|
|
1973
|
08/08
|
|
25
|
|||||||
|
Fairfield, AL
|
—
|
|
|
133
|
|
178
|
|
—
|
|
|
—
|
|
|
133
|
|
178
|
|
311
|
|
45
|
|
1974
|
08/08
|
|
25
|
|||||||
|
Gadsden, AL
|
—
|
|
|
250
|
|
389
|
|
—
|
|
|
—
|
|
|
250
|
|
389
|
|
639
|
|
62
|
|
2007
|
08/08
|
|
40
|
|||||||
|
Hueytown, AL
|
—
|
|
|
135
|
|
93
|
|
—
|
|
|
—
|
|
|
135
|
|
93
|
|
228
|
|
59
|
|
1948
|
08/08
|
|
10
|
|||||||
|
Jonesboro, GA
|
—
|
|
|
675
|
|
292
|
|
—
|
|
|
—
|
|
|
675
|
|
292
|
|
967
|
|
75
|
|
1970
|
08/08
|
|
25
|
|||||||
|
Lawrenceville, GA
|
—
|
|
|
370
|
|
332
|
|
—
|
|
|
—
|
|
|
370
|
|
332
|
|
702
|
|
71
|
|
1986
|
08/08
|
|
30
|
|||||||
|
Lewisburg, TN
|
—
|
|
|
70
|
|
298
|
|
—
|
|
|
—
|
|
|
70
|
|
298
|
|
368
|
|
54
|
|
1998
|
08/08
|
|
35
|
|||||||
|
Macon, GA
|
—
|
|
|
103
|
|
290
|
|
—
|
|
|
—
|
|
|
103
|
|
290
|
|
393
|
|
92
|
|
1967
|
08/08
|
|
20
|
|||||||
|
Marietta, GA
|
—
|
|
|
285
|
|
278
|
|
—
|
|
|
—
|
|
|
285
|
|
278
|
|
563
|
|
89
|
|
1967
|
08/08
|
|
20
|
|||||||
See accompanying report of independent registered public accounting firm.
F-56
|
Initial Cost to
Company
|
Costs Capitalized
Subsequent to
Acquisition
|
Gross Amount at Which
Carried at Close of Period (a) (b)
|
Life on Which
Depreciation &
Amortization in Latest Income
Statement is
Computed (Years)
|
|||||||||||||||||||||||||||||
|
Encumbrances
|
Land
|
Building,
Improvements &
Leasehold
Interests
|
Improvements
|
Carrying
Costs
|
Land
|
Building,
Improvements &
Leasehold
Interests
|
Total
|
Accumulated
Depreciation
and
Amortization
|
Date of
Construction
|
Date
Acquired
|
||||||||||||||||||||||
|
Real Estate Held for Investment the Company has Invested in Under Operating Leases:
|
||||||||||||||||||||||||||||||||
|
Memphis, TN
|
—
|
|
|
111
|
|
237
|
|
—
|
|
|
—
|
|
|
111
|
|
237
|
|
348
|
|
50
|
|
1981
|
08/08
|
|
30
|
|||||||
|
Memphis, TN
|
—
|
|
|
226
|
|
444
|
|
—
|
|
|
—
|
|
|
226
|
|
444
|
|
670
|
|
94
|
|
1986
|
08/08
|
|
30
|
|||||||
|
Montgomery, AL
|
—
|
|
|
96
|
|
233
|
|
—
|
|
|
—
|
|
|
96
|
|
233
|
|
329
|
|
59
|
|
1970
|
08/08
|
|
25
|
|||||||
|
Nashville, TN
|
—
|
|
|
268
|
|
276
|
|
—
|
|
|
—
|
|
|
268
|
|
276
|
|
544
|
|
70
|
|
1978
|
08/08
|
|
25
|
|||||||
|
Nashville, TN
|
—
|
|
|
256
|
|
301
|
|
—
|
|
|
—
|
|
|
256
|
|
301
|
|
557
|
|
64
|
|
1982
|
08/08
|
|
30
|
|||||||
|
Norcross, GA
|
—
|
|
|
599
|
|
350
|
|
—
|
|
|
—
|
|
|
599
|
|
350
|
|
949
|
|
89
|
|
1975
|
08/08
|
|
25
|
|||||||
|
Pulaski, TN
|
—
|
|
|
109
|
|
361
|
|
—
|
|
|
—
|
|
|
109
|
|
361
|
|
470
|
|
77
|
|
1986
|
08/08
|
|
30
|
|||||||
|
Riverdale, GA
|
—
|
|
|
877
|
|
400
|
|
—
|
|
|
—
|
|
|
877
|
|
400
|
|
1,277
|
|
102
|
|
1978
|
08/08
|
|
25
|
|||||||
|
Snellville, GA
|
—
|
|
|
565
|
|
396
|
|
—
|
|
|
—
|
|
|
565
|
|
396
|
|
961
|
|
101
|
|
1977
|
08/08
|
|
25
|
|||||||
|
Springfield, MO
|
—
|
|
|
125
|
|
230
|
|
—
|
|
|
—
|
|
|
125
|
|
230
|
|
355
|
|
59
|
|
1979
|
08/08
|
|
25
|
|||||||
|
Springfield, MO
|
—
|
|
|
220
|
|
400
|
|
—
|
|
|
—
|
|
|
220
|
|
400
|
|
620
|
|
102
|
|
1979
|
08/08
|
|
25
|
|||||||
|
St. Louis, MO
|
—
|
|
|
134
|
|
398
|
|
—
|
|
|
—
|
|
|
134
|
|
398
|
|
532
|
|
72
|
|
1993
|
08/08
|
|
35
|
|||||||
|
St. Louis, MO
|
—
|
|
|
244
|
|
288
|
|
—
|
|
|
—
|
|
|
244
|
|
288
|
|
532
|
|
73
|
|
1971
|
08/08
|
|
25
|
|||||||
|
Sylacauga, AL
|
—
|
|
|
94
|
|
191
|
|
—
|
|
|
—
|
|
|
94
|
|
191
|
|
285
|
|
41
|
|
1986
|
08/08
|
|
30
|
|||||||
|
Taylors, SC
|
—
|
|
|
299
|
|
372
|
|
—
|
|
|
—
|
|
|
299
|
|
372
|
|
671
|
|
68
|
|
1999
|
08/08
|
|
35
|
|||||||
|
Bay Minette, AL
|
—
|
|
|
51
|
|
113
|
|
—
|
|
|
—
|
|
|
51
|
|
113
|
|
164
|
|
18
|
|
1980
|
01/11
|
|
25
|
|||||||
|
N. Richland Hills, TX
|
—
|
|
|
132
|
|
132
|
|
—
|
|
|
—
|
|
|
132
|
|
132
|
|
264
|
|
26
|
|
1976
|
01/11
|
|
20
|
|||||||
|
Petersburg, VA
|
—
|
|
|
139
|
|
366
|
|
—
|
|
|
—
|
|
|
139
|
|
366
|
|
505
|
|
71
|
|
1979
|
02/11
|
|
20
|
|||||||
|
Savannah, GA
|
—
|
|
|
231
|
|
361
|
|
—
|
|
|
—
|
|
|
231
|
|
361
|
|
592
|
|
69
|
|
1972
|
03/11
|
|
20
|
|||||||
|
Fort Worth, TX
|
—
|
|
|
131
|
|
312
|
|
—
|
|
|
—
|
|
|
119
|
|
312
|
|
431
|
|
47
|
|
1985
|
03/11
|
|
25
|
|||||||
|
Hoover, AL
|
—
|
|
|
378
|
|
546
|
|
—
|
|
|
—
|
|
|
378
|
|
546
|
|
924
|
|
83
|
|
1970
|
03/11
|
|
25
|
|||||||
|
Eufaula, AL
|
—
|
|
|
61
|
|
360
|
|
—
|
|
|
—
|
|
|
61
|
|
360
|
|
421
|
|
49
|
|
1980
|
08/11
|
|
25
|
|||||||
|
Kansas City, MO
|
—
|
|
|
69
|
|
129
|
|
—
|
|
|
—
|
|
|
69
|
|
129
|
|
198
|
|
22
|
|
1920
|
08/11
|
|
20
|
|||||||
|
Arnold, MO
|
—
|
|
|
321
|
|
120
|
|
—
|
|
|
—
|
|
|
321
|
|
120
|
|
441
|
|
19
|
|
1960
|
10/11
|
|
20
|
|||||||
|
Bristol, VA
|
—
|
|
|
199
|
|
517
|
|
—
|
|
|
—
|
|
|
199
|
|
517
|
|
716
|
|
55
|
|
2001
|
10/11
|
|
30
|
|||||||
|
Fairview Heights, IL
|
—
|
|
|
93
|
|
185
|
|
—
|
|
|
—
|
|
|
93
|
|
185
|
|
278
|
|
24
|
|
1979
|
10/11
|
|
25
|
|||||||
|
Florissant, MO
|
—
|
|
|
143
|
|
153
|
|
—
|
|
|
—
|
|
|
143
|
|
153
|
|
296
|
|
20
|
|
1974
|
10/11
|
|
25
|
|||||||
|
Greenville, SC
|
—
|
|
|
602
|
|
612
|
|
—
|
|
|
—
|
|
|
602
|
|
612
|
|
1,214
|
|
78
|
|
2008
|
10/11
|
|
25
|
|||||||
|
Jonesboro, GA
|
—
|
|
|
301
|
|
683
|
|
—
|
|
|
—
|
|
|
301
|
|
683
|
|
984
|
|
63
|
|
2007
|
10/11
|
|
35
|
|||||||
|
Olive Branch, MS
|
—
|
|
|
121
|
|
312
|
|
—
|
|
|
—
|
|
|
121
|
|
312
|
|
433
|
|
40
|
|
1978
|
10/11
|
|
25
|
|||||||
|
Sugar Creek, MO
|
—
|
|
|
202
|
|
181
|
|
—
|
|
|
—
|
|
|
202
|
|
181
|
|
383
|
|
23
|
|
1978
|
10/11
|
|
25
|
|||||||
|
Roanoke, VA
|
—
|
|
|
158
|
|
207
|
|
—
|
|
|
—
|
|
|
158
|
|
207
|
|
365
|
|
25
|
|
1950
|
08/12
|
|
20
|
|||||||
|
Fredericksburg, VA
|
—
|
|
|
228
|
|
555
|
|
—
|
|
|
—
|
|
|
228
|
|
555
|
|
783
|
|
51
|
|
1989
|
09/12
|
|
25
|
|||||||
|
Florissant, MO
|
—
|
|
|
119
|
|
288
|
|
—
|
|
|
—
|
|
|
119
|
|
288
|
|
407
|
|
23
|
|
1970
|
12/12
|
|
25
|
|||||||
See accompanying report of independent registered public accounting firm.
F-57
|
Initial Cost to
Company
|
Costs Capitalized
Subsequent to
Acquisition
|
Gross Amount at Which
Carried at Close of Period (a) (b)
|
Life on Which
Depreciation &
Amortization in Latest Income
Statement is
Computed (Years)
|
|||||||||||||||||||||||||||||
|
Encumbrances
|
Land
|
Building,
Improvements &
Leasehold
Interests
|
Improvements
|
Carrying
Costs
|
Land
|
Building,
Improvements &
Leasehold
Interests
|
Total
|
Accumulated
Depreciation
and
Amortization
|
Date of
Construction
|
Date
Acquired
|
||||||||||||||||||||||
|
Real Estate Held for Investment the Company has Invested in Under Operating Leases:
|
||||||||||||||||||||||||||||||||
|
Savannah, GA
|
—
|
|
|
259
|
|
359
|
|
—
|
|
|
—
|
|
|
259
|
|
359
|
|
618
|
|
17
|
|
2012
|
05/13
|
|
35
|
|||||||
|
South Boston, VA
|
—
|
|
|
163
|
|
133
|
|
—
|
|
|
—
|
|
|
163
|
|
133
|
|
296
|
|
11
|
|
1980
|
05/13
|
|
20
|
|||||||
|
O'Fallon, MO
|
—
|
|
|
75
|
|
261
|
|
—
|
|
|
—
|
|
|
75
|
|
261
|
|
336
|
|
12
|
|
1981
|
11/13
|
|
25
|
|||||||
|
|
|
|
|
|
|
|||||||||||||||||||||||||||
|
Tony's Tires:
|
|
|
|
|
|
|||||||||||||||||||||||||||
|
Montgomery, AL
|
—
|
|
|
593
|
|
1,187
|
|
43
|
|
|
—
|
|
|
593
|
|
1,229
|
|
1,822
|
|
273
|
|
1998
|
08/06
|
|
40
|
|||||||
|
|
|
|
|
|
|
|||||||||||||||||||||||||||
|
Toys R Us:
|
|
|
|
|
|
|||||||||||||||||||||||||||
|
Gastonia, NC
|
—
|
|
|
1,825
|
|
—
|
|
6,101
|
|
|
—
|
|
|
1,825
|
|
6,101
|
|
7,926
|
|
472
|
|
1998
|
10/11
|
(m)
|
35
|
|||||||
|
|
|
|
|
|
|
|||||||||||||||||||||||||||
|
Tractor Supply Co.:
|
|
|
|
|
|
|||||||||||||||||||||||||||
|
Aransas Pass, TX
|
—
|
|
|
101
|
|
1,399
|
|
353
|
|
|
—
|
|
|
100
|
|
1,753
|
|
1,853
|
|
604
|
|
1983
|
03/99
|
|
40
|
|||||||
|
|
|
|
|
|
|
|||||||||||||||||||||||||||
|
Tully's:
|
|
|
|
|
|
|||||||||||||||||||||||||||
|
Cheektowaga, NY
|
—
|
|
|
689
|
|
386
|
|
—
|
|
|
—
|
|
|
689
|
|
386
|
|
1,075
|
|
126
|
|
1994
|
12/01
|
|
40
|
|||||||
|
|
|
|
|
|
|
|||||||||||||||||||||||||||
|
Tutor Time:
|
|
|
|
|
|
|||||||||||||||||||||||||||
|
Elk Grove, CA
|
—
|
|
|
1,216
|
|
2,786
|
|
9
|
|
|
—
|
|
|
1,216
|
|
2,750
|
|
3,966
|
|
381
|
|
2009
|
09/08
|
|
40
|
|||||||
|
|
|
|
|
|
|
|||||||||||||||||||||||||||
|
Twenty Seven Truck Stop:
|
|
|
|
|
|
|||||||||||||||||||||||||||
|
Lake Placid, FL
|
—
|
|
|
2,532
|
|
1,157
|
|
491
|
|
|
—
|
|
|
2,532
|
|
1,648
|
|
4,180
|
|
400
|
|
1990
|
12/05
|
|
40
|
|||||||
|
|
|
|
|
|
|
|||||||||||||||||||||||||||
|
Twin Peaks:
|
|
|
|
|
|
|||||||||||||||||||||||||||
|
Olathe, KS
|
—
|
|
|
525
|
|
731
|
|
—
|
|
|
—
|
|
|
525
|
|
731
|
|
1,256
|
|
90
|
|
2005
|
09/10
|
|
35
|
|||||||
|
|
|
|
|
|
|
|||||||||||||||||||||||||||
|
ULTA Salon, Cosmetics and Fragrance:
|
|
|
|
|
|
|||||||||||||||||||||||||||
|
Florissant, MO
|
—
|
|
|
423
|
|
499
|
|
1,444
|
|
|
—
|
|
|
425
|
|
1,942
|
|
2,367
|
|
240
|
|
1996
|
04/03
|
(g)
|
40
|
|||||||
|
|
|
|
|
|
|
|||||||||||||||||||||||||||
|
Ultra Car Wash:
|
|
|
|
|
|
|||||||||||||||||||||||||||
|
Mobile, AL
|
—
|
|
1,071
|
|
1,086
|
|
—
|
|
—
|
|
1,071
|
|
1,086
|
|
2,157
|
|
200
|
|
2005
|
08/07
|
|
40
|
||||||||||
|
Lilburn, GA
|
—
|
|
|
1,396
|
|
1,119
|
|
—
|
|
|
—
|
|
|
1,396
|
|
1,119
|
|
2,515
|
|
185
|
|
2004
|
05/08
|
|
40
|
|||||||
|
|
|
|
|
|
|
|||||||||||||||||||||||||||
|
Uni-Mart:
|
|
|
|
|
|
|||||||||||||||||||||||||||
|
East Brady, PA
|
—
|
|
|
269
|
|
583
|
|
—
|
|
|
—
|
|
|
269
|
|
583
|
|
852
|
|
273
|
|
1987
|
08/05
|
|
20
|
|||||||
See accompanying report of independent registered public accounting firm.
F-58
|
Initial Cost to
Company
|
Costs Capitalized
Subsequent to
Acquisition
|
Gross Amount at Which
Carried at Close of Period (a) (b)
|
Life on Which
Depreciation &
Amortization in Latest Income
Statement is
Computed (Years)
|
|||||||||||||||||||||||||||||
|
Encumbrances
|
Land
|
Building,
Improvements &
Leasehold
Interests
|
Improvements
|
Carrying
Costs
|
Land
|
Building,
Improvements &
Leasehold
Interests
|
Total
|
Accumulated
Depreciation
and
Amortization
|
Date of
Construction
|
Date
Acquired
|
||||||||||||||||||||||
|
Real Estate Held for Investment the Company has Invested in Under Operating Leases:
|
||||||||||||||||||||||||||||||||
|
Pleasant Gap, PA
|
—
|
|
|
332
|
|
593
|
|
—
|
|
|
—
|
|
|
332
|
|
593
|
|
925
|
|
278
|
|
1996
|
08/05
|
|
20
|
|||||||
|
Port Vue, PA
|
—
|
|
|
824
|
|
118
|
|
—
|
|
|
—
|
|
|
824
|
|
118
|
|
942
|
|
55
|
|
1953
|
08/05
|
|
20
|
|||||||
|
Punxsutawney, PA
|
—
|
|
|
253
|
|
542
|
|
—
|
|
|
—
|
|
|
253
|
|
542
|
|
795
|
|
254
|
|
1983
|
08/05
|
|
20
|
|||||||
|
Shamokin, PA
|
—
|
|
|
324
|
|
506
|
|
—
|
|
|
—
|
|
|
324
|
|
506
|
|
830
|
|
237
|
|
1956
|
08/05
|
|
20
|
|||||||
|
Shippensburg, PA
|
—
|
|
|
204
|
|
330
|
|
—
|
|
|
—
|
|
|
204
|
|
330
|
|
534
|
|
155
|
|
1989
|
08/05
|
|
20
|
|||||||
|
Wilkes-Barre, PA
|
—
|
|
|
178
|
|
471
|
|
—
|
|
|
—
|
|
|
178
|
|
471
|
|
649
|
|
221
|
|
1989
|
08/05
|
|
20
|
|||||||
|
Wilkes-Barre, PA
|
—
|
|
|
171
|
|
422
|
|
—
|
|
|
—
|
|
|
171
|
|
422
|
|
593
|
|
198
|
|
1999
|
08/05
|
|
20
|
|||||||
|
Wilkes-Barre, PA
|
—
|
|
|
876
|
|
1,957
|
|
—
|
|
|
—
|
|
|
876
|
|
1,957
|
|
2,833
|
|
917
|
|
1998
|
08/05
|
|
20
|
|||||||
|
Williamsport, PA
|
—
|
|
|
909
|
|
122
|
|
—
|
|
|
—
|
|
|
909
|
|
122
|
|
1,031
|
|
57
|
|
1950
|
08/05
|
|
20
|
|||||||
|
Ashland, PA
|
—
|
|
|
355
|
|
545
|
|
—
|
|
|
—
|
|
|
355
|
|
545
|
|
900
|
|
253
|
|
1977
|
09/05
|
|
20
|
|||||||
|
Mountaintop, PA
|
—
|
|
|
423
|
|
616
|
|
—
|
|
|
—
|
|
|
423
|
|
616
|
|
1,039
|
|
286
|
|
1987
|
09/05
|
|
20
|
|||||||
|
Effort, PA
|
—
|
|
|
1,297
|
|
1,202
|
|
—
|
|
|
—
|
|
|
1,297
|
|
1,202
|
|
2,499
|
|
269
|
|
2000
|
01/06
|
|
40
|
|||||||
|
Hughesville, PA
|
—
|
|
|
290
|
|
566
|
|
—
|
|
|
—
|
|
|
290
|
|
566
|
|
856
|
|
127
|
|
1977
|
01/06
|
|
40
|
|||||||
|
McSherrystown, PA
|
—
|
|
|
135
|
|
365
|
|
—
|
|
|
—
|
|
|
135
|
|
365
|
|
500
|
|
82
|
|
1988
|
01/06
|
|
40
|
|||||||
|
Milesburg, PA
|
—
|
|
|
134
|
|
373
|
|
—
|
|
|
—
|
|
|
134
|
|
373
|
|
507
|
|
84
|
|
1987
|
01/06
|
|
40
|
|||||||
|
Nanticoke, PA
|
—
|
|
|
175
|
|
482
|
|
—
|
|
|
—
|
|
|
175
|
|
482
|
|
657
|
|
108
|
|
1988
|
01/06
|
|
40
|
|||||||
|
Nuangola, PA
|
—
|
|
|
1,062
|
|
1,203
|
|
—
|
|
|
—
|
|
|
1,062
|
|
1,203
|
|
2,265
|
|
269
|
|
2000
|
01/06
|
|
40
|
|||||||
|
Plains, PA
|
—
|
|
|
204
|
|
401
|
|
—
|
|
|
—
|
|
|
204
|
|
401
|
|
605
|
|
90
|
|
1994
|
01/06
|
|
40
|
|||||||
|
Punxsutawney, PA
|
—
|
|
|
294
|
|
650
|
|
—
|
|
|
—
|
|
|
294
|
|
650
|
|
944
|
|
146
|
|
1983
|
01/06
|
|
40
|
|||||||
|
Williamsport, PA
|
—
|
|
|
295
|
|
379
|
|
—
|
|
|
—
|
|
|
295
|
|
379
|
|
674
|
|
85
|
|
1988
|
01/06
|
|
40
|
|||||||
|
Burnham, PA
|
—
|
|
|
265
|
|
510
|
|
—
|
|
|
—
|
|
|
340
|
|
435
|
|
775
|
|
184
|
|
1978
|
07/06
|
|
20
|
|||||||
|
|
|
|
|
|
|
|||||||||||||||||||||||||||
|
Uni-Mart Summerville:
|
|
|
|
|
|
|||||||||||||||||||||||||||
|
Summerville, PA
|
—
|
|
|
93
|
|
272
|
|
17
|
|
|
—
|
|
|
93
|
|
289
|
|
382
|
|
62
|
|
1988
|
01/06
|
|
40
|
|||||||
|
|
|
|
|
|
|
|||||||||||||||||||||||||||
|
United Rentals:
|
|
|
|
|
|
|||||||||||||||||||||||||||
|
Carrollton, TX
|
—
|
|
|
478
|
|
535
|
|
—
|
|
|
—
|
|
|
478
|
|
535
|
|
1,013
|
|
134
|
|
1981
|
12/04
|
|
40
|
|||||||
|
Cedar Park, TX (n)
|
—
|
|
|
535
|
|
829
|
|
—
|
|
|
—
|
|
|
535
|
|
829
|
|
1,364
|
|
208
|
|
1990
|
12/04
|
|
40
|
|||||||
|
Clearwater, FL (n)
|
—
|
|
|
1,173
|
|
1,811
|
|
—
|
|
|
—
|
|
|
1,173
|
|
1,811
|
|
2,984
|
|
455
|
|
2001
|
12/04
|
|
40
|
|||||||
|
Fort Collins, CO (n)
|
—
|
|
|
2,057
|
|
978
|
|
—
|
|
|
—
|
|
|
2,057
|
|
978
|
|
3,035
|
|
246
|
|
1975
|
12/04
|
|
40
|
|||||||
|
Irving, TX
|
—
|
|
|
708
|
|
911
|
|
—
|
|
|
—
|
|
|
708
|
|
911
|
|
1,619
|
|
229
|
|
1984
|
12/04
|
|
40
|
|||||||
|
La Porte, TX
|
—
|
|
|
1,115
|
|
2,125
|
|
—
|
|
|
—
|
|
|
1,115
|
|
2,125
|
|
3,240
|
|
534
|
|
2000
|
12/04
|
|
40
|
|||||||
|
Littleton, CO
|
—
|
|
|
1,743
|
|
1,944
|
|
—
|
|
|
—
|
|
|
1,743
|
|
1,944
|
|
3,687
|
|
488
|
|
2002
|
12/04
|
|
40
|
|||||||
|
Oklahoma City, OK
|
—
|
|
|
744
|
|
1,265
|
|
—
|
|
|
—
|
|
|
744
|
|
1,265
|
|
2,009
|
|
318
|
|
1997
|
12/04
|
|
40
|
|||||||
See accompanying report of independent registered public accounting firm.
F-59
|
Initial Cost to
Company
|
Costs Capitalized
Subsequent to
Acquisition
|
Gross Amount at Which
Carried at Close of Period (a) (b)
|
Life on Which
Depreciation &
Amortization in Latest Income
Statement is
Computed (Years)
|
|||||||||||||||||||||||||||||
|
Encumbrances
|
Land
|
Building,
Improvements &
Leasehold
Interests
|
Improvements
|
Carrying
Costs
|
Land
|
Building,
Improvements &
Leasehold
Interests
|
Total
|
Accumulated
Depreciation
and
Amortization
|
Date of
Construction
|
Date
Acquired
|
||||||||||||||||||||||
|
Real Estate Held for Investment the Company has Invested in Under Operating Leases:
|
||||||||||||||||||||||||||||||||
|
Perrysberg, OH
|
—
|
|
|
642
|
|
1,119
|
|
—
|
|
|
—
|
|
|
642
|
|
1,119
|
|
1,761
|
|
281
|
|
1979
|
12/04
|
|
40
|
|||||||
|
Plano, TX
|
—
|
|
|
1,030
|
|
1,148
|
|
—
|
|
|
—
|
|
|
1,030
|
|
1,148
|
|
2,178
|
|
288
|
|
1996
|
12/04
|
|
40
|
|||||||
|
Temple, TX (n)
|
—
|
|
|
1,160
|
|
1,360
|
|
—
|
|
|
—
|
|
|
1,160
|
|
1,360
|
|
2,520
|
|
342
|
|
1998
|
12/04
|
|
40
|
|||||||
|
Fort Worth, TX
|
—
|
|
|
1,428
|
|
—
|
|
—
|
|
|
—
|
|
|
1,428
|
|
(i)
|
|
1,428
|
|
(i)
|
|
(i)
|
01/05
|
|
(i)
|
|||||||
|
Fort Worth, TX
|
—
|
|
|
510
|
|
1,128
|
|
—
|
|
|
—
|
|
|
510
|
|
1,128
|
|
1,638
|
|
281
|
|
1997
|
01/05
|
|
40
|
|||||||
|
Melbourne, FL
|
—
|
|
|
747
|
|
607
|
|
—
|
|
|
—
|
|
|
747
|
|
607
|
|
1,354
|
|
146
|
|
1970
|
05/05
|
|
40
|
|||||||
|
|
|
|
|
|
|
|||||||||||||||||||||||||||
|
University of Phoenix:
|
|
|
|
|
|
|||||||||||||||||||||||||||
|
Glen Allen, VA
|
—
|
|
|
2,177
|
|
2,600
|
|
670
|
|
|
—
|
|
|
2,177
|
|
3,270
|
|
5,447
|
|
1,309
|
|
1995
|
06/95
|
|
40
|
|||||||
|
|
|
|
|
|
|
|||||||||||||||||||||||||||
|
Vacant Land:
|
|
|
|
|
|
|||||||||||||||||||||||||||
|
Indianapolis, IN
|
—
|
|
|
640
|
|
1,107
|
|
62
|
|
|
—
|
|
|
700
|
|
(e)
|
|
700
|
|
(e)
|
|
(e)
|
12/01
|
|
(e)
|
|||||||
|
Southfield, MI
|
—
|
|
|
405
|
|
644
|
|
—
|
|
|
—
|
|
|
497
|
|
(e)
|
|
497
|
|
39
|
|
(e)
|
12/01
|
|
15
|
|||||||
|
Tucson, AZ
|
—
|
|
|
1,156
|
|
—
|
|
—
|
|
|
—
|
|
|
707
|
|
(e)
|
|
707
|
|
(e)
|
|
(e)
|
07/06
|
|
(e)
|
|||||||
|
Bonita Springs, FL
|
—
|
|
|
112
|
|
—
|
|
—
|
|
|
—
|
|
|
25
|
|
(e)
|
|
25
|
|
(e)
|
|
(e)
|
09/06
|
|
(e)
|
|||||||
|
Lancaster, OH
|
—
|
|
|
1,035
|
|
—
|
|
—
|
|
|
—
|
|
|
218
|
|
(e)
|
|
218
|
|
(e)
|
|
(e)
|
01/08
|
|
(e)
|
|||||||
|
Bakersfield, CA
|
—
|
|
|
3,303
|
|
3,845
|
|
—
|
|
|
—
|
|
|
1,826
|
|
(e)
|
|
1,826
|
|
(e)
|
|
(e)
|
03/08
|
|
(e)
|
|||||||
|
|
|
|
|
|
|
|||||||||||||||||||||||||||
|
Vacant Property:
|
|
|
|
|
|
|||||||||||||||||||||||||||
|
Orlando, FL
|
—
|
|
|
820
|
|
2,441
|
|
6
|
|
|
—
|
|
|
820
|
|
2,448
|
|
3,268
|
|
1,259
|
|
1992
|
05/93
|
|
40
|
|||||||
|
Homestead, PA
|
—
|
|
|
1,139
|
|
—
|
|
2,158
|
|
|
—
|
|
|
1,139
|
|
2,158
|
|
3,297
|
|
650
|
|
1994
|
02/97
|
|
31
|
|||||||
|
Kenosha, WI
|
—
|
|
|
1,918
|
|
3,431
|
|
—
|
|
|
—
|
|
|
1,918
|
|
3,431
|
|
5,349
|
|
1,529
|
|
1992
|
02/97
|
|
40
|
|||||||
|
Conyers, GA
|
—
|
|
|
320
|
|
556
|
|
—
|
|
|
—
|
|
|
320
|
|
556
|
|
876
|
|
244
|
|
1997
|
06/97
|
|
40
|
|||||||
|
Harlingen, TX
|
—
|
|
|
317
|
|
756
|
|
120
|
|
|
—
|
|
|
317
|
|
876
|
|
1,193
|
|
303
|
|
1999
|
11/98
|
(f)
|
40
|
|||||||
|
Alpharetta, GA
|
—
|
|
|
3,033
|
|
1,642
|
|
—
|
|
|
—
|
|
|
3,033
|
|
1,642
|
|
4,675
|
|
535
|
|
1999
|
12/01
|
|
40
|
|||||||
|
Burton, MI
|
—
|
|
|
620
|
|
707
|
|
—
|
|
|
—
|
|
|
620
|
|
707
|
|
1,327
|
|
231
|
|
1997
|
12/01
|
|
40
|
|||||||
|
Hammond, LA
|
—
|
|
|
248
|
|
814
|
|
62
|
|
|
—
|
|
|
248
|
|
627
|
|
875
|
|
217
|
|
1997
|
12/01
|
|
40
|
|||||||
|
Kennedale, TX
|
—
|
|
|
400
|
|
692
|
|
—
|
|
|
—
|
|
|
391
|
|
692
|
|
1,083
|
|
226
|
|
1985
|
12/01
|
|
40
|
|||||||
|
Lewisville, TX
|
—
|
|
|
1,370
|
|
1,019
|
|
—
|
|
|
—
|
|
|
1,370
|
|
1,019
|
|
2,389
|
|
332
|
|
1994
|
12/01
|
|
40
|
|||||||
|
Mesa, AZ
|
—
|
|
|
153
|
|
400
|
|
—
|
|
|
—
|
|
|
153
|
|
400
|
|
553
|
|
131
|
|
1997
|
12/01
|
|
40
|
|||||||
|
Montgomery, AL
|
—
|
|
|
1,418
|
|
1,140
|
|
—
|
|
|
—
|
|
|
1,418
|
|
1,044
|
|
2,462
|
|
347
|
|
1999
|
12/01
|
|
40
|
|||||||
|
S. Beaumont, TX
|
—
|
|
|
439
|
|
1,363
|
|
—
|
|
|
—
|
|
|
439
|
|
1,363
|
|
1,802
|
|
445
|
|
2000
|
12/01
|
|
40
|
|||||||
|
Swansea, IL
|
—
|
|
|
46
|
|
133
|
|
57
|
|
|
—
|
|
|
46
|
|
190
|
|
236
|
|
25
|
|
1997
|
12/01
|
(g)
|
40
|
|||||||
|
Tacoma, WA
|
—
|
|
|
527
|
|
795
|
|
—
|
|
|
—
|
|
|
527
|
|
795
|
|
1,322
|
|
259
|
|
1981
|
12/01
|
|
40
|
|||||||
See accompanying report of independent registered public accounting firm.
F-60
|
Initial Cost to
Company
|
Costs Capitalized
Subsequent to
Acquisition
|
Gross Amount at Which
Carried at Close of Period (a) (b)
|
Life on Which
Depreciation &
Amortization in Latest Income
Statement is
Computed (Years)
|
|||||||||||||||||||||||||||||
|
Encumbrances
|
Land
|
Building,
Improvements &
Leasehold
Interests
|
Improvements
|
Carrying
Costs
|
Land
|
Building,
Improvements &
Leasehold
Interests
|
Total
|
Accumulated
Depreciation
and
Amortization
|
Date of
Construction
|
Date
Acquired
|
||||||||||||||||||||||
|
Real Estate Held for Investment the Company has Invested in Under Operating Leases:
|
||||||||||||||||||||||||||||||||
|
Woodstock, GA
|
—
|
|
|
1,937
|
|
1,285
|
|
—
|
|
|
—
|
|
|
1,297
|
|
277
|
|
1,574
|
|
277
|
|
1997
|
05/03
|
|
40
|
|||||||
|
St. Louis, MO
|
—
|
|
|
556
|
|
3,688
|
|
—
|
|
|
—
|
|
|
556
|
|
3,688
|
|
4,244
|
|
965
|
|
1975
|
05/04
|
|
40
|
|||||||
|
Hudson Falls, NY
|
—
|
|
|
57
|
|
780
|
|
39
|
|
|
—
|
|
|
57
|
|
819
|
|
876
|
|
209
|
|
1990
|
09/04
|
|
40
|
|||||||
|
Columbus, OH
|
—
|
|
|
1,596
|
|
934
|
|
13
|
|
|
—
|
|
|
1,605
|
|
939
|
|
2,544
|
|
238
|
|
1970
|
11/04
|
|
40
|
|||||||
|
Fort Worth, TX
|
—
|
|
|
2,505
|
|
2,138
|
|
—
|
|
|
—
|
|
|
2,505
|
|
2,138
|
|
4,643
|
|
528
|
|
1988
|
02/05
|
|
40
|
|||||||
|
Fort Worth, TX
|
—
|
|
|
988
|
|
2,368
|
|
—
|
|
|
—
|
|
|
988
|
|
2,368
|
|
3,356
|
|
585
|
|
1997
|
02/05
|
|
40
|
|||||||
|
Dallas, PA
|
—
|
|
|
214
|
|
345
|
|
—
|
|
|
—
|
|
|
214
|
|
345
|
|
559
|
|
162
|
|
1995
|
08/05
|
|
20
|
|||||||
|
Abbottstown, PA
|
—
|
|
|
55
|
|
200
|
|
—
|
|
|
—
|
|
|
55
|
|
200
|
|
255
|
|
45
|
|
2000
|
01/06
|
|
40
|
|||||||
|
Carlisle, PA
|
—
|
|
|
87
|
|
103
|
|
—
|
|
|
—
|
|
|
87
|
|
103
|
|
190
|
|
22
|
|
1988
|
01/06
|
|
40
|
|||||||
|
Indianapolis, IN
|
—
|
|
|
223
|
|
483
|
|
59
|
|
|
—
|
|
|
223
|
|
542
|
|
765
|
|
214
|
|
1979
|
09/06
|
|
20
|
|||||||
|
Little Rock, AR
|
—
|
|
|
672
|
|
77
|
|
44
|
|
|
—
|
|
|
672
|
|
121
|
|
793
|
|
35
|
|
1979
|
09/06
|
|
20
|
|||||||
|
Farmington, NM
|
—
|
|
|
2,757
|
|
—
|
|
730
|
|
|
—
|
|
|
2,757
|
|
730
|
|
3,487
|
|
121
|
|
2003
|
12/07
|
(m)
|
40
|
|||||||
|
Bakersfield, CA
|
—
|
|
|
2,099
|
|
2,011
|
|
15
|
|
|
—
|
|
|
1,774
|
|
39
|
|
1,813
|
|
39
|
|
1990
|
03/08
|
|
40
|
|||||||
|
Lubbock, TX
|
—
|
|
|
943
|
|
957
|
|
—
|
|
|
—
|
|
|
943
|
|
957
|
|
1,900
|
|
197
|
|
1964
|
11/10
|
|
20
|
|||||||
|
Bristol, VA
|
—
|
|
|
63
|
|
184
|
|
—
|
|
|
—
|
|
|
63
|
|
184
|
|
247
|
|
1
|
|
2000
|
07/14
|
|
25
|
|||||||
|
|
|
|
|
|
|
|||||||||||||||||||||||||||
|
Value City Furniture:
|
|
|
|
|
|
|||||||||||||||||||||||||||
|
White Marsh, MD
|
—
|
|
|
3,762
|
|
—
|
|
3,006
|
|
|
—
|
|
|
3,762
|
|
3,006
|
|
6,768
|
|
1,262
|
|
1998
|
10/97
|
(g)
|
40
|
|||||||
|
|
|
|
|
|
|
|||||||||||||||||||||||||||
|
VCA Animal Hospital:
|
|
|
|
|
|
|||||||||||||||||||||||||||
|
Mission, KS
|
—
|
|
|
891
|
|
3,758
|
|
—
|
|
|
—
|
|
|
852
|
|
3,758
|
|
4,610
|
|
350
|
|
2000
|
03/12
|
|
30
|
|||||||
|
|
|
|
|
|
|
|||||||||||||||||||||||||||
|
Verizon Wireless:
|
|
|
|
|
|
|||||||||||||||||||||||||||
|
Anderson, SC (n)
|
—
|
|
|
38
|
|
—
|
|
—
|
|
|
—
|
|
|
38
|
|
—
|
|
38
|
|
(e)
|
|
(e)
|
07/14
|
|
35
|
|||||||
|
Bristol, VA
|
—
|
|
|
175
|
|
512
|
|
—
|
|
|
—
|
|
|
175
|
|
512
|
|
687
|
|
12
|
|
2000
|
07/14
|
|
25
|
|||||||
|
|
|
|
|
|
|
|||||||||||||||||||||||||||
|
Virginia College:
|
|
|
|
|
|
|||||||||||||||||||||||||||
|
Knoxville, TN
|
—
|
|
|
1,500
|
|
5,571
|
|
—
|
|
|
—
|
|
|
1,500
|
|
5,571
|
|
7,071
|
|
426
|
|
1996
|
09/12
|
|
30
|
|||||||
|
|
|
|
|
|
|
|||||||||||||||||||||||||||
|
Vitamin Shoppe, The:
|
|
|
|
|
|
|||||||||||||||||||||||||||
|
Cincinnati, OH
|
—
|
|
|
297
|
|
443
|
|
385
|
|
|
—
|
|
|
312
|
|
813
|
|
1,125
|
|
231
|
|
1999
|
06/98
|
|
40
|
|||||||
|
|
|
|
|
|
|
|||||||||||||||||||||||||||
|
Voodoo Skate Center:
|
|
|
|
|
|
|||||||||||||||||||||||||||
|
Aransas Pass, TX
|
—
|
|
|
90
|
|
1,241
|
|
137
|
|
|
—
|
|
|
89
|
|
1,378
|
|
1,467
|
|
504
|
|
1983
|
03/99
|
|
40
|
|||||||
See accompanying report of independent registered public accounting firm.
F-61
|
Initial Cost to
Company
|
Costs Capitalized
Subsequent to
Acquisition
|
Gross Amount at Which
Carried at Close of Period (a) (b)
|
Life on Which
Depreciation &
Amortization in Latest Income
Statement is
Computed (Years)
|
|||||||||||||||||||||||||||||
|
Encumbrances
|
Land
|
Building,
Improvements &
Leasehold
Interests
|
Improvements
|
Carrying
Costs
|
Land
|
Building,
Improvements &
Leasehold
Interests
|
Total
|
Accumulated
Depreciation
and
Amortization
|
Date of
Construction
|
Date
Acquired
|
||||||||||||||||||||||
|
Real Estate Held for Investment the Company has Invested in Under Operating Leases:
|
||||||||||||||||||||||||||||||||
|
Walgreens:
|
|
|
|
|
|
|||||||||||||||||||||||||||
|
Sunrise, FL
|
—
|
|
|
1,958
|
|
1,401
|
|
—
|
|
|
—
|
|
|
1,958
|
|
1,401
|
|
3,359
|
|
407
|
|
1994
|
05/03
|
|
40
|
|||||||
|
Tulsa, OK
|
—
|
|
|
1,193
|
|
3,056
|
|
—
|
|
|
—
|
|
|
1,193
|
|
3,056
|
|
4,249
|
|
729
|
|
2003
|
06/05
|
|
40
|
|||||||
|
Boise, ID
|
—
|
|
|
792
|
|
1,875
|
|
—
|
|
|
—
|
|
|
792
|
|
1,875
|
|
2,667
|
|
300
|
|
2000
|
03/10
|
|
30
|
|||||||
|
Nampa, ID
|
—
|
|
|
1,062
|
|
2,253
|
|
—
|
|
|
—
|
|
|
1,062
|
|
2,253
|
|
3,315
|
|
360
|
|
2000
|
03/10
|
|
30
|
|||||||
|
Pueblo, CO
|
—
|
|
|
899
|
|
3,313
|
|
—
|
|
|
—
|
|
|
899
|
|
3,313
|
|
4,212
|
|
336
|
|
2000
|
12/11
|
|
30
|
|||||||
|
Rapid City, SD
|
—
|
|
|
1,387
|
|
2,957
|
|
—
|
|
|
—
|
|
|
1,387
|
|
2,957
|
|
4,344
|
|
250
|
|
2000
|
01/12
|
|
35
|
|||||||
|
Hamilton, OH
|
—
|
|
|
731
|
|
2,879
|
|
—
|
|
|
—
|
|
|
731
|
|
2,879
|
|
3,610
|
|
284
|
|
2000
|
01/12
|
|
30
|
|||||||
|
|
|
|
|
|
|
|||||||||||||||||||||||||||
|
Waterford Nails & Spa:
|
|
|
|
|
|
|||||||||||||||||||||||||||
|
Orlando, FL
|
19
|
|
(h)
|
40
|
|
111
|
|
—
|
|
|
—
|
|
|
40
|
|
111
|
|
151
|
|
30
|
|
2001
|
02/04
|
|
40
|
|||||||
|
|
|
|
|
|
|
|||||||||||||||||||||||||||
|
Wawa:
|
|
|
|
|
|
|||||||||||||||||||||||||||
|
Clearwater, FL
|
—
|
|
|
1,184
|
|
2,526
|
|
44
|
|
|
—
|
|
|
1,476
|
|
(i)
|
|
1,476
|
|
(i)
|
|
(i)
|
05/93
|
|
(i)
|
|||||||
|
|
|
|
|
|
|
|||||||||||||||||||||||||||
|
Wehrenberg Theater:
|
|
|
|
|
|
|||||||||||||||||||||||||||
|
Cedar Rapids, IA
|
—
|
|
|
1,567
|
|
8,433
|
|
—
|
|
|
—
|
|
|
1,567
|
|
8,433
|
|
10,000
|
|
729
|
|
2011
|
07/11
|
|
40
|
|||||||
|
|
|
|
|
|
|
|||||||||||||||||||||||||||
|
Wendy's:
|
|
|
|
|
|
|||||||||||||||||||||||||||
|
Sacramento, CA
|
—
|
|
|
586
|
|
—
|
|
—
|
|
|
—
|
|
|
586
|
|
(i)
|
|
586
|
|
(i)
|
|
(i)
|
02/98
|
|
(i)
|
|||||||
|
New Kensington, PA (n)
|
—
|
|
|
501
|
|
333
|
|
—
|
|
|
—
|
|
|
501
|
|
333
|
|
834
|
|
109
|
|
1980
|
12/01
|
|
40
|
|||||||
|
Orland Park, IL
|
—
|
|
|
562
|
|
556
|
|
—
|
|
|
—
|
|
|
562
|
|
377
|
|
939
|
|
125
|
|
1995
|
12/01
|
|
40
|
|||||||
|
Boerne, TX
|
—
|
|
|
456
|
|
679
|
|
—
|
|
|
—
|
|
|
456
|
|
679
|
|
1,135
|
|
55
|
|
1986
|
12/12
|
|
25
|
|||||||
|
Brownsburg, IN
|
—
|
|
|
242
|
|
1,483
|
|
—
|
|
|
—
|
|
|
242
|
|
1,483
|
|
1,725
|
|
121
|
|
1984
|
12/12
|
|
25
|
|||||||
|
Converse, TX
|
—
|
|
|
301
|
|
554
|
|
—
|
|
|
—
|
|
|
301
|
|
554
|
|
855
|
|
32
|
|
2007
|
12/12
|
|
35
|
|||||||
|
Everett, WA
|
—
|
|
|
486
|
|
437
|
|
—
|
|
|
—
|
|
|
486
|
|
437
|
|
923
|
|
36
|
|
1979
|
12/12
|
|
25
|
|||||||
|
Everett, WA
|
—
|
|
|
339
|
|
1,018
|
|
—
|
|
|
—
|
|
|
339
|
|
1,018
|
|
1,357
|
|
69
|
|
2000
|
12/12
|
|
30
|
|||||||
|
Fishers, IN
|
—
|
|
|
544
|
|
514
|
|
—
|
|
|
—
|
|
|
544
|
|
514
|
|
1,058
|
|
35
|
|
2000
|
12/12
|
|
30
|
|||||||
|
Fishers, IN
|
—
|
|
|
766
|
|
717
|
|
—
|
|
|
—
|
|
|
766
|
|
717
|
|
1,483
|
|
49
|
|
1990
|
12/12
|
|
30
|
|||||||
|
Henderson, NV
|
—
|
|
|
398
|
|
1,028
|
|
—
|
|
|
—
|
|
|
398
|
|
1,028
|
|
1,426
|
|
70
|
|
1991
|
12/12
|
|
30
|
|||||||
|
Henderson, NV
|
—
|
|
|
370
|
|
311
|
|
—
|
|
|
—
|
|
|
370
|
|
311
|
|
681
|
|
25
|
|
1988
|
12/12
|
|
25
|
|||||||
|
Indianapolis, IN
|
—
|
|
|
281
|
|
1,018
|
|
—
|
|
|
—
|
|
|
281
|
|
1,018
|
|
1,299
|
|
69
|
|
1996
|
12/12
|
|
30
|
|||||||
|
Indianapolis, IN
|
—
|
|
|
320
|
|
602
|
|
—
|
|
|
—
|
|
|
320
|
|
602
|
|
922
|
|
41
|
|
1998
|
12/12
|
|
30
|
|||||||
|
Indianapolis, IN
|
—
|
|
|
271
|
|
1,221
|
|
—
|
|
|
—
|
|
|
271
|
|
1,221
|
|
1,492
|
|
100
|
|
1974
|
12/12
|
|
25
|
|||||||
See accompanying report of independent registered public accounting firm.
F-62
|
Initial Cost to
Company
|
Costs Capitalized
Subsequent to
Acquisition
|
Gross Amount at Which
Carried at Close of Period (a) (b)
|
Life on Which
Depreciation &
Amortization in Latest Income
Statement is
Computed (Years)
|
||||||||||||||||||||||||||||||||||||||
|
Encumbrances
|
Land
|
Building,
Improvements &
Leasehold
Interests
|
Improvements
|
Carrying
Costs
|
Land
|
Building,
Improvements &
Leasehold
Interests
|
Total
|
Accumulated
Depreciation
and
Amortization
|
Date of
Construction
|
Date
Acquired
|
|||||||||||||||||||||||||||||||
|
Real Estate Held for Investment the Company has Invested in Under Operating Leases:
|
|||||||||||||||||||||||||||||||||||||||||
|
Indianapolis, IN
|
—
|
|
|
252
|
|
1,454
|
|
—
|
|
|
—
|
|
|
252
|
|
1,454
|
|
1,706
|
|
99
|
|
1999
|
12/12
|
|
30
|
||||||||||||||||
|
Indianapolis, IN
|
—
|
|
|
213
|
|
1,444
|
|
—
|
|
|
—
|
|
|
213
|
|
1,444
|
|
1,657
|
|
84
|
|
2003
|
12/12
|
|
35
|
||||||||||||||||
|
Indianapolis, IN
|
—
|
|
|
87
|
|
1,009
|
|
—
|
|
|
—
|
|
|
87
|
|
1,009
|
|
1,096
|
|
82
|
|
1973
|
12/12
|
|
25
|
||||||||||||||||
|
Indianapolis, IN
|
—
|
|
|
320
|
|
1,086
|
|
—
|
|
|
—
|
|
|
320
|
|
1,086
|
|
1,406
|
|
74
|
|
1993
|
12/12
|
|
30
|
||||||||||||||||
|
Indianapolis, IN
|
—
|
|
|
417
|
|
1,318
|
|
—
|
|
|
—
|
|
|
417
|
|
1,318
|
|
1,735
|
|
90
|
|
1991
|
12/12
|
|
30
|
||||||||||||||||
|
Las Vegas, NV
|
—
|
|
|
475
|
|
1,202
|
|
—
|
|
|
—
|
|
|
475
|
|
1,202
|
|
1,677
|
|
98
|
|
1986
|
12/12
|
|
25
|
||||||||||||||||
|
Las Vegas, NV
|
—
|
|
|
360
|
|
253
|
|
—
|
|
|
—
|
|
|
360
|
|
253
|
|
613
|
|
21
|
|
1980
|
12/12
|
|
25
|
||||||||||||||||
|
Las Vegas, NV
|
—
|
|
|
368
|
|
1,095
|
|
—
|
|
|
—
|
|
|
368
|
|
1,095
|
|
1,463
|
|
75
|
|
1999
|
12/12
|
|
30
|
||||||||||||||||
|
Las Vegas, NV
|
—
|
|
|
475
|
|
1,182
|
|
—
|
|
|
—
|
|
|
475
|
|
1,182
|
|
1,657
|
|
80
|
|
1996
|
12/12
|
|
30
|
||||||||||||||||
|
Las Vegas, NV
|
—
|
|
|
533
|
|
1,424
|
|
—
|
|
|
—
|
|
|
533
|
|
1,424
|
|
1,957
|
|
97
|
|
2001
|
12/12
|
|
30
|
||||||||||||||||
|
Las Vegas, NV
|
—
|
|
|
368
|
|
1,018
|
|
—
|
|
|
—
|
|
|
368
|
|
1,018
|
|
1,386
|
|
69
|
|
2001
|
12/12
|
|
30
|
||||||||||||||||
|
Lynnwood, WA
|
—
|
|
|
571
|
|
1,695
|
|
—
|
|
|
—
|
|
|
571
|
|
1,695
|
|
2,266
|
|
138
|
|
1978
|
12/12
|
|
25
|
||||||||||||||||
|
N. Las Vegas, NV
|
—
|
|
|
310
|
|
1,463
|
|
—
|
|
|
—
|
|
|
310
|
|
1,463
|
|
1,773
|
|
85
|
|
2001
|
12/12
|
|
35
|
||||||||||||||||
|
Noblesville, IN
|
—
|
|
|
582
|
|
979
|
|
—
|
|
|
—
|
|
|
582
|
|
979
|
|
1,561
|
|
67
|
|
1998
|
12/12
|
|
30
|
||||||||||||||||
|
Port Orchard, WA
|
—
|
|
|
784
|
|
1,540
|
|
—
|
|
|
—
|
|
|
784
|
|
1,540
|
|
2,324
|
|
105
|
|
1996
|
12/12
|
|
30
|
||||||||||||||||
|
Poulsbo, WA
|
—
|
|
|
620
|
|
901
|
|
—
|
|
|
—
|
|
|
620
|
|
901
|
|
1,521
|
|
46
|
|
2012
|
12/12
|
|
40
|
||||||||||||||||
|
San Antonio, TX
|
—
|
|
|
553
|
|
892
|
|
—
|
|
|
—
|
|
|
303
|
|
892
|
|
1,195
|
|
73
|
|
1986
|
12/12
|
|
25
|
||||||||||||||||
|
San Antonio, TX
|
—
|
|
|
688
|
|
727
|
|
—
|
|
|
—
|
|
|
688
|
|
727
|
|
1,415
|
|
49
|
|
1993
|
12/12
|
|
30
|
||||||||||||||||
|
San Antonio, TX
|
—
|
|
|
242
|
|
1,067
|
|
—
|
|
|
—
|
|
|
242
|
|
1,067
|
|
1,309
|
|
87
|
|
1977
|
12/12
|
|
25
|
||||||||||||||||
|
San Antonio, TX
|
—
|
|
|
931
|
|
223
|
|
—
|
|
|
—
|
|
|
931
|
|
223
|
|
1,154
|
|
15
|
|
1993
|
12/12
|
|
30
|
||||||||||||||||
|
San Antonio, TX
|
—
|
|
|
370
|
|
272
|
|
—
|
|
|
—
|
|
|
370
|
|
272
|
|
642
|
|
19
|
|
1993
|
12/12
|
|
30
|
||||||||||||||||
|
Lexington Park, MD
|
—
|
|
|
327
|
|
773
|
|
—
|
|
|
—
|
|
|
327
|
|
773
|
|
1,100
|
|
12
|
|
1982
|
07/14
|
|
30
|
||||||||||||||||
|
|
|
|
|
|
|
||||||||||||||||||||||||||||||||||||
|
Whataburger:
|
|
|
|
|
|
||||||||||||||||||||||||||||||||||||
|
Albuquerque, NM
|
—
|
|
|
624
|
|
419
|
|
—
|
|
|
—
|
|
|
624
|
|
419
|
|
1,043
|
|
137
|
|
1995
|
12/01
|
|
40
|
||||||||||||||||
|
|
|
|
|
|
|
||||||||||||||||||||||||||||||||||||
|
Wherehouse Music:
|
|
|
|
|
|
||||||||||||||||||||||||||||||||||||
|
Homewood, AL
|
—
|
|
|
1,032
|
|
697
|
|
—
|
|
|
—
|
|
|
1,032
|
|
697
|
|
1,729
|
|
227
|
|
1997
|
12/01
|
|
40
|
||||||||||||||||
|
Independence, MO
|
—
|
|
|
503
|
|
1,209
|
|
—
|
|
|
—
|
|
|
503
|
|
1,209
|
|
1,712
|
|
273
|
|
1994
|
12/05
|
|
40
|
||||||||||||||||
|
|
|
|
|
|
|
||||||||||||||||||||||||||||||||||||
|
Wingfoot:
|
|
|
|
|
|
||||||||||||||||||||||||||||||||||||
|
Anthony, TX
|
—
|
|
|
(l)
|
|
1,242
|
|
6
|
|
|
—
|
|
|
(l)
|
|
1,248
|
|
1,248
|
|
232
|
|
2007
|
02/07
|
|
40
|
||||||||||||||||
|
Beaverdam, OH
|
—
|
|
|
(l)
|
|
1,521
|
|
—
|
|
|
—
|
|
|
(l)
|
|
1,521
|
|
1,521
|
|
290
|
|
2004
|
05/07
|
|
40
|
||||||||||||||||
|
Benton, AR
|
—
|
|
|
(l)
|
|
309
|
|
—
|
|
|
—
|
|
|
(l)
|
|
309
|
|
309
|
|
58
|
|
2001
|
05/07
|
|
40
|
||||||||||||||||
See accompanying report of independent registered public accounting firm.
F-63
|
Initial Cost to
Company
|
Costs Capitalized
Subsequent to
Acquisition
|
Gross Amount at Which
Carried at Close of Period (a) (b)
|
Life on Which
Depreciation &
Amortization in Latest Income
Statement is
Computed (Years)
|
||||||||||||||||||||||||||||||||||||||
|
Encumbrances
|
Land
|
Building,
Improvements &
Leasehold
Interests
|
Improvements
|
Carrying
Costs
|
Land
|
Building,
Improvements &
Leasehold
Interests
|
Total
|
Accumulated
Depreciation
and
Amortization
|
Date of
Construction
|
Date
Acquired
|
|||||||||||||||||||||||||||||||
|
Real Estate Held for Investment the Company has Invested in Under Operating Leases:
|
|||||||||||||||||||||||||||||||||||||||||
|
Bowman, SC
|
—
|
|
|
(l)
|
|
969
|
|
—
|
|
|
—
|
|
|
(l)
|
|
969
|
|
969
|
|
211
|
|
1998
|
05/07
|
|
35
|
||||||||||||||||
|
Dalton, GA
|
—
|
|
|
(l)
|
|
1,541
|
|
—
|
|
|
—
|
|
|
(l)
|
|
1,541
|
|
1,541
|
|
294
|
|
2004
|
05/07
|
|
40
|
||||||||||||||||
|
Dandridge, TN
|
—
|
|
|
(l)
|
|
1,030
|
|
—
|
|
|
—
|
|
|
(l)
|
|
1,030
|
|
1,030
|
|
224
|
|
1989
|
05/07
|
|
35
|
||||||||||||||||
|
Franklin, OH
|
—
|
|
|
(l)
|
|
563
|
|
—
|
|
|
—
|
|
|
(l)
|
|
563
|
|
563
|
|
123
|
|
1998
|
05/07
|
|
35
|
||||||||||||||||
|
Gary, IN
|
—
|
|
|
(l)
|
|
1,486
|
|
—
|
|
|
—
|
|
|
(l)
|
|
1,486
|
|
1,486
|
|
283
|
|
2004
|
05/07
|
|
40
|
||||||||||||||||
|
Georgetown, KY
|
—
|
|
|
(l)
|
|
679
|
|
—
|
|
|
—
|
|
|
(l)
|
|
679
|
|
679
|
|
173
|
|
1997
|
05/07
|
|
30
|
||||||||||||||||
|
Mebane, NC
|
—
|
|
|
(l)
|
|
561
|
|
—
|
|
|
—
|
|
|
(l)
|
|
561
|
|
561
|
|
122
|
|
1998
|
05/07
|
|
35
|
||||||||||||||||
|
Piedmont, SC
|
—
|
|
|
(l)
|
|
567
|
|
—
|
|
|
—
|
|
|
(l)
|
|
567
|
|
567
|
|
123
|
|
1999
|
05/07
|
|
35
|
||||||||||||||||
|
Port Wentworth, GA
|
—
|
|
|
(l)
|
|
552
|
|
—
|
|
|
—
|
|
|
(l)
|
|
552
|
|
552
|
|
120
|
|
1998
|
05/07
|
|
35
|
||||||||||||||||
|
Valdosta, GA
|
—
|
|
|
(l)
|
|
1,477
|
|
—
|
|
|
—
|
|
|
(l)
|
|
1,477
|
|
1,477
|
|
282
|
|
2004
|
05/07
|
|
40
|
||||||||||||||||
|
Temple, GA
|
—
|
|
|
(l)
|
|
1,065
|
|
—
|
|
|
—
|
|
|
(l)
|
|
1,065
|
|
1,065
|
|
190
|
|
2007
|
06/07
|
|
40
|
||||||||||||||||
|
Whiteland, IN
|
—
|
|
|
(l)
|
|
1,471
|
|
—
|
|
|
—
|
|
|
(l)
|
|
1,471
|
|
1,471
|
|
274
|
|
2004
|
07/07
|
|
40
|
||||||||||||||||
|
Des Moines, IA
|
—
|
|
|
(l)
|
|
816
|
|
—
|
|
|
—
|
|
|
(l)
|
|
816
|
|
816
|
|
152
|
|
1987
|
07/07
|
|
40
|
||||||||||||||||
|
Robinson, TX
|
—
|
|
|
(l)
|
|
1,183
|
|
—
|
|
|
—
|
|
|
(l)
|
|
1,183
|
|
1,183
|
|
211
|
|
2007
|
07/07
|
|
40
|
||||||||||||||||
|
Kearney, MO
|
—
|
|
|
(l)
|
|
1,269
|
|
—
|
|
|
—
|
|
|
(l)
|
|
1,269
|
|
1,269
|
|
237
|
|
2003
|
07/07
|
|
40
|
||||||||||||||||
|
Oklahoma City, OK
|
—
|
|
|
(l)
|
|
1,247
|
|
—
|
|
|
—
|
|
|
(l)
|
|
1,247
|
|
1,247
|
|
214
|
|
2008
|
08/07
|
|
40
|
||||||||||||||||
|
Amarillo, TX
|
—
|
|
|
(l)
|
|
1,158
|
|
—
|
|
|
—
|
|
|
(l)
|
|
1,158
|
|
1,158
|
|
189
|
|
2008
|
02/08
|
|
40
|
||||||||||||||||
|
Jackson, MS
|
—
|
|
|
(l)
|
|
1,281
|
|
—
|
|
|
—
|
|
|
(l)
|
|
1,281
|
|
1,281
|
|
207
|
|
2008
|
03/08
|
|
40
|
||||||||||||||||
|
Glendale, KY
|
—
|
|
|
(l)
|
|
1,066
|
|
—
|
|
|
—
|
|
|
(l)
|
|
1,066
|
|
1,066
|
|
165
|
|
2008
|
07/08
|
|
40
|
||||||||||||||||
|
Lebanon, TN
|
—
|
|
|
(l)
|
|
1,331
|
|
—
|
|
|
—
|
|
|
(l)
|
|
1,331
|
|
1,331
|
|
201
|
|
2008
|
08/08
|
|
40
|
||||||||||||||||
|
Laredo, TX
|
—
|
|
|
(l)
|
|
1,238
|
|
—
|
|
|
—
|
|
|
(l)
|
|
1,238
|
|
1,238
|
|
179
|
|
2009
|
11/08
|
(j)
|
40
|
||||||||||||||||
|
Midland, TX
|
—
|
|
|
(l)
|
|
1,148
|
|
—
|
|
|
—
|
|
|
(l)
|
|
1,148
|
|
1,148
|
|
128
|
|
2010
|
04/10
|
(j)
|
40
|
||||||||||||||||
|
Tuscaloosa, AL
|
—
|
|
|
(l)
|
|
1,002
|
|
—
|
|
|
—
|
|
|
(l)
|
|
1,002
|
|
1,002
|
|
101
|
|
2010
|
08/10
|
(j)
|
40
|
||||||||||||||||
|
Kenly, NC
|
—
|
|
|
(l)
|
|
1,066
|
|
—
|
|
|
—
|
|
|
(l)
|
|
1,066
|
|
1,066
|
|
103
|
|
2011
|
11/10
|
(j)
|
40
|
||||||||||||||||
|
Matthews, MO
|
—
|
|
|
(l)
|
|
1,042
|
|
50
|
|
|
—
|
|
|
(l)
|
|
1,092
|
|
1,092
|
|
96
|
|
2011
|
01/11
|
(j)
|
40
|
||||||||||||||||
|
Baytown, TX
|
—
|
|
|
(l)
|
|
—
|
|
1,375
|
|
|
—
|
|
|
(l)
|
|
1,375
|
|
1,375
|
|
116
|
|
2011
|
05/11
|
(j)
|
40
|
||||||||||||||||
|
Sunbury, OH
|
—
|
|
|
(l)
|
|
—
|
|
1,424
|
|
|
—
|
|
|
(l)
|
|
1,424
|
|
1,424
|
|
108
|
|
2011
|
06/11
|
(j)
|
40
|
||||||||||||||||
|
Greenwood, LA
|
—
|
|
|
(l)
|
|
—
|
|
1,291
|
|
|
—
|
|
|
(l)
|
|
1,291
|
|
1,291
|
|
101
|
|
2011
|
06/11
|
(j)
|
40
|
||||||||||||||||
|
Joplin, MO
|
—
|
|
|
(l)
|
|
—
|
|
1,168
|
|
|
—
|
|
|
(l)
|
|
1,168
|
|
1,168
|
|
91
|
|
2011
|
06/11
|
(j)
|
40
|
||||||||||||||||
|
Winslow, AZ
|
—
|
|
|
(l)
|
|
—
|
|
1,613
|
|
|
—
|
|
|
(l)
|
|
1,613
|
|
1,613
|
|
116
|
|
2012
|
09/11
|
(j)
|
40
|
||||||||||||||||
|
Gulfport, MS
|
—
|
|
|
(l)
|
|
—
|
|
1,377
|
|
|
—
|
|
|
(l)
|
|
1,377
|
|
1,377
|
|
93
|
|
2012
|
11/11
|
(j)
|
40
|
||||||||||||||||
|
Sulphur Springs, TX
|
—
|
|
|
(l)
|
|
—
|
|
1,283
|
|
|
—
|
|
|
(l)
|
|
1,283
|
|
1,283
|
|
84
|
|
2012
|
12/11
|
(j)
|
40
|
||||||||||||||||
|
|
|
|
|
|
|
||||||||||||||||||||||||||||||||||||
See accompanying report of independent registered public accounting firm.
F-64
|
Initial Cost to
Company
|
Costs Capitalized
Subsequent to
Acquisition
|
Gross Amount at Which
Carried at Close of Period (a) (b)
|
Life on Which
Depreciation &
Amortization in Latest Income
Statement is
Computed (Years)
|
||||||||||||||||||||||||||||||||||||||
|
Encumbrances
|
Land
|
Building,
Improvements &
Leasehold
Interests
|
Improvements
|
Carrying
Costs
|
Land
|
Building,
Improvements &
Leasehold
Interests
|
Total
|
Accumulated
Depreciation
and
Amortization
|
Date of
Construction
|
Date
Acquired
|
|||||||||||||||||||||||||||||||
|
Real Estate Held for Investment the Company has Invested in Under Operating Leases:
|
|||||||||||||||||||||||||||||||||||||||||
|
Winn-Dixie:
|
|
|
|
|
|
||||||||||||||||||||||||||||||||||||
|
Columbus, GA
|
—
|
|
|
1,023
|
|
1,875
|
|
—
|
|
|
—
|
|
|
1,023
|
|
1,875
|
|
2,898
|
|
537
|
|
1984
|
07/03
|
|
40
|
||||||||||||||||
|
|
|
|
|
|
|
||||||||||||||||||||||||||||||||||||
|
Wireless Wizard:
|
|
|
|
|
|
||||||||||||||||||||||||||||||||||||
|
Ridgeland, MS
|
—
|
|
|
436
|
|
523
|
|
133
|
|
|
—
|
|
|
436
|
|
656
|
|
1,092
|
|
134
|
|
1997
|
08/06
|
|
40
|
||||||||||||||||
|
|
|
|
|
|
|
||||||||||||||||||||||||||||||||||||
|
Your Choice:
|
|
|
|
|
|
||||||||||||||||||||||||||||||||||||
|
Hazleton, PA
|
—
|
|
|
670
|
|
377
|
|
—
|
|
|
—
|
|
|
670
|
|
377
|
|
1,047
|
|
177
|
|
1974
|
08/05
|
|
20
|
||||||||||||||||
|
Montoursville, PA
|
—
|
|
|
158
|
|
415
|
|
13
|
|
|
—
|
|
|
158
|
|
428
|
|
586
|
|
95
|
|
1988
|
01/06
|
|
40
|
||||||||||||||||
|
|
|
|
|
|
|
||||||||||||||||||||||||||||||||||||
|
Ziebart:
|
|
|
|
|
|
||||||||||||||||||||||||||||||||||||
|
Maplewood, MN
|
—
|
|
|
308
|
|
311
|
|
—
|
|
|
—
|
|
|
308
|
|
311
|
|
619
|
|
77
|
|
1990
|
02/05
|
|
40
|
||||||||||||||||
|
Middleburg Heights, OH
|
—
|
|
|
199
|
|
148
|
|
—
|
|
|
—
|
|
|
199
|
|
148
|
|
347
|
|
37
|
|
1961
|
02/05
|
|
40
|
||||||||||||||||
|
|
|
|
|
|
|
||||||||||||||||||||||||||||||||||||
|
Zio's Italian Kitchen:
|
|
|
|
|
|
||||||||||||||||||||||||||||||||||||
|
Aurora, CO
|
—
|
|
|
1,168
|
|
1,105
|
|
—
|
|
|
—
|
|
|
1,168
|
|
1,105
|
|
2,273
|
|
351
|
|
2000
|
06/05
|
|
30
|
||||||||||||||||
|
|
|
|
|
|
|
||||||||||||||||||||||||||||||||||||
|
Leasehold Interests:
|
|
|
|
|
|
||||||||||||||||||||||||||||||||||||
|
Lima, OH
|
—
|
|
|
1,290
|
|
—
|
|
—
|
|
|
—
|
|
|
1,290
|
|
(e)
|
|
1,290
|
|
1,254
|
|
(e)
|
08/01
|
|
(e)
|
||||||||||||||||
|
SUBTOTAL
|
$
|
26,000
|
|
|
$
|
1,787,519
|
|
$
|
2,915,411
|
|
$
|
536,524
|
|
$
|
—
|
|
$
|
1,785,779
|
|
$
|
3,414,698
|
|
$
|
5,200,477
|
|
$
|
511,702
|
|
|
|
|||||||||||
See accompanying report of independent registered public accounting firm.
F-65
|
Initial Cost to
Company
|
Costs Capitalized
Subsequent to
Acquisition
|
Gross Amount at Which
Carried at Close of Period (a) (b)
|
Life on Which
Depreciation &
Amortization in Latest Income
Statement is
Computed (Years)
|
|||||||||||||||||||||||||||||||||||
|
Encumbrances
|
Land
|
Building,
Improvements &
Leasehold
Interests
|
Improvements
|
Carrying
Costs
|
Land
|
Building,
Improvements &
Leasehold
Interests
|
Total
|
Accumulated
Depreciation
and
Amortization
|
Date of
Construction
|
Date
Acquired
|
||||||||||||||||||||||||||||
|
Real Estate Held for Investment the Company has Invested in Under Direct Financing Leases:
|
||||||||||||||||||||||||||||||||||||||
|
CVS:
|
|
|
|
|
|
|
|
|
|
|
|
|
|
|
||||||||||||||||||||||||
|
Lafayette, LA
|
$
|
—
|
|
|
$
|
—
|
|
$
|
949
|
|
$
|
—
|
|
|
$
|
—
|
|
|
$
|
—
|
|
(c)
|
|
(c)
|
|
(c)
|
|
1995
|
01/96
|
|
(c)
|
|||||||
|
Oklahoma City, OK
|
—
|
|
(l)
|
|
1,365
|
|
—
|
|
—
|
|
(l)
|
|
(c)
|
|
(c)
|
|
(c)
|
|
1997
|
06/97
|
|
(c)
|
||||||||||||||||
|
Oklahoma City, OK
|
—
|
|
|
(l)
|
|
1,419
|
|
—
|
|
|
—
|
|
|
(l)
|
|
(c)
|
|
(c)
|
|
(c)
|
|
1997
|
06/97
|
|
(c)
|
|||||||||||||
|
|
|
|
|
|
|
|
|
|
|
|
|
|
||||||||||||||||||||||||||
|
Denny's:
|
|
|
|
|
|
|
|
|
|
|
|
|
||||||||||||||||||||||||||
|
Stockton, CA
|
—
|
|
|
940
|
|
509
|
|
—
|
|
|
—
|
|
|
(d)
|
|
(d)
|
|
(d)
|
|
(d)
|
|
1982
|
09/06
|
|
(d)
|
|||||||||||||
|
|
|
|
|
|
|
|
|
|
|
|
|
|
||||||||||||||||||||||||||
|
Food 4 Less:
|
|
|
|
|
|
|
|
|
|
|
|
|
|
|
|
|
||||||||||||||||||||||
|
Chula Vista, CA
|
—
|
|
|
—
|
|
4,266
|
|
—
|
|
|
—
|
|
|
—
|
|
(c)
|
|
(c)
|
|
(c)
|
|
1995
|
11/98
|
|
(c)
|
|||||||||||||
|
|
|
|
|
|
|
|
|
|
|
|
|
|
|
|
|
|
|
|
|
|
|
|
|
|||||||||||||||
|
Jared Jewelers:
|
|
|
|
|
|
|
|
|
|
|
|
|
|
|
||||||||||||||||||||||||
|
Phoenix, AZ
|
—
|
|
|
(l)
|
|
1,242
|
|
—
|
|
|
—
|
|
|
(l)
|
|
(c)
|
|
(c)
|
|
(c)
|
|
1998
|
12/01
|
|
(c)
|
|||||||||||||
|
Toledo, OH
|
—
|
|
|
(l)
|
|
1,458
|
|
—
|
|
|
—
|
|
|
(l)
|
|
(c)
|
|
(c)
|
|
(c)
|
|
1998
|
12/01
|
|
(c)
|
|||||||||||||
|
Lewisville, TX
|
116
|
|
(k)
|
(l)
|
|
1,503
|
|
—
|
|
|
—
|
|
|
(l)
|
|
(c)
|
|
(c)
|
|
(c)
|
|
1998
|
12/01
|
|
(c)
|
|||||||||||||
|
Glendale, AZ
|
—
|
|
|
(l)
|
|
1,599
|
|
—
|
|
|
—
|
|
|
(l)
|
|
(c)
|
|
(c)
|
|
(c)
|
|
1998
|
12/01
|
|
(c)
|
|||||||||||||
|
Oviedo, FL
|
223
|
|
(k)
|
—
|
|
1,500
|
|
—
|
|
|
—
|
|
|
—
|
|
(c)
|
|
(c)
|
|
(c)
|
|
1998
|
06/13
|
|
(c)
|
|||||||||||||
|
|
|
|
|
|
|
|
|
|
|
|
|
|
|
|
|
|
||||||||||||||||||||||
|
Kash n' Karry:
|
|
|
|
|
|
|
|
|
|
|
|
|
|
|
||||||||||||||||||||||||
|
Valrico, FL
|
—
|
|
|
1,235
|
|
3,255
|
|
—
|
|
|
—
|
|
|
(d)
|
|
(d)
|
|
(d)
|
|
(d)
|
|
1997
|
06/02
|
|
(d)
|
|||||||||||||
|
|
|
|
|
|
|
|
|
|
|
|
|
|
|
|
|
|
||||||||||||||||||||||
|
Rite Aid:
|
|
|
|
|
|
|
|
|
|
|
|
|
|
|
|
|
||||||||||||||||||||||
|
Kennett Square, PA
|
—
|
|
|
(l)
|
|
—
|
|
1,984
|
|
|
—
|
|
|
(l)
|
|
(c)
|
|
(c)
|
|
(c)
|
|
2000
|
12/00
|
|
(c)
|
|||||||||||||
|
Arlington, VA
|
—
|
|
|
(l)
|
|
3,201
|
|
—
|
|
|
—
|
|
|
(l)
|
|
(c)
|
|
(c)
|
|
(c)
|
|
2000
|
02/02
|
|
(c)
|
|||||||||||||
|
|
|
|
|
|
|
|
|
|
|
|
|
|
|
|
||||||||||||||||||||||||
|
Sunshine Energy:
|
|
|
|
|
|
|
|
|
|
|
|
|
|
|
|
|||||||||||||||||||||||
|
Altamont, KS
|
—
|
|
|
124
|
|
142
|
|
—
|
|
|
—
|
|
|
(d)
|
|
(d)
|
|
(d)
|
|
(d)
|
|
1979
|
07/09
|
|
(d)
|
|||||||||||||
|
SUBTOTAL
|
$
|
339
|
|
|
$
|
2,299
|
|
$
|
22,408
|
|
$
|
1,984
|
|
$
|
—
|
|
$
|
—
|
|
—
|
|
—
|
|
—
|
|
|||||||||||||
See accompanying report of independent registered public accounting firm.
F-66
|
Initial Cost to
Company
|
Costs Capitalized
Subsequent to
Acquisition
|
Gross Amount at Which
Carried at Close of Period (a) (b)
|
Life on Which
Depreciation &
Amortization in Latest Income
Statement is
Computed (Years)
|
||||||||||||||||||||||||||||||||||||||
|
Encumbrances
|
Land
|
Building,
Improvements &
Leasehold
Interests
|
Improvements
|
Carrying
Costs
|
Land
|
Building,
Improvements &
Leasehold
Interests
|
Total
|
Accumulated
Depreciation
and
Amortization
|
Date of
Construction
|
Date
Acquired
|
|||||||||||||||||||||||||||||||
|
Real Estate Held for Sale the Company has Invested in:
|
|||||||||||||||||||||||||||||||||||||||||
|
7-Eleven:
|
|
|
|
|
|
|
|
|
|
|
|
|
|
|
|||||||||||||||||||||||||||
|
Latrobe, PA
|
$
|
—
|
|
|
$
|
613
|
|
$
|
326
|
|
$
|
—
|
|
$
|
—
|
|
$
|
613
|
|
$
|
326
|
|
$
|
939
|
|
$
|
—
|
|
1989
|
07/14
|
|
—
|
|||||||||
|
|
|
|
|
|
|
||||||||||||||||||||||||||||||||||||
|
Chipotle:
|
|
|
|
|
|
||||||||||||||||||||||||||||||||||||
|
Hadley, MA
|
—
|
|
|
45
|
|
—
|
|
—
|
|
|
—
|
|
|
453
|
|
—
|
|
453
|
|
(e)
|
|
(e)
|
02/08
|
|
—
|
||||||||||||||||
|
|
|
|
|
|
|
||||||||||||||||||||||||||||||||||||
|
Power Center:
|
|
|
|
|
|
||||||||||||||||||||||||||||||||||||
|
Irving, TX
|
—
|
|
|
951
|
|
1,090
|
|
—
|
|
|
—
|
|
|
600
|
|
602
|
|
1,202
|
|
—
|
|
1987
|
02/06
|
|
—
|
||||||||||||||||
|
|
|
|
|
|
|
||||||||||||||||||||||||||||||||||||
|
Vacant Land:
|
|
|
|
|
|
||||||||||||||||||||||||||||||||||||
|
Grand Prairie, TX
|
—
|
|
|
387
|
|
—
|
|
—
|
|
|
—
|
|
|
108
|
|
—
|
|
108
|
|
(e)
|
|
(e)
|
12/02
|
|
—
|
||||||||||||||||
|
Rockwall, TX
|
—
|
|
|
900
|
|
—
|
|
—
|
|
|
—
|
|
|
545
|
|
—
|
|
545
|
|
(e)
|
|
(e)
|
02/06
|
|
—
|
||||||||||||||||
|
Hadley, MA
|
—
|
|
|
2,824
|
|
—
|
|
—
|
|
|
—
|
|
|
106
|
|
—
|
|
106
|
|
(e)
|
|
(e)
|
02/08
|
|
—
|
||||||||||||||||
|
|
|
|
|
|
|
||||||||||||||||||||||||||||||||||||
|
Vacant Property:
|
|
|
|
|
|
||||||||||||||||||||||||||||||||||||
|
Arlington, TX
|
—
|
|
|
596
|
|
1,411
|
|
—
|
|
|
—
|
|
|
596
|
|
1,411
|
|
2,007
|
|
720
|
|
1994
|
01/94
|
(r)
|
40
|
||||||||||||||||
|
Corpus Christi, TX
|
—
|
|
224
|
|
2,159
|
|
145
|
|
—
|
|
224
|
|
1,282
|
|
1,506
|
|
753
|
|
1983
|
03/99
|
(r)
|
40
|
|||||||||||||||||||
|
SUBTOTAL
|
$
|
—
|
|
|
$
|
6,540
|
|
$
|
4,986
|
|
$
|
145
|
|
$
|
—
|
|
$
|
3,245
|
|
$
|
3,621
|
|
$
|
6,866
|
|
$
|
1,473
|
|
|
|
|
||||||||||
See accompanying report of independent registered public accounting firm.
F-67
NATIONAL RETAIL PROPERTIES, INC. AND SUBSIDIARIES
NOTES TO SCHEDULE III - REAL ESTATE AND ACCUMULATED DEPRECIATION AND AMORTIZATION
December 31, 2014
(dollars in thousands)
|
(a)
|
Transactions in real estate and accumulated depreciation during
2014
,
2013
, and
2012
are summarized as follows:
|
|
2014
|
2013
|
2012
|
|||||||||
|
Land, buildings, and leasehold interests:
|
|||||||||||
|
Balance at the beginning of year
|
$
|
4,686,844
|
|
$
|
4,145,368
|
|
$
|
3,531,845
|
|
||
|
Acquisitions, completed construction and tenant improvements
|
601,168
|
|
602,836
|
|
701,054
|
|
|||||
|
Disposition of land, buildings, and leasehold interests
|
(50,938
|
)
|
(57,254
|
)
|
(77,219
|
)
|
|||||
|
Provision for loss on impairment of real estate
|
(823
|
)
|
(4,106
|
)
|
(10,312
|
)
|
|||||
|
Balance at the close of year
|
$
|
5,236,251
|
|
$
|
4,686,844
|
|
$
|
4,145,368
|
|
||
|
Accumulated depreciation and amortization:
|
|||||||||||
|
Balance at the beginning of year
|
$
|
418,136
|
|
$
|
333,778
|
|
$
|
270,621
|
|
||
|
Disposition of land, buildings, and leasehold interests
|
(9,153
|
)
|
(6,778
|
)
|
(6,980
|
)
|
|||||
|
Depreciation and amortization expense
|
104,192
|
|
91,136
|
|
70,137
|
|
|||||
|
Balance at the close of year
|
$
|
513,175
|
|
$
|
418,136
|
|
$
|
333,778
|
|
||
As of
December 31, 2014
,
2013
, and
2012
, the detailed real estate schedule excludes work in progress of
$28,908
,
$60,720
and
$86,579
, respectively, which is included in the above reconciliation.
|
(b)
|
As of
December 31, 2014
, the leases are treated as either operating or financing leases for federal income tax purposes. As of
December 31, 2014
, the aggregate cost of the properties owned by NNN that are under operating leases were
$5,119,673
and financing leases were
$2,703
.
|
|
(c)
|
For financial reporting purposes, the portion of the lease relating to the building has been recorded as a direct financing lease; therefore, depreciation is not applicable.
|
|
(d)
|
For financial reporting purposes, the lease for the land and building has been recorded as a direct financing lease; therefore, depreciation is not applicable.
|
|
(e)
|
NNN owns only the land for this property.
|
|
(f)
|
Date acquired represents acquisition date of land. Pursuant to lease agreement, NNN purchased the buildings from the tenants upon completion of construction, generally within 12 months from the acquisition of the land.
|
|
(g)
|
Date acquired represents acquisition date of land. NNN developed the buildings, generally completing construction within 12 months from the acquisition date of the land.
|
|
(h)
|
Property is encumbered as a part of NNN's
$6,952
long-term, fixed rate mortgage and security agreement.
|
|
(i)
|
NNN owns only the land for this property, which is subject to a ground lease between NNN and the tenant. The tenant funded the improvements on the property.
|
|
(j)
|
The land is subject to a ground lease between NNN and an unrelated third party. Pursuant to the lease agreement, NNN funds the tenant’s construction draws, final funding occurs generally within 12 months from the execution of the ground lease.
|
|
(k)
|
NNN owns only the building for this property, which is encumbered by a fixed rate mortgage and security agreement.
|
|
(l)
|
NNN owns only the building for this property. The land is subject to a ground lease between NNN and an unrelated third party.
|
|
(m)
|
Date acquired represents acquisition date of land. Pursuant to lease agreement, NNN funds the tenant’s construction draws, final funding occurs generally within 12 months from the acquisition of the land.
|
See accompanying report of independent registered public accounting firm.
F-68
|
(n)
|
The tenant of this property has subleased the property. The tenant continues to be responsible for complying with all the terms of the lease agreement and is continuing to pay rent on this property to NNN.
|
|
(o)
|
Date acquired represents acquisition date of land and building. Pursuant to lease agreement, NNN funds additional tenant construction draws. Final funding generally within 12 months from acquisition.
|
|
(p)
|
Property is encumbered as a part of NNN's
$15,151
long-term, fixed rate mortgage and security agreement, net of premium.
|
|
(q)
|
Building improvements are pending completion which is anticipated to occur within six months. Depreciation will commence upon completion.
|
|
(r)
|
As of December 31, 2014, this property has been classified as held for sale. Accumulated depreciation and amortization were recorded prior to this reclassification.
|
See accompanying report of independent registered public accounting firm.
F-69
NATIONAL RETAIL PROPERTIES, INC. AND SUBSIDIARIES
SCHEDULE IV - MORTGAGE LOANS ON REAL ESTATE
December 31, 2014
(dollars in thousands)
|
Description
|
Interest
Rate
|
Maturity
Date
|
Periodic
Payment
Terms
|
Prior
Liens
|
Face
Amount
of Mortgages
|
Carrying
Amount of
Mortgages (f)
|
|
Principal
Amount
of Loans Subject
to Delinquent
Principal or
Interest
|
|||||||||||||
|
First mortgages on properties:
|
|||||||||||||||||||||
|
Paramus, NJ
|
9.000
|
%
|
2/1/2022
|
(b)
|
—
|
|
$
|
6,000
|
|
$
|
3,725
|
|
|
$
|
—
|
|
|||||
|
Des Moines, IA
|
(d)
|
|
(d)
|
(d)
|
—
|
|
400
|
|
118
|
|
|
118
|
|
||||||||
|
Milford, CT
|
7.000
|
%
|
6/30/2016
|
(c)
|
—
|
|
1,550
|
|
1,550
|
|
|
—
|
|
||||||||
|
Marlow Heights, MD
|
7.000
|
%
|
5/14/2016
|
(c)
|
—
|
|
750
|
|
750
|
|
|
—
|
|
||||||||
|
Hillman, MI
|
7.500
|
%
|
6/1/2017
|
(c)
|
—
|
|
62
|
|
62
|
|
|
—
|
|
||||||||
|
4 properties in FL and GA
|
6.250
|
%
|
6/1/2015
|
(e)
|
—
|
|
5,500
|
|
4,725
|
|
—
|
|
|||||||||
|
$
|
14,262
|
|
$
|
10,930
|
|
(a)
|
$
|
118
|
|
||||||||||||
|
(a)
|
The following shows the changes in the carrying amounts of mortgage loans during the years:
|
|
2014
|
2013
|
2012
|
|||||||||||||||
|
Balance at beginning of year
|
$
|
14,430
|
|
|
$
|
17,482
|
|
|
$
|
22,815
|
|
|
|||||
|
New mortgage loans
|
7,307
|
|
(g)
|
3,547
|
|
(g)
|
7,344
|
|
(g)
|
||||||||
|
Deductions during the year:
|
|||||||||||||||||
|
Collections of principal
|
(10,807
|
)
|
(6,599
|
)
|
(12,339
|
)
|
|||||||||||
|
Foreclosures
|
—
|
|
—
|
|
|
(338
|
)
|
||||||||||
|
Balance at the close of year
|
$
|
10,930
|
|
|
$
|
14,430
|
|
|
$
|
17,482
|
|
|
|||||
|
(b)
|
Principal and interest is payable at level amounts over the life of the loan.
|
|
(c)
|
Interest only payments are due monthly. Principal is due at maturity.
|
|
(d)
|
This mortgage loan matured in November 2014 and the principal balance is currently delinquent. NNN and the borrower are currently in negotiations to reinstate the loan under modified terms.
|
|
(e)
|
Interest only payments are due monthly. Periodic principal payments are due over the course of the loan based on specific terms outlined in the loan agreement, with the remaining principal balance due at maturity.
|
|
(f)
|
Mortgages held by NNN and its subsidiaries for federal income tax purposes for the years ended December 31, 2014, 2013 and 2012 were
$10,930
,
$14,430
, and
$17,482
, respectively.
|
|
(g)
|
Mortgages totaling
$7,307
,
$3,547
, and
$7,344
, were accepted in connection with real estate transactions for the year ended December 31, 2014, 2013 and 2012, respectively.
|
See accompanying report of independent registered public accounting firm.
TABLE OF CONTENTS
Part IItem 1. BusinessItem 1A. Risk FactorsItem 1B. Unresolved Staff CommentsItem 2. PropertiesItem 3. Legal ProceedingsItem 4. Mine Safety DisclosuresPart IIItem 5. Market For Registrant S Common Equity, Related Stockholder Matters and Issuer Purchases Of Equity SecuritiesItem 6. Selected Financial DataItem 7. Management S Discussion and Analysis Of Financial Condition and Results Of OperationsItem 8. Financial Statements and Supplementary DataNote 1 Organization and Summary Of Significant Accounting Policies:Note 2 Real Estate:Note 3 Mortgages, Notes and Accrued Interest Receivable :Note 3 Mortgages, Notes and Accrued Interest ReceivableNote 4 Commercial Mortgage Residual Interests :Note 4 Commercial Mortgage Residual InterestsNote 5 Line Of Credit Payable :Note 5 Line Of Credit PayableNote 6 Mortgages Payable :Note 6 Mortgages PayableNote 7 Notes Payable Convertible :Note 7 Notes Payable ConvertibleNote 8 Notes Payable :Note 8 Notes PayableNote 9 Preferred Stock :Note 9 Preferred StockNote 10 Common Stock :Note 10 Common StockNote 11 Employee Benefit Plan :Note 11 Employee Benefit PlanNote 12 Dividends :Note 12 DividendsNote 13 Income Taxes :Note 13 Income TaxesNote 14 Earnings From Discontinued Operations :Note 14 Earnings From Discontinued OperationsNote 15 Derivatives :Note 15 DerivativesNote 16 Performance Incentive Plan :Note 16 Performance Incentive PlanNote 17 Fair Value Of Financial Instruments :Note 17 Fair Value Of Financial InstrumentsNote 18 Quarterly Financial Data (unaudited) :Note 18 Quarterly Financial Data (unaudited)Note 19 Segment Information :Note 19 Segment InformationNote 20 Fair Value Measurements :Note 20 Fair Value MeasurementsNote 21 Major Tenants :Note 21 Major TenantsNote 22 Commitments and Contingencies :Note 22 Commitments and ContingenciesNote 23 Subsequent Events :Note 23 Subsequent EventsItem 9. Changes in and Disagreements with Accountants on Accounting and Financial DisclosureItem 9A. Controls and ProceduresItem 9B. Other InformationPart IIIItem 10. Directors, Executive Officers and Corporate GovernanceItem 11. Executive CompensationItem 12. Security Ownership Of Certain Beneficial Owners and Management and Related Stockholder MattersItem 13. Certain Relationships and Related Transactions, and Director IndependenceItem 14. Principal Accountant Fees and ServicesPart IVItem 15. Exhibits and Financial Statement Schedules