NORTHROP GRUMMAN CORP /DE/
10-Ks and 10-Qs
|
|
|
|
|
|
|
|
|
|
|
|
|
|
|
|
|
|
|
|
|
|
|
|
|
|
|
|
|
|
|
|
|
|
|
|
|
|
|
|
|
|
|
|
|
|
|
|
|
|
|
|
|
|
|
|
UNITED STATES
SECURITIES AND EXCHANGE COMMISSION
Washington, D.C. 20549
_____________________
FORM 10-K
_____________________
|
x
|
ANNUAL REPORT PURSUANT TO SECTION 13 OR 15(d) OF THE SECURITIES EXCHANGE ACT OF 1934
|
For the fiscal year ended
December 31, 2017
or
|
o
|
TRANSITION REPORT PURSUANT TO SECTION 13 OR 15(d) OF THE SECURITIES EXCHANGE ACT OF 1934
|
For the transition period from to Commission file number 1-16411
NORTHROP GRUMMAN CORPORATION
(Exact name of registrant as specified in its charter)
|
DELAWARE
|
|
80-0640649
|
|
(State or other jurisdiction of
incorporation or organization)
|
|
(I.R.S. Employer
Identification Number)
|
|
2980 Fairview Park Drive
Falls Church, Virginia
|
22042
|
|
|
(Address of principal executive offices)
|
(Zip code)
|
|
(703) 280-2900
(Registrant’s telephone number, including area code)
Securities registered pursuant to section 12(b) of the Act:
|
Title of each class
|
|
Name of each exchange on which registered
|
|
Common Stock, $1 par value
|
|
New York Stock Exchange
|
Securities registered pursuant to Section 12(g) of the Act:
None
Indicate by check mark if the registrant is a well-known seasoned issuer, as defined in Rule 405 of the Securities Act.
|
Yes
x
|
|
No
o
|
|
Yes
o
|
|
No
x
|
Indicate by check mark whether the registrant (1) has filed all reports required to be filed by Section 13 or 15(d) of the Securities Exchange Act of 1934 during the preceding 12 months (or such shorter period that the registrant was required to file such reports), and (2) has been subject to such filing requirements for the past 90 days.
|
Yes
x
|
|
No
o
|
|
Yes
x
|
|
No
o
|
Indicate by check mark if disclosure of delinquent filers pursuant to Item 405 of Regulation S-K is not contained herein, and will not be contained, to the best of registrant’s knowledge, in definitive proxy or information statements incorporated by reference in Part III of this Form 10-K or any amendment to this Form 10-K.
o
Indicate by check mark whether the registrant is a large accelerated filer, an accelerated filer, a non-accelerated filer, smaller reporting company or an emerging growth company. See the definitions of “large accelerated filer,” “accelerated filer,” “smaller reporting company” and “emerging growth company” in Rule 12b-2 of the Exchange Act:
|
Large accelerated filer
x
|
Accelerated filer
o
|
|
Smaller reporting company
o
|
|||
|
Non-accelerated filer
o
(Do not check if a smaller reporting company)
|
Emerging growth company
o
|
|||||
If an emerging growth company, indicate by check mark if the registrant has elected not to use the extended transition period for complying with any new or revised financial accounting standards provided pursuant to Section 13(a) of the Exchange Act.
o
Indicate by check mark whether the registrant is a shell company (as defined in Rule 12b-2 of the Act).
|
Yes
o
|
|
No
x
|
As of
June 30, 2017
, the aggregate market value of the common stock (based upon the closing price of the stock on the New York Stock Exchange) of the registrant held by non-affiliates was approximately
$44.5 billion
.
As of
January 25, 2018
,
174,087,585
shares of common stock were outstanding.
DOCUMENTS INCORPORATED BY REFERENCE
Portions of Northrop Grumman Corporation’s Proxy Statement to be filed with the Securities and Exchange Commission pursuant to Regulation 14A for the
2018
Annual Meeting of Shareholders are incorporated by reference in Part III of this Form 10-K.
NORTHROP GRUMMAN CORPORATION
TABLE OF CONTENTS
|
|
|
Page
|
|
Item 1.
|
||
|
Item 1A.
|
||
|
Item 1B.
|
||
|
Item 2.
|
||
|
Item 3.
|
||
|
Item 4.
|
||
|
Item 5.
|
||
|
Item 6.
|
||
|
Item 7.
|
||
|
Item 7A.
|
||
|
Item 8.
|
||
i
|
|
|
Page
|
|
Item 9.
|
||
|
Item 9A.
|
||
|
Item 9B.
|
||
|
Item 10.
|
||
|
Item 11.
|
||
|
Item 12.
|
||
|
Item 13.
|
||
|
Item 14.
|
||
|
Item 15.
|
||
|
Item 16.
|
||
ii
NORTHROP GRUMMAN CORPORATION
HISTORY AND ORGANIZATION
History
Northrop Grumman Corporation (herein referred to as “Northrop Grumman,” the “company,” “we,” “us,” or “our”) is a leading global security company. We offer a broad portfolio of capabilities and technologies that enable us to deliver innovative products, systems and solutions for applications that range from undersea to outer space and into cyberspace. We provide products, systems and solutions in autonomous systems; cyber; command, control, communications and computers, intelligence, surveillance and reconnaissance (C4ISR); strike; and logistics and modernization. We participate in many high-priority defense and government programs in the United States (U.S.) and abroad. We conduct most of our business with the U.S. Government, principally the Department of Defense (DoD) and intelligence community. We also conduct business with foreign, state and local governments, as well as commercial customers.
For a discussion of risks associated with our operations, see
“
Risk Factors.
”
The company originally was formed in Hawthorne, California in 1939, as Northrop Aircraft Incorporated and was reincorporated in Delaware in 1985, as Northrop Corporation. Northrop Aircraft Incorporated was a principal developer of flying wing technology, including the B-2 Spirit bomber. The company developed into one of the largest defense contractors in the world through a series of acquisitions, as well as organic growth. In 1994, we acquired Grumman Corporation (Grumman), after which time the company was renamed Northrop Grumman Corporation. Grumman was a premier military aircraft systems integrator and builder of the Lunar Module that first delivered humans to the surface of the moon. In 1996, we acquired the defense and electronics businesses of Westinghouse Electric Corporation, a world leader in the development and production of sophisticated radar and other electronic systems for the nation’s defense, civil aviation, and other U.S. and international applications. In 2001, we acquired Litton Industries, a global electronics and information technology company, and one of the nation’s leading full service shipbuilders. Also in 2001, we acquired Newport News Shipbuilding, a leading designer and builder of nuclear-powered aircraft carriers and submarines. In 2002, we acquired TRW Inc., a leading developer of military and civil space systems and payloads, as well as a leading global integrator of complex, mission-enabling systems and services. In 2011, we completed the spin-off to our shareholders of Huntington Ingalls Industries, Inc. (HII). HII operates our former Shipbuilding business, comprised largely of a part of Litton Industries and Newport News Shipbuilding.
On September 17, 2017, the company entered into a definitive merger agreement to acquire Orbital ATK, Inc. (Orbital ATK).
We currently expect the transaction to close in the first half of 2018, after receiving regulatory approvals.
Upon completion of the Orbital ATK Acquisition, we plan to establish Orbital ATK as a new, fourth business sector named Northrop Grumman Innovation Systems.
See Notes 2 and 10
to the consolidated financial statements for further information.
Organization
From time to time, we acquire or dispose of businesses and realign contracts, programs or businesses among and within our operating segments. Internal realignments are typically designed to leverage existing capabilities more fully and to enhance development and delivery of products and services. The operating results for all periods presented have been revised to reflect any such changes made through
December 31, 2017
. The company is aligned in three operating sectors, which also comprise our reportable segments: Aerospace Systems, Mission Systems and Technology Services. See Note
4
to our consolidated financial statements for further information.
AEROSPACE SYSTEMS
Aerospace Systems, headquartered in Redondo Beach, California, is a leader in the design, development, integration and production of manned aircraft, autonomous systems, spacecraft, high-energy laser systems, microelectronics and other systems and subsystems. Aerospace Systems’ customers, primarily the DoD and other U.S. Government agencies, use these systems in mission areas including intelligence, surveillance and reconnaissance (ISR), strike operations, communications, earth observation, and space science and exploration. The sector is reported in three business areas, which reflect our core capabilities: Autonomous Systems, Manned Aircraft and Space.
Autonomous Systems
– designs, develops, manufactures, integrates and sustains autonomous aircraft systems for tactical and strategic ISR missions. Key programs include high-altitude long-endurance (HALE) systems, such as the Global Hawk system, which provides near real-time high resolution imagery of land masses for theater awareness; the Triton system, which provides real-time ISR over vast ocean and coastal regions for maritime domain awareness; and the North Atlantic Treaty Organization (NATO) Alliance Ground Surveillance (AGS) system for
-
1
-
NORTHROP GRUMMAN CORPORATION
multinational theater operations; the ship-based vertical take off and landing (VTOL) Fire Scout system, which provides situational awareness for maritime forces and precision targeting support; and the Navy Unmanned Combat Air System demonstrating an unmanned combat air vehicle for carrier-based operations.
Manned Aircraft
– designs, develops, manufactures, and integrates airborne C4ISR systems, long-range strike aircraft systems, tactical aircraft systems and directed energy systems. Key airborne C4ISR programs include the E-2D Advanced Hawkeye and Joint Surveillance Target Attack Radar System (JSTARS). Key long-range strike aircraft programs include
the B-21 Raider long-range strike bomber
and modernization and sustainment services for the B-2 Spirit bomber. Tactical aircraft includes the design, development, manufacture and integration of F-35 Lightning II center fuselage and F/A-18 Super Hornet center/aft fuselage sections. Directed energy involves the design, development, and integration of laser weapon systems for air, ground, and sea platforms, and production of the Airborne Laser Mine Detection System for the U.S. Navy and international customers.
Space
– designs, develops, manufactures, and integrates spacecraft systems, subsystems, sensors and communications payloads in support of space C4ISR and science missions. Key programs include the James Webb Space Telescope (JWST), a large infrared telescope being built for the National Aeronautics and Space Administration (NASA) that will be deployed in space to study the origins of the universe; Advanced Extremely High Frequency (AEHF) payloads providing survivable, protected communications to U.S. forces; Space-Based Infrared System (SBIRS) payloads providing data for missile surveillance, missile defense, technical intelligence and battlespace characterization; and restricted programs.
MISSION SYSTEMS
Mission Systems, headquartered in Linthicum, Maryland, is a leader in advanced end-to-end mission solutions and multifunction systems for DoD, intelligence community, international, federal-civil and commercial customers. Major products and services include C4ISR systems; radar, electro-optical/infrared (EO/IR) and acoustic sensors; electronic warfare systems; cyber solutions; space systems; intelligence processing systems; air and missile defense (AMD) integration; navigation; and shipboard missile and encapsulated payload launch systems. The sector is reported in three business areas, which reflect our core capabilities: Sensors and Processing, Cyber and ISR, and Advanced Capabilities.
Sensors and Processing
– delivers products, systems and services that support ground-based and fixed wing and rotary wing aircraft platforms with radar, electronic warfare, communications, command and control (C2), Signals Intelligence (SIGINT), and situational awareness mission systems. Competencies include targeting, surveillance, air defense, and early warning & control radar systems; EO/IR and radio frequency (RF) self-protection, targeting and surveillance systems; electronic attack and electronic support systems; communications and intelligence systems; digitized cockpits; and multi-sensor processing. Key programs include Airborne Early Warning & Control (AEW&C) and air-to-ground sensors; Battlefield Airborne Communications Node (BACN); F-35 fire control radar, Distributed Aperture System (DAS), and Communications, Navigation and Identification (CNI) integrated avionics system; Ground/Air Task Oriented Radar (G/ATOR); Joint Counter Radio-Controlled Improvised Explosive Device Electronic Warfare (JCREW); RF and Infrared Countermeasures (IRCM) programs for both fixed wing and rotary wing platforms; EO/IR targeting and surveillance programs; Scalable Agile Beam Radar (SABR); UH-60V Black Hawk integrated mission equipment package; and restricted programs.
Cyber and ISR
– delivers products, systems and services that support full-spectrum cyber solutions, space-based payload and exploitation systems, space-based C2 and processing systems, and enterprise integration of multi-intelligence mission data across all domains. Competencies include cyber mission management; large-scale cyber solutions for national security applications; missile warning and defense systems; weather and satellite communications; ground software systems; and geospatial intelligence and data fusion, specializing in the collection, processing and exploitation of data. Key programs include exploitation and cyber programs; operational services to the United States Computer Emergency Readiness Team (US-CERT); worldwide IT coverage and support services through Solutions for the Information Technology Enterprise (SITE); the Enterprise Application Managed Services (EAMS) program; and restricted programs.
Advanced Capabilities
–
provides integration and interoperability of net-enabled battle management, sensors, targeting and surveillance systems; air and missile defense C2; and global battlespace awareness. It also delivers products, systems and services that support maritime platforms and embedded navigation and positioning sensors for a range of platforms including ships, aircraft, spacecraft and weapons. Competencies include advanced AMD integration with land, air and space assets; shipboard missile and encapsulated payload launch systems; unmanned maritime vehicles and high-resolution undersea sensors; and inertial navigation systems. Key programs include the Integrated Air and Missile Defense Battle Command System (IBCS); Ground-based Midcourse Defense (GMD)
-
2
-
NORTHROP GRUMMAN CORPORATION
system; Surface Electronic Warfare Improvement Program (SEWIP) Block III; the Embedded Global Positioning System (GPS)/Inertial Navigation Systems-Modernization; AQS-24B Minehunting System; and Trident and Virginia-Class payload launch systems.
TECHNOLOGY SERVICES
Technology Services, headquartered in Herndon, Virginia, is a leader in logistic solutions supporting the full life cycle of platforms and systems and delivering innovative, technology-driven solutions and services for DoD, global defense and federal-civil customers. Major products and services include software and system sustainment; modernization of platforms and associated subsystems; advanced training solutions; and integrated logistics support. The sector is reported in three business areas, which reflect our core capabilities: Global Logistics and Modernization; Advanced Defense Services; and System Modernization and Services.
Global Logistics and Modernization
– provides global logistics support, sustainment, operations and modernization for air, sea and ground systems and weapon system components. Competencies include aircraft, electronics and software sustainment and engineering; electronic warfare/attack and avionics/electronics subsystems modernization; supply chain management; manned and unmanned weapon systems deployed logistics support; field services, on-going maintenance and technical assistance; and rapid response in support of global customers. Capabilities include: integration, delivery and global support of unmanned special mission aircraft solutions for platforms such as the MQ-5B Hunter, Global Hawk and Triton; subsystem and component-level depot repair and modernization for products such as AAQ-24, APN-241, ALQ-135 and ALQ-131A sensors; missile sustainment and modernization solutions for products, including the Intercontinental Ballistic Missile Minuteman III; and weapon systems sustainment, refurbishment, overhaul, modernization and contractor logistics support for several unique low-density/high-demand platforms, including the B-2 Spirit bomber, JSTARS, KC-30A and UK Airborne Warning and Control System.
Advanced Defense Services
– provides advanced defense and security services including cyber; network operations and security; system and software sustainment and modernization; and training to strengthen the national security of the U.S. and its allies. Key programs include the Marine Corps Cyber Operations Group, which provides network defense services for the U.S. Marine Corps; Ministry of the National Guard (MNG) Training Support, through our interest in a joint venture for which we consolidate the financial results, which provides equipment fielding, training and maintenance, logistics and operations support to the Saudi Arabia MNG; and the Mission Command Training Program, the Army's premier leadership and staff training exercise program at the tactical and operational level.
System Modernization and Services
–
provides full life cycle information systems modernization and sustainment primarily in support of civilian government agencies. Competencies include analytics; mission information processing; cyber and secure networking; and software development. Capabilities include fraud detection and compliance services, data analysis and decision support tools, and software system sustainment; services to U.S. Government healthcare agencies, including benefits systems administration, fraud prevention, payment modernization, bioinformatics, and precision health; and information sharing and analysis solutions as well as sophisticated enterprise-wide solutions to design, build and manage resilient and secure IT infrastructures. Our capabilities provide proactive network monitoring, patch management and desktop optimization to control and reduce overall operating costs.
SELECTED FINANCIAL DATA AND SEGMENT OPERATING RESULTS
For a summary of selected consolidated financial information, see “Selected Financial Data.” For a more complete understanding of our segment financial information, see “Segment Operating Results” in “Management’s Discussion and Analysis of Financial Condition and Results of Operations” (MD&A) and Note
4
to the consolidated financial statements.
CUSTOMER CONCENTRATION
Our largest customer is the U.S. Government. Sales to the U.S. Government accounted for
85 percent
,
84 percent
and
83 percent
of sales during the years ended
December 31, 2017
,
2016
and
2015
, respectively. For further information on sales by customer category, see Note
1
to the consolidated financial statements. No single program accounted for more than ten percent of total sales during any period presented. See “Risk Factors” for further discussion regarding risks related to customer concentration.
COMPETITIVE CONDITIONS
We compete with many companies in the defense, intelligence and federal markets. BAE Systems, Boeing, Booz Allen Hamilton, General Dynamics, Harris, L3 Technologies, Leidos, Leonardo, Lockheed Martin, Raytheon and
-
3
-
NORTHROP GRUMMAN CORPORATION
Thales are some of our primary competitors. Key characteristics of our industry include long operating cycles and intense competition, which is evident through the number of competitors bidding on program opportunities and the number of bid protests (competitor protests of U.S. Government procurement awards).
It is common in the defense industry for work on major programs to be shared among a number of companies. A company competing to be a prime contractor may, upon ultimate award of the contract to another competitor, become a subcontractor to the ultimate prime contracting company. It is not unusual to compete for a contract award with a peer company and, simultaneously, perform as a supplier to or a customer of that same competitor on other contracts, or vice versa.
SEASONALITY
No material portion of our business is considered to be seasonal.
BACKLOG
At
December 31, 2017
, total backlog was
$42.9 billion
, as compared with
$45.3 billion
at
December 31, 2016
. For further information, see “Backlog” in MD&A.
RESEARCH AND DEVELOPMENT
Our strategy includes significant investment in research and development (R&D) to support future technologies and mission solutions. In 2017, 2016 and 2015, we invested
2.5 percent
,
2.9 percent
and
3.0 percent
of total sales in company-sponsored R&D. For additional information on company-sponsored and customer-funded R&D, see Note
1
to the consolidated financial statements.
INTELLECTUAL PROPERTY
We routinely apply for and own a number of U.S. and foreign patents related to the technologies we develop. We also develop and protect intellectual property as trade secrets. In addition to owning a large portfolio of proprietary intellectual property, we license some intellectual property rights to third parties and we license or otherwise obtain access to intellectual property from third parties. The U.S. Government typically holds licenses to patents developed in the performance of U.S. Government contracts and may use or authorize others to use the inventions covered by these patents for certain purposes. See “Risk Factors” for further discussion regarding risks related to intellectual property.
RAW MATERIALS
We have not experienced significant delays in the supply or availability of raw materials, nor have we experienced a significant price increase for raw materials. See “Risk Factors” for further discussion regarding risks related to raw materials.
EMPLOYEE RELATIONS
We believe that we maintain good relations with our approximately
70,000
employees. Approximately
2,300
are covered by
10
collective agreements in the U.S., of which we negotiated
one
renewal in
2017
and expect to negotiate
two
renewals in
2018
. See “Risk Factors” for further discussion regarding risks related to employee relations.
REGULATORY MATTERS
Government Contract Security Restrictions
Certain classified programs with the U.S. Government are prohibited by the customer from being publicly discussed and are therefore generally referred to as “restricted” in this Annual Report on Form 10-K. The consolidated financial statements and financial information in this Annual Report on Form 10-K reflect the operating results of our entire company, including restricted programs.
Contracts
We generate the majority of our business from long-term contracts with the U.S. Government for development, production and support activities. Unless otherwise specified in a contract, allowable and allocable costs are billed to contracts with the U.S. Government pursuant to the Federal Acquisition Regulation (FAR) and U.S. Government Cost Accounting Standards (CAS). Examples of costs incurred by us and not billed to the U.S. Government in accordance with the FAR and CAS include, but are not limited to, certain legal costs, charitable donations, advertising costs, interest expense and unallowable employee compensation and benefits costs.
We monitor our contracts on a regular basis for compliance with our policies and procedures and applicable government regulations and laws to enhance compliance and consistent application for contracts with similar terms
-
4
-
NORTHROP GRUMMAN CORPORATION
and conditions. In addition, costs incurred and allocated to contracts with the U.S. Government are routinely audited by the Defense Contract Audit Agency (DCAA).
Our long-term contracts typically fall into one of two broad categories:
Cost-type contracts
– Cost-type contracts include cost plus fixed fee, cost plus award fee and cost plus incentive fee contracts. Cost-type contracts provide generally for reimbursement of a contractor’s allowable costs incurred plus fee. As a result, cost-type contracts have less financial risk associated with unanticipated cost growth but generally provide lower profit margins than fixed-price contracts. Cost-type contracts typically require that the contractor use its best efforts to accomplish the scope of the work within some specified time and stated dollar limitation. Fees on cost-type contracts can be fixed in terms of dollar value or percentage of costs. Award and incentive fees are generally based on performance criteria such as cost, schedule, quality and/or technical performance. Award fees are determined and earned based on customer evaluation of the company’s performance against contractual criteria. Incentive fees are generally based on cost and provide for an initially negotiated fee to be adjusted later, based on the relationship of total allowable costs to total target costs. Award and incentive fees that can reasonably be estimated and are deemed reasonably assured are recorded over the performance period of the contract.
Fixed-price contracts
– Firm fixed-price contracts include a specified scope of work for a price that is a pre-determined, negotiated amount and not generally subject to adjustment regardless of costs incurred by the contractor, absent changes in scope by the customer. As a result, fixed-price contracts have more financial risk associated with unanticipated cost growth, but generally provide the opportunity for higher profit margins than cost-type contracts. Certain fixed-price incentive fee contracts provide for reimbursement of the contractor’s allowable costs plus a fee up to a cost ceiling amount, typically through a cost-sharing ratio that affects profitability. These types of fixed-price incentive fee contracts effectively become firm fixed-price contracts once the cost-share ceiling is reached. Time-and-materials contracts are considered fixed-price contracts as they specify a fixed hourly rate for each labor hour charged.
Profit margins on our contracts may vary materially depending on, among other things, the contract type, contract phase (e.g., development, low-rate production or mature production), negotiated fee arrangements, achievement of performance objectives, and cost, schedule and technical performance.
See Note
1
to the consolidated financial statements and “Risk Factors.”
The following table summarizes sales for the year ended
December 31, 2017
, recognized by contract type and customer category:
|
($ in millions)
|
U.S.
Government
(1)
|
International
(2)
|
Other Customers
|
Total
|
Percentage
of Total Sales
|
||||||||||||||
|
Cost-type contracts
|
$
|
13,441
|
|
$
|
641
|
|
$
|
86
|
|
$
|
14,168
|
|
55
|
%
|
|||||
|
Fixed-price contracts
|
8,396
|
|
2,661
|
|
578
|
|
11,635
|
|
45
|
%
|
|||||||||
|
Total sales
|
$
|
21,837
|
|
$
|
3,302
|
|
$
|
664
|
|
$
|
25,803
|
|
100
|
%
|
|||||
|
(1)
|
Sales to the
U.S.
Government include sales from contracts for which we are the prime contractor, as well as those for which we are a subcontractor and the ultimate customer is the U.S. Government. Each of the company’s segments derives substantial revenue from the U.S. Government.
|
(2)
International sales include sales from contracts for which we are the prime contractor, as well as those for which we are a subcontractor and the ultimate customer is an international customer. These sales include foreign military sales contracted through the U.S. Government, direct sales with governments outside the U.S. and commercial sales outside the U.S.
Environmental
Our operations are subject to and affected by federal, state, local and foreign laws, regulations and enforcement actions relating to protection of the environment. In 2010, we established goals for the reduction of greenhouse gas emissions and implementation of best management practices for water use and solid waste; those goals were achieved as of December 31, 2014. In 2015, we announced our 2020 environmental sustainability goals: to reduce absolute greenhouse gas emissions by 30 percent from 2010 levels; to reduce potable water use by 20 percent from 2014 levels; and to achieve a 70 percent solid waste diversion rate (away from landfills).
We have incurred and expect to continue to incur capital and operating costs to comply with applicable environmental laws and regulations and to achieve our environmental sustainability commitments. See “Risk Factors” and Notes
1
and
12
to the consolidated financial statements.
-
5
-
NORTHROP GRUMMAN CORPORATION
EXECUTIVE OFFICERS
See “Directors, Executive Officers and Corporate Governance” for information about our executive officers.
AVAILABLE INFORMATION
Our principal executive offices are located at 2980 Fairview Park Drive, Falls Church, Virginia 22042. Our telephone number is (703) 280-2900 and our home page is www.northropgrumman.com.
Our annual reports on Form 10-K, quarterly reports on Form 10-Q, current reports on Form 8-K and proxy statement for the annual shareholders’ meeting, as well as any amendments to those reports, are available free of charge through our website as soon as reasonably practicable after we file them with the U.S. Securities and Exchange Commission (SEC). You can learn more about us by reviewing our SEC filings on the investor relations page of our website.
The SEC also maintains a website at www.sec.gov that contains reports, proxy statements and other information about SEC registrants, including Northrop Grumman Corporation.
References to our website and the SEC’s website in this report are provided as a convenience and do not constitute, and should not be viewed as, incorporation by reference of the information contained on, or available through, such websites. Such information should not be considered a part of this report, unless otherwise expressly incorporated by reference in this report.
Item
1A
. Risk Factors
Our consolidated financial position, results of operations and cash flows are subject to various risks, many of which are not exclusively within our control, that may cause actual performance to differ materially from historical or projected future performance. We encourage you to consider carefully the risk factors described below in evaluating the information contained in this report as the outcome of one or more of these risks could have a material adverse effect on our financial position, results of operations and/or cash flows.
|
▪
|
We depend heavily on a single customer, the U.S. Government, for a substantial portion of our business. Changes in this customer’s priorities and spending could have a material adverse effect on our financial position, results of operations and/or cash flows.
|
Our primary customer is the U.S. Government, from which we derived
85 percent
,
84 percent
and
83 percent
of our sales during the years ended
December 31, 2017
,
2016
and
2015
, respectively; we have a number of large programs with the U.S. Air Force, in particular. The U.S. Government has been implementing significant reductions in government spending and other significant program changes. We cannot predict the impact on existing, follow-on, replacement or future programs from potential changes in priorities due to changes in defense spending levels, the threat environment, military strategy and planning and/or changes in social, economic or political priorities.
The U.S. Government generally has the ability to terminate contracts, in whole or in part, for its convenience or for default based on performance. In the event of termination for the U.S. Government’s convenience, contractors are generally protected by provisions covering reimbursement for costs incurred on the contracts and profit on those costs up to the amount authorized under the contract, but not the anticipated profit that would have been earned had the contract been completed. Termination by the U.S. Government of a contract due to default could require us to pay for re-procurement costs in excess of the original contract price, net of the value of work accepted from the original contract, as well as other damages. Termination of a contract due to our default could have a material adverse effect on our reputation, our ability to compete for other contracts and our financial position, results of operations and/or cash flows.
The U.S. Government also has the ability to stop work under a contract for a limited period of time for its convenience. It is possible that the U.S. Government could invoke this ability across a limited or broad number of contracts. In the event of a stop work order, contractors are typically protected by provisions covering reimbursement for costs incurred on the contract to date and for costs associated with the temporary stoppage of work on the contract plus a reasonable fee. However, such temporary stoppages and delays could introduce inefficiencies and result in financial and other damages for which we may not be able to negotiate full recovery from the U.S. Government. They could also ultimately result in termination of a contract (or contracts) for convenience or reduced future orders.
A significant shift in government priorities to programs in which we do not participate and/or reductions in funding for or the termination of programs in which we do participate, unless offset by other programs and opportunities, could have a material adverse effect on our financial position, results of operations and/or cash flows.
-
6
-
NORTHROP GRUMMAN CORPORATION
|
▪
|
Significant delays or reductions in appropriations for our programs and U.S. Government funding more broadly may negatively impact our business and programs and could have a material adverse effect on our financial position, results of operations and/or cash flows.
|
U.S. Government programs are subject to annual congressional budget authorization and appropriation processes. For many programs, Congress appropriates funds on a fiscal year basis even though the program performance period may extend over several years. Consequently, programs are often partially funded initially and additional funds are committed only as Congress makes further appropriations. If we incur costs in excess of funds obligated on a contract, we may be at risk for reimbursement of those costs unless and until additional funds are obligated to the contract. We cannot predict the extent to which total funding and/or funding for individual programs will be included, increased or reduced as part of the annual budget process ultimately approved by Congress and the President or in separate supplemental appropriations or continuing resolutions, as applicable. Laws and plans adopted by the U.S. Government relating to, along with pressures on and uncertainty surrounding the federal budget, potential changes in priorities and defense spending levels, sequestration, the appropriations process, use of continuing resolutions (with restrictions, e.g., on new starts) and the permissible federal debt limit, could adversely affect the funding for individual programs and delay purchasing or payment decisions by our customers. In the event government funding for our significant programs becomes unavailable, or is reduced or delayed, or planned orders are reduced, our contract or subcontract under such programs may be terminated or adjusted by the U.S. Government or the prime contractor.
On November 2, 2015, the President signed the Bipartisan Budget Act of 2015 (the Budget Act). The Budget Act raised the statutory limit on the amount of permissible federal debt (the debt ceiling) until March 2017 and raised the sequester caps imposed by the Budget Control Act of 2011 (the BCA) by $80 billion, split equally between defense and non-defense discretionary spending in FY 2016 and FY 2017 ($50 billion in FY 2016 and $30 billion in FY 2017).
In March 2017, the debt ceiling was reached and the Treasury Department began taking “extraordinary measures” to finance the government and avoid a breach of the debt ceiling. On September 8, 2017, the debt ceiling was suspended for three months and on December 9, 2017, the Treasury Department again began taking extraordinary measures to finance the government. It is currently estimated that the Treasury Department will run out of the ability to take extraordinary measures to finance the government in the first half of 2018. If the debt ceiling is not raised and is breached, we may be required to continue to perform for some period of time on certain of our U.S. Government contracts even if the U.S. Government is not making timely payments. Unforeseen circumstances could cause an extended debt ceiling breach and have significant near and long-term consequences for our company, our employees, our suppliers and the defense industry.
In May 2017, the President signed into law the FY 2017 Consolidated Appropriations Act. In total for FY 2017, Congress appropriated $524 billion in base discretionary funding for the DoD, consistent with the Budget Act. Congress also appropriated approximately $68 billion in Overseas Contingency Operation (OCO) funding and approximately $15 billion in additional DoD appropriations.
In May 2017, the President released his FY 2018 budget request, which seeks $575 billion for the DoD’s base budget, approximately $52 billion above the statutory caps provided for in the BCA. The President’s budget request also seeks an additional $65 billion in OCO funding for expeditionary needs, not capped by the BCA. On September 8, 2017, the President signed a continuing resolution which generally funded the government at FY 2017 levels through December 8, 2017. The continuing resolution was extended to December 22, 2017 and further extended to January 19, 2018. As Congress did not enact appropriations legislation or a new continuing resolution by January 19, 2018, on January 20, 2018, the U.S. Government temporarily shut down. On January 22, 2018, a fourth continuing resolution was enacted, which funds the government through February 8, 2018.
The budget environment, including sequestration as currently mandated, and uncertainty surrounding the appropriations processes, remain significant short and long-term risks. Considerable uncertainty exists regarding how future budget and program decisions will unfold, including the defense spending priorities of the Administration and Congress, what challenges budget reductions (required by the BCA and otherwise) will present for the defense industry and whether an annual appropriations bill will be enacted for FY 2018. If an annual appropriations bill is not timely enacted for FY 2018 or beyond, the U.S. Government may continue to operate under a continuing resolution, restricting new contract or program starts, presenting resource allocation challenges and placing limitations on some planned program budgets, and we may face a government shutdown of unknown duration. If a prolonged government shutdown were to occur, it could result in program cancellations, disruptions
-
7
-
NORTHROP GRUMMAN CORPORATION
and/or stop work orders and could limit our ability to perform on our U.S. Government contracts and the U.S. Government’s ability to effectively progress programs and to make timely payments.
We believe continued budget pressures would have serious negative consequences for the security of our country, the defense industrial base, including Northrop Grumman, and the customers, employees, suppliers, investors, and communities that rely on companies in the defense industrial base. It is likely budget and program decisions made in this environment would have long-term implications for our company and the entire defense industry.
Funding for certain programs in which we participate may be reduced, delayed or cancelled. In addition, budget cuts globally could adversely affect the viability of our subcontractors and suppliers, and our employee base. While we believe that our business is well-positioned in areas that the DoD and other customers have indicated are areas of focus for future defense spending, the long-term impact of the BCA, other defense spending cuts, challenges in the appropriations process, the debt ceiling and the ongoing fiscal debates remain uncertain.
Significant delays or reductions in appropriations; long-term funding under a continuing resolution; an extended debt ceiling breach or government shutdown; and/or future budget and program decisions, among other items, may negatively impact our business and programs and could have a material adverse effect on our financial position, results of operations and/or cash flows.
|
▪
|
We are subject to various investigations, claims, disputes, enforcement actions, litigation and other legal proceedings that could ultimately be resolved against us.
|
The size, nature and complexity of our business make us susceptible to investigations, claims, disputes, enforcement actions, litigation and other legal proceedings, particularly those involving governments. We are and may become subject to investigations, claims, disputes, enforcement actions and administrative, civil or criminal litigation or other legal proceedings globally and across a broad array of matters, including, but not limited to, government contracts, false claims, false statements, mischarging, contract performance, products liability, fraud, procurement integrity, environmental, shareholder derivative actions, intellectual property, tax, employees, export/import, anti-corruption, labor, health and safety, accidents, employee benefits and plans, including plan administration, and improper payments. These matters could divert financial and management resources;
result in administrative, civil or criminal fines, penalties or other sanctions (which terms include judgments or convictions and consent or other voluntary decrees or agreements); compensatory, treble or other damages; non-monetary relief or actions; or other liabilities
; and otherwise harm our business. Government regulations provide that certain allegations against a contractor may lead to suspension or debarment from government contracts or suspension of export privileges for the company or one or more of its components. Suspension or debarment or criminal resolutions in particular could have a material adverse effect on the company because of our reliance on government contracts and export authorizations. An investigation, claim, dispute, enforcement action or litigation, even if not substantiated or fully indemnified or insured, could also negatively impact our reputation among our customers and the public, and make it substantially more difficult for us to compete effectively for business or obtain adequate insurance in the future. Investigations, claims, disputes, enforcement actions or litigation could have a material adverse effect on our financial position, results of operations and/or cash flows.
|
▪
|
We use estimates when accounting for contracts. Contract cost growth or changes in estimated contract revenues and costs could affect our profitability and our overall financial position.
|
Contract accounting requires judgment relative to assessing risks, estimating contract revenues and costs, and making assumptions regarding performance. Due to the size and nature of many of our contracts, the estimation of total revenues and costs at completion is complex and subject to many variables. Incentives, awards and/or penalties related to performance on contracts are considered in estimating revenue and profit rates when there is sufficient information to assess anticipated performance. Suppliers’ expected performance is also assessed and considered in estimating costs and profitability.
Our operating income can be adversely affected when we experience increased estimated contract costs. Reasons for increased estimated contract costs may include: design issues; changes in estimates of the nature and complexity of the work to be performed, including technical or quality issues or requests to perform additional work at the direction of the customer; production challenges, including those resulting from the availability and timeliness of customer funding, unavailability or reduced productivity of qualified and timely cleared labor or the effect of any delays in performance; the availability, performance, quality or financial strength of significant subcontractors; supplier issues, including the costs, timeliness and availability of materials and components; the effect of any changes in laws or regulations; actions deemed necessary for long-term customer satisfaction; and natural disasters
-
8
-
NORTHROP GRUMMAN CORPORATION
or environmental matters. We may file requests for equitable adjustment or claims to seek recovery in whole or in part for our increased costs.
Our risk varies with the type of contract. Due to their nature, fixed-price contracts inherently tend to have more financial risk than cost-type contracts. In 2017, approximately half of our sales were derived from fixed-price contracts. We typically enter into fixed-price contracts where costs can be more reasonably estimated based on actual experience, such as for mature production programs. In addition, our contracts contain provisions relating to cost controls and audit rights. If the terms specified in our contracts are not met, our profitability may be reduced and we may incur a loss.
Our fixed-price contracts may include fixed-price development work. This type of work is inherently more uncertain as to future events than production contracts, and, as a result, there is typically more variability in estimates of the costs to complete the development stage. As work progresses through the development stage into production, the risks associated with estimating the total costs of the contract are typically reduced. While management uses its best judgment to estimate costs associated with fixed-price development contracts, future events could result in either upward or downward adjustments to those estimates.
Under cost-type contracts, allowable costs incurred by the contractor are generally subject to reimbursement plus a fee. We often enter into cost-type contracts for development programs with complex design and technical challenges. These cost-type programs typically have award or incentive fees that are subject to uncertainty and may be earned over extended periods or towards the end of the contract. In these cases, the associated financial risks are primarily in recognizing profit, which ultimately may not be earned, or program cancellation if cost, schedule, or technical performance issues arise. We also may face additional financial risk due to an increasing number of contract solicitations requiring the contractor to bid on cost-type development work and related fixed-price production lots and/or options in one submission, or cost-type development work requiring the contractor to provide certain items to the customer at the contractor’s expense or at little or no fee.
Because of the significance of management’s judgments and the estimation processes described above, it is possible that materially different amounts could be obtained if different assumptions were used or if the underlying circumstances were to change. Changes in underlying assumptions, circumstances or estimates, and the failure to prevail on claims for equitable adjustments could have a material adverse effect on the profitability of one or more of the affected contracts and on our overall financial position, results of operations and/or cash flows. See “Critical Accounting Policies, Estimates and Judgments” in MD&A.
|
▪
|
Our international business exposes us to additional risks, including risks related to geopolitical and economic factors, laws and regulations.
|
Sales to customers outside the U.S. are an increasingly important component of our strategy. Our international business (including our participation in joint ventures) is subject to numerous political and economic factors, legal requirements, cross-cultural considerations and other risks associated with doing business globally. These risks differ in some respects from those associated with our U.S. business and our exposure to such risks may increase if our international business continues to grow as we anticipate.
Our international business is subject to both U.S. and foreign laws and regulations, including, without limitation, laws and regulations relating to import-export controls, technology transfer restrictions, data privacy and protection, investment, exchange rates and controls, the Foreign Corrupt Practices Act (FCPA) and other anti-corruption laws, the anti-boycott provisions of the U.S. Export Administration Act, labor and employment, works councils and other labor groups, taxes, environment, security restrictions and intellectual property. Failure by us, our employees, affiliates, partners or others with whom we work to comply with these laws and regulations could result in administrative, civil or criminal liabilities, including suspension or debarment from government contracts or suspension of our export privileges. Our customers outside of the U.S. generally have the ability to terminate contracts for default based on performance. Termination of a contract due to default could have a material adverse effect on our reputation, our ability to compete for other contracts and our financial position, results of operations and/or cash flows. We also are subject to various non-U.S. procurement and other laws applicable to our industry. New regulations and requirements, or changes to existing ones in the various countries in which we operate can significantly increase our costs and risks of doing business internationally.
Changes in laws, regulations, political leadership and environment, or security risks may dramatically affect our ability to conduct or continue to conduct business in international markets. Our international business may also be impacted by changes in foreign national policies and priorities, which may be influenced by changes in the threat environment, political leadership, geopolitical uncertainties, government budgets, and economic and political factors
-
9
-
NORTHROP GRUMMAN CORPORATION
more generally, any of which could impact funding for programs or delay purchasing decisions or customer payments. We also could be affected by the legal, regulatory and economic impacts of Britain’s exit from the European Union, the impact of which is not known at this time. Global economic conditions and fluctuations in foreign currency exchange rates could further impact our business. For example, the tightening of credit in financial markets outside of the U.S. could adversely affect the ability of our customers and suppliers to obtain financing and could result in a decrease in or cancellation of orders for our products and services or impact the ability of our customers to make payments.
Our contracts with non-U.S. customers may also include terms and reflect legal requirements that create additional risks. They may include industrial cooperation agreements requiring specific in-country purchases, investments, manufacturing agreements or other financial obligations, known as offset obligations, and provide for significant penalties if we fail to meet such requirements. They may also require us to enter into letters of credit, performance or surety bonds, bank guarantees and/or other financial arrangements to secure our performance obligations. We also increasingly are dependent on in-country suppliers and we face risks related to their failure to perform in accordance with the contracts, particularly where we rely on a sole source supplier. Our ability to sell products outside the U.S. could be adversely affected if we are unable to design our products for export on a cost effective basis or to obtain and retain all necessary export licenses and authorizations on a timely basis. We face risks related to our products that are approved for export, but may be subject to the U.S. Government changing or canceling the export license after the product is ordered. Our ability to conduct business outside of the U.S. also depends on our ability to attract and retain sufficient qualified personnel with the skills and/or security clearances in the markets in which we do business.
More broadly, our ability effectively to pursue and execute contracts outside the U.S. also may be impacted by our ability to partner successfully with non-U.S. companies, including through joint ventures, teaming agreements or other arrangements, in support of such pursuits. This risk includes the ability to identify and negotiate appropriate arrangements with local partners as well as potential exposure for their actions.
The products and services we provide internationally, including those provided by subcontractors and joint ventures in which we have an interest, are sometimes in countries with unstable governments, economic or fiscal challenges, military or political conflicts and/or developing legal systems. This may increase the risk to our employees, subcontractors or other third parties, and/or increase the risk of a wide range of liabilities, as well as loss of property or damage to our products.
The occurrence and impact of these factors is difficult to predict, but one or more of them could have a material adverse effect on our financial position, results of operations and/or cash flows.
|
▪
|
Our reputation, our ability to do business and our financial position, results of operations and/or cash flows may be impacted by the improper conduct of employees, agents, subcontractors, suppliers, business partners or joint ventures in which we participate.
|
We have implemented policies, procedures, training and other compliance controls, and have negotiated terms designed to prevent misconduct by employees, agents or others working on our behalf or with us that would violate the applicable laws of the jurisdictions in which we operate, including laws governing improper payments to government officials, the protection of export controlled or classified information, false claims, procurement integrity, cost accounting and billing, competition and data privacy, or the terms of our contracts. However, we cannot ensure that we will prevent all such misconduct committed by our employees, agents, subcontractors, suppliers, business partners or others working on our behalf or with us. We have in the past experienced and may in the future experience such misconduct, despite a vigorous compliance program. This risk of improper conduct may increase as we expand globally. In the ordinary course of our business we form and are members of joint ventures. We may be unable to prevent misconduct or other violations of applicable laws by these joint ventures (including their officers, directors and employees) or our partners. Improper actions by those with whom or through whom we do business (including our employees, agents, subcontractors, suppliers, business partners and joint ventures) could subject us to administrative, civil or criminal investigations and enforcement actions; monetary and non-monetary penalties; liabilities; and other sanctions, including suspension and debarment, which could negatively impact our reputation and ability to conduct business and could have a material adverse effect on our financial position, results of operations and/or cash flows.
|
▪
|
Our business could be negatively impacted by cyber and other security threats or disruptions.
|
As a defense contractor, we face various cyber and other security threats, including attempts to gain unauthorized access to sensitive information and networks; insider threats; threats to the safety of our directors, officers and
-
10
-
NORTHROP GRUMMAN CORPORATION
employees; threats to the security of our facilities, infrastructure and supply chain; and threats from terrorist acts or other acts of aggression. Our customers and partners (including our supply chain and joint ventures) face similar threats. Although we utilize various procedures and controls to monitor and mitigate the risk of these threats, there can be no assurance that these procedures and controls will be sufficient. These threats could lead to losses of sensitive information or capabilities; harm to personnel, infrastructure or products; financial liabilities and damage to our reputation.
Cyber threats are evolving and include, but are not limited to, malicious software, destructive malware, attempts to gain unauthorized access to data, disruption or denial of service attacks, and other electronic security breaches that could lead to disruptions in mission critical systems, unauthorized release of confidential, personal or otherwise protected information (ours or that of our employees, customers or partners), and corruption of data, networks or systems. In addition, we could be impacted by cyber threats or other disruptions or vulnerabilities found in products we use or in our partners’ or customers’ systems that are used in connection with our business. These events, if not prevented or effectively mitigated, could damage our reputation, require remedial actions and lead to loss of business, regulatory actions, potential liability and other financial losses.
We provide systems, products and services to various customers (government and commercial) who also face cyber threats. Our systems, products and services may themselves be subject to cyber threats and/or they may not be able to detect or deter threats, or effectively to mitigate resulting losses. These losses could adversely affect our customers and our company.
The impact of these factors is difficult to predict, but one or more of them could result in the loss of information or capabilities, harm to individuals or property, damage to our reputation, loss of business, contractual or regulatory actions and potential liabilities, any one of which could have a material adverse effect on our financial position, results of operations and/or cash flows.
|
▪
|
Our earnings and profitability depend, in part, on subcontractor and supplier performance and financial viability as well as raw material and component availability and pricing.
|
We rely on other companies to provide raw materials and major components and subsystems for our products and to produce hardware elements and sub-assemblies, provide software and intellectual property, and perform some of the services we provide to our customers, and to do so in compliance with all applicable laws, regulations and contract terms. Disruptions or performance problems caused by our subcontractors and suppliers, or a misalignment between our contractual obligations to our customers and our agreement with our subcontractors and suppliers, could have various impacts on the company, including on our ability to meet our commitments to customers.
Our ability to perform our obligations on time could be adversely affected if one or more of our subcontractors or suppliers were unable to provide the agreed-upon products or materials or perform the agreed-upon services in a timely, compliant and cost-effective manner or otherwise to meet the requirements of the contract. Changes in economic conditions, including changes in defense budgets or credit availability, or other changes impacting a subcontractor or supplier (including changes in ownership or operations) could adversely affect the financial stability of our subcontractors and suppliers and/or their ability to perform. The inability of our suppliers to perform, or their inability to perform adequately, could also result in the need for us to transition to alternate suppliers, which could result in significant incremental cost and delay or the need for us to provide other resources to support our existing suppliers.
In connection with our U.S. Government contracts, we are required to procure certain materials, components and parts from supply sources approved by the customer. We also are facing increased and changing regulatory requirements, both domestically and internationally, many of which apply to our subcontractors and suppliers. In some cases, there may be only one supplier for certain components. If a sole source supplier cannot meet our needs or is otherwise unavailable, we may be unable to find a suitable alternative.
Our procurement practices are intended to reduce the likelihood of our procurement of counterfeit, unauthorized or otherwise non-compliant parts or materials. We rely on our subcontractors and suppliers to comply with applicable laws, regulations and contract terms, including regarding the parts or materials we procure from them; in some circumstances, we rely on certifications provided by our subcontractors and suppliers regarding their compliance. We also rely on our subcontractors and suppliers effectively to mitigate the risk of cyber and security threats or other disruptions with respect to the products, components and services they deliver to us and the information entrusted to them by us or our customers and to comply with applicable laws and regulations, including our customer’s cybersecurity requirements.
-
11
-
NORTHROP GRUMMAN CORPORATION
If we are unable to procure or experience significant delays in subcontractor or supplier deliveries of needed materials, components, services, intellectual property or parts; if our subcontractors or suppliers fail to perform, if they do not comply with all applicable laws, regulations and contract terms, or if the certifications we receive from them are inaccurate; or if what we receive is counterfeit or otherwise improper, it could have a material adverse effect on our financial position, results of operations and/or cash flows.
|
▪
|
As a U.S. Government contractor, we and our partners are subject to various procurement and other laws and regulations applicable to our industry and we could be adversely affected by changes in such laws and regulations or any negative findings by the U.S. Government as to our compliance with them. We also may be adversely affected by changes in our customers’ business practices globally.
|
U.S. Government contractors (including their subcontractors and others with whom they do business) must comply with many significant procurement regulations and other specific legal requirements. These regulations and other requirements, although often customary in government contracts, increase our performance and compliance costs and risks and are regularly evolving. New laws, regulations or procurement requirements or changes to current ones (including, for example, regulations related to cybersecurity, recovery of employee compensation costs, counterfeit parts, anti-human trafficking, specialty metals and conflict minerals) can significantly increase our costs and risks and reduce our profitability.
We operate in a highly regulated environment and are routinely audited and reviewed by the U.S. Government and its agencies, such as the Defense Contract Audit Agency (DCAA), Defense Contract Management Agency (DCMA) and the DoD Inspector General. These agencies review performance under our contracts, our cost structure and our compliance with applicable laws, regulations and standards, as well as the adequacy of our systems and processes in meeting government requirements. Costs ultimately found to be unallowable or improperly allocated to a specific contract will not be reimbursed or must be refunded if already reimbursed. If an audit uncovers improper or illegal activities, we may be subject to civil and criminal penalties, sanctions, forfeiture of profits or suspension or debarment. Whether or not illegal activities are alleged, the U.S. Government has the ability to decrease or withhold certain payments when it deems systems subject to its review to be inadequate, with significant financial impact. In addition, we could suffer serious reputational harm if allegations of impropriety were made against us or business partners.
Our industry has experienced, and we expect it will continue to experience, significant changes to business practices globally as a result of an increased focus on affordability, efficiencies, business systems, recovery of costs and a reprioritization of available defense funds to key areas for future defense spending. As a result of certain of these initiatives, we have experienced and may continue to experience an increased number of audits and/or a lengthened period of time required to close open audits. For example, the thresholds for certain allowable costs in the U.S., including compensation costs, have been significantly reduced; the allowability of other types of costs are being challenged, debated and, in certain cases, modified, all with potentially significant financial costs to the company. In connection with these cost reduction initiatives, the U.S. Government is also pursuing alternatives to shift additional responsibility and performance risks to the contractor. The U.S. Government has been pursuing and may continue to pursue policies that could negatively impact our profitability. Changes in procurement practices favoring incentive-based fee arrangements, different award criteria, non-traditional contract provisions and government contract negotiation offers that indicate what our costs should be also may affect our profitability and predictability.
We (again, including our subcontractors and others with whom we do business) also are subject to and expected to perform in compliance with a vast array of federal laws and regulations related to our industry, including but not limited to the Truth in Negotiations Act, the False Claims Act, the Procurement Integrity Act, CAS, FAR, the International Traffic in Arms Regulations promulgated under the Arms Export Control Act, the Close the Contractor Fraud Loophole Act and the FCPA. If we are found to have violated such requirements, or are found not to have acted responsibly, we may be subject to reductions of the value of contracts; contract modifications or termination; the withholding of payments from our customer; the loss of export privileges; administrative or civil judgments and liabilities; criminal judgments or convictions, liabilities and consent or other voluntary decrees or agreements; other sanctions; the assessment of penalties, fines, or compensatory, treble or other damages or non-monetary relief or actions; or suspension or debarment.
If we or those with whom we do business do not comply with the laws, regulations and processes to which we are subject or if customer business practices change significantly, including with respect to the thresholds for allowable costs, it could affect our ability to compete and have a material adverse effect on our financial position, results of operations and/or cash flows.
-
12
-
NORTHROP GRUMMAN CORPORATION
|
▪
|
Competition within our markets and bid protests may affect our ability to win new contracts and result in reduced revenues and market share.
|
We operate in highly competitive markets and our competitors may have more financial capacity, more extensive or specialized engineering, manufacturing, or marketing capabilities in some areas, or be willing to accept more risk or lower profitability in competing for contracts. We have seen, and anticipate we will continue to see, increased competition in some of our core markets, especially as a result of budget pressures for many customers, a continued focus on affordability and competition, and our own success in winning business. We are facing increasing competition in the U.S. and outside the U.S. from U.S., foreign and multinational firms. In some instances outside the U.S., foreign companies may receive loans, marketing subsidies and other assistance from their governments that may not be available to U.S. companies and foreign companies may be subject to fewer restrictions on technology transfer. Additionally, some customers, including the DoD, may turn to commercial contractors, rather than traditional defense contractors, for some products and services, or may utilize small business contractors or determine to source work internally rather than hiring a contractor.
We are also seeing a significant number of bid protests from unsuccessful bidders on new program awards. Bid protests could result in contract modifications or the award decision being reversed and loss of the contract award. Even where a bid protest does not result in the loss of an award, the resolution can extend the time until the contract activity can begin, and delay earnings.
If we are unable to continue to compete successfully against our current or future competitors, or prevail in protests, we may experience declines in future revenues and market share, which could, over time, have a material adverse effect on our financial position, results of operations and/or cash flows.
|
▪
|
Our ability to win new competitions and meet the needs of our customers depends, in part, on our ability to maintain a qualified workforce.
|
Our operating results are heavily dependent upon our ability to attract and retain sufficient personnel with security clearances and requisite skills in multiple areas, including science, technology, engineering and math. Additionally, as we grow our international business, it is increasingly important that we are able to attract and retain personnel with relevant experience in local laws, regulations, customs and business practices. If qualified personnel are scarce or difficult to attract or retain or if we experience a high level of attrition, generally or in particular areas, or if such personnel are unable to obtain security clearances on a timely basis, we could experience higher labor, recruiting or training costs in order to attract and retain necessary employees.
Certain of our employees are covered by collective agreements. We generally have been able to renegotiate renewals to expiring agreements without significant disruption of operating activities. If we experience difficulties with renewals and renegotiations of existing collective agreements or if our employees pursue new collective representation, we could incur additional expenses and may be subject to work stoppages. Any such expenses or delays could adversely affect our programs served by employees who are covered by such agreements or representation.
If we are unable to attract and retain a qualified workforce, we may be unable to maintain our competitive position and our future success could be materially adversely affected.
|
▪
|
Many of our contracts contain performance obligations that require innovative design capabilities, are technologically complex, require state-of-the-art manufacturing expertise or are dependent upon factors not wholly within our control. Failure to meet our contractual obligations could adversely affect our profitability, reputation and future prospects.
|
We design, develop and manufacture technologically advanced and innovative products and services, which are applied by our customers in a variety of environments. Problems and delays in development or delivery, or system failures, as a result of issues with respect to design, technology, intellectual property rights, labor, inability to achieve learning curve assumptions, inability to manage effectively a broad array of programs, manufacturing materials or components, or subcontractor performance could prevent us from meeting requirements and create significant risk and liabilities. Similarly, failures to perform on schedule or otherwise to fulfill our contractual obligations could negatively impact our financial position, reputation and ability to win future business.
In addition, our products cannot be tested and proven in all situations and are otherwise subject to unforeseen problems. Examples of unforeseen problems that could negatively affect revenue, schedule and profitability include loss on launch or flight of spacecraft, loss of aviation platforms, premature failure of products that cannot be accessed for repair or replacement, problems with design, quality and workmanship, country of origin of procured materials, delivery of subcontractor components or services and degradation of product performance. These failures
-
13
-
NORTHROP GRUMMAN CORPORATION
could result, either directly or indirectly, in loss of life or property. Among the factors that may affect revenue and profitability could be inaccurate cost estimates, design issues, human factors, unforeseen costs and expenses not covered by insurance or indemnification from the customer, diversion of management focus in responding to unforeseen problems, loss of follow-on work, and, in the case of certain contracts, repayment to the government customer of contract cost and fee payments we previously received, or replacement obligations.
Certain contracts, primarily involving space satellite systems, contain provisions that also entitle the customer to recover fees in the event of failure of the system upon launch or subsequent deployment for less than a specified period of time. Under such terms, we could be required to forfeit fees previously recognized and/or collected.
If we are unable to meet our obligations, including due to issues regarding the design, development or manufacture of our products or services, or we experience launch, platform or satellite system failures, it could have a material adverse effect on our reputation, our ability to compete for other contracts and our financial position, results of operations and/or cash flows.
|
▪
|
Environmental matters, including unforeseen costs associated with compliance and remediation efforts, and government and third party claims, could have a material adverse effect on our reputation and our financial position, results of operations and/or cash flows.
|
Our operations are subject to and affected by a variety of federal, state, local and foreign environmental laws and regulations, including as they may be changed over time. Compliance with these environmental laws and regulations requires, and is expected to continue to require, significant operating and capital costs. We may be subject to substantial administrative, civil or criminal fines, penalties or other sanctions (including suspension and debarment) for violations. If we are found to be in violation of the Federal Clean Air Act or the Clean Water Act, the facility or facilities involved in the violation could be placed by the Environmental Protection Agency on a list maintained by the General Services Administration of facilities that generally cannot be used in performing on U.S. Government contracts until the violation is corrected.
We incur, and expect to continue to incur, substantial remediation costs related to the cleanup of pollutants previously released into the environment. Stricter or different enforcement of existing laws and regulations; new laws, regulations or cleanup requirements; discovery of previously unknown or more extensive contamination; imposition of fines, penalties, compensatory or other damages (including natural resource damages); a determination that certain environmental costs are unallowable; rulings on allocation or insurance coverage; and/or the insolvency or other inability or unwillingness of other parties to pay their share of such costs could require us to incur material additional costs in excess of those anticipated.
We also are and may become a party to various legal proceedings and disputes involving government and private parties (including class actions) relating to alleged impacts from pollutants released into the environment. These matters could result in compensatory or other damages, determinations on allowability or insurance coverage, fines, penalties, and non-monetary relief.
We are engaged in remediation activities relating to environmental conditions allegedly resulting from historic operations at the former United States Navy and Grumman facilities in Bethpage, New York. We have incurred, and expect to continue to incur, substantial remediation and other costs related to environmental conditions in Bethpage. The remediation standards or requirements to which we are subject may change and costs may increase materially. The State of New York has notified us that it intends to seek to impose additional remedial requirements and, among other things, is evaluating natural resource damages. We are and may become a party to various legal proceedings and disputes related to remediation and/or alleged environmental impacts in Bethpage, including with federal and state entities, local municipalities and water districts, insurance carriers and class action plaintiffs. These matters could result in fines, penalties, sanctions, compensatory or other damages (including natural resource damages), determinations on allocation, allowability and coverage, and non-monetary relief and actions.
In addition, government and private parties could seek to hold us responsible for liabilities or obligations related to former operations that have been divested or spun-off (including our former shipbuilding business) and/or for which other parties have agreed to be responsible and/or to indemnify us, directly or indirectly. The indemnity related rights we have may not be sufficient to protect us against such liabilities.
The impact of these factors is difficult to predict, but one or more of them could harm our reputation and business and have a material adverse effect on our financial position, results of operations and/or cash flows.
-
14
-
NORTHROP GRUMMAN CORPORATION
|
▪
|
Our business is subject to disruption caused by natural and/or environmental disasters that could adversely affect our profitability and our overall financial position.
|
We have significant operations located in regions that may be exposed to hurricanes, earthquakes and other damaging storms and natural disasters. Our business also may be subject to environmental disasters. Our subcontractors and suppliers are also subject to natural and environmental disasters that could affect their ability to deliver or perform under a contract. Although preventative measures may help to mitigate damage, the damage and disruption resulting from natural and environmental disasters may be significant.
Natural and environmental disasters could also disrupt our and our subcontractors’ and suppliers’ workforce and the critical industrial infrastructure needed for normal business operations.
If insurance or other risk transfer mechanisms are unavailable or insufficient to recover all costs or if we experience a significant disruption to our business due to a natural or environmental disaster, it could have a material adverse effect on our financial position, results of operations and/or cash flows.
|
▪
|
Our insurance coverage, customer indemnifications or other liability protections may be unavailable or inadequate to cover all of our significant risks or our insurers may deny coverage of or be unable to pay for material losses we incur, which could adversely affect our profitability and overall financial position.
|
We endeavor to obtain insurance agreements from financially solid, highly rated counterparties in established markets to cover significant risks and liabilities (including, for example, natural disasters and products liability). Not every risk or liability can be insured, and for risks that are insurable, the policy limits and terms of coverage reasonably obtainable in the market may not be sufficient to cover all actual losses or liabilities incurred. Even if insurance coverage is available, we may not be able to obtain it at a price or on terms acceptable to us. Disputes with insurance carriers, including over policy terms, reservation of rights, the applicability of coverage (including exclusions), compliance with provisions (including notice) and/or the insolvency of one or more of our insurers may significantly affect the amount or timing of recovery.
In some circumstances we may be entitled to certain legal protections or indemnifications from our customers through contractual provisions, laws, regulations or otherwise. However, these protections are not always available, are typically subject to certain terms or limitations, including the availability of funds, and may not be sufficient to cover all losses or liabilities incurred.
If insurance coverage, customer indemnifications and/or other legal protections are not available or are not sufficient to cover our risks or losses, it could have a material adverse effect on our financial position, results of operations and/or cash flows.
|
▪
|
We provide products and services related to hazardous and high risk operations, which subjects us to various environmental, regulatory, financial, reputational and other risks.
|
We provide products and services related to hazardous and high risk operations. Among other such operations, our products and services are used in nuclear-related activities (including nuclear-powered platforms) and used in support of nuclear-related operations of third parties. In addition, certain of our products are provided with space launch services. These activities subject us to various extraordinary risks, including potential liabilities relating to nuclear-related incidents; to the harmful effects on the environment and human health that may result from nuclear-related activities, operations or incidents, as well as the storage, handling and disposal of radioactive materials; and to failed launches of spacecraft. We may be subject to reputational harm and potential liabilities arising out of a nuclear or launch incident, among others, whether or not the cause was within our control. Under some circumstances, the U.S. Government and prime contractors provide for certain indemnification and other protection under certain of our government related contracts, including pursuant to, or in connection with, Public Law 85-804, the Price-Anderson Nuclear Industries Indemnity Act and the Terrorism Risk Insurance Reauthorization Act, for certain risks.
In addition, our customers may otherwise use our products and services in connection with hazardous activities, or in ways that can be unusually hazardous or risky, creating potential liabilities to our customers and/or our company as the provider of such products and services. In the event of an incident, if our customers fail to use our products properly or if our products or services do not operate as intended, we could be subject to reputational harm and potential liabilities.
If there was a nuclear incident or other nuclear-related damages, an incident related to launch activities or an incident or other damages related to or caused by the use of our products and services in connection with hazardous activities or risks, and if indemnification or other protection was not available to cover our losses and liabilities, it
-
15
-
NORTHROP GRUMMAN CORPORATION
could adversely affect our reputation and have a material adverse effect on our financial position, results of operations and/or cash flows.
|
▪
|
Pension and medical liabilities and related expenses recorded in our financial statements may fluctuate significantly depending upon future investment performance of plan assets, changes in actuarial assumptions, and legislative or other regulatory actions.
|
A substantial portion of our current and retired employee population is covered by pension and other post-retirement benefit plans. Defined benefit pension and medical liabilities and related expenses as recorded in our financial statements are primarily dependent upon future investment performance of plan assets and various assumptions, including discount rates applied to future payment obligations, mortality assumptions, estimated long-term rates of return on plan assets, rates of future cost growth and trends for future costs. In addition, funding requirements for benefit obligations of our pension and other post-retirement benefit plans, including Pension Benefit Guaranty Corporation premiums for certain of our defined benefit plans, and our health and welfare plans are subject to legislative and other government regulatory actions.
In accordance with government regulations, pension plan cost recoveries under our U.S. Government contracts may occur in different periods from when those pension costs are recognized for financial statement purposes or when pension funding is made. These timing differences could have a material adverse effect on our cash flows. The cost accounting rules have been revised in order to partially harmonize the measurement and period of assignment of defined benefit pension plan costs allocable to U.S. Government contracts and minimum required contributions under the Employee Retirement Income Security Act of 1974 (ERISA), as amended by the Pension Protection Act (PPA) of 2006. These rules better align, but do not eliminate, mismatches between ERISA funding requirements and CAS pension costs for U.S. Government CAS covered contracts.
Future investment performance of plan assets and changes in assumptions associated with our pension and other post-retirement benefit plans could have a material adverse effect on our financial position, results of operations and/or cash flows.
|
▪
|
Anticipated benefits of the Orbital ATK Acquisition may not be realized.
|
On September 17, 2017, the company entered into a definitive merger agreement to acquire Orbital ATK (the Orbital ATK Acquisition).
We believe this acquisition will enable us to broaden our capabilities and offerings, create value for shareholders, provide expanded opportunities for our combined employees and enhance our ability to provide innovative solutions to meet our customers’ emerging requirements.
However, in the course of integrating our business with Orbital ATK’s business, we may discover additional information about Orbital ATK’s business (including its financial controls and potential risks, opportunities and liabilities) that alters our assessment of the anticipated benefits, costs and risks of the Orbital ATK Acquisition. Additionally, our customers may not value our combined businesses and capabilities as much as we anticipate, in which case we may not realize the benefits of our combined business to the extent we currently anticipate or at all.
The Orbital ATK Acquisition is subject to the satisfaction of certain customary conditions, some of which are beyond our control and may prevent or otherwise negatively affect the consummation of the Orbital ATK Acquisition or the anticipated benefits therefrom. These conditions include the expiration or termination of the waiting period under the Hart-Scott-Rodino Antitrust Improvements Act of 1976 and satisfaction of the requirements of the European Commission. We cannot predict whether or when these conditions will be satisfied or what requirements will be imposed in order to satisfy these conditions. In addition, the merger agreement may be terminated if the Orbital ATK Acquisition is not completed by September 17, 2018 (subject to extension to December 17, 2018 in certain circumstances) and in certain other specified circumstances described in the merger agreement. If the Orbital ATK Acquisition is not consummated, we will have incurred significant transaction-related costs, expenses and risks without realizing the anticipated benefits of the acquisition.
Our ability to realize the anticipated benefits of the Orbital ATK Acquisition will depend, to a large extent, on our ability to integrate the Orbital ATK business with ours. The integration of an independent business with our business is a complex, costly and time-consuming process. Costs may include, among other things, those associated with facilities and systems consolidation, operational impacts, severance and other potential employment-related costs, as well as fees paid to financial, legal and other advisors. We are devoting and will be required to devote significant management attention and resources prior to the consummation of the Orbital ATK Acquisition to prepare for integration. We also will be required to devote significant management attention and resources following the consummation of the Orbital ATK Acquisition effectively to integrate Orbital ATK’s business and operations with our business and to realize the anticipated benefits. One area of integration will be internal controls processes and
-
16
-
NORTHROP GRUMMAN CORPORATION
procedures. In the past, Orbital ATK restated its financial statements and identified material weaknesses in internal control over financial reporting, which we will need to address post-closing in the integration process. The integration process may disrupt our business and, if implemented ineffectively, may not result in the realization of the expected benefits of the Orbital ATK Acquisition. The consummation of the Orbital ATK Acquisition may trigger change in control and other similar provisions in certain agreements to which Orbital ATK is a party, or otherwise affect contractual relationships, which could have an adverse impact on the combined business if we are unable to address such issues successfully. The failure to meet the challenges involved in integrating Orbital ATK’s business and to realize the anticipated benefits of the Orbital ATK Acquisition could cause an interruption of, or a loss of momentum in, our activities.
Assuming the Orbital ATK Acquisition closes, the above risks could have a material adverse effect on our future financial position, results of operations and/or cash flows.
|
▪
|
We may be unable fully to exploit or adequately to protect intellectual property rights, which could materially affect our ability to compete, our reputation and our financial position, results of operations and/or cash flows.
|
To perform on our contracts and to win new business, we depend on our ability to develop, protect and exploit our intellectual property and also to access the intellectual property of others under reasonable terms. We may not be able adequately to exploit, protect or access intellectual property and the conduct of our customers, competitors and suppliers may make it more difficult for us to do so.
We own many forms of intellectual property, including U.S. and foreign patents, trademarks, copyrights and trade secrets and we license or otherwise obtain access to various intellectual property rights of third parties. The U.S. Government and certain foreign governments hold licenses or other rights to certain intellectual property that we develop in performance of government contracts, and may seek to use or authorize others to use such intellectual property, including in competition with us. Governments have increased certain efforts to assert or obtain more extensive rights in intellectual property, which could reduce our ability to exploit certain of our intellectual property rights and to compete. Governments have also declined at times to make intellectual property of others available to us under acceptable terms.
We also rely significantly upon proprietary technology, information, processes and know-how. We typically seek to protect this information, including by entering into confidentiality agreements with our employees and other parties such as consultants and subcontractors. These agreements and other measures may not provide adequate protection for our trade secrets and other proprietary information. In the event of an infringement of such intellectual property rights, a breach of a confidentiality agreement or divulgence of proprietary information, we may not have adequate legal remedies. In addition, our trade secrets or other proprietary information may otherwise become known or be independently developed by competitors.
In some instances, our ability to seek, win or perform contracts may require us to access and use third party intellectual property. This may require that the government or our customer is willing and able to provide rights to such third party intellectual property, or that we are able to negotiate directly to obtain necessary rights on reasonable terms.
Our intellectual property is subject to challenge, invalidation, misappropriation or circumvention by third parties. Our use of intellectual property licensed or otherwise obtained from third parties is also subject to challenge. Litigation to determine the scope of intellectual property rights, even if ultimately successful, could be costly and could divert management’s attention away from other aspects of our business. Moreover, the laws concerning intellectual property rights vary among countries and the protection provided to our intellectual property by foreign laws and courts may not be the same as the remedies available under U.S. law.
If we are unable adequately to exploit our intellectual property rights, to protect our intellectual property rights against infringement or third party claims, or to obtain rights to intellectual property of others, it could have a material adverse effect on our reputation, ability to compete for and perform on contracts, financial position, results of operations and/or cash flows.
|
▪
|
Our future success depends, in part, on our ability to develop new products and new technologies and maintain technologies, facilities and equipment to win new competitions and meet the needs of our customers.
|
Many of the markets in which we operate are characterized by rapidly changing technologies. The product, program and service needs of our customers change and evolve regularly. Our success in the competitive defense industry depends upon our ability to develop technologically advanced, innovative and cost-effective products and services and market these products and services to our customers in the U.S. and internationally. In addition, our ability to develop innovative and technology advanced products depends, in part, on continued funding for research and
-
17
-
NORTHROP GRUMMAN CORPORATION
development projects. Our success also depends on our continued access to assured suppliers of important technologies and components and our ability to provide the people, technologies, facilities, equipment and financial capacity needed to deliver those products and services with maximum efficiency. If we are unable to develop new products and technologies, or if we fail to achieve market acceptance more rapidly than our competitors, we may be unable to maintain our competitive position and our future success could be materially adversely affected. If we fail to maintain our competitive position, we could lose a significant amount of future business to our competitors, which would negatively impact our ability to generate favorable financial results and maintain market share.
|
▪
|
Changes in future business conditions could cause business investments and/or recorded goodwill and other long-lived assets to become impaired, resulting in substantial losses and write-downs that would reduce our operating income.
|
Although we currently have significant excess fair value of our reporting units over their respective carrying values, goodwill accounts for approximately
36 percent
of our total assets. Market-based inputs to the calculations in our goodwill impairment test, such as weighted average cost of capital and terminal value (based on market comparisons) could change significantly from our current assumptions. We continue to monitor the recoverability of the carrying value of our goodwill and other long-lived assets. Significant write-offs of goodwill or other long-lived assets could have a material adverse effect on our financial condition and/or results of operations.
|
▪
|
Unanticipated changes in our tax provisions or exposure to additional tax liabilities could affect our profitability and cash flow.
|
We are subject to income and other taxes in the U.S. and foreign jurisdictions. Changes in applicable U.S. or foreign tax laws and regulations, or their interpretation and application, including the possibility of retroactive effect, could affect our tax expense and profitability as they did in 2017 upon passage of the Tax Cuts and Jobs Act. In addition, the final determination of any tax audits or related litigation could be materially different from our historical income tax provisions and accruals. Changes in our tax provision or an increase in our tax liabilities, whether due to changes in applicable laws and regulations, the interpretation or application thereof, or a final determination of tax audits or litigation, could have a material adverse effect on our financial position, results of operations and/or cash flows.
None.
FORWARD-LOOKING STATEMENTS AND PROJECTIONS
This Annual Report on Form 10-K and the information we are incorporating by reference contain statements, other than statements of historical fact, that constitute “forward-looking statements” within the meaning of the Private Securities Litigation Reform Act of 1995. Words such as “will,” “expect,” “intend,” “may,” “could,” “plan,” “project,” “forecast,” “believe,” “estimate,” “outlook,” “anticipate,” “trends,” “goals” and similar expressions generally identify these forward-looking statements. Forward-looking statements include, among other things, statements relating to our future financial condition, results of operations and/or cash flows. Forward-looking statements are based upon assumptions, expectations, plans and projections that we believe to be reasonable when made, but which may change over time. These statements are not guarantees of future performance and inherently involve a wide range of risks and uncertainties that are difficult to predict. Specific risks that could cause actual results to differ materially from those expressed or implied in these forward-looking statements include, but are not limited to, those identified under “Risk Factors” and other important factors disclosed in this report and from time to time in our other filings with the SEC. They include:
|
•
|
our dependence on the U.S. Government for a substantial portion of our business
|
|
•
|
significant delays or reductions in appropriations for our programs and U.S. Government funding more broadly
|
|
•
|
investigations, claims, disputes, enforcement actions and/or litigation
|
|
•
|
the use of estimates when accounting for our contracts and the effect of contract cost growth and/or changes in estimated contract revenues and costs
|
|
•
|
our exposure to additional risks as a result of our international business, including risks related to geopolitical and economic factors, laws and regulations
|
|
•
|
the improper conduct of employees, agents, subcontractors, suppliers, business partners or joint ventures in which we participate and the impact on our reputation, our ability to do business, and our financial position, results of operations and/or cash flows
|
-
18
-
NORTHROP GRUMMAN CORPORATION
|
•
|
cyber and other security threats or disruptions faced by us, our customers or our suppliers and other partners
|
|
•
|
the performance and financial viability of our subcontractors and suppliers and the availability and pricing of raw materials and components
|
|
•
|
changes in procurement and other laws, regulations and practices applicable to our industry, findings by the U.S. Government as to our compliance with such laws and regulations, and changes in our customers’ business practices globally
|
|
•
|
increased competition within our markets and bid protests
|
|
•
|
the ability to maintain a qualified workforce
|
|
•
|
our ability to meet performance obligations under our contracts, including obligations that are technologically complex, require certain manufacturing expertise or are dependent on factors not wholly within our control
|
|
•
|
environmental matters, including unforeseen environmental costs and government and third party claims
|
|
•
|
natural and/or environmental disasters
|
|
•
|
the adequacy and availability of our insurance coverage, customer indemnifications or other liability protections
|
|
•
|
products and services we provide related to hazardous and high risk operations, which subject us to various environmental, regulatory, financial, reputational and other risks
|
|
•
|
the future investment performance of plan assets, changes in actuarial assumptions associated with our pension and other post-retirement benefit plans and legislative or other regulatory actions impacting our pension, post-retirement and health and welfare plans
|
|
•
|
the satisfaction of conditions (including regulatory approvals) to and successful consummation of the Orbital ATK Acquisition; our ability successfully to integrate the Orbital ATK business and realize fully the anticipated benefits of the acquisition, without adverse consequences
|
|
•
|
our ability to exploit or protect intellectual property rights
|
|
•
|
our ability to develop new products and technologies and maintain technologies, facilities, and equipment to win new competitions and meet the needs of our customers
|
|
•
|
changes in business conditions that could impact business investments and/or recorded goodwill or the value of other long-lived assets
|
|
•
|
unanticipated changes in our tax provisions or exposure to additional tax liabilities
|
You are urged to consider the limitations on, and risks associated with, forward-looking statements and not unduly rely on the accuracy of forward-looking statements. These forward-looking statements speak only as of the date this report is first filed or, in the case of any document incorporated by reference, the date of that document. We undertake no obligation to publicly update or revise any forward-looking statements, whether as a result of new information, future events or otherwise, except as required by applicable law.
At
December 31, 2017
, we had approximately
35 million
square feet of floor space at
424
separate locations, primarily in the U.S., for manufacturing, warehousing, research and testing, administration and various other uses. At
December 31, 2017
, we leased to third parties approximately
220,000
square feet of our owned and leased facilities.
At
December 31, 2017
, we had major operations at the following locations:
Aerospace Systems
Azusa, Carson, El Segundo, Manhattan Beach, Mojave, Oxnard, Palmdale, Redondo Beach and San Diego, CA; Melbourne and St. Augustine, FL; Devens, MA; Moss Point, MS; and Oklahoma City, OK.
Mission Systems
Huntsville, AL; McClellan, Redondo Beach, San Diego, Sunnyvale and Woodland Hills, CA; Aurora and Colorado Springs, CO; Apopka, FL; Rolling Meadows, IL; Annapolis, Annapolis Junction, Elkridge, Halethorpe, Linthicum
-
19
-
NORTHROP GRUMMAN CORPORATION
and Sykesville, MD; Bethpage and Williamsville, NY; Beavercreek and Cincinnati, OH; Salt Lake City, UT; and Chantilly, Charlottesville, Fairfax, McLean and Richmond, VA. Locations outside the U.S. include Germany, Italy and the United Kingdom.
Technology Services
Sierra Vista, AZ; Warner Robins, GA; Lake Charles, LA; Baltimore, MD; and Chester and Herndon, VA. Locations outside the U.S. include Australia and France.
Corporate
Falls Church and Lebanon, VA and Irving, TX.
The following is a summary of our floor space at
December 31, 2017
:
|
Square feet (in thousands)
|
Owned
|
Leased
|
U.S. Government
Owned/Leased
|
Total
|
||||||||
|
Aerospace Systems
|
6,775
|
|
7,164
|
|
2,761
|
|
16,700
|
|
||||
|
Mission Systems
|
8,783
|
|
5,588
|
|
—
|
|
14,371
|
|
||||
|
Technology Services
|
434
|
|
2,772
|
|
1
|
|
3,207
|
|
||||
|
Corporate
|
657
|
|
444
|
|
—
|
|
1,101
|
|
||||
|
Total
|
16,649
|
|
15,968
|
|
2,762
|
|
35,379
|
|
||||
We maintain our properties in good operating condition and believe that the productive capacity of our properties is adequate to meet current contractual requirements and those for the foreseeable future.
We have provided information about certain legal proceedings in which we are involved in Notes
11
and 12 to the consolidated financial statements.
We are a party to various investigations, lawsuits, claims, enforcement actions and other legal proceedings, including government investigations and claims, that arise in the ordinary course of our business. These types of matters could
result in administrative, civil or criminal fines, penalties or other sanctions (which terms include judgments or convictions and consent or other voluntary decrees or agreements); compensatory, treble or other damages; non-monetary relief or actions; or other liabilities
. Government regulations provide that certain allegations against a contractor may lead to suspension or debarment from future government contracts or suspension of export privileges for the company or one or more of its components. The nature of legal proceedings is such that we cannot assure the outcome of any particular matter. For additional information on pending matters, please see Note
11
to the consolidated financial statements, and for further information on the risks we face from existing and future investigations, lawsuits, claims, enforcement actions and other legal proceedings, please see “Risk Factors.”
No information is required in response to this item.
-
20
-
NORTHROP GRUMMAN CORPORATION
COMMON STOCK
We have
800,000,000
shares authorized at a
$1
par value per share, of which
174,085,619
shares and
175,068,263
shares were issued and outstanding as of
December 31, 2017
and
2016
, respectively.
PREFERRED STOCK
We have
10,000,000
shares authorized at a
$1
par value per share, of which
no
shares were issued and outstanding as of
December 31, 2017
and
2016
.
DIVIDENDS AND MARKET INFORMATION
Our common stock is listed on the New York Stock Exchange and trades under the symbol NOC.
The following table sets forth, for the periods indicated, quarterly dividends declared per common share and the intraday low and high prices of our common stock as reported in the consolidated reporting system for the New York Stock Exchange Composite Transactions.
|
Dividends per common share
|
Stock prices (Low - High)
|
|||||||||||
|
2017
|
2016
|
2017
|
2016
|
|||||||||
|
First Quarter
|
$
|
0.90
|
|
$
|
0.80
|
|
$223.88 - $249.43
|
$175.00 - $200.78
|
||||
|
Second Quarter
|
|
1.00
|
|
|
0.90
|
|
235.16 - 262.59
|
198.75 - 223.42
|
||||
|
Third Quarter
|
|
1.00
|
|
|
0.90
|
|
256.65 - 287.81
|
206.69 - 224.12
|
||||
|
Fourth Quarter
|
|
1.00
|
|
|
0.90
|
|
287.22 - 311.15
|
212.02 - 253.80
|
||||
|
Total
|
$
|
3.90
|
|
$
|
3.50
|
|
$223.88 - $311.15
|
$175.00 - $253.80
|
||||
HOLDERS
The approximate number of common stockholders was
23,420
as of
January 25, 2018
.
PURCHASES OF EQUITY SECURITIES BY THE ISSUER AND AFFILIATED PURCHASERS
We had no repurchases of common stock during the three months ended
December 31, 2017
. The approximate dollar value of shares that may yet be purchased as part of the company’s publicly announced plans or programs is
$2.3 billion
as of December 31, 2017.
Share repurchases take place from time to time, subject to market conditions and management’s discretion, in the open market or in privately negotiated transactions. The company retires its common stock upon repurchase
.
See Note
3
to the consolidated financial statements for further information on our share repurchase programs.
-
21
-
NORTHROP GRUMMAN CORPORATION
STOCK PERFORMANCE GRAPH
Comparison of Cumulative Five Year Total Return
Among Northrop Grumman, the S&P 500 Index and the S&P Aerospace & Defense (A&D) Index
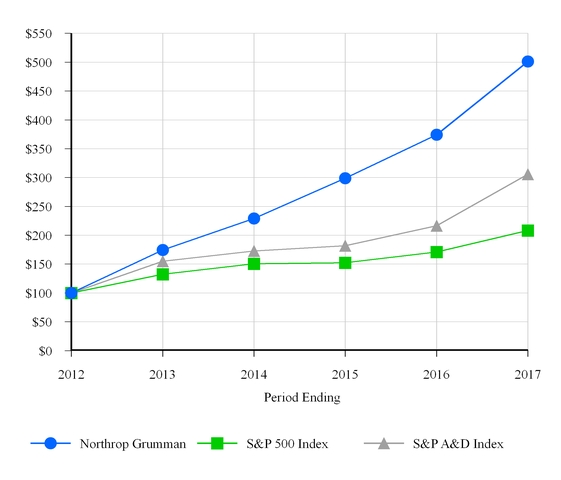
|
•
|
Assumes $100 invested at the close of business on
December 31, 2012
, in Northrop Grumman Corporation common stock, Standard & Poor’s (S&P) 500 Index and the S&P Aerospace & Defense Index.
|
|
•
|
The cumulative total return assumes reinvestment of dividends.
|
|
•
|
The S&P Aerospace & Defense Index is comprised of Arconic, Inc., The Boeing Company, General Dynamics Corporation, Harris Corporation, L3 Technologies, Inc., Lockheed Martin Corporation, Northrop Grumman Corporation, Raytheon Company, Rockwell Collins, Inc., Textron, Inc., TransDigm Group and United Technologies Corporation.
|
|
•
|
The total return is weighted according to market capitalization of each company at the beginning of each year.
|
|
•
|
This graph is not deemed to be “filed” with the U.S. Securities and Exchange Commission (SEC) or subject to the liabilities of Section 18 of the Securities Exchange Act of 1934 (the Exchange Act), and should not be deemed to be incorporated by reference into any of our prior or subsequent filings under the Securities Act of 1933 or the Exchange Act.
|
-
22
-
NORTHROP GRUMMAN CORPORATION
Item
6
. Selected Financial Data
The data presented in the following table is derived from the audited consolidated financial statements and other information.
SELECTED FINANCIAL DATA
|
|
Year Ended December 31
|
|||||||||||||||||||
|
$ in millions, except per share amounts
|
2017
|
2016
|
2015
|
2014
|
2013
|
|||||||||||||||
|
Sales
|
||||||||||||||||||||
|
U.S. Government
(1)
|
$
|
21,837
|
|
$
|
20,573
|
|
$
|
19,458
|
|
$
|
20,085
|
|
$
|
21,278
|
|
|||||
|
International
(2)
|
3,302
|
|
3,205
|
|
3,339
|
|
3,045
|
|
2,493
|
|
||||||||||
|
Other Customers
|
664
|
|
730
|
|
729
|
|
849
|
|
890
|
|
||||||||||
|
Total sales
|
25,803
|
|
24,508
|
|
23,526
|
|
23,979
|
|
24,661
|
|
||||||||||
|
Operating income
|
3,299
|
|
3,193
|
|
3,076
|
|
3,196
|
|
3,123
|
|
||||||||||
|
Net earnings
|
2,015
|
|
2,200
|
|
1,990
|
|
2,069
|
|
1,952
|
|
||||||||||
|
Basic earnings per share
|
$
|
11.55
|
|
$
|
12.30
|
|
$
|
10.51
|
|
$
|
9.91
|
|
$
|
8.50
|
|
|||||
|
Diluted earnings per share
|
11.47
|
|
12.19
|
|
10.39
|
|
9.75
|
|
8.35
|
|
||||||||||
|
Cash dividends declared per common share
|
3.90
|
|
3.50
|
|
3.10
|
|
2.71
|
|
2.38
|
|
||||||||||
|
Year-End Financial Position
|
||||||||||||||||||||
|
Total assets
|
$
|
34,917
|
|
$
|
25,614
|
|
$
|
24,424
|
|
$
|
26,545
|
|
$
|
26,351
|
|
|||||
|
Notes payable to banks and long-term debt
|
15,266
|
|
7,070
|
|
6,496
|
|
5,901
|
|
5,900
|
|
||||||||||
|
Other long-term obligations
(3)
|
6,505
|
|
7,667
|
|
7,059
|
|
7,520
|
|
4,018
|
|
||||||||||
|
Financial Metrics
|
||||||||||||||||||||
|
Net cash provided by operating activities
|
$
|
2,613
|
|
$
|
2,813
|
|
$
|
2,162
|
|
$
|
2,593
|
|
$
|
2,483
|
|
|||||
|
Free cash flow
(4)
|
1,685
|
|
1,893
|
|
1,691
|
|
2,032
|
|
2,119
|
|
||||||||||
|
Other Information
|
||||||||||||||||||||
|
Company-sponsored research and development expenses
|
$
|
639
|
|
$
|
705
|
|
$
|
712
|
|
$
|
569
|
|
$
|
507
|
|
|||||
|
Total backlog
|
42,878
|
|
45,339
|
|
35,923
|
|
38,199
|
|
37,033
|
|
||||||||||
|
Square footage at year-end (in thousands)
|
35,379
|
|
34,112
|
|
34,392
|
|
34,264
|
|
34,500
|
|
||||||||||
|
Number of employees at year-end
|
70,000
|
|
67,000
|
|
65,000
|
|
64,300
|
|
65,300
|
|
||||||||||
|
(1)
|
Sales to the
United States (U.S.)
Government include sales from contracts for which we are the prime contractor, as well as those for which we are a subcontractor and the ultimate customer is the U.S. Government. Each of the company’s segments derives substantial revenue from the U.S. Government.
|
|
(2)
|
International sales include sales from contracts for which we are the prime contractor, as well as those for which we are a subcontractor and the ultimate customer is an international customer. These sales include foreign military sales contracted through the U.S. Government, direct sales with governments outside the U.S. and commercial sales outside the U.S.
|
|
(3)
|
Other long-term obligations include pension and other post-retirement benefit plan liabilities, deferred compensation, unrecognized tax benefits, environmental liabilities and other long-term obligations.
|
|
(4)
|
Free cash flow is a non-GAAP measure defined as net cash
provided by
operating activities less capital expenditures, and may not be defined and calculated by other companies in the same manner. We use free cash flow as a key factor in our planning for, and consideration of, acquisitions, stock repurchases, and the payment of dividends. This measure may be useful to investors and other users of our financial statements as a supplemental measure of our cash performance, but should not be considered in isolation, as a measure of residual cash flow available for discretionary purposes, or as an alternative to operating cash flows presented in accordance with
accounting principles generally accepted in the United States of America (“GAAP” or “FAS”). See “Liquidity and Capital Resources” – “
Free Cash Flow
” in Management’s Discussion and Analysis of Financial Conditions and Results of Operations (MD&A) for more information on this measure, including a reconciliation of free cash flow to net cash
provided by
operating activities.
|
-
23
-
NORTHROP GRUMMAN CORPORATION
Item
7
. Management’s Discussion and Analysis of Financial Condition and Results of Operations
OVERVIEW
Pending Acquisition of Orbital ATK
On September 17, 2017, the company entered into a definitive merger agreement to acquire all of the outstanding shares of Orbital ATK, Inc. (Orbital ATK) for approximately
$7.8 billion
in cash, plus the assumption of approximately
$1.4 billion
in net debt (the “Orbital ATK Acquisition”).
See Item 1.01 in our Current Report on Form 8-K filed with the SEC on September 18, 2017 for a summary and copy of the merger agreement.
We believe this acquisition will enable us to broaden our capabilities and offerings, create value for shareholders, provide expanded opportunities for our combined employees and enhance our ability to provide innovative solutions to meet our customers’ emerging requirements.
Under the terms of the merger agreement, Orbital ATK shareholders are to receive all-cash consideration of
$134.50
per share. We expect to fund the Orbital ATK Acquisition with the proceeds from our debt financing completed in October 2017 and cash on hand.
See Note 10
to the consolidated financial statements
for further information on our Orbital ATK Acquisition financing. On November 29, 2017, Orbital ATK shareholders approved the proposed Orbital ATK Acquisition. We currently expect the transaction to close in the first half of 2018, after receiving regulatory approvals.
Upon completion of the Orbital ATK Acquisition, we plan to establish Orbital ATK as a new, fourth business sector named Northrop Grumman Innovation Systems.
U.S. Tax Reform
In December 2017, the Tax Cuts and Jobs Act (the “2017 Tax Act”) was enacted. The 2017 Tax Act represents major tax reform legislation that, among other provisions, reduces the U.S. corporate tax rate. Certain income tax effects of the 2017 Tax Act, including $300 million of tax expense recorded principally due to the write-down of our net deferred tax assets, are reflected in our financial results in accordance with Staff Accounting Bulletin No. 118 (SAB 118), which provides SEC staff guidance regarding the application of Accounting Standards Codification (ASC) Topic 740,
Income Taxes
, in the reporting period in which the 2017 Tax Act became law. See Note 7 to the consolidated financial statements for further information on the financial statement impact of the 2017 Tax Act.
Global Security and Economic Environment
The U.S. and its allies continue to face a global security environment of heightened tensions and instability, threats from state and non-state actors as well as terrorist organizations, emerging nuclear tensions and diverse regional security concerns. Global threats persist across all domains, from undersea to space to cyber. The market for defense products, services and solutions globally is driven by these complex and evolving security challenges, considered in the broader context of political and socioeconomic priorities.
The global economic environment also continues to be marked by uncertainty, instability and geopolitical tensions. Global economic growth is expected to remain in the low single digits in 2018, reflecting the impact of and uncertainty surrounding geopolitical tensions globally and financial market volatility. The global economy may also be affected by Britain’s exit from the European Union, the impact of which is not known at this time. Global economic conditions could impact customer purchasing decisions.
U.S. Political and Economic Environment
The U.S. continues to face an uncertain political environment and substantial fiscal and economic challenges, which affect funding for discretionary and non-discretionary budgets. Part I of the Budget Control Act of 2011 (the BCA) provided for a reduction in planned defense budgets by at least $487 billion over a ten year period. Part II mandated substantial additional reductions, through a process known as “sequestration,” which took effect in March 2013.
On November 2, 2015, the President signed the Bipartisan Budget Act of 2015 (the Budget Act). The Budget Act raised the debt ceiling until March 2017 and raised the sequester caps imposed by the BCA by $80 billion, split equally between defense and non-defense discretionary spending in the Government’s FY 2016 and FY 2017 ($50 billion in FY 2016 and $30 billion in FY 2017). Sequestration spending caps under the BCA could reduce defense spending again in FY 2018.
On February 9, 2016, the President delivered his FY 2017 budget to Congress. The FY 2017 budget reflected the FY 2017 spending caps established in the Budget Act and requested $583 billion for the DoD’s annual budget, including $59 billion for OCO. The President signed a continuing resolution in September 2016, which was extended in December 2016 and provided funding for the U.S. Government at FY 2016 levels through April 28, 2017.
In March 2017, the debt ceiling was reached and the Treasury Department began taking “extraordinary measures” to finance the government and avoid a breach of the debt ceiling. On September 8, 2017, the debt ceiling was suspended for three months and on December 9, 2017, the Treasury Department again began taking extraordinary
-
24
-
NORTHROP GRUMMAN CORPORATION
measures to finance the government. It is expected that the Treasury Department will run out of the ability to take extraordinary measures to finance the government in the first half of 2018.
In May 2017, the President signed into law the FY 2017 Consolidated Appropriations Act. In total for FY 2017, Congress appropriated $524 billion in base discretionary funding for the DoD, consistent with the Budget Act. Congress also appropriated approximately $68 billion in OCO funding and approximately $15 billion in additional DoD appropriations.
In May 2017, the President released his FY 2018 budget request, which seeks $575 billion for the DoD’s base budget, approximately $52 billion above the statutory caps provided for in the BCA. The President’s budget request also seeks an additional $65 billion in OCO funding for expeditionary needs, not capped by the BCA. On September 8, 2017, the President signed a continuing resolution which generally funded the government at FY 2017 levels through December 8, 2017. The continuing resolution was extended to December 22, 2017 and further extended to January 19, 2018. As Congress did not enact appropriations legislation or a new continuing resolution by January 19, 2018, on January 20, 2018, the U.S. Government temporarily shut down. On January 22, 2018, a fourth continuing resolution was enacted, which funds the government through February 8, 2018.
The federal budget and debt ceiling are expected to continue to be the subject of considerable debate, which could have a significant impact on defense spending broadly and the company's programs in particular.
For further information on the risks we face from the current political and economic environment, see “Risk Factors.”
Operating Performance Assessment and Reporting
We manage and assess our business based on our performance on contracts and programs (typically larger contracts or two or more closely-related contracts). We recognize sales from our portfolio of long-term contracts primarily using the cost-to-cost method of percentage of completion accounting, but in some cases we utilize the units-of-delivery method of percentage of completion accounting. As a result, sales tend to fluctuate in concert with costs incurred and units delivered across our large portfolio of contracts. Due to Federal Acquisition Regulation (FAR) rules that govern our U.S. Government business and related Cost Accounting Standards (CAS), most types of costs are allocable to U.S. Government contracts. As such, we do not focus on individual cost groupings (such as manufacturing, engineering and design labor, subcontractor, material, overhead and general and administrative (G&A) costs), as much as we do on total contract cost, which is the key driver of our sales and operating income.
In evaluating our operating performance, we look primarily at changes in sales and operating income. Where applicable, significant fluctuations in operating performance attributable to individual contracts or programs, or changes in a specific cost element across multiple contracts, are described in our analysis. Based on this approach and the nature of our operations, the discussion of results of operations below first focuses on our three segments before distinguishing between products and services. Changes in sales are generally described in terms of volume, deliveries or other indicators of sales activity. Changes in margin rates are generally described in terms of performance and contract mix. For purposes of this discussion, volume generally refers to increases or decreases in sales or cost from production/service activity levels or delivery rates. Performance generally refers to non-volume related changes in profitability. Contract mix generally refers to changes in the ratio of contract type and/or lifecycle (e.g., cost-type, fixed-price, development, production, and/or sustainment).
-
25
-
NORTHROP GRUMMAN CORPORATION
CONSOLIDATED OPERATING RESULTS
Selected financial highlights are presented in the table below:
|
|
Year Ended December 31
|
% Change in
|
|||||||||||||||
|
$ in millions, except per share amounts
|
2017
|
2016
|
2015
|
2017
|
|
2016
|
|||||||||||
|
Sales
|
$
|
25,803
|
|
$
|
24,508
|
|
$
|
23,526
|
|
5
|
%
|
4
|
%
|
||||
|
Operating costs and expenses
|
22,504
|
|
21,315
|
|
20,450
|
|
6
|
%
|
4
|
%
|
|||||||
|
Operating costs and expenses as a % of sales
|
87.2
|
%
|
87.0
|
%
|
86.9
|
%
|
|||||||||||
|
Operating income
|
3,299
|
|
3,193
|
|
3,076
|
|
3
|
%
|
4
|
%
|
|||||||
|
Operating margin rate
|
12.8
|
%
|
13.0
|
%
|
13.1
|
%
|
|||||||||||
|
Federal and foreign income tax expense
|
1,034
|
|
723
|
|
800
|
|
43
|
%
|
(10
|
)%
|
|||||||
|
Effective income tax rate
|
33.9
|
%
|
24.7
|
%
|
28.7
|
%
|
|||||||||||
|
Net earnings
|
2,015
|
|
2,200
|
|
1,990
|
|
(8
|
)%
|
11
|
%
|
|||||||
|
Diluted earnings per share
|
11.47
|
|
12.19
|
|
10.39
|
|
(6
|
)%
|
17
|
%
|
|||||||
Sales
2017
–
Sales
increased
$1.3 billion
, or
5 percent
, as compared with
2016
, primarily due to higher sales at Aerospace Systems and Mission Systems.
2016
–
Sales
increased
$982 million
, or
4 percent
, as compared with
2015
, primarily due to higher sales at Aerospace Systems and Mission Systems.
See “Revenue Recognition” in Note
1
to the consolidated financial statements for further information on sales by customer category. See “Segment Operating Results” below for further information by segment and “Product and Service Analysis” for product and service detail.
Operating Income
2017
–
Operating income
increased
$106 million
, or
3 percent
, as compared with
2016
, primarily due to a $278 million increase in our net FAS/CAS pension adjustment and a
$24 million
increase in segment operating income, partially offset by a $197 million increase in unallocated corporate expenses, as described in “Segment Operating Results.” Higher operating costs and expenses as a percentage of sales reduced our operating margin rate to
12.8 percent
from
13.0 percent
in the prior year period and was driven by the increase in unallocated corporate expenses and a lower segment operating margin rate, as described in “Segment Operating Results,” partially offset by the increase in our net FAS/CAS pension adjustment.
G&A as a percentage of sales
decreased
to
10.3 percent
in
2017
from
10.5 percent
in
2016
, principally due to higher sales volume.
2016
– Operating income
increased
$117 million
, or
4 percent
, as compared with
2015
, primarily due to a
$137 million
reduction in unallocated corporate expenses and higher sales volume, partially offset by a
$32 million
decrease in our net FAS/CAS pension adjustment and lower segment margin rates. Operating costs and expenses as a percentage of sales increased slightly in
2016
as compared with
2015
, which reduced our operating margin rate to
13.0 percent
from
13.1 percent
in the prior year period. The decrease in operating margin rate was driven by a lower segment operating margin rate and a
$32 million
decrease in our net FAS/CAS pension adjustment, partially offset by a
$137 million
reduction in unallocated corporate expenses, as described in “Segment Operating Results.”
G&A as a percentage of sales
decreased
to
10.5 percent
in
2016
from
10.9 percent
in
2015
, principally due to higher sales volume.
For further information regarding product and service operating costs and expenses, see “Product and Service Analysis” below.
Federal and Foreign Income Taxes
2017
– Our effective tax rate for
2017
was
33.9 percent
, as compared with
24.7 percent
in
2016
.
The higher rate is principally due to
$300 million
of tax expense recorded in connection with the 2017 Tax Act, largely due to the write-down of net deferred tax assets, partially offset by a
$69 million
increase in research credits and a
$39 million
benefit recognized for additional manufacturing deductions principally related to prior years. The effective tax rates for the years ended December 31, 2017 and 2016 each include separate approximately
$40 million
benefits
-
26
-
NORTHROP GRUMMAN CORPORATION
recognized in connection with the resolution of Internal Revenue Service (IRS) examinations of the company’s prior year tax returns.
2016
– Our effective tax rate for
2016
was
24.7 percent
, as compared with
28.7 percent
in
2015
. The lower rate is principally due to
$85 million
of excess tax benefits related to employee share-based payment transactions recognized in 2016, a
$40 million
benefit recognized in connection with resolution of the IRS examination of the company’s 2007-2011 tax returns and a
$33 million
benefit recognized in connection with the repatriation of earnings from certain of our foreign subsidiaries
. These benefits were partially offset by a
$58 million
decrease in research credits, which were principally a result of credits recorded in 2015 that were claimed on our prior year tax returns.
Net Earnings
2017
– Net earnings for
2017
decreased
$185 million
, or
8 percent
, as compared with
2016
, primarily due to the higher effective tax rate discussed above and higher interest expense resulting from our debt issuance in October 2017, as described in Note
10
to the consolidated financial statements. These decreases were partially offset by higher operating income and an increase in Other, net as a result of gains on the sale of two investments and higher interest income on short-term investments.
2016
– Net earnings for
2016
increased
$210 million
, or
11 percent
, as compared with
2015
, primarily due to the higher operating income and lower effective tax rate discussed above.
Diluted Earnings Per Share
2017
– Diluted earnings per share for
2017
decreased
$0.72
, or
6 percent
, as compared with
2016
. The decrease is primarily due to the
8 percent
decline in net earnings discussed above, partially offset by a
3 percent
reduction in weighted-average shares outstanding resulting principally from shares repurchased during 2016.
2016
– Diluted earnings per share for
2016
increased
$1.80
, or
17 percent
, as compared with
2015
. The increase is primarily due to the
11 percent
increase in net earnings discussed above and a
6 percent
reduction in weighted-average shares outstanding resulting from shares repurchased during 2015 and 2016.
SEGMENT OPERATING RESULTS
Basis of Presentation
The company is aligned in three operating sectors, which also comprise our reportable segments: Aerospace Systems, Mission Systems and Technology Services. For a more complete description of each segment’s products and services, see “Business.”
We present our sectors in the following business areas, which are reported in a manner reflecting core capabilities:
|
Aerospace Systems
|
Mission Systems
|
Technology Services
|
||
|
Autonomous Systems
|
Sensors and Processing
|
Global Logistics and Modernization
|
||
|
Manned Aircraft
|
Cyber and ISR
|
Advanced Defense Services
|
||
|
Space
|
Advanced Capabilities
|
System Modernization and Services
|
||
This section discusses segment sales, operating income and operating margin rates. A reconciliation of segment operating income to total operating income is provided below.
-
27
-
NORTHROP GRUMMAN CORPORATION
Segment Operating Income and Margin Rate
Segment operating income, as reconciled in the Reconciliation of Segment Operating Income to Total Operating Income section below, is a non-GAAP measure that reflects total earnings from our three segments, including allocated pension expense recognized under CAS, and excluding unallocated corporate items and FAS pension expense. This measure may be useful to investors and other users of our financial statements as a supplemental measure in evaluating the financial performance and operational trends of our sectors. This measure may not be defined and calculated by other companies in the same manner and should not be considered in isolation or as an alternative to operating results presented in accordance with GAAP.
|
|
Year Ended December 31
|
% Change in
|
|||||||||||||||
|
$ in millions
|
2017
|
2016
|
2015
|
2017
|
2016
|
||||||||||||
|
Segment operating income
|
$
|
2,959
|
|
$
|
2,935
|
|
$
|
2,920
|
|
1
|
%
|
1
|
%
|
||||
|
Segment operating margin rate
|
11.5
|
%
|
12.0
|
%
|
12.4
|
%
|
|||||||||||
2017
-
Segment operating income for
2017
increased
$24 million
, or
1 percent
, as compared with
2016
and includes higher operating income at all three sectors. The higher operating income includes a
$56 million
favorable EAC adjustment at Aerospace Systems on a restricted program largely related to performance incentives and $54 million recognized to date in connection with a claim related to certain costs incurred in prior years (the “Cost Claim”). Segment operating margin rate
decreased
to
11.5 percent
from
12.0 percent
in
2016
principally due to lower segment margin rates at Aerospace Systems and Mission Systems, partially offset by a higher segment margin rate at Technology Services.
2016
-
Segment operating income for
2016
increased
$15 million
, or
1 percent
, as compared with
2015
as a result of higher sales volume, which more than offset the lower segment operating margin rate. Segment operating margin rate
decreased
to
12.0 percent
from
12.4 percent
in 2015 principally due to a lower segment margin rate at Aerospace Systems.
Reconciliation of Segment Operating Income to Total Operating Income -
The table below reconciles segment operating income to total operating income by including the impact of the net FAS/CAS pension adjustment, as well as unallocated corporate expenses (certain corporate-level expenses, which are not considered allowable or allocable under applicable CAS or the FAR). See Note
4
to the consolidated financial statements for further information on the net FAS/CAS pension adjustment and unallocated corporate expenses.
|
Year Ended December 31
|
% Change in
|
||||||||||||||||
|
$ in millions
|
2017
|
2016
|
2015
|
2017
|
2016
|
||||||||||||
|
Segment operating income
|
$
|
2,959
|
|
$
|
2,935
|
|
$
|
2,920
|
|
1
|
%
|
1
|
%
|
||||
|
CAS pension expense
|
1,026
|
|
847
|
|
703
|
|
21
|
%
|
20
|
%
|
|||||||
|
Less: FAS pension expense
|
(432
|
)
|
(531
|
)
|
(355
|
)
|
(19
|
)%
|
50
|
%
|
|||||||
|
Net FAS/CAS pension adjustment
|
594
|
|
316
|
|
348
|
|
88
|
%
|
(9
|
)%
|
|||||||
|
Unallocated corporate expenses
|
(250
|
)
|
(53
|
)
|
(190
|
)
|
372
|
%
|
(72
|
)%
|
|||||||
|
Other
|
(4
|
)
|
(5
|
)
|
(2
|
)
|
(20
|
)%
|
150
|
%
|
|||||||
|
Total operating income
|
$
|
3,299
|
|
$
|
3,193
|
|
$
|
3,076
|
|
3
|
%
|
4
|
%
|
||||
2017
- The
increase
in net FAS/CAS pension adjustment is primarily due to higher CAS expense and lower FAS expense than in the prior year period. The increase in CAS expense relates to the continued phase-in of CAS harmonization and the impact of actual demographic experience, partially offset by a change in our mortality assumption as of December 31, 2016. The reduction in FAS expense was principally driven by our year-end 2016 FAS pension assumptions, including the noted change in our mortality assumption offset by a lower discount rate.
2016
- The
decrease
in net FAS/CAS pension adjustment is primarily due to lower than expected asset returns during 2015, partially offset by the increase in our FAS discount rate assumption as of
December 31, 2015
and the continued phase-in of CAS harmonization.
2017
- Unallocated corporate expenses
increased
in
2017
, as compared to
2016
, primarily due to
$47 million
of costs associated with the Orbital ATK Acquisition and
$41 million
of deferred state tax expense resulting from state tax adjustments associated with the filing of our prior year federal tax return and the company's $500 million discretionary pension contribution in December 2017. In addition, the prior year period included a
$35 million
-
28
-
NORTHROP GRUMMAN CORPORATION
benefit recognized for state tax refunds claimed on our prior year tax returns and a
$25 million
benefit recognized for estimated prior year overhead claim recoveries.
2016
- Unallocated corporate expenses
declined
in
2016
, as compared to
2015
. In
2016
, unallocated corporate expenses included a
$35 million
benefit recognized for state tax refunds claimed on our prior year tax returns and a
$25 million
benefit recognized for estimated prior year overhead claim recoveries. In
2015
, unallocated corporate expenses included a
$45 million
expense recognized for deferred state income taxes due to a change in accounting methods approved by the IRS that lowered our deductions for domestic production activities and a
$25 million
expense recognized for deferred state income taxes resulting from a discretionary pension contribution.
Net Estimate-At-Completion (EAC) Adjustments -
We record changes in estimated contract earnings at completion (net EAC adjustments) using the cumulative catch-up method of accounting. Net EAC adjustments can have a significant effect on reported sales and operating income and the aggregate amounts are presented in the table below:
|
Year Ended December 31
|
|||||||||||
|
$ in millions
|
2017
|
2016
|
2015
|
||||||||
|
Favorable EAC adjustments
|
$
|
668
|
|
$
|
765
|
|
$
|
924
|
|
||
|
Unfavorable EAC adjustments
|
(305
|
)
|
(271
|
)
|
(344
|
)
|
|||||
|
Net EAC adjustments
|
$
|
363
|
|
$
|
494
|
|
$
|
580
|
|
||
Net EAC adjustments by segment are presented in the table below:
|
Year Ended December 31
|
|||||||||||
|
$ in millions
|
2017
|
2016
|
2015
|
||||||||
|
Aerospace Systems
|
$
|
246
|
|
$
|
263
|
|
$
|
352
|
|
||
|
Mission Systems
|
79
|
|
191
|
|
169
|
|
|||||
|
Technology Services
|
51
|
|
69
|
|
68
|
|
|||||
|
Eliminations
|
(13
|
)
|
(29
|
)
|
(9
|
)
|
|||||
|
Net EAC adjustments
|
$
|
363
|
|
$
|
494
|
|
$
|
580
|
|
||
For purposes of the discussion in the remainder of this Segment Operating Results section, references to operating income and operating margin rate reflect segment operating income and segment operating margin rate, respectively.
AEROSPACE SYSTEMS
|
|
Year Ended December 31
|
% Change in
|
|||||||||||||||
|
$ in millions
|
2017
|
2016
|
2015
|
2017
|
2016
|
||||||||||||
|
Sales
|
$
|
11,955
|
|
$
|
10,828
|
|
$
|
9,940
|
|
10
|
%
|
9
|
%
|
||||
|
Operating income
|
1,259
|
|
1,236
|
|
1,205
|
|
2
|
%
|
3
|
%
|
|||||||
|
Operating margin rate
|
10.5
|
%
|
11.4
|
%
|
12.1
|
%
|
|||||||||||
2017
-
Aerospace Systems sales for
2017
increased
$1.1 billion
, or
10 percent
, as compared with
2016
, primarily due to higher volume on Manned Aircraft programs. Manned Aircraft sales were driven by higher restricted sales. Autonomous Systems sales increased principally due to higher volume for several programs, including Triton, partially offset by lower NATO Alliance Ground Surveillance (AGS) volume. Space sales increased primarily due to higher restricted sales, partially offset by lower volume on the James Webb Space Telescope (JWST) and Advanced Extremely High Frequency (AEHF) programs.
Operating income for
2017
increased
$23 million
, or
2 percent
, primarily due to higher sales, partially offset by a lower operating margin rate. Operating margin rate
decreased
to
10.5 percent
from
11.4 percent
principally due to changes in contract mix on Manned Aircraft programs and a gain of
$45 million
recognized in the prior year associated with the sale of a property, partially offset by the previously discussed
$56 million
favorable EAC adjustment largely related to performance incentives.
2016
-
Aerospace Systems sales for
2016
increased
$888 million
, or
9 percent
, as compared with
2015
. The increase was due to higher volume on Manned Aircraft and Autonomous Systems programs. Manned Aircraft sales increased primarily due to higher restricted volume, increased F-35 deliveries and production ramp-up on the E-2D program.
-
29
-
NORTHROP GRUMMAN CORPORATION
These increases were partially offset by lower B-2 volume and fewer F/A-18 deliveries. Autonomous Systems sales increased primarily due to higher volume on the Triton and Global Hawk programs, partially offset by ramp-down of the NATO AGS program. Space sales include higher volume on restricted programs, partially offset by lower volume on the AEHF program.
Operating income for
2016
increased
$31 million
, or
3 percent
, and includes a gain of
$45 million
associated with the sale of a property. Higher sales volume and improved performance on Space and Autonomous Systems programs were more than offset by lower margins on Manned Aircraft programs, principally due to changes in contract mix and the timing of risk reductions. Operating margin rate
decreased
to
11.4 percent
from
12.1 percent
primarily due to the lower margins on Manned Aircraft programs, partially offset by improved performance on Space and Autonomous Systems programs.
MISSION SYSTEMS
|
|
Year Ended December 31
|
% Change in
|
|||||||||||||||
|
$ in millions
|
2017
|
2016
|
2015
|
2017
|
2016
|
||||||||||||
|
Sales
|
$
|
11,382
|
|
$
|
10,928
|
|
$
|
10,674
|
|
4
|
%
|
2
|
%
|
||||
|
Operating income
|
1,453
|
|
1,445
|
|
1,410
|
|
1
|
%
|
2
|
%
|
|||||||
|
Operating margin rate
|
12.8
|
%
|
13.2
|
%
|
13.2
|
%
|
|||||||||||
2017
-
Mission Systems sales for
2017
increased
$454 million
, or
4 percent
, as compared with
2016
, primarily due to higher Sensors and Processing volume, partially offset by lower Cyber and ISR volume. Sensors and Processing sales increased principally due to higher volume on F-35 sensors, electro-optical/infrared self-protection and targeting programs, communications programs and the Scalable Agile Beam Radar program. These increases were partially offset by lower volume on international ground-based radar programs. Cyber and ISR sales decreased primarily due to lower volume on ISR and restricted programs.
Operating income for
2017
increased
$8 million
, or
1 percent
, primarily due to higher sales and $32 million recognized in connection with the Cost Claim described above, partially offset by a lower operating margin rate. Operating margin rate
decreased
to
12.8 percent
from
13.2 percent
primarily due to lower margin rates on Sensors and Processing and Cyber and ISR programs principally resulting from lower performance and changes in contract mix. This decrease was partially offset by improved margin rates at Advanced Capabilities primarily due to the prior year including a
$49 million
forward loss provision on an Advanced Capabilities program as described below.
2016
-
Mission Systems sales for
2016
increased
$254 million
, or
2 percent
, as compared with
2015
due to higher volume on Sensors and Processing and Advanced Capabilities programs, partially offset by lower volume on Cyber and ISR programs. Sensors and Processing sales increased primarily due to higher volume on communications programs, including the Joint Counter Radio-Controlled Improvised Explosive Device Electronic Warfare program; increased restricted volume and ramp-up on the G/ATOR program. These increases were partially offset by lower volume on international programs. Advanced Capabilities sales increased primarily due to higher volume on restricted, maritime systems and marine systems programs. Cyber and ISR sales reflect lower volume on space programs.
Operating income for
2016
increased
$35 million
, or
2 percent
, due to the higher sales volume described above and a
$21 million
gain associated with the sale of a commercial cyber security product business, partially offset by a
$49 million
forward loss provision recorded on an Advanced Capabilities program principally due to cost growth for changes impacting fixed-price options, which may not be fully recovered through additional contract value. Operating margin rate for 2016 was consistent with the same period in 2015 and reflects improved performance on Sensors and Processing programs, partially offset by lower margins on Advanced Capabilities programs.
TECHNOLOGY SERVICES
|
|
Year Ended December 31
|
% Change in
|
|||||||||||||||
|
$ in millions
|
2017
|
2016
|
2015
|
2017
|
2016
|
||||||||||||
|
Sales
|
$
|
4,750
|
|
$
|
4,825
|
|
$
|
4,819
|
|
(2
|
)%
|
—
|
%
|
||||
|
Operating income
|
524
|
|
512
|
|
514
|
|
2
|
%
|
—
|
%
|
|||||||
|
Operating margin rate
|
11.0
|
%
|
10.6
|
%
|
10.7
|
%
|
|||||||||||
2017
-
Technology Services sales for
2017
decreased
$75 million
, or
2 percent
, as compared with
2016
, primarily due to lower volume on System Modernization and Services programs, partially offset by higher volume on Global
-
30
-
NORTHROP GRUMMAN CORPORATION
Logistics and Modernization programs. System Modernization and Services sales decreased principally due to the completion of several programs in 2016 and 2017. Global Logistics and Modernization sales increased primarily due to higher intercompany volume and increased sales on the UKAWACS and Hunter programs, partially offset by lower volume on the KC-10 program as our contract nears completion.
Operating income for
2017
increased
$12 million
, or
2 percent
, and operating margin rate
increased
to
11.0 percent
from
10.6 percent
primarily due to improved performance across the sector.
2016
-
Technology Services sales for
2016
were slightly higher than the prior year and reflect higher volume on System Modernization and Services programs, partially offset by lower volume on Advanced Defense Services and Global Logistics and Modernization programs. System Modernization and Services sales increased primarily due to higher volume on U.S. Government health programs. Advanced Defense Services sales declined primarily due to the completion of several programs in 2015, partially offset by higher volume on the Saudi Arabian Ministry of National Guard Training Support program (through our interest in a joint venture for which we consolidate the financial results). Global Logistics and Modernization sales decreased principally due to lower volume on the Intercontinental Ballistic Missile program, partially offset by higher volume on the KC-10 program.
Operating income and margin rate for
2016
were comparable to the prior year.
PRODUCT AND SERVICE ANALYSIS
The following table presents product and service sales and operating costs and expenses by segment:
|
|
Year Ended December 31
|
|||||||||||||||||||||||
|
$ in millions
|
2017
|
2016
|
2015
|
|||||||||||||||||||||
|
Segment Information:
|
Sales
|
Operating Costs and Expenses
|
Sales
|
Operating Costs and Expenses
|
Sales
|
Operating Costs and Expenses
|
||||||||||||||||||
|
Aerospace Systems
|
||||||||||||||||||||||||
|
Product
|
$
|
9,841
|
|
$
|
8,796
|
|
$
|
8,868
|
|
$
|
7,837
|
|
$
|
7,976
|
|
$
|
7,025
|
|
||||||
|
Service
|
2,114
|
|
1,900
|
|
1,960
|
|
1,755
|
|
1,964
|
|
1,710
|
|
||||||||||||
|
Mission Systems
|
||||||||||||||||||||||||
|
Product
|
6,907
|
|
5,981
|
|
6,471
|
|
5,588
|
|
6,448
|
|
5,532
|
|
||||||||||||
|
Service
|
4,475
|
|
3,948
|
|
4,457
|
|
3,895
|
|
4,226
|
|
3,732
|
|
||||||||||||
|
Technology Services
|
||||||||||||||||||||||||
|
Product
|
392
|
|
360
|
|
320
|
|
292
|
|
358
|
|
339
|
|
||||||||||||
|
Service
|
4,358
|
|
3,866
|
|
4,505
|
|
4,021
|
|
4,461
|
|
3,966
|
|
||||||||||||
|
Segment Totals
|
||||||||||||||||||||||||
|
Total Product
|
$
|
17,140
|
|
$
|
15,137
|
|
$
|
15,659
|
|
$
|
13,717
|
|
$
|
14,782
|
|
$
|
12,896
|
|
||||||
|
Total Service
|
10,947
|
|
9,714
|
|
10,922
|
|
9,671
|
|
10,651
|
|
9,408
|
|
||||||||||||
|
Intersegment eliminations
|
(2,284
|
)
|
(2,007
|
)
|
(2,073
|
)
|
(1,815
|
)
|
(1,907
|
)
|
(1,698
|
)
|
||||||||||||
|
Total Segment
(1)
|
$
|
25,803
|
|
$
|
22,844
|
|
$
|
24,508
|
|
$
|
21,573
|
|
$
|
23,526
|
|
$
|
20,606
|
|
||||||
|
(1)
|
A reconciliation of segment operating income to total operating income is included in “Segment Operating Results.”
|
Product Sales and Costs
2017
-
Product sales for
2017
increased
$1.5 billion
, or
9 percent
, as compared with
2016
. The
increase
was primarily due to higher product sales at Aerospace Systems and Mission Systems. Higher Aerospace Systems product sales were primarily driven by increased restricted volume, partially offset by lower volume on the JWST and NATO AGS programs. The increase at Mission Systems was principally due to higher product volume on F-35 sensors, EO/IR self-protection and targeting programs and the SABR program.
Product costs for
2017
increased
$1.4 billion
, or
10 percent
, as compared to
2016
. The
increase
principally reflects a lower product margin rate at Aerospace Systems due to changes in contract mix.
2016
-
Product sales for
2016
increased
$877 million
, or
6 percent
, as compared with
2015
. The
increase
was primarily driven by higher product sales at Aerospace Systems due to higher restricted volume, increased F-35 deliveries and production ramp-up on the E-2D program.
-
31
-
NORTHROP GRUMMAN CORPORATION
Product costs for
2016
increased
$821 million
, or
6 percent
, as compared to
2015
, consistent with the change in product sales described above.
Service Sales and Costs
2017
-
Service sales for
2017
were comparable with
2016
. Higher service sales at Aerospace Systems on several Autonomous Systems and Manned Aircraft programs were offset by lower service volume principally on the KC-10 program at Technology Services.
Service costs for
2017
were comparable with
2016
, consistent with the change in service sales described above and reflect lower service margins at Mission Systems, partially offset by higher service margins at Technology Services principally due to improved performance across the sector.
2016
-
Service sales for
2016
increased
$271 million
, or
3 percent
, as compared with
2015
. The
increase
was primarily driven by higher volume on several Cyber and ISR and Sensors and Processing service programs at Mission Systems.
Service costs for
2016
increased
$263 million
, or
3 percent
, as compared with
2015
, consistent with the change in service sales described above and reflects higher service margins at Mission Systems, partially offset by lower service margins at Aerospace Systems.
BACKLOG
Total backlog includes both funded backlog (firm orders for which funding is authorized and appropriated) and unfunded backlog. Unexercised contract options and indefinite delivery indefinite quantity (IDIQ) contracts are not included in backlog until the time the option or IDIQ task order is exercised or awarded. For multi-year service contracts with non-U.S. Government customers having no stated contract values, backlog includes only the amounts committed by the customer. Backlog is converted into sales as costs are incurred or deliveries are made.
Backlog consisted of the following at
December 31, 2017
and
2016
:
|
|
2017
|
2016
|
|||||||||||||||||
|
$ in millions
|
Funded
|
Unfunded
|
Total
Backlog
|
Total
Backlog
|
% Change in 2017
|
||||||||||||||
|
Aerospace Systems
|
$
|
9,335
|
|
$
|
15,687
|
|
$
|
25,022
|
|
$
|
27,310
|
|
(8
|
)%
|
|||||
|
Mission Systems
|
10,241
|
|
3,790
|
|
14,031
|
|
13,715
|
|
2
|
%
|
|||||||||
|
Technology Services
|
2,797
|
|
1,028
|
|
3,825
|
|
4,314
|
|
(11
|
)%
|
|||||||||
|
Total backlog
|
$
|
22,373
|
|
$
|
20,505
|
|
$
|
42,878
|
|
$
|
45,339
|
|
(5
|
)%
|
|||||
Approximately
$20.3 billion
of the
$42.9 billion
total backlog at
December 31, 2017
is expected to be converted into sales in
2018
.
OTHER
On July 18, 2017, the Armed Services Board of Contract Appeals made public its decision that the government improperly required Northrop Grumman to treat $253 million of its post-retirement benefit costs as unallowable for government contract cost accounting purposes. The decision, if upheld on any potential appeal, would only apply to certain contracts spanning a 20-year period.
LIQUIDITY AND CAPITAL RESOURCES
We endeavor to ensure the most efficient conversion of operating income into cash for deployment in our business and to maximize shareholder value through cash deployment activities. In addition to our cash position, we use various financial measures to assist in capital deployment decision-making, including cash
provided by
operating activities and free cash flow, a non-GAAP measure described in more detail below.
As of
December 31, 2017
, we had cash and cash equivalents of
$11.2 billion
; approximately
$200 million
was held outside of the U.S. by foreign subsidiaries. Cash and cash equivalents and cash generated from operating activities, supplemented by borrowings under credit facilities and/or in the capital markets, if needed, are expected to be sufficient to fund our operations for at least the next 12 months. Capital expenditure commitments were
$492 million
at
December 31, 2017
, and are expected to be paid with cash on hand.
On September 17, 2017, we entered into a definitive merger agreement to acquire Orbital ATK for approximately
$7.8 billion
in cash, plus the assumption of approximately
$1.4 billion
in net debt. In October 2017, the company
-
32
-
NORTHROP GRUMMAN CORPORATION
issued
$8.25 billion
of unsecured senior notes and intends to use the net proceeds, as well as cash on hand, to finance the Orbital ATK Acquisition and to pay related fees and expenses. See Notes 2 and 10 to the consolidated financial statements for further information.
Operating Cash Flow
The table below summarizes key components of cash flow
provided by
operating activities:
|
|
Year Ended December 31
|
|||||||||||
|
$ in millions
|
2017
|
2016
|
2015
|
|||||||||
|
Net earnings
|
$
|
2,015
|
|
$
|
2,200
|
|
$
|
1,990
|
|
|||
|
Non-cash items
(1)
|
1,172
|
|
585
|
|
1,035
|
|
||||||
|
Changes in assets and liabilities:
|
||||||||||||
|
Trade working capital
|
(340
|
)
|
(240
|
)
|
(564
|
)
|
||||||
|
Retiree benefits
|
(191
|
)
|
393
|
|
(263
|
)
|
||||||
|
Other, net
|
(43
|
)
|
(125
|
)
|
(36
|
)
|
||||||
|
Net cash provided by operating activities
|
$
|
2,613
|
|
$
|
2,813
|
|
$
|
2,162
|
|
|||
|
(1)
|
Includes deferred income taxes, depreciation and amortization and stock based compensation expense (including related excess tax benefits in 2015).
|
2017
– Net cash
provided by
operating activities for
2017
decreased
by
$200 million
, or
7 percent
, as compared with
2016
, principally due to a $500 million voluntary pre-tax pension contribution ($325 million after-tax) made in December 2017.
2016
– Net cash provided by operating activities for
2016
increased
by
$651 million
, or
30 percent
, as compared with
2015
, principally due to a
$500 million
voluntary pre-tax pension contribution (
$325 million
after-tax) made in the first quarter of 2015, changes in trade working capital and an increase in net earnings during 2016, partially offset by an increase in net income tax payments.
Free Cash Flow
Free cash flow, as reconciled in the table below, is a non-GAAP measure defined as net cash
provided by
operating activities less capital expenditures, and may not be defined and calculated by other companies in the same manner. We use free cash flow as a key factor in our planning for, and consideration of, acquisitions, stock repurchases, and the payment of dividends. This measure may be useful to investors and other users of our financial statements as a supplemental measure of our cash performance, but should not be considered in isolation, as a measure of residual cash flow available for discretionary purposes, or as an alternative to operating cash flows presented in accordance with
GAAP.
The table below reconciles net cash
provided by
operating activities to free cash flow:
|
Year Ended December 31
|
% Change in
|
|||||||||||||||||
|
$ in millions
|
2017
|
2016
|
2015
|
2017
|
2016
|
|||||||||||||
|
Net cash provided by operating activities
|
$
|
2,613
|
|
$
|
2,813
|
|
$
|
2,162
|
|
(7
|
)%
|
30
|
%
|
|||||
|
Less: capital expenditures
|
(928
|
)
|
(920
|
)
|
(471
|
)
|
1
|
%
|
95
|
%
|
||||||||
|
Free cash flow
|
$
|
1,685
|
|
$
|
1,893
|
|
$
|
1,691
|
|
(11
|
)%
|
12
|
%
|
|||||
2017
–
Free cash flow for
2017
decreased
$208 million
, or
11 percent
, as compared with
2016
. The decrease was principally driven by the $500 million voluntary pre-tax pension contribution discussed above.
2016
–
Free cash flow for
2016
increased
$202 million
, or
12 percent
, as compared with
2015
. The increase was principally driven by the higher net cash provided by operating activities described above, partially offset by higher capital expenditures in 2016 reflecting $239 million for the purchase of facilities previously leased by Mission Systems and increased capital investment at Aerospace Systems.
Investing Cash Flow
2017
-
Net cash used in investing activities for
2017
increased
$84 million
, or
10 percent
, as compared with
2016
. The increase was primarily due to proceeds from the 2016 sales of a property at Aerospace Systems and a commercial cyber security business at Mission Systems, partially offset by proceeds from the sale of two investments in 2017.
-
33
-
NORTHROP GRUMMAN CORPORATION
2016
-
Net cash used in investing activities for
2016
increased
$374 million
, or
87 percent
, as compared with
2015
. The increase was principally due to the higher capital expenditures described above, partially offset by proceeds from the sale of a property at Aerospace Systems and the sale of a commercial cyber security business at Mission Systems.
Financing Cash Flow
2017
-
Net cash provided by financing activities during
2017
was
$7.0 billion
compared to net cash used in financing activities of
$1.8 billion
in 2016. The change is principally due to $7.5 billion higher net proceeds from the issuance of long-term debt and $1.2 billion lower share repurchases in 2017.
2016
-
Net cash used in financing activities during
2016
decreased
$1.5 billion
, or
45 percent
, as compared with
2015
, principally due to $1.6 billion lower share repurchases, $149 million higher net proceeds from the issuance of long-term debt and $135 million of borrowings under our credit facilities, partially offset by $321 million in debt repayments.
Share Repurchases -
See Note
3
to the consolidated financial statements for further information on our share repurchase programs.
Credit Facilities and Unsecured Senior Notes -
See Note
10
to the consolidated financial statements for further information on our credit facilities and unsecured senior notes.
Financial Arrangements -
See Note
12
to the consolidated financial statements for further information on our use of standby letters of credit and guarantees.
Other Sources of Capital -
We believe we can obtain additional capital, if necessary for long-term liquidity, from such sources as the public or private capital markets, the sale of assets, sale and leaseback of operating assets, and leasing rather than purchasing new assets. We have an effective shelf registration statement on file with the SEC, which allows us to access capital in a timely manner.
Contractual Obligations
At
December 31, 2017
, we had contractual commitments to repay debt with interest, make payments under operating leases, settle obligations related to agreements to purchase goods and services and make payments on various other liabilities. Payments due under these obligations and commitments, and the estimated timing of those payments, are as follows:
|
$ in millions
|
Total
|
2018
|
2019- 2020
|
2021- 2022
|
2023 and beyond
|
|||||||||||||||
|
Long-term debt
|
$
|
15,350
|
|
$
|
867
|
|
$
|
1,563
|
|
$
|
2,339
|
|
$
|
10,581
|
|
|||||
|
Interest payments on long-term debt
|
7,705
|
|
530
|
|
1,069
|
|
955
|
|
5,151
|
|
||||||||||
|
Operating leases
|
1,338
|
|
232
|
|
340
|
|
207
|
|
559
|
|
||||||||||
|
Purchase obligations
(1)
|
9,772
|
|
5,396
|
|
3,187
|
|
458
|
|
731
|
|
||||||||||
|
Other long-term liabilities
(2)
|
1,187
|
|
302
|
|
376
|
|
132
|
|
377
|
|
||||||||||
|
Total contractual obligations
|
$
|
35,352
|
|
$
|
7,327
|
|
$
|
6,535
|
|
$
|
4,091
|
|
$
|
17,399
|
|
|||||
|
(1)
|
A “purchase obligation” is defined as an agreement to purchase goods or services that is enforceable and legally binding on us and that specifies all significant terms, including: fixed or minimum quantities to be purchased; fixed, minimum, or variable price provisions; and the approximate timing of the transaction. These amounts are primarily comprised of open purchase order commitments to suppliers and subcontractors pertaining to funded contracts.
|
|
(2)
|
Other long-term liabilities, including their current portions, primarily consist of total accrued environmental reserves, deferred compensation and other miscellaneous liabilities, of which
$148 million
is related to environmental reserves recorded in other current liabilities. It excludes obligations for uncertain tax positions of
$294 million
, as the timing of such payments, if any, cannot be reasonably estimated.
|
The table above excludes estimated minimum funding requirements for retirement and other post-retirement benefit plans, as set forth by the Employee Retirement Income Security Act, as amended. For further information about future minimum contributions for these plans, see Note
13
to the consolidated financial statements. Further details regarding long-term debt and operating leases can be found in Notes
10
and
12
, respectively, to the consolidated financial statements.
-
34
-
NORTHROP GRUMMAN CORPORATION
CRITICAL ACCOUNTING POLICIES, ESTIMATES, AND JUDGMENTS
Our consolidated financial statements are based on GAAP, which requires us to make estimates and assumptions about future events that affect the amounts reported in our consolidated financial statements. We employ judgment in making our estimates in consideration of historical experience, currently available information and various other assumptions that we believe to be reasonable under the circumstances. Actual results could differ from our estimates and assumptions, and any such differences could be material to our consolidated financial statements. We believe the following accounting policies are critical to the understanding of our consolidated financial statements and require the use of significant management judgment in their application. For a summary of our significant accounting policies, see Note
1
to the consolidated financial statements.
Revenue Recognition
Due to the long-term nature of our contracts, we generally recognize revenue using the percentage-of-completion method of accounting as work on our contracts progresses, which requires us to make reasonably dependable estimates regarding the design, manufacture and delivery of our products and services. In accounting for these contracts, we utilize either the cost-to-cost or the units-of-delivery method of percentage-of-completion accounting, with cost-to-cost being the predominant method.
Contract sales may include estimated amounts not contractually agreed to or yet funded by the customer, including cost or performance incentives (such as award and incentive fees), un-priced change orders, contract claims and requests for equitable adjustment (REAs). Further, as contracts are performed, change orders can be a regular occurrence and may be un-priced until negotiated with the customer. Un-priced change orders, contract claims (including change orders unapproved as to both scope and price) and REAs are included in estimated contract sales when management believes it is probable the un-priced change order, claim and/or REA will result in additional contract revenue and the amount can be reliably estimated considering the facts and circumstances known to us at the time.
Our cost estimation process is based on the professional knowledge of our engineering, program management and financial professionals, and draws on their significant experience and judgment. We prepare EACs for our contracts and calculate an estimated contract operating margin based on estimated contract sales and cost. Since contract costs are typically incurred over a period of several years, estimation of these costs requires the use of judgment. Factors considered in estimating the cost of the work to be completed include our historical performance, the availability, productivity and cost of labor, the nature and complexity of work to be performed, the effect of change orders, the availability and cost of materials, components and subcontracts, the effect of any delays in performance and the level of indirect cost allocations.
We generally review and reassess our sales, cost and profit estimates for each significant contract at least annually or more frequently as determined by the occurrence of events, changes in circumstances and evaluations of contract performance to reflect the latest reliable information available. Changes in estimates of contract sales and cost are frequent. The company performs on a broad portfolio of long-term contracts, including the development of complex and customized military platforms and systems, as well as advanced electronic equipment and software, that often include technology at the forefront of science. Changes in estimates occur for a variety of reasons, including changes in contract scope, the resolution of risk at lower or higher cost than anticipated, unanticipated risks affecting contract costs, performance issues with our subcontractors or suppliers, changes in indirect cost allocations, such as overhead and G&A costs, and changes in estimated award and incentive fees. Identified risks typically include technical, schedule and/or performance risk based on our evaluation of the contract effort. Similarly, the changes in estimates may include changes in, or resolution of, identified opportunities for operating margin improvement.
For the impacts of changes in estimates on our consolidated statement of earnings and
comprehensive income
, see “Segment Operating Results” and Note
1
to the consolidated financial statements.
New Revenue Standard
Effective January 1, 2018, we adopted Accounting Standards Codification (ASC) Topic 606,
Revenue from Contracts with Customers
, using the full retrospective method. Topic 606 supersedes existing revenue recognition guidance, including ASC 605-35,
Revenue Recognition - Construction-Type and Production-Type Contracts
, and outlines a single set of comprehensive principles for recognizing revenue under GAAP. Under Topic 606, revenue is recognized as control transfers to the customer. As such, under the new standard, revenue for our contracts is generally recognized over time using the cost-to-cost method, which is consistent with the revenue recognition model used for the majority of our contracts prior to the adoption of Topic 606. In most cases the accounting for those contracts where we previously recognized revenue as units were delivered has changed under Topic 606 such that we now recognize revenue as costs are incurred. This change generally results in an acceleration of revenue as
-
35
-
NORTHROP GRUMMAN CORPORATION
compared with our previous revenue recognition method for those contracts. In addition, for certain of our contracts, there is a change in the number of performance obligations under Topic 606, which has altered the timing of revenue and margin recognition. See “Accounting Standards Updates” in Note
1
to the consolidated financial statements for additional information regarding our adoption of Topic 606.
Retirement Benefits
Overview
– The determination of projected benefit obligations and the fair value of plan assets for our pension and other post-retirement plans requires the use of estimates and actuarial assumptions. We perform an annual review of our actuarial assumptions in consultation with our actuaries. As we determine changes in the assumptions are warranted, or as a result of plan amendments, future pension and other post-retirement benefit expense and our projected benefit obligation could increase or decrease. The principal estimates and assumptions that have a significant effect on our consolidated financial position and annual results of operations are the discount rate, cash balance crediting rate, expected long-term rate of return on plan assets, estimated fair market value of plan assets, and the mortality rate of those covered by our pension and other post-retirement benefit plans.
Discount Rate
– The discount rate represents the interest rate that is used to determine the present value of future cash flows currently expected to be required to settle our pension and other post-retirement benefit obligations. The discount rate is generally based on the yield of high-quality corporate fixed-income investments. At the end of each year, we determine the discount rate using a theoretical bond portfolio model of bonds rated AA or better to match the notional cash outflows related to projected benefit payments for each of our significant benefit plans. Taking into consideration the factors noted above, our weighted-average composite pension discount rate was
3.68 percent
at
December 31, 2017
, and
4.19 percent
at
December 31, 2016
.
The effects of a hypothetical change in the discount rate may be nonlinear and asymmetrical for future years as the discount rate changes and the accounting corridor is applied. The accounting corridor is a defined range within which amortization of net gains and losses is not required and is equal to 10 percent of the greater of plan assets or benefit obligations. Holding all other assumptions constant, an increase or decrease of 25 basis points in the
December 31, 2017
discount rate assumption would have the following estimated effects on
2017
pension and other post-retirement benefit obligations and
2018
expected pension and other post-retirement expense:
|
$ increase/(decrease) in millions
|
25 Basis Point Decrease in Rate
|
25 Basis Point Increase in Rate
|
|||||
|
Pension expense
|
$
|
96
|
|
$
|
(92
|
)
|
|
|
Other post-retirement benefit expense
|
1
|
|
(1
|
)
|
|||
|
Pension obligation
|
1,096
|
|
(1,039
|
)
|
|||
|
Other post-retirement benefit obligation
|
57
|
|
(54
|
)
|
|||
Cash Balance Crediting Rate
- A portion of the company’s pension obligation and resulting pension expense is based on a cash balance formula, where participants’ hypothetical account balances are accumulated over time with pay-based credits and interest. Interest is credited monthly using the 30-Year Treasury bond rate. The interest crediting rate is part of the cash balance formula and independent of actual pension investment earnings. The cash balance crediting rate tends to move in concert with the discount rate but has an offsetting effect on pension benefit obligations and pension expense in comparison to the discount rate. Although current 30-Year Treasury bond rates are near historically low levels, we expect such bond rates to rise in the future. The cash balance crediting rate assumption has therefore been set to its current level of
2.75 percent
as of
December 31, 2017
, growing to
3.0 percent
by
2023
. Holding all other assumptions constant, an increase or decrease of 25 basis points in the
December 31, 2017
cash balance crediting rate assumption would have the following estimated effects on
2017
pension benefit obligations and
2018
expected pension expense:
|
$ increase/(decrease) in millions
|
25 Basis Point Decrease in Rate
|
25 Basis Point Increase in Rate
|
|||||
|
Pension expense
|
$
|
(26
|
)
|
$
|
27
|
|
|
|
Pension obligation
|
(135
|
)
|
141
|
|
|||
Expected Long-Term Rate of Return on Plan Assets –
The expected long-term rate of return on plan assets (EROA) assumption reflects the average rate of net earnings we expect on current and future benefit plan investments. EROA
-
36
-
NORTHROP GRUMMAN CORPORATION
is a long-term assumption, which we review annually and adjust to reflect changes in our long-term view of expected market returns and/or significant changes in our plan asset investment policy. Due to the inherent uncertainty of this assumption, we consider multiple data points at the measurement date including historical asset returns, the plan’s target asset allocation, and third party projection models of expected long-term returns for each of the plans’ strategic asset classes. In addition to the data points themselves, we consider trends in the data points, including changes from the prior measurement date. The EROA assumptions we use for pension benefits are consistent with those used for other post-retirement benefits; however, we reduce the EROA for other post-retirement benefit plans to allow for the impact of tax on investment earnings, as certain Voluntary Employee Beneficiary Association trusts are taxable.
While historical market returns are not necessarily predictive of future market returns, given our long history of plan performance supported by the stability in our investment mix, investment managers, and active asset management, we believe our actual historical performance is a reasonable metric to consider when developing our EROA. Our average annual rate of return from 1976 to 2017 was approximately
11.3 percent
and our 20-year rolling average rate of return was approximately
8.1 percent
, each determined on an arithmetic basis. Our 2017 asset returns, net of expenses, were approximately
16.4 percent
.
With regard to the company’s investment policy, during 2017, the Benefit Plans Investment Committee reviewed and re-affirmed the major asset class allocations. Our asset allocation is approximately 45% equities, 35% fixed-income and 20% alternatives and we are not currently contemplating significant changes to that investment mix. For further information on plan asset investments, see Note
13
to the consolidated financial statements.
Consistent with our past practice, we obtained long-term capital market forecasting models from several third parties and, using our target asset allocation, developed an expected rate of return on plan assets from each model. We considered not only the specific returns projected by those third party models, but also changes in the models year-to-year when developing our EROA.
For determining FAS expense in
2017
and
2016
, we assumed an expected long-term rate of return on pension plan assets of
8.0 percent
for both 2017 and 2016 and an expected long-term rate of return on other post-retirement benefit plan assets of
7.7 percent
for both 2017 and 2016. For
2018
FAS expense, we have assumed an expected long-term rate of return on pension plan assets of
8.0 percent
and
7.7 percent
on other post-retirement benefit plans. Holding all other assumptions constant, an increase or decrease of 25 basis points in our
December 31, 2017
EROA assumption would have the following estimated effects on
2018
pension and other post-retirement benefit expense:
|
$ increase/(decrease) in millions
|
25 Basis Point Decrease
|
25 Basis Point Increase
|
|||||
|
Pension expense
|
$
|
66
|
|
$
|
(66
|
)
|
|
|
Other post-retirement benefit expense
|
3
|
|
(3
|
)
|
|||
Estimated Fair Market Value of Plan Assets
– For certain plan assets where the fair market value is not readily determinable, such as real estate, private equity, hedge funds and opportunistic investments, estimates of fair value are determined using the best information available. Estimated fair values on these plan assets are based on redemption values and net asset values, as well as valuation methodologies that include third party appraisals, comparable transactions, discounted cash flow valuation models and public market data.
Mortality Rate
– Mortality assumptions are used to estimate life expectancies of plan participants. In October 2014, the Society of Actuaries (SOA) issued updated mortality tables and a mortality improvement scale, which reflected longer life expectancies than previously projected. The SOA has issued annual updates to their mortality improvement scale each year since then as additional data has become available. These updates generally contained lower mortality improvement projections than the original projections from 2014. After considering the additional information released by the SOA in October 2017, and after reviewing our own historical mortality experience, we continued our practice of adopting the latest SOA projection scale, but with a long-term improvement rate of
0.75%
versus
1.0%
assumed by the SOA. Accordingly, we updated the mortality assumptions used in calculating our pension and post-retirement benefit obligations recognized at
December 31, 2017
, and the amounts estimated for our
2018
pension and post-retirement benefit expense.
For further information regarding our pension and post-retirement benefits, see “Risk Factors” and Note
13
to the consolidated financial statements.
-
37
-
NORTHROP GRUMMAN CORPORATION
Litigation, Commitments and Contingencies
We are subject to a range of claims, disputes, enforcement actions, investigations, lawsuits, overhead cost claims, environmental matters, income tax matters and administrative proceedings that arise in the ordinary course of business. Estimating liabilities and costs associated with these matters requires judgment based upon the professional knowledge and experience of management. We determine whether to record a reserve and, if so, what amount based on consideration of the facts and circumstances of each matter as then known to us. Determinations regarding whether to record a reserve and, if so, of what amount, reflect management’s assessment regarding what is likely to occur; they do not necessarily reflect what management believes should occur. The ultimate resolution of any such exposure to us may vary materially from earlier estimates as further facts and circumstances develop or become known to us.
Environmental Matters
- We are subject to environmental laws and regulations in the jurisdictions in which we do or have done business. Factors that could result in changes to the assessment of probability, range of reasonably estimated costs and environmental accruals include: modification of planned remedial actions; changes in the estimated time required to conduct remedial actions; discovery of more or less extensive (or different) contamination than anticipated; information regarding the potential causes and effects of contamination; results of efforts to involve other responsible parties; financial capabilities of other responsible parties; changes in laws and regulations, their interpretation or application; contractual obligations affecting remediation or responsibilities; and improvements in remediation technology.
For further information on litigation, commitments and contingencies, see “Risk Factors” and Note
1
, Note
11
and Note
12
to the consolidated financial statements.
Goodwill
Overview
– We allocate the purchase price of acquired businesses to the underlying tangible and intangible assets acquired and liabilities assumed based upon their respective fair values, with the excess recorded as goodwill. Such fair value assessments require judgments and estimates that can be affected by contract performance and other factors over time, which may cause final amounts to differ materially from original estimates. Adjustments to the fair value of purchased assets and liabilities after the initial measurement period are recognized in net earnings.
Impairment Testing
– We test for impairment of goodwill annually at each of our reporting units, which comprise our operating segments. The results of our annual goodwill impairment tests as of
December 31, 2017
and
2016
, respectively, indicated that the estimated fair value of each reporting unit substantially exceeded its respective carrying value. There were no impairment charges recorded in the years ended
December 31, 2017
,
2016
and
2015
.
In addition to performing an annual goodwill impairment test, we may perform an interim impairment test if events occur or circumstances change that suggest goodwill in any of our reporting units may be impaired. Such indicators may include, but are not limited to, the loss of significant business, significant reductions in federal government appropriations or other significant adverse changes in industry or market conditions.
When testing goodwill for impairment, we compare the fair values of each of our reporting units to their respective carrying values. To determine the fair value of our reporting units, we primarily use the income approach based on the cash flows that the reporting unit expects to generate in the future, consistent with our operating plans. This income valuation method requires management to project sales, operating expenses, working capital, capital spending and cash flows for the reporting units over a multi-year period, as well as to determine the weighted-average cost of capital (WACC) used as a discount rate and terminal value assumptions. The WACC takes into account the relative weights of each component of our consolidated capital structure (equity and debt) and represents the expected cost of new capital adjusted as appropriate to consider lower risk profiles associated with longer-term contracts and barriers to market entry. The terminal value assumptions are applied to the final year of the discounted cash flow model. We use industry multiples (including relevant control premiums) of operating earnings to corroborate the fair values of our reporting units determined under the market valuation method of the income approach.
Impairment assessment inherently involves management judgments as to assumptions about expected future cash flows and the impact of market conditions on those assumptions. Due to the many variables inherent in the estimation of a business’ fair value and the relative size of our recorded goodwill, differences in assumptions may have a material effect on the results of our impairment analysis.
-
38
-
NORTHROP GRUMMAN CORPORATION
OTHER MATTERS
Off-Balance Sheet Arrangements
As of
December 31, 2017
, we had no significant off-balance sheet arrangements other than operating leases. For a description of our operating leases, see Note
12
to the consolidated financial statements.
-
39
-
NORTHROP GRUMMAN CORPORATION
EQUITY RISK
We are exposed to market risk with respect to our portfolio of trading and available-for-sale marketable securities with a fair value of
$353 million
at
December 31, 2017
. These securities are exposed to market volatilities, changes in price and interest rates.
INTEREST RATE RISK
We are exposed to interest rate risk on variable-rate, short-term borrowings under our credit facilities, for which there was
£100 million
(the equivalent of approximately
$134 million
as of
December 31, 2017
) outstanding at
December 31, 2017
. At
December 31, 2017
, we have
$15.3 billion
of long-term debt, primarily consisting of fixed-rate debt, with a fair value of approximately
$16.0 billion
. The terms of our fixed-rate debt obligations do not generally allow investors to demand payment of these obligations prior to maturity. Therefore, we do not have significant exposure to interest rate risk for our fixed-rate debt; however, we do have exposure to fair value risk if we repurchase or exchange long-term debt prior to maturity.
FOREIGN CURRENCY RISK
In certain circumstances, we are exposed to foreign currency risk. We enter into foreign currency forward contracts to manage a portion of the exchange rate risk related to receipts from customers and payments to suppliers denominated in foreign currencies. We do not hold or issue derivative financial instruments for trading purposes. At
December 31, 2017
, foreign currency forward contracts with a notional amount of
$89 million
were outstanding. At
December 31, 2017
, a
10
percent unfavorable foreign exchange rate movement would not have a material impact on our consolidated financial position, annual results of operations and/or cash flows.
INFLATION RISK
We have generally been able to anticipate increases in costs when pricing our contracts. Bids for longer-term firm fixed-price contracts typically include assumptions for labor and other cost escalations in amounts that historically have been sufficient to cover cost increases over the period of performance.
-
40
-
Item
8
. Financial Statements and Supplementary Data
REPORT OF INDEPENDENT REGISTERED PUBLIC ACCOUNTING FIRM
To the Board of Directors and Shareholders of
Northrop Grumman Corporation
Falls Church, Virginia
Opinion on the Financial Statements
We have audited the accompanying consolidated statements of financial position of Northrop Grumman Corporation and subsidiaries (the “Company”) as of
December 31, 2017
and
2016
, and the related consolidated statements of earnings and
comprehensive income
(loss), changes in shareholders’ equity, and cash flows for each of the three years in the period ended
December 31, 2017
, and the related notes (collectively referred to as the “financial statements”). In our opinion, the consolidated financial statements present fairly, in all material respects, the financial position of the Company as of
December 31, 2017
and
2016
, and the results of its operations and its cash flows for each of the three years in the period ended
December 31, 2017
, in conformity with accounting principles generally accepted in the United States of America.
We have also audited, in accordance with the standards of the Public Company Accounting Oversight Board (United States) (PCAOB), the Company’s internal control over financial reporting as of
December 31, 2017
, based on the criteria established in
Internal Control - Integrated Framework (2013)
issued by the Committee of Sponsoring Organizations of the Treadway Commission and our report dated
January 29, 2018
expressed an unqualified opinion on the Company’s internal control over financial reporting.
Basis for Opinion
These financial statements are the responsibility of the Company’s management. Our responsibility is to express an opinion on the Company’s financial statements based on our audits. We are a public accounting firm registered with the PCAOB and are required to be independent with respect to the Company in accordance with the U.S. federal securities laws and the applicable rules and regulations of the Securities and Exchange Commission and the PCAOB.
We conducted our audits in accordance with the standards of the PCAOB. Those standards require that we plan and perform the audit to obtain reasonable assurance about whether the financial statements are free of material misstatement, whether due to error or fraud. Our audits included performing procedures to assess the risks of material misstatement of the financial statements, whether due to error or fraud, and performing procedures that respond to those risks. Such procedures included examining, on a test basis, evidence regarding the amounts and disclosures in the financial statements. Our audits also included evaluating the accounting principles used and significant estimates made by management, as well as evaluating the overall presentation of the financial statements. We believe that our audits provide a reasonable basis for our opinion.
|
/s/
|
Deloitte & Touche LLP
|
|
McLean, Virginia
|
|
|
January 29, 2018
|
|
|
We have served as the Company’s auditor since 1975.
|
|
-
41
-
NORTHROP GRUMMAN CORPORATION
|
|
Year Ended December 31
|
|||||||||||
|
$ in millions, except per share amounts
|
2017
|
|
2016
|
|
2015
|
|||||||
|
Sales
|
|
|
|
|
|
|
|
|
||||
|
Product
|
$
|
16,038
|
|
|
$
|
14,738
|
|
|
$
|
13,966
|
|
|
|
Service
|
9,765
|
|
|
9,770
|
|
|
9,560
|
|
||||
|
Total sales
|
25,803
|
|
|
24,508
|
|
|
23,526
|
|
||||
|
Operating costs and expenses
|
|
|
|
|
|
|
|
|
||||
|
Product
|
12,271
|
|
|
11,002
|
|
|
10,333
|
|
||||
|
Service
|
7,578
|
|
|
7,729
|
|
|
7,551
|
|
||||
|
General and administrative expenses
|
2,655
|
|
|
2,584
|
|
|
2,566
|
|
||||
|
Operating income
|
3,299
|
|
|
3,193
|
|
|
3,076
|
|
||||
|
Other (expense) income
|
|
|
|
|
|
|
|
|
||||
|
Interest expense
|
(360
|
)
|
|
(301
|
)
|
|
(301
|
)
|
||||
|
Other, net
|
110
|
|
|
31
|
|
|
15
|
|
||||
|
Earnings before income taxes
|
3,049
|
|
|
2,923
|
|
|
2,790
|
|
||||
|
Federal and foreign income tax expense
|
1,034
|
|
|
723
|
|
|
800
|
|
||||
|
Net earnings
|
$
|
2,015
|
|
|
$
|
2,200
|
|
|
$
|
1,990
|
|
|
|
|
|
|
|
|
|
|
|
|||||
|
Basic earnings per share
|
$
|
11.55
|
|
|
$
|
12.30
|
|
|
$
|
10.51
|
|
|
|
Weighted-average common shares outstanding, in millions
|
174.4
|
|
|
178.9
|
|
|
189.4
|
|
||||
|
Diluted earnings per share
|
$
|
11.47
|
|
|
$
|
12.19
|
|
|
$
|
10.39
|
|
|
|
Weighted-average diluted shares outstanding, in millions
|
175.6
|
|
|
180.5
|
|
|
191.6
|
|
||||
|
|
|
|
|
|
|
|
|
|||||
|
Net earnings (from above)
|
$
|
2,015
|
|
|
$
|
2,200
|
|
|
$
|
1,990
|
|
|
|
Other comprehensive income (loss)
|
|
|
|
|
|
|
|
|
||||
|
Change in unamortized benefit plan costs, net of tax (expense) benefit of ($383) in 2017, $89 in 2016 and ($45) in 2015
|
830
|
|
|
(175
|
)
|
|
75
|
|
||||
|
Change in cumulative translation adjustment
|
(4
|
)
|
|
(50
|
)
|
|
(41
|
)
|
||||
|
Other, net
|
2
|
|
|
(1
|
)
|
|
2
|
|
||||
|
Other comprehensive income (loss), net of tax
|
828
|
|
|
(226
|
)
|
|
36
|
|
||||
|
Comprehensive income
|
$
|
2,843
|
|
|
$
|
1,974
|
|
|
$
|
2,026
|
|
|
The accompanying notes are an integral part of these consolidated financial statements.
-
42
-
NORTHROP GRUMMAN CORPORATION
|
|
December 31
|
|||||||
|
$ in millions
|
2017
|
2016
|
||||||
|
Assets
|
||||||||
|
Cash and cash equivalents
|
$
|
11,225
|
|
$
|
2,541
|
|
||
|
Accounts receivable, net
|
3,976
|
|
3,299
|
|
||||
|
Inventoried costs, net
|
780
|
|
816
|
|
||||
|
Prepaid expenses and other current assets
|
368
|
|
200
|
|
||||
|
Total current assets
|
16,349
|
|
6,856
|
|
||||
|
Property, plant and equipment, net of accumulated depreciation of $5,066 for 2017 and $4,831 for 2016
|
4,225
|
|
3,588
|
|
||||
|
Goodwill
|
12,455
|
|
12,450
|
|
||||
|
Deferred tax assets
|
475
|
|
1,462
|
|
||||
|
Other non-current assets
|
1,413
|
|
1,258
|
|
||||
|
Total assets
|
$
|
34,917
|
|
$
|
25,614
|
|
||
|
Liabilities
|
||||||||
|
Trade accounts payable
|
$
|
1,661
|
|
$
|
1,554
|
|
||
|
Accrued employee compensation
|
1,382
|
|
1,342
|
|
||||
|
Advance payments and amounts in excess of costs incurred
|
1,617
|
|
1,471
|
|
||||
|
Other current liabilities
|
2,305
|
|
1,263
|
|
||||
|
Total current liabilities
|
6,965
|
|
5,630
|
|
||||
|
Long-term debt, net of current portion of $867 for 2017 and $12 for 2016
|
14,399
|
|
7,058
|
|
||||
|
Pension and other post-retirement benefit plan liabilities
|
5,511
|
|
6,818
|
|
||||
|
Other non-current liabilities
|
994
|
|
849
|
|
||||
|
Total liabilities
|
27,869
|
|
20,355
|
|
||||
|
Commitments and contingencies (Note 12)
|
|
|
|
|
||||
|
Shareholders’ equity
|
||||||||
|
Preferred stock, $1 par value; 10,000,000 shares authorized; no shares issued and outstanding
|
—
|
|
—
|
|
||||
|
Common stock, $1 par value; 800,000,000 shares authorized; issued and outstanding: 2017—174,085,619 and 2016—175,068,263
|
174
|
|
175
|
|
||||
|
Paid-in capital
|
44
|
|
—
|
|
||||
|
Retained earnings
|
11,548
|
|
10,630
|
|
||||
|
Accumulated other comprehensive loss
|
(4,718
|
)
|
(5,546
|
)
|
||||
|
Total shareholders’ equity
|
7,048
|
|
5,259
|
|
||||
|
Total liabilities and shareholders’ equity
|
$
|
34,917
|
|
$
|
25,614
|
|
||
The accompanying notes are an integral part of these consolidated financial statements.
-
43
-
NORTHROP GRUMMAN CORPORATION
|
|
Year Ended December 31
|
|||||||||||
|
$ in millions
|
2017
|
|
2016
|
|
2015
|
|||||||
|
Operating activities
|
||||||||||||
|
Net earnings
|
$
|
2,015
|
|
|
$
|
2,200
|
|
|
$
|
1,990
|
|
|
|
Adjustments to reconcile to net cash provided by operating activities:
|
||||||||||||
|
Depreciation and amortization
|
475
|
|
|
456
|
|
|
467
|
|
||||
|
Stock-based compensation
|
94
|
|
|
93
|
|
|
99
|
|
||||
|
Excess tax benefits from stock-based compensation
|
—
|
|
|
—
|
|
|
(103
|
)
|
||||
|
Deferred income taxes
|
603
|
|
|
36
|
|
|
572
|
|
||||
|
Changes in assets and liabilities:
|
||||||||||||
|
Accounts receivable, net
|
(677
|
)
|
|
(461
|
)
|
|
(30
|
)
|
||||
|
Inventoried costs, net
|
36
|
|
|
(15
|
)
|
|
(80
|
)
|
||||
|
Prepaid expenses and other assets
|
(81
|
)
|
|
(110
|
)
|
|
43
|
|
||||
|
Accounts payable and other liabilities
|
539
|
|
|
198
|
|
|
(632
|
)
|
||||
|
Income taxes payable, net
|
(157
|
)
|
|
148
|
|
|
135
|
|
||||
|
Retiree benefits
|
(191
|
)
|
|
393
|
|
|
(263
|
)
|
||||
|
Other, net
|
(43
|
)
|
|
(125
|
)
|
|
(36
|
)
|
||||
|
Net cash provided by operating activities
|
2,613
|
|
|
2,813
|
|
|
2,162
|
|
||||
|
Investing activities
|
||||||||||||
|
Capital expenditures
|
(928
|
)
|
|
(920
|
)
|
|
(471
|
)
|
||||
|
Other, net
|
39
|
|
|
115
|
|
|
40
|
|
||||
|
Net cash used in investing activities
|
(889
|
)
|
|
(805
|
)
|
|
(431
|
)
|
||||
|
Financing activities
|
||||||||||||
|
Common stock repurchases
|
(393
|
)
|
|
(1,547
|
)
|
|
(3,182
|
)
|
||||
|
Net proceeds from issuance of long-term debt
|
8,245
|
|
|
749
|
|
|
600
|
|
||||
|
Payments of long-term debt
|
—
|
|
|
(321
|
)
|
|
—
|
|
||||
|
Net (payments to) proceeds from credit facilities
|
(13
|
)
|
135
|
|
—
|
|
||||||
|
Cash dividends paid
|
(689
|
)
|
|
(640
|
)
|
|
(603
|
)
|
||||
|
Payments of employee taxes withheld from share-based awards
|
(92
|
)
|
|
(153
|
)
|
|
(186
|
)
|
||||
|
Other, net
|
(98
|
)
|
|
(9
|
)
|
|
96
|
|
||||
|
Net cash provided by (used in) financing activities
|
6,960
|
|
|
(1,786
|
)
|
|
(3,275
|
)
|
||||
|
Increase (decrease) in cash and cash equivalents
|
8,684
|
|
|
222
|
|
|
(1,544
|
)
|
||||
|
Cash and cash equivalents, beginning of year
|
2,541
|
|
|
2,319
|
|
|
3,863
|
|
||||
|
Cash and cash equivalents, end of year
|
$
|
11,225
|
|
|
$
|
2,541
|
|
|
$
|
2,319
|
|
|
The accompanying notes are an integral part of these consolidated financial statements.
-
44
-
NORTHROP GRUMMAN CORPORATION
CONSOLIDATED STATEMENTS OF CHANGES IN SHAREHOLDERS’ EQUITY
|
|
Year Ended December 31
|
|||||||||||
|
$ in millions, except per share amounts
|
2017
|
2016
|
2015
|
|||||||||
|
Common stock
|
||||||||||||
|
Beginning of year
|
$
|
175
|
|
$
|
181
|
|
$
|
199
|
|
|||
|
Common stock repurchased
|
(2
|
)
|
(7
|
)
|
(19
|
)
|
||||||
|
Shares issued for employee stock awards and options
|
1
|
|
1
|
|
1
|
|
||||||
|
End of year
|
174
|
|
175
|
|
181
|
|
||||||
|
Paid-in capital
|
||||||||||||
|
Beginning of year
|
—
|
|
—
|
|
—
|
|
||||||
|
Stock compensation
|
44
|
|
—
|
|
—
|
|
||||||
|
End of year
|
44
|
|
—
|
|
—
|
|
||||||
|
Retained earnings
|
||||||||||||
|
Beginning of year
|
10,630
|
|
10,661
|
|
12,392
|
|
||||||
|
Common stock repurchased
|
(371
|
)
|
(1,548
|
)
|
(3,154
|
)
|
||||||
|
Net earnings
|
2,015
|
|
2,200
|
|
1,990
|
|
||||||
|
Dividends declared
|
(687
|
)
|
(633
|
)
|
(596
|
)
|
||||||
|
Stock compensation
|
(39
|
)
|
(50
|
)
|
29
|
|
||||||
|
End of year
|
11,548
|
|
10,630
|
|
10,661
|
|
||||||
|
Accumulated other comprehensive loss
|
||||||||||||
|
Beginning of year
|
(5,546
|
)
|
(5,320
|
)
|
(5,356
|
)
|
||||||
|
Other comprehensive income (loss), net of tax
|
828
|
|
(226
|
)
|
36
|
|
||||||
|
End of year
|
(4,718
|
)
|
(5,546
|
)
|
(5,320
|
)
|
||||||
|
Total shareholders’ equity
|
$
|
7,048
|
|
$
|
5,259
|
|
$
|
5,522
|
|
|||
|
Cash dividends declared per share
|
$
|
3.90
|
|
$
|
3.50
|
|
$
|
3.10
|
|
|||
The accompanying notes are an integral part of these consolidated financial statements.
-
45
-
NORTHROP GRUMMAN CORPORATION
NOTES TO CONSOLIDATED FINANCIAL STATEMENTS
1
. SUMMARY OF SIGNIFICANT ACCOUNTING POLICIES
Nature of Operations
Northrop Grumman Corporation (herein referred to as “Northrop Grumman,” the “company,” “we,” “us,” or “our”) is a leading global security company. We offer a broad portfolio of capabilities and technologies that enable us to deliver innovative products, systems and solutions for applications that range from undersea to outer space and into cyberspace. We provide products, systems and solutions in autonomous systems; cyber; command, control, communications and computers, intelligence, surveillance and reconnaissance (C4ISR); strike; and logistics and modernization. We participate in many high-priority defense and government programs in the United States (U.S.) and abroad. We conduct most of our business with the U.S. Government, principally the Department of Defense (DoD) and intelligence community. We also conduct business with foreign, state and local governments, as well as commercial customers.
Principles of Consolidation
The consolidated financial statements include the accounts of Northrop Grumman and its subsidiaries and joint ventures or other investments for which we consolidate the financial results. Material intercompany accounts, transactions and profits are eliminated in consolidation. Investments in equity securities and joint ventures where the company has significant influence, but not control, are accounted for using the equity method.
Accounting Estimates
The company’s consolidated financial statements are prepared in conformity with accounting principles generally accepted in the United States of America (“GAAP” or “FAS”). The preparation thereof requires management to make estimates and judgments that affect the reported amounts of assets and liabilities and the disclosure of contingencies at the date of the financial statements, as well as the reported amounts of sales and expenses during the reporting period. Estimates have been prepared using the most current and best available information; however, actual results could differ materially from those estimates.
Revenue Recognition
The majority of our sales are derived from long-term contracts with the U.S. Government for the production of goods, the provision of services, or a combination of both. In accounting for these contracts, we utilize either the cost-to-cost method or the units-of-delivery method of percentage-of-completion accounting, with cost-to-cost being the predominant method. Generally, sales under cost-reimbursement contracts and construction-type contracts that provide for deliveries at lower volume rates are accounted for using the cost-to-cost method. Under this method, sales, including estimated profits, are recorded as costs are incurred. Generally, sales under contracts that provide for deliveries at higher volume rates are accounted for using the units-of-delivery method. Under this method, cost and sales are recognized as units are delivered to the customer. The company estimates profit on contracts as the difference between total estimated sales and total estimated cost at completion and recognizes that profit either as costs are incurred (cost-to-cost) or as units are delivered (units-of-delivery). The company classifies sales as product or service depending upon the predominant attributes of the contract.
Contract sales may include estimated amounts not contractually agreed to or yet funded by the customer, including cost or performance incentives (such as award and incentive fees), un-priced change orders, contract claims and requests for equitable adjustment (REAs). Further, as contracts are performed, change orders can be a regular occurrence and may be un-priced until negotiated with the customer. Un-priced change orders, contract claims (including change orders unapproved as to both scope and price) and REAs are included in estimated contract sales when management believes it is probable the un-priced change order, claim and/or REA will result in additional contract revenue and the amount can be reliably estimated considering the facts and circumstances known to us at the time.
Net Estimate-At-Completion (EAC) Adjustments -
We recognize changes in estimated contract sales or costs and the resulting changes in contract operating margins using the cumulative catch-up method of accounting. This method recognizes, in current period operating margin, the cumulative effect of the changes on total costs incurred to date as net EAC adjustments; sales and operating margins in future periods of contract performance are recognized as if the revised estimates had been used since contract inception. If it is determined that a loss will result from the performance of a contract, the entire amount of the estimable future loss, including an allocation of general and administrative costs, is charged against income in the period the loss is identified. Each loss provision is first offset against costs included in unbilled accounts receivable or inventoried costs; remaining amounts are reflected in current liabilities.
-
46
-
NORTHROP GRUMMAN CORPORATION
Significant EAC adjustments on a single contract could have a material effect on the company’s consolidated financial position or results of operations. When such adjustments occur, we generally disclose the nature, underlying conditions and financial impact of the adjustments. During the third quarter of 2017, we recorded a
$56 million
favorable EAC adjustment on a restricted program at Aerospace Systems largely related to performance incentives.
The following table presents the effect of aggregate net EAC adjustments:
|
Year Ended December 31
|
|||||||||||
|
$ in millions, except per share data
|
2017
|
2016
|
2015
|
||||||||
|
Operating income
|
$
|
363
|
|
$
|
494
|
|
$
|
580
|
|
||
|
Net earnings
(1)
|
236
|
|
321
|
|
377
|
|
|||||
|
Diluted earnings per share
(1)
|
1.34
|
|
1.78
|
|
1.97
|
|
|||||
|
(1)
|
Based on statutory tax rates in effect for each year presented.
|
Sales by Customer Category -
The following table presents sales by customer category:
|
Year Ended December 31
|
||||||||||||||||||
|
2017
|
2016
|
2015
|
||||||||||||||||
|
$ in millions
|
$
|
%
|
$
|
%
|
$
|
%
|
||||||||||||
|
U.S. Government
(1)
|
$
|
21,837
|
|
85
|
%
|
$
|
20,573
|
|
84
|
%
|
$
|
19,458
|
|
83
|
%
|
|||
|
International
(2)
|
3,302
|
|
13
|
%
|
3,205
|
|
13
|
%
|
3,339
|
|
14
|
%
|
||||||
|
Other Customers
|
664
|
|
2
|
%
|
730
|
|
3
|
%
|
729
|
|
3
|
%
|
||||||
|
Total Sales
|
$
|
25,803
|
|
$
|
24,508
|
|
$
|
23,526
|
|
|||||||||
|
(1)
|
Sales to the
U.S.
Government include sales from contracts for which we are the prime contractor, as well as those for which we are a subcontractor and the ultimate customer is the U.S. Government. Each of the company’s segments derives substantial revenue from the U.S. Government.
|
|
(2)
|
International sales include sales from contracts for which we are the prime contractor, as well as those for which we are a subcontractor and the ultimate customer is an international customer. These sales include foreign military sales contracted through the U.S. Government, direct sales with governments outside the U.S. and commercial sales outside the U.S.
|
General and Administrative Expenses
In accordance with the regulations that govern cost accounting requirements for government contracts, most general management and corporate expenses incurred at the segment and corporate locations are considered allowable and allocable costs. Allowable and allocable G&A costs, including independent research and development (IR&D) and bid and proposal (B&P) costs, are allocated on a systematic basis to contracts in progress and are included as a component of total estimated contract costs.
Research and Development
Company-sponsored research and development activities primarily include efforts related to government programs. Company-sponsored IR&D expenses totaled
$639 million
,
$705 million
and
$712 million
in
2017
,
2016
and
2015
, respectively. Customer-funded research and development activities are charged directly to the related contracts.
Income Taxes
Provisions for federal and foreign income taxes are calculated on reported earnings before income taxes based on current tax law and include the cumulative effect of any changes in tax rates from those used previously in determining deferred tax assets and liabilities. Such provisions differ from the amounts currently payable because certain items of income and expense are recognized in different periods for financial reporting purposes than for income tax purposes. The company recognizes federal and foreign interest accrued related to unrecognized tax benefits in income tax expense. Federal tax penalties are recognized as a component of income tax expense.
In accordance with the regulations that govern cost accounting requirements for government contracts, current state and local income and franchise taxes are generally considered allowable and allocable costs and, consistent with industry practice, are recorded in operating costs and expenses. The company recognizes changes in deferred state taxes and unrecognized state tax benefits in unallocated corporate expenses.
Uncertain tax positions reflect the company’s expected treatment of tax positions taken in a filed tax return, or planned to be taken in a future tax return or claim, which have not been reflected in measuring income tax expense
-
47
-
NORTHROP GRUMMAN CORPORATION
for financial reporting purposes. Until these positions are sustained by the taxing authorities or the statute of limitations concerning such issues lapses, the company does not generally recognize the tax benefits resulting from such positions and reports the tax effects as a liability for uncertain tax positions in its consolidated statements of financial position.
Cash and Cash Equivalents
Cash and cash equivalents are comprised of cash in banks and highly liquid instruments with original maturities of three months or less, primarily consisting of bank time deposits and investments in institutional money market funds. Cash in bank accounts often exceeds federally insured limits.
Fair Value of Financial Instruments
The company measures the fair value of its financial instruments using observable and unobservable inputs. Observable inputs reflect market data obtained from independent sources, while unobservable inputs reflect internal market assumptions.
These two types of inputs create the following fair value hierarchy:
Level 1 - Quoted prices for identical instruments in active markets.
Level 2 - Quoted prices for similar instruments in active markets; quoted prices for identical or similar instruments in markets that are not active; and model-derived valuations whose inputs are observable or whose significant value drivers are observable.
Level 3 - Significant inputs to the valuation model are unobservable.
Marketable securities accounted for as trading and available-for-sale are recorded at fair value on a recurring basis. For available-for-sale securities, changes in unrealized gains and losses are reported as a component of other comprehensive income. Changes in unrealized gains and losses on trading securities are included in other, net in the consolidated statements of earnings and
comprehensive income
. Investments in held-to-maturity instruments with original maturities greater than three months are recorded at amortized cost.
Derivative financial instruments are recognized as assets or liabilities in the financial statements and measured at fair value on a recurring basis. Changes in the fair value of derivative financial instruments that are designated as fair value hedges are recorded in net earnings, while the effective portion of the changes in the fair value of derivative financial instruments that are designated as cash flow hedges are recorded as a component of other comprehensive income until settlement. For derivative financial instruments not designated as hedging instruments, gains or losses resulting from changes in the fair value are reported in other, net in the consolidated statements of earnings and
comprehensive income
.
The company may use derivative financial instruments to manage its exposure to interest rate risk for its long-term fixed-rate debt portfolio and foreign currency exchange risk related to receipts from customers and payments to suppliers denominated in foreign currencies. The company does not use derivative financial instruments for trading or speculative purposes, nor does it use leveraged financial instruments. Credit risk related to derivative financial instruments is considered minimal and is managed through the use of multiple counterparties with high credit standards and periodic settlements of positions, as well as by entering into master netting agreements with most of our counterparties.
Accounts Receivable and Inventoried Costs
Accounts receivable include amounts billed and currently due from customers, as well as amounts currently due but unbilled (primarily related to costs incurred on contracts accounted for under the cost-to-cost method). Accounts receivable also include certain estimated amounts for un-priced change orders, contract claims and/or REAs in negotiation that are probable of recovery and amounts retained by the customer pending contract completion.
Inventoried costs primarily relate to work in process on contracts accounted for under the units-of-delivery method. These costs represent accumulated contract costs less the portion of such costs allocated to delivered items. Product inventory primarily consists of raw materials and is stated at the lower of cost or net realizable value, generally using the average cost method.
Accumulated contract costs in unbilled accounts receivable and inventoried costs include manufacturing, engineering and design labor, subcontractor, material, overhead and, for government contracts, allowable G&A costs. According to the provisions of U.S. Government contracts, the customer asserts title to, or a security interest in, inventories related to such contracts as a result of contract advances, performance-based payments, and/or progress payments. In accordance with industry practice, unbilled accounts receivable and inventoried costs are classified as current assets and include amounts related to contracts having production cycles longer than one year.
-
48
-
NORTHROP GRUMMAN CORPORATION
Payments received in excess of unbilled accounts receivable and inventoried costs on a contract by contract basis are recorded as advance payments and amounts in excess of costs incurred in the consolidated statements of financial position.
Cash Surrender Value of Life Insurance Policies
The company maintains whole life insurance policies on a group of executives, which are recorded at their cash surrender value as determined by the insurance carrier. The company also has split-dollar life insurance policies on former officers and executives from acquired businesses, which are recorded at the lesser of their cash surrender value or premiums paid. These policies are utilized as a partial funding source for deferred compensation and other non-qualified employee retirement plans. As of
December 31, 2017
and
2016
, the carrying values associated with these policies were
$340 million
and
$304 million
, respectively, and are recorded in other non-current assets in the consolidated statements of financial position.
Property, Plant and Equipment
Property, plant and equipment are depreciated over the estimated useful lives of individual assets. Most of these assets are depreciated using declining-balance methods, with the remainder using the straight-line method. Major classes of property, plant and equipment and their useful lives are as follows:
|
|
December 31
|
|||||||||
|
Useful life in years, $ in millions
|
Useful Life
|
2017
|
2016
|
|||||||
|
Land and land improvements
|
Up to 40
(1)
|
$
|
420
|
|
$
|
415
|
|
|||
|
Buildings and improvements
|
Up to 40
|
1,834
|
|
1,798
|
|
|||||
|
Machinery and other equipment
|
Up to 20
|
5,105
|
|
4,711
|
|
|||||
|
Capitalized software costs
|
3-5
|
537
|
|
439
|
|
|||||
|
Leasehold improvements
|
Length of Lease
(2)
|
1,395
|
|
1,056
|
|
|||||
|
Property, plant and equipment, at cost
|
9,291
|
|
8,419
|
|
||||||
|
Accumulated depreciation
|
(5,066
|
)
|
(4,831
|
)
|
||||||
|
Property, plant and equipment, net
|
$
|
4,225
|
|
$
|
3,588
|
|
||||
|
(1)
|
Land is not a depreciable asset.
|
|
(2)
|
Leasehold improvements are depreciated over the shorter of the useful life of the asset or the length of the lease.
|
Goodwill and Other Purchased Intangible Assets
The company tests goodwill for impairment at least annually as of December 31, or when an indicator of potential impairment exists. When performing the goodwill impairment test, the company uses a discounted cash flow approach corroborated by comparative market multiples, where appropriate, to determine the fair value of its reporting units.
Goodwill and other purchased intangible asset balances are included in the identifiable assets of their assigned business segment. The company charges goodwill impairment, as well as the amortization of other purchased intangible assets, against the respective segment’s operating income. Purchased intangible assets are amortized on a straight-line basis over their estimated useful lives and are included in other non-current assets in the consolidated statements of financial position.
Leases
The company uses its incremental borrowing rate in the assessment of lease classification as capital or operating and defines the initial lease term to include renewal options determined to be reasonably assured. The majority of our leases are operating leases.
Many of the company’s real property lease agreements contain incentives for tenant improvements, rent holidays, or rent escalation clauses. For tenant improvement incentives, the company records a deferred rent liability and amortizes the deferred rent over the term of the lease as a reduction to rent expense. For rent holidays and rent escalation clauses during the lease term, the company records rental expense on a straight-line basis over the term of the lease. For purposes of recognizing lease incentives, the company uses the date of initial possession as the commencement date, which is generally when the company is given the right of access to the space and begins to make improvements in preparation for intended use.
-
49
-
NORTHROP GRUMMAN CORPORATION
Litigation, Commitments and Contingencies
We accrue for litigation, commitments and contingencies when management, after considering the facts and circumstances of each matter as then known to management, has determined it is probable a liability will be found to have been incurred and the amount of the loss can be reasonably estimated. When only a range of amounts is reasonably estimable and no amount within the range is more likely than another, the low end of the range is recorded. Legal fees are expensed as incurred. Due to the inherent uncertainties surrounding gain contingencies, we generally do not recognize potential gains until realized.
Environmental Costs
We accrue for environmental liabilities when management determines that, based on the facts and circumstances known to the company, it is probable the company will incur costs to address environmental impacts and the costs are reasonably estimable. When only a range of amounts is reasonably estimable and no amount within the range is more probable than another, we record the low end of the range. The company typically projects environmental costs for up to 30 years, records environmental liabilities on an undiscounted basis, and excludes asset retirement obligations and certain legal costs. At sites involving multiple parties, we accrue environmental liabilities based upon our expected share of liability, taking into account the financial viability of other liable parties. As a portion of environmental remediation liabilities are expected to be recoverable through overhead charges on government contracts, such amounts are deferred in inventoried costs (current portion) and other non-current assets until charged to contracts. The portion of environmental costs not expected to be recoverable is expensed.
Retirement Benefits
The company sponsors various defined benefit pension plans and defined contribution retirement plans covering substantially all of its employees. In most cases, our defined contribution plans provide for a company match of employee contributions. The company also provides post-retirement benefits other than pensions to eligible retirees and qualifying dependents, consisting principally of health care and life insurance benefits.
The liabilities, unamortized benefit plan costs and annual income or expense of the company’s defined benefit pension and other post-retirement benefit plans are determined using methodologies that involve several actuarial assumptions. Unamortized benefit plan costs consist primarily of accumulated net after-tax actuarial losses.
Because U.S. Government regulations require that the costs of pension and other post-retirement plans be charged to our contracts in accordance with the Federal Acquisition Regulation (FAR) and the related U.S. Government Cost Accounting Standards (CAS) that govern such plans, we calculate retiree benefit plan costs under both CAS and FAS methods. While both FAS and CAS recognize a normal service cost component in measuring periodic pension cost, there are differences in the way the components of annual pension costs are calculated under each method. Measuring plan obligations under FAS and CAS includes different assumptions and models, such as in estimating returns on plan assets, calculating interest expense, and the periods over which gains/losses related to pension assets and actuarial changes are amortized. As a result, annual retiree benefit plan expense amounts for FAS are different from the amounts for CAS in any given reporting period even though the ultimate cost of providing benefits over the life of the plans is the same under either method. CAS retiree benefit plan costs are charged to contracts and are included in segment operating income, and the difference between FAS and CAS expense is recorded in operating income at the consolidated company level.
For GAAP reporting, net actuarial gains or losses are amortized to expense on a plan-by-plan basis when they exceed the accounting corridor. The accounting corridor is a defined range within which amortization of net gains and losses is not required and is equal to
10 percent
of the greater of plan assets or benefit obligations. For most of the company’s plans, gains or losses outside of the corridor are subject to amortization over the average future service period of active plan participants (approximately
eight
years). For plans where all or almost all plan participants are inactive, gains or losses outside of the corridor are generally subject to amortization over the average remaining life expectancy of plan participants (approximately
20
years). Not all net periodic pension expense is recognized in net earnings in the year incurred because it is allocated as production costs and a portion remains in inventory at the end of a reporting period. The company’s funding policy for the qualified pension plans is to contribute, at a minimum, the statutorily required amount to an irrevocable trust.
Stock Compensation
The company’s stock compensation plans are classified as equity plans and compensation expense is generally recognized over the vesting period (typically
three
years), net of estimated forfeitures. The company issues stock awards in the form of restricted performance stock rights and restricted stock rights. The fair value of stock awards is determined based on the closing market price of the company’s common stock on the grant date. At each reporting
-
50
-
NORTHROP GRUMMAN CORPORATION
date, the number of shares used to calculate compensation expense and diluted earnings per share is adjusted to reflect the number ultimately expected to vest.
Accumulated Other Comprehensive Loss
The components of accumulated other comprehensive loss are as follows:
|
|
December 31
|
|||||||
|
$ in millions
|
2017
|
2016
|
||||||
|
Unamortized benefit plan costs, net of tax benefit of $3,056 for 2017 and $3,439 for 2016
|
$
|
(4,586
|
)
|
$
|
(5,416
|
)
|
||
|
Cumulative translation adjustment
|
(136
|
)
|
(132
|
)
|
||||
|
Net unrealized gain on marketable securities and cash flow hedges, net of tax
|
4
|
|
2
|
|
||||
|
Total accumulated other comprehensive loss
|
$
|
(4,718
|
)
|
$
|
(5,546
|
)
|
||
Unamortized benefit plan costs consist primarily of net after-tax actuarial losses totaling
$4.7 billion
and
$5.6 billion
as of
December 31, 2017
and
2016
, respectively. Net actuarial gains or losses are re-determined annually or upon remeasurement events and principally arise from changes in the interest rate used to discount our benefit obligations and differences between expected and actual returns on plan assets.
Reclassifications from accumulated other comprehensive loss to net earnings related to the amortization of benefit plan costs were
$398 million
,
$402 million
and
$388 million
, net of taxes, for the years ended
December 31, 2017
,
2016
and
2015
, respectively. The reclassifications represent the amortization of net actuarial losses and prior service credits, and are included in the computation of net periodic pension cost. See Note
13
for further information.
Reclassifications from accumulated other comprehensive loss to net earnings, relating to cumulative translation adjustments, marketable securities and effective cash flow hedges were not material for the years ended
December 31, 2017
,
2016
and
2015
.
Related Party Transactions
For all periods presented, the company had no material related party transactions.
Accounting Standards Updates
On March 10, 2017, the
Financial Accounting Standards Board (FASB)
issued
Accounting Standards Update (ASU)
No. 2017-07
Compensation Retirement Benefits (Topic 715): Improving the Presentation of Net Periodic Pension Cost and Net Periodic Postretirement Benefit Cost
. ASU 2017-07 requires employers that sponsor defined benefit pension and/or other post-retirement benefit plans to report the service cost component of net benefit cost in the same line item as other compensation costs arising from services rendered by the pertinent employees during the period. Employers are required to present the other components of net benefit costs in the income statement separately from the service cost component and outside a subtotal of income from operations. Additionally, only the service cost component of net periodic pension cost will be eligible for asset capitalization.
We expect adoption of ASU 2017-07 to result in a change in our net FAS/CAS pension adjustment within operating income, which will be offset by a corresponding change in Other, net to reflect the impact of presenting the interest cost, expected return on plan assets, and amortization of prior service credit and net actuarial loss components of net periodic benefit costs outside of operating income. In addition, interest on service cost and plan administrative expenses, which, in some cases, are currently included within service cost, will be presented in the interest cost and amortization of net actuarial loss components, respectively, in Other, net. We adopted ASU 2017-07 on January 1, 2018 using the retrospective method and do not anticipate a material change to our 2017 net FAS/CAS pension adjustment in operating income or Other, net when they are recast to reflect the standard. We also do not expect ASU 2017-07 to have a material impact on our consolidated statements of financial position and/or cash flows.
On February 25, 2016, the FASB issued ASU No. 2016-02,
Leases (Topic 842)
. ASU 2016-02 supersedes existing lease guidance, including Accounting Standards Codification (ASC) 840 -
Leases
. Among other things, ASU 2016-02 requires recognition of a right-of-use asset and liability for future lease payments for contracts that meet the definition of a lease and requires disclosure of certain information about leasing arrangements. ASU 2016-02 will be effective January 1, 2019, although early adoption is permitted, and it is currently required to be applied using a modified retrospective transition method. We expect to adopt the standard on January 1, 2019. We are reviewing our leases to determine the effect ASU 2016-02 will have on the company’s consolidated financial position, annual results of operations and/or cash flows. We currently expect the right-of-use assets and lease liabilities recognized upon adoption will each approximate our future minimum lease payments, as disclosed in our
Annual Report
s
on
-
51
-
NORTHROP GRUMMAN CORPORATION
Form 10-K. We do not expect ASU 2016-02 to have a material impact on our annual results of operations and/or cash flows.
On May 28, 2014, the FASB issued ASU No. 2014-09,
Revenue from Contracts with Customers
(Topic 606)
. Topic 606
supersedes existing revenue recognition guidance, including ASC 605-35,
Revenue Recognition - Construction-Type and Production-Type Contracts,
and outlines a single set of comprehensive principles for recognizing revenue under
GAAP. Among other things, it requires companies to identify contractual performance obligations and determine whether revenue should be recognized at a point in time or over time. On July 9, 2015, the FASB approved a one year deferral of the effective date of
Topic 606
to annual reporting periods beginning after December 15, 2017.
Topic 606
may be applied either retrospectively or through the use of a modified-retrospective method.
We
adopted
the standard
effective
January 1, 2018
, using the full retrospective method.
During
2017
, we
completed our evaluation of
Topic 606
, including the
impact on our business processes, systems and controls, and
differences in the timing and/or method of revenue recognition for our contracts. As a result of our evaluation, we identified changes to and
modified
certain of our accounting policies and practices. We also designed and implemented specific controls over our evaluation of the impact of
Topic 606
, including our calculation of the cumulative effect of adopting
Topic 606
. Although
there were no
significant changes to our accounting systems or controls upon adoption of
Topic 606
, we
modified
certain of our
existing
controls to incorporate the revisions we
made to our accounting policies and practices.
Based on our evaluation of
Topic 606, we do
not expect it to
have a material impact on our results of operations or cash flows in the periods after adoption.
Under
Topic 606
, revenue is recognized as control transfers to the customer. As such, under the new standard, revenue for our contracts is generally recognized over time using the cost-to-cost method, which is consistent with the revenue recognition model used for the majority of our contracts prior to the adoption of Topic 606. In most cases the accounting for those contracts where we previously recognized revenue as units were delivered has changed under
Topic 606
such that we now recognize revenue as costs are incurred. This change generally results in an acceleration of revenue as compared with our previous revenue recognition method for those contracts. In addition, for certain of our contracts,
there is a change in the number of performance obligations
under
Topic 606
, which
has altered the timing of revenue and margin recognition.
Topic 606
also requires expanded disclosure regarding the nature, timing, and uncertainty of revenue, cash flow and customer contract balances, including how and when we satisfy our performance obligations and the relationship between revenue recognized and changes in contract balances during a reporting period. We have evaluated these disclosure requirements and incorporated the collection of relevant data into our reporting process.
During
2017, we completed our assessment of the cumulative effect of adopting
Topic 606
. Under the full retrospective method, we
principally recognized the cumulative effect of adoption as an increase in unbilled accounts receivable, a reduction in inventoried costs, an increase in advance payments and amounts in excess of costs incurred and a net increase in retained earnings as of January 1, 2016.
We
also completed our assessment of the impact of adoption on our 2016
and 2017
results.
The following table includes selected financial information that has been recast to reflect the adoption of Topic 606:
|
Year Ended December 31
|
|||||||
|
$ in millions, except per share amounts
|
2017
|
2016
|
|||||
|
Sales
|
$
|
26,004
|
|
$
|
24,706
|
|
|
|
Operating income
|
3,246
|
|
3,125
|
|
|||
|
Net earnings
|
1,995
|
|
2,156
|
|
|||
|
Basic earnings per share
|
$
|
11.44
|
|
$
|
12.05
|
|
|
|
Diluted earnings per share
|
11.36
|
|
11.94
|
|
|||
These amounts principally reflect the impact under Topic 606 of converting contracts to the cost-to-cost method of accounting as well as changes in the number of performance obligations for certain of our contracts. The impact of adopting Topic 606 on our 2016 and 2017 results of operations may not be indicative of the impact in future years.
Other accounting standards updates issued, but not effective until after
December 31, 2017
, are not expected to have a material effect on the company’s consolidated financial position, annual results of operations and/or cash flows.
-
52
-
NORTHROP GRUMMAN CORPORATION
2
. PENDING ACQUISITION OF ORBITAL ATK
On September 17, 2017, the company entered into a definitive merger agreement to acquire all of the outstanding shares of Orbital ATK, Inc. (Orbital ATK) for approximately
$7.8 billion
in cash, plus the assumption of approximately
$1.4 billion
in net debt (the “Orbital ATK Acquisition”).
Under the terms of the merger agreement, Orbital ATK shareholders are to receive all-cash consideration of
$134.50
per share. We expect to fund the Orbital ATK Acquisition with the proceeds from our debt financing completed in October 2017 and cash on hand.
See Note 10
for further information on our Orbital ATK Acquisition financing. On November 29, 2017, Orbital ATK shareholders approved the proposed Orbital ATK Acquisition. We currently expect the transaction to close in the first half of 2018, after receiving regulatory approvals.
Upon completion of the Orbital ATK Acquisition, we plan to establish Orbital ATK as a new, fourth business sector named Northrop Grumman Innovation Systems.
3
. EARNINGS PER SHARE, SHARE REPURCHASES AND DIVIDENDS ON COMMON STOCK
Basic Earnings Per Share
We calculate basic earnings per share by dividing net earnings by the weighted-average number of shares of common stock outstanding during each period.
Diluted Earnings Per Share
Diluted earnings per share include the dilutive effect of awards granted to employees under stock-based compensation plans. The dilutive effect of these securities totaled
1.2 million
,
1.6 million
and
2.2 million
shares for the years ended
December 31, 2017
,
2016
and
2015
, respectively.
Share Repurchases
On May 15, 2013, the company’s board of directors authorized a share repurchase program of up to
$4.0 billion
of the company’s common stock (the “2013 Repurchase Program”). Repurchases under the 2013 Repurchase Program commenced in September 2013 and were completed in March 2015. On December 4, 2014, the company’s board of directors authorized a new share repurchase program of up to
$3.0 billion
of the company’s common stock (the “2014 Repurchase Program”). Repurchases under the 2014 Repurchase Program commenced in March 2015 and were completed in March 2016.
On September 16, 2015, the company’s board of directors authorized a new share repurchase program of up to
$4.0 billion
of the company’s common stock (the “2015 Repurchase Program”). Repurchases under the 2015 Repurchase Program commenced in March 2016 upon the completion of the company’s 2014 Repurchase Program. As of
December 31, 2017
, repurchases under the 2015 Repurchase Program totaled
$1.7 billion
;
$2.3 billion
remained under this share repurchase authorization. By its terms, the 2015 Repurchase Program is set to expire when we have used all authorized funds for repurchases.
Share repurchases take place from time to time, subject to market conditions and management’s discretion, in the open market or in privately negotiated transactions. The company retires its common stock upon repurchase
and, in the periods presented, has not made any purchases of common stock other than in connection with these publicly announced repurchase programs.
The table below summarizes the company’s share repurchases to date under the authorizations described above:
|
Repurchase Program
Authorization Date |
Amount
Authorized (in millions) |
Total
Shares Retired (in millions) |
Average
Price Per Share (1) |
Date Completed
|
Shares Repurchased
(in millions) |
|||||||||||||||||
|
Year Ended December 31
|
||||||||||||||||||||||
|
2017
|
2016
|
2015
|
||||||||||||||||||||
|
May 15, 2013
|
$
|
4,000
|
|
32.8
|
|
$
|
121.97
|
|
March 2015
|
—
|
|
—
|
|
2.7
|
|
|||||||
|
December 4, 2014
|
$
|
3,000
|
|
18.0
|
|
$
|
166.70
|
|
March 2016
|
—
|
|
1.4
|
|
16.6
|
|
|||||||
|
September 16, 2015
|
$
|
4,000
|
|
7.4
|
|
$
|
222.93
|
|
|
1.6
|
|
5.9
|
|
—
|
|
|||||||
|
1.6
|
|
7.3
|
|
19.3
|
|
|||||||||||||||||
|
(1)
|
Includes commissions paid.
|
Dividends on Common Stock
In May
2017
, the company increased the quarterly common stock dividend
11
percent to
$1.00
per share from the previous amount of
$0.90
per share.
-
53
-
NORTHROP GRUMMAN CORPORATION
In May
2016
, the company increased the quarterly common stock dividend
13
percent to
$0.90
per share from the previous amount of
$0.80
per share.
In May
2015
, the company increased the quarterly common stock dividend
14
percent to
$0.80
per share from the previous amount of
$0.70
per share.
4
. SEGMENT INFORMATION
The company is aligned in
three
operating sectors, which also comprise our reportable segments: Aerospace Systems, Mission Systems and Technology Services.
The following table presents sales and operating income by segment:
|
|
Year Ended December 31
|
|||||||||||
|
$ in millions
|
2017
|
2016
|
2015
|
|||||||||
|
Sales
|
||||||||||||
|
Aerospace Systems
|
$
|
11,955
|
|
$
|
10,828
|
|
$
|
9,940
|
|
|||
|
Mission Systems
|
11,382
|
|
10,928
|
|
10,674
|
|
||||||
|
Technology Services
|
4,750
|
|
4,825
|
|
4,819
|
|
||||||
|
Intersegment eliminations
|
(2,284
|
)
|
(2,073
|
)
|
(1,907
|
)
|
||||||
|
Total sales
|
25,803
|
|
24,508
|
|
23,526
|
|
||||||
|
Operating income
|
||||||||||||
|
Aerospace Systems
|
1,259
|
|
1,236
|
|
1,205
|
|
||||||
|
Mission Systems
|
1,453
|
|
1,445
|
|
1,410
|
|
||||||
|
Technology Services
|
524
|
|
512
|
|
514
|
|
||||||
|
Intersegment eliminations
|
(277
|
)
|
(258
|
)
|
(209
|
)
|
||||||
|
Total segment operating income
|
2,959
|
|
2,935
|
|
2,920
|
|
||||||
|
Net FAS/CAS pension adjustment
|
594
|
|
316
|
|
348
|
|
||||||
|
Unallocated corporate expenses
|
(250
|
)
|
(53
|
)
|
(190
|
)
|
||||||
|
Other
|
(4
|
)
|
(5
|
)
|
(2
|
)
|
||||||
|
Total operating income
|
$
|
3,299
|
|
$
|
3,193
|
|
$
|
3,076
|
|
|||
Net FAS/CAS Pension Adjustment
For financial statement purposes, we account for our employee pension plans in accordance with FAS. However, the cost of these plans is charged to our contracts in accordance with the FAR and the related CAS. The net FAS/CAS pension adjustment reflects the difference between CAS pension expense included as cost in segment operating income and FAS expense included in total operating income.
Unallocated Corporate Expenses
Unallocated corporate expenses include the portion of corporate expenses not considered allowable or allocable under applicable CAS or the FAR, and therefore not allocated to the segments. Such costs consist of a portion of management and administration, legal, environmental, compensation, retiree benefits and other corporate unallowable costs.
Intersegment Sales and Operating Income
Sales between segments are recorded at values that include intercompany operating income for the performing segment based on that segment’s estimated average operating margin rate for external sales. Such intercompany operating income is eliminated in consolidation, so that the company’s total sales and total operating income reflect only those transactions with external customers. See Note
1
for additional information.
-
54
-
NORTHROP GRUMMAN CORPORATION
The following table presents intersegment sales and operating income before eliminations:
|
|
Year Ended December 31
|
|||||||||||||||||||||||
|
$ in millions
|
2017
|
2016
|
2015
|
|||||||||||||||||||||
|
|
Sales
|
Operating
Income
|
Sales
|
Operating
Income
|
Sales
|
Operating
Income
|
||||||||||||||||||
|
Intersegment sales and operating income
|
||||||||||||||||||||||||
|
Aerospace Systems
|
$
|
295
|
|
$
|
33
|
|
$
|
239
|
|
$
|
28
|
|
$
|
221
|
|
$
|
27
|
|
||||||
|
Mission Systems
|
954
|
|
141
|
|
875
|
|
136
|
|
781
|
|
97
|
|
||||||||||||
|
Technology Services
|
1,035
|
|
103
|
|
959
|
|
94
|
|
905
|
|
85
|
|
||||||||||||
|
Total
|
$
|
2,284
|
|
$
|
277
|
|
$
|
2,073
|
|
$
|
258
|
|
$
|
1,907
|
|
$
|
209
|
|
||||||
Assets
Substantially all of the company’s operating assets are located in the U.S. The following table presents assets by segment:
|
December 31
|
||||||||
|
$ in millions
|
2017
|
2016
|
||||||
|
Assets
|
||||||||
|
Aerospace Systems
|
$
|
8,449
|
|
$
|
7,523
|
|
||
|
Mission Systems
|
10,204
|
|
9,991
|
|
||||
|
Technology Services
|
3,010
|
|
3,082
|
|
||||
|
Segment assets
|
21,663
|
|
20,596
|
|
||||
|
Corporate assets
(1)
|
13,254
|
|
5,018
|
|
||||
|
Total assets
|
$
|
34,917
|
|
$
|
25,614
|
|
||
|
(1)
|
Corporate assets principally consist of cash and cash equivalents and deferred tax assets.
|
Capital Expenditures and Depreciation and Amortization
The following table presents capital expenditures and depreciation and amortization by segment:
|
|
Capital Expenditures
|
Depreciation and Amortization
(1)
|
||||||||||||||||||||||
|
$ in millions
|
2017
|
2016
|
2015
|
2017
|
2016
|
2015
|
||||||||||||||||||
|
Aerospace Systems
|
$
|
665
|
|
$
|
451
|
|
$
|
237
|
|
$
|
234
|
|
$
|
216
|
|
$
|
215
|
|
||||||
|
Mission Systems
|
164
|
|
372
|
|
141
|
|
131
|
|
140
|
|
153
|
|
||||||||||||
|
Technology Services
|
15
|
|
6
|
|
3
|
|
40
|
|
37
|
|
36
|
|
||||||||||||
|
Corporate
|
84
|
|
91
|
|
90
|
|
70
|
|
63
|
|
63
|
|
||||||||||||
|
Total
|
$
|
928
|
|
$
|
920
|
|
$
|
471
|
|
$
|
475
|
|
$
|
456
|
|
$
|
467
|
|
||||||
|
(1)
|
Depreciation and amortization expense includes amortization of purchased intangible assets, as well as amortization of deferred and other outsourcing costs.
|
5. ACCOUNTS RECEIVABLE, NET
Unbilled amounts represent sales for which billings have not been presented to customers by period-end. These amounts are generally billed and collected within one year. Substantially all accounts receivable at
December 31, 2017
are expected to be collected in
2018
. The company does not believe it has significant exposure to credit risk, as accounts receivable and the related unbilled amounts are primarily due from the U.S. Government either as the ultimate customer or in connection with foreign military sales. Progress and performance-based payments are reflected as an offset to the related unbilled accounts receivable balance for contracts accounted for under the cost-to-cost method of percentage-of-completion accounting.
-
55
-
NORTHROP GRUMMAN CORPORATION
Accounts receivable consisted of the following:
|
|
December 31
|
|||||||
|
$ in millions
|
2017
|
2016
|
||||||
|
Due from U.S. Government
(1)
|
||||||||
|
Billed
|
$
|
656
|
|
$
|
482
|
|
||
|
Unbilled
|
10,818
|
|
9,730
|
|
||||
|
Progress and performance-based payments received
|
(8,068
|
)
|
(7,484
|
)
|
||||
|
Total due from U.S. Government
|
3,406
|
|
2,728
|
|
||||
|
Due from International and Other Customers
|
||||||||
|
Billed
|
218
|
|
200
|
|
||||
|
Unbilled
|
3,397
|
|
3,895
|
|
||||
|
Progress and performance-based payments received
|
(2,966
|
)
|
(3,461
|
)
|
||||
|
Total due from International and Other Customers
|
649
|
|
634
|
|
||||
|
Total accounts receivable
|
4,055
|
|
3,362
|
|
||||
|
Allowance for doubtful accounts
|
(79
|
)
|
(63
|
)
|
||||
|
Total accounts receivable, net
|
$
|
3,976
|
|
$
|
3,299
|
|
||
|
(1)
|
Includes receivables due from the U.S. Government associated with foreign military sales (FMS). For FMS, we contract with and are paid by the U.S. Government.
|
6. INVENTORIED COSTS, NET
Inventoried costs are primarily from contracts where the U.S. Government is the primary customer, therefore the company does not believe it has significant exposure to recoverability risk related to these amounts.
Inventoried costs consisted of the following:
|
|
December 31
|
|||||||
|
$ in millions
|
2017
|
2016
|
||||||
|
Production costs of contracts in process
|
$
|
1,813
|
|
$
|
1,574
|
|
||
|
G&A expenses
|
266
|
|
249
|
|
||||
|
Contracts in process, gross
|
2,079
|
|
1,823
|
|
||||
|
Progress and performance-based payments received
|
(1,396
|
)
|
(1,107
|
)
|
||||
|
Contracts in process, net
|
683
|
|
716
|
|
||||
|
Product inventory and raw material
|
97
|
|
100
|
|
||||
|
Total inventoried costs, net
|
$
|
780
|
|
$
|
816
|
|
||
7
. INCOME TAXES
In December 2017, the Tax Cuts and Jobs Act (the “2017 Tax Act”) was enacted. The 2017 Tax Act includes a number of changes to existing U.S. tax laws that impact the company, most notably a reduction of the U.S. corporate income tax rate from
35 percent
to
21 percent
for tax years beginning after December 31, 2017. The 2017 Tax Act also provides for a one-time transition tax on certain foreign earnings and the acceleration of depreciation for certain assets placed into service after September 27, 2017 as well as prospective changes beginning in 2018, including repeal of the domestic manufacturing deduction, acceleration of tax revenue recognition, capitalization of research and development expenditures, additional limitations on executive compensation and limitations on the deductibility of interest.
-
56
-
NORTHROP GRUMMAN CORPORATION
The company recognized the income tax effects of the 2017 Tax Act in its 2017 financial statements in accordance with Staff Accounting Bulletin No. 118, which provides SEC staff guidance for the application of ASC Topic 740,
Income Taxes
, in the reporting period in which the 2017 Tax Act was signed into law. As such, the company’s financial results reflect the income tax effects of the 2017 Tax Act for which the accounting under ASC Topic 740 is complete and provisional amounts for those specific income tax effects of the 2017 Tax Act for which the accounting under ASC Topic 740 is incomplete but a reasonable estimate could be determined. The company did not identify items for which the income tax effects of the 2017 Tax Act have not been completed and a reasonable estimate could not be determined as of December 31, 2017.
The following table presents the impact of the 2017 Tax Act as an increase (decrease) reflected in the noted line items in the Consolidated Statements of Earnings and Comprehensive Income and Consolidated Statements of Financial Position:
|
Year Ended December 31, 2017
|
|||||||||||||||
|
($ in millions)
|
Reduction of U.S. Corporate Income Tax Rate
|
Transition Tax on Foreign Earnings
|
Acceleration of Depreciation
|
Other
|
Total
|
||||||||||
|
Income tax expense
|
$
|
280
|
|
$
|
13
|
|
$
|
5
|
|
$
|
2
|
|
$
|
300
|
|
|
Effective tax rate
|
9.1
|
%
|
0.4
|
%
|
0.2
|
%
|
0.1
|
%
|
9.8
|
%
|
|||||
|
As of December 31, 2017
|
|||||||||||||||
|
($ in millions)
|
Reduction of U.S. Corporate Income Tax Rate
|
Transition Tax on Foreign Earnings
|
Acceleration of Depreciation
|
Other
|
Total
|
||||||||||
|
Deferred tax assets
|
$
|
(280
|
)
|
$
|
(13
|
)
|
$
|
(80
|
)
|
$
|
—
|
|
$
|
(373
|
)
|
|
Other current liabilities
|
—
|
|
—
|
|
(75
|
)
|
2
|
|
(73
|
)
|
|||||
The changes to existing U.S. tax laws as a result of the 2017 Tax Act, which we believe have the most significant impact on the company’s federal income taxes are as follows:
Reduction of the U.S. Corporate Income Tax Rate
The company measures deferred tax assets and liabilities using enacted tax rates that will apply in the years in which the temporary differences are expected to be recovered or paid. Accordingly, the company’s deferred tax assets and liabilities were remeasured to reflect the reduction in the U.S. corporate income tax rate from
35 percent
to
21 percent
, resulting in a
$280 million
increase in income tax expense for the year ended December 31, 2017 and a corresponding
$280 million
decrease in net deferred tax assets as of December 31, 2017.
Transition Tax on Foreign Earnings
The company recognized a provisional income tax expense of
$13 million
for the year ended December 31, 2017 related to the one-time transition tax on certain foreign earnings. This resulted in a corresponding decrease in deferred tax assets due to the utilization of foreign tax credit carryforwards. The determination of the transition tax requires further analysis regarding the amount and composition of the company’s historical foreign earnings, which is expected to be completed in the second half of 2018.
Acceleration of Depreciation
The company recognized a provisional reduction to net deferred tax assets of
$80 million
attributable to the accelerated depreciation for certain assets placed into service after September 27, 2017 and a provisional income tax expense of
$5 million
for the corresponding impact on its 2017 domestic manufacturing deduction. These provisional adjustments resulted in a decrease in income tax payable of
$75 million
. The income tax effects for these positions require further analysis due to the volume of data required to complete the calculations; the company expects to complete those analyses in the second half of 2018.
Effective January 1, 2018, the 2017 Tax Act requires the acceleration of revenue for tax purposes for certain types of revenue. This change impacts several accounting methods previously used by the company and is expected to result in an acceleration of taxability of such revenue beginning in 2018 as compared with prior U.S. tax laws.
-
57
-
NORTHROP GRUMMAN CORPORATION
Income Tax Expense
Federal and foreign income tax expense consisted of the following:
|
|
Year Ended December 31
|
|||||||||||
|
$ in millions
|
2017
|
2016
|
2015
|
|||||||||
|
Federal income tax expense:
|
||||||||||||
|
Current
|
$
|
449
|
|
$
|
661
|
|
$
|
310
|
|
|||
|
Deferred
|
581
|
|
49
|
|
472
|
|
||||||
|
Total federal income tax expense
|
1,030
|
|
710
|
|
782
|
|
||||||
|
Foreign income tax expense:
|
||||||||||||
|
Current
|
8
|
|
14
|
|
21
|
|
||||||
|
Deferred
|
(4
|
)
|
(1
|
)
|
(3
|
)
|
||||||
|
Total foreign income tax expense
|
4
|
|
13
|
|
18
|
|
||||||
|
Total federal and foreign income tax expense
|
$
|
1,034
|
|
$
|
723
|
|
$
|
800
|
|
|||
Earnings from foreign operations before income taxes are not material for all periods presented.
Income tax expense differs from the amount computed by multiplying earnings before income taxes by the statutory federal income tax rate due to the following:
|
|
Year Ended December 31
|
||||||||||||||||||||
|
$ in millions
|
2017
|
2016
|
2015
|
||||||||||||||||||
|
Income tax expense at statutory rate
|
$
|
1,067
|
|
35.0
|
%
|
$
|
1,023
|
|
35.0
|
%
|
$
|
976
|
|
35.0
|
%
|
||||||
|
Stock compensation - excess tax benefits
|
(48
|
)
|
(1.6
|
)
|
(85
|
)
|
(2.9
|
)
|
—
|
|
—
|
|
|||||||||
|
Research credit
|
(130
|
)
|
(4.2
|
)
|
(61
|
)
|
(2.1
|
)
|
(119
|
)
|
(4.3
|
)
|
|||||||||
|
Manufacturing deduction
|
(97
|
)
|
(3.2
|
)
|
(58
|
)
|
(2.0
|
)
|
(31
|
)
|
(1.1
|
)
|
|||||||||
|
Settlements with taxing authorities
|
(42
|
)
|
(1.4
|
)
|
(40
|
)
|
(1.4
|
)
|
—
|
|
—
|
|
|||||||||
|
Repatriation of non-U.S. earnings
|
—
|
|
—
|
|
(33
|
)
|
(1.1
|
)
|
—
|
|
—
|
|
|||||||||
|
Impacts related to the 2017 Tax Act
|
300
|
|
9.8
|
|
—
|
|
—
|
|
—
|
|
—
|
|
|||||||||
|
Other, net
|
(16
|
)
|
(0.5
|
)
|
(23
|
)
|
(0.8
|
)
|
(26
|
)
|
(0.9
|
)
|
|||||||||
|
Total federal and foreign income taxes
|
$
|
1,034
|
|
33.9
|
%
|
$
|
723
|
|
24.7
|
%
|
$
|
800
|
|
28.7
|
%
|
||||||
2017
– The effective tax rate for
2017
was
33.9 percent
, as compared with
24.7 percent
in
2016
.
The higher rate is principally due to
$300 million
of tax expense recorded in connection with the 2017 Tax Act, largely due to the write-down of net deferred tax assets, partially offset by a
$69 million
increase in research credits and a
$39 million
benefit recognized for additional manufacturing deductions principally related to prior years. The effective tax rates for the years ended December 31, 2017 and 2016 each include separate approximately
$40 million
benefits recognized in connection with the resolution of Internal Revenue Service (IRS) examinations of the company’s prior year tax returns.
2016
– The effective tax rate for
2016
was
24.7 percent
, as compared with
28.7 percent
in
2015
.
The lower rate is principally due to
$85 million
of excess tax benefits related to employee share-based payment transactions recognized in 2016
, a
$40 million
benefit recognized in connection with resolution of the IRS examination of the company’s 2007-2011 tax returns and a
$33 million
benefit recognized in connection with the repatriation of earnings from certain of our foreign subsidiaries
. These benefits were partially offset by a
$58 million
decrease in research credits, which were principally a result of credits recorded in 2015 that were claimed on our prior year tax returns.
Income tax payments, net of refunds received, were
$517 million
,
$691 million
and
$118 million
for the years ended
December 31, 2017
,
2016
and
2015
, respectively.
Uncertain Tax Positions
We file income tax returns in the U.S. federal jurisdiction and in various state and foreign jurisdictions. Our 2014-2015 federal tax returns are currently under
IRS
examination and our 2007-2011 federal tax returns are subject to examination due to the filing of refund claims for these years. The company believes it is reasonably possible that within the next twelve months we may resolve certain matters related to the years under examination, which may result in reductions of our unrecognized tax benefits up to
$115 million
and income tax expense up to
$30 million
.
-
58
-
NORTHROP GRUMMAN CORPORATION
Tax returns for open tax years related to state and foreign jurisdictions remain subject to examination, but the amounts currently subject to examination are not considered material.
The change in unrecognized tax benefits during
2017
,
2016
and
2015
, excluding interest, is as follows:
|
|
December 31
|
|||||||||||
|
$ in millions
|
2017
|
2016
|
2015
|
|||||||||
|
Unrecognized tax benefits at beginning of the year
|
$
|
135
|
|
$
|
223
|
|
$
|
210
|
|
|||
|
Additions based on tax positions related to the current year
|
102
|
|
35
|
|
52
|
|
||||||
|
Additions for tax positions of prior years
|
110
|
|
2
|
|
17
|
|
||||||
|
Reductions for tax positions of prior years
|
(44
|
)
|
(40
|
)
|
(10
|
)
|
||||||
|
Settlements with taxing authorities
|
(20
|
)
|
(84
|
)
|
—
|
|
||||||
|
Other, net
|
—
|
|
(1
|
)
|
(46
|
)
|
||||||
|
Net change in unrecognized tax benefits
|
148
|
|
(88
|
)
|
13
|
|
||||||
|
Unrecognized tax benefits at end of the year
|
$
|
283
|
|
$
|
135
|
|
$
|
223
|
|
|||
These liabilities, along with
$11 million
of accrued interest and penalties, are included in other current and non-current liabilities in the consolidated statements of financial position. If the income tax benefits from these tax positions are ultimately realized,
$149 million
of federal and foreign tax benefits would reduce the company’s effective tax rate.
Net interest expense within the company’s federal, foreign and state income tax provisions was not material for all years presented.
Deferred Income Taxes
Deferred income taxes reflect the net tax effects of temporary differences between the carrying amounts of assets and liabilities for financial reporting purposes and tax purposes. Net deferred tax assets and liabilities are classified as non-current in the consolidated statements of financial position. As described above, deferred tax assets and liabilities are measured based on the enacted tax rates that will apply in the years in which the temporary differences are expected to be recovered or paid. As such, during December 2017, the company remeasured its deferred tax assets and liabilities as a result of passage of the 2017 Tax Act. The primary impact of this remeasurement was a reduction in deferred tax assets and liabilities in connection with the reduction of the U.S. corporate income tax rate from
35 percent
to
21 percent
.
-
59
-
NORTHROP GRUMMAN CORPORATION
The tax effects of significant temporary differences and carryforwards that gave rise to year-end deferred federal, state and foreign tax balances, as presented in the consolidated statements of financial position, are as follows:
|
|
December 31
|
|||||||
|
$ in millions
|
2017
|
2016
|
||||||
|
Deferred Tax Assets
|
||||||||
|
Retiree benefits
|
$
|
1,477
|
|
$
|
2,814
|
|
||
|
Accrued employee compensation
|
263
|
|
349
|
|
||||
|
Provisions for accrued liabilities
|
193
|
|
295
|
|
||||
|
Inventory
|
191
|
|
287
|
|
||||
|
Stock-based compensation
|
46
|
|
72
|
|
||||
|
Other
|
39
|
|
72
|
|
||||
|
Gross deferred tax assets
|
2,209
|
|
3,889
|
|
||||
|
Less valuation allowance
|
(26
|
)
|
(31
|
)
|
||||
|
Net deferred tax assets
|
2,183
|
|
3,858
|
|
||||
|
Deferred Tax Liabilities
|
||||||||
|
Goodwill
|
511
|
|
798
|
|
||||
|
Property, plant and equipment, net
|
256
|
|
321
|
|
||||
|
Contract accounting differences
|
898
|
|
1,200
|
|
||||
|
Other
|
43
|
|
77
|
|
||||
|
Deferred tax liabilities
|
1,708
|
|
2,396
|
|
||||
|
Total net deferred tax assets
|
$
|
475
|
|
$
|
1,462
|
|
||
Realization of deferred tax assets is primarily dependent on generating sufficient taxable income in future periods. The company believes it is more-likely-than-not our deferred tax assets will be realized, net of valuation allowances currently established.
At
December 31, 2017
, the company has available foreign tax credits and unused net operating losses of
$5 million
and
$142 million
, respectively, that may be applied against future taxable income. The net operating losses are primarily attributable to the United Kingdom and may be carried forward indefinitely. A valuation allowance of
$26 million
, predominantly related to net operating losses, has been recorded due to the uncertainty regarding the realization of the asset.
Undistributed Foreign Earnings
As of
December 31, 2017
, the company has accumulated undistributed earnings generated by our foreign subsidiaries of approximately
$168 million
, of which
$153 million
was subject to the one-time transition tax on foreign earnings required by the
2017 Tax Act
or has otherwise been previously taxed. We intend to indefinitely reinvest these earnings, as well as future earnings from our foreign subsidiaries, to fund our international operations and foreign credit facility. In addition, we expect future U.S. cash generation will be sufficient to meet future U.S. cash needs.
8
. GOODWILL AND OTHER PURCHASED INTANGIBLE ASSETS
Goodwill
Changes in the carrying amounts of goodwill for the years ended
December 31, 2016
and
2017
, were as follows:
|
$ in millions
|
Aerospace Systems
|
Mission Systems
|
Technology Services
|
Total
|
||||||||||||
|
Balance as of December 31, 2015
|
$
|
3,742
|
|
$
|
6,704
|
|
$
|
2,014
|
|
$
|
12,460
|
|
||||
|
Businesses sold and other
(1)
|
—
|
|
(10
|
)
|
—
|
|
(10
|
)
|
||||||||
|
Balance as of December 31, 2016
|
$
|
3,742
|
|
$
|
6,694
|
|
$
|
2,014
|
|
$
|
12,450
|
|
||||
|
Other
(1)
|
—
|
|
2
|
|
3
|
|
5
|
|
||||||||
|
Balance as of December 31, 2017
|
$
|
3,742
|
|
$
|
6,696
|
|
$
|
2,017
|
|
$
|
12,455
|
|
||||
|
(1)
|
Other consists primarily of adjustments for foreign currency translation.
|
-
60
-
NORTHROP GRUMMAN CORPORATION
Accumulated goodwill impairment losses at
December 31, 2017
and
2016
, totaled
$570 million
at Aerospace Systems.
Purchased Intangible Assets
Purchased intangible assets at
December 31, 2017
and
2016
totaled
$52 million
and
$61 million
, respectively, net of accumulated amortization of
$1.8 billion
at each respective year end.
Amortization expense for
2017
,
2016
and
2015
, was
$14 million
,
$16 million
and
$22 million
, respectively. The company’s purchased intangible assets are being amortized over an aggregate weighted-average period of
22
years. As of
December 31, 2017
, the expected future amortization of purchased intangibles for each of the next five years is approximately
$10 million
per year.
9
. FAIR VALUE OF FINANCIAL INSTRUMENTS
The company holds a portfolio of marketable securities consisting of securities that are classified as either trading or available-for-sale to partially fund non-qualified employee benefit plans. These securities are included in other non-current assets in the consolidated statements of financial position.
The company’s derivative portfolio consists primarily of foreign currency forward contracts. Where model-derived valuations are appropriate, the company utilizes the income approach to determine the fair value and uses the applicable London Interbank Offered Rate (LIBOR) swap rates.
The following table presents the financial assets and liabilities we record at fair value on a recurring basis identified by the level of inputs used to determine fair value. See Note
1
for the definitions of these levels.
|
|
December 31, 2017
|
December 31, 2016
|
||||||||||||||||||||||
|
$ in millions
|
Level 1
|
Level 2
|
Total
|
Level 1
|
Level 2
|
Total
|
||||||||||||||||||
|
Financial Assets (Liabilities)
|
||||||||||||||||||||||||
|
Marketable securities
|
||||||||||||||||||||||||
|
Trading
|
$
|
342
|
|
$
|
1
|
|
$
|
343
|
|
$
|
321
|
|
$
|
2
|
|
$
|
323
|
|
||||||
|
Available-for-sale
|
10
|
|
—
|
|
10
|
|
7
|
|
—
|
|
7
|
|
||||||||||||
|
Derivatives
|
—
|
|
—
|
|
—
|
|
—
|
|
8
|
|
8
|
|
||||||||||||
The notional value of the company’s derivative portfolio at
December 31, 2017
and
2016
was
$89 million
and
$147 million
, respectively. The portion of notional value designated as a cash flow hedge at
December 31, 2017
was
$8 million
. At
December 31, 2016
,
no
portion of the notional value was designated as a cash flow hedge. The derivative fair values and related unrealized gains/losses at
December 31, 2017
and
2016
, were not material.
There were
no
transfers of financial instruments between the three levels of the fair value hierarchy during the years ended
December 31, 2017
and
2016
.
The carrying value of cash and cash equivalents approximates fair value.
10
. LONG-TERM DEBT
Unsecured Senior Notes
In October 2017, the company issued
$8.25 billion
of unsecured senior notes to finance the Orbital ATK Acquisition and to pay related fees and expenses as follows:
|
•
|
$1.0 billion
of
2.08 percent
Senior Notes due 2020 (the “2020 Notes”),
|
|
•
|
$1.5 billion
of
2.55 percent
Senior Notes due 2022 (the “2022 Notes”),
|
|
•
|
$1.5 billion
of
2.93 percent
Senior Notes due 2025 (the “2025 Notes”),
|
|
•
|
$2.0 billion
of
3.25 percent
Senior Notes due 2028 (the “2028 Notes”) and
|
|
•
|
$2.25 billion
of
4.03 percent
Senior Notes due 2047 (the “2047 Notes”).
|
We refer to the 2020 Notes, 2022 Notes, 2025 Notes, 2028 Notes and 2047 Notes, together, as the “notes.” Interest on the notes is payable semi-annually in arrears. The notes are generally subject to an optional redemption, in whole or in part, at the company's discretion at any time, or from time to time, prior to maturity at a redemption price equal to the greater of
100%
of the principal amount of the notes to be redeemed or an applicable “make-whole” amount, plus accrued and unpaid interest.
-
61
-
NORTHROP GRUMMAN CORPORATION
In addition, the 2020 Notes, 2022 Notes, 2025 Notes and 2047 Notes are subject to a mandatory redemption. If the Orbital ATK Acquisition is not consummated on or prior to December 17, 2018, or if the merger agreement relating to the Orbital ATK Acquisition is terminated prior to such date, then, in either case, the company will be required to redeem all of the outstanding 2020 Notes, 2022 Notes, 2025 Notes and 2047 Notes at a redemption price equal to
101%
of the aggregate principal amount of such notes, plus accrued and unpaid interest.
The 2028 Notes are not subject to a special mandatory redemption. If the Orbital ATK Acquisition is not consummated, the company expects to use the net proceeds from the offering of the 2028 Notes for general corporate purposes, which may include debt repayment, share repurchases, pension plan funding, acquisitions and working capital.
In December 2016, the company issued
$750 million
of unsecured senior notes due
February 1, 2027
, with a fixed interest rate of
3.20 percent
. We used the net proceeds from this offering for a debt repayment of
$200 million
in the fourth quarter of 2016 and for general corporate purposes.
Credit Facilities
In December 2016, a subsidiary of the company entered into a two-year credit facility, with two additional one-year option periods, in an aggregate principal amount of
£120 million
(the equivalent of approximately
$161 million
as of
December 31, 2017
) (the “2016 Credit Agreement”). The company exercised the first option to extend the maturity to December 2019. The 2016 Credit Agreement is guaranteed by the company. At
December 31, 2017
, there was
£100 million
(the equivalent of approximately
$134 million
as of
December 31, 2017
) outstanding under this facility, which bears interest at a rate of LIBOR plus
1.10 percent
. All of the borrowings outstanding under this facility mature less than one year from the date of issuance, but may be renewed under the terms of the facility. Based on our intent and ability to refinance the obligations on a long-term basis, substantially all of the borrowings are classified as non-current.
The company also maintains a five-year unsecured credit facility in an aggregate principal amount of
$1.6 billion
that matures in July 2020. At December 31, 2017, there was
no
balance outstanding under this facility.
Our credit agreements contain generally customary terms and conditions, including covenants restricting the company’s ability to sell all or substantially all of its assets, merge or consolidate with another entity or undertake other fundamental changes and incur liens.
The company also cannot permit the ratio of its debt to capitalization (as set forth in the credit agreements) to exceed 65 percent.
At
December 31, 2017
,
the company was in compliance with all covenants under its credit agreements.
-
62
-
NORTHROP GRUMMAN CORPORATION
Long-term debt consists of the following:
|
$ in millions
|
|
December 31
|
||||||||
|
2017
|
2016
|
|||||||||
|
Fixed-rate notes and debentures, maturing in
|
Interest rate
|
|||||||||
|
2018
|
1.75%
|
850
|
|
850
|
|
|||||
|
2019
|
5.05%
|
500
|
|
500
|
|
|||||
|
2020
|
2.08%
|
1,000
|
|
—
|
|
|||||
|
2021
|
3.50%
|
700
|
|
700
|
|
|||||
|
2022
|
2.55%
|
1,500
|
|
—
|
|
|||||
|
2023
|
3.25%
|
1,050
|
|
1,050
|
|
|||||
|
2025
|
2.93%
|
1,500
|
|
—
|
|
|||||
|
2026
|
7.75% - 7.88%
|
527
|
|
527
|
|
|||||
|
2027
|
3.20%
|
750
|
|
750
|
|
|||||
|
2028
|
3.25%
|
2,000
|
|
—
|
|
|||||
|
2031
|
7.75%
|
466
|
|
466
|
|
|||||
|
2040
|
5.05%
|
300
|
|
300
|
|
|||||
|
2043
|
4.75%
|
950
|
|
950
|
|
|||||
|
2045
|
3.85%
|
600
|
|
600
|
|
|||||
|
2047
|
4.03%
|
2,250
|
|
—
|
|
|||||
|
Credit facilities
|
1.62%
|
134
|
|
135
|
|
|||||
|
Other
|
Various
|
271
|
|
273
|
|
|||||
|
Debt issuance costs
|
|
(82
|
)
|
(31
|
)
|
|||||
|
Total long-term debt
|
15,266
|
|
7,070
|
|
||||||
|
Less: current portion
(1)
|
|
867
|
|
12
|
|
|||||
|
Long-term debt, net of current portion
|
|
$
|
14,399
|
|
$
|
7,058
|
|
|||
(1)
The current portion of long-term debt is recorded in Other current liabilities in the consolidated statements of financial position.
The estimated fair value of long-term debt was
$16.0 billion
and
$7.6 billion
as of
December 31, 2017
and
2016
, respectively. We calculated the fair value of long-term debt using Level 2 inputs, based on interest rates available for debt with terms and maturities similar to the company’s existing debt arrangements.
Indentures underlying long-term debt issued by the company or its subsidiaries contain various restrictions with respect to the issuer, including one or more restrictions relating to limitations on liens, sale-leaseback arrangements and funded debt of subsidiaries. The majority of these fixed rate notes and debentures are subject to redemption at the company’s discretion at any time prior to maturity in whole or in part at the principal amount plus any make-whole premium and accrued and unpaid interest. Interest on these fixed rate notes and debentures are payable semi-annually in arrears.
Total interest payments, net of interest received, were
$273 million
,
$299 million
, and
$291 million
for the years ended
December 31, 2017
,
2016
and
2015
, respectively.
-
63
-
NORTHROP GRUMMAN CORPORATION
Maturities of long-term debt as of
December 31, 2017
, are as follows:
|
$ in millions
|
|
|
|
|
Year Ending December 31
|
|||
|
2018
|
$
|
867
|
|
|
2019
|
518
|
|
|
|
2020
|
1,045
|
|
|
|
2021
|
834
|
|
|
|
2022
|
1,505
|
|
|
|
Thereafter
|
10,581
|
|
|
|
Total principal payments
|
15,350
|
|
|
|
Unamortized premium on long-term debt, net of discount
|
(2
|
)
|
|
|
Debt issuance costs
|
(82
|
)
|
|
|
Total long-term debt
|
$
|
15,266
|
|
11
. INVESTIGATIONS, CLAIMS AND LITIGATION
Litigation
On May 4, 2012, the company commenced an action,
Northrop Grumman Systems Corp. v. United States
, in the U.S. Court of Federal Claims. This lawsuit relates to an approximately
$875 million
firm fixed-price contract awarded to the company in 2007 by the U.S. Postal Service (USPS) for the construction and delivery of flats sequencing systems (FSS) as part of the postal automation program. The FSS have been delivered. The company’s lawsuit is based on various theories of liability. The complaint seeks approximately
$63 million
for unpaid portions of the contract price, and approximately
$115 million
based on the company’s assertions that, through various acts and omissions over the life of the contract, the USPS adversely affected the cost and schedule of performance and materially altered the company’s obligations under the contract. The United States responded to the company’s complaint with an answer, denying most of the company’s claims, and counterclaims seeking approximately
$410 million
, less certain amounts outstanding under the contract. The principal counterclaim alleges that the company delayed its performance and caused damages to the USPS because USPS did not realize certain costs savings as early as it had expected. On April 2, 2013, the U.S. Department of Justice informed the company of a False Claims Act complaint relating to the FSS contract that was filed under seal by a relator in June 2011 in the U.S. District Court for the Eastern District of Virginia. On June 3, 2013, the United States filed a Notice informing the Court that the United States had decided not to intervene in this case. The relator alleged that the company violated the False Claims Act in a number of ways with respect to the FSS contract, alleged damage to the USPS in an amount of at least approximately
$179 million
annually, alleged that he was improperly discharged in retaliation, and sought an unspecified partial refund of the contract purchase price, penalties, attorney’s fees and other costs of suit. The relator later voluntarily dismissed his retaliation claim and reasserted it in a separate arbitration, which he also ultimately voluntarily dismissed. On September 5, 2014, the court granted the company’s motion for summary judgment and ordered the relator’s False Claims Act case be dismissed with prejudice. On December 19, 2014, the company filed a motion for partial summary judgment asking the court to dismiss the principal counterclaim referenced above. On June 29, 2015, the Court heard argument and denied that motion without prejudice to filing a later motion to dismiss. Although the ultimate outcome of these matters (“the FSS matters,” collectively), including any possible loss, cannot be predicted or reasonably estimated at this time, the company intends vigorously to pursue and defend the FSS matters.
On August 8, 2013, the company received a court-appointed expert’s report in litigation pending in the Second Federal Court of the Federal District in Brazil brought by the Brazilian Post and Telegraph Corporation (ECT), a Brazilian state-owned entity, against Solystic SAS (Solystic), a French subsidiary of the company, and
two
of its consortium partners. In this suit, commenced on December 17, 2004, and relatively inactive for some period of time, ECT alleges the consortium breached its contract with ECT and seeks damages of approximately
R$111 million
(the equivalent of approximately
$33 million
as of
December 31, 2017
), plus interest, inflation adjustments and attorneys’ fees, as authorized by Brazilian law, which amounts could be significant over time. The original suit sought
R$89 million
(the equivalent of approximately
$27 million
as of
December 31, 2017
) in damages. In October 2013, ECT asserted an additional damage claim of
R$22 million
(the equivalent of approximately
$7 million
as of
December 31, 2017
). In its counterclaim, Solystic alleges ECT breached the contract by wrongfully refusing to accept the equipment Solystic had designed and built and seeks damages of approximately
€31 million
(the equivalent of approximately
$37 million
as of
December 31, 2017
), plus interest, inflation adjustments and attorneys’ fees, as authorized by Brazilian law. The Brazilian court retained an expert to consider certain issues
-
64
-
NORTHROP GRUMMAN CORPORATION
pending before it. On August 8, 2013 and September 10, 2014, the company received reports from the expert, which contain some recommended findings relating to liability and the damages calculations put forth by ECT. Some of the expert’s recommended findings were favorable to the company and others were favorable to ECT. In November 2014, the parties submitted comments on the expert’s most recent report. On June 16, 2015, the court published a decision denying the parties’ request to present oral testimony. At some future point, the court is expected to issue a decision on the parties’ claims and counterclaims that could accept or reject, in whole or in part, the expert’s recommended findings.
The company previously identified and disclosed to the U.S. Government various issues relating primarily to time-charging practices of some employees working on a particular program with remote deployments. The Department of Justice is continuing to investigate this matter, and the company is cooperating in that investigation. Depending upon the ultimate outcome of this matter, the company could be subject to damages, civil or criminal fines, penalties or other sanctions, and suspension or debarment actions; however, we cannot at this point predict the outcome.
We are engaged in remediation activities relating to environmental conditions allegedly resulting from historic operations at the former United States Navy and Grumman facilities in Bethpage, New York. For over 20 years, we have worked closely with the United States Navy, the United States Environmental Protection Agency, the New York State Department of Environmental Conservation, the New York State Department of Health and other federal, state and local governmental authorities, to address legacy environmental conditions in Bethpage. We have incurred, and expect to continue to incur, as included in Note 12
, substantial remediation costs related to these environmental conditions. The remediation standards or requirements to which we are subject may change and costs may increase materially. The State of New York has notified us that it intends to seek to impose additional remedial requirements and, among other things, is evaluating natural resource damages. In addition, we are and may become a party to various legal proceedings and disputes related to remediation and/or alleged environmental impacts in Bethpage, including with federal and state entities, local municipalities and water districts, insurance carriers and class action plaintiffs. These Bethpage matters could result in additional costs, fines, penalties, sanctions, compensatory or other damages (including natural resource damages), determinations on allocation, allowability and coverage, and non-monetary relief. We cannot at this time predict or reasonably estimate the potential cumulative outcomes or ranges of possible liability of these aggregate Bethpage matters.
The company is a party to various other investigations, lawsuits, claims, enforcement actions and other legal proceedings, including government investigations and claims, that arise in the ordinary course of our business. The nature of legal proceedings is such that we cannot assure the outcome of any particular matter. However, based on information available to the company to date, the company does not believe that the outcome of any of these other matters pending against the company is likely to have a material adverse effect on the company’s consolidated financial position as of
December 31, 2017
, or its annual results of operations and/or cash flows.
12
. COMMITMENTS AND CONTINGENCIES
U.S. Government Cost Claims
From time to time, the company is advised of claims by the U.S. Government concerning certain potential disallowed costs, plus, at times, penalties and interest. When such findings are presented, the company and the U.S. Government representatives engage in discussions to enable the company to evaluate the merits of these claims, as well as to assess the amounts being claimed. Where appropriate, provisions are made to reflect the company’s estimated exposure for such potential disallowed costs. Such provisions are reviewed periodically using the most recent information available.
The company believes it has adequately reserved for disputed amounts that are probable and reasonably estimable, and the outcome of any such matters would not have a material adverse effect on its consolidated financial position as of
December 31, 2017
, or its annual results of operations and/or cash flows.
-
65
-
NORTHROP GRUMMAN CORPORATION
Environmental Matters
The table below summarizes management’s estimate of the range of reasonably possible future costs for environmental remediation, the amount accrued within that range, and the deferred costs expected to be recoverable through overhead charges on U.S. Government contracts as of
December 31, 2017
and
2016
:
|
$ in millions
|
Range of Reasonably Possible Future Costs
(1)
|
Accrued Costs
(2)
|
Deferred Costs
(3)
|
|||||||
|
December 31, 2017
|
$405 - $792
|
$
|
410
|
|
$
|
207
|
|
|||
|
December 31, 2016
|
379- 774
|
385
|
|
195
|
|
|||||
|
(1)
|
Estimated remediation costs are not discounted to present value. The range of reasonably possible future costs does not take into consideration amounts expected to be recoverable through overhead charges on U.S. Government contracts.
|
|
(2)
|
As of
December 31, 2017
,
$148 million
is recorded in other current liabilities and
$262 million
is recorded in other non-current liabilities.
|
|
(3)
|
As of
December 31, 2017
,
$76 million
is deferred in inventoried costs and
$131 million
is deferred in other non-current assets. These amounts are evaluated for recoverability on a routine basis.
|
Although management cannot predict whether new information gained as our environmental remediation projects progress, or as changes in facts and circumstances occur, will materially affect the estimated liability accrued, except as we note below with respect to Bethpage, we
do not anticipate that future remediation expenditures associated with our currently identified projects will have a material adverse effect on the
company’s consolidated financial position as of
December 31, 2017
, or its annual results of operations and/or cash flows. With respect to Bethpage, as described in Note 11, we cannot at this time estimate the range of reasonably possible additional future costs that could result from potential changes to remediation standards or requirements to which we are subject.
Financial Arrangements
In the ordinary course of business, the company uses standby letters of credit and guarantees issued by commercial banks and surety bonds issued principally by insurance companies to guarantee the performance on certain obligations. At
December 31, 2017
, there were
$186 million
of stand-by letters of credit and guarantees and
$197 million
of surety bonds outstanding.
Indemnifications
The company has provided indemnification for certain environmental, income tax and other potential liabilities in connection with certain of its divestitures. The settlement of these liabilities is not expected to have a material adverse effect on the company’s consolidated financial position as of
December 31, 2017
, or its annual results of operations and/or cash flows.
Operating Leases
Rental expense for operating leases was
$300 million
in
2017
,
$298 million
in
2016
, and
$302 million
in
2015
. These amounts are net of immaterial amounts of sublease rental income. Minimum rental commitments under long-term non-cancelable operating leases as of
December 31, 2017
are payable as follows:
|
$ in millions
|
|
||
|
Year Ending December 31
|
|||
|
2018
|
$
|
232
|
|
|
2019
|
195
|
|
|
|
2020
|
145
|
|
|
|
2021
|
120
|
|
|
|
2022
|
87
|
|
|
|
Thereafter
|
559
|
|
|
|
Total minimum lease payments
|
$
|
1,338
|
|
13
. RETIREMENT BENEFITS
Plan Descriptions
U.S. Defined Benefit Pension Plans
– The company sponsors several defined benefit pension plans in the U.S. covering the majority of its employees. Pension benefits for most employees are based on the employee’s years of
-
66
-
NORTHROP GRUMMAN CORPORATION
service, age and compensation. It is our policy to fund at least the minimum amount required for all qualified plans, using actuarial cost methods and assumptions acceptable under U.S. Government regulations, by making payments into benefit trusts separate from the company.
Defined Contribution Plans
– The company also sponsors 401(k) defined contribution plans in which most employees are eligible to participate, including certain employees covered under collective agreements. Company contributions for most plans are based on employer matching of employee contributions up to
four percent
of compensation for employees hired on or before April 1, 2016. In addition to the 401(k) defined contribution benefit, certain employees hired from July 1, 2008 through April 1, 2016, are eligible to participate in Retirement Account Contributions (RAC) in lieu of a defined benefit pension plan. Most employees hired after April 1, 2016 and certain employees that did not previously participate in the pension plan or receive RAC are eligible for an increased company match of up to
seven percent
of compensation. The company’s contributions to these defined contribution plans for the years ended
December 31, 2017
,
2016
and
2015
, were
$344 million
,
$311 million
and
$291 million
, respectively.
Non-U.S. Benefit Plans –
The company sponsors several benefit plans for non-U.S. employees. These plans are designed to provide benefits appropriate to local practice and in accordance with local regulations. Some of these plans are funded using benefit trusts separate from the company.
Medical and Life Benefits
– The company provides a portion of the costs for certain health care and life insurance benefits for a substantial number of its active and retired employees. Certain covered employees achieve eligibility to participate in these plans upon retirement from active service if they meet specified age and years of service requirements. Qualifying dependents are also eligible for plan benefits in certain circumstances. The company reserves the right to amend or terminate the plans at any time. The company has capped the amount of its contributions to substantially all of its remaining post-retirement medical and life benefit plans.
In addition to a company and employee cost-sharing feature, the health plans also have provisions for deductibles, co-payments, coinsurance percentages, out-of-pocket limits, conformance to a schedule of reasonable fees, the use of managed care providers and coordination of benefits with other plans. The plans also provide for a Medicare carve-out. Subsequent to January 1, 2005 (or earlier at some segments), newly hired employees are not eligible for subsidized post-retirement medical and life benefits.
The company provides subsidies to reimburse certain retirees for a portion of the cost of individual Medicare-supplemental coverage purchased directly by the retiree through a private insurance exchange.
Summary Plan Results
The cost to the company of its retirement benefit plans is shown in the following table:
|
|
Year Ended December 31
|
|||||||||||||||||||||||
|
|
Pension Benefits
|
Medical and Life Benefits
|
||||||||||||||||||||||
|
$ in millions
|
2017
|
2016
|
2015
|
2017
|
2016
|
2015
|
||||||||||||||||||
|
Components of net periodic benefit cost
|
||||||||||||||||||||||||
|
Service cost
|
$
|
424
|
|
$
|
446
|
|
$
|
484
|
|
$
|
23
|
|
$
|
30
|
|
$
|
35
|
|
||||||
|
Interest cost
|
1,234
|
|
1,284
|
|
1,224
|
|
84
|
|
94
|
|
94
|
|
||||||||||||
|
Expected return on plan assets
|
(1,885
|
)
|
(1,853
|
)
|
(1,975
|
)
|
(89
|
)
|
(86
|
)
|
(89
|
)
|
||||||||||||
|
Amortization of:
|
||||||||||||||||||||||||
|
Prior service credit
|
(57
|
)
|
(60
|
)
|
(60
|
)
|
(22
|
)
|
(22
|
)
|
(28
|
)
|
||||||||||||
|
Net loss from previous years
|
712
|
|
714
|
|
682
|
|
9
|
|
16
|
|
27
|
|
||||||||||||
|
Other
|
4
|
|
—
|
|
—
|
|
1
|
|
—
|
|
—
|
|
||||||||||||
|
Net periodic benefit cost
|
$
|
432
|
|
$
|
531
|
|
$
|
355
|
|
$
|
6
|
|
$
|
32
|
|
$
|
39
|
|
||||||
-
67
-
NORTHROP GRUMMAN CORPORATION
The table below summarizes the components of changes in unamortized benefit plan costs for the years ended
December 31, 2015
,
2016
and
2017
:
|
$ in millions
|
Pension Benefits
|
Medical and Life Benefits
|
Total
|
|||||||||
|
Changes in unamortized benefit plan costs
|
||||||||||||
|
Change in net actuarial loss
|
$
|
626
|
|
$
|
(125
|
)
|
$
|
501
|
|
|||
|
Amortization of:
|
||||||||||||
|
Prior service credit
|
60
|
|
28
|
|
88
|
|
||||||
|
Net loss from previous years
|
(682
|
)
|
(27
|
)
|
(709
|
)
|
||||||
|
Tax (benefit) expense related to above items
|
(1
|
)
|
46
|
|
45
|
|
||||||
|
Change in unamortized benefit plan costs – 2015
|
3
|
|
(78
|
)
|
(75
|
)
|
||||||
|
Change in net actuarial loss
|
1,003
|
|
(91
|
)
|
912
|
|
||||||
|
Amortization of:
|
||||||||||||
|
Prior service credit
|
60
|
|
22
|
|
82
|
|
||||||
|
Net loss from previous years
|
(714
|
)
|
(16
|
)
|
(730
|
)
|
||||||
|
Tax (benefit) expense related to above items
|
(121
|
)
|
32
|
|
(89
|
)
|
||||||
|
Change in unamortized benefit plan costs – 2016
|
228
|
|
(53
|
)
|
175
|
|
||||||
|
Change in net actuarial loss
|
(476
|
)
|
(95
|
)
|
(571
|
)
|
||||||
|
Amortization of:
|
||||||||||||
|
Prior service credit
|
57
|
|
22
|
|
79
|
|
||||||
|
Net loss from previous years
|
(712
|
)
|
(9
|
)
|
(721
|
)
|
||||||
|
Tax (benefit) expense related to above items
|
365
|
|
18
|
|
383
|
|
||||||
|
Change in unamortized benefit plan costs – 2017
|
$
|
(766
|
)
|
$
|
(64
|
)
|
$
|
(830
|
)
|
|||
The table below presents the components of accumulated other comprehensive loss related to the company’s retirement benefit plans:
|
Pension Benefits
|
Medical and Life Benefits
|
|||||||||||||||
|
$ in millions
|
2017
|
2016
|
2017
|
2016
|
||||||||||||
|
Amounts recorded in accumulated other comprehensive loss
|
||||||||||||||||
|
Net actuarial loss
|
$
|
(7,842
|
)
|
$
|
(9,030
|
)
|
$
|
(9
|
)
|
$
|
(113
|
)
|
||||
|
Prior service credit
|
187
|
|
244
|
|
22
|
|
44
|
|
||||||||
|
Income tax benefits related to above items
|
3,042
|
|
3,407
|
|
14
|
|
32
|
|
||||||||
|
Unamortized benefit plan costs
|
$
|
(4,613
|
)
|
$
|
(5,379
|
)
|
$
|
27
|
|
$
|
(37
|
)
|
||||
-
68
-
NORTHROP GRUMMAN CORPORATION
The following table sets forth the funded status and amounts recognized in the consolidated statements of financial position for the company’s retirement benefit plans. Pension benefits data includes the qualified plans, foreign plans and U.S. unfunded non-qualified plans for benefits provided to directors, officers and certain employees. The company uses a December 31 measurement date for its plans.
|
|
Pension Benefits
|
Medical and Life Benefits
|
||||||||||||||
|
$ in millions
|
2017
|
2016
|
2017
|
2016
|
||||||||||||
|
Plan Assets
|
||||||||||||||||
|
Fair value of plan assets at beginning of year
|
$
|
24,384
|
|
$
|
23,950
|
|
$
|
1,208
|
|
$
|
1,153
|
|
||||
|
Net gain on plan assets
|
3,885
|
|
1,867
|
|
208
|
|
97
|
|
||||||||
|
Employer contributions
|
596
|
|
81
|
|
45
|
|
83
|
|
||||||||
|
Participant contributions
|
11
|
|
11
|
|
24
|
|
20
|
|
||||||||
|
Benefits paid
|
(1,617
|
)
|
(1,480
|
)
|
(144
|
)
|
(146
|
)
|
||||||||
|
Other
|
(33
|
)
|
(45
|
)
|
(3
|
)
|
1
|
|
||||||||
|
Fair value of plan assets at end of year
|
27,226
|
|
24,384
|
|
1,338
|
|
1,208
|
|
||||||||
|
Projected Benefit Obligation
|
||||||||||||||||
|
Projected benefit obligation at beginning of year
|
30,409
|
|
29,182
|
|
2,100
|
|
2,181
|
|
||||||||
|
Service cost
|
424
|
|
446
|
|
23
|
|
30
|
|
||||||||
|
Interest cost
|
1,234
|
|
1,284
|
|
84
|
|
94
|
|
||||||||
|
Participant contributions
|
11
|
|
11
|
|
24
|
|
20
|
|
||||||||
|
Actuarial loss (gain)
|
1,526
|
|
1,026
|
|
26
|
|
(80
|
)
|
||||||||
|
Benefits paid
|
(1,617
|
)
|
(1,480
|
)
|
(144
|
)
|
(146
|
)
|
||||||||
|
Other
|
(20
|
)
|
(60
|
)
|
(3
|
)
|
1
|
|
||||||||
|
Projected benefit obligation at end of year
|
31,967
|
|
30,409
|
|
2,110
|
|
2,100
|
|
||||||||
|
Funded status
|
$
|
(4,741
|
)
|
$
|
(6,025
|
)
|
$
|
(772
|
)
|
$
|
(892
|
)
|
||||
|
Classification of amounts recognized in the consolidated statements of financial position
|
||||||||||||||||
|
Non-current assets
|
$
|
82
|
|
$
|
2
|
|
$
|
112
|
|
$
|
87
|
|
||||
|
Current liability
|
(154
|
)
|
(146
|
)
|
(42
|
)
|
(42
|
)
|
||||||||
|
Non-current liability
|
(4,669
|
)
|
(5,881
|
)
|
(842
|
)
|
(937
|
)
|
||||||||
The following table shows those amounts expected to be recognized in net periodic benefit cost in
2018
:
|
$ in millions
|
Pension Benefits
|
Medical and Life Benefits
|
Total
|
||||||||
|
Amounts expected to be recognized in 2018 net periodic benefit cost
|
|||||||||||
|
Net actuarial loss
|
$
|
535
|
|
$
|
—
|
|
$
|
535
|
|
||
|
Prior service credit
|
(58
|
)
|
(21
|
)
|
(79
|
)
|
|||||
The accumulated benefit obligation for all defined benefit pension plans was
$31.6 billion
and
$30.1 billion
at
December 31, 2017
and
2016
, respectively.
Amounts for pension plans with accumulated benefit obligations in excess of fair value of plan assets are as follows:
|
|
December 31
|
|||||||
|
$ in millions
|
2017
|
2016
|
||||||
|
Projected benefit obligation
|
$
|
29,804
|
|
$
|
30,350
|
|
||
|
Accumulated benefit obligation
|
29,454
|
|
30,065
|
|
||||
|
Fair value of plan assets
|
24,981
|
|
24,322
|
|
||||
-
69
-
NORTHROP GRUMMAN CORPORATION
Plan Assumptions
On a weighted-average basis, the following assumptions were used to determine benefit obligations and net periodic benefit cost:
|
|
Pension Benefits
|
Medical and Life Benefits
|
||||||||||
|
|
2017
|
2016
|
2017
|
2016
|
||||||||
|
Assumptions used to determine benefit obligation at December 31
|
||||||||||||
|
Discount rate
|
3.68
|
%
|
4.19
|
%
|
3.66
|
%
|
4.13
|
%
|
||||
|
Initial cash balance crediting rate assumed for the next year
|
2.75
|
%
|
3.10
|
%
|
||||||||
|
Rate to which the cash balance crediting rate is assumed to increase (the ultimate rate)
|
3.00
|
%
|
3.60
|
%
|
||||||||
|
Year that the cash balance crediting rate reaches the ultimate rate
|
2023
|
|
2022
|
|
||||||||
|
Rate of compensation increase
|
3.00
|
%
|
3.00
|
%
|
||||||||
|
Initial health care cost trend rate assumed for the next year
|
6.50
|
%
|
6.50
|
%
|
||||||||
|
Rate to which the health care cost trend rate is assumed to decline (the ultimate trend rate)
|
5.00
|
%
|
5.00
|
%
|
||||||||
|
Year that the health care cost trend rate reaches the ultimate trend rate
|
2023
|
|
2020
|
|
||||||||
|
Assumptions used to determine benefit cost for the year ended December 31
|
||||||||||||
|
Discount rate
|
4.19
|
%
|
4.53
|
%
|
4.13
|
%
|
4.47
|
%
|
||||
|
Initial cash balance crediting rate assumed for the next year
|
3.10
|
%
|
3.00
|
%
|
||||||||
|
Rate to which the cash balance crediting rate is assumed to increase (the ultimate rate)
|
3.60
|
%
|
3.75
|
%
|
||||||||
|
Year that the cash balance crediting rate reaches the ultimate rate
|
2022
|
|
2021
|
|
||||||||
|
Expected long-term return on plan assets
|
8.00
|
%
|
8.00
|
%
|
7.70
|
%
|
7.70
|
%
|
||||
|
Rate of compensation increase
|
3.00
|
%
|
3.00
|
%
|
||||||||
|
Initial health care cost trend rate assumed for the next year
|
6.50
|
%
|
7.00
|
%
|
||||||||
|
Rate to which the health care cost trend rate is assumed to decline (the ultimate trend rate)
|
5.00
|
%
|
5.00
|
%
|
||||||||
|
Year that the health care cost trend rate reaches the ultimate trend rate
|
2020
|
|
2020
|
|
||||||||
Plan Assets and Investment Policy
Plan assets are invested in various asset classes that are expected to produce a sufficient level of diversification and investment return over the long term. The investment goal is to exceed the assumed rate of return over the long term within reasonable and prudent levels of risk.
Through consultation with our investment management team and outside investment advisers, management develops expected long-term returns for each of the plans’ strategic asset classes. In addition to our historical investment performance, we consider several factors, including current market data such as yields/price-earnings ratios, historical market returns over long periods and periodic surveys of investment managers’ expectations. Using policy target allocation percentages and the asset class expected returns, we calculate a weighted-average expected long-term rate of return.
Liability studies are conducted on a regular basis to provide guidance in setting investment goals with an objective to balance risk. Risk targets are established and monitored against acceptable ranges.
Our investment policies and procedures are designed to ensure the plans’ investments are in compliance with the Employee Retirement Income Security Act (ERISA). Guidelines are established defining permitted investments within each asset class. Derivatives are used for transitioning assets, asset class rebalancing, managing currency risk and for management of fixed-income and alternative investments.
-
70
-
NORTHROP GRUMMAN CORPORATION
For the majority of the plans’ assets, the investment policies require that the asset allocation be maintained within the following ranges as of
December 31, 2017
:
|
|
Asset Allocation Ranges
|
||||
|
Cash and cash equivalents
|
0% - 12%
|
||||
|
U.S. equities
|
15% - 35%
|
||||
|
International equities
|
10% - 30%
|
||||
|
Fixed-income securities
|
20% - 55%
|
||||
|
Alternative investments
|
8% - 28%
|
||||
The table below provides the fair values of the company’s pension and Voluntary Employee Beneficiary Association (VEBA) trust plan assets at
December 31, 2017
and
2016
, by asset category. The table also identifies the level of inputs used to determine the fair value of assets in each category. See Note
1
for the definitions of these levels. Certain investments that are measured at fair value using net asset value (NAV) per share (or its equivalent) as a practical expedient are not required to be categorized in the fair value hierarchy table. The total fair value of these investments is included in the table below to permit reconciliation of the fair value hierarchy to amounts presented in the funded status table above. As of
December 31, 2017
and
2016
, there were no investments expected to be sold at a value materially different than NAV.
|
|
Level 1
|
Level 2
|
Level 3
|
Total
|
||||||||||||||||||||||||||||
|
$ in millions
|
2017
|
2016
|
2017
|
2016
|
2017
|
2016
|
2017
|
2016
|
||||||||||||||||||||||||
|
Asset category
|
||||||||||||||||||||||||||||||||
|
Cash and cash equivalents
|
$
|
55
|
|
$
|
72
|
|
$
|
4,086
|
|
$
|
2,477
|
|
$
|
4,141
|
|
$
|
2,549
|
|
||||||||||||||
|
U.S. equities
|
3,365
|
|
3,686
|
|
$
|
1
|
|
$
|
3
|
|
3,366
|
|
3,689
|
|
||||||||||||||||||
|
International equities
|
2,453
|
|
2,392
|
|
—
|
|
48
|
|
1
|
|
1
|
|
2,454
|
|
2,441
|
|
||||||||||||||||
|
Fixed-income securities
|
||||||||||||||||||||||||||||||||
|
U.S. Treasuries
|
1,282
|
|
1,109
|
|
1,282
|
|
1,109
|
|
||||||||||||||||||||||||
|
U.S. Government Agency
|
345
|
|
424
|
|
345
|
|
424
|
|
||||||||||||||||||||||||
|
Corporate bond
|
|
|
|
|
2
|
|
—
|
|
2
|
|
—
|
|
||||||||||||||||||||
|
Non-U.S. Government
|
135
|
|
108
|
|
135
|
|
108
|
|
||||||||||||||||||||||||
|
Corporate debt
|
4,404
|
|
3,723
|
|
4,404
|
|
3,723
|
|
||||||||||||||||||||||||
|
Asset backed
|
255
|
|
296
|
|
—
|
|
1
|
|
255
|
|
297
|
|
||||||||||||||||||||
|
High yield debt
|
866
|
|
1,844
|
|
866
|
|
1,844
|
|
||||||||||||||||||||||||
|
Bank loans
|
248
|
|
297
|
|
248
|
|
297
|
|
||||||||||||||||||||||||
|
Other Assets
|
15
|
|
(10
|
)
|
3
|
|
12
|
|
2
|
|
—
|
|
20
|
|
2
|
|
||||||||||||||||
|
Investments valued using NAV as a practical expedient
|
||||||||||||||||||||||||||||||||
|
U.S. equities
|
1,053
|
|
700
|
|
||||||||||||||||||||||||||||
|
International equities
|
4,315
|
|
3,329
|
|
||||||||||||||||||||||||||||
|
Fixed-income funds
|
129
|
|
99
|
|
||||||||||||||||||||||||||||
|
Hedge funds
|
166
|
|
220
|
|
||||||||||||||||||||||||||||
|
Opportunistic investments
|
873
|
|
581
|
|
||||||||||||||||||||||||||||
|
Private equities
|
2,091
|
|
1,801
|
|
||||||||||||||||||||||||||||
|
Real estate funds
|
2,419
|
|
2,379
|
|
||||||||||||||||||||||||||||
|
Fair value of plan assets at the end of the year
|
$
|
5,888
|
|
$
|
6,140
|
|
$
|
11,626
|
|
$
|
10,338
|
|
$
|
4
|
|
$
|
5
|
|
$
|
28,564
|
|
$
|
25,592
|
|
||||||||
There were no transfers of plan assets between the three levels of the fair value hierarchy during the years ended
December 31, 2017
and
2016
.
Generally, investments are valued based on information in financial publications of general circulation, statistical and valuation services, records of security exchanges, appraisal by qualified persons, transactions and bona fide offers. Cash and cash equivalents are predominantly held in money market or short-term investment funds. U.S. and international equities consist primarily of common stocks and institutional common trust funds. Investments in
-
71
-
NORTHROP GRUMMAN CORPORATION
certain equity securities, which include domestic and international securities and registered investment companies, are valued at the last reported sales or quoted price on the last business day of the reporting period. Fair values for certain fixed-income securities, which are not exchange-traded, are valued using third-party pricing services.
Other assets include derivative assets with a fair value of
$34 million
and
$19 million
, derivative liabilities with a fair value of
$19 million
and
$28 million
, and net notional amounts of
$3.3 billion
and
$2.0 billion
, as of
December 31, 2017
and
2016
, respectively. Derivative instruments may include exchange traded futures contracts, interest rate swaps, options on futures and swaps, currency contracts, total return swaps and credit default swaps. Notional amounts do not quantify risk or represent assets or liabilities of the pension and VEBA trusts, but are used in the calculation of cash settlement under the contracts. The volume of derivative activity is commensurate with the amounts disclosed at year-end. Certain derivative financial instruments within the pension trust are subject to master netting agreements with certain counterparties.
Investments in certain equity and fixed-income funds, which include common/collective trust funds, and alternative investments, including hedge funds, opportunistic investments, private equity funds and real estate funds, are valued based on the NAV derived by the investment managers, as a practical expedient, and are described further below.
U.S. and International equities: Generally, redemption periods are monthly with a notice requirement less than 30 days. As of
December 31, 2017
and
2016
, unfunded commitments were not material.
Fixed-income funds: Redemption periods are
daily, monthly or quarterly
with various notice requirements but generally are less than
30
days. As of
December 31, 2017
and
2016
, there were no unfunded commitments.
Hedge funds: The redemption period of hedge funds is generally
quarterly
and requires a
90
-day notice. As of
December 31, 2017
and
2016
, there were no unfunded commitments.
Opportunistic investments: Opportunistic investments are primarily held in partnerships with a 5-10 year life. As of
December 31, 2017
and
2016
, unfunded commitments were
$768 million
and
$638 million
, respectively.
Private equities: The term of each fund is typically
10
or more years and the fund’s investors do not have an option to redeem their interest in the fund. As of
December 31, 2017
and
2016
, unfunded commitments were
$1.4 billion
and
$1.3 billion
, respectively.
Real estate funds: Consists of closed-end real estate funds and infrastructure funds with terms that are typically
10
or more years. This class also contains open-end funds that generally allow investors to redeem their interests in the fund. As of
December 31, 2017
and
2016
, unfunded commitments were
$71 million
and
$72 million
, respectively.
For the years ended
December 31, 2017
and
2016
, the defined benefit pension and VEBA trusts did not hold any Northrop Grumman common stock.
Benefit Payments
The following table reflects estimated future benefit payments for the next ten years, based upon the same assumptions used to measure the benefit obligation, and includes expected future employee service, as of
December 31, 2017
:
|
$ in millions
|
Pension Plans
|
Medical and Life Plans
|
Total
|
|||||||||
|
Year Ending December 31
|
||||||||||||
|
2018
|
$
|
1,573
|
|
$
|
149
|
|
$
|
1,722
|
|
|||
|
2019
|
1,618
|
|
153
|
|
1,771
|
|
||||||
|
2020
|
1,665
|
|
144
|
|
1,809
|
|
||||||
|
2021
|
1,713
|
|
144
|
|
1,857
|
|
||||||
|
2022
|
1,757
|
|
143
|
|
1,900
|
|
||||||
|
2023 through 2027
|
9,410
|
|
676
|
|
10,086
|
|
||||||
In
2018
, the company expects to contribute the required minimum funding of approximately
$87 million
to its pension plans and approximately
$43 million
to its medical and life benefit plans.
During the year ended
December 31, 2017
, the company made a voluntary pension contribution of
$500 million
.
14
. STOCK COMPENSATION PLANS AND OTHER COMPENSATION ARRANGEMENTS
Stock Compensation Plans
At
December 31, 2017
, the company had stock-based compensation awards outstanding under the following shareholder-approved plans: the 2011 Long-Term Incentive Stock Plan (2011 Plan), applicable to employees, and the 1993 Stock Plan for Non-Employee Directors (1993 SPND).
-
72
-
NORTHROP GRUMMAN CORPORATION
Employee Plans
– In May 2015, the company’s shareholders approved amendments to the 2011 Plan. These amendments provided that shares issued under the plan would be counted against the aggregate share limit on a one-for-one basis. As amended,
5.1 million
shares plus
2.4 million
of newly authorized shares were available for issuance under the 2011 Plan; as of
December 31, 2017
,
6.3 million
shares remain available for issuance.
The 2011 Plan provides for the following equity awards: stock options, stock appreciation rights (SARs) and stock awards. Under the 2011 Plan, no SARs have been granted and there are no outstanding stock options. Stock awards include restricted performance stock rights (RPSR) and restricted stock rights (RSR). RPSRs generally vest and are paid following the completion of a three-year performance period, based on achievement of financial objectives determined by the Board. RSRs generally vest 100% after three years. Each includes dividend equivalents, which are paid upon payment of the RPSR or RSR. The terms of equity awards granted under the 2011 Plan provide for accelerated vesting, and in some instances forfeiture, of all or a portion of an award upon termination of employment.
Non-Employee Director Plans
– Awards to non-employee directors are made pursuant to the Northrop Grumman Corporation Equity Grant Program for Non-Employee Directors under the 2011 Plan (the Director Program), which was amended and restated effective January 1, 2016. Prior to January 1, 2016, the Director Program and the 1993 SPND provided for quarterly award and vesting of an annual equity retainer in the form of deferred stock units (Automatic Stock Units) to be paid upon the conclusion of a director’s board service, or earlier, as specified by the director, if the director had
five
or more years of service.
Under the amended Director Program, each non-employee director is awarded an annual equity grant in the form of Automatic Stock Units, which vest on the one-year anniversary of the grant date. Directors may elect to have all or any portion of their Automatic Stock Units paid on (A) the earlier of (i) the beginning of a specified calendar year after the vesting date or (ii) their separation from service as a member of the Board, or (B) on the vesting date.
Directors also may elect to defer to a later year all or a portion of their remaining cash retainer or committee retainer fees into a stock unit account as Elective Stock Units or in alternative investment options. Elective Stock Units are awarded on a quarterly basis. Directors may elect to have all or a portion of their Elective Stock Units paid on the earlier of (i) the beginning of a specified calendar year or (ii) their separation from service as a member of the Board. Stock units awarded under the Director Program are paid out in an equivalent number of shares of Northrop Grumman common stock. Directors are credited with dividend equivalents in connection with the accumulated stock units until the shares of common stock relating to such stock units are issued.
Compensation Expense
Stock-based compensation expense for the years ended
December 31, 2017
,
2016
and
2015
was
$94 million
,
$93 million
and
$99 million
, respectively. The related tax benefits for stock-based compensation for the years ended
December 31, 2017
,
2016
and
2015
were
$48 million
,
$85 million
and
$103 million
, respectively.
At
December 31, 2017
, there was
$91 million
of unrecognized compensation expense related to unvested stock awards granted under the company’s stock-based compensation plans. These amounts are expected to be charged to expense over a weighted-average period of
1.3
years.
Stock Awards
Compensation expense for stock awards is measured at the grant date based on the fair value of the award and is recognized over the vesting period (generally
three
years). The fair value of stock awards and performance stock awards is determined based on the closing market price of the company’s common stock on the grant date. The fair value of market-based stock awards is determined at the grant date using a Monte Carlo simulation model. For purposes of measuring compensation expense for performance awards, the number of shares ultimately expected to vest is estimated at each reporting date based on management’s expectations regarding the relevant performance criteria.
-
73
-
NORTHROP GRUMMAN CORPORATION
Stock award activity for the years ended
December 31, 2015
,
2016
and
2017
, is presented in the table below. Vested awards do not include any adjustments to reflect the final performance measure for issued shares.
|
Stock
Awards (in thousands) |
Weighted-
Average Grant Date Fair Value Per Share |
Weighted-
Average Remaining Contractual Term (in years) |
|||||||
|
Outstanding at January 1, 2015
|
2,808
|
|
$
|
77
|
|
1.1
|
|||
|
Granted
|
539
|
|
166
|
|
|||||
|
Vested
|
(1,691
|
)
|
62
|
|
|||||
|
Forfeited
|
(70
|
)
|
108
|
|
|
||||
|
Outstanding at December 31, 2015
|
1,586
|
|
$
|
122
|
|
1.2
|
|||
|
Granted
|
483
|
|
186
|
|
|||||
|
Vested
|
(872
|
)
|
97
|
|
|||||
|
Forfeited
|
(49
|
)
|
143
|
|
|||||
|
Outstanding at December 31, 2016
|
1,148
|
|
$
|
167
|
|
1.3
|
|||
|
Granted
|
397
|
|
233
|
|
|||||
|
Vested
|
(521
|
)
|
152
|
|
|||||
|
Forfeited
|
(86
|
)
|
198
|
|
|||||
|
Outstanding at December 31, 2017
|
938
|
|
$
|
192
|
|
1.0
|
|||
The majority of our stock awards are granted annually during the first quarter. RSRs typically vest on the third anniversary of the grant date, while RPSRs generally vest and pay out based on the achievement of financial metrics over a three-year period.
The grant date fair value of shares issued in settlement of fully vested stock awards was
$96 million
,
$97 million
and
$143 million
during the years ended
December 31, 2017
,
2016
and
2015
, respectively.
Cash Awards
The company grants certain employees cash units (CUs) and cash performance units (CPUs). Depending on actual performance against financial objectives, recipients of CPUs earn between
0
and
200 percent
of the original grant. The following table presents the minimum and maximum aggregate payout amounts related to those cash awards granted for the periods presented:
|
Year Ended December 31
|
||||||||||
|
$ in millions
|
2017
|
2016
|
2015
|
|||||||
|
Minimum aggregate payout amount
|
$
|
38
|
|
$
|
39
|
|
$
|
37
|
|
|
|
Maximum aggregate payout amount
|
201
|
|
199
|
|
194
|
|
||||
The majority of our cash awards are granted annually during the first quarter. CUs typically vest and settle in cash on the third anniversary of the grant date, while CPUs generally vest and pay out in cash based on the achievement of financial metrics over a three-year period. At
December 31, 2017
, there was
$133 million
of unrecognized compensation expense related to cash awards.
-
74
-
NORTHROP GRUMMAN CORPORATION
15
. UNAUDITED SELECTED QUARTERLY DATA
Unaudited quarterly financial results are set forth in the following tables. It is the company’s long-standing practice to establish actual interim closing dates using a “fiscal” calendar in which we close our books on a Friday near each quarter-end date, in order to normalize the potentially disruptive effects of quarterly closings on business processes. This practice is only used at interim periods within a reporting year.
|
2017
|
|
|||||||||||||||
|
In millions, except per share amounts
|
1st Qtr
|
2nd Qtr
|
3rd Qtr
|
4th Qtr
|
||||||||||||
|
Sales
|
$
|
6,267
|
|
$
|
6,375
|
|
$
|
6,527
|
|
$
|
6,634
|
|
||||
|
Operating income
|
832
|
|
855
|
|
845
|
|
767
|
|
||||||||
|
Net earnings
|
640
|
|
552
|
|
645
|
|
178
|
|
||||||||
|
Basic earnings per share
|
3.66
|
|
3.16
|
|
3.70
|
|
1.02
|
|
||||||||
|
Diluted earnings per share
|
3.63
|
|
3.15
|
|
3.68
|
|
1.01
|
|
||||||||
|
Weighted-average common shares outstanding
|
174.8
|
|
174.5
|
|
174.2
|
|
174.2
|
|
||||||||
|
Weighted-average diluted shares outstanding
|
176.1
|
|
175.5
|
|
175.3
|
|
175.5
|
|
||||||||
|
2016
|
|
|||||||||||||||
|
In millions, except per share amounts
|
1st Qtr
|
2nd Qtr
|
3rd Qtr
|
4th Qtr
|
||||||||||||
|
Sales
|
$
|
5,956
|
|
$
|
6,000
|
|
$
|
6,155
|
|
$
|
6,397
|
|
||||
|
Operating income
|
739
|
|
797
|
|
826
|
|
831
|
|
||||||||
|
Net earnings
|
556
|
|
517
|
|
602
|
|
525
|
|
||||||||
|
Basic earnings per share
|
3.07
|
|
2.87
|
|
3.38
|
|
2.98
|
|
||||||||
|
Diluted earnings per share
|
3.03
|
|
2.85
|
|
3.35
|
|
2.96
|
|
||||||||
|
Weighted-average common shares outstanding
|
181.3
|
|
180.1
|
|
178.1
|
|
176.0
|
|
||||||||
|
Weighted-average diluted shares outstanding
|
183.4
|
|
181.5
|
|
179.6
|
|
177.6
|
|
||||||||
-
75
-
NORTHROP GRUMMAN CORPORATION
None.
DISCLOSURE CONTROLS AND PROCEDURES
Our principal executive officer (Chairman and Chief Executive Officer) and principal financial officer (Corporate Vice President and Chief Financial Officer) have evaluated the company’s disclosure controls and procedures (as defined in Rule 13a-15(e) and Rule 15d-15(e) of the Securities Exchange Act of 1934 (the Exchange Act)) as of
December 31, 2017
, and have concluded that these controls and procedures are effective to ensure that information required to be disclosed by us in the reports that we file or submit under the Exchange Act is recorded, processed, summarized and reported within the time periods specified in the Securities and Exchange Commission’s rules and forms. These disclosure controls and procedures include, without limitation, controls and procedures designed to ensure that information required to be disclosed in the reports that we file or submit is accumulated and communicated to management, including the principal executive officer and the principal financial officer, as appropriate to allow timely decisions regarding required disclosure.
CHANGES IN INTERNAL CONTROL OVER FINANCIAL REPORTING
During the three months ended
December 31, 2017
, no change occurred in our internal controls over financial reporting that materially affected, or is reasonably likely to materially affect, our internal controls over financial reporting.
None.
-
76
-
MANAGEMENT’S REPORT ON INTERNAL CONTROL OVER FINANCIAL REPORTING
The management of Northrop Grumman Corporation (the company) prepared and is responsible for the consolidated financial statements and all related financial information contained in this Annual Report. This responsibility includes establishing and maintaining effective internal control over financial reporting. The company’s internal control over financial reporting is designed to provide reasonable assurance regarding the reliability of financial reporting and the preparation of financial statements for external purposes in accordance with accounting principles generally accepted in the United States of America.
To comply with the requirements of Section 404 of the Sarbanes–Oxley Act of 2002, the company designed and implemented a structured and comprehensive assessment process to evaluate its internal control over financial reporting across the enterprise. The assessment of the effectiveness of the company’s internal control over financial reporting is based on criteria established in
Internal Control—Integrated Framework (2013)
issued by the Committee of Sponsoring Organizations of the Treadway Commission. Because of its inherent limitations, a system of internal control over financial reporting can provide only reasonable assurance and may not prevent or detect misstatements. Management regularly monitors its internal control over financial reporting, and actions are taken to correct deficiencies as they are identified. Based on its assessment, management has concluded that the company’s internal control over financial reporting was effective as of
December 31, 2017
.
Deloitte & Touche LLP issued an attestation report dated
January 29, 2018
, concerning the company’s internal control over financial reporting, which is contained in this Annual Report. The company’s consolidated financial statements as of and for the year ended
December 31, 2017
, have been audited by the independent registered public accounting firm of Deloitte & Touche LLP in accordance with the standards of the Public Company Accounting Oversight Board (United States).
/s/ Wesley G. Bush
Chairman and Chief Executive Officer
/s/ Kenneth L. Bedingfield
Corporate Vice President and Chief Financial Officer
January 29, 2018
-
77
-
REPORT OF INDEPENDENT REGISTERED PUBLIC ACCOUNTING FIRM
To the Board of Directors and Shareholders of
Northrop Grumman Corporation
Falls Church, Virginia
Opinion on Internal Control over Financial Reporting
We have audited the internal control over financial reporting of Northrop Grumman Corporation and subsidiaries (the “Company”) as of
December 31, 2017
, based on criteria established in
Internal Control - Integrated Framework (2013)
issued by the Committee of Sponsoring Organizations of the Treadway Commission (COSO). In our opinion, the Company maintained, in all material respects, effective internal control over financial reporting as of
December 31, 2017
, based on the criteria established in
Internal Control - Integrated Framework (2013)
issued by COSO.
We have also audited, in accordance with the standards of the Public Company Accounting Oversight Board (United States) (PCAOB), the consolidated financial statements as of and for the year ended December 31, 2017 of the Company and our report dated
January 29, 2018
expressed an unqualified opinion on those financial statements.
Basis for Opinion
The Company’s management is responsible for maintaining effective internal control over financial reporting and for its assessment of the effectiveness of internal control over financial reporting, included in the accompanying Management’s Report on Internal Control over Financial Reporting. Our responsibility is to express an opinion on the Company’s internal control over financial reporting based on our audit. We are a public accounting firm registered with the PCAOB and are required to be independent with respect to the Company in accordance with the U.S. federal securities laws and the applicable rules and regulations of the Securities and Exchange Commission and the PCAOB.
We conducted our audit in accordance with the standards of the PCAOB. Those standards require that we plan and perform the audit to obtain reasonable assurance about whether effective internal control over financial reporting was maintained in all material respects. Our audit included obtaining an understanding of internal control over financial reporting, assessing the risk that a material weakness exists, testing and evaluating the design and operating effectiveness of internal control based on the assessed risk, and performing such other procedures as we considered necessary in the circumstances. We believe that our audit provides a reasonable basis for our opinion.
Definition and Limitations of Internal Control over Financial Reporting
A company’s internal control over financial reporting is a process designed to provide reasonable assurance regarding the reliability of financial reporting and the preparation of financial statements for external purposes in accordance with generally accepted accounting principles. A company’s internal control over financial reporting includes those policies and procedures that (1) pertain to the maintenance of records that, in reasonable detail, accurately and fairly reflect the transactions and dispositions of the assets of the company; (2) provide reasonable assurance that transactions are recorded as necessary to permit preparation of financial statements in accordance with generally accepted accounting principles, and that receipts and expenditures of the company are being made only in accordance with authorizations of management and directors of the company; and (3) provide reasonable assurance regarding prevention or timely detection of unauthorized acquisition, use, or disposition of the company’s assets that could have a material effect on the financial statements.
Because of its inherent limitations, internal control over financial reporting may not prevent or detect misstatements. Also, projections of any evaluation of effectiveness to future periods are subject to the risk that controls may become inadequate because of changes in conditions, or that the degree of compliance with the policies or procedures may deteriorate.
/s/ Deloitte & Touche LLP
McLean, Virginia
January 29, 2018
-
78
-
NORTHROP GRUMMAN CORPORATION
Item
10
. Directors, Executive Officers and Corporate Governance
DIRECTORS
Information about our Directors will be incorporated herein by reference to the Proxy Statement for the
2018
Annual Meeting of Stockholders, to be filed with the Securities and Exchange Commission (SEC) within 120 days after the end of the company’s fiscal year.
EXECUTIVE OFFICERS
Our executive officers as of
January 29, 2018
, are listed below, along with their ages on that date, positions and offices held with the company, and principal occupations and employment, focused primarily on the past five years.
|
Name
|
Age
|
Office Held
|
Since
|
Recent Business Experience
|
|||||
|
Wesley G. Bush
|
56
|
|
Chairman and Chief Executive Officer
|
2011
|
Chairman, Chief Executive Officer and President (2011-2017)
|
||||
|
Patrick M. Antkowiak
|
57
|
|
Corporate Vice President and Chief Technology Officer
|
2014
|
Vice President and General Manager, Advanced Concepts and Technologies Division, Former Electronic Systems Sector (2010-2014)
|
||||
|
Kenneth L. Bedingfield
|
45
|
|
Corporate Vice President and Chief Financial Officer
|
2015
|
Vice President, Finance (2014-2015); Vice President, Business Management and Chief Financial Officer, Aerospace Systems Sector (2013-2014); Corporate Vice President, Controller and Chief Accounting Officer (2011-2013)
|
||||
|
Mark A. Caylor
|
53
|
|
Corporate Vice President and President, Mission Systems Sector
|
2018
|
Corporate Vice President and President, Enterprise Services and Chief Strategy Officer (2014-2017); Corporate Vice President and President, Enterprise Shared Services (2013-2014)
|
||||
|
Sheila C. Cheston
|
59
|
|
Corporate Vice President and General Counsel
|
2010
|
|||||
|
Lisa R. Davis
|
56
|
|
Corporate Vice President, Communications
|
2016
|
Vice President, Communications, Former Electronic Systems Sector (2014-2016); Vice President, Communications, AstraZeneca (a biopharmaceutical company) (2006-2013)
|
||||
|
Michael A. Hardesty
|
46
|
|
Corporate Vice President, Controller, and Chief Accounting Officer
|
2013
|
Vice President and Chief Financial Officer, Former Information Systems Sector (2011-2013)
|
||||
|
Christopher T. Jones
|
53
|
|
Corporate Vice President and President, Technology Services Sector
|
2016
|
Corporate Vice President and President, Former Technical Services Sector (2013-2015)
|
||||
-
79
-
NORTHROP GRUMMAN CORPORATION
|
Name
|
Age
|
Office Held
|
Since
|
Recent Business Experience
|
|||||
|
Lesley A. Kalan
|
44
|
|
Corporate Vice President, Government Relations
|
2018
|
Vice President, Legislative Affairs (2010-2017)
|
||||
|
Janis G. Pamiljans
|
57
|
|
Corporate Vice President and President, Aerospace Systems Sector
|
2017
|
Vice President and General Manager, Strategic Systems Division, Aerospace Systems Sector (2015-2017); Vice President and General Manager, Unmanned Systems (now Autonomous Systems), Aerospace Systems Sector (2012-2014)
|
||||
|
Denise M. Peppard
|
61
|
|
Corporate Vice President and Chief Human Resources Officer
|
2011
|
|||||
|
David T. Perry
|
53
|
|
Corporate Vice President and Chief Global Business Development Officer
|
2012
|
|||||
|
Shawn N. Purvis
|
44
|
|
Corporate Vice President and President of Enterprise Services
|
2018
|
Vice President and Chief Information Officer (2016-2017); Vice President and General Manager, Cyber Division, Former Information Systems Sector (2014-2016); Vice President and Business Manager, Integrated Intelligence Systems Business Unit, Former Information Systems Sector (2012-2014)
|
||||
|
Kathy J. Warden
|
46
|
|
President and Chief Operating Officer
|
2018
|
Corporate Vice President and President, Mission Systems Sector (2016-2017); Corporate Vice President and President, Former Information Systems Sector (2013-2015)
|
||||
AUDIT COMMITTEE FINANCIAL EXPERT
The information as to the Audit Committee and the Audit Committee Financial Expert will be incorporated herein by reference to the Proxy Statement for the
2018
Annual Meeting of Shareholders.
CODE OF ETHICS
We have adopted Standards of Business Conduct for all of our employees, including the principal executive officer, principal financial officer and principal accounting officer. The Standards of Business Conduct can be found on our internet website at www.northropgrumman.com under “Investor Relations – Corporate Governance – Overview.” A copy of the Standards of Business Conduct is available to any stockholder who requests it by writing to: Northrop Grumman Corporation, c/o Office of the Secretary, 2980 Fairview Park Drive, Falls Church, VA 22042. We disclose amendments to provisions of our Standards of Business Conduct by posting amendments on our website. Waivers of the provisions of our Standards of Business Conduct that apply to our directors and executive officers are disclosed in a Current Report on Form 8-K.
The website and information contained on it or incorporated in it are not intended to be incorporated in this report on Form 10-K or other filings with the SEC.
OTHER DISCLOSURES
Other disclosures required by this Item will be incorporated herein by reference to the Proxy Statement for the
2018
Annual Meeting of Shareholders.
Information concerning Executive Compensation, including information concerning Compensation Committee Interlocks and Insider Participation and the Compensation Committee Report, will be incorporated herein by reference to the Proxy Statement for the
2018
Annual Meeting of Shareholders.
-
80
-
NORTHROP GRUMMAN CORPORATION
The information as to Securities Authorized for Issuance Under Equity Compensation Plans and Security Ownership of Certain Beneficial Owners and Management will be incorporated herein by reference to the Proxy Statement for the
2018
Annual Meeting of Shareholders.
For a description of securities authorized under our equity compensation plans, see Note
14
to the consolidated financial statements.
The information as to Certain Relationships and Related Transactions and Director Independence will be incorporated herein by reference to the Proxy Statement for the
2018
Annual Meeting of Shareholders.
The information as to Principal Accountant Fees and Services will be incorporated herein by reference to the Proxy Statement for the
2018
Annual Meeting of Shareholders.
-
81
-
NORTHROP GRUMMAN CORPORATION
|
(a)
|
1. Report of Independent Registered Public Accounting Firm
|
Financial Statements
2. Financial Statement Schedules
All schedules have been omitted because they are not applicable, not required, or the information has been otherwise supplied in the financial statements or notes to the financial statements.
3. Exhibits
-
82
-
NORTHROP GRUMMAN CORPORATION
|
|
4(m)
|
Indenture between TRW Inc. (predecessor-in-interest to Northrop Grumman Systems Corporation) and Mellon Bank, N.A., as trustee, dated as of May 1, 1986 (incorporated by reference to Exhibit 2 to the Form 8-A Registration Statement of TRW Inc. dated July 3, 1986, File No. 001-02384)
|
|
|
4(n)
|
First Supplemental Indenture between TRW Inc. (predecessor-in-interest to Northrop Grumman Systems Corporation) and Mellon Bank, N.A., as trustee, dated as of August 24, 1989 (incorporated by reference to Exhibit 4(b) to Form S-3 Registration Statement No. 33-30350 of TRW Inc.)
|
-
83
-
NORTHROP GRUMMAN CORPORATION
-
84
-
NORTHROP GRUMMAN CORPORATION
-
85
-
NORTHROP GRUMMAN CORPORATION
-
86
-
NORTHROP GRUMMAN CORPORATION
-
87
-
NORTHROP GRUMMAN CORPORATION
-
88
-
NORTHROP GRUMMAN CORPORATION
|
|
*21
|
|
-
89
-
NORTHROP GRUMMAN CORPORATION
|
|
**32.2
|
|
|
|
*101
|
Northrop Grumman Corporation Annual Report on Form 10-K for the fiscal year ended December 31, 2017, formatted in XBRL (Extensible Business Reporting Language); (i) the Consolidated Statements of Earnings and Comprehensive Income, (ii) Consolidated Statements of Financial Position, (iii) Consolidated Statements of Cash Flows, (iv) Consolidated Statements of Changes in Shareholders’ Equity, and (v) Notes to Consolidated Financial Statements
|
|
|
+
|
Management contract or compensatory plan or arrangement
|
|
|
*
|
Filed with this Report
|
|
|
**
|
Furnished with this Report
|
None.
-
90
-
NORTHROP GRUMMAN CORPORATION
SIGNATURES
Pursuant to the requirements of Section 13 or 15(d) of the Securities Exchange Act of 1934, the registrant has duly caused this report to be signed on its behalf by the undersigned, thereunto duly authorized, on
the 29th day of January 2018
.
|
NORTHROP GRUMMAN CORPORATION
|
||
|
By:
|
/s/ Michael A. Hardesty
|
|
|
Michael A. Hardesty
|
||
|
Corporate Vice President, Controller, and Chief Accounting Officer
|
||
|
(Principal Accounting Officer)
|
||
Pursuant to the requirements of the Securities Exchange Act of 1934, this report has been signed on behalf of the registrant this
the 29th day of January 2018
, by the following persons and in the capacities indicated.
|
Signature
|
|
Title
|
|
Wesley G. Bush*
|
|
Chairman and Chief Executive Officer (Principal Executive Officer), and Director
|
|
Kenneth L. Bedingfield*
|
|
Corporate Vice President and Chief Financial Officer (Principal Financial Officer)
|
|
Michael A. Hardesty
|
|
Corporate Vice President, Controller and Chief Accounting Officer
|
|
Marianne C. Brown*
|
Director
|
|
|
Victor H. Fazio*
|
|
Director
|
|
Donald E. Felsinger*
|
|
Director
|
|
Ann M. Fudge*
|
|
Director
|
|
Bruce S. Gordon*
|
|
Director
|
|
William H. Hernandez*
|
Director
|
|
|
Madeleine A. Kleiner*
|
|
Director
|
|
Karl J. Krapek*
|
|
Director
|
|
Gary Roughead*
|
|
Director
|
|
Thomas M. Schoewe*
|
|
Director
|
|
James S. Turley*
|
|
Director
|
|
Mark A. Welsh III*
|
|
Director
|
|
*By:
|
/s/ Jennifer C. McGarey
|
|
Jennifer C. McGarey
|
|
|
Corporate Vice President and Secretary
|
|
|
Attorney-in-Fact
|
|
|
pursuant to a power of attorney
|
|
-
91
-
TABLE OF CONTENTS
Part IItem 1. BusinessItem 1A. Risk FactorsItem 1B. Unresolved Staff CommentsItem 2. PropertiesItem 3. Legal ProceedingsItem 4. Mine Safety DisclosuresPart IIItem 5. Market For Registrant S Common Equity, Related Stockholder Matters and Issuer Purchases Of Equity SecuritiesItem 6. Selected Financial DataItem 7. Management S Discussion and Analysis Of Financial Condition and Results Of OperationsItem 7A. Quantitative and Qualitative Disclosures About Market RiskItem 8. Financial Statements and Supplementary DataItem 9. Changes in and Disagreements with Accountants on Accounting and Financial DisclosureItem 9A. Controls and ProceduresItem 9B. Other InformationPart IIIItem 10. Directors, Executive Officers and Corporate GovernanceItem 11. Executive CompensationItem 12. Security Ownership Of Certain Beneficial Owners and Management and Related Stockholder MattersItem 13. Certain Relationships and Related Transactions, and Director IndependenceItem 14. Principal Accountant Fees and ServicesPart IVItem 15. Exhibits and Financial Statement SchedulesItem 16. Form 10-k Summary