NORTHERN OIL & GAS, INC.
10-Ks and 10-Qs
|
|
|
|
|
|
|
|
|
|
|
|
|
|
|
|
|
|
|
|
|
|
|
|
|
|
|
|
|
|
|
|
|
|
|
|
|
|
|
|
|
|
|
|
|
|
|
|
|
|
|
|
|
|
|
|
|
|
|
UNITED STATES
SECURITIES AND EXCHANGE COMMISSION
WASHINGTON, DC 20549
FORM 10-K
|
(Mark One)
|
|
|
x
|
ANNUAL REPORT PURSUANT TO SECTION 13 OR 15(d) OF THE SECURITIES EXCHANGE ACT OF 1934
|
For the fiscal year ended December 31, 2010
Or
|
¨
|
TRANSITION REPORT PURSUANT TO SECTION 13 OR 15(d) OF THE SECURITIES EXCHANGE ACT OF 1934
.
|
For the transition period from ________ to ________
Commission File No. 001-33999
__________________
NORTHERN OIL AND GAS, INC.
(
Exact Name of Registrant as Specified in Its Charter
)
|
Minnesota
|
95-3848122
|
|
|
(
State or Other Jurisdiction of Incorporation or Organization
)
|
(I.R.S. Employer Identification No.)
|
315 Manitoba Avenue – Suite 200, Wayzata, Minnesota 55391
(
Address of Principal Executive Offices
) (
Zip Code
)
952-476-9800
(
Registrant’s Telephone Number, Including Area Code
)
Securities registered pursuant to Section 12(b) of the Act:
|
Title of Each Class
|
Name of Each Exchange On Which Registered
|
|
|
Common Stock, $0.001 par value
|
NYSE Amex Equities Market
|
Securities registered pursuant to Section 12(g) of the Act:
None
|
Indicate by check mark if the registrant is a well-known seasoned issuer, as defined in Rule 405 of the Securities Act
|
Yes
x
No
¨
|
|
Indicate by check mark if the registrant is not required to file reports pursuant to Section 13 or 15(d) of the Act.
|
Yes
¨
No
x
|
|
Indicate by check mark whether the registrant (1) has filed all reports required to be filed by Section 13 or 15(d) of the Securities Exchange Act of 1934 during the preceding 12 months (or for such shorter period that the registrant was required to file such reports), and (2) has been subject to such filing requirements for the past 90 days.
|
Yes
x
No
¨
|
|
Indicate by check mark whether the registrant has submitted electronically and posted on its corporate Web site, if any, every Interactive Data File required to be submitted and posted pursuant to Rule 405 of Regulation S-T (§232.405 of this chapter) during the preceding 12 months
(or for such shorter period that the registrant was required to submit and post such files.
|
Yes
¨
No
¨
|
|
Indicate by check mark if disclosure of delinquent filers pursuant to Item 405 of Regulation S-K (§229.405) is not contained herein, and will not be contained, to the best of registrant’s knowledge, in definitive proxy or information statements incorporated by reference in Part III of this Form 10-K or any amendment to this Form 10-K.
|
x
|
|
Indicate by check mark whether the registrant is a large accelerated filer, an accelerated filer, a non-accelerated filer, or a small reporting company. See the definitions of “large accelerated filer,” “accelerated filer” and “smaller reporting compa
ny” in Rule 12b-2 of the Exchange Act. (Che
ck one):
|
|
Large Accelerated Filer
o
|
Accelerated Filer
x
|
Non-Accelerated Filer
o
(Do not check if a smaller reporting company)
|
Smaller Reporting Company
¨
|
|
Indicate by check mark whether the registrant is a shell company (as defined in Rule 12b-2 of the Exchange Act).
|
Yes
¨
No
x
|
The aggregate market value of the registrant’s voting and non-voting common equity held by non-affiliates of the registrant on the last business day of the registrant’s most recently completed second fiscal quarter (based on the closing sale price as reported by the NYSE Amex Equities Market) was approximately $583 million.
Indicate the number of shares outstanding of each of the registrant’s classes of common stock, as of the latest practicable date.
As of March 1, 2011, the registrant had 63,103,424 shares of common stock issued and outstanding.
DOCUMENTS INCORPORATED BY REFERENCE
Portions of the proxy statement related to the registrant’s 2011 Annual Meeting of Shareholders are incorporated by reference into Part III of this annual report.
CAUTIONARY STATEMENT CONCERNING FORWARD-LOOKING STATEMENTS
We are including the following discussion to inform our existing and potential security holders generally of some of the risks and uncertainties that can affect our company and to take advantage of the “safe harbor” protection for forward-looking statements that applicable federal securities law affords.
From time to time, our management or persons acting on our behalf may make forward-looking statements to inform existing and potential security holders about our company. All statements other than statements of historical facts included in this report regarding our financial position, business strategy, plans and objectives of management for future operations, industry conditions, and indebtedness covenant compliance are forward-looking statements. When used in this report, forward-looking statements are generally accompanied by terms or phrases such as “estimate,” “project,” “predict,” “believe,” “expect,” “anticipate,” “target,” “plan,” “intend,” “seek,” “goal,” “will,” “should,” “may” or other words and similar expressions that convey the uncertainty of future events or outcomes. Items contemplating or making assumptions about, actual or potential future sales, market size, collaborations, and trends or operating results also constitute such forward-looking statements.
Forward-looking statements involve inherent risks and uncertainties, and important factors (many of which are beyond our company’s control) that could cause actual results to differ materially from those set forth in the forward-looking statements, including the following: general economic or industry conditions, nationally and/or in the communities in which our company conducts business, changes in the interest rate environment, legislation or regulatory requirements, conditions of the securities markets, our ability to raise capital, changes in accounting principles, policies or guidelines, financial or political instability, acts of war or terrorism, other economic, competitive, governmental, regulatory and technical factors affecting our company’s operations, products, services and prices.
We have based these forward-looking statements on our current expectations and assumptions about future events. While our management considers these expectations and assumptions to be reasonable, they are inherently subject to significant business, economic, competitive, regulatory and other risks, contingencies and uncertainties, most of which are difficult to predict and many of which are beyond our control. Accordingly, results actually achieved may differ materially from expected results in these statements. Forward-looking statements speak only as of the date they are made. You should consider carefully the statements in “Item 1A. Risk Factors” and other sections of this report, which describe factors that could cause our actual results to differ from those set forth in the forward-looking statements. Our company does not undertake, and specifically disclaims, any obligation to update any forward-looking statements to reflect events or circumstances occurring after the date of such statements.
Readers are urged not to place undue reliance on these forward-looking statements, which speak only as of the date of this report. We assume no obligation to update any forward-looking statements in order to reflect any event or circumstance that may arise after the date of this report, other than as may be required by applicable law or regulation. Readers are urged to carefully review and consider the various disclosures made by us in our reports filed with the United States Securities and Exchange Commission (the “SEC”) which attempt to advise interested parties of the risks and factors that may affect our business, financial condition, results of operation and cash flows. If one or more of these risks or uncertainties materialize, or if the underlying assumptions prove incorrect, our actual results may vary materially from those expected or projected.
GLOSSARY OF TERMS
Unless otherwise indicated in this report, natural gas volumes are stated at the legal pressure base of the state or geographic area in which the reserves are located at 60 degrees Fahrenheit. Crude oil and natural gas equivalents are determined using the ratio of six Mcf of natural gas to one barrel of crude oil, condensate or natural gas liquids.
The following definitions shall apply to the technical terms used in this report.
Terms used to describe quantities of crude oil and natural gas:
“
Bbl
” – barrel or barrels.
“
BOE
” – barrels of crude oil equivalent.
“
Boepd
”
–
barrels of crude oil equivalent per day.
“
MBbl
” – thousand barrels.
“
MBoe
”
–
thousand barrels of crude oil equivalent.
“
Mcf
” – thousand cubic feet of gas.
“
Mcfe
” – thousand cubic feet of gas equivalent.
“
MMBbls
” – million barrels.
“
MMBoe
”
– million barrels of crude oil equivalent.
“
MMcf
” – million cubic feet of gas.
“
MMcfe
” – million cubic feet of gas equivalent.
“
MMcfepd
” – million cubic feet of gas equivalent per day.
“
MMcfpd
” – million cubic feet of gas per day.
Terms used to describe our interests in wells and acreage:
“
Developed acreage
” means acreage consisting of leased acres spaced or assignable to productive wells. Acreage included in spacing units of infill wells is classified as developed acreage at the time production commences from the initial well in the spacing unit. As such, the addition of an infill well does not have any impact on a company’s amount of developed acreage.
“
Development well
” is a well drilled within the proved area of a crude oil or natural gas reservoir to the depth of stratigraphic horizon (rock layer or formation) noted to be productive for the purpose of extracting proved crude oil or natural gas reserves.
“
Dry hole
” is an exploratory or development well found to be incapable of producing either crude oil or natural gas in sufficient quantities to justify completion as a crude oil or natural gas well.
“
Exploratory well
” is a well drilled to find and produce crude oil or natural gas in an unproved area, to find a new reservoir in a field previously found to be producing crude oil or natural gas in another reservoir, or to extend a known reservoir.
i
“
Gross acres
” refer to the number of acres in which we own a gross working interest.
“
Gross well
” is a well in which we own a working interest.
“
Infill well
” is a subsequent well drilled in an established spacing unit to the addition of an already established productive well in the spacing unit. Acreage on which infill wells are drilled is considered developed commencing with the initial productive well established in the spacing unit. As such, the addition of an infill well does not have any impact on a company’s amount of developed acreage.
“
Net acres
” represent our percentage ownership of gross acreage. Net acres are deemed to exist when the sum of fractional ownership working interests in gross acres equals one (e.g., a 10% working interest in a lease covering 640 gross acres is equivalent to 64 net acres).
“Net acres under the bit
” means those leased acres on which wells are spud, drilling, drilled, awaiting completion or completing, and not yet classified as developed acreage, regardless of whether or not such acreage contains proved reserves. Acreage included in spacing units of infill wells is not considered under the bit because such acreage was already previously classified as developed acreage when the initial well was completed in the subject spacing unit.
“
Net well
” is deemed to exist when the sum of fractional ownership working interests in gross wells equals one.
“
Productive well
” is an exploratory or a development well that is not a dry hole.
“
Undeveloped acreage
” means those leased acres on which wells have not been drilled or completed to a point that would permit the production of economic quantities of crude oil and natural gas, regardless of whether or not such acreage contains proved reserves. Undeveloped acreage includes net acres under the bit until a productive well is established in the spacing unit.
Terms used to assign a present value to or to classify our reserves:
“
Proved reserves
” or “
reserves
” – Proved crude oil and natural gas reserves are those quantities of crude oil and natural gas, which, by analysis of geoscience and engineering data, can be estimated with reasonable certainty to be economically producible—from a given date forward, from known reservoirs, and under existing economic conditions, operating methods, and government regulations—prior to the time at which contracts providing the right to operate expire, unless evidence indicates that renewal is reasonably certain, regardless of whether deterministic or probabilistic methods are used for the estimation.
The project to extract the hydrocarbons must have commenced or the operator must be reasonably certain that it will commence the project within a reasonable time.
“ Proved developed reserves (PDP’s) ” – Reserves that can be expected to be recovered through existing wells with existing equipment and operating methods. Additional crude oil and natural gas expected to be obtained through the application of fluid injection or other improved recovery techniques for supplementing the natural forces and mechanisms of primary recovery are included in “proved developed reserves” only after testing by a pilot project or after the operation of an installed program has confirmed through production response that increased recovery will be achieved.
“
Proved developed non-producing reserves (PDNP’s)
”
– Proved crude oil and natural gas reserves that are developed behind pipe, shut-in or that can be recovered through improved recovery only after the necessary equipment has been installed, or when the costs to do so are relatively minor. Shut-in reserves are expected to be recovered from (1) completion intervals which are open at the time of the estimate but which have not started producing, (2) wells that were shut-in for market conditions or pipeline connections, or (3) wells not capable of production for mechanical reasons. Behind-pipe reserves are expected to be recovered from zones in existing wells that will require additional completion work or future recompletion prior to the start of production.
“
Proved undeveloped drilling location
”
– A site on which a development well can be drilled consistent with spacing rules for purposes of recovering proved undeveloped reserves.
ii
“
Proved undeveloped reserves (PUD’s)
”
– Proved crude oil and natural gas reserves that are expected to be recovered from new wells on undrilled acreage or from existing wells where a relatively major expenditure is required for development. Reserves on undrilled acreage are limited to those drilling units offsetting productive units that are reasonably certain of production when drilled. Proved reserves for other undrilled units are claimed only where it can be demonstrated with certainty that there is continuity of production from the existing productive formation. Estimates for proved undeveloped reserves are not attributed to any acreage for which an application of fluid injection or other improved recovery technique is contemplated, unless such techniques have been proven effective by actual tests in the area and in the same reservoir.
“
Probable reserves
”
– are those additional reserves which analysis of geoscience and engineering data indicate are less likely to be recovered than proved reserves but which together with proved reserves, are as likely as not to be recovered.
“
Possible reserves
”
– are those additional reserves which analysis of geoscience and engineering data suggest are less likely to be recoverable than probable reserves.
“
Pre-tax
PV-10
”
– means estimated future net revenue, discounted at a rate of 10% per annum, before income taxes and with no price or cost escalation or de-escalation in accordance with guidelines promulgated by the SEC.
“
Standardized Measure
”
– means estimated future net revenue, discounted at a rate of 10% per annum, after income taxes and with no price or cost escalation, calculated in accordance with Accounting Standards Codification
(“ASC”)
932, formerly Statement of Financial Accounting Standards No. 69 “Disclosures About Oil and Gas Producing Activities.”
iii
NOR
THERN OIL AND GAS, INC.
TABLE OF CONTENTS
|
Page
|
||
|
Part I
|
||
|
Item 1.
|
2 | |
|
Item 1A.
|
10 | |
|
Item 1B.
|
19 | |
|
Item 2.
|
20 | |
|
Item 3.
|
27 | |
|
Item 4.
|
27 | |
|
Part II
|
||
|
Item 5.
|
27 | |
|
Item 6.
|
30 | |
|
Item 7.
|
31 | |
|
Item 7A.
|
46 | |
|
Item 8.
|
47 | |
|
Item 9.
|
47 | |
|
Item 9A.
|
47 | |
|
Item 9B.
|
50 | |
|
Part III
|
||
|
Item 10.
|
51 | |
|
Item 11.
|
52 | |
|
Item 12.
|
52 | |
|
Item 13.
|
52 | |
|
Item 14.
|
52 | |
|
Part IV
|
||
|
Item 15.
|
52 | |
| 55 | ||
| F-1 | ||
NORTHERN OIL AND GAS, INC.
ANNUAL REPORT ON FORM 10-K
FOR FISCAL YEAR ENDED DECEMBER 31, 2010
Overview
Our company took its present form on March 20, 2007, when Northern Oil and Gas, Inc. (“Northern”), a Nevada corporation engaged in our current business, merged with and into our subsidiary, with Northern remaining as the surviving corporation (the “Merger”). Northern then merged into us, and we were the surviving corporation. We then changed our name to Northern Oil and Gas, Inc. As a result of the Merger, Northern was deemed to be the acquiring company for financial reporting purposes and the transaction has been accounted for as a reverse merger. Our primary operations are now those formerly operated by Northern as well as other business activities since March 2007.
On June 30, 2010, Northern completed its reincorporation in the State of Minnesota from the State of Nevada pursuant to a plan of merger between Northern Oil and Gas, Inc., a Nevada corporation, and Northern Oil and Gas, Inc., a Minnesota corporation and wholly-owned subsidiary of the Nevada corporation. Upon the reincorporation, each outstanding certificate representing shares of the Nevada corporation’s common stock was deemed, without any action by the holders thereof, to represent the same number and class of shares of our company’s common stock. As of June 30, 2010, the rights of our shareholders began to be governed by Minnesota corporation law and our current articles of incorporation and bylaws.
Our common stock commenced trading on the American Stock Exchange (“AMEX”) on March 26, 2008 under the symbol “NOG.” Our common stock commenced trading on the New York Stock Exchange (“NYSE”) on the NYSE Amex Equities Market platform upon completion of NYSE Euronext’s acquisition of the AMEX.
Business
We are a growth-oriented independent energy company engaged in the acquisition, exploration, development and production of crude oil and natural gas properties, primarily in the Bakken and Three Forks formations within the Williston Basin in North Dakota and Montana. As of March 1, 2011, we controlled 147,407 net acres in the Williston Basin targeting the Bakken and Three Forks formations and owned working interests in 337 successful discoveries, consisting of 332 targeting the Bakken and Three Forks formations and five targeting Red River structures. Our current Bakken and Three Forks prospective acreage position will allow us to drill approximately 921 net wells based on six net wells per 960-acre spacing units. As of March 1, 2011, we had developed 23,279 net acres and had 11,596 net acres under the bit.
We reaffirm our focus and commitment to only the Williston Basin Bakken, Three Forks and Red River plays.
We believe that we are able to create value via strategic acreage acquisitions and convert that value or portion thereof into production by utilizing experienced industry partners specializing in the specific areas of interest. We have targeted specific prospects and began drilling for crude oil in the Williston Basin region in the fourth fiscal quarter of 2007.
As an exploration company, our business strategy is to identify and exploit the crude oil producing Bakken and Three Forks formation. We intend to take advantage of our expertise in aggressive land acquisition to pursue exploration and development projects as a non-operating working interest partner, participating in drilling activities primarily on a heads-up basis proportionate to our working interest. Our business does not depend upon any intellectual property, licenses or other proprietary property unique to our company, but instead revolves around our ability to acquire mineral rights and participate in drilling activities by virtue of our ownership of such rights and through the relationships we have developed with our operating partners.
We believe our competitive advantage lies in our ability to acquire property in the Williston Basin in a nimble and efficient fashion. We historically have acquired properties by purchasing individual or small groups of leases directly from mineral owners or from landmen or lease brokers, as well as purchasing lease packages in identified project areas controlled by specific operators. We continue to utilize a variety of methods to acquire properties, and are increasingly focusing our efforts on acquiring properties subject to specific drilling projects or included in permitted or drilling spacing units.
We are focused on maintaining a low overhead structure. We believe we are in a position to most efficiently exploit and identify high production crude oil and natural gas properties due to our unique non-operator model through which we are able to diversify our risk and participate in the evolution of technology by the collective expertise of those operators with which we partner. We intend to continue to carefully pursue the acquisition of properties that fit our profile.
Reserves
We completed our initial reservoir engineering calculations in the first fiscal quarter of 2008 and recently completed our most current reservoir engineering calculation as of December 31, 2010. Based on o
ur independent reservoir engineering firm’s calculation of proved undeveloped reserves as of December 31, 2009, approximately 22%
of our
proved undeveloped reserves were converted to proved developed reserves during 2010.
Based on the results of our December 31, 2010 reserve analysis, our proved reserves increased approximately 158% during 2010 primarily as a result of increased drilling activity involving our acreage and our acquisition of acreage subject to
specific drilling projects or included in permitted or drilling spacing units
. We incurred approximately $
124 million
of capital expenditures for drilling activities during the year ended December 31, 2010, all of which directly contributed to the increase in our proved developed reserves.
No other expenditures materially contributed to the development of proved developed reserves in 2010.
We expect that our proved undeveloped reserves will continue to be converted to proved developed producing reserves as additional wells are drilled including our acreage. We do not have any material amounts of proved undeveloped reserves that have remained undeveloped for five years or more.
At year-end, we had developed approximately 15% of our Bakken and Three Forks prospective acreage. At year end we had 10,748 net acres under the bit, for a total of approximately 31,974 net acres or 23% of our prospective Bakken and Three Forks position which consisted of both developed acreage and net acres under the bit. The value of our reserves is calculated by determining the present value of estimated future revenues to be generated from the production of our proved reserves, net of estimated lease operating expenses, production taxes and future development costs. All of our proved reserves are located in North Dakota and Montana.
Preparation of our reserve report is outlined in our Sarbanes-Oxley Act Section 404 internal control procedures. Our procedures require that our reserve report be prepared by a third-party registered independent engineering firm at the end of every year based on information we provide to such engineer. We accumulate historical production data for our wells, calculate historical lease operating expenses and differentials, update working interests and net revenue interests, obtain updated authorizations for expenditure (“AFEs”) from our operations department and obtain geological and geophysical information from operators. This data is forwarded to our third-party engineering firm for review and calculation. Our Chief Executive Officer provides a final review of our reserve report and the assumptions relied upon in such report.
We have utilized Ryder Scott Company, LP (“Ryder Scott”), an independent reservoir engineering firm, as our third-party engineering firm beginning with the preparation of our December 31, 2008 reserve report. The selection of Ryder Scott is approved by our Audit Committee [annually]. Ryder Scott is one of the largest reservoir-evaluation consulting firms and evaluates crude oil and natural gas properties and independently certifies petroleum reserves quantities for various clients throughout the United States and internationally. Ryder Scott has substantial experience calculating the reserves of various other companies with operations targeting the Bakken and Three Forks formations and, as such, we believe Ryder Scott has sufficient experience to appropriately determine our reserves. Ryder Scott utilizes proprietary technology, systems and data to calculate our reserves commensurate with this experience.
The proved reserves tables below summarize our estimated proved reserves as of December 31, 2010, based upon reports prepared by Ryder Scott
.
The reports
of our estimated proved reserves in their entirety
are
based on the information we provide to them. Ryder Scott is a Colorado Registered Engineering Firm (F-1580). Our primary contact at Ryder Scott is James L. Baird, Senior Vice President. Mr. Baird is a State of Colorado Licensed Professional Engineer (License #41521).
In accordance with applicable requirements of the SEC, estimates of our net proved reserves and future net revenues are made using average prices at the beginning of each month in the 12-month period prior to the date of such reserve estimates and are held constant throughout the life of the properties (except to the extent a contract specifically provides for escalation).
The reserves set forth in the Ryder Scott report for the properties are estimated by performance methods or analogy. In general, reserves attributable to producing wells and/or reservoirs are estimated by performance methods such as decline curve analysis which utilizes extrapolations of historical production data. Reserves attributable to non-producing and undeveloped reserves included in our report are estimated by analogy. The estimates of the reserves, future production, and income attributable to properties are prepared using the economic software package Aries for Windows, a copyrighted program of Halliburton.
To estimate economically recoverable crude oil and natural gas reserves and related future net cash flows, we consider many factors and assumptions including, but not limited to, the use of reservoir parameters derived from geological, geophysical and engineering data which cannot be measured directly, economic criteria based on current costs and SEC pricing requirements, and forecasts of future of production rates. Under the SEC regulations 210.4-10(a)(22)(v) and (26), proved reserves must be demonstrated to be economically producible based on existing economic conditions including the prices and costs at which economic producibility from a reservoir is to be determined as of the effective date of the report. With respect to the property interests we own, production and well tests from examined wells, normal direct costs of operating the wells or leases, other costs such as transportation and/or processing fees, production taxes, recompletion and development costs and product prices are based on the SEC regulations, geological maps, well logs, core analyses, and pressure measurements.
The reserve data set forth in the Ryder Scott report represents only estimates
, and should not be construed as being exact quantities. They may or may not be actually recovered, and if recovered, the actual revenues and costs could be more or less than the estimated amounts. Moreover, estimates of reserves may increase or decrease as a result of future operations.
Reservoir engineering is a subjective process of estimating underground accumulations of crude oil and natural gas that cannot be measured in an exact manner. There are numerous uncertainties inherent in estimating crude oil and natural gas reserves and their estimated values, including many factors beyond our control. The accuracy of any reserve estimate is a function of the quality of available data and of engineering and geologic interpretation and judgment. As a result, estimates of different engineers, including those used by us, may vary. In addition, estimates of reserves are subject to revision based upon actual production, results of future development and exploration activities, prevailing crude oil and natural gas prices, operating costs and other factors. The revisions may be material. Accordingly, reserve estimates are often different from the quantities of crude oil and natural gas that are ultimately recovered and are highly dependent upon the accuracy of the assumptions upon which they are based. Our estimated net proved reserves, included in our SEC filings, have not been filed with or included in reports to any other federal agency. See “Item 1A. Risk Factors – Estimates of crude oil and natural gas reserves that we make may be inaccurate and our actual revenues may be lower than our financial projections.”
Ryder Scott prepared two separate reserve reports valuing our proved reserves at December 31, 2010. The reports value only our proved reserves and do not value our probable reserves or our possible reserves. Both tables account for straight-line pricing of crude oil and natural gas at constant prices over the expected life of our wells. Our “SEC Pricing Proved Reserves” were calculated using crude oil and natural gas price parameters established by current SEC guidelines and Financial Accounting Standard Board guidance. Our “Sensitivity Case Proved Reserves” were calculated using higher assumed values for crude oil and natural gas selected at our discretion to better reflect our current expectations because the SEC pricing parameters are significantly lower than current market prices and our average realized price per barrel at December 31, 2010.
The Sensitivity Case Proved Reserves table provided below is intended to illustrate reserve sensitivities to the commodity prices.
The Sensitivity Case using the constant average price of $88.91 represents the February 25, 2010 closing WTI crude oil price less our weighted average deduction from spot price for the fiscal year end of 2010.
The “Sensitivity Case Proved Reserves” should not be confused with “SEC Pricing Proved Reserves” as outlined below and does not comply with SEC pricing assumptions, but does comply with all other definitions.
SEC Pricing Proved Reserves
(
1
)
|
Crude Oil
(barrels)
|
Natural Gas
(cubic feet)
|
Total
(BOE)
(
2
)
|
Pre-Tax
PV10% Value
(
3
)
|
|||||||||||||
|
PDP Properties
|
4,857,272 | 2,698,401 | 5,307,006 | $ | 160,307,688 | |||||||||||
|
PDNP Properties
|
983,474 | 815,026 | 1,119,312 | $ | 30,829,818 | |||||||||||
|
PUD Properties
|
8,152,953 | 6,936,538 | 9,309,043 | $ | 104,374,016 | |||||||||||
|
Total Proved Properties:
|
13,993,699 | 10,449,965 | 15,735,361 | $ | 295,511,522 | |||||||||||
Sensitivity Case Proved Reserves
(
1
)
|
Crude Oil
(barrels)
|
Natural Gas
(cubic feet)
|
Total
(BOE)
(
2)
|
Pre-Tax
PV10% Value
(
3
)
|
|||||||||||||
|
PDP Properties
|
4,960,356 | 2,746,567 | 5,418,117 | $ | 206,160,609 | |||||||||||
|
PDNP Properties
|
1,001,776 | 829,924 | 1,140,096 | $ | 39,942,594 | |||||||||||
|
PUD Properties
|
8,269,365 | 7,035,487 | 9,441,946 | $ | 172,593,734 | |||||||||||
|
Total Proved Properties:
|
14,231,497 | 10,611,978 | 16,000,159 | $ | 418,696,937 | |||||||||||
|
|
(1)
|
The SEC Pricing Proved Reserves table above values crude oil and natural gas reserve quantities and related discounted future net cash flows as of December 31, 2010 assuming a constant realized price of $70.46 per barrel of crude oil and a constant realized price of $5.04 per Mcf of natural gas.
The Sensitivity Case Proved Reserves table above values crude oil and natural gas reserve quantities and related discounted future net cash flows as of December 31, 2010 assuming a constant realized price of $88.91 per barrel of crude oil and a constant realized price of $5.04 per Mcf of natural gas, which prices are consistent with prior SEC pricing methodology.
The Sensitivity Case Proved Reserves table is intended to illustrate reserve sensitivities to the commodity prices. The “Sensitivity Case Proved Reserves” should not be confused with “SEC Pricing Proved Reserves” as outlined above and does not comply with SEC pricing assumptions, but does comply with all other definitions.
Based on Ryder Scott’s reserve analysis, the increase in the Sensitivity Case reserves is primarily attributed to the positive correlation between higher prices per barrel and longer well lives.
The values presented in both tables above were calculated by Ryder Scott.
|
|
|
(2)
|
B
OE are computed based on a conversion ratio of one BOE for each barrel of crude oil and one BOE for every 6,000 cubic feet (i.e., 6 Mcf) of natural gas.
|
|
|
(3)
|
Pre-tax PV10% may be considered a non-GAAP financial measure as defined by the SEC and is derived from the standardized measure of discounted future net cash flows, which is the most directly comparable standardized financial measure. Pre-tax PV10% is computed on the same basis as the standardized measure of discounted future net cash flows but without deducting future income taxes. We believe Pre-tax PV10% is a useful measure for investors for evaluating the relative monetary significance of our crude oil and natural gas properties. We further believe investors may utilize our Pre-tax PV10% as a basis for comparison of the relative size and value of our reserves to other companies because many factors that are unique to each individual company impact the amount of future income taxes to be paid. Our management uses this measure when assessing the potential return on investment related to our crude oil and natural gas properties and acquisitions. However, Pre-tax PV10% is not a substitute for the standardized measure of discounted future net cash flows. Our Pre-tax PV10% and the standardized measure of discounted future net cash flows do not purport to present the fair value of our crude oil and natural gas reserves.
The pre-tax PV10% values of our Total Proved Properties in the tables above differ from the tables reconciling our pre-tax PV10% value on the following page of this Annual Report due to rounding differences in certain tables of Ryder Scott’s reserve report.
|
Our December 31, 2010 reserve report includes an assessment of proven undeveloped locations for only Bakken and Three Forks prospective acreage, which includes approximately 85% of our Bakken and Three Forks undeveloped acreage. As of December 31, 2010, our Bakken and Three Forks prospective acreage position will allow us to drill approximately 876 net wells based on six net wells per 960-acre spacing units.
The tables above assume prices and costs discounted using an annual discount rate of 10% without future escalation, without giving effect to non-property related expenses such as general and administrative expenses, debt service and depreciation, depletion and amortization, or federal income taxes. The “Pre-tax PV10%” values of our proved reserves presented in the foregoing tables may be considered a non-GAAP financial measure as defined by the SEC.
The following table reconciles the pre-tax PV10% value of our SEC Pricing Proved Reserves to the standardized measure of discounted future net cash flows.
|
SEC Pricing Proved Reserves
Standardized Measure Reconciliation
|
||||
|
Pre-tax Present Value of estimated future net revenues (Pre-tax PV10%)
|
$ | 295,511,531 | ||
|
Future income taxes, discounted at 10%
|
(84,898,740 | ) | ||
|
Standardized measure of discounted future net cash flows
|
$ | 210,612,791 | ||
The following table reconciles the pre-tax PV10% value of our Sensitivity Case Proved Reserves to the standardized measure of discounted future net cash flows.
|
Sensitivity
Case Proved Reserves
Standardized Measure Reconciliation
|
||||
|
Pre-tax Present Value of estimated future net revenues (Pre-tax PV10%)
|
$ | 418,696,969 | ||
|
Future income taxes, discounted at 10%
|
(131,118,861 | ) | ||
|
Standardized measure of discounted future net cash flows
|
$ | 287,578,108 | ||
Uncertainties are inherent in estimating quantities of proved reserves, including many risk factors beyond our control. Reserve engineering is a subjective process of estimating subsurface accumulations of crude oil and natural gas that cannot be measured in an exact manner. As a result, estimates of proved reserves may vary depending upon the engineer valuing the reserves. Further, our actual realized price for our crude oil and natural gas is not likely to average the pricing parameters used to calculate our proved reserves. As such, the crude oil and natural gas quantities and the value of those commodities ultimately recovered from our properties will vary from reserve estimates.
Additional discussion of our proved reserves is set forth under the heading “Supplemental Oil and Gas Information” to our financial statements included later in this report.
Recent Developments
During 2010, we continued to focus our operations on acquiring leaseholds and drilling exploratory and developmental wells in the Williston Basin. We acquired an aggregate of 56,858 additional net mineral acres during 2010, for an average cost of $1,043 per net acre, primarily in Billings, Burke, Divide, Dunn, Golden Valley, McKenzie, Mountrail, Williams, and Stark Counties, of North Dakota but also in Richland, and Roosevelt of Montana. During 2010, we participated in the completion of 170 gross wells with a 100% success rate in the Bakken and Three Forks formations. As of December 31, 2010, our principal assets included approximately 145,220 net acres located in the Williston Basin region of the northern United States and approximately 7,950 net acres located in Yates County, New York, as more fully described under the heading “Properties – Leasehold Properties” in Item 2 of this report.
During 2010, we continued to acquire interests in crude oil, gas and mineral leases with the intention of increasing our acreage positions in desired prospects of the Williston Basin. A complete discussion of our significant acquisitions during the past fiscal year is included under the heading “Properties – Recent Acreage Acquisitions” in Item 2 of this report.
Production Methods
We primarily engage in crude oil and natural gas exploration and production by participating on a “heads-up” basis alongside third-party interests in wells drilled and completed in spacing units that include our acreage. We typically depend on drilling partners to propose, permit and initiate the drilling of wells. Prior to commencing drilling, our partners are required to provide all owners of crude oil, natural gas and mineral interests within the designated spacing unit the opportunity to participate in the drilling costs and revenues of the well to the extent of their pro-rata share of such interest within the spacing unit. In 2010, we participated in the drilling of all new wells that included any of our acreage. We will assess each drilling opportunity on a case-by-case basis going forward and participate in wells that we expect to meet our return thresholds based upon our estimates of ultimate recoverable crude oil and natural gas, expertise of the operator and completed well cost from each project, as well as other factors. At the present time we expect to participate pursuant to our working interest in substantially all, if not all, of the wells proposed to us.
We do not manage our commodities marketing activities internally, but our operating partners generally market and sell crude oil and natural gas produced from wells in which we have an interest. Our operating partners coordinate the transportation of our crude oil production from our wells to appropriate pipelines pursuant to arrangements that such partners negotiate and maintain with various parties purchasing the production. We understand that our partners generally sell our production to a variety of purchasers at prevailing market prices under separately negotiated short-term contracts. The price at which production is sold generally is tied to the spot market for crude oil. Williston Basin Light Sweet Crude from the Bakken source rock is generally 41-42 API crude oil and is readily accepted into the pipeline infrastructure. The weighted average differential reported to us by our producers during 2010 was $8.97 per barrel below New York Mercantile Exchange (NYMEX) pricing.
Our weighted average differential was approximately $10.09 during the fourth quarter of 2010. This differential represents the imbedded transportation costs in moving the crude oil from wellhead to refinery and will fluctuate based on availability of pipeline, rail and other transportation methods.
Competition
The crude oil and natural gas industry is intensely competitive, and we compete with numerous other crude oil and natural gas exploration and production companies. Some of these companies have substantially greater resources than we have. Not only do they explore for and produce crude oil and natural gas, but also many carry on midstream and refining operations and market petroleum and other products on a regional, national or worldwide basis. The operations of other companies may be able to pay more for exploratory prospects and productive crude oil and natural gas properties. They may also have more resources to define, evaluate, bid for and purchase a greater number of properties and prospects than our financial or human resources permit.
Our larger or integrated competitors may have the resources to be better able to absorb the burden of existing, and any changes to federal, state, and local laws and regulations more easily than we can, which would adversely affect our competitive position. Our ability to discover reserves and acquire additional properties in the future will be dependent upon our ability and resources to evaluate and select suitable properties and to consummate transactions in this highly competitive environment. In addition, we may be at a disadvantage in producing crude oil and natural gas properties and bidding for exploratory prospects, because we have fewer financial and human resources than other companies in our industry. Should a larger and better financed company decide to directly compete with us, and be successful in its efforts, our business could be adversely affected.
Marketing and Customers
The market for crude oil and natural gas that we will produce depends on factors beyond our control, including the extent of domestic production and imports of crude oil and natural gas, the proximity and capacity of natural gas pipelines and other transportation facilities, demand for crude oil and natural gas, the marketing of competitive fuels and the effects of state and federal regulation. The crude oil and natural gas industry also competes with other industries in supplying the energy and fuel requirements of industrial, commercial and individual consumers.
Our crude oil production is expected to be sold at prices tied to the spot crude oil markets. Our natural gas production is expected to be sold under short-term contracts and priced based on first of the month index prices or on daily spot market prices. We rely on our operating partners to market and sell our production. Our operating partners involve a variety of exploration and production companies, from large publicly-traded companies to small, privately-owned companies. We do not believe the loss of any single operator would have a material adverse effect on our company as a whole.
Principal Agreements Affecting Our Ordinary Business
We do not own any physical real estate, but, instead, our acreage is comprised of leasehold interests subject to the terms and provisions of lease agreements that provide our company the right to drill and maintain wells in specific geographic areas. All lease arrangements that comprise our acreage positions are established using industry-standard terms that have been established and used in the crude oil and natural gas industry for many years. Some of our leases may be acquired from other parties that obtained the original leasehold interest prior to our acquisition of the leasehold interest.
In general, our lease agreements stipulate five year terms. Bonuses and royalty rates are negotiated on a case-by-case basis consistent with industry standard pricing. Once a well is drilled and production established, the well is considered “held by production,” meaning the lease continues as long as crude oil is being produced. Other locations within the drilling unit created for a well may also be drilled at any time with no time limit as long as the lease is held by production. Given the current pace of drilling in the Bakken play at this time, we do not believe lease expiration issues will materially affect our North Dakota position.
Governmental Regulation and Environmental Matters
Our operations are subject to various rules, regulations and limitations impacting the crude oil and natural gas exploration and production industry as whole.
Regulation of Crude Oil and Natural Gas Production
Our crude oil and natural gas exploration, production and related operations, when developed, are subject to extensive rules and regulations promulgated by federal, state, tribal and local authorities and agencies. For example, North Dakota and Montana require permits for drilling operations, drilling bonds and reports concerning operations and impose other requirements relating to the exploration and production of crude oil and natural gas. Such states may also have statutes or regulations addressing conservation matters, including provisions for the unitization or pooling of crude oil and natural gas properties, the establishment of maximum rates of production from wells, and the regulation of spacing, plugging and abandonment of such wells. Failure to comply with any such rules and regulations can result in substantial penalties. The regulatory burden on the crude oil and natural gas industry will most likely increase our cost of doing business and may affect our profitability. Although we believe we are currently in substantial compliance with all applicable laws and regulations, because such rules and regulations are frequently amended or reinterpreted, we are unable to predict the future cost or impact of complying with such laws. Significant expenditures may be required to comply with governmental laws and regulations and may have a material adverse effect on our financial condition and results of operations.
Environmental Matters
Our operations and properties are subject to extensive and changing federal, state and local laws and regulations relating to environmental protection, including the generation, storage, handling, emission, transportation and discharge of materials into the environment, and relating to safety and health. The recent trend in environmental legislation and regulation generally is toward stricter standards, and this trend will likely continue. These laws and regulations may:
|
|
▪
|
require the acquisition of a permit or other authorization before construction or drilling commences and for certain other activities;
|
|
|
▪
|
limit or prohibit construction, drilling and other activities on certain lands lying within wilderness and other protected areas; and
|
|
|
▪
|
impose substantial liabilities for pollution resulting from its operations.
|
The permits required for our operations may be subject to revocation, modification and renewal by issuing authorities. Governmental authorities have the power to enforce their regulations, and violations are subject to fines or injunctions, or both. In the opinion of management, we are in substantial compliance with current applicable environmental laws and regulations, and have no material commitments for capital expenditures to comply with existing environmental requirements. Nevertheless, changes in existing environmental laws and regulations or in interpretations thereof could have a significant impact on our company, as well as the crude oil and natural gas industry in general.
The Comprehensive Environmental, Response, Compensation, and Liability Act (“CERCLA”) and comparable state statutes impose strict, joint and several liability on owners and operators of sites and on persons who disposed of or arranged for the disposal of “hazardous substances” found at such sites. It is not uncommon for the neighboring landowners and other third parties to file claims for personal injury and property damage allegedly caused by the hazardous substances released into the environment. The Federal Resource Conservation and Recovery Act (“RCRA”) and comparable state statutes govern the disposal of “solid waste” and “hazardous waste” and authorize the imposition of substantial fines and penalties for noncompliance. Although CERCLA currently excludes petroleum from its definition of “hazardous substance,” state laws affecting our operations may impose clean-up liability relating to petroleum and petroleum related products. In addition, although RCRA classifies certain crude oil field wastes as “non-hazardous,” such exploration and production wastes could be reclassified as hazardous wastes thereby making such wastes subject to more stringent handling and disposal requirements.
The Endangered Species Act (“ESA”) seeks to ensure that activities do not jeopardize endangered or threatened animal, fish and plant species, nor destroy or modify the critical habitat of such species. Under ESA, exploration and production operations, as well as actions by federal agencies, may not significantly impair or jeopardize the species or its habitat. ESA provides for criminal penalties for willful violations of the Act. Other statutes that provide protection to animal and plant species and that may apply to our operations include, but are not necessarily limited to, the Fish and Wildlife Coordination Act, the Fishery Conservation and Management Act, the Migratory Bird Treaty Act and the National Historic Preservation Act. Although we believe that our operations will be in substantial compliance with such statutes, any change in these statutes or any reclassification of a species as endangered could subject our company to significant expenses to modify our operations or could force our company to discontinue certain operations altogether.
Climate Change
Significant studies and research have been devoted to climate change and global warming, and climate change has developed into a major political issue in the United States and globally. Certain research suggests that greenhouse gas emissions contribute to climate change and pose a threat to the environment. Recent scientific research and political debate has focused in part on carbon dioxide and methane incidental to crude oil and natural gas exploration and production. Many states and the federal government have enacted legislation directed at controlling greenhouse gas emissions, and future legislation and regulation could impose additional restrictions or requirements in connection with our drilling and production activities and favor use of alternative energy sources, which could increase operating costs and demand for crude oil products. As such, our business could be materially adversely affected by domestic and international legislation targeted at controlling climate change.
Employees
We currently have 11 full time employees. Our Chief Executive Officer and Chairman, Michael L. Reger, and our President, Ryan R. Gilbertson, are responsible for all material policy-making decisions. They are assisted in the implementation of our company’s business by our Chief Financial Officer and our Chief Operating Officer and General Counsel. All employees have entered into written employment agreements. As drilling production activities continue to increase, we may hire additional technical or administrative personnel as appropriate. We do not expect a significant change in the number of full time employees over the next 12 months based upon our currently-projected drilling plan. We are using and will continue to use the services of independent consultants and contractors to perform various professional services, particularly in the area of land services and reservoir engineering. We believe that this use of third-party service providers enhances our ability to contain general and administrative expenses.
Office Locations
Our executive offices are located at 315 Manitoba Avenue, Suite 200, Wayzata, Minnesota 55391. Our office space consists of 3,044 square feet leased pursuant to a five-year office lease agreement that commenced in February 2008. We believe our current office space is sufficient to meet our needs for the foreseeable future.
Financial Information about Segments and Geographic Areas
We have not segregated our operations into geographic areas given the fact that all of our production activities occur within the Williston Basin.
Available Information – Reports to Security Holders
Our website address is
www.northernoil.com
. We make available on this website under “Investor Relations,” free of charge, our annual reports on Form 10-K (formerly Form 10-KSB), quarterly reports on Form 10-Q (formerly Form 10-QSB), current reports on Form 8-K and amendments to those reports as soon as reasonably practicable after we electronically file those materials with, or furnish those materials to, the SEC. These filings are also available to the public at the SEC’s Public Reference Room at 100 F Street, NE, Room 1580, Washington, DC 20549. The public may obtain information on the operation of the Public Reference Room by calling the SEC at 1-800-SEC-0330. Electronic filings with the SEC are also available on the SEC internet website at
www.sec.gov
.
We have also posted to our website our Audit Committee Charter, Compensation Committee Charter, Nominating Committee Charter and our Code of Business Conduct and Ethics, in addition to all pertinent company contact information.
Risks Related to our Business
The possibility of a global financial crisis may significantly impact our business and financial condition for the foreseeable future.
The credit crisis and related turmoil in the global financial system may adversely impact our business and our financial condition, and we may face challenges if conditions in the financial markets do not improve. Our ability to access the capital markets may be restricted at a time when we would like, or need, to raise financing, which could have a material negative impact on our flexibility to react to changing economic and business conditions. The economic situation could have a material negative impact on operators upon whom we are dependent for drilling our wells, our lenders or customers, causing them to fail to meet their obligations to us. Additionally, market conditions could have a material negative impact on our crude oil hedging arrangements if our counterparties are unable to perform their obligations or seek bankruptcy protection. We believe we will have sufficient capital to fund our 2011 drilling program. However, additional capital would be required in the event that we accelerate our drilling program or that crude oil prices decline substantially resulting in significantly lower revenues.
We may be unable to obtain additional capital that we will require to implement our business plan, which could restrict our ability to grow.
We expect that our cash position, unused credit facility and revenues from crude oil and natural gas sales will be sufficient to fund our 2011 drilling program. However, those funds may not be sufficient to fund both our continuing operations and our planned growth. We may require additional capital to continue to grow our business via acquisitions and to further expand our exploration and development programs. We may be unable to obtain additional capital if and when required.
Future acquisitions and future exploration, development, production and marketing activities, as well as our administrative requirements (such as salaries, insurance expenses and general overhead expenses, as well as legal compliance costs and accounting expenses) will require a substantial amount of capital and cash flow.
We may pursue sources of additional capital through various financing transactions or arrangements, including joint venturing of projects, debt financing, equity financing or other means. We may not be successful in identifying suitable financing transactions in the time period required or at all, and we may not obtain the capital we require by other means. If we do not succeed in raising additional capital, our resources may not be sufficient to fund our planned expansion of operations in the future.
Any additional capital raised through the sale of equity may dilute the ownership percentage of our shareholders. Raising any such capital could also result in a decrease in the fair market value of our equity securities because our assets would be owned by a larger pool of outstanding equity. The terms of securities we issue in future capital transactions may be more favorable to our new investors, and may include preferences, superior voting rights and the issuance of other derivative securities. In addition, we have granted and will continue to grant equity incentive awards under our equity incentive plans, which may have a further dilutive effect.
Our ability to obtain financing, if and when necessary, may be impaired by such factors as the capital markets (both generally and in the crude oil and natural gas industry in particular), our limited operating history, the location of our crude oil and natural gas properties and prices of crude oil and natural gas on the commodities markets (which will impact the amount of asset-based financing available to us) and the departure of key employees. Further, if crude oil or natural gas prices on the commodities markets decline, our revenues will likely decrease and such decreased revenues may increase our requirements for capital. If the amount of capital we are able to raise from financing activities, together with our revenues from operations, is not sufficient to satisfy our capital needs (even to the extent that we reduce our operations), we may be required to cease our operations, divest our assets at unattractive prices or obtain financing on unattractive terms.
We may incur substantial costs in pursuing future capital financing, including investment banking fees, legal fees, accounting fees, securities law compliance fees, printing and distribution expenses and other costs. We may also be required to recognize non-cash expenses in connection with certain securities we may issue, which may adversely impact our financial condition.
We have a limited operating history, and may not be successful in sustaining profitable business operations.
We have a limited operating history. Our business operations must be considered in light of the risks, expenses and difficulties frequently encountered in establishing a business in the crude oil and natural gas industries. We first generated revenues from operations in the fiscal year ended December 31, 2008. There can be no assurance that our business operations will prove to be successful in the long-term. Our future operating results will depend on many factors, including:
|
|
▪
|
our ability to raise adequate working capital;
|
|
|
▪
|
success of our development and exploration;
|
|
|
▪
|
demand for natural gas and crude oil;
|
|
|
▪
|
the level of our competition;
|
|
|
▪
|
our ability to attract and maintain key management and employees; and
|
|
|
▪
|
our ability to efficiently explore, develop and produce sufficient quantities of marketable natural gas or crude oil in a highly competitive and speculative environment while maintaining quality and controlling costs.
|
To sustain profitable operations in the future, we must, alone or with others, successfully manage the factors stated above, as well as continue to develop ways to enhance our production efforts. Despite our best efforts, we may not be successful in our exploration or development efforts, or obtain required regulatory approvals. There is a possibility that some of our wells may never produce natural gas or crude oil.
We are highly dependent on Michael Reger, our Chief Executive Officer, Chairman and Director, and Ryan Gilbertson, President and Director. The loss of either of them, upon whose knowledge, leadership and technical expertise we rely, would harm our ability to execute our business plan.
Our success depends heavily upon the continued contributions of Michael Reger and Ryan Gilbertson, whose knowledge, leadership and technical expertise would be difficult to replace, and on our ability to retain and attract experienced engineers, geoscientists and other technical and professional staff. If we were to lose their services, our ability to execute our business plan would be harmed and we may be forced to cease operations until such time as we are able to suitably replace them. Mr. Reger and Mr. Gilbertson have entered into employment agreements with our company, however, they may terminate their employment with our company at any time.
Our lack of diversification will increase the risk of an investment in our company, and our financial condition and results of operations may deteriorate if we fail to diversify.
Our business focus is on the crude oil and natural gas industry in a limited number of properties, primarily in Montana and North Dakota. Larger companies have the ability to manage their risk by diversification. However, we lack diversification, in terms of both the nature and geographic scope of our business. As a result, we will likely be impacted more acutely by factors affecting our industry or the regions in which we operate than we would if our business were more diversified, enhancing our risk profile. If we do not diversify our operations, our financial condition and results of operations could deteriorate.
Strategic relationships upon which we may rely are subject to change, which may diminish our ability to conduct our operations.
Our ability to successfully acquire additional properties, to increase our reserves, to participate in drilling opportunities and to identify and enter into commercial arrangements with customers will depend on developing and maintaining close working relationships with industry participants and our ability to select and evaluate suitable properties and to consummate transactions in a highly competitive environment. These realities are subject to change and our inability to maintain close working relationships with industry participants or continue to acquire suitable property may impair our ability to execute our business plan.
To continue to develop our business, we will endeavor to use the business relationships of our management to enter into strategic relationships, which may take the form of joint ventures with other private parties and contractual arrangements with other crude oil and natural gas companies, including those that supply equipment and other resources that we will use in our business. We may not be able to establish these strategic relationships, or if established, we may not be able to maintain them. In addition, the dynamics of our relationships with strategic partners may require us to incur expenses or undertake activities we would not otherwise be inclined to in order to fulfill our obligations to these partners or maintain our relationships. If sufficient strategic relationships are not established and maintained, our business prospects, financial condition and results of operations may be materially adversely affected.
As a non-operator, our development of successful operations relies extensively on third-parties who, if not successful, could have a material adverse affect on our results of operation.
We have only participated in wells operated by third-parties. Our current ability to develop successful business operations depends on the success of our consultants and drilling partners. As a result, we do not control the timing or success of the development, exploitation, production and exploration activities relating to our leasehold interests. If our consultants and drilling partners are not successful in such activities relating to our leasehold interests, or are unable or unwilling to perform, our financial condition and results of operation would be materially adversely affected.
Competition in obtaining rights to explore and develop crude oil and natural gas reserves and to market our production may impair our business.
The crude oil and natural gas industry is highly competitive. Other crude oil and natural gas companies may seek to acquire crude oil and natural gas leases and other properties and services we will need to operate our business in the areas in which we expect to operate. This competition is increasingly intense as prices of crude oil and natural gas on the commodities markets have risen in recent years. Additionally, other companies engaged in our line of business may compete with us from time to time in obtaining capital from investors. Competitors include larger companies which, in particular, may have access to greater resources, may be more successful in the recruitment and retention of qualified employees and may conduct their own refining and petroleum marketing operations, which may give them a competitive advantage. In addition, actual or potential competitors may be strengthened through the acquisition of additional assets and interests. If we are unable to compete effectively or respond adequately to competitive pressures, our results of operation and financial condition may be materially adversely affected.
We may not be able to effectively manage our growth, which may harm our profitability.
Our strategy envisions the expansion of our business. If we fail to effectively manage our growth, our financial results could be adversely affected. Growth may place a strain on our management systems and resources. We must continue to refine and expand our business capabilities, our systems and processes and our access to financing sources. As we grow, we must continue to hire, train, supervise and manage new employees. We cannot assure that we will be able to:
|
|
▪
|
meet our capital needs;
|
|
|
▪
|
expand our systems effectively or efficiently or in a timely manner;
|
|
|
▪
|
allocate our human resources optimally;
|
|
|
▪
|
identify and hire qualified employees or retain valued employees; or
|
|
|
▪
|
incorporate effectively the components of any business that we may acquire in our effort to achieve growth.
|
If we are unable to manage our growth, our financial condition and results of operations may be materially adversely affected.
Our hedging activities could result in financial losses or could reduce our net income, which may adversely affect your investment in our common stock.
We generally expect to enter into swap arrangements from time-to-time to hedge our expected production depending on reserves and market conditions. While intended to reduce the effects of volatile crude oil and natural gas prices, such transactions may limit our potential gains and increase our potential losses if crude oil and natural gas prices were to rise substantially over the price established by the hedge. In addition, such transactions may expose us to the risk of loss in certain circumstances, including instances in which:
|
|
▪
|
our production is less than expected;
|
|
|
▪
|
there is a widening of price differentials between delivery points for our production and the delivery point assumed in the hedge arrangement; or
|
|
|
▪
|
the counterparties to our hedging agreements fail to perform under the contracts.
|
Risks Related To Our Industry
Crude oil and natural gas prices are very volatile. A protracted period of depressed crude oil and natural gas prices may adversely affect our business, financial condition, results of operations or cash flows.
The crude oil and natural gas markets are very volatile, and we cannot predict future crude oil and natural gas prices. The price we receive for our crude oil and natural gas production heavily influences our revenue, profitability, access to capital and future rate of growth. The prices we receive for our production and the levels of our production depend on numerous factors beyond our control. These factors include, but are not limited to, the following:
|
|
▪
|
changes in global supply and demand for crude oil and natural gas;
|
|
|
▪
|
the actions of the Organization of Petroleum Exporting Countries;
|
|
|
▪
|
the price and quantity of imports of foreign crude oil and natural gas;
|
|
|
▪
|
political and economic conditions, including embargoes, in crude oil-producing countries or affecting other crude oil-producing activity;
|
|
|
▪
|
the level of global crude oil and natural gas exploration and production activity;
|
|
|
▪
|
the level of global crude oil and natural gas inventories;
|
|
|
▪
|
weather conditions;
|
|
|
▪
|
technological advances affecting energy consumption;
|
|
|
▪
|
domestic and foreign governmental regulations;
|
|
|
▪
|
proximity and capacity of crude oil and natural gas pipelines and other transportation facilities;
|
|
|
▪
|
the price and availability of competitors’ supplies of crude oil and natural gas in captive market areas; and
|
|
|
▪
|
the price and availability of alternative fuels.
|
The recent worldwide financial and credit crisis reduced the availability of liquidity and credit to fund the continuation and expansion of industrial business operations worldwide. The shortage of liquidity and credit combined with recent substantial losses in worldwide equity markets led to a worldwide economic recession. The slowdown in economic activity caused by future similar recessions could reduce worldwide demand for energy resulting in lower crude oil and natural gas prices and restrict our access to liquidity and credit.
Lower crude oil and natural gas prices may not only decrease our revenues on a per unit basis but also may reduce the amount of crude oil and natural gas that we can produce economically and therefore potentially lower our reserve bookings. A substantial or extended decline in crude oil or natural gas prices may result in impairments of our proved crude oil and natural gas properties and may materially and adversely affect our future business, financial condition, results of operations, liquidity or ability to finance planned capital expenditures. To the extent commodity prices received from production are insufficient to fund planned capital expenditures, we will be required to reduce spending or borrow to cover any such shortfall. Lower crude oil and natural gas prices may also reduce the amount of our borrowing base under our credit agreement, which is determined at the discretion of the lenders based on the collateral value of our proved reserves that have been mortgaged to the lenders, and is subject to regular redeterminations, as well as special redeterminations described in the credit agreement.
Drilling for and producing crude oil and natural gas are high risk activities with many uncertainties.
Our future success will depend on the success of our development, exploitation, production and exploration activities. Our crude oil and natural gas exploration and production activities are subject to numerous risks beyond our control, including the risk that drilling will not result in commercially viable crude oil or natural gas production. Our decisions to purchase, explore, develop or otherwise exploit prospects or properties will depend in part on the evaluation of data obtained through geophysical and geological analyses, production data and engineering studies, the results of which are often inconclusive or subject to varying interpretations. Our cost of drilling, completing and operating wells is often uncertain before drilling commences. Overruns in budgeted expenditures are common risks that can make a particular project uneconomical. Further, many factors may curtail, delay or cancel drilling, including the following:
|
|
▪
|
delays imposed by or resulting from compliance with regulatory requirements;
|
|
|
▪
|
pressure or irregularities in geological formations;
|
|
|
▪
|
shortages of or delays in obtaining qualified personnel or equipment, including drilling rigs and CO2;
|
|
|
▪
|
equipment failures or accidents; and
|
|
|
▪
|
adverse weather conditions, such as freezing temperatures, hurricanes and storms.
|
The presence of one or a combination of these factors at our properties could adversely affect our business, financial condition or results of operations.
Our business of exploring for crude oil and natural gas is risky and may not be commercially successful, and the advanced technologies we use cannot eliminate exploration risk.
Our future success will depend on the success of our exploratory drilling program. Crude oil and natural gas exploration involves a high degree of risk. These risks are more acute in the early stages of exploration. Our ability to produce revenue and our resulting financial performance are significantly affected by the prices we receive for crude oil and natural gas produced from wells on our acreage. Especially in recent years, the prices at which crude oil and natural gas trade in the open market have experienced significant volatility and will likely continue to fluctuate in the foreseeable future due to a variety of influences including, but not limited to, the following:
|
|
▪
|
domestic and foreign demand for crude oil and natural gas by both refineries and end users;
|
|
|
▪
|
the introduction of alternative forms of fuel to replace or compete with crude oil and natural gas;
|
|
|
▪
|
domestic and foreign reserves and supply of crude oil and natural gas;
|
|
|
▪
|
competitive measures implemented by our competitors and domestic and foreign governmental bodies;
|
|
|
▪
|
political climates in nations that traditionally produce and export significant quantities of crude oil and natural gas (including military and other conflicts in the Middle East and surrounding geographic region) and regulations and tariffs imposed by exporting and importing nations;
|
|
|
▪
|
weather conditions; and
|
|
|
▪
|
domestic and foreign economic volatility and stability.
|
Our expenditures on exploration may not result in new discoveries of crude oil or natural gas in commercially viable quantities. Projecting the costs of implementing an exploratory drilling program is difficult due to the inherent uncertainties of drilling in unknown formations, the costs associated with encountering various drilling conditions, such as over-pressured zones and tools lost in the hole, and changes in drilling plans and locations as a result of prior exploratory wells or additional seismic data and interpretations thereof.
Even when used and properly interpreted, three-dimensional (3-D) seismic data and visualization techniques only assist geoscientists in identifying subsurface structures and hydrocarbon indicators. Such data and techniques do not allow the interpreter to know conclusively if hydrocarbons are present or economically producible. In addition, the use of three-dimensional (3-D) seismic data becomes less reliable when used at increasing depths. We could incur losses as a result of expenditures on unsuccessful wells. If exploration costs exceed our estimates, or if our exploration efforts do not produce results which meet our expectations, our exploration efforts may not be commercially successful, which could adversely impact our ability to generate revenues from our operations.
We may not be able to develop crude oil and natural gas reserves on an economically viable basis, and our reserves and production may decline as a result.
If we continue to succeed in discovering crude oil and/or natural gas reserves, we cannot assure that these reserves will be capable of production levels we project or in sufficient quantities to be commercially viable. On a long-term basis, our viability depends on our ability to find or acquire, develop and commercially produce additional crude oil and natural gas reserves. Without the addition of reserves through acquisition, exploration or development activities, our reserves and production will decline over time as reserves are produced. Our future reserves will depend not only on our ability to develop then-existing properties, but also on our ability to identify and acquire additional suitable producing properties or prospects, to find markets for the crude oil and natural gas we develop and to effectively distribute our production into our markets.
Future crude oil and natural gas exploration may involve unprofitable efforts, not only from dry wells, but from wells that are productive but do not produce sufficient net revenues to return a profit after drilling, operating and other costs. Completion of a well does not assure a profit on the investment or recovery of drilling, completion and operating costs. In addition, drilling hazards or environmental damage could greatly increase the cost of operations, and various field operating conditions may adversely affect the production from successful wells. These conditions include delays in obtaining governmental approvals or consents, shut-downs of connected wells resulting from extreme weather conditions, problems in storage and distribution and adverse geological and mechanical conditions. While we will endeavor to effectively manage these conditions, we cannot be assured of doing so optimally, and we will not be able to eliminate them completely in any case. Therefore, these conditions could diminish our revenue and cash flow levels and result in the impairment of our crude oil and natural gas interests.
Estimates of crude oil and natural gas reserves that we make may be inaccurate and our actual revenues may be lower than our financial projections.
We make estimates of crude oil and natural gas reserves, upon which we base our financial projections. We make these reserve estimates using various assumptions, including assumptions as to crude oil and natural gas prices, drilling and operating expenses, capital expenditures, taxes and availability of funds. Some of these assumptions are inherently subjective, and the accuracy of our reserve estimates relies in part on the ability of our management team, engineers and other advisors to make accurate assumptions. Economic factors beyond our control, such as crude oil and natural gas prices and interest rates, will also impact the value of our reserves.
Determining the amount of crude oil and natural gas recoverable from various formations where we have exploration and production activities involves great uncertainty. For example, in 2006, the North Dakota Industrial Commission published an article that identified three different estimates of generated crude oil recoverable from the Bakken formation. An organic chemist estimated 50% of the reserves in the Bakken formation to be technically recoverable, a crude oil company estimated a recovery factor of 18%, and values presented in the North Dakota Industrial Commission Oil and Gas Hearings ranged from 3 to 10%.
The process of estimating crude oil and natural gas reserves is complex and will require us to use significant decisions and assumptions in the evaluation of available geological, geophysical, engineering and economic data for each property. As a result, our reserve estimates will be inherently imprecise. Actual future production, crude oil and natural gas prices, revenues, taxes, development expenditures, operating expenses and quantities of recoverable crude oil and natural gas reserves may vary substantially from those we estimate. If actual production results vary substantially from our reserve estimates, this could materially reduce our revenues and result in the impairment of our crude oil and natural gas interests.
Drilling new wells could result in new liabilities, which could endanger our interests in our properties and assets.
There are risks associated with the drilling of crude oil and natural gas wells, including encountering unexpected formations or pressures, premature declines of reservoirs, blow-outs, craterings, sour gas releases, fires and spills, among others. The occurrence of any of these events could significantly reduce our revenues or cause substantial losses, impairing our future operating results. We may become subject to liability for pollution, blow-outs or other hazards. We seek to maintain insurance with respect to these hazards; however, such insurance has limitations on liability that may not be sufficient to cover the full extent of such liabilities. The payment of such liabilities could reduce the funds available to us or could, in an extreme case, result in a total loss of our properties and assets. Moreover, we may not be able to maintain adequate insurance in the future at rates that are considered reasonable. Crude oil and natural gas production operations are also subject to all the risks typically associated with such operations, including premature decline of reservoirs and the invasion of water into producing formations.
Decommissioning costs are unknown and may be substantial. Unplanned costs could divert resources from other projects.
We may become responsible for costs associated with abandoning and reclaiming wells, facilities and pipelines which we use for production of crude oil and natural gas reserves. Abandonment and reclamation of these facilities and the costs associated therewith is often referred to as “decommissioning.” We accrue a liability for decommissioning costs associated with our wells, but have not established any cash reserve account for these potential costs in respect of any of our properties. If decommissioning is required before economic depletion of our properties or if our estimates of the costs of decommissioning exceed the value of the reserves remaining at any particular time to cover such decommissioning costs, we may have to draw on funds from other sources to satisfy such costs. The use of other funds to satisfy such decommissioning costs could impair our ability to focus capital investment in other areas of our business.
We may have difficulty distributing our production, which could harm our financial condition.
In order to sell the crude oil and natural gas that we are able to produce, the operators of our wells may have to make arrangements for storage and distribution to the market. We will rely on local infrastructure and the availability of transportation for storage and shipment of our products, but infrastructure development and storage and transportation facilities may be insufficient for our needs at commercially acceptable terms in the localities in which we operate. This situation could be particularly problematic to the extent that our operations are conducted in remote areas that are difficult to access, such as areas that are distant from shipping and/or pipeline facilities. These factors may affect our ability to explore and develop properties and to store and transport our crude oil and natural gas production and may increase our expenses.
Furthermore, weather conditions or natural disasters, actions by companies doing business in one or more of the areas in which we will operate, or labor disputes may impair the distribution of crude oil and/or natural gas and in turn diminish our financial condition or ability to maintain our operations.
Environmental risks may adversely affect our business.
All phases of the crude oil and natural gas business present environmental risks and hazards and are subject to environmental regulation pursuant to a variety of federal, state and municipal laws and regulations. Environmental legislation provides for, among other things, restrictions and prohibitions on spills, releases or emissions of various substances produced in association with crude oil and natural gas operations. The legislation also requires that wells and facility sites be operated, maintained, abandoned and reclaimed to the satisfaction of applicable regulatory authorities. Compliance with such legislation can require significant expenditures, and a breach may result in the imposition of fines and penalties, some of which may be material. Environmental legislation is evolving in a manner we expect may result in stricter standards and enforcement, larger fines and liability and potentially increased capital expenditures and operating costs. The discharge of crude oil, natural gas or other pollutants into the air, soil or water may give rise to liabilities to governments and third parties and may require us to incur costs to remedy such discharge. The application of environmental laws to our business may cause us to curtail our production or increase the costs of our production, development or exploration activities.
Our business will suffer if we cannot obtain or maintain necessary licenses.
Our operations require licenses, permits and in some cases renewals of licenses and permits from various governmental authorities. Our ability to obtain, sustain or renew such licenses and permits on acceptable terms is subject to change in regulations and policies and to the discretion of the applicable governmental authorities, among other factors. Our inability to obtain, or our loss of or denial of extension of, any of these licenses or permits could hamper our ability to produce revenues from our operations or otherwise materially adversely affect our financial condition and results of operations.
Challenges to our properties may impact our financial condition.
Title to crude oil and natural gas interests is often not capable of conclusive determination without incurring substantial expense. While we intend to make appropriate inquiries into the title of properties and other development rights we acquire, title defects may exist. In addition, we may be unable to obtain adequate insurance for title defects, on a commercially reasonable basis or at all. If title defects do exist, it is possible that we may lose all or a portion of our right, title and interests in and to the properties to which the title defects relate. If our property rights are reduced, our ability to conduct our exploration, development and production activities may be impaired. To mitigate title problems, common industry practice is to obtain a Title Opinion from a qualified crude oil and natural gas attorney prior to the drilling operations of a well.
We will rely on technology to conduct our business, and our technology could become ineffective or obsolete.
We rely on technology, including geographic and seismic analysis techniques and economic models, to develop our reserve estimates and to guide our exploration, development and production activities. We will be required to continually enhance and update our technology to maintain its efficacy and to avoid obsolescence. The costs of doing so may be substantial and may be higher than the costs that we anticipate for technology maintenance and development. If we are unable to maintain the efficacy of our technology, our ability to manage our business and to compete may be impaired. Further, even if we are able to maintain technical effectiveness, our technology may not be the most efficient means of reaching our objectives, in which case we may incur higher operating costs than we would were our technology more efficient.
Risks Related to our Common Stock
The market price of our common stock is, and is likely to continue to be, highly volatile and subject to wide fluctuations.
The market price of our common stock is likely to continue to be highly volatile and could be subject to wide fluctuations in response to a number of factors, some of which are beyond our control, including:
|
|
▪
|
dilution caused by our issuance of additional shares of common stock and other forms of equity securities, which we expect to make in connection with future capital financings to fund our operations and growth, to attract and retain valuable personnel and in connection with future strategic partnerships with other companies;
|
|
|
▪
|
announcements of new acquisitions, reserve discoveries or other business initiatives by us or our competitors;
|
|
|
▪
|
our ability to take advantage of new acquisitions, reserve discoveries or other business initiatives;
|
|
|
▪
|
fluctuations in revenue from our crude oil and natural gas business as new reserves come to market;
|
|
|
▪
|
changes in the market for crude oil and natural gas commodities and/or in the capital markets generally;
|
|
|
▪
|
changes in the demand for crude oil and natural gas, including changes resulting from economic conditions, governmental regulation or the introduction or expansion of alternative fuels;
|
|
|
▪
|
quarterly variations in our revenues and operating expenses;
|
|
|
▪
|
changes in the valuation of similarly situated companies, both in our industry and in other industries;
|
|
|
▪
|
changes in analysts’ estimates affecting our company, our competitors and/or our industry;
|
|
|
▪
|
changes in the accounting methods used in or otherwise affecting our industry;
|
|
|
▪
|
additions and departures of key personnel;
|
|
|
▪
|
announcements of technological innovations or new products available to the crude oil and natural gas industry;
|
|
|
▪
|
announcements by relevant governments pertaining to incentives for alternative energy development programs;
|
|
|
▪
|
fluctuations in interest rates and the availability of capital in the capital markets; and
|
|
|
▪
|
significant sales of our common stock, including sales by selling shareholders following the registration of shares under a prospectus.
|
Some of these and other factors are largely beyond our control, and the impact of these risks, singly or in the aggregate, may result in material adverse changes to the market price of our common stock and/or our results of operations and financial condition.
Our operating results may fluctuate significantly, and these fluctuations may cause the price of our common stock to decline.
Our operating results will likely vary in the future primarily as the result of fluctuations in our revenues and operating expenses, including the coming to market of crude oil and natural gas reserves that we are able to discover and develop, expenses that we incur, the prices of crude oil and natural gas in the commodities markets and other factors. If our results of operations do not meet the expectations of current or potential investors, the price of our common stock may decline.
Shareholders will experience dilution upon the exercise of options and issuance of common stock under our incentive plans.
As of December 31, 2010, we had options for 265,963 shares of common stock outstanding pursuant to our 2006 Incentive Stock Option Plan. Our 2009 Equity Incentive Plan permits us to issue up to 3,000,000 shares of our common stock either upon exercise of stock options granted under such plan or through restricted stock awards under such plan. As of December 31, 2010, we had issued 1,912,991 shares of common stock pursuant to our 2009 Equity Incentive Plan. No options have been issued under our 2009 Equity Incentive Plan. If the holders of outstanding options exercise those options or our Compensation Committee determines to grant additional stock awards under our incentive plan, shareholders may experience dilution in the net tangible book value of our common stock. Further, the sale or availability for sale of the underlying shares in the marketplace could depress our stock price.
We do not expect to pay dividends in the foreseeable future.
We do not intend to declare dividends for the foreseeable future, as we anticipate that we will reinvest any future earnings in the development and growth of our business. Therefore, investors will not receive any funds unless they sell their common stock, and shareholders may be unable to sell their shares on favorable terms or at all. Investors cannot be assured of a positive return on investment or that they will not lose the entire amount of their investment in our common stock.
We may issue additional stock without shareholder consent.
Our Board of Directors has authority, without action or vote of the shareholders, to issue all or part of our authorized but unissued shares. Additional shares may be issued in connection with future financing, acquisitions, employee stock plans, or otherwise. Any such issuance will dilute the percentage ownership of existing shareholders. We are also currently authorized to issue up to 5,000,000 shares of preferred stock. The Board of Directors can issue preferred stock in one or more series and fix the terms of such stock without shareholder approval. Preferred stock may include the right to vote as a series on particular matters, preferences as to dividends and liquidation, conversion and redemption rights and sinking fund provisions. The issuance of preferred stock could adversely affect the rights of the holders of common stock and reduce the value of the common stock. In addition, specific rights granted to holders of preferred stock could discourage, delay or prevent a transaction involving a change in control of our company, even if doing so would benefit our shareholders, and could also discourage proxy contests and make it more difficult for you and other shareholders to elect directors of your choosing and to cause us to take other corporate actions you desire.
None.
Leasehold Properties
As of December 31, 2010, our principal assets included approximately 153,170 net acres located in the northern region of the United States. Net acreage represents our percentage ownership of gross acreage. The following table summarizes our estimated gross and net developed and undeveloped acreage by prospect at December 31, 2010.
|
Developed Acreage
|
Undeveloped Acreage
|
Total Acreage
|
||||||||||||||||||||||
|
Gross
|
Net
|
Gross
|
Net
|
Gross
|
Net
|
|||||||||||||||||||
|
Bakken and Three Forks
|
272,304 | 20,851 | 264,785 | 119,365 | 537,089 | 140,216 | ||||||||||||||||||
|
Red River
|
1,600 | 374 | 5,334 | 4,630 | 6,934 | 5,004 | ||||||||||||||||||
|
Trenton/Black River, Marcellus and Queenstown-Medina
|
- | - | 7,950 | 7,950 | 7,950 | 7,950 | ||||||||||||||||||
|
Total
|
273,904 | 21,225 | 278,069 | 131,945 | 551,973 | 153,170 | ||||||||||||||||||
The following table summarizes our estimated gross and net developed and undeveloped acreage by state at December 31, 2010.
|
Developed Acreage
|
Undeveloped Acreage
|
Total Acreage
|
||||||||||||||||||||||
|
Gross
|
Net
|
Gross
|
Net
|
Gross
|
Net
|
|||||||||||||||||||
|
North Dakota
|
266,548 | 20,088 | 239,210 | 104,351 | 505,758 | 124,439 | ||||||||||||||||||
|
Montana
|
7,356 | 1,137 | 30,909 | 19,644 | 38,265 | 20,781 | ||||||||||||||||||
|
New York
|
- | - | 7,950 | 7,950 | 7,950 | 7,950 | ||||||||||||||||||
|
Total
|
273,904 | 21,225 | 278,069 | 131,945 | 551,973 | 153,170 | ||||||||||||||||||
The following table summarizes our estimated gross and net developed and undeveloped acreage by county at December 31, 2010.
|
Developed Acreage
|
Undeveloped Acreage
|
Total Acreage
|
||||||||||||||||||||||
|
Gross
|
Net
|
Gross
|
Net
|
Gross
|
Net
|
|||||||||||||||||||
|
Billings County, ND
|
1,920 | 32 | 355 | 317 | 2,275 | 349 | ||||||||||||||||||
|
Burke County, ND
|
8,320 | 979 | 27,116 | 4,892 | 35,436 | 5,871 | ||||||||||||||||||
|
Divide County, ND
|
15,996 | 1,895 | 38,277 | 6,898 | 54,273 | 8,793 | ||||||||||||||||||
|
Dunn County, ND
|
35,791 | 1,214 | 34,847 | 34,163 | 70,638 | 35,377 | ||||||||||||||||||
|
Golden Valley, ND
|
- | - | 320 | 50 | 320 | 50 | ||||||||||||||||||
|
McKenzie County, ND
|
17,356 | 787 | 42,620 | 19,785 | 59,976 | 20,572 | ||||||||||||||||||
|
Mercer County, ND
|
- | - | 5,654 | 495 | 5,654 | 495 | ||||||||||||||||||
|
Mountrail County, ND
|
162,136 | 12,344 | 59,305 | 26,041 | 221,441 | 38,385 | ||||||||||||||||||
|
Stark County, ND
|
2,560 | 116 | 5,992 | 2,041 | 8,552 | 2,157 | ||||||||||||||||||
|
Williams County, ND
|
22,469 | 2,721 | 24,724 | 9,669 | 47,193 | 12,390 | ||||||||||||||||||
|
Sheridan County, MT
|
1,600 | 374 | 5,334 | 4,630 | 6,934 | 5,004 | ||||||||||||||||||
|
Richland County, MT
|
4,480 | 431 | 18,141 | 11,846 | 22,621 | 12,277 | ||||||||||||||||||
|
Roosevelt County, MT
|
1,276 | 332 | 7,434 | 3,168 | 8,710 | 3,500 | ||||||||||||||||||
|
Yates County, NY
|
- | - | 7,950 | 7,950 | 7,950 | 7,950 | ||||||||||||||||||
Our leasehold properties set forth in the table above are more fully described as follows:
|
▪
|
Approximately 349 net acres located in Billings County, North Dakota, where we are targeting the Bakken and Three Forks formations, of which we have approximately 32 net acres determined as developed acreage. As a non-operator we face the risk of approximately 317 net acres expiring if an operator does not commence the development of operations within the agreed terms of our acquired leases. Our average expiration occurs in the third quarter of 2014.
|
|
|
▪
|
Approximately 5,871 net acres located in Burke County, North Dakota, where we are targeting the Bakken and Three Forks formations, of which we have approximately 979 net acres determined as developed acreage and 405 net acres under the bit. As a non-operator we face the risk of approximately 4,892 net acres expiring if an operator does not commence or continue the development of operations within the agreed terms of our acquired leases. Our average expiration occurs in the fourth quarter of 2012.
|
|
▪
|
Approximately 8,793 net acres located in Divide County, North Dakota, where we are targeting the Bakken and Three Forks formations, of which we have approximately 1,895 net acres determined as developed acreage and 1,125 net acres under the bit. As a non-operator we face the risk of approximately 6,898 net acres expiring if an operator does not commence or continue the development of operations within the agreed terms of our acquired leases. Our average expiration occurs in the second quarter of 2013.
|
|
▪
|
Approximately 35,377 net acres located in Dunn County, North Dakota, where we are targeting the Bakken and Three Forks formations, of which we have approximately 1,214 net acres determined as developed acreage and 2,416 net acres under the bit. As a non-operator we face the risk of approximately 34,163 net acres expiring if an operator does not commence or continue the development of operations within the agreed terms of our acquired leases. Our average expiration occurs in the first quarter of 2012.
|
|
▪
|
Approximately 50 net acres located in Golden Valley County, North Dakota, where we are targeting the Bakken and Three Forks formations, of which we have approximately zero net acres determined as developed acreage. As a non-operator we face the risk of approximately 50 net acres expiring if an operator does not commence the development of operations within the agreed terms of our acquired leases. Our average expiration occurs in the second quarter of 2013.
|
|
▪
|
Approximately 20,572 net acres located in McKenzie County, North Dakota, where we are targeting the Bakken and Three Forks formations, of which we have approximately 787 net acres determined as developed acreage and 2,198 net acres under the bit. As a non-operator we face the risk of approximately 19,785 net acres expiring if an operator does not commence or continue the development of operations within the agreed terms of our acquired leases. Our average expiration occurs in the third quarter of 2013.
|
|
▪
|
Approximately 495 net acres located in Mercer County, North Dakota, where we are targeting the Bakken and Three Forks formations, of which we have approximately zero net acres determined as developed acreage. As a non-operator we face the risk of approximately 495 net acres expiring if an operator does not commence the development of operations within the agreed terms of our acquired leases. Our average expiration occurs in the second quarter of 2013.
|
|
▪
|
Approximately 38,385 net acres located in Mountrail County, North Dakota, where we are targeting the Bakken and Three Forks formations, of which we have approximately 12,344 net acres determined as developed acreage and 2,825 net acres under the bit. As a non-operator we face the risk of approximately 26,041 net acres expiring if an operator does not commence or continue the development of operations within the agreed terms of our acquired leases. Our average expiration occurs in the second quarter of 2013.
|
|
▪
|
Approximately 2,157 net acres located in Stark County, North Dakota, where we are targeting the Bakken and Three Forks formations, of which we have approximately 116 net acres determined as developed acreage and 70 net acres under the bit. As a non-operator we face the risk of approximately 2,041 net acres expiring if an operator does not commence or continue the development of operations within the agreed terms of our acquired leases. Our average expiration occurs in the fourth quarter of 2013.
|
|
▪
|
Approximately 12,390 net acres located in Williams County, North Dakota, where we are targeting the Bakken and Three Forks formations, of which we have approximately 2,721 net acres determined as developed acreage and 972 net acres under the bit. As a non-operator we face the risk of approximately 9,669 net acres expiring if an operator does not commence or continue the development of operations within the agreed terms of our acquired leases. Our average expiration occurs in the fourth quarter of 2013.
|
|
▪
|
Approximately 5,004 net acres located in Sheridan County, North Dakota, representing a stacked pay prospect over which we have significant proprietary 3-D seismic data, of which we have approximately 374 net acres determined as developed acreage. As a non-operator we face the risk of 4,630 net acres expiring if an operator does not commence the development of operations within the agreed terms of our acquired leases. We expect all of the non-developed acreage to expire in the first quarter of 2011.
|
|
▪
|
A
pproximately
12,277
net acres located in Richland County,
Montana, where we are targeting the Bakken and Three Forks formations, of which we have approximately 431 net acres determined as developed acreage and 737 net acres under the bit. As a non-operator we face the risk of 11,846 net acres expiring if an operator does not commence or continue the development of operations within the agreed terms of our acquired leases. Our average expiration occurs in the first quarter of 2014.
|
|
▪
|
Approximately 3,500 net acres located in Roosevelt County, Montana, where we are targeting the Bakken and Three Forks formations, of which we have approximately 332 net acres determined as developed acreage. As a non-operator we face the risk of 3,168 net acres expiring if an operator does not commence the development of operations within the agreed terms of our acquired leases. Our average expiration occurs in the first quarter of 2012.
|
|
▪
|
Approximately 7,950 net acres located in the “Finger Lakes” region of Yates County, New York, where we are targeting natural gas production from the Trenton/Black River, Marcellus and Queenstown-Medina formations. Our average expiration occurs in the fourth quarter of 2011.
|
We believe the Bakken formation represents one of the most crude oil rich, rapidly developing and exciting plays in the Continental United States. We commenced the development of our Williston Basin properties in late 2007 and increased drilling activities quarter-over-quarter throughout 2008, 2009 and 2010.
Recent Acreage Acquisitions
In 2010, we acquired leasehold interests covering an aggregate of 56,858 net mineral acres in our key prospect areas. The following discussion summarizes these acquisitions.
In the fourth quarter of 2010, we acquired approximately 18,029 net mineral acres,
for an average cost of $954 per net acre,
in all of our key prospect areas in the form of both effective leases and top-leases. The acreage acquisitions involved properties spanning across the counties of Richland and Roosevelt, Montana and counties of Billings, Burke, Dunn, Golden Valley, McKenzie, Mountrail, Stark and Williams, North Dakota. We did not acquire any properties outside Montana or North Dakota during the fourth quarter of 2010. These acquisitions consisted of an average of 334 net mineral acres per transaction for an average cost of approximately $954 per net mineral acre.
We generally value acreage subject to near-term drilling activities on a lease-by-lease basis because we believe each lease’s contribution to a subject spacing unit is best assessed on that basis if development timing is sufficiently clear. Consistent with that approach, the majority of our acreage acquisitions involve properties that are “hand-picked” by us on a lease-by-lease basis for their contribution to a well expected to be spud in the near future, and the subject leases are then aggregated to complete one single closing with the transferor. As such, we generally view each acreage assignment from brokers, landmen and other parties as involving several separate acquisitions combined into one closing with the common transferor for convenience. However, in certain instances an acquisition may involve a larger number of leases presented by the transferors as a single package without negotiation on a lease-by-lease basis. In those instances, we still review each lease on a lease-by-lease basis to ensure that the package as a whole meets our acquisition criteria and drilling expectations. In December of 2010 we acquired a 50% working interest from Slawson Exploration (“Slawson”) in approximately 14,538 net acres in Richland County, Montana, as more fully described below. That acquisition accounted for approximately 12.8% of total number of net acres we acquired during 2010.
No other acquisition involved more than 10% of the total acreage we acquired during the year.
The following describes some of our larger acquisitions during the fourth quarter of 2010:
Williams and McKenzie Acreage Acquisition
In December of 2010 we acquired approximately 1,748 net acres for $2,500 per net acre in Williams and McKenzie Counties of North Dakota. All of the acreage consists of non-operated tracts that are not subject to specific exploration or development agreements. Several operators have been permitting and drilling wells in close proximity to the acreage, and we expect development of our acreage will commence in 2011.
Slawson Exploration Lambert Prospect
In December of 2010 we acquired a 50% working interest in approximately 14,538 net acres for total consideration of $1,737,483 in Richland County, Montana. Slawson will be operating the prospect and all drilling and future acquisition costs will be shared pro-rata with Slawson based upon our proportionate working interest in the prospect. This prospect is in close vicinity of Elm Coulee, and considered an extension of the Southwest Big Sky project, which is also operated by Slawson.
BLM Sale
In December of 2010 we purchased 720 net acres from the Bureau of Land Management for $875 per net acre in Richland County, Montana. The acreage lies within a selected township that recently experienced a successful test well targeting the Bakken formation, but is not subject to specific exploration or development agreements.
Miscellaneous Acreage Acquisitions
In November 2010 we purchased 506 net acres for $2,000 per net acre in a single spacing unit in McKenzie County, North Dakota. In December 2010 we purchased 506 net acres for $1,500 per net acre in a separate spacing unit in Richland County, Montana. As of December 31, 2010, the McKenzie County, North Dakota well was awaiting completion and the Richland County, Montana well was spud.
In December of 2010 we purchased 322 net acres for $1,775 per net acre in Mountrail County, North Dakota, of which 235 net acres is estimated to spud during the first quarter of 2011.
Developed and Undeveloped Acreage
As of December 31, 2010, approximately 21,225 net acres had been developed and approximately 131,945 net acres were undeveloped. The following table summarizes our estimated gross and net developed and undeveloped acreage by state at December 31, 2010. Net acreage represents our percentage ownership of gross acreage.
|
Developed Acreage
|
Undeveloped Acreage
|
Total Acreage
|
||||||||||||||||||||||
|
Gross
|
Net
|
Gross
|
Net
|
Gross
|
Net
|
|||||||||||||||||||
|
North Dakota
|
266,5478 | 20,088 | 239,210 | 104,351 | 505,758 | 124,439 | ||||||||||||||||||
|
Montana
|
7,356 | 1,137 | 30,909 | 19,644 | 38,265 | 20,781 | ||||||||||||||||||
|
New York
|
- | - | 7,950 | 7,950 | 7,950 | 7,950 | ||||||||||||||||||
|
Total
|
273,904 | 21,225 | 278,069 | 131,945 | 551,973 | 153,170 | ||||||||||||||||||
As a non-operator, we are subject to lease expirations if an operator does not commence the development of operations within the agreed terms of our leases. All of our leases for undeveloped acreage summarized in the table below will expire at the end of their respective primary terms, unless we renew the existing leases, establish commercial production from the acreage or some other “savings clause” is exercised. We expect to establish production from most of our acreage prior to expiration of the applicable lease terms however, there can be no guarantee we can do so. The approximate expiration of our gross and net acres which are subject to expire between 2011 and 2015 and thereafter, are set forth below:
|
Acres Expiring
|
||||||||
|
Year Ended
|
Gross
|
Net
|
||||||
|
December 31, 2011
|
52,313 | 37,395 | ||||||
|
December 31, 2012
|
110,557 | 40,184 | ||||||
|
December 31, 2013
|
78,977 | 35,072 | ||||||
|
December 31, 2014
|
25,567 | 14,347 | ||||||
|
December 31, 2015 and thereafter
|
10,655 | 4,947 | ||||||
|
Total
|
278,069 | 131,945 | ||||||
During 2010, leases expired in Sheridan County, Montana covering approximately 17,457 net acres and leases expired in Yates County, New York covering approximately 2,050 net acres. We believe that the expired acreage was not material to our capital deployed in these prospects. No leases that expired during 2010 comprised a majority of the acreage in any 640-acre spacing unit. From our inception to December 31, 2010, we spent approximately $115 million for acreage acquisitions. The Sheridan County, Montana expired acreage represented less than 1% of our total investment in acreage acquisitions from inception through December 31, 2010. The Yates County, New York expired acreage represented less than 1% of our total investment in acreage acquisitions from inception through December 31, 2010. In addition, none of the acreage was included when calculating our reserves at December 31, 2008, 2009 or 2010. Given our core focus on the Bakken and Three Forks formations in key areas of Montana and North Dakota, we determined it was not in our best interest to re-lease any expiring acreage. As such, we do not consider the expiration of acreage during 2010 to be material.
Unproved Properties
We had 11.69 net wells drilling and completing as of December 31, 2010. All properties that are not classified as proven properties are considered unproved properties and, thus, the costs associated with such properties are not subject to depletion. Once a property is classified as proven, all associated acreage and drilling costs are subject to depletion.
We historically have acquired our properties by purchasing individual or small groups of leases directly from mineral owners or from landmen or lease brokers, which leases historically have not been subject to specified drilling projects, and by purchasing lease packages in identified project areas controlled by specific operators. We generally participate in drilling activities on a heads up basis by electing whether to participate in each well on a well-by-well basis at the time wells are proposed for drilling, with the exception of three defined drilling projects with Slawson.
As of December 31, 2010, we were participating in three defined drilling projects with Slawson covering an aggregate of 9,390 net acres controlled by us. The Windsor project area includes approximately 3,323 net acres controlled by us, primarily located in Mountrail and surrounding counties of North Dakota. The Anvil project includes approximately 3,750 net acres controlled by us in Roosevelt and Sheridan Counties of Montana and Williams County, North Dakota. The South West Big Sky project includes approximately 2,317 total net acres controlled by us in Richland County, Montana.
We believe that the majority of our unproved costs will become subject to depletion within the next five years by proving up reserves relating to its acreage through exploration and development activities, by impairing the acreage that will expire before we can explore or develop it further or by determining that further exploration and development activity will not occur. The timing by which all other properties will become subject to depletion will be dependent upon the timing of future drilling activities and delineation of our reserves.
Production History
The following table presents information about our produced crude oil and natural gas volumes during each fiscal quarter in 2010 and the year ended December 31, 2010. As of December 31, 2010, we were selling crude oil and natural gas from a total of 311 gross wells. As of December 31, 2009, we were selling crude oil and natural gas from a total of 179 gross wells, all of which were located within the Williston Basin. As of December 31, 2008, we were selling crude oil and natural gas from a total of 36 gross wells. All data presented below is derived from accrued revenue and production volumes for the relevant period indicated.
|
Year Ended December 31,
|
||||||||||||
|
2010
|
2009
|
2008
|
||||||||||
|
Net Production:
|
||||||||||||
|
Crude Oil (Bbl)
|
849,845 | 274,328 | 50,880 | |||||||||
|
Natural Gas (Mcf)
|
234,411 | 47,305 | 3,969 | |||||||||
|
Barrel of Crude Oil Equivalent (BOE)
|
888,914 | 282,212 | 51,542 | |||||||||
|
Average Sales Prices:
|
||||||||||||
|
Crude Oil (per Bbl)
|
$ | 70.65 | $ | 60.45 | $ | 75.63 | ||||||
|
Effect of crude oil hedges on average price (per Bbl)
|
(0.55 | ) | (3.60 | ) | 15.31 | |||||||
|
Crude Oil net of hedging (per Bbl)
|
70.09 | 56.85 | 90.94 | |||||||||
|
Natural Gas and other liquids (per Mcf)
|
4.76 | 3.81 | 8.19 | |||||||||
|
Effect of natural gas hedges on average price (per Mcf)
|
– | – | – | |||||||||
|
Natural gas and other liquids net of hedging (per Mcf)
|
4.76 | 3.81 | 8.19 | |||||||||
|
Average Production Costs:
|
||||||||||||
|
Crude Oil (per Bbl)
|
$ | 3.78 | $ | 2.67 | $ | 1.37 | ||||||
|
Natural Gas (per Mcf)
|
0.24 | 0.19 | 0.32 | |||||||||
|
Barrel of Oil Equivalent (BOE)
|
3.68 | 2.63 | 1.38 | |||||||||
Depletion of crude oil and natural gas properties
Our depletion expense is driven by many factors including certain exploration costs involved in the development of producing reserves, production levels and estimates of proved reserve quantities and future developmental costs. The following table presents our depletion expenses during 2010, 2009 and 2008.
|
Year Ended December 31,
|
||||||||||||
|
2010
|
2009
|
2008
(As Adjusted)
(1
)
|
||||||||||
|
Depletion of crude oil and natural gas properties
|
$ | 16,884,563 | $ | 4,250,983 | $ | 677,915 | ||||||
|
(1)
|
See Note 2 to the financial statements accompanying this report.
|
Drilling and Other Exploratory and Development Activities
The following tables summarize gross and net productive and non productive crude oil wells by state at each of December 31, 2010, 2009 and 2008. A net well represents our percentage ownership of a gross well. No wells have been permitted or drilled on any of our Yates County, New York acreage. The following tables do not include wells that were awaiting completion, in the process of completion or awaiting flowback subsequent to fracture stimulation. We have not participated in any wells solely targeting natural gas reserves. We have classified all wells drilled to-date targeting the Bakken and Three Forks formations as development wells, meaning we have not drilled any exploratory wells in North Dakota. As of December 31, 2010, we have had 100% success rate in our North Dakota and Montana Bakken and Three Forks wells. We participated in the productive exploratory and developmental wells in North Dakota and Montana during the periods indicated below.
North Dakota
|
Year Ended December 31,
|
||||||||||||||||||||||||
|
2010
|
2009
|
2008
|
||||||||||||||||||||||
|
Gross
|
Net
|
Gross
|
Net
|
Gross
|
Net
|
|||||||||||||||||||
|
Development Wells:
|
||||||||||||||||||||||||
|
Natural gas
|
– | – | – | – | – | – | ||||||||||||||||||
|
Crude oil
|
165 | 15.73 | 139 | 6.63 | 29 | 1.38 | ||||||||||||||||||
|
Non-productive
|
– | – | – | – | – | – | ||||||||||||||||||
|
Total Development Wells
|
165 | 15.73 | 139 | 6.63 | 29 | 1.38 | ||||||||||||||||||
Montana
|
Year Ended December 31,
|
||||||||||||||||||||||||
|
2010
|
2009
|
2008
|
||||||||||||||||||||||
|
Gross
|
Net
|
Gross
|
Net
|
Gross
|
Net
|
|||||||||||||||||||
|
Exploratory Wells:
|
||||||||||||||||||||||||
|
Natural gas
|
– | – | – | – | – | – | ||||||||||||||||||
|
Crude oil
|
2 | 0.44 | 1 | 0.23 | 2 | 0.5 | ||||||||||||||||||
|
Non-productive
|
– | – | – | – | – | – | ||||||||||||||||||
|
Total Exploratory Wells
|
2 | 0.44 | 1 | 0.23 | 2 | 0.5 | ||||||||||||||||||
|
Development Wells:
|
||||||||||||||||||||||||
|
Natural gas
|
– | – | – | – | – | – | ||||||||||||||||||
|
Crude oil
|
3 | 0.68 | 5 | 0.23 | 1 | 0.7 | ||||||||||||||||||
|
Non-productive
|
– | – | – | – | – | – | ||||||||||||||||||
|
Total Development Wells
|
3 | 0.68 | 5 | 0.23 | 1 | 0.7 | ||||||||||||||||||
|
Total Productive Exploratory and Development Wells
|
5 | 1.12 | 6 | 0.46 | 3 | 0.12 | ||||||||||||||||||
The following table summarizes our cumulative gross and net productive crude oil wells by state at each of December 31, 2010, 2009 and 2008.
|
Year Ended December 31,
|
||||||||||||||||||||||||
|
2010
|
2009
|
2008
|
||||||||||||||||||||||
|
Gross
|
Net
|
Gross
|
Net
|
Gross
|
Net
|
|||||||||||||||||||
|
North Dakota
|
300 | 23.90 | 170 | 8.17 | 34 | 1.54 | ||||||||||||||||||
|
Montana
|
11 | 2.13 | 9 | 1.02 | 2 | 0.50 | ||||||||||||||||||
|
Total
|
311 | 26.03 | 179 | 9.19 | 36 | 2.04 | ||||||||||||||||||
As of December 31, 2010, we had 47 Bakken or Three Forks wells drilling in the Williston Basin, representing an aggregate of 4.38 net wells. We also had 57 Bakken or Three Forks wells in the Williston Basin awaiting completion, in the process of completion or awaiting flowback subsequent to fracture stimulation, representing an aggregate of 7.31 net wells.
Research and Development
We do not anticipate performing any significant product research and development under our plan of operation.
Reserves
We completed our most recent reservoir engineering calculation as of December 31, 2010. Tables summarizing the results of our most recent reserve report are included under the heading “Business – Reserves” in Item 1 of this report. A complete discussion of our proved reserves is set forth in “Supplemental Oil and Gas Information” to our financial statements included later in this report.
Delivery Commitments
We do not currently have any delivery commitments for product obtained from our wells.
On August 23, 2010, plaintiff Donald Rensch filed a three count shareholder derivative action in the United States District Court for the District of Minnesota against our company as nominal defendant, Michael L. Reger, Ryan R. Gilbertson, James R. Sankovitz and Chad D. Winter, James Randall Reger, James Russell Reger, Weldon W. Gilbertson, Douglas M. Polinsky, Joseph A. Geraci, II and Voyager Oil & Gas, Inc. (“Voyager”). The complaint alleges breach of fiduciary duty of loyalty and usurping of corporate opportunities by Messrs. M. Reger, Gilbertson, Sankovitz and Winter; asserts allegations against Messrs. James Randall Reger, Weldon W. Gilbertson, James Russell Reger, Douglas M. Polinsky and Joseph A. Geraci, II of aiding and abetting our officers in breaching their fiduciary duties and usurping of corporate opportunities in connection with the formation, capitalization, and operation of Plains Energy (Voyager’s predecessor); and asserts a claim against Voyager for tortious interference with a prospective business relationship. The plaintiff seeks injunctive relief and damages, including imposing on Voyager and all of its assets a constructive trust for our company’s benefit. We believe that each of the above claims lacks merit and intend to strongly defend our company and each of our current and/or former officers and directors in connection with this lawsuit. A motion to dismiss the lawsuit in the United States District Court for the District of Minnesota was filed on September 15, 2010. A hearing on the motion to dismiss was held on February 23, 2011. As of March 1, 2011, the Court had not issued an order concerning the motion to dismiss.
As of March 1, 2011, our company was a party to one litigation claim arising in the ordinary course of business and seeking the quieting of title for a leasehold interest acquired from a third party.
Our company is subject to litigation claims and governmental and regulatory proceedings arising in the ordinary course of business. Our management believes that all litigation matters in which we are involved are not likely to have a material adverse effect on our financial position, cash flows or results of operations.
Market Information
Our common stock commenced trading on the AMEX on March 26, 2008 under the symbol “NOG.”
The high and low sales prices for shares of common stock of our company for each quarter during 2009 and 2010 are set forth below.
|
Sales Price
|
||||||||
|
High
|
Low
|
|||||||
|
Fiscal Year Ended December 31, 2010
|
||||||||
|
First Quarter
|
$ | 15.85 | $ | 10.95 | ||||
|
Second Quarter
|
17.59 | 12.37 | ||||||
|
Third Quarter
|
16.94 | 12.31 | ||||||
|
Fourth Quarter
|
27.87 | 17.41 | ||||||
|
Fiscal Year Ended December 31, 2009
|
||||||||
|
First Quarter
|
$ | 4.24 | $ | 2.01 | ||||
|
Second Quarter
|
8.89 | 3.40 | ||||||
|
Third Quarter
|
8.44 | 4.74 | ||||||
|
Fourth Quarter
|
12.66 | 7.65 | ||||||
The closing price for our common stock on the NYSE Amex Equities Market on March 1, 2011 was $32.05 per share.
Comparison Chart
The following information in this Item 5 of this Annual Report on Form 10-K is not deemed to be “soliciting material” or to be “filed” with the SEC or subject to Regulation 14A or 14C under the Securities Exchange Act of 1934 or to the liabilities of Section 18 of the Securities Exchange Act of 1934, and will not be deemed to be incorporated by reference into any filing under the Securities Act of 1933 or the Securities Exchange Act of 1934, except to the extent we specifically incorporate it by reference into such a filing.
The following graph compares the 44-month cumulative total shareholder returns since completion of our reverse merger on April 13, 2007 of Northern Oil and Gas, Inc., and the cumulative total returns of Standard & Poor’s Composite 500 Index and the Amex Oil Index for the same period. This graph assumes $100 was invested in the stock or the Index on April 13, 2007 and also assumes the reinvestment of dividends. We have not included any graph for any period prior to April 13, 2007, because there was no active trading in our common stock prior to April 13, 2007 and, as such, data is not available for any period prior to such date.
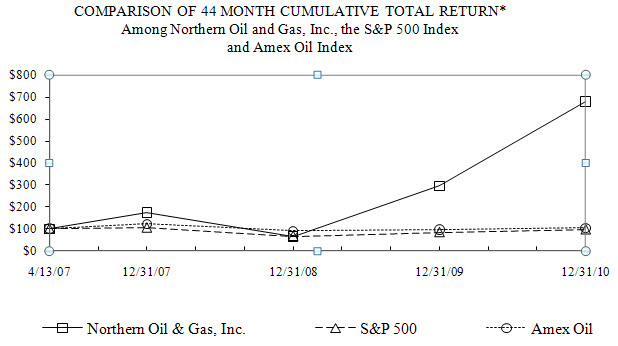
* The following table sets forth the total returns utilized to generate the foregoing graph.
|
4/13/2007
|
12/31/2007
|
12/31/2008
|
12/31/2009
|
12/31/2010
|
||||||||||||||||
|
Northern Oil and Gas, Inc. (NOG)
|
$ | 100.00 | $ | 173.75 | $ | 65.00 | $ | 296.00 | $ | 680.25 | ||||||||||
|
Standard & Poor’s Composite 500 Index
|
100.00 | 104.82 | 66.04 | 83.52 | 96.10 | |||||||||||||||
|
Amex Oil Index
|
100.00 | 120.91 | 89.24 | 96.00 | 103.40 | |||||||||||||||
Holders
As of March 1, 2011, we had 63,103,424 shares of our common stock outstanding, held by approximately 395 shareholders of record. The number of record holders does not necessarily bear any relationship to the number of beneficial owners of our common stock.
Dividends
The payment of dividends is subject to the discretion of our Board of Directors and will depend, among other things, upon our earnings, our capital requirements, our financial condition, and other relevant factors. We have not paid or declared any dividends upon our common stock since our inception and, by reason of our present financial status and our contemplated financial requirements, do not anticipate paying any dividends upon our common stock in the foreseeable future. We intend to reinvest any earnings in the development and expansion of our business. Any cash dividends in the future to common shareholders will be payable when, as and if declared by our Board of Directors or our Compensation Committee, based upon either the Board’s or the Committee’s assessment of:
|
|
▪
|
our financial condition and performance;
|
|
|
▪
|
earnings;
|
|
|
▪
|
need for funds;
|
|
|
▪
|
capital requirements;
|
|
|
▪
|
prior claims of preferred stock to the extent issued and outstanding; and
|
|
|
▪
|
other factors, including income tax consequences, restrictions and any applicable laws.
|
There can be no assurance, therefore, that any dividends on the common stock will ever be paid.
Recent Sales of Unregistered Securities
None.
| Fiscal Years | ||||||||||||||||||||
|
2010
|
2009
|
2008
|
2007
|
2006
(
1
)(
2
)
|
||||||||||||||||
|
(As Adjusted)*
|
||||||||||||||||||||
|
Statements of Income Information:
|
||||||||||||||||||||
|
Revenues
|
||||||||||||||||||||
|
Oil and Gas Sales
|
$ | 59,488,284 | $ | 15,171,824 | $ | 3,542,994 | $ | – | $ | – | ||||||||||
|
Gain (Loss) on Settled Derivatives
|
(469,607 | ) | (624,541 | ) | 778,885 | – | – | |||||||||||||
|
Mark-to-Market of Derivative Instruments
|
(14,545,477 | ) | (363,414 | ) | – | – | ||||||||||||||
|
Other Revenue
|
85,900 | 37,630 | – | – | – | |||||||||||||||
|
Total Revenues
|
$ | 44,559,100 | $ | 14,221,499 | $ | 4,321,879 | $ | – | $ | – | ||||||||||
|
Operating Expenses
|
||||||||||||||||||||
|
Production Expenses
|
$ | 3,288,482 | $ | 754,976 | $ | 70,954 | $ | – | $ | – | ||||||||||
|
Production Taxes
|
5,477,975 | 1,300,373 | 203,182 | – | – | |||||||||||||||
|
General and Administrative Expense
|
7,204,442 | 3,686,330 | 2,091,289 | 4,509,743 | 76,374 | |||||||||||||||
|
Depletion Oil and Gas Properties
|
16,884,563 | 4,250,983 | 677,915 | – | – | |||||||||||||||
|
Depreciation and Amortization
|
176,595 | 91,794 | 67,060 | 3,446 | – | |||||||||||||||
|
Accretion of Discount on Asset Retirement Obligations
|
21,755 | 8,082 | 1,030 | – | – | |||||||||||||||
|
Total Expenses
|
$ | 33,053,812 | $ | 10,092,538 | $ | 3,111,430 | $ | 4,513,189 | $ | 76,374 | ||||||||||
|
Income (Loss) from Operations
|
$ | 11,505,288 | $ | 4,128,961 | $ | 1,210,449 | $ | (4,513,189 | ) | $ | (76,374 | ) | ||||||||
|
Other (Expense) Income
|
(168,988 | ) | 135,991 | 383,891 | 207,896 | 267 | ||||||||||||||
|
Income (Loss) Before Income Taxes
|
$ | 11,336,300 | $ | 4,264,952 | $ | 1,594,340 | $ | (4,305,293 | ) | $ | (76,107 | ) | ||||||||
|
Income Tax Provision (Benefit)
|
4,419,000 | 1,466,000 | (830,000 | ) | – | – | ||||||||||||||
|
Net Income (Loss)
|
$ | 6,917,300 | $ | 2,798,952 | $ | 2,424,340 | $ | (4,305,293 | ) | $ | (76,107 | ) | ||||||||
|
Net Income (Loss) Per Common Share – Basic
|
$ | 0.14 | $ | 0.08 | $ | 0.08 | $ | (0.18 | ) | $ | (0.01 | ) | ||||||||
|
Net Income (Loss) Per Common Share – Diluted
|
$ | 0.14 | $ | 0.08 | $ | 0.07 | $ | (0.18 | ) | $ | (0.01 | ) | ||||||||
|
Weighted Average Shares Outstanding – Basic
|
50,387,203 | 36,705,267 | 31,920,747 | 23,667,119 | 18,000,000 | |||||||||||||||
|
Weighted Average Shares Outstanding - Diluted
|
50,778,245 | 36,877,070 | 32,653,552 | 23,667,119 | 18,000,000 | |||||||||||||||
|
Balance Sheet Information:
|
||||||||||||||||||||
|
Total Assets
|
$ | 509,693,965 | $ | 135,594,968 | $ | 54,520,399 | $ | 18,131,464 | $ | 1,105,935 | ||||||||||
|
Total Liabilities
|
$ | 74,334,483 | $ | 12,035,518 | $ | 4,991,336 | $ | 224,247 | $ | 1,143,067 | ||||||||||
|
Shareholders’ Equity (Deficit)
|
$ | 435,359,482 | $ | 123,559,450 | $ | 49,529,063 | $ | 17,907,217 | $ | (37,132 | ) | |||||||||
|
Statement of Cashflow Information:
|
||||||||||||||||||||
|
Net cash provided by (used for) operating activities
|
$ | 73,307,220 | $ | 9,812,910 | $ | 2,506,492 | $ | (491,509 | ) | $ | (38,532 | ) | ||||||||
|
Net cash provided by (used for) investing activities
|
$ | (207,893,450 | ) | $ | (71,848,701 | ) | $ | (40,357,962 | ) | $ | (5,078,758 | ) | $ | (255,000 | ) | |||||
|
Net cash provided by (used for) financing activities
|
$ | 280,463,559 | $ | 67,488,447 | $ | 28,519,526 | $ | 14,832,992 | $ | 1,143,467 | ||||||||||
*See Note 2
to the financial statements accompanying this report.
|
(1)
|
From inception on October 5, 2006 through December 31, 2006.
|
|
(2)
|
Derived from historical financial statements of Kentex Petroleum, Inc., our company’s predecessor company, as presented in our annual report on Form 10-KSB for the fiscal year ended December 31, 2006.
|
In the third quarter of 2009, we changed our method of accounting for drilling costs from the accrual of drilling costs at the time drilling commenced for a well to recording the costs when amounts are invoiced by operators. Recording drilling costs when the invoices are received from operators is deemed preferable as it better represents our actual drilling costs. The recording of drilling costs in this method also is consistent with other companies in the crude oil and natural gas industry. The change decreased Depletion Expense by $512,794, increased Income Tax Provision by $206,000, and increased Net Income by $306,794 or $0.01 per share on a diluted basis for the nine months ended September 30, 2009. The effect of the change on the three months ended September 30, 2009 was to decrease Depletion Expense by $261,870, increase Income Tax Provision by $105,000 and to Increase Net Income by $156,870 or $0.00 per share on a diluted basis.
The following discussion should be read in conjunction with the “Selected Financial Data” in Item 6 and the Financial Statements and Accompanying Notes appearing elsewhere in this report.
Overview and Outlook
We are a crude oil and natural gas exploration and production company. Our properties are located in Montana, North Dakota and New York. Our corporate strategy is to build shareholder value through the development and acquisition of crude oil and natural gas assets that exhibit economically producible hydrocarbons.
As of March 1, 2011,
we controlled the rights to mineral leases covering approximately 147,407 net acres prospective for the Bakken and Three Forks and, we acquired 7,191 net acres at an average price of $1,956 per acre, of which 40% or 2,842 net acres were permitted as of March 1, 2011.
Our goal is to continue to explore for and develop hydrocarbons within the mineral leases we control as well as continue to expand our acreage position should opportunities present themselves. To accomplish our objectives we must achieve the following;
|
|
▪
|
Continue to develop our substantial inventory of high quality core Bakken acreage with results consistent with those to-date;
|
|
|
▪
|
Retain and attract talented personnel;
|
|
|
▪
|
Continue to be a low-cost producer of hydrocarbons;
|
|
|
▪
|
Actively manage our cost structure and focus on accretive acquisitions; and
|
|
|
▪
|
Continue to manage our financial obligations to access the appropriate capital needed to develop our position of primarily undrilled acreage.
|
The following table sets forth selected operating data for the periods indicated. Production volumes and average sales prices are derived from accrued accounting data for the relevant period indicated.
|
Year Ended December 31,
|
||||||||||||
|
2010
|
2009
|
2008
(As Adjusted)
(1)
|
||||||||||
|
Net Production:
|
||||||||||||
|
Oil (Bbl)
|
849,845 | 274,328 | 50,880 | |||||||||
|
Natural Gas (Mcf)
|
234,411 | 47,305 | 3,969 | |||||||||
|
Net Sales:
|
||||||||||||
|
Oil Sales
|
$ | 58,020,694 | $ | 14,977,556 | $ | 3,510,597 | ||||||
|
Natural Gas
|
1,467,590 | 194,268 | 32,397 | |||||||||
|
Gain (Loss) on Settled Derivatives
|
(469,607 | ) | (624,541 | ) | 778,885 | |||||||
|
Mark-to-Market
of
Derivative Instruments
|
(14,545,477 | ) | (363,414 | ) | ||||||||
|
Other
Revenue
|
85,900 | 37,630 | ||||||||||
|
Total Revenues
|
44,559,100 | 14,221,499 | 4,321,879 | |||||||||
|
Average Sales Prices:
|
||||||||||||
|
Oil (per Bbl)
|
70.65 | 60.45 | 75.63 | |||||||||
|
Effect of Oil Hedges on Average Price (per Bbl)
|
(0.55 | ) | (3.60 | ) | 15.31 | |||||||
|
Oil Net of Hedging (per Bbl)
|
70.09 | 56.85 | 90.94 | |||||||||
|
Year Ended December 31,
|
||||||||||||
|
2010
|
2009
|
2008
(As Adjusted)
(1)
|
||||||||||
|
Natural Gas (per Mcf)
|
4.76 | 3.81 | 8.19 | |||||||||
|
Effect of Natural Gas Hedges on Average Price (per Mcf)
|
– | – | – | |||||||||
|
Natural gas net of hedging (per Mcf)
|
4.76 | 3.81 | 8.19 | |||||||||
|
Operating Expenses:
|
||||||||||||
|
Production Expenses
|
3,288,482 | 754,976 | 70,954 | |||||||||
|
Production Taxes
|
5,477,975 | 1,300,373 | 203,182 | |||||||||
|
General and Administrative Expense
(Including Share Based Compensation)
|
7,204,442 | 3,686,330 | 2,091,289 | |||||||||
|
Depletion of Oil and Gas Properties
(
10
)
|
16,884,563 | 4,250,983 | 677,915 | |||||||||
|
(1)
|
See Note 2 to the financial statement accompanying this report.
|
Results of Operations for the periods ended December 31, 2009 and December 31, 2010.
During 2009 and 2010 we significantly increased our drilling activities, generated income and achieved net earnings for both the 2009 and 2010 fiscal years. As of December 31, 2010, we have developed approximately 15% of our total Bakken and Three Forks prospective drillable acreage inventory (assuming one well per 960-acre spacing unit) and we expect to continue to add substantial volumes of production on a quarter-over-quarter basis going forward into the foreseeable future. We are predominately weighted to 640 spacing units compared to 1,280 spacing units, however we believe we will eventually grow into an average spacing unit size of 960 net acres per spacing unit over time as our acreage continues to be developed.
As of December 31, 2010, we had established production from 311 gross (26.03 net) wells in which we hold working interests, versus 179 gross (9.19 net) wells which had established production as of December 31, 2009. Our production at December 31, 2010 approximated 5,019 barrels of crude oil per day, compared to approximately 1,508 barrels of crude oil per day as of December 31, 2009.
We drilled with a 100% success rate in 2009 and 2010 with 104 gross and 11.69 net Bakken or Three Forks wells drilling, awaiting completion or completing as of December 31, 2010. As of March 1, 2011, we had 136 gross and 13.32 net Bakken or Three Forks wells drilling, awaiting completion, or completing. We have spud approximately 4 net Bakken or Three Forks wells and expect to spud an additional 4.6 net wells in the first quarter of 2011.
Our revenues, costs and net income increased in 2010 compared to 2009 as we continued our development plans and significantly increased our production. Revenues for the year ended December 31, 2010 were $44,559,100, compared to $14,221,499 for the year ended December 31, 2009. The increase in revenue is primarily due to our continued addition of wells and an increase in our average realized crude oil prices period-over-period. We have added wells each quarter since the first quarter of 2008 and, in particular, added production from 16.85 additional net wells during 2010. During 2010, we realized a $70.09 average price per barrel of crude oil (after the effect of settled hedges), compared to a $56.85 average price per barrel of crude oil (after the effect of settled hedges) during 2009.
We realized net income of $6,917,300 (representing approximately $0.14 per diluted share) for the year ended December 31, 2010, and net income of $2,798,952 (representing approximately $0.08 per diluted share) for the year ended December 31, 2009. The increase in net income is primarily due to our continued addition of crude oil and natural gas production from new wells and higher realized commodity prices in 2010 compared to 2009, partially offset by an increase in unrealized mark-to-market hedging losses.
Total operating expenses were $33,053,812 for the year ended December 31, 2010, compared to total operating expenses of $10,092,538 for the year ended December 31, 2009. The increase in operating expenses is due primarily to increased production expenses, production taxes, depletion and general and administrative expenses associated with our continued addition of crude oil and natural gas production from new wells.
During the year ended December 31, 2010, we had production expenses of $3,288,482, compared to production expenses of $754,976 during the year ended December 31, 2009. The increase in production expense is primarily a result of more mature wells utilizing artificial lift and the general aging of our production.
During the year ended December 31, 2010, we incurred production taxes of $5,477,975, compared to production taxes of $1,300,373 during the year ended December 31, 2009. The increase in production taxes is primarily due to the continued addition of producing oil and gas properties and related sales.
We recorded depletion of $16,884,563 during the year ended December 31, 2010, compared to depletion of $4,250,983 during the year ended December 31, 2009. The increase in depletion is primarily due to the addition of proven properties subject to the depletion calculation. Depletion expense for fiscal year 2010 was $18.99 per BOE, compared to $15.06 per BOE, for fiscal year 2009. We expect depletion per BOE to remain consistent in 2011 compared to 2010.
We had general and administrative expenses of $7,204,442 and $3,686,330 during the years ended December 31, 2010 and 2009, which included $3,638,309 and $2,452,823 net of share based compensation expense, respectively. The increase in general and administrative expense is primarily due to the increase in share based compensation, personnel, and travel expenses.
We expect general and administrative expenses to remain consistent in 2011 compared to 2010.
Non-GAAP
net income for the year ended December 31, 2010, excluding unrealized mark-to-market hedging losses, was $15,813,777 (representing approximately $0.31 per diluted share) as compared to non-GAAP net income of $3,022,366 (representing approximately $0.08 per diluted share) for the year ended December 31, 2009, excluding unrealized mark-to-market hedging gains. The increase in non-GAAP net income is primarily due to our continued addition of crude oil and natural gas production from new wells and higher realized commodity prices in 2010 compared to 2009.
We define Adjusted EBITDA as net income before (i) interest expense, (ii) income taxes, (iii) depreciation, depletion and amortization, (iv) accretion of abandonment liability, (v) pre-tax unrealized gain and losses on commodity risk and (vii) non-cash expenses relating to share based payments recognized under ASC Topic 718. Adjusted EBITDA for the year ended December 31, 2010 was $47,114,199 (representing approximately $0.93 per diluted share), compared to Adjusted EBITDA of $10,747,826 (representing approximately $0.29 per diluted share) for the year ended December 31, 2009.
The increase in Adjusted EBITDA is primarily due to our continued addition of crude oil and natural gas production from new wells and higher realized commodity prices in 2010 compared to 2009.
We believe the use of non-GAAP financial measures provides useful information to investors to gain an overall understanding of our current financial performance. Specifically, we believe the non-GAAP results included herein provide useful information to both management and investors by excluding certain expenses and unrealized commodity gains and losses that our management believes are not indicative of our core operating results. In addition, these non-GAAP financial measures are used by management for budgeting and forecasting as well as subsequently measuring our performance, and we believe that we are providing investors with financial measures that most closely align to our internal measurement processes. We consider these non-GAAP measures to be useful in evaluating our core operating results as they more closely reflect our essential revenue generating activities and direct operating expenses (resulting in cash expenditures) needed to perform these revenue generating activities. Our management also believes, based on feedback provided by the investment community, that the non-GAAP financial measures are necessary to allow the investment community to construct its valuation models to better compare our results with our competitors and market sector.
The non-GAAP financial information is presented using consistent methodology from year-to-year. These measures should be considered in addition to results prepared in accordance with GAAP. In addition, these non-GAAP financial measures are not based on any comprehensive set of accounting rules or principles. We believe that non-GAAP financial measures have limitations in that they do not reflect all of the amounts associated with our results of operations as determined in accordance with GAAP and that these measures should only be used to evaluate our results of operations in conjunction with the corresponding GAAP financial measures.
Net income excluding unrealized mark-to-market hedging gains (losses) and Adjusted EBITDA are non-GAAP measures. A reconciliation of these measures to GAAP is included below:
|
Northern Oil and Gas, Inc.
|
||||||||||||
|
Reconciliation of Adjusted EBITDA
|
||||||||||||
|
Year Ended December 31,
|
||||||||||||
|
2010
|
2009
|
2008
|
||||||||||
|
|
|
As Adjusted
(1)
|
||||||||||
|
Net Income
|
$ | 6,917,300 | $ | 2,798,952 | $ | 2,424,340 | ||||||
|
Add Back:
|
||||||||||||
|
Income Tax Provision (Benefit)
|
4,419,000 | 1,466,000 | (830,000 | ) | ||||||||
|
Depreciation, Depletion,
|
||||||||||||
|
Amortization and Accretion
|
17,082,913 | 4,350,859 | 746,005 | |||||||||
|
Share Based Compensation
|
3,566,133 | 1,233,507 | 105,375 | |||||||||
|
Mark-to-Market Derivative Instruments
|
14,545,477 | 363,414 | - | |||||||||
|
Interest Expense
|
583,376 | 535,094 | 28,976 | |||||||||
|
Adjusted EBITDA
|
$ | 47,114,199 | $ | 10,747,826 | $ | 2,474,696 | ||||||
|
Adjusted EBITDA Per Common Share - Basic
|
$ | 0.94 | $ | 0.29 | $ | 0.08 | ||||||
|
Adjusted EBITDA Per Common Share - Diluted
|
$ | 0.93 | $ | 0.29 | $ | 0.08 | ||||||
|
Weighted Average Shares Outstanding – Basic
|
50,387,203 | 36,705,267 | 31,920,747 | |||||||||
|
Weighted Average Shares Outstanding - Diluted
|
50,778,245 | 36,877,070 | 32,653,552 | |||||||||
|
(1)
|
See Note 2 to the financial statement accompanying this report.
|
|
Northern Oil and Gas, Inc.
|
||||||||||||
|
Reconciliation of Adjusted EBITDA Per Common Share – Basic
|
||||||||||||
|
Year Ended December 31,
|
||||||||||||
|
2010
|
2009
|
2008
|
||||||||||
|
As Adjusted
(1)
|
||||||||||||
|
Net Income (Loss) Per Common Share - Basic
|
$ | 0.14 | $ | 0.08 | $ | 0.08 | ||||||
|
(As Reported)
|
||||||||||||
|
Add Back:
|
||||||||||||
|
Income Tax Provision (Benefit)
|
0.09 | 0.04 | (0.02 | ) | ||||||||
|
Depreciation, Depletion, Amortization, and Accretion
|
0.34 | 0.12 | 0.02 | |||||||||
|
Share Based Compensation
|
0.07 | 0.03 | 0.00 | |||||||||
|
Mark-to-Market Derivative Instruments
|
0.29 | 0.01 | - | |||||||||
|
Interest Expense
|
0.01 | 0.01 | 0.00 | |||||||||
|
Adjusted EBITDA Per Common Share - Basic
|
$ | 0.94 | $ | 0.29 | $ | 0.08 | ||||||
|
(Adjusted for Non-GAAP Measurement)
|
||||||||||||
|
(1)
|
See Note 2 to the financial statement accompanying this report.
|
|
Northern Oil and Gas, Inc.
|
||||||||||||
|
Reconciliation of Adjusted EBITDA Per Common Share – Diluted
|
||||||||||||
|
Year Ended December 31,
|
||||||||||||
|
2010
|
2009
|
2008
|
||||||||||
|
As Adjusted
(1)
|
||||||||||||
|
Net Income (Loss) Per Common Share - Diluted
|
$ | 0.14 | $ | 0.08 | $ | 0.07 | ||||||
|
(As Reported)
|
||||||||||||
|
Add Back:
|
||||||||||||
|
Income Tax Provision (Benefit)
|
0.09 | 0.04 | (0.02 | ) | ||||||||
|
Depreciation, Depletion, Amortization, and Accretion
|
0.34 | 0.12 | 0.02 | |||||||||
|
Share Based Compensation
|
0.07 | 0.03 | 0.01 | |||||||||
|
Mark-to-Market Derivative Instruments
|
0.28 | 0.01 | - | |||||||||
|
Interest Expense
|
0.01 | 0.01 | 0.00 | |||||||||
|
Adjusted EBITDA Per Common Share - Diluted
|
$ | 0.93 | $ | 0.29 | $ | 0.08 | ||||||
|
(Adjusted for Non-GAAP Measurement)
|
||||||||||||
|
(1)
|
See Note 2 to the financial statement accompanying this report.
|
35
|
Northern Oil and Gas, Inc.
|
||||||||||||
|
Reconciliation of GAAP Net Income to Net Income Excluding
|
||||||||||||
|
Unrealized Mark-to-Market Hedging Losses
|
||||||||||||
|
Year Ended December 31,
|
||||||||||||
|
2010
|
2009
|
2008
|
||||||||||
|
As Adjusted*
|
||||||||||||
|
Net Income
|
$ | 6,917,300 | $ | 2,798,952 | $ | 2,424,340 | ||||||
|
Mark-to-Market of Derivative Instruments
|
14,545,477 | 363,414 | - | |||||||||
|
Tax Impact
|
(5,649,000 | ) | (140,000 | ) | - | |||||||
|
Net Income without the Effect of Certain Items
|
$ | 15,813,777 | $ | 3,022,366 | $ | 2,424,340 | ||||||
|
Net Income Per Common Share - Basic
|
$ | 0.31 | $ | 0.08 | $ | 0.08 | ||||||
|
Net Income Per Common Share - Diluted
|
$ | 0.31 | $ | 0.08 | $ | 0.07 | ||||||
|
Weighted Average Shares Outstanding – Basic
|
50,387,203 | 36,705,267 | 31,920,747 | |||||||||
|
Weighted Average Shares Outstanding - Diluted
|
50,778,245 | 36,877,070 | 32,653,552 | |||||||||
|
Net Income Per Common Share - Basic
|
$ | 0.14 | $ | 0.08 | $ | 0.08 | ||||||
|
Change due to Mark-to-Market of Derivative Instruments
|
0.28 | - | - | |||||||||
|
Change due to Tax Impact
|
( 0.11 | ) | - | - | ||||||||
|
Net Income without Effect of Certain Items Per Common Share - Basic
|
$ | 0.31 | $ | 0.08 | $ | 0.08 | ||||||
|
Net Income Per Common Share - Diluted
|
$ | 0.14 | $ | 0.08 | $ | 0.07 | ||||||
|
Change due to Mark-to-Market of Derivative Instruments
|
0.28 | - | - | |||||||||
|
Change due to Tax Impact
|
(0.11 | ) | - | - | ||||||||
|
Net Income without Effect of Certain Items Per Common Share - Diluted
|
$ | 0.31 | $ | 0.08 | $ | 0.07 | ||||||
|
(*)
|
See Note 2 to the financial statement accompanying this report.
|
Results of Operations for the periods ended December 31, 2008 and December 31, 2009.
During 2008 and 2009 we significantly increased our drilling activities, generated income and achieved net earnings for both the 2008 and 2009 fiscal years. To-date, we have developed approximately seven percent of our total drillable acreage inventory (assuming one well per 640-acre spacing unit) and we expect to continue to add substantial volumes of production on a quarter-over-quarter basis going forward into the foreseeable future.
As of December 31, 2009, we had established production from 179 gross (9.19 net) wells in which we hold working interests, 36 gross (2.04 net) wells of which had established production as of December 31, 2008. Our production at December 31, 2009 approximated 1,508 barrels of crude oil per day, compared to approximately 460 barrels of crude oil per day as of December 31, 2008. Our production increased to 1,986 barrels of crude oil per day as of March 1, 2010.
We drilled with a 100% success rate in 2008 and 2009 with 176 Bakken or Three Forks wells completed or completing. We also had three successful Red River discoveries at December 31, 2009.
Our revenues, costs and net income increased in 2009 compared to 2008 as we continued our development plans and significantly increased our production. Revenues for the twelve-month period ended December 31, 2009 were $14,221,499, compared to $4,321,879 for the twelve-month period ended December 31, 2008.These increases in revenue are primarily due to our continued addition of wells, partially offset by lower sales prices. We have added wells each quarter since the first quarter of 2008 and, in particular, added production from 7.09 additional net wells during 2009.
We realized net income of $2,798,952 (representing approximately $0.08 per diluted share) for the year ended December 31, 2009 and net income of $2,424,340 (representing approximately $0.07 per diluted share) for the year ended December 31, 2008.
Total operating expenses were $10,092,538 for the year ended December 31, 2009, compared to total operating expenses of $3,111,430 for the year ended December 31, 2008. These increases in expense are due primarily to increased production expenses, production taxes, depletion and general and administrative expenses associated with our continued addition of crude oil and natural gas production from new wells.
During the year ended December 31, 2009, we had production expenses of $754,976, compared to production expenses of $70,954 during the year ended December 31, 2008. The increase in production expense was primarily a result of more mature wells utilizing artificial lift and the general aging of our production.
During the year ended December 31, 2009, we incurred production taxes of $1,300,373, compared to production taxes of $203,182 during the year ended December 31, 2008. The increase in production taxes was primarily due to the continued addition of producing oil and gas properties and related sales.
We recorded depletion of $4,250,983 during the year ended December 31, 2009, compared to depletion of $677,915 during the year ended December 31, 2008. The increase in depletion was primarily due to the addition of proven properties subject to the depletion calculation.
We had general and administrative expenses of $3,686,330 and $2,091,289 during the year ended December 31, 2009 and 2008, which included $2,452,823 and $1,985,914 net of share based compensation expense, respectively. The increase in general and administrative expense was primarily due to the increase in share based compensation, professional service, personnel, and travel expenses.
Non-GAAP net income for the year ended December 31, 2009, excluding unrealized mark-to-market hedging losses, was $3,022,366 (representing approximately $0.08 per diluted share) as compared to net income of $2,424,340 (representing approximately $0.07 per diluted share) for the year ended December 31, 2008, excluding unrealized mark-to-market hedging gains.
Adjusted EBITDA for the year ended December 31, 2009 was $10,747,826 (representing approximately $0.29 per diluted share), compared to Adjusted EBITDA of $2,474,696 (representing approximately $0.08 per diluted share) for the year ended December 31, 2008.
2011 Operation Plan
We expect to drill approximately 36 net wells in 2011 with associated drilling capital expenditures approximating $227 million. The 2011 wells are expected to target both the Bakken and Three Forks formations. Drilling capital expenditures are expected to increase in 2011 due to the continued success of longer laterals and additional fractional stimulation stages. We currently expect to drill wells during 2011 at an average completed cost of $6.3 million per well, which represents a 10% to 15% increase in drilling costs for 2011 compared to 2010. Based on evolving conditions in the field, we expect to continue to evaluate further strategic acreage acquisitions during 2011. Assuming we acquire 200 to 300 net acres each business day at an average cost of $1,750 per net acre, we expect to incur approximately $75 million to $80 million of acreage capital expenditures during 2011. We expect to fund all 2011 commitments using cash-on-hand, cash flow and our currently undrawn credit facility.
Our future financial results will depend primarily on: (i) the ability to continue to source and screen potential projects; (ii) the ability to discover commercial quantities of crude oil and natural gas; (iii) the market price for crude oil and natural gas; and (iv) the ability to fully implement our exploration and development program, which is dependent on the availability of capital resources. There can be no assurance that we will be successful in any of these respects, that the prices of crude oil and natural gas prevailing at the time of production will be at a level allowing for profitable production, or that we will be able to obtain additional funding if necessary.
Liquidity and Capital Resources
Liquidity is a measure of a company’s ability to meet potential cash requirements. We have historically met our capital requirements through the issuance of common stock and by short term borrowings. In the future, we anticipate we will be able to provide the necessary liquidity by the revenues generated from the sales of our crude oil and natural gas reserves in our existing properties, however, if we do not generate sufficient sales revenues we will continue to finance our operations through equity and/or debt financings.
The following table summarizes total current assets, total current liabilities and working capital at December 31, 2010.
|
Current Assets
|
$ | 233,018,360 | ||
|
Current Liabilities
|
$ | 59,666,926 | ||
|
Working Capital
|
$ | 173,351,434 |
Macquarie Credit Facility
On May 26, 2010, we completed the assignment of our revolving credit facility to Macquarie Bank Limited (“Macquarie”) from CIT Capital USA Inc. In connection with the assignment, our company and Macquarie entered into an Amended and Restated Credit Agreement governing the facility.
The facility provides up to a maximum of $100 million in principal amount of borrowings to be used as working capital for exploration and production operations. Initially, $25 million of financing was available under the facility. As of December 31, 2010 and March 1, 2011, we had no borrowings under the facility.
The borrowing base of funds available to us is redetermined semi-annually based upon the net present value, discounted at 10% per annum, of the future net revenues expected to accrue from the its interests in proved reserves estimated to be produced from its crude oil and natural gas properties. Based on these borrowing base redeterminations, an additional $75 million of financing could become available to our company. The facility terminates on May 26, 2014.
We have the option to designate the reference rate of interest for each specific borrowing under the facility as amounts are advanced. Borrowings based upon the London interbank offering rate (LIBOR) will bear interest at a rate equal to LIBOR plus a spread ranging from 2.5% to 3.25%, depending on the percentage of borrowing base that is currently advanced. Any borrowings not designated as being based upon LIBOR will bear interest at a rate equal to the greater of (a) the current prime rate published by the Wall Street Journal, or (b) the current one month LIBOR rate plus 1.0%, plus in either case a spread ranging from 2% to 2.5%, depending on the percentage of borrowing base that is currently advanced. We have the option to designate either pricing mechanism. Interest payments are due under the facility in arrears, in the case of a loan based on LIBOR on the last day of the specified interest period and in the case of all other loans on the last day of each March, June, September and December. All outstanding principal is due and payable upon termination of the facility.
The applicable interest rate increases under the facility and the lenders may accelerate payments under the facility, or call all obligations due under certain circumstances, upon an event of default. The facility references various events constituting a default, including, but not limited to, failure to pay interest on any loan under the facility, any material violation of any representation or warranty under the Amended and Restated Credit Agreement, failure to observe or perform certain covenants, conditions or agreements under the Amended and Restated Credit Agreement, a change in control of our company, default under any other material indebtedness of our company, bankruptcy and similar proceedings and failure to pay disbursements from lines of credit issued under the facility.
The facility requires that our company enter into swap agreements with Macquarie for each month of the 36 month period following the date on which each such swap agreement is executed, the notional volumes for which (when aggregated with other commodity swap agreements and additional fixed-price physical off-take contracts then in effect, as of the date such swap agreement is executed, is not less than 50%, nor greater than 90%, of the reasonably anticipated projected production from our proved developed producing reserves.
All of our obligations under the facility and the swap agreements with Macquarie are secured by a first priority security interest in any and all of our assets.
Follow-On Equity Offerings
On April 20, 2010, we sold and issued a total of 5,750,000 shares of common stock to various institutional investors for $15.00 per share, resulting in net proceeds of approximately $82.8 million after deducting underwriters’ discounts. The proceeds were used to continue to pursue acquisition opportunities, to fund our accelerated drilling program, to repay short-term borrowings, and for other working capital purposes. Canaccord Adams Inc. acted as sole book-running manager and C. K. Cooper & Company, Inc. acted as a co-managing underwriter for the offering.
On November 24, 2010, we sold and issued a total of 10,292,500 shares of common stock to various institutional investors for $20.25 per share, resulting in net proceeds of approximately $200.1 million after deducting underwriters discounts. The proceeds were used to continue to pursue acquisition opportunities, to fund our accelerated drilling program and for other working capital purposes. Canaccord Genuity acted as sole book-running manager and Howard Weil Incorporated acted as co-lead manager. Capital One Southcoast, SunTrust Robinson Humphrey, C.K. Cooper & Company, Dougherty & Company and Northland Capital Markets acted as co-managers for the offering.
Satisfaction of Our Cash Obligations for the Next 12 Months
With the further addition of equity capital during 2010 and our credit facility, we believe we have sufficient capital to meet our drilling commitments and expected general and administrative expenses for the next twelve months at a minimum. Nonetheless, any strategic acquisition of assets may require us to access the capital markets at some point in 2011. We may also choose to access the equity capital markets rather than our credit facility or other debt instruments to fund accelerated or continued drilling at the discretion of management and depending on prevailing market conditions. We will evaluate any potential opportunities for acquisitions as they arise. Given our non-leveraged asset base and anticipated growing cash flows, we believe we are in a position to take advantage of any appropriately priced sales that may occur. However, there can be no assurance that any additional capital will be available to us on favorable terms or at all.
Over the next 24 months it is possible that our existing capital, the credit facility and anticipated funds from operations may not be sufficient to sustain continued acreage acquisition. Consequently, we may seek additional capital in the future to fund growth and expansion through additional equity or debt financing or credit facilities. No assurance can be made that such financing would be available, and if available it may take either the form of debt or equity. In either case, the financing could have a negative impact on our financial condition and our shareholders.
Though we achieved profitability in 2008 and remained profitable throughout 2009 and 2010, our prospects must be considered in light of the risks, expenses and difficulties frequently encountered by companies in their early stage of operations, particularly companies in the crude oil and natural gas exploration industry. Such risks include, but are not limited to, an evolving and unpredictable business model and the management of growth. To address these risks we must, among other things, implement and successfully execute our business and marketing strategy, continue to develop and upgrade technology and products, respond to competitive developments, and attract, retain and motivate qualified personnel. There can be no assurance that we will be successful in addressing such risks, and the failure to do so can have a material adverse effect on our business prospects, financial condition and results of operations.
Effects of Inflation and Pricing
The crude oil and natural gas industry is very cyclical and the demand for goods and services of crude oil field companies, suppliers and others associated with the industry put extreme pressure on the economic stability and pricing structure within the industry. Typically, as prices for crude oil and natural gas increase, so do all associated costs. Conversely, in a period of declining prices, associated cost declines are likely to lag and may not adjust downward in proportion. Material changes in prices also impact our current revenue stream, estimates of future reserves, borrowing base calculations of bank loans, impairment assessments of crude oil and natural gas properties, and values of properties in purchase and sale transactions. Material changes in prices can impact the value of crude oil and natural gas companies and their ability to raise capital, borrow money and retain personnel. While we do not currently expect business costs to materially increase, higher prices for crude oil and natural gas could result in increases in the costs of materials, services and personnel.
Contractual Obligations and Commitments
As of December 31, 2010, we did not have any material long-term debt obligations, capital lease obligations, operating lease obligations or purchase obligations requiring future payments other than our office lease that expires on January 31, 2013. The following table illustrates our contractual obligations as of December 31, 2010.
|
Payment due by Period
|
||||||||||||||||||||
|
Contractual Obligations
|
Less than 1 year
|
1-3 years
|
3-5 years
|
More than 5 years
|
Total
|
|||||||||||||||
|
Office Lease
(
1
)
|
$ | 154,087 | $ | 160,236 | $ | - | $ | - | $ | 314,323 | ||||||||||
|
Automobile Leases
(2
)
|
59,951 | 78,879 | - | - | 138,830 | |||||||||||||||
|
Total
|
$ | 214,038 | $ | 239,115 | $ | - | $ | - | $ | 453,153 | ||||||||||
|
(1)
|
Our office lease commenced on February 1, 2008 and continues for a period of five years.
|
|
(2)
|
In September 2008, we entered into an automobile lease for a vehicle utilized by one employee, which will expire in September 2011 . In July 2010, we entered into automobile leases for vehicles utilized by two additional employees, which will expire in July 2013. In September 2010, we entered into an automobile lease for a vehicle utilized by one employee, which will expire in September 2013.
|
Product Research and Development
We do not anticipate performing any significant product research and development given our current plan of operation.
Expected Purchase or Sale of Any Significant Equipment
We do not anticipate the purchase or sale of any plant or significant equipment as such items are not required by us at this time or anticipated to be needed in the next twelve months.
Critical Accounting Policies
The establishment and consistent application of accounting policies is a vital component of accurately and fairly presenting our consolidated financial statements in accordance with generally accepted accounting principles (GAAP), as well as ensuring compliance with applicable laws and regulations governing financial reporting. While there are rarely alternative methods or rules from which to select in establishing accounting and financial reporting policies, proper application often involves significant judgment regarding a given set of facts and circumstances and a complex series of decisions.
Use of Estimates
The preparation of financial statements under U.S. GAAP requires management to make estimates and assumptions that affect our reported amounts of assets and liabilities and disclosure of contingent assets and liabilities at the date of the financial statements and the reported amounts of revenues and expenses during the reporting period. Our estimates of our proved crude oil and natural gas reserves, future development costs, estimates relating to certain crude oil and natural gas revenues and expenses, fair value of derivative instruments, fair value of certain investments, and deferred income taxes are the most critical to our financial statements.
Crude Oil and Natural Gas Reserves
The determination of depreciation, depletion and amortization expense as well as impairments that are recognized on our crude oil and natural gas properties are highly dependent on the estimates of the proved crude oil and natural gas reserves attributable to our properties. Our estimate of proved reserves is based on the quantities of crude oil and natural gas which geological and engineering data demonstrate, with reasonable certainty, to be recoverable in the future years from known reservoirs under existing economic and operating conditions. The accuracy of any reserve estimate is a function of the quality of available data, engineering and geological interpretation, and judgment. For example, we must estimate the amount and timing of future operating costs, production taxes and development costs, all of which may in fact vary considerably from actual results. In addition, as the prices of crude oil and natural gas and cost levels change from year to year, the economics of producing our reserves may change and therefore the estimate of proved reserves may also change. Any significant variance in these assumptions could materially affect the estimated quantity and value of our reserves.
The information regarding present value of the future net cash flows attributable to our proved crude oil and natural gas reserves are estimates only and should not be construed as the current market value of the estimated crude oil and natural gas reserves attributable to our properties. Thus, such information includes revisions of certain reserve estimates attributable to our properties included in the prior year’s estimates. These revisions reflect additional information from subsequent activities, production history of the properties involved and any adjustments in the projected economic life of such properties resulting from changes in crude oil and natural gas prices. Any future downward revisions could adversely affect our financial condition, our borrowing ability, our future prospects and the value of our common stock.
The estimates of our proved crude oil and natural gas reserves used in the preparation of our financial statements were prepared by Ryder Scott Company, our registered independent petroleum consultants, and were prepared in accordance with the rules promulgated by the SEC.
Crude Oil and Natural Gas Properties
The method of accounting we use to account for our crude oil and natural gas investments determines what costs are capitalized and how these costs are ultimately matched with revenues and expensed.
We utilize the full cost method of accounting to account for our crude oil and natural gas investments instead of the successful efforts method because we believe it more accurately reflects the underlying economics of our programs to explore and develop crude oil and natural gas reserves. The full cost method embraces the concept that dry holes and other expenditures that fail to add reserves are intrinsic to the crude oil and natural gas exploration business. Thus, under the full cost method, all costs incurred in connection with the acquisition, development and exploration of crude oil and natural gas reserves are capitalized. These capitalized amounts include the costs of unproved properties, internal costs directly related to acquisitions, development and exploration activities, asset retirement costs, geological and geophysical costs and capitalized interest. Although some of these costs will ultimately result in no additional reserves, they are part of a program from which we expect the benefits of successful wells to more than offset the costs of any unsuccessful ones. The full cost method differs from the successful efforts method of accounting for crude oil and natural gas investments. The primary difference between these two methods is the treatment of exploratory dry hole costs. These costs are generally expensed under the successful efforts method when it is determined that measurable reserves do not exist. Geological and geophysical costs are also expensed under the successful efforts method. Under the full cost method, both dry hole costs and geological and geophysical costs are initially capitalized and classified as unproved properties pending determination of proved reserves. If no proved reserves are discovered, these costs are then amortized with all the costs in the full cost pool.
Capitalized amounts except unproved costs are depleted using the units of production method. The depletion expense per unit of production is the ratio of the sum of our unamortized historical costs and estimated future development costs to our proved reserve volumes. Estimation of hydrocarbon reserves relies on professional judgment and use of factors that cannot be precisely determined. Subsequent reserve estimates materially different from those reported would change the depletion expense recognized during the future reporting periods. For the year ended December 31, 2010, our average depletion expense per unit of production was $18.99 per BOE. A 10% decrease in our estimated net proved reserves at December 31, 2010 would result in a $1.99 per BOE increase in our per unit depletion expense and a $1,765,260 decrease in our pre-tax net income.
To the extent the capitalized costs in our full cost pool (net of depreciation, depletion and amortization and related deferred taxes) exceed the sum of the present value (using a 10% discount rate and based on period-end crude oil and natural gas prices) of the estimated future net cash flows from our proved crude oil and natural gas reserves and the capitalized cost associated with our unproved properties, we would have a capitalized ceiling impairment. Such costs would be charged to operations as a reduction of the carrying value of crude oil and natural gas properties. The risk that we will be required to write down the carrying value of our crude oil and natural gas properties increases when crude oil and natural gas prices are depressed, even if the low prices are temporary. In addition, capitalized ceiling impairment charges may occur if we experience poor drilling results or estimations of our proved reserves are substantially reduced. A capitalized ceiling impairment is a reduction in earnings that does not impact cash flows, but does impact operating income and shareholders’ equity. Once recognized, a capitalized ceiling impairment charge to crude oil and natural gas properties cannot be reversed at a later date. The risk that we will experience a ceiling test writedown increases when crude oil and natural gas prices are depressed or if we have substantial downward revisions in our estimated proved reserves. As of December 31, 2010 we have not incurred a capitalized ceiling impairment charge. However, no assurance can be given that we will not experience a capitalized ceiling impairment charge in future periods. In addition, capitalized ceiling impairment charges may occur if estimates of proved hydrocarbon reserves are substantially reduced or estimates of future development costs increase significantly.
Asset Retirement Obligations
We have significant obligations to plug and abandon our crude oil and natural gas wells and related equipment. Liabilities for asset retirement obligations are recorded at fair value in the period incurred. The related asset value is increased by the same amount. Asset retirement costs included in the carrying amount of the related asset are subsequently allocated to expense as part of our depletion calculation. Additionally, increases in the discounted asset retirement liability resulting from the passage of time are reported as accretion of discount on asset retirement obligations expense on our Statement of Operations.
Estimating future asset retirement obligations requires us to make estimates and judgments regarding timing, existence of a liability, as well as what constitutes adequate restoration. We use the present value of estimated cash flows related to our asset retirement obligations to determine the fair value. Present value calculations inherently incorporate numerous assumptions and judgments, which include the ultimate retirement and restoration costs, inflation factors, credit adjusted discount rates, timing of settlement, and changes in the legal, regulatory, environmental and political environments. To the extent future revisions to these assumptions impact the present value of our existing asset retirement obligation liability, a corresponding adjustment will be made to the carrying cost of the related asset.
Income Taxes
Deferred tax assets are recognized for temporary differences in financial statement and tax basis amounts that will result in deductible amounts and carry-forwards in future years. Deferred tax liabilities are recognized for temporary differences that will result in taxable amounts in future years. Deferred tax assets and liabilities are measured using enacted tax law and tax rate(s) for the year in which we expect the temporary differences to be deducted or settled. The effect of a change in tax law or rates on the valuation of deferred tax assets and liabilities is recognized in income in the period of enactment. Deferred tax assets are reduced by a valuation allowance when, in the opinion of management, it is more likely than not that some portion or all of the deferred tax assets will not be realized. Significant future taxable income would be required to realize this net tax asset.
Estimating the amount of the valuation allowance is dependent on estimates of future taxable income, alternative minimum tax income, and changes in shareholder ownership that would trigger limits on use of net operating losses under Internal Revenue Code Section 382.
Revenue Recognition
We derive revenue primarily from the sale of the crude oil and natural gas from our interests in producing wells, hence our revenue recognition policy for these sales is significant.
We recognize revenue from the sale of crude oil and natural gas when production is delivered to, and title has transferred to, the purchaser and to the extent the selling price is reasonable determinable.
We use the sales method of accounting for natural gas balancing of natural gas production and would recognize a liability if the existing proven reserves were not adequate to cover the current imbalance situation. As of December 31, 2010, 2009, and 2008, our natural gas production was in balance, meaning its cumulative portion of natural gas production taken and sold from wells in which it has an interest equaled its entitled interest in natural gas production from those wells.
Settlements for hydrocarbon sales can occur up to two months after the end of the month in which the crude oil, natural gas or other hydrocarbon products were produced. We estimate and accrue for the value of these sales using information available to us at the time our financial statements are generated. Differences are reflected in the accounting period that payments are received from the operator.
Derivative Instruments and Hedging Activities
We use derivative instruments from time to time to manage market risks resulting from fluctuations in prices of crude oil and natural gas. We periodically enter into derivative contracts, including price swaps, caps and floors, which require payments to (or receipts from) counterparties based on the differential between a fixed price and a variable price for a fixed quantity of crude oil and natural gas without the exchange of underlying volumes. The notional amounts of these financial instruments are based on expected production from existing wells.
Derivatives, historically, were recorded on the balance sheet at fair value and changes in the fair value of derivatives were recorded each period in current earnings or other comprehensive income, depending on whether a derivative was designated as part of a hedge transaction and, if it was, depending on the type of hedge transaction. Our derivatives historically consisted primarily of cash flow hedge transactions in which we were hedging the variability of cash flows related to a forecasted transaction. Period to period changes in the fair value of derivative instruments designated as cash flow hedges were reported in other comprehensive income and reclassified to earnings in the periods in which the contracts were settled. The ineffective portion of the cash flow hedges were reflected in current period earnings as gain or loss from derivative. Gains and losses on derivative instruments that did not qualify for hedge accounting were included in income or loss from derivatives in the period in which they occur. The resulting cash flows from derivatives were reported as cash flows from operating activities.
On November 1, 2009, due to the volatility of price differentials in the Williston Basin, we de-designated all derivatives that were previously classified as cash flow hedges and in addition, we have elected not to designate any subsequent derivative contracts as accounting hedges under FASB ASC 815-20-25. As such, all derivative positions are carried at their fair value on the balance sheet and are marked-to-market at the end of each period. Any realized and unrealized gains or losses are recorded on the statement of operations. We elected to include all derivative settlements and unrealized gains (losses) within revenues.
New Accounting Pronouncements
In March 2008, the FASB issued FASB ASC 815-10-15 (Prior authoritative literature, FASB Statement 161, Disclosures About Derivative Instruments and Hedging Activities). FASB ASC 815-10-15 is intended to improve financial reporting about derivative instruments and hedging activities by requiring enhanced disclosures to enable investors to better understand their effects on an entity's financial position, financial performance, and cash flows. FASB ASC 815-10-15 was effective for financial statements issued for fiscal years and interim periods beginning after November 15, 2008, with early application encouraged. Pursuant to the transition provisions of the Statement, we adopted FASB ASC 815-10-15 on January 1, 2009. The required disclosures are presented in Note 15 on a prospective basis. This Statement does not impact the financial results as it is disclosure-only in nature.
In April 2009, the FASB issued FASB ASC 270-10-05 (
Prior authoritative literature:
APB 28-1,
Interim Disclosures About Fair Value of Financial Instruments
)
.
FASB ASC 270-10-05 amended FASB ASC 825-10-50
(Prior authoritative literature:
FASB Statement 107,
Disclosures About Fair Value of Financial Instruments)
to require an entity to provide disclosures about fair value of financial instruments in interim financial information. FASB ASC 270-10-05 was to be applied prospectively and was effective for interim and annual periods ending after June 15, 2009 with early adoption permitted for periods ending after March 15, 2009. The required disclosures are presented in Note 13 on a prospective basis.
In February 2008, the FASB issued FASB ASC 820-10-65-1 (
Prior authoritative literature:
FSP FAS 157-2/Statement 157,
Effective Date of FASB Statement No. 157
).
FASB ASC 820-10-65-1
delayed the effective date for all nonfinancial assets and nonfinancial liabilities, except those that are recognized or disclosed at fair value in the financial statements on a recurring basis (at least annually). The adoption of the provisions of FASB ASC 820-10-65-1
related to nonfinancial assets and nonfinancial liabilities on January 1, 2009 did not have a material impact on the Financial Statements. See Note 13 for FASB ASC 820-10-65-1
disclosures.
In April 2009, the FASB issued FASB ASC 820-10-65-4 (
Prior authoritative literature:
FASB Statement 157-4,
Determining Fair Value When the Volume and Level of Activity for the Asset or Liability Have Significantly Decreased and Identifying Transactions That Are Not Orderly
)
.
FASB ASC 820-10-65-4 provides additional guidance in estimating fair value, when the volume and level of transaction activity for an asset or liability have significantly decreased in relation to normal market activity for the asset or liability. FASB ASC 820-10-65-4
also provides additional guidance on circumstances that may indicate a transaction is not orderly. FASB ASC 820-10-65-4
was effective for interim periods ending after June 15, 2009, and we adopted its provisions during the second quarter of 2009. FASB ASC 820-10-65-4 did not have a significant impact on our financial position, results of operations, cash flows, or disclosures.
In April 2009, the FASB issued FASB ASC 320-10-65 (
Prior authoritative literature:
FSP FAS 115-2/124-2,
Recognition and Presentation of Other-Than-Temporary Impairments
). The guidance applies to investments in debt securities for which other-than-temporary impairments may be recorded. If an entity’s management asserts that it does not have the intent to sell a debt security and it is more likely than not that it will not have to sell the security before recovery of its cost basis, then an entity may separate other-than-temporary impairments into two components: 1) the amount related to credit losses (recorded in earnings), and 2) all other amounts (recorded in other comprehensive income). This ASC was to be applied prospectively and was effective for interim and annual periods ending after June 15, 2009 with early adoption permitted for periods ending after March 15, 2009. The adoption of the provisions of this ASC in the second quarter of 2009 did not have a material impact on the Financial Statements.
In June 2009, the FASB issued FASB ASC 860-10-05 (
Prior authoritative literature:
FASB Statement 166,
Accounting for Transfers of Financial Assets
). FASB ASC 860-10-05 is effective for fiscal years beginning after November 15, 2009.
In June 2009, the FASB issued FASB ASC 810-10-25 (
Prior authoritative literature:
FASB Statement 167-Amendment to FIN 46(R),
Consolidation of Variable Entities).
FASB ASC 810-10-25 eliminates the quantitative approach previously required for determining the primary beneficiary of a variable interest entity and requires a qualitative analysis to determine whether an enterprise’s variable interest gives it a controlling financial interest in a variable interest entity. FASB ASC 810-10-25 contains
certain guidance for determining whether an entity is a variable interest entity. This statement also requires ongoing reassessments of whether an enterprise is the primary beneficiary of a variable interest entity.
In June 2009, the FASB issued FASB ASC 105-10-65 (
Prior authoritative literature:
FASB Statement 168,
The FASB Accounting Standards Codification and the Hierarchy of Generally Accepted Accounting Principles
). Under FASB ASC 105-10-65, the FASB Accounting Standards Codification ™ (the “Codification”) becomes the exclusive source of authoritative U.S. generally accepted accounting principles (“U.S. GAAP”) recognized by the FASB to be applied by nongovernmental entities. Rules and interpretive releases of the SEC under authority of federal securities laws are also sources of authoritative GAAP for SEC registrants. The Codification will supersede all then-existing non-SEC accounting and reporting standards, with the exception of certain non-SEC accounting literature which will become nonauthoritative. FASB ASC 105-10-65 was effective for our 2009 third fiscal quarter. The adoption of FASB ASC 105-10-65 did not have a material impact on our financial statements. All references to U.S. GAAP provided in the notes to the Financial Statements have been updated to conform to the Codification.
In October 2009, the FASB issued ASU No. 200-13, Revenue Recognition – Multiple Deliverable Revenue Arrangements (“ASU 2009-13”). ASU 2009-13 updated the existing multiple-element revenue arrangements guidance currently included in FASB ASC 605-25. The revised guidance provided for two significant changes to the existing multiple-element revenue arrangements guidance. The first change related to the determination of when the individual deliverables included in a multiple-element arrangement may be treated as separate units of accounting. This change resulted in the requirement to separate more deliverables within an arrangement, ultimately leading to less revenue deferral. The second change modified the manner in which the transaction consideration was allocated across the separately identified deliverables. Together, these changes resulted in earlier recognition of revenue and related costs for multiple-element arrangements than under previous guidance. This guidance expanded the disclosures required for multiple-element revenue arrangements effective for interim and annual reporting periods beginning after December 15, 2009.
Recent Accounting Pronouncements Not Yet Adopted
For a description of the accounting standards that we adopted in 2010, see
Notes to Financial Statements—Note 2. Significant Accounting Policies
.
Various accounting standards and interpretations were issued in 2010 with effective dates subsequent
to December 31, 2010. We have evaluated the recently issued accounting pronouncements that are effective
in 2011 and believe that none of them will have a material effect on our financial position, results of operations or cash flows when adopted.
Further, we are monitoring the joint standard-setting efforts of the Financial Accounting Standards Board and the International Accounting Standards Board. There are a large number of pending accounting standards that are being targeted for completion in 2011 and beyond, including, but not limited to, standards relating to revenue recognition, accounting for leases, fair value measurements, accounting for financial instruments, disclosure of loss contingencies and financial statement presentation. Because these pending standards have not yet been finalized, at this time we are not able to determine the potential future impact that these standards will have, if any, on our financial position, results of operations or cash flows.
Off-Balance Sheet Arrangements
We currently do not have any off-balance sheet arrangements that have or are reasonably likely to have a current or future effect on our financial condition, changes in financial condition, revenues or expenses, results of operations, liquidity, capital expenditures or capital resources that is material to investors.
Commodity Price Risk
The price we receive for our crude oil and natural gas production heavily influences our revenue, profitability, access to capital and future rate of growth. Crude oil and natural gas are commodities and, therefore, their prices are subject to wide fluctuations in response to relatively minor changes in supply and demand. Historically, the markets for crude oil and natural gas have been volatile, and these markets will likely continue to be volatile in the future. The prices we receive for our production depend on numerous factors beyond our control. Our revenue during 2010 generally would have increased or decreased along with any increases or decreases in crude oil or natural gas prices, but the exact impact on our income is indeterminable given the variety of expenses associated with producing and selling crude oil that also increase and decrease along with crude oil prices.
We have previously entered into derivative contracts to achieve a more predictable cash flow by reducing our exposure to crude oil and natural gas price volatility. On November 1, 2009, due to the volatility of price differentials in the Williston Basin, we de-designated all derivatives that were previously classified as cash flow hedges and in addition, we have elected not to designate any subsequent derivative contracts as accounting hedges. As such, all derivative positions are carried at their fair value on the balance sheet and are marked-to-market at the end of each period.
Any realized gains and losses are recorded to Gain (Loss) on Settled Derivatives and unrealized gains or losses are recorded to Mark-to-Market of Derivative Instruments on the Statement of Operations rather than as a component of other comprehensive income (loss) or other Income (expense).
The following table reflects the weighted average price of open commodity derivative contracts as of December 31, 2010, by year with associated volumes.
|
Weighted Average Price
Of Open Commodity Swap Contracts
|
|
|||||||
|
Year
|
|
Volumes (Bbl)
|
|
|
Weighted Average Price
|
|
||
|
2011
|
|
|
963,000
|
|
|
$
|
82.05
|
|
|
2012
|
|
|
399,000
|
|
|
$
|
81.36
|
|
As of December 31, 2010, we had a total hedged volume of 1,362,000 barrels at a weighted average price of approximately $81.85. In January 2011, we entered into a commodity swap contract. The crude oil swap contract is for 376,000 barrels of crude oil with settlement periods between January 2012 and December 2012. The price on the contract is fixed at $95.15 per barrel.
In January 2011, we entered into a costless collar (purchased put options and written call options). The costless collars are used to establish floor and ceiling prices on anticipated crude oil and natural gas production. There were no net premiums paid or received by us related to the costless collar agreement. We purchased put options at $85.00 per barrel and call options at $101.75 per barrel on 508,000 barrels of crude oil. The costless collar amounts settle between February 2011 and December 2011.
In February 2011, we entered into a commodity swap contract. The crude oil swap contract is for 20,000 barrels of crude oil per month for the months of January 2012 through December 2012. The price on the contract is fixed at $100.00 per barrel.
The following table reflects the weighted average price of open commodity swap contracts as of March 1, 2011, by year with associated volumes.
|
Weighted Average Price
Of Open Commodity Swap Contracts
|
|
|||||||
|
Year
|
|
Volumes (Bbl)
|
|
|
Weighted Average Price
|
|
||
|
2011
|
|
|
774,000
|
|
|
$
|
81.93
|
|
|
2012
|
|
|
1,015,000
|
|
|
$
|
90.87
|
|
As of March 1, 2011, we had a total hedged volume on open commodity swaps of 1,789,000 barrels at a weighted average price of approximately $87.00, as well as 451,000 barrels of crude oil collared between $85.00 and $101.75.
Interest Rate Risk
We did not have outstanding any borrowings under our credit facilities or other obligations that would subject us to significant interest rate risk at December 31, 2010. Our credit facility with Macquarie will, however, subject us to interest rate risk on borrowings under that facility. The credit facility allows us to fix the interest rate of borrowings under it for all or a portion of the principal balance for a period up to six months. To the extent the interest rate is fixed, interest rate changes affect the instrument’s fair market value but do not impact results of operations or cash flows. Conversely, for the portion of our borrowings that has a floating interest rate, interest rate changes will not affect the fair market value but will impact future results of operations and cash flows.
Our Financial Statements required by this item are included on the pages immediately following the Index to Financial Statements appearing on page F-1.
None.
Evaluation of Disclosure Controls and Procedures
We maintain a system of disclosure controls and procedures that is designed to ensure that information required to be disclosed in our Exchange Act reports is recorded, processed, summarized and reported within the time periods specified in the SEC’s rules and forms, and that such information is accumulated and communicated to our management, including our Chief Executive Officer and Chief Financial Officer, as appropriate, to allow timely decisions regarding required disclosures.
As of December 31, 2010, our management, including our Chief Executive Officer and Chief Financial Officer, had evaluated the effectiveness of the design and operation of our disclosure controls and procedures (as defined in Exchange Act Rules 13a-15(e) and 15d-15(e)) pursuant to Rule 13a-15(b) under the Exchange Act. Based upon and as of the date of the evaluation, our Chief Executive Officer and Chief Financial Officer concluded that information required to be disclosed is recorded, processed, summarized and reported within the specified periods and is accumulated and communicated to management, including our Chief Executive Officer and Chief Financial Officer, to allow for timely decisions regarding required disclosure of material information required to be included in our periodic SEC reports. Based on the foregoing, our management determined that our disclosure controls and procedures were effective as of December 31, 2010.
Management’s Annual Report on Internal Control over Financial Reporting
Our management is responsible for establishing and maintaining adequate internal control over financial reporting, as such term is defined in Exchange Act Rule 13a-15(f). The design of any system of controls is based in part upon certain assumptions about the likelihood of future events, and there can be no assurance that any design will succeed in achieving its stated goals under all potential future conditions, regardless of how remote. All internal control systems, no matter how well designed, have inherent limitations. Because of its inherent limitations, internal control over financial reporting may not prevent or detect misstatements. Projections of any evaluation of effectiveness to future periods are subject to the risk that controls may become inadequate because of changes in conditions, or that the degree of compliance with the policies or procedures may deteriorate. Therefore, even those systems determined to be effective can provide only reasonable assurance with respect to financial statement preparation and presentation.
We carried out an evaluation, under the supervision and with the participation of our Chief Executive Officer and Chief Financial Officer, of the effectiveness of our internal controls over financial reporting as of December 31, 2010. In making this assessment, our management used the criteria set forth by the Committee of Sponsoring Organizations of the Treadway Commission (COSO) in “Internal Control-Integrated Framework.” Based on this assessment, management believes that, as of December 31, 2010, our internal control over financial reporting was effective based on those criteria. There have been no changes in internal control over financial reporting since December 31, 2010, that has materially affected or is reasonably likely to materially affect our internal control over financial reporting.
The effectiveness of our internal control over financial reporting as of December 31, 2010 has been audited by Mantyla McReynolds LLC, an independent registered public accounting firm, as stated in their report which is included herein on the following page.
REPORT OF INDEPENDENT REGISTERED PUBLIC ACCOUNTING FIRM
To the Board of Directors and Stockholders
Northern Oil and Gas, Inc.:
We have audited Northern Oil and Gas, Inc.’s (the Company) internal control over financial reporting as of December 31, 2010, based on criteria established in
Internal Control—Integrated Framework
issued by the Committee of Sponsoring Organizations of the Treadway Commission (COSO). The Company’s management is responsible for maintaining effective internal control over financial reporting and for its assessment of the effectiveness of internal control over financial reporting included in the accompanying Management’s Annual Report on Internal Control Over Financial Reporting (Item 9A). Our responsibility is to express an opinion on the Company’s internal control over financial reporting based on our audit.
We conducted our audit in accordance with the standards of the Public Company Accounting Oversight Board (United States). Those standards require that we plan and perform the audit to obtain reasonable assurance about whether effective internal control over financial reporting was maintained in all material respects. Our audit of internal control over financial reporting included obtaining an understanding of internal control over financial reporting, assessing the risk that a material weakness exists, and testing and evaluating the design and operating effectiveness of internal control based on the assessed risk. Our audit also included performing such other procedures as we considered necessary in the circumstances. We believe that our audit provides a reasonable basis for our opinion.
A company’s internal control over financial reporting is a process designed to provide reasonable assurance regarding the reliability of financial reporting and the preparation of financial statements for external purposes in accordance with generally accepted accounting principles. A company’s internal control over financial reporting includes those policies and procedures that (1) pertain to the maintenance of records that, in reasonable detail, accurately and fairly reflect the transactions and dispositions of the assets of the company; (2) provide reasonable assurance that transactions are recorded as necessary to permit preparation of financial statements in accordance with generally accepted accounting principles, and that receipts and expenditures of the company are being made only in accordance with authorizations of management and directors of the company; and (3) provide reasonable assurance regarding prevention or timely detection of unauthorized acquisition, use, or disposition of the company’s assets that could have a material effect on the financial statements.
Because of its inherent limitations, internal control over financial reporting may not prevent or detect misstatements. Also, projections of any evaluation of effectiveness to future periods are subject to the risk that controls may become inadequate because of changes in conditions, or that the degree of compliance with the policies or procedures may deteriorate.
In our opinion, the Company maintained, in all material respects, effective internal control over financial reporting as of December 31, 2010, based on criteria established in
Internal Control—Integrated Framework
issued by COSO.
We have also audited, in accordance with the standards of the Public Company Accounting Oversight Board (United States), the balance sheets of Northern Oil and Gas, Inc. as of December 31, 2010 and 2009, and the related statements of operations, stockholders’ equity, and cash flows for each of the years in the three-year period ended December 31, 2010, and our report dated March 4, 2011 expressed an unqualified opinion on those financial statements.
Mantyla McReynolds LLC
Salt Lake City, Utah
March 4, 2011
None.
Certain information required by this Part III is incorporated by reference from our definitive Proxy Statement for the Annual Meeting of Shareholders to be held in 2011 (the “Proxy Statement”), which we intend to file with the SEC pursuant to Regulation 14A within 120 days after December 31, 2010. Except for those portions specifically incorporated into this Annual report on Form 10-K by reference to the Proxy Statement, no other portions of the Proxy Statement are deemed to be filed as part of this Annual Report on Form 10-K.
Executive Officers of the Registrant
Our executive officers, their ages and offices held, as of March 1, 2011 are as follows:
|
Name
|
Age
|
Positions
|
||
|
Michael L. Reger
|
34
|
Chairman, Chief Executive Officer and Director
|
||
|
Ryan R. Gilbertson
|
34
|
President and Director
|
||
|
Chad D. Winter
|
35
|
Chief Financial Officer
|
||
|
James R. Sankovitz
|
36
|
Chief Operating Officer and General Counsel
|
Michael L. Reger
has served as our Chief Executive Officer, Secretary and a Director since March 2007. Mr. Reger has been primarily involved in the acquisition of crude oil, gas and mineral rights for his entire professional life and is a director of Reger Oil based in Billings, Montana. Mr. Reger holds a Bachelor of Arts in Finance and an MBA in Finance/Management from the University of St. Thomas in St. Paul, Minnesota. The Reger family has a history of acreage acquisition in the Williston Basin dating to 1952.
Ryan R. Gilbertson
has served as our President since March 2010 and a director of our company since March 2007. Mr. Gilbertson had previously served as our Chief Financial Officer since March 2007. Mr. Gilbertson’s last position prior to co-founding Northern was at Piper Jaffray in Minneapolis from March 2004 to August 2006. Prior to Piper Jaffray, Ryan was a portfolio manager at Telluride Asset Management, a multi-strategy hedge fund based in Wayzata, Minnesota. Ryan holds a BA from Gustavus Adolphus College in International Business/Finance.
Chad D. Winter
has served as our Chief Financial Officer since March 2010. Mr. Winter joined Northern Oil in November 2007 as our internal operations manager. In 2008, Mr. Winter was promoted to vice president of operations and had primary responsibility for our SEC financial reporting, accounting, audit and tax functions as well as Sarbanes Oxley compliance. Prior to joining our company, Mr. Winter served as the acting director of product development within the enterprise media group at Dow Jones and Company from 2005 to 2007. During his tenure, Mr. Winter oversaw the development of enterprise financial solutions, which included managing the business unit’s financial models, forecasting, budgeting, strategy, marketing and product development.
James R. Sankovitz
has served as our Chief Operating Officer and General Counsel since March 2010. Mr. Sankovitz had previously served as our General Counsel since March 2008. Prior to joining our company, Mr. Sankovitz was a partner at the law firm Adams, Monahan & Sankovitz, LLP from November 2004 to March 2008, where he represented various public and private companies and individuals concerning state and federal securities laws, corporate finance matters, mergers and acquisitions, capital structuring, regulatory compliance and other business-related matters. Mr. Sankovitz has assisted clients as an attorney and consultant in pursuing capital-raising transactions (including private placements, mergers, tender offers, bond offerings, bridge financings and bank financings), structuring complex transactions, completing mergers, acquisitions and similar transactions, developing strategic business plans, exploring licensing opportunities, evaluating cash needs and resources, negotiating various agreements and addressing securities law compliance and general corporate matters.
The information appearing under the headings “Proposal 1: Election of Directors” and “Section 16(a) Beneficial Onership Reporting Compliance” in the Proxy Statement is incorporated herein by reference.
We have adopted a Code of Business Conduct and Ethics that applies to our chief executive officer, chief financial officer and persons performing similar functions. A copy is available on our website at
www.northernoil.com
. We intend to post on our website any amendments to, or waivers from, our Code of Business Conduct and Ethics pursuant to the rules of the SEC and NYSE Amex Equity Market.
The information appearing under the heading “Executive Compensation” and the information regarding compensation committee interlocks and insider participation under the heading “Our Board of Directors and Committees” in the Proxy Statement is incorporated herein by reference.
Securities Authorized for Issuance under Equity Compensation Plans
The following table provides information with respect to our common shares issuable under our equity compensation plans as of December 31, 2010:
|
Plan Category
|
Number of securities to be issued upon exercise of outstanding options, warrants and rights
|
Weighted-average exercise price of outstanding options, warrants and rights
|
Number of securities remaining available for future issuance under equity compensation plans
|
|||||||||
|
Equity compensation plans approved by security holders
|
||||||||||||
|
2006 Incentive Stock Option Plan
|
265,963 | $ | 5.18 | 340,000 | ||||||||
|
2009 Equity Incentive Plan
|
– | – | 1,087,009 | |||||||||
|
Equity compensation plans not approved by security holders
|
– | – | – | |||||||||
|
Total
|
265,963 | $ | 5.18 | 1,427,009 | ||||||||
The information appearing under the heading “Security Ownership of Certain Beneficial Owners and Management” in the Proxy Statement is incorporated herein by reference.
The information appearing under the headings “Certain Relationships and Related Transactions” and “Our Board of Directors and Committees” in the Proxy Statement is incorporated herein by reference.
The information appearing under the heading “Proposal 2: Ratification of Appointment of Independent Registered Public Accountants” in the Proxy Statement is incorporated herein by reference.
(a) Documents filed as Part of this Report:
|
|
1.
|
Financial Statements
|
See Index to Financial Statements on page F-1.
|
|
2.
|
Financial Statement Schedules
|
All schedules are omitted because they are either not applicable or required information is shown in the financial statements or notes thereto.
(b) Exhibits:
Unless otherwise indicated, all documents incorporated by reference into this report are filed with the SEC pursuant to the Securities Exchange Act of 1934, as amended, under file number 001-33999.
|
Exhibit No.
|
Description
|
Reference
|
|
2.1
|
Plan of Merger, dated as of June 30, 2010, by and between Northern Oil and Gas, Inc. (a Nevada corporation) with and into Northern Oil and Gas, Inc. (a Minnesota corporation)
|
Incorporated by reference to Exhibit 2.1 to the Registrant’s Current Report on Form 8-K filed with the SEC on July 2, 2010
|
|
3.1
|
Articles of Incorporation of Northern Oil and Gas, Inc. dated June 28, 2010
|
Incorporated by reference to Exhibit 3.1 to the Registrant’s Current Report on Form 8-K filed with the SEC on July 2, 2010
|
|
3.2
|
By-Laws of Northern Oil and Gas, Inc.
|
Incorporated by reference to Exhibit 3.2 to the Registrant’s Current Report on Form 8-K filed with the SEC on July 2, 2010
|
|
4.1
|
Specimen Stock Certificate of Northern Oil and Gas, Inc.
|
Incorporated by reference to Exhibit 4.1 to the Registrant’s Current Report on Form 8-K filed with the SEC on July 2, 2010
|
|
10.1
|
Form of Warrant
|
Incorporated by reference to Exhibit 10.2 to the current report on Form 8-K filed with the SEC on September 14, 2007 (File No. 000-30955)
|
|
10.2*
|
Amended and Restated Employment Agreement by and between Northern Oil and Gas, Inc. and Michael L. Reger, dated January 30, 2009
|
Incorporated by reference to Exhibit 10.2 to the Registrant’s Current Report on Form 8-K filed with the SEC on February 2, 2009 (File No. 000-30955)
|
|
10.3*
|
Amendment No. 1 to Amended and Restated Employment Agreement by and between Northern Oil and Gas, Inc. and Michael L. Reger, dated January 14, 2011
|
Filed herewith
|
|
10.4*
|
Amended and Restated Employment Agreement by and between Northern Oil and Gas, Inc. and Ryan R. Gilbertson, dated January 30, 2009
|
Incorporated by reference to Exhibit 10.3 to the Registrant’s Current Report on Form 8-K filed with the SEC on February 2, 2009 (File No. 000-30955)
|
|
10.5*
|
Amendment No. 1 to Amended and Restated Employment Agreement by and between Northern Oil and Gas, Inc. and Ryan R. Gilbertson, dated March 25, 2010
|
Incorporated by reference to Exhibit 10.3 to the Registrant’s Current Report on Form 8-K filed with the SEC on March 25, 2010
|
|
10.6*
|
Amendment No. 2 to Amended and Restated Employment Agreement by and between Northern Oil and Gas, Inc. and Ryan R. Gilbertson, dated January 14, 2011
|
Filed herewith
|
|
10.7
|
Warrant to Purchase Shares of Northern Oil and Gas, Inc. Common Stock Issued to CIT Group/Equity Investments, Inc. on February 27, 2009
|
Incorporated by reference to Exhibit 10.4 to the Registrant’s Current Report on Form 8-K filed with the SEC on March 2, 2009 (File No. 000-30955)
|
|
Exhibit No.
|
Description
|
Reference
|
|
10.8*
|
Northern Oil and Gas, Inc. 2009 Equity Incentive Plan
|
Incorporated by reference to Exhibit 10.1 to the Registrant’s Current Registration Statement on Form S-8 filed with the SEC on July 16, 2009 (File No. 333-160602)
|
|
10.9
|
Exploration and Development Agreement dated effective as of April 1, 2009 by and between Slawson Exploration Company, Inc. and Northern Oil and Gas, Inc.
|
Incorporated by reference to Exhibit 2.1 to the Registrant’s Current Report on Form 8-K filed with the SEC on May 29, 2009
|
|
10.10
|
First Amendment to Credit Agreement dated as of May 22, 2009 among Northern Oil and Gas, Inc., CIT Capital USA Inc., and the Lenders party thereto
|
Incorporated by reference to Exhibit 10.1 to the Registrant’s Current Report on Form 8-K filed with the SEC on May 29, 2009
|
|
10.11*
|
Form of Promissory Note issued to Michael L. Reger and Ryan R. Gilbertson
|
Incorporated by reference to Exhibit 10.18 to the Registrant’s Current Report on Form 10-K filed with the SEC on March 8, 2010
|
|
10.12*
|
Form of Restricted Stock Agreement issued under the Northern Oil and Gas, Inc. 2009 Equity Incentive Plan
|
Incorporated by reference to Exhibit 10.19 to the Registrant’s Current Report on Form 10-K filed with the SEC on March 8, 2010
|
|
10.13
|
Employment Agreement by and between Northern Oil and Gas, Inc. and Chad D. Winter, dated March 25, 2010
|
Incorporated by reference to Exhibit 10.1 to the Registrant’s Current Report on Form 8-K filed with the SEC on March 25, 2010
|
|
10.14
|
Employment Agreement by and between Northern Oil and Gas, Inc. and James R. Sankovitz, dated March 25, 2010
|
Incorporated by reference to Exhibit 10.2 to the Registrant’s Current Report on Form 8-K filed with the SEC on March 25, 2010
|
|
10.15
|
Amended and Restated Credit Agreement dated as of May 26, 2010 among Northern Oil and Gas, Inc., as Borrower, Macquarie Bank Limited, as Administrative Agent, and The Lenders party thereto
|
Incorporated by reference to Exhibit 10.1 to the Registrant’s Current Report on Form 8-K filed with the SEC on June 1, 2010
|
|
23.1
|
Consent of Independent Registered Public Accounting Firm Mantyla McReynolds LLC
|
Filed herewith
|
|
23.2
|
Consent of Ryder Scott Company, LP
|
Filed herewith
|
|
31.1
|
Certification of the Chief Executive Officer pursuant to Rule 13a-14(a) or 15d-14(a) under the Securities Exchange Act of 1934, as adopted pursuant to Section 302 of the Sarbanes-Oxley Act of 2002
|
Filed herewith
|
|
31.2
|
Certification of the Chief Financial Officer pursuant to Rule 13a-14(a) or 15d-14(a) under the Securities Exchange Act of 1934, as adopted pursuant to Section 302 of the Sarbanes-Oxley Act of 2002
|
Filed herewith
|
|
32.1
|
Certification of the Chief Executive Officer and Chief Financial Officer pursuant to 18 U.S.C. Section 1350, as adopted pursuant to Section 906 of the Sarbanes-Oxley Act of 2002
|
Filed herewith
|
|
99.1
|
Report of Ryder Scott Company, LP.
|
Filed herewith
|
|
|
* Management contract or compensatory plan or arrangement required to be filed as an exhibit to this report.
|
Pursuant to the requirements of Section 13 or 15(d) of the Securities Exchange Act of 1934, the registrant has duly caused this report to be signed on its behalf by the undersigned, thereunto duly authorized.
| NORTHERN OIL AND GAS, INC. | ||||
|
Date:
|
March 4, 2011
|
By:
|
/s/ Michael L. Reger
|
|
|
|
Michael L. Reger
|
|||
|
|
Chief Executive Officer
|
|||
POWER OF ATTORNEY
Each person whose signature appears below constitutes and appoints, Michael L. Reger and Chad D. Winter, or either of them, his/her true and lawful attorney-in-fact and agent, acting alone, with full power of substitution and resubstitution, for him/her and in his/her name, place and stead, in any and all capacities, to sign any and all amendments (including post-effective amendments) to this Annual Report on Form 10-K and to file the same, with all exhibits thereto, and other documents in connection wherewith, with the Commission, granting unto said attorney-in-fact and agent, each acting alone, full power and authority to do and perform each and every act and thing requisite and necessary to be done in and about the premises, as fully to all intents and purposes as he/she might or could do in person, hereby ratifying and confirming all said attorney-in-fact and agent, acting alone, or his/her substitute or substitutes, may lawfully do or cause to be done by virtue hereof.
Pursuant to the requirements of the Securities Exchange Act of 1934, this report has been signed below by the following persons on behalf of the registrant and in the capacity and on the dates indicated:
|
Signature
|
Title
|
Date
|
||
|
|
|
|||
|
/s/ Michael L. Reger
|
Chief Executive Officer, Chairman and Director
|
March 4, 2011
|
||
|
Michael L. Reger
|
|
|||
|
|
|
|||
|
/s/ Chad D. Winter
|
Chief Financial Officer, Principal Financial Officer, Principal Accounting Officer
|
March 4, 2011
|
||
| Chad D. Winter | ||||
|
|
||||
|
/s/ Ryan R. Gilbertson
|
President and Director
|
March 4, 2011
|
||
|
Ryan R. Gilbertson
|
||||
|
|
|
|||
|
/s/ Loren J. O’Toole
|
Director
|
March 4, 2011
|
||
|
Loren J. O’Toole
|
||||
|
|
|
|||
|
/s/ Carter Stewart
|
Director
|
March 4, 2011
|
||
|
Carter Stewart
|
|
|||
|
|
|
|||
|
/s/ Jack King
|
Director
|
March 4, 2011
|
||
|
Jack King
|
|
|||
|
|
|
|||
|
/s/ Robert Grabb
|
Director
|
March 4, 2011
|
||
|
Robert Grabb
|
|
|||
|
|
|
|||
|
/s/ Lisa Bromiley Meier
|
Director
|
March 4, 2011
|
||
|
Lisa Bromiley Meier
|
|
NORTHERN OIL AND GAS, INC.
|
Page
|
||||
| Report of Independent Registered Public Accounting Firm | F-2 | |||
|
Balance Sheets as of December 31, 2010 and 2009
|
F-3 | |||
|
Statements of Operations for the Years Ended December 31, 2010, December 31, 2009 and December 31, 2008
|
F-4 | |||
|
Statements of Cash Flows for the Years Ended December 31, 2010, December 31, 2009 and December 31, 2008
|
F-5 | |||
|
Statements of Stockholders’ Equity for the Years Ended December 31, 2010, December 31, 2009 and December 31, 2008
|
F-7 | |||
|
Notes to the Financial Statements
|
F-10 | |||
REPORT OF INDEPENDENT REGISTERED PUBLIC ACCOUNTING FIRM
To the Board of Directors and Stockholders
Northern Oil and Gas, Inc.:
We have audited the accompanying balance sheets of Northern Oil and Gas, Inc. (the Company) as of December 31, 2010 and 2009, and the related statements of operations, stockholders’ equity, and cash flows for each of the years in the three-year period ended December 31, 2010. These financial statements are the responsibility of the Company’s management. Our responsibility is to express an opinion on these financial statements based on our audits.
We conducted our audits in accordance with the standards of the Public Company Accounting Oversight Board (United States). Those standards require that we plan and perform the audit to obtain reasonable assurance about whether the financial statements are free of material misstatement. An audit includes examining, on a test basis, evidence supporting the amounts and disclosures in the financial statements. An audit also includes assessing the accounting principles used and significant estimates made by management, as well as evaluating the overall financial statement presentation. We believe that our audits provide a reasonable basis for our opinion.
In our opinion, the financial statements referred to above present fairly, in all material respects, the financial position of the Company as of December 31, 2010 and 2009, and the results of their operations and their cash flows for each of the years in the three-year period ended December 31, 2010 in conformity with accounting principles generally accepted in the United States of America.
We also have audited, in accordance with the standards of the Public Company Accounting Oversight Board (United States), the Company’s internal control over financial reporting as of December 31, 2010, based on criteria established in
Internal Control—Integrated Framework
issued by the Committee of Sponsoring Organizations of the Treadway Commission (COSO), and our report dated March 4, 2011 expressed an unqualified opinion on the effectiveness of the Company’s internal control over financial reporting.
Mantyla McReynolds LLC
Salt Lake City, Utah
March 4, 2011
F-2
NORTHERN OIL AND GAS, INC.
DECEMBER 31, 2010 AND 2009
|
December 31,
|
||||||||
|
2010
|
2009
|
|||||||
|
CURRENT ASSETS
|
||||||||
|
Cash and Cash Equivalents
|
$ | 152,110,701 | $ | 6,233,372 | ||||
|
Trade Receivables
|
22,033,647 | 7,025,011 | ||||||
|
Prepaid Drilling Costs
|
13,225,650 | 1,454,034 | ||||||
|
Prepaid Expenses
|
345,695 | 143,606 | ||||||
|
Other Current Assets
|
475,967 | 201,314 | ||||||
|
Short - Term Investments
|
39,726,700 | 24,903,476 | ||||||
|
Deferred Tax Asset
|
5,100,000 | 2,057,000 | ||||||
|
Total Current Assets
|
233,018,360 | 42,017,813 | ||||||
|
PROPERTY AND EQUIPMENT
|
||||||||
|
Oil and Natural Gas Properties, Full Cost Method of Accounting
|
||||||||
|
Proved
|
158,846,475 | 42,939,097 | ||||||
|
Unproved
|
136,135,163 | 53,862,529 | ||||||
|
Other Property and Equipment
|
2,479,199 | 439,656 | ||||||
|
Total Property and Equipment
|
297,460,837 | 97,241,282 | ||||||
|
Less - Accumulated Depreciation and Depletion
|
22,152,356 | 5,091,198 | ||||||
|
Total Property and Equipment, Net
|
275,308,481 | 92,150,084 | ||||||
|
DEBT ISSUANCE COSTS
|
1,367,124 | 1,427,071 | ||||||
|
Total Assets
|
$ | 509,693,965 | $ | 135,594,968 | ||||
|
LIABILITIES AND STOCKHOLDERS' EQUITY
|
||||||||
|
CURRENT LIABILITIES
|
||||||||
|
Accounts Payable
|
$ | 48,500,204 | $ | 6,419,534 | ||||
|
Line of Credit
|
- | 834,492 | ||||||
|
Accrued Expenses
|
2,829 | 316,977 | ||||||
|
Derivative Liability
|
11,145,319 | 1,320,679 | ||||||
|
Other Liabilities
|
18,574 | 18,574 | ||||||
|
Total Current Liabilities
|
59,666,926 | 8,910,256 | ||||||
|
LONG-TERM LIABILITIES
|
||||||||
|
Revolving Line of Credit
|
- | - | ||||||
|
Derivative Liability
|
5,022,657 | 1,459,374 | ||||||
|
Subordinated Notes
|
- | 500,000 | ||||||
|
Other Noncurrent Liabilities
|
477,900 | 243,888 | ||||||
|
Total Long-Term Liabilities
|
5,500,557 | 2,203,262 | ||||||
|
DEFERRED TAX LIABILITY
|
9,167,000 | 922,000 | ||||||
|
Total Liabilities
|
74,334,483 | 12,035,518 | ||||||
|
STOCKHOLDERS' EQUITY
|
||||||||
|
Preferred Stock, Par Value$.001; 5,000,000 Authorized, No Shares Outstanding
|
- | - | ||||||
|
Common Stock, Par Value $.001; 95,000,000 Authorized, 62,129,424 Outstanding (2009 – 43,911,044 Shares Outstanding)
|
62,129 | 43,912 | ||||||
|
Additional Paid-In Capital
|
428,484,092 | 124,884,266 | ||||||
|
Retained Earnings
|
7,759,192 | 841,892 | ||||||
|
Accumulated Other Comprehensive Income (Loss)
|
(945,931 | ) | (2,210,620 | ) | ||||
|
Total Stockholders' Equity
|
435,359,482 | 123,559,450 | ||||||
|
Total Liabilities and Stockholders' Equity
|
$ | 509,693,965 | $ | 135,594,968 | ||||
The accompanying notes are an integral part of these financial statements.
NORTHERN OIL AND GAS, INC.
FOR THE YEARS ENDED DECEMBER 31, 2010, 2009, AND 2008
|
Year Ended December 31,
|
||||||||||||
|
2008
|
||||||||||||
|
2010
|
2009
|
Adjusted *
|
||||||||||
|
REVENUES
|
||||||||||||
|
Oil and Gas Sales
|
$ | 59,488,284 | $ | 15,171,824 | $ | 3,542,994 | ||||||
|
Gain (Loss) on Settled Derivatives
|
(469,607 | ) | (624,541 | ) | 778,885 | |||||||
|
Mark-to-Market of Derivative Instruments
|
(14,545,477 | ) | (363,414 | ) | - | |||||||
|
Other Revenue
|
85,900 | 37,630 | - | |||||||||
| 44,559,100 | 14,221,499 | 4,321,879 | ||||||||||
|
OPERATING EXPENSES
|
||||||||||||
|
Production Expenses
|
3,288,482 | 754,976 | 70,954 | |||||||||
|
Production Taxes
|
5,477,975 | 1,300,373 | 203,182 | |||||||||
|
General and Administrative Expense
|
7,204,442 | 3,686,330 | 2,091,289 | |||||||||
|
Depletion of Oil and Gas Properties
|
16,884,563 | 4,250,983 | 677,915 | |||||||||
|
Depreciation and Amortization
|
176,595 | 91,794 | 67,060 | |||||||||
|
Accretion of Discount on Asset Retirement Obligations
|
21,755 | 8,082 | 1,030 | |||||||||
|
Total Expenses
|
33,053,812 | 10,092,538 | 3,111,430 | |||||||||
|
INCOME FROM OPERATIONS
|
11,505,288 | 4,128,961 | 1,210,449 | |||||||||
|
OTHER INCOME (EXPENSE)
|
(168,988 | ) | 135,991 | 383,891 | ||||||||
|
INCOME BEFORE INCOME TAXES
|
11,336,300 | 4,264,952 | 1,594,340 | |||||||||
|
INCOME TAX PROVISION (BENEFIT)
|
4,419,000 | 1,466,000 | (830,000 | ) | ||||||||
|
NET INCOME
|
$ | 6,917,300 | $ | 2,798,952 | $ | 2,424,340 | ||||||
|
Net Income Per Common Share - Basic
|
$ | 0.14 | $ | 0.08 | $ | 0.08 | ||||||
|
Net Income Per Common Share - Diluted
|
$ | 0.14 | $ | 0.08 | $ | 0.07 | ||||||
|
Weighted Average Shares Outstanding – Basic
|
50,387,203 | 36,705,267 | 31,920,747 | |||||||||
|
Weighted Average Shares Outstanding - Diluted
|
50,778,245 | 36,877,070 | 32,653,552 | |||||||||
*See Note 2
The accompanying notes are an integral part of these financial statements.
NORTHERN OIL AND GAS, INC.
FOR THE YEARS ENDED DECEMBER 31, 2010, 2009, AND 2008
|
Year Ended December 31,
|
||||||||||||
|
2008
|
||||||||||||
|
2010
|
2009
|
Adjusted *
|
||||||||||
|
CASH FLOWS FROM OPERATING ACTIVITIES
|
||||||||||||
|
Net Income
|
$ | 6,917,300 | $ | 2,798,952 | $ | 2,424,340 | ||||||
|
Adjustments to Reconcile Net Income to Net Cash
|
||||||||||||
|
Provided by
|
||||||||||||
|
Operating Activities:
|
||||||||||||
|
Depletion of Oil and Gas Properties
|
16,884,563 | 4,250,983 | 677,915 | |||||||||
|
Depreciation and Amortization
|
176,595 | 91,794 | 67,060 | |||||||||
|
Amortization of Debt Issuance Costs
|
455,302 | 459,343 | - | |||||||||
|
Accretion of Discount on Asset Retirement Obligations
|
21,755 | 8,082 | 1,030 | |||||||||
|
Income Tax Provision (Benefit)
|
4,419,000 | 1,466,000 | (830,000 | ) | ||||||||
|
Issuance of Stock for Consulting Fees
|
- | - | 49,875 | |||||||||
|
Net Loss on Sale of Available for Sale Securities
|
58,524 | - | 381 | |||||||||
|
Market Value adjustment of Derivative Instruments
|
14,545,477 | 363,414 | (95,148 | ) | ||||||||
|
Lease Incentives Received
|
- | - | 91,320 | |||||||||
|
Amortization of Deferred Rent
|
(18,573 | ) | (18,573 | ) | (17,026 | ) | ||||||
|
Share - Based Compensation Expense
|
3,566,133 | 1,213,292 | 105,375 | |||||||||
|
Changes in Working Capital and Other Items:
|
||||||||||||
|
Increase in Trade Receivables
|
(15,008,636 | ) | (4,996,070 | ) | (2,028,941 | ) | ||||||
|
Increase (Decrease) in Other Receivables
|
- | 874,453 | (874,453 | ) | ||||||||
|
Increase in Prepaid Expenses
|
(202,089 | ) | (72,052 | ) | (45,874 | ) | ||||||
|
Increase in Other Current Assets
|
(274,653 | ) | (158,334 | ) | - | |||||||
|
Increase in Accounts Payable
|
42,080,670 | 4,484,724 | 1,821,556 | |||||||||
|
Increase (Decrease) in Accrued Expenses
|
(314,148 | ) | (953,098 | ) | 1,159,082 | |||||||
|
Net Cash Provided By Operating Activities
|
73,307,220 | 9,812,910 | 2,506,492 | |||||||||
|
CASH FLOWS FROM INVESTING ACTIVITIES
|
||||||||||||
|
Purchases of Other Equipment and Furniture
|
(2,039,543 | ) | (31,256 | ) | (363,631 | ) | ||||||
|
Decrease (Increase) in Prepaid Drilling Costs
|
(11,771,616 | ) | (1,449,485 | ) | 359,741 | |||||||
|
Proceeds from Sale of Oil and Gas Properties
|
297,877 | - | 468,609 | |||||||||
|
Purchase of Available for Sale Securities
|
(48,679,264 | ) | (24,106,294 | ) | (3,800,524 | ) | ||||||
|
Proceeds from Sale of Available for Sale Securities
|
34,699,651 | 800,000 | 975,000 | |||||||||
|
Purchase of Oil and Gas Properties
|
(180,400,555 | ) | (47,061,666 | ) | (37,997,157 | ) | ||||||
|
Net Cash Used For Investing Activities
|
(207,893,450 | ) | (71,848,701 | ) | (40,357,962 | ) | ||||||
|
CASH FLOWS FROM FINANCING ACTIVITIES
|
||||||||||||
|
Increase in Margin Loan
|
- | - | 1,650,720 | |||||||||
|
Payments on Line of Credit
|
(834,492 | ) | (816,228 | ) | - | |||||||
|
Advances on Revolving Credit Facility
|
5,300,000 | 29,750,000 | - | |||||||||
|
Repayments on Revolving Credit Facility
|
(5,300,000 | ) | (29,750,000 | ) | - | |||||||
|
Cash Paid for Listing Fee
|
- | - | (65,000 | ) | ||||||||
|
Proceeds from Derivatives
|
- | - | 95,148 | |||||||||
|
Increase (Decrease) in Subordinated Notes, net
|
(500,000 | ) | 500,000 | |||||||||
|
Debt Issuance Costs Paid
|
(395,355 | ) | (1,190,061 | ) | - | |||||||
|
Proceeds from the Issuance of Common Stock - Net of Issuance Costs
|
282,193,406 | 68,994,736 | 25,904,858 | |||||||||
|
Proceeds from Exercise of Stock Options
|
- | - | 933,800 | |||||||||
|
Net Cash Provided by Financing Activities
|
280,463,559 | 67,488,447 | 28,519,526 | |||||||||
|
NET INCREASE (DECREASE) IN CASH AND CASH EQUIVALENTS
|
145,877,329 | 5,452,656 | (9,331,944 | ) | ||||||||
|
CASH AND CASH EQUIVALENTS – BEGINNING OF PERIOD
|
6,233,372 | 780,716 | 10,112,660 | |||||||||
|
CASH AND CASH EQUIVALENTS – END OF PERIOD
|
$ | 152,110,701 | $ | 6,233,372 | $ | 780,716 | ||||||
|
Year Ended December 31,
|
||||||||||||
|
2008
|
||||||||||||
|
2010
|
2009
|
Adjusted *
|
||||||||||
|
Supplemental Disclosure of Cash Flow Information
|
||||||||||||
|
Cash Paid During the Period for Interest
|
$ | 169,232 | $ | 624,717 | $ | - | ||||||
|
Cash Paid During the Period for Income Taxes
|
$ | - | $ | - | $ | - | ||||||
|
Non-Cash Financing and Investing Activities:
|
||||||||||||
|
Purchase of Oil and Gas Properties through Issuance of Common Stock
|
$ | 12,679,422 | $ | 1,115,738 | $ | 2,084,372 | ||||||
|
Payment of Consulting Fees through Issuance of Common Stock
|
$ | - | $ | - | $ | 49,875 | ||||||
|
Payment of Compensation through Issuance of Common Stock
|
$ | 8,733,215 | $ | 1,213,292 | $ | 105,375 | ||||||
|
Capitalized Asset Retirement Obligations
|
$ | 232,258 | $ | 137,222 | $ | 60,407.00 | ||||||
|
Cashless Exercise of Stock Options
|
$ | - | $ | 518,000 | $ | - | ||||||
|
Fair Value of Warrants Issued for Debt Issuance Costs
|
$ | - | $ | 221,153 | $ | - | ||||||
|
Payment of Debt Issuance Costs through Issuance of Common Stock
|
$ | - | $ | 475,200 | $ | - | ||||||
The accompanying notes are an integral part of these financial statements.
* See Note 2
NORTHERN OIL AND GAS, INC.
STATEMENT OF STOCKHOLDERS’ EQUITY (DEFICIT)
FOR THE YEARS ENDED DECEMBER 31, 2010, 2009, AND 2008
|
Accumulated
|
||||||||||||||||||||||||
|
Other
|
Retained
|
|||||||||||||||||||||||
|
Additional
|
Comprehensive
|
Earnings
|
Total
|
|||||||||||||||||||||
|
Common Stock
|
Paid-In
|
Income
|
(Accumulated
|
Stockholders'
|
||||||||||||||||||||
|
Shares
|
Amount
|
Capital
|
(Loss)
|
Deficit)
|
Equity
|
|||||||||||||||||||
|
Balance – December 31, 2007
|
28,695,922 | $ | 28,696 | $ | 22,259,921 | $ | - | $ | 4,381,400 | ) | $ | 17,907,217 | ||||||||||||
|
Issued 7,500 Common Shares to Roepke Communications for services
|
7,500 | 8 | 49,867 | - | - | 49,875 | ||||||||||||||||||
|
Issued 318,495 Common Shares for Leasehold Interest Gas Properties, LLC for Leasehold Interest (Value between $2.30 and $11.98 per Common Share)
|
318,495 | 319 | 2,084,053 | - | - | 2,084,372 | ||||||||||||||||||
|
Issued 20,000 Common Shares of Restricted Stock for employee services
|
20,000 | 20 | (20 | ) | - | - | - | |||||||||||||||||
|
Listing Fee Paid to American Stock Exchange
|
- | - | (65,000 | ) | - | - | (65,000 | ) | ||||||||||||||||
|
Issued Pursuant to Exercise of Options
|
260,000 | 260 | 933,540 | - | - | 933,800 | ||||||||||||||||||
|
Issued Pursuant to Exercise of Warrants
|
4,818,186 | 4,818 | 25,977,244 | - | - | 25,982,062 | ||||||||||||||||||
|
Warrant Exercise Costs
|
- | - | (77,204 | ) | - | - | (77,204 | ) | ||||||||||||||||
|
Stock Grant Compensation
|
- | - | 105,375 | - | - | 105,375 | ||||||||||||||||||
|
Unrealized Losses on Auction Rate Securities
|
- | - | - | (240,774 | ) | - | (240,774 | ) | ||||||||||||||||
|
Income Tax Benefit from Options Exercised
|
- | - | 425,000 | - | - | 425,000 | ||||||||||||||||||
|
Net Income - As Adjusted
|
- | - | - | 2,424,340 | 2,424,340 | |||||||||||||||||||
|
Balance – December 31, 2008
|
34,120,103 | $ | 34,121 | $ | 51,692,776 | $ | (240,774 | ) | $ | (1,957,060 | ) | $ | 49,529,063 | |||||||||||
|
Warrants Issued Included for Debt Issuance Costs
|
- | - | 221,153 | - | - | 221,153 | ||||||||||||||||||
|
Stock Grant Compensation
|
- | - | 366,690 | - | - | 366,690 | ||||||||||||||||||
|
Net Change in Cash Flow Hedge Derivatives
|
- | - | - | (1,483,639 | ) | - | (1,483,639 | ) | ||||||||||||||||
|
Unrealized Gain on Short-Term Investments
|
- | - | - | (486,207 | ) | - | (486,207 | ) | ||||||||||||||||
|
Issued 180,000 shares as Debt Issuance Costs
|
180,000 | 180 | 475,020 | - | - | 475,200 | ||||||||||||||||||
|
Issued 283,670 Shares as Compensation/Director Fees (Value between $2.84 and $9.70 per Common Share)
|
283,670 | 284 | 2,092,695 | - | - | 2,092,979 | ||||||||||||||||||
|
Accumulated
|
||||||||||||||||||||||||
|
Other
|
Retained
|
|||||||||||||||||||||||
|
Additional
|
Comprehensive
|
Earnings
|
Total
|
|||||||||||||||||||||
|
Common Stock
|
Paid-In
|
Income
|
(Accumulated
|
Stockholders'
|
||||||||||||||||||||
|
Shares
|
Amount
|
Capital
|
(Loss)
|
Deficit)
|
Equity
|
|||||||||||||||||||
|
Sale of 2,250,000 Common Shares for $6.00 Per Share
|
2,250,000 | 2,250 | 13,497,750 | - | - | 13,500,000 | ||||||||||||||||||
|
Sale of 6,500,000 Common Shares for $9.12 Per Share
|
6,500,000 | 6,500 | 59,273,500 | - | - | 59,280,000 | ||||||||||||||||||
|
Issued 128,907 Common Shares for Leasehold Interest
(Value between $4.25 and $11.46 per Common Share)
|
128,097 | 128 | 1,115,610 | - | - | 1,115,738 | ||||||||||||||||||
|
Repurchase of 2,084 Common Shares
|
(2,084 | ) | (2 | ) | (20,213 | ) | - | - | (20,215 | ) | ||||||||||||||
|
Costs of Capital Raise
|
- | - | (3,785,264 | ) | - | - | (3,785,264 | ) | ||||||||||||||||
|
Issued 361,330 Common Shares of Restricted Stock
|
361,330 | 361 | (361 | ) | - | - | - | |||||||||||||||||
|
Repurchase of 52,061 Common Shares
|
(52,061 | ) | (52 | ) | (517,948 | ) | - | - | (518,000 | ) | ||||||||||||||
|
Issued Pursuant to Exercise of Options
|
100,000 | 100 | 517,900 | - | - | 518,000 | ||||||||||||||||||
|
Share Adjustment Related to Kentex Transaction
|
41,989 | 42 | (42 | ) | - | - | - | |||||||||||||||||
|
Income Tax Provision for Share Based Compensation
|
- | - | (45,000 | ) | - | - | (45,000 | ) | ||||||||||||||||
|
Net Income
|
- | - | - | - | 2,798,952 | 2,798,952 | ||||||||||||||||||
|
Balance - December 31, 2009
|
43,911,044 | $ | 43,912 | $ | 124,884,266 | $ | (2,210,620 | ) | $ | 841,892 | $ | 123,559,450 | ||||||||||||
|
Stock Grant Compensation
|
- | - | 4,439,101 | - | - | 4,439,101 | ||||||||||||||||||
|
Net Change in Cash Flow Hedge Derivatives
|
- | - | - | 711,554 | - | 711,554 | ||||||||||||||||||
|
Net Change in Unrealized Gain(Loss) on Short-term Investments
|
- | - | - | 553,135 | - | 553,135 | ||||||||||||||||||
|
Issued 213,075 Shares as Compensation
(Value between $12.32 and $22.85 per Common Share)
|
213,075 | 211 | 4,293,903 | - | - | 4,294,114 | ||||||||||||||||||
|
Sale of 5,750,000 Common Shares for $14.40 Per Share
|
5,750,000 | 5,750 | 82,794,250 | - | - | 82,800,000 | ||||||||||||||||||
|
Sale of 10,292,500 Common Shares for $20.25 Per Share
(Net of Underwriting Fee of $8,336,925)
|
10,292,500 | 10,293 | 200,075,907 | - | - | 200,086,200 | ||||||||||||||||||
|
Issued 882,491 Common Shares for Leasehold Interest
(Value between $9.67 and $16.80 per Common Share)
|
882,491 | 883 | 12,678,539 | - | - | 12,679,422 | ||||||||||||||||||
|
Cost of Capital Raises
|
- | - | (692,794 | ) | - | - | (692,794 | ) | ||||||||||||||||
| Issued 1,058,000 Common Shares of Restricted Stock | 1,058,000 | 1,058 | (1,058 | ) | - | - | - | |||||||||||||||||
|
Accumulated
|
||||||||||||||||||||||||
|
Other
|
Retained
|
|||||||||||||||||||||||
|
Additional
|
Comprehensive
|
Earnings
|
Total
|
|||||||||||||||||||||
|
Common Stock
|
Paid-In
|
Income
|
(Accumulated
|
Stockholders'
|
||||||||||||||||||||
|
Shares
|
Amount
|
Capital
|
(Loss)
|
Deficit)
|
Equity
|
|||||||||||||||||||
|
Issued Pursuant to Cashless Exercise of Stock Options
|
22,314 | 22 | (22 | ) | - | - | - | |||||||||||||||||
|
Income Tax Provision for Share Based Compensation
|
- | - | 12,000 | - | - | 12,000 | ||||||||||||||||||
|
Net Income
|
- | - | - | - | 6,917,300 | 6,917,300 | ||||||||||||||||||
|
Balance - December 31, 2010
|
$ | 62,129,424 | $ | 62,129 | $ | 428,484,092 | $ | (945,931 | ) | $ | 7,759,192 | $ | 435,359,482 | |||||||||||
The accompanying notes are an integral part of these financial statements.
NOTES TO FINANCIAL STATEMENTS
DECEMBER 31, 2010
Northern Oil and Gas, Inc. (the “Company,” “our” and words of similar import) is a growth-oriented independent energy company engaged in the acquisition, exploration, exploitation and development of crude oil and natural gas properties. The Company’s common stock trades on the NYSE Amex Equities Market under the symbol “NOG”.
The Company acquires interests in crude oil and natural gas acreage and drilling projects, primarily within the Williston Basin Bakken Shale formation. The Company is continuing to develop its substantial leasehold acreage in the Bakken play and will target additional opportunities in the Bakken and Three Forks play utilizing its first mover leasing advantage. The Company owns working interest in wells, and does not lease land to operators. Management believes the Company’s advantage gained by participating as a non-operating partner has given the Company valuable data on completions and will help its operating partners control well costs and enhance results as the Company continues to develop its higher working interest sections in 2011 and beyond.
The Company participates on a heads up basis proportionate to its working interest in declared drilling units. As of December 31, 2010, our principal assets included approximately 153,170 net acres located in the northern region of the United States of which the Company controlled approximately 140,216 net mineral acres in the Williston Basin targeting the Bakken and Three Forks formations, which provides the potential to drill approximately 876 net wells using 960 acre spacing units assuming three horizontal Bakken and three horizontal Three Forks per spacing unit. The Company continues to expand its position through aggressive acquisition and leasing programs.
The Company’s land acquisition and field operations, along with various other services, are primarily outsourced through the use of consultants and drilling partners. The Company will continue to retain independent contractors to assist in operating and managing the prospects and other administrative functions. With the additional acquisition of crude oil and natural gas properties, the Company intends to continue to use both in-house employees and outside consultants to develop and exploit its leasehold interests.
As an independent crude oil and natural gas producer, the Company’s revenue, profitability and future rate of growth are substantially dependent on prevailing prices of crude oil and natural gas. A substantial or extended decline in crude oil or natural gas prices could have a material adverse effect on the Company’s financial position, results of operations, cash flows and access to capital, and on the quantities of natural gas and crude oil reserves that can be economically produced.
These financial statements have been prepared in accordance with accounting principles generally accepted in the United States of America (“GAAP”).
Cash and Cash Equivalents
The Company considers highly liquid investments with insignificant interest rate risk and original maturities to the Company of three months or less to be cash equivalents. Cash equivalents consist primarily of interest-bearing bank accounts and money market funds. The Company’s cash positions represent assets held in checking and money market accounts. These assets are generally available on a daily or weekly basis and are highly liquid in nature. Due to the balances being greater than $250,000, the Company does not have FDIC coverage on the entire amount of bank deposits. The company believes this risk is minimal. In addition, the Company is subject to Security Investor Protection Corporation (SIPC) protection on a vast majority of its financial assets.
Short-Term Investments
All marketable debt and equity securities and United States Treasuries that are included in short-term investments are considered available-for-sale and are carried at fair value. The short-term investments are considered current assets due their maturity term or the Company’s ability and intent to use them to fund current operations. The unrealized gains and losses related to these securities are included in accumulated other comprehensive income (loss). The realized gains and losses related to these securities are included in other income (expense) in the statements of operations.
Other Property and Equipment
Property and equipment that are not crude oil and natural gas properties are recorded at cost and depreciated using the straight-line method over their estimated useful lives of three to fifteen years. Expenditures for replacements, renewals, and betterments are capitalized. Maintenance and repairs are charged to operations as incurred. Long-lived assets, other than crude oil and natural gas properties, are evaluated for impairment to determine if current circumstances and market conditions indicate the carrying amount may not be recoverable. The Company has not recognized any impairment losses on non crude oil and natural gas long-lived assets. Depreciation expense was $176,595, $91,794, and $67,060 for the years ended December 31, 2010, 2009, and 2008.
Debt Issuance Costs
In February 2009, the Company entered into a revolving credit facility with CIT Capital USA, Inc. (“CIT”) (See Note 9). The Company incurred costs related to this facility that were capitalized on the Balance Sheet as Debt Issuance Costs. Included in the Debt Issuance Costs are direct costs paid to third parties for broker fees and legal fees, 180,000 shares of restricted common stock paid as additional compensation for broker fees, and the fair value of 300,000 warrants issued to CIT. The fair value of the warrants was calculated using the Black-Scholes valuation model based on factors present at the time of closing. CIT exercised these warrants at a price of $5.00 per share in January 2011. The initial total amount capitalized for Debt Issuance Costs was $1,670,000 related to the original agreement with CIT. In May 2009, the Company amended the revolving credit facility with CIT to allow for additional borrowings. The Company incurred and capitalized $216,414 of direct costs related to this amendment.
In May 2010, the Company completed an assignment of its revolving credit facility to Macquarie Bank Limited (“Macquarie”) from CIT. In connection with the assignment, the Company and Macquarie entered into an Amended and Restated Credit Agreement governing the credit facility. The Company incurred and capitalized $386,179 of direct costs related to this assignment and amendment.
The remaining capitalized costs from the original February 2009 agreement and the May 2009 amendment to the agreement and the additional costs for the assignment and amendment of the facility in May 2010 are being amortized over the remaining term of the amended facility using the effective interest method.
The amortization of debt issuance costs for the year ended December 31, 2010 and 2009 was $455,302 and $459,343, respectively.
Asset Retirement Obligations
The Company records the fair value of a liability for an asset retirement obligation in the period in which the asset is acquired and a corresponding increase in the carrying amount of the related long-lived asset.
The Asset Retirement Obligation is included in Other Noncurrent Liabilities on the balance sheet.
The liability is accreted to its present value each period, and the capitalized cost is depreciated over the useful life of the related asset. If the liability is settled for an amount other than the recorded amount, a gain or loss is recognized.
Revenue Recognition and Natural Gas Balancing
The Company recognizes crude oil and natural gas revenues from its interests in producing wells when production is delivered to, and title has transferred to, the purchaser and to the extent the selling price is reasonably determinable. The Company uses the sales method of accounting for natural gas balancing of natural gas production and would recognize a liability if the existing proven reserves were not adequate to cover the current imbalance situation. As of December 31, 2010, 2009, and 2008, the Company’s natural gas production was in balance, meaning its cumulative portion of natural gas production taken and sold from wells in which it has an interest equaled its entitled interest in natural gas production from those wells.
Stock-Based Compensation
The Company has accounted for stock-based compensation under the provisions of FASB Accounting Standards Codification (ASC) 718-10-55
.
This standard requires the Company to record an expense associated with the fair value of stock-based compensation. For options, the Company uses the Black-Scholes option valuation model to calculate stock based compensation at the date of grant. Option pricing models require the input of highly subjective assumptions, including the expected price volatility. Changes in these assumptions can materially affect the fair value estimate.
Income Taxes
The Company accounts for income taxes under FASB ASC 740-10-30. Deferred income tax assets and liabilities are determined based upon differences between the financial reporting and tax bases of assets and liabilities and are measured using the enacted tax rates and laws that will be in effect when the differences are expected to reverse. Accounting standards require the consideration of a valuation allowance for deferred tax assets if it is “more likely than not” that some component or all of the benefits of deferred tax assets will not be realized.
Stock Issuance
The Company records the stock-based compensation awards issued to non-employees and other external entities for goods and services at either the fair market value of the goods received or services rendered or the instruments issued in exchange for such services, whichever is more readily determinable, using the measurement date guidelines enumerated in FASB ASC 505-50-30
.
Net Income (Loss) Per Common Share
Basic earnings per share (“EPS”) are computed by dividing net income (the numerator) by the weighted average number of common shares outstanding for the period (the denominator). Diluted EPS is computed by dividing net income by the weighted average number of common shares and potential common shares outstanding (if dilutive) during each period. Potential common shares include stock options and warrants. The number of potential common shares outstanding relating to stock options and warrants is computed using the treasury stock method.
As of December 31, 2010, there were 265,963 potentially dilutive shares from stock options that became exercisable in 2007.
In addition, as of December 31, 2010, there were 300,000 warrants that were issued in conjunction with the February 2009 revolving credit facility with CIT that remained outstanding and exercisable. The warrants were exercised at a price of $5.00 per share in January 2011.
Full Cost Method
The Company follows the full cost method of accounting for crude oil and natural gas operations whereby all costs related to the exploration and development of crude oil and natural gas properties are initially capitalized into a single cost center (“full cost pool”). Such costs include land acquisition costs, geological and geophysical expenses, carrying charges on non-producing properties, costs of drilling directly related to acquisition, and exploration activities. Internal costs that are capitalized are directly attributable to acquisition, exploration and development activities and do not include costs related to the production, general corporate overhead or similar activities. Costs associated with production and general corporate activities are expensed in the period incurred. Capitalized costs are summarized as follows for the years ended December 31, 2010, 2009, and 2008:
|
Year Ended December 31,
|
||||||||||||
|
2010
|
2009
|
2008
|
||||||||||
|
Capitalized Certain Payroll and Other Internal Costs
|
$ | 6,559,741 | $ | 2,616,262 | $ | 1,374,071 | ||||||
|
Capitalized Interest Costs
|
59,711 | 624,717 | - | |||||||||
|
Total
|
$ | 6,619,452 | $ | 3,240,979 | $ | 1,374,071 | ||||||
As of December 31, 2010, the Company controlled acreage in Sheridan County, Montana with primary targets including the Red River and Mission Canyon. The Company controlled acreage in Billings, Burke, Divide, Dunn, Golden Valley, McKenzie, Mountrail, Stark and Williams Counties, North Dakota targeting the Bakken and Three Forks formations as well as acreage in Yates County, New York that is prospective for
Trenton/Black River, Marcellus and Queenstown-Medina
natural gas production. See Note 5 for explanation of activities on these properties.
Proceeds from property sales will generally be credited to the full cost pool, with no gain or loss recognized, unless such a sale would significantly alter the relationship between capitalized costs and the proved reserves attributable to these costs. A significant alteration would typically involve a sale of 25% or more of the proved reserves related to a single full cost pool. In the years ended December 31, 2010 and 2008, the Company sold acreage and production for $297,877 and $468,609. The proceeds for these sales were applied to reduce the capitalized costs of crude oil and natural gas properties. There were no property sales for the year ended December 31, 2009.
Capitalized costs associated with impaired properties and capitalized cost related to properties having proved reserves, plus the estimated future development costs, asset retirement costs under FASB ASC 410-20-25 are depleted and amortized on the unit-of-production method based on the estimated gross proved reserves as determined by independent petroleum engineers. The costs of unproved properties are withheld from the depletion base until such time as they are either developed or abandoned. When proved reserves are assigned or the property is considered to be impaired, the cost of the property or the amount of the impairment is added to costs subject to depletion calculations. As of December 31, 2010, the Company included $1,591,790 of costs related to expired leases in Sheridan County, Montana and Yates County, New York, which costs are subject to the depletion calculation.
Capitalized costs of crude oil and natural gas properties (net of related deferred income taxes) may not exceed an amount equal to the present value, discounted at 10% per annum, of the estimated future net cash flows from proved crude oil and natural gas reserves plus the cost of unproved properties (adjusted for related income tax effects). Should capitalized costs exceed this ceiling, impairment is recognized. The present value of estimated future net cash flows is computed by applying the 12-month average price of crude oil and natural gas to estimated future production of proved crude oil and natural gas reserves as of period-end, less estimated future expenditures to be incurred in developing and producing the proved reserves and assuming continuation of existing economic conditions. Such present value of proved reserves’ future net cash flows excludes future cash outflows associated with settling asset retirement obligations that have been accrued on the Balance Sheet. Should this comparison indicate an excess carrying value, the excess is charged to earnings as an impairment expense. As of December 31, 2010, the Company has not
realized any impairment of its properties due to our low basis in the acreage and productivity and economics of its producing wells.
Use of Estimates
The preparation of financial statements under generally accepted accounting principles (“GAAP”) in the United States requires management to make estimates and assumptions that affect the reported amounts of assets and liabilities and disclosure of contingent assets and liabilities at the date of the financial statements and the reported amounts of revenues and expenses during the reporting period. The most significant estimates relate to proved crude oil and natural gas reserve volumes, future development costs, estimates relating to certain crude oil and natural gas revenues and expenses, fair value of derivative instruments, fair value of certain investments, and deferred income taxes. Actual results may differ from those estimates.
Reclassifications
Certain reclassifications have been made to prior years’ reported amounts in order to conform with the current year presentation. In prior years the Company separately indentified share based compensation on its statement of operations. These amounts have been reclassified to be included in general and administrative expense. These reclassifications did not impact the Company’s net income, stockholders’ equity or cash flows.
Derivative Instruments and Price Risk Management
The Company uses derivative instruments from time to time to manage market risks resulting from fluctuations in the prices of crude oil and natural gas. The Company may periodically enter into derivative contracts, including price swaps, caps and floors, which require payments to (or receipts from) counterparties based on the differential between a fixed price and a variable price for a fixed quantity of crude oil or natural gas without the exchange of underlying volumes. The notional amounts of these financial instruments are based on expected production from existing wells. The Company has, and may continue to use exchange traded futures contracts and option contracts to hedge the delivery price of crude oil at a future date.
At the inception of a derivative contract, the Company historically designated the derivative as a cash flow hedge. For all derivatives designated as cash flow hedges, the Company formally documented the relationship between the derivative contract and the hedged items, as well as the risk management objective for entering into the derivative contract. To be designated as a cash flow hedge transaction, the relationship between the derivative and the hedged items must be highly effective in achieving the offset of changes in cash flows attributable to the risk both at the inception of the derivative and on an ongoing basis. The Company historically measured hedge effectiveness on a quarterly basis and hedge accounting would be discontinued prospectively if it determined that the derivative is no longer effective in offsetting changes in the cash flows of the hedged item. Gains and losses deferred in accumulated other comprehensive income related to cash flow hedge derivatives that become ineffective remain unchanged until the related production is delivered. If the Company determines that it is probable that a hedged forecasted transaction will not occur, deferred gains or losses on the
derivative are recognized in earnings immediately. See Note 15 for a description of the derivative contracts which the Company executed during 2010 and 2009.
Derivatives, historically, were recorded on the balance sheet at fair value and changes in the fair value of derivatives were recorded each period in current earnings or other comprehensive income, depending on whether a derivative was designated as part of a hedge transaction and, if it was, depending on the type of hedge transaction. The Company’s derivatives historically consisted primarily of cash flow hedge transactions in which the Company was hedging the variability of cash flows related to a forecasted transaction. Period to period changes in the fair value of derivative instruments designated as cash flow hedges were reported in other comprehensive income and reclassified to earnings in the periods in which the contracts were settled. The ineffective portion of the cash flow hedges were reflected in current period earnings as gain or loss from derivative. Gains and losses on derivative instruments that did not qualify for hedge accounting were included in income or loss from derivatives in the period in which they occur. The resulting cash flows from derivatives were reported as cash flows from operating activities.
On November 1, 2009, due to the volatility of price differentials in the Williston Basin, the Company de-designated all derivatives that were previously classified as cash flow hedges and in addition, the Company has elected not to designate any subsequent derivative contracts as accounting hedges under FASB ASC 815-20-25. As such, all derivative positions are carried at their fair value on the balance sheet and are marked-to-market at the end of each period. Any realized gains and losses are recorded to Gain (Loss) on Settled Derivatives and unrealized gains or losses are recorded to Mark-to-Market of Derivative Instruments on the Statement of Operations rather than as a component of other comprehensive income (loss) or other Income (expense).
Impairment
FASB ASC 360-10-35-21, requires that long-lived assets to be held and used be reviewed for impairment whenever events or changes in circumstances indicate that the carrying amount of an asset may not be recoverable. Oil and gas properties accounted for using the full cost method of accounting (which the Company uses) are excluded from this requirement but continue to be subject to the full cost method’s impairment rules. There was no impairment identified at December 31, 2010, 2009, and 2008.
Change in Accounting Principle Related to Drilling Costs
In 2009, the Company changed its method of accounting for drilling costs from the accrual of drilling costs at the time drilling commenced for a well to recording the costs when amounts are invoiced by operators. Recording
drilling costs when the amounts are invoiced by operators is deemed preferable as it better represents the Company’s actual drilling costs. The recording of drilling costs in this method also is consistent with other companies in the crude oil and natural gas industry. Generally accepted accounting principles require that the impact of the change in accounting be applied retrospectively to all periods presented. As a result, all prior period financial statements have been adjusted to give effect to the cumulative impact of this change.
The following table shows the effects on the Company’s Balance Sheet:
|
Year Ended December 31, 2008,
|
||||||||||||
|
As Reported
|
Adjusted
|
Effect of Change
|
||||||||||
|
Deferred Tax Asset – Current
|
$ | 1,433,000 | $ | 1,390,000 | $ | (43,000 | ) | |||||
|
Oil and Gas Properties, Full Cost Method
|
55,680,567 | 47,260,838 | (8,419,729 | ) | ||||||||
|
Accumulated Depreciation and Depletion
|
856,010 | 748,421 | (107,589 | ) | ||||||||
|
Accrued Drilling Costs
|
8,419,729 | - | (8,419,729 | ) | ||||||||
|
Accumulated Deficit
|
$ | (2,021,649 | ) | $ | (1,957,060 | ) | $ | 64,589 | ||||
The following table shows the effect on the Company’s Statement of Operations:
|
Year Ended December 31, 2008,
|
||||||||||||
|
As Reported
|
Adjusted
|
Effect of Change
|
||||||||||
|
Depletion Expense
|
$ | 785,504 | $ | 677,915 | $ | (107,589 | ) | |||||
|
Income Tax Provision (Benefit)
|
(873,000 | ) | (830,000 | ) | 43,000 | |||||||
|
Net Income
|
$ | 2,359,751 | $ | 2,424,340 | $ | 64,589 | ||||||
|
Earnings Per Share – Basic
|
$ | 0.07 | $ | 0.08 | $ | 0.01 | ||||||
|
Earnings Per Share – Diluted
|
$ | 0.07 | $ | 0.07 | $ | - | ||||||
The following table shows the effect on the Company’s Statement of Cash Flows:
|
Year Ended December 31, 2008,
|
||||||||||||
|
As Reported
|
Adjusted
|
Effect of Change
|
||||||||||
|
Net Income
|
$ | 2,359,751 | $ | 2,424,340 | $ | 64,589 | ||||||
|
Depletion of Oil and Gas Properties
|
785,504 | 677,915 | (107,589 | ) | ||||||||
|
Income Tax Benefit
|
(873,000 | ) | (830,000 | ) | 43,000 | |||||||
|
Increase in Accrued Drilling Costs
|
8,419,729 | - | (8,419,729 | ) | ||||||||
|
Increase in Oil and Gas Properties
|
(46,416,886 | ) | (37,997,157 | ) | 8,419,729 | |||||||
New Accounting Pronouncements
In January 2010, the Financial Accounting Standards Board (the “FASB”) issued Accounting Standards Update (“ASU”) No. 2010-06,
Fair Value Measurements and Disclosures (Topic 820)–Improving Disclosures about Fair Value Measurements
, which requires new disclosures and clarifies existing disclosure requirements related to fair value measurements. The new standard requires additional disclosures related to (i) the amounts of significant transfers between Level 1 and Level 2 fair value measurements and the reasons for the transfers, (ii) the reasons for any transfers in or out of Level 3 measurements, and (iii) the presentation of information in the rollforward of recurring Level 3 measurements about purchases, sales, issuances, and settlements on a gross basis. The new standard was effective for interim and annual reporting periods beginning after December 15, 2009, except for the disclosure requirements related to the gross presentation of purchases, sales, issuances, and settlements in the Level 3 rollforward. Those disclosures, which are not expected to have a material impact on the Company’s financial statements, are effective for fiscal years beginning after December 15, 2010 and will be incorporated into the Company’s Quarterly Report on Form 10-Q for the period ending March 31, 2011.
In February 2010, the FASB issued ASU 2010-09, “Subsequent Events (Topic 855) - Amendments to Certain Recognition and Disclosure Requirements.” ASU 2010-09 requires an entity that is a SEC filer to evaluate subsequent events through the date that the financial statements are issued and removes the requirement that a SEC filer disclose the date through which subsequent events have been evaluated. ASC 2010-09 was effective upon issuance. The adoption of this standard had no effect on the Company’s results of operations or financial position.
In April 2010, the FASB issued ASU 2010-13, “Compensation - Stock Compensation (Topic 718) - Effect of Denominating the Exercise Price of a Share-Based Payment Award in the Currency of the Market in Which the Underlying Equity Security Trades.” ASU 2010-13 provides amendments to Topic 718 to clarify that an employee share-based payment award with an exercise price denominated in the currency of a market in which a substantial portion of the entity’s equity securities trades should not be considered to contain a condition that is not a market, performance, or service condition. Therefore, an entity would not classify such an award as a liability if it otherwise qualifies as equity. The amendments in ASU 2010-13 are effective for fiscal years, and interim periods within those fiscal years, beginning on or after December 15, 2010. The adoption of this standard will not have an effect on the Company’s results of operations or financial position.
From time to time, new accounting pronouncements are issued by FASB that are adopted by the Company as of the specified effective date. If not discussed, management believes that the impact of recently issued standards, which are not yet effective, will not have a material impact on the Company’s financial statements upon adoption.
All marketable debt and equity securities and United States Treasuries that are included in short-term investments are considered available-for-sale and are carried at fair value. The short-term investments are considered current assets due to their maturity term or the company’s ability and intent to use them to fund current operations. The unrealized gains and losses related to these securities are included in accumulated other comprehensive income (loss). The realized gains and losses related to these securities are included in other income in the statements of operations.
The following is a summary of our short-term investments as of December 31, 2010:
|
Fair Market
|
||||||||||||
|
Cost at
|
Value at
|
|||||||||||
|
December 31,
|
Unrealized
|
December 31,
|
||||||||||
|
2010
|
(Loss)
|
2010
|
||||||||||
|
United States Treasuries
|
$ | 40,009,546 | $ | (282,846 | ) | $ | 39,726,700 | |||||
For the year ended December 31, 2010, the Company realized losses of $58,524 on the sale of short-term investments. There were no realized gains and losses recognized on the sale of investments for the year ended December 31, 2009 and minimal gains or losses recognized on the sales of investments for the year ended December 31, 2008.
The Company reviews these investments on a quarterly basis to determine if it is probable that the Company will realize some portion of the unrealized loss in accordance with FASB ASC 320-10-35
. In determining if the difference between cost and estimated fair value of the short-term investments was deemed either temporary or other-than-temporary impairment, the Company evaluated each type of short-term investment using a set of criteria including decline in value, duration of the decline, period until anticipated recovery, nature of investment, probability of recovery, financial condition and near-term prospects of the issuer, the Company’s intent and ability to retain the investment, attributes of the decline in value, status with rating agencies, status of principal and interest payments and any other issues related to the underlying securities. The Company determined the decline in the fair values in all of the short-term investments were temporary as of December 31, 2010.
Property and equipment at December 31, 2010 and 2009, consisted of the following:
|
Year Ended December 31,
|
||||||||
|
2010
|
2009
|
|||||||
|
Oil and Gas Properties, Full Cost Method
|
||||||||
|
Unproved Costs, Not Subject to Amortization or Ceiling Test
|
$ | 136,135,163 | $ | 53,862,529 | ||||
|
Proved Costs
|
158,846,475 | 42,939,097 | ||||||
| 294,981,638 | 96,801,626 | |||||||
|
Other Property and Equipment
|
2,479,199 | 439,656 | ||||||
| 297,460,837 | 97,241,282 | |||||||
|
Less: Accumulated Depreciation, Depletion and Amortization
|
||||||||
|
Property and Equipment
|
22,152,356 | 5,091,198 | ||||||
|
Total
|
$ | 275,308,481 | $ | 92,150,084 | ||||
The following table shows depreciation, depletion, and amortization expense by type of asset:
|
Year Ended December 31,
|
||||||||
|
2010
|
2009
|
|||||||
|
Depletion of Costs for Proved Oil and Gas Properties
|
$ | 16,884,563 | $ | 4,250,983 | ||||
|
Depreciation of Other Property and Equipment
|
176,595 | 91,794 | ||||||
|
Total Depreciation, Depletion, and Amortization Expense
|
$ | 17,061,158 | $ | 4,342,777 | ||||
The value of the Company’s crude oil and natural gas properties consists of all acreage acquisition costs (including cash expenditures and the value of stock consideration), drilling costs and other associated capitalized costs. Each of these costs contributed to the Company’s approximate $198 million increase in crude oil and natural gas properties during 2010.
Acquisitions
Montana Acquisitions
At various points in 2009, the Company acquired leasehold interests in approximately 6,100 net mineral acres in development areas located in Roosevelt, Richland and Sheridan Counties, Montana, in which the Company is targeting the Bakken Shale.
On November 13, 2009, the Company entered into a Letter of Intent with Slawson pursuant to which the Company agreed to acquire a 20% working interest ownership in the exploration and development of Slawson’s Big Sky Project in Richland County, Montana for which Slawson controls leasehold interest in 13,401 gross acres and 11,586 net acres. For each well the Company elects to participate, the Company will pay a participation interest share of all costs to drill, equip, complete, test and plug such well(s) on an at cost basis.
North Dakota Acquisitions
At various points in late 2007 and throughout 2008, the Company acquired leasehold interests in approximately 21,498 net mineral acres of land via bulk purchases in the core development area of Mountrail County, North Dakota. The Company paid a combination of cash and stock as consideration for such acquisitions, including the issuance of an aggregate of 633,027 restricted shares of its common stock. In addition to these major acquisitions the Company completed a series of small transactions pursuant to which it purchased leasehold interests in approximately 8,000 net mineral acres in Mountrail County.
On June 11, 2008, the Company entered into a purchase agreement pursuant to which it ultimately acquired leasehold interests in approximately 23,210 net mineral acres primarily in Dunn County, North Dakota. The Company also completed various additional acquisitions of crude oil and natural gas leasehold interests through numerous small transactions with several parties in fiscal years 2007 and 2008.
At various points in 2007 and 2008, the Company purchased leasehold interests in approximately 10,000 net mineral acres in and around Burke and Divide Counties of North Dakota for cash consideration.
In May 2009, the Company entered into an exploration and development agreement with Slawson Exploration Company, Inc. (Slawson) pursuant to which the Company acquired certain North Dakota Bakken assets from Windsor Bakken LLC as part of a syndicate led by privately owned Slawson. Pursuant to the agreement, the Company purchased a 5% interest of the undeveloped acreage, including approximately 60,000 net acres. The Company also acquired an additional 9% interest in the existing well bores purchased from Windsor Bakken LLC, providing the Company an aggregate 14% interest in the existing 59 gross Bakken and Three Forks well bores in North Dakota including approximately 1,200 barrels of crude oil production per day. In the transaction, the Company purchased approximately 300,000 barrels of proven producing reserves as well as approximately 3,000 net undeveloped acres. The Company paid a total cost of $7,300,000 for the initial acquisition of acreage and well bore interests.
On November 3, 2009, along with Slawson the Company acquired 24 high working interest sections comprising approximately 12,000 net acres located in western McKenzie and Williams Counties of North Dakota. The Company acquired a 50% interest in these properties and will participate in drilling on a heads-up basis. These properties are proximal to several recent high-rate producing wells. The Company paid approximately $1,100 per net acre acquired in this acquisition and expect to begin drilling these properties in early 2011.
On November 17, 2009, the Company entered into an Exploration and Development Agreement with Area of Mutual Interest with Slawson pursuant to which the Company agreed to participate with a 50% working interest ownership, which equates to a 30% participation interest in the exploration and development of Slawson’s Anvil Project in Roosevelt and Sheridan Counties, Montana and Williams County, North Dakota. In the transaction, the Company acquired an interest in 12,500 net acres in leases at $750 per net acre for a 30% interest and an aggregate sum of $2,812,500. The Company agreed to participate in all costs to drill, equip, complete, test and plug the well and to pay costs for the well on an at cost basis. The Company has the option to elect to participate or not participate as to each well drilled in the applicable project area. For each well in which the Company elects to participate, the Company will pay a participation interest share of all costs to drill, equip, complete, test and plug such wells on an at cost basis.
During 2010, the Company acquired approximately 56,858 net mineral acres, for an average cost of $1,043 per net acre, in all of its key prospect areas in the form of both effective leases and top-leases.
During 2010, the Company completed acreage acquisitions involving properties spanning across the following counties of North Dakota: Burke, Divide, Dunn, McKenzie, Mountrail, Stark and Williams. The Company generally values acreage subject to near-term drilling activities on a lease-by-lease basis because it believes each lease’s contribution to a subject spacing unit is best assessed on that basis if development timing is sufficiently clear. Consistent with that approach, the majority of the Company’s acreage acquisitions involve properties that are “hand-picked” by the Company on a lease-by-lease basis for their contribution to a well expected to be spud in the near future, and the subject leases are then aggregated to complete one single closing with the transferor. As such, the Company generally views each acreage assignment from brokers, landmen and other parties as involving several separate acquisitions combined into one closing with the common transferor for convenience. However, in certain instances an acquisition may involve a larger number of leases presented by the transferors as a single package without negotiation on a lease-by-lease basis. In those instances, the Company still reviews each lease on a lease-by-lease basis to ensure that the package as a whole meets its acquisition criteria and drilling expectations. In December of 2010, the Company acquired a 50% working interest from Slawson in approximately 14,538 net acres in Richland County, Montana. That acquisition accounted for approximately 12.8% of total number of net acres the Company acquired during 2010.
No other acquisition involved more than 10% of the total acreage the Company acquired during the year.
In June of 2010, the Company acquired approximately 3,498 net acres for $1,750 per net acre in Williams and McKenzie Counties of North Dakota. The Company issued and aggregate of 382,645 shares of its common stock and paid $761,464 in cash as consideration for the acreage. The fair value of the stock issued was $5,360,859 or $14.01 per share, based upon the market value of the Company’s common stock in the date the shares were registered with the SEC for resale, which is the date the leasehold interests were acquired.
In July of 2010, the Company acquired approximately 3,352 net acres for $2,000 per net acre in Divide County, North Dakota. The Company issued 444,186 shares of common stock as consideration for the acreage. The fair value of the stock issued was $6,529,534 or $14.70 per share, based upon the market value of the Company’s common stock on the date the leasehold interest was acquired.
The Company has also completed other miscellaneous non-material acquisitions in North Dakota, and utilized a combination of stock and cash consideration for some of the acquisitions.
Certain of the foregoing acquisitions were purchased using the services of, or purchased from, parties considered to be related to the Company or the Company’s Chief Executive Officer, Michael L. Reger. See Note 7. All transactions involving related parties were approved by the Company’s Board of Directors or Audit Committee.
Unproved Properties
The Company’s unproved properties not being amortized comprise of approximately 131,945 net acres of undeveloped leasehold interests. The Company believes that the majority of our unproved costs will become subject to depletion within the next five years by proving up reserves relating to the acreage through exploration and development activities, by impairing the acreage that will expire before the Company can explore or develop it further or by determining that further exploration and development activity will not occur.
Excluded costs for unproved properties are accumulated by year. Costs are reflected in the full cost pool as the drilling costs are incurred or as costs are evaluated and deemed impaired. The Company anticipates these excluded costs will be included in the depletion computation over the next five years. The Company is unable to predict the future impact on depletion rates. The following is a summary of capitalized costs excluded from depletion at December 31, 2010 by year incurred.
|
Year Ended December 31,
|
||||||||||||||||
|
2010
|
2009
|
2008
|
Prior Years
|
|||||||||||||
|
Property Acquisition
|
$ | 63,636,650 | $ | 16,061,848 | $ | 24,938,734 | $ | 5,147,236 | ||||||||
|
Drilling
|
26,350,695 | - | - | - | ||||||||||||
|
Total
|
$ | 89,987,345 | $ | 16,061,848 | $ | 24,938,734 | $ | 5,147,236 | ||||||||
The Company had 11.69 net wells drilling and completing as of December 31, 2010. All properties that are not classified as proven properties are considered unproved properties and, thus, the costs associated with such properties are not subject to depletion. Once a property is classified as proven, all associated acreage and drilling costs are subject to depletion.
The Company historically has acquired its properties by purchasing individual or small groups of leases directly from mineral owners or from landmen or lease brokers, which leases historically have not been subject to specified drilling projects, and by purchasing lease packages in identified project areas controlled by specific operators. The Company generally participates in drilling activities on a heads up basis by electing whether to participate in each well on a well-by-well basis at the time wells are proposed for drilling, with the exception of three defined drilling projects with Slawson.
As of December 31, 2010, the Company was participating in three defined drilling projects with Slawson covering an aggregate of 9,390 net acres controlled by the Company. The Windsor project area includes approximately 3,323 net acres controlled by the Company, primarily located in Mountrail and surrounding counties of North Dakota. The Anvil project includes approximately 3,750 net acres controlled by the Company in Roosevelt and Sheridan Counties of Montana and Williams County of North Dakota. The South West Big Sky project includes approximately 2,317 total net acres controlled by the Company in Richland County of Montana.
The Company believes that the majority of its unproved costs will become subject to depletion within the next five years by proving up reserves relating to its acreage through exploration and development activities, by impairing the acreage that will expire before the Company can explore or develop it further or by determining that further exploration and development activity will not occur. The timing by which all other properties will become subject to depletion will be dependent upon the timing of future drilling activities and delineation of our reserves.
The Company’s Articles of Incorporation authorize the issuance of up to 100,000,000 shares. The shares are classified in two classes, consisting of 95,000,000 shares of common stock, par value $.001 per share, and 5,000,000 shares of preferred stock, par value $.001 per share. The Board of Directors is authorized to establish one or more series of preferred stock, setting forth the designation of each such series, and fixing the relative rights and preferences of each such series. The Company has neither designated nor issued any shares of preferred stock.
In 2008 optionees exercised 260,000 stock options granted in 2006 and 2007, resulting in cash proceeds to the Company of $933,800. A tax benefit of $425,000 related to fully vested stock option awards exercised was recorded as an increase to additional paid-in capital
In February 2009, the Company agreed to issue 92,000 shares of Common Stock to three employees of the company as compensation for their services. The employees were fully vested in the shares on the date of the grant. The fair value of the stock to be issued was $261,280 or $2.84 per share, the market value of a share of common stock on the date the stock was obligated to be issued. The entire amount of this stock award was expensed in the year ended December 31, 2009.
On February 27, 2009, the Company closed on a revolving credit facility with CIT Capital USA, Inc. (“CIT”). As part of obtaining this credit facility agreement the Company entered into an engagement with Cynergy Advisors, LLC (Cynergy). As part of the compensation for the work performed on obtaining the financing, Cynergy received 180,000 shares of restricted Common Stock of the Company. The fair value of the restricted stock was $475,200 or $2.64 per share, the market value of a share of Common Stock on the date the financing closed. The fair value of this stock was capitalized as Debt Issuance Costs and is being amortized over the amended term of the financing.
On April 3, 2009, the Company acquired leasehold interests in North Dakota. The total consideration paid for this acreage was 49,092 shares of restricted common stock. The fair value of the restricted stock was $224,879, or $4.58 per share, the market value of a share of Common Stock on the date the leasehold interests were acquired.
In June 2009, the Company completed a registered direct offering of 2,250,000 shares of common stock at a price of $6.00 per share for total gross proceeds of $13,500,000. The Company incurred costs of $813,237 related to this offering. These costs were netted against the proceeds of the offering through Additional Paid-In Capital.
On October 26, 2009, the Company deposited 41,989 shares of common stock in a specially-designated shareholder account that had been previously-created to hold shares of our common stock represented by certificates that appear in our stock transfer records but were known to have been cancelled and their underlying shares transferred between July of 1987 and August of 1999. An aggregate of 58,268 shares of our common stock are held in the specially-designated shareholder account, which, following a substantial review of all available historical stock transfer records, the Company concluded represents the maximum number of shares of our common stock that could potentially be released to shareholders who may be able to establish a valid claim to such shares due to previously unrecognized issues with the Company’s stock transfer records. These shares are considered issued and outstanding and are included in the total number of shares outstanding disclosed on the cover page of this report.
On November 4, 2009, the Company completed a registered direct offering of 6,500,000 shares of common stock at a price of $9.12 per share for total gross proceeds of $59,280,000. The Company incurred costs of $2,972,027 related to the offering. These costs were netted against the proceeds of the offering through Additional Paid-in Capital.
In November and December 2009, the issued 79,005 shares of common stock related to the purchase of leasehold interests in North Dakota. The fair value of the stock was $890,859, the market value of the Common Stock on the date the leasehold interests were acquired.
In November 2009, the Company issued 50,000 shares of Common Stock to two employees of the company as compensation for their services. The employees were fully vested in the shares on the date of the grant. The fair value of the stock issued was $457,500 or $9.15 per share, the market value of a share of common stock on the date the stock was issued. The entire amount of this stock award was expensed in the year ended December 31, 2009.
In December 2009, the Company issued 100,000 shares of Common Stock to two executives of the company as compensation for their services. The executives were fully vested in the shares on the date of the grant. The fair value of the stock issued was $970,000 or $9.70 per share, the market value of a share of common stock on the date the stock was issued. The entire amount of this stock award was expensed in the year ended December 31, 2009.
In December 2009, the Company issued 41,670 shares of Common Stock to the Company’s outside Directors as compensation for their services. The Directors were fully vested in the shares on the date of the grant. The fair value of the stock issued was $404,199 or $9.70 per share, the market value of a share of common stock on the date the stock was issued. The entire amount of this stock award was expensed in the year ended December 31, 2009.
In December 2009, a Director of the Company exercised 100,000 stock options granted to him in 2007. The exercise of these options was completed through a cashless exercise whereas the company repurchased 52,061 of common shares to issue the common shares related to this option exercise.
In January 2010, the Company agreed to issue an aggregate of 4,000 shares of Common Stock to two employees of the Company. The shares were fully vested on the date of the grant. The fair value of the stock issued was $50,280 or $12.57 per share, based upon the market value of one share of the Company’s common stock on the date the stock was obligated to be issued. The entire amount of this stock award was expensed in the year ended December 31, 2010.
In January 2010, the Company agreed to issue 1,000 shares of Common Stock to a consultant of the Company. The shares were fully vested on the date of the grant. The fair value of the stock issued was $12,320 or $12.32 per share, based upon the market value of one share of common stock on the date the stock was obligated to be issued. The entire amount of this stock award was expensed in the year ended December 31, 2010.
In March 2010, the Company issued 10,287 shares of Common Stock as part of an acquisition of leasehold interests in North Dakota. The fair value of the stock issued was $99,475 or $9.67 per share, based upon the market value of one share of common stock on the date the leasehold interests were acquired.
In March 2010, pursuant to employment agreements the Company issued an aggregate of 50,000 shares of Common Stock to executives of the Company. The shares were fully vested on the date of the grant. The fair value of the stock issued was $664,500 or $13.29 per share, based upon the market value of one share of common stock on the date the stock was obligated to be issued. The Company expensed $307,331 in share-based compensation related to the issuance for the year ended December 31, 2010. The remainder of the fair value was capitalized into the full cost pool.
In April 2010, the Company entered into an underwriting agreement to sell 5,750,000 shares of common stock at a price of $15.00 less an underwriting discount of $0.60 per share for total net proceeds of approximately $82.8 million, after deducting underwriters’ discounts. The Company incurred costs of $300,000 related to this offering. These costs were netted against the proceeds of the offering through Additional Paid-In Capital.
On June 14, 2010, the Company issued 382,645 shares of Common Stock as part of an acquisition of leasehold interests in North Dakota. The fair value of the stock issued was $5,360,856 or $14.01 per share, based upon the market value of one share of common stock on the date the shares were registered with the SEC for resale, which is the date the leasehold interests were acquired.
On June 18, 2010, the Company granted 14,167 shares of Common Stock related to acquisitions of leasehold interests in North Dakota. The fair value of the stock granted was $238,006 or $16.80 per share, based upon the market value of one share of common stock on the date the leasehold interests were acquired.
On July 13, 2010, the Company granted 31,206 shares of Common Stock related to acquisitions of leasehold interests in North Dakota. The fair value of the stock granted was $451,551 or $14.47 per share, based upon the market value of one share of common stock on the date the leasehold acquisitions were agreed upon.
On July 14, 2010, the Company granted 444,186 shares of Common Stock related to acquisitions of leasehold interests in North Dakota. The fair value of the stock granted was $6,529,534 or $14.70 per share, based upon the market value of one share of common stock on the date the leasehold interests were acquired.
In July 2010, pursuant to an employment agreement the Company issued 5,000 shares of Common Stock to an employee of the Company. The shares were fully vested on the date of the grant. The fair value of the stock issued was $69,250 or $13.85 per share, based upon the market value of one share of common stock on the date the stock was obligated to be issued. The entire amount of this stock award was expensed in the year ended December 31, 2010.
In November 2010, the Company entered into an underwriting agreement to sell 10,292,500 shares of common stock at a price of $20.25 less an underwriting discount of $0.81 per share for total net proceeds of approximately $200.1 million, after deducting underwriters’ discounts. The Company incurred costs of $392,795 related to this offering. These costs were netted against the proceeds of the offering through Additional Paid-In Capital.
In November 2010, the Company issued 153,075 fully vested shares of Common Stock to the executives and employees of the Company as compensation for their services. The fair value of the stock issued was $3,497,764 or $22.85 per share, the market value of a share of common stock on the date the stock was issued. The Company expensed $1,235,429 in share-based compensation related to the issuance for the year ended December 31, 2010. The remainder of the fair value was capitalized into the full cost pool.
Restricted Stock Awards
During the years ended December 31, 2010, 2009, and 2008,the Company issued 1,058,000, 361,330 and 20,000, respectively, restricted shares of common stock as compensation to officers, employees, and directors of the Company. The restricted shares vest over various terms with all restricted shares vesting no later than December 31, 2013. As of December 31, 2010, there was approximately $13.2 million of total unrecognized compensation expense related to unvested restricted stock. This compensation expense will be recognized over the remaining vesting period of the grants. The Company has assumed a zero percent forfeiture rate for restricted stock.
The following table reflects the outstanding restricted stock awards and activity related thereto for the years ended December 31:
|
Year Ended
|
Year Ended
|
Year Ended
|
||||||||||||||||||||||
|
December 31, 2010,
|
December 31, 2009,
|
December 31, 2008,
|
||||||||||||||||||||||
|
Number
|
Weighted-
|
Number
|
Weighted-
|
Number
|
Weighted-
|
|||||||||||||||||||
|
of
|
Average
|
Of
|
Average
|
Of
|
Average
|
|||||||||||||||||||
|
Shares
|
Price
|
Shares
|
Price
|
Shares
|
Price
|
|||||||||||||||||||
|
Restricted Stock Awards:
|
||||||||||||||||||||||||
|
Restricted Shares Outstanding at the Beginning of the Year
|
325,330 | $ | 9.01 | 20,000 | $ | 7.03 | - | $ | - | |||||||||||||||
|
Shares Granted
|
1,058,000 | $ | 14.08 | 361,330 | $ | 8.49 | 20,000 | $ | 7.03 | |||||||||||||||
|
Lapse of Restrictions
|
(247,708) | $ | 11.11 | (56,000 | ) | $ | 4.91 | - | $ | - | ||||||||||||||
|
Restricted Shares Outstanding at the End of the Year
|
1,135,622 | $ | 13.28 | 325,330 | $ | 9.01 | 20,000 | $ | 7.03 | |||||||||||||||
The Company has purchased leasehold interests from South Fork Exploration, LLC (“SFE”) pursuant to a continuous lease program that covers specific agreed upon sections of townships and ranges in Burke, Divide, and Mountrail Counties of North Dakota where SFE previously acquired leasehold interests on the Company’s behalf and is authorized to continue to acquire additional acreage within the proximity of the originally-acquired leases. This program differs from other arrangements where the Company may purchase specific leases in one-time, single closing transactions. In 2008, the Company paid a total of $815,100 related to previously acquired leasehold interests. In 2009, the Company paid a total of $501,603 related to previously acquired leasehold interests. In 2010, the Company paid a total of $5,000 related to previously acquired leasehold interests. Because each lessor separately negotiates its own desired royalty, SFE’s over-riding royalty interest varies from lease to lease. The Company is receiving a net revenue interest ranging from 80.25% to 82.5% net revenue interest in the acquired leases, which is net of royalties and overriding royalties. SFE’s president is J.R. Reger, the brother of the Company’s CEO, Michael Reger. J.R. Reger is also a shareholder in the Company.
The Company has also purchased leasehold interests from Montana Oil Properties (“MOP”). In 2008, the Company purchased leasehold interests from MOP for a total consideration of approximately $5,160,824. In 2009, the Company paid MOP a total of $63,234 related to previously acquired leasehold interests. In July 2010, the Company paid MOP a total of $269,821 for leases and reimbursement costs pertaining to two separate wells in Mountrail County, North Dakota. MOP is controlled by Mr. Tom Ryan and Mr. Steven Reger, both are relatives of the Company’s Chief Executive Officer, Michael Reger.
The Company has also purchased leasehold interests from Gallatin Resources, LLC (“Gallatin”). In 2008, the Company purchased leasehold interests from Gallatin for a total consideration of approximately $22,109. In 2009, the Company paid Gallatin a total of $22,223 related to previously acquired leasehold interests. In 2010, the Company paid Gallatin a total of $15,822 related to a previously acquired leasehold interests. Carter Stewart, one of the Company’s directors, owns a 25% interest in Gallatin. Legal counsel for Gallatin informed the Company that Mr. Stewart does not have the power to control Gallatin Resources because each member of Gallatin has the right to vote on matters in proportion to their respective membership interest in the company and company matters are determined by a vote of the holders of a majority of membership interests. Further, Mr. Stewart is neither an officer nor a director of Gallatin. As such, Mr. Stewart does not have the ability to individually control company decisions for Gallatin.
The Company has a securities account with Morgan Stanley Smith Barney that is managed by Kathleen Gilbertson, a financial advisor with that firm who is the sister of the Company’s president and Director, Ryan Gilbertson.
All transactions involving related parties were approved by the Company’s Board of Directors or Audit Committee.
The Company’s Board of Directors approved a stock option plan in October 2006 (“2006 Stock Option Plan”) to provide incentives to employees, directors, officers, and consultants and under which 2,000,000 shares of common stock have been reserved for issuance. The options can be either incentive stock options or non-statutory stock options and are valued at the fair market value of the stock on the date of grant. The exercise price of incentive stock options may not be less than 100% of the fair market value of the stock subject to the option on the date of the grant and, in some cases, may not be less than 110% of such fair market value. The exercise price of non-statutory options may not be less than 100% of the fair market value of the stock on the date of grant.
On November 1, 2007, the Board of Directors granted 560,000 of options under this 2006 Stock Option Plan. The Company granted 500,000 options in aggregate, to members of the board and 60,000 options to one employee pursuant to an employment agreement. These options were granted at a price of $5.18 per share and the optionees were fully vested on the grant date. Of the 560,000 options, 265,963 shares had been exercised as of December 31, 2010.
The Company accounts for stock-based compensation under the provisions of FASB ASC 718-10-55. This statement requires the Company to record an expense associated with the fair value of stock-based compensation. The Company uses the Black-Scholes option valuation model to calculate stock-based compensation at the date of grant. Option pricing models require the input of highly subjective assumptions, including the expected price volatility. The Company used the simplified method to determine the expected term of the options due to the lack of sufficient historical data. Changes in these assumptions can materially affect the fair value estimate. The total fair value of the options is recognized as compensation over the vesting period. There have been no stock options granted in 2010, 2009, and 2008 under the 2006 Stock Option Plan, and all exercises of options during 2010, 2009, and 2008 related to 2007 grants.
Changes in stock options for the years ended December 31, 2010, 2009, and 2008 were as follows:
|
Number
of
Shares
|
Weighted Average Exercise Price
|
Remaining Contractual Term
(in Years)
|
Intrinsic Value
|
|||||||||||||
|
2008:
|
||||||||||||||||
|
Beginning Balance
|
660,000 | $ | - | - | - | |||||||||||
|
Granted
|
- | - | - | - | ||||||||||||
|
Exercised
|
260,000 | 3.59 | - | - | ||||||||||||
|
Outstanding at December 31
|
400,000 | 5.18 | 8.8 | - | ||||||||||||
|
Exercisable
|
400,000 | 5.18 | 8.8 | - | ||||||||||||
|
Ending Vested
|
400,000 | 5.18 | 8.8 | - | ||||||||||||
|
Weighted Average Fair Value of Options Granted During Year
|
$ | - | ||||||||||||||
|
2009:
|
||||||||||||||||
|
Beginning Balance
|
400,000 | $ | - | - | - | |||||||||||
|
Granted
|
- | - | - | - | ||||||||||||
|
Exercised
|
100,000 | 5.18 | - | - | ||||||||||||
|
Outstanding at December 31
|
300,000 | 5.18 | 7.8 | 1,998,000 | ||||||||||||
|
Exercisable
|
300,000 | 5.18 | 7.8 | 1,998,000 | ||||||||||||
|
Ending Vested
|
300,000 | 5.18 | 7.8 | 1,998,000 | ||||||||||||
|
Weighted Average Fair Value of Options Granted During Year
|
$ | - | ||||||||||||||
|
2010:
|
||||||||||||||||
|
Beginning Balance
|
300,000 | $ | - | - | - | |||||||||||
|
Granted
|
- | - | - | - | ||||||||||||
|
Exercised
|
22,314 | 5.18 | - | - | ||||||||||||
|
Forfeited
|
11,723 | 5.18 | - | - | ||||||||||||
|
Outstanding at December 31
|
265,963 | 5.18 | 6.8 | 5,859,000 | ||||||||||||
|
Exercisable
|
265,963 | 5.18 | 6.8 | 5,859,000 | ||||||||||||
|
Ending Vested
|
265,963 | 5.18 | 6.8 | 5,859,000 | ||||||||||||
|
Weighted Average Fair Value of Options Granted During Year
|
$ | - | ||||||||||||||
Currently Outstanding Options
|
|
·
|
No Options expired during the years ended December 31, 2010, 2009, and 2008.
|
|
|
·
|
The Company recorded no compensation expense related to these options for the years ended December 31, 2010, 2009, and 2008. There is no further compensation expense that will be recognized in future years, relating to all options that have been granted as of December 31, 2010, because the Company recognized the entire fair value of such compensation upon vesting of the options.
|
|
|
·
|
There were no unvested options at December 31, 2010, 2009, and 2008.
|
Warrants Granted February 2009
On February 27, 2009, in conjunction with the closing of the revolving credit facility (see Note 9), the Company issued CIT warrants to purchase a total of 300,000 shares of common stock exercisable at $5.00 per share. The total fair value of the warrants was calculated using the Black-Scholes valuation model based on factors present at the time the warrants were issued. The fair value of the warrants is included in Debt Issuance Costs and are being amortized over the amended term of the facility using the effective interest method. CIT exercised the warrants in January 2011.
The following assumptions were used for the Black-Scholes model:
|
|
February 27,
|
|||
|
|
2009
|
|||
|
Risk free rates
|
1% | |||
|
Dividend yield
|
0% | |||
|
Expected volatility
|
96.43% | |||
|
Weighted average expected warrant life
|
1.5 Years
|
|||
The “fair market value” at the date of issuance for the warrants issued using the formula relied upon for calculating the fair value of warrants is as follows:
|
Weighted average fair value per share
|
|
$
|
0.74
|
|
|
Total warrants granted
|
|
|
300,000
|
|
|
Total weighted average fair value of warrants granted
|
|
$
|
221,153
|
|
In January 2009, the Company’s Board of Directors adopted the 2009 Equity Incentive Plan, pursuant to which the Company may issue up to 3,000,000 shares of our common stock either upon exercise of stock options granted under such plan or through restricted stock awards under such plan. As of December 31, 2010, the Company had issued 1,912,991 shares of common stock pursuant to the Company’s 2009 Equity Incentive Plan (See Note 6).
The table below reflects the status of warrants outstanding at December 31, 2010:
|
|
|
|
|
|
|
|
|
|
|
|
|
|
Common
|
|
|
Exercise
|
|
Expiration
|
||
|
Issue Date
|
|
Shares
|
|
|
Price
|
|
Date
|
||
|
February 27, 2009
|
|
|
300,000
|
|
|
$
|
5.00
|
|
February 27, 2012
|
At December 31, 2010, the per-share weighted average exercise price of outstanding warrants was $5.00 per share, and the weighted average remaining contractual life was 1.2 years. All of the warrants were exercisable as of December 31, 2010. The warrants were exercised in January 2011.
In February 2009, the Company completed the closing of a revolving credit facility with CIT that provided up to a maximum principal amount of $25 million of working capital for exploration and production operations.
On May 26, 2010, the Company completed the assignment of its revolving credit facility to Macquarie from CIT. In connection with the assignment the Company and Macquarie entered into an Amended and Restated Credit Agreement governing the facility (the “Credit Facility”).
The Credit Facility provides up to a maximum principal amount of $100 million of working capital for exploration and production operations. The borrowing base of funds available under the Credit Facility is re-determined semi-annually based upon the net present value, discounted at 10% per annum, of the future net revenues expected to accrue from its interests in proved reserves estimated to be produced from its crude oil and natural gas properties. $25 million of financing is currently available under the Credit Facility. The Credit Facility terminates on May 26, 2014. The Company had no borrowings under the Credit Facility at December 31, 2010 and 2009.
The Company has the option to designate the reference rate of interest for each specific borrowing under the Credit Facility as amounts are advanced. Borrowings based upon the London interbank offering rate (“LIBOR”) will bear interest at a rate equal LIBOR plus a spread ranging from 2.5% to 3.25% depending on the percentage of borrowings base that is currently advanced. Any borrowings not designated as being based upon LIBOR will bear interest at a rate equal to the greater of (a) the current prime rate published by the Wall Street Journal, or (b) the current one month LIBOR rate plus 1.0%, plus in either case a spread ranging from 2% to 2.5%, depending on the percentage of borrowing base that is currently advanced. The Company has the option to designate either pricing mechanism. Payments are due under the Credit Facility in arrears, in the case of a loan based on LIBOR on the last day of the specified interest period and in the case of all other loans on the last day of each March, June, September and December. All outstanding principal is due and payable upon termination of the Credit Facility.
The applicable interest rate increases under the Credit Facility and the lenders may accelerate payments under the Credit Facility, or call all obligations due under certain circumstances, upon an event of default. The Credit Facility references various events constituting a default on the Credit Facility, including, but not limited to, failure to pay interest on any loan under the Credit Facility, any material violation of any representation or warranty under the Amended and Restated Credit Agreement, failure to observe or perform certain covenants, conditions or agreements under the Amended and Restated Credit Agreement, a change in control of the Company, default under any other material indebtedness the Company might have, bankruptcy and similar proceedings and failure to pay disbursements from lines of credit issued under the Credit Facility. The Company was not in default on the Credit Facility as of December 31, 2010, and is not expected to be in default in the future.
The Credit Facility requires that the Company enter into swap agreements with Macquarie for each month of the thirty-six (36) month period following the date on which each such swap agreement is executed, the notional volumes for which when aggregated with other commodity swap agreements and additional fixed-price physical off-take contracts then in effect, as of the date such swap agreement is executed, is not less than 50%, nor exceeds 90%, of the reasonably anticipated projected production from the Company’s proved developed producing reserves, as defined at the time of the agreement. The Company entered into swap agreements as required at the time, and presently there are no material hedging requirements imposed by Macquarie.
All of the Company’s obligations under the Credit Facility and the swap agreements with Macquarie are secured by a first priority security interest in any and all assets of the Company.
The Company has asset retirement obligations associated with the future plugging and abandonment of proved properties and related facilities. Under the provisions of FASB ASC 410-20-25, the fair value of a liability for an asset retirement obligation is recorded in the period in which it is incurred and a corresponding increase in the carrying amount of the related long lived asset. The liability is accreted to its present value each period, and the capitalized
cost is depreciated over the useful life of the related asset. If the liability is settled for an amount other than the recorded amount, a gain or loss is recognized. The Company has no assets that are legally restricted for purposes of settling asset retirement obligations.
The following table summarizes the company's asset retirement obligation transactions recorded in accordance with the provisions of FASB ASC 410-20-25 during the year ended December 31, 2010 and 2009.
|
Year Ended December 31,
|
||||||||
|
2010
|
2009
|
|||||||
|
Beginning Asset Retirement Obligation
|
$ | 206,741 | $ | 61,437 | ||||
|
Liabilities Incurred for New Wells Placed in Production
|
232,258 | 137,222 | ||||||
|
Liabilities Settled
|
(1,428 | ) | - | |||||
|
Accretion of Discount on Asset Retirement Obligations
|
21,755 | 8,082 | ||||||
|
Ending Asset Retirement Obligation
|
$ | 459,326 | 206,741 | |||||
The Company utilizes the asset and liability approach to measuring deferred tax assets and liabilities based on temporary differences existing at each balance sheet date using currently enacted tax rates in accordance with FASB ASC 740-10-30
.
Deferred tax assets are reduced by a valuation allowance when, in the opinion of management, it is more likely than not that some portion or all of the deferred tax assets will not be realized. Deferred tax assets and liabilities are adjusted for the effects of changes in tax laws and rates on the date of enactment.
The income tax expense (benefit) for the year ended December 31, 2010, 2009, and 2008 consists of the following:
|
2010
|
2009
|
2008
Adjusted
|
||||||||||
|
Current Income Taxes
|
$ | - | $ | - | $ | - | ||||||
|
Deferred Income Taxes
|
||||||||||||
|
Federal
|
3,625,000 | 1,215,000 | (680,000 | ) | ||||||||
|
State
|
794,000 | 251,000 | (150,000 | ) | ||||||||
|
Total Expense (Benefit)
|
$ | 4,419,000 | $ | 1,466,000 | $ | (830,000 | ) | |||||
The following is a reconciliation of the reported amount of income tax expense (benefit) for the years ended December 31, 2010, 2009, and 2008 to the amount of income tax expenses that would result from applying the statutory rate to pretax income.
Reconciliation of reported amount of income tax expense (benefit):
|
2010
|
2009
|
2008
Adjusted
|
||||||||||
|
Income Before Taxes and NOL
|
$ | 11,336,300 | $ | 4,264,952 | $ | 1,594,340 | ||||||
|
Federal Statutory Rate
|
X 34 | % | X 34 | % | x 34 | % | ||||||
|
Taxes Computed at Federal Statutory Rates
|
3,854,000 | 1,450,000 | 540,000 | |||||||||
|
State Taxes, Net of Federal Taxes
|
524,000 | 295,000 | 110,000 | |||||||||
|
Effects of:
|
||||||||||||
|
Other
|
41,000 | (279,000 | ) | (7,659 | ) | |||||||
|
Change in Valuation
|
- | - | (1,472,341 | ) | ||||||||
|
Reported Provision (Benefit)
|
$ | 4,419,000 | $ | 1,466,000 | $ | (830,000 | ) | |||||
At December 31, 2010, 2009 and 2008, the Company has a net operating loss carryforward for Federal income tax purposes of $62,100,000, $18,494,000 and $9,348,000, respectively, which expires in varying amounts during the tax years 2027, 2028 and 2029.
The components of the Company’s deferred tax asset (liability) were as follows:
|
|
Year Ended December 31,
|
|
||||||
|
|
2010
|
2009
|
|
|||||
|
Deferred Tax Assets (Liability)
|
|
|
|
|
|
|
||
|
Current:
|
|
|
|
|
|
|
||
|
Share Based Compensation (Options)
|
|
$
|
600,000
|
|
|
$
|
774,000
|
|
|
Share Based Compensation (Restricted Stock)
|
|
|
127,000
|
|
|
(91,000
|
)
|
|
|
Unrealized Investment Losses
|
|
|
4,414,000
|
|
|
|
1,231000
|
|
|
Accrued Payroll
|
|
|
-
|
|
|
|
288,000
|
|
|
Other
|
|
|
(41,000
|
)
|
|
|
(145,000
|
)
|
|
Current
|
|
|
5,100,000
|
|
|
|
2,057,000
|
|
|
|
|
|
|
|
|
|
|
|
|
Non-Current:
|
|
|
|
|
|
|
|
|
|
Net Operating Loss Carryforwards (NOLs)
|
|
|
23,987,000
|
|
|
|
7,583,000
|
|
|
Fixed Assets
|
|
|
(8,341,000
|
)
|
|
|
(2,646,000
|
)
|
|
Dry Well Write Off
|
|
|
(36,000
|
)
|
|
|
(36,000
|
)
|
|
Unrealized Investment Losses
|
|
|
1,939,000
|
|
|
|
395,000
|
|
|
Depletion
|
|
|
7,532,000
|
|
|
|
1,562,000
|
|
|
Intangible Drilling Costs
|
|
|
(34,432,000
|
)
|
|
|
(7,955,000
|
)
|
|
Sale of Land Lease Rights
|
|
|
155,000
|
|
|
|
117,000
|
|
|
Other
|
|
|
29,000
|
|
|
|
58,000
|
|
|
Non-Current
|
|
|
(9,167,000
|
)
|
|
|
(922,000
|
)
|
|
|
|
|
|
|
|
|
|
|
|
Total Deferred Tax Assets (Liabilities)
|
|
|
(4,067,000
|
)
|
|
|
1,135,000
|
|
|
Less: Valuation Allowance
|
|
|
-
|
|
|
|
-
|
|
|
Net Deferred Tax Asset (Liability)
|
|
$
|
(4,067,000
|
|
|
$
|
1,135,000
|
|
In June 2006, FASB issued FASB ASC 740-10-05-6. The Company adopted FASB ASC 740-10-05-6 on January 1, 2007. Under FASB ASC 740-10-05-6, tax benefits are recognized only for tax positions that are more likely than not to be sustained upon examination by tax authorities. The amount recognized is measured as the largest amount of benefit that is greater than 50 percent likely to be realized upon ultimate settlement. Unrecognized tax benefits are tax benefits claimed in the Company’s tax returns that do not meet these recognition and measurement standards.
Upon the adoption of FASB ASC 740-10-05-6, the Company had no liabilities for unrecognized tax benefits and, as such, the adoption had no impact on its financial statements, and the Company has recorded no additional interest or penalties. The adoption of FASB ASC 740-10-05-6
did not impact the Company’s effective tax rates.
The Company’s policy is to recognize potential interest and penalties accrued related to unrecognized tax benefits within income tax expense. For the years ended December 31, 2010, 2009 and 2008, the Company did not recognize any interest or penalties in its Statement of Operations, nor did it have any interest or penalties accrued in its Balance Sheet at December 31, 2010 and 2009 relating to unrecognized benefits.
The tax years 2010, 2009, 2008, 2007 and 2006 remain open to examination for federal income tax purposes and by the other major taxing jurisdictions to which the Company is subject.
Vehicles
The Company leases vehicles under noncancelable operating leases. Total lease expense under the agreements was approximately $58,000, $52,000 and $31,000 for the years ended December 31, 2010, 2009, and 2008, respectively.
Minimum future lease payments under these vehicle leases are as follows:
|
Year Ended December 31,
|
Amount
|
|||
|
2011
|
$ | 59,951 | ||
|
2012
|
$ | 50,114 | ||
|
2013
|
$ | 28,765 | ||
|
Total
|
$ | 138,830 | ||
Building
Effective February 2008, the Company entered into an operating lease agreement to lease 3,044 square feet of office space. The lease requires initial gross monthly lease payments of $11,415. The monthly payments increase by 4% on each anniversary date. The lease expires in December 2012. Total rent expense under the agreement was approximately $148,000, $142,000 and $114,000 for the years ended December 31, 2010, 2009, and 2008, respectively.
The Company has prepaid $34,245, the last three months rent. Minimum future lease payments under the building lease are as follows:
|
Year Ended December 31,
|
Amount
|
|||
|
2011
|
$ | 154,087 | ||
|
2012
|
$ | 160,236 | ||
|
Total
|
$ | 314,323 | ||
The Company received $91,320 of landlord incentives under the lease agreement. The Company has recorded a deferred rent liability for this amount that is being amortized over the term of the lease.
Prior to this lease the Company was paying $1,250 on a month-to-month lease.
FASB ASC 820-10-55
defines fair value, establishes a framework for measuring fair value under generally accepted accounting principles and enhances disclosures about fair value measurements. Fair value is defined under FASB ASC 820-10-55 as the exchange price that would be received for an asset or paid to transfer a liability (an exit price) in the principal or most advantageous market for the asset or liability in an orderly transaction between market participants on the measurement date. Valuation techniques used to measure fair value under FASB ASC 820-10-55 must maximize the use of observable inputs and minimize the use of unobservable inputs. The standard describes a fair value hierarchy based on three levels of inputs, of which the first two are considered observable and the last unobservable, that may be used to measure fair value which are the following:
Level 1 - Quoted prices in active markets for identical assets or liabilities.
Level 2 - Inputs other than Level 1 that are observable, either directly or indirectly, such as quoted prices for similar assets of liabilities; quoted prices in markets that are not active; or other inputs that are observable or can be corroborated by observable market data for substantially the full term of the assets or liabilities.
Level 3 - Unobservable inputs that are supported by little or no market activity and that are significant to the fair value of the assets or liabilities.
The following schedule summarizes the valuation of financial instruments measured at fair value on a recurring basis in the balance sheet as of December 31, 2010 and 2009.
|
Fair Value Measurements at December 31, 2010 Using
|
||||||||||||
|
Quoted Prices In Active Markets for Identical Assets
(Level 1)
|
Significant Other Observable Inputs
(Level 2)
|
Significant Unobservable Inputs
(Level 3)
|
||||||||||
|
Current Derivative Liabilities
|
$ | - | $ | (11,145,318 | ) | $ | - | |||||
|
Non-Current Derivative Liabilities
|
$ | - | $ | (5,022,657 | ) | $ | - | |||||
|
Short-Term Investments (See Note 3)
|
$ | 39,726,700 | $ | - | $ | - | ||||||
|
Total
|
$ | 39,726,700 | $ | (16,167,975 | ) | $ | - | |||||
|
Fair Value Measurements at December 31, 2009 Using
|
||||||||||||
|
Quoted Prices In Active Markets for Identical Assets
(Level 1)
|
Significant Other Observable Inputs
(Level 2)
|
Significant Unobservable Inputs
(Level 3)
|
||||||||||
|
Current Derivative Liabilities
|
$ | - | $ | (1,320,679 | ) | $ | - | |||||
|
Non-Current Derivative Liabilities
|
$ | - | $ | (1,459,374 | ) | $ | - | |||||
|
Short-Term Investments (See Note 3)
|
$ | 23,085,120 | $ | - | $ | 1,818,356 | ||||||
|
Total
|
$ | 23,085,120 | $ | (2,780,053 | ) | $ | 1,818,356 | |||||
Level 1 assets consist of US Treasury Notes, the fair value of these treasuries is based on quoted market prices.
Level 2 liabilities consist of derivative liabilities (see Note 15). Under FASB ASC 820-10-55, the fair value of the Company's derivative financial instruments is determined based on spot prices and the notional quantities. The fair value of all derivative contracts is reflected on the balance sheet. The current derivative liability amounts represent the fair values expected to be included in the results of operations for the subsequent year.
Level 3 assets consist of municipal bonds and floating rate preferred stock with an auction reset feature (“auction rate securities” or ARS). The underlying assets for the municipal bonds are student loans which are substantially backed by the federal government. Auction-rate securities are long-term floating rate bonds or floating rate perpetual preferred stock tied to short-term interest rates. After the initial issuance of the securities, the interest rate on the securities is reset periodically, at intervals established at the time of issuance (primarily every twenty-eight days), based on market demand for a reset period. Auction-rate securities are bought and sold in the marketplace through a competitive bidding process often referred to as a “Dutch auction”. If there is insufficient interest in the securities at the time of an auction, the auction may not be completed and the rates may be reset to pre-determined “penalty” or “maximum” rates based on mathematical formulas in accordance with each security's prospectus.
The following table provides a reconciliation of the beginning and ending balances for the assets measured at fair value using significant unobservable inputs (Level 3):
|
Fair Value Measurements at Reporting Date Using Significant Unobservable Inputs (Level 3)
Level 3 Financial Assets
|
||||
|
Balance at January 1, 2009
|
$ | 2,416,369 | ||
|
Sales
|
(800,000 | ) | ||
|
Unrealized Gain Included in Other Comprehensive Income (Loss)
|
201,987 | |||
|
Balance at December 31, 2009
|
$ | 1,818,356 | ||
|
Sales
|
(2,025,003 | ) | ||
|
Unrealized Gain Included in Other Comprehensive Income (Loss)
|
206,787 | |||
|
Realized Loss on Sales
|
(140 | ) | ||
|
Balance at December 31, 2010
|
$ | - | ||
The Company’s assessment of the significance of a particular input to the fair value measurement requires judgment and may effect the valuation of the nonfinancial assets and liabilities and their placement in the fair value hierarchy levels. The fair value of the Company’s asset retirement obligations are determined using discounted cash flow methodologies based on inputs that are not readily available in public markets. The fair value of the asset retirement obligations is reflected on the balance sheet as follows.
|
Fair Value Measurements at December 31, 2010 Using
|
||||||||||||||||
|
Description
|
December 31, 2010
|
Quoted Prices In Active Markets for Identical Assets
(Level 1)
|
Significant Other Observable Inputs
(Level 2)
|
Significant Unobservable Inputs
(Level 3)
|
||||||||||||
|
Other Non-current Liabilities
|
$ | (459,326 | ) | $ | - | $ | - | $ | (459,326 | ) | ||||||
|
Total
|
$ | (459,326 | ) | $ | - | $ | - | $ | (459,326 | ) | ||||||
|
Fair Value Measurements at December 31, 2009 Using
|
||||||||||||||||
|
Description
|
December 31, 2009
|
Quoted Prices In Active Markets for Identical Assets
(Level 1)
|
Significant Other Observable Inputs
(Level 2)
|
Significant Unobservable Inputs
(Level 3)
|
||||||||||||
|
Other Non-current Liabilities
|
$ | (206,741 | ) | $ | - | $ | - | $ | (206,741 | ) | ||||||
|
Total
|
$ | (206,741 | ) | $ | - | $ | - | $ | (206,741 | ) | ||||||
See Note 10 for a rollforward of the Asset Retirement Obligation.
The Company’s non-derivative financial instruments include cash and cash equivalents, accounts receivable, short term inveastments, accounts payable and line of credit. The carrying amount of cash and cash equivalents, accounts receivable, accounts payable, and line of credit approximate fair value because of their immediate or short-term maturities.
The Company’s accounts receivable relate to crude oil and natural gas sold to various industry companies. Credit terms, typical of industry standards, are of a short-term nature and the Company does not require collateral. Management believes the Company’s accounts receivable at December 31, 2010 and 2009 do not represent significant credit risks as they are dispersed across many counterparties.
The Company utilizes commodity swap contracts to (i) reduce the effects of volatility in price changes on the crude oil commodities it produces and sells, (ii) reduce commodity price risk and (iii) provide a base level of cash flow in order to assure it can execute at least a portion of its capital spending.
Crude Oil Derivative Contracts Cash-flow Hedges
Historically, all derivative positions that qualified for hedge accounting were designated on the date the Company entered into the contract as a hedge against the variability in cash flows associated with the forecasted sale of future crude oil production. The cash flow hedges were valued at the end of each period and adjustments to the fair value of the contract prior to settlement were recorded on the statement of stockholders’ equity as other comprehensive income. Upon settlement, the gain (loss) on the cash flow hedge was recorded as an increase or decrease in revenue on the statement of operations. The Company reports average crude oil and natural gas prices and revenues including the net results of hedging activities.
On November 1, 2009, due to the volatility of price differentials in the Williston Basin, the Company de-designated all derivates that were previously classified as cash flow hedges and, in addition, the Company has elected not to designate any subsequent derivative contracts as cash flow hedges under FASB ASC 815-20-25. Beginning on November 1, 2009, all derivative positions are carried at their fair value on the balance sheet and are marked-to-market at the end of each period.
Any realized gains and losses are recorded to Gain (Loss) on Settled Derivatives and unrealized gains or losses are recorded to Mark-to-Market of Derivative Instruments on the Statement of Operations rather than as a component of other comprehensive income (loss) or other Income (expense).
FASB ASC 815-20-25 requires the fair value disclosure of derivative instruments be presented on a gross basis, even when those instruments are subject to a master netting arrangement and qualify for net presentations on the balance sheet in accordance with ASC 210-20. The Company has a master netting agreement on each of the individual crude oil contracts and therefore the current asset and liability are netted on the balance sheet and the non-current asset and liability are netted on the balance sheet.
The net mark-to-market loss on the Company's remaining swaps that qualified for cash flow hedge accounting at the date the decision was made to discontinue hedge accounting totals $1,259,085 and $2,416,639 as of December 31, 2010 and 2009. The Company has recorded that amount as accumulated other comprehensive income in stockholders' equity and the entire amount will be amortized into revenues as the original forecasted hedged crude oil production occurs in the following periods.
|
For the Quarter Ended
|
|
Commodity
Derivatives
|
|
|
|
March 31, 2011
|
|
$
|
270,150
|
|
|
June 30, 2011
|
|
|
283,800
|
|
|
September 30, 2011
|
|
|
295,950
|
|
|
December 31, 2011
|
|
|
307,875
|
|
|
March 31, 2012
|
|
|
101,310
|
|
|
Total
|
|
$
|
1,259,085
|
|
The Company realized a settled derivative loss of $469,607 and $624,541 and maintained a mark-to-market value of and unrealized loss of $14,545,477 and $363,414 on derivative instruments for the years ended December 31, 2010 and 2009. The Company realized a settled derivative gain of $778,885 for the year ended December 31, 2008.
The following table reflects open commodity derivative contracts as of December 31, 2010, the associated volumes and the corresponding weighted average NYMEX reference price.
|
Settlement Period
|
|
Oil (Barrels)
|
|
Fixed Price
|
|
Weighted Avg
NYMEX Reference Price
|
|
Oil Swaps
|
|
|
|
|
|
|
|
01/01/11 – 02/29/12
|
|
27,000
|
|
51.25
|
|
93.81
|
|
01/01/11 – 12/31/11
|
|
18,000
|
|
66.15
|
|
93.76
|
|
01/01/11 12/31/11
|
48,000
|
82.60
|
93.76
|
|||
|
01/01/11 12/31/11
|
18,000
|
84.25
|
93.76
|
|||
|
01/01/11 12/31/11
|
54,996
|
80.90
|
93.76
|
|||
|
01/01/11 12/31/11
|
101,000
|
88.00
|
93.66
|
|||
|
01/01/11 06/30/12
|
246,504
|
80.00
|
93.73
|
|||
|
01/01/11 06/30/12
|
545,500
|
81.50
|
93.97
|
|||
|
01/01/11 06/30/12
|
303,000
|
85.50
|
93.51
|
As of December 31, 2010, the Company had a total hedged volume of 1,362,000 barrels at a weighted average price of approximately $81.85.
The following table reflects the weighted average price of open commodity derivative contracts as of December 31, 2010, by year with associated volumes.
|
Weighted Average Price
Of Open Commodity Swap Contracts
|
||||||||
|
Year
|
Volumes (Bbl)
|
Weighted
Average Price
|
||||||
|
2011
|
963,000 | $ | 82.05 | |||||
|
2012
|
399,000 | 81.36 | ||||||
At December 31, 2010 and 2009, the Company had derivative financial instruments under FASB ASC 815-20-25 recorded on the consolidated balance sheet as set forth below:
|
Type of Contract
|
Balance Sheet Location
|
|
December 31, 2010
Estimated Fair Value
|
|
|
December 31, 2009 Estimated Fair Value
|
|
||
|
Derivatives Designated as Hedging Instruments
|
|
|
|
|
|
|
|
||
|
Derivative Assets:
|
|
|
|
|
|
|
|
||
|
Oil Contracts
|
Other current assets
|
|
$
|
-
|
|
|
$
|
96,163
|
|
|
Oil Contracts
|
Other non-current assets
|
|
|
-
|
|
|
|
-
|
|
|
Total Derivative Assets
|
|
|
$
|
-
|
|
|
$
|
96,163
|
|
|
|
|
|
|
|
|
|
|
|
|
|
Derivative Liabilities:
|
|
|
|
|
|
|
|
|
|
|
Oil Contracts
|
Other current liabilities
|
|
$
|
(11,145,318
|
)
|
|
$
|
(1,402,910
|
)
|
|
Oil Contracts
|
Other non-current liabilities
|
|
|
(5,022,657
|
)
|
|
|
(1,473,306
|
)
|
|
Total Derivative Liabilities
|
|
|
$
|
(16,167,975
|
)
|
|
$
|
(2,876,216
|
)
|
The following disclosures are applicable to our financial statements, as of December 31, 2010 and December 31, 2009:
|
Amount of Gain/(Loss)
|
|||||||||
|
Derivative Type
|
Location of Gain /(Loss)
for Effective and
Ineffective
Portion of Derivative
in Income
|
|
Reclassified from
|
|
|||||
|
|
AOCI into Income
|
|
|||||||
|
|
Year Ended
December 31,
2010
|
|
|
Year Ended
December 31,
2009
|
|
||||
|
Commodity-Cash Flow
|
Gain (Loss) on Settled Derivatives
|
|
$
|
(1,157,554)
|
|
|
$
|
(363,414)
|
|
The use of derivative transactions involves the risk that the counterparties will be unable to meet the financial terms of such transactions. The Company has netting arrangements with Macquarie Bank Limited that provide for offsetting payables against receivables from separate derivative instruments.
The following is a reconciliation of the numerator and denominator used to calculate basic earnings per share and diluted earnings per share for the years ended December 31, 2010, 2009, and 2008:
|
|
2010
|
2009
|
2008
|
|||||||||||||||||||||||||||||||||
|
|
Net
Income
|
Shares
|
Per Share
|
Net
Income
|
Shares
|
Per Share
|
Net
Income Adjusted
|
Shares
|
Per Share
|
|||||||||||||||||||||||||||
|
Basic EPS
|
$ | 6,917,300 | 50,387,203 | $ | 0.14 | $ | 2,798,952 | 36,705,267 | $ | 0.08 | $ | 2,424,340 | 31,920,747 | $ | 0.08 | |||||||||||||||||||||
| Dilutive effect of options | - | 391,042 | - | 171,803 | - | 732,805 | ||||||||||||||||||||||||||||||
|
Diluted EPS
|
$ | 6,917,300 | 50,778,245 | $ | 0.14 | $ | 2,798,952 | 36,877,070 | $ | 0.08 | $ | 2,424,340 | 32,653,552 | $ | 0.07 | |||||||||||||||||||||
For the years ended December 31, 2009 and 2008, options and warrants to purchase 21,678 and 7,476 shares of common stock were not considered in calculating diluted earnings per share because the exercise prices were greater than the average market price of common shares during the year and, therefore, the effect would be anti-dilutive.
The Company follows the provisions of FASB ASC 220-10-55 which establishes standards for reporting comprehensive income. In addition to net income, comprehensive income includes all changes in equity during a period, except those resulting from investments and distributions to shareholders of the Company.
For the periods indicated, comprehensive income (loss) consisted of the following:
| Year Ended | ||||||||||||
| December 31, | ||||||||||||
|
2010
|
2009
|
2008 Adjusted
|
||||||||||
|
Net Income (Loss)
|
$ | 6,917,300 | $ | 2,798,952 | $ | 2,424,340 | ||||||
|
Unrealized losses on Short-term Investments (net of tax of $349,000, $290,000 and $168,000 at December 31, 2010, 2009 and 2008)
|
553,135 | (486,207 | ) | (240,774 | ) | |||||||
|
Net unrealized losses on hedges (Net of tax of $446,000 and $933,000 at December 31, 2010 and 2009)
|
711,554 | (1,483,639 | ) | - | ||||||||
|
Other Comprehensive income (loss) net
|
$ | 8,181,989 | $ | 829,106 | $ | 2,183,566 | ||||||
I
n 2009, the Company adopted a defined contribution 401(k) plan for substantially all of its employees. The plan provides for Company matching of employee contributions to the plan, at the Company’s discretion. During 2010 and 2009, the Company provided a match contribution equal to 100% of an eligible employee’s deferral contribution, up to 6% of the employee’s earnings up to $16,500. The Company contributed approximately $80,000 and $66,400 to the 401(k) plan for the years ended December 31, 2010 and 2009.
In February 2009, the Company entered into a revolving credit facility with CIT, in which CIT was issued 300,000 warrants in connection with the transaction. In January 2011, CIT exercised the 300,000 warrants at a price of $5.00 per share.
In January 2011, the Company entered into a commodity swap contract. The crude oil swap contract is for 376,000 barrels of crude oil with settlement periods between January 2012 and December 2012. The price on the contract is fixed at $95.15 per barrel.
In January 2011, the Company entered into a costless collar (purchased put options and written call options). The costless collars are used to establish floor and ceiling prices on anticipated crude oil and natural gas production. There were no net premiums paid or received by the Company related to the costless collar agreement. The Company purchased put options at $85.00 per barrel and call options at $101.75 per barrel on 508,000 barrels of crude oil. The costless collar amounts settle between February 2011 and December 2011.
In February 2011, the Company entered into a commodity swap contract. The crude oil swap contract is for 20,000 barrels of crude oil per month for the months of January 2012 through December 2012. The price on the contract is fixed at $100.00 per barrel.
The following table reflects the weighted average price of open commodity swap contracts as of March 1, 2011, by year with associated volumes.
|
Weighted Average Price
Of Open Commodity Swap Contracts
|
||||||||
|
Year
|
Volumes (Bbl)
|
Weighted
Average Price
|
||||||
|
2011
|
774,000 | $ | 81.93 | |||||
|
2012
|
1,015,000 | $ | 90.87 | |||||
As of March 1, 2011, the Company had a total hedged volume on open commodity swaps of 1,789,000 barrels at a weighted average price of approximately $87.00, as well as 451,000 barrels of crude oil collared between $85.00 and $101.75.
SUPPLEMENTAL OIL AND GAS INFORMATION
(UNAUDITED)
Oil and Natural Gas Exploration and Production Activities
Oil and gas sales reflect the market prices of net production sold or transferred with appropriate adjustments for royalties, net profits interest, and other contractual provisions. Production expenses include lifting costs incurred to operate and maintain productive wells and related equipment including such costs as operating labor, repairs and maintenance, materials, supplies and fuel consumed. Production taxes include production and severance taxes. Depletion of crude oil and natural gas properties relates to capitalized costs incurred in acquisition, exploration, and development activities. Results of operations do not include interest expense and general corporate amounts. The results of operations for the Company’s crude oil and natural gas production activities are provided in the Company’s related statements of operations.
Costs Incurred and Capitalized Costs
The costs incurred in crude oil and natural gas acquisition, exploration and development activities are highlighted in the table below. As the Company expanded the geographic area of its acreage acquisition program in 2010, property acquisitions that the company deemed proven were categorized as proven property acquisitions. All other acquisition costs were categorized as unproved property acquisitions. For 2009 and 2008, all acreage acquisition costs were categorized as proved property acquisitions as the Company determined that all acreage acquisitions in those years were in proven areas at the time they were acquired.
|
Year Ended December 31,
|
||||||||||||
|
2010
|
2009
|
2008
|
||||||||||
|
Costs Incurred for the Year:
|
||||||||||||
|
Proved Property Acquisition
|
$ | 2,236,167 | $ | 30,800,883 | $ | 30,508,139 | ||||||
|
Unproved Property Acquisition
|
72,308,719 | - | - | |||||||||
|
Development
|
123,933,003 | 18,739,905 | 9,165,188 | |||||||||
|
Total
|
$ | 198,477,889 | $ | 49,540,788 | $ | 39,673,327 | ||||||
Excluded costs for unproved properties are accumulated by year. Costs are reflected in the full cost pool as the drilling costs are incurred or as costs are evaluated and deemed impaired. The Company anticipates these excluded costs will be included in the depletion computation over the next five years. The Company is unable to predict the future impact on depletion rates. The following is a summary of capitalized costs excluded from depletion at December 31, 2009 by year incurred.
|
Year Ended December 31,
|
||||||||||||||||
|
2010
|
2009
|
2008
|
Prior Years
|
|||||||||||||
|
Property Acquisition
|
$ | 63,636,650 | $ | 16,061,848 | $ | 24,938,734 | $ | 5,147,236 | ||||||||
|
Drilling
|
26,350,695 | - | - | - | ||||||||||||
|
Total
|
$ | 89,987,345 | $ | 16,061,848 | $ | 24,938,734 | $ | 5,147,236 | ||||||||
Oil and Natural Gas Reserves and Related Financial Data
Information with respect to the Company’s crude oil and natural gas producing activities is presented in the following tables. Reserve quantities, as well as certain information regarding future production and discounted cash flows, were determined by Ryder Scott Company, independent petroleum consultants based on information provided by the Company.
Oil and Natural Gas Reserve Data
The following tables present the Company’s independent petroleum consultants’ estimates of its proved crude oil and natural gas reserves. The Company emphasizes that reserves are approximations and are expected to change as additional information becomes available. Reservoir engineering is a subjective process of estimating underground accumulations of crude oil and natural gas that cannot be measured in an exact way, and the accuracy of any reserve estimate is a function of the quality of available data and of engineering and geological interpretation and judgment.
|
Natural
|
||||||||
|
Gas
|
Oil
|
|||||||
|
(MCF)
|
(BBLS)
|
|||||||
|
Proved Developed and Undeveloped Reserves at December 31, 2008
|
216,451 | 727,665 | ||||||
|
Revisions of Previous Estimates
|
(27,820 | ) | (93,819 | ) | ||||
|
Extensions, Discoveries and Other Additions
|
1,619,597 | 5,456,261 | ||||||
|
Production
|
(47,305 | ) | (274,528 | ) | ||||
|
Proved Developed and Undeveloped Reserves at December 31, 2009
|
1,760,923 | 5,815,579 | ||||||
|
Revisions of Previous Estimates
|
625,103 | 514,899 | ||||||
|
Extensions, Discoveries and Other Additions
|
8,298,347 | 8,513,064 | ||||||
|
Production
|
(234,411 | ) | (849,845 | ) | ||||
|
Proved Developed and Undeveloped Reserves at December 31, 2010
|
10,449,962 | 13,993,697 | ||||||
|
Proved Developed Reserves at December 31, 2008
|
216,451 | 727,665 | ||||||
|
Proved Developed Reserves at December 31, 2009
|
727,237 | 2,247,718 | ||||||
|
Proved Developed Reserves at December 31, 2010
|
3,513,427 | 5,840,745 | ||||||
Proved reserves are estimated quantities of crude oil and natural gas, which geological and engineering data indicate with reasonable certainty to be recoverable in future years from known reservoirs under existing economic and operating conditions. Proved developed reserves are proved reserves that can be expected to be recovered through existing wells with existing equipment and operating methods. Proved undeveloped reserves are included for reserves for which there is a high degree of confidence in their recoverability and they are scheduled to be drilled within the next five years.
Standardized Measure of Discounted Future Net Cash Inflows and Changes Therein
The following table presents a standardized measure of discounted future net cash flows relating to proved crude oil and natural gas reserves and the changes in standardized measure of discounted future net cash flows relating proved crude oil and natural gas were prepared in accordance with the provisions of ASC 932-235-555 (formerly SFAS 69). Future cash inflows were computed by applying average prices of crude oil and natural gas for the last 12 months as of December 31, 2010, December 31, 2009 and December 31, 2008 to estimated future production. Future production and development costs were computed by estimating the expenditures to be incurred in developing and producing the proved crude oil and natural gas reserves at the end of the year, based on year-end costs and assuming continuation of existing economic conditions. Future income tax expenses were calculated by applying appropriate year-end tax rates to future pretax cash flows relating to proved crude oil and natural gas reserves, less the tax basis of properties involved and tax credits and loss carryforwards relating to crude oil and natural gas producing activities. Future net cash flows are discounted at the rate of 10% annually to derive the standardized measure of discounted future cash flows. Actual future cash inflows may vary considerably, and the standardized measure does not necessarily represent the fair value of the Company’s crude oil and natural gas reserves.
|
Year Ended December 31,
|
||||||||||||
|
2010
|
2009
|
2008
|
||||||||||
|
Future Cash Inflows
|
$ | 1,038,703,438 | $ | 315,142,688 | $ | 29,342,354 | ||||||
|
Future Production Costs
|
(271,843,571 | ) | (105,982,773 | ) | (8,719,621 | ) | ||||||
|
Future Development Costs
|
(161,853,922 | ) | (54,011,133 | ) | (1,321,948 | ) | ||||||
|
Future Income Tax Expense
|
(199,197,425
|
) | (43,761,765 | ) | - | |||||||
|
Future Net Cash Inflows
|
405,808,520
|
111,387,017 | 19,300,785 | |||||||||
|
10% Annual Discount for Estimated Timing of Cash Flows
|
(195,195,729
|
) | (43,580,456 | ) | (7,514,731 | ) | ||||||
|
Standardized Measure of Discounted Future Net Cash Flows
|
$ |
210,612,791
|
$ | 67,806,561 | $ | 11,786,054 | ||||||
The twelve month average prices for the year ended December 31, 2010, December 31, 2009 and year-end spot prices at December 31, 2008 were adjusted to reflect applicable transportation and quality differentials on a well-by-well basis to arrive at realized sales prices used to estimate the Company’s reserves. The prices for the Company’s reserve estimates were as follows:
|
Natural Gas
|
Oil
|
|||||||
|
MCF
|
Bbl
|
|||||||
|
December 31, 2010 (Spot Price)
|
$ | 5.04 | $ | 70.46 | ||||
|
December 31, 2009 (Average)
|
$ | 3.93 | $ | 53.00 | ||||
|
December 31, 2008 (Average)
|
$ | 5.80 | $ | 38.60 | ||||
Changes in the Standardized Measure of Discounted Future Net Cash Flows at 10% per annum follow:
|
Year Ended December 31,
|
||||||||||||
|
2010
|
2009
|
2008
|
||||||||||
|
Beginning of Period
|
$ | 67,806,561 | $ | 11,786,054 | $ | - | ||||||
|
Sales of Oil and Natural Gas Produced, Net of Production Costs
|
(50,721,827 | ) | (13,116,475 | ) | (3,268,858 | ) | ||||||
|
Extensions and Discoveries
|
185,403,280 | 74,946,755 | 19,967,182 | |||||||||
|
Previously Estimated Development Cost Incurred During the Period
|
3,350,016 | 1,321,948 | - | |||||||||
|
Net Change of Prices and Production Costs
|
88,564,348 | 4,352,381 | (3,660,754 | ) | ||||||||
|
Change in Future Development Costs
|
(3,003,304 | ) | - | (1,251,516 | ) | |||||||
|
Revisions of Quantity and Timing Estimates
|
(3,237,346 | ) | (1,650,626 | ) | - | |||||||
|
Accretion of Discount
|
8,781,249 | 1,178,605 | - | |||||||||
|
Change in Income Taxes
|
(104,428,302 | ) | (20,005,322 | ) | - | |||||||
|
Purchase of Reserves in Place
|
- | 9,579,951 | - | |||||||||
|
Other
|
(1,431,520 | ) | (586,710 | ) | - | |||||||
|
End of Period
|
$ | 191,083,155 | $ | 67,806,561 | $ | 11,786,054 | ||||||
QUARTERLY RESULTS OF OPERATIONS (UNAUDITED)
Quarterly data for the years end December 31, 2010, 2009, and 2008 is as follows:
|
Quarter Ended
|
||||||||||||||||
|
March 31,
|
June 30,
|
September 30,
|
December 31,
|
|||||||||||||
|
2010
|
||||||||||||||||
|
Revenue
|
$ | 7,221,514 | $ | 16,231,773 | $ | 9,883,821 | $ | 11,221,992 | ||||||||
|
Expenses
|
4,596,936 | 6,133,565 | 8,159,485 | 14,163,826 | ||||||||||||
|
Income from Operations
|
2,624,578 | 10,098,208 | 1,724,336 | (2,941,834 | ) | |||||||||||
|
Other Income (Expense)
|
(87,948 | ) | (144,342 | ) | (117,110 | ) | 180,412 | |||||||||
|
Income Tax Provision
|
977,000 | 3,833,000 | 620,000 | (1,011,000 | ) | |||||||||||
|
Net Income
|
1,559,630 | 6,150,866 | 987,226 | (1,750,422 | ) | |||||||||||
|
Net Income Per Common Share – Basic
|
0.04 | 0.12 | 0.02 | (0.03 | ) | |||||||||||
|
Net Income Per Common Share – Diluted
|
0.04 | 0.12 | 0.02 | (0.03 | ) | |||||||||||
|
Quarter Ended
|
||||||||||||||||
|
March 31,
|
June 30,
|
September 30,
|
December 31,
|
|||||||||||||
|
Adjusted **
|
Adjusted **
|
Adjusted **
|
Adjusted
|
|||||||||||||
|
2009
|
||||||||||||||||
|
Revenue
|
$ | 658,268 | $ | 2,275,084 | $ | 4,855,972 | $ | 6,432,175 | ||||||||
|
Expenses
|
1,047,614 | 1,437,445 | 2,530,315 | 5,077,164 | ||||||||||||
|
Income (Loss) from Operations
|
(389,346 | ) | 837,639 | 2,325,657 | 1,355,011 | |||||||||||
|
Other Income (Expense)
|
(43,527 | ) | (139,243 | ) | 321,589 | (2,828 | ) | |||||||||
|
Income Tax Provision (Benefit)
|
(174,000 | ) | 280,000 | 1,059,000 | 301,000 | |||||||||||
|
Net Income (Loss)
|
(258,873 | ) | 418,396 | 1,588,246 | 1,051,183 | |||||||||||
|
Net Income (Loss) Per Common Share – Basic
|
(0.01 | ) | 0.01 | 0.04 | 0.03 | |||||||||||
|
Net Income (Loss) Per Common Share – Diluted
|
(0.01 | ) | 0.01 | 0.04 | 0.03 | |||||||||||
|
Quarter Ended
|
||||||||||||||||
|
March 31,
|
June 30,
|
September 30,
|
December 31,
|
|||||||||||||
|
Adjusted**
|
Adjusted**
|
Adjusted**
|
Adjusted**
|
|||||||||||||
|
2008
|
||||||||||||||||
|
Revenue
|
$ | 287,029 | $ | 764,528 | $ | 1,362,655 | $ | 1,907,667 | ||||||||
|
Expenses
|
570,575 | 548,849 | 600,213 | 1,391,793 | ||||||||||||
|
Income (Loss) from Operations
|
(283,546 | ) | 215,679 | 762,442 | 515,874 | |||||||||||
|
Other Income
|
96,269 | 95,424 | 155,121 | 37,077 | ||||||||||||
|
Income Tax Provision (Benefit)
|
- | - | - | (830,000 | ) | |||||||||||
|
Net Income (Loss)
|
(187,277 | ) | 311,103 | 917,563 | 1,382,951 | |||||||||||
|
Net Income (Loss) Per Common Share – Basic and Diluted
|
(0.01 | ) | 0.01 | 0.03 | 0.03 | |||||||||||
|
|
** In 2009, the Company changed its method of accounting for drilling costs. As required by generally accepted accounting principles the impact of the change in accounting has been applied retrospectively to all periods presented.
|
TABLE OF CONTENTS
Part IItem 1. BusinessItem 1A. Risk FactorsItem 1B. Un Resol Ved Staff CommentsItem 2. PropertiesItem 3. Legal ProceedingsItem 4. ReservedPart IIItem 5. Market For Registrant S Common Equity, Related Stockholder Matters and Issuer Purchases Of Equity SecuritiesItem 6. Selected Financial DataItem 7. Management S Discussion and Analysis Of Financial Condition and Results Of OperationsItem 7A. Quantitative and Qualitative Disclosures About Market RiskItem 8. Financial Statements and Supplementary DataItem 9. Changes in and Disagreements with Accountants on Accounting and Financial DisclosureItem 9A. Controls and ProceduresItem 9B. Other InformationPart IIIItem 10. Directors, Executive Officers and Corporate GovernanceItem 11. Executive CompensationItem 12. Security Ownership Of Certain Beneficial Owners and Management and Related Stockholder MattersItem 13. Certain Relationships and Related Transactions, and Director IndependenceItem 14. Principal Accountant Fees and ServicesPart IVItem 15. Exhibits and Financial Statement SchedulesNote 1 Organization and Nature Of BusinessNote 2 Significant Accounting PoliciesNote 3 Short-term InvestmentsNote 4 Property and EquipmentNote 5 Oil and Gas PropertiesNote 6 Preferred and Common StockNote 7 Related Party TransactionsNote 8 Stock Options/stock-based Compensation and WarrantsNote 9 Revolving Credit FacilityNote 10 Asset Retirement ObligationNote 11 Income TaxesNote 12 Operating LeasesNote 13 Fair ValueNote 14 Financial InstrumentsNote 15 Derivative Instruments and Price Risk ManagementNote 16 Earnings Per ShareNote 17 Comprehensive IncomeNote 18 Employee Benefit PlansNote 19 Subsequent Events