SERVICENOW, INC.
10-Ks and 10-Qs
|
|
|
|
|
|
|
|
|
|
|
|
|
|
|
|
|
|
|
|
|
|
|
|
|
|
|
|
|
|
|
|
|
|
|
|
|
|
|
|
|
|
|
|
|
|
|
|
|
|
UNITED STATES
SECURITIES AND EXCHANGE COMMISSION
Washington, D.C. 20549
FORM 10-K
|
x
|
Annual Report pursuant to Section 13 or 15(d) of the Securities Exchange Act of 1934
|
For the fiscal year ended December 31, 2012
OR
|
¨
|
Transition report pursuant to Section 13 or 15(d) of the Securities Exchange Act of 1934
|
Commission File Number: 001-32224

S
ERVICE
N
OW,
I
NC.
(Exact name of registrant as specified in its charter)
|
Delaware
|
20-2056195
|
|
|
(State or other jurisdiction of
incorporation or organization)
|
(I.R.S. Employer
Identification Number)
|
|
ServiceNow, Inc.
4810 Eastgate Mall
San Diego, California 92121
(858) 720-0477
(Address, including zip code, and telephone number, including area code, of registrant’s principal executive offices)
Securities registered pursuant to Section 12(b) of the Act:
|
Title of each class
|
Name of each exchange on which registered
|
|
|
Common stock, par value $0.001 per share
|
New York Stock Exchange, Inc.
|
|
Securities registered pursuant to section 12(g) of the Act:
Not applicable
__________________________
Indicate by check mark if the Registrant is a well-known seasoned issuer, as defined in Rule 405 of the Securities Act. Yes
¨
No
x
Indicate by check mark if the Registrant is not required to file reports pursuant to Section 13 or Section 15(d) of Act. Yes
¨
No
x
Indicate by check mark whether the Registrant (1) has filed all reports required to be filed by Section 13 or 15(d) of the Securities Exchange Act of 1934 during the preceding 12 months (or for such shorter period that the Registrant was required to file such reports), and (2) has been subject to such filing requirements for the past 90 days: Yes
x
No
¨
Indicate by check mark whether the Registrant has submitted electronically and posted on its corporate Web site, if any, every Interactive Data File required to be submitted and posted pursuant to Rule 405 of Regulation S-T (§232.405 of this chapter) during the preceding 12 months (or for such shorter period that the Registrant was required to submit and post such files). Yes
x
No
¨
Indicate by check mark if disclosure of delinquent filers pursuant to Item 405 of Regulation S-K (§229.405 of this chapter) is not contained herein, and will not be contained, to the best of Registrant’s knowledge, in definitive proxy or information statements incorporated by reference in Part III of this Form 10-K or any amendment to this Form 10-K.
¨
Indicate by check mark whether the Registrant is a large accelerated filer, an accelerated filer, a non-accelerated filer or a smaller reporting company. See the definitions of “large accelerated filer,” “accelerated filer” and “smaller reporting company” in Rule 12b-2 of the Exchange Act. (Check one):
Large accelerated filer
¨
Accelerated filer
¨
Non-accelerated filer
x
Smaller reporting company
¨
Indicate by check mark whether the Registrant is a shell company (as defined in Rule 12b-2 of the Act). Yes
¨
No
x
Based on the closing price of the Registrant’s Common Stock on the last business day of the Registrant’s most recently completed second fiscal quarter, which was June 30, 2012, the aggregate market value of its shares (based on a closing price of $24.60 per share on June 29, 2012) held by non-affiliates was approximately $765.8 million. Shares of the Registrant’s Common Stock held by each executive officer and director and by each entity or person that owned 5 percent or more of the Registrant’s outstanding Common Stock were excluded in that such persons may be deemed to be affiliates. This determination of affiliate status is not necessarily a conclusive determination for other purposes.
As of February 28, 2013, there were approximately
131.9 million
shares of the Registrant’s Common Stock outstanding.
DOCUMENTS INCORPORATED BY REFERENCE
Portions of the Registrant’s definitive proxy statement for its 2013 Annual Meeting of Stockholders (the “Proxy Statement”), to be filed within 120 days of the Registrant’s fiscal year ended December 31, 2012, are incorporated by reference in Part III of this Report on Form 10-K. Except with respect to information specifically incorporated by reference in this Form 10-K, the Proxy Statement is not deemed to be filed as part of this Form 10-K.
TABLE OF CONTENTS
|
|
Page
|
|
|
Item 1
|
||
|
Item 1A
|
||
|
Item 1B
|
||
|
Item 2
|
||
|
Item 3
|
||
|
Item 4
|
||
|
Item 5
|
||
|
Item 6
|
||
|
Item 7
|
||
|
Item 7A
|
||
|
Item 8
|
||
|
Item 9
|
||
|
Item 9A
|
||
|
Item 9B
|
||
|
Item 10
|
||
|
Item 11
|
||
|
Item 12
|
||
|
Item 13
|
||
|
Item 14
|
||
|
Item 15
|
||
|
Index to Exhibits
|
||
i
FORWARD-LOOKING STATEMENTS
This Annual Report on Form 10-K, including the “Management's Discussion and Analysis of Financial Condition and Results of Operations,” contains forward-looking statements regarding future events and our future results that are based on our current expectations, estimates, forecasts, and projections about our business, our results of operations, the industry in which we operate and the beliefs and assumptions of our management. Words such as “believe,” “may,” “will,” “estimate,” “continue,” “anticipate,” “would,” “could,” “should,” “intend” and “expect,” variations of these words, and similar expressions are intended to identify those forward-looking statements. These forward-looking statements are only predictions and are subject to risks, uncertainties and assumptions that are difficult to predict. Therefore, actual results may differ materially and adversely from those expressed in any forward-looking statements. Factors that might cause or contribute to such differences include, but are not limited to, those discussed in this Report under the section entitled “Risk Factors” in Item 1A of Part I and elsewhere herein, and in other reports we file with the SEC. While forward-looking statements are based on reasonable expectations of our management at the time that they are made, you should not rely on them. We undertake no obligation to revise or update publicly any forward-looking statements for any reason, whether as a result of new information, future events or otherwise, except as may be required by law.
Overview
ServiceNow is a leading provider of cloud-based services to automate enterprise IT operations. Our service includes a suite of applications built on our proprietary platform that automates workflow and integrates related business processes. We focus on transforming enterprise IT by automating and standardizing business processes and consolidating IT across the global enterprise. Organizations deploy our service to create a single system of record for enterprise IT, lower operational costs and enhance efficiency. Additionally, our customers use our extensible platform to build custom applications for automating activities unique to their business requirements.
We help transform IT organizations from reactive, manual and task-oriented, to pro-active, automated and service-oriented organizations. Our on-demand service enables organizations to define their IT service strategy, design the systems and infrastructure that will support that strategy, and implement, manage and automate that infrastructure throughout its lifecycle. We provide a broad set of integrated applications that are highly configurable and can be efficiently implemented and upgraded. Further, our multi-instance architecture has proven scalability for global enterprises, as well as advantages in security, reliability and deployment location.
We offer our service under a Software-as-a-Service, or SaaS, business model. Customers can rapidly deploy our service in a modular fashion, allowing them to solve immediate business needs and access, configure and build new applications as their requirements evolve. Our service, which is accessed through an intuitive web-based interface, can be easily configured to adapt to customer workflow and processes. Upgrades to our service are designed to be efficient and compatible with configuration changes and applied with minimal disruption to ongoing operations.
We were incorporated as Glidesoft, Inc. in California in June 2004 and changed our name to Service-now.com in February 2006. In May 2012, we reincorporated into Delaware as ServiceNow, Inc.
In February 2012, we changed our fiscal year-end from June 30 to December 31. Throughout this filing, references to “fiscal 2009,” “fiscal 2010” and “fiscal 2011” are to the fiscal years ended June 30, 2009, 2010 and 2011, while references to 2011, 2012 and 2013 refer to the year ending on December 31, respectively.
Our Service
We help transform IT organizations from reactive, manual and task-oriented, to pro-active, automated and service-oriented organizations. Our on-demand service includes a suite of applications that runs on a common extensible platform designed to automate IT service delivery, specifically management and processes. Our customers can also use our service automation platform to build custom applications designed to automate processes unique to their businesses. All of these applications run on our platform and are provided as a hosted service under a SaaS business model. Our cloud-based service includes the following key elements.
1
Key Elements
Broad set of integrated functionality
. Our suite of applications was developed to address core Information Technology Infrastructure Library, or ITIL, processes as well as additional, non-ITIL, business processes. Our suite runs on a single extensible platform that includes workflow automation, notification, assignment and escalation, third-party integration capabilities, reporting and business intelligence, social, collaboration and administration capabilities. Our cloud-based service is designed to be deployed in a modular fashion, allowing customers to solve immediate business needs and access new application functionality as needs evolve.
Automation of IT operations
. Our service automates the documentation, categorization, prioritization, assignment, notification and escalation of IT and other business processes. Additionally, our service automates routine and repeatable data center operations such as rebooting a server, cloning a database or deploying a virtualized environment. These elements of automation result in more consistent, reliable and secure execution, allowing the reallocation of expensive IT staff to more complex issues.
Highly configurable and extensible to meet business needs
. Our configuration features are designed to give customers the ability to easily alter the appearance and operation of the user interface, change and develop business rules to meet specific requirements, and extend the database schema to support the tracking and capturing of necessary data. As a result, our service enables management of IT operations without requiring changes to existing business processes. In addition, our customers and partners can use our platform to build applications to automate processes that are unique to their businesses.
Efficient implementations and integration
. Our cloud-based model allows customers to quickly access and deploy our service without the need to install and maintain costly infrastructure hardware and software necessary for on-premise deployments. We believe the average time that a customer requires to deploy our service is significantly shorter than for traditional, legacy software products for managing IT operations. We also offer consulting and training services and have a network of third party service providers to assist customers in rapidly deploying and optimizing their use of our service. Our service is developed on an architecture that enables efficient integration to third-party architectures and other data sources.
Efficient upgrades
. We design our upgrades to be compatible with customer configuration changes and applied rapidly with minimal disruption to ongoing operations, enabling customers to be on the most up-to-date version. Upgrades are included as part of the subscription service and do not require professional services to implement.
Scalable, secure and reliable multi-instance architecture
. Our customers require scalability, security and reliability for their large, global businesses. Our multi-instance architecture is designed to meet these requirements. By providing customers with dedicated applications and databases we ensure that customer data is not comingled. In addition, this architecture reduces risk associated with infrastructure outages, improves system scalability and security, and allows for flexibility in deployment location. We believe this architecture is the best solution for the large global enterprises that rely on us for critical applications.
Business Benefits
Single system of record for IT
. We provide a single system of record for IT executives to track assets, activities and resources across the multiple systems and infrastructures currently in use in large enterprises. This provides executives with the ability to execute their IT strategy by quickly assessing how well their IT infrastructure is supporting business processes, analyzing business needs real-time and developing business solutions as needs evolve.
Lower total cost of ownership
. We assume complete responsibility for our service, including application set, hosting infrastructure, maintenance, monitoring, storage, security, customer support and upgrades, all of which free customer resources. Our service only requires a browser and an Internet connection to function. Additionally, we manage, monitor and handle upgrades and patch deployments remotely, which can result in lower total cost of ownership to our customers compared to legacy IT management products.
Easy to use and widely accessible
. Our suite of intuitive and easy-to-use applications provides users with a familiar experience based on business-to-consumer concepts. In addition, users with knowledge of basic software applications are able to create custom applications on our platform to solve specific business issues. Users can access our service through a web-based interface anywhere an Internet connection is available, including through mobile devices. We believe this ease of use and accessibility result in increased user adoption and system utilization. This enables businesses to earn higher return on investment and makes it more likely that users perform tasks based on standard defined processes, reducing system failure.
2
Our Applications
Our service includes the following applications:
Management Applications
|
•
|
Project Management
tracks and manages projects planned or being worked on by the IT staff.
|
|
•
|
IT Cost Management
tracks and monitors staff work time, project-related expenses and labor costs.
|
|
•
|
IT Governance, Risk and Compliance
details applications, databases, servers, network equipment and personnel for a regulatory or compliance audit.
|
Operational Applications
|
•
|
Incident Management
manages the process of restoring a failed service to an operational state.
|
|
•
|
Problem Management
manages the process of resolving the root cause of recurring service outages or issues affecting multiple users.
|
|
•
|
Change Management
manages the proposal and approval process for changes to be made to the IT infrastructure.
|
|
•
|
Release Management
assigns, manages and monitors the various tasks comprising the actual implementation or execution of a proposed change.
|
|
•
|
Service Catalog and Request Management
presents a "virtual storefront" of business services offered to the enterprise.
|
|
•
|
Software Development Lifecycle Management
tracks and manages new features and functions to be developed in upgrades or new software applications.
|
Infrastructure Applications
|
•
|
Configuration Management
creates and manages the inventory repository of all hardware, software and network equipment comprising the IT infrastructure.
|
|
•
|
Discovery
finds computers and other devices connected to an enterprise network, most commonly for the purpose of configuration management.
|
|
•
|
Asset Management
tracks the physical, contractual and financial elements of IT infrastructure.
|
|
•
|
Orchestration
automates defined, repeatable tasks that require execution across multiple systems
|
Our Service Automation Platform and Custom Applications
Our proprietary platform serves as the development environment for our suite of applications and custom applications, built by or for our customers and partners. Applications can leverage shared platform resources for automation, process integration, interface usability and data consistency. Platform resources include social IT, reporting, survey management, content management, knowledge management, service level management, graphical workflow, mobile access and application templates for HR, SFA, facilities and field service management.
Our customers and partners can purchase the use of our platform to build custom applications designed to automate processes that are unique to their businesses. Some examples include human resources, facilities and quality control management applications. We plan to grow investments in our platform to better enable the creation of custom applications to address specific business issues. We believe our platform provides substantial application development capabilities and we intend to further promote the potential of our platform.
3
Professional Services
Customers configure their implementation of our service to accommodate their unique organizational structures and workflows as well as to integrate our service with other technologies in their environments. We provide implementation services to customers through our professional services consultants and through a network of partners. Customers may also implement our service independently or use a third party. Our professional services include customer guidance on implementation, as well as comprehensive integration and implementation projects, and can include the development of custom applications. Customers typically implement applications in phases and each phase is governed by a separate statement of work. Typical professional service engagements vary in length from a few weeks to several months depending on the scope and size of the customer initiative.
Training and Certification
We offer training and certification solutions designed to match customer requirements, skill level, learning style and schedule.
Support
We offer technical support through web, phone, online documentation and an online forum. The technical support team is located in our support centers in San Diego, London and Amsterdam.
Our Technology
We designed our cloud-based service to support large global enterprises. The architecture, design, deployment and management of our service are focused on:
Scalability
. Our service is designed to support concurrent user sessions within a global enterprise, processing thousands of record-producing transactions and managing multiple terabytes of data while continuing to deliver best-in-class transaction processing time.
Availability
. Our customers are highly dependent on our service for the day-to-day operations of their IT infrastructure. Our service is designed as an “always on” solution.
Security
. Our service hosts and manages a large quantity of highly sensitive customer data. We employ a number of technologies, policies and procedures to protect customer data. We offer data centers that have SSAE 16 or ISO 27001 attestations or equivalent attestations.
We have a standardized Java-based development environment with the majority of our software written in industry standard software programming languages. We also use Web 2.0 technologies like AJAX and HTML which give users an intuitive and familiar experience. Our hardware primarily consists of industry standard servers and network components. Our standard operating system and database are Linux and MySQL, respectively, and the system is highly portable across multiple platforms including Microsoft Windows, Microsoft SQL Server and Oracle databases.
Unlike many SaaS vendors, we operate a multi-instance architecture that provides all customers with dedicated applications and databases. Most customers run on shared infrastructure servers while larger customers may run on dedicated servers. This architecture reduces risk associated with infrastructure outages, improves system scalability and security, and allows for flexibility in deployment location. We are also investing in enhancements to our cloud architecture, which are designed to provide all our customers with increased data reliability and availability.
For an increased subscription fee, we offer our customers the option to be deployed on dedicated hardware in our data centers. In limited circumstances, we grant certain customers the right to deploy our subscription service on the customers' own servers without significant penalty. Our multi-instance architecture gives us the added flexibility to deploy our applications on-premises at a customer data center in order to support regulatory or security requirements. When our software is installed at the customer site, we define the hardware requirements that the customer must install and manage. We then work with the customers to remotely install the applications and provide ongoing customer support in a similar way to how we support customer instances deployed in our own managed data centers. A small percentage of our customers run an on-premises solution.
4
Sales and Marketing
We sell our product and services through direct field sales and indirect channel sales. Our primary sales channel in North America is direct sales, and we also partner with strategic resellers and system integrators. For international markets outside of the United Kingdom and Germany we have historically partnered with strategic resellers. In the past year we have made significant investments in direct sales in many markets, and we intend to continue to invest in our direct sales force and strategic resellers globally.
Our marketing efforts and lead generation activities consist primarily of customer referrals, Internet advertising, trade shows and industry events and press releases. We also host an annual user conference, Knowledge, and webinars where customers both participate in and present a variety of programs designed to help accelerate marketing success with our service and platform.
We are investing in new geographies, including investment in direct and indirect sales channels, professional services capability, customer support resource and implementation partners. We plan to increase our investment in our existing international locations in order to achieve scale efficiencies in our sales and marketing efforts, in addition to adding new geographies.
Customers
We primarily market our service to large enterprises, which we define as companies with over $750 million in revenues and a minimum of 200 IT employees, and public sector organizations. We have proven scalability supporting large enterprise-wide deployments. As of
December 31, 2012
, we had
1,512
customers that operate in a wide variety of industries, including financial services, consumer products, IT services, health care and technology. No single customer accounted for more than 10% of our revenue for any of the periods presented.
Backlog
Backlog represents future amounts to be invoiced under our agreements and is not included in deferred revenue. As of
December 31, 2012
and
2011
, we had backlog of approximately
$379 million
and
$210 million
, respectively. We expect backlog will change from period to period for several reasons, including the timing and duration of customer subscription and professional services agreements, varying billing cycles of subscription agreements, and the timing of customer renewals.
Financial Information About Segments and Geographic Areas
We manage our operations and allocate resources as a single reporting segment. For information regarding our revenue, revenue by geographic area and long-lived assets by geographic area, please refer to Note 2 and Note 18 to our consolidated financial statements in this Annual Report on Form 10-K. For financial information about our segment, please refer to the section entitled “Management's Discussion and Analysis of Financial Condition and Results of Operations” in Item 7 of Part II and to our consolidated financial statements and the related notes in this Annual Report on Form 10-K. For information regarding risks associated with our international operations, please refer to the section entitled “Risk Factors” in Item 1A of Part I in this Annual Report on Form 10-K.
Data Center Operations
We currently run our service from data centers located in
eleven
locations in the United States, Canada, the United Kingdom, the Netherlands, Switzerland and Australia. Our data centers operate in a mirrored configuration to provide high availability. For our U.S. federal government customers we are in the process of becoming compliant with the Federal Information Security Management Act. We will add data centers, or expand our existing data center operations, as required to meet regulatory requirements and accommodate growth.
Research and Development
Our ability to compete depends in large part on our continuous commitment to research and development and our ability to timely introduce new products, technologies, features and functionality. Our research and development organization is responsible for the design, development, testing and certification of our products and services. Our efforts are focused on developing new products and core technologies and further enhancing the functionality, reliability, performance and flexibility of existing solutions. We focus our efforts on anticipating customer demand and then bringing new products and new versions of existing products to market quickly in order to remain competitive in the marketplace. We have made, and
5
will continue to make, significant investments in research and development to strengthen our existing applications, expand the number of applications on our platform and develop additional automation technologies.
Competition
The market for enterprise IT management solutions is fragmented, rapidly evolving and highly competitive. We face competition from in-house solutions, large integrated systems vendors and smaller companies with point solutions. Our competitors vary in size and in the breadth and scope of the products and services offered. Our primary competitors include BMC Software, Inc., CA, Inc., Hewlett-Packard Company and International Business Machines Corporation, all of which can bundle competing products and services with other software offerings, or offer them at a low price as part of a larger sale. With the introduction of new technologies, evolution of our product offerings and new market entrants, we expect competition to intensify in the future.
The principal competitive factors in our industry include total cost of ownership, product functionality, breadth of offerings, flexibility and performance. We believe that we compete favorably with our competitors on each of these factors. However, many of our primary competitors have greater name recognition, longer operating histories, more established customer relationships, larger marketing budgets and significantly greater resources than we do.
Intellectual Property
We rely upon a combination of copyright, trade secret and trademark laws and contractual restrictions, such as confidentiality agreements and licenses, to establish and protect our proprietary rights. We have only recently begun to develop a strategy to seek patent protections for our technology. We pursue the registration of our domain names and trademarks and service marks in the United States and in certain locations outside the United States.
Despite our efforts to protect our proprietary rights, unauthorized parties may attempt to copy or obtain and use our technology to develop products and services that provide features and functionality that are similar to our service offerings. Policing unauthorized use of our technology is difficult. The laws of the countries in which we market our service may offer little or no effective protection of our proprietary technology. Our competitors could also independently develop services equivalent to ours, and our intellectual property rights may not be broad enough for us to prevent competitors from doing so. Reverse engineering, unauthorized copying or other misappropriation of our proprietary technology could enable third parties to benefit from our technology without paying us for it, which would significantly harm our business.
We expect that we and others in our industry may be subject to third-party infringement claims as the number of competitors grows and the functionality of products and services overlaps. Our competitors could decide to make a claim of infringement against us with respect to our service and underlying technology, whether or not actually merited. Third parties may currently have, or may eventually be issued, patents upon which our current solution or future technology infringe. Any of these third parties might make a claim of infringement against us at any time.
Employees
As of
December 31, 2012
, we had
1,077
full-time employees worldwide, including
350
in sales and marketing,
401
in operations, professional services, training and customer support,
200
in research and development and
126
in general and administrative roles. None of our U.S. employees is represented by a labor union with respect to his or her employment. Employees in certain European countries have the benefits of collective bargaining arrangements at the national level. We have not experienced any work stoppages.
Available Information
You can obtain copies of our Form 10-K, Quarterly Reports on Form 10-Q, Current Reports on Form 8-K, and other filings with the SEC, and all amendments to these filings, free of charge from our website at www.servicenow.com as soon as reasonably practicable following our filing of any of these reports with the SEC. The public may read and copy any materials we have filed with the SEC at the SEC’s Public Reference Room at 100 F Street, NE, Room 1580, Washington, DC 20549. The public may obtain information on the operation of the Public Reference Room by calling the SEC at 1-800-SEC-0330. The SEC maintains an Internet site that contains reports, proxy and information statements and other information regarding issuers that file electronically with the SEC at www.sec.gov. The contents of these websites are not incorporated into this filing. Further, our references to the URLs for these websites are intended to be inactive textual references only.
6
We have identified the following risks and uncertainties that may have a material adverse effect on our business, financial condition, results of operations and future prospects. Our business could be harmed by any of these risks. The trading price of our common stock could decline due to any of these risks, and you may lose all or part of your investment. In assessing these risks, you should also refer to the other information contained in this Annual Report on Form 10-K, including our consolidated financial statements and related notes.
Risks Related to Our Business and Industry
Defects or disruptions in our service could diminish demand for our service, harm our financial results and subject us to substantial liability.
Our customers use our service to manage important aspects of their businesses, and any errors, defects, disruptions to our service or other performance problems with our service could hurt our reputation and may damage our customers' businesses. From time to time, we have found defects in our service, and new errors in our existing service may be detected in the future. For example, recently a few of our largest customers experienced reduced levels of availability, performance and functionality due to the scale at which they had implemented our service. We cannot be sure that we will not experience similar or other issues at even larger scales in the future. We provide regular product updates, which frequently contain undetected errors when first introduced or released. Defects may also be introduced by our use of third-party software, including open-source software. Defects can be hard to detect and may result in disruptions to our service. In addition, our customers may use our service in ways that cause disruptions in service for other customers. In some of these instances, customers have delayed, and may in the future delay payment to us, may elect not to renew, and may make service credit claims, warranty claims or other claims against us. Such instances may also adversely impact our future sales. Further, if we do not meet the stated service level commitments we have guaranteed to our customers or suffer extended periods of unavailability for our service, we have provided and in the future may be contractually obligated to provide these customers with credits for future service. The occurrence of payment delays, service credit, warranty or other claims against us could result in an increase in our bad debt expense, an increase in collection cycles for accounts receivable, an increase to our warranty provisions or service level credit accruals or other increased expenses or risks of litigation. We do not carry insurance sufficient to compensate us for the potentially significant losses that may result from claims arising from defects or disruptions in our service or the potential harm to the future growth of our business due to defects or disruptions.
We have experienced rapid growth in recent periods. If we are not able to manage this growth and expansion, or if our business does not grow as we expect, our operating results may suffer.
We continue to experience rapid growth in our customer base and have significantly expanded our operations during the last several years. In particular, we are aggressively investing in: significant expansion of our cloud infrastructure and associated service capacity; our global sales, marketing and operations activities and personnel; and additional office facility lease commitments and administrative employees. Our employee headcount has increased to
1,077
as of
December 31, 2012
from
603
as of
December 31, 2011
. We signed new leases for a larger corporate office in San Diego in February 2012, additional office space in Amsterdam in September 2012, in San Jose in November 2012 and in London in December 2012. In addition, we hired new senior management in 2011 and 2012. Our rapid growth has placed, and will continue to place, a significant strain on our administrative and operational infrastructure facilities and other resources. Our ability to manage our operations and growth will require us to continue to expand our sales force, facilities, infrastructure and operations, and refine our operational, financial and management controls, human resource policies, and reporting systems and procedures. For instance, in 2012 we implemented a new financial enterprise resource planning system to help manage our future growth and are in the process of integrating that system with our customer relationship management system. If we fail to efficiently expand our sales force, operations, cloud infrastructure or IT and financial systems, or if we fail to implement or maintain effective internal controls and procedures, our costs and expenses may increase more than we plan and we may lose the ability to close customer opportunities, enhance our existing service, develop new applications, satisfy customer requirements, respond to competitive pressures or otherwise execute our business plan. Additionally, as our operating expenses increase in anticipation of the growth of our business, if such growth does not meet our expectations, our financial results likely would be harmed.
We have a limited history of operating profits, did not generate a profit in the
year ended
December 31, 2012
, and may not achieve or maintain profitability in the future.
We have not been consistently profitable on a quarterly or annual basis and experienced a net loss of
$37.3 million
for the
year ended
December 31, 2012
. As of
December 31, 2012
, our accumulated deficit was
$105.5 million
. While we have experienced significant revenue growth over recent periods, this growth rate is likely to decrease and we may not return to profitability. Over the past year, we have significantly increased our expenditures to support the development and expansion of our business, which has resulted in increased losses. We plan to continue to invest for future growth, and as a result, we do not expect to be profitable
7
for the foreseeable future. In addition, as a public company, we will continue to incur significant accounting, legal and other expenses that we did not incur as a private company. As a result of these increased expenditures, we will have to generate and sustain increased revenues to achieve future profitability. We may incur significant losses in the future for a number of reasons, including without limitation the other risks and uncertainties described in this filing. Additionally, we may encounter unforeseen operating expenses, difficulties, complications, delays and other unknown factors that may result in losses in future periods. If these losses exceed our expectations or our revenue growth expectations are not met in future periods, our financial performance will be harmed.
We face security risks, including but not limited to theft of personal data, theft of proprietary information, denial of service attacks and other hacking attacks. If our security measures are breached or unauthorized access to customer data is otherwise obtained, our service may be perceived as not being secure, customers may curtail or stop using our service, and we may incur significant liabilities.
Our operations involve the storage and transmission of our customers’ confidential information, and security breaches, computer malware and computer hacking attacks could expose us to a risk of loss of this information, litigation, indemnity obligations and other liability. For example, our third-party data center facility in London was subjected to a distributed denial of service attack in January 2012 that prevented some of our customers hosted in that data center from using our service intermittently for a period of about three hours. While we have administrative, technical, and physical security measures in place, and try to contractually require third parties to whom we transfer data to implement and maintain appropriate security measures, if our security measures are breached as a result of third-party action, employee error, malfeasance or otherwise, and, as a result, someone obtains unauthorized access to our customers’ data, including personally identifiable information regarding users, our reputation will be damaged, our business may suffer and we could incur significant liability. Additionally, third parties may attempt to fraudulently induce employees or customers into disclosing sensitive information such as user names, passwords or other information in order to gain access to our customers’ data or our data, including our intellectual property and other confidential business information, or our information technology systems. Because techniques used to obtain unauthorized access or to sabotage systems change frequently and generally are not recognized until successfully launched against a target, we may be unable to anticipate these techniques or to implement adequate preventative measures. If an actual or perceived breach of our security occurs, the market perception of the effectiveness of our security measures could be harmed and we could lose potential sales and existing customers.
We need to continue to invest in enhancements to our cloud infrastructure and if our required investments are greater than anticipated or fail to yield anticipated cost savings and performance benefits, our financial results will be negatively impacted.
We have made and will continue to make substantial investments in new equipment to support growth at our data centers, provide enhanced levels of service to our customers and reduce future costs of subscription revenues. In the
year ended
December 31, 2012
, we purchased
$20.8 million
in equipment for use in our data centers. Ongoing improvements to our cloud infrastructure may be more expensive than we anticipate, and may not yield the expected savings in operating costs or the expected performance benefits. In addition, we may be required to re-invest any cost savings achieved from prior cloud infrastructure improvements in future infrastructure projects to maintain the levels of service required by our customers. We may not be able to maintain or achieve cost savings from our investments, which could harm our financial results.
We may not timely and effectively scale and adapt our existing technology to meet our customers’ performance and other requirements.
Our future growth is dependent upon our ability to continue to meet the needs of new customers and the expanding needs of our existing customers as their use of our service grows. As our customers gain more experience with our service, the number of users and transactions managed by our service, the amount of data transferred, processed and stored by us, the number of locations where our service is being accessed, and the number of processes and systems managed by our service on behalf of these customers have in some cases, and may in the future, expand rapidly. Recently, a few of our largest customers have experienced reduced levels of availability, performance and functionality due to the scale at which they have implemented our service. In order to meet the performance and other requirements of our customers, we intend to continue to make significant investments to develop and implement new technologies in our service and cloud infrastructure operations. These technologies, which include databases, applications and server optimizations, network and hosting strategies, and automation, are often advanced, complex, new and untested. We may not be successful in developing or implementing these technologies. In addition, it takes a significant amount of time to plan, develop and test improvements to our technologies and infrastructure, and we may not be able to accurately forecast demand or predict the results we will realize from such improvements. We are also dependent upon open source and other third-party technologies and may be unable to quickly effect changes to such technologies, which may prevent us from rapidly responding to evolving customer requirements. To the extent that we do not effectively scale our service and operations to meet the needs of our growing customer base and to maintain performance as our customers expand their use of our service, we may not be able to
8
grow as quickly as we anticipate, our customers may reduce or cancel use of our services and we may be unable to compete as effectively and our business and operating results may be harmed.
Interruptions or delays in service from our third-party data center facilities could impair the delivery of our service and harm our business.
We currently serve our customers from third-party data center facilities, operated by several different providers, located around the world, with the largest located in Virginia, California, London and Amsterdam. Any damage to, or failure of, our systems, or those of our third-party data centers, could result in interruptions in our service. Impairment of or interruptions in our service may reduce our revenues, cause us to issue credits or pay penalties, subject us to claims and litigation, cause our customers to terminate their subscriptions and adversely affect our renewal rates and our ability to attract new customers. Our business will also be harmed if our customers and potential customers believe our service is unreliable.
We do not control, or in some cases have limited control over, the operation of the data center facilities we use, and they are vulnerable to damage or interruption from earthquakes, floods, fires, power loss and similar events. They may also be subject to break-ins, sabotage, intentional acts of vandalism and similar misconduct, and to adverse events caused by operator error. We cannot rapidly switch to new data centers or move customers from one data center to another in the event of any adverse event. Despite precautions taken at these facilities, the occurrence of a natural disaster, an act of terrorism or other act of malfeasance, a decision to close the facilities without adequate notice or other unanticipated problems at these facilities could result in lengthy interruptions in our service and the loss of customer data.
If the market for our technology delivery model and SaaS develops more slowly than we expect, our growth may slow or stall, and our operating results would be harmed.
Use of SaaS applications to manage and automate enterprise IT is at an early stage. We do not know whether the trend of adoption of enterprise SaaS solutions we have experienced in the past will continue in the future. In particular, many organizations have invested substantial personnel and financial resources to integrate legacy software into their businesses over time, and some have been reluctant or unwilling to migrate to SaaS. Furthermore, some organizations, particularly large enterprises upon which we are dependent, have been reluctant or unwilling to use SaaS because they have concerns regarding the risks associated with the security of their data and the reliability of the technology delivery model associated with these solutions. In addition, if other SaaS providers experience security incidents, loss of customer data, disruptions in delivery or other problems, the market for SaaS solutions as a whole, including our service, will be negatively impacted. If the adoption of SaaS solutions does not continue, the market for these solutions may stop developing or may develop more slowly than we expect, either of which would harm our operating results.
The market in which we participate is intensely competitive, and if we do not compete effectively, our operating results could be harmed.
The market for enterprise IT operations management solutions is fragmented, rapidly evolving and highly competitive, with relatively low barriers to entry in some segments. Many of our competitors and potential competitors are larger and have greater name recognition, much longer operating histories, more established customer relationships, larger marketing budgets and significantly greater resources than we do. As a result, our competitors may be able to respond more quickly and effectively than we can to new or changing opportunities, technologies, standards or customer requirements. With the introduction of new technologies, the evolution of our service and new market entrants, we expect competition to intensify in the future. If we fail to compete effectively, our business will be harmed. Some of our principal competitors offer their products or services at a lower price, which has resulted in pricing pressures. If we are unable to achieve our target pricing levels, our operating results would be negatively impacted. In addition, pricing pressures and increased competition generally could result in reduced sales, reduced margins, losses or the failure of our service to achieve or maintain more widespread market acceptance, any of which could harm our business.
We face competition from in-house solutions, large integrated systems vendors and smaller companies with point solutions including SaaS offerings. Our competitors vary in size and in the breadth and scope of the products and services offered. Our primary competitors include BMC Software, Inc., CA, Inc., Hewlett-Packard Company and International Business Machines Corporation, all of which are much larger and have substantially more financial resources than we do, and have the operating flexibility to bundle competing products and services with other software offerings, including offering them at a lower price as part of a larger sale. In addition, many of our competitors offer SaaS solutions and may make acquisitions of businesses or assets that improve their service offerings. Further, other established SaaS providers not currently operating in enterprise IT operations management may expand their services to compete with our service. Many of our current and potential competitors have established marketing relationships, access to larger customer bases, pre-existing customer relationships and major distribution agreements with consultants, system integrators and resellers. In addition, some competitors may offer software that addresses one or a limited
9
number of enterprise IT operation functions at lower prices or with greater depth than our service. Moreover, as we expand the scope of our service, we may face additional competition from platform and application development vendors. Additionally, some potential customers, particularly large enterprises, may elect to develop their own internal solutions. For all of these reasons, we may not be able to compete successfully against our current and future competitors.
Because our sales efforts are targeted at large enterprise customers, we face longer sales cycles, substantial upfront sales costs and less predictability in completing some of our sales. If our sales cycle lengthens, or if our substantial upfront sales investments do not result in sufficient sales, our operating results could be harmed.
We target our sales efforts at large enterprises, which we define as companies with over $750 million in revenues and a minimum of 200 IT employees. For instance, we derived approximately
11%
of our revenues from large enterprise customers in the financial services industry for the
year ended
December 31, 2012
. Because our large enterprise customers are often making an enterprise-wide decision to deploy our service, sometimes on a global basis, we face long sales cycles, complex customer requirements, substantial upfront sales costs and less predictability in completing some of our sales. Our sales cycle is generally six to nine months, but is variable and difficult to predict and can be much longer. Large enterprises often undertake a prolonged evaluation of our service, including whether the customer needs professional services performed by us or a third party for its unique IT and business process needs, and a comparison of our service to products offered by our competitors. Moreover, our large enterprise customers often begin to deploy our service on a limited basis, but nevertheless demand extensive configuration, integration services and pricing concessions, which increase our upfront investment in the sales effort with no guarantee that these customers will deploy our service widely enough across their organization to justify our substantial upfront investment. It is possible in the future we may experience even longer sales cycles, more complex customer needs, higher upfront sales costs and less predictability in completing some of our sales as we continue to expand our direct sales force and thereby increase the percentage of our sales personnel with less experience in selling our service, expand into new territories and expand into functional areas outside of the traditional ITIL processes. If our sales cycle lengthens or our substantial upfront sales and implementation investments do not result in sufficient sales to justify our investments, our operating results may be harmed.
Our business depends substantially on our customers renewing their subscriptions and purchasing additional subscriptions from us. Any decline in our customer renewals would harm our future operating results.
In order for us to maintain or improve our operating results, it is important that our customers renew their subscriptions when the initial contract term expires and add additional authorized users to their subscriptions. Our customers have no obligation to renew their subscriptions, and we cannot assure you that our customers will renew subscriptions with a similar contract period or with the same or a greater number of authorized users. Although our renewal rates have been historically high, some of our customers have elected not to renew their agreements with us and we cannot accurately predict renewal rates. Moreover, in some cases, some of our customers have the right to cancel their agreements prior to the expiration of the term.
Our renewal rates may decline or fluctuate as a result of a number of factors, including our customers' satisfaction with our subscription service, professional services, customer support, or prices, the prices of competing solutions, mergers and acquisitions affecting our customer base, the effects of global economic conditions, or reductions in our customers’ spending levels. Our future success also depends in part on our ability to sell more subscriptions and additional professional services to our current customers. If our customers do not renew their subscriptions, renew on less favorable terms or fail to add more authorized users or fail to purchase additional professional services, our revenues may decline, and we may not realize improved operating results from our customer base.
If we are not able to develop enhancements and new applications that achieve market acceptance or that keep pace with technological developments, our business could be harmed.
Our ability to attract new customers and increase revenues from existing customers depends in large part on our ability to enhance and improve our existing service and to introduce new services. In order to grow our business, we must develop a service that reflects future updates to the ITIL framework and extends beyond the ITIL framework into other areas of enterprise IT operations management. We are also dependent on achieving growth in demand for our platform. The success of any enhancement or new service depends on several factors, including timely completion, adequate quality testing, introduction and market acceptance. Any new service that we develop may not be introduced in a timely or cost-effective manner, may contain defects or may not achieve the broad market acceptance necessary to generate significant revenues. If we are unable to successfully develop new applications or enhance our existing service to meet the evolving requirements of our customers, our business and operating results will be harmed.
Because we designed our service to be provided over the Internet, we need to continuously modify and enhance our service to keep pace with changes in Internet-related hardware, software, communication, database and security technologies and standards.
10
If we are unable to respond in a timely and cost-effective manner to these rapid technological developments and standards changes, our service may become less marketable and less competitive or obsolete and our operating results may be harmed.
If we fail to integrate our service with a variety of operating systems, software applications and hardware that are developed by others, our service may become less marketable and less competitive or obsolete, and our operating results would be harmed.
Our service must integrate with a variety of network, hardware and software platforms, and we need to continuously modify and enhance our platform to adapt to changes in cloud-enabled hardware, software, networking, browser, security and database technologies. Any failure of our service to operate effectively with future infrastructure platforms and technologies could reduce the demand for our service, resulting in customer dissatisfaction and harm to our business. If we are unable to respond to these changes in a cost-effective manner, our service may become less marketable and less competitive or obsolete and our operating results may be negatively impacted. In addition, an increasing number of individuals within the enterprise are utilizing mobile devices to access the Internet and corporate resources and to conduct business. If we cannot effectively make our service available on these mobile devices and offer the information, services and functionality required by enterprises that widely use mobile devices, we may experience difficulty attracting and retaining customers.
A portion of our revenues are generated by sales to government entities and heavily regulated organizations, which are subject to a number of challenges and risks.
A portion of our sales are to governmental agencies. Additionally, many of our current and prospective customers, such as those in the financial services and health care industries, are highly regulated and may be required to comply with more stringent regulations in connection with subscribing to and implementing our service. Selling to these entities can be highly competitive, expensive and time consuming, often requiring significant upfront time and expense without any assurance that we will successfully complete a sale. Furthermore, engaging in sales activities to foreign governments introduces incremental compliance risks specific to the Foreign Corrupt Practices Act, the UK Bribery Act and other similar statutory requirements prohibiting bribery and corruption in the jurisdictions in which we operate. Government and highly regulated entities often require contract terms that differ from our standard arrangements and impose compliance requirements that are complicated, require preferential pricing or “most favored nation” terms and conditions, or are otherwise time consuming and expensive to satisfy. Due to the additional requirements of the U.S. federal government, we are in the process of establishing compliance with the Federal Information Security Management Act and other federal standards relating to our operations, security controls, processes and architecture. Individual agencies also have unique requirements, such as requirements that we use U.S.-only personnel or a requirement to use our service in a non-hosted environment. We may not be able to meet these standards or requirements. Even if we do meet them, the additional costs associated with providing our service to government and highly regulated customers could harm our margins. Moreover, changes in the underlying regulatory conditions that affect these types of customers could harm our ability to efficiently provide our service to them and to grow or maintain our customer base.
Failure to effectively expand our sales and marketing capabilities could harm our ability to increase our customer base and achieve broader market acceptance of our service.
Increasing our customer base and achieving broader market acceptance of our service will depend, to a significant extent, on our ability to effectively expand our sales and marketing operations and activities. We are substantially dependent on our direct sales force to obtain new customers. From
December 31, 2011
to
December 31, 2012
, our sales and marketing organization increased from
242
to
350
employees. We plan to continue to expand our direct sales force both domestically and internationally. We believe there is significant competition for direct sales personnel with the sales skills and technical knowledge that we require. Our ability to achieve significant revenue growth in the future will depend, in large part, on our success in recruiting, training and retaining a sufficient number of direct sales personnel. New hires require significant training and time before they achieve full productivity, particularly in new sales territories. Our recent hires and planned hires may not become as productive as quickly as we would like, and we may be unable to hire or retain sufficient numbers of qualified individuals in the future in the markets where we do business. Because we do not have a long history of expansion in our sales force, we cannot predict whether or to what extent our sales will increase as we expand our sales force or how long it will take for sales personnel to become productive. Moreover, we do not have significant experience as an organization developing and implementing overseas marketing campaigns, and such campaigns may be expensive and difficult to implement. Our business will be harmed if our expansion efforts do not generate a significant increase in revenues.
Our current management team is new and if we lose key members of our management team or are unable to attract and retain executives and employees we need to support our operations and growth, our business may be harmed.
Each of our executive officers either joined us recently or has taken on a new role in the organization. These changes in our executive management team may be disruptive to our business. Our success depends substantially upon the continued services of this new group of executive officers, particularly Frank Slootman, our Chief Executive Officer, who joined us in May 2011, and
11
Frederic B. Luddy, our founder and Chief Product Officer, who are critical to our vision, strategic direction, culture, services and technology. From time to time, there may be changes in our executive management team resulting from the hiring or departure of executives. Our executive officers are generally employed on an at-will basis, which means that our executive officers could terminate their employment with us at any time. The loss of one or more of our executive officers or the failure by our executive team to effectively work with our employees and lead our company could harm our business.
In the technology industry, there is substantial and continuous competition for engineers with high levels of experience in designing, developing and managing software and Internet-related solutions, as well as competition for sales executives and operations personnel. We may not be successful in attracting and retaining qualified personnel. We have from time to time experienced, and we expect to continue to experience, difficulty in hiring and retaining highly skilled employees with appropriate qualifications. In particular, competition for experienced software and cloud infrastructure engineers in San Diego, San Jose, Seattle, London and Amsterdam, our primary operating locations, is intense. If we fail to attract new personnel or fail to retain and motivate our current personnel, our business and future growth prospects could be harmed.
Our quarterly results may fluctuate, and if we fail to meet the expectations of analysts or investors or our previously issued guidance, our stock price and the value of your investment could decline substantially.
Our quarterly financial results may fluctuate as a result of a variety of factors, many of which are outside of our control. If our quarterly financial results fall below the expectations of investors or any securities analysts who follow our stock, or fail to meet or exceed any forward guidance we issue, the price of our common stock could decline substantially. Some of the important factors that may cause our revenues, operating results and cash flows to fluctuate from quarter to quarter include:
|
•
|
our ability to retain and increase sales to existing customers, attract new customers and satisfy our customers’ requirements;
|
|
•
|
the number of new employees added;
|
|
•
|
the rate of expansion and productivity of our sales force;
|
|
•
|
changes in the relative and absolute levels of professional services we provide;
|
|
•
|
the cost, timing and management effort for the development of new services;
|
|
•
|
the length of the sales cycle for our service;
|
|
•
|
changes in our pricing policies whether initiated by us or as a result of competition;
|
|
•
|
the amount and timing of operating costs and capital expenditures related to the operations and expansion of our business;
|
|
•
|
significant security breaches, technical difficulties or interruptions of our service;
|
|
•
|
new solutions, products or changes in pricing policies introduced by our competitors;
|
|
•
|
changes in foreign currency exchange rates;
|
|
•
|
changes in effective tax rates;
|
|
•
|
general economic conditions that may adversely affect either our customers’ ability or willingness to purchase additional subscriptions, delay a prospective customer’s purchasing decision, reduce the value of new subscription contracts, or affect renewal rates;
|
|
•
|
changes in deferred revenue balances due to the seasonal nature of our customer invoicing, changes in the average duration of our customer agreements, the rate of renewals and the rate of new business growth;
|
|
•
|
the timing of customer payments and payment defaults by customers;
|
|
•
|
extraordinary expenses such as litigation or other dispute-related settlement payments;
|
|
•
|
the impact of new accounting pronouncements; and
|
|
•
|
the timing of stock awards to employees and the related adverse financial statement impact of having to expense those stock awards ratably over their vesting schedules.
|
Many of these factors are outside of our control, and the occurrence of one or more of them might cause our operating results to vary widely. As such, we believe that quarter-to-quarter comparisons of our revenues, operating results and cash flows may not be meaningful and should not be relied upon as an indication of future performance.
12
We expect our revenue growth rate to decline, and as our costs increase, we may not be able to generate sufficient revenue to generate or sustain profitability or positive cash flow from operations, net of our investments, over the long term.
From fiscal 2009 to the
year ended
December 31, 2012
, our revenues grew from $19.3 million to
$243.7 million
. We expect that, in the future, as our revenues increase to higher levels, our revenue growth rate will decline. However, we may not be able to generate sufficient revenues to achieve and sustain profitability as we also expect our costs to increase in future periods. We expect to continue to expend substantial financial and other resources on:
|
•
|
our technology infrastructure, including enhancements to our cloud architecture and hiring of additional employees for our research and development team;
|
|
•
|
software development, including investments in our software development team, the development of new features and the improvement of the scalability, availability and security of our service;
|
|
•
|
sales and marketing, including a significant expansion of our direct sales organization;
|
|
•
|
international expansion in an effort to increase our customer base and sales; and
|
|
•
|
general administration, including legal and accounting expenses related to being a public company.
|
These investments may not result in increased revenues or growth in our business. We may be unable to generate positive cash flow from operations, net of investments. If we fail to continue to grow our revenues and overall business, our operating results and business would be harmed.
Because we recognize revenues from our subscription service over the subscription term, downturns or upturns in new sales and renewals will not be immediately reflected in our operating results.
We generally recognize revenues from customers ratably over the terms of their subscriptions, which on average are approximately
32
months in duration for initial contract terms, although terms can range from 12 to 120 months. As a result, most of the revenues we report in each quarter are derived from the recognition of deferred revenues relating to subscriptions entered into during previous quarters. Consequently, a decline in new or renewed subscriptions in any single quarter will likely have only a small, and perhaps no apparent, impact on our revenue results for that quarter. Such a decline, however, will negatively affect our revenues in future quarters. Accordingly, the effect of significant downturns in sales and market acceptance of our service, and potential changes in our rate of renewals may not be fully reflected in our results of operations until future periods. Our subscription model also makes it difficult for us to rapidly increase our revenues through additional sales in any period, as revenues from new customers must be recognized over the applicable subscription term. In addition, we may be unable to adjust our cost structure to reflect the changes in revenues.
If we are unable to successfully manage the growth of our professional services business and improve our profit margin from these services, our operating results will be harmed.
Our professional services business, which performs implementation and configuration of our subscription service and training for our customers, has grown as our revenues from subscriptions have grown. We believe our investment in professional services facilitates the adoption of our subscription service. As a result, our sales efforts have been focused primarily on our subscription service, rather than the profitability of our professional services business. Historically, our pricing for professional services was predominantly on a fixed-fee basis and the cost of the time and materials incurred to complete these services was greater than the amount charged to the customer. These factors contributed to our negative gross profit percentages from professional services and other of
(4)%
for the
year ended
December 31, 2012
,
(51)%
and
(43)%
for the
six months ended
December 31, 2011
and
December 31, 2010
and (21)% and
(202)%
for fiscal 2011 and
fiscal 2010
. The improvement in gross profit percentages was due in part to the adoption of new revenue recognition accounting guidance commencing on July 1, 2010. In addition, in December 2011, we began shifting our pricing model to a time-and-materials basis and pricing our services predominantly based on the anticipated cost of those services. If we are unable to manage the growth of our professional services business and sustain our projected utilization rate for our professional services personnel, our operating results, including our profit margins, will be harmed.
We may be sued by third parties for alleged infringement of their proprietary rights.
There is considerable patent and other intellectual property development activity in our industry. Our success depends in part on not infringing upon the intellectual property rights of others, however, we may be unaware of the intellectual property rights of others that may cover some or all of our technology or services. From time to time, our competitors or other third parties may claim that we are infringing upon their intellectual property rights, and we may be found to be infringing upon such rights. In the future, we may receive claims that our applications and underlying technology infringe or violate the claimant’s intellectual property rights. Any claims or litigation could cause us to incur significant expenses and, if successfully asserted against us, could
13
require that we pay substantial damages or ongoing royalty payments, prevent us from offering our service, or require that we comply with other unfavorable terms. We may also be obligated to indemnify our customers or business partners in connection with any such litigation and to obtain licenses, modify our service or refund fees, which could further exhaust our resources. In addition, we may pay substantial settlement costs to resolve claims or litigation, whether or not legitimately or successfully asserted against us, which could include royalty or settlement payments in connection with any such litigation or to obtain licenses, modify our service or refund fees, which could further exhaust our resources. Even if we were to prevail in the event of claims or litigation against us, any claim or litigation regarding our intellectual property could be costly and time-consuming and divert the attention of our management and key personnel from our business operations. Such disputes could also disrupt our service, causing an adverse impact to our customer satisfaction and related renewal rates.
Our use of “open source” software could harm our ability to sell our service and subject us to possible litigation.
A significant portion of the technologies licensed or developed by us incorporate so-called “open source” software, and we may incorporate open source software into other services in the future. We attempt to monitor our use of open source software in an effort to avoid subjecting our service to conditions we do not intend; however, there can be no assurance that our efforts have been or will be successful. There is little or no legal precedent governing the interpretation of the terms of open source licenses, and therefore the potential impact of these terms on our business is uncertain and enforcement of these terms may result in unanticipated obligations regarding our service and technologies. For example, depending on which open source license governs open source software included within our service or technologies, we may be subjected to conditions requiring us to offer our service to users at no cost; make available the source code for modifications and derivative works based upon, incorporating or using the open source software; and license such modifications or derivative works under the terms of the particular open source license.
If an author or other third party that distributes such open source software were to allege that we had not complied with the conditions of one or more of these licenses, we could be required to incur significant legal costs defending ourselves against such allegations, we could be subject to significant damages or be enjoined from the distribution of our service. In addition, if we combine our proprietary software with open source software in a certain manner, under some open source licenses we could be required to release the source code of our proprietary software, which could substantially help our competitors develop solutions that are similar to or better than our service.
Any failure to protect our intellectual property rights could impair our differentiation or hurt our brand.
Our success depends to a significant degree on our ability to protect our proprietary technology and our brand. We rely on a combination of copyright, trade secret and other intellectual property laws and confidentiality procedures to protect our proprietary rights. If we fail to protect our intellectual property rights adequately, our competitors may gain access to our technology and our business may be harmed. In addition, defending our intellectual property rights might entail significant expense. Any of our trademarks or other intellectual property rights may be challenged by others or invalidated through administrative process or litigation. We have only recently begun to develop a strategy to seek, and may be unable to obtain, patent protection for our technology. In addition, any patents issued in the future may not provide us with competitive advantages, or may be successfully challenged by third parties. Furthermore, legal standards relating to the validity, enforceability and scope of protection of intellectual property rights are uncertain. Effective patent, trademark, copyright and trade secret protection may not be available to us in every country in which our service is available. The laws of some foreign countries may not be as protective of intellectual property rights as those in the United States, and mechanisms for enforcement of intellectual property rights may be inadequate. Accordingly, despite our efforts, we may be unable to prevent third parties from infringing upon or misappropriating our intellectual property.
We may be required to spend significant resources to monitor and protect our intellectual property rights. We may initiate claims or litigation against third parties for infringement of our proprietary rights or to establish the validity of our proprietary rights. Any litigation, whether or not it is resolved in our favor, could result in significant expense to us and divert the efforts of our technical and management personnel.
Our growth depends in part on the success of our strategic relationships with third parties and their continued performance.
We anticipate that we will continue to depend on various third parties, such as sales partners, implementation partners, systems integrators and managed services providers, in order to grow our business. Identifying and qualifying these and other partners, and negotiating and documenting relationships with them, require significant time and resources. Our agreements with partners are typically non-exclusive and do not prohibit them from working with our competitors or from offering competing solutions. Our competitors may be effective in providing incentives to third parties, including our partners, to favor their solutions or to prevent or reduce subscriptions to our service either by disrupting our relationship with existing customers or by limiting our ability to win new customers. In addition, global economic conditions could harm the businesses of our partners, and it is possible that they may not be able to devote the additional resources we expect to the relationship. If we are unsuccessful in
14
establishing or maintaining our relationships with these third parties, our ability to compete in the marketplace or to grow our revenues could be impaired and our operating results would suffer. Even if we are successful, we cannot assure you that these relationships will result in greater customer usage of our service or increased revenues.
If a customer is not satisfied with the quality of work performed by us or a third party, we could incur additional costs to address the situation, the profitability of that work might be impaired, and the customer’s dissatisfaction with our professional services could damage our reputation or ability to obtain additional revenues from that customer or prospective customers.
Sales to customers outside North America expose us to risks inherent in international sales.
Because we sell our service throughout the world, we are subject to risks and challenges that we would otherwise not face if we conducted our business only in North America. Sales outside of North America represented
29%
of our total revenues for the
year ended
December 31, 2012
, and we intend to continue to expand our international sales efforts. Our business and future prospects depend on increasing our international sales as a percentage of our total revenues, and the failure to grow internationally will harm our business. The risks and challenges associated with sales to customers outside North America are different in some ways from those associated with sales in North America and we have a limited history addressing those risks and meeting those challenges. The risks and challenges inherent with international sales include:
|
•
|
localization of our service, including translation into foreign languages and associated expenses;
|
|
•
|
differing laws and business practices, which may favor local competitors;
|
|
•
|
longer sales cycles;
|
|
•
|
compliance with multiple, conflicting and changing governmental laws and regulations, including employment, tax, privacy and data protection laws and regulations;
|
|
•
|
treatment of revenues from international sources and changes to tax codes, including being subject to foreign tax laws and being liable for paying withholding, income or other taxes in foreign jurisdictions;
|
|
•
|
regional data privacy laws that apply to the transmission of our customers’ data across international borders;
|
|
•
|
foreign currency fluctuations and controls;
|
|
•
|
different pricing environments;
|
|
•
|
differing cultural environments;
|
|
•
|
difficulties in staffing and managing foreign operations;
|
|
•
|
different or lesser protection of our intellectual property;
|
|
•
|
longer accounts receivable payment cycles and other collection difficulties;
|
|
•
|
regional economic conditions; and
|
|
•
|
regional political conditions.
|
Any of these factors could negatively impact our business and results of operations.
We face exposure to foreign currency exchange rate fluctuations.
We conduct significant transactions, including intercompany transactions, in currencies other than the United States dollar or the functional operating currency of the transactional entities. In addition, our international subsidiaries maintain significant net assets that are denominated in currencies other than the functional operating currencies of these entities. Accordingly, changes in the value of foreign currencies relative to the United States dollar can affect our revenues and operating results due to transactional and translational remeasurement that is reflected in our earnings. We do not currently maintain a program to hedge transactional exposures in foreign currencies. However, in the future, we may use derivative instruments, such as foreign currency forward and option contracts, to hedge certain exposures to fluctuations in foreign currency exchange rates. The use of such hedging activities may not offset any or more than a portion of the adverse financial effects of unfavorable movements in foreign exchange rates over the limited time the hedges are in place. Moreover, the use of hedging instruments may introduce additional risks if we are unable to structure effective hedges with such instruments. It is particularly difficult to forecast any impact from exchange rate movements, so there is a material risk that unanticipated currency fluctuations could adversely affect our results or cause our results to differ from investor expectations or our own guidance in any future periods.
15
Weakened global economic conditions may harm our industry, business and results of operations.
Our overall performance depends in part on worldwide economic conditions, which may remain challenging for the foreseeable future. Global financial developments seemingly unrelated to us or the IT industry may harm us. The United States and other key international economies have been impacted by falling demand for a variety of goods and services, restricted credit, poor liquidity, reduced corporate profitability, volatility in credit, equity and foreign exchange markets, bankruptcies and overall uncertainty with respect to the economy. These conditions affect the rate of information technology spending and could adversely affect our customers’ ability or willingness to purchase our service, delay prospective customers’ purchasing decisions, reduce the value or duration of their subscriptions, or affect renewal rates, all of which could harm our operating results.
Changes in laws, regulations and standards related to the Internet may cause our business to suffer.
Federal, state or foreign government bodies or agencies have in the past adopted, and may in the future adopt, laws and regulations affecting data privacy and the use of the Internet as a commercial medium. Industry organizations also regularly adopt and advocate for new standards in this area. For instance, we believe increased regulation is likely in the area of data privacy, and changing laws, regulations and standards applying to the solicitation, collection, processing or use of personal or consumer information could affect our customers’ ability to use and share data, potentially restricting our ability to store, process and share data with our customers. In addition, government agencies or private organizations may begin to impose taxes, fees or other charges for accessing the Internet, commerce conducted via the Internet or validation that particular processes follow the latest standards. These changes could limit the viability of Internet-based services such as ours. If we are not able to adjust to changing laws, regulations and standards related to the Internet, our business may be harmed.
Unanticipated changes in our effective tax rate could harm our future results.
We are subject to income taxes in the United States and various foreign jurisdictions, and our domestic and international tax liabilities are subject to the allocation of earnings and losses in differing jurisdictions. Our effective tax rate could be adversely affected by changes in the mix of earnings and losses in countries with differing statutory tax rates, certain non-deductible expenses as a result of acquisitions, the valuation of deferred tax assets and liabilities and changes in federal, state or international tax laws and accounting principles. Increases in our effective tax rate would reduce our profitability or in some cases increase our losses.
In addition, we may be subject to income tax audits by many tax jurisdictions throughout the world, many of which have not established clear guidance on the tax treatment of SaaS-based companies. Although we believe our income tax liabilities are reasonably estimated and accounted for in accordance with applicable laws and principles, an adverse resolution of one or more uncertain tax positions in any period could have a material impact on the results of operations for that period, and potentially result in increased effective tax rates over the long term.
Natural disasters and other events beyond our control could harm our business.
Natural disasters or other catastrophic events may cause damage or disruption to our operations, international commerce and the global economy, and thus could have a negative effect on us. Our business operations are subject to interruption by natural disasters, fire, power shortages, pandemics and other events beyond our control. Although we maintain crisis management and disaster response plans, such events could make it difficult or impossible for us to deliver our service to our customers, and could decrease demand for our service. The majority of our research and development activities, corporate offices, information technology systems, and other critical business operations are located near major seismic faults in California. Customer data could be lost, significant recovery time could be required to resume operations and our financial condition and operating results could be harmed in the event of a major earthquake or catastrophic event.
We are an “emerging growth company,” and any decision on our part to comply with certain reduced disclosure requirements applicable to emerging growth companies could make our common stock less attractive to investors.
We are an “emerging growth company,” as defined in the Jumpstart Our Business Startups Act enacted in April 2012, and, for as long as we continue to be an emerging growth company, we may choose to take advantage of exemptions from various reporting requirements applicable to other public companies including, but not limited to, not being required to comply with the auditor attestation requirements of Section 404 of the Sarbanes-Oxley Act of 2002, reduced disclosure obligations regarding executive compensation in our periodic reports and proxy statements, and exemptions from the requirements of holding a nonbinding advisory vote on executive compensation and stockholder approval of any golden parachute payments not previously approved. We could be an emerging growth company for up to five years, although, if the market value of our common stock that is held by non-affiliates exceeds $700 million as of June 30 of any year starting with June 30, 2013, we could cease to be an “emerging growth company” as of the following December 31. We cannot predict if investors will find our common stock less attractive if we choose to rely on these exemptions. If some investors find our common stock less attractive as a result of any
16
choices to reduce future disclosure, there may be a less active trading market for our common stock and our stock price may be more volatile. We expect that we will cease to be an “emerging growth company” as of December 31, 2013.
Under Section 107(b) of the Jumpstart Our Business Startups Act, emerging growth companies can delay adopting new or revised accounting standards until such time as those standards apply to private companies. We have irrevocably elected not to avail ourselves of this exemption from new or revised accounting standards and, therefore, we will be subject to the same new or revised accounting standards as other public companies that are not emerging growth companies.
We incur significant costs as a result of operating as a public company and our management has to devote substantial time to public company communications and compliance obligations.
As a public company, we incur significant legal, accounting and other expenses that we did not incur as a private company. The Sarbanes-Oxley Act and other legislation and rules implemented by the Securities and Exchange Commission, or SEC, and the New York Stock Exchange impose various requirements on public companies, including requiring changes in corporate governance practices. Our management and other personnel need to devote a substantial amount of time to these compliance requirements. These burdens may increase as new legislation is passed and implemented, including any new requirements that the Dodd-Frank Wall Street Reform and Consumer Protection Act of 2010 may impose on public companies. Moreover, these rules and regulations, along with compliance with accounting principles and regulatory interpretations of such principles, have increased and will continue to increase our legal, accounting and financial compliance costs and have made and will continue to make some activities more time-consuming and costly. For example, we expect these rules and regulations to make it more difficult and more expensive for us to obtain director and officer liability insurance, and we may be required to accept reduced policy limits and coverage or incur substantial costs to maintain the same or similar coverage.
These rules and regulations could also make it more difficult for us to attract and retain qualified persons to serve on our board of directors or our board committees, or as executive officers.
If we do not remediate material weaknesses in our internal control over financial reporting or are unable to implement and maintain effective internal control over financial reporting in the future, the accuracy and timeliness of our financial reporting may be adversely affected.
Prior to our initial public offering in June 2012, we were a private company and historically had limited accounting personnel and other supervisory resources with which to adequately execute our accounting processes and effectively address our internal control over financial reporting. This lack of adequate accounting resources contributed to audit adjustments to our financial statements in the past.
In connection with our preparation of the financial statements for the year ended June 30, 2011 and the six months ended December 31, 2011, our independent registered public accounting firm identified control deficiencies in our internal control that constituted material weaknesses. A material weakness is defined under the standards issued by the Public Company Accounting Oversight Board as a deficiency, or combination of deficiencies, in internal control over financial reporting, such that there is a reasonable possibility that a material misstatement of our financial statements will not be prevented or detected and corrected on a timely basis. The material weaknesses our independent registered public accounting firm identified related to the design and operation of policies and procedures for accounting and reporting control processes, performance of account review and analysis, the development and review of complex judgments and estimates, the preparation of the provision for income taxes and the identification, communication and accounting of significant contracts and agreements. These material weaknesses, which contributed to multiple audit adjustments, primarily resulted from our failure to maintain a sufficient number of personnel with an appropriate level of knowledge, experience and training in the application of U.S. generally accepted accounting principles, or GAAP.
During the six months ended December 31, 2011, we hired a new Chief Financial Officer, a new Vice President of Finance and several new finance and accounting managers which significantly increases our finance and accounting team’s experience in GAAP and financial reporting for publicly traded companies. In September 2011, we engaged a third-party tax firm and in February 2012, we hired a Senior Manager of Internal Audit. In March 2012, we hired a Vice President of Tax to assist with the accounting for income taxes and review of complex tax accounting matters. In January 2013, we appointed a Vice-President, Internal Audit and increased the staff of internal audit. In addition, we expect to retain consultants to advise us on making further improvements to our internal controls related to these accounting areas. We believe that these additional resources enable us to broaden the scope and quality of our internal review of underlying information related to financial reporting and to further enhance our financial review procedures, including both the accounting processes for income taxes and significant contracts and agreements.
We have taken steps to address the material weaknesses as disclosed in the preceding paragraphs and as a result, we believe that these material weaknesses have been remediated. However, we have not completed the necessary documentation and testing
17
procedures under Section 404 of the Sarbanes-Oxley Act and cannot assure you that we will be able to implement and maintain an effective internal control over financial reporting in the future. Any failure to maintain such controls could severely inhibit our ability to accurately report our financial condition or results of operations.
The Sarbanes-Oxley Act requires, among other things, that we assess the effectiveness of our internal control over financial reporting annually and disclosure controls and procedures quarterly. In particular, beginning with the year ending on December 31, 2013, we must perform system and process evaluation and testing of our internal control over financial reporting to allow management to report on the effectiveness of our internal control over financial reporting, as required by Section 404(a) of the Sarbanes-Oxley Act. Our independent registered public accounting firm is not required to attest to the effectiveness of our internal control over financial reporting pursuant to Section 404(b) of the Sarbanes-Oxley Act until the later of the year following our first annual report required to be filed with the SEC, or the date we are no longer an emerging growth company. At such time, our independent registered public accounting firm may issue a report that is adverse in the event it is not satisfied with the level at which our controls are documented, designed or operating. Moreover, our testing, or the subsequent testing by our independent registered public accounting firm, that must be performed may reveal other material weaknesses or that the material weaknesses described above have not been fully remediated. If we do not remediate the material weaknesses described above, or if other material weaknesses are identified or we are not able to comply with the requirements of Section 404 in a timely manner, our reported financial results could be materially misstated or could subsequently require restatement, we could receive an adverse opinion regarding our internal controls over financial reporting from our independent registered public accounting firm and we could be subject to investigations or sanctions by regulatory authorities. The remediation of this situation could require additional financial and management resources, further divert management's time and attention from the core business, hurt our reputation with investors, and the market price of our stock could decline.
We may acquire or invest in companies, which may divert our management’s attention, and result in additional dilution to our stockholders. We may be unable to integrate acquired businesses and technologies successfully or achieve the expected benefits of such acquisitions or investments.
We may evaluate and consider potential strategic transactions, including acquisitions of, or investments in, businesses, technologies, services, products and other assets in the future. We also may enter into relationships with other businesses to expand our service offerings or our ability to provide services in international locations, which could involve preferred or exclusive licenses, additional channels of distribution, discount pricing or investments in other companies. An acquisition, investment or business relationship may result in unforeseen operating difficulties and expenditures. In particular, we may encounter difficulties assimilating or integrating the businesses, technologies, products, personnel or operations of the acquired companies, particularly if the key personnel of the acquired company choose not to work for us, their software is not easily adapted to work with ours, or we have difficulty retaining the customers of any acquired business due to changes in ownership, management or otherwise. Acquisitions may also disrupt our business, divert our resources and require significant management attention that would otherwise be available for development of our existing business. Moreover, the anticipated benefits of any acquisition, investment or business relationship may not be realized or we may be exposed to unknown risks or liabilities.
Negotiating these transactions can be time-consuming, difficult and expensive, and our ability to close these transactions may often be subject to conditions or approvals that are beyond our control. Consequently, these transactions, even if undertaken and announced, may not close. For one or more of those transactions, we may:
|
•
|
issue additional equity securities that would dilute our stockholders;
|
|
•
|
use cash that we may need in the future to operate our business;
|
|
•
|
incur debt on terms unfavorable to us or that we are unable to repay;
|
|
•
|
incur large charges or substantial liabilities;
|
|
•
|
encounter difficulties retaining key employees of the acquired company or integrating diverse software codes or business cultures; and
|
|
•
|
become subject to adverse tax consequences, substantial depreciation or deferred compensation charges.
|
Risks Relating to Ownership of Our Common Stock
The market price of our common stock is likely to be volatile and could subject us to litigation.
The trading price of our common stock has been, and is likely to continue to be, volatile and could be subject to wide fluctuations in response to various factors, some of which are beyond our control. Since shares of our common stock were sold in our initial public offering in June 2012 at a price of $18.00 per share, our stock price has ranged from $22.62 to $41.77 through
18
February 28, 2013. In addition, the trading prices of the securities of technology companies in general have been highly volatile, and the volatility in market price and trading volume of securities is often unrelated or disproportionate to the financial performance of the companies issuing the securities. Factors affecting the market price of our common stock include:
|
•
|
variations in our operating results, earnings per share, cash flows from operating activities, deferred revenue, and other financial metrics and non-financial metrics, and how those results compare to analyst expectations;
|
|
•
|
forward-looking statements related to future revenues and earnings per share;
|
|
•
|
the net increases in the number of customers, either independently or as compared with published expectations of industry, financial or other analysts that cover our company;
|
|
•
|
changes in the estimates of our operating results or changes in recommendations by securities analysts that elect to follow our common stock;
|
|
•
|
announcements of technological innovations, new solutions or enhancements to services, strategic alliances or significant agreements by us or by our competitors;
|
|
•
|
announcements by us or by our competitors of mergers or other strategic acquisitions, or rumors of such transactions involving us or our competitors;
|
|
•
|
announcements of customer additions and customer cancellations or delays in customer purchases;
|
|
•
|
recruitment or departure of key personnel;
|
|
•
|
disruptions in our service due to computer hardware, software or network problems, security breaches, or other man-made or natural disasters;
|
|
•
|
the economy as a whole, market conditions in our industry, and the industries of our customers;
|
|
•
|
trading activity by a limited number of stockholders who together beneficially own a majority of our outstanding common stock;
|
|
•
|
the size of our market float; and
|
|
•
|
any other factors discussed herein.
|
In addition, if the market for technology stocks or the stock market in general experiences uneven investor confidence, the market price of our common stock could decline for reasons unrelated to our business, operating results or financial condition. The market price of our common stock might also decline in reaction to events that affect other companies within, or outside, our industry even if these events do not directly affect us. Some companies that have experienced volatility in the trading price of their stock have been the subject of securities class action litigation. If we are the subject of such litigation, it could result in substantial costs and a diversion of our management’s attention and resources.
We do not intend to pay dividends on our common stock so any returns will be limited to changes in the value of our common stock.
We have never declared or paid any cash dividends on our common stock. We currently anticipate that we will retain future earnings for the development, operation and expansion of our business and do not anticipate declaring or paying any cash dividends for the foreseeable future. In addition, our ability to pay cash dividends on our common stock may be prohibited or limited by the terms of any future debt financing arrangement. Any return to stockholders will therefore be limited to the increase, if any, of our stock price.
Our directors, officers and principal stockholders beneficially own a significant percentage of our stock and are able to exert significant control over matters subject to stockholder approval.
As of February 28, 2013, our directors, officers and their respective affiliates beneficially owned in the aggregate approximately 42% of our outstanding voting stock, including approximately 18% controlled by persons affiliated with Sequoia Capital and approximately 14% controlled by persons affiliated with JMI Equity. Together, these stockholders have the ability to influence us through this ownership position. These stockholders may be able to determine all matters requiring stockholder approval. For example, these stockholders may be able to control elections of directors, amendments of our organizational documents, or the approval of any merger, sale of assets, or other major corporate transaction. This may prevent or discourage unsolicited acquisition proposals or offers for our common stock that you may feel are in your best interest as one of our stockholders.
19
Sales of a substantial number of shares of our common stock in the public market by our existing stockholders could cause our stock price to fall.
Sales of a substantial number of shares of our common stock in the public market, or the perception that these sales might occur could depress the market price of our common stock and may make it more difficult for you to sell your common stock at a time and price that you deem appropriate. We are unable to predict the effect that sales may have on the prevailing market price of our common stock. In addition, certain holders of shares of our common stock are entitled to rights with respect to the registration of their shares under the Securities Act of 1933, as amended, or the Securities Act, Registration of these shares under the Securities Act would result in the shares becoming freely tradable without restriction under the Securities Act, except for shares held by our affiliates as defined in Rule 144 under the Securities Act. Any sales of securities by existing stockholders could have a material adverse effect on the trading price of our common stock.
Provisions in our restated certificate of incorporation and restated bylaws and Delaware law might discourage, delay or prevent a change of control of our company or changes in our management and, therefore, depress the market price of our common stock.
Our restated certificate of incorporation and restated bylaws contain provisions that could depress the market price of our common stock by acting to discourage, delay or prevent a change in control of our company or changes in our management that the stockholders of our company may deem advantageous. These provisions among other things:
|
•
|
establish a classified board of directors so that not all members of our board are elected at one time;
|
|
•
|
permit the board of directors to establish the number of directors;
|
|
•
|
provide that directors may only be removed “for cause” and only with the approval of 66 2/3% of our stockholders;
|
|
•
|
require super-majority voting to amend some provisions in our restated certificate of incorporation and restated bylaws;
|
|
•
|
authorize the issuance of “blank check” preferred stock that our board could use to implement a stockholder rights plan;
|
|
•
|
eliminate the ability of our stockholders to call special meetings of stockholders;
|
|
•
|
prohibit stockholder action by written consent, which requires all stockholder actions to be taken at a meeting of our stockholders;
|
|
•
|
provide that the board of directors is expressly authorized to make, alter or repeal our restated bylaws; and
|
|
•
|
establish advance notice requirements for nominations for election to our board or for proposing matters that can be acted upon by stockholders at annual stockholder meetings.
|
In addition, Section 203 of the Delaware General Corporation Law may discourage, delay or prevent a change in control of our company. Section 203 imposes certain restrictions on merger, business combinations and other transactions between us and holders of 15% or more of our common stock.
20
None.
Our principal office is located in San Diego, California. We also maintain offices in multiple locations in the United States and internationally, including Amsterdam, Boston, London, New York, San Jose, Seattle and Sydney. All of our properties are currently leased. We believe our existing facilities are adequate to meet our current requirements. See Note 17 to the consolidated financial statements for more information about our lease commitments. If we were to require additional space, we believe we will be able to obtain such space on acceptable, commercially reasonable, terms.
From time to time, we may become involved in legal proceedings arising in the ordinary course of our business. We are not presently a party to any legal proceedings that, if determined adversely to us, would individually or taken together have a material adverse effect on our business, operating results, financial condition or cash flows.
Not applicable.
Market Information for Common Stock
Our common stock is listed on the New York Stock Exchange under the symbol “NOW.”
The following table sets forth for the indicated periods the high and low sales prices of our common stock as reported by the New York Stock Exchange.
|
High
|
|
Low
|
|||||
|
Year ended December 31, 2012
|
|||||||
|
Second Quarter (from June 29, 2012)
|
$
|
24.75
|
|
$
|
22.83
|
|
|
|
Third Quarter
|
$
|
41.77
|
|
$
|
22.62
|
|
|
|
Fourth Quarter
|
$
|
38.14
|
|
$
|
28.15
|
|
|
Dividend Policy
We have never paid any cash dividends on our common stock. Our board of directors currently intends to retain any future earnings to support operations and to finance the growth and development of our business and does not intend to pay cash dividends on our common stock for the foreseeable future. Any future determination related to our dividend policy will be made at the discretion of our board.
Stockholders
As of December 31, 2012, there were 42 registered stockholders of record (not including beneficial holders of stock held in street names) of our common stock.
Securities Authorized for Issuance under Equity Compensation Plans
The information required by this item will be included in an amendment to this Annual Report on Form 10-K or incorporated by reference from our definitive proxy statement to be filed pursuant to Regulation 14A.
Stock Performance Graph
21
The following shall not be deemed incorporated by reference into any of our other filings under the Securities Exchange Act of 1934, as amended, or the Securities Act of 1933, as amended, except to the extent we specifically incorporate it by reference into such filing.
The graph below compares the cumulative total stockholder return on our common stock with the cumulative total return on the NYSE Composite Index and the Standard & Poor Systems Software Index for the period beginning on June 29, 2012 (the date our common stock commenced trading on the New York Stock Exchange) through December 31, 2012, assuming an initial investment of $100. Data for the NYSE Composite Index and the Standard & Poor Systems Software Index assume reinvestment of dividends.
The comparisons in the graph below are based upon historical data and are not indicative of, nor intended to forecast, future performance of our common stock.
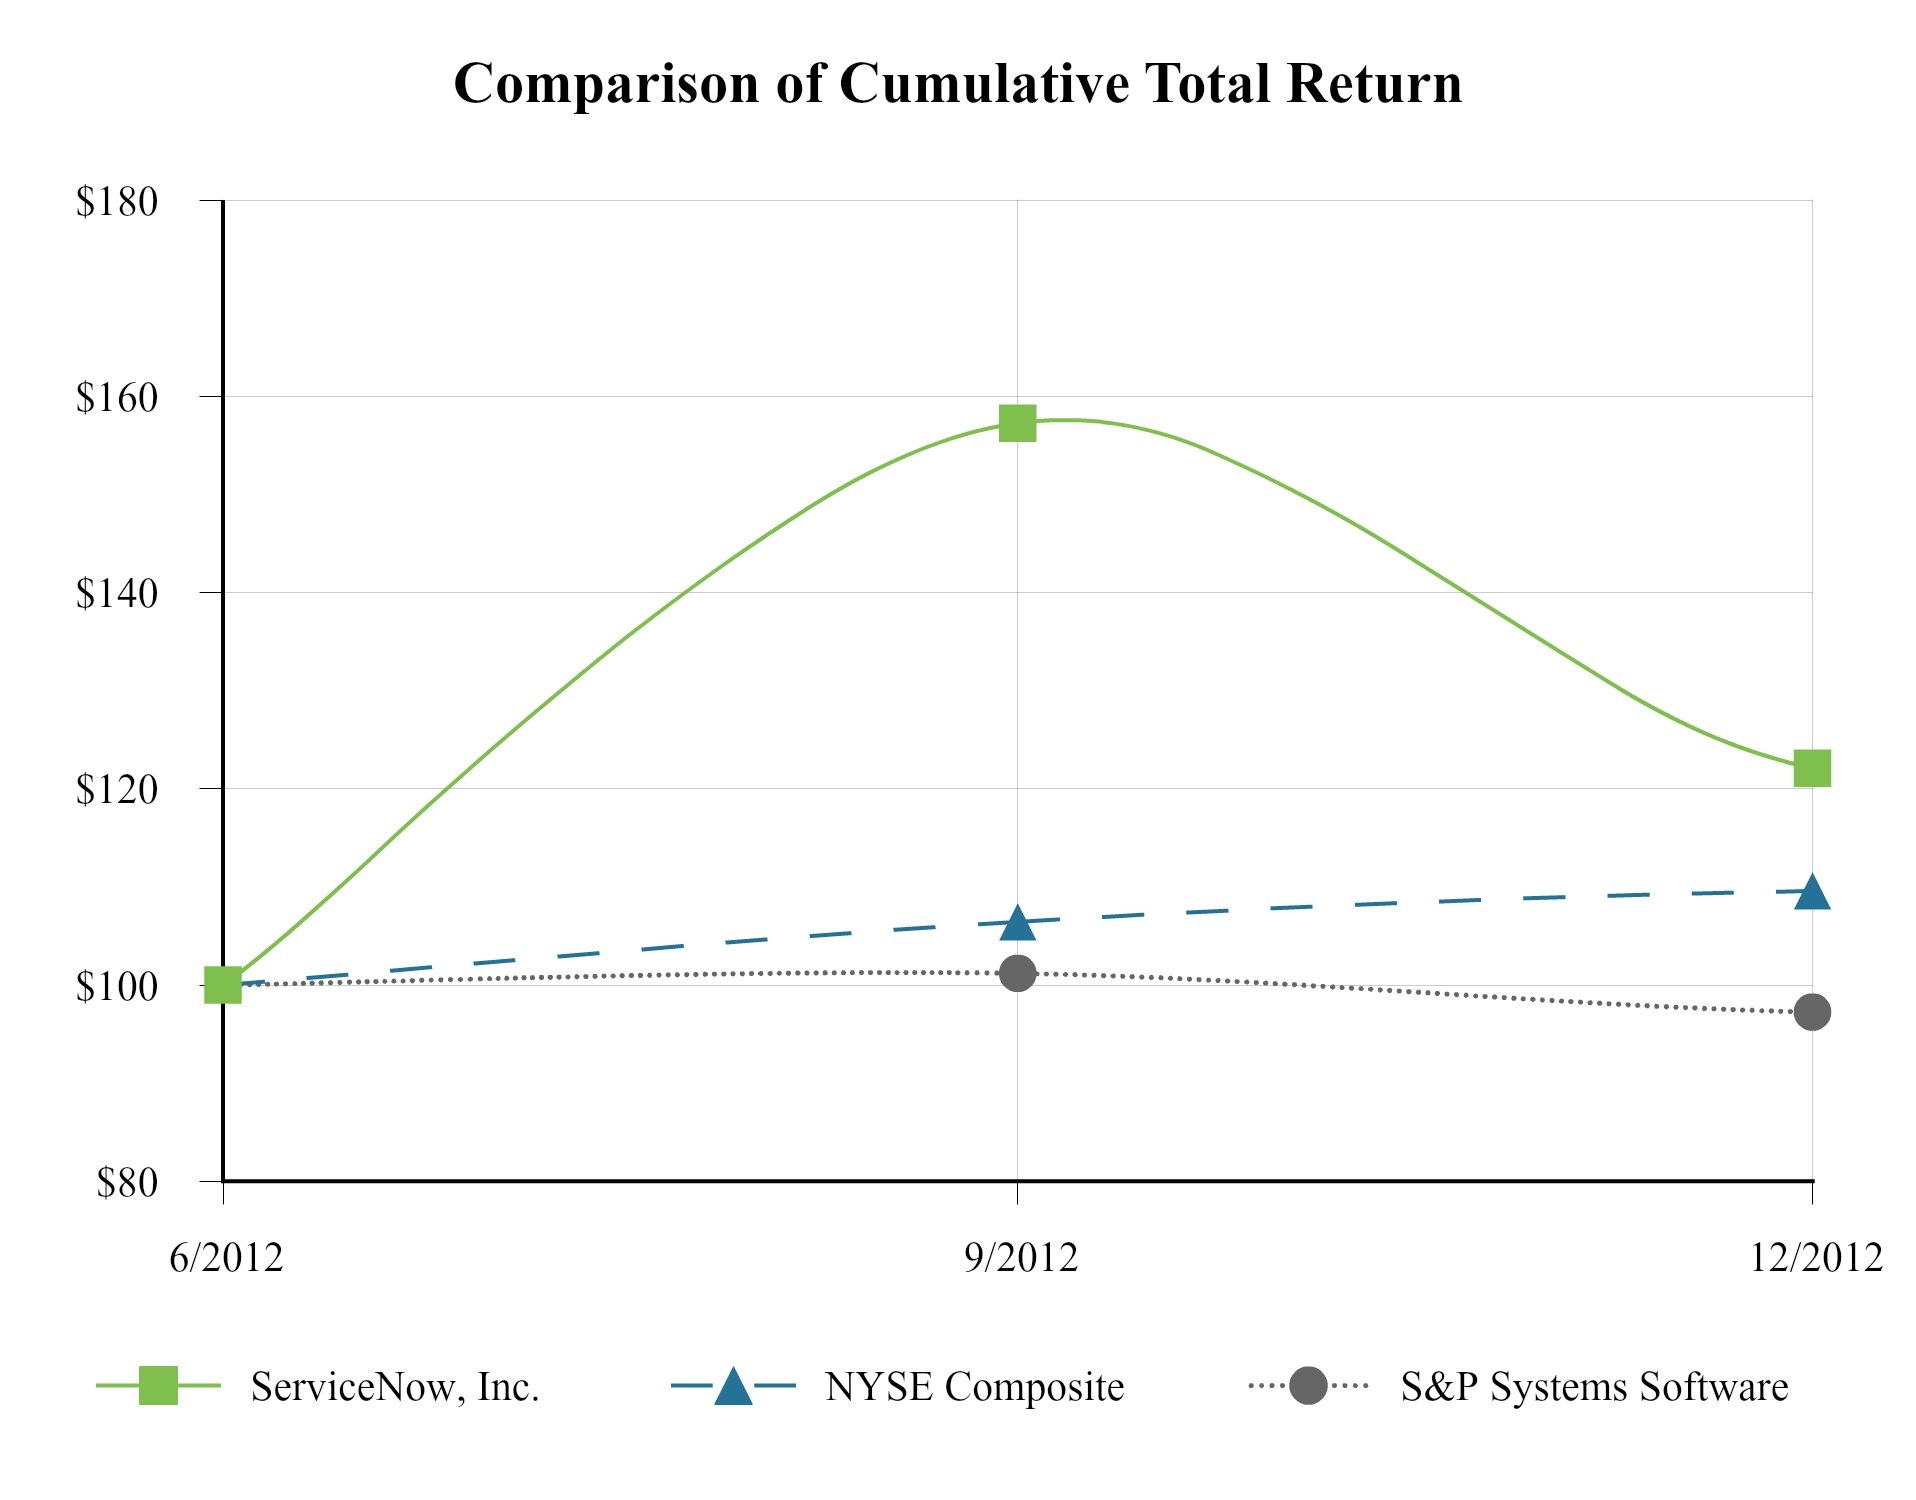
|
6/29/2012
|
|
9/30/2012
|
|
12/31/2012
|
|
|||
|
ServiceNow, Inc.
|
100.00
|
|
157.24
|
|
122.07
|
|
||
|
NYSE Composite
|
100.00
|
|
106.46
|
|
109.60
|
|
||
|
S&P Systems Software
|
100.00
|
|
101.19
|
|
97.22
|
|
||
Recent Sales of Unregistered Securities and Use of Proceeds
The Form S-1 Registration Statement (Registration No. 333-180486) relating to our initial public offering, or IPO, was declared effective by the SEC on June 28, 2012, and the offering commenced the following day. The offering did not terminate before all of the securities registered in the registration statement were sold. Morgan Stanley & Co. LLC, Citigroup Global Markets, Inc. and Deutsche Bank Securities Inc. acted as book running managers for the offering, and Barclays Capital Inc., Credit Suisse Securities (USA) LLC, UBS Securities LLC, Pacific Crest Securities LLC and Wells Fargo Securities, LLC acted as co-managers of the offering.
The securities registered were 11,650,000 shares of common stock (2,650,000 shares of which were held before our IPO by certain of our stockholders), plus 1,747,500 additional shares to cover the underwriters' over-allotment option (397,500 of which
22
were held before our IPO by certain of our stockholders). The aggregate public offering price of the offering amount registered, including shares to cover the underwriters' over-allotment option, was $241.2 million. On July 5, 2012 we closed the IPO in which we sold 10,350,000 shares of our common stock and the selling stockholders sold 3,047,500 shares of our common stock. The shares sold and issued in the IPO included the underwriters' full exercise of their over-allotment option. All sales were at the IPO price of $18.00 per share, for an aggregate offering price of $186.3 million for the shares sold by us, and $54.9 million for the shares sold by the selling stockholders, making the aggregate offering price of the amount sold $241.2 million.
The net offering proceeds to us after deducting underwriters' discounts and commissions of approximately $13.0 million and other offering expenses of approximately $3.5 million was approximately
$169.8 million
. No payments were made by us to directors, officers or persons owning ten percent or more of our common stock or to their associates, or to our affiliates, other than payments in the ordinary course of business to officers for salaries, or as a result of sales of shares of common stock by selling stockholders in the offering.
There has been no material change in the planned use of proceeds from our initial public offering as described in our final prospectus filed with the Securities and Exchange Commission on June 29, 2012 pursuant to Rule 424(b).
As of
December 31, 2012
, we used $
78.9 million
of the proceeds from the IPO for additions to and expansions of our data center operations, to build out our office facilities, and for working capital and other general corporate purposes. Pending the use of proceeds from the IPO, we have invested the net proceeds in short-term, interest-bearing, investment-grade securities. Our management has broad discretion in the application of the net proceeds from the IPO and investors will be relying on the judgment of our management regarding the application of the proceeds.
Purchases of Equity Securities.
During the three months ended December 31, 2012, we repurchased and subsequently retired the following shares from former employees by exercising our right to repurchase unvested shares upon termination of employment at a price equal to the original purchase price paid by such employees for such shares:
|
(a)
Total Number of Shares (or Units) Purchased
|
(b)
Average Price Paid per Share (or Unit)
|
(c)
Total Number of Shares (or Units) Purchased as Part of Publicly Announced Plans or Programs
|
(d)
Maximum Number (or Approximate Dollar Value) of Shares (or Units) That May Yet Be Purchased Under the Plans or Programs
|
|||||||
|
October 2012
|
32,084
|
|
$
|
2.33
|
|
N/A
|
N/A
|
|||
|
November 2012
|
—
|
|
N/A
|
|
N/A
|
N/A
|
||||
|
December 2012
|
—
|
|
N/A
|
|
N/A
|
N/A
|
||||
|
Total
|
32,084
|
|
$
|
2.33
|
|
N/A
|
N/A
|
|||
23
The following selected consolidated financial data should be read together with our consolidated financial statements and accompanying notes and “Management’s Discussion and Analysis of Financial Condition and Results of Operations” appearing elsewhere in this filing. The selected consolidated financial data in this section are not intended to replace our consolidated financial statements and the related notes. Our historical results are not necessarily indicative of our future results.
The selected consolidated statements of operations data for the year ended December 31, 2012, for the six months ended December 31, 2011, fiscal 2011 and 2010, and the selected consolidated balance sheet data as of December 31, 2012 and 2011 are derived from our audited consolidated financial statements and are included in this Form 10-K. The consolidated statements of operations data for fiscal 2009 and the consolidated balance sheet data as of June 30, 2011, 2010, and 2009 are derived from our audited consolidated financial statements which are not included in this Form 10-K. The consolidated statement of operations data for the year ended December 31, 2011 and the six months ended December 31, 2010 are derived from our unaudited consolidated financial statements included in this Form 10-K. The consolidated statements of operations data for fiscal 2008 and the consolidated balance sheet data as of June 30, 2008 are derived from our unaudited consolidated financial statements which are not included in this Form 10-K. We have prepared the unaudited financial information on the same basis as the audited consolidated financial statements and have included, in our opinion, all adjustments, consisting only of normal recurring adjustments, we consider necessary for a fair statement of the financial information set forth in those statements.
|
|
Year Ended December 31,
|
Six Months Ended
December 31,
|
Fiscal Year Ended June 30,
|
||||||||||||||||||||||||||||
|
|
2012
|
2011
|
2011
|
2010
|
2011
|
2010
|
2009
|
2008
|
|||||||||||||||||||||||
|
|
(in thousands, except share and per share data)
|
||||||||||||||||||||||||||||||
|
Consolidated Statements of Operations Data:
|
|||||||||||||||||||||||||||||||
|
Revenues
(1)
:
|
|||||||||||||||||||||||||||||||
|
Subscription
|
$
|
204,526
|
|
$
|
110,886
|
|
$
|
64,886
|
|
$
|
33,191
|
|
$
|
79,191
|
|
$
|
40,078
|
|
$
|
17,841
|
|
$
|
8,644
|
|
|||||||
|
Professional services and other
|
39,186
|
|
17,186
|
|
8,489
|
|
4,753
|
|
13,450
|
|
3,251
|
|
1,474
|
|
137
|
|
|||||||||||||||
|
Total revenues
|
243,712
|
|
128,072
|
|
73,375
|
|
37,944
|
|
92,641
|
|
43,329
|
|
19,315
|
|
8,781
|
|
|||||||||||||||
|
Cost of revenues
(2)(3)
:
|
|||||||||||||||||||||||||||||||
|
Subscription
|
63,258
|
|
24,288
|
|
15,073
|
|
6,096
|
|
15,311
|
|
6,378
|
|
3,140
|
|
1,838
|
|
|||||||||||||||
|
Professional services and other
|
40,751
|
|
22,336
|
|
12,850
|
|
6,778
|
|
16,264
|
|
9,812
|
|
4,711
|
|
2,717
|
|
|||||||||||||||
|
Total cost of revenues
|
104,009
|
|
46,624
|
|
27,923
|
|
12,874
|
|
31,575
|
|
16,190
|
|
7,851
|
|
4,555
|
|
|||||||||||||||
|
Gross profit
|
139,703
|
|
81,448
|
|
45,452
|
|
25,070
|
|
61,066
|
|
27,139
|
|
11,464
|
|
4,226
|
|
|||||||||||||||
|
Operating expenses
(2)(3)
:
|
|||||||||||||||||||||||||||||||
|
Sales and marketing
|
103,837
|
|
52,896
|
|
32,501
|
|
13,728
|
|
34,123
|
|
19,334
|
|
8,499
|
|
6,142
|
|
|||||||||||||||
|
Research and development
|
39,333
|
|
11,276
|
|
7,030
|
|
2,758
|
|
7,004
|
|
7,194
|
|
2,433
|
|
2,098
|
|
|||||||||||||||
|
General and administrative
|
34,117
|
|
16,046
|
|
10,084
|
|
3,417
|
|
9,379
|
|
28,810
|
|
6,363
|
|
1,854
|
|
|||||||||||||||
|
Total operating expenses
|
177,287
|
|
80,218
|
|
49,615
|
|
19,903
|
|
50,506
|
|
55,338
|
|
17,295
|
|
10,094
|
|
|||||||||||||||
|
Income (loss) from operations
|
(37,584
|
)
|
1,230
|
|
(4,163
|
)
|
5,167
|
|
10,560
|
|
(28,199
|
)
|
(5,831
|
)
|
(5,868
|
)
|
|||||||||||||||
|
Interest and other income (expense), net
|
1,604
|
|
(1,129
|
)
|
(1,446
|
)
|
289
|
|
606
|
|
(1,226
|
)
|
(27
|
)
|
10
|
|
|||||||||||||||
|
Income (loss) before provision for income taxes
|
(35,980
|
)
|
101
|
|
(5,609
|
)
|
5,456
|
|
11,166
|
|
(29,425
|
)
|
(5,858
|
)
|
(5,858
|
)
|
|||||||||||||||
|
Provision for income taxes
|
1,368
|
|
1,758
|
|
1,075
|
|
653
|
|
1,336
|
|
280
|
|
48
|
|
23
|
|
|||||||||||||||
|
Net income (loss)
|
$
|
(37,348
|
)
|
$
|
(1,657
|
)
|
$
|
(6,684
|
)
|
$
|
4,803
|
|
$
|
9,830
|
|
$
|
(29,705
|
)
|
$
|
(5,906
|
)
|
$
|
(5,881
|
)
|
|||||||
|
Net income (loss) attributable to common stockholders
(4)
:
|
|||||||||||||||||||||||||||||||
|
Basic
|
$
|
(37,656
|
)
|
$
|
(2,282
|
)
|
$
|
(6,996
|
)
|
$
|
762
|
|
$
|
1,639
|
|
$
|
(30,345
|
)
|
$
|
(6,531
|
)
|
$
|
(6,503
|
)
|
|||||||
|
Diluted
|
$
|
(37,656
|
)
|
$
|
(2,282
|
)
|
$
|
(6,996
|
)
|
$
|
1,111
|
|
$
|
2,310
|
|
$
|
(30,345
|
)
|
$
|
(6,531
|
)
|
$
|
(6,503
|
)
|
|||||||
|
Net income (loss) per share attributable to common stockholders
(4)
:
|
|||||||||||||||||||||||||||||||
|
Basic
|
$
|
(0.51
|
)
|
$
|
(0.11
|
)
|
$
|
(0.33
|
)
|
$
|
0.04
|
|
$
|
0.09
|
|
$
|
(1.31
|
)
|
$
|
(0.17
|
)
|
$
|
(0.16
|
)
|
|||||||
|
Diluted
|
$
|
(0.51
|
)
|
$
|
(0.11
|
)
|
$
|
(0.33
|
)
|
$
|
0.04
|
|
$
|
0.08
|
|
$
|
(1.31
|
)
|
$
|
(0.17
|
)
|
$
|
(0.16
|
)
|
|||||||
|
Weighted-average shares used to compute net income (loss) per share attributable to common stockholders
(4)
:
|
|||||||||||||||||||||||||||||||
|
Basic
|
73,908,631
|
|
20,154,088
|
|
21,104,219
|
|
17,156,445
|
|
18,163,977
|
|
23,157,576
|
|
39,039,066
|
|
40,115,383
|
|
|||||||||||||||
|
Diluted
|
73,908,631
|
|
20,154,088
|
|
21,104,219
|
|
27,622,357
|
|
28,095,486
|
|
23,157,576
|
|
39,039,066
|
|
40,115,383
|
|
|||||||||||||||
24
|
(1)
|
Revenues for the
year ended
December 31, 2012
and
2011
, the
six months ended
December 31, 2011
and
2010
and the fiscal year ended
June 30, 2011
reflect the prospective adoption of new revenue accounting guidance commencing on July 1, 2010. As a result of this guidance, we separately allocate value for multiple element contracts between our subscription revenues and professional services revenues based on the best estimate of selling price. Additionally, we recognize professional services revenues as the services are delivered. Please refer to Note 2 to our consolidated financial statements for further discussion of our revenue recognition policies.
|
|
(2)
|
Stock-based compensation included in the statements of operations data above was as follows:
|
|
|
Year Ended December 31,
|
Six Months Ended
December 31,
|
Fiscal Year Ended June 30,
|
||||||||||||||||||||||||||||
|
|
2012
|
2011
|
2011
|
2010
|
2011
|
2010
|
2009
|
2008
|
|||||||||||||||||||||||
|
|
(in thousands)
|
||||||||||||||||||||||||||||||
|
Cost of revenues:
|
|||||||||||||||||||||||||||||||
|
Subscription
|
$
|
3,929
|
|
$
|
997
|
|
$
|
674
|
|
$
|
225
|
|
$
|
548
|
|
$
|
48
|
|
$
|
6
|
|
$
|
3
|
|
|||||||
|
Professional services and other
|
1,574
|
|
273
|
|
193
|
|
37
|
|
117
|
|
28
|
|
11
|
|
5
|
|
|||||||||||||||
|
Sales and marketing
|
10,189
|
|
2,583
|
|
2,010
|
|
431
|
|
1,004
|
|
277
|
|
45
|
|
22
|
|
|||||||||||||||
|
Research and development
|
6,496
|
|
965
|
|
704
|
|
207
|
|
468
|
|
90
|
|
50
|
|
12
|
|
|||||||||||||||
|
General and administrative
|
5,749
|
|
2,652
|
|
2,056
|
|
221
|
|
817
|
|
102
|
|
15
|
|
14
|
|
|||||||||||||||
|
(3)
|
Cost of revenues and operating expenses for the fiscal year ended June 30, 2010 reflect compensation expense of $0.7 million and $30.1 million, respectively, related to the repurchase of shares from eligible stockholders in connection with our sale and issuance of Series D preferred stock. Operating expenses for the fiscal year ended June 30, 2009 reflect compensation expense of $3.8 million related to the stock settlement of an outstanding promissory note in connection with our sale and issuance of Series C preferred stock.
|
|
(4)
|
Please refer to Note 14 to our consolidated financial statements for an explanation of the method used to calculate the historical net income (loss) and net income (loss) per share attributable to common stockholders and the number of shares used in the computation of the per share amounts.
|
|
|
As of December 31,
|
As of June 30,
|
|||||||||||||||||||||
|
|
2012
|
2011
|
2011
|
2010
|
2009
|
2008
|
|||||||||||||||||
|
|
(in thousands)
|
||||||||||||||||||||||
|
Consolidated Balance Sheet Data:
|
|||||||||||||||||||||||
|
Cash and cash equivalents
|
$
|
118,989
|
|
$
|
68,088
|
|
$
|
59,853
|
|
$
|
29,402
|
|
$
|
7,788
|
|
$
|
4,772
|
|
|||||
|
Working capital, excluding deferred revenue
|
364,426
|
|
95,033
|
|
75,801
|
|
33,080
|
|
10,090
|
|
5,401
|
|
|||||||||||
|
Total assets
|
478,114
|
|
156,323
|
|
108,746
|
|
51,369
|
|
15,327
|
|
7,725
|
|
|||||||||||
|
Deferred revenue, current and non-current portion
|
170,361
|
|
104,636
|
|
74,646
|
|
40,731
|
|
16,778
|
|
9,867
|
|
|||||||||||
|
Convertible preferred stock
|
—
|
|
68,172
|
|
67,860
|
|
67,227
|
|
15,342
|
|
8,810
|
|
|||||||||||
|
Total stockholders’ equity (deficit)
|
243,405
|
|
(57,426
|
)
|
(58,381
|
)
|
(71,262
|
)
|
(21,690
|
)
|
(13,112
|
)
|
|||||||||||
25
You should read the following discussion and analysis of our financial condition and results of operations together with our consolidated financial statements and the related notes appearing at the end of this filing. Some of the information contained in this discussion and analysis or set forth elsewhere in this filing, including information with respect to our plans and strategy for our business, includes forward-looking statements that involve risks and uncertainties. You should read the “Risk Factors” section of this filing for a discussion of important factors that could cause actual results and the timing of certain events to differ materially from future results expressed or implied by the forward-looking statements contained in the following discussion and analysis.
Overview
ServiceNow is a leading provider of cloud-based services to automate enterprise IT operations. We focus on transforming enterprise IT by automating and standardizing business processes and consolidating IT across the global enterprise. Organizations deploy our service to create a single system of record for enterprise IT, lower operational costs and enhance efficiency. Additionally, our customers use our extensible platform to build custom applications for automating activities unique to their business requirements.
We offer our service under a SaaS business model. Our subscription fee includes access to our suite of on-demand applications, access to our platform to build custom applications, and our technical support and management of our cloud-based infrastructure. We provide a scaled pricing model based on the duration of the subscription term and we frequently extend discounts to our customers based on the number of users. We generally bill our customers annually in advance. We generate sales through our direct sales team and indirectly through channel partners and third-party referrals. We also generate revenues from professional services for implementation and training of customer personnel.
Many customers initially subscribe to our service to solve a specific and immediate problem. Once their problem is solved, many of our customers deploy additional applications as they become more familiar with our service and apply it to new IT processes. In addition, some customers adopt our platform to build applications that automate various processes for business uses outside of IT such as human resources, facilities and quality control management. A majority of our revenues come from large global enterprise customers. Our total customers grew
55%
to
1,512
as of
December 31, 2012
from
974
as of
December 31,
2011
.
We were founded in 2004 and entered into our first commercial contract in 2005. To date, we have funded our business primarily with cash flows from operations. We raised net proceeds of $173.3 million in our June 2012 initial public offering after deducting underwriting discounts and commissions and before deducting expenses in connection with the offering of $3.5 million. In November 2012, we raised an additional $51.0 million after deducting underwriting discounts and commissions and before deducting expenses in connection with the offering of $1.2 million. We continue to invest in the development of our service, infrastructure and sales and marketing to drive long-term growth. We increased our overall employee headcount to
1,077
as of
December 31, 2012
from
603
as of
December 31, 2011
.
Fiscal Year End
On February 3, 2012, our board of directors approved a change to our fiscal year-end from June 30 to December 31. Included in this filing is the transition period for the six months ended December 31, 2011. References to “fiscal 2011” and “fiscal 2010” still refer to the fiscal years ended June 30, 2011 and 2010, respectively.
Key Factors Affecting Our Performance
Total customers
. We believe total customers is a key indicator of our market penetration, growth and future revenues. We have aggressively invested in and intend to continue to invest in our direct sales force, as well as the pursuit of additional partnerships within our indirect sales channel. We generally define a customer as an entity with an active service contract as of the measurement date. In situations where there is a single contract that applies to entities with multiple subsidiaries or divisions, universities, or governmental organizations, each entity that has contracted for a separate production instance of our service is counted as a separate customer. Our total customers were
1,512
and
974
as of
December 31, 2012
and
December 31, 2011
, respectively.
Investment in growth
. We have aggressively invested, and intend to continue to invest, in expanding our operations, increasing our headcount and developing technology to support our growth. We expect our total operating expenses to increase in the foreseeable future, particularly as we continue to expand our sales and marketing organizations, further invest in research and development and grow our cloud-based infrastructure to support our growth. We continue to invest in our sales and marketing organization to drive additional revenues and support the growth of our customer base. Any investments we make in our sales and marketing organization and our capacity to deliver our services will occur in advance of experiencing any benefits from such investments, so it may be difficult for us to determine if we are efficiently allocating our resources in these areas.
26
Renewal rate
. We calculate our renewal rate by subtracting our attrition rate from 100%. Our attrition rate for a period is equal to the annual contract value from customers that are due for renewal in the period and did not renew, divided by the total annual contract value from all customers due for renewal during the period. Annual contract value is equal to the first twelve months of expected subscription revenues under a contract. We believe our renewal rate is an important metric to measure the long-term value of customer agreements and our ability to retain our customers. Our renewal rate was
97%
for each of the
years ended
December 31, 2012
and
2011
, 97% and 99% for the six months ended December 31, 2011 and 2010, respectively, and 97% and 95% for fiscal 2011 and 2010, respectively.
Upsells
. In order for us to continue to grow our business, it is important to generate additional revenue from existing customers. We believe there is significant opportunity to increase the number of subscriptions sold to current customers as customers become more familiar with our platform, adopt our applications to address additional business use cases and expand the use of the platform throughout their enterprise. Our increase in subscriptions is driven by the increased number of users accessing our suite of on-demand applications, as well as our other enabling technologies, Discovery and Orchestration, that are separately priced on a per server basis. We believe our ability to upsell is a key factor affecting our ability to further penetrate our existing customer base. We monitor upsells by measuring the annual contract value of upsells signed in the period as a percentage of our total annual contract value of all contracts signed in the period. Upsells as a percentage of total annual contract value signed was
30%
and
29%
for the
year ended
December 31, 2012
and
2011
, respectively,
28%
and
25%
for the
six months ended
December 31, 2011
and
2010
, and
27%
and
25%
for
fiscal 2011
and
2010
, respectively.
Investment in infrastructure
. We have made and will continue to make investments in new equipment to support growth and enhancements at our data centers and expand our office facilities around the world. During the fourth quarter of 2012, we completed our transition from a managed service hosting model to a co-location model and invested in enhancements to our cloud architecture in our co-location data centers. We recorded additional expense during the year ended December 31, 2012 related to the transition from our managed service data centers to our co-location infrastructure investments. During 2013, we will continue to invest in enhancements to our cloud architecture, which are designed to provide our customers with enhanced scalability, data reliability and availability, including the purchase of additional networking infrastructure. We are also evaluating the expansion of our data center locations to address additional geographic markets, which will result in additional investments to our infrastructure if pursued. In addition, we will continue to enter into new office facility leases in the future to accommodate our projected headcount growth at various locations around the world. These new leases may require investments in leasehold improvements, as well as furniture and equipment to support our employees. If we add to our headcount at a faster rate than anticipated, we may incur substantial costs in terminating leases to enter into new leases for larger space.
Professional services model
. We believe our investment in professional services facilitates the adoption of our subscription service. Prior to 2012, our pricing for professional services was predominantly on a fixed-fee basis and the cost of the time and materials incurred to complete these services was often greater than the amount charged to the customer. Beginning in December 2011, we began shifting our pricing model to a time-and-materials basis and increased our focus on scoping projects and managing resource utilization. As a result of these changes, our gross profit percentage from professional services improved to
(4)%
for the
year ended
December 31, 2012
compared to
(30)%
for the
year ended
December 31, 2011
, and
(51)%
and
(43)%
in the
six months ended
December 31, 2011
and
2010
, and
(21)%
and
(202)%
in
fiscal 2011
and
2010
, respectively. The improvement in gross profit percentages was also due in part to the adoption of the new revenue recognition accounting guidance commencing on July 1, 2010.
Platform adoption
. Our service includes access to our suite of applications, as well as access to our platform to create customer-built extensions to our suite of applications. Customers may also purchase the use of the platform to develop custom applications. Though in the near term we expect our revenue growth to be primarily driven by the pace of adoption and penetration of our suite of applications, we are investing resources to enhance the development capabilities of our platform. We believe the extensibility and simplicity of our platform is resulting in an increased use of our platform by our customers to create extensions of our applications or custom applications, and will enhance our ability to acquire new customers, increase upsells and sustain high renewal rates.
Components of Results of Operations
Revenues
Subscription revenues
. Subscription revenues are primarily comprised of fees which give customers access to our suite of on-demand applications, as well as access to our platform to build custom applications. Pricing includes multiple instances, hosting and support services, data backup and disaster recovery services, as well as future upgrades offered during the subscription period. In addition, we offer two separately priced enabling technologies, Discovery and Orchestration. We typically invoice our customers for subscription fees in annual increments upon initiation of the initial contract or subsequent renewal. Our average initial contract
27
term was approximately
32
months for
2012
. Our contracts are generally non-cancelable, though customers can terminate for breach if we materially fail to perform.
We generate sales directly through our sales team and, to a lesser extent, through our channel partners. Sales to our channel partners are made at a discount and revenues are recorded at the discounted price when all revenue recognition criteria are met. In addition, in some cases, we pay referral fees to third parties typically ranging from
10%
to
20%
of the first year’s annual contract value. These fees are included in sales and marketing expense.
Professional services and other revenues
. Professional services revenues consist of fees associated with the implementation and configuration of our subscription service. Other revenues include customer training and attendance and sponsorship fees for our annual user conference, Knowledge. Prior to 2012, our pricing for professional services was predominantly on a fixed-fee basis. Beginning in December 2011, we began shifting our pricing model to a time-and-materials basis. Going forward, we anticipate the majority of our new business will be priced on a time-and-materials basis. Historically, most of our professional services engagements spanned six to eight months. During
2012
, our professional services engagements spanned approximately
four
to
six
months. Historically, we billed for our fixed price professional services in two installments, with the first installment due up front and the second installment due at either a specified future date (usually approximately three months from the contract start date) or upon completion of the services. In December 2011, we changed these billing practices to bill for our fixed price professional services in installments based on milestones related to the completion of specified projects or specified dates. Our time-and-materials professional services are generally billed monthly in arrears based on actual hours and expenses incurred. Typical payment terms provide our customers pay us within 30 days of invoice.
Prior to fiscal 2011, we recorded revenues from our professional services over a period commensurate with our subscription service contracts. However, the cost associated with our professional services engagements was recorded as the services were delivered, resulting in lower gross profit percentages in fiscal 2010 and 2009. On July 1, 2010, we adopted new revenue recognition accounting guidance on a prospective basis that enabled us to separately allocate value for our multiple element arrangements between our subscription revenues and professional services revenues, based on the best estimate of selling price. As a result, professional services revenues are recognized as the services are delivered, which is substantially the same period as the associated costs are incurred. This shift resulted in an increase to professional services and other revenues of $5.5 million for fiscal 2011. Refer to “Critical Accounting Policies and Significant Judgments and Estimates” below for further discussion of our revenue recognition accounting policy.
Backlog
. Backlog represents future amounts to be invoiced under our agreements and is not included in deferred revenue. As of
December 31, 2012
and
2011
, we had backlog of approximately
$379 million
and
$210 million
, respectively. We expect backlog will change from period to period for several reasons, including the timing and duration of customer subscription and professional services agreements, varying billing cycles of subscription agreements, and the timing of customer renewals.
Overhead Allocation
Overhead associated with benefits, facilities, IT costs and noncloud-based infrastructure related depreciation is allocated to cost of revenues and operating expenses based on headcount. Depreciation related to our cloud-based infrastructure are classified as cost of subscription revenues.
Cost of Revenues
Subscription cost of revenues
. Cost of subscription revenues primarily consists of expenses related to hosting our service and providing support to our customers. These expenses are comprised of data center capacity costs; personnel and related costs directly associated with our cloud infrastructure and customer support, including salaries, benefits, bonuses and stock-based compensation; and allocated overhead.
Professional services and other cost of revenues
. Cost of professional services and other revenues consists primarily of personnel and related costs directly associated with our professional services and training departments, including salaries, benefits, bonuses and stock-based compensation; the costs of contracted third-party vendors; and allocated overhead.
Professional services associated with the implementation and configuration of our subscription services are performed directly by our services team, as well as by contracted third-party vendors. Fees paid up-front to our third-party vendors are deferred and amortized to cost of revenues as the professional services are delivered. Fees owed to our third-party vendors are accrued over the same requisite service period. Internal payroll costs are similarly recognized as professional services are delivered. Cost of revenues associated with our professional services engagements contracted with third-party vendors as a percentage of professional services and other revenues was
26%
and
55%
in the
year ended
December 31, 2012
and
2011
, respectively,
64%
and
70%
in the
six months ended
December 31, 2011
and
2010
, and
54%
and
135%
in
fiscal 2011
and
2010
, respectively.
28
Sales and Marketing Expenses
Sales and marketing expenses consist primarily of personnel and related expenses directly associated with our sales and marketing staff, including salaries, benefits, bonuses, commissions and stock-based compensation. Other costs included in this expense are third-party referral fees, marketing and promotional events, including our Knowledge conference, online marketing, product marketing and allocated overhead.
Research and Development Expenses
Research and development expenses consist primarily of personnel and related expenses directly associated with our research and development staff, including salaries, benefits, bonuses and stock-based compensation, and allocated overhead.
General and Administrative Expenses
General and administrative expenses primarily consist of personnel and related expenses for our executive, finance, legal, human resources and administrative personnel, including salaries, benefits, bonuses and stock-based compensation; legal, accounting and other professional services fees; other corporate expenses; and allocated overhead.
Provision for Income Taxes
Provision for income taxes consists of federal, state and foreign income taxes. Due to recent losses, we maintain a valuation allowance against our deferred tax assets as of
December 31, 2012
. We consider all available evidence, both positive and negative, in assessing the extent to which a valuation allowance should be applied against our deferred tax assets.
29
Results of Operations
To enhance comparability, the following table sets forth our results of operations for the periods presented. The period-to-period comparison of financial results is not necessarily indicative of future results.
|
|
Year Ended December 31,
|
Six Months Ended
December 31,
|
Fiscal Year Ended June 30,
|
||||||||||||||||||||
|
|
2012
|
2011
|
2011
|
2010
|
2011
|
2010
|
|||||||||||||||||
|
|
(in thousands)
|
||||||||||||||||||||||
|
Revenues
(1)
:
|
|
|
|
|
|
|
|
|
|
|
|
||||||||||||
|
Subscription
|
$
|
204,526
|
|
|
$
|
110,886
|
|
|
$
|
64,886
|
|
|
$
|
33,191
|
|
|
$
|
79,191
|
|
|
$
|
40,078
|
|
|
Professional services and other
|
39,186
|
|
|
17,186
|
|
|
8,489
|
|
|
4,753
|
|
|
13,450
|
|
|
3,251
|
|
||||||
|
Total revenues
|
243,712
|
|
|
128,072
|
|
|
73,375
|
|
|
37,944
|
|
|
92,641
|
|
|
43,329
|
|
||||||
|
Cost of revenues
(2)(3)
:
|
|
|
|
|
|
|
|
|
|
|
|
||||||||||||
|
Subscription
|
63,258
|
|
|
24,288
|
|
|
15,073
|
|
|
6,096
|
|
|
15,311
|
|
|
6,378
|
|
||||||
|
Professional services and other
|
40,751
|
|
|
22,336
|
|
|
12,850
|
|
|
6,778
|
|
|
16,264
|
|
|
9,812
|
|
||||||
|
Total cost of revenues
|
104,009
|
|
|
46,624
|
|
|
27,923
|
|
|
12,874
|
|
|
31,575
|
|
|
16,190
|
|
||||||
|
Gross profit
|
139,703
|
|
|
81,448
|
|
|
45,452
|
|
|
25,070
|
|
|
61,066
|
|
|
27,139
|
|
||||||
|
Operating expenses
(2)(3)
:
|
|
|
|
|
|
|
|
|
|
|
|
||||||||||||
|
Sales and marketing
|
103,837
|
|
|
52,896
|
|
|
32,501
|
|
|
13,728
|
|
|
34,123
|
|
|
19,334
|
|
||||||
|
Research and development
|
39,333
|
|
|
11,276
|
|
|
7,030
|
|
|
2,758
|
|
|
7,004
|
|
|
7,194
|
|
||||||
|
General and administrative
|
34,117
|
|
|
16,046
|
|
|
10,084
|
|
|
3,417
|
|
|
9,379
|
|
|
28,810
|
|
||||||
|
Total operating expenses
|
177,287
|
|
|
80,218
|
|
|
49,615
|
|
|
19,903
|
|
|
50,506
|
|
|
55,338
|
|
||||||
|
Income (loss) from operations
|
(37,584
|
)
|
|
1,230
|
|
|
(4,163
|
)
|
|
5,167
|
|
|
10,560
|
|
|
(28,199
|
)
|
||||||
|
Interest and other income (expense), net
|
1,604
|
|
|
(1,129
|
)
|
|
(1,446
|
)
|
|
289
|
|
|
606
|
|
|
(1,226
|
)
|
||||||
|
Income (loss) before provision for income taxes
|
(35,980
|
)
|
|
101
|
|
|
(5,609
|
)
|
|
5,456
|
|
|
11,166
|
|
|
(29,425
|
)
|
||||||
|
Provision for income taxes
|
1,368
|
|
|
1,758
|
|
|
1,075
|
|
|
653
|
|
|
1,336
|
|
|
280
|
|
||||||
|
Net income (loss)
|
$
|
(37,348
|
)
|
|
$
|
(1,657
|
)
|
|
$
|
(6,684
|
)
|
|
$
|
4,803
|
|
|
$
|
9,830
|
|
|
$
|
(29,705
|
)
|
|
(1)
|
Revenues for the
year ended
December 31, 2012
and
2011
, the
six months ended
December 31, 2011
and
2010
and the fiscal
year ended
June 30, 2011
reflect the prospective adoption of new revenue accounting guidance commencing on July 1, 2010. As a result of this guidance, we separately allocate value for multiple element contracts between our subscription revenues and professional services revenues based on the best estimate of selling price. Additionally, we recognize professional services revenues as the services are delivered. Please refer to Note 2 to our consolidated financial statements for further discussion of our revenue recognition policies.
|
|
(2)
|
Stock-based compensation included in the statements of operations data above was as follows:
|
|
|
Year Ended December 31,
|
Six Months Ended
December 31,
|
Fiscal Year Ended June 30,
|
||||||||||||||||||||
|
|
2012
|
2011
|
2011
|
2010
|
2011
|
2010
|
|||||||||||||||||
|
|
(in thousands)
|
||||||||||||||||||||||
|
Cost of revenues:
|
|||||||||||||||||||||||
|
Subscription
|
$
|
3,929
|
|
$
|
997
|
|
$
|
674
|
|
$
|
225
|
|
$
|
548
|
|
$
|
48
|
|
|||||
|
Professional services and other
|
1,574
|
|
273
|
|
193
|
|
37
|
|
117
|
|
28
|
|
|||||||||||
|
Sales and marketing
|
10,189
|
|
2,583
|
|
2,010
|
|
431
|
|
1,004
|
|
277
|
|
|||||||||||
|
Research and development
|
6,496
|
|
965
|
|
704
|
|
207
|
|
468
|
|
90
|
|
|||||||||||
|
General and administrative
|
5,749
|
|
2,652
|
|
2,056
|
|
221
|
|
817
|
|
102
|
|
|||||||||||
|
(3)
|
Cost of revenues and operating expenses for the fiscal
year ended
June 30, 2010
reflect compensation expense of $0.7 million and $30.1 million, respectively, related to the repurchase of shares from eligible stockholders in connection with our sale and issuance of Series D preferred stock.
|
30
|
|
Year Ended December 31,
|
Six Months Ended
December 31,
|
Fiscal Year Ended June 30,
|
||||||||||||||
|
|
2012
|
2011
|
2011
|
2010
|
2011
|
2010
|
|||||||||||
|
Revenues:
|
|||||||||||||||||
|
Subscription
|
84
|
%
|
87
|
%
|
88
|
%
|
87
|
%
|
85
|
%
|
92
|
%
|
|||||
|
Professional services and other
|
16
|
|
13
|
|
12
|
|
13
|
|
15
|
|
8
|
|
|||||
|
Total revenues
|
100
|
|
100
|
|
100
|
|
100
|
|
100
|
|
100
|
|
|||||
|
Cost of revenues:
|
|
|
|
|
|
|
|||||||||||
|
Subscription
|
26
|
|
19
|
|
20
|
|
16
|
|
16
|
|
15
|
|
|||||
|
Professional services and other
|
17
|
|
17
|
|
18
|
|
18
|
|
18
|
|
22
|
|
|||||
|
Total cost of revenues
|
43
|
|
36
|
|
38
|
|
34
|
|
34
|
|
37
|
|
|||||
|
Gross profit
|
57
|
|
64
|
|
62
|
|
66
|
|
66
|
|
63
|
|
|||||
|
Operating expenses:
|
|
|
|
|
|
|
|||||||||||
|
Sales and marketing
|
42
|
|
41
|
|
44
|
|
36
|
|
37
|
|
45
|
|
|||||
|
Research and development
|
16
|
|
9
|
|
10
|
|
7
|
|
8
|
|
17
|
|
|||||
|
General and administrative
|
14
|
|
13
|
|
14
|
|
9
|
|
10
|
|
66
|
|
|||||
|
Total operating expenses
|
72
|
|
63
|
|
68
|
|
52
|
|
55
|
|
128
|
|
|||||
|
Income (loss) from operations
|
(15
|
)
|
1
|
|
(6
|
)
|
14
|
|
11
|
|
(65
|
)
|
|||||
|
Interest and other income (expense), net
|
1
|
|
(1
|
)
|
(2
|
)
|
1
|
|
1
|
|
(3
|
)
|
|||||
|
Income (loss) before provision for income taxes
|
(14
|
)
|
—
|
|
(8
|
)
|
15
|
|
12
|
|
(68
|
)
|
|||||
|
Provision for income taxes
|
1
|
|
1
|
|
1
|
|
2
|
|
1
|
|
1
|
|
|||||
|
Net income (loss)
|
(15
|
)%
|
(1
|
)%
|
(9
|
)%
|
13
|
%
|
11
|
%
|
(69
|
)%
|
|||||
|
|
Year Ended December 31,
|
Six Months Ended
December 31,
|
Fiscal Year Ended June 30,
|
||||||||||||||||||||
|
|
2012
|
2011
|
2011
|
2010
|
2011
|
2010
|
|||||||||||||||||
|
|
(in thousands)
|
||||||||||||||||||||||
|
Revenues by geography
|
|||||||||||||||||||||||
|
North America
|
$
|
173,001
|
|
$
|
93,315
|
|
$
|
51,901
|
|
$
|
27,919
|
|
$
|
69,333
|
|
$
|
31,396
|
|
|||||
|
Europe
|
60,579
|
|
30,242
|
|
18,842
|
|
8,693
|
|
20,093
|
|
10,708
|
|
|||||||||||
|
Asia Pacific and other
|
10,132
|
|
4,515
|
|
2,632
|
|
1,332
|
|
3,215
|
|
1,225
|
|
|||||||||||
|
Total revenues
|
$
|
243,712
|
|
$
|
128,072
|
|
$
|
73,375
|
|
$
|
37,944
|
|
$
|
92,641
|
|
$
|
43,329
|
|
|||||
|
|
Year Ended December 31,
|
Six Months Ended
December 31,
|
Fiscal Year Ended June 30,
|
||||||||||||||
|
|
2012
|
2011
|
2011
|
2010
|
2011
|
2012
|
|||||||||||
|
Revenues by geography
|
|||||||||||||||||
|
North America
|
71
|
%
|
73
|
%
|
71
|
%
|
74
|
%
|
75
|
%
|
72
|
%
|
|||||
|
Europe
|
25
|
|
24
|
|
26
|
|
23
|
|
22
|
|
25
|
|
|||||
|
Asia Pacific and other
|
4
|
|
3
|
|
3
|
|
3
|
|
3
|
|
3
|
|
|||||
|
Total revenues
|
100
|
%
|
100
|
%
|
100
|
%
|
100
|
%
|
100
|
%
|
100
|
%
|
|||||
31
Comparison of the years ended
December 31, 2012
and
2011
Revenues
|
|
Year Ended December 31,
|
% Change
|
||||||||
|
|
2012
|
2011
|
||||||||
|
|
(dollars in thousands)
|
|
||||||||
|
Revenues:
|
||||||||||
|
Subscription
|
$
|
204,526
|
|
$
|
110,886
|
|
84
|
%
|
||
|
Professional services and other
|
39,186
|
|
17,186
|
|
128
|
%
|
||||
|
Total revenues
|
$
|
243,712
|
|
$
|
128,072
|
|
90
|
%
|
||
|
Percentage of revenues:
|
||||||||||
|
Subscription
|
84
|
%
|
87
|
%
|
||||||
|
Professional services and other
|
16
|
|
13
|
|
||||||
|
Total
|
100
|
%
|
100
|
%
|
||||||
Revenues increased
$115.6 million
, primarily due to the increase in subscription revenues of
$93.6 million
. Of the total increase in subscription revenues,
34%
represented revenues from new customers acquired after
December 31, 2011
, and
66%
represented revenues from existing customers at or prior to
December 31, 2011
. Our total customers increased
55%
to
1,512
at
December 31, 2012
from
974
at
December 31, 2011
. The average total revenues per customer, calculated based on revenue during the trailing four quarters divided by the average number of customers during the trailing four quarters, increased to approximately
$190,000
from approximately
$157,000
over this period primarily due to an increase in the number of subscriptions sold to existing customers and an increase in average new customer deal size.
Of the
$93.6 million
total increase in subscription revenues for the
year ended
December 31, 2012
,
86%
represented sales to customers by our direct sales organization and
14%
represented revenues from channel partners. Subscription revenues in North America represented
68%
of the
$93.6 million
total increase in subscription revenues and
32%
represented subscription revenues outside North America. During the
year ended
December 31, 2012
, we continued to increase our focus on international markets through the addition of new channel partners, the expansion of our direct sales organization and the opening of additional sales and marketing offices in Sweden and Israel.
The increase in professional services and other revenues of
$22.0 million
was primarily due to an increase in the services provided to our growing customer base in addition to a shift in our pricing model to a time-and-materials basis. We had an increase in revenues of
$3.4 million
associated with acceptances received in 2012 and an increase of
$0.9 million
associated with our Knowledge conference, held in May 2012. Revenues in North America represented
71%
of the
$22.0 million
total increase in professional services and other revenues. Revenues outside North America represented the remaining
29%
.
32
Cost of Revenues and Gross Profit Percentage
|
|
Year Ended December 31,
|
% Change
|
||||||||
|
|
2012
|
2011
|
||||||||
|
|
(dollars in thousands)
|
|
||||||||
|
Cost of revenues:
|
||||||||||
|
Subscription
|
$
|
63,258
|
|
$
|
24,288
|
|
160
|
%
|
||
|
Professional services and other
|
40,751
|
|
22,336
|
|
82
|
%
|
||||
|
Total cost of revenues
|
$
|
104,009
|
|
$
|
46,624
|
|
123
|
%
|
||
|
Gross profit percentage:
|
||||||||||
|
Subscription
|
69
|
%
|
78
|
%
|
||||||
|
Professional services and other
|
(4
|
)%
|
(30
|
)%
|
||||||
|
Total gross profit percentage
|
57
|
%
|
64
|
%
|
||||||
|
Gross profit
|
$
|
139,703
|
|
$
|
81,448
|
|
72
|
%
|
||
|
Headcount (at period end)
|
||||||||||
|
Subscription
|
218
|
|
119
|
|
83
|
%
|
||||
|
Professional services and other
|
183
|
|
98
|
|
87
|
%
|
||||
|
Total headcount
|
401
|
|
217
|
|
85
|
%
|
||||
Cost of subscription revenues increased
$39.0 million
during the
year ended
December 31, 2012
compared to the prior year, primarily due to increases in personnel-related and overhead expenses and expenses related to our data centers. Personnel-related expenses increased
$18.6 million
, consisting primarily of increased employee compensation, benefits and travel expenses of
$15.5 million
and additional stock-based compensation of
$2.9 million
. Overhead expenses increased
$1.7 million
. Growth in personnel-related and overhead expenses was driven by headcount growth and investments in our cloud infrastructure and support organizations. We expect personnel-related and overhead expenses to continue to increase as we continue to hire employees in our cloud infrastructure and support organizations in order to stay ahead of our growing customer demands.
Hosting expenses related to our network infrastructure increased
$6.9 million
as we increased data center capacity to migrate customers from our managed service data centers to our co-location data centers and to support our customer growth. We also opened
six
new data centers since
December 31, 2011
. In the fourth quarter of 2012, we completed the transition of all our managed services data centers to our co-location data centers. Depreciation expense related to our equipment in our data centers increased
$8.3 million
, of which
$6.6 million
is due to purchases of network infrastructure to support our new data centers and growth within our existing data centers and
$1.7 million
is due to the accelerated depreciation of the assets located in our managed services data centers. Depreciation expense related to our managed services data centers for the
year ended
December 31, 2012
was
$3.1 million
. Additionally, outside services primarily related to enhancements to our data center security and the migration of our customers increased
$2.0 million
for the
year ended
December 31, 2012. We expect data center costs to continue to increase as we continue to grow our data center footprint and purchase new equipment to support our new customers.
In
2013
, we anticipate a substantial portion of our capital expenditures on data center capacity will be on new equipment within existing data centers to accommodate growth, which generally requires less capital expenditure than provisioning the equivalent capacity in a new data center. We may also add an additional data center during
2013
to service our growth in customers.
Our subscription gross profit percentage decreased from
78%
during the
year ended
December 31, 2011
to
69%
for the
year ended
December 31, 2012
. We anticipate cost of subscription revenues to increase as we increase capacity and invest in ongoing infrastructure improvements in our existing co-location data centers, which will partially offset the savings related to the exit of our managed service data centers during 2012. Cost of subscription revenues will also increase if we add new data centers. However, we anticipate cost of subscription revenues will grow at rates slower than our anticipated subscription revenue growth such that our gross profit percentage should improve during 2013.
Cost of professional services and other revenues increased
$18.4 million
during the
year ended
December 31, 2012
as compared to the prior year. The overall increase was primarily attributable to increased personnel-related expenses of
$15.5 million
, consisting primarily of increased employee compensation, benefits and travel expenses of
$13.8 million
and additional stock-based compensation of
$1.3 million
, driven by headcount growth and an increase in our stock price. Overhead expenses increased
$1.1 million
also due to headcount growth. In addition, outside services expenses increased
$1.8 million
primarily due to an increase in implementation services as a result of our increased sales volume.
33
Our professional services and other gross profit (loss) percentage improved from
(30)%
during the
year ended
December 31, 2011
to
(4)%
during the
year ended
December 31, 2012
. The improved gross profit percentage was primarily attributable to a shift in our pricing model to a time-and-materials basis and an increased focus on scoping projects and managing resource utilization. Additionally, during the
year ended
December 31, 2012
, the amount of work we sub-contracted to our partners decreased as a percentage of total professional services and other revenues compared to the prior year. Professional services and other revenues include
$2.0 million
and
$1.1 million
for our Knowledge conference, for the
years ended
December 31,
2012
and
2011
, respectively. Revenues from our Knowledge conference contributed
6
percentage points and
9
percentage points to the professional services and other gross profit percentage for the
years ended
December 31,
2012
and
2011
, respectively. Expenses associated with the conference are included in sales and marketing expense. We expect our gross profit percentage from professional services and other to improve as we continue to realize the benefits of the shift in our pricing model to primarily time and materials.
Sales and Marketing
|
|
Year Ended December 31
|
% Change
|
||||||||
|
|
2012
|
2011
|
||||||||
|
|
(dollars in thousands)
|
|
||||||||
|
Sales and marketing
|
$
|
103,837
|
|
$
|
52,896
|
|
96
|
%
|
||
|
Percentage of revenues
|
42
|
%
|
41
|
%
|
||||||
|
Headcount (at period end)
|
350
|
|
242
|
|
45
|
%
|
||||
Sales and marketing expenses increased
$50.9 million
due to the expansion of our sales force and increases in marketing programs to address additional opportunities in new and existing markets. Total headcount in sales and marketing increased
45%
from
December 31, 2011
to
December 31, 2012
, contributing to a
$34.1 million
increase in personnel-related expenses, consisting primarily of increased employee compensation, benefits and travel expenses associated with our marketing team and direct sales force of
$25.5 million
and additional stock-based compensation of
$7.6 million
. The increase is also due to increased overhead expenses of
$2.3 million
due to increased headcount. In addition, we incurred an increase of
$4.8 million
in marketing and event expenses primarily attributable to our Knowledge conference, which experienced a 102% increase in attendance year-over-year. Commissions increased
$9.0 million
in the
year ended
December 31,
2012
as compared to the
year ended
December 31, 2011
, which was directly attributable to increased revenues and changes made to our commission plans. Commissions and referral fees amounted to
8%
and
7%
of subscription revenues in 2012 and 2011, respectively. These fees are deferred and amortized on a straight-line basis over the non-cancelable terms of the related customer contracts.
During 2013, we expect sales and marketing expenses to increase in terms of dollars but remain relatively flat as a percent of total revenues as we continue to expand our direct sales force, increase our marketing activities, grow our international operations, build brand awareness and sponsor additional marketing events. In the second quarter of 2013, we expect to incur expenses of approximately $8.0 million to $9.0 million related to our Knowledge conference in May 2013 compared to $3.6 million incurred for the event in the second quarter of 2012, due to a significant increase in the size of the event.
Research and Development
|
|
Year Ended December 31
|
% Change
|
||||||||
|
|
2012
|
2011
|
||||||||
|
|
(dollars in thousands)
|
|
||||||||
|
Research and development
|
$
|
39,333
|
|
$
|
11,276
|
|
249
|
%
|
||
|
Percentage of revenues
|
16
|
%
|
9
|
%
|
||||||
|
Headcount (at period end)
|
200
|
|
83
|
|
141
|
%
|
||||
Research and development expenses increased
$28.1 million
primarily due to increased personnel-related expenses of
$25.3 million
, consisting primarily of increased employee compensation, benefits and travel expenses associated with our research and development team of
$19.3 million
and additional stock-based compensation of
$5.5 million
. Overhead expenses also increased
$1.5 million
due to headcount growth. Total headcount in research and development increased
141%
from
December 31, 2011
to
December 31, 2012
as we upgraded and extended our service offerings and developed new technologies.
34
During 2013, we expect research and development expenses to increase in terms of dollar and as a percent of revenue as we continue to improve the existing functionality of our service, develop new applications to fill market needs and continue to enhance our core platform.
General and Administrative
|
|
Year Ended December 31
|
% Change
|
||||||||
|
|
2012
|
2011
|
||||||||
|
|
(dollars in thousands)
|
|
||||||||
|
General and administrative
|
$
|
34,117
|
|
$
|
16,046
|
|
113
|
%
|
||
|
Percentage of revenues
|
16
|
%
|
9
|
%
|
||||||
|
Headcount (at period end)
|
126
|
|
61
|
|
107
|
%
|
||||
General and administrative expenses increased
$18.1 million
primarily due to increased headcount, expenses associated with being a public company and our international expansion. Personnel-related expenses increased
$10.6 million
, consisting primarily of increased employee compensation, benefits and travel expenses of
$7.4 million
and additional stock-based compensation of
$3.1 million
, as we added employees to support the growth of our business. Professional and outside service expenses increased
$2.7 million
, comprised primarily of accounting fees related to our external audit and tax consulting fees associated with our international expansion. Expenses from third-party software and service license agreements increased
$1.5 million
due to the implementation of additional systems to support the growth of our business. In August 2012, we relocated our San Diego, California office to another facility in the same city. As part of this move, we incurred
$2.5 million
in lease abandonment costs, which included a loss on disposal of our leasehold improvements and furniture and fixtures and a cease-use loss.
During 2013, we expect general and administrative expenses to increase in terms of dollars but decrease as a percent of revenue as we continue to grow and incur expenses related to being a public company. These expenses include higher legal, corporate insurance and accounting expenses, and the additional expenses of achieving and maintaining compliance with Section 404 of the Sarbanes-Oxley Act and related regulations. We also anticipate to incur exits costs related to the relocation of our San Jose facility of less than $1.0 million and may incur other lease abandonment costs in the future if our existing leases cannot accommodate our future headcount growth.
Interest and Other Income, net
|
|
Year Ended December 31
|
% Change
|
|||||||
|
|
2012
|
2011
|
|||||||
|
|
(dollars in thousands)
|
|
|||||||
|
Interest and other income, net
|
$
|
1,604
|
|
$
|
(1,129
|
)
|
NM
|
||
|
Percentage of revenues
|
1
|
%
|
(1
|
)%
|
|||||
Interest and other income, net, primarily consists of foreign currency transaction gains and losses. The increase is due to the strengthening of the U.S. dollar compared to the prior year and an increase in interest income of $0.3 million related to our investments in marketable securities.
While we have not engaged in the hedging of our foreign currency transactions to date, we are presently evaluating the costs and benefits of initiating such a program and may hedge selected significant transactions denominated in currencies other than the U.S. dollar in the future.
Provision for Income Taxes
|
|
Year Ended December 31
|
% Change
|
||||||||
|
|
2012
|
2011
|
||||||||
|
|
(dollars in thousands)
|
|
||||||||
|
Income before income taxes
|
$
|
(35,980
|
)
|
$
|
101
|
|
NM
|
|
||
|
Provision for income taxes
|
1,368
|
|
1,758
|
|
(22
|
)%
|
||||
|
Effective tax rate
|
(4
|
)%
|
1,741
|
%
|
||||||
35
The provision for income taxes decreased
$0.4 million
, primarily as a result of our operating loss, a lower proportion of earnings in taxable jurisdictions, and benefit from California research and development credits in the
year ended
December 31,
2012
compared to the prior year. See Note 15 to our consolidated financial statements for our reconciliation of income taxes at the statutory federal rate to the provision for income taxes.
We continue to maintain a full valuation allowance on our federal and state deferred tax assets, and the significant components of the tax expense recorded are current cash taxes in various jurisdictions. The cash tax expenses are impacted by each jurisdiction’s individual tax rates, laws on timing of recognition of income and deductions and availability of net operating losses and tax credits. In December 2011, we reorganized our international operations and established our non-U.S. headquarters in the Netherlands, which has an effective tax rate that is lower than the U.S. federal statutory rate. Given the full valuation allowance, sensitivity of current cash taxes to local rules and our foreign restructuring, we expect our effective tax rate could fluctuate significantly on a quarterly basis and could be adversely affected to the extent earnings are lower than anticipated in countries that have lower statutory rates and higher than anticipated in countries that have higher statutory rates. The earnings of our foreign subsidiaries are considered to be permanently reinvested outside of the United States.
Comparison of the
six months ended
December 31, 2011
and
2010
Revenues
|
|
Six Months Ended December 31,
|
% Change
|
||||||||
|
|
2011
|
2010
|
||||||||
|
|
(dollars in thousands)
|
|
||||||||
|
Revenues:
|
||||||||||
|
Subscription
|
$
|
64,886
|
|
$
|
33,191
|
|
95
|
%
|
||
|
Professional services and other
|
8,489
|
|
4,753
|
|
79
|
%
|
||||
|
Total revenues
|
$
|
73,375
|
|
$
|
37,944
|
|
93
|
%
|
||
|
Percentage of revenues:
|
||||||||||
|
Subscription
|
88
|
%
|
87
|
%
|
||||||
|
Professional services and other
|
12
|
|
13
|
|
||||||
|
Total
|
100
|
%
|
100
|
%
|
||||||
Revenues increased
$35.4 million
, primarily due to the increase in subscription revenues of $31.7 million. Of the total increase in subscription revenues, 55% represented revenues from new customers acquired after
December 31, 2010
, and 45% represented revenues from existing customers at or prior to
December 31, 2010
. Our total customers increased 62% from
December 31, 2010
to
December 31, 2011
. The average subscription revenues per customer increased 19% over this period primarily due to an increase in the number of subscriptions sold to existing customers.
Of the
$31.7 million
total increase in subscription revenues for the
six months ended
December 31, 2011
, 81% represented sales to customers by our direct sales organization and 19% represented revenues from channel partners. Subscription revenues in North America represented 67% of the $31.7 million total increase in subscription revenues and 33% represented subscription revenues outside North America. The increase in revenues from channel partners was due primarily to increased market adoption of our subscription service through sales by our existing channel partners and to a lesser extent the addition of new channel partners. The increase in subscription revenues outside North America was due primarily to increased adoption of our subscription service through sales by our existing channel partners and direct sales organization, and to a lesser extent the addition of new channel partners and the expansion of our direct sales organization. During the
six months ended
December 31, 2011
, we opened additional sales and marketing offices in Denmark and France, which did not account for a significant portion of increased revenues during the period.
The increase in professional services and other revenues of
$3.7 million
was primarily due to the growth in our customer base. Revenues in North America represented 73% of the $3.7 million total increase in professional services and other revenues. Revenues outside North America represented the remaining 27%.
36
Cost of Revenues and Gross Profit Percentage
|
|
Six Months Ended December 31,
|
% Change
|
||||||||
|
|
2011
|
2010
|
||||||||
|
|
(dollars in thousands)
|
|
||||||||
|
Cost of revenues:
|
||||||||||
|
Subscription
|
$
|
15,073
|
|
$
|
6,096
|
|
147
|
%
|
||
|
Professional services and other
|
12,850
|
|
6,778
|
|
90
|
%
|
||||
|
Total cost of revenues
|
$
|
27,923
|
|
$
|
12,874
|
|
117
|
%
|
||
|
Gross profit percentage:
|
||||||||||
|
Subscription
|
77
|
%
|
82
|
%
|
||||||
|
Professional services and other
|
(51
|
)
|
(43
|
)
|
||||||
|
Total gross profit percentage
|
62
|
%
|
66
|
%
|
||||||
|
Gross profit
|
$
|
45,452
|
|
$
|
25,070
|
|
81
|
%
|
||
|
Headcount (at period end):
|
||||||||||
|
Subscription
|
119
|
|
51
|
|
133
|
%
|
||||
|
Professional services and other
|
98
|
|
50
|
|
96
|
%
|
||||
|
Total headcount
|
217
|
|
101
|
|
115
|
%
|
||||
Cost of subscription revenues increased
$9.0 million
during the
six months ended
December 31, 2011
as compared to the same period in the prior year. The overall increase in cost of subscription revenues was primarily attributed to increased personnel-related expenses of $4.9 million, consisting of increased employee compensation, benefits and travel expenses of $4.5 million and additional stock-based compensation of
$0.4 million
. The increase in personnel-related expenses was driven by headcount growth. In addition, hosting fees for our network infrastructure increased $1.6 million as we increased data center capacity to support our growth. At
December 31, 2011
, we delivered our service from
six
data centers in North America and
seven
data centers internationally, compared to three data centers in North America and five data centers internationally at
December 31, 2010
. Depreciation expense also increased $1.1 million as we started the transition of our network infrastructure from a managed services hosting model to a co-location model.
Our subscription gross profit percentage decreased from
82%
to
77%
during the
six months ended
December 31, 2011
as compared to the same period in the prior year primarily due to these increased expenses.
Cost of professional services and other revenues increased $6.1 million during the
six months ended
December 31, 2011
as compared to the same period in the prior year. The overall increase was primarily attributed to increased personnel-related expenses of $3.7 million, consisting of increased employee compensation, benefits and travel expenses of $3.5 million and additional stock-based compensation of
$0.2 million
driven by headcount growth. In addition, outside services expenses increased $1.9 million primarily due to additional fees paid to third-parties to provide implementation services.
Our professional services and other gross profit percentage decreased from
(43)%
to
(51)%
during the
six months ended
December 31, 2011
as compared to the same period in the prior year primarily due to these increased expenses.
Sales and Marketing
|
|
Six Months Ended December 31,
|
% Change
|
||||||||
|
|
2011
|
2010
|
||||||||
|
|
(dollars in thousands)
|
|
||||||||
|
Sales and marketing
|
$
|
32,501
|
|
$
|
13,728
|
|
137
|
%
|
||
|
Percentage of revenues
|
44
|
%
|
36
|
%
|
||||||
|
Headcount (at period end)
|
242
|
|
90
|
|
169
|
%
|
||||
Sales and marketing expenses increased
$18.8 million
due to the expansion of our sales force and increases in marketing programs to address additional opportunities in new and existing markets. Total headcount in sales and marketing increased,
169%
from
December 31, 2010
to
December 31, 2011
, contributing to a $13.3 million increase in personnel-related expenses, consisting primarily of increased employee compensation, benefits and travel expenses associated with our direct sales force of $11.8 million,
37
and additional stock-based compensation of
$1.6 million
. In addition, we incurred an increase of $3.1 million in commissions, which was directly attributed to increased revenues and changes made to our commission plans in the
six months ended
December 31, 2011
. Marketing and event expenses increased $1.3 million due to our continued efforts to generate sales leads and build brand awareness.
Research and Development
|
|
Six Months Ended December 31,
|
% Change
|
||||||||
|
|
2011
|
2010
|
||||||||
|
|
(dollars in thousands)
|
|
||||||||
|
Research and development
|
$
|
7,030
|
|
$
|
2,758
|
|
155
|
%
|
||
|
Percentage of revenues
|
10
|
%
|
7
|
%
|
||||||
|
Headcount (at period end)
|
83
|
|
34
|
|
144
|
%
|
||||
Research and development expenses increased
$4.3 million
primarily due to increased personnel-related expenses of $4.0 million, consisting of increased employee compensation, benefits and travel expenses associated with our research and development team of $3.5 million and additional stock-based compensation of
$0.5 million
. Total headcount in research and development increased as we upgraded and extended our service offerings and developed new technologies.
General and Administrative
|
|
Six Months Ended December 31,
|
% Change
|
||||||||
|
|
2011
|
2010
|
||||||||
|
|
(dollars in thousands)
|
|
||||||||
|
General and administrative
|
$
|
10,084
|
|
$
|
3,417
|
|
195
|
%
|
||
|
Percentage of revenues
|
14
|
%
|
9
|
%
|
||||||
|
Headcount (at period end)
|
61
|
|
25
|
|
144
|
%
|
||||
General and administrative expenses increased
$6.7 million
primarily due to increased headcount. Personnel-related expenses increased $4.1 million, consisting of increased employee compensation, benefits and travel expenses of $2.3 million and additional stock-based compensation of
$1.8 million
, as we added employees to support the growth of our business. Professional and outside service expenses increased $1.6 million, comprised primarily of legal and accounting fees associated with our international expansion.
Interest and Other Income (Expense), net
|
|
Six Months Ended December 31,
|
% Change
|
|||||||
|
|
2011
|
2010
|
|||||||
|
|
(dollars in thousands)
|
|
|||||||
|
Interest and other income (expense), net
|
$
|
(1,446
|
)
|
$
|
289
|
|
NM
|
||
|
Percentage of revenues
|
(2
|
)%
|
1
|
%
|
|||||
Interest and other income (expense), net primarily consist of foreign currency transaction gains and losses. The decrease of
$1.7 million
is primarily due to unrealized losses on amounts invoiced to customers that are denominated in British Pounds and Euros as the U.S. Dollar strengthened over the
six months ended
December 31, 2011
as compared to the
six months ended
December 31, 2010
.
38
Provision for Income Taxes
|
|
Six Months Ended December 31,
|
% Change
|
||||||||
|
|
2011
|
2010
|
||||||||
|
|
(dollars in thousands)
|
|
||||||||
|
Income before income taxes
|
$
|
(5,609
|
)
|
$
|
5,456
|
|
NM
|
|
||
|
Provision for income taxes
|
1,075
|
|
653
|
|
65
|
%
|
||||
|
Effective tax rate
|
(19
|
)%
|
12
|
%
|
||||||
The provision for income taxes increased
$0.4 million
, primarily as a result of the increase in pre-tax income related to international operations and California taxes for the
six months ended
December 31, 2011
compared to the same period in the prior year. During the
six months ended
December 31, 2011
, we recorded a provision for income taxes principally attributable to foreign taxes, U.S. federal taxes and California taxes.
We maintain a full valuation allowance on our federal and state deferred tax assets, and the significant components of the tax expense recorded are current cash taxes in various jurisdictions. The cash tax expenses are impacted by each jurisdiction’s individual tax rates, laws on timing of recognition of income and deductions and availability of net operating losses and tax credits. In December 2011, we reorganized our international operations and established our non-U.S. headquarters in the Netherlands, which has an effective tax rate that is lower than the U.S. federal statutory rate. Given the full valuation allowance, sensitivity of current cash taxes to local rules and our foreign restructuring, our effective tax rate fluctuates significantly on a quarterly basis and could be adversely affected to the extent earnings are lower than anticipated in countries that have lower statutory rates and higher than anticipated in countries that have higher statutory rates.
Comparison of Fiscal 2011 and 2010
Revenues
|
|
Fiscal Year Ended June 30,
|
% Change
|
||||||||
|
|
2011
|
2010
|
||||||||
|
|
(dollars in thousands)
|
|
||||||||
|
Revenues:
|
||||||||||
|
Subscription
|
$
|
79,191
|
|
$
|
40,078
|
|
98
|
%
|
||
|
Professional services and other
|
13,450
|
|
3,251
|
|
314
|
%
|
||||
|
Total revenues
|
$
|
92,641
|
|
$
|
43,329
|
|
114
|
%
|
||
|
Percentage of revenues:
|
||||||||||
|
Subscription
|
85
|
%
|
92
|
%
|
||||||
|
Professional services and other
|
15
|
|
8
|
|
||||||
|
Total
|
100
|
%
|
100
|
%
|
||||||
Revenues increased
$49.3 million
, primarily due to the increase in subscription revenues of
$39.1 million
. Of the total increase in subscription revenues, 46% represented revenues from new customers acquired after June 30, 2010, and 54% represented revenues from existing customers at or prior to June 30, 2010. Our total customers increased 68% from June 30, 2010 to June 30, 2011. The average subscription revenues per customer increased 19% over this period primarily due to an increase in the number of subscriptions sold to existing customers.
Of the
$39.1 million
total increase in subscription revenues for fiscal 2011, 87% represented sales to customers by our direct sales organization and 13% represented revenues from channel partners. Subscription revenues in North America represented 75% of the
$39.1 million
total increase in subscription revenues and 25% represented subscription revenues outside North America.
The increase in professional services and other revenues of
$10.2 million
was primarily due to the prospective adoption of new revenue accounting guidance resulting in an increase to professional services and other revenues of
$5.5 million
in fiscal 2011. The remaining increase of $4.7 million was attributable to the growth in our customer base. Revenues in North America represented 83% of the
$10.2 million
total increase in professional services and other revenues. Revenues outside North America represented 17% of the
$10.2 million
total increase in professional services and other revenues. The increase in subscription revenues outside North America was due primarily to increased adoption of our subscription service through sales from new
39
channel partners and to a lesser extent, sales by our existing channel partners and the expansion of our direct sales organization. During fiscal 2011, we opened additional sales and marketing offices in Australia and the Netherlands.
Cost of Revenues and Gross Profit Percentage
|
|
Fiscal Year Ended June 30,
|
% Change
|
||||||||
|
|
2011
|
2010
|
||||||||
|
|
(dollars in thousands)
|
|
||||||||
|
Cost of revenues:
|
||||||||||
|
Subscription
|
$
|
15,311
|
|
$
|
6,378
|
|
140
|
%
|
||
|
Professional services and other
|
16,264
|
|
9,812
|
|
66
|
%
|
||||
|
Total cost of revenues
|
$
|
31,575
|
|
$
|
16,190
|
|
95
|
%
|
||
|
Gross profit percentage:
|
||||||||||
|
Subscription
|
81
|
%
|
84
|
%
|
||||||
|
Professional services and other
|
(21
|
)
|
(202
|
)
|
||||||
|
Total gross profit percentage
|
66
|
%
|
63
|
%
|
||||||
|
Gross profit
|
$
|
61,066
|
|
$
|
27,139
|
|
125
|
%
|
||
|
Headcount (at period end):
|
||||||||||
|
Subscription
|
83
|
|
30
|
|
177
|
%
|
||||
|
Professional services and other
|
67
|
|
36
|
|
86
|
%
|
||||
|
Total headcount
|
150
|
|
66
|
|
127
|
%
|
||||
Cost of subscription revenues increased
$8.9 million
during fiscal 2011 as compared to the same period in the prior year. The overall increase in cost of subscription revenues was primarily attributed to increased personnel-related expenses of $5.0 million, consisting of increased employee compensation, benefits and travel expenses of $4.5 million and additional stock-based compensation of
$0.5 million
. These personnel-related expenses increases were driven by headcount. In addition, hosting fees for our network infrastructure increased $2.1 million as we increased data center capacity to support our growth. At June 30, 2011, we delivered our service from six data centers in North America and five data centers internationally compared to three data centers in the United States and five data centers internationally at June 30, 2010. Depreciation expense also increased $0.8 million as we started the transition of our network infrastructure from a managed service hosting model to a co-location model.
Our subscription gross profit percentage decreased from
84%
to
81%
from fiscal 2010 to fiscal 2011 primarily due to these increased expenses.
Cost of professional services and other revenues increased $6.5 million during fiscal 2011 as compared to the same period in the prior year. The overall increase in cost of professional services and other revenues was primarily attributed to increased employee compensation, benefits and travel expenses of $3.1 million driven by headcount growth. In addition, outside services expenses increased $3.1 million primarily due to additional fees paid to third parties to provide implementation services.
Our professional services and other gross profit percentage improved from (202)% to (21)% from fiscal 2010 to fiscal 2011, primarily due to increased revenues as a result of the prospective adoption of new revenue recognition accounting guidance. This guidance enabled us to recognize professional services revenues as the services are delivered.
Sales and Marketing
|
|
Fiscal Year Ended June 30,
|
% Change
|
||||||||
|
|
2011
|
2010
|
||||||||
|
|
(dollars in thousands)
|
|
||||||||
|
Sales and marketing
|
$
|
34,123
|
|
$
|
19,334
|
|
76
|
%
|
||
|
Percentage of revenues
|
37
|
%
|
45
|
%
|
||||||
|
Headcount (at period end)
|
140
|
|
72
|
|
94
|
%
|
||||
40
Sales and marketing expenses increased $14.8 million. Employee-related expenses increased $13.3 million, consisting of increased employee compensation, benefits and travel expenses in connection with our direct sales force of $11.5 million, increased commissions of $1.1 million, and an increase in stock-based compensation of $0.7 million, which was primarily driven by an increase in sales and marketing headcount. In addition, we incurred an increase of $2.7 million in marketing and event expenses primarily attributable to our annual Knowledge conference, which experienced a 107% increase in attendance year-over-year. Offsetting these increases was a decrease of $2.0 million in compensation expenses related to the fiscal 2010 repurchase of shares from eligible stockholders in connection with our sale and issuance of Series D preferred stock. Please see Note 9 to our consolidated financial statements for further explanation of this transaction.
Research and Development
|
|
Fiscal Year Ended June 30,
|
% Change
|
||||||||
|
|
2011
|
2010
|
||||||||
|
|
(dollars in thousands)
|
|
||||||||
|
Research and development
|
$
|
7,004
|
|
$
|
7,194
|
|
(3
|
)%
|
||
|
Percentage of revenues
|
8
|
%
|
17
|
%
|
||||||
|
Headcount (at period end)
|
44
|
|
28
|
|
57
|
%
|
||||
Research and development expenses decreased $0.2 million. Personnel-related costs increased $2.8 million, consisting of increased employee compensation, benefits and travel expenses of $2.4 million and increased stock-based compensation of $0.4 million, which was primarily driven by an increase in research and development headcount. In addition, outside services expenses increased $0.4 million. Offsetting these increases was a decrease of $3.6 million in compensation expenses related to the fiscal 2010 repurchase of shares from eligible stockholders in connection with our sale and issuance of Series D preferred stock.
General and Administrative
|
|
Fiscal Year Ended June 30,
|
% Change
|
||||||||
|
|
2011
|
2010
|
||||||||
|
|
(dollars in thousands)
|
|
||||||||
|
General and administrative
|
$
|
9,379
|
|
$
|
28,810
|
|
(67
|
)%
|
||
|
Percentage of revenues
|
10
|
%
|
66
|
%
|
||||||
|
Headcount (at period end)
|
41
|
|
12
|
|
242
|
%
|
||||
General and administrative expenses decreased
$19.4 million
. Personnel-related expenses increased $3.3 million, consisting of increased employee compensation, benefits and travel costs of $2.6 million and increased stock-based compensation of
0.7 million
primarily driven by an increase in general and administrative headcount. Professional and outside service costs, comprised primarily of legal and accounting and auditing fees, increased $1.1 million. Offsetting these increases was a decrease of $24.5 million in compensation expenses related to the fiscal 2010 repurchase of shares from eligible stockholders in connection with our sale and issuance of Series D preferred stock.
Interest and Other Income (Expense), net
|
|
Fiscal Year Ended June 30,
|
% Change
|
|||||||
|
|
2011
|
2010
|
|||||||
|
|
(dollars in thousands)
|
|
|||||||
|
Interest and other income (expense), net
|
$
|
606
|
|
$
|
(1,226
|
)
|
NM
|
||
|
Percentage of revenues
|
—
|
|
(3
|
)%
|
|||||
The increase in interest and other income (expense), net of
$1.8 million
is due to losses on foreign currency transactions of $0.6 million during fiscal 2011 as compared to realized and unrealized gains of $0.5 million during fiscal 2010. Additionally,
41
during fiscal 2010, we marked to market our preferred stock warrants and revalued them upon settlement as part of the sale and issuance of Series D preferred stock, resulting in additional expense of $0.7 million.
Provision for Income Taxes
|
|
Fiscal Year Ended June 30,
|
% Change
|
||||||||
|
|
2011
|
2010
|
||||||||
|
|
(dollars in thousands)
|
|
||||||||
|
Income before income taxes
|
$
|
11,166
|
|
$
|
(29,425
|
)
|
NM
|
|
||
|
Provision for income taxes
|
1,336
|
|
280
|
|
377
|
%
|
||||
|
Effective tax rate
|
12
|
%
|
(1
|
)%
|
||||||
The provision for income taxes increased
$1.1 million
primarily as a result of the increase in pre-tax income related to international operations and California taxes.
We maintain a full valuation allowance on our U.S. federal and state deferred tax assets, and the significant components of the tax expense recorded are current cash taxes in various jurisdictions. The cash tax expenses are impacted by each jurisdiction’s individual tax rates, laws on timing of recognition of income and deductions and availability of net operating losses and tax credits. Given the full valuation allowance and sensitivity of current cash taxes to local rules, our effective tax rate fluctuates significantly on an annual basis and could be adversely affected to the extent earnings are lower than anticipated in countries that have lower statutory rates and higher than anticipated in countries that have higher statutory rates.
Quarterly Results of Operations
The following table set forth our quarterly consolidated statements of operations. We have prepared the quarterly data on a consistent basis with the audited consolidated financial statements included in this Annual Report on Form 10-K. In the opinion of management, the financial information reflects all necessary adjustments, consisting only of normal recurring adjustments, necessary for a fair presentation of this data. This information should be read in conjunction with the audited consolidated financial statements and related notes included in this Annual Report on Form 10-K. The results of historical periods are not necessarily indicative of the results of operations for a full year or any future period.
42
|
For the Three Months Ended
|
|||||||||||||||||||||||||||||||
|
|
Dec 31,
2012
|
Sep 30,
2012
|
June 30,
2012
|
March 31,
2012
|
Dec 31,
2011
|
Sep 30,
2011
|
June 30,
2011
|
March 31,
2011
|
|||||||||||||||||||||||
|
(in thousands, except per share data)
|
|||||||||||||||||||||||||||||||
|
Revenues:
|
|||||||||||||||||||||||||||||||
|
Subscription
|
$
|
62,886
|
|
$
|
55,279
|
|
$
|
46,820
|
|
$
|
39,541
|
|
$
|
34,555
|
|
$
|
30,331
|
|
$
|
24,776
|
|
$
|
21,224
|
|
|||||||
|
Professional services and other
|
12,276
|
|
9,066
|
|
9,954
|
|
7,890
|
|
4,623
|
|
3,866
|
|
4,709
|
|
3,988
|
|
|||||||||||||||
|
Total revenues
|
75,162
|
|
64,345
|
|
56,774
|
|
47,431
|
|
39,178
|
|
34,197
|
|
29,485
|
|
25,212
|
|
|||||||||||||||
|
Cost of revenues
(1)
:
|
|||||||||||||||||||||||||||||||
|
Subscription
|
20,076
|
|
17,931
|
|
14,239
|
|
11,012
|
|
8,750
|
|
6,323
|
|
4,764
|
|
4,451
|
|
|||||||||||||||
|
Professional services and other
|
12,232
|
|
9,643
|
|
8,652
|
|
10,224
|
|
7,241
|
|
5,609
|
|
4,723
|
|
4,763
|
|
|||||||||||||||
|
Total cost of revenues
|
32,308
|
|
27,574
|
|
22,891
|
|
21,236
|
|
15,991
|
|
11,932
|
|
9,487
|
|
9,214
|
|
|||||||||||||||
|
Gross profit
|
42,854
|
|
36,771
|
|
33,883
|
|
26,195
|
|
23,187
|
|
22,265
|
|
19,998
|
|
15,998
|
|
|||||||||||||||
|
Operating expenses:
|
|||||||||||||||||||||||||||||||
|
Sales and marketing
|
29,481
|
|
28,140
|
|
26,909
|
|
19,307
|
|
18,521
|
|
13,980
|
|
12,086
|
|
8,309
|
|
|||||||||||||||
|
Research and development
|
13,235
|
|
10,783
|
|
9,272
|
|
6,043
|
|
4,273
|
|
2,757
|
|
2,361
|
|
1,885
|
|
|||||||||||||||
|
General and administrative
|
9,676
|
|
11,195
|
|
6,819
|
|
6,427
|
|
5,575
|
|
4,509
|
|
3,282
|
|
2,680
|
|
|||||||||||||||
|
Total operating expenses
|
52,392
|
|
50,118
|
|
43,000
|
|
31,777
|
|
28,369
|
|
21,246
|
|
17,729
|
|
12,874
|
|
|||||||||||||||
|
Income (loss) from operations
|
(9,538
|
)
|
(13,347
|
)
|
(9,117
|
)
|
(5,582
|
)
|
(5,182
|
)
|
1,019
|
|
2,269
|
|
3,124
|
|
|||||||||||||||
|
Interest and other income (expense), net
|
456
|
|
615
|
|
41
|
|
492
|
|
(717
|
)
|
(729
|
)
|
65
|
|
252
|
|
|||||||||||||||
|
Income (loss) before provision for income taxes
|
(9,082
|
)
|
(12,732
|
)
|
(9,076
|
)
|
(5,090
|
)
|
(5,899
|
)
|
290
|
|
2,334
|
|
3,376
|
|
|||||||||||||||
|
Provision for income taxes
|
849
|
|
321
|
|
(352
|
)
|
550
|
|
906
|
|
169
|
|
298
|
|
385
|
|
|||||||||||||||
|
Net income (loss)
|
$
|
(9,931
|
)
|
$
|
(13,053
|
)
|
$
|
(8,724
|
)
|
$
|
(5,640
|
)
|
$
|
(6,805
|
)
|
$
|
121
|
|
$
|
2,036
|
|
$
|
2,991
|
|
|||||||
|
Net income (loss) per share attributable to common stockholder - Basic
|
$
|
(9,931
|
)
|
$
|
(13,053
|
)
|
$
|
(8,878
|
)
|
$
|
(5,794
|
)
|
$
|
(6,960
|
)
|
$
|
(36
|
)
|
$
|
358
|
|
$
|
516
|
|
|||||||
|
Net income (loss) per share attributable to common stockholder - Diluted
|
$
|
(9,931
|
)
|
$
|
(13,053
|
)
|
$
|
(8,878
|
)
|
$
|
(5,794
|
)
|
$
|
(6,960
|
)
|
$
|
(10
|
)
|
$
|
491
|
|
$
|
716
|
|
|||||||
|
Basic
|
$
|
(0.08
|
)
|
$
|
(0.11
|
)
|
$
|
(0.32
|
)
|
$
|
(0.23
|
)
|
$
|
(0.32
|
)
|
$
|
—
|
|
$
|
0.02
|
|
$
|
0.03
|
|
|||||||
|
Diluted
|
$
|
(0.08
|
)
|
$
|
(0.11
|
)
|
$
|
(0.32
|
)
|
$
|
(0.23
|
)
|
$
|
(0.32
|
)
|
$
|
—
|
|
$
|
0.02
|
|
$
|
0.03
|
|
|||||||
Seasonality, Cyclicality and Quarterly Trends
We have historically experienced seasonality in terms of when we enter into customer agreements for our service. We sign a significantly higher percentage of agreements with new customers, as well as renewal agreements with existing customers, in the quarters ended June 30 and December 31. The increase in customer agreements for the quarters ended June 30 is primarily as
43
a result of the historical terms of our commission plans to incentivize our direct sales force to meet their quotas by June 30, our prior fiscal year end. The increase in customer agreements for the quarter ended December 31 can be attributed to large enterprise account buying patterns typical in the software industry. Furthermore, we usually sign a significant portion of these agreements during the last month, and often the last two weeks, of each quarter. This seasonality is reflected to a much lesser extent, and sometimes is not immediately apparent, in our revenues, due to the fact that we recognize subscription revenues over the term of the license agreement, which is generally 12 to 36 months. As a result of the change in our fiscal year end from June 30 to December 31 and changes to our commission plans to provide for earlier incentives, we may not see the same seasonality pattern for future quarters ended June 30. Although these seasonal factors are common in the technology industry, historical patterns should not be considered a reliable indicator of our future sales activity or performance.
Our revenues have increased over the periods presented due to increased sales to new customers, as well as upsells to existing customers. Our operating expenses have increased sequentially in every quarter primarily due to increases in headcount and other related expenses to support our growth. We anticipate these expenses will continue to increase in future periods as we continue to focus on investing in the long-term growth of our business.
Beginning in the quarter ended September 30, 2011, we accelerated investments in our headcount and infrastructure to drive our future growth. As a result, we generated net losses for each of the quarters in the period from the three months ended December 31, 2011 through the three months ended December 31, 2012 despite significant revenue growth in the period.
Liquidity and Capital Resources
|
|
Year Ended December 31,
|
Six Months Ended
December 31,
|
Fiscal Year Ended June 30,
|
||||||||||||||||||||
|
|
2012
|
2011
|
2011
|
2010
|
2011
|
2010
|
|||||||||||||||||
|
|
(dollars in thousands)
|
||||||||||||||||||||||
|
Net cash provided by (used in) operating activities
|
$
|
48,766
|
|
|
$
|
39,977
|
|
$
|
13,220
|
|
|
$
|
10,711
|
|
$
|
37,468
|
|
|
$
|
(7,532
|
)
|
||
|
Net cash used in investing activities
|
(239,149
|
)
|
|
(14,485
|
)
|
(7,959
|
)
|
|
(1,857
|
)
|
(8,383
|
)
|
|
(1,455
|
)
|
||||||||
|
Net cash provided by financing activities
|
241,839
|
|
|
3,159
|
|
2,154
|
|
|
222
|
|
1,227
|
|
|
30,672
|
|
||||||||
|
Net increase in cash and cash equivalents, net of impact of exchange rates on cash
|
50,901
|
|
|
29,631
|
|
8,235
|
|
|
9,055
|
|
30,451
|
|
|
21,614
|
|
||||||||
To date, we have funded our business primarily with cash flows from operating activities and the net proceeds from our two public offerings. At
December 31, 2012
, we had
$119.0 million
in cash and cash equivalents, of which
$7.7 million
represented cash located overseas. We also had
$195.7 million
in short-term investments consisting of commercial paper, corporate debt securities and U.S. government agency securities.
Our historical cash flows from operating activities have been significantly impacted by customer billings and payment terms, as well as operating expenses related to sales and marketing, research and development, and expenses related to our cloud infrastructure and professional services.
Based on our current level of operations and anticipated growth, we believe our current cash, cash equivalents and short term investments, and cash flows from operating activities will be sufficient to fund our operating needs for at least the next 12 months, barring unforeseen circumstances.
In 2013, we expect to reinvest our cash flows from operations back into the business to support our growth. Our primary short-term needs for cash, which are subject to change, include expenditures related to the growth of our sales and marketing and cloud infrastructure organizations, including the expansion of data centers, and the acquisition of fixed assets and investments in office facilities to accommodate our growth. We made capital expenditures of
$42.1 million
in the
year ended
December 31, 2012
and anticipate increasing capital expenditures in 2013, primarily related to investments in our cloud infrastructure and facilities build-outs to accommodate our growth. In 2013, we expect our cash flows from operations less capital expenditures to be relatively flat compared to 2012.
Our short-term needs for cash also include expenditures related to:
|
•
|
the growth of our sales and marketing and professional services efforts;
|
44
|
•
|
support of our sales and marketing efforts related to our current and future services and applications, including expansion of our direct sales force and support resources both in the United States and abroad;
|
|
•
|
the continued advancement of research and development; and
|
|
•
|
the expansion and buildout of our facilities, including costs of leasing additional facilities.
|
To the extent existing cash and cash equivalents, short-term investments and cash from operations are not sufficient to fund our future activities, we may need to raise additional funds. Although we are not currently a party to any agreement or letter of intent with respect to potential investments in, or acquisitions of, complementary businesses, services or technologies, we may enter into these types of arrangements in the future, which could also require us to seek additional equity financing or use our cash resources. We have no present understandings, commitments or agreements to enter into any such acquisitions.
Depending on certain growth opportunities, we may choose to accelerate investments in sales and marketing, cloud infrastructure, professional services, and research and development, which may require the use of proceeds from our public offerings.
Operating Activities
Net cash provided by operating activities in the
year ended
December 31, 2012
was
$48.8 million
, reflecting our net loss of
$37.3 million
, adjusted by non-cash charges including
$27.9 million
for stock-based compensation,
$13.7 million
for the amortization of deferred commissions,
$13.5 million
for depreciation and amortization and
$2.5 million
for lease abandonment costs, and non-cash benefits including
$1.7 million
tax benefit from exercise of stock options and changes in our operating assets and liabilities. Our overall net change in operating assets and liabilities was primarily comprised of an increase of
$64.8 million
in deferred revenue, a
$22.9 million
increase in accrued liabilities, an increase of
$4.2 million
in other long-term liabilities, and an increase of
$4.9 million
in accounts payable, partially offset by a
$33.3 million
increase in accounts receivable, a
$29.2 million
increase in deferred commissions, a
$2.5 million
increase in prepaid expenses and other current assets and a
$2.2 million
decrease in deferred rent. The increases in deferred revenue, deferred commissions and accounts receivable were primarily due to increased sales in the
year ended
December 31, 2012
. The increase in accrued liabilities, accounts payable and prepaid expenses are due to the growth of our business and increased headcount of
79%
during the
year ended
December 31, 2012
. The decrease in deferred rent is offset by the increase in other long-term liabilities related to the relocation of our San Diego office to another facility in San Diego in August 2012.
Net cash provided by operating activities in the
year ended
December 31, 2011
was
$40 million
, reflecting our net loss of
$1.7 million
, adjusted by non-cash charges including
$7.5 million
for stock-based compensation,
$5.9 million
for the amortization of deferred commissions, and
$3.0 million
for depreciation, and changes in our operating assets and liabilities. The fluctuations in our operating assets and liabilities were primarily attributed to an increase of
$51.3 million
in deferred revenue,
$10.8 million
increase in accrued liabilities,
$3.1 million
increase in deferred rent and
$2.6 million
increase in accounts payable partially offset by an increase of
$27.5 million
in accounts receivable,
$11.7 million
increase in deferred commissions and
$3.7 million
increase in prepaid expenses and other current assets. The increase in deferred revenue, accounts receivable and deferred commissions was primarily due to increased sales. The increase in deferred rent, accrued liabilities, accounts payable and prepaid expenses was primarily due to the growth of our business, increased headcount and the resulting move of our San Diego office to a new building during the period. Our total headcount increased
141%
during the
year ended
December 31, 2011
.
Net cash provided by operating activities in the six months ended December 31, 2011 reflected our net loss of $6.7 million, adjusted by non-cash charges including $5.6 million for stock-based compensation, $3.5 million for amortization of deferred commissions and $2.0 million for depreciation, and changes in our operating assets and liabilities. The fluctuations in our operating assets and liabilities were primarily attributed to a $30.0 million increase in deferred revenue and a $6.9 million increase in accrued liabilities, partially offset by a $20.4 million increase in accounts receivable and an $8.3 million increase in deferred commissions. The increase in deferred revenue, accounts receivable and deferred commissions was primarily due to increased sales. Our sales and marketing headcount increased 73% during the six months ended December 31, 2011. The increase in accrued liabilities was due to the growth in our business and increased headcount.
Net cash provided by operating activities in the six months ended December 31, 2010 reflected our net income of $4.8 million and changes in our working capital. The fluctuations in our operating assets and liabilities were primarily attributed to a $12.6 million increase in deferred revenue, partially offset by a $7.6 million increase in accounts receivable. The increase in deferred revenue and accounts receivable was primarily due to increased sales.
Net cash provided by operating activities in fiscal 2011 reflected our net income of $9.8 million, adjusted by non-cash charges including $4.0 million for the amortization of deferred commissions and $3.0 million for stock-based compensation, and changes in our working capital. The fluctuations in our operating assets and liabilities were primarily attributed to a $33.9 million
45
increase in deferred revenue, a $5.4 million increase in accrued liabilities and a $3.2 million increase in deferred rent, partially offset by a $14.8 million increase in accounts receivable and a $5.6 million increase in deferred commissions. The increase in deferred revenue, accounts receivable and deferred commissions was primarily due to increased sales in fiscal 2011. The increase in accrued liabilities and deferred rent was primarily due to the growth of our business and the move of our San Diego office to a new building during the period.
Net cash used in operating activities in fiscal 2010 reflected our net loss of $29.7 million, which included non-cash compensation expense of $30.8 million related to the premium paid to eligible stockholders for the repurchase of common stock in connection with the sale of Series D preferred stock, and the changes in our operating assets and liabilities. The fluctuations in our working capital were primarily attributed to a $24.0 million increase in deferred revenue and an $8.9 million increase in accrued liabilities, partially offset by a $5.3 million increase in deferred commissions, a $5.2 million increase in accounts receivable and a $4.9 million increase in prepaid expenses and other current assets. The increase in accrued liabilities included $4.5 million in withholding taxes associated with the repurchase of our founder’s shares as part of the sale and issuance Series D preferred stock, with a corresponding offset of $4.5 million for a receivable in prepaid expenses and other current assets owed to us by our founder. The remaining increase to accrued liabilities was due to the increase in headcount.
Investing Activities
In the
year ended
December 31, 2012
, cash used in investing activities was primarily attributed to the purchase of
$240.6 million
in short-term investments offset by maturities of
$42.5 million
. In addition, we paid cash for capital expenditures of
$42.1 million
primarily related to the purchase of servers, networking equipment and storage infrastructure to support the expansion of our data centers as well as investments in leasehold improvements and furniture and equipment to support our headcount growth. We expect these investments to continue in 2013.
In the
year ended
December 31, 2011
, the six months ended December 31, 2011 and 2010, and fiscal 2011 and 2010, our investing activities primarily consisted of capital expenditures related to the purchase of servers, networking equipment and storage infrastructure to support the expansion of our data centers and tenant improvements associated with the growth of our office facilities.
Financing Activities
Our financing activities have primarily consisted of equity issuances, including excess tax benefits from stock award activities.
In the
year ended
December 31, 2012
, cash provided by financing activities primarily consisted of initial public offering proceeds of
$169.8 million
, net of paid underwriter discounts, commissions and issuance costs, follow-on offering proceeds of
$50.6 million
, net of paid underwriter discounts, commissions and issuance costs,
$17.8 million
in gross proceeds from the issuance of
1,750,980
shares of common stock at a price of $10.20 per share through a private placement with a new stockholder and
$3.9 million
in proceeds from the issuance of common stock through the exercise and early exercise of employee stock options. These increases in cash were slightly offset by purchases of common stock and restricted stock from stockholders of
$2.0 million
.
In the
year ended
December 31, 2011
, cash provided by financing activities primarily consisted of
$3.1 million
in proceeds from the issuance of common stock through the exercise and early exercise of employee stock options.
In the six months ended December 31, 2011, cash provided by financing activities primarily consisted of $2.1 million in proceeds from the issuance of common stock through the exercise and early exercise of employee stock options.
In the six months ended December 31, 2010, we had no significant financing activities.
In fiscal 2011, cash provided by financing activities primarily consisted of $1.1 million in proceeds from the issuance of common stock through the exercise and early exercise of employee stock options.
In fiscal 2010, we received net proceeds of $51.2 million from the sale and issuance of Series D preferred stock, which was used to repurchase and subsequently cancel shares of common stock from eligible stockholders and warrants to purchase Series B preferred stock from a warrant holder.
Contractual Obligations and Commitments
Contractual obligations represent future cash commitments and liabilities under agreements with third parties, and exclude orders for goods and services entered into in the normal course of business that are not enforceable or legally binding.
46
The following table represents our known contractual obligations as of
December 31, 2012
, aggregated by type:
|
|
Payments Due by Period
|
||||||||||||||||||
|
Contractual Obligations
|
Total
|
Less
Than
1 Year
|
1 – 3
Years
|
3 – 5
Years
|
More
Than
5 Years
|
||||||||||||||
|
|
(in thousands)
|
||||||||||||||||||
|
Operating leases:
|
|||||||||||||||||||
|
Data centers
(1)
|
$
|
13,077
|
|
$
|
7,474
|
|
$
|
5,603
|
|
$
|
—
|
|
$
|
—
|
|
||||
|
Facilities space
(2)
|
98,213
|
|
6,251
|
|
21,759
|
|
22,776
|
|
47,427
|
|
|||||||||
|
Total operating leases
|
$
|
111,290
|
|
$
|
13,725
|
|
$
|
27,362
|
|
$
|
22,776
|
|
$
|
47,427
|
|
||||
|
(1)
|
Operating leases for data centers represent our principal commitment for co-location facilities for data center capacity.
|
|
(2)
|
Operating leases for facilities space represents our principal commitments, which consists of obligations under leases for office space. Lease commitments of
$9.9 million
related to the lease for our former San Diego office are also included in the table above.
|
In addition to the obligations in the table above, approximately
$0.9 million
of unrecognized tax benefits have been recorded as liabilities as of
December 31, 2012
. It is uncertain as to if or when such amounts may be settled. We have also recorded a liability for potential penalties of
$0.2 million
and interest of
$0.1 million
related to these unrecognized tax benefits.
Off-Balance Sheet Arrangements
During all periods presented, we did not have any relationships with unconsolidated entities or financial partnerships, such as entities often referred to as structured finance or special purpose entities, which would have been established for the purpose of facilitating off-balance sheet arrangements or other contractually narrow or limited purposes. As such, we are not exposed to any financing, liquidity, market or credit risk that could arise if we had engaged in those types of relationships.
Critical Accounting Policies and Significant Judgments and Estimates
Our management’s discussion and analysis of financial condition and results of operations is based on our consolidated financial statements, which have been prepared in accordance with accounting principles generally accepted in the United States. The preparation of these consolidated financial statements requires us to make estimates and assumptions that affect the reported amounts of assets and liabilities and the disclosure of contingent assets and liabilities at the date of the consolidated financial statements, as well as the reported revenues and expenses during the reporting periods. These items are monitored and analyzed by us for changes in facts and circumstances, and material changes in these estimates could occur in the future. We base our estimates on historical experience and on various other factors that we believe are reasonable under the circumstances, the results of which form the basis for making judgments about the carrying value of assets and liabilities that are not readily apparent from other sources. Changes in estimates are reflected in reported results for the period in which they become known. Actual results may differ from these estimates under different assumptions or conditions.
While our significant accounting policies are more fully described in Note 2 to our consolidated financial statements, we believe that the following accounting policies are critical to the process of making significant judgments and estimates in the preparation of our audited consolidated financial statements.
Revenue Recognition
We commence revenue recognition when all of the following conditions are met:
|
•
|
There is persuasive evidence of an arrangement;
|
|
•
|
The service has been provided to the customer;
|
|
•
|
The collection of related fees is reasonably assured; and
|
|
•
|
The amount of fees to be paid by the customer is fixed or determinable.
|
Signed agreements are used as evidence of an arrangement. If a signed contract by the customer does not exist, we have historically used either a purchase order or a signed order form as evidence of an arrangement. In cases where both a signed contract and either a purchase order or signed order form exist, we consider the signed contract to be the final persuasive evidence of an arrangement.
47
Subscription revenues are recognized ratably over the contract term beginning on the commencement date of each contract, which is the date we make our service available to our customers. Once our service is available to customers, amounts that have been invoiced are recorded in accounts receivable and in deferred revenue. Our professional services are priced either on a fixed-fee basis or on a time-and-materials basis. Professional services and other revenues are recognized as the services are delivered using a proportional performance model. Such services are delivered over a short period of time. In instances where final acceptance of the services are required before revenues are recognized, professional services revenues and the associated costs are deferred until all acceptance criteria have been met.
We assess collectibility based on a number of factors such as past collection history and creditworthiness of the customer. If we determine collectibility is not reasonably assured, we defer revenue recognition until collectibility becomes reasonably assured. We assess whether the fee is fixed or determinable based on the payment terms associated with the transaction and whether the sales price is subject to refund or adjustment. Our arrangements do not include general rights of return.
We have multiple element arrangements comprised of subscription fees and professional services. In October 2009, the Financial Accounting Standards Board, or FASB, ratified authoritative accounting guidance regarding revenue recognition for arrangements with multiple deliverables effective for fiscal periods beginning on or after June 15, 2010. The guidance affects the determination of separate units of accounting in arrangements with multiple deliverables and the allocation of transaction consideration to each of the identified units of accounting. Previously, a delivered item was considered a separate unit of accounting when (i) it had value to the customer on a stand-alone basis, (ii) there was objective and reliable evidence of the fair value of the undelivered items, and (iii) there was no general right of return relative to the delivered services or the performance of the undelivered services was probable and substantially controlled by the vendor. The new guidance eliminates the requirement for objective and reliable evidence of fair value to exist for the undelivered items in order for a delivered item to be treated as a separate unit of accounting. The guidance also requires arrangement consideration to be allocated at the inception of the arrangement to all deliverables using the relative-selling-price method and eliminates the use of the residual method of allocation. Under the relative-selling-price method, the selling price for each deliverable is determined using vendor-specific objective evidence, or VSOE, of selling price or third-party evidence, or TPE, of selling price if VSOE does not exist. If neither VSOE nor TPE of selling price exists for a deliverable, the guidance requires an entity to determine the best estimate of selling price, or BESP.
Prior to the adoption of this authoritative accounting guidance, we did not have objective and reliable evidence of fair value for the items in our multiple element arrangements. As a result, we accounted for subscription and professional services revenues as one unit of account and recognized total contracted revenues ratably over the contracted term of the subscription agreement.
We adopted the new guidance on a prospective basis for fiscal 2011. As a result, this guidance was applied to all revenue arrangements entered into or materially modified since July 1, 2010. The following table summarizes the effects of this new guidance on our consolidated balance sheets and statements of comprehensive income (loss) (in thousands):
|
|
As of and for the Fiscal Year Ended
June 30, 2011
|
||||||||||
|
|
As
Reported
|
Under
Previous
Accounting
Guidance
|
Impact of
Adoption of
ASU 2009-13
|
||||||||
|
Total deferred revenue
|
$
|
74,646
|
|
$
|
81,036
|
|
$
|
(6,390
|
)
|
||
|
Revenues:
|
|||||||||||
|
Subscription
|
$
|
79,191
|
|
$
|
78,305
|
|
$
|
886
|
|
||
|
Professional services and other
|
13,450
|
|
7,946
|
|
5,504
|
|
|||||
|
Total revenues
|
$
|
92,641
|
|
$
|
86,251
|
|
$
|
6,390
|
|
||
Upon adoption of this authoritative accounting guidance, we have accounted for subscription and professional services revenues as separate units of accounting. To qualify as a separate unit of accounting, the delivered item must have value to the customer on a standalone basis. Our subscription service has standalone value as it is routinely sold separately by us, we provide customers access to our subscription service at the beginning of the contract term, and our on-demand application is fully functional without any additional development, modification or customization. In determining whether professional services have standalone value, we consider the following factors for each professional services agreement: availability of the services from other vendors, the nature of the professional services, the timing of when the professional services contract was signed in comparison to the subscription service start date and the contractual dependence of the subscription service on the customer’s satisfaction with the professional services work. Our professional services, including implementation and configuration services, are not so unique and complex that other vendors cannot provide them. In some instances, our customers independently contract with third-party vendors
48
to do the implementation and we regularly outsource implementation services to contracted third-party vendors. As a result, we concluded professional services, including implementation and configuration services, also have standalone value.
We determine the selling price of each deliverable in the arrangement using the relative-selling price method based on the selling price hierarchy. The selling price for each unit of account is based on the BESP since VSOE and TPE are not available for our subscription service or professional services and other. The BESP for each deliverable is determined primarily by considering the historical selling price of these deliverables in similar transactions as well as other factors, including, but not limited to, market competition, review of stand-alone sales and pricing practices. The total arrangement fee for these multiple element arrangements is then allocated to the separate units of account based on the relative selling price. The method used to determine the BESP for our subscription service is consistent with the method used to determine prices for our services that are sold regularly on a standalone basis. In determining the appropriate pricing structure, we consider the extent of competitive pricing of similar products, marketing analyses and other feedback from analysts. We price our subscription service based on the number of users with a defined process role, according to a tiered structure. The BESP for our subscription service is based upon the historical selling price of these deliverables. Prior to December 2011, our professional services were priced on a fixed-fee basis as a percentage of the subscription fee. We also prepared a standard build-up cost analysis to estimate the fixed fee for our professional services based on the estimated level of effort to complete the professional services. If professional services were priced below the expected range due to discounting, fees allocated to professional services were limited to the amount not contingent upon the delivery of our subscription service. In December 2011, we began shifting our pricing model for professional services to a time-and-materials basis.
In limited circumstances, we grant certain customers the right to deploy our subscription service on the customers’ own servers without significant penalty. We have analyzed all of the elements in these particular multiple element arrangements and determined we do not have sufficient VSOE of fair value to allocate revenue to our subscription service and professional services. We defer all revenue under the arrangement until the commencement of the subscription service and any associated professional services. Once the subscription service and the associated professional services have commenced, the entire fee from the arrangement is recognized ratably over the remaining period of the arrangement.
Deferred Commissions
We defer expenses associated with commission payments made to our direct sales force and referral fees paid to independent third-parties. The commissions are deferred and amortized to sales expense over the non-cancelable terms of the related contracts with our customers. The commission payments are a direct and incremental cost of the revenue arrangements. The deferred commission amounts are recoverable through the future revenue streams under the non-cancelable customer contracts. We believe this is preferable to expensing sales commissions as incurred because the commission charges are so closely related to revenues they should be recorded as an asset and charged to expense over the same period the revenues are recognized. Additionally, we believe this policy election enhances the comparability of our consolidated financial statements to those of other companies in our industry.
Stock-Based Compensation
We measure compensation expense for all stock-based payments made to employees and directors based on the fair value of the award as of the date of grant. The expense is recognized, net of estimated forfeitures, over the requisite service period, which is generally the vesting period of the respective award. We estimate forfeitures based upon our historical experience. At each period end, we review the estimated forfeiture rate and make changes as factors affecting the forfeiture rate calculations and assumptions change. We use the Black-Scholes option-pricing model to determine the fair value of our stock-based awards.
Determining the fair value under this model requires the use of inputs that are subjective and generally require significant analysis and judgment to develop. These inputs include the fair value of our common stock, expected volatility, expected term, risk-free interest rate, and expected dividend yield, which are estimated as follows:
|
•
|
Fair value of our common stock
: Because our stock was not publicly traded prior to our initial public offering, we estimated the fair value of our common stock, as discussed in “Common Stock Valuations” below. Following our initial public offering in June 2012, our common stock was valued by reference to its publicly traded price.
|
|
•
|
Expected volatility
: We use the historic volatility of publicly traded peer companies as an estimate for our expected volatility. In considering peer companies, we assess characteristics such as industry, stage of development, size, and financial leverage. For each period, the peer group of publicly traded companies used to determine expected volatility was the same as the peer group used to determine the fair value of our common stock. We intend to continue to consistently apply this process using the same or similar public companies until a sufficient amount of historical information regarding the volatility of our own common stock share price becomes available.
|
49
|
•
|
Expected term
: We estimate the expected term using the simplified method due to the lack of historical exercise activity for our company. The simplified method calculates the expected term as the mid-point between the vesting date and the contractual expiration date of the award.
|
|
•
|
Risk-free interest rate
: The risk-free interest rate is based on the U.S. Treasury yield curve in effect at the time of grant for the expected term of the stock-based award.
|
|
•
|
Dividend yield
: Our expected dividend yield is zero, as we have not and do not currently intend to declare dividends in the foreseeable future.
|
If any assumptions used in the Black-Scholes model change significantly, stock-based compensation for future awards may differ materially compared with the awards granted previously.
Common Stock Valuations
Prior to our initial public offering, the fair value of the common stock underlying our stock options was determined by our board of directors, which intended all options granted to be exercisable at a price per share not less than the per share fair value of our common stock underlying those options on the date of grant. The valuations of our common stock were determined in accordance with the guidelines outlined in the
American Institute of Certified Public Accountants Practice Aid, Valuation of Privately-Held-Company Equity Securities Issued as Compensation
. The assumptions we used in the valuation model were based on future expectations combined with management judgment. In the absence of a public trading market, our board of directors with input from management exercised significant judgment and considered numerous objective and subjective factors to determine the fair value of our common stock as of the date of each option grant, including the following factors:
|
•
|
contemporaneous independent valuations performed at periodic intervals;
|
|
•
|
the prices, rights, preferences and privileges of our convertible preferred stock relative to the common stock;
|
|
•
|
recent sales of our common stock;
|
|
•
|
our operating and financial performance and forecast;
|
|
•
|
current business conditions;
|
|
•
|
the hiring of key personnel;
|
|
•
|
our stage of development;
|
|
•
|
the likelihood of achieving a liquidity event for the shares of common stock underlying these stock options, such as an initial public offering or sale of our company, given prevailing market conditions;
|
|
•
|
any adjustment necessary to recognize a lack of marketability for our common stock;
|
|
•
|
the market performance of comparable publicly traded technology companies;
|
|
•
|
mergers and acquisition activity in our industry; and
|
|
•
|
the U.S. and global capital market conditions.
|
In order to determine the fair value of our common stock underlying award grants prior to our initial public offering, we considered contemporaneous valuations of our stock. We utilized the probability weighted expected return method, or PWERM, approach to allocate value to our common shares. The PWERM approach employs various market approach and income approach calculations depending upon the likelihood of various liquidation scenarios. For each of the various scenarios, an equity value is estimated and the rights and preferences for each stockholder class are considered to allocate the equity value to common shares. The common share value is then multiplied by a discount factor reflecting the calculated discount rate and the timing of the event. Lastly, the common share value is multiplied by an estimated probability for each scenario. The probability and timing of each scenario were based upon discussions between our board of directors and our management team. Under the PWERM, the value of our common stock was based upon four possible future events for our company:
|
•
|
initial public offering, or IPO;
|
|
•
|
strategic merger or sale;
|
|
•
|
remaining a private company; and
|
|
•
|
dissolution.
|
50
The market approach uses similar companies or transactions in the marketplace. We utilized the guideline company method of the market approach for determining the fair value of our common stock under the initial public offering scenario. We identified companies similar to our business and used these guideline companies to develop relevant market multiples and ratios. We selected the peer group of companies based on their size, business model, industry, business description and developmental stage. While we believe that our proprietary platform to automate enterprise IT operations that we provide to our customers differentiates us from other software companies, we selected this peer group from publicly traded companies that are similarly viewed as being in the information technology industry and offering their services under a SaaS business model. We then applied these market multiples and ratios to our financial forecasts to create an indication of total equity value. Under the strategic merger or sale scenario, we utilized the guideline company method and the guideline transaction method of the market approach to determine the fair value of the common stock. The guideline transaction method compares the operating results and market value of the equity or invested capital of acquired companies similar to our business. The income approach, which we utilized to assess fair value of the common stock under the assumption we remained a private company, is an estimate of the present value of the future monetary benefits generated by an investment in that asset. Specifically, debt free cash flows and the estimated terminal value are discounted at an appropriate risk-adjusted discount rate to estimate the total invested capital value of the entity. Under the dissolution scenario, we assumed no value remained to be allocated to our common stockholders. We continually reviewed and updated the selection of companies in the peer group of publicly traded companies to better reflect the size and developmental stage of our company and to account for the acquisition of certain of the peer companies.
Stock Options and RSUs Granted Subsequent to our Initial Public Offering
For stock options and RSUs granted subsequent to our initial public offering, our board of directors determined the fair value based on the closing price of our common stock as reported on the New York Stock Exchange on the date of grant.
Income Taxes
Our provision for income taxes, deferred tax assets and liabilities, and reserves for unrecognized tax benefits reflect our best assessment of estimated future taxes to be paid. Significant judgments and estimates based on interpretations of existing tax laws or regulations in the United States and the numerous foreign jurisdictions where we are subject to income tax are required in determining our provision for income taxes. Changes in tax laws, statutory tax rates, and estimates of our future taxable income could impact the deferred tax assets and liabilities provided for in the consolidated financial statements and would require an adjustment to the provision for income taxes.
Deferred tax assets are regularly assessed to determine the likelihood they will be recovered from future taxable income. A valuation allowance is established when we believe it is more likely than not the future realization of all or some of a deferred tax asset will not be achieved. In evaluating our ability to recover deferred tax assets within the jurisdiction in which they arise we consider all available positive and negative evidence. Factors reviewed include the cumulative pre-tax book income for the past three years, scheduled reversals of deferred tax liabilities, our history of earnings and reliable forecasting, projections of pre-tax book income over the foreseeable future, and the impact of any feasible and prudent tax planning strategies.
We recognize the impact of a tax position in our consolidated financial statements only if that position is more likely than not of being sustained upon examination by taxing authorities, based on the technical merits of the position. Tax authorities regularly examine our returns in the jurisdictions in which we do business and we regularly assess the tax risk of our return filing positions. Due to the complexity of some of the uncertainties, the ultimate resolution may result in payments that are materially different from our current estimate of the tax liability. These differences, as well as any interest and penalties, will be reflected in the provision for income taxes in the period in which they are determined.
Cease-Use Loss upon Exit of Facility
In August 2012, we relocated our San Diego office to another facility in San Diego. As part of this move, we incurred lease abandonment costs of
$2.5 million
, which primarily consists of a loss on disposal of assets and a cease-use loss recorded upon vacating our prior San Diego office. The lease on our prior headquarters facility expires in 2019. The cease-use loss was calculated as the present value of the remaining lease obligation offset by estimated sublease rental receipts during the remaining lease period, adjusted for deferred items and lease incentives. In calculating the cease-use loss, management is required to make significant judgments to estimate the present value of future cash flows from the assumed sublease. The key assumptions used in our discounted cash flow model include the amount and timing of estimated sublease rental receipts, and a credit-adjusted, risk-free discount rate of 5.08%. These assumptions are subjective in nature and the actual future cash flows could differ from our estimates, resulting in significant adjustments to the cease-use loss recorded or to be recorded.
51
Recent Accounting Pronouncements
In February 2013, the FASB issued new disclosure guidance related to the presentation of the Statement of Comprehensive Income. This guidance requires the disclosure of the effect of significant amounts reclassified from each component of accumulated other comprehensive income based on its source and the income statement line items affected by the reclassification. We will adopt this accounting standard upon its effective date for periods beginning on or after December 15, 2012, and this adoption will not have any impact on our financial position or results of operations.
|
ITEM 7A.
|
QUALITATIVE AND QUANTITATIVE DISCLOSURES ABOUT MARKET RISK
|
Foreign Currency Exchange Risk
We have foreign currency risks related to our revenue and operating expenses denominated in currencies other than the U.S. dollar, primarily the Euro and British Pound Sterling. Revenues outside of North America as a percentage of revenue was
29%
and
27%
during the
year ended
December 31,
2012
and
2011
, respectively, 29% and 26% during the six months ended December 31, 2011 and 2010, respectively, and 25% and 28% in fiscal 2011 and 2010, respectively. Changes in exchange rates may negatively affect our revenue and other operating results as expressed in U.S. dollars.
We have experienced and will continue to experience fluctuations in our net income as a result of transaction gains or losses related to revaluing certain current asset and current liability balances that are denominated in currencies other than the functional currency of the entities in which they are recorded.
For the most part, we are unable to accurately forecast the changes in exchange rates and consequent gains and losses from such fluctuations.
We recognized foreign currency net gains of $1.1 million, $1.6 million and $0.5 million in the
year ended
December 31, 2012
, the six months ended December 31, 2011 and fiscal 2010, respectively. We recognized foreign currency net losses of $1.3 million, $0.6 million and $0.3 million in the year ended December 31, 2011, fiscal 2011 and the six months ended December 31, 2010, respectively. While we have not engaged in the hedging of our foreign currency transactions to date, we are presently evaluating the costs and benefits of initiating such a program and may in the future hedge selected significant transactions denominated in currencies other than the U.S. Dollar.
We estimate that a 10% decline in the value of the U.S. dollar as measured against the other currencies in which our transactions are denominated would have widened our operating loss in the year ended December 31, 2012. This sensitivity analysis disregards the possibilities that rates can move in opposite directions and that losses from one geographic area may be offset by gains from another geographic area.
Interest Rate Sensitivity
In February 2012, we began investing in corporate debt securities. The primary objectives of our investment activities are the preservation of capital and supporting our liquidity requirements. We do not enter into investments for trading or speculative purposes. Our investments are exposed to market risk due to a fluctuation in interest rates, which may affect our interest income and the fair market value of our investments. Due to the short-term nature of our investment portfolio, however, we do not believe an immediate 10% increase or decrease in interest rates would have a material effect on the fair market value of our portfolio. We therefore do not expect our operating results or cash flows to be materially affected by a sudden change in market interest rates.
52
|
ITEM 8.
|
CONSOLIDATED FINANCIAL STATEMENTS AND SUPPLEMENTARY DATA
|
SERVICENOW, INC.
INDEX TO CONSOLIDATED FINANCIAL STATEMENTS
|
|
Page
|
|
Consolidated Financial Statements
|
|
53
Report of Independent Registered Public Accounting Firm
To the Board of Directors and Stockholders of ServiceNow, Inc.:
In our opinion, the accompanying consolidated balance sheets and the related consolidated statements of comprehensive income (loss), changes in convertible preferred stock and stockholders' equity (deficit), and cash flows
present fairly, in all material respects, the financial position of
ServiceNow, Inc. and its subsidiaries
at
December 31, 2012
and December 31, 2011,
and the results of their operations and their cash flows for the year ended
December 31, 2012, the six months ended December 31, 2011, and each of the two years in the period ended June 30, 2011 in conformity with accounting principles generally accepted in the United States of America. These financial statements are the responsibility of the Company's management. Our responsibility is to express an opinion on these financial statements based on our audits. We conducted our audits of these statements in accordance with the standards of the Public Company Accounting Oversight Board (United States). Those standards require that we plan and perform the audit to obtain reasonable assurance about whether the financial statements are free of material misstatement. An audit includes examining, on a test basis, evidence supporting the amounts and disclosures in the financial statements, assessing the accounting principles used and significant estimates made by management, and evaluating the overall financial statement presentation. We believe that our audits provide a reasonable basis for our opinion.
As discussed in Note 2 to the consolidated financial statements, the Company changed the manner in which it accounts for multiple element revenue arrangements beginning July 1, 2010.
/s/ PricewaterhouseCoopers LLP
San Diego, California
March 8, 2013
54
SERVICENOW, INC.
(in thousands, except share and per share data)
|
|
December 31, 2012
|
December 31, 2011
|
|||||
|
|
|||||||
|
Assets
|
|||||||
|
Current assets:
|
|||||||
|
Cash and cash equivalents
|
$
|
118,989
|
|
$
|
68,088
|
|
|
|
Restricted cash
|
—
|
|
45
|
|
|||
|
Short-term investments
|
195,702
|
|
—
|
|
|||
|
Accounts receivable, net
|
78,163
|
|
44,860
|
|
|||
|
Current portion of deferred commissions
|
14,979
|
|
6,087
|
|
|||
|
Prepaid expenses and other current assets
|
13,596
|
|
9,883
|
|
|||
|
Current portion of deferred tax assets
|
660
|
|
1,544
|
|
|||
|
Total current assets
|
422,089
|
|
130,507
|
|
|||
|
Deferred commissions, less current portion
|
11,296
|
|
4,597
|
|
|||
|
Property and equipment, net
|
42,342
|
|
20,695
|
|
|||
|
Other assets
|
2,387
|
|
524
|
|
|||
|
Total assets
|
$
|
478,114
|
|
$
|
156,323
|
|
|
|
Liabilities, Convertible Preferred Stock and Stockholders’ Equity (Deficit)
|
|||||||
|
Current liabilities:
|
|||||||
|
Accounts payable
|
$
|
9,604
|
|
$
|
9,411
|
|
|
|
Accrued expenses and other current liabilities
|
48,042
|
|
25,608
|
|
|||
|
Current portion of deferred revenue
|
153,964
|
|
91,087
|
|
|||
|
Current portion of deferred rent
|
17
|
|
455
|
|
|||
|
Total current liabilities
|
211,627
|
|
126,561
|
|
|||
|
Deferred revenue, less current portion
|
16,397
|
|
13,549
|
|
|||
|
Deferred rent, less current portion
|
1,148
|
|
2,935
|
|
|||
|
Other long-term liabilities
|
5,537
|
|
2,532
|
|
|||
|
Total liabilities
|
234,709
|
|
145,577
|
|
|||
|
Commitments and contingencies
|
|
|
|
||||
|
Convertible preferred stock, $0.001 par value; no shares authorized, issued and outstanding at December 31, 2012 and 11,354,473 shares authorized; 10,462,877 issued and outstanding at December 31, 2011; liquidation preference of $68,610 at December 31, 2011
|
—
|
|
68,172
|
|
|||
|
Stockholders’ equity (deficit):
|
|||||||
|
Preferred stock, $0.001 par value; 10,000,000 shares authorized; no shares issued or outstanding
|
—
|
|
—
|
|
|||
|
Common stock $0.001 par value; 600,000,000 shares authorized; 126,367,700 and 22,229,978 shares issued and outstanding at December 31, 2012 and 2011, respectively
|
126
|
|
22
|
|
|||
|
Additional paid-in capital
|
348,803
|
|
9,793
|
|
|||
|
Accumulated other comprehensive income (loss)
|
(36
|
)
|
899
|
|
|||
|
Accumulated deficit
|
(105,488
|
)
|
(68,140
|
)
|
|||
|
Total stockholders’ equity (deficit)
|
243,405
|
|
(57,426
|
)
|
|||
|
Total liabilities, convertible preferred stock and stockholders’ equity (deficit)
|
$
|
478,114
|
|
$
|
156,323
|
|
|
See accompanying notes to consolidated financial statements
55
SERVICENOW, INC.
(in thousands, except share and per share data)
|
|
Year Ended December 31,
|
Six Months Ended December 31,
|
Fiscal Years Ended June 30,
|
||||||||||||||||
|
|
2012
|
2011
|
2010
|
2011
|
2010
|
||||||||||||||
|
|
(Unaudited)
|
||||||||||||||||||
|
Revenues:
|
|||||||||||||||||||
|
Subscription
|
$
|
204,526
|
|
$
|
64,886
|
|
$
|
33,191
|
|
$
|
79,191
|
|
$
|
40,078
|
|
||||
|
Professional services and other
|
39,186
|
|
8,489
|
|
4,753
|
|
13,450
|
|
3,251
|
|
|||||||||
|
Total revenues
|
243,712
|
|
73,375
|
|
37,944
|
|
92,641
|
|
43,329
|
|
|||||||||
|
Cost of revenues
(1)
:
|
|||||||||||||||||||
|
Subscription
|
63,258
|
|
15,073
|
|
6,096
|
|
15,311
|
|
6,378
|
|
|||||||||
|
Professional services and other
|
40,751
|
|
12,850
|
|
6,778
|
|
16,264
|
|
9,812
|
|
|||||||||
|
Total cost of revenues
|
104,009
|
|
27,923
|
|
12,874
|
|
31,575
|
|
16,190
|
|
|||||||||
|
Gross profit
|
139,703
|
|
45,452
|
|
25,070
|
|
61,066
|
|
27,139
|
|
|||||||||
|
Operating expenses
(1)
:
|
|||||||||||||||||||
|
Sales and marketing
|
103,837
|
|
32,501
|
|
13,728
|
|
34,123
|
|
19,334
|
|
|||||||||
|
Research and development
|
39,333
|
|
7,030
|
|
2,758
|
|
7,004
|
|
7,194
|
|
|||||||||
|
General and administrative
|
34,117
|
|
10,084
|
|
3,417
|
|
9,379
|
|
28,810
|
|
|||||||||
|
Total operating expenses
|
177,287
|
|
49,615
|
|
19,903
|
|
50,506
|
|
55,338
|
|
|||||||||
|
Income (loss) from operations
|
(37,584
|
)
|
(4,163
|
)
|
5,167
|
|
10,560
|
|
(28,199
|
)
|
|||||||||
|
Interest and other income (expense), net
|
1,604
|
|
(1,446
|
)
|
289
|
|
606
|
|
(1,226
|
)
|
|||||||||
|
Income (loss) before provision for income taxes
|
(35,980
|
)
|
(5,609
|
)
|
5,456
|
|
11,166
|
|
(29,425
|
)
|
|||||||||
|
Provision for income taxes
|
1,368
|
|
1,075
|
|
653
|
|
1,336
|
|
280
|
|
|||||||||
|
Net income (loss)
|
$
|
(37,348
|
)
|
$
|
(6,684
|
)
|
$
|
4,803
|
|
$
|
9,830
|
|
$
|
(29,705
|
)
|
||||
|
Net income (loss) attributable to common stockholders
|
|||||||||||||||||||
|
Basic
|
$
|
(37,656
|
)
|
$
|
(6,996
|
)
|
$
|
762
|
|
$
|
1,639
|
|
$
|
(30,345
|
)
|
||||
|
Diluted
|
$
|
(37,656
|
)
|
$
|
(6,996
|
)
|
$
|
1,111
|
|
$
|
2,310
|
|
$
|
(30,345
|
)
|
||||
|
Net income (loss) per share attributable to common stockholders:
|
|||||||||||||||||||
|
Basic
|
$
|
(0.51
|
)
|
$
|
(0.33
|
)
|
$
|
0.04
|
|
$
|
0.09
|
|
$
|
(1.31
|
)
|
||||
|
Diluted
|
$
|
(0.51
|
)
|
$
|
(0.33
|
)
|
$
|
0.04
|
|
$
|
0.08
|
|
$
|
(1.31
|
)
|
||||
|
Weighted-average shares used to compute net income (loss) per share attributable to common stockholders:
|
|||||||||||||||||||
|
Basic
|
73,908,631
|
|
21,104,219
|
|
17,156,445
|
|
18,163,977
|
|
23,157,576
|
|
|||||||||
|
Diluted
|
73,908,631
|
|
21,104,219
|
|
27,622,357
|
|
28,095,486
|
|
23,157,576
|
|
|||||||||
|
Other comprehensive income (loss):
|
|||||||||||||||||||
|
Foreign currency translation adjustments
|
$
|
(830
|
)
|
$
|
807
|
|
$
|
(49
|
)
|
$
|
167
|
|
$
|
(43
|
)
|
||||
|
Unrealized loss on investments
|
(105
|
)
|
—
|
|
—
|
|
—
|
|
—
|
|
|||||||||
|
Provision for (benefit from) income taxes
|
—
|
|
26
|
|
(14
|
)
|
57
|
|
(15
|
)
|
|||||||||
|
Other comprehensive income (loss), net of tax
|
(935
|
)
|
781
|
|
(35
|
)
|
110
|
|
(28
|
)
|
|||||||||
|
Comprehensive income (loss)
|
$
|
(38,283
|
)
|
$
|
(5,903
|
)
|
$
|
4,768
|
|
$
|
9,940
|
|
$
|
(29,733
|
)
|
||||
See accompanying notes to consolidated financial statements
56
SERVICENOW, INC.
CONSOLIDATED STATEMENTS OF COMPREHENSIVE INCOME (LOSS) (continued)
(in thousands, except share and per share data)
|
(1)
|
Includes stock-based compensation as follows:
|
|
|
Year Ended December 31,
|
Six Months Ended December 31,
|
Fiscal Years Ended June 30,
|
||||||||||||||||
|
|
2012
|
2011
|
2010
|
2011
|
2010
|
||||||||||||||
|
|
(Unaudited)
|
||||||||||||||||||
|
Cost of revenues:
|
|||||||||||||||||||
|
Subscription
|
$
|
3,929
|
|
$
|
674
|
|
$
|
225
|
|
$
|
548
|
|
$
|
48
|
|
||||
|
Professional services and other
|
1,574
|
|
193
|
|
37
|
|
117
|
|
28
|
|
|||||||||
|
Sales and marketing
|
10,189
|
|
2,010
|
|
431
|
|
1,004
|
|
277
|
|
|||||||||
|
Research and development
|
6,496
|
|
704
|
|
207
|
|
468
|
|
90
|
|
|||||||||
|
General and administrative
|
5,749
|
|
2,056
|
|
221
|
|
817
|
|
102
|
|
|||||||||
See accompanying notes to consolidated financial statements
57
SERVICENOW, INC.
CONSOLIDATED STATEMENTS OF CHANGES IN CONVERTIBLE PREFERRED STOCK AND STOCKHOLDERS’ EQUITY (DEFICIT)
(in thousands, except share data)
|
|
Series C
Redeemable
Convertible
Preferred Stock
|
Series A
Redeemable
Convertible
Preferred Stock
|
Series B
Redeemable
Convertible
Preferred Stock
|
Series D
Convertible
Preferred Stock
|
Common Stock
|
Additional
Paid-in
Capital
|
Accumulated
Deficit
|
Accumulated
Other
Comprehensive
Income (Loss)
|
Total
Stockholders’
Equity
(Deficit)
|
||||||||||||||||||||||||||||||||||||||||||
|
|
Shares
|
Amount
|
Shares
|
Amount
|
Shares
|
Amount
|
Shares
|
Amount
|
Shares
|
Amount
|
|||||||||||||||||||||||||||||||||||||||||
|
Balance at June 30, 2009
|
983,606
|
|
$
|
5,911
|
|
2,500,000
|
|
$
|
3,298
|
|
3,988,636
|
|
$
|
6,133
|
|
—
|
|
$
|
—
|
|
32,966,984
|
|
$
|
33
|
|
$
|
—
|
|
$
|
(21,759
|
)
|
$
|
36
|
|
$
|
(21,690
|
)
|
||||||||||||||
|
Stock option exercises
|
—
|
|
$
|
—
|
|
—
|
|
$
|
—
|
|
—
|
|
$
|
—
|
|
—
|
|
$
|
—
|
|
7,036,768
|
|
$
|
7
|
|
$
|
234
|
|
$
|
—
|
|
$
|
—
|
|
$
|
241
|
|
||||||||||||||
|
Buyback and retirement of common stock
|
—
|
|
—
|
|
—
|
|
—
|
|
—
|
|
—
|
|
—
|
|
—
|
|
(23,510,264
|
)
|
(24
|
)
|
(779
|
)
|
(19,182
|
)
|
—
|
|
(19,985
|
)
|
|||||||||||||||||||||||
|
Issuance of series D convertible preferred stock, net of issuance costs
|
—
|
|
—
|
|
—
|
|
—
|
|
—
|
|
—
|
|
2,990,635
|
|
51,245
|
|
—
|
|
—
|
|
—
|
|
—
|
|
—
|
|
—
|
|
|||||||||||||||||||||||
|
Stock-based compensation
|
—
|
|
—
|
|
—
|
|
—
|
|
—
|
|
—
|
|
—
|
|
—
|
|
—
|
|
—
|
|
545
|
|
—
|
|
—
|
|
545
|
|
|||||||||||||||||||||||
|
Accretion of preferred stock dividends and issuance costs
|
—
|
|
19
|
|
—
|
|
206
|
|
—
|
|
415
|
|
—
|
|
—
|
|
—
|
|
—
|
|
—
|
|
(640
|
)
|
—
|
|
(640
|
)
|
|||||||||||||||||||||||
|
Other comprehensive loss
|
—
|
|
—
|
|
—
|
|
—
|
|
—
|
|
—
|
|
—
|
|
—
|
|
—
|
|
—
|
|
—
|
|
—
|
|
(28
|
)
|
(28
|
)
|
|||||||||||||||||||||||
|
Net loss
|
—
|
|
—
|
|
—
|
|
—
|
|
—
|
|
—
|
|
—
|
|
—
|
|
—
|
|
—
|
|
—
|
|
(29,705
|
)
|
—
|
|
(29,705
|
)
|
|||||||||||||||||||||||
|
Balance at June 30, 2010
|
983,606
|
|
$
|
5,930
|
|
2,500,000
|
|
$
|
3,504
|
|
3,988,636
|
|
$
|
6,548
|
|
2,990,635
|
|
$
|
51,245
|
|
16,493,488
|
|
$
|
16
|
|
$
|
—
|
|
$
|
(71,286
|
)
|
$
|
8
|
|
$
|
(71,262
|
)
|
||||||||||||||
|
Stock option exercises
|
—
|
|
—
|
|
—
|
|
—
|
|
—
|
|
—
|
|
—
|
|
—
|
|
4,279,456
|
|
5
|
|
441
|
|
—
|
|
—
|
|
446
|
|
|||||||||||||||||||||||
|
Tax benefit from exercise of nonqualified stock options
|
—
|
|
—
|
|
—
|
|
—
|
|
—
|
|
—
|
|
—
|
|
—
|
|
—
|
|
—
|
|
138
|
|
—
|
|
—
|
|
138
|
|
|||||||||||||||||||||||
|
Vesting of early exercised stock options
|
—
|
|
—
|
|
—
|
|
—
|
|
—
|
|
—
|
|
—
|
|
—
|
|
—
|
|
—
|
|
36
|
|
—
|
|
—
|
|
36
|
|
|||||||||||||||||||||||
|
Stock-based compensation
|
—
|
|
—
|
|
—
|
|
—
|
|
—
|
|
—
|
|
—
|
|
—
|
|
—
|
|
—
|
|
2,954
|
|
—
|
|
—
|
|
2,954
|
|
|||||||||||||||||||||||
|
Accretion of preferred stock dividends and issuance costs
|
—
|
|
18
|
|
—
|
|
200
|
|
—
|
|
415
|
|
—
|
|
—
|
|
—
|
|
—
|
|
(633
|
)
|
—
|
|
—
|
|
(633
|
)
|
|||||||||||||||||||||||
|
Other comprehensive income
|
—
|
|
—
|
|
—
|
|
—
|
|
—
|
|
—
|
|
—
|
|
—
|
|
—
|
|
—
|
|
—
|
|
—
|
|
110
|
|
110
|
|
|||||||||||||||||||||||
|
Net income
|
—
|
|
—
|
|
—
|
|
—
|
|
—
|
|
—
|
|
—
|
|
—
|
|
—
|
|
—
|
|
—
|
|
9,830
|
|
—
|
|
9,830
|
|
|||||||||||||||||||||||
|
Balance at June 30, 2011
|
983,606
|
|
$
|
5,948
|
|
2,500,000
|
|
$
|
3,704
|
|
3,988,636
|
|
$
|
6,963
|
|
2,990,635
|
|
$
|
51,245
|
|
20,772,944
|
|
$
|
21
|
|
$
|
2,936
|
|
$
|
(61,456
|
)
|
$
|
118
|
|
$
|
(58,381
|
)
|
||||||||||||||
58
SERVICENOW, INC.
CONSOLIDATED STATEMENTS OF CHANGES IN CONVERTIBLE PREFERRED STOCK AND STOCKHOLDERS’ EQUITY (DEFICIT)
(in thousands, except share data)
|
|
Series C
Redeemable
Convertible
Preferred Stock
|
Series A
Redeemable
Convertible
Preferred Stock
|
Series B
Redeemable
Convertible
Preferred Stock
|
Series D
Convertible
Preferred Stock
|
Common Stock
|
Additional
Paid-in
Capital
|
Accumulated
Deficit
|
Accumulated
Other
Comprehensive
Income (Loss)
|
Total
Stockholders’
Equity
(Deficit)
|
||||||||||||||||||||||||||||||||||||||||||
|
|
Shares
|
Amount
|
Shares
|
Amount
|
Shares
|
Amount
|
Shares
|
Amount
|
Shares
|
Amount
|
|||||||||||||||||||||||||||||||||||||||||
|
Stock option exercises
|
—
|
|
$
|
—
|
|
—
|
|
$
|
—
|
|
—
|
|
$
|
—
|
|
—
|
|
$
|
—
|
|
1,469,118
|
|
$
|
1
|
|
$
|
1,283
|
|
$
|
—
|
|
$
|
—
|
|
$
|
1,284
|
|
||||||||||||||
|
Tax benefit from exercise of nonqualified stock options
|
—
|
|
—
|
|
—
|
|
—
|
|
—
|
|
—
|
|
—
|
|
—
|
|
—
|
|
—
|
|
41
|
|
—
|
|
—
|
|
41
|
|
|||||||||||||||||||||||
|
Vesting of early exercised stock options
|
—
|
|
—
|
|
—
|
|
—
|
|
—
|
|
—
|
|
—
|
|
—
|
|
—
|
|
—
|
|
208
|
|
—
|
|
—
|
|
208
|
|
|||||||||||||||||||||||
|
Buyback of restricted common stock
|
—
|
|
—
|
|
—
|
|
—
|
|
—
|
|
—
|
|
—
|
|
—
|
|
(12,084
|
)
|
—
|
|
—
|
|
—
|
|
—
|
|
—
|
|
|||||||||||||||||||||||
|
Stock-based compensation
|
—
|
|
—
|
|
—
|
|
—
|
|
—
|
|
—
|
|
—
|
|
—
|
|
—
|
|
—
|
|
5,637
|
|
—
|
|
—
|
|
5,637
|
|
|||||||||||||||||||||||
|
Accretion of preferred stock dividends and issuance costs
|
—
|
|
9
|
|
—
|
|
101
|
|
—
|
|
202
|
|
—
|
|
—
|
|
—
|
|
—
|
|
(312
|
)
|
—
|
|
—
|
|
(312
|
)
|
|||||||||||||||||||||||
|
Other comprehensive income
|
—
|
|
—
|
|
—
|
|
—
|
|
—
|
|
—
|
|
—
|
|
—
|
|
—
|
|
—
|
|
—
|
|
—
|
|
781
|
|
781
|
|
|||||||||||||||||||||||
|
Net loss
|
—
|
|
—
|
|
—
|
|
—
|
|
—
|
|
—
|
|
—
|
|
—
|
|
—
|
|
—
|
|
—
|
|
(6,684
|
)
|
—
|
|
(6,684
|
)
|
|||||||||||||||||||||||
|
Balance at December 31, 2011
|
983,606
|
|
$
|
5,957
|
|
2,500,000
|
|
$
|
3,805
|
|
3,988,636
|
|
$
|
7,165
|
|
2,990,635
|
|
$
|
51,245
|
|
22,229,978
|
|
$
|
22
|
|
$
|
9,793
|
|
$
|
(68,140
|
)
|
$
|
899
|
|
$
|
(57,426
|
)
|
||||||||||||||
59
SERVICENOW, INC.
CONSOLIDATED STATEMENTS OF CHANGES IN CONVERTIBLE PREFERRED STOCK AND STOCKHOLDERS’ EQUITY (DEFICIT)
(in thousands, except share data)
|
|
Series C
Redeemable
Convertible
Preferred Stock
|
Series A
Redeemable
Convertible
Preferred Stock
|
Series B
Redeemable
Convertible
Preferred Stock
|
Series D
Convertible
Preferred Stock
|
Common Stock
|
Additional
Paid-in
Capital
|
Accumulated
Deficit
|
Accumulated
Other
Comprehensive
Income (Loss)
|
Total
Stockholders’
Equity
(Deficit)
|
||||||||||||||||||||||||||||||||||||||||||
|
|
Shares
|
Amount
|
Shares
|
Amount
|
Shares
|
Amount
|
Shares
|
Amount
|
Shares
|
Amount
|
|||||||||||||||||||||||||||||||||||||||||
|
Issuance of common stock upon initial public offering, net of offering costs
|
—
|
|
—
|
|
—
|
|
—
|
|
—
|
|
—
|
|
—
|
|
—
|
|
10,350,000
|
|
10
|
|
169,774
|
|
—
|
|
—
|
|
169,784
|
|
|||||||||||||||||||||||
|
Conversion of preferred stock to common stock upon initial public offering
|
(983,606
|
)
|
(5,966
|
)
|
(2,500,000
|
)
|
(3,905
|
)
|
(3,988,636
|
)
|
(7,364
|
)
|
(2,990,635
|
)
|
(51,245
|
)
|
83,703,016
|
|
84
|
|
68,396
|
|
—
|
|
—
|
|
68,480
|
|
|||||||||||||||||||||||
|
Issuance of common stock upon follow-on offering, net of issuance costs
|
—
|
|
—
|
|
—
|
|
—
|
|
—
|
|
—
|
|
—
|
|
—
|
|
1,897,500
|
|
2
|
|
49,848
|
|
—
|
|
—
|
|
49,850
|
|
|||||||||||||||||||||||
|
Stock option exercises
|
—
|
|
—
|
|
—
|
|
—
|
|
—
|
|
—
|
|
—
|
|
—
|
|
6,654,558
|
|
6
|
|
4,047
|
|
—
|
|
—
|
|
4,053
|
|
|||||||||||||||||||||||
|
Issuance of common stock to third party investors, net of issuance costs
|
—
|
|
—
|
|
—
|
|
—
|
|
—
|
|
—
|
|
—
|
|
—
|
|
1,750,980
|
|
2
|
|
17,846
|
|
—
|
|
—
|
|
17,848
|
|
|||||||||||||||||||||||
|
Tax benefit from exercise of nonqualified stock options
|
—
|
|
—
|
|
—
|
|
—
|
|
—
|
|
—
|
|
—
|
|
—
|
|
—
|
|
—
|
|
1,694
|
|
—
|
|
—
|
|
1,694
|
|
|||||||||||||||||||||||
|
Vesting of early exercised stock options
|
—
|
|
—
|
|
—
|
|
—
|
|
—
|
|
—
|
|
—
|
|
—
|
|
—
|
|
—
|
|
1,606
|
|
—
|
|
—
|
|
1,606
|
|
|||||||||||||||||||||||
|
Buyback of restricted common stock
|
—
|
|
—
|
|
—
|
|
—
|
|
—
|
|
—
|
|
—
|
|
—
|
|
(34,168
|
)
|
—
|
|
—
|
|
—
|
|
—
|
|
—
|
|
|||||||||||||||||||||||
|
Buyback and retirement of common stock
|
—
|
|
—
|
|
—
|
|
—
|
|
—
|
|
—
|
|
—
|
|
—
|
|
(184,164
|
)
|
—
|
|
(1,960
|
)
|
—
|
|
—
|
|
(1,960
|
)
|
|||||||||||||||||||||||
|
Stock-based compensation
|
—
|
|
—
|
|
—
|
|
—
|
|
—
|
|
—
|
|
—
|
|
—
|
|
—
|
|
—
|
|
28,067
|
|
—
|
|
—
|
|
28,067
|
|
|||||||||||||||||||||||
|
Accretion of preferred stock dividends and issuance costs
|
—
|
|
9
|
|
—
|
|
100
|
|
—
|
|
199
|
|
—
|
|
—
|
|
—
|
|
—
|
|
(308
|
)
|
—
|
|
—
|
|
(308
|
)
|
|||||||||||||||||||||||
|
Other comprehensive loss
|
—
|
|
—
|
|
—
|
|
—
|
|
—
|
|
—
|
|
—
|
|
—
|
|
—
|
|
—
|
|
—
|
|
—
|
|
(935
|
)
|
(935
|
)
|
|||||||||||||||||||||||
|
Net loss
|
—
|
|
—
|
|
—
|
|
—
|
|
—
|
|
—
|
|
—
|
|
—
|
|
—
|
|
—
|
|
—
|
|
(37,348
|
)
|
—
|
|
(37,348
|
)
|
|||||||||||||||||||||||
|
Balance at December 31, 2012
|
—
|
|
$
|
—
|
|
—
|
|
$
|
—
|
|
—
|
|
$
|
—
|
|
—
|
|
$
|
—
|
|
126,367,700
|
|
$
|
126
|
|
$
|
348,803
|
|
$
|
(105,488
|
)
|
$
|
(36
|
)
|
$
|
243,405
|
|
||||||||||||||
See accompanying notes to consolidated financial statements
60
SERVICENOW, INC.
(in thousands)
|
|
Year Ended December 31,
|
Six Months Ended December 31,
|
Fiscal Years Ended June 30,
|
||||||||||||||||
|
|
2012
|
2011
|
2010
|
2011
|
2010
|
||||||||||||||
|
|
(Unaudited)
|
||||||||||||||||||
|
Cash flows from operating activities:
|
|||||||||||||||||||
|
Net income (loss)
|
$
|
(37,348
|
)
|
$
|
(6,684
|
)
|
$
|
4,803
|
|
$
|
9,830
|
|
$
|
(29,705
|
)
|
||||
|
Adjustments to reconcile net income (loss) to net cash provided by (used in) operating activities:
|
|||||||||||||||||||
|
Depreciation and amortization
|
13,506
|
|
2,045
|
|
502
|
|
1,472
|
|
369
|
|
|||||||||
|
Amortization of premiums on short-term investments, net
|
1,337
|
|
—
|
|
—
|
|
—
|
|
—
|
|
|||||||||
|
Amortization of deferred commissions
|
13,710
|
|
3,492
|
|
1,642
|
|
4,023
|
|
2,189
|
|
|||||||||
|
Stock-based compensation
|
27,937
|
|
5,637
|
|
1,121
|
|
2,954
|
|
545
|
|
|||||||||
|
Tax benefit from exercise of stock options
|
(1,694
|
)
|
(41
|
)
|
(117
|
)
|
(138
|
)
|
—
|
|
|||||||||
|
Deferred tax assets
|
(746
|
)
|
—
|
|
—
|
|
—
|
|
—
|
|
|||||||||
|
Expense for preferred stock warrants
|
—
|
|
—
|
|
—
|
|
—
|
|
702
|
|
|||||||||
|
Bad debt expense
|
384
|
|
—
|
|
—
|
|
—
|
|
64
|
|
|||||||||
|
(Gain) loss on disposal of property and equipment
|
(1
|
)
|
72
|
|
—
|
|
60
|
|
—
|
|
|||||||||
|
Lease abandonment costs
|
2,467
|
|
—
|
|
—
|
|
—
|
|
—
|
|
|||||||||
|
Changes in operating assets and liabilities:
|
|||||||||||||||||||
|
Accounts receivable
|
(33,341
|
)
|
(20,365
|
)
|
(7,631
|
)
|
(14,762
|
)
|
(5,176
|
)
|
|||||||||
|
Deferred commissions
|
(29,175
|
)
|
(8,313
|
)
|
(2,180
|
)
|
(5,568
|
)
|
(5,271
|
)
|
|||||||||
|
Prepaid expenses and other current assets
(1)
|
(2,537
|
)
|
(1,355
|
)
|
(560
|
)
|
(2,872
|
)
|
(4,851
|
)
|
|||||||||
|
Other assets
|
(367
|
)
|
(90
|
)
|
(88
|
)
|
(308
|
)
|
(91
|
)
|
|||||||||
|
Accounts payable
|
4,887
|
|
1,490
|
|
(845
|
)
|
254
|
|
912
|
|
|||||||||
|
Accrued expenses and other current liabilities
|
22,948
|
|
6,921
|
|
1,569
|
|
5,438
|
|
8,901
|
|
|||||||||
|
Deferred rent
|
(2,227
|
)
|
(151
|
)
|
(57
|
)
|
3,179
|
|
(85
|
)
|
|||||||||
|
Deferred revenue
|
64,845
|
|
29,990
|
|
12,557
|
|
33,915
|
|
23,953
|
|
|||||||||
|
Other long-term liabilities
|
4,181
|
|
572
|
|
(5
|
)
|
(9
|
)
|
12
|
|
|||||||||
|
Net cash provided by (used in) operating activities
|
48,766
|
|
13,220
|
|
10,711
|
|
37,468
|
|
(7,532
|
)
|
|||||||||
|
Cash flows from investing activities:
|
|||||||||||||||||||
|
Purchases of property and equipment
|
(42,066
|
)
|
(7,959
|
)
|
(2,057
|
)
|
(8,733
|
)
|
(1,584
|
)
|
|||||||||
|
Purchases of short-term investments
|
(240,626
|
)
|
—
|
|
—
|
|
—
|
|
—
|
|
|||||||||
|
Sale of short-term investments
|
1,025
|
|
—
|
|
—
|
|
—
|
|
—
|
|
|||||||||
|
Maturities of short-term investments
|
42,473
|
|
—
|
|
—
|
|
—
|
|
—
|
|
|||||||||
|
Restricted cash
|
45
|
|
—
|
|
200
|
|
350
|
|
129
|
|
|||||||||
|
Net cash used in investing activities
|
(239,149
|
)
|
(7,959
|
)
|
(1,857
|
)
|
(8,383
|
)
|
(1,455
|
)
|
|||||||||
|
Cash flows from financing activities:
|
|||||||||||||||||||
|
Net proceeds from initial public offering
|
169,784
|
|
—
|
|
—
|
|
—
|
|
—
|
|
|||||||||
|
Net proceeds from follow-on offering
|
50,561
|
|
—
|
|
—
|
|
—
|
|
—
|
|
|||||||||
|
Proceeds from exercise of stock options
|
2,963
|
|
1,284
|
|
105
|
|
446
|
|
241
|
|
|||||||||
|
Proceeds from early exercise of stock options
|
949
|
|
844
|
|
—
|
|
643
|
|
—
|
|
|||||||||
|
Tax benefit from exercise of stock options
|
1,694
|
|
41
|
|
117
|
|
138
|
|
—
|
|
|||||||||
|
Net proceeds from issuance of convertible preferred stock
|
—
|
|
—
|
|
—
|
|
—
|
|
51,245
|
|
|||||||||
|
Net proceeds from issuance of common stock
|
17,848
|
|
—
|
|
—
|
|
—
|
|
—
|
|
|||||||||
|
Purchases of common stock and restricted stock from stockholders
|
(1,960
|
)
|
(15
|
)
|
—
|
|
—
|
|
(20,814
|
)
|
|||||||||
|
Net cash provided by financing activities
|
241,839
|
|
2,154
|
|
222
|
|
1,227
|
|
30,672
|
|
|||||||||
|
Foreign currency effect on cash and cash equivalents
|
(555
|
)
|
820
|
|
(21
|
)
|
139
|
|
(71
|
)
|
|||||||||
|
Net increase in cash and cash equivalents
|
50,901
|
|
8,235
|
|
9,055
|
|
30,451
|
|
21,614
|
|
|||||||||
|
Cash at beginning of period
|
68,088
|
|
59,853
|
|
29,402
|
|
29,402
|
|
7,788
|
|
|||||||||
|
Cash and cash equivalents at end of period
|
$
|
118,989
|
|
$
|
68,088
|
|
$
|
38,457
|
|
$
|
59,853
|
|
$
|
29,402
|
|
||||
|
Supplemental disclosures of other cash flow information:
|
|||||||||||||||||||
|
Interest paid
|
$
|
3
|
|
$
|
—
|
|
$
|
1
|
|
$
|
5
|
|
$
|
10
|
|
||||
|
Taxes paid
|
1,524
|
|
360
|
|
—
|
|
1,403
|
|
4
|
|
|||||||||
|
Non-cash investing and financing activities:
|
|||||||||||||||||||
|
Conversion of preferred stock to common stock
|
$
|
68,480
|
|
$
|
—
|
|
$
|
—
|
|
$
|
—
|
|
$
|
—
|
|
||||
|
Property and equipment included in accounts payable and accrued expenses
|
1,234
|
|
6,296
|
|
369
|
|
756
|
|
196
|
|
|||||||||
|
Property and equipment acquired under capital leases
|
—
|
|
—
|
|
—
|
|
—
|
|
25
|
|
|||||||||
|
Exercise of stock options included in prepaid and other assets
|
1,089
|
|
—
|
|
—
|
|
—
|
|
—
|
|
|||||||||
|
Vesting of early exercised stock options
|
1,606
|
|
208
|
|
—
|
|
36
|
|
—
|
|
|||||||||
|
Accretion of preferred stock dividends and issuance costs
|
308
|
|
312
|
|
320
|
|
633
|
|
640
|
|
|||||||||
|
Offering costs not yet paid
|
711
|
|
—
|
|
—
|
|
—
|
|
—
|
|
|||||||||
|
(1)
|
Includes $5.3 million payment received from our founder during the
year ended
December 31, 2012
. Refer to Note 16.
|
See accompanying notes to consolidated financial statements
61
SERVICENOW, INC.
NOTES TO CONSOLIDATED FINANCIAL STATEMENTS
(1) Description of the Business
ServiceNow is a leading provider of cloud-based services to automate enterprise IT operations. We focus on transforming enterprise IT by automating and standardizing business processes and consolidating IT across the global enterprise. Organizations deploy our service to create a single system of record for enterprise IT, lower operational costs and enhance efficiency. Additionally, our customers use our extensible platform to build custom applications for automating activities unique to their business requirements.
We were incorporated as Glidesoft, Inc. in California in June 2004 and changed our name to Service-now.com in February 2006. In May 2012, we reincorporated into Delaware as ServiceNow, Inc. We reincorporated in Delaware as ServiceNow, Inc. in May 2012.
(2) Summary of Significant Accounting Policies
Principles of Consolidation
The consolidated financial statements have been prepared in conformity with U.S. generally accepted accounting principles, or GAAP, and include our accounts and the accounts of our wholly-owned subsidiaries. All significant intercompany transactions and balances have been eliminated upon consolidation.
Fiscal Year Change
On February 3, 2012, our board of directors approved a change to our fiscal year end from June 30 to December 31. Included in this report is the transition period for the six months ended
December 31, 2011
. Accordingly, we included the unaudited consolidated statements of comprehensive income (loss) and cash flows for the six months ended
December 31, 2010
for comparative purposes. In the opinion of management, the unaudited consolidated financial information reflects all adjustments, consisting of normal and recurring adjustments, necessary for the fair statement of the results of our operations and our cash flows for the six months ended
December 31, 2010
. References to fiscal
2011
and
2010
still refer to the fiscal years ended
June 30, 2011
and
2010
, respectively.
Use of Estimates
The preparation of consolidated financial statements in conformity with GAAP requires management to make certain estimates and assumptions. These estimates and assumptions affect the reported amounts of assets and liabilities and disclosure of contingent assets and liabilities at the date of the consolidated financial statements, as well as reported amounts of revenues and expenses during the reporting period. Actual results could differ from those estimates. Items subject to the use of estimates include revenue recognition, allowance for trade accounts receivable, reserves for service level credits, useful lives of fixed assets, certain accrued liabilities including our facility exit obligation, the determination of the provision for income taxes, the fair value of stock awards and loss contingencies.
Segments
We define the term “chief operating decision maker” to be our Chief Executive Officer. Our Chief Executive Officer reviews the financial information presented on a consolidated basis, accompanied by disaggregated information about revenue by geographic region for purposes of allocating resources and evaluating of financial performance. Accordingly, we have determined that we operate in a single reporting segment, enterprise IT operations management.
Foreign Currency Translation
The functional currencies for our foreign subsidiaries are their local currencies. Assets and liabilities of the wholly-owned foreign subsidiaries are translated into U.S. dollars at exchange rates in effect at each period end. Amounts classified in stockholders’ equity (deficit) are translated at historical exchange rates. Revenues and expenses are translated at the average exchange rates during the period. The resulting translation adjustments are recorded in accumulated other comprehensive income (loss) as a component of stockholders’ equity (deficit). Foreign currency transaction gains and losses are included in interest and other income (expense), net within the consolidated statements of comprehensive income (loss).
Allocation of Overhead Costs
62
Overhead associated with benefits, facilities, IT costs and noncloud-based infrastructure related depreciation is allocated to cost of revenues and operating expenses based on headcount. Depreciation related to our cloud-based infrastructure are classified as cost of subscription revenues.
Revenue Recognition
We derive our revenues from two sources: (i) subscriptions and (ii) professional services and other. Subscription revenues are primarily comprised of fees which give customers access to our suite of on-demand applications, as well as access to our extensible platform to build custom applications. Our contracts typically do not give the customer the right to take possession of the software supporting the solution. Professional services and other revenues consist of fees associated with the implementation and configuration of our service. Professional services and other revenues also include customer training and attendance and sponsorship fees for Knowledge, our annual user conference.
We commence revenue recognition when all of the following conditions are met:
|
•
|
There is persuasive evidence of an arrangement;
|
|
•
|
The service has been provided to the customer;
|
|
•
|
The collection of related fees is reasonably assured; and
|
|
•
|
The amount of fees to be paid by the customer is fixed or determinable.
|
Signed agreements are used as evidence of an arrangement. If a signed contract by the customer does not exist, we have historically used either a purchase order or a signed order form as evidence of an arrangement. In cases where both a signed contract and either a purchase order or signed order form exist, we consider the signed contract to be the final persuasive evidence of an arrangement.
Subscription revenues are recognized ratably over the contract term beginning on the commencement date of each contract, which is the date we make our service available to our customers. Once our service is available to customers, amounts that have been invoiced are recorded in accounts receivable and in deferred revenue. Our professional services are priced either on a fixed-fee basis or on a time-and-materials basis. Professional services and other revenues are recognized as the services are delivered using a proportional performance model. Such services are delivered over a short period of time. In instances where final acceptance of the services are required before revenues are recognized, professional services revenues and the associated costs are deferred until all acceptance criteria have been met.
We assess collectibility based on a number of factors such as past collection history with the customer and creditworthiness of the customer. If we determine collectibility is not reasonably assured, we defer revenue recognition until collectibility becomes reasonably assured. We assess whether the fee is fixed or determinable based on the payment terms associated with the transaction and whether the sales price is subject to refund or adjustment. Our arrangements do not include general rights of return.
We have multiple element arrangements comprised of subscription fees and professional services. In October 2009, the Financial Accounting Standards Board, or FASB, ratified authoritative accounting guidance regarding revenue recognition for arrangements with multiple deliverables effective for fiscal periods beginning on or after June 15, 2010. The guidance affects the determination of separate units of accounting in arrangements with multiple deliverables and the allocation of transaction consideration to each of the identified units of accounting. Previously, a delivered item was considered a separate unit of accounting when (i) it had value to the customer on a stand-alone basis, (ii) there was objective and reliable evidence of the fair value of the undelivered items, and (iii) there was no general right of return relative to the delivered services or the performance of the undelivered services was probable and substantially controlled by the vendor. The new guidance eliminates the requirement for objective and reliable evidence of fair value to exist for the undelivered items in order for a delivered item to be treated as a separate unit of accounting. The guidance also requires arrangement consideration to be allocated at the inception of the arrangement to all deliverables using the relative-selling-price method and eliminates the use of the residual method of allocation. Under the relative-selling-price method, the selling price for each deliverable is determined using vendor-specific objective evidence, or VSOE, of selling price or third-party evidence, or TPE, of selling price if VSOE does not exist. If neither VSOE nor TPE of selling price exists for a deliverable, the guidance requires an entity to determine the best estimate of selling price, or BESP.
Prior to the adoption of this authoritative accounting guidance, we did not have objective and reliable evidence of fair value for the items in our multiple element arrangements. As a result, we accounted for subscription and professional services revenues as one unit of account and recognized total contracted revenues ratably over the contracted term of the subscription agreement.
63
We adopted the new guidance on a prospective basis for fiscal 2011. As a result, this guidance was applied to all revenue arrangements entered into or materially modified since July 1, 2010. The following table summarizes the effects of this new guidance on our consolidated balance sheets and statements of comprehensive income (loss) (in thousands):
|
|
As of and for the Fiscal Year Ended
June 30, 2011
|
||||||||||
|
|
As Reported
|
Under
Previous
Accounting
Guidance
|
Impact of
Adoption of
ASU 2009-13
|
||||||||
|
Total deferred revenue
|
$
|
74,646
|
|
$
|
81,036
|
|
$
|
(6,390
|
)
|
||
|
Revenues:
|
|||||||||||
|
Subscription
|
$
|
79,191
|
|
$
|
78,305
|
|
$
|
886
|
|
||
|
Professional services and other
|
13,450
|
|
7,946
|
|
5,504
|
|
|||||
|
Total revenues
|
$
|
92,641
|
|
$
|
86,251
|
|
$
|
6,390
|
|
||
Upon adoption of this authoritative accounting guidance, we have accounted for subscription and professional services revenues as separate units of accounting. To qualify as a separate unit of accounting, the delivered item must have value to the customer on a standalone basis. Our subscription service has standalone value as it is routinely sold separately by us, we provide customers access to our subscription service at the beginning of the contract term, and our on-demand application is fully functional without any additional development, modification or customization. In determining whether professional services have standalone value, we consider the following factors for each professional services agreement: availability of the services from other vendors, the nature of the professional services, the timing of when the professional services contract was signed in comparison to the subscription service start date and the contractual dependence of the subscription service on the customer’s satisfaction with the professional services work. Our professional services, including implementation and configuration services, are not so unique and complex that other vendors cannot provide them. In some instances, our customers independently contract with third-party vendors to do the implementation and we regularly outsource implementation services to contracted third-party vendors. As a result, we concluded professional services, including implementation and configuration services, also have standalone value.
We determine the selling price of each deliverable in the arrangement using the relative-selling price method based on the selling price hierarchy. The selling price for each unit of account is based on the BESP since VSOE and TPE are not available for our subscription service or professional services and other. The BESP for each deliverable is determined primarily by considering the historical selling price of these deliverables in similar transactions as well as other factors, including, but not limited to, market competition, review of stand-alone sales and pricing practices. The total arrangement fee for these multiple element arrangements is then allocated to the separate units of account based on the relative selling price. The method used to determine the BESP for our subscription service is consistent with the method used to determine prices for our services that are sold regularly on a standalone basis. In determining the appropriate pricing structure, we consider the extent of competitive pricing of similar products, marketing analyses and other feedback from analysts. We price our subscription service using a scaled model based on the duration of the subscription term and we frequently extend discounts to our customers based on the number of users. The BESP for our subscription service is based upon the historical selling price of these deliverables. Prior to December 2011, our professional services were priced on a fixed-fee basis as a percentage of the subscription fee. We also prepared a standard build-up cost analysis to estimate the fixed fee for our professional services based on the estimated level of effort to complete the professional services. If professional services were priced below the expected range due to discounting, fees allocated to professional services were limited to the amount not contingent upon the delivery of our subscription service. In December 2011, we began shifting our pricing model for professional services to a time-and-materials basis.
In limited circumstances, we grant certain customers the right to deploy our subscription service on the customers’ own servers without significant penalty. We have analyzed all of the elements in these particular multiple element arrangements and determined we do not have sufficient VSOE of fair value to allocate revenue to our subscription service and professional services. We defer all revenue under the arrangement until the commencement of the subscription service and any associated professional services. Once the subscription service and the associated professional services have commenced, the entire fee from the arrangement is recognized ratably over the remaining period of the arrangement.
Deferred Revenue
Deferred revenue consists primarily of payments received in advance of revenue recognition for our subscriptions and professional services and other revenues and is recognized as the revenue recognition criteria are met. We generally invoice our customers in annual installments for our subscription service. Accordingly, the deferred revenue balance does not represent the total contract value of annual or multi-year, non-cancelable subscription license agreements. Deferred revenue that will be
64
recognized during the succeeding
12
-month period is recorded as current portion of deferred revenue and the remaining portion is recorded as long-term.
Deferred Commissions
Deferred commissions are the incremental costs that are directly associated with our non-cancelable subscription contracts with customers and consist of sales commissions paid to our direct sales force and referral fees paid to independent third-parties. The commissions are deferred and amortized on a straight-line basis over the non-cancelable terms of the related customer contracts. Amortization of deferred commissions is included in sales and marketing expense in the consolidated statements of comprehensive income (loss).
Fair Value Measurements
We apply fair value accounting for all financial assets and liabilities and non-financial assets and liabilities that are recognized or disclosed at fair value in the financial statements on a recurring basis. Fair value is defined as the exchange price that would be received for an asset or paid to transfer a liability (an exit price) in the principal or most advantageous market for the asset or liability in an orderly transaction between market participants on the measurement date. We use a fair value hierarchy that is based on three levels of inputs, of which the first two are considered observable and the last unobservable. The three levels of the fair value hierarchy are as follows:
Level 1—Quoted prices (unadjusted) in active markets for identical assets or liabilities that we have the ability to access;
Level 2—Inputs other than Level 1 that are directly or indirectly observable, such as quoted prices for identical or similar assets and liabilities, quoted prices in markets that are not active, or other inputs that are observable or can be corroborated by observable market data for substantially the full term of the assets or liabilities, such as interest rates, yield curves and foreign currency spot rates; and
Level 3—Unobservable inputs that are supported by little or no market activity and that are significant to the fair value of the assets and liabilities.
Cash and Cash Equivalents
Cash and cash equivalents consist of highly liquid investments with original maturities of three months or less. Our cash and cash equivalents as of
December 31, 2012
primarily consist of investments in money market mutual funds and commercial paper. Cash and cash equivalents are stated at fair value.
Short-term Investments
Short-term investments consist of commercial paper, corporate notes and bonds and U.S. government agency securities. We classify short-term investments as available-for-sale at the time of purchase and reevaluate such classification as of each balance sheet date. All short-term investments are recorded at estimated fair value. Unrealized gains and losses for available-for-sale securities are in accumulated other comprehensive income (loss), a component of stockholders’ equity (deficit). We evaluate our investments to assess whether those with unrealized loss positions are other than temporarily impaired. We consider impairments to be other than temporary if they are related to deterioration in credit risk or if it is likely we will sell the securities before the recovery of their cost basis. Realized gains and losses and declines in value judged to be other than temporary are determined based on the specific identification method and are reported in interest and other income (expense), net in the consolidated statements of comprehensive income (loss).
Accounts Receivable
We record trade accounts receivable at the net invoice value and such receivables are non-interest bearing. We consider receivables past due based on the contractual payment terms. We review our exposure to accounts receivable and reserves for specific amounts if collectibility is no longer reasonably assured.
Property and Equipment
Property and equipment, net, are stated at cost, subject to review of impairment, and depreciated using the straight-line method over the estimated useful lives of the assets as follows:
65
|
Computer equipment and software
|
|
3—5 years
|
|
Furniture and fixtures
|
|
3—5 years
|
|
Leasehold improvements
|
|
shorter of the lease term or estimated useful life
|
When assets are sold, or otherwise disposed of, the cost and related accumulated depreciation are removed from the accounts and any gain or loss is included in operating expenses. Repairs and maintenance are charged to operations as incurred.
We establish assets and liabilities for the present value of estimated future costs to return certain of our leased facilities to their original condition. Such assets are depreciated over the lease period into operating expense, and the recorded liabilities are accreted to the future value of the estimated restoration costs. Recorded amounts are not material.
Long-Lived Assets
We assess the recoverability of long-lived assets whenever adverse events or changes in circumstances indicate impairment may have occurred. If the future undiscounted cash flows expected to result from the use of the related assets are less than the carrying value of such assets, an impairment is incurred and a loss is recognized to reduce the carrying value of the long-lived assets to fair value, which is determined by discounting estimated future cash flows.
In addition to the recoverability assessment, we routinely review the remaining estimated lives of our long-lived assets. During the six months ended
December 31, 2011
and December 31,
2010
(unaudited) and fiscal
2011
and
2010
, there was no change to useful lives and related depreciation expense as we believe these estimates are reflective of the period the assets will be used in operations. During the
year ended
December 31, 2012
, we reassessed the useful lives of our assets located in our managed service data centers and accelerated depreciation expense based on the decision to exit these data centers by December 31, 2012. During the
year ended
December 31, 2012
, we recognized an additional
$1.7 million
in depreciation expense due to our decision to accelerate the useful lives on the related assets. The impact to earnings per share from the acceleration is
$(0.02)
per share.
Capitalized Software Costs
Costs incurred to develop our internal administration, finance and accounting systems are capitalized during the application development stage and amortized over the software’s estimated useful life of
five years
.
No
software development costs were capitalized during the six months ended
December 31, 2011
and
2010
(unaudited) and fiscal
2011
and
2010
. We capitalized
$4.5 million
in software development costs during the
year ended
December 31, 2012
.
Leases
Leases are reviewed and classified as capital or operating at their inception. For leases that contain rent escalations or periods during the lease term where rent is not required, we recognize rent expense based on allocating the total rent payable on a straight-line basis over the term of the lease excluding lease extension periods. The difference between rent payments and straight-line rent expense is recorded as deferred rent in the consolidated balance sheets. Deferred rent that will be recognized during the succeeding
12
-month period is recorded as the current portion of deferred rent and the remainder is recorded as long-term deferred rent.
Under certain leases, we also receive incentives for leasehold improvements, which are recognized as deferred rent, if we determine they are owned by us, and amortized on a straight-line basis over the shorter of the lease term or estimated useful life as a reduction to rent expense. The leasehold improvements are included in property and equipment, net.
During the
year ended
December 31, 2012
, we relocated our San Diego office to another facility in San Diego. As part of this move, we incurred
$2.5 million
in lease abandonment costs, which primarily consists of a loss on disposal of assets recorded upon vacating our prior headquarters facility in August 2012. As of
December 31, 2012
, we recorded a corresponding facility exit obligation of
$2.3 million
, of which
$1.3 million
is classified as current and included in accrued liabilities on the consolidated balance sheet and the remaining
$1.0 million
is recorded as other long-term liabilities. The lease on our prior headquarter facility does not expire until 2019. The cease-use loss was calculated as the present value of the remaining lease obligation offset by estimated sublease rental receipts during the remaining lease period, adjusted for deferred items and estimated lease incentives. The key assumptions used in our discounted cash flow model include the amount and timing of estimated sublease rental receipts, and a credit-adjusted, risk-free discount rate of
5.08%
. Over the course of the remaining lease term of the former facility, we will record additional lease abandonment costs due to the accretion on the facility exit obligation and adjustments that may arise from
66
changes in estimates for the sublease rental receipts. The lease abandonment costs are included in general and administrative expense on our consolidated statement of comprehensive income (loss).
Preferred Stock Warrants Liability
In connection with a line of credit with a financial institution, we issued warrants that allowed the holder to exercise the warrants into a fixed number of shares (subject to antidilution adjustments) of series B redeemable convertible preferred stock. These warrants provided for the issuance of shares that were redeemable at the option of the holder, therefore, the warrants were classified as a liability and initially measured at fair value. A corresponding offsetting debt discount was recorded and amortized as additional interest expense over the
12
-month term of the associated line of credit which has since matured. We remeasured the warrants at subsequent reporting periods with the change in fair value reflected as interest and other income (expense), net in the consolidated statements of comprehensive income (loss). We continued to remeasure the warrants to fair value until they were net settled during fiscal 2010.
Convertible Preferred Stock
Prior to the close of our initial public offering, we had shares of series A redeemable convertible preferred stock (Series A), series B redeemable convertible preferred stock (Series B), series C redeemable convertible preferred stock (Series C) and series D convertible preferred stock (Series D) outstanding, which hereafter are collectively referred to as our “convertible preferred stock.” Series A, Series B and Series C included a contingent and optional redemption provision that may have required us to redeem the preferred shares. Additionally, the convertible preferred stock included certain redemption provisions upon liquidation. The holders of our convertible preferred stock, acting as a group, would have been able to elect the majority of our board of directors and control the outcome of any vote of our stockholders, including a change-in-control that would have triggered liquidation. As redemption of our convertible preferred stock was outside of our control, all shares of our convertible preferred stock were presented outside of stockholders’ equity (deficit) in our consolidated balance sheets and consolidated statements of changes in convertible preferred stock and stockholders’ equity (deficit) immediately prior to the conversion into common stock.
Upon the closing of our initial public offering on July 5, 2012, all of the outstanding
10,462,877
shares of convertible preferred stock converted into an aggregate of
83,703,016
shares of common stock.
Stock-based and Other Compensation
We recognize compensation expense related to stock options and restricted stock units, or RSUs, on a straight-line basis over the requisite service period, which is generally the vesting term of
four years
. We recognize compensation expense related to shares issued pursuant to the employee stock purchase plan, or ESPP, on a straight-line basis over the offering period, which is generally six months. Compensation expense is recognized, net of forfeiture activity, estimated to be
4%
annually. The fair value of awards is estimated using the Black-Scholes options pricing model. Refer to Note 13 for further information.
During fiscal
2010
, additional compensation expense was recorded as our employees and our founder sold shares of common stock back to us as part of the Series C and Series D financings. The transactions resulted in a premium paid to our employees and our founder in excess of fair value of
$30.8 million
reflected as employee compensation for fiscal
2010
. There were
no
similar material charges for the
year ended
December 31, 2012
, the six months ended
December 31, 2011
and
2010
(unaudited) or fiscal
2011
.
Net Income (Loss) Per Share Attributable to Common Stockholders
We compute net income (loss) attributable to common stockholders using the two-class method required for participating securities. We consider our convertible preferred stock that was outstanding prior to the close of our initial public offering and shares of common stock subject to repurchase resulting from the early exercise of stock options to be participating securities since they contain nonforfeitable rights to dividends or dividend equivalents in the event we declare a dividend for common stock. In accordance with the two-class method, earnings allocated to these participating securities, are subtracted from net income after deducting preferred stock dividends and accretion to the redemption value of the Series A, Series B and Series C to determine total undistributed earnings to be allocated to common stockholders. The holders of our convertible preferred stock did not have a contractual obligation to share in our net losses and such shares were excluded from the computation of basic earnings per share in periods of net loss.
Basic net income (loss) per share attributable to common stockholders is computed by dividing net income (loss) attributable to common stockholders by the weighted-average number of common shares outstanding during the period. All participating securities are excluded from basic weighted-average common shares outstanding. In computing diluted net income (loss) attributable to common stockholders, undistributed earnings are reallocated to reflect the potential impact of dilutive securities. Diluted net income (loss) per share is computed by dividing net income (loss) attributable to common stockholders by the weighted-
67
average number of shares of common stock outstanding during the period, adjusted for the effects of potentially dilutive common shares, which are comprised of outstanding common stock options, warrants, convertible preferred stock, RSUs, common stock subject to repurchase and ESPP obligations. The dilutive potential common shares are computed using the treasury stock method or the as-if converted method, as applicable. In periods where the effect of the conversion of preferred stock is dilutive, net income (loss) attributable to common stockholders is adjusted by the associated preferred dividends and accretions. The effects of outstanding common stock options, warrants, convertible preferred stock, RSUs, common stock subject to repurchase and ESPP obligations are excluded from the computation of diluted net income (loss) per common share in periods in which the effect would be antidilutive.
Concentration of Credit Risk and Significant Customers
Financial instruments potentially exposing us to credit risk consist primarily of cash equivalents, restricted cash, short-term investments and accounts receivable. We maintain cash, cash equivalents and short-term investments at financial institutions that management believes to have good credit ratings and represent minimal risk of loss of principal.
Credit risk arising from accounts receivable is mitigated due to our large number of customers and their dispersion across various industries. At
December 31, 2012
and
2011
, there were
no
customers that represented more than
10%
of our accounts receivable balance. During the
year ended
December 31, 2012
, the six months ended
December 31, 2011
and
2010
(unaudited) and fiscal
2011
and
2010
, there were
no
customers that individually exceeded
10%
of our revenues.
We review the composition of the accounts receivable balance, historical write-off experience and the potential risk of loss associated with delinquent accounts to determine if an allowance for doubtful accounts is necessary. Individual accounts receivable are written off when we become aware of a specific customer’s inability to meet its financial obligation, and all collection efforts are exhausted. As of
December 31, 2011
, there was no allowance for doubtful accounts as historical write-offs had not been significant. The following table presents the changes in the allowance for doubtful accounts (in thousands):
|
Balance at January 1, 2012
|
$
|
—
|
|
|
Additions: Charged to operations
|
570
|
|
|
|
Additions: Charged to Deferred Revenue
|
172
|
|
|
|
Less: Write-offs
|
—
|
|
|
|
Balance at December 31, 2012
|
$
|
742
|
|
Warranties and Indemnification
Our cloud-based service to automate enterprise IT operations is typically warranted to perform in a manner consistent with general industry standards that are reasonably applicable and materially in accordance with our online help documentation under normal use and circumstances.
We include service level commitments to our customers warranting certain levels of uptime reliability and performance and permitting those customers to receive credits in the event we fail to meet those levels. An accrual is established based on historical credits paid and an evaluation of the performance of our platform. Prior to the year ended December 31, 2012, we had not incurred significant costs as a result of such commitments and had not recorded any liabilities related to such obligations in the consolidated financial statements. Service level credit accrual charges are recorded against revenue. The following table presents the changes in the service level credit accrual (in thousands):
|
Balance at January 1, 2012
|
$
|
250
|
|
|
Additions: Charged against revenue
|
1,574
|
|
|
|
Less: Usage
|
628
|
|
|
|
Balance at December 31, 2012
|
$
|
1,196
|
|
We have also agreed to indemnify our directors and executive officers for costs associated with any fees, expenses, judgments, fines and settlement amounts incurred by any of these persons in any action or proceeding to which any of those persons is, or is threatened to be, made a party by reason of the person’s service as a director or officer, including any action by us, arising out of that person’s services as a director or officer of our company or that person’s services provided to any other company or enterprise at our request. We maintain director and officer insurance coverage that may enable us to recover a portion of any future amounts paid. The fair values of these obligations are not material as of each balance sheet date.
68
Our arrangements include provisions indemnifying customers against liabilities if our products infringe a third-party’s intellectual property rights. We have not incurred any costs as a result of such indemnifications and have not recorded any liabilities related to such obligations in the consolidated financial statements.
Income Taxes
We use the asset and liability method of accounting for income taxes in which deferred tax assets and liabilities are recognized for the future tax consequences attributable to differences between the consolidated financial statement carrying amounts of existing assets and liabilities and their respective tax bases. Deferred tax assets and liabilities are measured using enacted tax rates expected to apply to taxable income in the years in which those temporary differences are expected to be reversed. The effect on deferred tax assets and liabilities of a change in tax rates is recognized as income in the period that includes the enactment date. A valuation allowance is established if it is more likely than not that all or a portion of the deferred tax asset will not be realized.
Our tax positions are subject to income tax audits by multiple tax jurisdictions throughout the world. We recognize the tax benefit of an uncertain tax position only if it is more likely than not the position is sustainable upon examination by the taxing authority, based on the technical merits. The tax benefit recognized is measured as the largest amount of benefit which is more likely than not to be realized upon settlement with the taxing authority. We recognize interest accrued and penalties related to unrecognized tax benefits in our tax provision.
We calculate the current and deferred income tax provision based on estimates and assumptions that could differ from the actual results reflected in income tax returns filed in subsequent years. Adjustments based on filed income tax returns are recorded when identified. The amount of income taxes paid is subject to examination by U.S. federal, state and foreign tax authorities. The estimate of the potential outcome of any uncertain tax issue is subject to management’s assessment of relevant risks, facts and circumstances existing at that time. To the extent the assessment of such tax position changes, the change in estimate is recorded in the period in which the determination is made.
Recent Accounting Pronouncements
In February 2013, the FASB issued new disclosure guidance related to the presentation of the Statement of Comprehensive Income. This guidance requires the disclosure of the effect of significant amounts reclassified from each component of accumulated other comprehensive income based on its source and the income statement line items affected by the reclassification. We will adopt this accounting standard update upon its effective date for periods beginning on or after December 15, 2012, and this adoption will not have any impact on our financial position or results of operations.
(3) Investments
During the
year ended
December 31, 2012
, we purchased commercial paper, corporate notes and bonds and U.S. government agency securities, all with maturities of less than
twelve months
. We had no investments as of
December 31, 2011
. The following is a summary of our investments (in thousands):
|
|
December 31, 2012
|
||||||||||||||
|
|
Amortized
Cost
|
Gross
Unrealized
Gains
|
Gross
Unrealized
Losses
|
Estimated
Fair Value
|
|||||||||||
|
Available-for-sale securities:
|
|||||||||||||||
|
Commercial paper
|
$
|
72,850
|
|
$
|
—
|
|
$
|
(15
|
)
|
$
|
72,835
|
|
|||
|
Corporate notes and bonds
|
158,038
|
|
8
|
|
(98
|
)
|
157,948
|
|
|||||||
|
U.S. government agency securities
|
1,001
|
|
—
|
|
—
|
|
1,001
|
|
|||||||
|
Total available-for-sale securities
|
$
|
231,889
|
|
$
|
8
|
|
$
|
(113
|
)
|
$
|
231,784
|
|
|||
As of
December 31, 2012
, we had certain available-for-sale securities in a gross unrealized loss position, all of which had been in such position for less than
twelve months
. There was
no
impairments considered other-than-temporary as it is more likely than not we will hold the securities until maturity or a recovery of the cost basis. The following table shows the fair values and the gross unrealized losses of these available-for-sale securities aggregated by investment category (in thousands):
69
|
|
December 31, 2012
|
||||||
|
|
Fair Value
|
Gross Unrealized
Losses
|
|||||
|
Commercial paper
|
$
|
36,753
|
|
$
|
(15
|
)
|
|
|
Corporate notes and bonds
|
137,558
|
|
(98
|
)
|
|||
|
Total
|
$
|
174,311
|
|
$
|
(113
|
)
|
|
Realized gains and losses are determined based on the specific identification method and are reported in interest and other income (expense), net in our consolidated statements of comprehensive income (loss). For the
year ended
December 31, 2012
, gross realized gains and losses on sales of our available-for-sale securities were immaterial.
(4) Prepaid Expenses and Other Current Assets
Prepaid expenses and other current assets consist of the following (in thousands):
|
|
December 31,
|
||||||
|
|
2012
|
2011
|
|||||
|
Founder’s receivable
|
$
|
—
|
|
$
|
5,267
|
|
|
|
Other receivables
|
6,317
|
|
305
|
|
|||
|
Other
|
7,279
|
|
4,311
|
|
|||
|
Total prepaid expenses and other current assets
|
$
|
13,596
|
|
$
|
9,883
|
|
|
Refer to Note 16 for further information regarding our founder’s receivable.
5) Property and Equipment
Property and equipment, net consists of the following (in thousands):
|
|
December 31,
|
||||||
|
|
2012
|
2011
|
|||||
|
Computer equipment and software
|
$
|
46,541
|
|
$
|
16,586
|
|
|
|
Furniture and fixtures
|
4,691
|
|
1,755
|
|
|||
|
Leasehold improvements
|
2,649
|
|
2,795
|
|
|||
|
Construction in progress
|
4,855
|
|
3,740
|
|
|||
|
58,736
|
|
24,876
|
|
||||
|
Less: accumulated depreciation
|
(16,394
|
)
|
(4,181
|
)
|
|||
|
Total property and equipment, net
|
$
|
42,342
|
|
$
|
20,695
|
|
|
Construction in progress consists primarily of leasehold improvements and servers, networking equipment and storage infrastructure being provisioned in our new third-party data center hosting facilities. Depreciation expense for the
year ended
December 31, 2012
was
$13.5 million
, the six months ended
December 31, 2011
and
December 31, 2010
(unaudited) was
$2.0 million
and
$0.5 million
, respectively, and
fiscal 2011
and
fiscal 2010
was
$1.5 million
and
$0.4 million
, respectively.
(6) Accrued Expenses and Other Current Liabilities
Accrued expenses and other current liabilities consist of the following (in thousands):
70
|
|
December 31,
|
||||||
|
|
2012
|
2011
|
|||||
|
Taxes payable
|
$
|
1,941
|
|
$
|
7,399
|
|
|
|
Bonuses and commissions
|
10,999
|
|
6,080
|
|
|||
|
Accrued compensation
|
18,392
|
|
3,570
|
|
|||
|
Accrued third-party professional services
|
951
|
|
1,919
|
|
|||
|
Other employee expenses
|
7,796
|
|
1,809
|
|
|||
|
Current portion of facility exit obligation
|
1,515
|
|
—
|
|
|||
|
Other
|
6,448
|
|
4,831
|
|
|||
|
Total accrued expenses and other current liabilities
|
$
|
48,042
|
|
$
|
25,608
|
|
|
Refer to Notes 15 and 16 for further information regarding taxes payable.
(7) Accumulated Other Comprehensive Income (Loss)
The components of accumulated other comprehensive income (loss), net of tax, consist of the following (in thousands):
|
|
December 31,
|
||||||
|
|
2012
|
2011
|
|||||
|
Foreign currency translation adjustment
|
$
|
69
|
|
$
|
899
|
|
|
|
Net unrealized loss on investments
|
(105
|
)
|
—
|
|
|||
|
Accumulated other comprehensive income (loss)
|
$
|
(36
|
)
|
$
|
899
|
|
|
(8) Warrants for the Purchase of Series B Redeemable Convertible Preferred Stock
In June 2006 and 2007, we issued warrants exercisable for
19,943
and
31,909
shares of Series B, respectively, with an exercise price of
$1.25
per share. The warrants were fully exercisable and each had a term of
seven years
from the date of issuance. The fair values of the warrants were determined on the date of issuance and subsequently using the Black-Scholes options pricing model until they were net settled during fiscal 2010. The assumptions used to determine the fair value of the warrants as of June 30, 2009 were as follows: estimated volatility of
70%
, expected term of
4.61
years, risk-free interest rate of
2.37%
, and expected dividend yield of
zero
. The weighted-average fair value of the warrants on the date of issuance was approximately
$3.01
per share.
(9) Fair Value Measurements
The following table presents our fair value hierarchy for our assets and liabilities measured at fair value on a recurring basis at
December 31, 2012
(in thousands):
|
Level 1
|
Level 2
|
Level 3
|
Total
|
||||||||||||
|
Cash equivalents:
|
|||||||||||||||
|
Money market funds
|
$
|
35,429
|
|
$
|
—
|
|
$
|
—
|
|
$
|
35,429
|
|
|||
|
Commercial paper
|
—
|
|
36,082
|
|
—
|
|
36,082
|
|
|||||||
|
Short-term investments:
|
|||||||||||||||
|
Commercial paper
|
—
|
|
36,753
|
|
—
|
|
36,753
|
|
|||||||
|
Corporate notes and bonds
|
—
|
|
157,948
|
|
—
|
|
157,948
|
|
|||||||
|
U.S. government agency securities
|
—
|
|
1,001
|
|
—
|
|
1,001
|
|
|||||||
|
Total
|
$
|
35,429
|
|
$
|
231,784
|
|
$
|
—
|
|
$
|
267,213
|
|
|||
We determine the fair value of our security holdings based on pricing from our service provider. The service provider values the securities based on “consensus pricing,” using market prices from a variety of industry-standard independent data providers. Such market prices may be quoted prices in active markets for identical assets (Level 1 inputs) or pricing determined using inputs other than quoted prices that are observable either directly or indirectly (Level 2 inputs), such as yield curve, volatility factors,
71
credit spreads, default rates, loss severity, current market and contractual prices for the underlying instruments or debt, broker and dealer quotes, as well as other relevant economic measures.
Our Level 3 financial liabilities consisted of long-term liabilities related to warrants issued for the purchase of preferred stock that were net settled during fiscal 2010. Measurement of fair values for the warrants is made utilizing the Black-Scholes options pricing model. The inputs used in determining the fair values are discussed in detail in Note 8. Level 3 activity is as follows (in thousands):
|
|
Level 3
|
||
|
Balance at June 30, 2009
|
$
|
128
|
|
|
Interest and other income (expense), net for change in fair value of preferred stock warrants
|
702
|
|
|
|
Net settlement of preferred stock warrant liability
|
(830
|
)
|
|
|
Balance at June 30, 2010
|
$
|
—
|
|
(10) Convertible Preferred Stock
On November 20, 2009, we entered into a Series D Preferred Stock Purchase Agreement with a new stockholder. The new stockholder purchased
2,990,635
shares of Series D at a price of
$17.27
per share, for gross proceeds of
$51.6 million
. Concurrent with the sale and issuance of Series D preferred stock, we repurchased and subsequently cancelled
23,510,264
shares of common stock from eligible stockholders, including
16,480,000
shares of common stock from our founder, at a price of
$2.16
per share. We also offered to repurchase
51,852
vested warrants from a financial institution for
$17.27
per share, less the strike price of
$1.25
per warrant. Gross proceeds from this transaction to our stockholders and warrant holders were
$51.6 million
. Eligible stockholders consist of all former and current employees whose employment commenced on or prior to November 1, 2009 and had vested shares as of December 2, 2009. Current employees were required to retain a minimum of
30%
of their vested shares, while former employees could sell
100%
of their shares.
At the time we repurchased the common stock and warrants, the estimated fair value of our common stock was
$0.85
per share. The difference between the fair value and the price paid resulted in a premium paid to repurchase the common stock of approximately
$30.8 million
, of which
$0.7 million
,
$2.0 million
,
$3.6 million
and
$24.5 million
are reflected in cost of revenues, sales and marketing expenses, research and development expenses, and general and administrative expenses in the consolidated statement of comprehensive income (loss) for fiscal 2010, respectively. Additionally, the difference between the fair value and the price paid for the warrants resulted in a premium of
$0.3 million
reflected in interest and other income (expense), net in the consolidated statement of comprehensive income (loss) for fiscal 2010.
The following table summarizes Convertible Preferred Stock authorized and issued as of December 31, 2011 (dollars in thousands):
|
Date of Issuance
|
Shares Authorized
|
Shares Issued and Outstanding
|
Aggregate Liquidation Preference
|
||||||
|
Series C
|
983,606
|
|
983,606
|
|
$
|
6,000
|
|
||
|
Series A
|
2,500,000
|
|
2,500,000
|
|
3,805
|
||||
|
Series B
|
4,040,488
|
|
3,988,636
|
|
7,165
|
||||
|
Series D
|
3,830,379
|
|
2,990,635
|
|
51,640
|
||||
|
11,354,473
|
|
10,462,877
|
|
$
|
68,610
|
|
|||
Upon the closing of our initial public offering, all of the outstanding
10,462,877
shares of our convertible preferred stock automatically converted into an aggregate of
83,703,016
shares of common stock.
The rights, preferences and privileges of our convertible preferred stock were as follows:
Dividends
The holders of shares of the Series A and Series B were entitled to receive dividends of cash at the rate of
8%
of the original issue price per annum, payable when and if declared by our board of directors or in connection with a liquidation event. The right to receive dividends was cumulative. As of
December 31, 2012
and
2011
,
no
dividends were declared or paid.
Voting Rights
72
Each holder of convertible preferred stock was entitled to the number of votes equal to the number of whole shares of common stock into which the shares of convertible preferred stock held by such holder were then convertible.
Conversion
Each share of convertible preferred stock was convertible at any time at the option of the holder into
eight
shares of common stock (subject to customary adjustments to protect against dilution). In addition, each series of convertible preferred stock automatically converted into common stock upon the vote of the majority of the outstanding shares of such series and all series of convertible preferred stock automatically converted into common stock upon the closing of an IPO in which the cash proceeds, net of underwriting discounts and commissions, were at least
$50.0 million
.
Redemption
The Series A, Series B, and Series C had redemption provisions requiring us to redeem all of the then outstanding Series A, Series B, and Series C in
three
annual installments, beginning on a date no sooner than
five
years after November 25, 2009 if the holders of a majority of the Series A, the holders of a majority of the Series B, and the holders of a majority of the Series C all elect such a redemption. Upon redemption, the amount payable for each share of Series A, Series B and Series C shall be equal to the original issue price of such share plus, in the case of the Series A and Series B, an amount equal to
8%
of the original issue price per annum on such share calculated from the date of issue of the first share of Series A or Series B, as applicable.
Due to the redemption provisions, the Series A, Series B and Series C were classified outside of permanent equity as “mezzanine” at their original fair value on the date of issue, net of issuance costs. Subsequent accretion charges were recorded to increase the net amount of these shares to the redemption amount, including the additional
8%
per annum redemption amounts payable in respect of the Series A and Series B, at the earliest possible redemption date. The accretion charges were charged against additional paid-in capital as we did not have retained earnings, and to accumulated deficit once there was no additional paid-in capital available.
The combined aggregate amount of redemption requirements for all issuances of capital stock that were redeemable assuming exercise of redemption rights at the earliest possible date, was as follows as of
December 31, 2011
(in thousands):
|
Series A
|
Series B
|
Series C
|
Total
|
||||||||||||
|
Years Ended December 31,
|
|||||||||||||||
|
2012
|
$
|
—
|
|
$
|
—
|
|
$
|
—
|
|
$
|
—
|
|
|||
|
2013
|
—
|
|
—
|
|
—
|
|
—
|
|
|||||||
|
2014
|
216
|
|
410
|
|
2,000
|
|
2,626
|
|
|||||||
|
2015
|
2,263
|
|
4,304
|
|
2,000
|
|
8,567
|
|
|||||||
|
2016
|
2,107
|
|
4,013
|
|
2,000
|
|
8,120
|
|
|||||||
|
Total redemption requirements
|
$
|
4,586
|
|
$
|
8,727
|
|
$
|
6,000
|
|
$
|
19,313
|
|
|||
Liquidation Preference
Upon the liquidation, dissolution or winding up of our company, a consolidation or merger involving a change in control of our company or the conveyance of substantially all of our assets, the holders of Series C had a preference in liquidation over the Series A, Series B, Series D and common stockholders equal to the original issue price plus all declared and unpaid dividends. If our assets were insufficient to fulfill the Series C liquidation amount, the Series C stockholders would share in the distribution of the assets on a pro rata basis based on the full liquidation preference owed to each Series C stockholder.
After the payment in full of the liquidation preference of the Series C, the holders of the Series A and Series B had a preference in liquidation over the Series D and common stockholders equal to the original issue price plus all accrued or declared and unpaid dividends. If our assets were insufficient to fulfill the Series A and Series B liquidation amounts, the Series A and Series B stockholders would share in the distribution of the assets on a pari-passu, pro rata basis based on the full liquidation preference owed to each Series A and Series B stockholder.
After the payment in full of the liquidation preference of the Series C, Series A and Series B, the holders of the Series D had a preference in liquidation over the common stockholders equal to the original issue price plus all declared and unpaid dividends. If our assets were insufficient to fulfill the Series D liquidation amounts, the Series D stockholders would share in the distribution of the assets on a pro rata basis based on the full liquidation preference owed to each Series D stockholder.
73
After payment in full of the liquidation preference of the Series C, Series A, Series B and Series D, our assets that were legally available for distribution would be distributed ratably to the holders of common stock.
All preferred stock liquidation preferences were subject to appropriate adjustment in the event of any stock dividends, combinations, splits, recapitalizations and the like affecting such shares.
Due to the liquidation provisions of Series D, these shares were also classified outside of permanent equity as “mezzanine” at the redemption value as the deemed liquidation events and related timing were not solely within our control.
(11) Common Stock
The consolidated financial statements reflect
three
2
-for-1 stock splits of our common stock with no corresponding change in par value, approved by the board of directors and stockholders, effective July 30, 2010, May 13, 2011 and December 15, 2011. Share and per share amounts have been retroactively restated to reflect the stock splits for all periods presented.
Per the terms of the convertible preferred stock, each stock split results in a proportional adjustment to the conversion ratio and liquidation preference of each series of the convertible preferred stock. Upon the closing of our initial public offering on July 5, 2012, all of the outstanding
10,462,877
shares of convertible preferred stock converted into an aggregate of
83,703,016
shares of common stock.
We are authorized to issue
600,000,000
shares of common stock at
December 31, 2012
. Holders of our common stock are not entitled to receive dividends unless declared by our board of directors.
In February 2012, we issued and sold
1,750,980
shares of common stock at a price of
$10.20
per share for gross proceeds of
$17.9 million
in a private placement with a new stockholder. As part of this private placement, our founder sold
700,000
shares of common stock at the same price per share to this new stockholder.
In July 2012, we closed our initial public offering, IPO, of
13,397,500
shares of common stock at an offering price of
$18.00
per share. The offering included
10,350,000
shares sold and issued by us and
3,047,500
shares sold by our founder. The shares sold in the offering included
1,350,000
shares and
397,500
shares sold by us and our founder, respectively, pursuant to the underwriters’ full exercise of their overallotment option. The net proceeds to us from the offering were approximately
$173.3 million
after deducting underwriting discounts and commissions, and before deducting total estimated expenses in connection with the offering of
$3.5 million
.
In November 2012, we and the selling shareholders sold
16,100,000
shares of common stock at a price of
$28.00
per share, including the exercise in full by the underwriters of their overallotment option to purchase
2,100,000
shares of common stock. Of the
16,100,000
shares of common stock sold in the follow-on public offering,
1,897,500
shares were sold by us and
14,202,500
shares were sold by selling stockholders. The offering generated net proceeds to us of
$51.0 million
after deducting underwriting discounts and commissions, and before deducting total estimated expenses in connection with the offering of
$1.2 million
.
During the
year ended
December 31, 2012
, we repurchased and subsequently cancelled
100,000
shares,
77,498
shares and
6,666
shares of common stock at a price of
$10.00
,
$11.50
and
$12.00
per share, respectively.
As of
December 31, 2012
, we had
126,367,700
shares of common stock outstanding and had reserved shares of common stock for future issuance as follows:
|
|
December 31, 2012
|
|
|
Stock option plan:
|
||
|
Options outstanding
|
36,115,460
|
|
|
RSUs
|
1,457,870
|
|
|
Stock awards available for future grants:
|
||
|
2005 Stock Option Plan
(1)
|
—
|
|
|
2012 Equity Incentive Plan
(1)
|
11,377,630
|
|
|
2012 Employee Stock Purchase Plan
(1)
|
5,000,000
|
|
|
Total reserved shares of common stock for future issuance
|
53,950,960
|
|
|
(1)
|
Refer to Note 12 for a description of these plans.
|
74
(12) Stock Awards
We have a 2005 Stock Option Plan, or 2005 Stock Plan, which provides for grants of stock awards, including options to purchase shares of common stock, stock purchase rights and RSUs to certain employees, officers, directors and consultants. As of December 31, 2012, there were
55,592,864
total shares of common stock authorized for issuance under the 2005 Plan, which includes shares already issued under such plan and shares reserved for issuance pursuant to outstanding options and RSUs, and shares available for future issuance.
On April 27, 2012, the board of directors approved the 2012 Plan, and the 2012 Employee Stock Purchase Plan, or the 2012 ESPP, which became effective on June 27, 2012 and June 28, 2012, respectively.
The 2012 Plan provides for the grant of incentive stock options, nonqualified stock options, stock appreciation rights, restricted stock awards, RSUs, performance-based stock awards and other forms of equity compensation, or collectively, stock awards. In addition, the 2012 Plan provides for the grant of performance cash awards. Incentive stock options may be granted only to employees. All other awards may be granted to employees, including officers, as well as directors and consultants. As of
December 31, 2012
, there were
13,587,576
total shares of common stock authorized for issuance under the 2012 Plan. The number of shares of common stock reserved for issuance under the 2012 Plan will automatically increase on January 1 of each year, starting on January 1, 2013 and continuing through January 1, 2022, by up to
5%
of the total number of shares of the common stock outstanding on December 31 of the preceding calendar year as determined by the board of directors. The share reserve may increase to the extent that outstanding options under the 2005 Stock Plan expire or terminate unexercised.
The 2012 ESPP authorizes the issuance of shares of common stock pursuant to purchase rights granted to our employees. As of
December 31, 2012
, we had
5,000,000
total shares of common stock reserved for issuance under the 2012 ESPP. The number of shares of common stock reserved for issuance will automatically increase on January 1 of each calendar year, from January 1, 2013 through January 1, 2022, by up to
1%
of the total number of shares of the common stock outstanding on December 31 of the preceding calendar year.
Stock Options
The stock options are exercisable at a price equal to the market value of the underlying shares of common stock on the date of the grant as determined by our board of directors or, for those stock options issued subsequent to our IPO, the closing price of our common stock as reported on the New York Stock Exchange on the date of grant. Stock options granted under our 2005 Stock Plan and the 2012 Plan to new employees generally vest
25%
one year from the date the requisite service period begins and continue to vest monthly for each month of continued employment over the remaining
three years
. Options granted to members of our board of directors and to employees who have previously been granted options generally vest in
48
equal monthly installments. Options that were granted to members of our board of directors in June 2012 vest in
3
equal annual installments. Options granted generally are exercisable for a period of up to
10 years
. Option holders under the 2005 Stock Plan can exercise unvested options to acquire restricted stock. Upon termination of service, we have the right to repurchase at the original purchase price any unvested (but issued) shares of common stock. Shares of common stock purchased under our 2005 Stock Plan are subject to certain restrictions.
On September 9, 2011, we granted
275,808
stock options subject to performance-based vesting criteria to an executive. Vesting was contingent upon meeting certain board-approved financial performance targets over a period of
one year
ending on June 30, 2012. Upon conclusion of the measurement period, the executive achieved
98%
of his target, resulting in
243,744
stock options eligible to vest. These stock options vest over a period of
four years
with
25%
vesting
one
year from the date his requisite service period began and continue to vest monthly for each month of continued employment over the remaining
three years
. We recorded stock-based compensation expense of
$1.3 million
related to this grant for the
year ended
December 31, 2012
as part of sales and marketing expense on the consolidated statements of comprehensive income (loss). No expense was recognized in the six months ended
December 31, 2011
as achievement was not deemed probable during that period.
A summary of the stock option activity for the
year ended
December 31, 2012
, the six months ended
December 31, 2011
, fiscal
2011
and
2010
is as follows:
75
|
Number of
Shares
|
Weighted-
Average
Exercise
Price
|
Weighted-
Average
Remaining
Contractual
Term (Years)
|
Aggregate
Intrinsic Value
(in thousands)
|
|||||||||
|
Outstanding at June 30, 2009
|
19,164,000
|
|
$
|
0.07
|
|
|||||||
|
Granted
|
4,684,000
|
|
1.00
|
|||||||||
|
Exercised
|
(7,036,768
|
)
|
0.03
|
$
|
10,054
|
|
||||||
|
Forfeited
|
(290,248
|
)
|
0.41
|
|||||||||
|
Outstanding at June 30, 2010
|
16,520,984
|
|
0.34
|
|||||||||
|
Granted
|
15,402,456
|
|
2.15
|
|||||||||
|
Exercised
|
(4,279,456
|
)
|
0.25
|
$
|
7,489
|
|
||||||
|
Forfeited
|
(867,590
|
)
|
0.87
|
|||||||||
|
Cancelled
|
(450,000
|
)
|
0.18
|
|||||||||
|
Outstanding at June 30, 2011
|
26,326,394
|
|
1.40
|
|||||||||
|
Granted
|
17,055,120
|
|
3.29
|
|||||||||
|
Exercised
|
(1,469,118
|
)
|
1.45
|
$
|
2,380
|
|
||||||
|
Forfeited
|
(2,310,756
|
)
|
1.61
|
|||||||||
|
Outstanding at December 31, 2011
|
39,601,640
|
|
2.20
|
|||||||||
|
Granted
|
7,695,730
|
|
15.03
|
|||||||||
|
Exercised
|
(6,654,558
|
)
|
0.76
|
$
|
84,215
|
|
||||||
|
Forfeited
|
(4,187,185
|
)
|
3.47
|
|||||||||
|
Cancelled
|
(340,167
|
)
|
1.90
|
|||||||||
|
Outstanding at December 31, 2012
|
36,115,460
|
|
$
|
5.05
|
|
8.31
|
$
|
905,846
|
|
|||
|
Vested and expected to vest as of December 31, 2012
|
35,427,432
|
|
$
|
4.99
|
|
8.30
|
$
|
890,661
|
|
|||
|
Vested and exercisable as of December 31, 2012
|
13,155,248
|
|
$
|
2.11
|
|
7.57
|
$
|
367,353
|
|
|||
Aggregate intrinsic value represents the difference between the estimated fair value of our common stock and the exercise price of outstanding, in-the-money options. The weighted-average grant date per share fair value of options granted was
$7.68
,
$2.52
,
$1.16
and
$0.61
for the
year ended
December 31, 2012
, the six months ended
December 31, 2011
and for fiscal
2011
and
2010
, respectively. The total fair value of shares vested was
$19.2 million
,
$2.6 million
,
$2.0 million
and
$0.3 million
for the
year ended
December 31, 2012
, the six months ended
December 31, 2011
and for fiscal
2011
and
2010
, respectively.
As of
December 31, 2012
, total unrecognized compensation cost, adjusted for estimated forfeitures, related to unvested stock options was approximately
$76.0 million
. The weighted-average remaining vesting period of unvested stock options at
December 31, 2012
was
2.65 years
.
Under our 2005 Stock Plan, we issue shares of restricted stock as a result of the cash exercise of unvested stock options. The proceeds initially are recorded as a liability from the early exercise of stock options and reclassified to common stock as our repurchase right lapses. A summary of the restricted stock activity for the
year ended
December 31, 2012
, the six months ended
December 31, 2011
and fiscal
2011
is as follows:
76
|
Shares
Outstanding
|
Weighted-Average
Grant Date Fair Value
|
|||||
|
Balance at June 30, 2010
|
—
|
|
$
|
—
|
|
|
|
Early exercised
|
453,243
|
|
0.86
|
|
||
|
Vested
|
(37,755
|
)
|
0.58
|
|
||
|
Balance at June 30, 2011
|
415,488
|
|
0.89
|
|
||
|
Early exercised
|
360,852
|
|
1.29
|
|
||
|
Vested
|
(185,640
|
)
|
0.66
|
|
||
|
Repurchased
|
(12,084
|
)
|
0.74
|
|
||
|
Balance at December 31, 2011
|
578,616
|
|
1.21
|
|
||
|
Early exercised
|
263,970
|
|
2.38
|
|
||
|
Vested
|
(573,352
|
)
|
1.62
|
|
||
|
Repurchased
|
(34,168
|
)
|
1.42
|
|
||
|
Balance at December 31, 2012
|
235,066
|
|
1.49
|
|
||
RSUs
|
Number of
Shares
|
Weighted Average Grant Date Fair Value
|
Weighted-
Average
Remaining
Contractual
Term (Years)
|
Aggregate
Intrinsic Value
(in thousands)
|
|||||||||
|
Non-vested share units at December 31, 2011
|
—
|
|
$
|
—
|
|
|||||||
|
Granted
|
1,470,072
|
|
17.02
|
|
||||||||
|
Vested
|
—
|
|
—
|
|
$
|
—
|
|
|||||
|
Forfeited
|
(12,202
|
)
|
31.97
|
|
||||||||
|
Non-vested share units at December 31, 2012
|
1,457,870
|
|
$
|
16.89
|
|
9.40
|
$
|
43,780
|
|
|||
|
Expected to vest as of December 31, 2012
|
1,399,510
|
|
9.40
|
$
|
42,027
|
|
||||||
RSUs granted under the 2005 Stock Plan and the 2012 Plan to employees generally vest annually over a four-year period. As of
December 31, 2012
, total unrecognized compensation cost, adjusted for estimated forfeitures, related to unvested RSUs was approximately
$16.8 million
and the weighted-average remaining vesting period was
3.38 years
.
ESPP
The price at which common stock is purchased under the 2012 ESPP is equal to
85%
of the fair market value of the common stock on the first or last day of the offering period, whichever is lower. As the current offering period is June 28, 2012 through January 31, 2013,
no
shares were issued under the 2012 ESPP during the
year ended
December 31, 2012
.
(13) Stock-Based Compensation
We use the Black-Scholes options pricing model to estimate the fair value of our stock-based awards. This model incorporates various assumptions including expected volatility, expected term, risk-free interest rates and expected dividend yields. The following weighted-average assumptions were used for each respective period to calculate our stock-based compensation for each stock option grant:
77
|
|
Year Ended December 31,
|
Six Months Ended December 31,
|
Fiscal Year Ended June 30,
|
|||||||
|
|
2012
|
2011
|
2010
|
2011
|
2010
|
|||||
|
|
|
(Unaudited)
|
|
|
||||||
|
Stock Options:
|
||||||||||
|
Expected volatility
|
53% - 57%
|
56% - 69%
|
57% - 67%
|
50% - 69%
|
65
|
%
|
||||
|
Expected term (in years)
|
6.05
|
5.75
|
6.04
|
6.05
|
6.02
|
|
||||
|
Risk-free interest rate
|
0.83% - 1.18%
|
0% - 1.92%
|
1.43% - 2.06%
|
1.43% - 2.96%
|
2.57% - 3.04%
|
|
||||
|
Dividend yield
|
—
|
—
|
—
|
—
|
—
|
|
||||
The following weighted-average assumptions were used to calculate our stock-based compensation for each stock purchase right granted under the Employee Stock Purchase Plan (ESPP), which became effective on June 28, 2012:
|
|
Year Ended, December 31, 2012
|
|
|
|
||
|
ESPP:
|
||
|
Expected volatility
|
42
|
%
|
|
Expected term (in years)
|
0.58
|
|
|
Risk-free interest rate
|
0.16
|
%
|
|
Dividend yield
|
—
|
|
Expected volatility
. We use the historic volatility of publicly traded peer companies as an estimate for expected volatility. In considering peer companies, characteristics such as industry, stage of development, size and financial leverage are considered. We intend to continue to consistently apply this process using the same or similar public companies until a sufficient amount of historical information regarding the volatility of our own common stock share price becomes available.
Expected term
. We estimate the expected term using the simplified method due to the lack of historical exercise activity for our company. The simplified method calculates the expected term as the mid-point between the vesting date and the contractual expiration date of the award.
Risk-free interest rate
. The risk-free interest rate is based on the U.S. Treasury yield curve in effect at the time of grant for the expected term of the stock-based award.
Expected dividend yield
. Our expected dividend yield is zero, as we have not and do not currently intend to declare dividends in the foreseeable future.
Expected forfeiture rate
. We consider our pre-vesting forfeiture history to determine our expected forfeiture rate.
Fair value of common stock
. Prior to our initial public offering, the fair value of our common stock was determined by our board of directors, which intended all options granted to be exercisable at a price per share not less than the per share fair value of the common stock underlying those options on the date of grant. The valuations of our common stock were determined in accordance with the guidelines outlined in the
American Institute of Certified Public Accountants Practice Aid, Valuation of Privately-Held-Company Equity Securities Issued as Compensation
. The assumptions used in the valuation model are based on future expectations combined with management judgment.
Prior to March 2010, values for our shares of common stock were determined using an option pricing method. Estimates of the volatility were based on available information on the volatility of common stock of comparable, publicly traded companies. The common stock valuations were based on the discounted cash flow method, or DCF, under the income approach and the comparable company method and the recent transaction method under the market-based approach, which we used to estimate the total value of our company. The DCF method estimates enterprise value based on the estimated present value of future net cash flows the business is expected to generate over a forecasted period and an estimate of the present value of cash flows beyond that period, which is referred to as terminal value. The estimated present value is calculated using a discount rate known as the weighted-average cost of capital, which accounts for the time value of money and the appropriate degree of risks inherent in the business. The market-based approach considers multiples of financial metrics based on both acquisitions and trading multiples of a selected peer group of companies. These multiples are then applied to our financial metrics to derive a range of indicated values. If different estimates and assumptions had been used, the valuations could have been different.
78
From March 2010 until our initial public offering in June 2012, we utilized the probability weighted expected return method, or PWERM, approach to allocate value to our common shares. The PWERM approach employs various market approach and income approach calculations depending upon the likelihood of various liquidation scenarios. For each of the various scenarios, an equity value is estimated and the rights and preferences for each stockholder class are considered to allocate the equity value to common shares. The common share value is then multiplied by a discount factor reflecting the calculated discount rate and the timing of the event. Lastly, the common share value is multiplied by an estimated probability for each scenario. The probability and timing of each scenario was based upon discussions between our board of directors and our management team. Under the PWERM, the value of our common stock was based upon four possible future events for our company: an IPO; a strategic merger or sale; remaining a private company; and dissolution.
For stock options granted subsequent to our initial public offering, our board of directors determined the fair value based on the closing price of our common stock as reported on the New York Stock Exchange on the date of grant.
(14) Net Income (Loss) Per Share Attributable to Common Stockholders
The following tables present the calculation of basic and diluted net income (loss) per share attributable to common stockholders (in thousands, except share and per share data):
|
|
Year Ended December 31,
|
Six Months Ended December 31,
|
Fiscal Year Ended June 30,
|
||||||||||||||||
|
|
2012
|
2011
|
2010
|
2011
|
2010
|
||||||||||||||
|
|
|
(Unaudited)
|
|
|
|||||||||||||||
|
Numerator:
|
|||||||||||||||||||
|
Net income (loss)
|
$
|
(37,348
|
)
|
$
|
(6,684
|
)
|
$
|
4,803
|
|
$
|
9,830
|
|
$
|
(29,705
|
)
|
||||
|
Accretion of redeemable convertible preferred stock
|
(308
|
)
|
(312
|
)
|
(320
|
)
|
(633
|
)
|
(640
|
)
|
|||||||||
|
Net income attributable to participating securities
|
—
|
|
—
|
|
(3,721
|
)
|
(7,558
|
)
|
—
|
|
|||||||||
|
Net income (loss) attributable to common stockholders—basic
|
$
|
(37,656
|
)
|
$
|
(6,996
|
)
|
$
|
762
|
|
$
|
1,639
|
|
$
|
(30,345
|
)
|
||||
|
Undistributed earnings reallocated to participating securities
|
$
|
—
|
|
$
|
—
|
|
$
|
349
|
|
$
|
671
|
|
$
|
—
|
|
||||
|
Net income (loss) attributable to common stockholders— diluted
|
$
|
(37,656
|
)
|
$
|
(6,996
|
)
|
$
|
1,111
|
|
$
|
2,310
|
|
$
|
(30,345
|
)
|
||||
|
Denominator:
|
|||||||||||||||||||
|
Weighted-average shares outstanding Basic
|
73,908,631
|
|
21,104,219
|
|
17,156,445
|
|
18,163,977
|
|
23,157,576
|
|
|||||||||
|
Effect of potentially dilutive securities:
|
|||||||||||||||||||
|
Common stock options
|
—
|
|
—
|
|
10,465,912
|
|
9,931,509
|
|
—
|
|
|||||||||
|
Weighted-average shares outstanding Diluted
|
73,908,631
|
|
21,104,219
|
|
27,622,357
|
|
28,095,486
|
|
23,157,576
|
|
|||||||||
|
Net income (loss) per share attributable to common stockholders:
|
|||||||||||||||||||
|
Basic
|
$
|
(0.51
|
)
|
$
|
(0.33
|
)
|
$
|
0.04
|
|
$
|
0.09
|
|
$
|
(1.31
|
)
|
||||
|
Diluted
|
$
|
(0.51
|
)
|
$
|
(0.33
|
)
|
$
|
0.04
|
|
$
|
0.08
|
|
$
|
(1.31
|
)
|
||||
Potentially dilutive securities that are not included in the calculation of diluted net income (loss) per share because doing so would be antidilutive are as follows:
|
|
Year Ended December 31,
|
Six Months Ended December 31,
|
Fiscal Year Ended June 30,
|
|||||||||||
|
|
2012
|
2011
|
2010
|
2011
|
2010
|
|||||||||
|
|
|
(Unaudited)
|
|
|
||||||||||
|
Common stock options
|
36,115,460
|
|
39,601,640
|
|
7,890,844
|
|
7,635,190
|
|
16,520,984
|
|
||||
|
Convertible preferred stock
|
—
|
|
83,703,016
|
|
83,703,016
|
|
83,703,016
|
|
83,703,016
|
|
||||
|
Restricted stock units
|
1,457,870
|
|
—
|
|
—
|
|
—
|
|
—
|
|
||||
|
Common stock subject to repurchase
|
235,066
|
|
578,616
|
|
—
|
|
83,551
|
|
—
|
|
||||
|
ESPP obligations
|
435,945
|
|
—
|
|
—
|
|
—
|
|
—
|
|
||||
|
Total potentially dilutive securities
|
38,244,341
|
|
123,883,272
|
|
91,593,860
|
|
91,421,757
|
|
100,224,000
|
|
||||
79
(15) Income Taxes
The provision for income taxes consists of the following (in thousands):
|
|
Year Ended December 31,
|
Six Months Ended December 31,
|
Fiscal Year Ended June 30,
|
||||||||||||||||
|
|
2012
|
2011
|
2010
|
2011
|
2010
|
||||||||||||||
|
|
|
(Unaudited)
|
|
|
|||||||||||||||
|
Current provision:
|
|||||||||||||||||||
|
Federal
|
$
|
187
|
|
$
|
325
|
|
$
|
111
|
|
$
|
62
|
|
$
|
—
|
|
||||
|
State
|
200
|
|
396
|
|
449
|
|
988
|
|
2
|
|
|||||||||
|
Foreign
|
1,787
|
|
329
|
|
93
|
|
286
|
|
278
|
|
|||||||||
|
2,174
|
|
1,050
|
|
653
|
|
1,336
|
|
280
|
|
||||||||||
|
Deferred provision:
|
|||||||||||||||||||
|
Federal
|
(55
|
)
|
22
|
|
—
|
|
—
|
|
—
|
|
|||||||||
|
State
|
(5
|
)
|
3
|
|
—
|
|
—
|
|
—
|
|
|||||||||
|
Foreign
|
(746
|
)
|
—
|
|
—
|
|
—
|
|
—
|
|
|||||||||
|
(806
|
)
|
25
|
|
—
|
|
—
|
|
—
|
|
||||||||||
|
Provision for income taxes
|
$
|
1,368
|
|
$
|
1,075
|
|
$
|
653
|
|
$
|
1,336
|
|
$
|
280
|
|
||||
The components of income (loss) from continuing operations before income taxes by United States and foreign jurisdictions were as follows (in thousands):
|
|
Year Ended December 31,
|
Six Months Ended December 31,
|
Fiscal Year Ended June 30,
|
||||||||||||||||
|
|
2012
|
2011
|
2010
|
2011
|
2010
|
||||||||||||||
|
|
(Unaudited)
|
||||||||||||||||||
|
United States
|
$
|
(7,903
|
)
|
$
|
(1,375
|
)
|
$
|
5,368
|
|
$
|
10,585
|
|
$
|
(29,602
|
)
|
||||
|
Foreign
|
(28,077
|
)
|
(4,234
|
)
|
88
|
|
581
|
|
177
|
|
|||||||||
|
Total
|
$
|
(35,980
|
)
|
$
|
(5,609
|
)
|
$
|
5,456
|
|
$
|
11,166
|
|
$
|
(29,425
|
)
|
||||
The effective income tax rate differs from the federal statutory income tax rate applied to the income (loss) before provision for income taxes due to the following (in thousands):
|
|
Year Ended December 31,
|
Six Months Ended December 31,
|
Fiscal Year Ended June 30,
|
||||||||||||||||
|
|
2012
|
2011
|
2010
|
2011
|
2010
|
||||||||||||||
|
|
(Unaudited)
|
||||||||||||||||||
|
Tax computed at the federal statutory rate
|
$
|
(12,234
|
)
|
$
|
(1,907
|
)
|
$
|
1,857
|
|
$
|
3,799
|
|
$
|
(10,005
|
)
|
||||
|
State taxes, net of federal benefit
|
329
|
|
82
|
|
122
|
|
250
|
|
(359
|
)
|
|||||||||
|
Tax rate differential for international subsidiaries
(1)
|
10,743
|
|
1,589
|
|
(23
|
)
|
(47
|
)
|
(13
|
)
|
|||||||||
|
Stock-based compensation
|
3,926
|
|
978
|
|
244
|
|
727
|
|
149
|
|
|||||||||
|
Tax credits
|
(1,056
|
)
|
(378
|
)
|
(150
|
)
|
(409
|
)
|
(282
|
)
|
|||||||||
|
Tax contingencies
|
452
|
|
178
|
|
74
|
|
171
|
|
265
|
|
|||||||||
|
Permanent differences
|
532
|
|
244
|
|
120
|
|
305
|
|
411
|
|
|||||||||
|
Change in state rate
|
(68
|
)
|
8
|
|
295
|
|
662
|
|
(1,170
|
)
|
|||||||||
|
Other
|
(697
|
)
|
146
|
|
379
|
|
344
|
|
117
|
|
|||||||||
|
Valuation allowance
|
(559
|
)
|
135
|
|
(2,265
|
)
|
(4,466
|
)
|
11,167
|
|
|||||||||
|
Provision for income taxes
|
$
|
1,368
|
|
$
|
1,075
|
|
$
|
653
|
|
$
|
1,336
|
|
$
|
280
|
|
||||
80
|
(1)
|
The change in the impact of the tax rate differential for international jurisdictions is primarily attributable to a change in the mix of income/loss from the United States to international jurisdictions with different income tax rates compared to the United States.
|
Significant components of our deferred tax assets as of
December 31, 2012
and
2011
are shown below (in thousands). A valuation allowance has been recognized to offset our deferred tax assets, as necessary, by the amount of any tax benefits that, based on evidence, are not expected to be realized.
|
|
December 31,
|
||||||
|
|
2012
|
2011
|
|||||
|
Deferred tax assets:
|
|||||||
|
Net operating losses
|
$
|
2,647
|
|
$
|
4,182
|
|
|
|
Deferred revenue
|
2,421
|
|
8,434
|
|
|||
|
Accrued expenses
|
1,357
|
|
700
|
|
|||
|
Deferred rent
|
322
|
|
201
|
|
|||
|
Credit carryforwards
|
2,342
|
|
1,357
|
|
|||
|
Incentive from lessor
|
46
|
|
1,023
|
|
|||
|
Facility exit obligation
|
1,102
|
|
—
|
|
|||
|
Depreciation
|
304
|
|
—
|
|
|||
|
Stock-based compensation
|
7,474
|
|
1,333
|
|
|||
|
Other
|
1,017
|
|
1,130
|
|
|||
|
Total deferred tax assets
|
19,032
|
|
18,360
|
|
|||
|
Less valuation allowance
|
(13,270
|
)
|
(13,829
|
)
|
|||
|
5,762
|
|
4,531
|
|
||||
|
Deferred tax liabilities:
|
|||||||
|
Depreciation
|
(5,016
|
)
|
(4,531
|
)
|
|||
|
Net deferred tax assets
|
$
|
746
|
|
$
|
—
|
|
|
As of
December 31, 2012
, we had U.S. federal net operating losses and federal tax credit carryforwards of approximately
$30.0 million
and
$0.9 million
, respectively. The federal net operating loss carryforwards and federal tax credits will begin to expire in
2024
if not utilized. In addition, we had state net operating losses and state tax credit carryforwards of approximately
$42.0 million
and
$1.0 million
, respectively. The state net operating loss and tax credit carryforwards will begin to expire in
2018
if not utilized. Utilization of our net operating loss and credit carryforwards may be subject to annual limitation due to the ownership change limitations provided by the Internal Revenue Code and similar state provisions. Such an annual limitation could result in the expiration of the net operating loss and tax credit carry forwards before utilization.
Approximately
$27.9 million
of federal net operating losses and
$8.6 million
of state net operating losses relate to stock-based compensation deductions in excess of book expense, the tax effect of which would be to credit additional paid-in capital, if realized.
We have maintained a valuation allowance against our U.S. deferred tax assets as of
December 31, 2012
. Due to a loss over recent years and based on all available evidence, we have determined that it is more likely than not that net deferred tax assets in the U.S. will not be realized with the exception of
$0.7 million
related to foreign deferred tax assets. The valuation allowance decreased
$0.6 million
for the
year ended
December 31, 2012
, increased
$0.1 million
and decreased
$2.2 million
for the six months ended December 31, 2011 and 2010 (unaudited), respectively, and decreased
$4.5 million
and increased
$11.2 million
for fiscal 2011 and 2010, respectively.
We have not recorded a provision for deferred U.S. tax expense that could result from the remittance of foreign undistributed earnings since we intend to reinvest the earnings of these foreign subsidiaries indefinitely.
Our share of the undistributed earnings of foreign corporations not included in our consolidated federal income tax returns that could be subject to additional U.S. income tax if remitted was approximately
$0.3 million
and
$0.8 million
as of
December 31, 2012
and
2011
, respectively. The determination of the amount of unrecognized U.S federal deferred income tax liability for undistributed earnings is not practicable.
A reconciliation of the beginning and ending balance of total unrecognized tax benefits is as follows (in thousands):
81
|
|
Year Ended December 31,
|
Six Months Ended December 31,
|
Fiscal Year Ended June 30,
|
||||||||||||||||
|
|
2012
|
2011
|
2010
|
2011
|
2010
|
||||||||||||||
|
|
(Unaudited)
|
||||||||||||||||||
|
Beginning balance
|
$
|
710
|
|
$
|
519
|
|
$
|
374
|
|
$
|
374
|
|
$
|
185
|
|
||||
|
Gross increases - tax positions in prior period
|
827
|
|
—
|
|
—
|
|
—
|
|
—
|
|
|||||||||
|
Gross decreases - tax positions in prior period
|
(65
|
)
|
—
|
|
—
|
|
—
|
|
—
|
|
|||||||||
|
Gross increases - tax positions in current period
|
264
|
|
191
|
|
73
|
|
145
|
|
189
|
|
|||||||||
|
Lapse of statute of limitations
|
(11
|
)
|
—
|
|
—
|
|
—
|
|
—
|
|
|||||||||
|
Ending balance
|
$
|
1,725
|
|
$
|
710
|
|
$
|
447
|
|
$
|
519
|
|
$
|
374
|
|
||||
As of
December 31, 2012
, we had gross unrecognized tax benefits of approximately
$1.7 million
, of which
$0.9 million
would impact the effective tax rate, if recognized. We recognize potential accrued interest and penalties related to unrecognized tax benefits as income tax expense. Accrued interest and penalties included in our liability related to unrecognized tax benefits at
December 31, 2012
and
2011
were
$0.4 million
and
$0.3 million
, respectively. The amount of unrecognized tax benefits could be reduced upon expiration of the applicable statutes of limitations. The potential reduction in unrecognized tax benefits during the next twelve months is not expected to be material. Interest and penalties accrued on these uncertain tax positions will be released upon the expiration of the statutes of limitations and these amounts are also not material.
We are subject to taxation in the United States and various state and foreign jurisdictions. As of
December 31, 2012
, our tax years 2005 to 2012 remain subject to examination in most jurisdictions.
(16) Related Party Transactions
In connection with the sale and issuance of our Series D preferred stock, we repurchased and subsequently cancelled
23,510,264
shares of common stock from eligible stockholders, including a total of
18,436,000
shares from our founder and his family, and our former chief financial officer.
As part of our sale of Series C and Series D preferred stock, we recorded a liability of
$5.3 million
for withholding taxes associated with the repurchase of our founder’s shares plus potential interest and penalties that may be imposed by the tax authorities. We recorded an offsetting receivable of
$5.3 million
in prepaid expenses and other current assets at
December 31, 2011
and
June 30, 2011
and
2010
and representing the total amount that was subsequently paid to us by our founder in February 2012 for these withholding taxes. In April 2012, we paid
$5.3 million
to the tax authorities for these withholding taxes.
(17) Commitments and Contingencies
Leases
We lease managed and co-location facilities for data center capacity and office space under noncancellable operating lease agreements with various expiration dates. Our data centers are located in the United States, the Netherlands, the United Kingdom, Switzerland, Canada, and Australia. Expenses at our co-location facilities consist primarily of space, power, cooling and ancillary services. Our managed facilities include the same expenses as co-location facilities as well as expenses related to leases of equipment, such as servers, networking equipment, and storage infrastructure. Rent expense associated with these facilities, included in cost of revenues, was
$13.3 million
for the
year ended
December 31, 2012
,
$3.7 million
and
$2.1 million
for the
six months ended
December 31, 2011
and
2010
(unaudited), respectively, and
$4.8 million
and
$2.7 million
for
fiscal 2011
and
fiscal 2010
, respectively.
Our principal office is located in San Diego, California and we lease office space in the United States, the United Kingdom, Germany, Australia, the Netherlands, Canada, Denmark, France, Sweden and Israel. Rent expense associated with these leases was
$4.5 million
for the
year ended
December 31, 2012
,
$1.2 million
and
$0.5 million
for the
six months ended
December 31, 2011
and
2010
(unaudited), respectively, and
$2.3 million
and
$1.1 million
for
fiscal 2011
and
fiscal 2010
, respectively. During fiscal 2011, we relocated our San Diego office and terminated a lease on our former premises. The termination fee of
$0.7 million
is included in rent expense for fiscal
2011
.
Annual future minimum payments under these operating leases as of
December 31, 2012
(in thousands) are presented in the table below. Included in the table below are future minimum lease payments under noncancelable subleases as of December 31, 2012 of
$1.1 million
.
82
|
Data Centers
|
Office Leases
|
Total
|
|||||||||
|
Fiscal Period:
|
|||||||||||
|
2013
|
$
|
7,474
|
|
$
|
6,251
|
|
$
|
13,725
|
|
||
|
2014
|
5,127
|
|
10,661
|
|
15,788
|
|
|||||
|
2015
|
476
|
|
11,098
|
|
11,574
|
|
|||||
|
2016
|
—
|
|
11,303
|
|
11,303
|
|
|||||
|
2017
|
—
|
|
11,473
|
|
11,473
|
|
|||||
|
Thereafter
|
—
|
|
47,427
|
|
47,427
|
|
|||||
|
Total minimum lease payments
|
$
|
13,077
|
|
$
|
98,213
|
|
$
|
111,290
|
|
||
Lease commitments of
$9.9 million
related to the lease for our former San Diego office are included in the table above. Upon vacating our former San Diego office in August 2012, we recorded a facility exit obligation of
$2.3 million
, as we are further obligated for certain ongoing operating costs.
In February 2012, we signed a lease for our new San Diego office. The lease is for a
94,543
square-foot building with total minimum lease commitments of approximately
$13.7 million
. The lease is for a period of
eight
years and commenced on August 17, 2012.
In September 2012, we signed a lease for a total of
43,590
square-feet of office space located in Amsterdam. The square-footage for the first year is approximately
17,857
and increases incrementally over the term of the lease, with total minimum lease commitments of approximately
$10.5 million
. The lease is for a period of
10.5
years and commenced on October 1, 2012.
On November 8, 2012, we entered into a lease agreement for
148,704
square feet of office space located in San Jose. The lease is for a period of approximately
11
years and is anticipated to begin on or around March 1, 2013. Rent will be paid on a monthly basis and will increase incrementally over the term of the lease for total minimum lease payments of approximately
$48.8 million
.
Legal Proceedings
From time to time, we are party to litigation and other legal proceedings in the ordinary course of business. While the results of any litigation or other legal proceedings are uncertain, management does not believe the ultimate resolution of any pending legal matters is likely to have a material adverse effect on our financial position, results of operations or cash flows, except for those matters for which we have recorded a loss contingency. We accrue for loss contingencies when it is both probable that we will incur the loss and when the amount of the loss can be reasonably estimated.
Generally, our subscription agreements require us to indemnify our customers for third-party intellectual property infringement claims. Any adverse determination related to intellectual property claims or litigation could prevent us from offering our service and adversely affect our financial condition and results of operations.
(18) Information about Geographic Areas
Revenues by geographic area, based on the billing location of the customer, were as follows for the periods presented (in thousands):
|
|
Year Ended December 31,
|
Six Months Ended December 31,
|
Fiscal Year Ended June 30,
|
||||||||||||||||
|
|
2012
|
2011
|
2010
|
2011
|
2010
|
||||||||||||||
|
|
(Unaudited)
|
||||||||||||||||||
|
Revenues by geography
|
|||||||||||||||||||
|
North America
|
$
|
173,001
|
|
$
|
51,901
|
|
$
|
27,919
|
|
$
|
69,333
|
|
$
|
31,396
|
|
||||
|
EMEA
(1)
|
60,579
|
|
18,842
|
|
8,693
|
|
20,093
|
|
10,708
|
|
|||||||||
|
Asia Pacific and other
|
10,132
|
|
2,632
|
|
1,332
|
|
3,215
|
|
1,225
|
|
|||||||||
|
Total revenues
|
$
|
243,712
|
|
$
|
73,375
|
|
$
|
37,944
|
|
$
|
92,641
|
|
$
|
43,329
|
|
||||
(1) Europe, the Middle East and Africa ("EMEA")
83
Long-lived assets by geographic area were as follows (in thousands):
|
|
December 31,
|
||||||
|
2012
|
2011
|
||||||
|
Long-lived assets:
|
|||||||
|
North America
|
$
|
30,209
|
|
$
|
15,820
|
|
|
|
EMEA
(1)
|
10,513
|
|
4,537
|
|
|||
|
Asia Pacific and other
|
1,620
|
|
338
|
|
|||
|
Total long-lived assets
|
$
|
42,342
|
|
$
|
20,695
|
|
|
(1) Europe, the Middle East and Africa ("EMEA")
|
ITEM 9.
|
CHANGES IN AND DISAGREEMENTS WITH ACCOUNTANTS ON ACCOUNTING AND FINACIAL DISCLOSURE
|
None.
|
ITEM 9A.
|
CONTROLS AND PROCEDURES
|
(a) Evaluation of disclosure controls and procedures
Our management is responsible for establishing and maintaining adequate internal control over financial reporting. Management, with the participation of our chief executive officer and our chief financial officer, evaluated the effectiveness of our disclosure controls and procedures as of December 31, 2012. The term “disclosure controls and procedures,” as defined in Rules 13a-15(e) and 15d-15(e) under the Exchange Act, means controls and other procedures of a company that are designed to ensure that information required to be disclosed by a company in the reports that it files or submits under the Exchange Act is recorded, processed, summarized and reported, within the time periods specified in the SEC's rules and forms. Disclosure controls and procedures include, without limitation, controls and procedures designed to ensure that information required to be disclosed by a company in the reports that it files or submits under the Exchange Act is accumulated and communicated to the company's management, including its principal executive and principal financial officers, as appropriate to allow timely decisions regarding required disclosure. Management recognizes that any controls and procedures, no matter how well designed and operated, can provide only reasonable assurance of achieving their objectives, and management necessarily applies its judgment in evaluating the cost-benefit relationship of possible controls and procedures. Based on the evaluation of our disclosure controls and procedures as of December 31, 2012, our chief executive officer and chief financial officer concluded that, as of such date, our disclosure controls and procedures were effective at the reasonable assurance level.
(b) Management's Report on Internal Control Over Financial Reporting
This report does not include a report of management's assessment regarding internal control over financial reporting or an attestation report of our registered public accounting firm due to a transition period established by rules of the Securities and Exchange Commission for newly public companies.
(c) Changes in internal control over financial reporting
There were no changes in our internal control over financial reporting identified in management's evaluation pursuant to Rules 13a-15(d) or 15d-15(d) of the Exchange Act during the most recent fiscal quarter that materially affected, or are reasonably likely to materially affect, our internal control over financial reporting.
|
ITEM 9B.
|
OTHER INFORMATION
|
None.
|
ITEM 10.
|
DIRECTORS, EXECUTIVE OFFICERS AND CORPORATE GOVERNANCE
|
The information required by this item will be included in an amendment to this Annual Report on Form 10-K or incorporated by reference from our definitive proxy statement to be filed pursuant to Regulation 14A.
84
|
ITEM 11.
|
EXECUTIVE COMPENSATION
|
The information required by this item will be included in an amendment to this Annual Report on Form 10-K or incorporated by reference from our definitive proxy statement to be filed pursuant to Regulation 14A.
|
ITEM 12.
|
SECURITY OWNERSHIP OF CERTAIN BENEFICIAL OWNERS AND MANAGEMENT AND RELATED STOCKHOLDER MATTERS
|
The information required by this item will be included in an amendment to this Annual Report on Form 10-K or incorporated by reference from our definitive proxy statement to be filed pursuant to Regulation 14A.
|
ITEM 13.
|
CERTAIN RELATIONSHIPS AND RELATED TRANSACTIONS AND DIRECTOR INDEPENDENCE
|
The information required by this item will be included in an amendment to this Annual Report on Form 10-K or incorporated by reference from our definitive proxy statement to be filed pursuant to Regulation 14A.
|
ITEM 14.
|
PRINCIPAL ACCOUNTING FEES AND SERVICES
|
The information required by this item will be included in an amendment to this Annual Report on Form 10-K or incorporated by reference from our definitive proxy statement to be filed pursuant to Regulation 14A.
|
ITEM 15.
|
EXHIBITS AND FINANCIAL STATEMENT SCHEDULES
|
The following documents are filed as a part of this Annual Report on Form 10-K:
(a) Financial Statements
The information concerning our financial statements, and Report of Independent Registered Public Accounting Firm required by this Item is incorporated by reference herein to the section of this Annual Report on Form 10-K in Item 8, entitled “Financial Statements and Supplementary Data.”
(b)
Financial Statement Schedules
All schedules have been omitted because the required information is not present or not present in amounts sufficient to require submission of the schedules, or because the information required is included in the Consolidated Financial Statements or notes thereto.
(c) Exhibits.
The list of exhibits filed with this report is set forth in the Exhibit Index following the signature pages and is incorporated herein by reference.
85
SIGNATURES
Pursuant to the requirements of Section 13 or 15(d) of the Securities Exchange Act of 1934, the registrant has duly caused this report to be signed on its behalf by the undersigned thereunto duly authorized.
Dated: March 8, 2013
|
S
ERVICE
N
OW
, I
NC
.
|
|||
|
By:
|
/s/ Frank Slootman
|
||
|
Frank Slootman
President and Chief Executive Officer
|
|||
POWER OF ATTORNEY
KNOW ALL BY THESE PRESENTS, that each person whose signature appears below constitutes and appoints Frank Slootman and Michael P. Scarpelli, and each of them, as his true and lawful attorneys-in-fact and agents, each with the full power of substitution, for him and in his name, place or stead, in any and all capacities, to sign any and all amendments to this report, and to file the same, with exhibits thereto and other documents in connection therewith, with the Securities and Exchange Commission, granting unto said attorneys-in-fact and agents, and each of them, full power and authority to do and perform each and every act and thing requisite and necessary to be done in and about the premises, as fully to all intents and purposes as he might or could do in person, hereby ratifying and confirming all that said attorneys-in-fact and agents, or their or his substitute or substitutes, may lawfully do or cause to be done by virtue hereof.
Pursuant to the requirements of the Securities Act of 1933, this report has been signed by the following persons in the capacities and on the dates indicated.
|
Signature
|
Title
|
Date
|
||
|
/s/ Frank Slootman
|
President, Chief Executive Officer and Director
(Principal Executive Officer)
|
March 8, 2013
|
||
|
Frank Slootman
|
||||
|
/s/ Michael P. Scarpelli
|
Chief Financial Officer
(Principal Financial Officer and Principal Accounting Officer)
|
March 8, 2013
|
||
|
Michael P. Scarpelli
|
||||
|
/s/ Frederic B. Luddy
|
Chief Product Officer and Director
|
March 8, 2013
|
||
|
Frederic B. Luddy
|
||||
|
s/ Paul V. Barber
|
Director
|
March 8, 2013
|
||
|
Paul V. Barber
|
||||
|
/s/ Ronald E.F. Codd
|
Director
|
March 8, 2013
|
||
|
Ronald E. F. Codd
|
||||
|
/s/ Douglas M. Leone
|
Director
|
March 8, 2013
|
||
|
Douglas M. Leone
|
||||
|
/s/ Jeffrey A. Miller
|
Director
|
March 8, 2013
|
||
|
Jeffrey A. Miller
|
||||
|
/s/ Charles E. Noell, III
|
Director
|
March 8, 2013
|
||
|
Charles E. Noell, III
|
||||
|
/s/ William L. Strauss
|
Director
|
March 8, 2013
|
||
|
William L. Strauss
|
||||
86
EXHIBIT INDEX
|
Exhibit
Number
|
Description of Document
|
Incorporated by Reference
|
Filed
Herewith
|
||||||||
|
Form
|
File No.
|
Exhibit
|
Filing Date
|
||||||||
|
3.1
|
Restated Certificate of Incorporation.
|
10-Q
|
001-35580
|
3.1
|
8/10/2012
|
||||||
|
3.2
|
Restated Bylaws.
|
S-1
|
333-180486
|
3.4
|
5/4/2012
|
||||||
|
4.1
|
Form of Common Stock Certificate.
|
S-1
|
333-180486
|
4.1
|
6/19/2012
|
||||||
|
4.2
|
Third Amended and Restated Investors Rights Agreement dated November 25, 2009 among the Registrant and certain of its stockholders, as amended.
|
S-1
|
333-180486
|
4.2
|
3/30/2012
|
||||||
|
10.1
|
Form of Indemnification Agreement.
|
S-1
|
333-180486
|
10.1
|
6/19/2012
|
||||||
|
10.2
|
2005 Stock Plan, Forms of Stock Option Agreement and Form of Restricted Stock Unit Agreement thereunder.
|
S-1
|
333-180486
|
10.2
|
3/30/2012
|
||||||
|
10.3
|
2012 Equity Incentive Plan, Forms of Stock Option Award Agreement, Restricted Stock Agreement, Stock Appreciation Right Award Agreement and Restricted Stock Unit Award Agreement thereunder.
|
S-1
|
333-180486
|
10.3
|
6/19/2012
|
||||||
|
10.4
|
2012 Employee Stock Purchase Plan and Form of Subscription Agreement thereunder.
|
|
|
x
|
|||||||
|
10.5
|
Employment Agreement dated May 2, 2011 among the Registrant and Frank Slootman.
|
S-1
|
333-180486
|
10.5
|
3/30/2012
|
||||||
|
10.6
|
Employment Agreement dated May 12, 2011 among the Registrant and Michael P. Scarpelli.
|
S-1
|
333-180486
|
10.6
|
3/30/2012
|
||||||
|
10.7
|
Employment Agreement dated May 21, 2011 among the Registrant and David L. Schneider.
|
S-1
|
333-180486
|
10.7
|
3/30/2012
|
||||||
|
10.8
|
Employment Agreement dated August 1, 2011 among the Registrant and Daniel R. McGee.
|
S-1
|
333-180486
|
10.8
|
3/30/2012
|
||||||
|
10.9
|
Employment Agreement dated August 15, 2011 among the Registrant and Arne Josefsberg.
|
S-1
|
333-180486
|
10.9
|
3/30/2012
|
||||||
|
10.10
|
Office Lease dated August 27, 2010 between the Registrant and Kilroy Realty, L.P.
|
S-1
|
333-180486
|
10.10
|
3/30/2012
|
||||||
|
10.11
|
Office Lease dated February 14, 2012 between the Registrant and The Irvine Company LLC.
|
S-1
|
333-180486
|
10.11
|
3/30/2012
|
||||||
|
10.12
|
Lease Agreement dated November 8, 2012 between the Registrant and Jay Ridge LLC.
|
S-1
|
333-184674
|
10.12
|
11/9/2012
|
||||||
|
21.1
|
Subsidiaries of the Registrant.
|
|
|
x
|
|||||||
|
23.1
|
Consent of independent registered public accounting firm.
|
x
|
|||||||||
|
24.1
|
Power of Attorney. Reference is made to the signature page hereto.
|
x
|
|||||||||
|
31.1
|
Certification of Periodic Report by Chief Executive Officer under Section 302 of the Sarbanes-Oxley Act of 2002
|
x
|
|||||||||
|
31.2
|
Certification of Periodic Report by Chief Financial Officer under Section 302 of the Sarbanes-Oxley Act of 2002
|
x
|
|||||||||
|
32.1
|
Certification of Chief Executive Officer Pursuant to 18 U.S.C. Section 1350 as Adopted Pursuant to Section 906 of the Sarbanes-Oxley Act of 2002
|
x
|
|||||||||
87
|
Exhibit
Number
|
Description of Document
|
Incorporated by Reference
|
Filed
Herewith
|
||||||||
|
Form
|
File No.
|
Exhibit
|
Filing Date
|
||||||||
|
32.2
|
Certification of Chief Financial Officer Pursuant to 18 U.S.C. Section 1350 as Adopted Pursuant to Section 906 of the Sarbanes-Oxley Act of 2002
|
x
|
|||||||||
|
101.INS
|
XBRL Instance Document
|
x
|
|||||||||
|
101.SCH
|
XBRL Taxonomy Schema Linkbase Document
|
x
|
|||||||||
|
101.CAL
|
XBRL Taxonomy Calculation Linkbase Document
|
x
|
|||||||||
|
101.DEF
|
XBRL Taxonomy Definition Linkbase Document
|
x
|
|||||||||
|
101.LAB
|
XBRL Taxonomy Labels Linkbase Document
|
x
|
|||||||||
|
101.PRE
|
XBRL Taxonomy Presentation Linkbase Document
|
x
|
|||||||||
88
TABLE OF CONTENTS
Part IItem 1. BusinessItem 1A. Risk FactorsItem 1B. Unresolved Staff CommentsItem 2. PropertiesItem 3. Legal ProceedingsItem 4. Mine Safety DisclosuresPart IIItem 5. Market For Registrant's Common Equity, Related Stockholder Matters and Issuer Purchases Of Equity SecuritiesItem 6. Selected Consolidated Financial DataItem 7. Management S Discussion and Analysis Of Financial Condition and Results Of OperationsItem 7A. Qualitative and Quantitative Disclosures About Market RiskItem 8. Consolidated Financial Statements and Supplementary DataItem 9. Changes in and Disagreements with Accountants on Accounting and Finacial DisclosureItem 9A. Controls and ProceduresItem 9B. Other InformationPart IIIItem 10. Directors, Executive Officers and Corporate GovernanceItem 11. Executive CompensationItem 12. Security Ownership Of Certain Beneficial Owners and Management and Related Stockholder MattersItem 13. Certain Relationships and Related Transactions and Director IndependenceItem 14. Principal Accounting Fees and ServicesPart IVItem 15. Exhibits and Financial Statement Schedules