NRG ENERGY, INC.
10-Ks and 10-Qs
|
|
|
|
|
|
|
|
|
|
|
|
|
|
|
|
|
|
|
|
|
|
|
|
|
|
|
|
|
|
|
|
|
|
|
|
|
|
|
|
|
|
|
|
|
|
|
|
|
|
|
|
|
|
|
|
UNITED STATES SECURITIES AND EXCHANGE COMMISSION
Washington, D.C. 20549
Form 10-K
|
x
|
|
ANNUAL REPORT PURSUANT TO SECTION 13 OR 15(d) OF THE SECURITIES EXCHANGE ACT OF 1934
For the Fiscal Year ended December 31, 2011.
|
|
o
|
|
TRANSITION REPORT PURSUANT TO SECTION 13 OR 15(d) OF THE SECURITIES EXCHANGE ACT OF 1934
For the Transition period from to .
|
Commission file No. 001-15891
NRG Energy, Inc.
(Exact name of registrant as specified in its charter)
|
Delaware
(State or other jurisdiction of incorporation or organization)
|
|
41-1724239
(I.R.S. Employer Identification No.)
|
|
211 Carnegie Center Princeton, New Jersey
(Address of principal executive offices)
|
|
08540
(Zip Code)
|
(609) 524-4500
(Registrant's telephone number, including area code)
Securities registered pursuant to Section 12(b) of the Act:
|
Title of Each Class
|
|
Name of Exchange on Which Registered
|
|
Common Stock, par value $0.01
|
|
New York Stock Exchange
|
Securities registered pursuant to Section 12(g) of the Act:
None
Indicate by check mark if the registrant is a well-known seasoned issuer, as defined in Rule 405 of the Securities Act. Yes
x
No
o
Indicate by check mark if the registrant is not required to file reports pursuant to Section 13 or Section 15(d) of the Exchange Act. Yes
o
No
x
Indicate by check mark whether the registrant (1) has filed all reports to be filed by Section 13 or 15(d) of the Securities Exchange Act of 1934 during the preceding 12 months (or for such shorter period that the registrant was required to file such reports), and (2) has been subject to such filing requirements for the past 90 days. Yes
x
No
o
Indicate by check mark whether the registrant has submitted electronically and posted on its corporate Web site, if any, every Interactive Data File required to be submitted and posted pursuant to Rule 405 of Regulation S-T (§232.405 of this chapter) during the preceding 12 months (or for such shorter period that the registrant was required to submit and post such files). Yes
x
No
o
Indicate by check mark if disclosure of delinquent filers pursuant to Item 405 of Regulation S-K (§ 229.405 of this chapter) is not contained herein, and will not be contained, to the best of the registrant's knowledge, in definitive proxy or information statements incorporated by reference in Part III of this Form 10-K or any amendment to this Form 10-K.
o
Indicate by check mark whether the registrant is a large accelerated filer, an accelerated filer, a non-accelerated filer, or a smaller reporting company. See the definitions of "large accelerated filer," "accelerated filer" and "smaller reporting company" in Rule 12b-2 of the Exchange Act.
|
Large accelerated filer
x
|
|
Accelerated filer
o
|
|
Non-accelerated filer
o
|
|
Smaller reporting company
o
|
|
(Do not check if a smaller reporting company)
|
||||||
Indicate by check mark whether the registrant is a shell company (as defined in Rule 12b-2 of the Act). Yes
o
No
x
As of the last business day of the most recently completed second fiscal quarter, the aggregate market value of the common stock of the registrant held by non-affiliates was approximately
$5,509,659,060
based on the closing sale price of
$24.58
as reported on the New York Stock Exchange.
Indicate the number of shares outstanding of each of the registrant's classes of common stock as of the latest practicable date.
|
Class
|
|
Outstanding at February 22, 2012
|
|
Common Stock, par value $0.01 per share
|
|
227,685,120
|
Documents Incorporated by Reference:
Portions of the registrants definitive Proxy Statement relating to its 2012 Annual Meeting of Stockholders
are incorporated by reference into Part III of this Annual Report on Form 10-K
TABLE OF CONTENTS
|
|
||
|
|
||
|
|
||
|
|
||
|
|
||
|
|
||
|
|
||
|
|
||
|
|
||
|
|
||
|
|
||
|
|
||
|
|
||
|
|
||
|
|
||
|
|
||
|
|
||
|
|
||
|
|
||
|
|
||
|
|
||
2
Glossary of Terms
When the following terms and abbreviations appear in the text of this report, they have the meanings indicated below:
|
2011 Form 10-K
|
NRG's Annual Report on Form 10-K for the year ended December 31, 2011
|
|
|
2011 Revolving Credit Facility
|
The Company's $2.3 billion revolving credit facility due 2016, a component of the 2011 Senior Credit Facility
|
|
|
2011 Senior Credit Facility
|
As of July 1, 2011, NRG's new senior secured facility, comprised of a $1.6 billion term loan facility and a $2.3 billion revolving credit facility, which replaces the Senior Credit Facility
|
|
|
2011 Term Loan Facility
|
The Company's $1.6 billion term loan facility due 2018, a component of the 2011 Senior Credit Facility
|
|
|
316(b) Rule
|
A section of the Clean Water Act regulating cooling water intake structures
|
|
|
AB32
|
|
Assembly Bill 32 — California Global Warming Solutions Act of 2006
|
|
ASC
|
|
The FASB Accounting Standards Codification, which the FASB established as the source of authoritative U.S. GAAP
|
|
ASR Agreement
|
Accelerated Share Repurchase Agreement
|
|
|
ASU
|
|
Accounting Standards Updates – updates to the ASC
|
|
Baseload Capacity
|
|
Coal and nuclear electric power generation capacity normally expected to serve loads on an around-the-clock basis throughout the calendar year
|
|
BACT
|
|
Best Available Control Technology
|
|
BTU
|
|
British Thermal Unit
|
|
CAA
|
|
Clean Air Act
|
|
CAIR
|
|
Clean Air Interstate Rule
|
|
CAISO
|
|
California Independent System Operator
|
|
Capital Allocation Plan
|
|
Share repurchase program
|
|
Capital Allocation Program
|
|
NRG's plan of allocating capital between debt reduction, reinvestment in the business, and share repurchases through the Capital Allocation Plan
|
|
CDWR
|
|
California Department of Water Resources
|
|
C&I
|
|
Commercial, industrial and governmental/institutional
|
|
CFTC
|
|
U.S. Commodity Futures Trading Commission
|
|
CO
2
|
|
Carbon dioxide
|
|
CPS
|
|
CPS Energy
|
|
CS
|
|
Credit Suisse Group
|
|
CSAPR
|
Cross-State Air Pollution Rule
|
|
|
CSF I
|
|
NRG Common Stock Finance I LLC
|
|
CSF II
|
|
NRG Common Stock Finance II LLC
|
|
CSF Debt
|
|
CSF I and CSF II issued notes and preferred interest, individually referred to as CSF I Debt and CSF II Debt
|
|
CSRA
|
|
Credit Sleeve Reimbursement Agreement with Merrill Lynch in connection with acquisition of Reliant Energy, as hereinafter defined
|
|
Distributed Solar
|
Solar power projects, typically less than 20 MW in size, that primarily sell power produced to customers for usage on site, or are interconnected to sell power into the local distribution grid
|
|
|
DNREC
|
|
Delaware Department of Natural Resources and Environmental Control
|
|
Energy Plus
|
Energy Plus Holdings LLC
|
|
|
EPC
|
|
Engineering, Procurement and Construction
|
|
ERCOT
|
|
Electric Reliability Council of Texas, the Independent System Operator and the regional reliability coordinator of the various electricity systems within Texas
|
|
ESPP
|
|
Employee Stock Purchase Plan
|
|
EWG
|
|
Exempt Wholesale Generator
|
|
Exchange Act
|
|
The Securities Exchange Act of 1934, as amended
|
3
|
Expected Baseload Generation
|
|
The net baseload generation limited by economic factors (relationship between cost of generation and market price) and reliability factors (scheduled and unplanned outages)
|
|
FCM
|
|
Forward Capacity Market
|
|
FERC
|
|
Federal Energy Regulatory Commission
|
|
FFB
|
Federal Financing Bank
|
|
|
FPA
|
|
Federal Power Act
|
|
Fresh Start
|
|
Reporting requirements as defined by ASC-852,
Reorganizations
|
|
Funded Letter of Credit Facility
|
|
Prior to July 1, 2011, NRG's $1.3 billion term loan-backed fully funded senior secured letter of credit facility, of which $500 million would have matured on February 1, 2013, and $800 million would have matured on August 31, 2015, and was a component of NRG's Senior Credit Facility. On July 1, 2011, NRG replaced its Senior Credit Facility, including the Funded Letter of Credit Facility, with the 2011 Senior Credit Facility.
|
|
GenOn
|
|
GenOn Energy, Inc. (formerly RRI Energy, Inc., formerly Reliant Energy, Inc.)
|
|
GHG
|
|
Greenhouse Gases
|
|
Green Mountain Energy
|
|
Green Mountain Energy Company
|
|
GWh
|
|
Gigawatt hour
|
|
Heat Rate
|
|
A measure of thermal efficiency computed by dividing the total BTU content of the fuel burned by the resulting kWh's generated. Heat rates can be expressed as either gross or net heat rates, depending whether the electricity output measured is gross or net generation and is generally expressed as BTU per net kWh
|
|
ISO
|
|
Independent System Operator, also referred to as Regional Transmission Organizations, or RTO
|
|
ISO-NE
|
|
ISO New England Inc.
|
|
kWh
|
|
Kilowatt-hours
|
|
LFRM
|
|
Locational Forward Reserve Market
|
|
LIBOR
|
|
London Inter-Bank Offer Rate
|
|
LTIP
|
|
Long-Term Incentive Plan
|
|
Mass
|
|
Residential and small business
|
|
MATS
|
Mercury and Air Toxics Standards
|
|
|
Merit Order
|
|
A term used for the ranking of power stations in order of ascending marginal cost
|
|
MIBRAG
|
|
Mitteldeutsche Braunkohlengesellschaft mbH
|
|
MMBtu
|
|
Million British Thermal Units
|
|
MW
|
|
Megawatts
|
|
MWh
|
|
Saleable megawatt hours net of internal/parasitic load megawatt-hours
|
|
MWt
|
|
Megawatts Thermal Equivalent
|
|
NAAQS
|
|
National Ambient Air Quality Standards
|
|
Net Baseload Capacity
|
|
Nominal summer net megawatt capacity of power generation adjusted for ownership and parasitic load, and excluding capacity from mothballed units as of December 31, 2010
|
|
Net Capacity Factor
|
|
The net amount of electricity that a generating unit produces over a period of time divided by the net amount of electricity it could have produced if it had run at full power over that time period. The net amount of electricity produced is the total amount of electricity generated minus the amount of electricity used during generation.
|
|
Net Exposure
|
|
Counterparty credit exposure to NRG, net of collateral
|
|
Net Generation
|
|
The net amount of electricity produced, expressed in kWhs or MWhs, that is the total amount of electricity generated (gross) minus the amount of electricity used during generation.
|
|
NINA
|
|
Nuclear Innovation North America LLC
|
|
NO
x
|
|
Nitrogen oxide
|
|
NOL
|
|
Net Operating Loss
|
|
NPNS
|
|
Normal Purchase Normal Sale
|
|
NRC
|
|
U.S. Nuclear Regulatory Commission
|
|
NSPS
|
|
New Source Performance Standards
|
4
|
NSR
|
|
New Source Review
|
|
NYISO
|
|
New York Independent System Operator
|
|
OCI
|
|
Other comprehensive income
|
|
Phase II 316(b) Rule
|
|
A section of the Clean Water Act regulating cooling water intake structures
|
|
PJM
|
|
PJM Interconnection, LLC
|
|
PJM market
|
|
The wholesale and retail electric market operated by PJM primarily in all or parts of Delaware, the District of Columbia, Illinois, Maryland, New Jersey, Ohio, Pennsylvania, Virginia and West Virginia
|
|
PM 2.5
|
|
Particulate matter particles with a diameter of 2.5 micrometers or less
|
|
PPA
|
|
Power Purchase Agreement
|
|
PSD
|
|
Prevention of Significant Deterioration
|
|
PUCT
|
|
Public Utility Commission of Texas
|
|
PUHCA of 2005
|
|
Public Utility Holding Company Act of 2005
|
|
PURPA
|
|
Public Utility Regulatory Policy Act
|
|
QF
|
|
Qualifying Facility under PURPA
|
|
QSE
|
Qualified Scheduling Entities
|
|
|
Reliant Energy
|
|
NRG's retail business in Texas purchased on May 1, 2009, from Reliant Energy, Inc. which is now known as GenOn Energy, Inc., or GenOn
|
|
Repowering
|
|
Technologies utilized to replace, rebuild, or redevelop major portions of an existing electrical generating facility, not only to achieve a substantial emissions reduction, but also to increase facility capacity, and improve system efficiency
|
|
REP
|
Retail Electric Provider
|
|
|
RERH
|
|
RERH Holding, LLC and its subsidiaries
|
|
Revolving Credit Facility
|
|
Prior to July 1, 2011, NRG's $925 million senior secured revolving credit facility, which would have matured on August 31, 2015, and was a component of NRG's Senior Credit Facility. On July 1, 2011, NRG replaced the Senior Credit Facility, including the Revolving Credit Facility, with the 2011 Senior Credit Facility.
|
|
RGGI
|
|
Regional Greenhouse Gas Initiative
|
|
RMR
|
|
Reliability Must-Run
|
|
Schkopau
|
|
Kraftwerk Schkopau Betriebsgesellschaft mbH, an entity in which NRG has a 41.9% interest
|
|
SEC
|
|
United States Securities and Exchange Commission
|
|
Securities Act
|
|
The Securities Act of 1933, as amended
|
|
Senior Credit Facility
|
|
Prior to July 1, 2011, NRG's senior secured facility was comprised of a Term Loan Facility, an $925 million Revolving Credit Facility and a $1.3 billion Funded Letter of Credit Facility. On July 1, 2011, NRG replaced the Senior Credit Facility with the 2011 Senior Credit Facility.
|
|
SIFMA
|
|
Securities Industry and Financial Markets Association
|
|
Senior Notes
|
|
The Company's $6.1 billion outstanding unsecured senior notes consisting of $1.1 billion of 7.375% senior notes due 2017, $1.2 billion of 7.625% senior notes due 2018, $700 million of 8.5% senior notes due 2019, $800 million of 7.625% senior notes due 2019, $1.1 billion of 8.25% senior notes due 2020, and $1.2 billion of 7.875% senior notes due 2021
|
|
SERC
|
|
Southeastern Electric Reliability Council/Entergy
|
|
SO
2
|
|
Sulfur dioxide
|
|
STP
|
|
South Texas Project — nuclear generating facility located near Bay City, Texas in which NRG owns a 44% Interest
|
|
STPNOC
|
|
South Texas Project Nuclear Operating Company
|
|
TANE
|
|
Toshiba America Nuclear Energy Corporation
|
|
TANE Facility
|
|
NINA's $500 million credit facility with TANE
|
|
TEPCO
|
|
The Tokyo Electric Power Company of Japan, Inc.
|
5
|
Term Loan Facility
|
|
Prior to July 1, 2011, a senior first priority secured term loan, of which approximately $608 million would have matured on February 1, 2013, and $990 million would have matured on August 31, 2015, and was a component of NRG's Senior Credit Facility. On July 1, 2011, NRG replaced its Senior Credit Facility, including the Term Loan Facility, with the 2011 Senior Credit Facility.
|
|
Texas Genco
|
|
Texas Genco LLC, now referred to as the Company's Texas Region
|
|
Tonnes
|
|
Metric tonnes, which are units of mass or weight in the metric system each equal to 2,205lbs and are the global measurement for GHG
|
|
TWh
|
|
Terawatt hour
|
|
U.S.
|
|
United States of America
|
|
U.S. DOE
|
|
United States Department of Energy
|
|
U.S. EPA
|
|
United States Environmental Protection Agency
|
|
U.S. GAAP
|
|
Accounting principles generally accepted in the United States
|
|
Utility Scale Solar
|
Solar power projects, typically 20 MW or greater in size, that are interconnected into the transmission or distribution grid to sell power at a wholesale level
|
|
|
VaR
|
Value at Risk
|
|
|
VIE
|
|
Variable Interest Entity
|
|
WCP
|
|
WCP (Generation) Holdings, Inc.
|
6
General
NRG Energy, Inc., or NRG or the Company, is an integrated wholesale power generation and retail electricity company that aspires to be a leader in the way the industry and consumers think about, use, produce and deliver energy and energy services in major competitive power markets in the United States. First, NRG is a wholesale power generator engaged in the ownership and operation of power generation facilities; the trading of energy, capacity and related products; and the transacting in and trading of fuel and transportation services. Second, NRG is a retail electricity company engaged in the supply of electricity, energy services, and cleaner energy products to retail electricity customers in deregulated markets through Reliant Energy, Green Mountain Energy, and Energy Plus (collectively, the Retail Businesses). Finally, NRG is focused on the deployment and commercialization of potential disruptive technologies, like electric vehicles, Distributed Solar and smart meter technology, which have the potential to change the nature of the power supply industry.
Wholesale Power Generation
NRG's generation facilities consist of intermittent, baseload, intermediate and peaking power generation facilities in the United States and two international locations. The sale of capacity and power from baseload generation facilities accounts for a majority of the Company's generation revenues. In addition, NRG's generation portfolio provides the Company with opportunities to capture additional revenues by selling power during periods of peak demand, offering capacity or similar products, and providing ancillary services to support system reliability.
Retail
NRG's Retail Businesses arrange for the transmission and delivery of energy-related products to customers, bill customers, collect payments for products sold, and maintain call centers to provide customer service. The Retail Businesses sell products that range from system power to bundled products, which combine system power with protection products, energy efficiency and renewable energy solutions, or other value added products and services, including customer rewards offered through exclusive loyalty and affinity program partnerships. Based on metered locations, as of December 31, 2011, NRG's Retail Businesses combined to serve approximately 2.1 million residential, small business, commercial and industrial customers.
Alternative Energy
NRG's investment in and development of new technologies is focused where the Company believes the benefits of such investments represent significant commercial opportunities and create a comparative advantage for the Company. The development and investment initiatives are primarily focused in the areas of Distributed Solar, solar thermal and solar photovoltaic, and also include other low or no Greenhouse Gases, or GHG, emitting energy generating sources, such as the fueling infrastructure for electric vehicle, or EV, ecosystems.
NRG's Business Strategy
The Company believes that the American energy industry is going to be increasingly impacted by the long-term societal trend towards sustainability which is both generational and irreversible. Moreover, the information technology-driven revolution which has enabled greater and easier personal choice in other sectors of the consumer economy will do the same in the American energy sector over the years to come. As a result, energy consumers will have increasing personal control over whom they buy their energy from, how that energy is generated and used and what environmental impact these individual choices will have. The Company's initiatives in this area of future growth are focused on: (i) renewables, with a concentration in solar development; (ii) electric vehicle ecosystems; (iii) customer-facing energy products and services including smart grid services, nationwide retail green electricity, unique retail sales channels involving loyalty and affinity programs and custom design; and (iv) construction of other forms of on-site clean power generation. The Company's advances in each of these areas are driven by select acquisitions, joint ventures, and investments that are more fully described in Item 1,
Business - New and On-going Company Initiatives and Development Projects.
7
The Company's core business is focused on: (i) excellence in safety and operating performance of its existing assets; (ii) serving the energy needs of end-use residential, commercial and industrial customers in the Company's core markets with a retail energy product that is differentiated either by premium service (Reliant), sustainability (Green Mountain Energy) or loyalty/affinity programs (Energy Plus); (iii) optimal hedging of baseload generation and retail load operations, while retaining optionality on the Company's peaking facilities; (iv) repowering of power generation assets at premium sites; (v) investment in, and deployment of, alternative energy technologies both in its wholesale and, particularly, in and around its retail businesses and their customers; (vi) pursuing selective acquisitions, joint ventures, divestitures and investments; and (vii) engaging in a proactive capital allocation plan focused on achieving the regular return of and on stockholder capital within the dictates of prudent balance sheet management.
In summary, NRG's business strategy is intended to maximize stockholder value through the production and sale of safe, reliable and affordable power to its customers in the markets served by the Company, while aggressively positioning the Company to meet the market's increasing demand for sustainable and low carbon energy solutions. This strategy is designed to enhance the Company's core business of competitive power generation and mitigate the risk of declining power prices. The Company expects to become a leading provider of sustainable energy solutions that promotes national energy security, while utilizing the Company's retail business to complement and advance both initiatives.
Competition
NRG competes in wholesale power generation, deregulated retail energy services and in the development of renewable and conventional energy resources.
Wholesale Power Generation
Wholesale power generation is a capital-intensive, commodity-driven business with numerous industry participants. NRG competes on the basis of the location of its plants and ownership of portfolios of plants in various regions, which increases the stability and reliability of its energy supply. Wholesale power generation is a regional business that is currently highly fragmented and diverse in terms of industry structure. As such, there is a wide variation in terms of the capabilities, resources, nature and identity of the companies NRG competes with depending on the market. Competitors include regulated utilities, other independent power producers, and power marketers or trading companies, including those owned by financial institutions, municipalities and cooperatives.
Retail
The restructured electricity markets across the nation provide an intensely competitive landscape for energy providers to sell products and services to all customer segments (residential, small and mid-market businesses, governments and other public institutions). The markets in which we compete include, but are not limited to: Connecticut, Delaware, the District of Columbia, Illinois, Maryland, Massachusetts, New Jersey, New York, Pennsylvania, Ohio and Texas. The Electric Reliability Council of Texas, or ERCOT, is our primary market and constitutes both the highest number of customers and a substantial concentration of NRG's gross profits.
Retail customers make purchase decisions based on a variety of factors, including price, customer service, brand image, product choices, bundles or value-added features. Customers purchase products through a variety of sales channels including direct sales force, call centers, websites, brokers and brick-and-mortar stores. The Retail Businesses compete with national and international companies that operate in multiple geographic areas, as well as numerous companies that are regional or local in nature. Significant competitors in the markets in which we compete include Constellation, Direct Energy, GDF Suez and Energy Future Holdings (d/b/a TXU Energy), and other competitors, typically incumbent retail electric providers, which have the advantage of long-standing relationships with customers.
Development
NRG may submit bids to develop generation resources, predominantly in response to requests for proposals, or RFPs, for new conventional or renewable generation and/or generating capacity. Bids are solicited by regulated utilities or electric system operators, often to comply with mandated renewable portfolio standards or to achieve an improved reserve margin, which is a measure of a utility's available electric power capacity over and above the electric power capacity needed to meet normal peak demand levels. NRG competes against other power plant developers and manufacturers of solar panel assemblies. The number and type of competitors vary based on the location, generation type, project size and counterparty specified in the RFP. Bids are awarded based on price, location of existing generation, prior experience developing generation resources similar to that specified in the RFP, and creditworthiness.
8
Competitive Strengths
Conventional Wholesale Power Generation
NRG has one of the largest and most diversified power generation portfolios in the United States, with approximately 23,585 MW of fossil fuel and nuclear generation capacity in 189 active generating units at 45 plants as of December 31, 2011. In addition, the Company has a 550 MW combined cycle gas plant under construction. The Company's power generation assets are diversified by fuel-type, dispatch level and region, which helps mitigate the risks associated with fuel price volatility and market demand cycles.
NRG's U.S. baseload and intermediate facilities provide the Company with a significant source of cash flow, while its peaking facilities provide NRG with opportunities to capture upside potential that can arise from time to time during periods of high demand.
Many of NRG's generation assets are located within densely populated areas that tend to have more robust wholesale pricing as a result of relatively favorable local supply-demand balance. NRG has generation assets located within Houston, New York City, southwestern Connecticut, and the Los Angeles and San Diego load basins. These facilities are often ideally situated for repowering or the addition of new capacity, because their location and existing infrastructure give them significant advantages over undeveloped sites.
Retail
Through its Retail Businesses, NRG served 2.1 million customers in 2011, delivering over 57 TWhs, making it one of the largest retail energy providers in the United States. NRG's Retail Businesses offer a broad range of services and value propositions that enable it to attract, retain, and increase the value of our residential, small business and commercial customer relationships. With the largest market share in ERCOT based on volume sales, Reliant Energy is recognized by its exemplary customer service (ranked the highest in customer satisfaction by the Public Utility Commission of Texas, or PUCT, in 2011) as well as its innovative technology product offerings and home energy services. As one of the nation's leading retail providers of clean energy, Green Mountain Energy is widely recognized as a pioneer in the competitive retail energy market and provides customers an environmentally friendly alternative to their energy supply requirements. Acquired in 2011, Energy Plus primarily enrolls and retains electricity and natural gas customers through exclusive marketing arrangements with leading loyalty program providers and affinity group associations. Through these Retail Businesses, NRG is able to provide its customers a broad range of energy services and products, including system power, distributed generation, solar and wind products, carbon management and specialty services, and smart grid services. The breadth and scope of these Retail Businesses also create opportunities for delivering value enhancing energy solutions to customers on a national level.
Solar and Other Alternative Energy Technologies
NRG is one of the largest solar power developers in the U.S., having demonstrated the ability to develop, construct and finance a full range of solar energy solutions for utilities, schools, municipalities, commercial and residential market segments. The Company has 545 MW of renewable generation capacity which consists of ownership interests in four wind farms, three Utility Scale Solar facilities, and approximately 30 MW of Distributed Solar as of December 31, 2011. In addition, the Company has 860 MW of solar capacity under construction: 855 MW at six Utility Scale Solar facilities and 5 MW of Distributed Solar. Through its relationships with solar equipment providers, NRG is able to deploy diverse solar technologies in both the utility and distributed generating scale projects that creates value for the Company while meeting the clean renewable energy requirements of its customers NRG is responding to the growing consumer demand for cleaner transportation solutions by building the first privately funded EV charging infrastructure network in select major metropolitan areas.
9
The map below shows the locations of NRG's U.S. power generation facilities as of December 31, 2011, (excluding Distributed Solar), both operating and under construction, as well as the states where NRG operates its Retail Businesses:

10
The following table summarizes NRG's global generation portfolio as of December 31, 2011, by operating segment, which includes 47 fossil fuel plants, three Utility Scale Solar facilities and four wind farms, as well as Distributed Solar facilities. Also included are one natural gas plant, six Utility Scale Solar facilities and additional Distributed Solar facilities currently under construction. All Utility Scale Solar and Distributed Solar facilities are described in megawatts on an alternating current, or AC, basis:
|
Fossil Fuel, Nuclear, and Renewable
|
||||||||||||||||||||||||
|
(In MW)
|
||||||||||||||||||||||||
|
Generation Type
|
Texas
|
Northeast
|
South Central
|
West
|
Thermal
|
Total Domestic
|
Inter-national
|
Total Global
|
||||||||||||||||
|
Natural gas
|
4,930
|
|
1,300
|
|
2,630
|
|
2,130
|
|
105
|
|
11,095
|
|
—
|
|
11,095
|
|
||||||||
|
Coal
|
4,190
|
|
1,600
|
|
1,495
|
|
—
|
|
15
|
|
7,300
|
|
1,005
|
|
8,305
|
|
||||||||
|
Oil
|
—
|
|
4,015
|
|
—
|
|
—
|
|
—
|
|
4,015
|
|
4,015
|
|
||||||||||
|
Nuclear
|
1,175
|
|
—
|
|
—
|
|
—
|
|
—
|
|
1,175
|
|
—
|
|
1,175
|
|
||||||||
|
Wind
|
450
|
|
—
|
|
—
|
|
—
|
|
—
|
|
450
|
|
—
|
|
450
|
|
||||||||
|
Utility Scale Solar
|
—
|
|
—
|
|
—
|
|
65
|
|
—
|
|
65
|
|
—
|
|
65
|
|
||||||||
|
Distributed Solar
|
—
|
|
—
|
|
—
|
|
30
|
|
—
|
|
30
|
|
—
|
|
30
|
|
||||||||
|
Total generation capacity
|
10,745
|
|
6,915
|
|
4,125
|
|
2,225
|
|
120
|
|
24,130
|
|
1,005
|
|
25,135
|
|
||||||||
|
Under Construction
|
||||||||||||||||||||||||
|
Natural gas
|
—
|
|
—
|
|
—
|
|
550
|
|
—
|
|
550
|
|
—
|
|
550
|
|
||||||||
|
Utility Scale Solar
(a)
|
—
|
|
—
|
|
—
|
|
855
|
|
—
|
|
855
|
|
—
|
|
855
|
|
||||||||
|
Distributed Solar
|
—
|
|
—
|
|
—
|
|
5
|
|
—
|
|
5
|
|
—
|
|
5
|
|
||||||||
|
Total under construction
|
—
|
|
—
|
|
—
|
|
1,410
|
|
—
|
|
1,410
|
|
—
|
|
1,410
|
|
||||||||
(a) Includes
142
MWs, representing
49%
of Agua Caliente's capacity, which was sold to a partner on January 18, 2012
In addition, the Company's thermal assets provide steam and chilled water capacity of approximately 1,170 megawatts thermal equivalent, or MWt, through its district energy business.
Reliability of future cash flows and portfolio diversification
NRG has hedged a portion of its expected baseload generation capacity with decreasing hedge levels through 2016. NRG also has cooperative load contract obligations in the South Central region expiring over various dates through 2025, which largely hedge the Company's generation in this region. In addition, as of December 31, 2011, the Company had purchased fuel forward under fixed price contracts, with contractually-specified price escalators, for approximately 42% of its expected baseload coal requirement from 2012 to 2016, excluding inventory. The Company has the capacity and intent to enter into additional hedges when market conditions are favorable.
The Company also has the advantage of being able to supply its Retail Businesses with its own generation, which can reduce the need to sell and buy power from other financial institutions and intermediaries, resulting in lower transaction costs and credit exposures. This combination of generation and retail allows for a reduction in actual and contingent collateral, through offsetting transactions and by reducing the need to hedge the retail power supply through third parties.
The generation and retail combination also provides stability in cash flows, as changes in commodity prices generally have offsetting impacts between the two businesses. The offsetting nature of generation and retail in relation to changes in market prices, is an integral part of NRG's goal of providing a reliable source of future cash flow for the Company.
When developing renewable and new, conventional power generation facilities, NRG typically secures long-term Power Purchase Agreements, or PPAs, which insulate the Company from commodity market volatility and provide future cash flow stability. These PPAs are typically contracted with high credit quality local utilities and have durations up to 25 years. Such projects include all of the Company's major Utility Scale Solar projects, in operation and under construction, as well as the 550 MW El Segundo Energy Center, or ESEC, project that is under construction.
11
Commercial Operations Overview
NRG seeks to maximize profitability and manage cash flow volatility through the marketing, trading and sale of energy, capacity and ancillary services into spot, intermediate and long-term markets and through the active management and trading of emissions allowances, fuel supplies and transportation-related services. The Company's principal objectives are the realization of the full market value of its asset base, including the capture of its extrinsic value, the management and mitigation of commodity market risk and the reduction of cash flow volatility over time.
NRG enters into power sales and hedging arrangements via a wide range of products and contracts, including power purchase agreements, or PPAs, fuel supply contracts, capacity auctions, natural gas derivative instruments and other financial instruments. The PPAs that NRG enters into require the Company to deliver MWh of power to its counterparties. In addition, because changes in power prices in the markets where NRG operates are generally correlated to changes in natural gas prices, NRG uses hedging strategies which may include power and natural gas forward sales contracts to manage the commodity price risk primarily associated with the Company's baseload generation assets. The objective of these hedging strategies is to stabilize the cash flow generated by NRG's portfolio of assets.
Baseload Operations
The following table summarizes NRG's U.S. Baseload capacity and the corresponding revenues and average natural gas prices and positions resulting from Baseload hedge agreements extending beyond February 14, 2012, and through 2016:
|
2012
(a)
|
2013
|
2014
|
2015
|
2016
|
Annual
Average for
2012-2016
|
|||||||||||||||||
|
|
(Dollars in millions unless otherwise stated)
|
|||||||||||||||||||||
|
Net Baseload Capacity (MW)
(b)
|
8,466
|
|
8,466
|
|
8,311
|
|
8,311
|
|
8,311
|
|
8,373
|
|
||||||||||
|
Forecasted Baseload Capacity (MW)
(c)
|
5,823
|
|
5,797
|
|
5,453
|
|
5,818
|
|
6,013
|
|
5,781
|
|
||||||||||
|
Total Baseload Sales (MW)
(d)
|
5,761
|
|
4,756
|
|
3,098
|
|
1,407
|
|
1,399
|
|
3,284
|
|
||||||||||
|
Percentage Baseload Capacity Sold Forward
(e)
|
99
|
%
|
82
|
%
|
57
|
%
|
24
|
%
|
23
|
%
|
57
|
%
|
||||||||||
|
Total Forward Hedged Revenues
(f)(g)
|
$
|
2,236
|
|
$
|
1,909
|
|
$
|
1,103
|
|
NM
(h)
|
|
NM
(h)
|
|
|||||||||
|
Weighted Average Hedged Price ($ per MWh)
(f)
|
$
|
52.86
|
|
$
|
45.83
|
|
$
|
40.64
|
|
NM
(h)
|
|
NM
(h)
|
|
|||||||||
|
Average Equivalent Natural Gas Price ($ per MMBtu)
|
$
|
5.38
|
|
$
|
5.29
|
|
$
|
4.80
|
|
NM
(h)
|
|
NM
(h)
|
|
|||||||||
|
Baseload Gas $1/MMBtu Up Sensitivity
|
$
|
50
|
|
$
|
145
|
|
$
|
259
|
|
$
|
368
|
|
$
|
387
|
|
|||||||
|
Baseload Gas $1/MMBtu Down Sensitivity
|
$
|
—
|
|
$
|
(46
|
)
|
$
|
(180
|
)
|
$
|
(329
|
)
|
$
|
(350
|
)
|
|||||||
|
Baseload Heat Rate 1 MMBtu/MWh Up Sensitivity
|
$
|
16
|
|
$
|
70
|
|
$
|
146
|
|
$
|
171
|
|
$
|
209
|
|
|||||||
|
Baseload Heat Rate 1 MMBtu/MWh Down Sensitivity
|
$
|
(1
|
)
|
$
|
(47
|
)
|
$
|
(119
|
)
|
$
|
(157
|
)
|
$
|
(191
|
)
|
|||||||
|
(a)
|
2012 represents the period March through December.
|
|
(b)
|
Nameplate capacity net of station services reflecting unit retirement schedule.
|
|
(c)
|
Forecasted generation dispatch output (MWh) based on forward price curve as of February 14, 2012, which is then divided by number of hours in a given year to arrive at MW capacity. The dispatch takes into account planned and unplanned outage assumptions.
|
|
(d)
|
Includes amounts under power sales contracts and natural gas hedges. The forward natural gas quantities are reflected in equivalent MWh based on forward market implied heat rate as of February 14, 2012, and then combined with power sales to arrive at equivalent MWh hedged which is then divided by number of hours in given year to arrive at MW hedged. The Baseload Sales include swaps and delta of options sold which is subject to change. For detailed information on the Company's hedging methodology through use of derivative instruments, see discussion in Item 15 - Note 6,
Accounting for Derivative Instruments and Hedging Activities
, to the Consolidated Financial Statements. Includes inter-segment sales from the Company's Texas wholesale power generation business to the Retail Businesses.
|
|
(e)
|
Percentage hedged is based on total baseload sales as described in (d) above divided by the forecasted baseload capacity.
|
|
(f)
|
Represents all North American baseload sales, including energy revenue and demand charges.
|
|
(g)
|
The South Central region's weighted average hedged prices ranges from $40/MWh-$50/MWh. These prices include demand charges and an estimated energy charge.
|
|
(h)
|
NM — Not meaningful, as South Central hedges, which are subject to renegotiation of the transportation component of coal costs, represent a substantial portion of total hedges.
|
12
Retail Operations
NRG's retail operations sell electricity on fixed price or indexed products, and these contracts have terms typically ranging from one month to five years. In 2011, the Company's Retail Businesses sold approximately 57 TWh of load. In any given year, TWh sold can be affected by weather, economic conditions and competition. The wholesale supply is typically purchased as the load is contracted in order to secure profit margin. The wholesale supply is purchased from a combination of NRG's wholesale portfolio and other third parties, depending on the existing hedge position for the NRG wholesale portfolio at the time.
Capacity and Other Contracted Revenue Sources
NRG revenues and cash flows benefit from capacity/demand payments and other contracted revenue sources, originating from either market clearing capacity prices, Resource Adequacy, or RA, contracts, tolling arrangements, PPAs and other long-term contractual arrangements:
|
•
|
Northeast — The Company's largest sources for capacity revenues are derived from market capacity auctions in ISO New England Inc., or ISO-NE, New York Independent System Operator, or NYISO, and PJM Interconnection LLC, or PJM. The region's share of the GenConn plants in Connecticut earns fixed payments for their output under long-term financial contracts with a utility counterparty.
|
|
•
|
South Central — NRG earns demand payments from its long-term full-requirements load contracts with ten Louisiana distribution cooperatives. Of the ten contracts, seven expire in 2025 and account for 57% of the cooperative customer contract load, with the remaining three contracts currently set to expire in 2014. The Company has executed agreements to extend the contracts of two of these three cooperatives representing 19% of the cooperative load through 2025, subject to regulatory approval. The remaining counterparty, with a 550 MW load service contract, accounting for 24% of the cooperative total, has elected not to extend their contract when it expires in 2014. Demand payments from the current long term contracts are tied to summer peak demand and provide a mechanism for recovering a portion of costs associated with new or changed environmental laws or regulations.
|
|
•
|
West — Many of the region's sites, including solar and gas projects currently under construction, are under either long-term PPAs, tolling agreements, or renewable incentive agreements. The remaining sites have short-term RA contracts.
|
|
•
|
Thermal — Output from the Company's thermal assets is generally sold under long-term contracts or through regulated public utility tariffs. The contracts or tariffs contain capacity or demand elements, mechanisms for fuel recovery and/or the recovery of operating expenses. Thermal output from the Thermal region's Northwind business is sold under long-term agreements with customers in Phoenix, while the PJM assets participate in the PJM capacity markets.
|
|
•
|
Texas — The region's sources of capacity and contracted revenues are through a PPA contract for South Trent wind generation, capacity option premium agreements, and black start agreements with ERCOT.
|
|
•
|
International — Generation output from the Company's share of the Schkopau facility in Germany and the Gladstone facility in Australia is sold under long-term contracts, which include capacity payments as well as the reimbursement of certain fixed and variable costs.
|
Fuel Supply and Transportation
NRG's fuel requirements consist of nuclear fuel and various forms of fossil fuel including coal, natural gas and oil. The prices of fossil fuels are highly volatile. The Company obtains its fossil fuels from multiple suppliers and transportation sources. Although availability is generally not an issue, localized shortages, transportation availability and supplier financial stability issues can and do occur. The preceding factors related to the sources and availability of raw materials are fairly uniform across the Company's business segments.
Coal
— The Company is completely hedged for its domestic coal consumption for 2012; less so for subsequent years. Coal hedging is dynamic and is based on forecasted generation and market volatility. As of December 31, 2011, NRG had purchased forward contracts to provide fuel for approximately 42% of the Company's expected requirements from 2012 through 2016, excluding inventory. NRG arranges for the purchase, transportation and delivery of coal for the Company's baseload coal plants via a variety of coal purchase agreements, rail/barge transportation agreements, and rail car lease arrangements. The Company purchased approximately 27 million tons of coal in 2011, of which 98% was Powder River Basin coal and lignite.
13
The following table shows the percentage of the Company's coal requirements from 2012 through 2016 that have been purchased forward as of December 31, 2011:
|
|
Percentage of
Company's
Requirement
(a)(b)
|
|
|
2012
|
100
|
%
|
|
2013
|
52
|
%
|
|
2014
|
21
|
%
|
|
2015
|
20
|
%
|
|
2016
|
17
|
%
|
|
(a)
|
The hedge percentages reflect the current plan for the Jewett mine, which supplies lignite for NRG's Limestone facility. NRG has the contractual ability to change volumes and may do so in the future.
|
|
(b)
|
Does not include coal inventory.
|
As of December 31, 2011, NRG had approximately 5,900 privately leased or owned rail cars in the Company's transportation fleet. NRG has entered into rail transportation agreements with varying tenures that provide for substantially all of the Company's rail transportation requirements for the next three years.
Natural Gas
— NRG operates a fleet of natural gas plants across all its U.S. wholesale regions, which are primarily comprised of peaking assets that run in times of high power demand. Due to the uncertainty of their dispatch, the fuel needs are managed on a spot basis as the Company does not believe it is prudent to forward purchase natural gas for units, the dispatch of which is highly unpredictable. The Company contracts for natural gas storage services as well as natural gas transportation services to ensure delivery of natural gas when needed.
Nuclear Fuel
— South Texas Project's, or STP's, owners satisfy STP's fuel supply requirements by: (i) acquiring uranium concentrates and contracting for conversion of the uranium concentrates into uranium hexafluoride; (ii) contracting for enrichment of uranium hexafluoride; and (iii) contracting for fabrication of nuclear fuel assemblies. Through its proportionate participation in South Texas Project Nuclear Operating Company, or STPNOC, which is the U.S. Nuclear Regulatory Commission, or NRC, -licensed operator of STP and responsible for all aspects of fuel procurement, NRG is party to a number of long-term forward purchase contracts with many of the world's largest suppliers covering STP requirements for uranium and conversion services for the next five years, and with substantial portions of STP's requirements procured thereafter. Similarly, NRG is party to long-term contracts to procure STP's requirements for enrichment services and fuel fabrication for the life of the operating license.
Seasonality and Price Volatility
Annual and quarterly operating results of the Company's wholesale power generation segments can be significantly affected by weather and energy commodity price volatility. Significant other events, such as the demand for natural gas, interruptions in fuel supply infrastructure and relative levels of hydroelectric capacity can increase seasonal fuel and power price volatility. NRG derives a majority of its annual revenues in the months of May through October, when demand for electricity is generally at its highest in the Company's core domestic markets. Further, power price volatility is generally higher in the summer months, traditionally NRG's most important season. The Company's second most important season is the winter months of December through March when volatility and price spikes in underlying delivered fuel prices have tended to drive seasonal electricity prices. The preceding factors related to seasonality and price volatility are fairly uniform across the Company's wholesale generation business segments.
The sale of electric power to retail customers is also a seasonal business with the demand for power generally peaking during the summer months. As a result, net working capital requirements for the Company's retail operations generally increase during summer months along with the higher revenues, and then decline during off-peak months. Weather may impact operating results and extreme weather conditions could materially affect results of operations. The rates charged to retail customers may be impacted by fluctuations in the price of natural gas, transmission constraints, competition, and changes in market heat rates.
14
Regional Segment Review
Revenues
The following table contains a summary of NRG's operating revenues by segment for the years ended December 31, 2011, 2010, and 2009, as discussed in Item 15 — Note 18,
Segment Reporting,
to the Consolidated Financial Statements. Refer to that footnote for additional financial information about NRG's business segments and geographic areas, including a profit measure and total assets. In addition, refer to Item 2
— Properties
, for information about facilities in each of NRG's business segments.
|
|
Year Ended December 31, 2011
|
||||||||||||||||||||||||||||||
|
|
Energy
Revenues
|
Capacity
Revenues
|
Retail
Revenues
|
Mark-to-
Market
Activities
|
Contract Amor-tization
|
Thermal Revenues
|
Other
Revenues
|
Total
Operating
Revenues
|
|||||||||||||||||||||||
|
|
(In millions)
|
||||||||||||||||||||||||||||||
|
Reliant Energy
|
$
|
—
|
|
$
|
—
|
|
$
|
5,075
|
|
$
|
8
|
|
$
|
(145
|
)
|
$
|
—
|
|
$
|
—
|
|
$
|
4,938
|
|
|||||||
|
Texas
|
2,561
|
|
28
|
|
—
|
|
173
|
|
—
|
|
—
|
|
106
|
|
2,868
|
|
|||||||||||||||
|
Northeast
|
579
|
|
291
|
|
—
|
|
28
|
|
—
|
|
—
|
|
26
|
|
924
|
|
|||||||||||||||
|
South Central
|
548
|
|
243
|
|
—
|
|
(12
|
)
|
20
|
|
—
|
|
18
|
|
817
|
|
|||||||||||||||
|
West
|
42
|
|
118
|
|
—
|
|
(4
|
)
|
—
|
|
—
|
|
4
|
|
160
|
|
|||||||||||||||
|
International
|
58
|
|
70
|
|
—
|
|
—
|
|
—
|
|
—
|
|
16
|
|
144
|
|
|||||||||||||||
|
Thermal
|
—
|
|
—
|
|
—
|
|
—
|
|
(1
|
)
|
143
|
|
—
|
|
142
|
|
|||||||||||||||
|
Corporate and Eliminations
(a)(b)
|
(1,719
|
)
|
(14
|
)
|
732
|
|
132
|
|
(33
|
)
|
—
|
|
(12
|
)
|
(914
|
)
|
|||||||||||||||
|
Total
|
$
|
2,069
|
|
$
|
736
|
|
$
|
5,807
|
|
$
|
325
|
|
$
|
(159
|
)
|
$
|
143
|
|
$
|
158
|
|
$
|
9,079
|
|
|||||||
|
(a)
|
Energy revenues include inter-segment sales primarily between Texas and Northeast, and the Retail Businesses.
|
|
(b)
|
Retail revenues include Energy Plus retail revenues of $63 million for the period October 1, 2011, to December 31, 2011.
|
|
|
Year Ended December 31, 2010
|
||||||||||||||||||||||||||||||
|
|
Energy
Revenues
|
Capacity
Revenues
|
Retail
Revenues
|
Mark-to-
Market
Activities
|
Contract Amor-tization
|
Thermal Revenues
|
Other
Revenues
|
Total
Operating
Revenues
|
|||||||||||||||||||||||
|
|
(In millions)
|
||||||||||||||||||||||||||||||
|
Reliant Energy
|
$
|
—
|
|
$
|
—
|
|
$
|
5,210
|
|
$
|
(1
|
)
|
$
|
(219
|
)
|
$
|
—
|
|
$
|
—
|
|
$
|
4,990
|
|
|||||||
|
Texas
|
2,850
|
|
25
|
|
—
|
|
57
|
|
7
|
|
—
|
|
118
|
|
3,057
|
|
|||||||||||||||
|
Northeast
|
726
|
|
396
|
|
—
|
|
(144
|
)
|
—
|
|
—
|
|
47
|
|
1,025
|
|
|||||||||||||||
|
South Central
|
387
|
|
235
|
|
—
|
|
(45
|
)
|
21
|
|
—
|
|
10
|
|
608
|
|
|||||||||||||||
|
West
|
31
|
|
113
|
|
—
|
|
(4
|
)
|
—
|
|
—
|
|
4
|
|
144
|
|
|||||||||||||||
|
International
|
46
|
|
71
|
|
—
|
|
—
|
|
—
|
|
—
|
|
11
|
|
128
|
|
|||||||||||||||
|
Thermal
|
—
|
|
—
|
|
—
|
|
(2
|
)
|
—
|
|
145
|
|
—
|
|
143
|
|
|||||||||||||||
|
Corporate and Eliminations
(c)(d)
|
(1,186
|
)
|
(16
|
)
|
67
|
|
(60
|
)
|
(4
|
)
|
—
|
|
(47
|
)
|
(1,246
|
)
|
|||||||||||||||
|
Total
|
$
|
2,854
|
|
$
|
824
|
|
$
|
5,277
|
|
$
|
(199
|
)
|
$
|
(195
|
)
|
$
|
145
|
|
$
|
143
|
|
$
|
8,849
|
|
|||||||
|
(c)
|
Energy revenues include inter-segment sales primarily between Texas and both Reliant Energy and Green Mountain Energy.
|
|
(d)
|
Retail revenues include Green Mountain Energy retail revenues of $69 million for the period November 5, 2010, to December 31, 2010.
|
|
|
Year Ended December 31, 2009
|
||||||||||||||||||||||||||||||
|
|
Energy
Revenues
|
Capacity
Revenues
|
Retail
Revenues
|
Mark-to-
Market
Activities
|
Contract Amor-tization
|
Thermal Revenues
|
Other
Revenues
|
Total
Operating
Revenues
|
|||||||||||||||||||||||
|
|
(In millions)
|
||||||||||||||||||||||||||||||
|
Reliant Energy
(e)
|
$
|
—
|
|
$
|
—
|
|
$
|
4,440
|
|
$
|
—
|
|
$
|
(258
|
)
|
$
|
—
|
|
$
|
—
|
|
$
|
4,182
|
|
|||||||
|
Texas
|
2,770
|
|
193
|
|
—
|
|
(17
|
)
|
57
|
|
—
|
|
(57
|
)
|
2,946
|
|
|||||||||||||||
|
Northeast
|
873
|
|
407
|
|
—
|
|
(70
|
)
|
—
|
|
—
|
|
(9
|
)
|
1,201
|
|
|||||||||||||||
|
South Central
|
367
|
|
269
|
|
—
|
|
(17
|
)
|
22
|
|
—
|
|
(60
|
)
|
581
|
|
|||||||||||||||
|
West
|
26
|
|
122
|
|
—
|
|
—
|
|
—
|
|
—
|
|
2
|
|
150
|
|
|||||||||||||||
|
International
|
52
|
|
79
|
|
—
|
|
—
|
|
—
|
|
—
|
|
13
|
|
144
|
|
|||||||||||||||
|
Thermal
|
—
|
|
—
|
|
—
|
|
(2
|
)
|
—
|
|
137
|
|
—
|
|
135
|
|
|||||||||||||||
|
Corporate and Eliminations
(f)
|
(362
|
)
|
(47
|
)
|
—
|
|
(1
|
)
|
—
|
|
—
|
|
23
|
|
(387
|
)
|
|||||||||||||||
|
Total
|
$
|
3,726
|
|
$
|
1,023
|
|
$
|
4,440
|
|
$
|
(107
|
)
|
$
|
(179
|
)
|
$
|
137
|
|
$
|
(88
|
)
|
$
|
8,952
|
|
|||||||
|
(e)
|
For the period May 1, 2009, to December 31, 2009.
|
|
(f)
|
Energy revenues include inter-segment sales between Texas and Reliant Energy.
|
15
Operational Statistics
The following are industry statistics for the Company's fossil and nuclear plants, as defined by the North American Electric Reliability Council, or NERC, and are more fully described below:
Annual Equivalent Availability Factor, or EAF
— Measures the percentage of maximum generation available over time as the fraction of net maximum generation that could be provided over a defined period of time after all types of outages and deratings, including seasonal deratings, are taken into account.
Net heat rate
— The net heat rate represents the total amount of fuel in British Thermal Unit, or BTU, required to generate one net kWh provided.
Net Capacity Factor
— The net amount of electricity that a generating unit produces over a period of time divided by the net amount of electricity it could have produced if it had run at full power over that time period. The net amount of electricity produced is the total amount of electricity generated minus the amount of electricity used during generation.
The tables below present these performance metrics for the Company's U.S. power generation portfolio, including those accounted for through equity method investments, for the years ended December 31, 2011, and 2010:
|
|
Year Ended December 31, 2011
|
|||||||||||||
|
Fossil and Nuclear Plants
|
||||||||||||||
|
|
Net Owned
Capacity (MW)
|
Net
Generation
(MWh)
|
Annual
Equivalent
Availability
Factor
|
Average Net
Heat Rate
BTU/kWh
|
Net Capacity
Factor
|
|||||||||
|
|
(In thousands of MWh)
|
|||||||||||||
|
Texas
|
10,745
|
|
46,348
|
|
88.2
|
%
|
10,300
|
|
46.7
|
%
|
||||
|
Northeast
(a)
|
6,915
|
|
7,376
|
|
87.2
|
|
11,100
|
|
11.1
|
|
||||
|
South Central
|
4,125
|
|
16,000
|
|
89.9
|
|
9,700
|
|
43.9
|
|
||||
|
West
|
2,225
|
|
1,131
|
|
88.5
|
|
12,400
|
|
5.6
|
|
||||
|
|
Year Ended December 31, 2010
|
|||||||||||||
|
Fossil and Nuclear Plants
|
||||||||||||||
|
|
Net Owned
Capacity (MW)
|
Net
Generation
(MWh)
|
Annual
Equivalent
Availability
Factor
|
Average Net
Heat Rate
BTU/kWh
|
Net Capacity
Factor
|
|||||||||
|
|
(In thousands of MWh)
|
|||||||||||||
|
Texas
|
10,745
|
|
44,700
|
|
89.6
|
%
|
10,300
|
|
48.1
|
%
|
||||
|
Northeast
(a)
|
6,900
|
|
9,366
|
|
88.3
|
|
11,000
|
|
14.1
|
|
||||
|
South Central
(b)
|
4,125
|
|
11,168
|
|
91.3
|
|
10,500
|
|
41.9
|
|
||||
|
West
|
2,150
|
|
921
|
|
89.7
|
|
11,800
|
|
4.8
|
|
||||
|
(a)
|
Factor data and heat rate do not include the Keystone and Conemaugh facilities.
|
|
(b)
|
Includes Cottonwood for the period November 15, 2010 (acquisition date), to December 31, 2010.
|
16
The generation performance by region for the three years ended December 31, 2011, 2010, and 2009, is shown below:
|
|
Net Generation
|
|||||||
|
|
2011
|
2010
|
2009
|
|||||
|
|
(In thousands of MWh)
|
|||||||
|
Texas
|
|
|
||||||
|
Coal
|
30,256
|
|
29,633
|
|
30,023
|
|
||
|
Gas
(a)
|
5,949
|
|
4,794
|
|
5,224
|
|
||
|
Nuclear
(b)
|
8,960
|
|
9,295
|
|
9,396
|
|
||
|
Wind
|
1,183
|
|
978
|
|
350
|
|
||
|
Total Texas
|
46,348
|
|
44,700
|
|
44,993
|
|
||
|
Northeast
|
|
|
||||||
|
Coal
|
5,551
|
|
7,905
|
|
7,945
|
|
||
|
Oil
|
83
|
|
114
|
|
134
|
|
||
|
Gas
|
1,742
|
|
1,347
|
|
1,141
|
|
||
|
Total Northeast
|
7,376
|
|
9,366
|
|
9,220
|
|
||
|
South Central
|
|
|
||||||
|
Coal
|
10,865
|
|
10,778
|
|
10,235
|
|
||
|
Gas
(c)
|
5,135
|
|
390
|
|
163
|
|
||
|
Total South Central
|
16,000
|
|
11,168
|
|
10,398
|
|
||
|
West
|
|
|
||||||
|
Gas
|
1,052
|
|
869
|
|
639
|
|
||
|
Solar
|
79
|
|
52
|
|
1
|
|
||
|
Total West
|
1,131
|
|
921
|
|
640
|
|
||
|
(a)
|
MWh information reflects the undivided interest in total MWh generated by Cedar Bayou 4 beginning June 2009.
|
|
(b)
|
MWh information reflects the Company's undivided interest in total MWh generated by STP.
|
|
(c)
|
Includes Cottonwood since November 15, 2010 (acquisition date).
|
17
Market Framework
Texas
NRG's largest wholesale power generation business segment is located in Texas in the physical control areas of the ERCOT market. In addition, Reliant Energy, Green Mountain Energy and Energy Plus activities in Texas are subject to standards and regulations adopted by the PUCT and ERCOT. In the ERCOT market, NRG's Retail Businesses are certified by the PUCT as Retail Electric Providers, or REPs, to contract with end-users to sell electricity and provide other value-enhancing services. In addition, NRG's Retail Businesses contract with transmission and distribution service providers, or TDSPs, to arrange for transportation to the customer.
The ERCOT market is one of the nation's largest and historically fastest growing power markets. For 2011, hourly demand ranged from a low of approximately 22,000 MW to a high of over 68,000 MW with installed generation capacity of approximately 81,000 MW (24,000 MW from coal, lignite and nuclear plants, 48,000 MW from gas, and 9,000 MW from wind). The ERCOT market has limited interconnections compared to other markets in the United States.
In November 2010, the ERCOT board of directors approved a new target equilibrium reserve margin level of 13.75%. The summer reserve margin for 2011 was forecast to be 18.4% in ERCOT's May 2011 Capacity, Demand and Reserve Report, or CDR. The latest CDR, initially published in December 2011, but updated in January 2012, forecasts a reserve margin level of 13.86% for Summer 2012. There are currently plans being implemented by the PUCT to build a significant amount of transmission from west Texas, the Texas panhandle, and continuing across the state to enable wind generation to reach load. The ultimate impact on wholesale dynamics from these plans are unknown. Currently, due to its intermittency and Texas' typically lower wind speeds during the summer months, ERCOT utilizes a capacity factor of 8.7% for the installed wind units when calculating the summer reserve margins.
On December 1, 2010, in compliance with a rule adopted by the PUCT, ERCOT replaced the zonal wholesale market design with a nodal market design that is based on Location Marginal Prices, or LMPs. The new nodal market, operational for all of 2011, includes, among other design changes, a financially binding day-ahead energy and ancillary services market administered by ERCOT. The nodal market design has resulted in improved dispatch of generation resources, more efficient management of transmission congestion, and an improved ability to integrate increased quantities of intermittent resources, such as wind and solar generating resources. Transmission congestion costs in the nodal market are directly assigned to the parties causing the congestion.
In response to projected shortfalls in planning reserves, and real time supply constraints in August 2011, at the direction of the PUCT, the ERCOT Independent System Operator, or ISO, is developing and implementing a number of market rule changes designed to achieve real-time energy pricing more reflective of higher energy value when ISO operating reserves are scarce or constrained - and thus improve forward market pricing signals and provide incentives for resource investment. Energy offer floors for certain ancillary service deployments have been implemented; other proposals under review include administrative pricing adjustments during operational shortages, higher energy pricing for ISO unit commitments for capacity, mitigation of price dampening from minimum energy from on-line resources, and formalizing emergency supply procurement by the ISO in a manner that would not suppress competitive pricing.
18
Northeast
NRG's second largest asset base is located in the Northeast region of the United States with generation assets within the control areas of the NYISO, ISO-NE, and PJM. Although each of the three NYISOs, also referred to as Regional Transmission Organizations, or RTOs, and their respective energy markets are functionally, administratively and operationally independent, they all follow, to a certain extent, similar market designs. Each ISO optimizes the scheduling and dispatch of power plant capabilities and price offers to meet system energy and reliability needs, and settles financial and physical energy deliveries at LMPs. LMPs reflect the value of energy at the specific location and time it is delivered. The LMP is determined by dispatching generators with the least cost energy supply offers to create the most reliable and economic solution where the energy is needed, subject to reliability and operational constraints on the system or individual generators. The ISO-sponsored LMP energy markets consist of two separate and characteristically distinct settlement time-frames. The first time-frame is a financially firm, day-ahead unit commitment market. The second time-frame is a financially settled, real-time dispatch and balancing market that fluctuates over a 24 hour period. All of these LMP energy markets are subject to stringent market mitigation measures, which can result in lower prices associated with certain generating units that are mitigated because they are deemed to have locational market power. In addition to the energy markets, each of the Northeast ISOs operates a capacity market that provides an additional opportunity for generating and demand response resources to earn revenues to offset their fixed costs that are not recovered in the energy markets, and reserve markets.
NRG's Retail Businesses are active in a number of areas in the Northeast region that have introduced retail competition, which allows our businesses to competitively provide retail power, natural gas and other value-enhancing services to customers. Each retail choice state is responsible for its own retail competition laws and regulations, and the specific operational, licensing, and compliance requirements vary on a state-by-state basis. In general, our Retail Businesses purchase energy from the wholesale market and utilize the existing transmission and distribution system to provide that power to end-use customers. Primary factors in the success of retail competition include how the state provides and prices default service. Incumbent utilities currently provide default service and as a result typically serve a majority of residential customers. However, as customers become more informed about the many benefits of retail choice and states continue to implement retail policies to further improve market dynamics, retail choice is expected to grow. The Company's Retail Businesses are currently licensed in many of the states allowing for retail choice in either the Commercial, industrial and governmental/institutional, or C&I, or Residential markets. Our Retail Businesses are expanding into a number of competitive choice states and offering a plethora of value propositions to customers to meet individual consumer preferences.
South Central
NRG's South Central region operates primarily in the Southeastern Electric Reliability Council/Entergy, or SERC-Entergy, region, which is a bilateral market without an RTO. In the South Central region, all power sales and purchases are consummated bilaterally between individual counterparties. Transacting counterparties are required to procure transmission service from the relevant transmission owners at their Federal Energy Regulatory Commission, or FERC, -approved tariff rates. In this market structure, NRG is able to provide balancing authority services in addition to wholesale power that allows NRG to provide full requirement services to load-serving entities, thus making NRG a competitive alternative to the integrated utilities operating in the region. NRG operates four Balancing Authorities, including the LAGEN Balancing Authority, which encompasses the generating facilities, the Company's cooperative load, and certain municipal entities purchasing long-term firm power from NRG.
West & Solar
The Company operates a fast-growing fleet of Utility Scale Solar and Distributed Solar generating assets within the balancing authority of the California Independent System Operator, or CAISO, as well as neighboring systems, and operates a fleet of natural gas fired facilities located entirely within the CAISO footprint. The CAISO operates day-ahead and real-time locational markets for energy and ancillary services, while managing congestion through nodal price fluctuations. The CAISO system facilitates NRG's sale of power and capacity products at market-based rates, or bilaterally pursuant to tolling arrangements with California's load serving entities, or LSEs. The CAISO, in conjunction with the California Public Utilities Commission, or CPUC, also determines specific capacity requirements for specified local areas. Both CAISO and CPUC rules require LSEs to contract with sufficient generation resources in order to maintain minimum levels of generation within defined local reliability areas.
19
California's resource mix is being significantly shaped by California's renewable portfolio standard and its greenhouse gas reduction rules. In particular, the state's renewable portfolio standard is 33% by 2020. In part driven by the renewable portfolio standard, several LSEs have entered into long-term PPAs with the Company's California and Arizona-based Utility Scale Solar generating facilities. The Company currently has PPAs for over 890 MW of solar generation assets both within the CAISO balancing authority, and selected markets outside of California, including Arizona. These contracts were approved by the CPUC.
The renewable portfolio standard is also expected to drive the need for generation resources with increased operating flexibility. The need is expected to be particularly acute in constrained areas of the transmission system, such as the San Diego and Los Angeles local reliability areas in which the Company currently operates natural gas-fired generation. The projected retirement of older flexible gas-fired coastal generating units that utilize once-through cooling is also a significant driver of long-term prices in California. Implementing market mechanisms to procure the needed flexibility, and allocating the costs associated with this flexibility, are key CAISO 2012 initiatives. NRG's CAISO natural gas-fired assets are in the Los Angeles or San Diego local reliability areas, and may benefit from local capacity requirements. The Company's El Segundo Energy Center development, which is currently under construction and the subject of a long-term tolling agreement, is an example of the type of flexible natural gas-fired generation resource that the CAISO has suggested will be necessary to maintain system reliability. Longer term, NRG's California portfolio's locational advantage may be impacted by new transmission, which may affect load pocket procurement requirements, and by the state's goal for additional distributed generation, which may also be located within these constrained local areas.
20
New and On-going Company Initiatives and Development Projects
NRG has a comprehensive set of initiatives and development projects that supports its strategy focused on: (i) excellence in safety and enhanced operating performance; (ii) earning a margin by selling electricity to end-use customers; (iii) development of new renewable and conventional power generation projects and repowering of power generation assets at existing sites; (iv) empowering retail customers with distinctive products and services; (v) engaging in a proactive capital allocation plan; and (vi) pursuing selective acquisitions, joint ventures, divestitures and investment in new energy-related businesses and new technologies in order to enhance the Company's asset mix and combat climate change.
Renewable Development and Acquisitions
As part of its core strategy, NRG has started and intends to continue to invest significantly in the development and acquisition of renewable energy projects, primarily solar. NRG's renewable strategy is intended to capitalize on first mover advantage in a high growth segment of NRG's business, the Company's existing presence in regions with attractive renewable resources and the prevalence, in the Company's core markets, of state-mandated renewable portfolio standards. A brief description of the Company's development efforts with respect to each renewable technology follows.
Solar
NRG has acquired and is developing a number of solar projects utilizing photovoltaic, or PV, as well as solar thermal technologies. The following table is a brief summary of the Company's major Utility Scale Solar projects as of December 31, 2011, that are under construction.
|
NRG Owned Projects
|
Location
|
PPA
|
MW
(a)
|
Expected COD
|
Status
|
|
|
Ivanpah
|
Ivanpah, CA
|
20 - 25 year
|
392
|
|
2013
|
Under Construction
|
|
Agua Caliente
(b)
|
Yuma County, AZ
|
25 year
|
290
|
|
2012 - 2014
|
Under Construction
|
|
CVSR
|
San Luis Obispo, CA
|
25 year
|
250
|
|
2012 - 2013
|
Under Construction
|
|
Alpine
|
Lancaster, CA
|
20 year
|
66
|
|
2012
|
Under Construction
|
|
Borrego
|
Borrego Springs, CA
|
25 year
|
26
|
|
2012
|
Under Construction
|
|
Avra Valley
|
Pima County, AZ
|
25 year
|
25
|
|
2012
|
Under Construction
|
(a) Represents total project size.
(b) Includes a 30 MW block, which reached commercial operations on January 18, 2012.
Below is a summary of recent developments related to solar projects:
Ivanpah
—
On April 5, 2011, NRG acquired a 50.1% stake in the 392 MW Ivanpah Solar Electric Generation System, or Ivanpah, from BrightSource Energy, Inc., or BSE. BSE maintained a 21.8% interest in Ivanpah and the remaining 28.1% was acquired by a wholly-owned subsidiary of Google. Ivanpah is composed of three separate facilities - Ivanpah 1 (126 MW), Ivanpah 2 (133 MW), and Ivanpah 3 (133 MW). Operations for the first phase are scheduled to commence in the first quarter of 2013, with the second and third phases expected to reach commercial operations in the second and third quarters of 2013, respectively. Power generated from Ivanpah will be sold to Southern California Edison and Pacific Gas and Electric, under multiple 20 to 25 year PPAs. Ivanpah has entered into the Ivanpah Credit Agreement with the Federal Financing Bank, or FFB, which is guaranteed by the United States Department of Energy, or U.S. DOE, to borrow up to $1.6 billion to fund the construction of this solar facility. On June 10, 2011, the U.S. Fish and Wildlife Service, or FWS, issued a revised biological opinion allowing the Bureau of Land Management to lift its temporary suspension of activities order with respect to the Ivanpah Project, thus allowing those aspects of the project which were delayed to proceed.
Western Watershed Project filed a motion seeking a temporary restraining order against the Ivanpah Project on June 27, 2011, to shut the project down in order to protect the desert tortoise as well as other animals. It was denied as was plaintiff's request for a preliminary injunction. The plaintiffs appealed this decision on August 20, 2011 to the U.S. Court of Appeals for the Ninth Circuit. On January 27, 2012, the district court heard arguments on the parties' cross motions for summary judgment. The Company awaits the court's rulings.
21
Agua Caliente
—
On August 5, 2011, NRG acquired 100% of the 290 MW Agua Caliente solar project, or Agua Caliente, in Yuma, AZ. Operations are scheduled to commence in phases, with the first 30 MW block achieving commercial operations on January 19, 2012, and the final block scheduled to come on line in the first quarter of 2014. Power generated from Agua Caliente will be sold to Pacific Gas and Electric under a 25 year PPA. In connection with the acquisition, Agua Caliente Solar, LLC, a wholly-owned subsidiary of NRG, entered into the Agua Caliente Financing Agreement with the FFB, which is guaranteed by the U.S. DOE, to borrow up to $967 million to fund the construction of this solar facility.
On January 18, 2012, the Company completed the sale of a 49% interest in NRG Solar AC Holdings LLC, the indirect owner of the Agua Caliente project entity, to MidAmerican Energy Holdings Company, or MidAmerican. A portion of the cash consideration received at closing represented 49% of construction costs funded by NRG's equity contributions. MidAmerican will fund its proportionate share of future equity contributions and other credit support for the project.
CVSR
—
On September 30, 2011, NRG acquired 100% of the 250 MW California Valley Solar Ranch project, or CVSR, in eastern San Luis Obispo County, California. Power generated from CVSR will be sold to Pacific Gas and Electric under a 25 year PPA. In connection with the acquisition, High Plains Ranch II, LLC, a wholly-owned subsidiary of NRG, entered into the CVSR Financing Agreement with the FFB, which is guaranteed by the U.S. DOE, to borrow up to $1.2 billion to fund the construction of this solar facility. The Company continues to work with its partners and the U.S. DOE to satisfy all of the U.S. DOE loan disbursement requirements and funding is anticipated by the end of the first quarter of 2012. Operations are expected to commence in phases beginning in the third quarter of 2012 through the fourth quarter of 2013.
Utility Scale Solar Development Pipeline
NRG has a pipeline of solar development projects that currently total approximately 967 MW in generation capacity as of December 31, 2011. The projects in the pipeline, which were either acquired or internally developed, range in size from 20 MW to 238 MW, and have the potential to become operational between 2012 and 2018.
Distributed Solar
On September 28, 2011, the Company entered into an agreement with Prologis, Inc. to invest in a distributed generation project of up to 733 MW led by Prologis, which includes a U.S. DOE loan guarantee commitment of up to $1.4 billion.
On November 8, 2011, the Company acquired Solar Power Partners, or SPP, a leading developer of commercial and industrial Distributed Solar projects with 21 MW of Distributed Solar projects in operation or under construction. The acquisition combines the financial resources of NRG with the development and deal structuring capability of SPP to facilitate the build out of SPP's development pipeline of more than 300 MW of projects in early to late stage development in California, Hawaii, Arizona, Connecticut, New Mexico, Massachusetts, New Jersey, Ontario and Puerto Rico.
In furtherance of its Distributed Solar strategy, in December 2011, NRG announced that it will install solar power generating systems at MetLife Stadium, home of the New York Football Giants and New York Jets, as well as Gillette Stadium, home of the New England Patriots. In addition, it will install a solar power generating system at Patriot Place, a shopping, dining, and entertainment venue in Foxborough, Massachusetts. All of the Company's Distributed Solar projects are supported by long-term PPAs.
In support of the Company's solar generation strategy, in the fourth quarter of 2011, NRG Solar purchased solar panels in the aggregate amount of approximately $130 million from various equipment vendors, including SunPower Systems SARL, GCL Solar Energy, Inc., Solar Frontier Americas Inc. and Hanwha SolarOne (Qidong) Co., Ltd.. These transactions will provide economic benefits for designated Utility Scale Solar and Distributed Solar projects in the development pipeline as they are constructed and achieve commercial operation.
22
Retail Acquisition
On September 30, 2011, NRG acquired Energy Plus, a Philadelphia-based retail electricity and natural gas provider with a customer base principally in New York, Connecticut, Pennsylvania, New Jersey, Maryland, and Illinois. Energy Plus also sells electricity to retail customers in Texas and natural gas in Ohio, New York and New Jersey. As of December 31, 2011, Energy Plus had 188,000 customers from its retail and natural gas businesses combined. Through its rewards program offered through the company's exclusive marketing partnerships with leading loyalty program providers, Energy Plus provides NRG with an additional retail platform to expand its customer services and products in multiple retail markets.
Retail Growth Initiatives
Reliant Energy continues to expand its Reliant eSense
TM
product offerings. eSense is a suite of technology solutions that use the advanced meter system network (smart meters) that is being rolled out to customers in ERCOT. Through December 31, 2011, Reliant has 525,000 customers using one of these products that provide customers insights, choices and convenience solutions. Reliant's eSense development was accelerated by the U.S. DOE grant received during 2010.
Reliant also continues to expand its Home Solutions
SM
business with almost 220,000 customers utilizing home services products including protection products such as surge protection, in home power line protection, HVAC maintenance and energy efficiency products like air filter delivery and solar panel leasing.
Reliant Energy now offers commercial service in Delaware, Illinois, Maryland, New Jersey, Pennsylvania, and Washington, DC.
Electric Vehicle Infrastructure Development
NRG, through its subsidiary eVgo, continues its build out of the Houston and Dallas/Fort Worth Metroplex EV ecosystems, and the Company is on track to be the first company to equip an entire major market with the privately funded infrastructure needed for successful EV adoption and integration. As of December 2011, Houston had the largest single metropolitan-area network of DC fast chargers in the nation. eVgo offers consumers a subscription-based plan that locks in all charging requirements for EVs at a competitive monthly fee. Based upon the successful launch of its subscription-based business model in Texas, eVgo is evaluating a number of other geographical areas for expansion.
In September 2011, NRG, through its subsidiary, eV2g LLC, agreed to partner with the University of Delaware to develop vehicle-to-grid, or V2G, aggregation technology, a new EV infrastructure technology that manages the interaction of plugged-in electric vehicles with the electric grid to provide electricity supply and ancillary services including frequency regulation, demand response and other grid functions.
Post-combustion Carbon Capture Project
On March 9, 2010, NRG was selected by the U.S. DOE to receive up to $167 million, including funding from the American Recovery and Reinvestment Act, to build a 60 MW-equivalent post-combustion carbon capture demonstration unit at NRG's WA Parish plant southwest of Houston, with the intent of using the captured CO
2
in enhanced oil recovery operations in oil fields on the Texas Gulf Coast. In the first half of 2011, an application was submitted to and approved by the U.S. DOE to conduct a front-end engineering and design, or FEED, study for an up-to 250 MW sized project, which would allow for larger volumes of CO
2
production, leading to increased oil production through enhanced recovery efforts. The FEED study has been completed, and 50% of the costs of this phase were reimbursed by the U.S. DOE. To further the project's enhanced oil recovery operations, on October 3, 2011, Petra Nova LLC, a wholly-owned subsidiary of NRG, acquired a 50% interest in Texas Coastal Ventures, LLC, which owns a 100% working interest in the West Ranch oil field in Jackson County, Texas.
23
Energy Technology Ventures
On January 27, 2011, NRG entered into a joint venture with GE and ConocoPhillips to invest in venture-stage and growth-stage next generation energy technology companies. The joint venture, Energy Technology Ventures, will invest in and offer commercial collaboration opportunities to emerging energy technology companies in various sectors, including renewable power generation, smart grid, energy efficiency, emission controls, oil, natural gas, coal and biofuels. As of December 31, 2011, NRG has invested $14 million in several growth companies through Energy Technology Ventures as part of its plan to invest up to $100 million in this joint venture over four years.
Conventional Power Development
Projects Under Construction
The Company's El Segundo Energy Center LLC, or ESEC, commenced construction at its El Segundo Power Generating Station in El Segundo, California. Full notice to proceed with construction of the 550 MW fast start, gas turbine combined cycle generating facility was provided to the construction vendor on June 6, 2011. On August 23, 2011, the Company through its wholly owned subsidiary, NRG West Holdings LLC, entered into a credit agreement that established a loan facility with respect to ESEC consisting of a $540 million construction loan, $138 million in letter of credit facilities, and a revolving loan facility which permits working capital loans or letters of credit of up to $10 million. At the end of construction, the loan will convert to a term facility with semi annual amortization of principal and interest and a maturity date of August 31, 2023. The Company expects a commercial operation date of August 1, 2013.
24
Regulatory Matters
As operators of power plants and participants in wholesale and retail energy markets, certain NRG entities are subject to regulation by various federal and state government agencies. These include the Commodities Futures Trading Commission, or CFTC, FERC, NRC, and PUCT, as well as other public utility commissions in certain states where NRG's generating, thermal, or distributed generation assets are located. In addition, NRG is subject to the market rules, procedures and protocols of the various ISO markets in which it participates. Likewise, certain NRG entities participating in the retail markets are subject to rules and regulations established by the states in which NRG entities are licensed to sell at retail. NRG must also comply with the mandatory reliability requirements imposed by NERC and the regional reliability entities in the regions where the Company operates.
NRG's operations within the ERCOT footprint are not subject to rate regulation by the FERC, as they are deemed to operate solely within the ERCOT market and not in interstate commerce. As discussed below, these operations are subject to regulation by PUCT, as well as to regulation by the NRC with respect to the Company's ownership interest in STP.
CFTC
The CFTC, among other things, has regulatory oversight authority over the trading of electricity and gas commodities, including financial products and derivatives, under the Commodity Exchange Act, or CEA. On July 21, 2010, President Obama signed the Dodd-Frank Wall Street Reform and Consumer Protection Act, or the Dodd-Frank Act, which, among other things, aims to improve transparency and accountability in derivative markets. The Dodd-Frank Act increases the CFTC's regulatory authority on matters related to over-the-counter derivatives, market clearing, position reporting, and capital requirements. The Company expects that in 2012 the CFTC will clarify the scope of the Dodd-Frank Act and issue final rules concerning a central clearing and execution exemption for derivative end-users, margin requirements for transactions, the definition of a “swap” and other issues that will affect the Company's over-the-counter derivatives trading. Because there are many details that remain to be addressed in CFTC rulemaking proceedings, at this time we cannot measure the impact to the Company on its current operations or collateral requirements.
FERC
The FERC, among other things, regulates the transmission and the wholesale sale of electricity in interstate commerce under the authority of the Federal Power Act, or FPA. The transmission of electric energy occurring wholly within ERCOT is not subject to the FERC's jurisdiction under Sections 203 or 205 of the Federal Power Act. Under existing regulations, the FERC determines whether an entity owning a generation facility is an Exempt Wholesale Generator, or EWG, as defined in the Public Utility Holding Company Act of 2005, or PUHCA of 2005. The FERC also determines whether a generation facility meets the ownership and technical criteria of a Qualifying Facility, or QF, under Public Utility Regulatory Policies Act of 1978, or PURPA. Each of NRG's non-ERCOT U.S. generating facilities qualifies as a QF, or the subsidiary owning the facility qualifies as an EWG.
Federal Power Act
— The FPA gives the FERC exclusive rate-making jurisdiction over the wholesale sale of electricity and transmission of electricity in interstate commerce. Under the FPA, the FERC, with certain exceptions, regulates the owners of facilities used for the wholesale sale of electricity or transmission in interstate commerce as public utilities, and establishes market rules that are just and reasonable.
Public utilities are required to obtain the FERC's acceptance, pursuant to Section 205 of the FPA, of their rate schedules for the wholesale sale of electricity. All of NRG's non-QF generating and power marketing entities located outside of ERCOT make sales of electricity pursuant to market-based rates, as opposed to traditional cost-of-service regulated rates. Every three years FERC conducts a review of the Company's market based rates and potential market power on a regional basis. In 2011, FERC approved NRG's market power update filing for its Northeast assets.
The FPA also gives the FERC jurisdiction to review certain transactions and numerous other activities of public utilities. Section 203 of the FPA requires the FERC's prior approval for the transfer of control of assets subject to the FERC's jurisdiction. Section 204 of the FPA gives the FERC jurisdiction over a public utility's issuance of securities or assumption of liabilities. However, the FERC typically grants blanket approval for future securities issuances and the assumption of liabilities to entities with market-based rate authority.
25
In accordance with the Energy Policy Act of 2005, or EPAct of 2005, the FERC has approved the NERC as the national Energy Reliability Organization, or ERO. As the ERO, NERC is responsible for the development and enforcement of mandatory reliability standards for the wholesale electric power system. In addition to complying with NERC requirements, each NRG entity must comply with the requirements of the regional reliability entity for the region in which it is located.
Public Utility Holding Company Act of 2005
— PUHCA of 2005 provides the FERC with certain authority over and access to books and records of public utility holding companies not otherwise exempt by virtue of their ownership of EWGs, QFs, and Foreign Utility Companies, or FUCOs. NRG is a public utility holding company, but because all of the Company's generating facilities have QF status or are owned through EWGs, it is exempt from the accounting, record retention, and reporting requirements of the PUHCA of 2005.
Public Utility Regulatory Policies Act
— PURPA was passed in 1978 in large part to promote increased energy efficiency and development of independent power producers. PURPA created QFs to further both goals, and the FERC is primarily charged with administering PURPA as it applies to QFs. Certain QFs are exempt from regulation, either in whole or in part, under the FPA as public utilities.
NRC
The NRC is authorized under the Atomic Energy Act of 1954, as amended, or the AEA, among other things, to grant licenses for, and regulate the operation of, commercial nuclear power reactors. As a holder of an ownership interest in STP, NRG is an NRC licensee and is subject to NRC regulation. The NRC license gives the Company the right to only possess an interest in STP but not to operate it. Operating authority under the NRC operating license for STP is held by STPNOC. NRC regulation involves licensing, inspection, enforcement, testing, evaluation, and modification of all aspects of plant design and operation including the right to order a plant shutdown, technical and financial qualifications, and decommissioning funding assurance in light of NRC safety and environmental requirements. In addition, NRC's written approval is required prior to a licensee transferring an interest in its license, either directly or indirectly. As a possession-only licensee, i.e., non-operating co-owner, the NRC's regulation of NRG is primarily focused on the Company's ability to meet its financial and decommissioning funding assurance obligations. In connection with the NRC license, the Company and its subsidiaries have a support agreement to provide up to $120 million to support operations at STP.
Decommissioning Trusts
— Upon expiration of the operation licenses for the two generating units at STP, currently scheduled for 2027 and 2028, the co-owners of STP are required under federal law to decontaminate and decommission the STP facility. Under NRC regulations, a power reactor licensee generally must pre-fund the full amount of its estimated NRC decommissioning obligations unless it is a rate-regulated utility, or a state or municipal entity that sets its own rates, or has the benefit of a state-mandated non-bypassable charge available to periodically fund the decommissioning trust such that the trust, plus allowable earnings, will equal the estimated decommissioning obligations by the time the decommissioning is expected to begin.
NRG, through its 44% ownership interest, is the beneficiary of decommissioning trusts that have been established to provide funding for decontamination and decommissioning of STP. CenterPoint Energy Houston Electric, LLC, or CenterPoint, and American Electric Power, or AEP, collect, through rates or other authorized charges to their electric utility customers, amounts designated for funding NRG's portion of the decommissioning of the facility. See also Item 15 — Note 7,
Nuclear Decommissioning Trust Fund,
to the Consolidated Financial Statements for additional discussion.
In the event that the funds from the trusts are ultimately determined to be inadequate to decommission the STP facilities, the original owners of the Company's STP interests, CenterPoint and AEP, each will be required to collect, through their PUCT-authorized non-bypassable rates or other charges to customers, additional amounts required to fund NRG's obligations relating to the decommissioning of the facility. Following the completion of the decommissioning, if surplus funds remain in the decommissioning trusts, those excesses will be refunded to the respective rate payers of CenterPoint or AEP, or their successors.
26
PUCT
The Company's Texas generation subsidiaries are registered as power generation companies with the PUCT. The PUCT also has jurisdiction over power generation companies with regard to their sales in the wholesale markets, the implementation of measures to address undue market power or price volatility, and the administration of nuclear decommissioning trusts. The PUCT exercises its jurisdiction both directly, and indirectly, through its oversight of the ERCOT, the regional transmission organization. Certain of the Company's subsidiaries within the Texas region are also subject to regulatory oversight as a power marketer or as a Qualified Scheduling Entity. NRG Power Marketing, LLC, or PML, is registered as a power marketer with the PUCT and thus is also subject to the jurisdiction of the PUCT with respect to its sales in the ERCOT. Certain of the Company's retail entities are competitive REPs, and as such are subject to the rules and regulations of the PUCT governing REPs.
New York State Public Service Commission, or NYSPSC
The Company's NYSPSC generation subsidiaries are electric corporations subject to "lightened" regulation by the NYSPSC. As such, the NYSPSC exercises its jurisdictional authority over certain non-rate aspects of the facilities, including safety, retirements, and the issuance of debt secured by recourse to the Company's generation assets located in New York. The Company currently has blanket authorization from the NYSPSC for the issuance of $15 billion of debt.
Regional Regulatory Developments
In New England, New York, the Mid-Atlantic region, the Midwest and California, the FERC has approved regional transmission organizations, also commonly referred to as ISOs. Most of these ISOs administer a wholesale centralized bid-based spot market in their regions pursuant to tariffs approved by the FERC and associated ISO market rules. These tariffs/market rules dictate how the capacity and energy markets operate, how market participants may make bilateral sales with one another, and how entities with market-based rates are compensated within those markets. The ISOs in these regions also control access to and the operation of the transmission grid within their regions. In Texas, pursuant to a 1999 restructuring statute, the PUCT granted similar responsibilities to the ERCOT. NRG is affected by rule/tariff changes that occur in the ISO regions.
For further discussion on regulatory developments see Item 15 — Note 23,
Regulatory Matters,
to the Consolidated Financial Statements.
Texas Region
Nuclear Regulatory Commission, or NRC, Task Force Report
— On July 12, 2011, the NRC Near-Term Task Force, or the Task Force, issued its report, which reviewed nuclear processes and regulations in light of the accident at the Fukushima Daiichi Nuclear Power Station in Japan. The Task Force concluded that U.S. nuclear plants are operating safely and did not identify changes to the existing nuclear licensing process nor recommend fundamental changes to spent nuclear fuel storage. The Task Force report made recommendations in three key areas: the NRC's regulatory framework, specific plant design requirements, and emergency preparedness and actions. STPNOC expects the report to be the first step in a longer-term review that the NRC will conduct, along with seeking broad stakeholder input. STPNOC continues to apply lessons learned and work with regulators and industry organizations on appropriate assessments and actions.
On January 13, 2012, the NRC issued six draft “information request letters,” seeking industry comment on additional recommendations made by the Near-Term Task Force. Topics for comment include how to improve the robustness of existing emergency preparedness plans, whether to mandate on-site availability of emergency response materials, and guidance on how to identify sites vulnerable to flooding, seismic events, or other natural external hazards (such as hurricanes and tornadoes). The NRC has requested feedback from nuclear utilities on its proposed measures. Until further actions are taken by the NRC, the Company cannot predict the impact of the recommendations in the NRC Task Force report, and could be required to make additional investments at STP Units 1 & 2.
Northeast Region
New England
— On April 13, 2011, FERC issued an order addressing proposed amendments submitted by ISO-NE to its Forward Capacity Market, or FCM, design, as well as two pending complaints. Among other market revisions, FERC's order extends the price floor for “at least” the fifth (2014/2015) and sixth (2015/2016) Forward Capacity Auctions in order to address the effect of historical out-of-market capacity. On January 19, 2012, FERC issued an order largely denying rehearing of its prior decision. The January 19 order also approved ISO-NE's request to eliminate the price floor as of the seventh (2016/2017) Forward Capacity Auction.
27
New York
—
On November 30, 2010, the NYISO filed at FERC its proposed installed capacity demand curves for 2011/2012, 2012/2013, and 2013/2014. The demand curves are a critical determinant of capacity market prices. The Company and other market participants protested the NYISO's filing, and on January 28, 2011, FERC found in favor of generators on a number of issues principally related to determining the cost of new entry and the resulting adjustments to the demand curves should positively affect capacity clearing prices. On May 19, 2011, FERC granted rehearing to remove property taxes from the cost of new entry of new in-city generation, denied other requests for rehearing, and directed the NYISO to make a series of compliance filings to implement the new rate. On September 15, 2011, FERC issued an order accepting the NYISO's compliance filing, and directing the NYISO to implement the new rate, to take effect November 1, 2011. On December 15, 2011, FERC issued an order denying rehearing of its May 19, 2011, order. The Company and other independent generators with interests in the New York City capacity market have requested judicial review of FERC's December 15, 2011, order.
In addition, on June 3, 2011, as amended on June 15, 2011, several New York in-city generators filed a complaint with FERC seeking additional transparency into: whether (i) the NYISO was correctly evaluating if new entrants into the capacity markets should be subject to mitigation and, if so, (ii) the NYISO was appropriately setting the level of any mitigation. On June 29, 2011, the NYISO released its July spot capacity auction clearing prices for New York City, which significantly decreased over June clearing prices. Clearing prices for the third quarter 2011 were comparable to the July clearing prices. The apparent cause of this decrease was a decision by the NYISO to allow a new entrant to bid into the July spot capacity auction, either without mitigation or without proper mitigation. Additionally, another new entrant has since indicated that it also received a mitigation exemption from NYISO and that it intends to begin participating in the NYISO capacity market starting with the May 2012 capability period. The addition of this second new entrant may further affect capacity clearing prices in New York. On July 10, 2011, in response to the July spot auction capacity clearing prices, two independent generators filed a second complaint alleging that the NYISO had improperly exempted both new entrants from mitigation, and requested that FERC immediately direct the NYISO to apply its offer-floor market mitigation rules to both new entrants, to resettle the July capacity spot auction, and other relief. The Company filed at FERC in support of applying offer-floor mitigation to the new entrants. On August 31, 2011, FERC issued an interim order on the second complaint directing the NYISO to provide additional information, on a confidential basis, regarding its mitigation decisions, which were filed on September 23, 2011. Several market participants, including the Company, filed comments in response. Both complaints are pending before FERC.
PJM
— On April 12, 2011, FERC issued an order addressing a complaint filed by PJM Power Providers Group seeking to require PJM to address the potential adverse impacts of out-of-market generation on the PJM capacity market, as well as PJM's subsequent submission seeking revisions to the capacity market design, in particular the Minimum Offer Price Rule, or MOPR. In its order, FERC generally strengthened the MOPR and the protections against market price distortion from out-of-market generation. On November 17, 2011, FERC largely denied rehearing of its April 12, 2011, order. Several parties have appealed FERC's decision to federal court, and those appeals have been consolidated in the Third Circuit Court of Appeals. The outcome of this proceeding could affect the Company's ability to meet its obligations under New Jersey's Long-Term Capacity Agreement Pilot Program.
South Central Region
On April 25, 2011, Entergy Corporation, or Entergy, announced that it will pursue joining the Midwest Independent System Operator regional transmission organization, or MISO, with a current target date for joining of December 2013. Entergy's proposal is subject to approval from the regulatory commissions of the states of Arkansas, Louisiana, Mississippi, and Texas, as well as the City of New Orleans. The Company's South Central region is dependent upon Entergy's transmission system to conduct its business, and thus would necessarily move with Entergy into MISO. This development is not expected to materially impact the Company's ability to serve its customers in the region, and the Company is continuing to analyze the impact of the possible changes in transmission access and market design.
West Region
California
— On March 17, 2011, FERC issued an order on CAISO's proposal to replace its interim backstop Capacity Procurement Mechanism, or CPM, with a permanent version. On December 23, 2011, the parties to the proceeding submitted a proposed settlement that increases the price, quantity and term of contracts given to generating units not otherwise contracted to fulfill California's Resource Adequacy requirements, but nevertheless needed for reliability. The settlement is subject to FERC approval and may increase payments to any non-contracted units called upon to provide reliability service.
28
Environmental Matters
NRG is subject to a wide range of environmental regulations across a broad number of jurisdictions in the development, ownership, construction and operation of domestic and international projects. These laws and regulations generally require that governmental permits and approvals be obtained before construction and during operation of power plants. Environmental laws have become increasingly stringent and NRG expects this trend to continue. The electric generation industry will face new requirements to address air emissions, climate change, combustion byproducts and water use. In general, future laws and regulations are expected to require the addition of emission controls or other environmental quality equipment or the imposition of certain restrictions on the operations of the Company's facilities. NRG expects that future liability under, or compliance with, environmental requirements could have a material effect on the Company's operations or competitive position.
Climate Change
— NRG emits GHGs in the process of generating electricity. The following table shows the reduction in CO
2
, which makes up greater than 99% of the Company's GHG emissions, from 2000 to the present. NRG anticipates reductions in its future emissions profile as the Company implements its strategy to add more renewable sources like wind and solar, modernize the fleet through Repowering, improve generation efficiencies, explore methods to capture CO
2
, and seeks ways to offset GHGs.
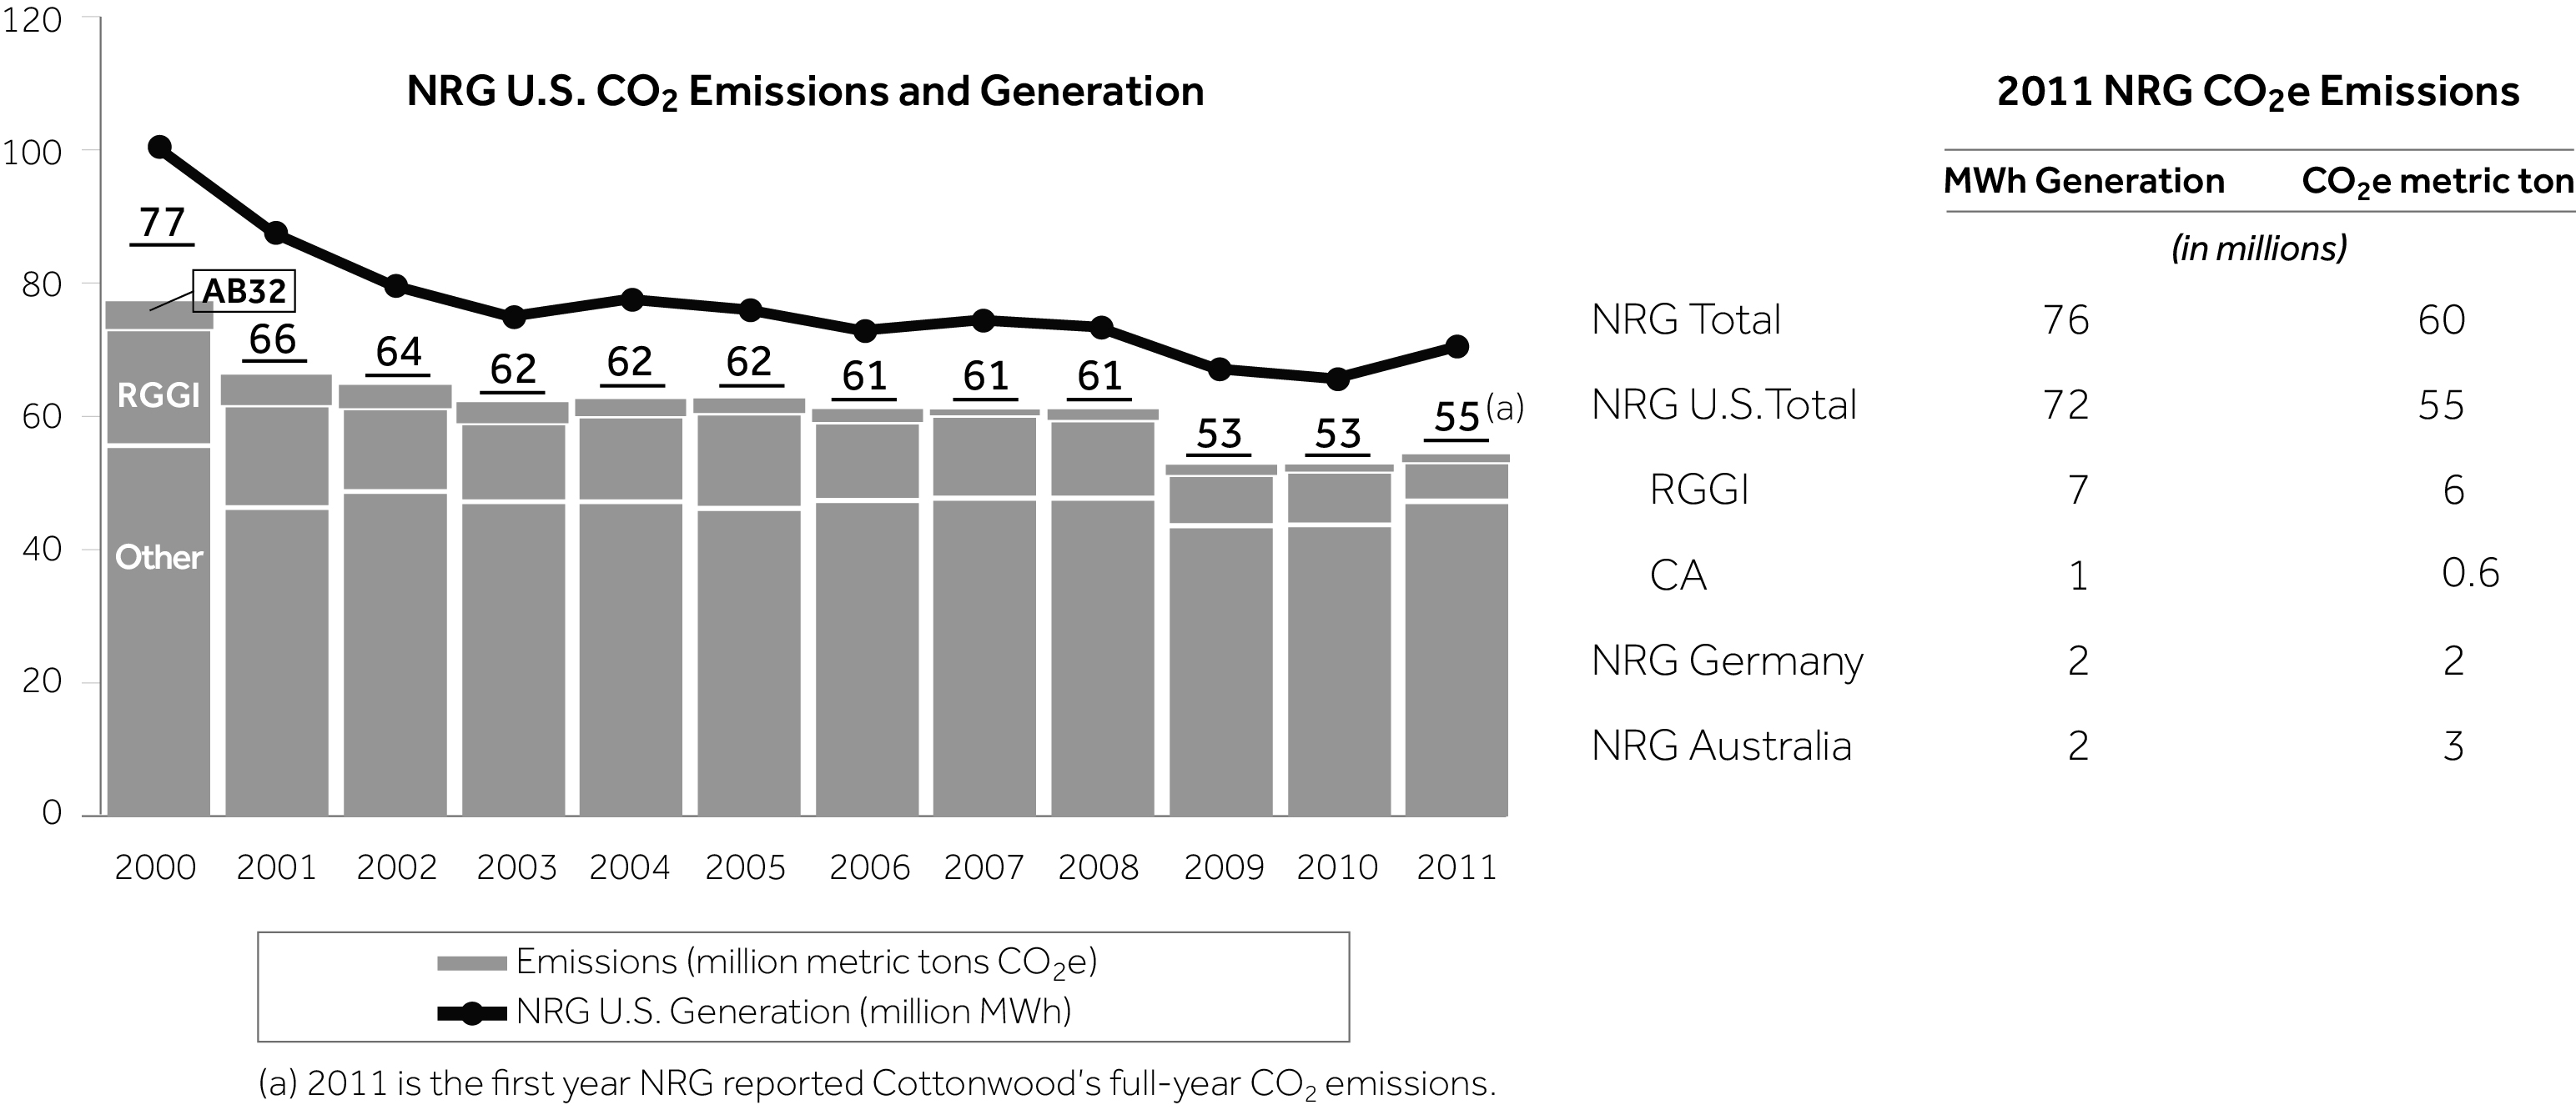
The impact from legislation or federal, regional or state regulation of GHGs on the Company's financial performance will depend on a number of factors, including the level of GHG standards under any such regulations, the applicability of offsets, and the extent to which NRG would be entitled to receive CO
2
emissions credits without having to purchase them in an auction or on the open market. Thereafter, under any such legislation or regulation, the impact on NRG would depend on the Company's level of success in developing and deploying low and no carbon technologies.
Federal Environmental Initiatives
Environmental Regulatory Landscape
— In 2011, a number of U.S. Environmental Protection Agency, or U.S. EPA, air regulations were finalized providing more clarity on the impact to electric generating units. A number of regulations with the potential for impact are still in development or under review by the U.S. EPA: New Source Performance Standards, or NSPS, for GHGs, National Ambient Air Quality Standards, or NAAQS, revisions, coal combustion byproducts, and once-through cooling. While most of these regulations have been considered for some time, the outcomes and any resulting impact on NRG cannot be fully predicted until the rules are finalized. The timing and stringency of these regulations will contribute to a framework for the retrofit of existing fossil plants and deployment of new, cleaner technologies in the next decade. See discussion below for more detail.
29
Air
— The U.S. EPA released the Cross-State Air Pollution Rule, or CSAPR, on July 7, 2011, with additional proposed updates on October 6, 2011. CSAPR was scheduled to replace the Clean Air Interstate Rule, or CAIR, on January 1, 2012. It was designed to bring states into attainment with PM 2.5 and ozone NAAQS, reducing SO
2
and NO
x
emissions from power plants. The proposed implementation employed cap and trade allowance programs starting in 2012 for Group 1 SO
2
, Group 2 SO
2
, Annual NO
x
, and Ozone Season NO
x
. In 2014, the SO
2
cap would be further reduced in Group 1 states. Under CSAPR, use of Acid Rain SO
2
and NO
x
allowances for CAIR would be discontinued and replaced with these completely distinct allowance programs. Acid Rain allowances would still be required on a 1:1 basis under the Acid Rain Program. NRG owns or has minority interests in plants in six states that would be covered by the rule. No plant impairments nor material capital investment were expected for NRG facilities to comply with CSAPR.
|
State
|
Group 1 SO
2
|
Group 2 SO
2
|
Annual NO
x
|
Ozone NO
x
|
|
IL
|
X
|
X
|
X
|
|
|
LA
|
X
|
|||
|
MD
|
X
|
X
|
X
|
|
|
NY
|
X
|
X
|
X
|
|
|
PA
|
X
|
X
|
X
|
|
|
TX
|
X
|
X
|
X
|
|
In the third quarter 2011, the Company recorded an impairment charge of $160 million on the Company's Acid Rain Program SO
2
emission allowances, which were recorded as an intangible asset on the Company's balance sheet. The impairment charge reflects the write-off under CSAPR of the value of emission allowances in excess of those required for compliance with the Acid Rain Program.
CSAPR was challenged by numerous petitioners. On December 30, 2011, the U.S. Court of Appeals for the District of Columbia Circuit stayed the rule pending resolution of the numerous petitions for judicial review. CAIR will remain in effect during the stay. The court has implemented briefing schedules that would allow the CSAPR appeal to be heard as early as April 2012. The Company is unable to predict the final outcome of the court proceeding. There is no material impact to NRG related to the stay.
On March 16, 2011, the U.S. EPA released the proposed Mercury and Air Toxics Standards, or MATS, to control emissions of hazardous air pollutants from coal and oil fired electric generating units. The rule was signed in final form on December 16, 2011, but has not yet been published in the Federal Register (the timing of which will set compliance dates). Requirements include meeting the standards for mercury, acid gases, and certain metals (such as particulate matter) in 2015 on a plantwide basis with the potential for a one year extension. NRG does not anticipate any plant impairments or capital expenditures beyond the current environmental capital expenditures schedule.
On September 22, 2011, the U.S. EPA released draft guidance on the development and submission of state implementation plans, or SIPs, for the 1-hour SO
2
standard that was finalized in 2010. States will have to identify areas of non-attainment and submit SIPs by June 2013 and demonstrate attainment by August 2017. If any areas in which NRG owns coal-fired power plants were ultimately designated as non-attainment, it could require further SO
2
controls. The Company cannot determine the impact, if any, of the NAAQS until the rules are final.
On December 20, 2011, the U.S. EPA published their intended designations for the 2008 ozone standard. Designations for counties/parishes in which NRG has power plants remained largely unchanged. The U.S. EPA intends to release final designations in the spring of 2012 and a final rule by July 2014. NRG cannot determine the impact, if any, of these NAAQS until the rules are final.
30
Waste
— On May 4, 2010, the U.S. EPA proposed two options for the regulation of coal combustion residue, commonly known as coal ash. Under the Proposal's first regulatory option, the U.S. EPA would reverse its August 1993 and May 2000 Bevill Regulatory Determinations and list coal ash as a special waste subject to regulation under hazardous waste regulations. The second regulatory option would leave the Bevill Determination in place and regulate disposal of coal ash as non-hazardous. Under both options, an exemption for the beneficial use of coal ash would remain in place. Additionally, under both options, the U.S. EPA would establish dam safety requirements to address the structural integrity of surface impoundments. While it is not possible to predict the impact of this rule until it is final, as proposed it is not expected to have a material impact on NRG's operations, as all NRG flyash disposal sites are dry landfills. However, should the U.S. EPA implement the hazardous waste option, NRG may incur significant costs due to loss of markets for beneficial reuse. Given the recent release of this proposed rule, NRG will continue to monitor developments and their respective impact on the Company's operations
Water
— In July 2004, the U.S. EPA published rules governing cooling water intake structures at existing power facilities commonly referred to as the 316(b) Rule. As a result of a decision by the U.S. Court of Appeals for the Second Circuit, the U.S. EPA suspended the rule in July 2007 while preparing a revised version. On March 28, 2011, the U.S. EPA released the proposed 316(b) Rule. States such as California and New York moved ahead with their own more stringent requirements for once-through cooled units, which are expected to satisfy the requirements of the proposed 316(b) Rule. NRG expects to comply with these requirements with a mix of intake and operational modifications.
Regional U.S. Environmental Initiatives
Northeast
On July 20, 2011, the New York State Department of Environmental Conservation, or NYDEC, announced the State's final policy on cooling water intake structures, confirming the Company's planned capital expenditure for cooling water intakes in that state. NRG expects to comply with these requirements with a mix of intake and operational modifications.
West
The California Air Resources Board adopted the state's GHG cap-and-trade program under Assembly Bill 32, or AB32, on October 20, 2011. Participation by the electric generation sector will begin in 2013. NRG does not expect implementation of the GHG cap-and-trade program in California to have a significant adverse financial impact on the Company for a variety of reasons, including the fact that the portion of NRG's California portfolio that is merchant consists mainly of natural gas-fired facilities and the market price of power when dispatched is expected to have embedded in it the market price of allowances. The contracted portion of NRG's portfolio included pass-through language with respect to the obligation to purchase allowances. New NRG renewable projects in California markets will support AB32 requirements for the increased use of renewable energy.
The California statewide 316(b) policy to mitigate once-through cooling was effective as of October 1, 2010. NRG's affected plants submitted alternative plans to meet equivalent mitigation criteria which are reflected in our current schedule of environmental capital expenditures. Specified compliance dates for NRG's El Segundo and Encina power plants are December 31, 2015, and December 31, 2017, respectively.
South Central Region
On February 11, 2009, the U.S. Department of Justice, or U.S. DOJ, acting at the request of the U.S. EPA commenced a lawsuit against Louisiana Generating, LLC in the United States District Court in the Middle District of Louisiana alleging violations of the Clean Air Act, or CAA, at the Big Cajun II power plant. This is the same matter for which Notice of Violations, or NOVs, were issued to Louisiana Generating, LLC on February 15, 2005, and on December 8, 2006. Further discussion on this matter can be found in Item 3 — Legal Proceedings
, United States of America v. Louisiana Generating, LLC
.
Environmental Capital Expenditures
Based on current rules, technology and plans, NRG has estimated that environmental capital expenditures from 2012 through 2016 to meet NRG's environmental commitments will be approximately $553 million. These costs are primarily associated with mercury controls to satisfy MATS on the Company's Big Cajun II, W.A. Parish and Limestone facilities and a number of intake modification projects across the fleet under state or proposed federal 316(b) rules. NRG continues to explore cost effective compliance alternatives to reduce costs. A more detailed discussion of environmental capital expenditures can be found in Item 7,
Management's Discussion and Analysis of Financial Condition and Results of Operations - Liquidity and Capital Resources, Capital Expenditures
and
Environmental Capital Expenditures.
31
Domestic Site Remediation Matters
Under certain federal, state and local environmental laws and regulations, a current or previous owner or operator of any facility, including an electric generating facility, may be required to investigate and remediate releases or threatened releases of hazardous or toxic substances or petroleum products at the facility. NRG may also be held liable to a governmental entity or to third parties for property damage, personal injury and investigation and remediation costs incurred by a party in connection with hazardous material releases or threatened releases. These laws, including the Comprehensive Environmental Response, Compensation and Liability Act of 1980 as amended by the Superfund Amendments and Reauthorization Act of 1986, or SARA, impose liability without regard to whether the owner knew of or caused the presence of the hazardous substances, and the courts have interpreted liability under such laws to be strict (without fault) and joint and several. Cleanup obligations can often be triggered during the closure or decommissioning of a facility, in addition to spills or other occurrences during its operations. Further discussions of affected NRG sites can be found in Item 15 —
Note 24
,
Environmental Matters
, to the Consolidated Financial Statements.
Nuclear Waste
— The federal government's program to construct a nuclear waste repository at Yucca Mountain, Nevada was discontinued in 2010. In order to meet the federal government's obligations to safely manage used nuclear fuel and radioactive waste under the U.S. Nuclear Waste Policy Act of 1982, the U.S. DOE established a blue ribbon commission to explore alternatives. Also consistent with the Act, owners of nuclear plants, including the owners of STP, entered into contracts setting out the obligations of the owners and the U.S. DOE, including the fees to be paid by the owners for the U.S. DOE's services. Since 1998, the U.S. DOE has been in default on its obligations to begin removing spent nuclear fuel and high-level radioactive waste from reactors, necessitating each site to take steps to construct interim spent fuel storage installations. STP has sufficient capacity in its spent fuel pool through 2016 at which time its dry cask storage facility will be ready for operation.
Under the federal Low-Level Radioactive Waste Policy Act of 1980, as amended, the state of Texas is required to provide, either on its own or jointly with other states in a compact, for the disposal of all low-level radioactive waste generated within the state. STP's warehouse capacity is adequate for on-site storage until a site in Andrews County, Texas becomes fully operational.
Employees
As of December 31, 2011, NRG had 5,193 employees, approximately 28% of whom were covered by U.S. bargaining agreements. During 2011, the Company did not experience any labor stoppages or labor disputes at any of its facilities.
Available Information
NRG's annual reports on Form 10-K, quarterly reports on Form 10-Q, current reports on Form 8-K, and amendments to those reports filed or furnished pursuant to section 13(a) or 15(d) of the Securities Exchange Act of 1934, as amended, or Exchange Act, are available free of charge through the Company's website, www.nrgenergy.com, as soon as reasonably practicable after they are electronically filed with, or furnished to the United States Securities and Exchange Commission, or SEC. The Company also routinely posts press releases, presentations, webcasts, and other information regarding the Company on the Company's website.
32
Many of NRG's power generation facilities operate, wholly or partially, without long-term power sale agreements.
Many of NRG's facilities operate as "merchant" facilities without long-term power sales agreements for some or all of their generating capacity and output, and therefore are exposed to market fluctuations. Without the benefit of long-term power sales agreements for these assets, NRG cannot be sure that it will be able to sell any or all of the power generated by these facilities at commercially attractive rates or that these facilities will be able to operate profitably. This could lead to future impairments of the Company's property, plant and equipment or to the closing of certain of its facilities, resulting in economic losses and liabilities, which could have a material adverse effect on the Company's results of operations, financial condition or cash flows.
NRG's financial performance may be impacted by changing natural gas prices, significant and unpredictable price fluctuations in the wholesale power markets and other market factors that are beyond the Company's control.
A significant percentage of the Company's domestic revenues are derived from baseload power plants that are fueled by coal. In many of the competitive markets where NRG operates, the price of power typically is set by natural gas-fired power plants that generally have higher variable costs than NRG's coal-fired baseload power plants. This allows the Company's baseload coal generation assets to earn attractive operating margins compared to plants fueled by natural gas. A decrease in natural gas prices could result in a corresponding decrease in the market price of power that could significantly reduce the operating margins of the Company's baseload generation assets and materially and adversely impact its financial performance.
At low enough natural gas prices, gas plants become more economical than coal generation. In such a price environment, the Company's coal units cycle more often or even shut down until prices or load increases enough to justify running them again.
In addition, because changes in power prices in the markets where NRG operates are generally correlated with changes in natural gas prices, NRG's hedging portfolio includes natural gas derivative instruments to hedge power prices for its baseload generation. If this correlation between power prices and natural gas prices is not maintained and a change in gas prices is not proportionately offset by a change in power prices, the Company's natural gas hedges may not fully cover this differential. This could have a material adverse impact on the Company's cash flow and financial position.
Market prices for power, capacity and ancillary services tend to fluctuate substantially. Unlike most other commodities, electric power can only be stored on a very limited basis and generally must be produced concurrently with its use. As a result, power prices are subject to significant volatility from supply and demand imbalances, especially in the day-ahead and spot markets. Long- and short-term power prices may also fluctuate substantially due to other factors outside of the Company's control, including:
|
•
|
changes in generation capacity in the Company's markets, including the addition of new supplies of power from existing competitors or new market entrants as a result of the development of new generation plants, expansion of existing plants or additional transmission capacity;
|
|
•
|
electric supply disruptions, including plant outages and transmission disruptions;
|
|
•
|
changes in power transmission infrastructure;
|
|
•
|
fuel transportation capacity constraints;
|
|
•
|
weather conditions;
|
|
•
|
changes in the demand for power or in patterns of power usage, including the potential development of demand-side management tools and practices;
|
|
•
|
development of new fuels and new technologies for the production of power;
|
|
•
|
development of new technologies for the production of natural gas
|
|
•
|
regulations and actions of the ISOs; and
|
|
•
|
federal and state power market and environmental regulation and legislation.
|
These factors have caused the Company's operating results to fluctuate in the past and will continue to cause them to do so in the future.
33
NRG's costs, results of operations, financial condition and cash flows could be adversely impacted by disruption of its fuel supplies.
NRG relies on coal, oil and natural gas to fuel a majority of its power generation facilities. Delivery of these fuels to the facilities is dependent upon the continuing financial viability of contractual counterparties as well as upon the infrastructure (including rail lines, rail cars, barge facilities, roadways, and natural gas pipelines) available to serve each generation facility. As a result, the Company is subject to the risks of disruptions or curtailments in the production of power at its generation facilities if a counterparty fails to perform or if there is a disruption in the fuel delivery infrastructure.
NRG has sold forward a substantial portion of its baseload power in order to lock in long-term prices that it deemed to be favorable at the time it entered into the forward sale contracts. In order to hedge its obligations under these forward power sales contracts, the Company has entered into long-term and short-term contracts for the purchase and delivery of fuel. Many of the forward power sales contracts do not allow the Company to pass through changes in fuel costs or discharge the power sale obligations in the case of a disruption in fuel supply due to force majeure events or the default of a fuel supplier or transporter. Disruptions in the Company's fuel supplies may therefore require it to find alternative fuel sources at higher costs, to find other sources of power to deliver to counterparties at a higher cost, or to pay damages to counterparties for failure to deliver power as contracted. Any such event could have a material adverse effect on the Company's financial performance.
NRG also buys significant quantities of fuel on a short-term or spot market basis. Prices for all of the Company's fuels fluctuate, sometimes rising or falling significantly over a relatively short period of time. The price NRG can obtain for the sale of energy may not rise at the same rate, or may not rise at all, to match a rise in fuel or delivery costs. This may have a material adverse effect on the Company's financial performance. Changes in market prices for natural gas, coal and oil may result from the following:
|
•
|
weather conditions;
|
|
•
|
seasonality;
|
|
•
|
demand for energy commodities and general economic conditions;
|
|
•
|
disruption or other constraints or inefficiencies of electricity, gas or coal transmission or transportation;
|
|
•
|
additional generating capacity;
|
|
•
|
availability and levels of storage and inventory for fuel stocks;
|
|
•
|
natural gas, crude oil, refined products and coal production levels;
|
|
•
|
changes in market liquidity;
|
|
•
|
federal, state and foreign governmental regulation and legislation; and
|
|
•
|
the creditworthiness and liquidity and willingness of fuel suppliers/transporters to do business with the Company.
|
NRG's plant operating characteristics and equipment, particularly at its coal-fired plants, often dictate the specific fuel quality to be combusted. The availability and price of specific fuel qualities may vary due to supplier financial or operational disruptions, transportation disruptions and force majeure. At times, coal of specific quality may not be available at any price, or the Company may not be able to transport such coal to its facilities on a timely basis. In this case, the Company may not be able to run the coal facility even if it would be profitable. Operating a coal facility with different quality coal can lead to emission or operating problems. If the Company had sold forward the power from such a coal facility, it could be required to supply or purchase power from alternate sources, perhaps at a loss. This could have a material adverse impact on the financial results of specific plants and on the Company's results of operations.
34
There may be periods when NRG will not be able to meet its commitments under forward sale obligations at a reasonable cost or at all.
A substantial portion of the output from NRG's baseload facilities has been sold forward under fixed price power sales contracts through 2014, and the Company also sells forward the output from its intermediate and peaking facilities when it deems it commercially advantageous to do so. Because the obligations under most of these agreements are not contingent on a unit being available to generate power, NRG is generally required to deliver power to the buyer, even in the event of a plant outage, fuel supply disruption or a reduction in the available capacity of the unit. To the extent that the Company does not have sufficient lower cost capacity to meet its commitments under its forward sale obligations, the Company would be required to supply replacement power either by running its other, higher cost power plants or by obtaining power from third-party sources at market prices that could substantially exceed the contract price. If NRG fails to deliver the contracted power, it would be required to pay the difference between the market price at the delivery point and the contract price, and the amount of such payments could be substantial.
In the South Central region, NRG has long-term contracts with rural cooperatives that require it to serve all of the cooperatives' requirements at prices that generally reflect the costs of coal-fired generation. During limited peak demand periods, the load requirements of these contract customers exceed the baseload capacity of NRG's coal-fired Big Cajun II plant. During such peak demand periods, NRG employs its intermediate and/or peaking facilities. Depending upon the then-current gas commodity pricing, NRG's financial returns from its South Central region could be negatively impacted for a limited period if the cost of its intermediate and/or peaking power is at higher prices than can be recovered under the Company's contracts.
NRG's trading operations and the use of hedging agreements could result in financial losses that negatively impact its results of operations.
The Company typically enters into hedging agreements, including contracts to purchase or sell commodities at future dates and at fixed prices, in order to manage the commodity price risks inherent in its power generation operations. These activities, although intended to mitigate price volatility, expose the Company to other risks. When the Company sells power forward, it gives up the opportunity to sell power at higher prices in the future, which not only may result in lost opportunity costs but also may require the Company to post significant amounts of cash collateral or other credit support to its counterparties. The Company also relies on counterparty performance under its hedging agreements and is exposed to the credit quality of its counterparties under those agreements. Further, if the values of the financial contracts change in a manner that the Company does not anticipate, or if a counterparty fails to perform under a contract, it could harm the Company's business, operating results or financial position.
NRG does not typically hedge the entire exposure of its operations against commodity price volatility. To the extent it does not hedge against commodity price volatility, the Company's results of operations and financial position may be improved or diminished based upon movement in commodity prices.
NRG may engage in trading activities, including the trading of power, fuel and emissions allowances that are not directly related to the operation of the Company's generation facilities or the management of related risks. These trading activities take place in volatile markets and some of these trades could be characterized as speculative. The Company would expect to settle these trades financially rather than through the production of power or the delivery of fuel. This trading activity may expose the Company to the risk of significant financial losses which could have a material adverse effect on its business and financial condition.
NRG may not have sufficient liquidity to hedge market risks effectively.
The Company is exposed to market risks through its power marketing business, which involves the sale of energy, capacity and related products and the purchase and sale of fuel, transmission services and emission allowances. These market risks include, among other risks, volatility arising from location and timing differences that may be associated with buying and transporting fuel, converting fuel into energy and delivering the energy to a buyer.
NRG undertakes these marketing activities through agreements with various counterparties. Many of the Company's agreements with counterparties include provisions that require the Company to provide guarantees, offset of netting arrangements, letters of credit, a first lien on assets and/or cash collateral to protect the counterparties against the risk of the Company's default or insolvency. The amount of such credit support that must be provided typically is based on the difference between the price of the commodity in a given contract and the market price of the commodity. Significant movements in market prices can result in the Company being required to provide cash collateral and letters of credit in very large amounts. The effectiveness of the Company's strategy may be dependent on the amount of collateral available to enter into or maintain these contracts, and liquidity requirements may be greater than the Company anticipates or will be able to meet. Without a sufficient amount of working capital to post as collateral in support of performance guarantees or as a cash margin, the Company may not be able to manage price volatility effectively or to implement its strategy. An increase in the amount of letters of credit or cash collateral required to be provided to the Company's counterparties may negatively affect the Company's liquidity and financial condition.
35
Further, if any of NRG's facilities experience unplanned outages, the Company may be required to procure replacement power at spot market prices in order to fulfill contractual commitments. Without adequate liquidity to meet margin and collateral requirements, the Company may be exposed to significant losses, may miss significant opportunities, and may have increased exposure to the volatility of spot markets.
The accounting for NRG's hedging activities may increase the volatility in the Company's quarterly and annual financial results.
NRG engages in commodity-related marketing and price-risk management activities in order to financially hedge its exposure to market risk with respect to electricity sales from its generation assets, fuel utilized by those assets and emission allowances.
NRG generally attempts to balance its fixed-price physical and financial purchases and sales commitments in terms of contract volumes and the timing of performance and delivery obligations through the use of financial and physical derivative contracts. These derivatives are accounted for in accordance with the Financial Accounting Standards Board, or FASB, Accounting Standard Codification, or ASC, 815,
Derivatives and Hedging,
or ASC 815, which requires the Company to record all derivatives on the balance sheet at fair value with changes in the fair value resulting from fluctuations in the underlying commodity prices immediately recognized in earnings, unless the derivative qualifies for cash flow hedge accounting treatment. Whether a derivative qualifies for cash flow hedge accounting treatment depends upon it meeting specific criteria used to determine if the cash flow hedge is and will remain appropriate for the term of the derivative. All economic hedges may not necessarily qualify for cash flow hedge accounting treatment. As a result, the Company's quarterly and annual results are subject to significant fluctuations caused by changes in market prices.
Competition in wholesale power markets may have a material adverse effect on NRG's results of operations, cash flows and the market value of its assets.
NRG has numerous competitors in all aspects of its business, and additional competitors may enter the industry. Because many of the Company's facilities are old, newer plants owned by the Company's competitors are often more efficient than NRG's aging plants, which may put some of these plants at a competitive disadvantage to the extent the Company's competitors are able to consume the same or less fuel as the Company's plants consume. Over time, the Company's plants may be squeezed out of their markets, or may be unable to compete with these more efficient plants.
In NRG's power marketing and commercial operations, it competes on the basis of its relative skills, financial position and access to capital with other providers of electric energy in the procurement of fuel and transportation services, and the sale of capacity, energy and related products. In order to compete successfully, the Company seeks to aggregate fuel supplies at competitive prices from different sources and locations and to efficiently utilize transportation services from third-party pipelines, railways and other fuel transporters and transmission services from electric utilities.
Other companies with which NRG competes with may have greater liquidity, greater access to credit and other financial resources, lower cost structures, more effective risk management policies and procedures, greater ability to incur losses, longer-standing relationships with customers, greater potential for profitability from ancillary services or greater flexibility in the timing of their sale of generation capacity and ancillary services than NRG does.
NRG's competitors may be able to respond more quickly to new laws or regulations or emerging technologies, or to devote greater resources to the construction, expansion or refurbishment of their power generation facilities than NRG can. In addition, current and potential competitors may make strategic acquisitions or establish cooperative relationships among themselves or with third parties. Accordingly, it is possible that new competitors or alliances among current and new competitors may emerge and rapidly gain significant market share. There can be no assurance that NRG will be able to compete successfully against current and future competitors, and any failure to do so would have a material adverse effect on the Company's business, financial condition, results of operations and cash flow.
36
Operation of power generation facilities involves significant risks and hazards customary to the power industry that could have a material adverse effect on NRG's revenues and results of operations. NRG may not have adequate insurance to cover these risks and hazards.
The ongoing operation of NRG's facilities involves risks that include the breakdown or failure of equipment or processes, performance below expected levels of output or efficiency and the inability to transport the Company's product to its customers in an efficient manner due to a lack of transmission capacity. Unplanned outages of generating units, including extensions of scheduled outages due to mechanical failures or other problems occur from time to time and are an inherent risk of the Company's business. Unplanned outages typically increase the Company's operation and maintenance expenses and may reduce the Company's revenues as a result of selling fewer MWh or require NRG to incur significant costs as a result of running one of its higher cost units or obtaining replacement power from third parties in the open market to satisfy the Company's forward power sales obligations. NRG's inability to operate the Company's plants efficiently, manage capital expenditures and costs, and generate earnings and cash flow from the Company's asset-based businesses could have a material adverse effect on the Company's results of operations, financial condition or cash flows. While NRG maintains insurance, obtains warranties from vendors and obligates contractors to meet certain performance levels, the proceeds of such insurance, warranties or performance guarantees may not be adequate to cover the Company's lost revenues, increased expenses or liquidated damages payments should the Company experience equipment breakdown or non-performance by contractors or vendors.
Power generation involves hazardous activities, including acquiring, transporting and unloading fuel, operating large pieces of rotating equipment and delivering electricity to transmission and distribution systems. In addition to natural risks such as earthquake, flood, lightning, hurricane and wind, other hazards, such as fire, explosion, structural collapse and machinery failure are inherent risks in the Company's operations. These and other hazards can cause significant personal injury or loss of life, severe damage to and destruction of property, plant and equipment, contamination of, or damage to, the environment and suspension of operations. The occurrence of any one of these events may result in NRG being named as a defendant in lawsuits asserting claims for substantial damages, including for environmental cleanup costs, personal injury and property damage and fines and/or penalties. NRG maintains an amount of insurance protection that it considers adequate, but the Company cannot provide any assurance that its insurance will be sufficient or effective under all circumstances and against all hazards or liabilities to which it may be subject. A successful claim for which the Company is not fully insured could hurt its financial results and materially harm NRG's financial condition. Further, due to rising insurance costs and changes in the insurance markets, NRG cannot provide any assurance that its insurance coverage will continue to be available at all or at rates or on terms similar to those presently available. Any losses not covered by insurance could have a material adverse effect on the Company's financial condition, results of operations or cash flows.
Maintenance, expansion and refurbishment of power generation facilities involve significant risks that could result in unplanned power outages or reduced output and could have a material adverse effect on NRG's results of operations, cash flow and financial condition.
Many of NRG's facilities are old and require periodic upgrading and improvement. Any unexpected failure, including failure associated with breakdowns, forced outages or any unanticipated capital expenditures could result in reduced profitability.
NRG cannot be certain of the level of capital expenditures that will be required due to changing environmental and safety laws and regulations (including changes in the interpretation or enforcement thereof), needed facility repairs and unexpected events (such as natural disasters or terrorist attacks). The unexpected requirement of large capital expenditures could have a material adverse effect on the Company's liquidity and financial condition.
If NRG makes any major modifications to its power generation facilities, the Company may be required to install the best available control technology or to achieve the lowest achievable emission rates as such terms are defined under the new source review provisions of the federal Clean Air Act. Any such modifications would likely result in substantial additional capital expenditures.
37
The Company may incur additional costs or delays in the development, construction and operation of new plants, improvements to existing plants, or the implementation of environmental control equipment at existing plants and may not be able to recover their investment or complete the project.
The Company is in the process of developing or constructing new generation facilities, improving its existing facilities; and adding environmental controls to its existing facilities. The development, construction, expansion, modification and refurbishment of power generation facilities involve many additional risks, including:
|
•
|
the inability to receive U.S. DOE loan guarantees, funding or cash grants;
|
|
•
|
delays in obtaining necessary permits and licenses;
|
|
•
|
the inability to sell down interests in a project or develop successful partnering relationships;
|
|
•
|
environmental remediation of soil or groundwater at contaminated sites;
|
|
•
|
interruptions to dispatch at the Company's facilities;
|
|
•
|
supply interruptions;
|
|
•
|
work stoppages;
|
|
•
|
labor disputes;
|
|
•
|
weather interferences;
|
|
•
|
unforeseen engineering, environmental and geological problems;
|
|
•
|
unanticipated cost overruns;
|
|
•
|
exchange rate risks; and
|
|
•
|
failure of contracting parties to perform under contracts, including EPC contractors.
|
Any of these risks could cause NRG's financial returns on new investments to be lower than expected, or could cause the Company to operate below expected capacity or availability levels, which could result in lost revenues, increased expenses, higher maintenance costs and penalties. Insurance is maintained to protect against these risks, warranties are generally obtained for limited periods relating to the construction of each project and its equipment in varying degrees, and contractors and equipment suppliers are obligated to meet certain performance levels. The insurance, warranties or performance guarantees, however, may not be adequate to cover increased expenses. As a result, a project may cost more than projected and may be unable to fund principal and interest payments under its construction financing obligations, if any. A default under such a financing obligation could result in losing the Company's interest in a power generation facility.
Furthermore, where the Company has partnering relationships with a third party, the Company is subject to the viability and performance of the third party. The Company's inability to find a replacement contracting party, particularly an EPC contractor, where the original contracting party has failed to perform, could result in the abandonment of the development and/or construction of such project, while the Company could remain obligated on other agreements associated with the project, including PPAs.
If the Company is unable to complete the development or construction of a facility or environmental control, or decides to delay, downsize, or cancel such project, it may not be able to recover its investment in that facility or environmental control. Furthermore, if construction projects are not completed according to specification, the Company may incur liabilities and suffer reduced plant efficiency, higher operating costs and reduced net income.
NRG and its subsidiaries have guaranteed the performance of third parties, which may result in substantial costs in the event of non-performance.
NRG and its subsidiaries have issued certain guarantees of the performance of others, which obligate NRG and its subsidiaries to perform in the event that the third parties do not perform. In the event of non-performance by the third parties, NRG could incur substantial cost to fulfill their obligations under these guarantees. Such performance guarantees could have a material impact on the operating results, financial condition, or cash flows of the Company.
38
The Company's development programs are subject to financing and public policy risks that could adversely impact NRG's financial performance or result in the abandonment of such development projects.
While NRG currently intends to develop and finance the more capital intensive projects on a non-recourse or limited recourse basis through separate project financed entities, and intends to seek additional investments in most of these projects from third parties, NRG anticipates that it will need to make significant equity investments in these projects. NRG may also decide to develop and finance some of the projects, such as smaller gas-fired and renewable projects, using corporate financial resources rather than non-recourse debt, which could subject NRG to significant capital expenditure requirements and to risks inherent in the development and construction of new generation facilities. In addition to providing some or all of the equity required to develop and build the proposed projects, NRG's ability to finance these projects on a non-recourse basis is contingent upon a number of factors, including the terms of the EPC contracts, construction costs, PPAs and fuel procurement contracts, capital markets conditions, the availability of tax credits and other government incentives for certain new technologies. To the extent NRG is not able to obtain non-recourse financing for any project or should the credit rating agencies attribute a material amount of the project finance debt to NRG's credit, the financing of the development projects could have a negative impact on the credit ratings of NRG.
NRG may also choose to undertake the repowering, refurbishment or upgrade of current facilities based on the Company's assessment that such activity will provide adequate financial returns. Such projects often require several years of development and capital expenditures before commencement of commercial operations, and key assumptions underpinning a decision to make such an investment may prove incorrect, including assumptions regarding construction costs, timing, available financing and future fuel and power prices.
Furthermore, the viability of the Company's renewable development projects are largely contingent on public policy mechanisms including production and investment tax credits, cash grants, loan guarantees, accelerated depreciation tax benefits, renewable portfolio standards, or RPS, and carbon trading plans. These mechanisms have been implemented at the state and federal levels to support the development of renewable generation, demand-side and smart grid, and other clean infrastructure technologies. The availability and continuation of public policy support mechanisms will drive a significant part of the economics and viability of the Company's development program and expansion into clean energy investments.
Supplier and/or customer concentration at certain of NRG's facilities may expose the Company to significant financial credit or performance risks.
NRG often relies on a single contracted supplier or a small number of suppliers for the provision of fuel, transportation of fuel and other services required for the operation of certain of its facilities. If these suppliers cannot perform, the Company utilizes the marketplace to provide these services. There can be no assurance that the marketplace can provide these services as, when and where required.
At times, NRG relies on a single customer or a few customers to purchase all or a significant portion of a facility's output, in some cases under long-term agreements that account for a substantial percentage of the anticipated revenue from a given facility. The Company has also hedged a portion of its exposure to power price fluctuations through forward fixed price power sales and natural gas price swap agreements. Counterparties to these agreements may breach or may be unable to perform their obligations. NRG may not be able to enter into replacement agreements on terms as favorable as its existing agreements, or at all. If the Company was unable to enter into replacement PPA's, the Company would sell its plants' power at market prices. If the Company is unable to enter into replacement fuel or fuel transportation purchase agreements, NRG would seek to purchase the Company's fuel requirements at market prices, exposing the Company to market price volatility and the risk that fuel and transportation may not be available during certain periods at any price.
The failure of any supplier or customer to fulfill its contractual obligations to NRG could have a material adverse effect on the Company's financial results. Consequently, the financial performance of the Company's facilities is dependent on the credit quality of, and continued performance by, suppliers and customers.
39
NRG relies on power transmission facilities that it does not own or control and that are subject to transmission constraints within a number of the Company's core regions. If these facilities fail to provide NRG with adequate transmission capacity, the Company may be restricted in its ability to deliver wholesale electric power to its customers and the Company may either incur additional costs or forego revenues. Conversely, improvements to certain transmission systems could also reduce revenues.
NRG depends on transmission facilities owned and operated by others to deliver the wholesale power it sells from the Company's power generation plants to its customers. If transmission is disrupted, or if the transmission capacity infrastructure is inadequate, NRG's ability to sell and deliver wholesale power may be adversely impacted. If a region's power transmission infrastructure is inadequate, the Company's recovery of wholesale costs and profits may be limited. If restrictive transmission price regulation is imposed, the transmission companies may not have sufficient incentive to invest in expansion of transmission infrastructure. The Company cannot also predict whether transmission facilities will be expanded in specific markets to accommodate competitive access to those markets.
In addition, in certain of the markets in which NRG operates, energy transmission congestion may occur and the Company may be deemed responsible for congestion costs if it schedules delivery of power between congestion zones during times when congestion occurs between the zones. If NRG were liable for such congestion costs, the Company's financial results could be adversely affected.
The Company has a significant amount of generation located in load pockets, making that generation valuable, particularly with respect to maintaining the reliability of the transmission grid. Expansion of transmission systems to reduce or eliminate these load pockets could negatively impact the value or profitability of the Company's existing facilities in these areas.
Because NRG owns less than a majority of some of its project investments, the Company cannot exercise complete control over their operations.
NRG has limited control over the operation of some project investments and joint ventures because the Company's investments are in projects where it beneficially owns less than a majority of the ownership interests. NRG seeks to exert a degree of influence with respect to the management and operation of projects in which it owns less than a majority of the ownership interests by negotiating to obtain positions on management committees or to receive certain limited governance rights, such as rights to veto significant actions. However, the Company may not always succeed in such negotiations. NRG may be dependent on its co-venturers to operate such projects. The Company's co-venturers may not have the level of experience, technical expertise, human resources management and other attributes necessary to operate these projects optimally. The approval of co-venturers also may be required for NRG to receive distributions of funds from projects or to transfer the Company's interest in projects.
Future acquisition activities may have adverse effects.
NRG may seek to acquire additional companies or assets in the Company's industry or which complement the Company's industry. The acquisition of companies and assets is subject to substantial risks, including the failure to identify material problems during due diligence, the risk of over-paying for assets, the ability to retain customers and the inability to arrange financing for an acquisition as may be required or desired. Further, the integration and consolidation of acquisitions requires substantial human, financial and other resources and, ultimately, the Company's acquisitions may not be successfully integrated. There can be no assurances that any future acquisitions will perform as expected or that the returns from such acquisitions will support the indebtedness incurred to acquire them or the capital expenditures needed to develop them.
NRG's business is subject to substantial governmental regulation and may be adversely affected by legislative or regulatory changes, as well as liability under, or any future inability to comply with, existing or future regulations or requirements.
NRG's business is subject to extensive foreign, and U.S. federal, state and local laws and regulation. Compliance with the requirements under these various regulatory regimes may cause the Company to incur significant additional costs, and failure to comply with such requirements could result in the shutdown of the non-complying facility, the imposition of liens, fines, and/or civil or criminal liability.
Public utilities under the FPA are required to obtain FERC acceptance of their rate schedules for wholesale sales of electricity. Except for ERCOT generating facilities and power marketers, all of NRG's non-qualifying facility generating companies and power marketing affiliates in the U.S. make sales of electricity in interstate commerce and are public utilities for purposes of the FPA. The FERC has granted each of NRG's generating and power marketing companies that make sales of electricity outside of ERCOT the authority to sell electricity at market-based rates. The FERC's orders that grant NRG's generating and power marketing companies market-based rate authority reserve the right to revoke or revise that authority if the FERC subsequently determines that NRG can exercise market power in transmission or generation, create barriers to entry, or engage in abusive affiliate transactions.
40
In addition, NRG's market-based sales are subject to certain market behavior rules, and if any of NRG's generating and power marketing companies were deemed to have violated one of those rules, they are subject to potential disgorgement of profits associated with the violation and/or suspension or revocation of their market-based rate authority. If NRG's generating and power marketing companies were to lose their market-based rate authority, such companies would be required to obtain the FERC's acceptance of a cost-of-service rate schedule and could become subject to the accounting, record-keeping, and reporting requirements that are imposed on utilities with cost-based rate schedules. This could have an adverse effect on the rates NRG charges for power from its facilities.
NRG is also affected by legislative and regulatory changes, as well as changes to market design, market rules, tariffs, cost allocations, and bidding rules that occur in the existing ISOs. The ISOs that oversee most of the wholesale power markets impose, and in the future may continue to impose, mitigation, including price limitations, offer caps, and other mechanisms to address some of the volatility and the potential exercise of market power in these markets. These types of price limitations and other regulatory mechanisms may have an adverse effect on the profitability of NRG's generation facilities that sell energy and capacity into the wholesale power markets.
The regulatory environment has undergone significant changes in the last several years due to state and federal policies affecting wholesale and retail competition and the creation of incentives for the addition of large amounts of new renewable generation and, in some cases, transmission. These changes are ongoing and the Company cannot predict the future design of the wholesale power markets or the ultimate effect that the changing regulatory environment will have on NRG's business. In addition, in some of these markets, interested parties have proposed material market design changes, including the elimination of a single clearing price mechanism, as well as proposals to re-regulate the markets or require divestiture by generating companies to reduce their market share. Other proposals to re-regulate may be made and legislative or other attention to the electric power market restructuring process may delay or reverse the deregulation process. If competitive restructuring of the electric power markets is reversed, discontinued, or delayed, the Company's business prospects and financial results could be negatively impacted.
NRG cannot predict at this time the outcome of the ongoing efforts by the CFTC to implement the Dodd-Frank Act and to increase the regulation of over-the-counter derivatives including those related to energy commodities. The CFTC efforts are seeking, among other things, increased clearing of such derivatives through clearing organizations and the increased standardization of contracts, products, and collateral requirements. Such changes could negatively impact NRG's ability to hedge its portfolio in an efficient, cost-effective manner by, among other things, limiting NRG's ability to utilize liens as collateral and decreasing liquidity in the forward commodity markets. The Company expects that in 2012 the CFTC will clarify the scope of the Dodd-Frank Act and issue final rules concerning a central clearing and execution exemption for derivative end-users, margin requirements for transactions, the definition of a “swap” and other issues that will affect the Company's over-the-counter derivatives trading.
NRG's ownership interest in a nuclear power facility subjects the Company to regulations, costs and liabilities uniquely associated with these types of facilities.
Under the Atomic Energy Act of 1954, as amended, or AEA, operation of STP, of which NRG indirectly owns a 44.0% interest, is subject to regulation by the NRC. Such regulation includes licensing, inspection, enforcement, testing, evaluation and modification of all aspects of nuclear reactor power plant design and operation, environmental and safety performance, technical and financial qualifications, decommissioning funding assurance and transfer and foreign ownership restrictions. NRG's 44% share of the output of STP represents approximately 1,175 MW of generation capacity.
There are unique risks to owning and operating a nuclear power facility. These include liabilities related to the handling, treatment, storage, disposal, transport, release and use of radioactive materials, particularly with respect to spent nuclear fuel, and uncertainties regarding the ultimate, and potential exposure to, technical and financial risks associated with modifying or decommissioning a nuclear facility. The NRC could require the shutdown of the plant for safety reasons or refuse to permit restart of the unit after unplanned or planned outages. New or amended NRC safety and regulatory requirements may give rise to additional operation and maintenance costs and capital expenditures. STP may be obligated to continue storing spent nuclear fuel if the U.S. DOE continues to fail to meet its contractual obligations to STP made pursuant to the U.S. Nuclear Waste Policy Act of 1982 to accept and dispose of STP's spent nuclear fuel. See also Item 1
—
Environmental Matters — U.S. Federal Environmental Initiatives — Nuclear Waste
for further discussion. Costs associated with these risks could be substantial and have a material adverse effect on NRG's results of operations, financial condition or cash flow. In addition, to the extent that all or a part of STP is required by the NRC to permanently or temporarily shut down or modify its operations, or is otherwise subject to a forced outage, NRG may incur additional costs to the extent it is obligated to provide power from more expensive alternative sources — either NRG's own plants, third party generators or the ERCOT — to cover the Company's then existing forward sale obligations. Such shutdown or modification could also lead to substantial costs related to the storage and disposal of radioactive materials and spent nuclear fuel.
41
While STP maintains property and liability insurance for losses related to nuclear operations, there may be limitations on the amounts and types of insurance commercially available. An accident at STP or another nuclear facility could have a material adverse effect on NRG's financial condition, its operational results, or liquidity as losses may exceed the insurance coverage available and/or may result in the obligation to pay retrospective premium obligations.
NRG is subject to environmental laws and regulations that impose extensive and increasingly stringent requirements on the Company's ongoing operations, as well as potentially substantial liabilities arising out of environmental contamination. These environmental requirements and liabilities could adversely impact NRG's results of operations, financial condition and cash flows.
NRG's business is subject to the environmental laws and regulations of foreign, federal, state and local authorities. The Company must comply with numerous environmental laws and regulations and obtain numerous governmental permits and approvals to operate the Company's plants. Should NRG fail to comply with any environmental requirements that apply to its operations, the Company could be subject to administrative, civil and/or criminal liability and fines, and regulatory agencies could take other actions seeking to curtail the Company's operations. In addition, when new requirements take effect or when existing environmental requirements are revised, reinterpreted or subject to changing enforcement policies, NRG's business, results of operations, financial condition and cash flows could be adversely affected.
Environmental laws and regulations have generally become more stringent over time, and the Company expects this trend to continue. Regulations currently under revision by the U.S. EPA, including the 316 (b) rule to mitigate impact by once-through cooling, could result in tighter standards or reduced compliance flexibility. While the NRG fleet employs advanced controls and utilizes industry's best practices, new regulations to address tightened National Ambient Air Quality Standards, or NAAQS, limit GHG emissions or restrict ash handling at coal-fired power plants could also further affect plant operations.
Policies at the national, regional and state levels to regulate GHG emissions could adversely impact NRG's result of operations, financial condition and cash flows.
NRG's GHG emissions for 2011 can be found in Item 1,
Business
-
Environmental Matters.
The impact of further legislation or regulation of GHGs on the Company's financial performance will depend on a number of factors, including the level of GHG standards, the extent to which mitigation is required, the applicability of offsets, and the extent to which NRG would be entitled to receive CO
2
emissions credits without having to purchase them in an auction or on the open market
The Company operates generating units in Connecticut, Delaware, Maryland, Massachusetts, and New York that are subject to the Regional Greenhouse Gas Initiative, or RGGI. While 2009 through 2011 RGGI CO
2
allowance prices have remained low, the impact of RGGI on future power prices (and thus on the Company's financial performance), indirectly through generators seeking to pass through the cost of their CO
2
emissions, cannot be predicted.
In addition, under certain conditions, GHG emissions from power plants are subject to existing sections of the CAA including Prevention of Significant Deterioration and New Source Review, or PSD/NSR, and Title V permitting. Implementation practices under the PSD/NSR and GHG performance standards that may be set under Section 111 will determine the extent to which power plant operations are affected over time.
Hazards customary to the power production industry include the potential for unusual weather conditions, which could affect fuel pricing and availability, the Company's route to market or access to customers, i.e. transmission and distribution lines, or critical plant assets. To the extent that climate change contributes to the frequency or intensity of weather related events, NRG's operations and planning process could be impacted.
NRG's business, financial condition and results of operations could be adversely impacted by strikes or work stoppages by its unionized employees or inability to replace employees as they retire.
As of December 31, 2011, approximately 63% of NRG's employees at its U.S. generation plants were covered by collective bargaining agreements. In the event that the Company's union employees strike, participate in a work stoppage or slowdown or engage in other forms of labor strife or disruption, NRG would be responsible for procuring replacement labor or the Company could experience reduced power generation or outages. NRG's ability to procure such labor is uncertain. Strikes, work stoppages or the inability to negotiate future collective bargaining agreements on favorable terms could have a material adverse effect on the Company's business, financial condition, results of operations and cash flow. In addition, a number of the Company's employees at NRG's plants are close to retirement. The Company's inability to replace those workers could create potential knowledge and expertise gaps as those workers retire.
42
Changes in technology may impair the value of NRG's power plants.
Research and development activities are ongoing to provide alternative and more efficient technologies to produce power, including "clean" coal and coal gasification, wind, photovoltaic (solar) cells, energy storage, and improvements in traditional technologies and equipment, such as more efficient gas turbines. Advances in these or other technologies could reduce the costs of power production to a level below what the Company has currently forecasted, which could adversely affect its cash flow, results of operations or competitive position.
Risks that are beyond NRG's control, including but not limited to acts of terrorism or related acts of war, natural disaster, hostile cyber intrusions or other catastrophic events could have a material adverse effect on NRG's financial condition, results of operations and cash flows.
NRG's generation facilities and the facilities of third parties on which they rely may be targets of terrorist activities, as well as events occurring in response to or in connection with them, that could cause environmental repercussions and/or result in full or partial disruption of the facilities ability to generate, transmit, transport or distribute electricity or natural gas. Strategic targets, such as energy-related facilities, may be at greater risk of future terrorist activities than other domestic targets. Hostile cyber intrusions, including those targeting information systems as well as electronic control systems used at the generating plants and for the distribution systems, could severely disrupt business operations and result in loss of service to customers, as well as significant expense to repair security breaches or system damage. Any such environmental repercussions or disruption could result in a significant decrease in revenues or significant reconstruction or remediation costs, beyond what could be recovered through insurance policies which could have a material adverse effect on the Company's financial condition, results of operations and cash flow.
NRG's level of indebtedness could adversely affect its ability to raise additional capital to fund its operations, or return capital to stockholders. It could also expose it to the risk of increased interest rates and limit its ability to react to changes in the economy or its industry.
NRG's substantial debt could have important consequences, including:
|
•
|
increasing NRG's vulnerability to general economic and industry conditions;
|
|
•
|
requiring a substantial portion of NRG's cash flow from operations to be dedicated to the payment of principal and interest on its indebtedness, therefore reducing NRG's ability to pay dividends to holders of its preferred or common stock or to use its cash flow to fund its operations, capital expenditures and future business opportunities;
|
|
•
|
limiting NRG's ability to enter into long-term power sales or fuel purchases which require credit support;
|
|
•
|
exposing NRG to the risk of increased interest rates because certain of its borrowings, including borrowings under its new senior secured credit facility are at variable rates of interest;
|
|
•
|
limiting NRG's ability to obtain additional financing for working capital including collateral postings, capital expenditures, debt service requirements, acquisitions and general corporate or other purposes; and
|
|
•
|
limiting NRG's ability to adjust to changing market conditions and placing it at a competitive disadvantage compared to its competitors who have less debt.
|
The indentures for NRG's notes and senior secured credit facility contain financial and other restrictive covenants that may limit the Company's ability to return capital to stockholders or otherwise engage in activities that may be in its long-term best interests. NRG's failure to comply with those covenants could result in an event of default which, if not cured or waived, could result in the acceleration of all of the Company's indebtedness.
43
In addition, NRG's ability to arrange financing, either at the corporate level or at a non-recourse project-level subsidiary, and the costs of such capital, are dependent on numerous factors, including:
|
•
|
general economic and capital market conditions;
|
|
•
|
credit availability from banks and other financial institutions;
|
|
•
|
investor confidence in NRG, its partners and the regional wholesale power markets;
|
|
•
|
NRG's financial performance and the financial performance of its subsidiaries;
|
|
•
|
NRG's level of indebtedness and compliance with covenants in debt agreements;
|
|
•
|
maintenance of acceptable credit ratings;
|
|
•
|
cash flow; and
|
|
•
|
provisions of tax and securities laws that may impact raising capital.
|
NRG may not be successful in obtaining additional capital for these or other reasons. The failure to obtain additional capital from time to time may have a material adverse effect on its business and operations.
Goodwill and/or other intangible assets not subject to amortization that NRG has recorded in connection with its acquisitions are subject to mandatory annual impairment evaluations and as a result, the Company could be required to write off some or all of this goodwill and other intangible assets, which may adversely affect the Company's financial condition and results of operations.
In accordance with ASC 350,
Intangibles — Goodwill and Other,
or ASC 350, goodwill is not amortized but is reviewed annually or more frequently for impairment and other intangibles are also reviewed at least annually or more frequently, if certain conditions exist, and may be amortized. Any reduction in or impairment of the value of goodwill or other intangible assets will result in a charge against earnings which could materially adversely affect NRG's reported results of operations and financial position in future periods.
Volatile power supply costs and demand for power could adversely affect the financial performance of NRG's Retail Businesses.
Although NRG is the primary provider of Reliant Energy's supply requirements, Reliant Energy purchases a significant portion of its supply requirements from third parties. As a result, Reliant Energy's financial performance depends on its ability to obtain adequate supplies of electric generation from third parties at prices below the prices it charges its customers. Consequently, the Company's earnings and cash flows could be adversely affected in any period in which Reliant Energy's power supply costs rise at a greater rate than the rates it charges to customers. The price of power supply purchases associated with Reliant Energy's energy commitments can be different than that reflected in the rates charged to customers due to, among other factors:
|
•
|
varying supply procurement contracts used and the timing of entering into related contracts;
|
|
•
|
subsequent changes in the overall price of natural gas;
|
|
•
|
daily, monthly or seasonal fluctuations in the price of natural gas relative to the 12-month forward prices;
|
|
•
|
transmission constraints and the Company's ability to move power to its customers; and
|
|
•
|
changes in market heat rate (i.e., the relationship between power and natural gas prices).
|
The Company's earnings and cash flows could also be adversely affected in any period in which the demand for power significantly varies from the forecasted supply, which could occur due to, among other factors, weather events, competition and economic conditions.
Significant events beyond the Company's control, such as hurricanes and other weather-related problems or acts of terrorism, could cause a loss of load and customers and thus have a material adverse effect on the Company's Retail Businesses.
The uncertainty associated with events beyond the Company's control, such as significant weather events and the risk of future terrorist activity, could cause a loss of load and customers and may affect the Company's results of operations and financial condition in unpredictable ways. In addition, significant weather events or terrorist actions could damage or shut down the power transmission and distribution facilities upon which the retail business is dependent. Power supply may be sold at a loss if these events cause a significant loss of retail customer load.
44
The Company's Retail Businesses may lose a significant number of retail customers due to competitive marketing activity by other retail electricity provider which could adversely affect the financial performance of NRG's Retail Businesses.
The Retail Businesses face competition for customers. Competitors may offer lower prices and other incentives, which may attract customers away from the Retail Businesses. In some retail electricity markets, the principal competitor may be the incumbent retail electricity provider. The incumbent retail electricity provider has the advantage of long-standing relationships with its customers, including well-known brand recognition. Furthermore, the Retail Businesses may face competition from a number of other energy service providers, other energy industry participants, or nationally branded providers of consumer products and services who may develop businesses that will compete with NRG and its Retail Businesses.
The Company's Retail Businesses are subject to the risk that sensitive customer data may be compromised, which could result in an adverse impact to its reputation and/or the results of operations of the Retail Businesses.
The Retail Businesses require access to sensitive customer data in the ordinary course of business. Examples of sensitive customer data are names, addresses, account information, historical electricity usage, expected patterns of use, payment history, credit bureau data, credit and debit card account numbers, drivers license numbers, social security numbers and bank account information. The Retail Businesses may need to provide sensitive customer data to vendors and service providers who require access to this information in order to provide services, such as call center operations, to the retail businesses. If a significant breach occurred, the reputation of NRG and the Retail Businesses may be adversely affected, customer confidence may be diminished, or NRG and the Retail Businesses may be subject to legal claims, any of which may contribute to the loss of customers and have a negative impact on the business and/or results of operations.
45
Cautionary Statement Regarding Forward Looking Information
This Annual Report on Form 10-K includes forward-looking statements within the meaning of Section 27A of the Securities Act of 1933, as amended, or Securities Act, and Section 21E of the Exchange Act. The words "believes", "projects", "anticipates", "plans", "expects", "intends", "estimates" and similar expressions are intended to identify forward-looking statements. These forward-looking statements involve known and unknown risks, uncertainties and other factors that may cause NRG Energy, Inc.'s actual results, performance and achievements, or industry results, to be materially different from any future results, performance or achievements expressed or implied by such forward-looking statements. These factors, risks and uncertainties include the factors described under Item 1A —
Risk Factors Related to NRG Energy, Inc.
and the following:
|
•
|
General economic conditions, changes in the wholesale power markets and fluctuations in the cost of fuel;
|
|
•
|
Volatile power supply costs and demand for power;
|
|
•
|
Hazards customary to the power production industry and power generation operations such as fuel and electricity price volatility, unusual weather conditions, catastrophic weather-related or other damage to facilities, unscheduled generation outages, maintenance or repairs, unanticipated changes to fuel supply costs or availability due to higher demand, shortages, transportation problems or other developments, environmental incidents, or electric transmission or gas pipeline system constraints and the possibility that NRG may not have adequate insurance to cover losses as a result of such hazards;
|
|
•
|
The effectiveness of NRG's risk management policies and procedures, and the ability of NRG's counterparties to satisfy their financial commitments;
|
|
•
|
Counterparties' collateral demands and other factors affecting NRG's liquidity position and financial condition;
|
|
•
|
NRG's ability to operate its businesses efficiently, manage capital expenditures and costs tightly, and generate earnings and cash flows from its asset-based businesses in relation to its debt and other obligations;
|
|
•
|
NRG's ability to enter into contracts to sell power and procure fuel on acceptable terms and prices;
|
|
•
|
The liquidity and competitiveness of wholesale markets for energy commodities;
|
|
•
|
Government regulation, including compliance with regulatory requirements and changes in market rules, rates, tariffs and environmental laws and increased regulation of carbon dioxide and other greenhouse gas emissions;
|
|
•
|
Price mitigation strategies and other market structures employed by ISOs or RTOs that result in a failure to adequately compensate NRG's generation units for all of its costs;
|
|
•
|
NRG's ability to borrow additional funds and access capital markets, as well as NRG's substantial indebtedness and the possibility that NRG may incur additional indebtedness going forward;
|
|
•
|
NRG's ability to receive Federal loan guarantees or cash grants to support development projects;
|
|
•
|
Operating and financial restrictions placed on NRG and its subsidiaries that are contained in the indentures governing NRG's outstanding notes, in NRG's Senior Credit Facility, and in debt and other agreements of certain of NRG subsidiaries and project affiliates generally;
|
|
•
|
NRG's ability to implement its strategy of developing and building new power generation facilities, including new solar projects;
|
|
•
|
NRG's ability to implement its econrg strategy of finding ways to meet the challenges of climate change, clean air and protecting natural resources while taking advantage of business opportunities;
|
|
•
|
NRG's ability to implement its
FOR
NRG strategy of increasing the return on invested capital through operational performance improvements and a range of initiatives at plants and corporate offices to reduce costs or generate revenues;
|
|
•
|
NRG's ability to achieve its strategy of regularly returning capital to stockholders;
|
|
•
|
NRG's ability to maintain retail market share;
|
|
•
|
NRG's ability to successfully evaluate investments in new business and growth initiatives;
|
|
•
|
NRG's ability to successfully integrate and manage any acquired businesses; and
|
|
•
|
NRG's ability to develop and maintain successful partnering relationships.
|
Forward-looking statements speak only as of the date they were made, and NRG Energy, Inc. undertakes no obligation to publicly update or revise any forward-looking statements, whether as a result of new information, future events or otherwise. The foregoing review of factors that could cause NRG's actual results to differ materially from those contemplated in any forward-looking statements included in this Annual Report on Form 10-K should not be construed as exhaustive.
None.
46
Listed below are descriptions of NRG's interests in facilities, operations and/or projects owned as of December 31, 2011. The MW figures provided represent nominal summer net megawatt capacity of power generated as adjusted for the Company's ownership position excluding capacity from inactive/mothballed units as of December 31, 2011. The following table summarizes NRG's power production and cogeneration facilities by region:
|
Name and Location of Facility
|
Power Market
|
% Owned
|
Net
Generation
Capacity (MW)
(a)
|
Primary
Fuel-type
|
||||
|
Texas Region:
|
|
|
|
|
||||
|
Cedar Bayou, Baytown, TX
|
ERCOT
|
100.0
|
1,495
|
|
Natural Gas
|
|||
|
Cedar Bayou 4, Baytown, TX
|
ERCOT
|
50.0
|
260
|
|
Natural Gas
|
|||
|
Elbow Creek Wind Farm, Howard County, TX
|
ERCOT
|
100.0
|
125
|
|
Wind
|
|||
|
Greens Bayou, Houston, TX
|
ERCOT
|
100.0
|
355
|
|
Natural Gas
|
|||
|
Langford Wind Farm, Christoval, TX
|
ERCOT
|
100.0
|
150
|
|
Wind
|
|||
|
Limestone, Jewett, TX
|
ERCOT
|
100.0
|
1,690
|
|
Coal
|
|||
|
San Jacinto, LaPorte, TX
|
ERCOT
|
100.0
|
160
|
|
Natural Gas
|
|||
|
Sherbino Wind Farm, Pecos County, TX
|
ERCOT
|
50.0
|
75
|
|
Wind
|
|||
|
South Texas Project, Bay City, TX
(b)
|
ERCOT
|
44.0
|
1,175
|
|
Nuclear
|
|||
|
South Trent Wind Farm, Sweetwater, TX
|
ERCOT
|
100.0
|
100
|
|
Wind
|
|||
|
S. R. Bertron, Deer Park, TX
|
ERCOT
|
100.0
|
470
|
|
Natural Gas
|
|||
|
T. H. Wharton, Houston, TX
|
ERCOT
|
100.0
|
1,025
|
|
Natural Gas
|
|||
|
W. A. Parish, Thompsons, TX
(c)
|
ERCOT
|
100.0
|
2,490
|
|
Coal
|
|||
|
W. A. Parish, Thompsons, TX
(c)
|
ERCOT
|
100.0
|
1,175
|
|
Natural Gas
|
|||
|
Northeast Region:
|
|
|
|
|
||||
|
Arthur Kill, Staten Island, NY
|
NYISO
|
100.0
|
865
|
|
Natural Gas
|
|||
|
Astoria Gas Turbines, Queens, NY
|
NYISO
|
100.0
|
550
|
|
Natural Gas
|
|||
|
Conemaugh, New Florence, PA
|
PJM
|
3.7
|
65
|
|
Coal
|
|||
|
Connecticut Jet Power, CT (four sites)
|
ISO-NE
|
100.0
|
140
|
|
Oil
|
|||
|
Devon, Milford, CT
|
ISO-NE
|
100.0
|
135
|
|
Oil
|
|||
|
GenConn Devon, Milford, CT
|
ISO-NE
|
50.0
|
95
|
|
Oil
|
|||
|
Dunkirk, NY
|
NYISO
|
100.0
|
530
|
|
Coal
|
|||
|
Huntley, Tonawanda, NY
|
NYISO
|
100.0
|
380
|
|
Coal
|
|||
|
Indian River, Millsboro, DE
(d)
|
PJM
|
100.0
|
580
|
|
Coal
|
|||
|
Keystone, Shelocta, PA
|
PJM
|
3.7
|
65
|
|
Coal
|
|||
|
Middletown, CT
|
ISO-NE
|
100.0
|
770
|
|
Oil
|
|||
|
GenConn Middletown, CT
|
ISO-NE
|
50.0
|
95
|
|
Oil
|
|||
|
Montville, Uncasville, CT
|
ISO-NE
|
100.0
|
500
|
|
Oil
|
|||
|
Norwalk Harbor, So. Norwalk, CT
|
ISO-NE
|
100.0
|
340
|
|
Oil
|
|||
|
Oswego, NY
|
NYISO
|
100.0
|
1,635
|
|
Oil
|
|||
|
Vienna, MD
|
PJM
|
100.0
|
170
|
|
Oil
|
|||
|
South Central Region:
|
|
|
|
|
||||
|
Bayou Cove, Jennings, LA
|
SERC-Entergy
|
100.0
|
300
|
|
Natural Gas
|
|||
|
Big Cajun I, Jarreau, LA
|
SERC-Entergy
|
100.0
|
430
|
|
Natural Gas
|
|||
|
Big Cajun II, New Roads, LA
(e)
|
SERC-Entergy
|
86.0
|
1,495
|
|
Coal
|
|||
|
Cottonwood, Deweyville, TX
|
SERC-Entergy
|
100.0
|
1,265
|
|
Natural Gas
|
|||
|
Rockford I, IL
|
PJM
|
100.0
|
305
|
|
Natural Gas
|
|||
47
|
Rockford II, IL
|
PJM
|
100.0
|
155
|
|
Natural Gas
|
|||
|
Sterlington, LA
|
SERC-Entergy
|
100.0
|
175
|
|
Natural Gas
|
|||
|
West Region:
|
|
|
|
|
||||
|
Avenal, CA
|
CAISO
|
50.0
|
25
|
|
Solar
|
|||
|
Blythe, CA
|
CAISO
|
100.0
|
20
|
|
Solar
|
|||
|
El Segundo Power, CA
|
CAISO
|
100.0
|
670
|
|
Natural Gas
|
|||
|
Encina, Carlsbad, CA
|
CAISO
|
100.0
|
965
|
|
Natural Gas
|
|||
|
Long Beach, CA
|
CAISO
|
100.0
|
260
|
|
Natural Gas
|
|||
|
Roadrunner, Santa Teresa, NM
|
EPE
|
100.0
|
20
|
|
Solar
|
|||
|
Saguaro Power Co., Henderson, NV
|
WECC
|
50.0
|
45
|
|
Natural Gas
|
|||
|
San Diego Combustion Turbines, CA (four sites)
|
CAISO
|
100.0
|
190
|
|
Natural Gas
|
|||
|
International Region:
|
|
|
|
|
||||
|
Gladstone Power Station, Queensland, Australia
|
Enertrade/Boyne Smelter
|
37.5
|
605
|
|
Coal
|
|||
|
Schkopau Power Station, Germany
|
Vattenfall Europe
|
41.9
|
400
|
|
Coal
|
|||
|
(a)
|
Actual capacity can vary depending on factors including weather conditions, operational conditions, and other factors. Additionally, ERCOT requires periodic demonstration of capability, and the capacity may vary individually and in the aggregate from time to time.
|
|
(b)
|
Generation capacity figure consists of the Company's 44% individual interest in the two units at STP.
|
|
(c)
|
W.A. Parish has nine units, four of which are baseload coal-fired units and five of which are natural gas-fired units.
|
|
(d)
|
Indian River Unit 1 was retired May 31, 2011, and Indian River Unit 3 will be retired by December 31, 2013.
|
|
(e)
|
Units 1 and 2 owned 100.0%, Unit 3 owned 58.0%.
|
Thermal Facilities
The Company's thermal businesses in Pittsburgh, Harrisburg and San Francisco are regulated by their respective state's Public Utility Commission. The other thermal businesses are subject to contract terms with their customers.
The following table summarizes NRG's thermal steam and chilled water facilities as of December 31, 2011:
|
Name and Location of Facility
|
% Owned
|
Thermal Energy Purchaser
|
Megawatt
Thermal
Equivalent
Capacity (MWt)
|
Generating
Capacity
|
|||||
|
NRG Energy Center Minneapolis, MN
|
100.0
|
|
Approx. 100 steam and 50 chilled water customers
|
334
141
|
|
Steam: 1,140 MMBtu/hr.
Chilled Water: 40,200 tons
|
|||
|
NRG Energy Center San Francisco, CA
|
100.0
|
|
Approx 170 steam customers
|
133
|
|
Steam: 454 MMBtu/Hr.
|
|||
|
NRG Energy Center Harrisburg, PA
|
100.0
|
|
Approx 210 steam and 3 chilled water customers
|
129
8
|
|
Steam: 440 MMBtu/hr.
Chilled water: 2,400 tons
|
|||
|
NRG Energy Center Phoenix, AZ
|
100.0
|
|
Approx 30 chilled water customers
|
90
|
|
Chilled water: 25,600 tons
|
|||
|
NRG Energy Center Pittsburgh, PA
|
100.0
|
|
Approx 25 steam and 25 chilled water customers
|
87
45
|
|
Steam: 296 MMBtu/hr.
Chilled water: 12,920 tons
|
|||
|
NRG Energy Center San Diego, CA
|
100.0
|
|
Approx 20 chilled water customers
|
26
|
|
Chilled water: 7,425 tons
|
|||
|
Camas Power Boiler Camas, WA
|
100.0
|
|
Georgia Pacific Group
|
59
|
|
Steam: 200 MMBtu/hr.
|
|||
|
NRG Energy Center Dover, DE
|
100.0
|
|
Kraft Foods Inc. and Proctor & Gamble Company
|
56
|
|
Steam: 190 MMBtu/hr.
|
|||
The following table summarizes NRG's thermal power generation facilities, as of December 31, 2011:
|
Name and Location of Facility
|
Power Market/
Zone
|
% Owned
|
Generation
Capacity (MW)
|
Primary
Fuel Type
|
|||||
|
Paxton Creek Cogeneration Harrisburg, PA
|
PJM / East
|
100.0
|
|
12
|
|
Natural Gas
|
|||
|
Dover Cogeneration, DE
|
PJM / West
|
100.0
|
|
104
|
|
Coal
|
|||
|
Princeton Hospital, NJ
|
PJM/East
|
100.0
|
|
5
|
|
Natural Gas
|
|||
48
Other Properties
NRG owns 30 MW of Distributed Solar facilities at various locations throughout the United States, concentrated primarily in the West Region.
In addition, NRG owns several real properties and facilities relating to its generation assets, other vacant real property unrelated to the Company's generation assets, interests in construction projects, and properties not used for operational purposes. NRG believes it has satisfactory title to its plants and facilities in accordance with standards generally accepted in the electric power industry, subject to exceptions that, in the Company's opinion, would not have a material adverse effect on the use or value of its portfolio.
NRG leases its corporate offices at 211 Carnegie Center, Princeton, New Jersey, its Reliant Energy, Green Mountain Energy, and Energy Plus offices and call centers, and various other office space.
49
Public Utilities Commission of the State of California v. Long-Term Sellers of Long-Term Contracts to the California Department of Water Resources
,
FERC Docket No. EL02-60 et al.
—
This matter concerns, among other contracts and other defendants, the California Department of Water Resources, or CDWR, and its wholesale power contract with subsidiaries of WCP (Generation) Holdings, Inc., or WCP. The case originated with a February 2002 complaint filed by the State of California alleging that many parties, including WCP subsidiaries, overcharged the State of California. For WCP, the alleged overcharges totaled approximately $940 million for 2001 and 2002. The complaint demanded that the FERC, abrogate the CDWR contract and sought refunds associated with revenues collected under the contract. In 2003, the FERC rejected this complaint, denied rehearing, and the case was appealed to the U.S. Court of Appeals for the Ninth Circuit where oral argument was held on December 8, 2004. On December 19, 2006, the Ninth Circuit decided that in the FERC's review of the contracts at issue, the FERC could not rely on the
Mobile-Sierra
standard presumption of just and reasonable rates, where such contracts were not reviewed by the FERC with full knowledge of the then existing market conditions. WCP and others sought review by the U.S. Supreme Court. WCP's appeal was not selected, but instead held by the Supreme Court. In the appeal that was selected by the Supreme Court, on June 26, 2008, the Supreme Court ruled: (i) that the
Mobile-Sierra
public interest standard of review applied to contracts made under a seller's market-based rate authority; (ii) that the public interest “bar” required to set aside a contract remains a very high one to overcome; and (iii) that the
Mobile-Sierra
presumption of contract reasonableness applies when a contract is formed during a period of market dysfunction unless (a) such market conditions were caused by the illegal actions of one of the parties or (b) the contract negotiations were tainted by fraud or duress. In this related case, the U.S. Supreme Court affirmed the Ninth Circuit's decision agreeing that the case should be remanded to the FERC to clarify the FERC's 2003 reasoning regarding its rejection of the original complaint relating to the financial burdens under the contracts at issue and to alleged market manipulation at the time these contracts were formed. As a result, the U.S. Supreme Court then reversed and remanded the WCP CDWR case to the Ninth Circuit for treatment consistent with its June 26, 2008, decision in the related case. On October 20, 2008, the Ninth Circuit asked the parties in the remanded CDWR case, including WCP and the FERC, whether that Court should answer a question the U.S. Supreme Court did not address in its June 26, 2008, decision; whether the
Mobile-Sierra
doctrine applies to a third-party that was not a signatory to any of the wholesale power contracts, including the CDWR contract, at issue in that case. Without answering that reserved question, on December 4, 2008, the Ninth Circuit vacated its prior opinion and remanded the WCP CDWR case back to the FERC for proceedings consistent with the U.S. Supreme Court's June 26, 2008, decision.
On December 15, 2008, WCP and the other seller-defendants filed with the FERC a Motion for Order Governing Proceedings on Remand. On January 14, 2009, the Public Utilities Commission of the State of California filed an Answer and Cross Motion for an Order Governing Procedures on Remand and on January 28, 2009, WCP and the other seller-defendants filed their reply. At this time, the FERC has not acted on remand.
At this time, while NRG cannot predict with certainty whether WCP will be required to make refunds for rates collected under the CDWR contract or estimate the range of any such possible refunds, a reconsideration of the CDWR contract by the FERC with a resulting order mandating significant refunds could have a material adverse impact on NRG's financial position, statement of operations, and statement of cash flows. As part of the 2006 acquisition of Dynegy's
50%
ownership interest in WCP, WCP and NRG assumed responsibility for any risk of loss arising from this case, unless any such loss was deemed to have resulted from certain acts of gross negligence or willful misconduct on the part of Dynegy, in which case any such loss would be shared equally between WCP and Dynegy.
On January 14, 2010, the U.S. Supreme Court issued its decision in an unrelated proceeding involving the
Mobile-Sierra
doctrine that will affect the standard of review applied to the CDWR contract on remand before the FERC. In
NRG Power Marketing v. Maine Public Utilities Commission
, the Supreme Court held that the
Mobile-Sierra
presumption regarding the reasonableness of contract rates does not depend on the identity of the complainant who seeks a FERC investigation/refund.
50
United States of America v. Louisiana Generating, LLC., U.S.D.C Middle District of Louisiana,
Civil Action No. 09-100-RET-CN (filed February 11, 2009) —
On February 11, 2009, the U.S. DOJ, acting at the request of the U.S. Environmental Protection Agency, or U.S. EPA, commenced a lawsuit against Louisiana Generating, LLC, or LaGen, in the United States District Court in the Middle District of Louisiana alleging violations of the CAA at the Big Cajun II power plant. This is the same matter for which Notices of Violation, or NOVs, were issued to LaGen on February 15, 2005, and on December 8, 2006. Specifically, it is alleged that in the late 1990's, several years prior to NRG's acquisition of the Big Cajun II power plant from the Cajun Electric bankruptcy and several years prior to the NRG bankruptcy, modifications were made to Big Cajun II Units 1 and 2 by the prior owners without appropriate or adequate permits and without installing and employing the best available control technology, or BACT, to control emissions of nitrogen oxides and/or sulfur dioxides. The relief sought in the complaint includes a request for an injunction to: (i) preclude the operation of Units 1 and 2 except in accordance with the CAA; (ii) order the installation of BACT on Units 1 and 2 for each pollutant subject to regulation under the CAA; (iii) obtain all necessary permits for Units 1 and 2; (iv) order the surrender of emission allowances or credits; (v) conduct audits to determine if any additional modifications have been made which would require compliance with the CAA's Prevention of Significant Deterioration program; (vi) award to the Department of Justice its costs in prosecuting this litigation; and (vii) assess civil penalties of up to
$27,500
per day for each CAA violation found to have occurred between January 31, 1997, and March 15, 2004, up to
$32,500
for each CAA violation found to have occurred between March 15, 2004, and January 12, 2009, and up to
$37,500
for each CAA violation found to have occurred after January 12, 2009.
On April 27, 2009, LaGen filed an objection in the Cajun Electric Cooperative Power, Inc.'s bankruptcy proceeding in the U.S. Bankruptcy Court for the Middle District of Louisiana to seek to prevent the bankruptcy from closing. LaGen also filed a complaint, or adversary proceeding, in the same bankruptcy proceeding, seeking a judgment that: (i) it did not assume liability from Cajun Electric for any claims or other liabilities under environmental laws with respect to Big Cajun II that arose, or are based on activities that were undertaken, prior to the closing date of the acquisition; (ii) it is not otherwise the successor to Cajun Electric with respect to environmental liabilities arising prior to the acquisition; and (iii) Cajun Electric and/or the Bankruptcy Trustee are exclusively liable for any of the violations alleged in the February 11, 2009, lawsuit to the extent that such claims are determined to have merit. On April 15, 2010, the bankruptcy court signed an order granting LaGen's stipulation of voluntary dismissal without prejudice of the adversary proceeding. The bankruptcy proceeding has since closed.
On August 24, 2009, LaGen filed a motion to dismiss this lawsuit, and on September 25, 2009, the U.S. DOJ filed its opposition to the motion. Thereafter, on February 18, 2010, the Louisiana Department of Environmental Quality, or LDEQ, filed a motion to intervene in the above lawsuit and a complaint against LaGen for alleged violations of Louisiana's Prevention of Significant Deterioration, or PSD, regulations and Louisiana's Title V operating permit program. LDEQ seeks substantially similar relief to that requested by the U.S. DOJ. On February 19, 2010, the district court granted LDEQ's motion to intervene. On April 26, 2010, LaGen filed a motion to dismiss the LDEQ complaint. On July 21, 2010, the motions to dismiss the U.S. DOJ and LDEQ complaints were argued to the district court. On August 20, 2010, the parties submitted proposed findings of fact and conclusions of law, and thereafter submitted additional briefing on emerging jurisprudence from other jurisdictions touching on the issues at stake in the lawsuit. On February 4, 2011, LaGen filed motions for summary judgment requesting that the court dismiss all of the U.S. DOJ's claims. Also on February 4, 2011, the U.S. DOJ filed three motions for partial summary judgment. Additional summary judgment briefing was filed by the parties on April 4, 2011. On November 2, 2011, the court heard oral argument on three motions for summary judgment. On December 1, 2011, the Court issued an order denying two of LaGen's motions for summary judgment addressing potential legal defenses to CAA liability. In the same Order, the Court also granted, in part, the U.S. DOJ's motion for summary judgment on its successor liability theory. The Court held that LaGen could be found to have assumed liability for alleged PSD violations under the terms of the agreement through which LaGen acquired Big Cajun II in 2000, but ruled that the facts necessary to determine whether any such liabilities were actually assumed must be determined at a liability-phase trial, if necessary. In its December 1, 2011, decision, the Court also ruled that any potential civil penalties would not be available for the periods prior to the five year period preceding the filing of the lawsuit on February 11, 2009.
Three additional motions for summary judgment and multiple motions in limine, including motions that could result in dismissal of the governments' claims before trial if resolved in LaGen's favor, remain pending before the court, with some of these motions set to be argued on March 21, 2012. On January 17, 2012, LaGen filed a demand for a jury trial. On January 20, 2012, the court scheduled a liability-phase trial for October 15, 2012, should the case proceed to that stage, with a remedy-phase trial set to occur at a later date to be determined in the event of an adverse decision in a liability-phase trial. Because of the inherent uncertainty of litigation, including the fact that no determination of liability has yet been made by the Court, we cannot predict the impact, at this time, that this matter may have on our business, results of operations, financial position, or cash flows.
51
Louisiana Generating, LLC and NRG Energy, Inc. v. Illinois Union Insurance Company, U.S.D.C. Middle District of Louisiana,
Civil Action No. 10-516-JJB-SCR
(filed August 9, 2010)
—
In a related matter, soon after the filing of the above referenced U.S. DOJ lawsuit, LaGen sought insurance coverage from its insurance carrier, Illinois Union Insurance Company, or ILU. ILU denied coverage and thereafter LaGen filed this lawsuit (which was consolidated with a prior suit filed by ILU) seeking a declaration that ILU must provide coverage to LaGen for the defense costs incurred in defending the U.S. DOJ lawsuit. LaGen and ILU both filed motions for summary judgment and on January 30, 2012, the court issued an order granting LaGen's motion finding that ILU has a duty to defend LaGen.
Excess Mitigation Credits
— From January 2002 to April 2005, CenterPoint Energy applied excess mitigation credits, or EMCs, to its monthly charges to retail electric providers as ordered by the PUCT. The PUCT imposed these credits to facilitate the transition to competition in Texas, which had the effect of lowering the retail electric providers' monthly charges payable to CenterPoint Energy. As indicated in its Petition for Review filed with the Supreme Court of Texas on June 2, 2008, CenterPoint Energy has claimed that the portion of those EMCs credited to Reliant Energy Retail Services, LLC, or RERS, a retail electric provider and NRG subsidiary acquired from RRI Energy, Inc. (formerly Reliant Energy, Inc.), totaled
$385 million
for RERS's “Price to Beat” Customers. It is unclear what the actual number may be. “Price to Beat” was the rate RERS was required by state law to charge residential and small commercial customers that were transitioned to RERS from the incumbent integrated utility company commencing in 2002. In its original stranded cost case brought before the PUCT on March 31, 2004, CenterPoint Energy sought recovery of all EMCs that were credited to all retail electric providers, including RERS, and the PUCT ordered that relief in its Order on Rehearing in Docket No. 29526, on December 17, 2004. After an appeal to state district court, the court entered a final judgment on August 26, 2005, affirming the PUCT's order with regard to EMCs credited to RERS. Various parties filed appeals of that judgment, and on April 17, 2008, the Court of Appeals for the Third District reversed the lower court's decision ruling that CenterPoint Energy's stranded cost recovery should exclude only EMCs credited to RERS for its “Price to Beat” customers. On June 2, 2008, CenterPoint Energy's Petition for Review with the Supreme Court of Texas was accepted. Oral argument occurred on October 6, 2009, and on March 18, 2011, the Texas Supreme Court reversed the Court of Appeals, finding no basis for deducting EMCs credited to RERS. Motions for rehearing were filed on May 4, 2011. On June 10, 2011, the Texas Supreme Court denied all motions for rehearing, thereby ending the matter.
In November 2008, CenterPoint Energy and Reliant Energy Inc., or REI, on behalf of itself and affiliates including RERS, agreed to suspend unexpired deadlines, if any, related to limitations periods that might exist for possible claims against REI and its affiliates if CenterPoint Energy is ultimately not allowed to include in its stranded cost calculation those EMCs previously credited to RERS. The agreed upon suspension of unexpired deadlines ceased on August 29, 2011. NRG believes that any possible future CenterPoint Energy claim against RERS for EMCs credited to RERS would lack legal merit. No such claim has been filed.
Wise v. Energy Plus Holdings, LLC
— On October 18, 2011, plaintiff filed a purported class action lawsuit on behalf of New York consumers against Energy Plus in the U.S. District Court for the Southern District of New York. Claiming statutory damages in excess of $5 million, the plaintiff alleges violations of New York business laws as well as unjust enrichment. Specifically, the plaintiff claims that Energy Plus misrepresents that its rates are competitive in the market; fails to disclose that its rates are substantially higher than those in the market and that Energy Plus has engaged in deceptive practices in its marketing of energy services. Plaintiff seeks that this matter be certified as a class action, with treble damages, interest, costs, attorneys fees, and any other relief that the court deems just and proper. On January 11, 2012, plaintiff filed an amended complaint in which they added another co-plaintiff, made additional claims as to how they became customers of Energy Plus and made some additional allegations as to alleged representations on the Energy Plus website. On February 1, 2012, Energy Plus filed a motion to dismiss the amended complaint. Oral argument on the motion to dismiss is scheduled to be heard on March 23, 2012.
Additional Litigation
— In addition to the foregoing, NRG is party to other litigation or legal proceedings. The Company believes that it has valid defenses to the legal proceedings and investigations described above and intends to defend them vigorously. However, litigation is inherently subject to many uncertainties. There can be no assurance that additional litigation will not be filed against the Company or its subsidiaries in the future asserting similar or different legal theories and seeking similar or different types of damages and relief. Unless specified above, the Company is unable to predict the outcome these legal proceedings and investigations may have or reasonably estimate the scope or amount of any associated costs and potential liabilities. An unfavorable outcome in one or more of these proceedings could have a material impact on the Company's consolidated financial position, results of operations or cash flows. The Company also has indemnity rights for some of these proceedings to reimburse the Company for certain legal expenses and to offset certain amounts deemed to be owed in the event of an unfavorable litigation outcome.
Not applicable
52
Market Information and Holders
NRG's authorized capital stock consists of 500,000,000 shares of NRG common stock and 10,000,000 shares of preferred stock. A total of 22,000,000 shares of the Company's common stock are available for issuance under NRG's Long-Term Incentive Plan, or LTIP. NRG has also filed with the Secretary of State of Delaware a Certificate of Designation for the 3.625% Convertible Perpetual Preferred Stock.
NRG's common stock is listed on the New York Stock Exchange and has been assigned the symbol: NRG. The high and low sales prices, as well as the closing price for the Company's common stock on a per share basis for 2011 and 2010 are set forth below:
|
Common Stock Price
|
Fourth
Quarter
2011
|
Third
Quarter
2011
|
Second
Quarter
2011
|
First
Quarter
2011
|
Fourth
Quarter
2010
|
Third
Quarter
2010
|
Second
Quarter
2010
|
First
Quarter
2010
|
|||||||||||||||||||||||
|
High
|
$
|
22.61
|
|
$
|
25.66
|
|
$
|
25.54
|
|
$
|
21.95
|
|
$
|
21.64
|
|
$
|
23.81
|
|
$
|
25.19
|
|
$
|
25.70
|
|
|||||||
|
Low
|
17.47
|
|
19.98
|
|
21.05
|
|
19.09
|
|
18.22
|
|
20.02
|
|
20.49
|
|
20.20
|
|
|||||||||||||||
|
Closing
|
18.12
|
|
21.21
|
|
24.58
|
|
21.54
|
|
19.54
|
|
20.82
|
|
21.21
|
|
20.90
|
|
|||||||||||||||
NRG had 227,519,521 shares outstanding as of December 31, 2011. As of February 22, 2012, there were
227,685,120
shares outstanding, and there were 135 common stockholders of record.
Dividends
NRG has not declared or paid dividends on its common stock. To the extent NRG declares such a dividend, the amount available for dividends is currently limited by the Company's senior secured credit agreements and high yield note indentures.
Repurchase of equity securities
NRG's repurchases of equity securities for the year ended December 31, 2011, were as follows:
|
For the Year Ended December 31, 2011
|
Total Number of
Shares Purchased
|
Average Price
Paid per Share
|
Total Number
of Shares
Purchased as
Part of Publicly
Announced Plans
or Programs
|
Dollar Value of
Shares that may be
Purchased Under the
2011 Capital
Allocation Plan
|
|||||||||
|
First quarter
|
—
|
|
$
|
—
|
|
—
|
|
$
|
180,000,000
|
|
|||
|
Second quarter
|
6,229,574
|
|
20.87
|
|
6,229,574
|
|
50,000,000
|
|
|||||
|
Third quarter
|
2,650,000
|
|
21.73
|
|
2,650,000
|
|
242,372,395
|
|
|||||
|
Fourth quarter
|
11,096,080
|
|
21.84
|
|
11,096,080
|
|
—
|
|
|||||
|
Total for 2011
|
19,975,654
|
|
21.52
|
|
19,975,654
|
|
—
|
|
|||||
On February 22, 2011, the Company announced a plan to repurchase $180 million of common stock under the Company's 2011 Capital Allocation Plan. On August 4, 2011, the Company announced additional share repurchases of $250 million under the Capital Allocation Plan, bringing the total targeted share repurchases for 2011 to $430 million. The shares repurchased in the fourth quarter 2011 completed the Company's share buyback program for 2011. The Company share repurchases are subject to market prices, financial restrictions under the Company's debt facilities, and as permitted by securities laws.
53
Securities Authorized for Issuance under Equity Compensation Plans
|
Plan Category
|
(a)
Number of Securities
to be Issued Upon
Exercise of
Outstanding Options,
Warrants and Rights
|
(b)
Weighted-Average Exercise
Price of Outstanding
Options, Warrants and
Rights
|
(c)
Number of Securities
Remaining Available
for Future Issuance
Under Equity Compensation
Plans (Excluding
Securities Reflected
in Column (a))
|
||||||
|
Equity compensation plans approved by security holders
|
10,675,739
|
|
$
|
22.93
|
|
8,135,048
|
|
||
|
Equity compensation plans not approved by security holders
|
—
|
|
N/A
|
|
—
|
|
|||
|
Total
|
10,675,739
|
|
$
|
22.93
|
|
8,135,048
|
|
||
|
(a)
|
Consists of NRG Energy, Inc.'s LTIP and NRG Energy, Inc.'s Employee Stock Purchase Plan, or the ESPP. The LTIP became effective upon the Company's emergence from bankruptcy. The LTIP was subsequently approved by the Company's stockholders on August 4, 2004, and was amended on April 28, 2006, to increase the number of shares available for issuance to 16,000,000, on a post-split basis, and again on December 8, 2006, to make technical and administrative changes. On July 28, 2010, the LTIP was amended to increase the number of shares available for issuance to 22,000,000. The LTIP provides for grants of stock options, stock appreciation rights, restricted stock, performance units, deferred stock units and dividend equivalent rights. NRG's directors, officers and employees, as well as other individuals performing services for, or to whom an offer of employment has been extended by the Company, are eligible to receive grants under the LTIP. The purpose of the LTIP is to promote the Company's long-term growth and profitability by providing these individuals with incentives to maximize stockholder value and otherwise contribute to the Company's success and to enable the Company to attract, retain and reward the best available persons for positions of responsibility. The Compensation Committee of the Board of Directors administers the LTIP. There were 7,957,697 and 10,141,819 shares of common stock remaining available for grants of awards under NRG's LTIP as of December 31, 2011, and 2010, respectively. The ESPP was approved by the Company's stockholders on May 14, 2008. There were 500,000 shares reserved from the Company's treasury shares for the ESPP. As of December 31, 2011, there were 177,351 shares of treasury stock reserved for issuance under the ESPP. In the first quarter of 2012, 76,423 shares were issued to employees' accounts from the treasury stock reserve for the ESPP.
|
54
Stock Performance Graph
The performance graph below compares NRG's cumulative total stockholder return on the Company's common stock for the period December 31, 2006, through December 31, 2011, with the cumulative total return of the Standard & Poor's 500 Composite Stock Price Index, or S&P 500, and the Philadelphia Utility Sector Index, or UTY. NRG's common stock trades on the New York Stock Exchange under the symbol "NRG".
The performance graph shown below is being furnished and compares each period assuming that $100 was invested on December 31, 2006, in each of the common stock of NRG, the stocks included in the S&P 500 and the stocks included in the UTY, and that all dividends were reinvested.
Comparison of Cumulative Total Return

|
Dec-2006
|
Dec-2007
|
Dec-2008
|
Dec-2009
|
Dec-2010
|
Dec-2011
|
||||||||||||||||||
|
NRG Energy, Inc.
|
$
|
100.00
|
|
$
|
154.76
|
|
$
|
83.31
|
|
$
|
84.31
|
|
$
|
69.77
|
|
$
|
64.70
|
|
|||||
|
S&P 500
|
100.00
|
|
105.49
|
|
66.46
|
|
84.05
|
|
96.71
|
|
98.76
|
|
|||||||||||
|
UTY
|
$
|
100.00
|
|
$
|
118.71
|
|
$
|
86.94
|
|
$
|
95.18
|
|
$
|
100.33
|
|
$
|
119.15
|
|
|||||
55
The following table presents NRG's historical selected financial data. The data included in the following table has been recast to reflect the assets, liabilities and results of operations of certain projects that have met the criteria for treatment as discontinued operations in 2007 and 2008.
This historical data should be read in conjunction with the Consolidated Financial Statements and the related notes thereto in Item 15 and Item 7,
Management's Discussion and Analysis of Financial Condition and Results of Operations.
|
Year Ended December 31,
|
|||||||||||||||||||
|
2011
|
2010
|
2009
|
2008
|
2007
|
|||||||||||||||
|
(In millions except ratios and per share data)
|
|||||||||||||||||||
|
Statement of income data:
|
|||||||||||||||||||
|
Total operating revenues
|
$
|
9,079
|
|
$
|
8,849
|
|
$
|
8,952
|
|
$
|
6,885
|
|
$
|
5,989
|
|
||||
|
Total operating costs and expenses, and other expenses
|
9,725
|
|
8,119
|
|
7,283
|
|
5,119
|
|
5,073
|
|
|||||||||
|
Income from continuing operations, net
|
197
|
|
476
|
|
941
|
|
1,053
|
|
556
|
|
|||||||||
|
Income from discontinued operations, net
|
—
|
|
—
|
|
—
|
|
172
|
|
17
|
|
|||||||||
|
Net income attributable to NRG Energy, Inc.
|
$
|
197
|
|
$
|
477
|
|
$
|
942
|
|
$
|
1,225
|
|
$
|
573
|
|
||||
|
Common share data:
|
|||||||||||||||||||
|
Basic shares outstanding — average
|
240
|
|
252
|
|
246
|
|
235
|
|
240
|
|
|||||||||
|
Diluted shares outstanding — average
|
241
|
|
254
|
|
271
|
|
275
|
|
288
|
|
|||||||||
|
Shares outstanding — end of year
|
228
|
|
247
|
|
254
|
|
234
|
|
237
|
|
|||||||||
|
Per share data:
|
|||||||||||||||||||
|
Income attributable to NRG from continuing operations — basic
|
$
|
0.78
|
|
$
|
1.86
|
|
$
|
3.70
|
|
$
|
4.25
|
|
$
|
2.09
|
|
||||
|
Income attributable to NRG from continuing operations — diluted
|
0.78
|
|
1.84
|
|
3.44
|
|
3.80
|
|
1.90
|
|
|||||||||
|
Net income attributable to NRG — basic
|
0.78
|
|
1.86
|
|
3.70
|
|
4.98
|
|
2.16
|
|
|||||||||
|
Net income attributable to NRG — diluted
|
0.78
|
|
1.84
|
|
3.44
|
|
4.43
|
|
1.96
|
|
|||||||||
|
Book value
|
$
|
33.71
|
|
$
|
32.65
|
|
$
|
29.72
|
|
$
|
26.75
|
|
$
|
19.55
|
|
||||
|
Business metrics:
|
|||||||||||||||||||
|
Cash flow from operations
|
$
|
1,166
|
|
$
|
1,623
|
|
$
|
2,106
|
|
$
|
1,479
|
|
$
|
1,517
|
|
||||
|
Liquidity position
(a)
|
$
|
2,328
|
|
$
|
4,660
|
|
$
|
3,971
|
|
$
|
4,124
|
|
$
|
2,715
|
|
||||
|
Ratio of earnings to fixed charges
|
0.77
|
|
2.03
|
|
3.27
|
|
3.65
|
|
2.24
|
|
|||||||||
|
Ratio of earnings to fixed charges and preferred dividends
|
0.76
|
|
1.99
|
|
3.04
|
|
3.19
|
|
1.99
|
|
|||||||||
|
Return on equity
|
2.57
|
%
|
5.91
|
%
|
12.24
|
%
|
17.20
|
%
|
10.38
|
%
|
|||||||||
|
Ratio of debt to total capitalization
|
52.43
|
%
|
42.94
|
%
|
43.49
|
%
|
47.50
|
%
|
55.58
|
%
|
|||||||||
|
Balance sheet data:
|
|||||||||||||||||||
|
Current assets
|
$
|
7,597
|
|
$
|
7,137
|
|
$
|
6,208
|
|
$
|
8,492
|
|
$
|
3,562
|
|
||||
|
Current liabilities
|
5,671
|
|
4,220
|
|
3,762
|
|
6,581
|
|
2,277
|
|
|||||||||
|
Property, plant and equipment, net
|
13,621
|
|
12,517
|
|
11,564
|
|
11,545
|
|
11,320
|
|
|||||||||
|
Total assets
|
26,715
|
|
26,896
|
|
23,378
|
|
24,808
|
|
19,274
|
|
|||||||||
|
Long-term debt, including current maturities, capital leases, and funded letter of credit
|
9,832
|
|
10,511
|
|
8,418
|
|
8,161
|
|
8,346
|
|
|||||||||
|
Total stockholders' equity
|
$
|
7,669
|
|
$
|
8,072
|
|
$
|
7,697
|
|
$
|
7,123
|
|
$
|
5,519
|
|
||||
|
(a)
|
Liquidity position is determined as disclosed in Item 7,
Liquidity and Capital Resources, Liquidity Position
. It includes funds deposited by counterparties of
$258 million
,
$408 million
, and
$177 million
as of December 31, 2011, 2010, and 2009, respectively, which represents cash held as collateral from hedge counterparties in support of energy risk management activities. It is the Company's intention to limit the use of these funds for repayment of the related current liability for collateral received in support of energy risk management activities.
|
56
The following table provides the details of NRG's operating revenues:
|
|
Year Ended December 31,
|
||||||||||||||||||
|
|
2011
|
2010
|
2009
|
2008
|
2007
|
||||||||||||||
|
|
(In millions)
|
||||||||||||||||||
|
Energy revenue
|
$
|
3,788
|
|
$
|
4,040
|
|
$
|
4,087
|
|
$
|
4,408
|
|
$
|
4,349
|
|
||||
|
Capacity revenue
|
750
|
|
840
|
|
1,070
|
|
1,343
|
|
1,175
|
|
|||||||||
|
Retail revenue
|
5,807
|
|
5,277
|
|
4,440
|
|
—
|
|
—
|
|
|||||||||
|
Mark-to-market for economic hedging activities
|
325
|
|
(199
|
)
|
(107
|
)
|
462
|
|
(94
|
)
|
|||||||||
|
Contract amortization
|
(159
|
)
|
(195
|
)
|
(179
|
)
|
278
|
|
242
|
|
|||||||||
|
Thermal revenue
|
143
|
|
145
|
|
137
|
|
114
|
|
125
|
|
|||||||||
|
Other revenues
|
181
|
|
191
|
|
(82
|
)
|
280
|
|
192
|
|
|||||||||
|
Eliminations
|
(1,756
|
)
|
(1,250
|
)
|
(414
|
)
|
|||||||||||||
|
Total operating revenues
|
$
|
9,079
|
|
$
|
8,849
|
|
$
|
8,952
|
|
$
|
6,885
|
|
$
|
5,989
|
|
||||
Energy revenue consists of revenues received from third parties for sales of electricity in the day-ahead and real-time markets, as well as bilateral sales. It also includes energy sold through long-term PPAs for renewable facilities. In addition, energy revenue includes revenues from the settlement of financial instruments and net realized trading revenues.
Capacity revenue consists of revenues received from a third party at either the market or negotiated contract rates for making installed generation capacity available in order to satisfy system integrity and reliability requirements. Capacity revenue also includes revenues from the settlement of financial instruments. In addition, capacity revenue includes revenues received under tolling arrangements, which entitle third parties to dispatch NRG's facilities and assume title to the electrical generation produced from that facility.
Retail revenue, representing operating revenues of NRG's Retail Businesses, consists of revenues from retail electric sales to residential, small business, commercial, industrial and governmental/institutional customers, as well as revenues from the sale of excess supply into various markets, primarily in Texas.
Mark-to-market for economic hedging activities includes fair value changes of economic hedges that did not qualify for cash flow hedge accounting and ineffectiveness on cash flow hedges.
Contract amortization revenue consists of the amortization of the intangible assets for net in-market C&I contracts established in connection with the acquisitions of Reliant Energy and Green Mountain Energy, as well as acquired power contracts, gas derivative instruments, and certain power sales agreements assumed at Fresh Start and Texas Genco purchase accounting dates related to the sale of electric capacity and energy in future periods. These amounts are amortized into revenue over the term of the underlying contracts based on actual generation or contracted volumes.
Thermal revenue consists of revenues received from the sale of steam, hot and chilled water generally produced at a central district energy plant and sold to commercial, governmental and residential buildings for space heating, domestic hot water heating and air conditioning. It also includes the sale of high-pressure steam produced and delivered to industrial customers that is used as part of an industrial process.
Other revenues also consists of operations and maintenance fees, or O&M fees, construction management services, or CMA fees, sale of natural gas and emission allowances, and revenues from ancillary services. O&M fees consist of revenues received from providing certain unconsolidated affiliates with services under long-term operating agreements. CMA fees are earned where NRG provides certain management and oversight of construction projects pursuant to negotiated agreements such as for the GenConn, Cedar Bayou 4 and certain solar construction projects. Ancillary services are comprised of the sale of energy-related products associated with the generation of electrical energy such as spinning reserves, reactive power and other similar products. Other revenues also includes unrealized trading activities.
57
The discussion and analysis below has been organized as follows:
|
•
|
Executive Summary, including business strategy, the business environment in which NRG operates, how regulation, weather, competition and other factors affect the business, and significant events that are important to understanding the results of operations and financial condition for the 2011 period;
|
|
•
|
Results of operations, including an explanation of significant differences between the periods in the specific line items of NRG's Consolidated Statements of Operations;
|
|
•
|
Financial condition addressing credit ratings, liquidity position, sources and uses of cash, capital resources and requirements, commitments, and off-balance sheet arrangements; and
|
|
•
|
Critical accounting policies which are most important to both the portrayal of the Company's financial condition and results of operations, and which require management's most difficult, subjective or complex judgment.
|
As you read this discussion and analysis, refer to NRG's Consolidated Statements of Operations to this Form 10-K, which presents the results of the Company's operations for the years ended December 31, 2011, 2010, and 2009, and also refer to Item I to this Form 10-K for more detailed discussion about the Company's business.
58
Executive Summary
Business Strategy
NRG Energy, Inc., or NRG or the Company, is an integrated wholesale power generation and retail electricity company that aspires to be a leader in the way the industry and consumers think about, use, produce and deliver energy and energy services in major competitive power markets in the United States. First, NRG is a wholesale power generator engaged in the ownership and operation of power generation facilities; the trading of energy, capacity and related products; and the transacting in and trading of fuel and transportation services. Second, NRG is a retail electricity company engaged in the supply of electricity, energy services, and cleaner energy products to retail electricity customers in deregulated markets through the Retail Businesses. Finally, NRG is focused on the deployment and commercialization of potential disruptive technologies, like electric vehicles, Distributed Solar and smart meter technology, which have the potential to change the nature of the power supply industry.
The Company's core business is focused on: (i) excellence in safety and operating performance of its existing assets; (ii) serving the energy needs of end-use residential, commercial and industrial customers in the Company's core markets with a retail energy product that is differentiated either by premium service (Reliant), sustainability (Green Mountain Energy) or loyalty/affinity programs (Energy Plus); (iii) optimal hedging of baseload generation and retail load operations, while retaining optionality on the Company's peaking facilities; (iv) repowering of power generation assets at premium sites; (v) investment in, and deployment of, alternative energy technologies both in its wholesale and, particularly, in and around its retail businesses and their customers; (vi) pursuing selective acquisitions, joint ventures, divestitures and investments; and (vii) engaging in a proactive capital allocation plan focused on achieving the regular return of and on stockholder capital within the dictates of prudent balance sheet management.
The Company believes that the American energy industry is going to be increasingly impacted by the long-term societal trend towards sustainability which is both generational and irreversible. Moreover, the information technology-driven revolution which has enabled greater and easier personal choice in other sectors on the consumer economy will do the same in the American energy sector over the years to come. As a result, energy consumers will have increasing personal control over whom they buy their energy from, how that energy is generated and used and what environmental impact these individual choices will have. The Company's initiatives in this area of future growth are focused on: (i) renewables, with a concentration in solar development; (ii) electric vehicle ecosystems; (iii) customer-facing energy products and services including smart grid services, nationwide retail green electricity, unique retail sales channels involving loyalty and affinity programs and custom design; and (iv) construction of other forms of on-site clean power generation. The Company's advances in each of these areas are driven by select acquisitions, joint ventures, and investments that are more fully described in Item 1,
Business
—
New and On-going Company Initiatives and Development Projects.
Business Environment
The industry dynamics and external influences affecting the Company and the power generation industry in 2011 and for the future medium term include:
Consolidation
— There were several mergers and acquisitions in the U.S. power sector in 2011. Over the long term, industry consolidation is expected to continue.
Environmental Regulatory Landscape
— In 2011, a number of U.S. EPA air regulations were finalized providing more clarity on the impact to electric generating units. A number of regulations with the potential for impact are still in development or under review by the U.S. EPA: NSPS for GHGs, NAAQS revisions, coal combustion byproducts, and once-through cooling. While most of these regulations have been considered for some time, the outcomes and any resulting impact on NRG cannot be fully predicted until the rules are finalized. The timing and stringency of these regulations will contribute to a framework for the retrofit of existing fossil plants and deployment of new, cleaner technologies in the next decade. See Item 1,
Business
—
Environmental Matters
, for further discussion.
Public Policy Support and Government Financial Incentives for Clean Infrastructure Development
— Policy mechanisms including production and investment tax credits, cash grants, loan guarantees, accelerated depreciation tax benefits, RPS, and carbon trading plans have been implemented at the state and federal levels to support the development of renewable generation, demand-side and smart grid, and other clean infrastructure technologies. The availability and continuation of public policy support mechanisms will drive a significant part of the economics of the Company's development program and expansion into clean energy investments.
59
Natural Gas Market
— The price of natural gas plays an important role in setting the price of electricity in many of the regions where NRG operates power plants. Natural gas prices are driven by variables including demand from the industrial, residential, and electric sectors, productivity across natural gas supply basins, costs of natural gas production, changes in pipeline infrastructure, and the financial and hedging profile of natural gas consumers and producers. In 2011, average natural gas prices were 8% lower than 2010 and comparable to prices seen in 2009. Supply continues to reflect increased production from low extraction cost resources such as the shale basins. In 2012, a mild winter and increased production have led to spot prices dipping into the $2.50/MMBtu range. At these current depressed levels, significant coal-to-gas switching is expected, making wholesale changes to Merit Order in many electric markets. While some gas producers have publicly spoken of scaling back production, it is too early to assess whether there is action behind their words. At current rates of production, storage levels may challenge storage limits later in the year. While the near-term gas price outlook is depressed, a return to normal weather, coal-fired plant retirements due to proposed environmental regulations and Liquid Natural Gas export possibilities may drive higher gas prices in the medium term.
If long-term gas prices remain depressed, the Company is likely to encounter further reductions in realized energy prices, leading to lower energy revenues as higher priced hedge contracts mature and are replaced by contracts with lower gas and power prices. The Retail Businesses' gross margins have historically improved as natural gas prices decline and are likely to partially offset the impact of declining gas prices on conventional wholesale power generation. To further mitigate this impact, NRG may increase its percentage of baseload capacity sold forward using a variety of hedging instruments, as described under the heading Energy Related Commodities in Item 15 — Note 6,
Accounting for Derivative Instruments and Hedging Activities,
to the Consolidated Financial Statements. The Company's increased investment in renewable power generation supported by PPAs also mitigates declines in long term gas prices.
Electricity Price
— The price of electricity is a key determinant of the profitability of the Company's generation portfolio. Many variables such as the price of different fuels, weather, load growth and unit availability all coalesce to impact the final price for electricity. In 2011, electricity prices in Texas were higher than 2010 due primarily to the extreme weather and record-setting load experienced in August 2011. In NRG's other regions, prices were lower than in 2010, mainly due to lower gas prices and negligible demand growth. The following table summarizes average on-peak power prices for each of the major markets in which NRG operates for the years ended December 31, 2011, 2010, and 2009:
|
|
Average on Peak Power Price ($/MWh)
|
||||||||||
|
Region
|
2011
|
2010
|
2009
|
||||||||
|
Texas
|
$
|
57.42
|
|
$
|
40.40
|
|
$
|
35.43
|
|
||
|
Northeast
|
53.09
|
|
56.69
|
|
46.14
|
|
|||||
|
South Central
|
36.30
|
|
40.25
|
|
33.58
|
|
|||||
|
West
|
36.39
|
|
40.05
|
|
39.70
|
|
|||||
Weather
Weather conditions in the regions of the United States in which NRG does business influence the Company's financial results. Weather conditions can affect the supply and demand for electricity and fuels. Changes in energy supply and demand may impact the price of these energy commodities in both the spot and forward markets, which may affect the Company's results in any given period. Typically, demand for and the price of electricity is higher in the summer and the winter seasons, when temperatures are more extreme. The demand for and price of natural gas are higher in the winter. However, all regions of the United States typically do not experience extreme weather conditions at the same time, thus NRG is typically not exposed to the effects of extreme weather in all parts of its business at once.
60
Other Factors
A number of other factors significantly influence the level and volatility of prices for energy commodities and related derivative products for NRG's business. These factors include:
|
•
|
seasonal, daily and hourly changes in demand;
|
|
•
|
extreme peak demands;
|
|
•
|
available supply resources;
|
|
•
|
transportation and transmission availability and reliability within and between regions;
|
|
•
|
location of NRG's generating facilities relative to the location of its load-serving opportunities;
|
|
•
|
procedures used to maintain the integrity of the physical electricity system during extreme conditions; and
|
|
•
|
changes in the nature and extent of federal and state regulations.
|
These factors can affect energy commodity and derivative prices in different ways and to different degrees. These effects may vary throughout the country as a result of regional differences in:
|
•
|
weather conditions;
|
|
•
|
market liquidity;
|
|
•
|
capability and reliability of the physical electricity and gas systems;
|
|
•
|
local transportation systems; and
|
|
•
|
the nature and extent of electricity deregulation.
|
Environmental Matters, Regulatory Matters and Legal Proceedings
NRG discusses details of its other environmental matters in Item 15 — Note 24,
Environmental Matters
, to the Consolidated Financial Statements and Item 1,
Business — Environmental Matters,
section. NRG discusses details of its regulatory matters in Item 15 — Note 23,
Regulatory Matters
, to the Consolidated Financial Statements and Item 1,
Business — Regulatory Matters,
section. NRG discusses details of its legal proceedings in Item 15 — Note 22,
Commitments and Contingencies
, to the Consolidated Financial Statements. Some of this information relates to costs that may be material to the Company's financial results.
Impact of inflation on NRG's results
Unless discussed specifically in the relevant segment, for the years ended December 31, 2011, 2010 and 2009, the impact of inflation and changing prices (due to changes in exchange rates) on NRG's revenues and net income was immaterial.
Significant events during the year ended December 31, 2011
Results of Operations and Financial Condition
|
•
|
Lower net income
— Net income decreased by 59% from $477 million to $197 million, which reflects a decrease in gross margin for wholesale generation driven by lower realized prices and a decrease in gross margin from the unprecedented heat wave in August 2011 in Texas, which negatively impacted both retail and generation gross margins. In addition, the decrease reflects a $160 million impairment charge on emissions allowances, the $495 million impairment of NRG's investment in Nuclear Innovation North America LLC, or NINA, and a loss on debt extinguishment of $175 million. These amounts were offset in part by a tax benefit of $843 million in 2011, which primarily reflects the impact of the resolution of the federal tax audit in June 2011, compared to tax expense of $277 million in 2010.
|
|
•
|
Liquidity position
— The Company's total liquidity, excluding collateral received, decreased by $2.2 billion in 2011. Cash balances decreased by $1.8 billion since the end of 2010, primarily due to capital expenditures for solar and other repowering projects, as well as additional share repurchases. In addition, availability under the revolving credit arrangements decreased due to additional letters of credit required for solar and other repowering projects.
|
|
•
|
Long-term debt
— During 2011, the Company increased its non-recourse debt by approximately $1.0 billion primarily in connection with the financing of the construction of three Utility Scale Solar facilities.
|
61
Consolidated Results of Operations
2011 compared to 2010
The following table provides selected financial information for the Company:
|
|
Year Ended December 31,
|
|
||||||||
|
(In millions except otherwise noted)
|
2011
|
2010
|
Change %
|
|||||||
|
Operating Revenues
|
|
|
|
|||||||
|
Energy revenue
(a)
|
$
|
2,069
|
|
$
|
2,854
|
|
(28
|
)%
|
||
|
Capacity revenue
(a)
|
736
|
|
824
|
|
(11
|
)
|
||||
|
Retail revenue
|
5,807
|
|
5,277
|
|
10
|
|
||||
|
Mark-to-market for economic hedging activities
|
325
|
|
(199
|
)
|
263
|
|
||||
|
Contract amortization
|
(159
|
)
|
(195
|
)
|
18
|
|
||||
|
Thermal revenue
|
143
|
|
145
|
|
(1
|
)
|
||||
|
Other revenues
(b)
|
158
|
|
143
|
|
10
|
|
||||
|
Total operating revenues
|
9,079
|
|
8,849
|
|
3
|
|
||||
|
Operating Costs and Expenses
|
|
|
|
|||||||
|
Generation cost of sales
(a)
|
2,425
|
|
2,102
|
|
15
|
|
||||
|
Retail cost of sales
(a)
|
2,815
|
|
2,822
|
|
—
|
|
||||
|
Mark-to-market for economic hedging activities
|
169
|
|
(111
|
)
|
252
|
|
||||
|
Contract and emissions credit amortization
|
47
|
|
15
|
|
213
|
|
||||
|
Thermal cost of sales
|
63
|
|
68
|
|
(7
|
)
|
||||
|
Other cost of operations
|
1,156
|
|
1,177
|
|
(2
|
)
|
||||
|
Total cost of operations
|
6,675
|
|
6,073
|
|
10
|
|
||||
|
Depreciation and amortization
|
896
|
|
838
|
|
7
|
|
||||
|
Impairment charge on emission allowances
|
160
|
|
—
|
|
N/A
|
|
||||
|
Selling, general and administrative
|
668
|
|
598
|
|
12
|
|
||||
|
Development costs
|
45
|
|
55
|
|
(18
|
)
|
||||
|
Total operating costs and expenses
|
8,444
|
|
7,564
|
|
12
|
|
||||
|
Gain on sale of assets
|
—
|
|
23
|
|
(100
|
)
|
||||
|
Operating Income
|
635
|
|
1,308
|
|
(51
|
)
|
||||
|
Other Income/(Expense)
|
|
|
|
|||||||
|
Equity in earnings of unconsolidated affiliates
|
35
|
|
44
|
|
(20
|
)
|
||||
|
Impairment charge on investment
|
(495
|
)
|
—
|
|
N/A
|
|
||||
|
Other income, net
|
19
|
|
33
|
|
(42
|
)
|
||||
|
Loss on debt extinguishment
|
(175
|
)
|
(2
|
)
|
N/A
|
|
||||
|
Interest expense
|
(665
|
)
|
(630
|
)
|
6
|
|
||||
|
Total other expense
|
(1,281
|
)
|
(555
|
)
|
131
|
|
||||
|
(Loss)/Income before income tax expense
|
(646
|
)
|
753
|
|
(186
|
)
|
||||
|
Income tax (benefit)/ expense
|
(843
|
)
|
277
|
|
(404
|
)
|
||||
|
Net Income
|
197
|
|
476
|
|
(59
|
)
|
||||
|
Less: Net loss attributable to noncontrolling interest
|
—
|
|
(1
|
)
|
100
|
|
||||
|
Net income attributable to NRG Energy, Inc.
|
$
|
197
|
|
$
|
477
|
|
(59
|
)
|
||
|
Business Metrics
|
|
|
|
|||||||
|
Average natural gas price — Henry Hub ($/MMBtu)
|
4.04
|
|
4.39
|
|
(8
|
)%
|
||||
|
(a)
|
Includes realized gains and losses from financially settled transactions.
|
|
(b)
|
Includes unrealized trading gains and losses.
|
|
(c)
|
Includes amortization of SO
2
and NO
x
credits and excludes amortization of Regional Greenhouse Gas Initiative, or RGGI, credits.
|
N/A - Not Applicable
62
Management's discussion of the results of operations for the years ended December 31, 2011 and 2010
Wholesale Power Generation Revenues and Cost of Sales
The following is a discussion of gross margin for NRG's wholesale power generation regions, adjusted to eliminate intersegment activity primarily with Reliant Energy and Green Mountain Energy.
|
|
Year Ended December 31, 2011
|
||||||||||||||||||||||||||||||
|
(In millions except otherwise noted)
|
Texas
|
Northeast
|
South Central
|
West
|
Other
|
Total
Wholesale
Power
Generation
|
Eliminations
|
Consolidated
Total
|
|||||||||||||||||||||||
|
Energy revenue
|
$
|
2,561
|
|
$
|
579
|
|
$
|
548
|
|
$
|
42
|
|
$
|
58
|
|
$
|
3,788
|
|
$
|
(1,719
|
)
|
$
|
2,069
|
|
|||||||
|
Capacity revenue
|
28
|
|
291
|
|
243
|
|
118
|
|
70
|
|
750
|
|
(14
|
)
|
736
|
|
|||||||||||||||
|
Thermal revenue
|
143
|
|
143
|
|
143
|
|
|||||||||||||||||||||||||
|
Other revenue
|
106
|
|
26
|
|
18
|
|
4
|
|
27
|
|
181
|
|
(23
|
)
|
158
|
|
|||||||||||||||
|
Generation revenue
|
2,695
|
|
896
|
|
809
|
|
164
|
|
298
|
|
4,862
|
|
$
|
(1,756
|
)
|
$
|
3,106
|
|
|||||||||||||
|
Generation cost of sales
|
(1,220
|
)
|
(527
|
)
|
(547
|
)
|
(16
|
)
|
(115
|
)
|
(2,425
|
)
|
|||||||||||||||||||
|
Thermal cost of sales
|
(63
|
)
|
(63
|
)
|
|||||||||||||||||||||||||||
|
Generation cost of sales
|
(1,220
|
)
|
(527
|
)
|
(547
|
)
|
(16
|
)
|
(178
|
)
|
(2,488
|
)
|
|||||||||||||||||||
|
Generation gross margin
|
$
|
1,475
|
|
$
|
369
|
|
$
|
262
|
|
$
|
148
|
|
$
|
120
|
|
$
|
2,374
|
|
|||||||||||||
|
Business Metrics
|
|
|
|
|
|
|
|
|
|||||||||||||||||||||||
|
MWh sold (in thousands)
|
49,261
|
|
9,317
|
|
17,131
|
|
295
|
|
|
|
|
|
|
|
|
|
|||||||||||||||
|
MWh generated (in thousands)
|
46,348
|
|
7,361
|
|
16,000
|
|
295
|
|
|
|
|
|
|
|
|
|
|||||||||||||||
|
|
Year Ended December 31, 2010
|
||||||||||||||||||||||||||||||
|
(In millions except otherwise noted)
|
Texas
|
Northeast
|
South Central
|
West
|
Other
|
Total
Wholesale
Power
Generation
|
Eliminations
|
Consolidated
Total
|
|||||||||||||||||||||||
|
Energy revenue
|
$
|
2,850
|
|
$
|
726
|
|
$
|
387
|
|
$
|
31
|
|
$
|
46
|
|
$
|
4,040
|
|
$
|
(1,186
|
)
|
$
|
2,854
|
|
|||||||
|
Capacity revenue
|
25
|
|
396
|
|
235
|
|
113
|
|
71
|
|
840
|
|
(16
|
)
|
824
|
|
|||||||||||||||
|
Thermal revenue
|
145
|
|
145
|
|
145
|
|
|||||||||||||||||||||||||
|
Other revenue
|
118
|
|
47
|
|
10
|
|
4
|
|
12
|
|
191
|
|
(48
|
)
|
143
|
|
|||||||||||||||
|
Generation revenue
|
2,993
|
|
1,169
|
|
632
|
|
148
|
|
274
|
|
5,216
|
|
$
|
(1,250
|
)
|
$
|
3,966
|
|
|||||||||||||
|
Generation cost of sales
|
(1,088
|
)
|
(493
|
)
|
(403
|
)
|
(15
|
)
|
(103
|
)
|
(2,102
|
)
|
|||||||||||||||||||
|
Thermal cost of sales
|
(68
|
)
|
(68
|
)
|
|||||||||||||||||||||||||||
|
Generation cost of sales
|
(1,088
|
)
|
(493
|
)
|
(403
|
)
|
(15
|
)
|
(171
|
)
|
(2,170
|
)
|
|||||||||||||||||||
|
Generation gross margin
|
$
|
1,905
|
|
$
|
676
|
|
$
|
229
|
|
$
|
133
|
|
$
|
103
|
|
$
|
3,046
|
|
|||||||||||||
|
Business Metrics
|
|
|
|
|
|
|
|
|
|||||||||||||||||||||||
|
MWh sold (in thousands)
|
46,926
|
|
10,581
|
|
13,046
|
|
269
|
|
|
|
|
|
|
|
|
|
|||||||||||||||
|
MWh generated (in thousands)
|
44,700
|
|
9,355
|
|
11,168
|
|
269
|
|
|
|
|
|
|
|
|
|
|||||||||||||||
63
|
|
Year Ended December 31,
|
||||||||||
|
|
Texas
|
Northeast
|
South Central
|
West
|
|||||||
|
Weather Metrics
|
|
|
|
|
|||||||
|
2011
|
|
|
|
|
|||||||
|
CDDs
(a)
|
3,440
|
|
750
|
|
1,817
|
|
717
|
|
|||
|
HDDs
(a)
|
1,911
|
|
5,770
|
|
3,387
|
|
3,364
|
|
|||
|
2010
|
|
|
|
|
|||||||
|
CDDs
|
2,884
|
|
850
|
|
2,006
|
|
678
|
|
|||
|
HDDs
|
2,161
|
|
5,720
|
|
3,929
|
|
2,753
|
|
|||
|
30 year average
|
|
|
|
|
|||||||
|
CDDs
|
2,647
|
|
537
|
|
1,548
|
|
704
|
|
|||
|
HDDs
|
1,997
|
|
6,257
|
|
3,601
|
|
3,218
|
|
|||
|
(a)
|
National Oceanic and Atmospheric Administration-Climate Prediction Center — A Cooling Degree Day, or CDD, represents the number of degrees that the mean temperature for a particular day is above 65 degrees Fahrenheit in each region. A Heating Degree Day, or HDD, represents the number of degrees that the mean temperature for a particular day is below 65 degrees Fahrenheit in each region. The CDDs/HDDs for a period of time are calculated by adding the CDDs/HDDs for each day during the period.
|
Generation gross margin —
decreased by $672 million, including intercompany sales, during the year ended December 31, 2011, compared to the same period in
2010
, due to:
|
Decrease in Texas region
|
$
|
(430
|
)
|
|
Decrease in Northeast region
|
(307
|
)
|
|
|
Increase in South Central region
|
33
|
|
|
|
Increase in West region
|
15
|
|
|
|
Other
|
17
|
|
|
|
$
|
(672
|
)
|
|
The decrease in gross margin in the Texas region was driven by:
|
Lower energy revenue due to a 14% decrease in average realized energy prices, which reflects lower
hedged prices in 2011
|
$
|
(327
|
)
|
|
Losses incurred primarily due to hedging and trading optimization activities, and the impact of unplanned outages at gas plants as ERCOT power prices spiked in August 2011
|
(80
|
)
|
|
|
Higher coal costs due to a 9% increase in realized coal prices offset by favorable financial fuel hedges
|
(40
|
)
|
|
|
Favorable gross margin impact from a 2% increase in coal generation driven by higher economic dispatch and fewer planned outages, partially offset by greater unplanned outages
|
24
|
|
|
|
Unfavorable gross margin impact due to a 4% decrease in nuclear generation driven by an increase in unplanned outages
|
(18
|
)
|
|
|
Favorable gross margin impact from a 21% increase in wind generation primarily from the acquisition of
South Trent in 2010
|
12
|
|
|
|
Other
|
(1
|
)
|
|
|
$
|
(430
|
)
|
|
64
The decrease in gross margin in the Northeast region was driven by:
|
Lower gross margin from coal plants due to a 34% decrease in realized energy prices
|
$
|
(129
|
)
|
|
Lower gross margin from coal plants resulting from a 30% decrease in generation, due to the region's power generation switching from coal to gas plants as gas prices decreased and due to the retirement of one unit at Indian River
|
(81
|
)
|
|
|
Lower capacity revenue due to 10% lower volumes from higher forced outage rates and a 12% decrease in realized prices
|
(71
|
)
|
|
|
Lower capacity revenue due to significantly lower LFRM prices and volumes in New England
|
(27
|
)
|
|
|
Other
|
1
|
|
|
|
$
|
(307
|
)
|
|
The increase in gross margin in the South Central region was driven by:
|
Higher gross margin from merchant energy due to a 155% increase in MWh sold, primarily related to the addition of the Cottonwood facility
|
$
|
29
|
|
|
Lower merchant revenue related to a 7% decrease in average realized prices
|
(18
|
)
|
|
|
Higher contract revenue from new contracts with three regional municipalities
|
29
|
|
|
|
Higher capacity revenue due primarily to higher cooperative billing peaks
|
8
|
|
|
|
Higher coal costs due to a 1% increase in generation at the region's coal plant which reflects fewer outage hours in 2011 and a 4% increase in price due to higher transportation costs
|
(16
|
)
|
|
|
Other
|
1
|
|
|
|
$
|
33
|
|
|
The increase in gross margin in the West region was driven by:
|
Higher capacity revenue due to additional sales at El Segundo and a price increase on the Cabrillo I tolling agreement
|
$
|
5
|
|
|
Increase in merchant gross margin related to additional generation from various solar facilities that began operations in 2011, as well as a 6% increase in El Segundo merchant generation
|
4
|
|
|
|
Increase in other revenue due to fuel oil sales at Encina and financial revenues
|
6
|
|
|
|
$
|
15
|
|
|
65
Retail Gross Margin
The Company's retail gross margin, which reflects retail operating revenues less retail cost of sales, includes the results of NRG's Reliant Energy business segment, as well as the results of Green Mountain Energy and Energy Plus which are included in NRG's Corporate business segment.
|
Year ended December 31, 2011
|
||||||||||||||||||
|
(In millions)
|
Reliant Energy
|
Green Mountain
|
Energy Plus
(a)
|
Total Retail Businesses
|
Eliminations
|
Consolidated Total
|
||||||||||||
|
Retail operating revenues
|
$
|
5,075
|
|
$
|
674
|
|
$
|
63
|
|
$
|
5,812
|
|
$
|
(5
|
)
|
$
|
5,807
|
|
|
Retail cost of sales
|
4,020
|
|
500
|
|
38
|
|
4,558
|
|
(1,743
|
)
|
2,815
|
|
||||||
|
Retail gross margin
|
$
|
1,055
|
|
$
|
174
|
|
$
|
25
|
|
$
|
1,254
|
|
|
|
||||
|
(a) Energy Plus was acquired on September 30, 2011.
|
||||||||||||||||||
|
Year ended December 31, 2010
|
||||||||||||||||||
|
(In millions)
|
Reliant Energy
|
Green Mountain
(b)
|
Total Retail Businesses
|
Eliminations
|
Consolidated Total
|
|||||||||||||
|
Retail operating revenues
|
5,210
|
|
$
|
69
|
|
$
|
5,279
|
|
$
|
(2
|
)
|
$
|
5,277
|
|
||||
|
Retail cost of sales
|
4,020
|
|
46
|
|
4,066
|
|
(1,244
|
)
|
2,822
|
|
||||||||
|
Retail gross margin
|
$
|
1,190
|
|
$
|
23
|
|
|
$
|
1,213
|
|
||||||||
|
(b) Green Mountain Energy was acquired in November 2010.
|
|
|||||||||||||||||
Reliant Energy
The following is a detailed discussion of retail gross margin for NRG's Reliant Energy business segment.
|
Year ended December 31
|
|||||||
|
(In millions except otherwise noted)
|
2011
|
2010
|
|||||
|
Operating Revenues
|
|
|
|||||
|
Mass revenues
|
$
|
3,008
|
|
$
|
3,076
|
|
|
|
Commercial and Industrial revenues
|
1,894
|
|
1,976
|
|
|||
|
Supply management revenues
|
173
|
|
158
|
|
|||
|
Retail operating revenues
(a)
|
5,075
|
|
5,210
|
|
|||
|
Retail cost of sales
(b)
|
4,020
|
|
4,020
|
|
|||
|
Retail gross margin
|
$
|
1,055
|
|
$
|
1,190
|
|
|
|
Business Metrics
|
|
|
|||||
|
Electricity sales volume — GWh
|
|
|
|||||
|
Mass
|
23,684
|
|
22,255
|
|
|||
|
Commercial and Industrial
(a)
|
26,022
|
|
26,124
|
|
|||
|
Average retail customers count (in thousands, metered locations)
|
|
|
|||||
|
Mass
|
1,477
|
|
1,490
|
|
|||
|
Commercial and Industrial
(a)
|
62
|
|
63
|
|
|||
|
Retail customers count (in thousands, metered locations)
|
|
|
|||||
|
Mass
|
1,489
|
|
1,459
|
|
|||
|
Commercial and Industrial
(a)
|
66
|
|
62
|
|
|||
|
Weather Metrics
|
|
|
|||||
|
CDDs
(c)
|
3,845
|
|
3,305
|
|
|||
|
HDDs
(c)
|
1,570
|
|
1,812
|
|
|||
|
(a)
|
Includes customers of the Texas General Land Office, for whom the Company provides services.
|
|
(b)
|
Includes intercompany purchases from the Texas region of $1,537 million and $1,241 million, respectively.
|
|
(c)
|
The CDDs/HDDs amounts are representative of the Coast and North Central Zones within the ERCOT market in which Reliant Energy serves its customer base.
|
66
|
•
|
Retail gross margin
— Reliant Energy's gross margin decreased $135 million for the year ended December 31, 2011, compared to the same period in
2010
, driven by:
|
|
Unfavorable gross margin impact of an unprecedented heat wave which resulted in high supply costs for incremental weather volume in August 2011, offset in part by the favorable impact of weather in the first six months of 2011
|
$
|
(50
|
)
|
|
Favorable volume impact on gross margin of higher average customer usage, offset in part by fewer customers and a change in customer mix
|
25
|
|
|
|
Decrease in retail margins of 8% due to lower pricing on acquisitions and renewals consistent with
competitive offers
|
(42
|
)
|
|
|
Estimated favorable impact in 2010 as compared to 2011 from the termination of out-of-market supply contracts in conjunction with 2009 CSRA unwind
|
(68
|
)
|
|
|
$
|
(135
|
)
|
|
|
•
|
Trends — C
ustomer counts increased by approximately 34,000 since
December 31, 2010
, indicating a stabilization of customer attrition. Higher than normal cooling and heating degree days in both periods resulted in higher customer usage of 13% in 2011 and 7% in 2010 when compared to ten-year normal weather.
|
Green Mountain Energy
The following is a discussion of retail gross margin for Green Mountain Energy, which is included in the Company's Corporate segment:
|
Year ended December 31
|
|||||||
|
(in millions)
|
2011
|
2010
(b)
|
|||||
|
Retail operating revenues
|
$
|
674
|
|
$
|
69
|
|
|
|
Retail cost of sales
(a)
|
500
|
|
46
|
|
|||
|
Retail gross margin
|
$
|
174
|
|
$
|
23
|
|
|
|
(a) Includes intercompany purchases of $190 million
|
|||||||
|
(b) 2010 represents the period from November 5, 2010 to December 31, 2010.
|
|||||||
|
•
|
Retail gross margin —
Green Mountain Energy's gross margin of $174 million for the year ended
December 31, 2011
, reflects increasing customer count during the year and higher than normal customer usage due to the impact of an unprecedented heat wave in Texas in the third quarter. Certain extraordinary weather events during the year led to abnormally high power prices in Texas, which resulted in increased cost of sales for the incremental customer usage. Revenues were generated 63% and 37% from residential and commercial customers, respectively. Total metered customer counts, including utility partner customers, were approximately 411,000 and increased approximately 15%, or 55,000 in the
twelve
months ended
December 31, 2011
.
|
Energy Plus
The following is a discussion of retail gross margin for Energy Plus, which is included in the Company's Corporate segment, for the period from September 30, 2011 to December 31, 2011:
|
Retail operating revenues
|
$
|
63
|
|
|
Retail cost of sales
(a)
|
38
|
|
|
|
Retail gross margin
|
$
|
25
|
|
|
(a) Includes intercompany purchases of $16 million
|
|||
|
•
|
Retail gross margin —
Energy Plus gross margin of $25 million for the period ended
December 31, 2011
, reflects increasing customer count during the period. Total metered customer counts were 188,000 and increased approximately 13%, or 22,000 in the three months ended
December 31, 2011
.
|
67
Mark-to-market for Economic Hedging Activities
Mark-to-market for economic hedging activities includes asset-backed hedges that have not been designated as cash flow hedges and ineffectiveness on cash flow hedges. Total net mark-to-market results increased by $244 million in the year ended December 31, 2011, compared to the same period in 2010.
The breakdown of gains and losses included in operating revenues and operating costs and expenses by region are as follows:
|
|
Year Ended December 31, 2011
|
||||||||||||||||||||||||||||||||||
|
|
Reliant
Energy
|
Texas
|
North-east
|
South
Central
|
West
|
Thermal
|
Corporate
(a)
|
Elimination
(b)
|
Total
|
||||||||||||||||||||||||||
|
|
(In millions)
|
||||||||||||||||||||||||||||||||||
|
Mark-to-market results in operating revenues
|
|
|
|
|
|
|
|
|
|
||||||||||||||||||||||||||
|
Reversal of previously recognized unrealized (gains)/losses on settled positions related to economic hedges
|
$
|
(1
|
)
|
$
|
(72
|
)
|
$
|
19
|
|
$
|
26
|
|
$
|
(2
|
)
|
$
|
—
|
|
$
|
—
|
|
$
|
(48
|
)
|
$
|
(78
|
)
|
||||||||
|
Net unrealized gains/(losses) on open positions related to economic hedges
|
9
|
|
245
|
|
9
|
|
(38
|
)
|
(2
|
)
|
—
|
|
—
|
|
180
|
|
403
|
|
|||||||||||||||||
|
Total mark-to-market gains/(losses) in operating revenues
|
$
|
8
|
|
$
|
173
|
|
$
|
28
|
|
$
|
(12
|
)
|
$
|
(4
|
)
|
$
|
—
|
|
$
|
—
|
|
$
|
132
|
|
$
|
325
|
|
||||||||
|
Mark-to-market results in operating costs and expenses
|
|
|
|
|
|
|
|
|
|
||||||||||||||||||||||||||
|
Reversal of previously recognized unrealized losses/(gains) on settled positions related to economic hedges
|
$
|
104
|
|
$
|
—
|
|
$
|
(6
|
)
|
$
|
(4
|
)
|
$
|
—
|
|
$
|
—
|
|
$
|
(10
|
)
|
$
|
48
|
|
$
|
132
|
|
||||||||
|
Reversal of loss positions acquired as part of the Reliant Energy acquisition as of May 1, 2009
|
72
|
|
—
|
|
—
|
|
—
|
|
—
|
|
—
|
|
—
|
|
—
|
|
72
|
|
|||||||||||||||||
|
Reversal of loss positions acquired as part of the Green Mountain Energy acquisition as of November 5, 2010
|
—
|
|
—
|
|
—
|
|
—
|
|
—
|
|
—
|
|
35
|
|
—
|
|
35
|
|
|||||||||||||||||
|
Net unrealized losses on open positions related to economic hedges
|
(139
|
)
|
(23
|
)
|
(17
|
)
|
(13
|
)
|
—
|
|
—
|
|
(36
|
)
|
(180
|
)
|
(408
|
)
|
|||||||||||||||||
|
Total mark-to-market gains/(losses) in operating costs and expenses
|
$
|
37
|
|
$
|
(23
|
)
|
$
|
(23
|
)
|
$
|
(17
|
)
|
$
|
—
|
|
$
|
—
|
|
$
|
(11
|
)
|
$
|
(132
|
)
|
$
|
(169
|
)
|
||||||||
|
(a)
|
Corporate segment consists of Green Mountain Energy and Energy Plus activity.
|
|
(b)
|
Represents the elimination of the intercompany activity between the Texas or Northeast and Reliant Energy, Green Mountain Energy or Energy Plus regions.
|
Mark-to-market results consist of unrealized gains and losses. The settlement of these transactions is reflected in the same caption as the items being hedged.
For the year ended December 31, 2011, the $403 million gain in operating revenue from economic hedge positions was primarily driven by an increase in value of forward purchases and sales of natural gas and electricity due to a decrease in forward power and gas prices. The $408 million loss in operating costs and expenses from economic hedge positions was primarily driven by a decrease in value of forward purchases of natural gas, electricity and fuel due to a decrease in forward power and gas prices. Reliant Energy's $72 million gain from the roll-off of acquired derivatives consists of loss positions that were acquired as of May 1, 2009, and valued using forward prices on that date. These roll-off amounts were offset by realized losses at the settled prices and higher costs of physical power which are reflected in operating costs and expenses during the same period. Green Mountain Energy's $35 million gain from the roll-off of acquired derivatives consists of loss positions that were acquired as of November 5, 2010, and valued using forward prices on that date. These roll-off amounts were offset by realized losses at the settled prices and higher costs of physical power which are reflected in operating costs and expenses during the same period.
68
In accordance with ASC 815, the following table represents the results of the Company's financial and physical trading of energy commodities for the years ended December 31, 2011, and 2010. The realized and unrealized financial and physical trading results are included in operating revenues. The Company's trading activities are subject to limits within the Company's Risk Management Policy.
|
|
Year Ended December 31,
|
||||||
|
|
2011
|
2010
|
|||||
|
|
(In millions)
|
||||||
|
Trading gains/(losses)
|
|
|
|||||
|
Realized
|
$
|
(31
|
)
|
$
|
(25
|
)
|
|
|
Unrealized
|
63
|
|
64
|
|
|||
|
Total trading gains
|
$
|
32
|
|
$
|
39
|
|
|
Contract Amortization Revenue
Contract amortization represents the roll-off of in-market customer contracts valued under purchase accounting and the favorable change of $36 million as compared to the prior period in 2010 related primarily to lower contract amortization of $74 million for Reliant Energy, offset by higher contract amortization of $29 million for Green Mountain Energy.
Contract and Emissions Credit Amortization
Contract and emissions credit amortization increased primarily due to lower amortization, which is an offset to expense, of out-of-the-money energy supply contracts that were valued as part of the purchase accounting for Reliant Energy.
Other Operating Costs
|
Reliant
Energy
|
Texas
|
Northeast
|
South
Central
|
West
|
Thermal
|
Other
|
Total
|
||||||||||||||||||||||||
|
|
(In millions)
|
||||||||||||||||||||||||||||||
|
Year Ended December 31, 2011
|
$
|
187
|
|
$
|
507
|
|
$
|
241
|
|
$
|
104
|
|
$
|
59
|
|
$
|
37
|
|
$
|
21
|
|
$
|
1,156
|
|
|||||||
|
Year Ended December 31, 2010
|
$
|
193
|
|
$
|
501
|
|
$
|
287
|
|
$
|
93
|
|
$
|
65
|
|
$
|
40
|
|
$
|
(2
|
)
|
$
|
1,177
|
|
|||||||
Other operating costs decreased by $21 million for the year ended
December 31, 2011
, compared to the same period in
2010
, due to:
|
(In millions)
|
|||
|
Decrease in Northeast region operations and maintenance expense
|
$
|
(50
|
)
|
|
Increase in Corporate operations and maintenance expense
|
25
|
|
|
|
Increase in South Central region operations and maintenance expense
|
6
|
|
|
|
Other
|
(2
|
)
|
|
|
$
|
(21
|
)
|
|
69
|
◦
|
Northeast operations and maintenance
—
decreased due to a $19 million reduction in normal and major maintenance, primarily in Western New York, an $18 million decrease in operational labor from headcount reductions at plants in New England and New York, and prior year write-offs of $21 million of construction-in-progress, including those in connection with the early retirement of Indian River Unit 3, and additional write-offs at Arthur Kill, Keystone and Conemaugh. These were offset in part by the current year write-off of $12 million of Bluewater Wind assets.
|
|
◦
|
Corporate operations and maintenance
—
increased as a result of the acquisition of Green Mountain Energy in November 2010, resulting in a full year of expense compared to two months in the prior year, as well as the acquisition of Energy Plus on September 30, 2011.
|
|
◦
|
South Central operations and maintenance
—
increased by $18 million due to increased operations and maintenance related to the addition of the Cottonwood Facility, offset in part by $12 million related to the scope and timing of outage work at Big Cajun II in 2010.
|
Depreciation and Amortization
NRG's depreciation and amortization expense increased by $58 million during the year ended December 31, 2011, compared to the same period in 2010. This was primarily due to additional depreciation related to a full year of depreciation for Cottonwood, Green Mountain Energy, and Northwind Phoenix which were acquired in 2010, as compared to a partial year of depreciation in 2010.
Impairment Charge on Emission Allowances
As described in Item 15
—
Note 24
,
Environmental Matters
,
to the Consolidated Financial Statements,
the Company recorded an impairment charge of $160 million in the year ended
December 31, 2011
, on the Company's Acid Rain Program SO
2
emission allowances, which were recorded as an intangible asset on the Company's balance sheet. The impairment charge reflects the write-off of the value of emission allowances in excess of those required for compliance with the Acid Rain Program.
Selling, General and Administrative Expenses
Selling, general and administrative expenses increased by $70 million during the year ended December 31, 2011, compared to the same period in 2010, which was primarily due to:
|
•
|
The acquisition of Green Mountain Energy in November 2010, and the acquisition of Energy Plus in September 2011, which resulted in additional expense in 2011 of $74 million and $16 million, respectively.
|
|
•
|
Increased marketing costs of $8 million associated with additional advertising campaigns and sponsorship arrangements.
|
These increases were offset by:
|
•
|
A decrease in bad debt expense of $13 million at Reliant Energy due to improved customer payment behavior and decreased revenues.
|
|
•
|
A decrease in employee benefits costs of $24 million.
|
|
•
|
A reduction in charitable contributions, due to $8 million of funding for the Reliant Energy Charitable Foundation which was created and funded in 2010.
|
Development Costs
Development costs decreased $10 million during the year ended December 31, 2011, compared to the same period in 2010, as many of the NRG Solar projects are in construction phase in 2011.
Gain on Sale of Assets
On January 11, 2010, NRG sold Padoma to Enel, recognizing a gain on the sale of $23 million.
70
Equity in Earnings of Unconsolidated Affiliates
NRG's equity earnings from unconsolidated affiliates decreased by $9 million during the year ended December 31, 2011, compared to the same period in 2010. The decrease is due primarily to the changes in fair value of Sherbino's forward gas contract of $10 million and a decrease in equity earnings from Gladstone of $15 million, offset by an increase in equity earnings of $10 million from GenConn, as the Devon and Middletown peaking facilities commenced commercial operations in June 2010 and June 2011, respectively, and an increase of $2 million from Saguaro.
Impairment Charge on Investment
As discussed in more detail in Item 15
—
Note 4
,
Nuclear Innovation North America LLC Developments, Including Impairment Charge
, to the Consolidated Financial Statements, the devastating March 2011 earthquake and tsunami in Japan, which in turn, triggered a nuclear incident at the Fukushima Daiichi Nuclear Power Station, caused NRG to evaluate its investment in NINA for impairment. Consequently, NRG deconsolidated its investment in NINA and recorded an impairment charge in the first quarter equal to the balance of its investment in NINA. In concurrence with a substantial reduction in NINA's project workforce, and to support NINA's reduced scope of work, NRG contributed an additional $14 million into NINA in the year ended
December 31, 2011
. As a result, NRG recorded an impairment charge of
$495 million
in the year ended
December 31, 2011
.
Other Income/(Expense), Net
NRG's other income, net decreased $14 million during the year ended December 31, 2011, compared to the same period in 2010, which relates primarily to foreign exchange gains of $14 million recognized in the prior period.
A loss on debt extinguishment of $175 million was recorded in the year ended
December 31, 2011
, which primarily consisted of the premiums paid on redemption and the write-off of previously deferred financing costs related to the redemptions of the 2014 Senior Notes and the 2016 Senior Notes, and the write-off of previously deferred financing costs related to the replacement of NRG's Senior Credit Facility with the 2011 Senior Credit Facility.
Interest Expense
NRG's interest expense increased by $35 million during the year ended December 31, 2011, compared to the same period in 2010 due to the following:
|
|
(In millions)
|
||
|
Increase/(decrease) in interest expense
|
|
||
|
Increase for 2020 Senior Notes issued in August 2010
|
$
|
58
|
|
|
Increase for 2018 Senior Notes issued in January 2011
|
85
|
|
|
|
Increase for 2019 and 2021 Senior Notes issued in May 2011
|
94
|
|
|
|
Decrease for 2014 Senior Notes redeemed in January and February 2011
|
(65
|
)
|
|
|
Decrease for 2016 Senior Notes redeemed in May and June 2011
|
(102
|
)
|
|
|
Increase for project financings
|
15
|
|
|
|
Increase for tax-exempt bonds
|
12
|
|
|
|
Decrease for refinancing of term loan and revolving credit facility
|
(18
|
)
|
|
|
Decrease for capitalized interest
|
(44
|
)
|
|
|
Total
|
$
|
35
|
|
71
Income Tax Expense
There was an income tax benefit of $843 million for the year ended December 31, 2011, compared to income tax expense of $277 million for the year ended December 31, 2010. The effective tax rate was 130.5% and 36.8% for the year ended December 31, 2011, and 2010, respectively.
|
|
Year Ended December 31,
|
||||||
|
|
2011
|
2010
|
|||||
|
|
(In millions
except as otherwise stated)
|
||||||
|
(Loss)/Income Before Income Taxes
|
$
|
(646
|
)
|
$
|
753
|
|
|
|
Tax at 35%
|
(226
|
)
|
264
|
|
|||
|
State taxes, net of federal benefit
|
15
|
|
18
|
|
|||
|
Foreign operations
|
(3
|
)
|
(3
|
)
|
|||
|
Federal and state tax credits
|
(1
|
)
|
(7
|
)
|
|||
|
Valuation allowance
|
(63
|
)
|
(34
|
)
|
|||
|
Expiration/utilization of capital losses
|
45
|
|
—
|
|
|||
|
Reversal of valuation allowance on expired/utilized capital losses
|
(45
|
)
|
—
|
|
|||
|
Foreign earnings
|
4
|
|
17
|
|
|||
|
Non-deductible interest
|
—
|
|
4
|
|
|||
|
Interest accrued on uncertain tax positions
|
2
|
|
25
|
|
|||
|
Production tax credits
|
(14
|
)
|
(11
|
)
|
|||
|
Reversal of uncertain tax position reserves
|
(561
|
)
|
—
|
|
|||
|
Other
|
4
|
|
4
|
|
|||
|
Income tax (benefit)/expense
|
$
|
(843
|
)
|
$
|
277
|
|
|
|
Effective income tax rate
|
130.5
|
%
|
36.8
|
%
|
|||
The effective tax rate for the year ended December 31, 2011 differs from the statutory rate of 35% primarily due to a benefit of $633 million resulting from the resolution of the federal tax audit. The benefit is predominantly due to the recognition of previously uncertain tax benefits that were settled upon audit in 2011 and that were mainly composed of net operating losses of $536 million which had been classified as capital loss carryforwards for financial statement purposes.
The effective income tax rate may vary from period to period depending on, among other factors, the geographic and business mix of earnings and losses and changes in valuation allowances in accordance with ASC 740,
Income Taxes,
or ASC 740. These factors and others, including the Company's history of pre-tax earnings and losses, are taken into account in assessing the ability to realize deferred tax assets.
72
Consolidated Results of Operations
2010 compared to 2009
The following table provides selected financial information for the Company:
|
|
Year Ended December 31,
|
|
||||||||
|
(In millions except otherwise noted)
|
2010
|
2009
|
Change %
|
|||||||
|
Operating Revenues
|
|
|
|
|||||||
|
Energy revenue
(a)
|
$
|
2,854
|
|
$
|
3,726
|
|
(23
|
)%
|
||
|
Capacity revenue
(a)
|
824
|
|
1,023
|
|
(19
|
)
|
||||
|
Retail revenue
|
5,277
|
|
4,440
|
|
19
|
|
||||
|
Mark-to-market for economic hedging activities
|
(199
|
)
|
(107
|
)
|
(86
|
)
|
||||
|
Contract amortization
|
(195
|
)
|
(179
|
)
|
(9
|
)
|
||||
|
Thermal revenue
|
145
|
|
137
|
|
6
|
|
||||
|
Other revenues
(b)
|
143
|
|
(88
|
)
|
263
|
|
||||
|
Total operating revenues
|
8,849
|
|
8,952
|
|
(1
|
)
|
||||
|
Operating Costs and Expenses
|
|
|
|
|||||||
|
Generation cost of sales
(a)
|
2,102
|
|
1,844
|
|
14
|
|
||||
|
Retail cost of sales
(a)
|
2,822
|
|
3,121
|
|
(10
|
)
|
||||
|
Mark-to-market activities
|
(111
|
)
|
(842
|
)
|
(87
|
)
|
||||
|
Contract and emissions credit amortization
(c)
|
15
|
|
(4
|
)
|
475
|
|
||||
|
Thermal cost of sales
|
68
|
|
67
|
|
1
|
|
||||
|
Other cost of operations
|
1,177
|
|
1,137
|
|
4
|
|
||||
|
Total cost of operations
|
6,073
|
|
5,323
|
|
14
|
|
||||
|
Depreciation and amortization
|
838
|
|
818
|
|
2
|
|
||||
|
Selling, general and administrative
|
598
|
|
550
|
|
9
|
|
||||
|
Acquisition-related transaction and integration costs
|
—
|
|
54
|
|
(100
|
)
|
||||
|
Development costs
|
55
|
|
48
|
|
15
|
|
||||
|
Total operating costs and expenses
|
7,564
|
|
6,793
|
|
11
|
|
||||
|
Gain on sale of assets
|
23
|
|
—
|
|
N/A
|
|
||||
|
Operating income
|
1,308
|
|
2,159
|
|
(39
|
)
|
||||
|
Other Income/(Expense)
|
|
|
|
|||||||
|
Equity in earnings of unconsolidated affiliates
|
44
|
|
41
|
|
7
|
|
||||
|
Gain on sale of equity method investments
|
—
|
|
128
|
|
(100
|
)
|
||||
|
Other income/(expense), net
|
33
|
|
(5
|
)
|
N/A
|
|
||||
|
Loss on debt extinguishment and refinancing expenses
|
(2
|
)
|
(20
|
)
|
(90
|
)
|
||||
|
Interest expense
|
(630
|
)
|
(634
|
)
|
(1
|
)
|
||||
|
Total other expense
|
(555
|
)
|
(490
|
)
|
13
|
|
||||
|
Income before income tax expense
|
753
|
|
1,669
|
|
(55
|
)
|
||||
|
Income tax expense
|
277
|
|
728
|
|
(62
|
)
|
||||
|
Net Income
|
476
|
|
941
|
|
(49
|
)
|
||||
|
Less: Net loss attributable to noncontrolling interest
|
(1
|
)
|
(1
|
)
|
—
|
|
||||
|
Net income attributable to NRG Energy, Inc.
|
$
|
477
|
|
$
|
942
|
|
(49
|
)
|
||
|
Business Metrics
|
|
|
|
|||||||
|
Average natural gas price — Henry Hub ($/MMBtu)
|
4.39
|
|
3.92
|
|
12
|
%
|
||||
(a) Includes realized gains and losses from financially settled transactions.
|
(b)
|
Includes unrealized trading gains and losses.
|
|
(c)
|
Includes amortization of SO
2
and NO
x
credits and excludes amortization of Regional Greenhouse Gas Initiative, or RGGI, credits.
|
N/A - Not Applicable
73
Management's discussion of the results of operations for the years ended December 31, 2010 and 2009
Wholesale Power Generation Revenues and Cost of Sales
The following is a discussion of gross margin for NRG's wholesale power generation regions, adjusted to eliminate intersegment activity primarily with Reliant Energy and Green Mountain Energy.
|
|
Year Ended December 31, 2010
|
||||||||||||||||||||||||||||||
|
(In millions except otherwise noted)
|
Texas
|
Northeast
|
South Central
|
West
|
Other
|
Total
Wholesale
Power
Generation
|
Eliminations
|
Consolidated
Total
|
|||||||||||||||||||||||
|
Energy revenue
|
$
|
2,850
|
|
$
|
726
|
|
$
|
387
|
|
$
|
31
|
|
$
|
46
|
|
$
|
4,040
|
|
$
|
(1,186
|
)
|
$
|
2,854
|
|
|||||||
|
Capacity revenue
|
25
|
|
396
|
|
235
|
|
113
|
|
71
|
|
840
|
|
(16
|
)
|
824
|
|
|||||||||||||||
|
Thermal revenue
|
—
|
|
—
|
|
—
|
|
—
|
|
145
|
|
145
|
|
—
|
|
145
|
|
|||||||||||||||
|
Other revenue
|
118
|
|
47
|
|
10
|
|
4
|
|
12
|
|
191
|
|
(48
|
)
|
143
|
|
|||||||||||||||
|
Generation revenue
|
2,993
|
|
1,169
|
|
632
|
|
148
|
|
274
|
|
5,216
|
|
$
|
(1,250
|
)
|
$
|
3,966
|
|
|||||||||||||
|
Generation cost of sales
|
(1,088
|
)
|
(493
|
)
|
(403
|
)
|
(15
|
)
|
(103
|
)
|
(2,102
|
)
|
|||||||||||||||||||
|
Thermal cost of sales
|
—
|
|
—
|
|
—
|
|
—
|
|
(68
|
)
|
(68
|
)
|
|||||||||||||||||||
|
Generation cost of sales
|
(1,088
|
)
|
(493
|
)
|
(403
|
)
|
(15
|
)
|
(171
|
)
|
(2,170
|
)
|
|||||||||||||||||||
|
Generation gross margin
|
$
|
1,905
|
|
$
|
676
|
|
$
|
229
|
|
$
|
133
|
|
$
|
103
|
|
$
|
3,046
|
|
|||||||||||||
|
Business Metrics
|
|
|
|
|
|
|
|
|
|||||||||||||||||||||||
|
MWh sold (in thousands)
|
46,926
|
|
10,581
|
|
13,046
|
|
269
|
|
|
|
|
|
|
|
|
|
|||||||||||||||
|
MWh generated (in thousands)
|
44,700
|
|
9,355
|
|
11,168
|
|
269
|
|
|
|
|
|
|
|
|
|
|||||||||||||||
|
|
Year Ended December 31, 2009
|
||||||||||||||||||||||||||||||
|
(In millions except otherwise noted)
|
Texas
|
Northeast
|
South Central
|
West
|
Other
|
Total
Wholesale
Power
Generation
|
Eliminations
|
Consolidated
Total
|
|||||||||||||||||||||||
|
Energy revenue
|
$
|
2,770
|
|
$
|
873
|
|
$
|
367
|
|
$
|
26
|
|
$
|
51
|
|
$
|
4,087
|
|
$
|
(361
|
)
|
$
|
3,726
|
|
|||||||
|
Capacity revenue
|
193
|
|
407
|
|
269
|
|
122
|
|
79
|
|
1,070
|
|
(47
|
)
|
1,023
|
|
|||||||||||||||
|
Thermal revenue
|
—
|
|
—
|
|
—
|
|
—
|
|
137
|
|
137
|
|
—
|
|
137
|
|
|||||||||||||||
|
Other revenue
|
(57
|
)
|
(9
|
)
|
(60
|
)
|
2
|
|
42
|
|
(82
|
)
|
(6
|
)
|
(88
|
)
|
|||||||||||||||
|
Generation revenue
|
2,906
|
|
1,271
|
|
576
|
|
150
|
|
309
|
|
5,212
|
|
$
|
(414
|
)
|
$
|
4,798
|
|
|||||||||||||
|
Generation cost of sales
|
(910
|
)
|
(408
|
)
|
(387
|
)
|
(29
|
)
|
(110
|
)
|
(1,844
|
)
|
|||||||||||||||||||
|
Thermal cost of sales
|
—
|
|
—
|
|
—
|
|
—
|
|
(67
|
)
|
(67
|
)
|
|||||||||||||||||||
|
Generation cost of sales
|
(910
|
)
|
(408
|
)
|
(387
|
)
|
(29
|
)
|
(177
|
)
|
(1,911
|
)
|
|||||||||||||||||||
|
Generation gross margin
|
$
|
1,996
|
|
$
|
863
|
|
$
|
189
|
|
$
|
121
|
|
$
|
132
|
|
$
|
3,301
|
|
|||||||||||||
|
Business Metrics
|
|
|
|
|
|
|
|
|
|||||||||||||||||||||||
|
MWh sold (in thousands)
|
47,259
|
|
9,220
|
|
12,144
|
|
386
|
|
|
|
|
|
|
|
|
|
|||||||||||||||
|
MWh generated (in thousands)
|
44,993
|
|
9,220
|
|
10,398
|
|
386
|
|
|
|
|
|
|
|
|
|
|||||||||||||||
74
|
|
Year Ended December 31,
|
||||||||||
|
|
Texas
|
Northeast
|
South Central
|
West
|
|||||||
|
Weather Metrics
|
|
|
|
|
|||||||
|
2010
|
|
|
|
|
|||||||
|
CDDs
|
2,884
|
|
850
|
|
2,006
|
|
678
|
|
|||
|
HDDs
|
2,161
|
|
5,720
|
|
3,929
|
|
2,753
|
|
|||
|
2009
|
|
|
|
|
|||||||
|
CDDs
|
2,881
|
|
475
|
|
1,549
|
|
908
|
|
|||
|
HDDs
|
1,890
|
|
6,286
|
|
3,521
|
|
3,105
|
|
|||
|
30 year average
|
|
|
|
|
|||||||
|
CDDs
|
2,647
|
|
537
|
|
1,548
|
|
704
|
|
|||
|
HDDs
|
1,997
|
|
6,262
|
|
3,604
|
|
3,228
|
|
|||
Generation gross margin —
decreased by $255 million, including intercompany sales, during the year ended December 31, 2010, compared to the same period in 2009, due to:
|
Decrease in Texas region
|
$
|
(91
|
)
|
|
Decrease in Northeast region
|
(187
|
)
|
|
|
Increase in South Central region
|
40
|
|
|
|
Increase in West region
|
12
|
|
|
|
Other
|
(29
|
)
|
|
|
$
|
(255
|
)
|
|
The decrease in gross margin in the Texas region was driven by:
|
Lower capacity revenue due to a lower proportion of baseload contracts which contain a capacity component
|
$
|
(168
|
)
|
|
Increase in unrealized trading activities
|
119
|
|
|
|
Higher energy margin driven by 2% higher average realized energy prices which reflect higher hedged prices in 2010
|
56
|
|
|
|
Increased coal costs due primarily to increased transportation costs
|
(61
|
)
|
|
|
Increase in costs of purchased energy for increased obligations when baseload plants are unavailable and additional purchases for bilateral and toll energy agreements
|
(61
|
)
|
|
|
Favorable gross margin impact due to an increase in owned wind farm generation as Langford wind facilities began commercial operations in December 2009 and South Trent was acquired in June 2010
|
38
|
|
|
|
Unfavorable gross margin impact from a 1%
reduction in coal generation driven by lower economic dispatch and more unplanned outages, partially offset by fewer planned outages
|
(16
|
)
|
|
|
Other
|
2
|
|
|
|
$
|
(91
|
)
|
|
75
The decrease in gross margin in the Northeast region was driven by:
|
Lower gross margin from coal plants due to a 30% decrease in realized energy prices
|
$
|
(236
|
)
|
|
Lower capacity revenue from the expiration of RMR contracts for Montville, Middletown, and Norwalk
|
(26
|
)
|
|
|
Lower capacity revenue due to significantly lower LFRM prices and volumes in New England
|
(10
|
)
|
|
|
Higher capacity revenue due to 17% higher prices in the NYISO and PJM markets driven in part by the retirement of the New York Power Authority's Poletti facility in January 2010, offset in part by slightly lower volumes and unfavorable hedges.
|
26
|
|
|
|
Lower margin on contract revenue due to a decrease in prices
|
(27
|
)
|
|
|
Higher gross margin from oil and gas plants due to a 31% increase in realized energy prices
|
21
|
|
|
|
Increase in unrealized trading activities
|
58
|
|
|
|
Other
|
7
|
|
|
|
$
|
(187
|
)
|
|
The increase in gross margin in the South Central region was driven by:
|
Lower gross margin related to merchant energy due primarily to a decrease in average realized prices and lower volumes
|
$
|
(50
|
)
|
|
Higher contract revenue due primarily to the region's cooperative customers from fuel cost pass-through and a new contract with a regional municipality
|
70
|
|
|
|
Lower capacity revenue due the expiration of a capacity agreement with a regional utility
|
(34
|
)
|
|
|
Increase in unrealized trading activities
|
68
|
|
|
|
Higher natural gas costs due primarily to the addition of the Cottonwood facility to the region in 2010
|
(9
|
)
|
|
|
Other
|
(5
|
)
|
|
|
$
|
40
|
|
|
The increase in gross margin in the West region was driven by:
|
Higher merchant gross margin from the commencement of operations at Blythe and an increase in realized energy prices, offset in part by a decrease in generation
|
$
|
19
|
|
|
Lower capacity revenue due to reduced resource adequacy and call option contract sales at El Segundo in 2010 as compared to 2009
|
(9
|
)
|
|
|
Other
|
2
|
|
|
|
$
|
12
|
|
|
76
Retail Gross Margin
The Company's retail gross margin, which reflects retail operating revenues less retail cost of sales, includes the results of NRG's Reliant Energy business segment, as well as the results of Green Mountain Energy which is included in NRG's Corporate business segment.
|
Year ended December 31, 2010
|
||||||||||||||||
|
(In millions)
|
Reliant Energy
|
Green Mountain
(a)
|
Total Retail Businesses
|
Eliminations
|
Consolidated Total
|
|||||||||||
|
Retail operating revenues
|
$
|
5,210
|
|
$
|
69
|
|
$
|
5,279
|
|
$
|
(2
|
)
|
$
|
5,277
|
|
|
|
Retail cost of sales
|
4,020
|
|
46
|
|
4,066
|
|
(1,244
|
)
|
2,822
|
|
||||||
|
Retail gross margin
|
$
|
1,190
|
|
$
|
23
|
|
$
|
1,213
|
|
|
||||||
|
(a) Green Mountain Energy was acquired in November 2010.
|
||||||||||||||||
|
Year ended December 31, 2009
|
||||||||||||||||
|
(In millions)
|
Reliant Energy
(b)
|
Total Retail Businesses
|
Eliminations
|
Consolidated Total
|
||||||||||||
|
Retail operating revenues
|
$
|
4,440
|
|
$
|
4,440
|
|
$
|
—
|
|
$
|
4,440
|
|
||||
|
Retail cost of sales
|
3,531
|
|
3,531
|
|
(410
|
)
|
3,121
|
|
||||||||
|
Retail gross margin
|
$
|
909
|
|
|
$
|
909
|
|
|||||||||
|
(b) Reliant was acquired in May 2009.
|
||||||||||||||||
77
Reliant Energy
The following is a detailed discussion of retail gross margin for NRG's Reliant Energy business segment.
Selected Income Statement Data
|
(In millions except otherwise noted)
|
Year ended December 31, 2010
|
Four months ended April 30, 2010
|
Eight months ended December 31, 2010
|
Eight months ended December 31, 2009
|
|||||||||||
|
Operating Revenues
|
|
|
|||||||||||||
|
Mass revenues
|
$
|
3,076
|
|
$
|
903
|
|
$
|
2,173
|
|
$
|
2,597
|
|
|||
|
Commercial and Industrial revenues
|
1,976
|
|
640
|
|
1,336
|
|
1,592
|
|
|||||||
|
Supply management revenues
|
158
|
|
56
|
|
102
|
|
251
|
|
|||||||
|
Retail operating revenues
(a)
|
5,210
|
|
1,599
|
|
3,611
|
|
4,440
|
|
|||||||
|
Retail cost of sales
(b)
|
4,020
|
|
1,232
|
|
2,788
|
|
3,531
|
|
|||||||
|
Retail gross margin
|
$
|
1,190
|
|
$
|
367
|
|
$
|
823
|
|
$
|
909
|
|
|||
|
Business Metrics
|
|
|
|||||||||||||
|
Electricity sales volume — GWh
|
|
|
|||||||||||||
|
Mass
|
22,255
|
|
6,089
|
|
16,166
|
|
17,152
|
|
|||||||
|
Commercial and Industrial
(a)
|
26,124
|
|
8,268
|
|
17,856
|
|
20,915
|
|
|||||||
|
Average retail customers count (in thousands, metered locations)
|
|
|
|||||||||||||
|
Mass
|
1,490
|
|
1,519
|
|
1,475
|
|
1,566
|
|
|||||||
|
Commercial and Industrial
(a)
|
63
|
|
64
|
|
62
|
|
68
|
|
|||||||
|
Retail customers count (in thousands, metered locations)
|
|
|
|||||||||||||
|
Mass
|
1,459
|
|
1,513
|
|
1,459
|
|
1,531
|
|
|||||||
|
Commercial and Industrial
(a)
|
62
|
|
64
|
|
62
|
|
66
|
|
|||||||
|
Weather Metrics
|
|
|
|||||||||||||
|
CDDs
(c)
|
3,305
|
|
166
|
|
3,139
|
|
2,972
|
|
|||||||
|
HDDs
(c)
|
1,812
|
|
1,267
|
|
545
|
|
699
|
|
|||||||
|
(a)
|
Includes customers of the Texas General Land Office, for whom the Company provides services.
|
|
(b)
|
Includes intercompany purchases from the Texas region of $1,241 million, $293 million, $948 million and $409 million, respectively.
|
|
(c)
|
The CDDs/HDDs amounts are representative of the Coast and North Central Zones within the ERCOT market in which Reliant Energy serves its customer base.
|
|
•
|
Retail gross margin
— excluding gross margin of $367 million for the first four months of 2010, Reliant Energy's gross margin decreased $86 million for the year ended December 31, 2010, compared to the same period in 2009, driven by:
|
|
Decrease in retail margins of 12% due to lower lower pricing on acquisitions and renewals and price reductions for certain customer segments.
|
$
|
(138
|
)
|
|
Estimated favorable impact in 2010 as compared to 2009 from the termination of out-of-market supply contracts in conjunction with the termination of the Reliant credit sleeve
|
129
|
|
|
|
Unfavorable volume impact on gross margin from fewer customers in 2010 as well as a change in customer mix
|
(60
|
)
|
|
|
Unfavorable gross margin impact due to a 36% decrease in the margin rate on the incremental weather volumes partially offset by higher volumes in 2010 primarily due to warmer weather in the second and third quarters
|
(17
|
)
|
|
|
$
|
(86
|
)
|
|
78
Green Mountain Energy
The following table shows gross margin for Green Mountain Energy for the year ended
December 31, 2010
:
|
Retail operating revenues
|
$
|
69
|
|
|
|
Retail cost of sales
(a)
|
46
|
|
||
|
Retail gross margin
|
$
|
23
|
|
|
|
(a) Includes intercompany purchases of $3 million.
|
||||
Green Mountain Energy was acquired on November 5, 2010.
Mark-to-market for Economic Hedging Activities
Mark-to-market for economic hedging activities includes asset-backed hedges that have not been designated as cash flow hedges and ineffectiveness on cash flow hedges. Total net mark-to-market results decreased by $823 million in years ended December 31, 2010, compared to the same period in 2009.
The breakdown of gains and losses included in operating revenues and operating costs and expenses by region are as follows:
|
|
Year Ended December 31, 2010
|
||||||||||||||||||||||||||||||||||
|
|
Reliant
Energy
|
Texas
|
Northeast
|
South
Central
|
West
|
Thermal
|
Corporate
(a)
|
Elimination
(b)
|
Total
|
||||||||||||||||||||||||||
|
|
(In millions)
|
||||||||||||||||||||||||||||||||||
|
Mark-to-market results in operating revenues
|
|
|
|
|
|
|
|
|
|||||||||||||||||||||||||||
|
Reversal of previously recognized unrealized (gains)/losses on settled positions related to economic hedges
|
$
|
(1
|
)
|
$
|
(68
|
)
|
$
|
(108
|
)
|
$
|
2
|
|
$
|
—
|
|
$
|
(2
|
)
|
$
|
—
|
|
$
|
11
|
|
$
|
(166
|
)
|
||||||||
|
Net unrealized gains/(losses) on open positions related to economic hedges
|
—
|
|
125
|
|
(36
|
)
|
(47
|
)
|
(4
|
)
|
—
|
|
—
|
|
(71
|
)
|
(33
|
)
|
|||||||||||||||||
|
Total mark-to-market (losses)/gains in operating revenues
|
$
|
(1
|
)
|
$
|
57
|
|
$
|
(144
|
)
|
$
|
(45
|
)
|
$
|
(4
|
)
|
$
|
(2
|
)
|
$
|
—
|
|
$
|
(60
|
)
|
$
|
(199
|
)
|
||||||||
|
Mark-to-market results in operating costs and expenses
|
|
|
|
|
|
|
|
|
|||||||||||||||||||||||||||
|
Reversal of previously recognized unrealized (gains)/losses on settled positions related to economic hedges
|
$
|
(60
|
)
|
$
|
36
|
|
$
|
13
|
|
$
|
17
|
|
$
|
—
|
|
$
|
—
|
|
$
|
—
|
|
$
|
(11
|
)
|
$
|
(5
|
)
|
||||||||
|
Reversal of loss positions acquired as part of the Reliant Energy acquisition as of May 1, 2009
|
223
|
|
—
|
|
—
|
|
—
|
|
—
|
|
—
|
|
—
|
|
—
|
|
223
|
|
|||||||||||||||||
|
Reversal of loss positions acquired as part of the Green Mountain Energy acquisition as of November 5, 2010
|
—
|
|
—
|
|
—
|
|
—
|
|
—
|
|
—
|
|
13
|
|
—
|
|
13
|
|
|||||||||||||||||
|
Net unrealized (losses)/gains on open positions related to economic hedges
|
(210
|
)
|
(2
|
)
|
5
|
|
4
|
|
—
|
|
—
|
|
12
|
|
71
|
|
(120
|
)
|
|||||||||||||||||
|
Total mark-to-market (losses)/gains in operating costs and expenses
|
$
|
(47
|
)
|
$
|
34
|
|
$
|
18
|
|
$
|
21
|
|
$
|
—
|
|
$
|
—
|
|
$
|
25
|
|
$
|
60
|
|
$
|
111
|
|
||||||||
|
(a)
|
Corporate segment consists of Green Mountain Energy activity.
|
|
(b)
|
Represents the elimination of the intercompany activity between the Texas or Northeast and Reliant Energy or Green Mountain Energy regions.
|
79
Mark-to-market results consist of unrealized gains and losses. The settlement of these transactions is reflected in the same caption as the items being hedged.
For the year ended December 31, 2010, the $33 million loss in operating revenue from economic hedge positions is primarily driven by a decrease in value of forward purchases and sales of natural gas and electricity due to a decrease in forward power and gas prices. The $120 million loss in operating costs and expenses from economic hedge positions is primarily driven by a decrease in value of forward purchases of natural gas, electricity and fuel due to a decrease in forward power and gas prices. Reliant Energy's $223 million gain from the roll-off of acquired derivatives consists of loss positions that were acquired as of May 1, 2009, and valued using forward prices on that date. These roll-off amounts were offset by realized losses at the settled prices and higher costs of physical power which are reflected in operating costs and expenses during the same period. Green Mountain Energy's $13 million gain from the roll-off of acquired derivatives consists of loss positions that were acquired as of November 5, 2010, and valued using forward prices on that date. These roll-off amounts were offset by realized losses at the settled prices and higher costs of physical power which are reflected in operating costs and expenses during the same period.
In accordance with ASC 815, the following table represents the results of the Company's financial and physical trading of energy commodities for the years ended December 31, 2010, and 2009. The realized and unrealized financial and physical trading results are included in operating revenues. The Company's trading activities are subject to limits within the Company's Risk Management Policy.
|
|
Year Ended December 31,
|
||||||
|
|
2010
|
2009
|
|||||
|
|
(In millions)
|
||||||
|
Trading gains/(losses)
|
|
|
|||||
|
Realized
|
$
|
(25
|
)
|
$
|
216
|
|
|
|
Unrealized
|
64
|
|
(183
|
)
|
|||
|
Total trading gains
|
$
|
39
|
|
$
|
33
|
|
|
Contract Amortization Revenue
Contract amortization represents the roll-off of in-market customer contracts valued under purchase accounting and the increase of $16 million as compared to the prior period in 2010 related primarily to lower contract amortization of $50 million for Texas offset in part by higher contract amortization for Reliant Energy.
Contract and Emissions Credit Amortization
Contract and emissions credit amortization increased primarily due to lower amortization, which is an offset to expense, in the current year for energy supply contracts that were valued as part of the purchase accounting for Reliant Energy.
80
Other Operating Costs
|
Reliant
Energy
|
Texas
|
Northeast
|
South
Central
|
West
|
Thermal
|
Other
|
Total
|
||||||||||||||||||||||||
|
|
(In millions)
|
||||||||||||||||||||||||||||||
|
Year Ended December 31, 2010
|
$
|
193
|
|
$
|
501
|
|
$
|
287
|
|
$
|
93
|
|
$
|
65
|
|
$
|
40
|
|
$
|
(2
|
)
|
$
|
1,177
|
|
|||||||
|
Year Ended December 31, 2009
|
$
|
153
|
|
$
|
504
|
|
$
|
306
|
|
$
|
80
|
|
$
|
63
|
|
$
|
34
|
|
$
|
(3
|
)
|
$
|
1,137
|
|
|||||||
Other operating costs increased $40 million during the year ended December 31, 2010, compared to the same period in 2009, due to:
|
(In millions)
|
|||
|
Increase due to Reliant Energy for an additional four months of costs in 2010 as compared to 2009
|
$
|
49
|
|
|
Decrease in property and other tax expense
|
(22
|
)
|
|
|
Increase in South Central operations and maintenance expense
|
12
|
|
|
|
Increase in Thermal operations and maintenance expense
|
6
|
|
|
|
Decrease in Reliant operations and maintenance expense
|
(11
|
)
|
|
|
Other
|
6
|
|
|
|
$
|
40
|
|
|
|
•
|
Property and other taxes
— decreased by $8 million due to a charge in June 2009 to reflect changes in Empire Zone regulations that eliminated the Oswego plant's ability to continue participation in the Empire Zone program and decreased $10 million due to a decrease in gross receipts tax as a result of the decrease in retail revenues.
|
|
•
|
South Central operations and maintenance expense
— increased by $12 million as the scope and duration of planned maintenance work at the region's coal facility was greater in 2010 than in the same period in 2009.
|
|
•
|
Thermal operations and maintenance expense
— increase by $6 million relating to the acquisition of Northwind Phoenix in 2010.
|
|
•
|
Reliant Energy operations and maintenance expense
— decreased by $11 million due to lower spending for external costs associated with customer activities including the call center, billing, remittance processing, and credit and collections as well as information technology costs associated with those activities.
|
Depreciation and Amortization
NRG's depreciation and amortization expense increased by $20 million during the year ended December 31, 2010, compared to the same period in 2009. An increase of $26 million was due to depreciation on the baghouse projects in Western New York and additional depreciation at the Cedar Bayou plant, the Langford wind facilities and the Blythe solar facility. Cedar Bayou began commercial operation in June 2009 and the Langford wind facilities began commercial operation in December 2009. An additional increase of $9 million was due to amortization expense at Green Mountain Energy after the date of acquisition.
This increase was offset by a $20 million decrease in depreciation and amortization for Reliant Energy compared to the same period in 2009. Reliant Energy's depreciation and amortization expense decreased $59 million during the eight months ended December 31, 2010 as compared to the same period in 2009, which relates primarily to the amortization expense related to Mass customer relationships valued under purchase accounting which is recognized as the underlying contracts roll off. This decrease at Reliant Energy was offset by $39 million of additional depreciation and amortization expense for the first four months of 2010.
81
Selling, General and Administrative Expenses
Selling, general and administrative expenses increased by $48 million during the year ended December 31, 2010, compared to the same period in 2009. Excluding $68 million of additional expense for Reliant Energy in the first four months of 2010, selling, general and administrative expenses decreased by $20 million, due to:
|
•
|
A decrease in bad debt expense of $20 million due to decreased revenues and improved customer payment behavior.
|
|
•
|
Prior year non-recurring costs related to Exelon's exchange offer and proxy contest efforts of $31 million.
|
These decreases were offset by:
|
•
|
Green Mountain Energy's costs of $10 million incurred since the acquisition date.
|
|
•
|
The contribution of $8 million in funding for the Reliant Energy Charitable Foundation which was created in 2010.
|
|
•
|
An increase in $8 million in professional services for various on-going projects in 2010.
|
Reliant Energy Acquisition-Related Transaction and Integration Costs
NRG incurred Reliant Energy acquisition-related transaction and integration costs of $54 million for 2009. These integration efforts were completed by the end of 2009.
Development Costs
Development costs increased $7 million during the year ended December 31, 2010, compared to the same period in 2009 due to increased costs incurred primarily on NRG Solar development projects.
Gain on Sale of Assets
On January 11, 2010, NRG sold Padoma to Enel, recognizing a gain on sale of $23 million.
Equity in Earnings of Unconsolidated Affiliates
NRG's equity earnings from unconsolidated affiliates increased by $3 million during the year ended December 31, 2010, compared to the same period in 2009. The 2010 results included increased equity earnings of $15 million from Sherbino, which related to the fair value of a hedge, and $7 million from Gladstone. In 2009, NRG recognized equity earnings of $15 million from MIBRAG, which was sold in June 2009.
Gain on Sale of Equity Method Investments and Other Income/(Loss), Net
NRG's gain on sale of equity method investments in 2009 represents a $128 million gain on the sale of NRG's 50% ownership interest in MIBRAG.
Other Income/(Expense), Net
NRG's other income, net increased $38 million during the year ended December 31, 2010, compared to the same period in 2009 principally due to foreign exchange transactions. The 2010 amount included $5 million and $9 million of unrealized and realized foreign exchange gains, respectively. The 2009 amount included a $24 million loss on a forward contract for foreign currency executed to hedge the sale proceeds from the MIBRAG sale in 2009.
Refinancing Expenses
In 2009, NRG incurred a $20 million expense associated with the CSRA unwind with Merrill Lynch.
82
Interest Expense
NRG's interest expense decreased by $4 million during the year ended December 31, 2010, compared to the same period in 2009 due to the following:
|
|
(In millions)
|
||
|
(Decrease)/increase in interest expense
|
|
||
|
Increase for 2020 Senior Notes issued in August 2010
|
$
|
33
|
|
|
Increase for 2019 Senior Notes issued in June 2009
|
25
|
|
|
|
Decrease due to settlement of the CSF Debt in 2009 and early 2010
|
(26
|
)
|
|
|
Decrease in fees incurred on the CSRA facility
|
(27
|
)
|
|
|
Decrease in capitalized interest
|
2
|
|
|
|
Decrease due to Term Loan balance reduction in 2010
|
(9
|
)
|
|
|
Other
|
(2
|
)
|
|
|
Total
|
$
|
(4
|
)
|
Income Tax Expense
Income tax expense decreased by $451 million for the year ended December 31, 2010, compared to 2009. The effective tax rate was 36.8% and 43.6% for the year ended December 31, 2010, and 2009, respectively.
|
|
Year Ended
December 31,
|
||||||
|
|
2010
|
2009
|
|||||
|
(In millions
except as otherwise stated)
|
|||||||
|
Income before income taxes
|
$
|
753
|
|
$
|
1,669
|
|
|
|
Tax at 35%
|
264
|
|
584
|
|
|||
|
State taxes, net of federal benefit
|
18
|
|
23
|
|
|||
|
Foreign operations
|
(3
|
)
|
(53
|
)
|
|||
|
State investment tax credits
|
(7
|
)
|
—
|
|
|||
|
Valuation allowance
|
(34
|
)
|
119
|
|
|||
|
Expiration of capital losses
|
—
|
|
249
|
|
|||
|
Reversal of valuation allowance on expired capital losses
|
—
|
|
(249
|
)
|
|||
|
Change in state effective tax rate
|
—
|
|
(5
|
)
|
|||
|
Foreign earnings
|
17
|
|
33
|
|
|||
|
Non-deductible interest
|
4
|
|
10
|
|
|||
|
Interest on uncertain tax positions
|
25
|
|
9
|
|
|||
|
Production tax credits
|
(11
|
)
|
(10
|
)
|
|||
|
Other
|
4
|
|
18
|
|
|||
|
Income tax expense
|
$
|
277
|
|
$
|
728
|
|
|
|
Effective income tax rate
|
36.8
|
%
|
43.6
|
%
|
|||
The Company's effective tax rate differs from the U.S. statutory rate of 35% due to:
|
•
|
Valuation Allowance
— The Company generated capital gains in 2010 primarily due to the derivative contracts that are treated as capital items for tax purposes. The valuation allowance is recorded primarily against capital loss carryforwards, this resulted in an decrease of $34 million in income tax expense in 2010.
|
|
•
|
Tax Expense Reduction
— The Company recorded a lower federal and state tax expense of $325 million primarily due to lower pre-tax earnings.
|
|
•
|
Foreign Operations
— In 2010, the Company repatriated foreign dividends to the U.S. resulting in an increase in tax expense of $17 million.
|
The effective income tax rate may vary from period to period depending on, among other factors, the geographic and business mix of earnings and losses and changes in valuation allowances in accordance with ASC 740,
Income Taxes,
or ASC 740. These factors and others, including the Company's history of pre-tax earnings and losses, are taken into account in assessing the ability to realize deferred tax assets.
83
Liquidity and Capital Resources
Liquidity Position
As of December 31, 2011, and 2010, NRG's liquidity, excluding collateral received, was approximately $2.1 billion and $4.3 billion, respectively, comprised of the following:
|
|
As of December 31,
|
||||||
|
|
2011
|
2010
|
|||||
|
|
(In millions)
|
||||||
|
Cash and cash equivalents
|
$
|
1,105
|
|
$
|
2,951
|
|
|
|
Funds deposited by counterparties
|
258
|
|
408
|
|
|||
|
Restricted cash
|
292
|
|
8
|
|
|||
|
Total
|
1,655
|
|
3,367
|
|
|||
|
2011 Revolving Credit Facility availability
|
673
|
|
—
|
|
|||
|
Funded Letter of Credit Facility availability
|
—
|
|
440
|
|
|||
|
Revolving Credit Facility availability
|
—
|
|
853
|
|
|||
|
Total liquidity
|
2,328
|
|
4,660
|
|
|||
|
Less: Funds deposited as collateral by hedge counterparties
|
(258
|
)
|
(408
|
)
|
|||
|
Total liquidity, excluding collateral received
|
$
|
2,070
|
|
$
|
4,252
|
|
|
For the year ended December 31, 2011, total liquidity, excluding collateral received, decreased by $2.2 billion due primarily to $1.8 billion lower cash and cash equivalent balances. Changes in cash and cash equivalent balances are further discussed hereinafter under the heading
Cash
Flow Discussion
. Cash and cash equivalents and funds deposited by counterparties at December 31, 2011, were predominantly held in money market funds invested in treasury securities, treasury repurchase agreements or government agency debt.
Included in restricted cash is $216 million of cash and cash equivalents held in controlled accounts as collateral to support the Company's equity funding obligations for the Ivanpah, Agua Caliente, and CVSR projects. As discussed more fully in Item 15— Note 3,
Business Acquisitions and Disposition
, to the Consolidated Financial Statements, this is a requirement of the U.S. DOE, which guarantees the Agua Caliente, Ivanpah, and CVSR debt. This collateral can be replaced, at the Company's discretion, with a letter of credit in order to utilize such amounts for other purposes. The Company's total liquidity excluding such amounts is $1.9 billion.
The line item "Funds deposited by counterparties" represents the amounts that are held by NRG as a result of collateral posting obligations from the Company's counterparties due to positions in the Company's hedging program. These amounts are segregated into separate accounts that are not contractually restricted but, based on the Company's intention, are not available for the payment of NRG's general corporate obligations. Depending on market fluctuation and the settlement of the underlying contracts, the Company will refund this collateral to the counterparties pursuant to the terms and conditions of the underlying trades. Since collateral requirements fluctuate daily and the Company cannot predict if any collateral will be held for more than twelve months, the funds deposited by counterparties are classified as a current asset on the Company's balance sheet, with an offsetting liability for this cash collateral received within current liabilities.
As discussed more fully in Item 15— Note 12,
Debt and Capital Leases,
to the Consolidated Financial Statements, to this Form 10-K, on July 1, 2011, NRG replaced its Senior Credit Facility, consisting of its Term Loan Facility, Revolving Credit Facility and Funded Letter of Credit Facility, with the 2011 Senior Credit Facility, which includes the 2011 Revolving Credit Facility.
Management believes that the Company's liquidity position and cash flows from operations will be adequate to finance operating and maintenance capital expenditures, to fund dividends to NRG's preferred stockholders, and other liquidity commitments. Management continues to regularly monitor the Company's ability to finance the needs of its operating, financing and investing activity within the dictates of prudent balance sheet management.
84
Credit Ratings
Credit rating agencies rate a firm's public debt securities. These ratings are utilized by the debt markets in evaluating a firm's credit risk. Ratings influence the price paid to issue new debt securities by indicating to the market the Company's ability to pay principal, interest and preferred dividends. Rating agencies evaluate a firm's industry, cash flow, leverage, liquidity, and hedge profile, among other factors, in their credit analysis of a firm's credit risk.
The following table summarizes the credit ratings for NRG Energy, Inc., its 2011 Term Loan Facility and its Senior Notes as of December 31, 2011:
|
|
S&P
|
Moody's
|
|
Fitch
|
|
|
NRG Energy, Inc.
|
BB-
|
|
Ba3
|
|
B+
|
|
7.875% Senior Notes, due 2021
|
BB-
|
B1
|
BB
|
||
|
8.25% Senior Notes, due 2020
|
BB-
|
|
B1
|
|
BB
|
|
7.625% Senior Notes, due 2019
|
BB-
|
B1
|
BB
|
||
|
8.5% Senior Notes, due 2019
|
BB-
|
|
B1
|
|
BB
|
|
7.625% Senior Notes, due 2018
|
BB-
|
B1
|
BB
|
||
|
7.375% Senior Notes, due 2017
|
BB-
|
|
B1
|
|
BB
|
|
Term Loan Facility, due 2018
|
BB+
|
|
Baa3
|
|
BB+
|
Sources of Liquidity
The principal sources of liquidity for NRG's future operating and capital expenditures are expected to be derived from new and existing financing arrangements, existing cash on hand and cash flows from operations. As described in Item 15 — Note 12,
Debt and Capital Leases,
to the Consolidated Financial Statements, the Company's financing arrangements consist mainly of the 2011 Senior Credit Facility, the Senior Notes, and project-related financings.
In addition, NRG has granted first liens to certain counterparties on substantially all of the Company's assets. NRG uses the first lien structure to reduce the amount of cash collateral and letters of credit that it would otherwise be required to post from time to time to support its obligations under out-of-the-money hedge agreements for forward sales of power or MWh equivalents. To the extent that the underlying hedge positions for a counterparty are in-the-money to NRG, the counterparty would have no claim under the lien program. The lien program limits the volume that can be hedged, not the value of underlying out-of-the-money positions. The first lien program does not require NRG to post collateral above any threshold amount of exposure. Within the first lien structure, the Company can hedge up to 80% of its baseload capacity and 10% of its non-baseload assets with these counterparties for the first 60 months and then declining thereafter. Net exposure to a counterparty on all trades must be positively correlated to the price of the relevant commodity for the first lien to be available to that counterparty. The first lien structure is not subject to unwind or termination upon a ratings downgrade of a counterparty and has no stated maturity date.
The Company's lien counterparties may have a claim on its assets to the extent market prices exceed the hedged prices. As of December 31, 2011, all hedges under the first liens were in-the-money on a counterparty aggregate basis.
The following table summarizes the amount of MWs hedged against the Company's baseload assets and as a percentage relative to the Company's baseload capacity under the first lien structure as of December 31, 2011:
|
Equivalent Net Sales Secured by First Lien Structure
(a)
|
2012
|
2013
|
2014
|
2015
|
|||||||
|
In MW
(b)
|
1,268
|
|
464
|
|
127
|
|
—
|
|
|||
|
As a percentage of total net baseload capacity
(c)
|
19
|
%
|
7
|
%
|
2
|
%
|
—
|
%
|
|||
|
(a)
|
Equivalent Net Sales include natural gas swaps converted using a weighted average heat rate by region.
|
|
(b)
|
2012 MW value consists of February through December positions only.
|
|
(c)
|
Net baseload capacity under the first lien structure represents 80% of the Company's total baseload assets.
|
85
Uses of Liquidity
The Company's requirements for liquidity and capital resources, other than for operating its facilities, can generally be categorized by the following: (i) commercial operations activities; (ii) debt service obligations, as described more fully in Item 15 — Note 12,
Debt and Capital Leases
, to the Consolidated Financial Statements; (iii) capital expenditures, including repowering and renewable development, and environmental; and (iv) corporate financial transactions including return of capital to stockholders, as described in Item 15 — Note 15,
Capital Structure
, to the Consolidated Financial Statements.
Commercial Operations
NRG's commercial operations activities require a significant amount of liquidity and capital resources. These liquidity requirements are primarily driven by: (i) margin and collateral posted with counterparties; (ii) margin and collateral required to participate in physical markets and commodity exchanges; (iii) timing of disbursements and receipts (i.e. buying fuel before receiving energy revenues); (iv) initial collateral for large structured transactions; and (v) collateral for project development. As of December 31, 2011, commercial operations had total cash collateral outstanding of $311 million, and $715 million outstanding in letters of credit to third parties primarily to support its commercial activities for both wholesale and retail transactions (includes a $51 million letter of credit relating to deposits at the PUCT that cover outstanding customer deposits and residential advance payments). As of December 31, 2011, total collateral held from counterparties was $258 million in cash, and $12 million of letters of credit.
Future liquidity requirements may change based on the Company's hedging activities and structures, fuel purchases, and future market conditions, including forward prices for energy and fuel and market volatility. In addition, liquidity requirements are dependent on NRG's credit ratings and general perception of its creditworthiness.
86
Debt Service Obligations
Principal payments on debt and capital leases as of December 31, 2011, are due in the following periods:
|
Description
|
2012
|
2013
|
2014
|
2015
|
2016
|
Thereafter
|
Total
|
||||||||||||||||||||
|
|
(In millions)
|
||||||||||||||||||||||||||
|
NRG Recourse Debt:
|
|
|
|
|
|
|
|||||||||||||||||||||
|
7.875% Notes due 2021
|
$
|
—
|
|
$
|
—
|
|
$
|
—
|
|
$
|
—
|
|
$
|
—
|
|
$
|
1,200
|
|
$
|
1,200
|
|
||||||
|
8.25% Notes due 2020
|
—
|
|
—
|
|
—
|
|
—
|
|
—
|
|
1,100
|
|
1,100
|
|
|||||||||||||
|
7.625% Notes due 2019
|
—
|
|
—
|
|
—
|
|
—
|
|
—
|
|
800
|
|
800
|
|
|||||||||||||
|
8.5% Notes due 2019
|
—
|
|
—
|
|
—
|
|
—
|
|
—
|
|
700
|
|
700
|
|
|||||||||||||
|
7.625% Notes due 2018
|
—
|
|
—
|
|
—
|
|
—
|
|
—
|
|
1,200
|
|
1,200
|
|
|||||||||||||
|
7.375% Notes due 2017
|
—
|
|
—
|
|
—
|
|
—
|
|
—
|
|
1,090
|
|
1,090
|
|
|||||||||||||
|
Term Loan Facility, due 2018
|
16
|
|
16
|
|
16
|
|
16
|
|
16
|
|
1,512
|
|
1,592
|
|
|||||||||||||
|
Indian River Power LLC, tax-exempt bonds, due 2040 and 2045
|
—
|
|
—
|
|
—
|
|
—
|
|
—
|
|
205
|
|
205
|
|
|||||||||||||
|
Dunkirk Power LLC, tax-exempt bonds, due 2042
|
—
|
|
—
|
|
—
|
|
—
|
|
—
|
|
59
|
|
59
|
|
|||||||||||||
|
Subtotal NRG Recourse Debt
|
16
|
|
16
|
|
|
16
|
|
|
16
|
|
|
16
|
|
|
7,866
|
|
7,946
|
|
|||||||||
|
NRG Non-Recourse Debt:
|
|||||||||||||||||||||||||||
|
Ivanpah Financing:
|
|
|
|||||||||||||||||||||||||
|
Solar Partners I, due 2014 and 2033
|
—
|
|
—
|
|
154
|
|
5
|
|
6
|
|
125
|
|
290
|
|
|||||||||||||
|
Solar Partners II, due 2014 and 2038
|
—
|
|
—
|
|
128
|
|
5
|
|
6
|
|
175
|
|
314
|
|
|||||||||||||
|
Solar Partners VIII, due 2014 and 2038
|
—
|
|
—
|
|
111
|
|
4
|
|
4
|
|
151
|
|
270
|
|
|||||||||||||
|
NRG Peaker Finance Co. LLC, bonds, due 2019
|
22
|
|
23
|
|
29
|
|
31
|
|
33
|
|
72
|
|
210
|
|
|||||||||||||
|
Agua Caliente Solar, LLC
|
—
|
|
—
|
|
5
|
|
5
|
|
6
|
|
165
|
|
181
|
|
|||||||||||||
|
NRG West Holdings LLC, term loan, due 2023
|
—
|
|
—
|
|
32
|
|
37
|
|
41
|
|
49
|
|
159
|
|
|||||||||||||
|
NRG Energy Center Minneapolis LLC, senior secured notes, due 2013, 2017 and 2025
|
13
|
|
10
|
|
7
|
|
12
|
|
12
|
|
96
|
|
150
|
|
|||||||||||||
|
South Trent Wind LLC, due 2020
|
3
|
|
3
|
|
4
|
|
4
|
|
4
|
|
57
|
|
75
|
|
|||||||||||||
|
Solar Power Partners Financing
|
10
|
|
9
|
|
5
|
|
4
|
|
3
|
|
38
|
|
69
|
|
|||||||||||||
|
NRG Roadrunner LLC, due 2031
|
14
|
|
2
|
|
2
|
|
2
|
|
3
|
|
38
|
|
61
|
|
|||||||||||||
|
NRG Solar Blythe LLC, due 2028
|
2
|
|
2
|
|
1
|
|
2
|
|
1
|
|
19
|
|
27
|
|
|||||||||||||
|
Other
|
5
|
|
4
|
|
—
|
|
—
|
|
—
|
|
—
|
|
9
|
|
|||||||||||||
|
Subtotal NRG Non-Recourse Debt
|
69
|
|
53
|
|
478
|
|
111
|
|
119
|
|
985
|
|
1,815
|
|
|||||||||||||
|
Capital Lease:
|
|
|
|
|
|
|
|||||||||||||||||||||
|
Saale Energie GmbH, Schkopau
|
8
|
|
7
|
|
6
|
|
6
|
|
4
|
|
72
|
|
103
|
|
|||||||||||||
|
Total Debt and Capital Leases
|
$
|
93
|
|
$
|
76
|
|
$
|
500
|
|
$
|
133
|
|
$
|
139
|
|
$
|
8,923
|
|
$
|
9,864
|
|
||||||
In addition to the debt and capital leases shown in the preceding table, NRG had issued $1.627 billion of letters of credit under the Company's $2.3 billion 2011 Revolving Credit Facility as of December 31, 2011.
87
Capital Expenditures
The following tables and descriptions summarize the Company's capital expenditures, including accruals, for maintenance, environmental, and repowering and renewable development, other than cash paid for nuclear development, for the year ended December 31, 2011, and the estimated capital expenditure and repowering and renewable investments forecast for 2012.
|
Maintenance
|
Environmental
|
Repowering and Renewables
|
Total
|
||||||||||||
|
|
(In millions)
|
||||||||||||||
|
Northeast
|
$
|
21
|
|
$
|
167
|
|
$
|
—
|
|
$
|
188
|
|
|||
|
Texas
|
99
|
|
—
|
|
22
|
|
121
|
|
|||||||
|
South Central
|
23
|
|
2
|
|
—
|
|
25
|
|
|||||||
|
West
|
18
|
|
—
|
|
2,070
|
|
2,088
|
|
|||||||
|
Reliant Energy
|
19
|
|
—
|
|
—
|
|
19
|
|
|||||||
|
Other
|
29
|
|
—
|
|
36
|
|
65
|
|
|||||||
|
Total capital expenditures for the year ended
December 31, 2011
|
209
|
|
169
|
|
2,128
|
|
2,506
|
|
|||||||
|
Accrual impact
|
(9
|
)
|
20
|
|
(227
|
)
|
(216
|
)
|
|||||||
|
Total cash capital expenditures for the year ended
December 31, 2011
|
200
|
|
189
|
|
1,901
|
|
2,290
|
|
|||||||
|
Other investments
(a)
|
—
|
|
—
|
|
621
|
|
621
|
|
|||||||
|
Funding from debt financing, net of fees
|
—
|
|
(138
|
)
|
(1,215
|
)
|
(1,353
|
)
|
|||||||
|
Funding from third party equity partners
|
—
|
|
—
|
|
(29
|
)
|
(29
|
)
|
|||||||
|
Total capital expenditures and investments, net
|
$
|
200
|
|
$
|
51
|
|
$
|
1,278
|
|
$
|
1,529
|
|
|||
|
Estimated capital expenditures for 2012
|
$
|
259
|
|
$
|
54
|
|
$
|
3,200
|
|
$
|
3,513
|
|
|||
|
Other investments
(b)
|
—
|
|
—
|
|
(172
|
)
|
(172
|
)
|
|||||||
|
Funding from debt financing, net of fees
|
—
|
|
(61
|
)
|
(2,452
|
)
|
(2,513
|
)
|
|||||||
|
Funding from third party equity partners
|
—
|
|
—
|
|
(192
|
)
|
(192
|
)
|
|||||||
|
NRG estimated capital expenditures for 2012, net of financings
|
$
|
259
|
|
$
|
(7
|
)
|
$
|
384
|
|
$
|
636
|
|
|||
|
(a)
|
2011 Other investments includes initial investments in the Agua Caliente, Ivanpah and Distributed Solar projects; solar project reserves that are placed in restricted cash on the balance sheet; and other project costs.
|
|
(b)
|
2012 Other investments represents the use of project reserves previously placed in restricted cash on the balance sheet and other project costs.
|
|
•
|
Repowering and Renewable capital expenditures
— For the year ended December 31, 2011, the Company's repowering and renewable capital expenditures included $1.8 billion for solar projects and $252 million for the Company's El Segundo project. In 2012, NRG will be continuing its efforts on the solar and El Segundo projects.
|
|
•
|
Maintenance and Environmental capital expenditures
— For the year ended December 31, 2011, the Company's maintenance capital expenditures includes $51 million in nuclear fuel expenditures related to STP Units 1 and 2. The environmental capital expenditures includes $155 million related to a project to install selective catalytic reduction systems, scrubbers and fabric filters on Indian River Unit 4. The system was operational at year-end 2011 and is undergoing performance testing.
|
88
Environmental Capital Expenditures Estimate
Based on current rules, technology and plans, NRG has estimated that environmental capital expenditures from 2012 through 2016 to meet NRG's environmental commitments will be approximately $553 million. These costs are primarily associated with mercury controls to satisfy MATS on the Company's Big Cajun II, W.A. Parish and Limestone facilities and a number of intake modification projects across the fleet under state or proposed federal 316(b) rules. NRG continues to explore cost effective compliance alternatives to reduce costs. While this estimate reflects anticipated schedules and controls related to the proposed 316(b) Rule, the full impact on the scope and timing of environmental retrofits from any new or revised regulations cannot be determined until these rules are final and any legal challenges are reviewed. However, NRG believes it is positioned to meet more stringent requirements through its planned capital expenditures, existing controls, and increasing generation from renewable resources.
The table below summarizes installed and planned air quality controls for the NRG coal fleet. Planned investments are either in construction or budgeted in the existing capital expenditures budget. Changes to regulations could result in changes to planned installation dates. NRG uses an integrated approach to fuels, controls and emissions markets to meet environmental standards.
|
|
SO
2
|
NO
x
|
Mercury
|
Particulate
|
|||||||||||
|
Units
|
Control
Equipment
|
Install Date
|
Control
Equipment
|
Install Date
|
Control
Equipment
|
Install Date
|
Control
Equipment
|
Install Date
|
|||||||
|
Huntley 67
|
DSI/FF
|
2009
|
SNCR
|
2009
|
ACI
|
2009
|
FF
|
2009
|
|||||||
|
Huntley 68
|
DSI/FF
|
2009
|
SNCR
|
2009
|
ACI
|
2009
|
FF
|
2009
|
|||||||
|
Dunkirk 1
|
DSI/FF
|
2010
|
SNCR
|
2010
|
ACI
|
2010
|
FF
|
2010
|
|||||||
|
Dunkirk 2
|
DSI/FF
|
2010
|
SNCR
|
2010
|
ACI
|
2010
|
FF
|
2010
|
|||||||
|
Dunkirk 3
|
DSI/FF
|
2009
|
SNCR
|
2009
|
ACI
|
2009
|
FF
|
2009
|
|||||||
|
Dunkirk 4
|
DSI/FF
|
2009
|
SNCR
|
2009
|
ACI
|
2009
|
FF
|
2009
|
|||||||
|
Indian River 3
|
|
|
SNCR
|
2000
|
ACI
|
2008
|
ESP
|
1980
|
|||||||
|
Indian River 4
|
Circulating Dry Scrubber
|
2011
|
SCR
|
2011
|
ACI
|
2008
|
ESP/FF
|
1980 / 2011
|
|||||||
|
Big Cajun II 1
|
FF co-benefit
|
2015
|
LNBOFA
|
2005
|
ACI
|
2015
|
ESP/FF
|
1981 / 2015
|
|||||||
|
Big Cajun II 2
|
|
|
LNBOFA
|
2004
|
ACI
|
2015
|
ESP
|
1981
|
|||||||
|
Big Cajun II 3
|
FF co-benefit
|
2015
|
LNBOFA
|
2002
|
ACI
|
2015
|
ESP/FF
|
1983 / 2015
|
|||||||
|
Limestone 1 & 2
|
Wet Scrubbers
|
1985-86
|
LNBOFA/ SNCR
|
2002 / 2014
|
ACI
|
2014
|
ESP
|
1985-86
|
|||||||
|
WA Parish 5, 6, 7
|
FF co-benefit
|
1988
|
SCR
|
2004
|
ACI
|
2014
|
FF
|
1988
|
|||||||
|
WA Parish 8
|
Wet Scrubber
|
1982
|
SCR
|
2004
|
ACI
|
2014
|
FF
|
1988
|
|||||||
ACI — Activated Carbon Injection
DSI — Dry Sorbent Injection with Trona
ESP — Electrostatic Precipitator
FF— Fabric Filter
LNBOFA — Low NO
x
Burner with Overfire Air
SCR — Selective Catalytic Reduction
SNCR — Selective Non-Catalytic Reduction
The following table summarizes the estimated environmental capital expenditures for the referenced periods by region:
|
Texas
|
Northeast
|
South Central
|
Total
|
|||||||||||||
|
|
(in millions)
|
|||||||||||||||
|
2012
|
$
|
4
|
|
$
|
45
|
|
$
|
8
|
|
$
|
57
|
|
||||
|
2013
|
35
|
|
16
|
|
93
|
|
144
|
|
||||||||
|
2014
|
48
|
|
20
|
|
172
|
|
240
|
|
||||||||
|
2015
|
9
|
|
3
|
|
92
|
|
104
|
|
||||||||
|
2016
|
7
|
|
1
|
|
—
|
|
8
|
|
||||||||
|
Total
|
$
|
103
|
|
$
|
85
|
|
$
|
365
|
|
$
|
553
|
|
||||
89
NRG's current contracts with the Company's rural electrical customers in the South Central region allow for recovery of a portion of the regions' capital costs once in operation, along with a capital return incurred by complying with any change in law, including interest over the asset life of the required expenditures. The actual recoveries will depend, among other things, on the timing of the completion of the capital projects and the remaining duration of the contracts.
2011 Capital Allocation Program
On February 22, 2011, the Company announced its 2011 Capital Allocation Plan to purchase $180 million in common stock. On August 4, 2011, the Company announced additional share repurchases of $250 million under the Capital Allocation Plan, bringing the total targeted share repurchases for 2011 to $430 million. During 2011, the Company repurchased 14,875,798 shares of NRG common stock for $320 million under two separate Accelerated Share Repurchase, or ASR, Agreements, and purchased an additional 5,099,856 shares for $110 million in open market purchases. The Company's share repurchases are subject to market prices, financial restrictions under the Company's debt facilities and securities laws.
As part of the 2011 program, the Company invested approximately $389 million in maintenance and environmental capital expenditures in existing assets, and approximately $2.5 billion in solar and other projects under development. In 2011, the Company obtained U.S. DOE loan guarantees for its Ivanpah, Agua Caliente, and CVSR solar projects in the amounts of $1.6 billion, $967 million, and $1.2 billion, respectively.
Finally, in addition to scheduled debt amortization payments, in the first quarter 2011 the Company paid its first lien lenders $149 million of its 2010 excess cash flow, as defined in the Senior Credit Facility.
2012 Capital Allocation Program
On February 28, 2012, the Company announced its intention to initiate an annual common stock dividend of $0.36 per share, with the first quarterly payment expected to be paid in the third quarter of 2012. Furthermore, the Company still intends to refinance its remaining $1.1 billion of 2017 Senior Notes to simplify its capital structure and better align covenant packages, but any refinancing will depend on market conditions and is therefore subject to change. Upon completion of this undertaking, a more flexible covenant package across credit facilities and debt securities will enable NRG to invest more opportunistically in growth initiatives and enhance its ability to efficiently return capital to all stockholders.
Preferred Stock Dividend Payments
For the year ended December 31, 2011, NRG paid $9 million in dividend payments to holders of the Company's 3.625% Preferred Stock.
90
Cash Flow Discussion
The following table reflects the changes in cash flows for the comparative years:
|
(In millions)
|
|
|
|
||||||||
|
Year ended December 31,
|
2011
|
2010
|
Change
|
||||||||
|
Net cash provided by operating activities
|
$
|
1,166
|
|
$
|
1,623
|
|
$
|
(457
|
)
|
||
|
Net cash used by investing activities
|
(3,047
|
)
|
(1,623
|
)
|
(1,424
|
)
|
|||||
|
Net cash provided by financing activities
|
33
|
|
651
|
|
(618
|
)
|
|||||
Net Cash Provided By Operating Activities
Changes to net cash provided by operating activities were driven by:
|
Decrease in operating income adjusted for non-cash charges
|
$
|
(454
|
)
|
|
Other changes in working capital
|
(3
|
)
|
|
|
$
|
(457
|
)
|
|
Net Cash Used By Investing Activities
Changes to net cash used by investing activities were driven by:
|
Increase in capital expenditures due to increased spending on maintenance, repowering and renewable development
,
primarily for solar projects in construction
|
$
|
(1,604
|
)
|
|
Increase in restricted cash, which was mainly to support equity requirements for
U.S. DOE funded projects
|
(246
|
)
|
|
|
Lower cash spent for acquisitions, which primarily reflects three Solar acquisitions and Energy Plus in 2011, compared to Green Mountain, South Trent, Northwind Phoenix and Cottonwood in 2010
|
629
|
|
|
|
Decrease in purchases and sales of emissions allowances
|
15
|
|
|
|
Decrease in cash for sale of assets, which primarily reflects sale of land in 2011, compared to the sale of Padoma in 2010
|
(36
|
)
|
|
|
Receipt of cash grants in 2010
|
(102
|
)
|
|
|
Investments in unconsolidated affiliates, primarily related to investments in a clean technology joint venture and Petra Nova
|
(43
|
)
|
|
|
Other
|
(37
|
)
|
|
|
$
|
(1,424
|
)
|
|
Net Cash Provided By Financing Activities
Changes in net cash provided by financing activities were driven by:
|
Increase in cash paid to repurchase shares of NRG common stock
|
$
|
(250
|
)
|
|
Increase in net cash paid/received for the settlement of acquired derivatives with financing elements
|
(220
|
)
|
|
|
Increase in cash paid for debt issuance and hedging costs
|
(132
|
)
|
|
|
Net increase in cash received for proceeds for issuance of long-term debt
|
4,740
|
|
|
|
Net increase in the payments of debt, primarily related to payment of secured Senior Notes
|
(4,735
|
)
|
|
|
Decrease in cash contributions from noncontrolling interest
|
(21
|
)
|
|
|
$
|
(618
|
)
|
|
91
NOLs, Deferred Tax Assets and Uncertain Tax Position Implications, under ASC 740
As of December 31, 2011, the Company had a total domestic pre-tax book loss of $680 million and foreign pre-tax book income of $34 million. For the year ended December 31, 2011, the Company generated a net operating loss, or NOL, of $30 million which is available to offset taxable income in future periods. As of December 31, 2011, the Company has cumulative domestic NOL carryforwards of $233 million for financial statement purposes. In addition, NRG has cumulative foreign NOL carryforwards of $255 million, of which $77 million will expire starting 2012 through 2019 and of which $178 million do not have an expiration date.
In addition to these amounts, the Company has $178 million of tax effected uncertain tax benefits. As a result of the Company's tax position, and based on current forecasts, NRG anticipates income tax payments, primarily due to foreign, state and local jurisdictions, of up to $50 million in 2012.
However, as the position remains uncertain for the $178 million of tax effected uncertain tax benefits, the Company has recorded a non-current tax liability of $58 million and may accrue the remaining balance as an increase to non-current liabilities until final resolution with the related taxing authority. The $58 million non-current tax liability for uncertain tax benefits is primarily from positions taken on various state returns, including accrued interest.
During 2011, the Company settled the Internal Revenue Service's audit examination for the years 2004 through 2006 and recognized a benefit of $633 million. The benefit is predominantly due to the recognition of previously uncertain tax benefits mainly composed of net operating losses of $536 million which had been classified as capital loss carryforwards for financial statement purposes.
The Company continues to be under examination for various state jurisdictions for multiple years.
Off-Balance Sheet Arrangements
Obligations under Certain Guarantee Contracts
NRG and certain of its subsidiaries enter into guarantee arrangements in the normal course of business to facilitate commercial transactions with third parties. These arrangements include financial and performance guarantees, stand-by letters of credit, debt guarantees, surety bonds and indemnifications. See also Item 15 — Note 26,
Guarantees,
to the Consolidated Financial Statements for additional discussion.
Retained or Contingent Interests
NRG does not have any material retained or contingent interests in assets transferred to an unconsolidated entity.
Derivative Instrument Obligations
The Company's 3.625% Preferred Stock includes a feature which is considered an embedded derivative per ASC 815. Although it is considered an embedded derivative, it is exempt from derivative accounting as it is excluded from the scope pursuant to ASC 815. As of December 31, 2011, based on the Company's stock price, the embedded derivative was out-of-the-money and had no redemption value. See also Item 15 — Note 15,
Capital Structure,
to the Consolidated Financial Statements for additional discussion.
Obligations Arising Out of a Variable Interest in an Unconsolidated Entity
Variable interest in Equity investments
— As of December 31, 2011, NRG has several investments with an ownership interest percentage of 50% or less in energy and energy-related entities that are accounted for under the equity method of accounting. Several of these investments are variable interest entities for which NRG is not the primary beneficiary.
NRG's pro-rata share of non-recourse debt held by unconsolidated affiliates was approximately $244 million as of December 31, 2011. This indebtedness may restrict the ability of these subsidiaries to issue dividends or distributions to NRG. See also Item 15 — Note 16,
Investments Accounted for by the Equity Method and Variable Interest Entities,
to the Consolidated Financial Statements for additional discussion.
92
Contractual Obligations and Commercial Commitments
NRG has a variety of contractual obligations and other commercial commitments that represent prospective cash requirements in addition to the Company's capital expenditure programs. The following tables summarize NRG's contractual obligations and contingent obligations for guarantee. See also Item 15 — Note 12,
Debt and Capital Leases
, Note 22,
Commitments and Contingencies
, and Note 26,
Guarantees
, to the Consolidated Financial Statements for additional discussion.
|
|
By Remaining Maturity at December 31,
|
||||||||||||||||||||||
|
|
2011
|
|
|||||||||||||||||||||
|
Contractual Cash Obligations
|
Under
1 Year
|
1-3 Years
|
3-5 Years
|
Over
5 Years
|
Total (a)
|
2010
Total
|
|||||||||||||||||
|
|
(In millions)
|
||||||||||||||||||||||
|
Long-term debt and funded letter of credit (including estimated interest)
|
$
|
708
|
|
$
|
1,793
|
|
$
|
1,513
|
|
$
|
10,639
|
|
$
|
14,653
|
|
$
|
14,340
|
|
|||||
|
Capital lease obligations (including estimated interest)
|
11
|
|
18
|
|
12
|
|
82
|
|
123
|
|
133
|
|
|||||||||||
|
Operating leases
|
67
|
|
125
|
|
106
|
|
280
|
|
578
|
|
508
|
|
|||||||||||
|
Fuel purchase and transportation obligations
(b)
|
891
|
|
266
|
|
204
|
|
484
|
|
1,845
|
|
1,761
|
|
|||||||||||
|
Fixed purchased power commitments
|
37
|
|
32
|
|
18
|
|
9
|
|
96
|
|
370
|
|
|||||||||||
|
Pension minimum funding requirement
(c)
|
37
|
|
90
|
|
98
|
|
89
|
|
314
|
|
191
|
|
|||||||||||
|
Other postretirement benefits minimum funding requirement
(d)
|
4
|
|
7
|
|
9
|
|
18
|
|
38
|
|
22
|
|
|||||||||||
|
Other liabilities
(e)
|
54
|
|
85
|
|
66
|
|
280
|
|
485
|
|
697
|
|
|||||||||||
|
Total
|
$
|
1,809
|
|
$
|
2,416
|
|
$
|
2,026
|
|
$
|
11,881
|
|
$
|
18,132
|
|
$
|
18,022
|
|
|||||
|
(a)
|
Excludes $57 million non-current payable relating to NRG's uncertain tax benefits under ASC 740 as the period of payment cannot be reasonably estimated. Also excludes $443 million of asset retirement obligations which are discussed in Item 15 — Note 13,
Asset Retirement Obligations
, to the Consolidated Financial Statements.
|
|
(b)
|
Includes only those coal transportation and lignite commitments for 2012 as no other nominations were made as of December 31, 2011. Natural gas nomination is through February 2016.
|
|
(c)
|
These amounts represent the Company's estimated minimum pension contributions required under the Pension Protection Act of 2006. These amounts represent estimates that are based on assumptions that are subject to change.
|
|
(d)
|
These amounts represent estimates that are based on assumptions that are subject to change. The minimum required contribution for years after 2019 are currently not available.
|
|
(e)
|
Includes water right agreements, service and maintenance agreements, stadium naming rights and other contractual obligations.
|
|
|
By Remaining Maturity at December 31,
|
||||||||||||||||||||||
|
|
2011
|
|
|||||||||||||||||||||
|
Guarantees
|
Under
1 Year
|
1-3 Years
|
3-5 Years
|
Over
5 Years
|
Total
|
2010
Total
|
|||||||||||||||||
|
|
(In millions)
|
||||||||||||||||||||||
|
Letters of credit and surety bonds
|
$
|
1,562
|
|
$
|
108
|
|
$
|
—
|
|
$
|
—
|
|
$
|
1,670
|
|
$
|
887
|
|
|||||
|
Asset sales guarantee obligations
|
60
|
|
—
|
|
567
|
|
8
|
|
635
|
|
1,022
|
|
|||||||||||
|
Commercial sales arrangements
|
91
|
|
100
|
|
91
|
|
1,123
|
|
1,405
|
|
1,285
|
|
|||||||||||
|
Other guarantees
|
1
|
|
—
|
|
—
|
|
460
|
|
461
|
|
171
|
|
|||||||||||
|
Total guarantees
|
$
|
1,714
|
|
$
|
208
|
|
$
|
658
|
|
$
|
1,591
|
|
$
|
4,171
|
|
$
|
3,365
|
|
|||||
93
Fair Value of Derivative Instruments
NRG may enter into long-term power purchase and sales contracts, fuel purchase contracts and other energy-related financial instruments to mitigate variability in earnings due to fluctuations in spot market prices and to hedge fuel requirements at generation facilities or retail load obligations. In addition, in order to mitigate interest rate risk associated with the issuance of the Company's variable rate and fixed rate debt, NRG enters into interest rate swap agreements.
NRG's trading activities are subject to limits in accordance with the Company's Risk Management Policy. These contracts are recognized on the balance sheet at fair value and changes in the fair value of these derivative financial instruments are recognized in earnings.
The tables below disclose the activities that include both exchange and non-exchange traded contracts accounted for at fair value in accordance with ASC 820,
Fair Value Measurements and Disclosures
, or ASC 820. Specifically, these tables disaggregate realized and unrealized changes in fair value; disaggregate estimated fair values at December 31, 2011, based on their level within the fair value hierarchy defined in ASC 820; and indicate the maturities of contracts at December 31, 2011. For a full discussion of the Company's valuation methodology of its contracts, see
Derivative Fair Value Measurements
in Item 15 — Note 5,
Fair Value of Financial Instruments
, to the Consolidated Financial Statements.
|
Derivative Activity Gains/(Losses)
|
(In millions)
|
||
|
Fair value of contracts as of December 31, 2010
|
$
|
672
|
|
|
Contracts realized or otherwise settled during the period
|
(395
|
)
|
|
|
Changes in fair value
|
174
|
|
|
|
Fair value of contracts as of December 31, 2011
|
$
|
451
|
|
|
|
Fair Value of Contracts as of December 31, 2011
|
||||||||||||||||||
|
Fair value hierarchy Gains/(Losses)
|
Maturity
Less Than
1 Year
|
Maturity
1-3 Years
|
Maturity
4-5 Years
|
Maturity
in Excess
4-5 Years
|
Total Fair
Value
|
||||||||||||||
|
|
(In millions)
|
||||||||||||||||||
|
Level 1
|
$
|
(36
|
)
|
$
|
(52
|
)
|
$
|
(8
|
)
|
$
|
—
|
|
$
|
(96
|
)
|
||||
|
Level 2
|
493
|
|
80
|
|
(20
|
)
|
(14
|
)
|
539
|
|
|||||||||
|
Level 3
|
8
|
|
—
|
|
—
|
|
—
|
|
8
|
|
|||||||||
|
Total
|
$
|
465
|
|
$
|
28
|
|
$
|
(28
|
)
|
$
|
(14
|
)
|
$
|
451
|
|
||||
The Company has elected to disclose derivative assets and liabilities on a trade-by-trade basis and does not offset amounts at the counterparty master agreement level. Also, collateral received or paid on the Company's derivative assets or liabilities are recorded on a separate line item on the balance sheet. Consequently, the magnitude of the changes in individual current and non-current derivative assets or liabilities is higher than the underlying credit and market risk of the Company's portfolio. As discussed in Item 7A
— Commodity Price Risk
, NRG measures the sensitivity of the Company's portfolio to potential changes in market prices using Value at Risk, or VaR, a statistical model which attempts to predict risk of loss based on market price and volatility. NRG's risk management policy places a limit on one-day holding period VaR, which limits the Company's net open position. As the Company's trade-by-trade derivative accounting results in a gross-up of the Company's derivative assets and liabilities, the net derivative assets and liability position is a better indicator of NRG's hedging activity. As of December 31, 2011, NRG's net derivative asset was $451 million, a decrease to total fair value of $221 million as compared to December 31, 2010. This decrease was primarily driven by the roll off of contracts that settled during the period offset by an increase in fair value due to the decreases in gas and power prices.
Based on a sensitivity analysis using simplified assumptions, the impact of a $1 per MMBtu increase or decrease in natural gas prices across the term of the derivative contracts would cause a change of approximately $35 million in the net value of derivatives as of December 31, 2011.
94
Critical Accounting Policies and Estimates
NRG's discussion and analysis of the financial condition and results of operations are based upon the consolidated financial statements, which have been prepared in accordance with accounting principles generally accepted in the U.S, or U.S. GAAP. The preparation of these financial statements and related disclosures in compliance with U.S. GAAP requires the application of appropriate technical accounting rules and guidance as well as the use of estimates and judgments that affect the reported amounts of assets, liabilities, revenues and expenses, and related disclosures of contingent assets and liabilities. The application of these policies necessarily involves judgments regarding future events, including the likelihood of success of particular projects, legal and regulatory challenges, and the fair value of certain assets and liabilities. These judgments, in and of themselves, could materially affect the financial statements and disclosures based on varying assumptions, which may be appropriate to use. In addition, the financial and operating environment may also have a significant effect, not only on the operation of the business, but on the results reported through the application of accounting measures used in preparing the financial statements and related disclosures, even if the nature of the accounting policies have not changed.
On an ongoing basis, NRG evaluates these estimates, utilizing historic experience, consultation with experts and other methods the Company considers reasonable. In any event, actual results may differ substantially from the Company's estimates. Any effects on the Company's business, financial position or results of operations resulting from revisions to these estimates are recorded in the period in which the information that gives rise to the revision becomes known.
NRG's significant accounting policies are summarized in Item 15 — Note 2,
Summary of Significant Accounting Policies
, to the Consolidated Financial Statements. The Company identifies its most critical accounting policies as those that are the most pervasive and important to the portrayal of the Company's financial position and results of operations, and that require the most difficult, subjective and/or complex judgments by management regarding estimates about matters that are inherently uncertain.
|
Accounting Policy
|
Judgments/Uncertainties Affecting Application
|
|
Derivative Instruments
|
Assumptions used in valuation techniques
|
|
Assumptions used in forecasting generation
|
|
|
Market maturity and economic conditions
|
|
|
Contract interpretation
|
|
|
Market conditions in the energy industry, especially the effects of price volatility on contractual commitments
|
|
|
Income Taxes and Valuation Allowance for Deferred Tax Assets
|
Ability to withstand legal challenges of tax authority decisions or appeals
|
|
Anticipated future decisions of tax authorities
|
|
|
Application of tax statutes and regulations to transactions
|
|
|
Ability to utilize tax benefits through carry backs to prior periods and carry forwards to future periods
|
|
|
Impairment of Long Lived Assets
|
Recoverability of investment through future operations
|
|
Regulatory and political environments and requirements
|
|
|
Estimated useful lives of assets
|
|
|
Environmental obligations and operational limitations
|
|
|
Estimates of future cash flows
|
|
|
Estimates of fair value
|
|
|
Judgment about triggering events
|
|
|
Goodwill and Other Intangible Assets
|
Estimated useful lives for finite-lived intangible assets
|
|
Judgment about impairment triggering events
|
|
|
Estimates of reporting unit's fair value
|
|
|
Fair value estimate of intangible assets acquired in business combinations
|
|
|
Contingencies
|
Estimated financial impact of event(s)
|
|
Judgment about likelihood of event(s) occurring
|
|
|
Regulatory and political environments and requirements
|
|
95
Derivative Instruments
The Company follows the guidance of ASC 815 to account for derivative instruments. ASC 815 requires the Company to mark-to-market all derivative instruments on the balance sheet, and recognize changes in the fair value of non-hedge derivative instruments immediately in earnings. In certain cases, NRG may apply hedge accounting to the Company's derivative instruments. The criteria used to determine if hedge accounting treatment is appropriate are: (i) the designation of the hedge to an underlying exposure; (ii) whether the overall risk is being reduced; and (iii) if there is a correlation between the changes in fair value of the derivative instrument and the underlying hedged item. Changes in the fair value of derivatives instruments accounted for as hedges are either recognized in earnings as an offset to the changes in the fair value of the related hedged item, or deferred and recorded as a component of Other Comprehensive Income, or OCI, and subsequently recognized in earnings when the hedged transactions occur.
For purposes of measuring the fair value of derivative instruments, NRG uses quoted exchange prices and broker quotes. When external prices are not available, NRG uses internal models to determine the fair value. These internal models include assumptions of the future prices of energy commodities based on the specific market in which the energy commodity is being purchased or sold, using externally available forward market pricing curves for all periods possible under the pricing model. In order to qualify derivative instruments for hedged transactions, NRG estimates the forecasted generation occurring within a specified time period. Judgments related to the probability of forecasted generation occurring are based on available baseload capacity, internal forecasts of sales and generation, and historical physical delivery on similar contracts. The probability that hedged forecasted generation will occur by the end of a specified time period could change the results of operations by requiring amounts currently classified in OCI to be reclassified into earnings, creating increased variability in the Company's earnings. These estimations are considered to be critical accounting estimates.
Certain derivative instruments that meet the criteria for derivative accounting treatment also qualify for a scope exception to derivative accounting, as they are considered to be Normal Purchase Normal Sale, or NPNS. The availability of this exception is based upon the assumption that NRG has the ability and it is probable to deliver or take delivery of the underlying item. These assumptions are based on available baseload capacity, internal forecasts of sales and generation and historical physical delivery on contracts. Derivatives that are considered to be NPNS are exempt from derivative accounting treatment, and are accounted for under accrual accounting. If it is determined that a transaction designated as NPNS no longer meets the scope exception due to changes in estimates, the related contract would be recorded on the balance sheet at fair value combined with the immediate recognition through earnings.
Income Taxes and Valuation Allowance for Deferred Tax Assets
As of December 31, 2011, NRG had a valuation allowance of $83 million. This amount is comprised of foreign net operating loss carryforwards of $71 million, foreign capital loss carryforwards of approximately $1 million and U.S. domestic state NOLs of $11 million. In assessing the recoverability of NRG's deferred tax assets, the Company considers whether it is more likely than not that some portion or all of the deferred tax assets will be realized. The ultimate realization of deferred tax assets is primarily dependent upon earnings in foreign jurisdictions.
NRG continues to be under audit for multiple years by taxing authorities in other jurisdictions. Considerable judgment is required to determine the tax treatment of a particular item that involves interpretations of complex tax laws. NRG is subject to examination by taxing authorities for income tax returns filed in the U.S. federal jurisdiction and various state and foreign jurisdictions including operations located in Germany and Australia. The Company is no longer subject to U.S. federal income tax examinations for years prior to 2007. With few exceptions, state and local income tax examinations are no longer open for years before 2003. The Company's significant foreign operations are also no longer subject to examination by local jurisdictions for years prior to 2004.
96
Evaluation of Assets for Impairment and Other Than Temporary Decline in Value
In accordance with ASC 360,
Property, Plant, and Equipment
, or ASC 360, NRG evaluates property, plant and equipment and certain intangible assets for impairment whenever indicators of impairment exist. Examples of such indicators or events are:
|
•
|
Significant decrease in the market price of a long-lived asset;
|
|
•
|
Significant adverse change in the manner an asset is being used or its physical condition;
|
|
•
|
Adverse business climate;
|
|
•
|
Accumulation of costs significantly in excess of the amount originally expected for the construction or acquisition of an asset;
|
|
•
|
Current-period loss combined with a history of losses or the projection of future losses; and
|
|
•
|
Change in the Company's intent about an asset from an intent to hold to a greater than 50% likelihood that an asset will be sold or disposed of before the end of its previously estimated useful life.
|
Recoverability of assets to be held and used is measured by a comparison of the carrying amount of the assets to the future net cash flows expected to be generated by the asset, through considering project specific assumptions for long-term power pool prices, escalated future project operating costs and expected plant operations. If such assets are considered to be impaired, the impairment to be recognized is measured by the amount by which the carrying amount of the assets exceeds the fair value of the assets by factoring in the probability weighting of different courses of action available to the Company. Generally, fair value will be determined using valuation techniques such as the present value of expected future cash flows. NRG uses its best estimates in making these evaluations and considers various factors, including forward price curves for energy, fuel costs and operating costs. However, actual future market prices and project costs could vary from the assumptions used in the Company's estimates, and the impact of such variations could be material.
For assets to be held and used, if the Company determines that the undiscounted cash flows from the asset are less than the carrying amount of the asset, NRG must estimate fair value to determine the amount of any impairment loss. Assets held-for-sale are reported at the lower of the carrying amount or fair value less the cost to sell. The estimation of fair value under ASC 360, whether in conjunction with an asset to be held and used or with an asset held-for-sale, and the evaluation of asset impairment are, by their nature, subjective. NRG considers quoted market prices in active markets to the extent they are available. In the absence of such information, the Company may consider prices of similar assets, consult with brokers, or employ other valuation techniques. NRG will also discount the estimated future cash flows associated with the asset using a single interest rate representative of the risk involved with such an investment or employ an expected present value method that probability-weights a range of possible outcomes. The use of these methods involves the same inherent uncertainty of future cash flows as previously discussed with respect to undiscounted cash flows. Actual future market prices and project costs could vary from those used in the Company's estimates, and the impact of such variations could be material.
NRG is also required to evaluate its equity-method and cost-method investments to determine whether or not they are impaired. ASC 323,
Investments - Equity Method and Joint Ventures
, or ASC 323, provides the accounting requirements for these investments. The standard for determining whether an impairment must be recorded under ASC 323 is whether the value is considered an "other than a temporary" decline in value. The evaluation and measurement of impairments under ASC 323 involves the same uncertainties as described for long-lived assets that the Company owns directly and accounts for in accordance with ASC 360. Similarly, the estimates that NRG makes with respect to its equity and cost-method investments are subjective, and the impact of variations in these estimates could be material. Additionally, if the projects in which the Company holds these investments recognize an impairment under the provisions of ASC 360, NRG would record its proportionate share of that impairment loss and would evaluate its investment for an other than temporary decline in value under ASC 323.
Goodwill and Other Intangible Assets
At December 31, 2011, NRG reported goodwill of $1.9 billion, consisting of $1.7 billion in its Texas operating segment, or NRG Texas, that is associated with the acquisition of Texas Genco in 2006, and $144 million and $29 million in its corporate operating segment that is associated with the acquisition of Green Mountain Energy in November 2010 and Energy Plus in September 2011, respectively. The Company has also recorded intangible assets in connection with its business acquisitions, measured primarily based on significant inputs that are not observable in the market and thus represent a Level 3 measurement as defined in ASC 820. See Item 15 —
Note 3
,
Business Acquisitions and Dispositions
, and
Note 11
,
Goodwill and Other Intangibles
, to the Consolidated Financial Statements for further discussion.
97
The Company applies ASC 805,
Business Combinations
, or ASC 805, and ASC 350, to account for its goodwill and intangible assets. Under these standards, the Company amortizes all finite-lived intangible assets over their respective estimated weighted-average useful lives, while goodwill has an indefinite life and is not amortized. However, goodwill and all intangible assets not subject to amortization are tested for impairments at least annually, or more frequently whenever an event or change in circumstances occurs that would more likely than not reduce the fair value of a reporting unit below its carrying amount. The Company tests goodwill for impairment at the reporting unit level, which is identified by assessing whether the components of the Company's operating segments constitute businesses for which discrete financial information is available and whether segment management regularly reviews the operating results of those components. The Company performs the annual goodwill impairment assessment as of December 31 or when events or changes in circumstances indicate that the carrying value may not be recoverable. In 2011, NRG adopted the provisions of ASU 2011-08,
Intangibles - Goodwill and Othe
r
(Topic 350) Testing Goodwill for Impairment
, or ASU 2011-08, which allows the consideration of qualitative factors to determine if it is more likely than not that impairment has occurred. In the absence of sufficient qualitative factors, goodwill impairment is determined utilizing a two-step process. If it is determined that the fair value of a reporting unit is below its carrying amount, where necessary, the Company's goodwill and/or intangible asset with indefinite lives will be impaired at that time.
The Company performed its annual goodwill impairment assessment as of December 31, 2011, based on its qualitative assessment of macroeconomic, industry, and market events and circumstances as well as the overall financial performance subsequent to the November 2010 and September 2011 acquisition dates of the Green Mountain Energy and Energy Plus reporting units, respectively, the Company determined it was not more likely than not that the fair value of goodwill attributed to these reporting units was less than its carrying amount; as such, the annual two-step impairment test was deemed not necessary to be performed for these reporting units for the year ended December 31, 2011.
The Company performed step one of the two-step impairment test for its Texas reporting unit, NRG Texas, which is at the operating segment level. The Company determined the fair value of this reporting unit using primarily an income approach and then applied an overall market approach reasonableness test to reconcile that fair value with NRG's overall market capitalization. The Company believes the methodology and assumptions used in the valuation are consistent with the views of market participants. Significant inputs to the determination of fair value were as follows:
|
•
|
For the three solid-fuel baseload plants that drive a majority of the value in the reporting unit, and for the region's Elbow Creek, Langford, Cedar Bayou and South Trent facilities, the Company applied a discounted cash flow methodology to their long-term budgets. This approach is consistent with that used to determine fair value in prior years. These budgets are based on the Company's views of power and fuel prices, which consider market prices in the near term and the Company's fundamental view for the longer term as some relevant market prices are illiquid beyond 24 months. Hedging is included to the extent of contracts already in place. Projected generation in the long-term budgets is based on management's estimate of supply and demand within the sub-markets for each plant and the physical and economic characteristics of each plant;
|
|
•
|
For the reporting unit's remaining gas plants, the Company applied a market-derived earnings multiple to the gas plants' aggregate estimated 2011 earnings before interest, taxes, depreciation and amortization. This approach is consistent with that used to determine fair values in prior years; and
|
|
•
|
The intangible value to NRG Texas for synergies it provides to the Retail Businesses was determined by capitalizing estimated annual collateral charge and supply cost savings.
|
Under step one, if the fair value of a reporting unit exceeds its carrying value, goodwill of the reporting unit is not considered impaired. Under the income approach described above, the Company estimated the fair value of NRG Texas' invested capital to exceed its carrying value by approximately 12% at December 31, 2011. The Company also evaluated various market-derived data including market research forecasts, recent merger and acquisition activity and earnings multiples, and together with its estimate of fair value, concluded that NRG Texas's goodwill is not impaired at December 31, 2011.
98
To reconcile the fair value determined under the income approach with NRG's market capitalization, the Company considered historical and future budgeted earnings measures to estimate the average percentage of total company value represented by NRG Texas, and applied this percentage to an adjusted business enterprise value of NRG. To derive this adjusted business enterprise value, the Company applied a range of control premiums based on recent market transactions to the business enterprise value of NRG on a non-controlling, marketable basis, and also made adjustments for some non-operating assets and for some of the significant factors that impact NRG differently from NRG Texas, such as environmental capital expenditures outside of the Texas region on NRG's stock price. The Company also qualitatively considered the impact on its stock price of shorter-term market views about forward natural gas prices. The Company was able to reconcile the proportional value of NRG Texas to NRG's market capitalization at a value that would not indicate an impairment.
The Company's estimate of fair value under the income approach described above is affected by assumptions about projected power prices, generation, fuel costs, capital expenditure requirements and environmental regulations, and the Company believes that the most significant impact arises from future power prices. The price of natural gas plays an important role in setting the price of electricity in many of the regions where NRG operates power plants. Due to recent downward trends in market natural gas prices, the Company performed a sensitivity scenario by using the quoted natural gas prices on the New York Mercantile Exchange, or NYMEX, as of December 31, 2011, and changes to the implied heat rate that would support new build of combined cycle gas plant in the Texas markets, coal and transportation charges, variable operations and maintenance costs, and the impact on forecasted generation for the baseload plants during the budget period. Under this sensitivity scenario, the fair value of NRG Texas was 16% below its carrying value at December 31, 2011. While not required, the Company further performed a high-level hypothetical step two analysis for this sensitivity scenario. Step two requires an allocation of fair value to the individual asset and liabilities using a hypothetical purchase price allocation in order to determine the implied fair value of goodwill. If the implied fair value of goodwill is less than the carrying amount, an impairment loss is recorded. Under the hypothetical step two for the sensitivity scenario it was determined that no goodwill impairment was necessary as of December 31, 2011. If long-term natural gas prices remain depressed for an extended period of time, the Company's goodwill may become impaired in the future, which would result in a non-cash charge, not to exceed $1.7 billion, related to the NRG Texas reporting unit.
Contingencies
NRG records a loss contingency when management determines it is probable that a liability has been incurred and the amount of the loss can be reasonably estimated. Gain contingencies are not recorded until management determines it is certain that the future event will become or does become a reality. Such determinations are subject to interpretations of current facts and circumstances, forecasts of future events, and estimates of the financial impacts of such events. NRG describes in detail its contingencies in Item 15 — Note 22,
Commitments and Contingencies,
to the Consolidated Financial Statements.
Recent Accounting Developments
See Item 15 — Note 2,
Summary of Significant Accounting Policies,
to the Consolidated Financial Statements for a discussion of recent accounting developments.
99
NRG is exposed to several market risks in the Company's normal business activities. Market risk is the potential loss that may result from market changes associated with the Company's merchant power generation or with an existing or forecasted financial or commodity transaction. The types of market risks the Company is exposed to are commodity price risk, interest rate risk, liquidity risk, credit risk and currency exchange risk. In order to manage these risks the Company uses various fixed-price forward purchase and sales contracts, futures and option contracts traded on NYMEX, and swaps and options traded in the over-the-counter financial markets to:
|
•
|
Manage and hedge fixed-price purchase and sales commitments;
|
|
•
|
Manage and hedge exposure to variable rate debt obligations;
|
|
•
|
Reduce exposure to the volatility of cash market prices, and
|
|
•
|
Hedge fuel requirements for the Company's generating facilities.
|
Commodity Price Risk
Commodity price risks result from exposures to changes in spot prices, forward prices, volatilities, and correlations between various commodities, such as natural gas, electricity, coal, oil, and emissions credits. NRG manages the commodity price risk of the Company's merchant generation operations and load serving obligations by entering into various derivative or non-derivative instruments to hedge the variability in future cash flows from forecasted sales and purchases of electricity and fuel. These instruments include forwards, futures, swaps, and option contracts traded on various exchanges, such as NYMEX and Intercontinental Exchange, or ICE, as well as over-the-counter markets. The portion of forecasted transactions hedged may vary based upon management's assessment of market, weather, operation and other factors.
While some of the contracts the Company uses to manage risk represent commodities or instruments for which prices are available from external sources, other commodities and certain contracts are not actively traded and are valued using other pricing sources and modeling techniques to determine expected future market prices, contract quantities, or both. NRG uses the Company's best estimates to determine the fair value of those derivative contracts. However, it is likely that future market prices could vary from those used in recording mark-to-market derivative instrument valuation, and such variations could be material.
NRG measures the risk of the Company's portfolio using several analytical methods, including sensitivity tests, scenario tests, stress tests, position reports, and Value at Risk, or VaR. NRG uses a Monte Carlo simulation based VaR model to estimate the potential loss in the fair value of the Company's energy assets and liabilities, which includes generation assets, load obligations, and bilateral physical and financial transactions. The key assumptions for the Company's VaR model include: (i) lognormal distribution of prices; (ii) one-day holding period; (iii) 95% confidence interval; (iv) rolling 36-month forward looking period; and (v) market implied volatilities and historical price correlations.
As of December 31, 2011, the VaR for NRG's commodity portfolio, including generation assets, load obligations and bilateral physical and financial transactions calculated using the VaR model, was $45 million.
The following table summarizes average, maximum and minimum VaR for NRG for the years ended December 31, 2011, and 2010:
|
(In millions)
|
2011
|
2010
|
|||||
|
VaR as of December 31,
|
$
|
45
|
|
$
|
50
|
|
|
|
For the year ended December 31,
|
|||||||
|
Average
|
$
|
60
|
|
$
|
54
|
|
|
|
Maximum
|
77
|
|
70
|
|
|||
|
Minimum
|
44
|
|
37
|
|
|||
Due to the inherent limitations of statistical measures such as VaR, the evolving nature of the competitive markets for electricity and related derivatives, and the seasonality of changes in market prices, the VaR calculation may not capture the full extent of commodity price exposure. As a result, actual changes in the fair value of mark-to-market energy assets and liabilities could differ from the calculated VaR, and such changes could have a material impact on the Company's financial results.
100
In order to provide additional information for comparative purposes to NRG's peers, the Company also uses VaR to estimate the potential loss of derivative financial instruments that are subject to mark-to-market accounting. These derivative instruments include transactions that were entered into for both asset management and trading purposes. The VaR for the derivative financial instruments calculated using the diversified VaR model as of December 31, 2011, for the entire term of these instruments entered into for both asset management and trading, was $13 million primarily driven by asset-backed transactions.
Interest Rate Risk
NRG is exposed to fluctuations in interest rates through the Company's issuance of fixed rate and variable rate debt. Exposures to interest rate fluctuations may be mitigated by entering into derivative instruments known as interest rate swaps, caps, collars and put or call options. These contracts reduce exposure to interest rate volatility and result in primarily fixed rate debt obligations when taking into account the combination of the variable rate debt and the interest rate derivative instrument. NRG's risk management policies allow the Company to reduce interest rate exposure from variable rate debt obligations.
NRG entered into interest rate swaps, which became effective on April 1, 2011, and are intended to hedge the risks associated with floating interest rates. For the interest rate swaps, the Company will pay its counterparty the equivalent of a fixed interest payment on a predetermined notional value, and NRG receives the monthly equivalent of a floating interest payment based on a 1-month London Inter-Bank Offer Rate, or LIBOR, calculated on the same notional value. All interest rate swap payments by NRG and its counterparties are made monthly and the LIBOR is determined in advance of each interest period. The total notional amount of the swaps, which mature on February 1, 2013, is $900 million.
In addition to those discussed above, the Company's project subsidiaries enter into interest rate swaps, intended to hedge the risks associated with interest rates on non-recourse project level debt. See Item 15 -
Note 12
,
Debt and Capital Leases
, to the Consolidated Financial Statements, for more information about interest rate swaps of the Company's project subsidiaries.
If all of the above swaps had been discontinued on December 31, 2011, the Company would have owed the counterparties $100 million. Based on the investment grade rating of the counterparties, NRG believes its exposure to credit risk due to nonperformance by counterparties to its hedge contracts to be insignificant.
As part of the CVSR financing, the Company entered into swaptions with a notional value of $686 million in order to hedge the project interest rate risk. If the swaptions were discontinued on December 31, 2011, the counterparty would have owed the Company approximately $27 million.
NRG has both long and short-term debt instruments that subject the Company to the risk of loss associated with movements in market interest rates. As of December 31, 2011, a 1% change in interest rates would result in an $8 million change in interest expense on a rolling twelve month basis.
As of December 31, 2011, the fair value of the Company's debt was equal to its carrying value of $9.7 billion. NRG estimates that a 1% decrease in market interest rates would have increased the fair value of the Company's long-term debt by $797 million.
Liquidity Risk
Liquidity risk arises from the general funding needs of NRG's activities and in the management of the Company's assets and liabilities. The Company is currently exposed to additional collateral posting if natural gas prices decline primarily due to the long natural gas equivalent position at various exchanges used to hedge NRG's retail supply load obligations.
Based on a sensitivity analysis for power and gas positions under marginable contracts, a $1 per MMBtu change in natural gas prices across the term of the marginable contracts would cause a change in margin collateral posted of approximately $123 million as of December 31, 2011 and a 1.25 MMBtu/MWh change in heat rates for heat rate positions would result in a change in margin collateral posted of approximately $68 million as of December 31, 2011. This analysis uses simplified assumptions and is calculated based on portfolio composition and margin-related contract provisions as of December 31, 2011.
Counterparty Credit Risk
Credit risk relates to the risk of loss resulting from non-performance or non-payment by counterparties pursuant to the terms of their contractual obligations. The Company monitors and manages credit risk through credit policies that include: (i) an established credit approval process; (ii) a daily monitoring of counterparties' credit limits; (iii) the use of credit mitigation measures such as margin, collateral, prepayment arrangements, or volumetric limits; (iv) the use of payment netting agreements; and (v) the
101
use of master netting agreements that allow for the netting of positive and negative exposures of various contracts associated with a single counterparty. Risks surrounding counterparty performance and credit could ultimately impact the amount and timing of expected cash flows. The Company seeks to mitigate counterparty risk by having a diversified portfolio of counterparties. The Company also has credit protection within various agreements to call on additional collateral support if and when necessary. Cash margin is collected and held at NRG to cover the credit risk of the counterparty until positions settle.
As of December 31, 2011, counterparty credit exposure to a significant portion of the Company's counterparties was $1.2 billion and NRG held collateral (cash and letters of credit) against those positions of $261 million resulting in a net exposure of $919 million. Counterparty credit exposure is discounted at the risk free rate. The following table highlights the credit quality and the net counterparty credit exposure by industry sector. Net counterparty credit exposure is defined as the aggregate net asset position for NRG with counterparties where netting is permitted under the enabling agreement and includes all cash flow, mark-to-market and NPNS, and non-derivative transactions. As of December 31, 2011, the exposure is shown net of collateral held, and includes amounts net of receivables or payables.
|
Category
|
Net Exposure
(a)
(% of Total)
|
|
|
Financial institutions
|
57
|
%
|
|
Utilities, energy merchants, marketers and other
|
39
|
|
|
Coal and emissions
|
1
|
|
|
ISOs
|
3
|
|
|
Total
|
100
|
%
|
|
Category
|
Net Exposure
(a)
(% of Total)
|
|
|
Investment grade
|
70
|
%
|
|
Non-rated
(b)
|
27
|
|
|
Non-Investment grade
|
3
|
|
|
Total
|
100
|
%
|
|
(a)
|
Counterparty credit exposure excludes uranium and coal transportation contracts because of the unavailability of market prices.
|
|
(b)
|
For non-rated counterparties, the majority are related to ISO and municipal public power entities, which are considered investment grade equivalent ratings based on NRG's internal credit ratings.
|
102
NRG has credit risk exposure to certain wholesale counterparties representing more than 10% of the total net exposure discussed above and the aggregate of credit risk exposure to such counterparties was $265 million. Approximately 89% of NRG's positions relating to this credit risk roll-off by the end of 2013. Changes in hedge positions and market prices will affect credit exposure and counterparty concentration. Given the credit quality, diversification and term of the exposure in the portfolio, NRG does not anticipate a material impact on the Company's financial position or results of operations from nonperformance by any of NRG's counterparties.
Counterparty credit exposure described above excludes credit risk exposure under certain long term contracts, including California tolling agreements, South Central load obligations, solar PPAs and a coal supply agreement. As external sources or observable market quotes are not available to estimate such exposure, the Company valued these contracts based on various techniques including but not limited to internal models based on a fundamental analysis of the market and extrapolation of observable market data with similar characteristics. Based on these valuation techniques, as of December 31, 2011, credit risk exposure to these counterparties is approximately $866 million for the next five years. This amount excludes potential credit exposures for projects with long term PPAs that have not reached commercial operations. Many of these power contracts are with utilities or public power entities that have strong credit quality and specific public utility commission or other regulatory support. In the case of the coal supply agreement, NRG holds a lien against the underlying asset. These factors significantly reduce the risk of loss.
Retail Customer Credit Risk
NRG is exposed to retail credit risk through its retail electricity providers, which serve C&I customers and the Mass market. Retail credit risk results when a customer fails to pay for services rendered. The losses could be incurred from nonpayment of customer accounts receivable and any in-the-money forward value. NRG manages retail credit risk through the use of established credit policies that include monitoring of the portfolio, and the use of credit mitigation measures such as deposits or prepayment arrangements.
As of December 31, 2011, the Company's credit exposure to C&I customers was diversified across many customers and various industries, with a significant portion of the exposure with government entities.
NRG is also exposed to credit risk relating to its Mass customers, which may result in a write-off of bad debt. During 2011, the Company continued to experience improved customer payment behavior, but current economic conditions may affect the Company's customers' ability to pay bills in a timely manner, which could increase customer delinquencies and may lead to an increase in bad debt expense.
Credit Risk Related Contingent Features
Certain of the Company's hedging agreements contain provisions that require the Company to post additional collateral if the counterparty determines that there has been deterioration in credit quality, generally termed "adequate assurance" under the agreements, or require the Company to post additional collateral if there were a one notch downgrade in the Company's credit rating. The collateral required for contracts that have adequate assurance clauses that are in a net liability position as of December 31, 2011, was $69 million. The collateral required for contracts with credit rating contingent features that are in a net liability position as of December 31, 2011, was $35 million. The Company is also a party to certain marginable agreements where NRG has a net liability position but the counterparty has not called for the collateral due, which is approximately $15 million as of December 31, 2011.
Currency Exchange Risk
NRG's foreign earnings and investments may be subject to foreign currency exchange risk, which NRG generally does not hedge. As these earnings and investments are not material to NRG's consolidated results, the Company's foreign currency exposure is limited.
103
The financial statements and schedules are listed in Part IV, Item 15 of this Form 10-K.
None.
Conclusion Regarding the Effectiveness of Disclosure Controls and Procedures and Internal Control Over Financial Reporting
Under the supervision and with the participation of NRG's management, including its principal executive officer, principal financial officer and principal accounting officer, NRG conducted an evaluation of the effectiveness of the design and operation of its disclosure controls and procedures, as such term is defined in Rules 13a-15(e) or 15d-15(e) of the Securities Exchange Act of 1934, as amended, or the Exchange Act. Based on this evaluation, the Company's principal executive officer, principal financial officer and principal accounting officer concluded that the disclosure controls and procedures were effective as of the end of the period covered by this annual report on Form 10-K. Management's report on the Company's internal control over financial reporting and the report of the Company's independent registered public accounting firm are incorporated under the caption "Management's Report on Internal Control over Financial Reporting" and under the caption "Report of Independent Registered Public Accounting Firm," of the Company's Annual Report on Form 10-K for the fiscal year ended December 31, 2011.
Changes in Internal Control over Financial Reporting
There were no changes in the Company's internal control over financial reporting (as such term is defined in Rule 13a-15(f) under the Exchange Act) that occurred in the fourth quarter of 2011 that materially affected, or are reasonably likely to materially affect, the Company's internal control over financial reporting.
Inherent Limitations over Internal Controls
NRG's internal control over financial reporting is designed to provide reasonable assurance regarding the reliability of financial reporting and the preparation of consolidated financial statements for external purposes in accordance with generally accepted accounting principles. The Company's internal control over financial reporting includes those policies and procedures that:
|
1.
|
Pertain to the maintenance of records that, in reasonable detail, accurately and fairly reflect the transactions and dispositions of the Company's assets;
|
|
2.
|
Provide reasonable assurance that transactions are recorded as necessary to permit preparation of consolidated financial statements in accordance with generally accepted accounting principles, and that the Company's receipts and expenditures are being made only in accordance with authorizations of its management and directors; and
|
|
3.
|
Provide reasonable assurance regarding prevention or timely detection of unauthorized acquisition, use or disposition of the Company's assets that could have a material effect on the consolidated financial statements.
|
Internal control over financial reporting cannot provide absolute assurance of achieving financial reporting objectives because of its inherent limitations, including the possibility of human error and circumvention by collusion or overriding of controls. Accordingly, even an effective internal control system may not prevent or detect material misstatements on a timely basis. Also, projections of any evaluation of effectiveness to future periods are subject to the risk that controls may become inadequate because of changes in conditions or that the degree of compliance with the policies or procedures may deteriorate.
None.
104
Directors
Kirbyjon H. Caldwell
has been a director of NRG since March 2009. He was a director of Reliant Energy, Inc. (now known as GenOn Energy, Inc.) from August 2003 to March 2009. Since 1982, he has served as Senior Pastor at the 16,000-member Windsor Village United Methodist Church in Houston, Texas. Pastor Caldwell was also a director of United Continental Holdings, Inc. (formerly Continental Airlines, Inc.) from 1999 to September 2011.
John F. Chlebowski
has been a director of NRG since December 2003. Mr. Chlebowski served as the President and Chief Executive Officer of Lakeshore Operating Partners, LLC, a bulk liquid distribution firm, from March 2000 until his retirement in December 2004. From July 1999 until March 2000, Mr. Chlebowski was a senior executive and cofounder of Lakeshore Liquids Operating Partners, LLC, a private venture firm in the bulk liquid distribution and logistics business, and from January 1998 until July 1999, he was a private investor and consultant in bulk liquid distribution. From 1994 until 1997, he was the President and Chief Executive Officer of GATX Terminals Corporation, a subsidiary of GATX Corporation. Prior to that, he served as Vice President of Finance Chief Financial Officer of GATX Corporation from 1986 to 1994. Mr. Chlebowski is a director of First Midwest Bancorp Inc. and the Non-Executive Chairman of SemGroup Corporation. Mr. Chlebowski also served as a director of Laidlaw International, Inc. from June 2003 until October 2007, SpectraSite, Inc. from June 2004 until August 2005, and Phosphate Resource Partners Limited Partnership from June 2004 until August 2005.
Lawrence S. Coben
has been a director of NRG since December 2003. He is currently Chairman and Chief Executive Officer of Tremisis Energy Corporation LLC. He was Chairman and Chief Executive Officer of Tremisis Energy Acquisition Corporation II, a publicly held company since July 2007, from December 2007 through March 2009 and of Tremisis Energy Acquisition Corporation from February 2004 to May 2006. From January 2001 to January 2004, he was a Senior Principal of Sunrise Capital Partners L.P., a private equity firm. From 1997 to January 2001, Mr. Coben was an independent consultant. From 1994 to 1996, Mr. Coben was Chief Executive Officer of Bolivian Power Company.
Howard E. Cosgrove
has served as Chairman of the Board and a director of NRG since December 2003. He was Chairman and Chief Executive Officer of Conectiv and its predecessor Delmarva Power and Light Company from December 1992 to August 2002. Prior to December 1992, Mr. Cosgrove held various positions with Delmarva Power and Light including Chief Operating Officer and Chief Financial Officer. Mr. Cosgrove serves as Chairman of the Board of Trustees of the University of Delaware.
David Crane
has served as the President, Chief Executive Officer and a director of NRG since December 2003. Prior to joining NRG, Mr. Crane served as Chief Executive Officer of International Power plc, a UK-domiciled wholesale power generation company, from January 2003 to November 2003, and as Chief Operating Officer from March 2000 through December 2002. Mr. Crane was Senior Vice President - Global Power New York at Lehman Brothers Inc., an investment banking firm, from January 1999 to February 2000, and was Senior Vice President - Global Power Group, Asia (Hong Kong) at Lehman Brothers from June 1996 to January 1999. Mr. Crane is also a director of El Paso Corporation.
Stephen L. Cropper
has been a director of NRG since December 2003. Mr. Cropper spent 25 years with The Williams Companies Inc., an energy company, before retiring in 1998 as President and Chief Executive Officer of Williams Energy Services. Mr. Cropper is a director of Berry Petroleum Company, Sunoco Logistics Partners L.P., Wawa, Inc., QuikTrip Corporation and NGL Energy Partners, LP, and was a director of Rental Car Finance Corporation, a subsidiary of Dollar Thrifty Automotive Group, Inc. until December 2011.
William E. Hantke
has been a director of NRG since March 2006. Mr. Hantke served as Executive Vice President and Chief Financial Officer of Premcor, Inc., a refining company, from February 2002 until December 2005. Mr. Hantke was Corporate Vice President of Development of Tosco Corporation, a refining and marketing company, from September 1999 until September 2001, and he also served as Corporate Controller from December 1993 until September 1999. Prior to that position, he was employed by Coopers & Lybrand as Senior Manager, Mergers and Acquisitions from 1989 until 1990. He also held various positions from 1975 until 1988 with AMAX, Inc., including Corporate Vice President, Operations Analysis and Senior Vice President, Finance and Administration, Metals and Mining. He was employed by Arthur Young from 1970 to 1975 as Staff/Senior Accountant. Mr. Hantke was Non-Executive Chairman of Process Energy Solutions, a private alternative energy company until March 31, 2008 and served as director and Vice-Chairman of NTR Acquisition Co., an oil refining start-up, until January 2009.
105
Paul W. Hobby
has been a director of NRG since March 2006. Mr. Hobby is the Managing Partner of Genesis Park, L.P., a Houston-based private equity business specializing in technology and communications investments which he helped to form in 2000. In that capacity, he serves as the Chief Executive Officer of Alpheus Communications, Inc., a Texas wholesale telecommunications provider, and as Former Chairman of CapRock Services Corp., the largest provider of satellite services to the global energy business. From November 1992 until January 2001, he served as Chairman and Chief Executive Officer of Hobby Media Services and was Chairman of Columbine JDS Systems, Inc. from 1995 until 1997. He was an Assistant U.S. Attorney for the Southern District of Texas from 1989 to 1992, Chief of Staff to the Lieutenant Governor of Texas, Bob Bullock, in 1991 and an Associate at Fulbright & Jaworski from 1986 to 1989. Mr. Hobby is also a director of Stewart Information Services Corporation (Stewart Title).
Gerald Luterman
has been a director of NRG since April 2009. He also served as Interim Chief Financial Officer of the Company from November 2009 through May 2010. Mr. Luterman was Executive Vice President and Chief Financial Officer of KeySpan Corporation from August 1999 to September 2007. Prior to this time, Mr. Luterman had more than 30 years experience in senior financial positions with companies including American Express, Booz Allen & Hamilton, Emerson Electric Company and Arrow Electronics. Mr. Luterman also served as a director of IKON Office Solutions, Inc. from November 2003 until August 2008 and U.S. Shipping Partners L.P. from May 2006 until November 2009.
Kathleen A. McGinty
has been a director of NRG since October 2008. Most recently, Ms. McGinty served as Secretary of the Pennsylvania Department of Environmental Protection (“DEP”), a position she held from 2003 until July 2008. Before joining the DEP, Ms. McGinty spent six years in the Clinton White House, where she was chair of the White House Council on Environmental Quality and earlier served as a senior environmental advisor to Vice President Al Gore. She currently serves as Secretary of the Board of Trustees at Saint Joseph's University in Pennsylvania and is the former Chair of the Pennsylvania Energy Development Authority. Ms. McGinty is also a founding partner of Peregrine Technology Partners, LLC, a firm focused on commercialization of resource efficient technologies, and operating partner of Element Partners, an investor in the clean technology sector. Ms. McGinty is also a director of Iberdrola USA and currently serves as Senior Vice President and Managing Director of Weston Solutions, Inc.
Anne C. Schaumburg
has been a director of NRG since April 2005. From 1984 until her retirement in January 2002, she was employed by Credit Suisse First Boston in the Global Energy Group, where she last served as Managing Director. From 1979 to 1984, she was in the Utilities Group at Dean Witter Financial Services Group, where she last served as Managing Director. From 1971 to 1978, she was at The First Boston Corporation in the Public Utilities Group. Ms. Schaumburg is also a director of Brookfield Infrastructure Partners L.P.
Herbert H. Tate
has been a director of NRG since December 2003. Mr. Tate was Of Counsel to Wolff & Samson, P.C. a New Jersey law firm from 2002 to 2004. In 2004, he became Corporate Vice President of Regulatory Strategy for NiSource Corporation and served until April 2006. From 1994 to 2001, Mr. Tate was appointed by New Jersey Governor Christine Todd Whitman as President to the New Jersey Board of Public Utilities (NJBPU). During that period, Mr. Tate also served on the Board of Directors for the National Regulatory Research Institute (NRRI), at Ohio State University; as a member of the Electricity Committee of the National Association of Regulatory Utility Commissioners (NARUC); and as a member of the Harvard Electric Policy Group. During 2001 and 2002, Mr. Tate was Professor for Energy Policy Studies at the New Jersey Institute of Technology, and from 2001 through 2005, Mr. Tate served as a member of the Advisory Committee to the Electric Power Research Institute (EPRI) Board of Directors. Upon leaving the NJBPU in 2001 and until 2004, Mr. Tate served on the Board of Directors for Central Vermont Public Service electric utility and on the Audit Committee. From 2001 to 2005, Mr. Tate also served on the Board of Directors for IDT Capital and IDT Spectrum, subsidiaries to IDT Corporation. In addition to his experience in the electric and natural gas industries, Mr. Tate was appointed by President George H.W. Bush as Assistant Administrator for Enforcement to the United States Environmental Protection Agency from 1991 to 1993. Mr. Tate served on the Board of Directors to the Environmental Law Institute from 2004 to 2009.
Thomas H. Weidemeyer
has been a director of NRG since December 2003. Until his retirement in December 2003, Mr. Weidemeyer served as Director, Senior Vice President and Chief Operating Officer of United Parcel Service, Inc., the world's largest transportation company and President of UPS Airlines. Mr. Weidemeyer became Manager of the Americas International Operation in 1989, and in that capacity directed the development of the UPS delivery network throughout Central and South America. In 1990, Mr. Weidemeyer became Vice President and Airline Manager of UPS Airlines and, in 1994, was elected its President and Chief Operating Officer. Mr. Weidemeyer became Senior Vice President and a member of the Management Committee of United Parcel Service, Inc. that same year, and he became Chief Operating Officer of United Parcel Service, Inc. in January 2001. Mr. Weidemeyer also serves as a director of The Goodyear Tire & Rubber Co., Waste Management, Inc. and Amsted Industries Incorporated.
106
Walter R. Young
has been a director of NRG since December 2003. From May 1990 to June 2003, Mr. Young was Chairman, Chief Executive Officer and President of Champion Enterprises, Inc., an assembler and manufacturer of manufactured homes. Mr. Young has held senior management positions with The Henley Group, The Budd Company and BFGoodrich.
Executive Officers
David Crane
has served as the President, Chief Executive Officer and a director of NRG since December 2003. For additional biographical information for Mr. Crane, see above under “Directors.”
Kirkland Andrews
has served as Executive Vice President and Chief Financial Officer of NRG Energy since September 2011. Prior to joining NRG, he served as Managing Director and Co-Head Investment Banking, Power and Utilities - Americas at Deutsche Bank Securities from June 2009 to September 2011. Prior to this, he served in several capacities at Citigroup Global Markets Inc., including Managing Director, Group Head, North American Power from November 2007 to June 2009, and Head of Power M&A, Mergers and Acquisitions from July 2005 to November 2007. In his banking career, Mr. Andrews led multiple large and innovative strategic, debt, equity and commodities transactions.
Michael R. Bramnick
has served as Executive Vice President and General Counsel since August 2010. He previously served as Senior Vice President, General Counsel, from February 2009 to August 2010. As General Counsel, Mr. Bramnick is responsible for NRG's legal affairs as well as corporate and regulatory compliance. He previously served as Deputy General Counsel and Chief Compliance Officer, having joined NRG in December 2004. In that position, he managed all litigation and dispute resolution for the Company, was responsible for the Corporate Compliance Program including the Company's Code of Conduct, and led the Regulatory Compliance Group. Prior to joining NRG, Mr. Bramnick was Associate General Counsel at Millennium Chemicals. He previously held in-house positions at Lucent Technologies and EnviroSource and served in private practice for six years at Pepper Hamilton, LLP.
Mauricio Gutierrez
has served as Executive Vice President and Chief Operating Officer since July 2010. In this capacity, Mr. Gutierrez oversees NRG's Plant Operations, Commercial Operations, Environmental Compliance, as well as the Engineering, Procurement and Construction division. He previously served as Executive Vice President, Commercial Operations, from January 2009 to July 2010 and Senior Vice President, Commercial Operations, from March 2008 to January 2009. In this capacity, he was responsible for the optimization of the Company's asset portfolio and fuel requirements. Prior to this, Mr. Gutierrez served as Vice President Commercial Operations Trading from May 2006 to March 2008. Prior to joining NRG in August 2004, Mr. Gutierrez held various positions within Dynegy, Inc., including Managing Director, Trading - Southeast and Texas, Senior Trader East Power and Asset Manager. Prior to Dynegy, Mr. Gutierrez served as senior consultant and project manager at DTP involved in various energy and infrastructure projects in Mexico.
James J. Ingoldsby
has served as Senior Vice President and Chief Accounting Officer since March 2008. He is responsible for directing NRG's financial accounting and reporting activities. From August 2006 to March 2008, Mr. Ingoldsby served as Vice President, Financial Planning and Analysis. From May 2004 to July 2006, Mr. Ingoldsby served as NRG's Vice President and Controller. Mr. Ingoldsby, who led the Sarbanes-Oxley implementation at chemical company Hercules, Inc., previously held various executive positions at GE Betz, formerly BetzDearborn from 1993 to 2003, including serving as Controller and Director of Business Analysis and Director of Financial Reporting. He also held various staff and managerial accounting and auditing positions at Mack Trucks, Inc. from 1982 to 1993. Mr. Ingoldsby began his career with Deloitte and Touche.
John W. Ragan
has served as Executive Vice President and Regional President, Gulf Coast since July 2010. In this capacity, Mr. Ragan is responsible for managing NRG's largest regional power generation portfolio, totaling over 10,500 megawatts of power in Texas and NRG's retail electric provider, Reliant Energy. He previously served as Executive Vice President and Chief Operating Officer from February 2009 to July 2010, overseeing NRG's Plant Operations, Commercial Operations, Environmental Compliance, as well as the Engineering, Procurement and Construction division. He previously served as Executive Vice President and Regional President, Northeast from December 2006 to February 2009. Prior to joining NRG, Mr. Ragan was Vice President of Trading, Transmission, and Operations at FPL Energy in 2006 and also served as Vice President of Business Management for FPL Energy's Northeast Region from August 2005 through July 2006. Prior to this, Mr. Ragan served as General Manager - Containerboard and Packaging for Georgia Pacific Corporation from October 2004 through July 2005. He also served in increasing roles of responsibility for Mirant Corporation from 1996 through 2004, notably as Senior Vice President and Chief Executive Officer of Mirant's International Group from August 2003 to July 2004.
107
Denise M. Wilson
has served as Executive Vice President and President, New Business since July 2011. In this capacity, Ms. Wilson is responsible for the oversight of all new business ventures and development. Prior to this, Ms. Wilson served as Executive Vice President and Chief Administrative Officer (“CAO”) from September 2008 to July 2011. As CAO, Ms. Wilson had oversight for several key corporate functions including Human Resources, Investor Relations, Communications and Information Technology. Ms. Wilson originally joined NRG in 2000 and served as Vice President, Human Resources from 2004 until she was named CAO in July 2006. She served in that position until March 2007 when she joined Nash-Finch Company, a leading national food distributor as Senior Vice President, Human Resources. Ms. Wilson left Nash-Finch in June 2008 to retire and then rejoined NRG in September 2008. Ms. Wilson has also served as Vice President, Human Resources Operations with Metris Companies Inc. and Director, Human Resources with General Electric ITS.
Code of Ethics
NRG has adopted a code of ethics entitled "NRG Code of Conduct" that applies to directors, officers and employees, including the chief executive officer and senior financial officers of NRG. It may be accessed through the Corporate Governance section of the Company's website at
http://www.nrgenergy.com/investor/corpgov.htm.
NRG Energy, Inc. also elects to disclose the information required by Form 8-K, Item 5.05, "Amendments to the Registrant's Code of Ethics, or Waiver of a Provision of the Code of Ethics," through the Company's website, and such information will remain available on this website for at least a 12-month period. A copy of the "NRG Energy, Inc. Code of Conduct" is available in print to any stockholder who requests it.
Other information required by this Item will be incorporated by reference to the similarly named section of NRG's definitive Proxy Statement for its 2012 Annual Meeting of Stockholders.
Other information required by this Item will be incorporated by reference to the similarly named section of NRG's Definitive Proxy Statement for its 2012 Annual Meeting of Stockholders.
Other information required by this Item will be incorporated by reference to the similarly named section of NRG's Definitive Proxy Statement for its 2012 Annual Meeting of Stockholders.
Other information required by this Item will be incorporated by reference to the similarly named section of NRG's Definitive Proxy Statement for its 2012 Annual Meeting of Stockholders.
Other information required by this Item will be incorporated by reference to the similarly named section of NRG's Definitive Proxy Statement for its 2012 Annual Meeting of Stockholders.
108
(a)(1) Financial Statements
The following consolidated financial statements of NRG Energy, Inc. and related notes thereto, together with the reports thereon of KPMG LLP, are included herein:
Consolidated Statements of Operations — Years ended December 31, 2011, 2010, and 2009
Consolidated Balance Sheets — December 31, 2011 and 2010
Consolidated Statements of Cash Flows — Years ended December 31, 2011, 2010, and 2009
Consolidated Statement of Stockholders' Equity and Comprehensive Income— Years ended December 31, 2011, 2010, and 2009
Notes to Consolidated Financial Statements
(a)(2) Financial Statement Schedule
The following Consolidated Financial Statement Schedule of NRG Energy, Inc. is filed as part of Item 15(d) of this report and should be read in conjunction with the Consolidated Financial Statements.
Schedule II — Valuation and Qualifying Accounts
All other schedules for which provision is made in the applicable accounting regulation of the Securities and Exchange Commission are not required under the related instructions or are inapplicable, and therefore, have been omitted.
(a)(3) Exhibits: See Exhibit Index submitted as a separate section of this report.
(b) Exhibits
See Exhibit Index submitted as a separate section of this report.
(c) Not applicable
109
MANAGEMENT'S REPORT ON INTERNAL CONTROL OVER FINANCIAL REPORTING
NRG Energy Inc.'s management is responsible for establishing and maintaining adequate internal control over financial reporting, as such term is defined in Exchange Act Rule 13a-15(f). Under the supervision and with the participation of the Company's management, including its principal executive officer, principal financial officer and principal accounting officer, the Company conducted an evaluation of the effectiveness of its internal control over financial reporting based on the framework in Internal Control — Integrated Framework issued by the Committee of Sponsoring Organizations of the Treadway Commission. Based on the Company's evaluation under the framework in Internal Control — Integrated Framework, the Company's management concluded that its internal control over financial reporting was effective as of December 31, 2011.
The effectiveness of the Company's internal control over financial reporting as of December 31, 2011, has been audited by KPMG LLP, the Company's independent registered public accounting firm, as stated in its report which is included in this Form 10‑K.
110
REPORT OF INDEPENDENT REGISTERED PUBLIC ACCOUNTING FIRM
The Board of Directors and Stockholders
NRG Energy, Inc.:
We have audited NRG Energy, Inc.'s internal control over financial reporting as of December 31, 2011, based on criteria established in Internal Control - Integrated Framework issued by the Committee of Sponsoring Organizations of the Treadway Commission (COSO). NRG Energy, Inc.'s management is responsible for maintaining effective internal control over financial reporting and for its assessment of the effectiveness of internal control over financial reporting, included in the accompanying Management's Report on Internal Control over Financial Reporting. Our responsibility is to express an opinion on the Company's internal control over financial reporting based on our audit.
We conducted our audit in accordance with the standards of the Public Company Accounting Oversight Board (United States). Those standards require that we plan and perform the audit to obtain reasonable assurance about whether effective internal control over financial reporting was maintained in all material respects. Our audit included obtaining an understanding of internal control over financial reporting, assessing the risk that a material weakness exists, and testing and evaluating the design and operating effectiveness of internal control based on the assessed risk. Our audit also included performing such other procedures as we considered necessary in the circumstances. We believe that our audit provides a reasonable basis for our opinion.
A company's internal control over financial reporting is a process designed to provide reasonable assurance regarding the reliability of financial reporting and the preparation of financial statements for external purposes in accordance with generally accepted accounting principles. A company's internal control over financial reporting includes those policies and procedures that (1) pertain to the maintenance of records that, in reasonable detail, accurately and fairly reflect the transactions and dispositions of the assets of the company; (2) provide reasonable assurance that transactions are recorded as necessary to permit preparation of financial statements in accordance with generally accepted accounting principles, and that receipts and expenditures of the company are being made only in accordance with authorizations of management and directors of the company; and (3) provide reasonable assurance regarding prevention or timely detection of unauthorized acquisition, use, or disposition of the company's assets that could have a material effect on the financial statements.
Because of its inherent limitations, internal control over financial reporting may not prevent or detect misstatements. Also, projections of any evaluation of effectiveness to future periods are subject to the risk that controls may become inadequate because of changes in conditions, or that the degree of compliance with the policies or procedures may deteriorate.
In our opinion, NRG Energy, Inc. maintained, in all material respects, effective internal control over financial reporting as of December 31, 2011, based on criteria established in Internal Control - Integrated Framework issued by the Committee of Sponsoring Organizations of the Treadway Commission.
We also have audited, in accordance with the standards of the Public Company Accounting Oversight Board (United States), the consolidated balance sheets of NRG Energy, Inc. and subsidiaries as of December 31, 2011 and 2010, and the related consolidated statements of operations, stockholders' equity and comprehensive income, and cash flows for each of the years in the three-year period ended December 31, 2011, and our report dated February 28, 2012 expressed an unqualified opinion on those consolidated financial statements.
|
/s/ KPMG LLP
|
|
|
|
KPMG LLP
|
|
Philadelphia, Pennsylvania
|
|
|
February 28, 2012
|
|
111
REPORT OF INDEPENDENT REGISTERED PUBLIC ACCOUNTING FIRM
The Board of Directors and Stockholders
NRG Energy, Inc.:
We have audited the accompanying consolidated balance sheets of NRG Energy, Inc. and subsidiaries as of December 31, 2011 and 2010, and the related consolidated statements of operations, stockholders' equity and comprehensive income, and cash flows for each of the years in the three-year period ended December 31, 2011. In connection with our audits of the consolidated financial statements, we also have audited financial statement schedule “Schedule II Valuation and Qualifying Accounts.” These consolidated financial statements and financial statement schedule are the responsibility of the Company's management. Our responsibility is to express an opinion on these consolidated financial statements and financial statement schedule based on our audits.
We conducted our audits in accordance with the standards of the Public Company Accounting Oversight Board (United States). Those standards require that we plan and perform the audit to obtain reasonable assurance about whether the financial statements are free of material misstatement. An audit includes examining, on a test basis, evidence supporting the amounts and disclosures in the financial statements. An audit also includes assessing the accounting principles used and significant estimates made by management, as well as evaluating the overall financial statement presentation. We believe that our audits provide a reasonable basis for our opinion.
In our opinion, the consolidated financial statements referred to above present fairly, in all material respects, the financial position of NRG Energy, Inc. and subsidiaries as of December 31, 2011 and 2010, and the results of their operations and their cash flows for each of the years in the three-year period ended December 31, 2011, in conformity with U.S. generally accepted accounting principles. Also in our opinion, the related financial statement schedule, when considered in relation to the basic consolidated financial statements taken as a whole, present fairly, in all material respects, the information set forth therein.
We also have audited, in accordance with the standards of the Public Company Accounting Oversight Board (United States), the effectiveness of NRG Energy, Inc. and subsidiaries internal control over financial reporting as of December 31, 2011, based on criteria established in Internal Control - Integrated Framework issued by the Committee of Sponsoring Organizations of the Treadway Commission (COSO), and our report dated February 28, 2012 expressed an unqualified opinion on the effectiveness of the Company's internal control over financial reporting.
|
/s/ KPMG LLP
|
|
|
|
KPMG LLP
|
|
Philadelphia, Pennsylvania
|
|
|
February 28, 2012
|
|
112
NRG ENERGY, INC. AND SUBSIDIARIES
|
|
For the Year Ended December 31,
|
||||||||||
|
(In millions, except per share amounts)
|
2011
|
2010
|
2009
|
||||||||
|
Operating Revenues
|
|||||||||||
|
Total operating revenues
|
$
|
9,079
|
|
$
|
8,849
|
|
$
|
8,952
|
|
||
|
Operating Costs and Expenses
|
|
|
|||||||||
|
Cost of operations
|
6,675
|
|
6,073
|
|
5,323
|
|
|||||
|
Depreciation and amortization
|
896
|
|
838
|
|
818
|
|
|||||
|
Impairment charge on emission allowances
|
160
|
|
—
|
|
—
|
|
|||||
|
Selling, general and administrative
|
668
|
|
598
|
|
550
|
|
|||||
|
Reliant Energy acquisition-related transaction and integration costs
|
—
|
|
—
|
|
54
|
|
|||||
|
Development costs
|
45
|
|
55
|
|
48
|
|
|||||
|
Total operating costs and expenses
|
8,444
|
|
7,564
|
|
6,793
|
|
|||||
|
Gain on sale of assets
|
—
|
|
23
|
|
—
|
|
|||||
|
Operating Income
|
635
|
|
1,308
|
|
2,159
|
|
|||||
|
Other Income/(Expense)
|
|
|
|||||||||
|
Equity in earnings of unconsolidated affiliates
|
35
|
|
44
|
|
41
|
|
|||||
|
Gain on sale of equity method investments
|
—
|
|
—
|
|
128
|
|
|||||
|
Impairment charge on investment
|
(495
|
)
|
—
|
|
—
|
|
|||||
|
Other income/(expense), net
|
19
|
|
33
|
|
(5
|
)
|
|||||
|
Loss on debt extinguishment and refinancing expense
|
(175
|
)
|
(2
|
)
|
(20
|
)
|
|||||
|
Interest expense
|
(665
|
)
|
(630
|
)
|
(634
|
)
|
|||||
|
Total other expense
|
(1,281
|
)
|
(555
|
)
|
(490
|
)
|
|||||
|
(Loss)/Income Before Income Taxes
|
(646
|
)
|
753
|
|
1,669
|
|
|||||
|
Income tax (benefit)/expense
|
(843
|
)
|
277
|
|
728
|
|
|||||
|
Net Income
|
197
|
|
476
|
|
941
|
|
|||||
|
Less: Net loss attributable to noncontrolling interest
|
—
|
|
(1
|
)
|
(1
|
)
|
|||||
|
Net Income Attributable to NRG Energy, Inc.
|
197
|
|
477
|
|
942
|
|
|||||
|
Dividends for preferred shares
|
9
|
|
9
|
|
33
|
|
|||||
|
Income Available for Common Stockholders
|
$
|
188
|
|
$
|
468
|
|
$
|
909
|
|
||
|
Earnings Per Share Attributable to NRG Energy, Inc. Common Stockholders
|
|||||||||||
|
Weighted average number of common shares outstanding — basic
|
240
|
|
252
|
|
246
|
|
|||||
|
Net Income per Weighted Average Common Share — Basic
|
$
|
0.78
|
|
$
|
1.86
|
|
$
|
3.70
|
|
||
|
Weighted average number of common shares outstanding — diluted
|
241
|
|
254
|
|
271
|
|
|||||
|
Net Income per Weighted Average Common Share — Diluted
|
$
|
0.78
|
|
$
|
1.84
|
|
$
|
3.44
|
|
||
See notes to Consolidated Financial Statements.
113
NRG ENERGY, INC. AND SUBSIDIARIES
|
|
As of December 31,
|
||||||
|
|
2011
|
2010
|
|||||
|
|
(In millions)
|
||||||
|
ASSETS
|
|
|
|||||
|
Current Assets
|
|
|
|||||
|
Cash and cash equivalents
|
$
|
1,105
|
|
$
|
2,951
|
|
|
|
Funds deposited by counterparties
|
258
|
|
408
|
|
|||
|
Restricted cash
|
292
|
|
8
|
|
|||
|
Accounts receivable — trade, less allowance for doubtful accounts of $23 and $25
|
834
|
|
734
|
|
|||
|
Inventory
|
308
|
|
453
|
|
|||
|
Derivative instruments
|
4,216
|
|
1,964
|
|
|||
|
Cash collateral paid in support of energy risk management activities
|
311
|
|
323
|
|
|||
|
Prepayments and other current assets
|
273
|
|
296
|
|
|||
|
Total current assets
|
7,597
|
|
7,137
|
|
|||
|
Property, Plant and Equipment
|
|
||||||
|
In service
|
15,704
|
|
14,913
|
|
|||
|
Under construction
|
2,487
|
|
1,400
|
|
|||
|
Total property, plant and equipment
|
18,191
|
|
16,313
|
|
|||
|
Less accumulated depreciation
|
(4,570
|
)
|
(3,796
|
)
|
|||
|
Net property, plant and equipment
|
13,621
|
|
12,517
|
|
|||
|
Other Assets
|
|
||||||
|
Equity investments in affiliates
|
640
|
|
536
|
|
|||
|
Capital leases and notes receivable, less current portion
|
342
|
|
384
|
|
|||
|
Goodwill
|
1,886
|
|
1,868
|
|
|||
|
Intangible assets, net of accumulated amortization of $1,452 and $1,064
|
1,419
|
|
1,776
|
|
|||
|
Nuclear decommissioning trust fund
|
424
|
|
412
|
|
|||
|
Derivative instruments
|
450
|
|
758
|
|
|||
|
Restricted cash supporting funded letter of credit facility
|
—
|
|
1,300
|
|
|||
|
Other non-current assets
|
336
|
|
208
|
|
|||
|
Total other assets
|
5,497
|
|
7,242
|
|
|||
|
Total Assets
|
$
|
26,715
|
|
$
|
26,896
|
|
|
See notes to Consolidated Financial Statements.
114
NRG ENERGY, INC. AND SUBSIDIARIES
CONSOLIDATED BALANCE SHEETS (Continued)
|
|
As of December 31,
|
||||||
|
|
2011
|
2010
|
|||||
|
|
(In millions, except share data)
|
||||||
|
LIABILITIES AND STOCKHOLDERS' EQUITY
|
|
|
|||||
|
Current Liabilities
|
|
||||||
|
Current portion of long-term debt and capital leases
|
$
|
87
|
|
$
|
463
|
|
|
|
Accounts payable
|
808
|
|
783
|
|
|||
|
Derivative instruments
|
3,751
|
|
1,685
|
|
|||
|
Deferred income taxes
|
127
|
|
108
|
|
|||
|
Cash collateral received in support of energy risk management activities
|
258
|
|
408
|
|
|||
|
Accrued interest expense
|
165
|
|
192
|
|
|||
|
Other accrued expenses
|
281
|
|
307
|
|
|||
|
Other current liabilities
|
194
|
|
274
|
|
|||
|
Total current liabilities
|
5,671
|
|
4,220
|
|
|||
|
Other Liabilities
|
|
||||||
|
Long-term debt and capital leases
|
9,745
|
|
8,748
|
|
|||
|
Funded letter of credit
|
—
|
|
1,300
|
|
|||
|
Nuclear decommissioning reserve
|
335
|
|
317
|
|
|||
|
Nuclear decommissioning trust liability
|
254
|
|
272
|
|
|||
|
Postretirement and other benefit obligations
|
400
|
|
322
|
|
|||
|
Deferred income taxes
|
1,389
|
|
1,989
|
|
|||
|
Derivative instruments
|
464
|
|
365
|
|
|||
|
Out-of-market commodity contracts
|
183
|
|
223
|
|
|||
|
Other non-current liabilities
|
356
|
|
820
|
|
|||
|
Total non-current liabilities
|
13,126
|
|
14,356
|
|
|||
|
Total Liabilities
|
18,797
|
|
18,576
|
|
|||
|
3.625% convertible perpetual preferred stock; $0.01 par value; 250,000 shares issued and outstanding (at liquidation value of $250, net of issuance costs)
|
249
|
|
248
|
|
|||
|
Commitments and Contingencies
|
|||||||
|
Stockholders' Equity
|
|||||||
|
Common stock; $0.01 par value; 500,000,000 shares authorized; 304,183,720 and 304,006,027 shares issued and 227,519,521 and 247,197,355 shares outstanding at December 31, 2011 and 2010
|
3
|
|
3
|
|
|||
|
Additional paid-in capital
|
5,346
|
|
5,323
|
|
|||
|
Retained earnings
|
3,987
|
|
3,800
|
|
|||
|
Less treasury stock, at cost — 76,664,199 and 56,808,672 shares at
December 31, 2011 and 2010
|
(1,924
|
)
|
(1,503
|
)
|
|||
|
Accumulated other comprehensive income
|
74
|
|
432
|
|
|||
|
Noncontrolling interest
|
183
|
|
17
|
|
|||
|
Total Stockholders' Equity
|
7,669
|
|
8,072
|
|
|||
|
Total Liabilities and Stockholders' Equity
|
$
|
26,715
|
|
$
|
26,896
|
|
|
See notes to Consolidated Financial Statements.
115
NRG ENERGY, INC. AND SUBSIDIARIES
|
|
Year Ended December 31,
|
|||||||||||
|
|
2011
|
2010
|
2009
|
|||||||||
|
|
(In millions)
|
|||||||||||
|
Cash Flows from Operating Activities
|
|
|
|
|||||||||
|
Net income
|
$
|
197
|
|
$
|
476
|
|
$
|
941
|
|
|||
|
Adjustments to reconcile net income to net cash provided by operating activities:
|
|
|
|
|||||||||
|
Distributions and equity in earnings of unconsolidated affiliates
|
9
|
|
(19
|
)
|
(41
|
)
|
||||||
|
Depreciation and amortization
|
896
|
|
838
|
|
818
|
|
||||||
|
Provision for bad debts
|
59
|
|
54
|
|
61
|
|
||||||
|
Amortization of nuclear fuel
|
39
|
|
40
|
|
36
|
|
||||||
|
Amortization of financing costs and debt discount/premiums
|
32
|
|
32
|
|
44
|
|
||||||
|
Loss on debt extinguishment
|
58
|
|
—
|
|
—
|
|
||||||
|
Amortization of intangibles and out-of-market commodity contracts
|
167
|
|
4
|
|
153
|
|
||||||
|
Amortization of unearned equity compensation
|
28
|
|
30
|
|
26
|
|
||||||
|
Loss on disposals and sales of assets
|
14
|
|
4
|
|
13
|
|
||||||
|
Impairment charges and asset write downs
|
657
|
|
25
|
|
—
|
|
||||||
|
Changes in derivative instruments
|
(138
|
)
|
(114
|
)
|
(225
|
)
|
||||||
|
Changes in deferred income taxes and liability for uncertain tax benefits
|
(859
|
)
|
255
|
|
689
|
|
||||||
|
Gain on sale of equity method investment
|
—
|
|
—
|
|
(128
|
)
|
||||||
|
Gain recognized on settlement of pre-existing relationship
|
—
|
|
—
|
|
(31
|
)
|
||||||
|
Changes in nuclear decommissioning trust liability
|
20
|
|
34
|
|
26
|
|
||||||
|
Cash provided/(used) by changes in other working capital, net of acquisition and disposition effects:
|
||||||||||||
|
Accounts receivable - trade
|
(119
|
)
|
138
|
|
88
|
|
||||||
|
Inventory
|
145
|
|
91
|
|
(83
|
)
|
||||||
|
Prepayments and other current assets
|
59
|
|
(51
|
)
|
26
|
|
||||||
|
Accounts payable
|
9
|
|
(261
|
)
|
(176
|
)
|
||||||
|
Accrued expenses and other current liabilities
|
(111
|
)
|
(48
|
)
|
48
|
|
||||||
|
Other assets and liabilities
|
4
|
|
95
|
|
(179
|
)
|
||||||
|
Net Cash Provided by Operating Activities
|
1,166
|
|
1,623
|
|
2,106
|
|
||||||
|
Cash Flows from Investing Activities
|
|
|
|
|||||||||
|
Acquisition of businesses, net of cash acquired
|
(377
|
)
|
(1,006
|
)
|
(427
|
)
|
||||||
|
Capital expenditures
|
(2,310
|
)
|
(706
|
)
|
(734
|
)
|
||||||
|
(Increase)/decrease in restricted cash, net
|
(35
|
)
|
(4
|
)
|
14
|
|
||||||
|
Increase in restricted cash to support equity requirements for U.S. DOE funded projects
|
(215
|
)
|
—
|
|
—
|
|
—
|
|
||||
|
Decrease/(increase) in notes receivable
|
12
|
|
39
|
|
(22
|
)
|
||||||
|
Proceeds from renewable energy grants
|
—
|
|
102
|
|
—
|
|
||||||
|
Purchases of emission allowances, net of proceeds
|
(19
|
)
|
(34
|
)
|
(38
|
)
|
||||||
|
Investments in nuclear decommissioning trust fund securities
|
(406
|
)
|
(341
|
)
|
(305
|
)
|
||||||
|
Proceeds from sales of nuclear decommissioning trust fund securities
|
385
|
|
307
|
|
279
|
|
||||||
|
Proceeds from sale of assets, net
|
7
|
|
43
|
|
6
|
|
||||||
|
(Investments in)/proceeds from sales of unconsolidated affiliates, net
|
(66
|
)
|
(23
|
)
|
278
|
|
||||||
|
Other
|
(23
|
)
|
—
|
|
(5
|
)
|
||||||
|
Net Cash Used by Investing Activities
|
(3,047
|
)
|
(1,623
|
)
|
(954
|
)
|
||||||
|
Cash Flows from Financing Activities
|
|
|
|
|||||||||
|
Payment of dividends to preferred stockholders
|
(9
|
)
|
(9
|
)
|
(33
|
)
|
||||||
|
(Payments for)/net receipts from settlement of acquired derivatives that include financing elements
|
(83
|
)
|
137
|
|
(79
|
)
|
||||||
|
Payment for treasury stock
|
(430
|
)
|
(180
|
)
|
(500
|
)
|
||||||
|
Cash proceeds from noncontrolling interest in subsidiary
|
29
|
|
50
|
|
50
|
|
||||||
|
Proceeds from issuance of common stock
|
2
|
|
2
|
|
2
|
|
||||||
|
Proceeds from issuance of long-term debt
|
6,224
|
|
1,484
|
|
892
|
|
||||||
|
(Payments for)/proceeds from term loan for funded letter of credit facility
|
(1,300
|
)
|
1,300
|
|
—
|
|
||||||
|
Decrease/(increase) in restricted cash supporting funded letter of credit facility
|
1,300
|
|
(1,300
|
)
|
—
|
|
||||||
|
Payment of debt issuance and hedging costs
|
(207
|
)
|
(75
|
)
|
(31
|
)
|
||||||
|
Payments for short and long-term debt
|
(5,493
|
)
|
(758
|
)
|
(644
|
)
|
||||||
|
Net Cash Provided By/(Used by) Financing Activities
|
33
|
|
651
|
|
(343
|
)
|
||||||
|
Effect of exchange rate changes on cash and cash equivalents
|
2
|
|
(4
|
)
|
1
|
|
||||||
|
Net (Decrease)/Increase in Cash and Cash Equivalents
|
(1,846
|
)
|
647
|
|
810
|
|
||||||
|
Cash and Cash Equivalents at Beginning of Period
|
2,951
|
|
2,304
|
|
1,494
|
|
||||||
|
Cash and Cash Equivalents at End of Period
|
$
|
1,105
|
|
$
|
2,951
|
|
$
|
2,304
|
|
|||
See notes to Consolidated Financial Statements.
116
NRG ENERGY, INC. AND SUBSIDIARIES
CONSOLIDATED STATEMENT OF STOCKHOLDERS' EQUITY AND COMPREHENSIVE INCOME
|
Preferred
Stock
|
Common
Stock
|
Additional
Paid-In
Capital
|
Retained
Earnings
|
Treasury
Stock
|
Accumulated
Other
Comprehensive
Income/(Loss)
|
Noncon-trolling
Interest
|
Total
Stockholders'
Equity
|
||||||||||||||||||||||||
|
(In millions)
|
|||||||||||||||||||||||||||||||
|
Balances at December 31, 2008
|
$
|
853
|
|
$
|
3
|
|
$
|
4,350
|
|
$
|
2,423
|
|
$
|
(823
|
)
|
$
|
310
|
|
$
|
7
|
|
$
|
7,123
|
|
|||||||
|
Net income/(loss)
|
|
|
|
|
|
|
942
|
|
|
|
|
|
(1
|
)
|
941
|
|
|||||||||||||||
|
Foreign currency translation adjustments, net of $21 tax
|
|
|
|
|
|
|
|
|
|
|
35
|
|
|
|
35
|
|
|||||||||||||||
|
Reclassification adjustment for translation loss realized upon sale of MIBRAG, net of tax benefit of $13
|
|
|
|
|
|
|
|
|
|
|
(22
|
)
|
|
|
(22
|
)
|
|||||||||||||||
|
Unrealized gain on derivatives, net of $53 tax
|
|
|
|
|
|
|
|
|
|
|
91
|
|
|
|
91
|
|
|||||||||||||||
|
Available-for-sale securities, net of $2 tax
|
|
|
|
|
|
|
|
|
|
|
4
|
|
|
|
4
|
|
|||||||||||||||
|
Defined benefit plan, net of $1 tax benefit
|
|
|
|
|
|
|
|
|
|
|
(2
|
)
|
|
|
(2
|
)
|
|||||||||||||||
|
Comprehensive income for 2009
|
|
|
|
|
|
|
|
|
|
|
|
|
|
|
1,047
|
|
|||||||||||||||
|
Equity-based compensation
|
|
|
|
|
26
|
|
|
|
|
|
|
|
|
|
26
|
|
|||||||||||||||
|
Purchase of treasury stock
|
|
|
|
|
|
|
|
|
(500
|
)
|
|
|
|
|
(500
|
)
|
|||||||||||||||
|
Preferred stock dividends
|
|
|
|
|
|
|
(33
|
)
|
|
|
|
|
|
|
(33
|
)
|
|||||||||||||||
|
ESPP share purchases
|
|
|
|
|
2
|
|
|
|
|
|
|
|
|
|
2
|
|
|||||||||||||||
|
NINA contribution, net of $16 tax
|
|
|
|
|
28
|
|
|
|
|
|
|
|
6
|
|
34
|
|
|||||||||||||||
|
5.75% preferred stock conversion to common stock
|
(447
|
)
|
|
|
447
|
|
|
|
|
|
|
|
|
|
—
|
|
|||||||||||||||
|
4.00% preferred stock conversion to common stock
|
(257
|
)
|
|
|
257
|
|
|
|
|
|
|
|
|
|
—
|
|
|||||||||||||||
|
Shares loaned to affiliate of CS
|
|
|
|
|
(291
|
)
|
|
|
291
|
|
|
|
|
|
—
|
|
|||||||||||||||
|
Shares returned from affiliate of CS
|
|
|
|
|
131
|
|
|
|
(131
|
)
|
|
|
|
|
—
|
|
|||||||||||||||
|
Other
|
|
|
|
|
(2
|
)
|
|
|
|
|
|
|
|
|
(2
|
)
|
|||||||||||||||
|
Balances at December 31, 2009
|
$
|
149
|
|
$
|
3
|
|
$
|
4,948
|
|
$
|
3,332
|
|
$
|
(1,163
|
)
|
$
|
416
|
|
$
|
12
|
|
$
|
7,697
|
|
|||||||
|
Net income/(loss)
|
|
|
|
|
|
|
477
|
|
|
|
|
|
(1
|
)
|
476
|
|
|||||||||||||||
|
Foreign currency translation adjustments, net of $1 tax
|
|
|
|
|
|
|
|
|
|
|
(3
|
)
|
|
|
(3
|
)
|
|||||||||||||||
|
Unrealized gain on derivatives, net of $20 tax
|
|
|
|
|
|
|
|
|
|
|
35
|
|
|
|
35
|
|
|||||||||||||||
|
Defined benefit plan, net of $9 tax benefit
|
|
|
|
|
|
|
|
|
|
|
(16
|
)
|
|
|
(16
|
)
|
|||||||||||||||
|
Comprehensive income for 2010
|
|
|
|
|
|
|
|
|
|
|
|
|
|
|
492
|
|
|||||||||||||||
|
Equity-based compensation
|
|
|
|
|
28
|
|
|
|
|
|
|
|
|
|
28
|
|
|||||||||||||||
|
Purchase of treasury stock
|
|
|
|
|
|
|
|
|
(180
|
)
|
|
|
|
|
(180
|
)
|
|||||||||||||||
|
Preferred stock dividends
|
|
|
|
|
|
|
(9
|
)
|
|
|
|
|
|
|
(9
|
)
|
|||||||||||||||
|
ESPP share purchases
|
|
|
|
|
3
|
|
|
|
|
|
|
|
|
|
3
|
|
|||||||||||||||
|
NINA contribution, net of $17 tax
|
|
|
|
|
27
|
|
|
|
|
|
|
|
6
|
|
33
|
|
|||||||||||||||
|
4.00% preferred stock conversion to common stock
|
(149
|
)
|
|
|
149
|
|
|
|
|
|
|
|
|
|
—
|
|
|||||||||||||||
|
Shares returned from affiliate of CS
|
|
|
|
|
160
|
|
|
|
(160
|
)
|
|
|
|
|
—
|
|
|||||||||||||||
|
Other
|
|
|
|
|
8
|
|
|
|
|
|
|
|
|
|
8
|
|
|||||||||||||||
|
Balances at December 31, 2010
|
$
|
—
|
|
$
|
3
|
|
$
|
5,323
|
|
$
|
3,800
|
|
$
|
(1,503
|
)
|
$
|
432
|
|
$
|
17
|
|
$
|
8,072
|
|
|||||||
|
Net income
|
|
|
|
|
|
|
197
|
|
|
|
|
|
|
|
197
|
|
|||||||||||||||
|
Foreign currency translation adjustments, net of $1 tax
|
|
|
|
|
|
|
|
|
|
|
(2
|
)
|
|
|
(2
|
)
|
|||||||||||||||
|
Unrealized loss on derivatives, net of $181 tax
|
|
|
|
|
|
|
|
|
|
|
(309
|
)
|
|
|
(309
|
)
|
|||||||||||||||
|
Available-for-sale securities, net of tax
|
|
|
|
|
|
|
|
|
|
|
(1
|
)
|
|
|
(1
|
)
|
|||||||||||||||
|
Defined benefit plan, net of $27 tax benefit
|
|
|
|
|
|
|
|
|
|
|
(46
|
)
|
|
|
(46
|
)
|
|||||||||||||||
|
Comprehensive loss for 2011
|
|
|
|
|
|
|
|
|
|
|
|
|
|
|
(161
|
)
|
|||||||||||||||
|
Equity-based compensation
|
|
|
|
|
28
|
|
|
|
|
|
|
|
|
|
28
|
|
|||||||||||||||
|
Purchase of treasury stock
|
|
|
|
|
|
|
|
|
(430
|
)
|
|
|
|
|
(430
|
)
|
|||||||||||||||
|
Preferred stock dividends
|
|
|
|
|
|
|
(9
|
)
|
|
|
|
|
|
|
(9
|
)
|
|||||||||||||||
|
ESPP share purchases
|
|
|
|
|
(5
|
)
|
(1
|
)
|
9
|
|
|
|
|
|
3
|
|
|||||||||||||||
|
NINA contribution
|
|
|
|
|
|
|
|
|
|
|
|
|
(17
|
)
|
(17
|
)
|
|||||||||||||||
|
Ivanpah contribution
|
|
|
|
|
|
|
183
|
|
183
|
|
|||||||||||||||||||||
|
Balances at December 31, 2011
|
$
|
—
|
|
$
|
3
|
|
$
|
5,346
|
|
$
|
3,987
|
|
$
|
(1,924
|
)
|
$
|
74
|
|
183
|
|
$
|
7,669
|
|
||||||||
See notes to Consolidated Financial Statements.
117
NRG ENERGY, INC. AND SUBSIDIARIES
NOTES TO CONSOLIDATED FINANCIAL STATEMENTS
General
NRG Energy, Inc., or NRG or the Company, is an integrated wholesale power generation and retail electricity company in the United States. First, NRG is a wholesale power generator engaged in the ownership and operation of power generation facilities; the trading of energy, capacity and related products; and the transacting in and trading of fuel and transportation services. Second, NRG is a retail electricity company engaged in the supply of electricity, energy services, and cleaner energy products to retail electricity customers in deregulated markets through Reliant Energy, Green Mountain Energy, and Energy Plus, (collectively, the Retail Businesses). Finally, NRG is focused on the deployment and commercialization of potential disruptive technologies, like electric vehicles, Distributed Solar and smart meter technology, which have the potential to change the nature of the power supply industry.
NRG's domestic generation facilities consist of intermittent, baseload, intermediate, and peaking power generation facilities. The following table summarizes NRG's global generation portfolio by operating segment, which includes
47
fossil fuel plants,
three
Utility Scale Solar facilities and
four
wind farms, as well as Distributed Solar facilities. Also included are
one
natural gas plant,
six
Utility Scale Solar facilities and additional Distributed Solar facilities currently under construction. All Utility Scale Solar and Distributed Solar facilities are described in megawatts on an alternating current, or AC, basis:
|
Fossil Fuel, Nuclear, and Renewable
|
||||||||||||||||||||||||
|
(In MW)
|
||||||||||||||||||||||||
|
Generation Type
|
Texas
|
Northeast
|
South Central
|
West
|
Thermal
|
Total Domestic
|
Inter-national
|
Total Global
|
||||||||||||||||
|
Natural gas
|
4,930
|
|
1,300
|
|
2,630
|
|
2,130
|
|
105
|
|
11,095
|
|
—
|
|
11,095
|
|
||||||||
|
Coal
|
4,190
|
|
1,600
|
|
1,495
|
|
—
|
|
15
|
|
7,300
|
|
1,005
|
|
8,305
|
|
||||||||
|
Oil
|
—
|
|
4,015
|
|
—
|
|
—
|
|
—
|
|
4,015
|
|
—
|
|
4,015
|
|
||||||||
|
Nuclear
|
1,175
|
|
—
|
|
—
|
|
—
|
|
—
|
|
1,175
|
|
—
|
|
1,175
|
|
||||||||
|
Wind
|
450
|
|
—
|
|
—
|
|
—
|
|
—
|
|
450
|
|
—
|
|
450
|
|
||||||||
|
Utility Scale Solar
|
—
|
|
—
|
|
—
|
|
65
|
|
—
|
|
65
|
|
—
|
|
65
|
|
||||||||
|
Distributed Solar
|
—
|
|
—
|
|
—
|
|
30
|
|
—
|
|
30
|
|
—
|
|
30
|
|
||||||||
|
Total generation capacity
|
10,745
|
|
6,915
|
|
4,125
|
|
2,225
|
|
120
|
|
24,130
|
|
1,005
|
|
25,135
|
|
||||||||
|
Under Construction
|
||||||||||||||||||||||||
|
Natural gas
|
—
|
|
—
|
|
—
|
|
550
|
|
—
|
|
550
|
|
—
|
|
550
|
|
||||||||
|
Utility Scale Solar
(a)
|
—
|
|
—
|
|
—
|
|
855
|
|
—
|
|
855
|
|
—
|
|
855
|
|
||||||||
|
Distributed Solar
|
—
|
|
—
|
|
—
|
|
5
|
|
—
|
|
5
|
|
—
|
|
5
|
|
||||||||
|
Total under construction
|
—
|
|
—
|
|
—
|
|
1,410
|
|
—
|
|
1,410
|
|
—
|
|
1,410
|
|
||||||||
(a) Includes
142
MW, representing
49%
of Agua Caliente's capacity, which was sold to a partner on January 18, 2012
In addition, the Company's thermal assets provide steam and chilled water capacity of approximately
1,170
megawatts thermal equivalent, or MWt, through its district energy business.
NRG sells power from its generation portfolio and offers capacity or similar products to retail electric providers and others, and providing ancillary services to support system reliability.
NRG's Retail Businesses arrange for the transmission and delivery of electricity to customers, bill customers, collect payments for electricity sold and maintain call centers to provide customer service. Based on metered locations, as of December 31, 2011, the Retail Businesses combined to serve approximately
2.1 million
residential, small business, commercial and industrial customers.
NRG was incorporated as a Delaware corporation on May 29, 1992. NRG's common stock is listed on the New York Stock Exchange under the symbol "NRG". The Company's headquarters and principal executive offices are located at 211 Carnegie Center, Princeton, New Jersey 08540. NRG's telephone number is (609) 524-4500. The address of the Company's website is
www.nrgenergy.com
. NRG's recent annual reports, quarterly reports, current reports, and other periodic filings are available free of charge through the Company's website.
118
Principles of Consolidation and Basis of Presentation
The Company's consolidated financial statements have been prepared in accordance with accounting principles generally accepted in the U.S., or U.S. GAAP. The Financial Accounting Standards Board, or FASB, Accounting Standards Codification, or ASC, is the source of authoritative U.S. GAAP to be applied by nongovernmental entities. In addition, the rules and interpretative releases of the SEC under authority of federal securities laws are also sources of authoritative U.S. GAAP for SEC registrants.
The consolidated financial statements include NRG's accounts and operations and those of its subsidiaries in which the Company has a controlling interest. All significant intercompany transactions and balances have been eliminated in consolidation. The usual condition for a controlling financial interest is ownership of a majority of the voting interests of an entity. However, a controlling financial interest may also exist through arrangements that do not involve controlling voting interests. As such, NRG applies the guidance of ASC 810,
Consolidations,
or ASC 810, to determine when an entity that is insufficiently capitalized or not controlled through its voting interests, referred to as a variable interest entity, or VIE, should be consolidated.
Cash and Cash Equivalents
Cash and cash equivalents include highly liquid investments with an original maturity of three months or less at the time of purchase.
Funds Deposited by Counterparties
Funds deposited by counterparties consist of cash held by NRG as a result of collateral posting obligations from the Company's counterparties with positions in NRG's hedging program. These amounts are segregated into separate accounts that are not contractually restricted but, based on the Company's intention, are not available for the payment of NRG's general corporate obligations. Depending on market fluctuations and the settlement of the underlying contracts, the Company will refund this collateral to the hedge counterparties pursuant to the terms and conditions of the underlying trades. Since collateral requirements fluctuate daily and the Company cannot predict if any collateral will be held for more than
twelve
months, the funds deposited by counterparties are classified as a current asset on the Company's balance sheet, with an offsetting liability for this cash collateral received within current liabilities. Changes in funds deposited by counterparties are closely associated with the Company's operating activities, and are classified as an operating activity in the Company's consolidated statements of cash flows.
Restricted Cash
Restricted cash consists primarily of funds held to satisfy the requirements of certain debt agreements and funds held within the Company's projects that are restricted in their use. These funds are used to pay for current operating expenses and current debt service payments as well as to fund required equity contributions, per the restrictions of the debt agreements.
Trade Receivables and Allowance for Doubtful Accounts
Trade receivables are reported in the balance sheet at outstanding principal adjusted for any write-offs and the allowance for doubtful accounts. For its Retail Businesses, the Company accrues an allowance for doubtful accounts based on estimates of uncollectible revenues by analyzing counterparty credit ratings (for commercial and industrial customers), historical collections, accounts receivable aging and other factors. These businesses write-off accounts receivable balances against the allowance for doubtful accounts when it determines a receivable is uncollectible.
Inventory
Inventory is valued at the lower of weighted average cost or market, and consists principally of fuel oil, coal and raw materials used to generate electricity or steam. The Company removes these inventories as they are used in the production of electricity or steam. Spare parts inventory is valued at a weighted average cost, since the Company expects to recover these costs in the ordinary course of business. The Company removes these inventories when they are used for repairs, maintenance or capital projects. Sales of inventory are classified as an operating activity in the consolidated statements of cash flows.
119
Property, Plant and Equipment
Property, plant and equipment are stated at cost; however impairment adjustments are recorded whenever events or changes in circumstances indicate that their carrying values may not be recoverable. NRG also classifies nuclear fuel related to the Company's
44%
ownership interest in South Texas Project, or STP, as part of the Company's property, plant, and equipment. Significant additions or improvements extending asset lives are capitalized as incurred, while repairs and maintenance that do not improve or extend the life of the respective asset are charged to expense as incurred. Depreciation other than nuclear fuel is computed using the straight-line method, while nuclear fuel is amortized based on units of production over the estimated useful lives. Certain assets and their related accumulated depreciation amounts are adjusted for asset retirements and disposals with the resulting gain or loss included in cost of operations in the consolidated statements of operations.
Asset Impairments
Long-lived assets that are held and used are reviewed for impairment whenever events or changes in circumstances indicate carrying values may not be recoverable. Such reviews are performed in accordance with ASC 360,
Property, Plant, and Equipment
, or ASC 360. An impairment loss is recognized if the total future estimated undiscounted cash flows expected from an asset are less than its carrying value. An impairment charge is measured by the difference between an asset's carrying amount and fair value with the difference recorded in operating costs and expenses in the statements of operations. Fair values are determined by a variety of valuation methods, including appraisals, sales prices of similar assets and present value techniques.
Investments accounted for by the equity method are reviewed for impairment in accordance with ASC 323,
Investments-Equity Method and Joint Ventures
, or ASC 323, which requires that a loss in value of an investment that is other than a temporary decline should be recognized. The Company identifies and measures losses in the value of equity method investments based upon a comparison of fair value to carrying value.
Discontinued Operations
Long-lived assets or disposal groups are classified as discontinued operations when all of the required criteria specified in ASC 360 are met. These criteria include, among others, existence of a qualified plan to dispose of an asset or disposal group, an assessment that completion of a sale within
one
year is probable and approval of the appropriate level of management. In addition, upon completion of the transaction, the operations and cash flows of the disposal group must be eliminated from ongoing operations of the Company, and the disposal group must not have any significant continuing involvement with the Company. Discontinued operations are reported at the lower of the asset's carrying amount or fair value less cost to sell. The Company had no discontinued operations for the three years ended December 31, 2011.
Project Development Costs and Capitalized Interest
Project development costs are expensed in the preliminary stages of a project and capitalized when the project is deemed to be commercially viable. Commercial viability is determined by one or a series of actions including among others, Board of Director approval pursuant to a formal project plan that subjects the Company to significant future obligations that can only be discharged by the use of a Company asset.
Interest incurred on funds borrowed to finance capital projects is capitalized, until the project under construction is ready for its intended use. The amount of interest capitalized for the years ended
December 31, 2011
,
2010
, and
2009
, was
$80 million
,
$36 million
, and
$37 million
, respectively.
When a project is available for operations, capitalized interest and project development costs are reclassified to property, plant and equipment and amortized on a straight-line basis over the estimated useful life of the project's related assets. Capitalized costs are charged to expense if a project is abandoned or management otherwise determines the costs to be unrecoverable.
Debt Issuance Costs
Debt issuance costs are capitalized and amortized as interest expense on a basis which approximates the effective interest method over the term of the related debt.
120
Intangible Assets
Intangible assets represent contractual rights held by NRG. The Company recognizes specifically identifiable intangible assets including customer contracts, customer relationships, energy supply contracts, marketing partnerships, development rights, trade names, emission allowances, and fuel contracts when specific rights and contracts are acquired. In addition, NRG also established values for emission allowances and power contracts upon adoption of Fresh Start reporting. These intangible assets are amortized based on expected volumes, expected delivery, expected discounted future net cash flows, straight line or units of production basis.
Intangible assets determined to have indefinite lives are not amortized, but rather are tested for impairment at least annually or more frequently if events or changes in circumstances indicate that such acquired intangible assets have been determined to have finite lives and should now be amortized over their useful lives. NRG had no intangible assets with indefinite lives recorded as of
December 31, 2011
.
Emission allowances held-for-sale, which are included in other non-current assets on the Company's consolidated balance sheet, are not amortized; they are carried at the lower of cost or fair value and reviewed for impairment in accordance with ASC 360.
Goodwill
In accordance with ASC 350,
Goodwill - Intangibles and Others
, or ASC 350, the Company recognizes goodwill for the excess cost of an acquired entity over the net value assigned to assets acquired and liabilities assumed. NRG performs goodwill impairment tests annually, during the fourth quarter, and when events or changes in circumstances indicate that the carrying value may not be recoverable.
In September 2011, the FASB issued ASU No. 2011-08,
Intangibles - Goodwill and Othe
r
(Topic 350) Testing Goodwill for Impairment
, or ASU No. 2011-08. The objective of ASU 2011-08 is to simplify how entities test goodwill for impairment. The amendments in ASU No. 2011-08 permit an entity to first assess qualitative factors to determine whether it is more likely than not that the fair value of a reporting unit is less than its carrying amount as a basis for determining whether it is necessary to perform the two-step goodwill impairment test described in Topic 350. The more-likely-than-not threshold is defined as having a likelihood of more than 50 percent. ASU No. 2011-08 is effective for annual and interim goodwill impairment tests performed in fiscal years beginning after December 15, 2011. Early adoption is permitted. The Company adopted the provisions of ASU No. 2011-08, effective January 1, 2011, with no impact on its results of operations, financial position or cash flows.
In the absence of sufficient qualitative factors, goodwill impairment is determined using a two step process:
|
|
Step one —
|
Identify potential impairment by comparing the fair value of a reporting unit to the book value, including goodwill. If the fair value exceeds book value, goodwill of the reporting unit is not considered impaired. If the book value exceeds fair value, proceed to step two.
|
|
|
Step two —
|
Compare the implied fair value of the reporting unit's goodwill to the book value of the reporting unit goodwill. If the book value of goodwill exceeds fair value, an impairment charge is recognized for the sum of such excess.
|
Income Taxes
NRG accounts for income taxes using the liability method in accordance with ASC 740,
Income Taxes
, or ASC 740, which requires that the Company use the asset and liability method of accounting for deferred income taxes and provide deferred income taxes for all significant temporary differences.
NRG has two categories of income tax expense or benefit — current and deferred, as follows:
|
•
|
Current income tax expense or benefit consists solely of tax less applicable tax credits, and
|
|
•
|
Deferred income tax expense or benefit is the change in the net deferred income tax asset or liability, excluding amounts charged or credited to accumulated other comprehensive income.
|
121
NRG reports some of the Company's revenues and expenses differently for financial statement purposes than for income tax return purposes, resulting in temporary and permanent differences between the Company's financial statements and income tax returns. The tax effects of such temporary differences are recorded as either deferred income tax assets or deferred income tax liabilities in the Company's consolidated balance sheets. NRG measures the Company's deferred income tax assets and deferred income tax liabilities using income tax rates that are currently in effect. A valuation allowance is recorded to reduce the Company's net deferred tax assets to an amount that is more-likely-than-not to be realized.
The Company accounts for uncertain tax positions in accordance with ASC 740, which applies to all tax positions related to income taxes. Under ASC 740, tax benefits are recognized when it is more-likely-than-not that a tax position will be sustained upon examination by the authorities. The benefit recognized from a position that has surpassed the more-likely-than-not threshold is the largest amount of benefit that is more than
50%
likely to be realized upon settlement. The Company recognizes interest and penalties accrued related to uncertain tax benefits as a component of income tax expense.
In accordance with ASC 805 and as discussed further in Note 19,
Income Taxes
, changes to existing net deferred tax assets or valuation allowances or changes to uncertain tax benefits, are recorded to income tax expense.
Revenue Recognition
Energy
— Both physical and financial transactions are entered into to optimize the financial performance of NRG's generating facilities. Electric energy revenue is recognized upon transmission to the customer. Physical transactions, or the sale of generated electricity to meet supply and demand, are recorded on a gross basis in the Company's consolidated statements of operations. Financial transactions, or the buying and selling of energy for trading purposes, are recorded net within operating revenues in the consolidated statements of operations in accordance with ASC 815,
Derivatives and Hedging
, or ASC 815.
Capacity
— Capacity revenues are recognized when contractually earned, and consist of revenues billed to a third party at either the market or a negotiated contract price for making installed generation capacity available in order to satisfy system integrity and reliability requirements.
Sale of Emission Allowances
— NRG records the Company's bank of emission allowances as part of the Company's intangible assets. From time to time, management may authorize the transfer of emission allowances in excess of usage from the Company's emission bank to intangible assets held-for-sale for trading purposes. NRG records the sale of emission allowances on a net basis within operating revenue in the Company's consolidated statements of operations.
Contract Amortization
— Assets and liabilities recognized from power sales agreements assumed at Fresh Start and through acquisitions related to the sale of electric capacity and energy in future periods for which the fair value has been determined to be significantly less (more) than market are amortized to revenue over the term of each underlying contract based on actual generation and/or contracted volumes.
Retail revenues
— Gross revenues for energy sales and services to retail customers are recognized upon delivery under the accrual method. Energy sales and services that have been delivered but not billed by period end are estimated. Gross revenues also includes energy revenues from resales of purchased power, which were
$186 million
and
$158 million
for the years ended December 31, 2011, and 2010, respectively, and
$251 million
for the eight-month period ended
December 31, 2009
. These revenues represent the sale of excess supply to third parties in the market.
Accrued unbilled revenues are based on estimates of customer usage since the date of the last meter reading provided by the independent system operators or electric distribution companies. Volume estimates are based on daily forecasted volumes and estimated customer usage by class. Unbilled revenues are calculated by multiplying these volume estimates by the applicable rate by customer class. Estimated amounts are adjusted when actual usage is known and billed. NRG recorded receivables for unbilled revenues of
$318 million
and
$282 million
as of
December 31, 2011
and
2010
, respectively, for retail energy sales and services.
122
Cost of Energy for Retail Operations
The cost of energy for electricity sales and services to retail customers is based on estimated supply volumes for the applicable reporting period. A portion of the cost of energy (
$87 million
and
$61 million
as of
December 31, 2011
, and
2010
, respectively) was accrued and consisted of estimated transmission and distribution charges not yet billed by the transmission and distribution utilities. In estimating supply volumes, the Company considers the effects of historical customer volumes, weather factors and usage by customer class. Transmission and distribution delivery fees are estimated using the same method used for electricity sales and services to retail customers. In addition, Independent System Operator, or ISO, fees are estimated based on historical trends, estimated supply volumes and initial Electric Reliability Council of Texas, or ERCOT, ISO settlements. Volume estimates are then multiplied by the supply rate and recorded as cost of operations in the applicable reporting period.
Derivative Financial Instruments
NRG accounts for derivative financial instruments under ASC 815,
Derivatives and Hedging
, or ASC 815, which requires the Company to record all derivatives on the balance sheet at fair value unless they qualify for a Normal Purchase Normal Sale, or NPNS, exception. Changes in the fair value of non-hedge derivatives are immediately recognized in earnings. Changes in the fair value of derivatives accounted for as hedges, if elected for hedge accounting, are either:
|
•
|
Recognized in earnings as an offset to the changes in the fair value of the related hedged assets, liabilities and firm commitments; or
|
|
•
|
Deferred and recorded as a component of accumulated OCI until the hedged transactions occur and are recognized in earnings.
|
NRG's primary derivative instruments are power sales contracts, fuels purchase contracts, other energy related commodities, and interest rate instruments used to mitigate variability in earnings due to fluctuations in market prices and interest rates. On an ongoing basis, NRG assesses the effectiveness of all derivatives that are designated as hedges for accounting purposes in order to determine that each derivative continues to be highly effective in offsetting changes in fair values or cash flows of hedged items. Internal analyses that measure the statistical correlation between the derivative and the associated hedged item determine the effectiveness of such an energy contract designated as a hedge. If it is determined that the derivative instrument is not highly effective as a hedge, hedge accounting will be discontinued prospectively. Hedge accounting will also be discontinued on contracts related to commodity price risk previously accounted for as cash flow hedges when it is probable that delivery will not be made against these contracts. In this case, the gain or loss previously deferred in accumulated OCI would be immediately reclassified into earnings. If the derivative instrument is terminated, the effective portion of this derivative deferred in accumulated OCI will be frozen until the underlying hedged item is delivered.
Revenues and expenses on contracts that qualify for the NPNS exception are recognized when the underlying physical transaction is delivered. While these contracts are considered derivative financial instruments under ASC 815, they are not recorded at fair value, but on an accrual basis of accounting. If it is determined that a transaction designated as NPNS no longer meets the scope exception, the fair value of the related contract is recorded on the balance sheet and immediately recognized through earnings.
NRG's trading activities are subject to limits in accordance with the Company's Risk Management Policy. These contracts are recognized on the balance sheet at fair value and changes in the fair value of these derivative financial instruments are recognized in earnings.
Foreign Currency Translation and Transaction Gains and Losses
The local currencies are generally the functional currency of NRG's foreign operations. Foreign currency denominated assets and liabilities are translated at end-of-period rates of exchange. Revenues, expenses, and cash flows are translated at the weighted-average rates of exchange for the period. The resulting currency translation adjustments are not included in the Company's statements of operations for the period, but are accumulated and reported as a separate component of stockholders' equity until sale or complete or substantially complete liquidation of the net investment in the foreign entity takes place. Foreign currency transaction gains or losses are reported within other income/(expense) in the Company's statements of operations. For the years ended
December 31, 2011
,
2010
, and
2009
, amounts recognized as foreign currency transaction gains (losses) were immaterial. The Company's cumulative translation adjustment balances as of
December 31, 2011
, and
2010
were
$72 million
and
$76 million
, respectively.
123
Concentrations of Credit Risk
Financial instruments which potentially subject NRG to concentrations of credit risk consist primarily of cash, trust funds, accounts receivable, notes receivable, derivatives, and investments in debt securities. Cash and cash equivalents and funds deposited by counterparties are predominantly held in money market funds invested in treasury securities, treasury repurchase agreements or government agency debt. Trust funds are held in accounts managed by experienced investment advisors. Certain accounts receivable, notes receivable, and derivative instruments are concentrated within entities engaged in the energy industry. These industry concentrations may impact the Company's overall exposure to credit risk, either positively or negatively, in that the customers may be similarly affected by changes in economic, industry or other conditions. Receivables and other contractual arrangements are subject to collateral requirements under the terms of enabling agreements. However, NRG believes that the credit risk posed by industry concentration is offset by the diversification and creditworthiness of the Company's customer base. See Note 5,
Fair Value of Financial Instruments,
for a further discussion of derivative concentrations.
Fair Value of Financial Instruments
The carrying amount of cash and cash equivalents, funds deposited by counterparties, receivables, accounts payables, and accrued liabilities approximate fair value because of the short-term maturity of these instruments. See Note 5,
Fair Value of Financial Instruments
for a further discussion of fair value of financial instruments.
Asset Retirement Obligations
NRG accounts for its asset retirement obligations, or AROs, in accordance with ASC 410-20,
Asset Retirement Obligations,
or ASC 410-20. Retirement obligations associated with long-lived assets included within the scope of ASC 410-20 are those for which a legal obligation exists under enacted laws, statutes, and written or oral contracts, including obligations arising under the doctrine of promissory estoppel, and for which the timing and/or method of settlement may be conditional on a future event. ASC 410-20 requires an entity to recognize the fair value of a liability for an ARO in the period in which it is incurred and a reasonable estimate of fair value can be made.
Upon initial recognition of a liability for an ARO, NRG capitalizes the asset retirement cost by increasing the carrying amount of the related long-lived asset by the same amount. Over time, the liability is accreted to its future value, while the capitalized cost is depreciated over the useful life of the related asset. See Note 13,
Asset Retirement Obligations,
for a further discussion of AROs.
Pensions
NRG offers pension benefits through either a defined benefit pension plan or a cash balance plan. In addition, the Company provides postretirement health and welfare benefits for certain groups of employees. NRG accounts for pension and other postretirement benefits in accordance with ASC 715,
Compensation — Retirement Benefits.
NRG recognizes the funded status of the Company's defined benefit plans in the statement of financial position and records an offset to other comprehensive income. In addition, NRG also recognizes on an after-tax basis, as a component of other comprehensive income, gains and losses as well as all prior service costs that have not been included as part of the Company's net periodic benefit cost. The determination of NRG's obligation and expenses for pension benefits is dependent on the selection of certain assumptions. These assumptions determined by management include the discount rate, the expected rate of return on plan assets and the rate of future compensation increases. NRG's actuarial consultants determine assumptions for such items as retirement age. The assumptions used may differ materially from actual results, which may result in a significant impact to the amount of pension obligation or expense recorded by the Company.
NRG measures the fair value of its pension assets in accordance with ASC 820,
Fair Value Measurements and Disclosures,
or ASC 820.
124
Stock-Based Compensation
NRG accounts for its stock-based compensation in accordance with ASC 718,
Compensation — Stock Compensation,
or ASC 718
.
The fair value of the Company's non-qualified stock options and performance units are estimated on the date of grant using the Black-Scholes option-pricing model and the Monte Carlo valuation model, respectively. NRG uses the Company's common stock price on the date of grant as the fair value of the Company's restricted stock units and deferred stock units. Forfeiture rates are estimated based on an analysis of NRG's historical forfeitures, employment turnover, and expected future behavior. The Company recognizes compensation expense for both graded and cliff vesting awards on a straight-line basis over the requisite service period for the entire award.
Investments Accounted for by the Equity Method
NRG has investments in various international and domestic energy projects. The equity method of accounting is applied to such investments in affiliates, which include joint ventures and partnerships, because the ownership structure prevents NRG from exercising a controlling influence over the operating and financial policies of the projects. Under this method, equity in pre-tax income or losses of domestic partnerships and, generally, in the net income or losses of international projects, are reflected as equity in earnings of unconsolidated affiliates.
Gross Receipts and Sales Taxes
In connection with its Retail Businesses, the Company records gross receipts taxes on a gross basis in revenues and cost of operations in its consolidated statements of operations. During the years ended
December 31, 2011
, 2010, and the eight-month period ended December 31, 2009, NRG's revenues and cost of operations included gross receipts taxes of
$64 million
,
$67 million
, and
$55 million
, respectively. Additionally, the Retail Businesses record sales taxes collected from their taxable customers and remitted to the various governmental entities on a net basis, thus, there is no impact on the Company's consolidated statement of operations.
Marketing and Advertising Costs
The Company expenses its advertising and marketing costs as incurred. The costs of tangible assets used in advertising campaigns are recorded as fixed assets or deferred advertising costs and amortized as advertising costs over the shorter of the useful life of the asset or the advertising campaign. The Company has several long-term sponsorship arrangements. Payments related to these arrangements are deferred and expensed over the term of the arrangement. Marketing and advertising expenses included within selling, general and administrative expense for the years ended December 31, 2011, 2010, and 2009 were
$127 million
,
$81 million
, and
$47 million
, respectively.
Business Combinations
The Company accounts for its business combinations in accordance with ASC 805,
Business Combinations,
or ASC 805. ASC 805 requires an acquirer to recognize and measure in its financial statements the identifiable assets acquired, the liabilities assumed, and any noncontrolling interest in the acquiree at fair value at the acquisition date. It also recognizes and measures the goodwill acquired or a gain from a bargain purchase in the business combination and determines what information to disclose to enable users of an entity's financial statements to evaluate the nature and financial effects of the business combination. In addition, transaction costs are expensed as incurred.
Use of Estimates
The preparation of financial statements in conformity with accounting principles generally accepted in the United States requires management to make estimates and assumptions that affect the reported amounts of assets and liabilities at the date of the financial statements, disclosure of contingent assets and liabilities at the date of the financial statements, and the reported amounts of revenues and expenses during the reporting period. Actual results could differ from these estimates.
In recording transactions and balances resulting from business operations, NRG uses estimates based on the best information available. Estimates are used for such items as plant depreciable lives, tax provisions, uncollectible accounts, actuarially determined benefit costs, and the valuation of energy commodity contracts, environmental liabilities, and legal costs incurred in connection with recorded loss contingencies, among others. In addition, estimates are used to test long-lived assets and goodwill for impairment and to determine the fair value of impaired assets. As better information becomes available or actual amounts are determinable, the recorded estimates are revised. Consequently, operating results can be affected by revisions to prior accounting estimates.
125
Reclassifications
Certain prior-year amounts have been reclassified for comparative purposes.
Recent Accounting Developments
ASU 2011-05
—
In June 2011, the FASB issued ASU No. 2011-05,
Comprehensive Income (Topic 220) Presentation of Comprehensive Income
, or ASU No. 2011-05, which was further amended by ASU No. 2011-12,
Comprehensive Income (Topic 220) Deferral of the Effective Date for Amendments to the Presentation of Reclassifications of Items Out of Accumulated Other Comprehensive Income in Accounting Standards Update No. 2011-05,
issued in December 2011. The amendments in ASU No. 2011-05 require the Company to present the total of comprehensive income, the components of net income and the components of other comprehensive income either in a single statement of comprehensive income or in two separate but consecutive statements. The Company is required to present, in either option, each component of net income, total net income, each component of other comprehensive income, total other comprehensive income and total comprehensive income. The provisions of ASU No. 2011-05 are required to be adopted retroactively. The Company will adopt the provisions of ASU No. 2011-05 on January 1, 2012. As this guidance provides only presentation requirements, the adoption of this standard will not impact the Company's results of operations, cash flows or financial position.
ASU 2011-11
—
In December 2011, the FASB issued ASU No. 2011-11,
Balance Sheet (Topic 210) Disclosures about Offsetting Assets and Liabilities
, or ASU No. 2011-11. The guidance provides enhanced disclosure requirements to evaluate the effect or potential effect of netting arrangements on an entity's financial position by improving information about financial instruments and derivative instruments that either (1) offset in accordance with either ASC 210-20-45 or ASC 810-20-45 or (2) are subject to an enforceable master netting arrangement or similar agreement, irrespective of whether they are offset. Reporting entities will be required to disclose both gross and net information about both instruments and transactions eligible for offset in the statement of financial position and instruments and transactions subject to an agreement similar to a master netting arrangement. The disclosures required by ASU No. 2011-10 are required to be adopted retroactively. ASU No. 2011-11 is effective for annual and interim periods in fiscal years beginning on or after January 1, 2013, and early adoption is permitted. As this guidance provides only disclosure requirements, the adoption of this standard will not impact the Company's results of operations, cash flows or financial position.
126
2011 Acquisitions
Energy Plus
—
On September 30, 2011, NRG acquired Energy Plus Holdings LLC, or Energy Plus, for
$194 million
in cash, net of
$5 million
cash acquired, funded from cash on hand. Energy Plus is a retail electricity provider with
188,000
customers as of December 31, 2011, a Northeast concentration and a unique sales channel involving exclusive loyalty and affinity program partnerships. Energy Plus will be run as a standalone retail business within NRG. The acquisition was recorded as a business combination under ASC 805, with identifiable assets acquired and liabilities assumed provisionally recorded at their estimated fair values on the acquisition date. The purchase price was primarily allocated to customer relationships of
$63 million
, marketing partnerships of
$88 million
, trade names of
$10 million
and goodwill of
$29 million
. The initial accounting for the business combination is not complete because the evaluations necessary to assess the fair values of certain net assets acquired and the amount of goodwill to be recognized are still in process. The provisional amounts are subject to revision until the evaluations are completed to the extent that additional information is obtained about the facts and circumstances that existed as of the acquisition date. Any changes to the fair value assessments will affect the acquisition-date fair value of goodwill. The factors that resulted in goodwill arising from the acquisition include the revenues associated with expanding the Energy Plus retail business and its unique sales channel in new regions, expanding its loyalty and affinity program partnerships and the synergies associated with combining the business with NRG's generation assets.
The provisional fair values of the intangible assets and liabilities at the acquisition date were measured primarily based on significant inputs that are not observable in the market and thus represent a Level 3 measurement as defined in ASC 820. Significant inputs were as follows:
|
•
|
Customer relationships
—
The customer relationships, which reflect Energy Plus' residential and commercial customer base, were valued using a variation of the income approach. Under this approach, the present value of expected future cash flows resulting from the existing customer relationships, considering attrition and charges for contributory assets (such as net working capital, fixed assets, workforce and trade names) utilized in the business were estimated and then discounted at an integrated utility peer group's weighted average cost of capital adjusted to be consistent with the risk inherent in the cash flows. The customer relationships are amortized to depreciation and amortization expense, over a weighted-average amortization period of
five
years, based on the expected discounted future net cash flows by year.
|
|
•
|
Loyalty and affinity program partnerships
—
The marketing partnerships, which reflect Energy Plus' loyalty and affinity program partnerships, were valued using a variation of the income approach. These partnerships are based on contractual relationships typically structured for three to five year periods with options for renewal. Under this approach, the present value of expected future cash flows resulting from the existing marketing partnerships, including renewal expectations and charges for contributory assets (such as working capital, fixed assets, marketing costs, workforce and trade names) utilized in the business, were estimated and then discounted at an integrated utility peer group's weighted average cost of capital adjusted to be consistent with the risk inherent in the cash flows. The marketing partnerships are amortized to depreciation and amortization expense, over a weighted-average amortization period of
18
years, based on the expected discounted net cash flows by year.
|
|
•
|
Trade names
—
The trade names were valued using a “relief from royalty” method, an approach under which fair value is estimated to be the present value of royalties saved because NRG owns the intangible asset and therefore does not have to pay a royalty for its use. The avoided royalty revenues were discounted at an integrated utility peer group's weighted average cost of capital adjusted to be consistent with the risk inherent in the cash flows. The remaining useful life of the trade names were determined by considering various factors, such as turnover and name changes in the independent power producer and utility industries, the current age of the Energy Plus brand, management's intent to continue using the name at the current time, and feedback from external consultants regarding their experience with similar trade names. The trade names are amortized to depreciation and amortization expense, on a straight-line basis, over
five
years.
|
127
Solar Acquisitions
—
During the year ended
December 31, 2011
, NRG acquired stakes in
three
Utility Scale Solar facilities for approximately
$165 million
in cash consideration, as part of the Company's initiative to capture opportunities for future growth in renewables. During 2011, subsequent to the acquisition dates, NRG made capital contributions into these projects of
$420 million
. In addition, NRG has a commitment to contribute additional amounts into the projects, comprised of
$216 million
in restricted cash and
$815 million
in letters of credit as of
December 31, 2011
. The Company may increase its letters of credit to replace the restricted cash at its discretion. In addition, the projects had
$49 million
in restricted cash for various agreements. NRG's minority partners had contributed approximately
$29 million
of equity during 2011, subsequent to the acquisition date, and had additional equity commitments of
$115 million
as of
December 31, 2011
. These acquisitions were recorded as business combinations under ASC 805, with identifiable assets acquired and liabilities assumed provisionally recorded at their estimated fair values on the acquisition date.
The acquisitions of these three solar facilities are further described below:
California Valley Solar Ranch
—
On September 30, 2011, NRG Solar LLC, a wholly-owned subsidiary of NRG, acquired
100%
of the
250
MW California Valley Solar Ranch project, or CVSR, in eastern San Luis Obispo County, California. Power generated from CVSR will be sold to Pacific Gas and Electric under a
25
year Power Purchase Agreement, or PPA. In connection with the acquisition, High Plains Ranch II, LLC, a wholly-owned subsidiary of NRG, entered into the California Valley Solar Ranch Financing Agreement with the Federal Financing Bank, or FFB, which is guaranteed by the United States Department of Energy, or U.S. DOE, to borrow up to
$1.2 billion
to fund the costs of constructing this solar facility, or the CVSR Financing Agreement. The terms of the borrowings, which are non-recourse to NRG, are described further in
Note 12
,
Debt and Capital Leases
. The Company continues to work with its partners and the U.S. DOE to satisfy all of the U.S. DOE loan disbursement requirements and funding is anticipated by the end of the first quarter of 2012. Operations are expected to commence in phases beginning in the third quarter of 2012 through the fourth quarter of 2013.
Agua Caliente
—
On August 5, 2011, NRG, through its wholly-owned subsidiary, NRG Solar PV LLC, acquired
100%
of the
290
MW Agua Caliente solar project, or Agua Caliente, in Yuma, AZ. Operations are scheduled to commence in phases beginning in the third quarter of 2012 through the first quarter of 2014. Power generated from Agua Caliente will be sold to Pacific Gas and Electric under a
25
year PPA. In connection with the acquisition, Agua Caliente Solar, LLC, a wholly-owned subsidiary of NRG, entered into the Agua Caliente Financing Agreement with the FFB, which is guaranteed by the U.S. DOE, to borrow up to
$967 million
to fund the construction of this solar facility, or the Agua Caliente Financing Agreement. The terms of the borrowings, which are non-recourse to NRG, are described further in
Note 12
,
Debt and Capital Leases
.
In addition, on January 18, 2012, the Company completed the sale of a
49%
interest in NRG Solar AC Holdings LLC, the indirect owner of the Agua Caliente project entity, to MidAmerican Energy Holdings Company, or MidAmerican. A portion of the cash consideration received at closing represented
49%
of construction costs funded by NRG's equity contributions. MidAmerican will fund its proportionate share of future equity contributions and other credit support for the project. NRG will continue to hold a majority interest in the project, which will continue to be consolidated. MidAmerican's non-controlling interest on the Company's balance sheet will represent the fair value of their capital contributions.
Ivanpah
—
On April 5, 2011, NRG acquired a
50.1%
stake in the
392
MW Ivanpah Solar Electric Generation System, or Ivanpah, from BrightSource Energy, Inc., or BSE. BSE maintained a
21.8%
interest in Ivanpah and the remaining
28.1%
was acquired by a wholly-owned subsidiary of Google. Ivanpah is composed of
three
separate facilities - Ivanpah 1 (
126
MW), Ivanpah 2 (
133
MW), and Ivanpah 3 (
133
MW), all of which are expected to be fully operational by the end of 2013. Power generated from Ivanpah will be sold to Southern California Edison and Pacific Gas and Electric, under multiple
20
to
25
year PPAs. The non-controlling interest represents the fair value of the capital contributions from the minority investors in Ivanpah. Ivanpah has entered into the Ivanpah Credit Agreement with the FFB, which is guaranteed by the U.S. DOE, to borrow up to
$1.6 billion
to fund the construction of this solar facility, or the Ivanpah Credit Agreement. The terms of the borrowings, which are non-recourse to NRG, are described further in
Note 12
,
Debt and Capital Leases
.
128
The purchase price for these acquisitions, considered business combinations, was provisionally allocated as follows:
|
(In millions)
|
|||
|
Assets
|
|||
|
Restricted cash
|
$
|
25
|
|
|
Property, plant and equipment
|
767
|
|
|
|
Other current and non-current assets
|
35
|
|
|
|
Total assets
|
$
|
827
|
|
|
Liabilities
|
|||
|
Accrued expenses
|
$
|
489
|
|
|
Long-term debt
|
4
|
|
|
|
Other non-current liabilities
|
15
|
|
|
|
Total liabilities
|
508
|
|
|
|
Less: Non-controlling interest (Ivanpah)
|
154
|
|
|
|
Net assets acquired
|
$
|
165
|
|
Significant considerations in determining fair value measurements as defined in ASC 820 of the assets acquired and liabilities assumed are as follows:
|
•
|
Property, plant & equipment
—
The fair values of property, plant and equipment acquired were valued utilizing the cost approach. Under this approach, the fair value approximates the current cost of replacing an asset with another of equivalent economic utility adjusted for functional obsolescence and physical depreciation. The assets acquired have been classified as construction in progress and will commence depreciation upon the commercial operation date of each respective facility.
|
|
•
|
Power purchase agreements
—
The fair values of the power purchase agreements acquired were determined utilizing a variation of the income approach and were determined to be
zero
for each facility. Under this approach, the expected future cash flows resulting from the acquired power purchase agreements, considering operating costs of the solar facility and charges for contributory assets utilized in the business, including working capital and property, plant and equipment were estimated and then discounted to present value at the weighted average cost of capital of an integrated utility peer group adjusted for project-specific financing attributes. Charges for contributory assets are largely driven by costs incurred to construct the facilities under the related Engineering, Procurement & Construction, or EPC, agreements. Since the expected contracted revenues to be recognized over the term of the acquired PPAs are largely offset by the costs to operate the facility and a return of and on the investment in the property, plant and equipment, the acquisition date fair value for each of these PPAs was determined to be
zero
. To corroborate this outcome, the Company examined available market data and concluded that an appropriate benchmark for fair value of the acquired PPAs would be a similar PPA with a delivery date consistent with the expected commercial operations date of each facility, which would likely have been negotiated during the same period as the PPAs acquired. Accordingly, the acquired PPAs are considered to be at market, which is consistent with the outcome of the income approach.
|
129
2010 Acquisitions
The Company made several acquisitions in 2010, which were recorded as business combinations under ASC 805. Those acquisitions for which purchase accounting was not finalized as of December 31, 2010, are briefly summarized below. See
Note 3
,
Business Acquisitions and Dispositions
and
Note 12
,
Debt and Capital Leases
, in the Company's 2010 Form 10-K for additional information related to these acquisitions.
Green Mountain Energy
—
On November 5, 2010, NRG acquired Green Mountain Energy for
$357 million
in cash, net of
$75 million
cash acquired, funded from cash on hand. The acquisition was recorded as a business combination under ASC 805, with identifiable assets acquired and liabilities assumed provisionally recorded at their estimated fair values on the acquisition date. The purchase price was primarily allocated to customer relationships of
$158 million
, trade names of
$130 million
, favorable commercial customer contracts of
$54 million
, net deferred tax liabilities of
$78 million
, net derivative liabilities of
$60 million
, and goodwill of
$155 million
. The factors that resulted in goodwill arising from the acquisition include the revenues associated with expanding the Green Mountain Energy business of providing renewable energy products and services to new customers in new regions and through new providers and the synergies associated with combining a renewable retail business with NRG's renewable generation assets. The accounting for the Green Mountain Energy acquisition was completed as of September 30, 2011, at which point the provisional fair values became final with no material changes.
Cottonwood
—
On November 15, 2010, NRG acquired the Cottonwood Generating Station, or Cottonwood, a
1,265
MW combined cycle natural gas plant in the Entergy zone of east Texas for
$507 million
in cash, funded from cash on hand. The acquisition was recorded as a business combination under ASC 805 and the purchase price was allocated to the assets acquired and liabilities assumed, which were recorded at provisional fair value on the acquisition date. The purchase price was primarily allocated to fixed assets. The accounting for the Cottonwood acquisition was completed as of March 31, 2011, at which point the provisional fair values became final with no material changes.
2010 Disposition
Padoma
—
On January 11, 2010, NRG sold its terrestrial wind development company, Padoma Wind Power LLC, or Padoma to Enel North America, Inc. NRG recognized a gain on the sale of Padoma of
$23 million
, which was recorded as a component of operating income in the statement of operation during the year ended December 31, 2010.
2009 Disposition
MIBRAG
—
On June 10, 2009, NRG completed the sale of its
50%
ownership interest in MIBRAG, which owned and managed a coal mining operation,
three
lignite-fueled power generation facilities and other related businesses in Germany. For its share, NRG received
€203 million
(
$284 million
), net of transaction costs, and recognized an after-tax gain of
$128 million
for the year ended December 31, 2009. In addition, NRG entered into a foreign currency forward contract to hedge the impact of exchange rate fluctuations on the sale proceeds. and recorded an exchange loss of
$24 million
on the contract within Other (loss)/income, net for the year ended December 31, 2009.
130
Nuclear Innovation North America LLC, or NINA, which is majority-owned by NRG, was established in May 2008 to focus on marketing, siting, developing, financing and investing in new advanced design nuclear projects in select markets across North America, including the planned South Texas Project Units 3 and 4 Project, or STP 3 & 4. Toshiba America Nuclear Energy Corporation, or TANE, a wholly-owned subsidiary of Toshiba Corporation, is the minority owner of NINA. NINA is a bankruptcy remote entity under NRG's corporate structure and designated as an Excluded Project Subsidiary under NRG's 2011 Senior Credit Facility and senior unsecured notes, which require that NRG not be obligated to contribute any capital to service NINA's debt or fund the repayment of any NINA debt in the event of a default. Furthermore, NRG is not required to continue the funding of NINA and any capital provided to NINA by any other equity partner could result in the dilution of NRG's equity interest.
On March 11, 2011, Japan was hit by a devastating earthquake and tsunami which, in turn, triggered a nuclear incident at the Fukushima Daiichi Nuclear Power Station owned by The Tokyo Electric Power Company of Japan, Inc., or TEPCO. The nuclear incident in Japan introduced multiple and substantial uncertainties around new nuclear development in the United States and the availability of debt and equity financing to NINA. Consequently, NINA announced, on March 21, 2011, that it was reducing the scope of development at the STP 3 & 4 expansion to allow time for the U.S. Nuclear Regulatory Commission, or NRC, and other nuclear stakeholders to assess the impacts from the events in Japan. NINA suspended indefinitely all detailed engineering work and other pre-construction activities and, as a result, dramatically reduced the project workforce. The decision to reduce the scope of activities was made jointly by NINA, NRG and Toshiba. Further, on April 19, 2011, NRG announced that, while it will cooperate with and support its current partners and any prospective future partners in attempting to develop STP 3 & 4 successfully, NRG was withdrawing from further financial participation in NINA's development of STP 3 & 4. NINA, going forward, will be focused solely on securing a combined operating license from the NRC and on obtaining the loan guarantee from the U.S. DOE,
two
items that are essential to the success of any future project development. TANE agreed, for the time being, to assume responsibility for NINA's ongoing costs associated with continuation of the licensing process.
Due to the events described above, NRG evaluated its investment in NINA for impairment. As part of this process, NRG evaluated the contractual rights and economic interests held by the various stakeholders in NINA, and concluded that while it continues to hold majority legal ownership, NRG ceased to have a controlling financial interest in NINA at the end of the first quarter of 2011. Consequently, NRG deconsolidated NINA as of March 31, 2011, in accordance with ASC 810. This resulted in the removal of the following amounts from NRG's consolidated balance sheet:
$930 million
of construction in progress;
$154 million
of accounts payable and accrued expenses;
$297 million
of long-term debt;
$17 million
of non-controlling interest; and
$19 million
of other assets and liabilities. Furthermore, NRG assessed the impact of the diminished prospects for the STP 3 & 4 project on the fair value of NINA's assets relative to NINA's existing liabilities as well as NINA's potential contingent liabilities. Based on this assessment, the Company concluded it was remote that NRG would recover any portion of the carrying amount of its equity investment in NINA and, consequently, recorded an impairment charge of
$481 million
as of March 31, 2011 for the full amount of its investment. In concurrence with the substantial reduction in NINA's project workforce, and to support NINA's reduced scope of work, NRG contributed an additional
$14 million
during the remainder of 2011, bringing the total impairment charge to
$495 million
for the year ended
December 31, 2011
. NRG expects to incur additional one-time costs, related to contributions to NINA in future periods, of up to
$6 million
, bringing these total expected costs to
$20 million
. These additional contributions are expensed as incurred to "Impairment charge on investment." This impairment charge included net assets contributed from all of NINA's equity investors, both NRG and TANE, which the Company previously consolidated.
As part of a
March 1, 2010
, settlement of litigation with CPS Energy, or CPS, NRG had agreed to pay
$80 million
to CPS, subject to the U.S. DOE's approval of a fully executed term sheet for a conditional U.S. DOE loan guarantee for STP 3 & 4. NRG also had agreed to donate an additional
$10 million
, unconditionally, over
four
years in annual payments of
$2.5 million
to the Residential Energy Assistance Partnership, or REAP, in San Antonio. Payments of
$5 million
were made to REAP through December 31, 2011. As a result of the events stemming from the nuclear incident in Japan, the Company no longer believes it probable that the conditional U.S. DOE loan guarantee will be received or accepted. Therefore, as of March 31, 2011, the Company reversed the
$80 million
contingent liability to CPS previously recorded within other current liabilities, along with the
$80 million
of associated amounts capitalized to construction in progress within property, plant and equipment. At
December 31, 2011
,
$5 million
in liabilities remains on the condensed consolidated balance sheet for the obligations to REAP.
131
For cash and cash equivalents, funds deposited by counterparties, restricted cash, cash collateral paid and received in support of energy risk management activities, and restricted cash supporting the funded letter of credit facility, the carrying amount approximates fair value because of the short-term maturity of those instruments. Debt securities, equity securities, trust fund investments, which are comprised of various U.S. debt and equity securities, and derivative assets and liabilities are carried at fair market value.
The estimated carrying values and fair values of NRG's recorded financial instruments not carried at fair market value are as follows:
|
|
As of December 31,
|
||||||||||||||
|
2011
|
2010
|
||||||||||||||
|
|
Carrying Amount
|
Fair Value
|
Carrying Amount
|
Fair Value
|
|||||||||||
|
|
(In millions)
|
||||||||||||||
|
Assets
|
|||||||||||||||
|
Notes receivable
|
$
|
156
|
|
$
|
161
|
|
$
|
177
|
|
$
|
190
|
|
|||
|
Liabilities
|
|||||||||||||||
|
Long-term debt, including current portion
|
9,729
|
|
9,716
|
|
9,104
|
|
9,236
|
|
|||||||
|
Funded letter of credit
|
—
|
|
—
|
|
1,300
|
|
1,295
|
|
|||||||
The fair value of notes receivable, debt securities and certain long-term debt are based on expected future cash flows discounted at market interest rates. The fair value of the remaining long-term debt and the funded letter of credit is based on quoted market prices for these instruments that are publicly traded, or estimated based on the income approach valuation technique for non-publicly traded debt using current interest rates for similar instruments with equivalent credit quality.
Fair Value Accounting under ASC 820
ASC 820 establishes a fair value hierarchy that prioritizes the inputs to valuation techniques used to measure fair value into three levels as follows:
|
•
|
Level 1 — quoted prices (unadjusted) in active markets for identical assets or liabilities that the Company has the ability to access as of the measurement date. NRG's financial assets and liabilities utilizing Level 1 inputs include active exchange-traded securities, energy derivatives, and trust fund investments.
|
|
•
|
Level 2 — inputs other than quoted prices included within Level 1 that are directly observable for the asset or liability or indirectly observable through corroboration with observable market data. NRG's financial assets and liabilities utilizing Level 2 inputs include fixed income securities, exchange-based derivatives, and over the counter derivatives such as swaps, options and forward contracts.
|
|
•
|
Level 3 — unobservable inputs for the asset or liability only used when there is little, if any, market activity for the asset or liability at the measurement date. NRG's financial assets and liabilities utilizing Level 3 inputs include infrequently-traded, non-exchange-based derivatives and commingled investment funds, and are measured using present value pricing models.
|
In accordance with ASC 820, the Company determines the level in the fair value hierarchy within which each fair value measurement in its entirety falls, based on the lowest level input that is significant to the fair value measurement in its entirety.
132
Recurring Fair Value Measurements
For cash and cash equivalents, funds deposited by counterparties, restricted cash, cash collateral paid and received in support of energy risk management activities, and restricted cash supporting the funded letter of credit facility, the carrying amount approximates fair value because of the nature and short-term maturity of those instruments and are classified as Level 1 within the fair value hierarchy.
The following tables present assets and liabilities measured and recorded at fair value on the Company's consolidated balance sheet on a recurring basis and their level within the fair value hierarchy:
|
|
As of December 31, 2011
|
||||||||||||||
|
|
Fair Value
|
||||||||||||||
|
|
Level 1
|
Level 2
|
Level 3
|
Total
|
|||||||||||
|
|
(In millions)
|
||||||||||||||
|
Investment in available-for-sale securities (classified within other non-current assets):
|
|
||||||||||||||
|
Debt securities
|
$
|
—
|
|
$
|
—
|
|
$
|
7
|
|
$
|
7
|
|
|||
|
Marketable equity securities
|
1
|
|
—
|
|
—
|
|
1
|
|
|||||||
|
Trust fund investments:
|
|
||||||||||||||
|
Cash and cash equivalents
|
2
|
|
—
|
|
—
|
|
2
|
|
|||||||
|
U.S. government and federal agency obligations
|
44
|
|
—
|
|
—
|
|
44
|
|
|||||||
|
Federal agency mortgage-backed securities
|
—
|
|
63
|
|
—
|
|
63
|
|
|||||||
|
Commercial mortgage-backed securities
|
—
|
|
7
|
|
—
|
|
7
|
|
|||||||
|
Corporate debt securities
|
—
|
|
54
|
|
—
|
|
54
|
|
|||||||
|
Equity securities
|
209
|
|
—
|
|
42
|
|
251
|
|
|||||||
|
Foreign government fixed income securities
|
—
|
|
4
|
|
—
|
|
4
|
|
|||||||
|
Derivative assets:
|
|
|
|||||||||||||
|
Commodity contracts
|
2,661
|
|
1,930
|
|
75
|
|
4,666
|
|
|||||||
|
Total assets
|
$
|
2,917
|
|
$
|
2,058
|
|
$
|
124
|
|
$
|
5,099
|
|
|||
|
Derivative liabilities:
|
|
||||||||||||||
|
Commodity contracts
|
$
|
2,757
|
|
$
|
1,283
|
|
$
|
67
|
|
$
|
4,107
|
|
|||
|
Interest rate contracts
|
—
|
|
108
|
|
—
|
|
108
|
|
|||||||
|
Total liabilities
|
$
|
2,757
|
|
$
|
1,391
|
|
$
|
67
|
|
$
|
4,215
|
|
|||
133
|
|
As of December 31, 2010
|
||||||||||||||
|
|
Fair Value
|
||||||||||||||
|
|
Level 1
|
Level 2
|
Level 3
|
Total
|
|||||||||||
|
|
(In millions)
|
||||||||||||||
|
Investment in available-for-sale securities (classified within other non-current assets):
|
|
|
|
||||||||||||
|
Debt securities
|
$
|
—
|
|
$
|
—
|
|
$
|
8
|
|
$
|
8
|
|
|||
|
Marketable equity securities
|
3
|
|
—
|
|
—
|
|
3
|
|
|||||||
|
Trust fund investments:
|
|
|
|
|
|
|
|
|
|||||||
|
Cash and cash equivalents
|
9
|
|
—
|
|
—
|
|
9
|
|
|||||||
|
U.S. government and federal agency obligations
|
27
|
|
—
|
|
—
|
|
27
|
|
|||||||
|
Federal agency mortgage-backed securities
|
—
|
|
57
|
|
—
|
|
57
|
|
|||||||
|
Commercial mortgage-backed securities
|
—
|
|
11
|
|
—
|
|
11
|
|
|||||||
|
Corporate debt securities
|
—
|
|
56
|
|
—
|
|
56
|
|
|||||||
|
Equity securities
|
213
|
|
—
|
|
39
|
|
252
|
|
|||||||
|
Foreign government fixed income securities
|
—
|
|
2
|
|
—
|
|
2
|
|
|||||||
|
Derivative assets:
|
|||||||||||||||
|
Commodity contracts
|
652
|
|
2,046
|
|
24
|
|
2,722
|
|
|||||||
|
Total assets
|
$
|
904
|
|
$
|
2,172
|
|
$
|
71
|
|
$
|
3,147
|
|
|||
|
Derivative liabilities:
|
|
|
|
|
|
|
|||||||||
|
Commodity contracts
|
$
|
660
|
|
$
|
1,251
|
|
$
|
51
|
|
$
|
1,962
|
|
|||
|
Interest rate contracts
|
—
|
|
88
|
|
—
|
|
88
|
|
|||||||
|
Total liabilities
|
$
|
660
|
|
$
|
1,339
|
|
$
|
51
|
|
$
|
2,050
|
|
|||
There have been
no
transfers during the year ended
December 31, 2011
, between Levels 1 and 2. The following tables reconcile, for the years ended
December 31, 2011
, and
2010
, the beginning and ending balances for financial instruments that are recognized at fair value in the consolidated financial statements at least annually using significant unobservable inputs:
|
|
For the Year Ended December 31, 2011
|
||||||||||||||
|
|
Fair Value Measurement Using Significant Unobservable Inputs (Level 3)
|
||||||||||||||
|
|
Debt
Securities
|
Trust Fund
Investments
|
Derivatives
(a)
|
Total
|
|||||||||||
|
|
(In millions)
|
||||||||||||||
|
Beginning balance as of January 1, 2011
|
$
|
8
|
|
$
|
39
|
|
$
|
(27
|
)
|
$
|
20
|
|
|||
|
Total gains and losses (realized/unrealized):
|
|
||||||||||||||
|
Included in OCI
|
(1
|
)
|
—
|
|
—
|
|
(1
|
)
|
|||||||
|
Included in earnings
|
—
|
|
—
|
|
28
|
|
28
|
|
|||||||
|
Included in nuclear decommissioning obligations
|
—
|
|
(6
|
)
|
—
|
|
(6
|
)
|
|||||||
|
Purchases
|
—
|
|
9
|
|
4
|
|
13
|
|
|||||||
|
Transfers into Level 3
(b)
|
—
|
|
—
|
|
(3
|
)
|
(3
|
)
|
|||||||
|
Transfers out of Level 3
(b)
|
—
|
|
—
|
|
6
|
|
6
|
|
|||||||
|
Ending balance as of December 31, 2011
|
$
|
7
|
|
$
|
42
|
|
$
|
8
|
|
$
|
57
|
|
|||
|
The amount of the total gains for the period included in earnings attributable to the change in unrealized gains relating to assets still held as of December 31, 2011
|
$
|
—
|
|
$
|
—
|
|
$
|
3
|
|
$
|
3
|
|
|||
134
|
|
For the Year Ended December 31, 2010
|
||||||||||||||
|
|
Fair Value Measurement Using Significant Unobservable Inputs (Level 3)
|
||||||||||||||
|
|
Debt
Securities
|
Trust Fund
Investments
|
Derivatives
(a)
|
Total
|
|||||||||||
|
|
(In millions)
|
||||||||||||||
|
Beginning balance as of January 1, 2010
|
$
|
9
|
|
$
|
37
|
|
$
|
(13
|
)
|
$
|
33
|
|
|||
|
Total gains and losses (realized/unrealized):
|
|
|
|
|
|||||||||||
|
Included in OCI
|
1
|
|
—
|
|
—
|
|
1
|
|
|||||||
|
Included in earnings
|
3
|
|
—
|
|
28
|
|
31
|
|
|||||||
|
Included in nuclear decommissioning obligations
|
—
|
|
2
|
|
—
|
|
2
|
|
|||||||
|
Purchases
|
—
|
|
—
|
|
(8
|
)
|
(8
|
)
|
|||||||
|
Sales
|
(5
|
)
|
—
|
|
—
|
|
(5
|
)
|
|||||||
|
Transfers into Level 3
(b)
|
—
|
|
—
|
|
(26
|
)
|
(26
|
)
|
|||||||
|
Transfer out of Level 3
(b)
|
—
|
|
—
|
|
(8
|
)
|
(8
|
)
|
|||||||
|
Ending balance as of December 31, 2010
|
$
|
8
|
|
$
|
39
|
|
$
|
(27
|
)
|
$
|
20
|
|
|||
|
The amount of the total gains for the period included in earnings attributable to the change in unrealized gains relating to assets still held as of December 31, 2010
|
$
|
—
|
|
$
|
—
|
|
$
|
5
|
|
$
|
5
|
|
|||
|
(a)
|
Consists of derivatives assets and liabilities, net.
|
|
(b)
|
Transfers in/out of Level 3 are related to the availability of external broker quotes, and are valued as of the end of the reporting period. All transfers in/out are with Level 2.
|
Realized and unrealized gains and losses included in earnings that are related to the energy derivatives are recorded in operating revenues and cost of operations.
Non-derivative fair value measurements
NRG's investments in debt securities are classified as Level 3 and consist of non-traded debt instruments that are valued based on third-party market value assessments.
The trust fund investments are held primarily to satisfy NRG's nuclear decommissioning obligations. These trust fund investments hold debt and equity securities directly and equity securities indirectly through commingled funds. The fair values of equity securities held directly by the trust funds are based on quoted prices in active markets and are categorized in Level 1. In addition, U.S. government and federal agency obligations are categorized as Level 1 because they trade in a highly liquid and transparent market. The fair values of corporate debt securities, are based on evaluated prices that reflect observable market information, such as actual trade information of similar securities, adjusted for observable differences and are categorized in Level 2. Certain equity securities, classified as commingled funds, are analogous to mutual funds, are maintained by investment companies, and hold certain investments in accordance with a stated set of fund objectives. The fair value of the equity securities classified as commingled funds are based on net asset values per fund share (the unit of account), derived from the quoted prices in active markets of the underlying equity securities. However, because the shares in the commingled funds are not publicly quoted, not traded in an active market and are subject to certain restrictions regarding their purchase and sale, the commingled funds are categorized in Level 3. See also Note 7,
Nuclear Decommissioning Trust Fund.
Derivative fair value measurements
A portion of NRG's contracts are exchange-traded contracts with readily available quoted market prices. The majority of NRG's contracts are non-exchange-traded contracts valued using prices provided by external sources, primarily price quotations available through brokers or over-the-counter and on-line exchanges. For the majority of NRG markets, the Company receives quotes from multiple sources. To the extent that NRG receives multiple quotes, the Company's prices reflect the average of the bid-ask mid-point prices obtained from all sources that NRG believes provide the most liquid market for the commodity. If the Company receives one quote, then the mid-point of the bid-ask spread for that quote is used. The terms for which such price information is available vary by commodity, region and product. A significant portion of the fair value of the Company's derivative portfolio is based on price quotes from brokers in active markets who regularly facilitate those transactions and the Company believes such price quotes are executable. The Company does not use third party sources that derive price based on proprietary models or market surveys. The remainder of the assets and liabilities represents contracts for which external sources or observable
135
market quotes are not available. These contracts are valued based on various valuation techniques including but not limited to internal models based on a fundamental analysis of the market and extrapolation of observable market data with similar characteristics. Contracts valued with prices provided by models and other valuation techniques make up
2%
of the total fair value of all derivative contracts. The fair value of each contract is discounted using a risk free interest rate. In addition, the Company applies a credit reserve to reflect credit risk which is calculated based on published default probabilities. To the extent that NRG's net exposure under a specific master agreement is an asset, the Company uses the counterparty's default swap rate. If the exposure under a specific master agreement is a liability, the Company uses NRG's default swap rate. The credit reserve is added to the discounted fair value to reflect the exit price that a market participant would be willing to receive to assume NRG's liabilities or that a market participant would be willing to pay for NRG's assets. As of December 31, 2011, the credit reserve resulted in a
$4 million
decrease in fair value which is composed of a
$2 million
loss in operating revenue and cost of operations and a
$2 million
decrease in OCI.
The fair values in each category reflect the level of forward prices and volatility factors as of
December 31, 2011
, and may change as a result of changes in these factors. Management uses its best estimates to determine the fair value of commodity and derivative contracts NRG holds and sells. These estimates consider various factors including closing exchange and over-the-counter price quotations, time value, volatility factors and credit exposure. It is possible, however, that future market prices could vary from those used in recording assets and liabilities from energy marketing and trading activities and such variations could be material.
Under the guidance of ASC 815, entities may choose to offset cash collateral paid or received against the fair value of derivative positions executed with the same counterparties under the same master netting agreements. The Company has chosen not to offset positions as defined in ASC 815. As of
December 31, 2011
, the Company recorded
$311 million
of cash collateral paid and
$258 million
of cash collateral received on its balance sheet.
Concentration of Credit Risk
In addition to the credit risk discussion as disclosed in Note 2,
Summary of Significant Accounting Policies
, the following item is a discussion of the concentration of credit risk for the Company's financial instruments. Credit risk relates to the risk of loss resulting from non-performance or non-payment by counterparties pursuant to the terms of their contractual obligations. The Company monitors and manages credit risk through credit policies that include: (i) an established credit approval process; (ii) a daily monitoring of counterparties' credit limits; (iii) the use of credit mitigation measures such as margin, collateral, prepayment arrangements, or volumetric limits (iv) the use of payment netting agreements; and (v) the use of master netting agreements that allow for the netting of positive and negative exposures of various contracts associated with a single counterparty. Risks surrounding counterparty performance and credit could ultimately impact the amount and timing of expected cash flows. The Company seeks to mitigate counterparty risk by having a diversified portfolio of counterparties. The Company also has credit protection within various agreements to call on additional collateral support if and when necessary. Cash margin is collected and held at NRG to cover the credit risk of the counterparty until positions settle.
As of
December 31, 2011
, counterparty credit exposure to a significant portion of the Company's counterparties was $
1.2 billion
and NRG held collateral (cash and letters of credit) against those positions of
$261 million
, resulting in a net exposure of
$919 million
. Counterparty credit exposure is discounted at the risk free rate. The following table highlights the counterparty credit quality and the net counterparty credit exposure by industry sector. Net counterparty credit exposure is defined as the aggregate net asset position for NRG with counterparties where netting is permitted under the enabling agreement and includes all cash flow, mark-to-market and NPNS, and non-derivative transactions. The exposure as of
December 31, 2011
is shown net of collateral held, and includes amounts net of receivables or payables.
|
Category
|
Net Exposure (a)
(% of Total)
|
|
|
Financial institutions
|
57
|
%
|
|
Utilities, energy merchants, marketers and other
|
39
|
|
|
Coal and emissions
|
1
|
|
|
ISOs
|
3
|
|
|
Total
|
100
|
%
|
136
|
Category
|
Net Exposure
(a)
(% of Total)
|
|
|
Investment grade
|
70
|
%
|
|
Non-rated
(b)
|
27
|
|
|
Non-Investment grade
|
3
|
|
|
Total
|
100
|
%
|
|
(a)
|
Counterparty credit exposure excludes uranium and coal transportation contracts because of the unavailability of market prices.
|
|
(b)
|
For non-rated counterparties, the majority of the exposure is related to ISO and municipal public power entities, which are considered investment grade equivalent ratings based on NRG's internal credit ratings.
|
NRG has counterparty credit risk exposure to certain counterparties representing more than
10%
of total net exposure discussed above and the aggregate of such counterparties was
$265 million
. Approximately
89%
of NRG's positions relating to this credit risk roll-off by the end of 2013. Changes in hedge positions and market prices will affect credit exposure and counterparty concentration. Given the credit quality, diversification and term of the exposure in the portfolio, NRG does not anticipate a material impact on the Company's financial position or results of operations from nonperformance by any of NRG's counterparties.
Counterparty credit exposure described above excludes credit risk exposure under certain long term agreements, including California tolling agreements, South Central load obligations, solar PPAs, and a coal supply agreement. As external sources or observable market quotes are not available to estimate such exposure, the Company valued these contracts based on various techniques including but not limited to internal models based on a fundamental analysis of the market and extrapolation of observable market data with similar characteristics. Based on these valuation techniques, as of
December 31, 2011
, credit risk exposure to these counterparties is approximately
$866 million
for the next five years. This amount excludes potential credit exposures for projects with long term PPAs that have not reached commercial operations. Many of these power contracts are with utilities or public power entities that have strong credit quality and specific public utility commission or other regulatory support. In the case of the coal supply agreement, NRG holds a lien against the underlying asset. These factors significantly reduce the risk of loss.
Retail Customer Credit Risk
NRG is exposed to retail credit risk through the Company's retail electricity providers, which serve C&I customers and the Mass market. Retail credit risk results when a customer fails to pay for services rendered. The losses may result from both nonpayment of customer accounts receivable and the loss of in-the-money forward value. NRG manages retail credit risk through the use of established credit policies that include monitoring of the portfolio, and the use of credit mitigation measures such as deposits or prepayment arrangements.
As of
December 31, 2011
, the Company's retail customer credit exposure to C&I customers was diversified across many customers and various industries, with a significant portion of the exposure with government entities.
NRG is also exposed to retail customer credit risk relating to its Mass customers, which may result in a write-off of bad debt. During 2011, the Company continued to experience improved customer payment behavior, but current economic conditions may affect the Company's customers' ability to pay bills in a timely manner, which could increase customer delinquencies and may lead to an increase in bad debt expense.
137
ASC 815 requires NRG to recognize all derivative instruments on the balance sheet as either assets or liabilities and to measure them at fair value each reporting period unless they qualify for a NPNS exception. NRG may elect to designate certain derivatives as cash flow hedges, if certain conditions are met, and defer the effective portion of the change in fair value of the derivatives to accumulated OCI, until the hedged transactions occur and are recognized in earnings. The ineffective portion of a cash flow hedge is immediately recognized in earnings.
For derivatives designated as hedges of the fair value of assets or liabilities, the changes in fair value of both the derivative and the hedged transaction are recorded in current earnings.
For derivatives that are not designated as cash flow hedges or do not qualify for hedge accounting treatment, the changes in the fair value will be immediately recognized in earnings. Certain derivative instruments may qualify for the NPNS exception and are therefore exempt from fair value accounting treatment. ASC 815 applies to NRG's energy related commodity contracts, interest rate swaps, and foreign exchange contracts.
As the Company engages principally in the trading and marketing of its generation assets and retail business, some of NRG's commercial activities qualify for hedge accounting. In order for the generation assets to qualify, the physical generation and sale of electricity should be highly probable at inception of the trade and throughout the period it is held, as is the case with the Company's baseload plants. For this reason, many trades in support of NRG's baseload units normally qualify for NPNS or cash flow hedge accounting treatment, and trades in support of NRG's peaking unit's asset optimization will generally not qualify for hedge accounting treatment, with any changes in fair value likely to be reflected on a mark-to-market basis in the statement of operations. Most of the retail load contracts either qualify for the NPNS exception or fail to meet the criteria for a derivative and the majority of the retail supply and fuels supply contracts are recorded under mark-to-market accounting. All of NRG's hedging and trading activities are subject to limits within the Company's Risk Management Policy.
Energy-Related Commodities
To manage the commodity price risk associated with the Company's competitive supply activities and the price risk associated with wholesale power sales from the Company's electric generation facilities and retail power sales from Retail Businesses, NRG enters into a variety of derivative and non-derivative hedging instruments, utilizing the following:
|
•
|
Forward contracts, which commit NRG to purchase or sell energy commodities or purchase fuels in the future.
|
|
•
|
Futures contracts, which are exchange-traded standardized commitments to purchase or sell a commodity or financial instrument.
|
|
•
|
Swap agreements, which require payments to or from counter-parties based upon the differential between two prices for a predetermined contractual, or notional, quantity.
|
|
•
|
Option contracts, which convey to the option holder the right but not the obligation to purchase or sell a commodity.
|
|
•
|
Extendable swaps, which include a combination of swaps and options executed simultaneously for different periods. This combination of instruments allows NRG to sell out-year volatility through call options in exchange for natural gas swaps with fixed prices in excess of the market price for natural gas at that time. The above-market swap combined with its later-year call option are priced in aggregate at market at the trade's inception.
|
|
•
|
Weather and hurricane derivative products used to mitigate a portion of Reliant Energy's lost revenue due to weather.
|
The objectives for entering into derivative contracts designated as hedges include:
|
•
|
Fixing the price for a portion of anticipated future electricity sales that provides an acceptable return on the Company's electric generation operations.
|
|
•
|
Fixing the price of a portion of anticipated fuel purchases for the operation of NRG's power plants.
|
|
•
|
Fixing the price of a portion of anticipated power purchases for the Company's retail sales.
|
As of
December 31, 2011
, NRG had cash flow hedge energy-related derivative financial instruments extending through December 2013.
138
NRG's trading and hedging activities are subject to limits within the Company's Risk Management Policy. These contracts are recognized on the balance sheet at fair value and changes in the fair value of these derivative financial instruments are recognized in earnings.
As of
December 31, 2011
, NRG had energy-related derivative financial instruments, and other energy-related contracts that did meet the definition of derivative instruments extending through December 2039. As of
December 31, 2011
, NRG's derivative assets and liabilities consisted primarily of the following:
|
•
|
Forward and financial contracts for the purchase/sale of electricity and related products economically hedging NRG's generation assets' forecasted output or NRG's retail load obligations through 2017.
|
|
•
|
Forward and financial contracts for the purchase of fuel commodities relating to the forecasted usage of NRG's generation assets through 2017.
|
Also, as of
December 31, 2011
, NRG had other energy-related contracts that qualified for the NPNS exception and were therefore exempt from fair value accounting treatment as follows:
|
•
|
Power sales and capacity contracts extending through 2025.
|
Also, as of
December 31, 2011
, NRG had other energy-related contracts that did not meet the definition of derivatives as follows:
|
•
|
Load-following forward electric sale contracts extending through 2026;
|
|
•
|
Power Tolling contracts through 2039;
|
|
•
|
Lignite purchase contract through 2018;
|
|
•
|
Power transmission contracts through 2015;
|
|
•
|
Natural gas transportation contracts and storage agreements through 2018; and
|
|
•
|
Coal transportation contracts through 2016.
|
Interest Rate Swaps
NRG is exposed to changes in interest rates through the Company's issuance of variable and fixed rate debt. In order to manage the Company's interest rate risk, NRG enters into interest rate swap agreements. As of
December 31, 2011
, NRG had interest rate derivative instruments on recourse debt extending through 2013 and on non-recourse debt extending through 2029, the majority of which are designated as cash flow hedges.
Volumetric Underlying Derivative Transactions
The following table summarizes the net notional volume buy/(sell) of NRG's open derivative transactions broken out by commodity, excluding those derivatives that qualified for the NPNS exception as of
December 31, 2011
, and
December 31, 2010
. Option contracts are reflected using delta volume. Delta volume equals the notional volume of an option adjusted for the probability that the option will be in-the-money at its expiration date.
|
|
|
Total Volume
|
||||||
|
Commodity
|
Units
|
December 31, 2011
|
December 31, 2010
|
|||||
|
|
|
(In millions)
|
||||||
|
Emissions
|
Short Ton
|
(2
|
)
|
—
|
|
|||
|
Coal
|
Short Ton
|
37
|
|
34
|
|
|||
|
Natural Gas
|
MMBtu
|
13
|
|
(175
|
)
|
|||
|
Oil
|
Barrel
|
1
|
|
1
|
|
|||
|
Power
|
MWh
|
4
|
|
5
|
|
|||
|
Capacity
|
MW/Day
|
—
|
|
(1
|
)
|
|||
|
Interest
|
Dollars
|
$
|
2,121
|
|
$
|
2,782
|
|
|
139
Fair Value of Derivative Instruments
The Company has elected to disclose derivative assets and liabilities on a trade-by-trade basis and does not offset amounts at the counterparty master agreement level. Also, collateral received or paid on the Company's derivative assets or liabilities are recorded on a separate line item on the balance sheet. The Company has chosen not to offset positions as permitted in ASC 815. As of
December 31, 2011
, the Company recorded
$311 million
of cash collateral paid and
$258 million
of cash collateral received on its balance sheet.
The following table summarizes the fair value within the derivative instrument valuation on the balance sheet:
|
|
Fair Value
|
||||||||||||||
|
|
Derivative Assets
|
Derivative Liabilities
|
|||||||||||||
|
(In millions)
|
December 31, 2011
|
December 31, 2010
|
December 31, 2011
|
December 31, 2010
|
|||||||||||
|
Derivatives Designated as Cash Flow or Fair Value Hedges
:
|
|
|
|
|
|||||||||||
|
Interest rate contracts current
|
$
|
—
|
|
$
|
—
|
|
$
|
39
|
|
$
|
17
|
|
|||
|
Interest rate contracts long-term
|
—
|
|
—
|
|
68
|
|
71
|
|
|||||||
|
Commodity contracts current
|
318
|
|
392
|
|
—
|
|
2
|
|
|||||||
|
Commodity contracts long-term
|
—
|
|
217
|
|
1
|
|
—
|
|
|||||||
|
Total Derivatives Designated as Cash Flow or Fair Value Hedges
|
318
|
|
609
|
|
108
|
|
90
|
|
|||||||
|
Derivatives Not Designated as Cash Flow or Fair Value Hedges
:
|
|
|
|
|
|||||||||||
|
Interest rate contracts long-term
|
—
|
|
—
|
|
1
|
|
—
|
|
|||||||
|
Commodity contracts current
|
3,898
|
|
1,572
|
|
3,712
|
|
1,666
|
|
|||||||
|
Commodity contracts long-term
|
450
|
|
541
|
|
394
|
|
294
|
|
|||||||
|
Total Derivatives Not Designated as Cash Flow or Fair Value Hedges
|
4,348
|
|
2,113
|
|
4,107
|
|
1,960
|
|
|||||||
|
Total Derivatives
|
$
|
4,666
|
|
$
|
2,722
|
|
$
|
4,215
|
|
$
|
2,050
|
|
|||
140
Accumulated Other Comprehensive Income
The following tables summarize the effects on NRG's accumulated OCI balance attributable to cash flow hedge derivatives, net of tax:
|
|
Year Ended December 31, 2011
|
||||||||||
|
|
Energy
Commodities
|
Interest
Rate
|
Total
|
||||||||
|
|
(In millions)
|
||||||||||
|
Accumulated OCI balance at December 31, 2010
|
$
|
488
|
|
$
|
(47
|
)
|
$
|
441
|
|
||
|
Reclassified from accumulated OCI to income:
|
|
|
|
||||||||
|
- Due to realization of previously deferred amounts
|
(374
|
)
|
12
|
|
(362
|
)
|
|||||
|
Mark-to-market of cash flow hedge accounting contracts
|
74
|
|
(21
|
)
|
53
|
|
|||||
|
Accumulated OCI balance at December 31, 2011, net of $87 tax
|
$
|
188
|
|
$
|
(56
|
)
|
$
|
132
|
|
||
|
Gains/(losses) expected to be realized from OCI during the next 12 months, net of $71 tax
|
$
|
145
|
|
$
|
(23
|
)
|
$
|
122
|
|
||
|
Gains recognized in income from the ineffective portion of cash flow hedges
|
$
|
28
|
|
$
|
3
|
|
$
|
31
|
|
||
|
|
Year Ended December 31, 2010
|
||||||||||
|
|
Energy
Commodities
|
Interest
Rate
|
Total
|
||||||||
|
|
(In millions)
|
||||||||||
|
Accumulated OCI balance at December 31, 2009
|
$
|
461
|
|
$
|
(55
|
)
|
$
|
406
|
|
||
|
Reclassified from accumulated OCI to income:
|
|
|
|
||||||||
|
- Due to realization of previously deferred amounts
|
(474
|
)
|
1
|
|
(473
|
)
|
|||||
|
Mark-to-market of cash flow hedge accounting contracts
|
501
|
|
7
|
|
508
|
|
|||||
|
Accumulated OCI balance at December 31, 2010, net of $268 tax
|
$
|
488
|
|
$
|
(47
|
)
|
$
|
441
|
|
||
|
Gains recognized in income from the ineffective portion of cash flow hedges
|
$
|
—
|
|
$
|
1
|
|
$
|
1
|
|
||
|
|
Year Ended December 31, 2009
|
||||||||||
|
|
Energy
Commodities
|
Interest
Rate
|
Total
|
||||||||
|
|
(In millions)
|
||||||||||
|
Accumulated OCI balance at December 31, 2008
|
$
|
406
|
|
$
|
(91
|
)
|
$
|
315
|
|
||
|
Reclassified from accumulated OCI to income:
|
|
||||||||||
|
- Due to realization of previously deferred amounts
|
(335
|
)
|
1
|
|
(334
|
)
|
|||||
|
- Due to discontinuance of cash flow hedge accounting
|
(137
|
)
|
—
|
|
(137
|
)
|
|||||
|
Mark-to-market of cash flow hedge accounting contracts
|
527
|
|
35
|
|
562
|
|
|||||
|
Accumulated OCI balance at December 31, 2009, net of $247 tax
|
$
|
461
|
|
$
|
(55
|
)
|
$
|
406
|
|
||
|
Gains/(losses) recognized in income from the ineffective portion of cash flow hedges
|
$
|
45
|
|
$
|
(4
|
)
|
$
|
41
|
|
||
Amounts reclassified from accumulated OCI into income and amounts recognized in income from the ineffective portion of cash flow hedges are recorded to operating revenue for commodity contracts and interest expense for interest rate contracts.
141
Accounting guidelines require a high degree of correlation between the derivative and the hedged item throughout the period in order to qualify as a cash flow hedge. As of July 31, 2011, the Company's regression analysis for natural gas prices to ERCOT power prices, while positively correlated, did not meet the required threshold for cash flow hedge accounting for calendar years 2011. As a result, the Company de-designated its 2011 ERCOT cash flow hedges as of July 31, 2011, and prospectively marked these derivatives to market through the income statement.
The following table summarizes the amount of unrealized gain/(loss) resulting from fair value hedges reflected in interest income/(expense) for interest rate contracts:
|
|
Year Ended December 31,
|
||||||||||
|
(In millions)
|
2011
|
2010
|
2009
|
||||||||
|
Derivative
|
$
|
—
|
|
$
|
(8
|
)
|
$
|
(6
|
)
|
||
|
Senior Notes (hedged item)
|
—
|
|
11
|
|
6
|
|
|||||
Impact of Derivative Instruments on the Statement of Operations
Unrealized gains and losses associated with changes in the fair value of derivative instruments not accounted for as cash flow hedges and ineffectiveness of hedge derivatives are reflected in current period earnings.
The following table summarizes the pre-tax effects of economic hedges that have not been designated as cash flow hedges, ineffectiveness on cash flow hedges, and trading activity on NRG's statement of operations. These amounts are included within operating revenues and cost of operations.
|
|
Year Ended December 31,
|
||||||||||
|
|
2011
|
2010
|
2009
|
||||||||
|
|
(In millions)
|
||||||||||
|
Unrealized mark-to-market results
|
|
|
|||||||||
|
Reversal of previously recognized unrealized losses/(gains) on settled positions related to economic hedges
|
$
|
54
|
|
$
|
(171
|
)
|
$
|
(68
|
)
|
||
|
Reversal of loss positions acquired as part of the Reliant Energy acquisition as of May 1, 2009
|
72
|
|
223
|
|
656
|
|
|||||
|
Reversal of previously recognized unrealized losses due to the termination of positions related to the CSRA unwind
|
—
|
|
—
|
|
80
|
|
|||||
|
Reversal of loss positions acquired as part of the Green Mountain Energy acquisition as of November 5, 2010
|
35
|
|
13
|
|
—
|
|
|||||
|
Net unrealized (losses)/gains on open positions related to economic hedges
|
(33
|
)
|
(153
|
)
|
22
|
|
|||||
|
Gains on ineffectiveness associated with open positions treated as cash flow hedges
|
28
|
|
—
|
|
45
|
|
|||||
|
Total unrealized mark-to-market gains/(losses) for economic hedging activities
|
156
|
|
(88
|
)
|
735
|
|
|||||
|
Reversal of previously recognized unrealized losses/(gains) on settled positions related to trading activity
|
21
|
|
68
|
|
(157
|
)
|
|||||
|
Net unrealized gains/(losses) on open positions related to trading activity
|
42
|
|
(5
|
)
|
(26
|
)
|
|||||
|
Total unrealized mark-to-market gains/(losses) for trading activity
|
63
|
|
63
|
|
(183
|
)
|
|||||
|
Total unrealized gains/(losses)
|
$
|
219
|
|
$
|
(25
|
)
|
$
|
552
|
|
||
142
|
|
Year Ended December 31,
|
||||||||||
|
|
2011
|
2010
|
2009
|
||||||||
|
|
(In millions)
|
||||||||||
|
Revenue from operations — energy commodities
|
$
|
388
|
|
$
|
(136
|
)
|
$
|
(290
|
)
|
||
|
Cost of operations
|
(169
|
)
|
111
|
|
842
|
|
|||||
|
Total impact to statement of operations
|
$
|
219
|
|
$
|
(25
|
)
|
$
|
552
|
|
||
Reliant Energy's loss positions were acquired as of May 1, 2009, and valued using forward prices on that date. Green Mountain Energy's loss positions were acquired as of November 5, 2010, and valued using forward prices on that date. The roll-off amounts were offset by realized losses at the settled prices and are reflected in the cost of operations during the same period.
For the year ended
December 31, 2011
, the
$33 million
loss from economic hedge positions was the result of a decrease in value of forward purchases and sales of natural gas, electricity and fuel due to a decrease in forward power and gas prices.
For the year ended
December 31, 2010
, the
$153 million
loss from economic hedge positions was the result of forward purchases and sales of natural gas, electricity and fuel due to decrease in forward power and gas prices.
Credit Risk Related Contingent Features
Certain of the Company's hedging agreements contain provisions that require the Company to post additional collateral if the counterparty determines that there has been deterioration in credit quality, generally termed "adequate assurance" under the agreements, or require the Company to post additional collateral if there were a one notch downgrade in the Company's credit rating. The collateral required for contracts that have adequate assurance clauses that are in net liability positions as of
December 31, 2011
, was
$69 million
. The collateral required for contracts with credit rating contingent features that are in a net liability position as of
December 31, 2011
, was
$35 million
. The Company is also a party to certain marginable agreements where NRG has a net liability position, but the counterparty has not called for the collateral due, which is approximately
$15 million
as of
December 31, 2011
.
See Note 5,
Fair Value of Financial Instruments,
for discussion regarding concentration of credit risk.
143
NRG's nuclear decommissioning trust fund assets, which are for the decommissioning of STP, are comprised of securities classified as available-for-sale and recorded at fair value based on actively quoted market prices. Although NRG is responsible for managing the decommissioning of its
44%
interest in STP, the predecessor utilities that owned STP are authorized by the Public Utility Commission of Texas, or PUCT, to collect decommissioning funds from their ratepayers to cover decommissioning costs on behalf of NRG. NRC requirements determine the decommissioning cost estimate which is the minimum required level of funding. In the event that funds from the ratepayers that accumulate in the nuclear decommissioning trust are ultimately determined to be inadequate to decommission the STP facilities, the utilities will be required to collect through rates charged to rate payers all additional amounts, with no obligation from NRG, provided that NRG has complied with PUCT rules and regulations regarding decommissioning trusts. Following completion of the decommissioning, if surplus funds remain in the decommissioning trusts, any excess will be refunded to the respective ratepayers of the utilities.
NRG accounts for the nuclear decommissioning trust fund in accordance with ASC 980,
Regulated Operations
, or ASC 980 because the Company's nuclear decommissioning activities are subject to approval by the PUCT, with regulated rates that are designed to recover all decommissioning costs and that can be charged to and collected from the ratepayers per PUCT mandate. Since the Company is in compliance with PUCT rules and regulations regarding decommissioning trusts and the cost of decommissioning is the responsibility of the Texas ratepayers, not NRG, all realized and unrealized gains or losses (including other-than-temporary impairments) related to the Nuclear Decommissioning Trust Fund are recorded to the Nuclear Decommissioning Trust Liability and are not included in net income or accumulated other comprehensive income, consistent with regulatory treatment.
The following table summarizes the aggregate fair values and unrealized gains and losses (including other-than-temporary impairments) for the securities held in the trust funds, as well as information about the contractual maturities of those securities.
|
|
As of December 31, 2011
|
As of December 31, 2010
|
|||||||||||||||||||||||||||
|
(In millions, except otherwise noted)
|
Fair
Value
|
Unrealized
Gains
|
Unrealized
Losses
|
Weighted-
average
maturities
(in years)
|
Fair
Value
|
Unrealized
Gains
|
Unrealized
Losses
|
Weighted-
average
maturities
(in years)
|
|||||||||||||||||||||
|
Cash and cash equivalents
|
$
|
2
|
|
$
|
—
|
|
$
|
—
|
|
—
|
|
$
|
9
|
|
$
|
—
|
|
$
|
—
|
|
—
|
|
|||||||
|
U.S. government and federal agency obligations
|
43
|
|
3
|
|
—
|
|
10
|
|
25
|
|
1
|
|
—
|
|
9
|
|
|||||||||||||
|
Federal agency mortgage-backed securities
|
63
|
|
3
|
|
—
|
|
23
|
|
57
|
|
2
|
|
—
|
|
24
|
|
|||||||||||||
|
Commercial mortgage-backed securities
|
7
|
|
—
|
|
—
|
|
28
|
|
11
|
|
—
|
|
—
|
|
29
|
|
|||||||||||||
|
Corporate debt securities
|
54
|
|
3
|
|
1
|
|
10
|
|
56
|
|
3
|
|
1
|
|
10
|
|
|||||||||||||
|
Equity securities
|
251
|
|
113
|
|
1
|
|
—
|
|
252
|
|
117
|
|
1
|
|
—
|
|
|||||||||||||
|
Foreign government fixed income securities
|
4
|
|
—
|
|
—
|
|
8
|
|
2
|
|
—
|
|
—
|
|
8
|
|
|||||||||||||
|
Total
|
$
|
424
|
|
$
|
122
|
|
$
|
2
|
|
|
|
$
|
412
|
|
$
|
123
|
|
$
|
2
|
|
|
|
|||||||
The following table summarizes proceeds from sales of available-for-sale securities and the related realized gains and losses from these sales. The cost of securities sold is determined on the specific identification method.
|
|
Year Ended December 31,
|
||||||||||
|
|
2011
|
2010
|
2009
|
||||||||
|
|
(In millions)
|
||||||||||
|
Realized gains
|
$
|
4
|
|
$
|
8
|
|
$
|
2
|
|
||
|
Realized losses
|
(3
|
)
|
(5
|
)
|
(1
|
)
|
|||||
|
Proceeds from sale of securities
|
385
|
|
307
|
|
279
|
|
|||||
144
Inventory consisted of:
|
|
As of December 31,
|
||||||
|
|
2011
|
2010
|
|||||
|
|
(In millions)
|
||||||
|
Fuel oil
|
$
|
59
|
|
$
|
72
|
|
|
|
Coal/Lignite
|
82
|
|
215
|
|
|||
|
Natural gas
|
10
|
|
8
|
|
|||
|
Spare parts
|
157
|
|
157
|
|
|||
|
Other
|
—
|
|
1
|
|
|||
|
Total Inventory
|
$
|
308
|
|
$
|
453
|
|
|
Notes receivable primarily consisted of fixed and variable rate notes secured by equity interests in partnerships and joint ventures. NRG's notes receivable and capital leases were as follows:
|
|
As of December 31,
|
||||||
|
|
2011
|
2010
|
|||||
|
|
(In millions)
|
||||||
|
Capital Leases Receivable — non-affiliates
|
|
|
|||||
|
Vattenfall Europe Generation AG & Co. KG., due August 31, 2021, 11.00%
(a)
|
$
|
199
|
|
$
|
233
|
|
|
|
Other
|
1
|
|
3
|
|
|||
|
Capital Leases — non-affiliates
|
200
|
|
236
|
|
|||
|
Notes Receivable — non-affiliates
(b)
|
36
|
|
—
|
|
|||
|
Notes Receivable — affiliates
|
|
|
|||||
|
Kraftwerke Schkopau GBR, indefinite maturity date, 6.91%-7.00%
(c)
|
112
|
|
115
|
|
|||
|
GCE Holding LLC which wholly-owns GenConn Energy LLC, indefinite maturity date, LIBOR +3%
(d)
|
—
|
|
62
|
|
|||
|
Avenal Solar Holdings LLC, indefinite maturity date, 4.5%
(e)
|
8
|
|
—
|
|
|||
|
Notes receivable — affiliates
|
120
|
|
177
|
|
|||
|
Subtotal — Capital leases and notes receivable
|
356
|
|
413
|
|
|||
|
Less current maturities:
|
|
|
|||||
|
Capital leases
(f)
|
14
|
|
29
|
|
|||
|
Total Capital leases and notes receivable — noncurrent
|
$
|
342
|
|
$
|
384
|
|
|
|
(a)
|
Saale Energie GmbH, or SEG, has sold
100%
of its share of capacity from the Schkopau power plant to Vattenfall Europe Generation AG & Co. KG under a
25
-year contract, which is more than
83%
of the useful life of the plant. This direct financing lease receivable amount was calculated based on the present value of the income to be received over the life of the contract.
|
|
(b)
|
Agua Caliente and CVSR have entered into agreements with their respective transmission owners to provide financing for required network upgrades. The notes will be repaid within a five year period following the date each facility reaches commercial operations.
|
|
(c)
|
SEG entered into a note receivable with Kraftwerke Schkopau GBR, a partnership between SEG and E.On Kraftwerke GmbH. The note was used to fund SEG's initial capital contribution to the partnership and to cover project liquidity shortfalls during construction of the Schkopau power plant. The note is subject to repayment upon the disposition of the Schkopau plant.
|
|
(d)
|
NRG entered into a long-term
$122 million
note receivable facility with GCE Holding LLC to fund project liquidity needs in 2009. Per the terms of the facility,
$63 million
of the outstanding balance, including accrued interest was converted into equity in GenConn Energy LLC when the Middletown project reached commercial operations in 2011. See
Note 12
,
Debt and Capital Leases
for further discussion.
|
|
(e)
|
NRG entered into a long-term
$35 million
note receivable facility with Avenal Solar Holdings LLC, to fund project liquidity needs in 2011.
|
|
(f)
|
The current portion of capital leases is recorded in Prepayments and other current assets on the Consolidated Balance Sheet.
|
145
NRG's major classes of property, plant, and equipment were as follows:
|
|
As of December 31,
|
Depreciable
|
|||||||
|
|
2011
|
2010
|
Lives
|
||||||
|
|
(In millions)
|
|
|||||||
|
Facilities and equipment
|
$
|
14,483
|
|
$
|
13,820
|
|
1-40 Years
|
||
|
Land and improvements
|
602
|
|
580
|
|
|||||
|
Nuclear fuel
|
365
|
|
314
|
|
5 Years
|
||||
|
Office furnishings and equipment
|
254
|
|
199
|
|
2-10 Years
|
||||
|
Construction in progress
|
2,487
|
|
1,400
|
|
|
||||
|
Total property, plant, and equipment
|
18,191
|
|
16,313
|
|
|
||||
|
Accumulated depreciation
|
(4,570
|
)
|
(3,796
|
)
|
|
||||
|
Net property, plant, and equipment
|
$
|
13,621
|
|
$
|
12,517
|
|
|
||
Goodwill
— NRG's goodwill balance was
$1.9 billion
as of both December 31, 2011, and 2010. The Company recorded approximately
$1.7 billion
of goodwill in connection with the acquisition of Texas Genco in 2006. The Company recorded
$144 million
of goodwill in connection with the 2010 acquisition of Green Mountain Energy and
$29 million
in connection with the 2011 acquisition of Energy Plus. The Green Mountain Energy and Energy Plus acquisitions are discussed further in
Note 3
,
Business Acquisitions and Dispositions
. As of
December 31, 2011
, there was no impairment to goodwill. As of
December 31, 2011
, and
2010
, NRG had approximately
$594 million
and
$660 million
, respectively, of goodwill that is deductible for U.S. income tax purposes in future periods.
Intangible Assets
— The Company's intangible assets as of
December 31, 2011
, primarily reflect intangible assets established with the acquisitions of various companies in 2011, 2010, 2009, and 2006, and are comprised of the following:
|
•
|
Emission Allowances
— These intangibles primarily consist of SO
2
and NO
x
emission allowances established with the 2006 Texas Genco acquisition and also include RGGI emission credits which NRG began purchasing in 2009. These emission allowances are held-for-use and are amortized to cost of operations, with NO
x
allowances amortized on a straight-line basis and SO
2
allowances and Regional Greenhouse Gas Initiative, or RGGI, credits amortized based on units of production. During the year ended December 31, 2011, the Company recorded an impairment charge of
$160 million
on the Company's Acid Rain Program SO
2
emission allowances in order to comply with the Acid Rain Program as discussed in Note 24,
Environmental Matters.
|
|
•
|
Development rights
— Arising primarily from the acquisition of solar businesses in 2010 and 2011, these intangibles are amortizable to depreciation and amortization expense on a straight-line basis over the estimated life of the related project portfolio.
|
|
•
|
Energy supply contracts
— Established with the acquisitions of Reliant Energy and Green Mountain Energy, these represent the fair value at the acquisition date of in-market contracts for the purchase of energy to serve retail electric customers. The contracts are amortized to cost of operations based on the expected delivery under the respective contracts.
|
|
•
|
In-market fuel (gas and nuclear) contracts
— These intangibles were established with the Texas Genco acquisition in 2006 and are amortized to cost of operations over expected volumes over the life of each contract.
|
|
•
|
Customer contracts
— Established with the acquisitions of Reliant Energy, Green Mountain Energy, and Northwind Phoenix
,
these intangibles represent the fair value at the acquisition date of contracts that primarily provide electricity to Reliant Energy's and Green Mountain Energy's C&I customers. These contracts are amortized to revenues based on expected volumes to be delivered for the portfolio.
|
|
•
|
Customer relationships
— These intangibles represent the fair value at the acquisition date of acquired businesses' customer base, primarily for Energy Plus, Reliant Energy and Green Mountain Energy. The customer relationships are amortized to depreciation and amortization expense based on the expected discounted future net cash flows by year.
|
146
|
•
|
Marketing partnerships
— Established with the acquisition of Energy Plus, as further discussed in Note 3,
Business Acquisitions and Dispositions
, these intangibles represent the fair value at the acquisition date of existing agreements with loyalty and affinity partners. The marketing partnerships are amortized to depreciation and amortization expense based on the expected discounted future net cash flows by year.
|
|
•
|
Trade names
— Established with the Energy Plus, Reliant Energy and Green Mountain Energy acquisitions, these intangibles are amortized to depreciation and amortization expense, on a straight-line basis.
|
|
•
|
Other
— Consists of renewable energy credits, wind intangible assets, costs to extend the operating license for STP Units 1 and 2, the intangible asset related to a purchased ground lease and the value of acquired power purchase agreements.
|
The following tables summarize the components of NRG's intangible assets subject to amortization:
|
|
|
|
Contracts
|
|
|
|
|
||||||||||||||||||||||||||||||||
|
Year Ended December 31, 2011
|
Emission
Allowances
|
Development
Rights
|
Energy
Supply
|
Fuel
|
Customer
|
Customer
Relationships
|
Marketing Partnerships
|
Trade
Names
|
Other
|
Total
|
|||||||||||||||||||||||||||||
|
|
(In millions)
|
||||||||||||||||||||||||||||||||||||||
|
January 1, 2011
|
$
|
935
|
|
$
|
18
|
|
$
|
54
|
|
$
|
72
|
|
$
|
859
|
|
$
|
571
|
|
$
|
—
|
|
$
|
308
|
|
$
|
23
|
|
$
|
2,840
|
|
|||||||||
|
Purchases
|
8
|
|
6
|
|
—
|
|
—
|
|
—
|
|
—
|
|
—
|
|
—
|
|
26
|
|
40
|
|
|||||||||||||||||||
|
Acquisition of businesses
|
—
|
|
—
|
|
—
|
|
—
|
|
—
|
|
63
|
|
88
|
|
10
|
|
13
|
|
174
|
|
|||||||||||||||||||
|
Usage
|
—
|
|
—
|
|
—
|
|
—
|
|
—
|
|
—
|
|
—
|
|
—
|
|
(19
|
)
|
(19
|
)
|
|||||||||||||||||||
|
Impairment charge on emission allowances
|
(160
|
)
|
—
|
|
—
|
|
—
|
|
—
|
|
—
|
|
—
|
|
—
|
|
—
|
|
(160
|
)
|
|||||||||||||||||||
|
Other
|
—
|
|
—
|
|
—
|
|
—
|
|
—
|
|
—
|
|
—
|
|
—
|
|
(4
|
)
|
(4
|
)
|
|||||||||||||||||||
|
Adjusted gross amount
|
783
|
|
24
|
|
54
|
|
72
|
|
859
|
|
634
|
|
88
|
|
318
|
|
39
|
|
2,871
|
|
|||||||||||||||||||
|
Less accumulated amortization
|
(335
|
)
|
—
|
|
(25
|
)
|
(57
|
)
|
(675
|
)
|
(317
|
)
|
—
|
|
(42
|
)
|
(1
|
)
|
(1,452
|
)
|
|||||||||||||||||||
|
Net carrying amount
|
$
|
448
|
|
$
|
24
|
|
$
|
29
|
|
$
|
15
|
|
$
|
184
|
|
$
|
317
|
|
$
|
88
|
|
$
|
276
|
|
$
|
38
|
|
$
|
1,419
|
|
|||||||||
|
|
|
Contracts
|
|
|
|
|
|||||||||||||||||||||||||||||
|
Year Ended December 31, 2010
|
Emission
Allowances
|
Development Rights
|
Energy
Supply
|
Fuel
|
Customer
|
Customer
Relationships
|
Trade
Names
|
Other
|
Total
|
||||||||||||||||||||||||||
|
|
(In millions)
|
||||||||||||||||||||||||||||||||||
|
January 1, 2010
|
$
|
919
|
|
$
|
—
|
|
$
|
54
|
|
$
|
71
|
|
$
|
790
|
|
$
|
399
|
|
$
|
178
|
|
$
|
14
|
|
$
|
2,425
|
|
||||||||
|
Purchases
|
19
|
|
—
|
|
—
|
|
—
|
|
—
|
|
—
|
|
—
|
|
20
|
|
39
|
|
|||||||||||||||||
|
Acquisition of businesses
|
—
|
|
18
|
|
—
|
|
—
|
|
69
|
|
172
|
|
130
|
|
4
|
|
393
|
|
|||||||||||||||||
|
Usage
|
—
|
|
—
|
|
—
|
|
—
|
|
—
|
|
—
|
|
—
|
|
(15
|
)
|
(15
|
)
|
|||||||||||||||||
|
Other
|
(3
|
)
|
—
|
|
—
|
|
1
|
|
—
|
|
—
|
|
—
|
|
—
|
|
(2
|
)
|
|||||||||||||||||
|
Adjusted gross amount
|
935
|
|
18
|
|
54
|
|
72
|
|
859
|
|
571
|
|
308
|
|
23
|
|
2,840
|
|
|||||||||||||||||
|
Less accumulated amortization
|
(269
|
)
|
—
|
|
(21
|
)
|
(55
|
)
|
(490
|
)
|
(208
|
)
|
(20
|
)
|
(1
|
)
|
(1,064
|
)
|
|||||||||||||||||
|
Net carrying amount
|
$
|
666
|
|
$
|
18
|
|
$
|
33
|
|
$
|
17
|
|
$
|
369
|
|
$
|
363
|
|
$
|
288
|
|
$
|
22
|
|
$
|
1,776
|
|
||||||||
147
The following table presents NRG's amortization of intangible assets for each of the past three years:
|
|
Years Ended December 31,
|
||||||||||
|
Amortization
|
2011
|
2010
|
2009
|
||||||||
|
|
(In millions)
|
||||||||||
|
Emission allowances
|
$
|
66
|
|
$
|
70
|
|
$
|
63
|
|
||
|
Energy supply contracts
|
4
|
|
3
|
|
18
|
|
|||||
|
Fuel contracts
|
2
|
|
7
|
|
15
|
|
|||||
|
Customer contracts
|
185
|
|
232
|
|
258
|
|
|||||
|
Customer relationships
|
109
|
|
91
|
|
117
|
|
|||||
|
Trade names
|
22
|
|
12
|
|
8
|
|
|||||
|
Other
|
—
|
|
1
|
|
—
|
|
|||||
|
Total amortization
|
$
|
388
|
|
$
|
416
|
|
$
|
479
|
|
||
The following table presents estimated amortization of NRG's intangible assets for each of the next five years:
|
|
|
|
Contracts
|
|
|
|
|||||||||||||||||||||||||||||
|
Year Ended December 31,
|
Emission
Allowances
|
Development
Rights
|
Energy
Supply
|
Fuel
|
Customer
|
Customer
Relationships
|
Marketing Partnerships
|
Trade
Names
|
Total
|
||||||||||||||||||||||||||
|
|
(In millions)
|
||||||||||||||||||||||||||||||||||
|
2012
|
$
|
50
|
|
$
|
1
|
|
$
|
5
|
|
$
|
2
|
|
$
|
119
|
|
$
|
98
|
|
$
|
3
|
|
$
|
23
|
|
$
|
301
|
|
||||||||
|
2013
|
54
|
|
1
|
|
6
|
|
2
|
|
53
|
|
68
|
|
9
|
|
23
|
|
216
|
|
|||||||||||||||||
|
2014
|
33
|
|
1
|
|
6
|
|
2
|
|
1
|
|
48
|
|
15
|
|
23
|
|
129
|
|
|||||||||||||||||
|
2015
|
41
|
|
1
|
|
6
|
|
2
|
|
1
|
|
36
|
|
14
|
|
23
|
|
124
|
|
|||||||||||||||||
|
2016
|
46
|
|
1
|
|
6
|
|
2
|
|
1
|
|
26
|
|
9
|
|
22
|
|
113
|
|
|||||||||||||||||
The following table presents the weighted average remaining amortization period related to NRG's intangible assets purchased in 2011 business acquisitions:
|
As of December 31, 2011
|
Marketing Partnerships
|
Trade
Names
|
Customer
Relationships
|
Other
|
Total
|
||||||||||
|
|
(In years)
|
||||||||||||||
|
Weighted average remaining amortization period
|
18
|
|
5
|
|
5
|
|
18
|
|
11
|
|
|||||
Intangible assets held for sale
— From time to time, management may authorize the transfer from the Company's emission bank of emission allowances held-for-use to intangible assets held-for-sale. Emission allowances held-for-sale are included in other non current assets on the Company's consolidated balance sheet and are not amortized, but rather expensed as sold. As of
December 31, 2011
, the value of emission allowances held-for-sale is
$19 million
and is managed within the Corporate segment. Once transferred to held-for-sale, these emission allowances are prohibited from moving back to held-for-use.
Out-of-market contracts
— Due to business acquisitions and upon the adoption of Fresh Start accounting, NRG acquired certain out-of-market contracts, which are classified as non-current liabilities on NRG's consolidated balance sheet. The power and customer contracts are amortized to revenues, while the energy supply contracts are amortized to cost of operations.
The following table summarizes the estimated amortization related to NRG's out-of-market contracts:
|
|
Contracts
|
|
|||||||||||||
|
Year Ended December 31,
|
Customer
|
Energy
Supply
|
Power
|
Total
|
|||||||||||
|
|
(In millions)
|
||||||||||||||
|
2012
|
$
|
2
|
|
$
|
6
|
|
$
|
21
|
|
$
|
29
|
|
|||
|
2013
|
1
|
|
2
|
|
19
|
|
22
|
|
|||||||
|
2014
|
—
|
|
—
|
|
17
|
|
17
|
|
|||||||
|
2015
|
—
|
|
—
|
|
17
|
|
17
|
|
|||||||
|
2016
|
—
|
|
—
|
|
17
|
|
17
|
|
|||||||
148
Long-term debt and capital leases consisted of the following:
|
|
As of December 31,
|
|
|
||||||||
|
|
2011
|
2010
|
Interest Rate
|
|
|||||||
|
|
(In millions except rates)
|
|
|||||||||
|
NRG Recourse Debt:
|
|
|
|
||||||||
|
Senior notes, due 2021
|
$
|
1,200
|
|
$
|
—
|
|
7.875
|
||||
|
Senior notes, due 2020
|
1,100
|
|
1,100
|
|
8.250
|
|
|||||
|
Senior notes, due 2019
|
800
|
|
—
|
|
7.625
|
|
|||||
|
Senior notes, due 2019
(a)
|
691
|
|
690
|
|
8.500
|
||||||
|
Senior notes, due 2018
|
1,200
|
|
—
|
|
7.625
|
||||||
|
Senior notes, due 2017
|
1,090
|
|
1,100
|
|
7.375
|
|
|||||
|
Senior notes, due 2016
|
—
|
|
2,400
|
|
7.375
|
|
|||||
|
Senior notes, due 2014
(b)
|
—
|
|
1,205
|
|
7.250
|
|
|||||
|
Term loan facility, due 2018
(c)
|
1,588
|
|
—
|
|
L+3.00
|
(f)
|
|||||
|
Term loan facility, due 2013-2015
|
—
|
|
1,759
|
|
L+3.25/L+1.75
|
(f)
|
|||||
|
Indian River Power LLC, tax exempt bonds, due 2040
|
57
|
1
|
|
6.000
|
|||||||
|
Indian River Power LLC, tax exempt bonds, due 2045
|
148
|
66
|
|
5.375
|
|||||||
|
Dunkirk Power LLC, tax exempt bonds, due 2042
|
59
|
59
|
|
5.875
|
|||||||
|
Subtotal NRG Recourse Debt
|
7,933
|
|
8,380
|
|
|
|
|||||
|
NRG Non-Recourse Debt:
|
|||||||||||
|
Ivanpah financing:
|
|||||||||||
|
Solar Partners I, due 2014 and 2033
|
290
|
|
—
|
|
1.126 - 3.991
|
||||||
|
Solar Partners II, due 2014 and 2038
|
314
|
|
—
|
|
1.116 - 4.195
|
||||||
|
Solar Partners VIII, due 2014 and 2038
|
270
|
|
—
|
|
1.381 - 4.256
|
||||||
|
NRG Peaker Finance Co. LLC, bonds, due 2019
(d)
|
190
|
|
206
|
|
L+1.07
|
(f)
|
|||||
|
Agua Caliente Solar, LLC, due 2037
|
181
|
|
—
|
|
2.730 - 3.256
|
||||||
|
NRG West Holdings LLC, term loan, due 2023
|
159
|
|
—
|
|
L+2.25 - 2.75
|
(f)
|
|||||
|
NRG Energy Center Minneapolis LLC, senior secured notes, due 2013, 2017, and 2025
(e)
|
151
|
|
163
|
|
5.95 - 7.31
|
|
|||||
|
South Trent Wind LLC, financing agreement, due 2020
|
75
|
|
78
|
|
L+ 2.50
|
(f)
|
|||||
|
Solar Power Partners - SPP Fund II/IIB LLC term loans, due 2017
|
17
|
|
—
|
|
L+3.50
|
(f)
|
|||||
|
Solar Power Partners - SPP Fund III LLC term loan, due 2024
|
42
|
|
—
|
|
L+3.50
|
(f)
|
|||||
|
NRG Roadrunner LLC, due 2031
|
61
|
|
—
|
|
L+2.01
|
(f)
|
|||||
|
NRG Solar Blythe LLC, credit agreement, due 2028
|
27
|
|
29
|
|
L+ 2.50
|
(f)
|
|||||
|
NRG Connecticut Peaking Development LLC, equity bridge loan facility, due 2010 and 2011
|
—
|
|
61
|
|
L + 2.00
|
(f)
|
|||||
|
NINA TANE and Shaw facilities, due 2012 and 2013
|
—
|
|
167
|
|
L+2.00 - 6.00
|
(f)
|
|||||
|
Other
|
19
|
|
20
|
|
various
|
|
|||||
|
Subtotal NRG Non-Recourse Debt
|
1,796
|
|
724
|
|
|||||||
|
Subtotal
|
9,729
|
|
9,104
|
|
|
|
|||||
|
Capital leases:
|
|
|
|
||||||||
|
Saale Energie GmbH, Schkopau capital lease, due 2021
|
103
|
|
107
|
|
|
|
|||||
|
Subtotal
|
9,832
|
|
9,211
|
|
|
|
|||||
|
Less current maturities
(g)
|
87
|
|
463
|
|
|
|
|||||
|
Total long-term debt and capital leases
|
$
|
9,745
|
|
$
|
8,748
|
|
|
|
|||
|
Funded letter of credit
|
$
|
—
|
|
$
|
1,300
|
|
L+1.75-L+3.25
|
(f)
|
|||
|
(a)
|
Includes discount of
$(9) million
and
$(10) million
as of
December 31, 2011
, and
2010
, respectively. On June 5, 2009, NRG issued these
$700 million
aggregate principal amount bonds at a yield of
8.75%
.
|
|
(b)
|
Includes fair value adjustment of
$5 million
as of December 31,
2010
, reflecting an adjustment for an interest rate swap.
|
|
(c)
|
Includes discount of
$(3) million
as of December 31, 2011.
|
|
(d)
|
Includes discount of
$(20) million
and
$(25) million
as of
December 31, 2011
, and
2010
, respectively.
|
|
(e)
|
Includes premium of
$1 million
and
$1 million
as of
December 31, 2011
, and
2010
, respectively.
|
|
(f)
|
L+ equals LIBOR plus x%.
|
|
(g)
|
Includes discount of
$(5) million
and
$(5) million
on the NRG Peaker Finance debt as of
December 31, 2011
, and
2010
, respectively.
|
149
Senior Notes
Redemption of Senior Notes
On
January 26, 2011
, the Company redeemed
$945 million
of the 2014 Senior Notes through a tender offer, at an early redemption percentage of
102.063%
. An additional
$2 million
was tendered at a redemption percentage of
100.063%
and the remaining
$253 million
of 2014 Senior Notes were called on
February 25, 2011
, at a redemption percentage of
101.813%
A
$28 million
loss on the extinguishment of the 2014 Senior Notes was recorded, which primarily consisted of the premiums paid on the redemption and the write-off of previously deferred financing costs.
On
May 24, 2011
, the Company redeemed
$1.7 billion
of the 2016 Senior Notes through a tender offer, at an early redemption percentage of
103.938%
. An additional
$0.4 million
was tendered at a redemption percentage of
102.938%
and the remaining
$666 million
of 2016 Senior Notes was called on June 23, 2011, at a redemption percentage of
103.688%
A
$115 million
loss on the extinguishment of the 2016 Senior Notes was recorded, which primarily consisted of the premiums paid on the redemption and the write-off of previously deferred financing costs.
Senior Notes Outstanding
As of
December 31, 2011
, NRG had six outstanding issuances of senior notes, or Senior Notes, under an Indenture, dated February 2, 2006, or the Indenture, between NRG and Law Debenture Trust Company of New York, as trustee:
(i.)
7.375%
senior notes, issued November 21, 2006 and due January 15, 2017, or the 2017 Senior Notes;
(ii.)
8.500%
senior notes, issued June 5, 2009 and due June 15, 2019, or the 2019 Senior Notes;
(iii.)
8.250%
senior notes, issued August 20, 2010 and due September 1, 2020, or the 2020 Senior Notes;
(iv.)
7.625%
senior notes, issued January 26, 2011 and due January 15, 2018, or the 2018 Senior Notes;
(v.)
7.625%
senior notes, issued May 24, 2011 and due May 15, 2019, or the
7.625%
2019 Senior Notes; and
(vi.)
7.875%
senior notes, issued May 24, 2011 and due May 15, 2021, or the 2021 Senior Notes.
The Company periodically enters into supplemental indentures for the purpose of adding entities under the Senior Notes as guarantors.
The Indentures and the form of notes provide, among other things, that the Senior Notes will be senior unsecured obligations of NRG. The Indentures also provide for customary events of default, which include, among others: nonpayment of principal or interest; breach of other agreements in the Indentures; defaults in failure to pay certain other indebtedness; the rendering of judgments to pay certain amounts of money against NRG and its subsidiaries; the failure of certain guarantees to be enforceable; and certain events of bankruptcy or insolvency. Generally, if an event of default occurs, the Trustee or the Holders of at least
25%
in principal amount of the then outstanding series of Senior Notes may declare all of the Senior Notes of such series to be due and payable immediately. The terms of the Indentures, among other things, limit NRG's ability and certain of its subsidiaries' ability to return capital to stockholders, grant liens on assets to lenders and incur additional debt. Interest is payable semi-annually on the Senior Notes until their maturity dates.
150
2017 Senior Notes
On or after January 15, 2012, NRG may redeem some or all of the notes at redemption prices expressed as percentages of principal amount as set forth below, plus accrued and unpaid interest on the notes redeemed to the first applicable redemption date:
|
Redemption Period
|
Redemption
Percentage
|
|
|
February 1, 2012 to January 31, 2013
|
103.688
|
%
|
|
February 1, 2013 to January 31, 2014
|
102.458
|
%
|
|
February 1, 2014 to January 31, 2015
|
101.229
|
%
|
|
February 1, 2015 and thereafter
|
100.000
|
%
|
2019 Senior Notes
Prior to June 15, 2012, NRG may redeem up to
35%
of the aggregate principal amount of the 2019 Senior Notes with the net proceeds of certain equity offerings, at a redemption price of
108.5%
of the principal amount. Prior to June 15, 2014, NRG may redeem all or a portion of the 2019 Senior Notes at a price equal to
100%
of the principal amount plus a premium and accrued and unpaid interest. The premium is the greater of: (i)
1%
of the principal amount of the notes; or (ii) the excess of the principal amount of the note over the following: the present value of
104.25%
of the note, plus interest payments due on the note from the date of redemption through June 15, 2014, discounted at a Treasury rate plus
0.50%
. In addition, on or after June 15, 2014, NRG may redeem some or all of the notes at redemption prices expressed as percentages of principal amount as set forth in the following table, plus accrued and unpaid interest on the notes redeemed to the first applicable redemption date:
|
Redemption Period
|
Redemption
Percentage
|
|
|
June 15, 2014 to June 14, 2015
|
104.250
|
%
|
|
June 15, 2015 to June 14, 2016
|
102.830
|
%
|
|
June 15, 2016 to June 14, 2017
|
101.420
|
%
|
|
June 15, 2017 and thereafter
|
100.000
|
%
|
2020 Senior Notes
Prior to September 1, 2013, NRG may redeem up to
35%
of the aggregate principal amount of the 2020 Senior Notes with the net proceeds of certain equity offerings, at a redemption price of
108.25%
of the principal amount. Prior to September 1, 2015, NRG may redeem all or a portion of the 2020 Senior Notes at a price equal to
100%
of the principal amount plus a premium and accrued and unpaid interest. The premium is the greater of (i)
1%
of the principal amount of the note; or (ii) the excess of the principal amount of the note over the following: the present value of
104.125%
of the note, plus interest payments due on the note from the date of redemption through September 1, 2015, discounted at a Treasury rate plus
0.50%
. In addition, on or after September 1, 2015, NRG may redeem some or all of the notes at redemption prices expressed as percentages of principal amount as set forth in the following table, plus accrued and unpaid interest on the notes redeemed to the first applicable redemption date:
|
Redemption Period
|
Redemption
Percentage
|
|
|
On or after September 1, 2015
|
104.125
|
%
|
|
On or after September 1, 2016
|
102.750
|
%
|
|
On or after September 1, 2017
|
101.375
|
%
|
|
September 1, 2018 and thereafter
|
100.000
|
%
|
2018 Senior Notes
On January 26, 2011, NRG issued
$1.2 billion
aggregate principal amount at par of
7.625%
Senior Notes due 2018, or the 2018 Senior Notes. The 2018 Senior Notes were issued under the Indenture. The Indenture and the form of the notes provide, among other things, that the 2018 Senior Notes will be senior unsecured obligations of NRG. The net proceeds of
$1.195 billion
were used primarily to complete the tender offer of the 2014 Senior Notes. Interest is payable semi-annually beginning on July 15, 2011, until their maturity date of January 15, 2018.
151
Prior to maturity, NRG may redeem all or a portion of the 2018 Senior Notes at a redemption price equal to
100%
of the principal amount of the notes redeemed plus a premium and accrued and unpaid interest. The premium is the greater of (i)
1%
of the principal amount of the note or (ii) the excess of the present value of the principal amount at maturity plus all required interest payments due on the note through the maturity date discounted at a Treasury rate plus
0.50%
.
7.625% 2019 Senior Notes and 2021 Senior Notes
On May 24, 2011, NRG issued
$800 million
aggregate principal amount at par of
7.625%
Senior Notes due 2019, or the
7.625%
2019 Senior Notes, and
$1.2 billion
aggregate principal amount at par of
7.875%
Senior Notes due 2021, or the 2021 Senior Notes.
The net proceeds of
$2 billion
for both the
7.625%
2019 Senior Notes and the 2021 Senior Notes were used to complete the tender offer of the 2016 Senior Notes. Interest is payable semi-annually beginning on November 15, 2011, until their maturity dates of May 15, 2019, and May 15, 2021, respectively.
Prior to May 15, 2014, NRG may redeem up to
35%
of the aggregate principal amount of the
7.625%
2019 Senior Notes with the net proceeds of certain equity offerings, at a redemption price of
107.625%
of the principal amount. Prior to May 15, 2014, NRG may redeem all or a portion of the
7.625%
2019 Senior Notes at a price equal to
100%
of the principal amount plus a premium and accrued and unpaid interest. The premium is the greater of: (i)
1%
of the principal amount of the notes; or (ii) the excess of the principal amount of the note over the following: the present value of
103.813%
of the note, plus interest payments due on the note from the date of redemption through May 15, 2014, discounted at a Treasury rate plus
0.50%
. In addition, on or after May 15, 2014, NRG may redeem some or all of the notes at redemption prices expressed as percentages of principal amount as set forth in the following table, plus accrued and unpaid interest on the notes redeemed to the first applicable redemption date:
|
Redemption Period
|
Redemption
Percentage
|
|
|
May 15, 2014 to May 14, 2015
|
103.813
|
%
|
|
May 15, 2015 to May 14, 2016
|
101.906
|
%
|
|
May 15, 2016 and thereafter
|
100.000
|
%
|
Prior to May 15, 2016, NRG may redeem up to
35%
of the aggregate principal amount of the 2021 Senior Notes with the net proceeds of certain equity offerings, at a redemption price of
107.875%
of the principal amount. Prior to May 15, 2016, NRG may redeem all or a portion of the 2021 Senior Notes at a price equal to
100%
of the principal amount plus a premium and accrued and unpaid interest. The premium is the greater of: (i)
1%
of the principal amount of the notes; or (ii) the excess of the principal amount of the note over the following: the present value of
103.938%
of the note, plus interest payments due on the note from the date of redemption through May 15, 2016, discounted at a Treasury rate plus
0.50%
. In addition, on or after May 15, 2016, NRG may redeem some or all of the notes at redemption prices expressed as percentages of principal amount as set forth in the following table, plus accrued and unpaid interest on the notes redeemed to the first applicable redemption date:
|
Redemption Period
|
Redemption
Percentage
|
|
|
May 15, 2016 to May 14, 2017
|
103.938
|
%
|
|
May 15, 2017 to May 14, 2018
|
102.625
|
%
|
|
May 15, 2018 to May 14, 2019
|
101.313
|
%
|
|
May 15, 2019 and thereafter
|
100.000
|
%
|
152
Senior Credit Facility
On July 1, 2011, NRG replaced its Senior Credit Facility, consisting of its Term Loan Facility, Revolving Credit Facility and Funded Letter of Credit Facility, with a new senior secured facility, or the 2011 Senior Credit Facility, which includes the following:
|
•
|
A
$2.3 billion
revolving credit facility, or the 2011 Revolving Credit Facility, with a maturity date of July 1, 2016, which will pay interest on amounts drawn at a rate of
LIBOR
plus
2.75%
. In addition, the related Funded Letter of Credit loan was repaid, the non-current restricted cash balance was returned to the lenders and the related balances were removed from NRG's balance sheet. A
$13 million
loss on extinguishment of the Revolving Credit Facility and Funded Letter of Credit Facility was recorded, which consisted of the write-off of previously deferred financing costs. As of December 31, 2011, a total of
$1.627 billion
letters of credit were issued under the 2011 Revolving Credit Facility, with
$673 million
remaining available to be issued. Commitment fees of
0.50%
are charged on the unused portion of the 2011 Revolving Credit Facility.
|
|
•
|
A
$1.6 billion
term loan facility, or the 2011 Term Loan Facility, with a maturity date of July 1, 2018, which will pay interest at a rate of
LIBOR
plus
3.00%
, with a
LIBOR
floor of
1.00%
. The debt was issued at
99.75%
of face value; the discount will be amortized to interest expense over the life of the loan. Repayments under the 2011Term Loan Facility will consist of
0.25%
per quarter, with the remainder due at maturity. The proceeds of the new term loan facility were used to repay the existing Term Loan Facility balance outstanding. A
$19 million
loss on extinguishment of the Term Loan Facility was recorded, which consisted of the write-off of previously deferred financing costs.
|
The 2011 Senior Credit Facility is guaranteed by substantially all of NRG's existing and future direct and indirect subsidiaries, with certain customary or agreed-upon exceptions for unrestricted foreign subsidiaries, project subsidiaries, and certain other subsidiaries. The capital stock of substantially all of NRG's subsidiaries, with certain exceptions for unrestricted subsidiaries, foreign subsidiaries, and project subsidiaries, has been pledged for the benefit of the 2011 Senior Credit Facility's lenders.
The 2011 Senior Credit Facility is also secured by first-priority perfected security interests in substantially all of the property and assets owned or acquired by NRG and its subsidiaries, other than certain limited exceptions. These exceptions include assets of certain unrestricted subsidiaries, equity interests in certain of NRG's project affiliates that have non-recourse debt financing, and voting equity interests in excess of
66%
of the total outstanding voting equity interest of certain of NRG's foreign subsidiaries.
The 2011 Senior Credit Facility contains customary covenants, which, among other things, require NRG to meet certain financial tests, including minimum interest coverage ratio and a maximum leverage ratio on a consolidated basis, and limit NRG's ability to:
|
•
|
incur indebtedness and liens and enter into sale and lease-back transactions;
|
|
•
|
make investments, loans and advances; and
|
|
•
|
return capital to stockholders.
|
Interest Rate Swaps
- NRG entered into interest rate swaps, which became effective on April 1, 2011, and are intended to hedge the risks associated with floating interest rates. The Company pays its counterparty the equivalent of a fixed interest payment on a predetermined notional value, and NRG receives the monthly equivalent of a floating interest payment based on a
1-month LIBOR
calculated on the same notional value. All interest rate swap payments by NRG and its counterparty are made monthly and the LIBOR is determined in advance of each interest period. The total notional amount of the swaps, which mature on February 1, 2013, is
$900 million
with changes in the fair value through June 30, 2011 recorded in OCI and subsequent changes in the fair value reported in interest expense.
153
Indian River Power LLC Tax-Exempt Bonds
On October 12, 2010, NRG executed a
$190 million
tax-exempt bond financing through its wholly-owned subsidiary, Indian River Power LLC. The bonds were issued by the Delaware Economic Development Authority and will be used for construction of emission control equipment on the Indian River Generating Station in Millsboro, DE, or Indian River. The bonds were issued at a rate of
5.375%
, have a maturity date of October 1, 2045, and are supported by an NRG guarantee. The proceeds received through
December 31, 2011
, were
$148 million
, and the remaining balance will be received over time as construction costs are paid.
On December 10, 2010, NRG executed an additional
$57 million
tax-exempt bond financing through Indian River Power LLC. The bonds were issued by Sussex County, Delaware, and will be used for construction of emission control equipment on Indian River. The bonds were issued at a rate of
6.0%
, have a maturity date of October 1, 2040, and are supported by an NRG guarantee. The proceeds received through
December 31, 2011
, were
$57 million
, and the remaining balance will be received over time as construction costs are paid.
Dunkirk Power LLC Tax-Exempt Bonds
On April 15, 2009, NRG executed a
$59 million
tax-exempt bond financing, or the Dunkirk bonds, through its wholly-owned subsidiary, Dunkirk Power LLC, whereby all the proceeds were received as of
December 31, 2011
. The bonds were issued by the County of Chautauqua Industrial Development Agency and are being used for the construction of emission control equipment on the Dunkirk Generating Station in Dunkirk, NY. The bonds initially bore weekly interest based on the Securities Industry and Financial Markets Association, or SIFMA, rate, and on February 1, 2010, the Company fixed the rate on the bonds at
5.875%
, with interest payable semiannually. The bonds have a maturity date of April 1, 2042, and are supported by an NRG guarantee.
NRG Non-Recourse Debt
Project Financings
The following are descriptions of certain indebtedness of NRG's project subsidiaries that are outstanding as of
December 31, 2011
. The indebtedness described below is non-recourse to NRG, unless otherwise noted.
Ivanpah Financing
On April 5, 2011, NRG acquired a majority interest in Ivanpah, as discussed in
Note 3
,
Business Acquisitions and Dispositions
. On April 5, 2011, Ivanpah entered into the Ivanpah Credit Agreement with the FFB to borrow up to
$1.6 billion
to finance the costs of constructing the Ivanpah solar facilities. Each phase of the project is governed by a separate financing agreement and is non recourse to both the other projects and to NRG. Funding requests are submitted to the FFB on a monthly basis and the loans provided by the FFB are guaranteed by the U.S. DOE. Amounts borrowed under the Ivanpah Credit Agreement accrue interest at a fixed rate based on
U.S. Treasury
rates plus a spread of
0.375%
and are secured by all the assets of Ivanpah. Ivanpah intends to submit an application to the U.S. Department of Treasury for a cash grant; any proceeds received will be utilized to repay the borrowings that mature in 2014.
The following table reflects the borrowings under the Ivanpah Credit Agreement as of December 31, 2011:
|
Maximum borrowings available under Ivanpah Credit Agreement
|
Amounts borrowed
|
Weighted average interest rate on amounts borrowed
|
||||||||
|
(In millions, except rates)
|
||||||||||
|
Solar Partners I, due June 27, 2014
(a)
|
$
|
159
|
|
$
|
154
|
|
1.678
|
%
|
||
|
Solar Partners I, due June 27, 2033
|
392
|
|
136
|
|
3.181
|
%
|
||||
|
Solar Partners II, due February 27, 2014
(a)
|
132
|
|
129
|
|
1.609
|
%
|
||||
|
Solar Partners II, due February 27, 2038
|
387
|
|
185
|
|
3.458
|
%
|
||||
|
Solar Partners VIII, due October 27, 2014
(a)
|
117
|
|
111
|
|
1.997
|
%
|
||||
|
Solar Partners VIII, due October 27, 2038
|
440
|
|
159
|
|
3.561
|
%
|
||||
|
$
|
1,627
|
|
$
|
874
|
|
|||||
(a) The cash portion of the loan is fully drawn; additional amounts will be utilized for capitalized interest.
154
Peakers
In June 2002, NRG Peaker Finance Company LLC, or Peakers, an indirect wholly-owned subsidiary, issued
$325 million
in floating rate bonds due June 2019. Peakers subsequently swapped such floating rate debt for fixed rate debt at an all-in cost of
6.67%
per annum. Principal, interest, and swap payments were originally guaranteed by Syncora Guarantee Inc., successor in interest to XL Capital Assurance, through a financial guaranty insurance policy. In 2009, Assured Guaranty Mutual Corp assumed the responsibility as the bond insurer and controlling party. Syncora Guarantee Inc. continues to be the swap insurer. These notes are also secured by, among other things, substantially all of the assets of and membership interests in Bayou Cove Peaking Power LLC, Big Cajun I Peaking Power LLC, NRG Sterlington Power LLC, NRG Rockford LLC, NRG Rockford II LLC, and NRG Rockford Equipment LLC. As of
December 31, 2011
,
$210 million
in principal remained outstanding on these bonds. Upon emergence from bankruptcy, NRG issued a
$36 million
letter of credit to Peakers' collateral agent. The letter of credit may be drawn if the project is unable to meet principal or interest payments. There are no provisions requiring NRG to replenish the letter of credit if it is drawn. On December 31, 2011, the collateral agent drew
$18 million
on the letter of credit to meet the debt service requirements and as of
December 31, 2011
,
$4 million
remains available for additional letters of credit issuances.
Agua Caliente Financing
On
August 5, 2011
, NRG acquired Agua Caliente, as discussed in
Note 3
,
Business Acquisitions and Dispositions
. In connection with the acquisition, Agua Caliente Solar LLC, a wholly-owned subsidiary of NRG, entered into the Agua Caliente Financing Agreement with the FFB, to borrow up to
$967 million
to finance the costs of constructing this solar facility. The Agua Caliente Financing Agreement, which matures in 2037, is non-recourse to NRG. Funding requests will be submitted to the FFB on a monthly basis and the loans provided by the FFB are guaranteed by the U.S. DOE. Amounts borrowed under the Agua Caliente Financing Agreement accrue interest at a fixed rate based on
U.S. Treasury
rates plus a spread of
0.375%
, and are secured by the assets of Agua Caliente. As of December 31, 2011,
$181 million
had been drawn under this agreement.
NRG West Holdings Credit Agreement
On August 23, 2011, NRG, through its wholly-owned subsidiary, NRG West Holdings LLC, or West Holdings, entered into a credit agreement with a group of lenders in respect to the El Segundo Energy Center, or the West Holdings Credit Agreement. The West Holdings Credit Agreement, which establishes a
$540 million
, two tranche construction loan facility with additional facilities for the issuance of letters of credit or working capital loans, is secured by the assets of West Holdings.
The two tranche construction loan facility consists of the
$480 million
Tranche A Construction Facility, or the Tranche A Facility, and the
$60 million
Tranche B Construction Facility, or the Tranche B Facility. The Tranche A and Tranche B Facilities, which mature in August 2023, convert to a term loan and have an interest rate of
LIBOR
, plus an applicable margin which increases by
0.125%
periodically from conversion through year eight for the Tranche A Facility and increases by
0.125%
upon term conversion and on the third and sixth anniversary of the term conversion and by
0.250%
on the eighth anniversary of the term conversion for the Tranche B Facility. The Tranche A and Tranche B Facilities amortize based upon a predetermined schedule over the term of the loan with the balance payable at maturity.
The West Holdings Credit Agreement also provides for the issuance of letters of credit and working capital loans to support the El Segundo Energy Center collateral needs. This includes letter of credit facilities on behalf of West Holdings of up to
$90 million
in support of the PPA, up to
$48 million
in support of the collateral agent, and a working capital facility which permits loans or the issuance of letters of credit of up to
$10 million
.
As of
December 31, 2011
, under the West Holdings Credit Agreement, West Holdings borrowed
$159 million
under the Tranche A Facility, issued a
$30 million
letter of credit in support of the PPA, and issued a
$6 million
letter of credit under the working capital facility.
155
NRG Thermal
NRG owns and operates its thermal business through a wholly-owned subsidiary holding company, NRG Thermal LLC, or NRG Thermal. In 1993, the predecessor entity to NRG Thermal's largest subsidiary, NRG Energy Center Minneapolis LLC, or NRG Thermal Minneapolis, issued
$84 million
of
7.31%
senior secured notes due June 2013, of which
$12 million
remained outstanding as of
December 31, 2011
. In 2002, NRG Thermal Minneapolis issued an additional
$55 million
of
7.25%
Series A notes due August 2017, of which
$29 million
remained outstanding as of
December 31, 2011
, and
$20 million
of
7.12%
Series B notes due August 2017, of which
$10 million
remained outstanding as of
December 31, 2011
. In 2010, NRG Thermal Minneapolis issued
$100 million
of
5.95%
Series C notes due June 23, 2025, of which
$100 million
remained outstanding as of
December 31, 2011
.
The indebtedness under these notes is secured by substantially all of the assets of NRG Thermal Minneapolis. NRG Thermal has guaranteed the indebtedness, and its guarantee is secured by a pledge of the equity interests in all of NRG Thermal's subsidiaries.
South Trent Financing Agreement
In connection with the acquisition, on June 14, 2010, South Trent Wind LLC entered into a financing agreement, or the South Trent Financing Agreement, with a group of lenders, which matures on June 14, 2020. The South Trent Financing Agreement includes a
$79 million
term loan, as well as a
$10 million
letter of credit facility in support of the PPA. The South Trent Financing Agreement also provides for up to
$7 million
in additional letter of credit facilities. The term loan accrues interest at
LIBOR
plus a margin based upon a grid, which is initially
2.5%
and increases every two years by
12.5
basis points. The term loan amortizes quarterly based upon a predetermined schedule with the unamortized portion due at maturity. As of
December 31, 2011
,
$75 million
was outstanding under the term loan and
$10 million
was issued under the letter of credit facility.
Solar Power Partners Financing
NRG acquired Solar Power Partners, or SPP, on November 7, 2011. The following is a description of the long-term debt acquired in connection with the acquisition.
SPP Fund II/II-B
— In order to finance the construction of solar assets, SPP Fund II entered into a term loan agreement with a bank. Under the agreement, SPP Fund II borrowed
$20 million
, which matures on June 30, 2024, and bears interest at
LIBOR
plus
3.50%
and SPP Fund II-B borrowed $
3 million
, which matures on September 30, 2024 and bears interest at
LIBOR
plus
3.50%
. The term loans are secured by substantially all of the assets of the respective fund and contain certain non-financial reporting covenants. The outstanding balance under the Fund II term loan was
$15 million
and under the Fund II-B term loan was
$2 million
as of the acquisition date and as of December 31, 2011.
SPP Fund III
— In order to finance the construction of solar assets, SPP Fund III entered into a credit facility for a
$75 million
construction loan with two banks. The construction phase was completed in 2011 with the Company having borrowed
$44 million
. In June 2011 the construction loan converted to a term loan which amortizes quarterly with the remaining balance due on March 31, 2017, and bears interest at
LIBOR
plus
3.50%
. SPP Fund III also issued a
$1 million
letter of credit in support of its agreements with one of its customers. The term loans are secured by substantially all of the assets of the respective fund and contain certain nonfinancial reporting covenants. As of the acquisition date and as of December 31, 2011,
$42 million
was outstanding under the credit facility.
Roadrunner Financing
On May 25, 2011, NRG, through its wholly-owned subsidiary, NRG Roadrunner LLC, or Roadrunner, entered into a credit agreement with a bank, or the Roadrunner Financing Agreement, for a
$47 million
construction loan that converted to a term loan on January 10, 2012 and a
$21 million
cash grant loan, both of which have an interest rate of
LIBOR
plus an applicable margin of
2.01%
. The term loan has an interest rate of
LIBOR
plus an applicable margin which escalates
0.25%
every
five
years and ranges from
2.10%
at closing to
2.76%
in year
fifteen
through maturity. The term loan, which is secured by all the assets of Roadrunner, matures on
September 30, 2031
, and amortizes based upon a predetermined schedule. The cash grant loan matures upon the earlier of the receipt of the cash grant or
March 31, 2012
. The Roadrunner Financing Agreement also includes a letter of credit facility on behalf of Roadrunner of up to
$5 million
. Roadrunner pays an availability fee of
100%
of the applicable margin on issued letters of credit. As of December 31, 2011,
$47 million
was outstanding under the construction loan,
$14 million
was outstanding under the cash grant loans and
$2 million
in letters of credit in support of the PPA were issued. On January 10, 2012, in connection with the conversion of the construction loan to a term loan, the Company borrowed an additional
$4 million
of cash grant loans and issued a
$3 million
letter of credit in support of debt service.
156
Blythe Credit Agreement
On June 24, 2010, NRG Solar Blythe LLC, or Blythe, entered into a credit agreement with a bank, or the Blythe Credit Agreement, for a
$30 million
term loan which has an interest rate of
LIBOR
plus an applicable margin which escalates
0.25%
every three years and ranges from
2.5%
at closing to
3.75%
in year fifteen. The term loan matures in June 2028, amortizes based upon a predetermined schedule, and is secured by all of the assets of Blythe. The bank has also issued two letters of credit on behalf of Blythe, totaling
$6 million
. Blythe pays an availability fee of
100%
of the applicable margin on these issued letters of credit. As of
December 31, 2011
,
$27 million
was outstanding under the term loan and
$6 million
in letters of credit were issued.
CVSR Financing
On September 30, 2011, NRG acquired CVSR, as discussed in
Note 3
,
Business Acquisitions and Dispositions
. In connection with the acquisition, High Plains Ranch II LLC, a wholly-owned subsidiary of NRG, entered into the CVSR Financing Agreement with the FFB, to borrow up to
$1.2 billion
to finance the costs of constructing this solar facility. The CVSR Financing Agreement, which matures in 2037, is non-recourse to NRG. Funding requests will be submitted to the FFB on a monthly basis and the loans provided by the FFB are guaranteed by the U.S. DOE. Amounts borrowed under the CVSR Financing Agreement accrue interest at a fixed rate based on
U.S. Treasury
rates plus a spread of
0.375%
, and are secured by the assets of CVSR. As of
December 31, 2011
, no amounts were drawn under this agreement. CVSR intends to submit an application to the U.S. Department of Treasury for a cash grant; any proceeds received will be utilized to repay borrowings under the CVSR Financing Agreement.
Under the terms of the CVSR Financing Agreement, on November 17, 2011, CVSR entered into a series of swaptions with a notional value of
$686 million
, or
80%
of the guaranteed term loan amount, in order to hedge the project interest rate risk. These swaptions mature over a series of
seven
scheduled settlement dates to correspond with the completion dates of the project.
GenConn Energy LLC related financings
NRG Connecticut Peaking Development LLC, or NRG Connecticut Peaking, a wholly-owned subsidiary of NRG, had an equity bridge loan facility, or EBL, in the amount of
$122 million
from a syndicate of banks. The purpose of the EBL was to fund the Company's proportionate share of the project construction costs required to be contributed into GenConn Energy LLC, or GenConn, a
50%
equity method investment of the Company. The EBL bore interest at a rate of LIBOR +
2%
on drawn amounts, and was backed by a letter of credit issued by NRG under its Funded Letter of Credit Facility equal to at least
104%
of amounts outstanding under the EBL. On September 29, 2010, GenConn's Devon project reached its commercial operations date, or COD, as defined in the financing documents and NRG Connecticut Peaking repaid the
$55 million
portion of the EBL used to fund the Devon project, and converted
$56 million
of a promissory note from GenConn into equity. On J
une 29, 2011
, when GenConn's Middletown project reached COD, as defined in the financing documents, NRG Connecticut Peaking repaid the remaining
$61 million
outstanding under the EBL. The commitment was terminated and the collateral held under the EBL, including the letter of credit issued by NRG under the Funded Letter of Credit Facility, was returned.
NRG Repowering Holdings LLC
NRG Repowering Holdings LLC, or NRG Repowering, had
$5 million
outstanding under a revolving credit facility as of
December 31, 2011
. On January 25, 2012, the facility was repaid and terminated and a supporting letter of credit issued by NRG was returned.
On January 25, 2012, NRG Repowering entered into a Credit and Reimbursement Agreement which provides for a
$10 million
working capital facility that can be used for general corporate purposes or to issue letters of credit, and an
$80 million
letter of credit facility. Interest on the letters of credit accrues at
3.5%
and on loans under the working capital facility at
LIBOR
plus
3.5%
. The facility is secured by NRG Repowering's investments in GenConn and South Trent Wind LLC, and matures January 25, 2015. As of January 23, 2012, NRG Repowering had issued a
$10 million
letter of credit under the working capital facility and
$80 million
in letters of credit under the letter of credit facility.
157
NINA Financing Arrangements
TANE and Shaw Facilities
— NINA and TANE entered into a credit facility, wherein TANE committed up to
$500 million
to finance purchases of long-lead materials and equipment for the construction of STP Units 3 and 4. NINA also entered into a credit facility with Shaw, wherein Shaw committed up to
$100 million
to finance working capital needs and the expenses of Shaw related to the construction of STP Units 3 and 4. As described further in
Note 4
,
Nuclear Innovation North America LLC Developments, Including Impairment Charge
, NRG deconsolidated NINA as of March 31, 2011; therefore any amounts outstanding under these facilities are no longer consolidated into NRG's financial statements.
Interest Rate Swaps
—
Project Financings
Many of NRG's project subsidiaries entered into interest rate swaps, intended to hedge the risks associated with interest rates on non-recourse project level debt. These swaps amortize in proportion to their respective loans and are floating for fixed where the project subsidiary pays its counterparty the equivalent of a fixed interest payment on a predetermined notional value and will receive quarterly the equivalent of a floating interest payment based on the same notional value. All interest rate swap payments by the project subsidiary and its counterparty are made quarterly and the LIBOR is determined in advance of each interest period. The following table summarizes the swaps, some of which are forward starting as indicated, related to NRG's project level debt as of December 31, 2011.
|
Non-Recourse Debt
|
% of Principal
|
Fixed Interest Rate
|
Floating Interest Rate
|
Notional
Amount at December 31, 2011
(In millions)
|
Effective Date
|
Maturity Date
|
||||||||||
|
NRG Peaker Finance Co. LLC
|
100
|
%
|
6.673
|
%
|
3-mo. LIBOR + 1.07%
|
$
|
210
|
|
June 18, 2002
|
June 10, 2019
|
||||||
|
NRG West Holdings LLC
|
75
|
%
|
2.4165
|
%
|
3-mo. LIBOR
|
135
|
|
November 30, 2011
|
August 31, 2023
|
|||||||
|
South Trent Wind LLC
|
75
|
%
|
3.265
|
%
|
3-mo. LIBOR
|
56
|
|
June 14, 2010
|
June 14, 2020
|
|||||||
|
South Trent Wind LLC
|
75
|
%
|
4.95
|
%
|
3-mo. LIBOR
|
21
|
|
June 14, 2020
|
June 14, 2028
|
|||||||
|
NRG Solar Roadrunner LLC
|
75
|
%
|
4.313
|
%
|
3-mo. LIBOR
|
36
|
|
September 30, 2011
|
December 31, 2029
|
|||||||
|
NRG Solar Blythe LLC
|
75
|
%
|
3.563
|
%
|
3-mo. LIBOR
|
20
|
|
June 25, 2010
|
June 25, 2028
|
|||||||
|
Solar Power Partners II
|
75
|
%
|
7.14
|
%
|
3-mo. LIBOR + 3.5%
|
11
|
|
June 30, 2009
|
June 30, 2024
|
|||||||
|
Solar Power Partners II-B
|
75
|
%
|
6.72
|
%
|
3-mo. LIBOR + 3.5%
|
2
|
|
October 1, 2009
|
September 30, 2024
|
|||||||
|
Solar Power Partners III
|
100
|
%
|
3.67
|
%
|
3-mo. LIBOR
|
42
|
|
April 30, 2010
|
September 30, 2026
|
|||||||
Capital Leases
Saale Energie GmbH
Saale Energie GmbH, or SEG, an NRG wholly-owned subsidiary, has a
41.9%
participation in Schkopau through NRG's interest in the Kraftwerke Schkopau GbR, or KSGbR, partnership. Under the terms of a Use and Benefit Fee Agreement, SEG and the other partner to the project, E.ON Kraftwerke GmbH, are required to fund debt service and certain other costs resulting from the construction and financing of Schkopau. The Use and Benefit Fee Agreement is treated as a capital lease under U.S. GAAP. Calls for funds are made to the partners based on their participation interest as cash is needed. As of
December 31, 2011
, the capital lease obligation at SEG was
$103 million
.
The KSGbR issued debt to fund Schkopau pursuant to multiple facilities totaling
€785 million
. As of
December 31, 2011
,
€117 million
(approximately
$152 million
) remained outstanding at Schkopau. Interest accrues on the individual loans at fixed rates averaging
6.70%
per annum, with maturities occurring between 2012 and 2020. SEG remains liable to the lenders as a partner in KSGbR, but there is no recourse to NRG.
158
Consolidated Annual Maturities and Future Minimum Lease Payments
Annual payments based on the maturities of NRG's debt and capital leases, for the years ending after
December 31, 2011
are as follows:
|
|
(In millions)
|
||
|
2012
|
$
|
87
|
|
|
2013
|
71
|
|
|
|
2014
|
496
|
|
|
|
2015
|
129
|
|
|
|
2016
|
137
|
|
|
|
Thereafter
|
8,912
|
|
|
|
Total
|
$
|
9,832
|
|
NRG's future minimum lease payments for capital leases included above as of
December 31, 2011
, are as follows:
|
|
(In millions)
|
||
|
2012
|
$
|
11
|
|
|
2013
|
10
|
|
|
|
2014
|
8
|
|
|
|
2015
|
7
|
|
|
|
2016
|
5
|
|
|
|
Thereafter
|
82
|
|
|
|
Total minimum obligations
|
123
|
|
|
|
Interest
|
20
|
|
|
|
Present value of minimum obligations
|
103
|
|
|
|
Current portion
|
8
|
|
|
|
Long-term obligations
|
$
|
95
|
|
159
NRG's AROs are primarily related to the future dismantlement of equipment on leased property and environmental obligations related to nuclear decommissioning, ash disposal, site closures, and fuel storage facilities. In addition, NRG has also identified conditional AROs for asbestos removal and disposal, which are specific to certain power generation operations.
See Note 7,
Nuclear Decommissioning Trust Fund,
for a further discussion of NRG's nuclear decommissioning obligations. Consequently, accretion for the nuclear decommissioning ARO and amortization of the related ARO asset are recorded to the Nuclear Decommissioning Trust Liability to the ratepayers and are not included in net income, consistent with regulatory treatment.
The following table represents the balance of ARO obligations as of December 31, 2011, and 2010, along with the additions, reductions and accretion related to the Company's ARO obligations for the year ended
December 31, 2011
:
|
|
(In millions)
|
||
|
Balance as of December 31, 2010
|
$
|
432
|
|
|
Revisions in estimates for current obligations
|
(10
|
)
|
|
|
Spending for current obligations
|
(5
|
)
|
|
|
Accretion — Expense
|
8
|
|
|
|
Accretion — Nuclear decommissioning
|
18
|
|
|
|
Balance as of December 31, 2011
|
$
|
443
|
|
160
NRG sponsors and operates
three
defined benefit pension and other postretirement plans. The NRG Plan for Bargained Employees and the NRG Plan for Non-bargained Employees are maintained solely for eligible legacy NRG participants. A third plan, the Texas Genco Retirement Plan, is maintained for participation by eligible Texas based employees. NRG expects to contribute
$23 million
to the Company's three pension plans in 2012.
NRG Plans for Bargained and Non-bargained Employees
— Substantially all employees hired prior to December 5, 2003, were eligible to participate in NRG's legacy defined benefit pension plans. The Company initiated a noncontributory, defined benefit pension plan effective January 1, 2004, with credit for service from December 5, 2003. In addition, the Company provides postretirement health and welfare benefits for certain groups of employees. Generally, these are groups that were acquired prior to 2004 and for whom prior benefits are being continued (at least for a certain period of time or as required by union contracts). Cost sharing provisions vary by acquisition group and terms of any applicable collective bargaining agreements.
Texas Genco Retirement Plan
— The Texas region's pension plan is a noncontributory defined benefit pension plan that provides a final average pay benefit or cash balance benefit, where the participant receives the more favorable of the two formulas, based on all years of service. In addition, employees who were hired prior to 1999 are also eligible for grandfathered benefits under a final average pay formula. In most cases, the benefits under the grandfathered formula were frozen on December 31, 2008. NRG's Texas region employees are also covered under an unfunded postretirement health and welfare plan. Each year, employees receive a fixed credit of
$750
to their account plus interest. At retirement, the employees may use their accounts to purchase retiree medical and dental benefits from NRG. NRG's costs are limited to the amounts earned in the employee's account; all other costs are paid by the participant.
NRG Defined Benefit Plans
The net annual periodic pension cost related to NRG domestic pension and other postretirement benefit plans include the following components:
|
|
Year Ended December 31,
|
||||||||||
|
|
Pension Benefits
|
||||||||||
|
|
2011
|
2010
|
2009
|
||||||||
|
|
(In millions)
|
||||||||||
|
Service cost benefits earned
|
$
|
14
|
|
$
|
14
|
|
$
|
12
|
|
||
|
Interest cost on benefit obligation
|
21
|
|
21
|
|
20
|
|
|||||
|
Expected return on plan assets
|
(21
|
)
|
(20
|
)
|
(16
|
)
|
|||||
|
Amortization of unrecognized net gain
|
—
|
|
—
|
|
1
|
|
|||||
|
Net periodic benefit cost
|
$
|
14
|
|
$
|
15
|
|
$
|
17
|
|
||
|
|
Year Ended December 31,
|
||||||||||
|
|
Other Postretirement Benefits
|
||||||||||
|
|
2011
|
2010
|
2009
|
||||||||
|
|
(In millions)
|
||||||||||
|
Service cost benefits earned
|
$
|
2
|
|
$
|
2
|
|
$
|
2
|
|
||
|
Interest cost on benefit obligation
|
6
|
|
6
|
|
6
|
|
|||||
|
Amortization of unrecognized prior service cost
|
—
|
|
—
|
|
1
|
|
|||||
|
Net periodic benefit cost
|
$
|
8
|
|
$
|
8
|
|
$
|
9
|
|
||
161
A comparison of the pension benefit obligation, other postretirement benefit obligations, and related plan assets for NRG's plans on a combined basis is as follows:
|
|
As of December 31,
|
||||||||||||||
|
|
Pension Benefits
|
Other Postretirement
Benefits
|
|||||||||||||
|
|
2011
|
2010
|
2011
|
2010
|
|||||||||||
|
|
(In millions)
|
||||||||||||||
|
Benefit obligation at January 1
|
$
|
404
|
|
$
|
357
|
|
$
|
106
|
|
$
|
104
|
|
|||
|
Service cost
|
14
|
|
14
|
|
2
|
|
2
|
|
|||||||
|
Interest cost
|
21
|
|
21
|
|
6
|
|
6
|
|
|||||||
|
Plan amendments
|
—
|
|
—
|
|
—
|
|
(5
|
)
|
|||||||
|
Actuarial loss
|
34
|
|
24
|
|
9
|
|
—
|
|
|||||||
|
Employee and retiree contributions
|
—
|
|
—
|
|
1
|
|
1
|
|
|||||||
|
Benefit payments
|
(17
|
)
|
(12
|
)
|
(2
|
)
|
(2
|
)
|
|||||||
|
Benefit obligation at December 31
|
456
|
|
404
|
|
122
|
|
106
|
|
|||||||
|
Fair value of plan assets at January 1
|
297
|
|
263
|
|
—
|
|
—
|
|
|||||||
|
Actual return on plan assets
|
10
|
|
30
|
|
—
|
|
—
|
|
|||||||
|
Employee contributions
|
—
|
|
—
|
|
1
|
|
1
|
|
|||||||
|
Employer contributions
|
18
|
|
16
|
|
1
|
|
1
|
|
|||||||
|
Benefit payments
|
(17
|
)
|
(12
|
)
|
(2
|
)
|
(2
|
)
|
|||||||
|
Fair value of plan assets at December 31
|
308
|
|
297
|
|
—
|
|
—
|
|
|||||||
|
Funded status at December 31 — excess of obligation over assets
|
$
|
(148
|
)
|
$
|
(107
|
)
|
$
|
(122
|
)
|
$
|
(106
|
)
|
|||
Amounts recognized in NRG's balance sheets were as follows:
|
|
As of December 31,
|
||||||||||||||
|
|
Pension Benefits
|
Other Postretirement
Benefits
|
|||||||||||||
|
|
2011
|
2010
|
2011
|
2010
|
|||||||||||
|
|
(In millions)
|
||||||||||||||
|
Current liabilities
|
$
|
—
|
|
$
|
—
|
|
$
|
3
|
|
$
|
2
|
|
|||
|
Non-current liabilities
|
148
|
|
107
|
|
119
|
|
104
|
|
|||||||
Amounts recognized in NRG's accumulated OCI that have not yet been recognized as components of net periodic benefit cost were as follows:
|
|
As of December 31,
|
||||||||||||||
|
|
Pension Benefits
|
Other Postretirement
Benefits
|
|||||||||||||
|
|
2011
|
2010
|
2011
|
2010
|
|||||||||||
|
|
(In millions)
|
||||||||||||||
|
Unrecognized loss
|
$
|
88
|
|
$
|
42
|
|
$
|
11
|
|
$
|
1
|
|
|||
|
Prior service (credit)/cost
|
(2
|
)
|
(2
|
)
|
(1
|
)
|
—
|
|
|||||||
162
Other changes in plan assets and benefit obligations recognized in other comprehensive income were as follows:
|
|
Year Ended December 31,
|
||||||||||||||
|
|
Pension
Benefits
|
Other Postretirement
Benefits
|
|||||||||||||
|
|
2011
|
2010
|
2011
|
2010
|
|||||||||||
|
|
(In millions)
|
||||||||||||||
|
Unrecognized loss
|
$
|
46
|
|
$
|
13
|
|
$
|
9
|
|
$
|
—
|
|
|||
|
Prior service cost/(credit)
|
—
|
|
—
|
|
—
|
|
(5
|
)
|
|||||||
|
Amortization for prior service cost/(credit)
|
—
|
|
1
|
|
—
|
|
—
|
|
|||||||
|
Total recognized in other comprehensive loss/(gain)
|
$
|
46
|
|
$
|
14
|
|
$
|
9
|
|
$
|
(5
|
)
|
|||
|
Total recognized in net periodic pension cost and other comprehensive income
|
$
|
60
|
|
$
|
28
|
|
$
|
17
|
|
$
|
3
|
|
|||
The Company's estimated unrecognized loss for NRG's domestic pension plan that will be amortized from accumulated OCI to net periodic cost over the next fiscal year is approximately
$4 million
. The Company's estimated unrecognized loss for NRG's postretirement plan that will be amortized from accumulated OCI to net periodic cost over the next fiscal year is minimal.
The following table presents the balances of significant components of NRG's domestic pension plan:
|
|
As of December 31,
|
||||||
|
|
Pension Benefits
|
||||||
|
|
2011
|
2010
|
|||||
|
|
(In millions)
|
||||||
|
Projected benefit obligation
|
$
|
456
|
|
$
|
404
|
|
|
|
Accumulated benefit obligation
|
392
|
|
347
|
|
|||
|
Fair value of plan assets
|
308
|
|
297
|
|
|||
NRG's market-related value of its plan assets is the fair value of the assets. The fair values of the Company's pension plan assets by asset category and their level within the fair value hierarchy are as follows:
|
|
Fair Value Measurements as of December 31, 2011
|
||||||||||
|
|
Quoted Prices in
Active Markets for
Identical Assets
(Level 1)
|
Significant
Observable Inputs
(Level 2)
|
Total
|
||||||||
|
|
(In millions)
|
||||||||||
|
U.S. equity investment
|
$
|
47
|
|
$
|
—
|
|
$
|
47
|
|
||
|
International equity investment
|
18
|
|
—
|
|
18
|
|
|||||
|
Corporate bond investment-fixed income
|
37
|
|
—
|
|
37
|
|
|||||
|
Common/collective trust investment — U.S. equity
|
—
|
|
78
|
|
78
|
|
|||||
|
Common/collective trust investment — international equity
|
—
|
|
32
|
|
32
|
|
|||||
|
Common/collective trust investment — fixed income
|
—
|
|
96
|
|
96
|
|
|||||
|
Total
|
$
|
102
|
|
$
|
206
|
|
$
|
308
|
|
||
163
|
|
Fair Value Measurements as of December 31, 2010
|
||||||||||
|
|
Quoted Prices in
Active Markets for
Identical Assets
(Level 1)
|
Significant
Observable Inputs
(Level 2)
|
Total
|
||||||||
|
|
(In millions)
|
||||||||||
|
U.S. equity investment
|
$
|
46
|
|
$
|
—
|
|
$
|
46
|
|
||
|
International equity investment
|
19
|
|
—
|
|
19
|
|
|||||
|
Corporate bond investment-fixed income
|
31
|
|
—
|
|
31
|
|
|||||
|
Common/collective trust investment — U.S. equity
|
—
|
|
80
|
|
80
|
|
|||||
|
Common/collective trust investment — international equity
|
—
|
|
35
|
|
35
|
|
|||||
|
Common/collective trust investment — fixed income
|
—
|
|
85
|
|
85
|
|
|||||
|
Short-term investment fund
|
—
|
|
1
|
|
1
|
|
|||||
|
Total
|
$
|
96
|
|
$
|
201
|
|
$
|
297
|
|
||
In accordance with ASC 820, the Company determines the level in the fair value hierarchy within which each fair value measurement in its entirety falls, based on the lowest level input that is significant to the fair value measurement in its entirety. The fair value of the U.S. and international equity investments and the corporate bond investment is based on quoted prices in active markets, and is categorized as Level 1. All equity investments are valued at the net asset value of shares held at year end. The fair value of the corporate bond investment is based on the closing price reported on the active market on which the individual securities are traded. The fair value of the common/collective trusts is valued at fair value which is equal to the sum of the market value of all of the fund's underlying investments, and is categorized as Level 2. There are no investments categorized as Level 3.
The following table presents the significant assumptions used to calculate NRG's benefit obligations:
|
|
As of December 31,
|
||||||||||
|
|
Pension Benefits
|
Other Postretirement Benefits
|
|||||||||
|
Weighted-Average Assumptions
|
2011
|
2010
|
2011
|
2010
|
|||||||
|
Discount rate
|
4.98
|
%
|
5.47
|
%
|
5.18
|
%
|
5.77
|
%
|
|||
|
Rate of compensation increase
|
4.00-4.50%
|
|
4.00-4.50%
|
|
N/A
|
|
N/A
|
|
|||
|
Health care trend rate
|
—
|
|
—
|
|
8% grading to
5% in 2019 |
|
8% grading to
5% in 2019 |
|
|||
The following table presents the significant assumptions used to calculate NRG's benefit expense:
|
|
As of December 31,
|
||||||||||||||||
|
|
Pension Benefits
|
Other Postretirement Benefits
|
|||||||||||||||
|
Weighted-Average Assumptions
|
2011
|
2010
|
2009
|
2011
|
2010
|
2009
|
|||||||||||
|
Discount rate
|
5.47
|
%
|
5.93
|
%
|
6.88
|
%
|
5.77
|
%
|
6.14
|
%
|
6.88
|
%
|
|||||
|
Expected return on plan assets
|
7.25%-7.50%
|
|
7.50
|
%
|
7.50
|
%
|
—
|
|
—
|
|
—
|
|
|||||
|
Rate of compensation increase
|
4.00-4.50%
|
|
4.00-4.50%
|
|
4.00-4.50%
|
|
—
|
|
—
|
|
—
|
|
|||||
|
Health care trend rate
|
—
|
|
—
|
|
—
|
|
8.0% grading to
5.0% in 2019 |
9.5% grading to
5.5% in 2016 |
9.5% grading to
5.5% in 2016 |
||||||||
NRG uses December 31 of each respective year as the measurement date for the Company's pension and other postretirement benefit plans. The Company sets the discount rate assumptions on an annual basis for each of NRG's retirement related benefit plans at their respective measurement date. This rate is determined by NRG's Investment Committee based on information provided by the Company's actuary. The discount rate assumptions reflect the current rate at which the associated liabilities could be effectively settled at the end of the year. The discount rate assumptions used to determine future pension obligations as of December 31, 2011, were based on the Aon Hewitt AA Above Median (AAM) yield curve; which was designed by Aon Hewitt to provide a means for corporate plan sponsors to value the liabilities of defined benefit and other post retirement benefit plans. The AAM is a hypothetical Aa yield curve represented by a series of annualized individual discount rates from
0.5
to
99
years. Each bond issue is required to have an average rating of AA, when averaging all available ratings by Moody's Investor Services, Standard &
164
Poor's and Fitch. The discount rate assumptions used to determine future pension obligations as of December 31, 2010, and
2009
were based on the Hewitt Yield Curve, or HYC, which was designed by Hewitt Associates to provide a means for plan sponsors to value the liabilities of their postretirement benefit plans. The HYC is a hypothetical yield curve represented by a series of annualized individual discount rates. Each bond issue underlying the HYC is required to have a rating of Aa or better by Moody's Investor Service, Inc. or a rating of AA or better by Standard & Poor's.
NRG employs a total return investment approach, whereby a mix of equities and fixed income investments are used to maximize the long-term return of plan assets for a prudent level of risk. Risk tolerance is established through careful consideration of plan liabilities, plan funded status, and corporate financial condition. The target allocation of plan assets is
47%
to
73%
invested in equity securities of which
34%
to
51%
is invested in U.S. equity securities, with the remainder invested in fixed income securities. The Investment Committee reviews the asset mix periodically and as the plan assets increase in future years, the Investment Committee may examine other asset classes such as real estate or private equity. NRG employs a building block approach to determining the long-term rate of return for plan assets, with proper consideration given to diversification and rebalancing. Historical markets are studied and long-term historical relationships between equities and fixed income are preserved, consistent with the widely accepted capital market principle that assets with higher volatility generate a greater return over the long run. Current factors such as inflation and interest rates are evaluated before long-term capital market assumptions are determined. Peer data and historical returns are reviewed to check for reasonableness and appropriateness.
Plan assets are currently invested in a diversified blend of equity and fixed-income investments. Furthermore, equity investments are diversified across U.S. and non-U.S. equities, as well as among growth, value, small and large capitalization stocks.
NRG's pension plan assets weighted average allocations were as follows:
|
|
As of December 31,
|
||
|
|
2011
|
2010
|
|
|
U.S. equity
|
33.5-50.5%
|
33.5-50.5%
|
|
|
International equity
|
13.5-22.5%
|
13.5-22.5%
|
|
|
U.S. fixed income
|
30-50%
|
30-50%
|
|
NRG's expected future benefit payments for each of the next five years, and in the aggregate for the five years thereafter, are as follows:
|
|
|
Other Postretirement Benefit
|
|||||||||
|
|
Pension
Benefit Payments
|
Benefit Payments
|
Medicare Prescription Drug Reimbursements
|
||||||||
|
(In millions)
|
|||||||||||
|
2012
|
$
|
21
|
|
$
|
3
|
|
$
|
—
|
|
||
|
2013
|
23
|
|
3
|
|
—
|
|
|||||
|
2014
|
24
|
|
4
|
|
—
|
|
|||||
|
2015
|
26
|
|
4
|
|
—
|
|
|||||
|
2016
|
29
|
|
5
|
|
—
|
|
|||||
|
2017-2021
|
182
|
|
33
|
|
1
|
|
|||||
Assumed health care cost trend rates have a significant effect on the amounts reported for the health care plans. A one-percentage-point change in assumed health care cost trend rates would have the following effect:
|
1-Percentage-
Point Increase
|
1-Percentage-
Point Decrease
|
||||||
|
|
(In millions)
|
||||||
|
Effect on total service and interest cost components
|
$
|
1
|
|
$
|
(1
|
)
|
|
|
Effect on postretirement benefit obligation
|
9
|
|
(7
|
)
|
|||
165
STP Defined Benefit Plans
NRG has a
44%
undivided ownership interest in STP, as discussed further in Note 27,
Jointly Owned Plants
. South Texas Project Nuclear Operating Company, or STPNOC, which operates and maintains STP, provides its employees a defined benefit pension plan as well as postretirement health and welfare benefits. Although NRG does not sponsor the STP plan, it reimburses STPNOC for
44%
of the contributions made towards its retirement plan obligations. For the years ending
December 31, 2011
, and
2010
NRG reimbursed STPNOC approximately
$12 million
and
$4 million
, respectively, towards its defined benefit plans. In 2012, NRG expects to reimburse STPNOC
$15 million
for its contributions towards the plans.
The Company has recognized the following in its statement of financial position, statement of operations and accumulated OCI related to its
44%
interest in STP:
|
|
As of December 31,
|
||||||||||||||
|
|
Pension Benefits
|
Other
Postretirement Benefits
|
|||||||||||||
|
|
2011
|
2010
|
2011
|
2010
|
|||||||||||
|
|
(In millions)
|
||||||||||||||
|
Funded status — STPNOC benefit plans
|
$
|
(67
|
)
|
$
|
(55
|
)
|
$
|
(49
|
)
|
$
|
(40
|
)
|
|||
|
Net periodic benefit costs
|
9
|
|
8
|
|
6
|
|
4
|
|
|||||||
|
Other changes in plan assets and benefit obligations recognized in other comprehensive income
|
15
|
|
8
|
|
3
|
|
7
|
|
|||||||
Defined Contribution Plans
NRG's employees have also been eligible to participate in defined contribution 401(k) plans. The Company's contributions to these plans were as follows:
|
|
Year Ended December 31,
|
||||||||||
|
|
2011
|
2010
|
2009
|
||||||||
|
|
(In millions)
|
||||||||||
|
Company contributions to defined contribution plans
|
$
|
24
|
|
$
|
28
|
|
$
|
22
|
|
||
166
For the period from December 31, 2008, to
December 31, 2011
, the Company had
10,000,000
shares of preferred stock authorized and
500,000,000
shares of common stock authorized. The following table reflects the changes in NRG's preferred and common shares issued and outstanding for each period presented:
|
|
Preferred Stock Issued and Outstanding
|
Common
|
|||||||||||||||
|
|
3.625%
|
4%
|
5.75%
|
Issued
|
Treasury
|
Outstanding
|
|||||||||||
|
Balance as of December 31, 2008
|
250,000
|
|
420,000
|
|
1,841,680
|
|
263,599,200
|
|
(29,242,483
|
)
|
234,356,717
|
|
|||||
|
Shares issued under ESPP
|
—
|
|
—
|
|
—
|
|
—
|
|
81,532
|
|
81,532
|
|
|||||
|
Shares loaned to affiliates of CS
|
—
|
|
—
|
|
—
|
|
—
|
|
12,000,000
|
|
12,000,000
|
|
|||||
|
Shares returned by affiliate of CS
|
—
|
|
—
|
|
—
|
|
—
|
|
(5,400,000
|
)
|
(5,400,000
|
)
|
|||||
|
Capital Allocation Plan repurchases
|
—
|
|
—
|
|
—
|
|
—
|
|
(19,305,500
|
)
|
(19,305,500
|
)
|
|||||
|
Shares issued from LTIP
|
—
|
|
—
|
|
—
|
|
367,858
|
|
—
|
|
367,858
|
|
|||||
|
4.00% Preferred Stock conversion
|
—
|
|
(265,870
|
)
|
—
|
|
13,293,500
|
|
—
|
|
13,293,500
|
|
|||||
|
4.00% Preferred Stock redeemed for cash
|
—
|
|
(73
|
)
|
—
|
|
—
|
|
—
|
|
—
|
|
|||||
|
5.75% Preferred Stock conversion
|
—
|
|
—
|
|
(1,841,680
|
)
|
18,601,201
|
|
—
|
|
18,601,201
|
|
|||||
|
Balance as of December 31, 2009
|
250,000
|
|
154,057
|
|
—
|
|
295,861,759
|
|
(41,866,451
|
)
|
253,995,308
|
|
|||||
|
Shares issued under ESPP
|
—
|
|
—
|
|
—
|
|
—
|
|
120,990
|
|
120,990
|
|
|||||
|
Shares returned by affiliate of CS
|
—
|
|
—
|
|
—
|
|
—
|
|
(6,600,000
|
)
|
(6,600,000
|
)
|
|||||
|
Capital Allocation Plan repurchases
|
—
|
|
—
|
|
—
|
|
—
|
|
(8,463,211
|
)
|
(8,463,211
|
)
|
|||||
|
Shares issued from LTIP
|
—
|
|
—
|
|
—
|
|
442,818
|
|
—
|
|
442,818
|
|
|||||
|
4.00% Preferred Stock conversion
|
—
|
|
(154,029
|
)
|
—
|
|
7,701,450
|
|
—
|
|
7,701,450
|
|
|||||
|
4.00% Preferred Stock redeemed for cash
|
—
|
|
(28
|
)
|
—
|
|
—
|
|
—
|
|
—
|
|
|||||
|
Balance as of December 31, 2010
|
250,000
|
|
—
|
|
—
|
|
304,006,027
|
|
(56,808,672
|
)
|
247,197,355
|
|
|||||
|
Shares issued under ESPP
|
—
|
|
—
|
|
—
|
|
—
|
|
120,127
|
|
120,127
|
|
|||||
|
Shares issued under LTIP
|
—
|
|
—
|
|
—
|
|
177,693
|
|
—
|
|
177,693
|
|
|||||
|
Capital Allocation Plan repurchases
|
—
|
|
—
|
|
—
|
|
—
|
|
(19,975,654
|
)
|
(19,975,654
|
)
|
|||||
|
Balance as of December 31, 2011
|
250,000
|
|
—
|
|
—
|
|
304,183,720
|
|
(76,664,199
|
)
|
227,519,521
|
|
|||||
Common Stock
The following table summarizes NRG's common stock reserved for the maximum number of shares potentially issuable based on the conversion and redemption features of outstanding equity instruments and the long-term incentive plan as of
December 31, 2011
.
|
Equity Instrument
|
Common Stock
Reserve Balance
|
|
|
3.625% Convertible perpetual preferred
|
16,000,000
|
|
|
Long-term incentive plan
|
18,573,196
|
|
|
Total
|
34,573,196
|
|
Capital Allocation Plan
— As part of the Company's Capital Allocation Program, the Company returns capital to shareholders through NRG common stock repurchases under the Capital Allocation Plan. Shares repurchased are included in treasury stock.
Employee Stock Purchase Plan
— Under the NRG Energy, Inc. Employee Stock Purchase Plan, or ESPP, eligible employees may elect to withhold up to
10%
of their eligible compensation to purchase shares of NRG common stock at
85%
of its fair market value on the exercise date. An exercise date occurs each June 30 and December 31. As of
December 31, 2011
, there remained
177,351
shares of treasury stock reserved for issuance under the ESPP, and in the first quarter of 2012,
76,423
shares of common stock were issued to employee accounts from treasury stock.
Share Lending Agreements
— On February 20, 2009, Common Stock Finance, or CSF, I and II entered into Share Lending Agreements, or SLAs, with affiliates of Credit Suisse Group, or CS, relating to the shares of NRG common stock held by CSF I and II in connection with the CSF Debt. CSF I and CSF II loaned
12,000,000
shares of NRG common stock to affiliates of CS in the first quarter 2009. The shares were treated as outstanding for corporate law purposes, but were not considered outstanding for the purpose of computing and reporting the Company's basic or diluted earnings per share, because the CS affiliates were required to return all borrowed shares (or identical shares).
167
In the fourth quarter 2009, CS returned
5,400,000
of these shares in connection with the maturity of the CSF II Debt, and
6,600,000
common shares, with a fair value of
$156 million
, remained outstanding at December 31, 2009. CS returned these
6,600,000
shares of NRG as part of the CSF I Debt unwind on March 2, 2010. The
12,000,000
shares of NRG common stock were returned to treasury stock and are no longer be treated as outstanding for corporate law purposes.
Preferred Stock
5.75% Preferred Stock
On February 2, 2006, NRG completed the issuance of
2,000,000
shares of 5.75% Mandatory Convertible Preferred Stock, or 5.75% Preferred Stock, for net proceeds of
$486 million
, reflecting an offering price of
$250
per share and the deduction of offering expenses and discounts of
$14 million
. Dividends on the 5.75% Preferred Stock were
$14.375
per share per year, and were due and payable on a quarterly basis beginning on March 15, 2006. The 5.75% Preferred Stock agreement provided for automatic conversion into common stock on March 16, 2009, and for earlier conversion under certain circumstances. All conversions and redemptions were completed by March 25, 2009.
4% Preferred Stock
The Company's 4% Convertible Perpetual Preferred Stock, or 4% Preferred Stock, had a liquidation preference of
$1,000
per share, and its holders were entitled to receive cash dividends at the rate of 4% per annum, or
$40.00
per share per year, payable quarterly in arrears commencing on March 15, 2005. The 4% Preferred Stock was convertible, at the option of the holder, at any time into shares of NRG's common stock at an initial conversion price of
$20.00
per share. In addition, NRG had the ability to redeem, on or after December 20, 2009, and subject to certain limitations, some or all of the 4% Preferred Stock with cash at a redemption price equal to
100%
of the liquidation preference, plus accumulated but unpaid dividends, including liquidated damages, if any, to the redemption date. In the fourth quarter of 2009, NRG notified the holders of the Company's intention to redeem the 4% Preferred Stock, and the majority of the holders elected to convert their shares in response to this notification. All conversions and redemptions were completed by January 21, 2010.
Redeemable Preferred Stock
3.625% Preferred Stock
On August 11, 2005, NRG issued
250,000
shares of 3.625% Convertible Perpetual Preferred Stock, or 3.625% Preferred Stock, which is treated as Redeemable Preferred Stock, to CS in a private placement. The 3.625% Preferred Stock amount is located after the liabilities but before the stockholders' equity section on the balance sheet, due to the fact that the preferred shares can be redeemed in cash by the stockholder. The 3.625% Preferred Stock has a liquidation preference of
$1,000
per share. Holders of the 3.625% Preferred Stock are entitled to receive, out of legally available funds, cash dividends at the rate of 3.625% per annum, or
$36.25
per share per year, payable in cash quarterly in arrears commencing on December 15, 2005.
Each share of the 3.625% Preferred Stock is convertible during the
90
-day period beginning August 11, 2015, at the option of NRG or the holder.
Holders tendering the 3.625% Preferred Stock for conversion shall be entitled to receive, for each share of 3.625% Preferred Stock converted, $1,000 in cash and a number of shares of NRG common stock equal in value to the product of (a) the greater of (i) the difference between the average closing share price of NRG common stock on each of the twenty consecutive scheduled trading days starting on the date thirty exchange business days immediately prior to the conversion date, or the Market Price, and $29.54 and (ii) zero, times (b) 50.77. The number of NRG common stock to be delivered under the conversion feature is limited to 16,000,000 shares. If upon conversion, the Market Price is less than $19.69, then the Holder will deliver to NRG cash or a number of shares of NRG common stock equal in value to the product of (i) $19.69 minus the Market Price, times (ii) 50.77.
NRG may elect to make a cash payment in lieu of delivering shares of NRG common stock in connection with such conversion, and NRG may elect to receive cash in lieu of shares of common stock, if any, from the Holder in connection with such conversion. The conversion feature is considered an embedded derivative per ASC 815 that is exempt from derivative accounting as it is excluded from the scope pursuant to ASC 815.
If a fundamental change occurs, the holders will have the right to require NRG to repurchase all or a portion of the 3.625% Preferred Stock for a period of time after the fundamental change at a purchase price equal to
100%
of the liquidation preference, plus accumulated and unpaid dividends. The 3.625% Preferred Stock is senior to all classes of common stock, and junior to all of the Company's existing and future debt obligations and all of NRG subsidiaries' existing and future liabilities and capital stock held by persons other than NRG or its subsidiaries.
168
NRG accounts for the Company's significant investments using the equity method of accounting. NRG's carrying value of equity investments can be impacted by impairments, unrealized gains and losses on derivatives and movements in foreign currency exchange rates, as well as other adjustments.
The following table summarizes NRG's equity method investments as of
December 31, 2011
:
|
Name
|
Geographic Area
|
Economic
Interest
|
|
|
Avenal Solar Holdings LLC
|
United States
|
50.0
|
%
|
|
GenConn Energy LLC
|
United States
|
50.0
|
%
|
|
Saguaro Power Company
|
United States
|
50.0
|
%
|
|
Sherbino I Wind Farm LLC
|
United States
|
50.0
|
%
|
|
Texas Coastal Ventures, LLC
|
United States
|
50.0
|
%
|
|
Gladstone Power Station
|
Australia
|
37.5
|
%
|
|
Energy Technology Ventures
|
United States
|
33.3
|
%
|
|
|
As of December 31,
|
||||||
|
|
2011
|
2010
|
|||||
|
|
(In millions)
|
||||||
|
Undistributed earnings from equity investments
|
$
|
150
|
|
$
|
160
|
|
|
Variable Interest Entities, or VIEs
NRG accounts for its interests in certain entities that are considered VIEs under ASC 810, but NRG is not the primary beneficiary, under the equity method.
GenConn Energy LLC
— Through its subsidiary, NRG Connecticut Peaking, NRG owns a
50%
interest in GenConn, a limited liability company formed to construct, own and operate
two
200
MW peaking generation facilities in Connecticut at NRG's Devon and Middletown sites. Each of these facilities was constructed pursuant to
30
-year cost of service type contracts with the Connecticut Light & Power Company. All
four
units at the GenConn Devon facility reached commercial operation in 2010 and were released to the ISO-NE by July 2010. In June 2011, the GenConn Middletown facility reached commercial operation and was released to the ISO-NE.
The project was funded through equity contributions from the owners and non-recourse, project level debt. As of December 31,
2010
, NRG Connecticut Peaking had
$61 million
, of outstanding borrowings under an EBL, as described in Note 12,
Debt and Capital Leases
and had a note receivable due from GenConn for
$62 million
as discussed in Note 9,
Capital Leases and Notes Receivable
. When the Middletown project reached its commercial operations date, NRG Connecticut Peaking repaid the
$61 million
portion of the EBL used to fund the Middletown project, and converted
$62 million
of the note receivable from GenConn into equity. As of December 31, 2011, NRG had a
$131 million
equity investment in GenConn. NRG's maximum exposure to loss is limited to its equity investment.
In April 2009, GenConn secured financing for
50%
of the Devon and Middletown project construction costs through a
seven
-year term loan facility, and also entered into a
five
-year revolving working capital loan and letter of credit facility, which collectively with the term loan is referred to as the GenConn Facility. The aggregate credit amount secured under the GenConn Facility, which is non-recourse to NRG, is
$291 million
, including
$48 million
for the working capital facility. GenConn began to draw under the GenConn Facility to cover costs related to the Devon project in August 2009, and the Middletown project in June 2010. During 2011, the GenConn Facility was fully drawn and GenConn repaid
$6 million
of the GenConn Facility. As of December 31, 2011,
$237 million
was outstanding for the GenConn facility.
As discussed in Note 21,
Related Party Transactions
, NRG earned revenues from construction management agreements with Devon and Middletown and interest income from the note receivable with GenConn.
169
Sherbino I Wind Farm LLC
— NRG owns a
50%
interest in Sherbino, a joint venture with BP Wind Energy North America Inc. Sherbino is a
150
MW wind farm, which commenced commercial operations in October 2008. In December 2008, Sherbino entered into a
15
-year term loan facility which is non-recourse to NRG. As of
December 31, 2011
, the outstanding principal balance of the term loan facility was
$125 million
, and is secured by substantially all of Sherbino's assets and membership interests. NRG's maximum exposure to loss is limited to its equity investment, which was
$100 million
as of
December 31, 2011
.
Texas Coastal Ventures, LLC
—
NRG owns a
50%
interest in Texas Coastal Ventures, LLC, or TCV, a joint venture with Hilcorp Energy I, L.P., through its subsidiary Petra Nova LLC. Texas Coastal Ventures was formed by Petra Nova and Hilcorp for the purpose of using carbon dioxide captured from flue gas from certain of NRG's coal-generating power plants in the United States Gulf Coast in an enhanced oil recovery process. TCV is managed by the joint venture participants and operated by Hilcorp. TCV entered into service agreements with Petra Nova LLC, which include a management services agreement for the operation and management of the joint venture's pipeline assets, as well as a CO
2
supply agreement having an initial term of
twenty
years. NRG's maximum exposure to loss is limited to its equity investment, which was
$48 million
as of
December 31, 2011
.
Other Equity Investments
Gladstone
— Through a joint venture, NRG owns a
37.5%
interest in Gladstone, a
1,613
megawatt coal-fueled power generation facility in Queensland, Australia. The power generation facility is managed by the joint venture participants and the facility is operated by NRG. Operating expenses incurred in connection with the operation of the facility are funded by each of the participants in proportion to their ownership interests. Coal is sourced from local mines in Queensland. NRG and the joint venture participants receive their respective share of revenues directly from the off takers in proportion to the ownership interests in the joint venture. Power generated by the facility is primarily sold to an adjacent aluminum smelter, with excess power sold to the Queensland Government owned utility under long term supply contracts.
170
Basic earnings per common share is computed by dividing net income less accumulated preferred stock dividends by the weighted average number of common shares outstanding. Shares issued and treasury shares repurchased during the year are weighted for the portion of the year that they were outstanding. Diluted earnings per share is computed in a manner consistent with that of basic earnings per share while giving effect to all potentially dilutive common shares that were outstanding during the period. Share borrowed under the SLA (see
Note 15
,
Capital Structure
) were not treated as outstanding for earnings per share purposes.
Dilutive effect for equity compensation
— The outstanding non-qualified stock options, non-vested restricted stock units, deferred stock units and performance units are not considered outstanding for purposes of computing basic earnings per share. However, these instruments are included in the denominator for purposes of computing diluted earnings per share under the treasury stock method.
Dilutive effect for other equity instruments
— Prior to their conversion, NRG's
4%
and
5.75%
Preferred Stock were not considered outstanding for purposes of computing basic earnings per share. However, these instruments were considered for inclusion in the denominator for purposes of computing diluted earnings per share under the if-converted method. The if-converted method is also used to determine the dilutive effect of embedded derivatives in the Company's
3.625%
Preferred Stock.
The reconciliation of NRG's basic earnings per share to diluted earnings per share is shown in the following table:
|
|
Year Ended December 31,
|
||||||||||
|
|
2011
|
2010
|
2009
|
||||||||
|
|
(In millions, except per share amounts)
|
||||||||||
|
Basic earnings per share attributable to NRG common stockholders
|
|
|
|
||||||||
|
Numerator:
|
|
|
|
||||||||
|
Net income attributable to NRG Energy, Inc.
|
$
|
197
|
|
$
|
477
|
|
$
|
942
|
|
||
|
Preferred stock dividends
|
(9
|
)
|
(9
|
)
|
(33
|
)
|
|||||
|
Net income attributable to NRG Energy, Inc. available to common stockholders
|
$
|
188
|
|
$
|
468
|
|
$
|
909
|
|
||
|
Denominator:
|
|
|
|
||||||||
|
Weighted average number of common shares outstanding
|
240
|
|
252
|
|
246
|
|
|||||
|
Basic earnings per share:
|
|
|
|
||||||||
|
Net income attributable to NRG Energy, Inc.
|
$
|
0.78
|
|
$
|
1.86
|
|
$
|
3.70
|
|
||
|
Diluted earnings per share attributable to NRG common stockholders
|
|
|
|
||||||||
|
Numerator:
|
|
|
|
||||||||
|
Net income attributable to NRG Energy, Inc.
|
$
|
188
|
|
$
|
468
|
|
$
|
909
|
|
||
|
Add preferred stock dividends for dilutive preferred stock
|
—
|
|
—
|
|
23
|
|
|||||
|
Net income attributable to NRG Energy, Inc. available to common stockholders
|
$
|
188
|
|
$
|
468
|
|
$
|
932
|
|
||
|
Denominator:
|
|
|
|
||||||||
|
Weighted average number of common shares outstanding
|
240
|
|
252
|
|
246
|
|
|||||
|
Incremental shares attributable to the issuance of equity compensation (treasury stock method)
|
1
|
|
1
|
|
1
|
|
|||||
|
Incremental shares attributable to the assumed conversion features of outstanding preferred stock (if-converted method)
|
—
|
|
1
|
|
24
|
|
|||||
|
Total dilutive shares
|
241
|
|
254
|
|
271
|
|
|||||
|
Diluted earnings per share:
|
|
|
|
||||||||
|
Net income attributable to NRG Energy, Inc.
|
$
|
0.78
|
|
$
|
1.84
|
|
$
|
3.44
|
|
||
The following table summarizes NRG's outstanding equity instruments that are anti-dilutive and were not included in the computation of the Company's diluted earnings per share:
|
|
Year Ended December 31,
|
|||||||
|
|
2011
|
2010
|
2009
|
|||||
|
|
(In millions of shares)
|
|||||||
|
Equity compensation — NQSOs and PUs
|
7
|
|
6
|
|
6
|
|
||
|
Embedded derivative of 3.625% redeemable perpetual preferred stock
|
16
|
|
16
|
|
16
|
|
||
|
Total
|
23
|
|
22
|
|
22
|
|
||
171
NRG's segment structure reflects core areas of operation which are primarily segregated based on the Company's wholesale power generation, Reliant Energy, thermal and chilled water business, and corporate activities. In May 2009, NRG's segment structure changed to reflect the Company's acquisition of Reliant Energy and has been incorporated as a separate reporting segment as per ASC 280,
Segment Reporting
. Within NRG's wholesale power generation operations, there are distinct components with separate operating results and management structures for the following geographical regions: Texas, Northeast, South Central, West and International. The Company's corporate activities include solar and wind development, Green Mountain Energy, and Energy Plus. Intersegment supply sales between Texas, Northeast, and the Retail Businesses are accounted for at market.
For the years ended December 31, 2011, 2010, and 2009, there were
no
customers from whom the Company derived more than
10%
of the Company's consolidated revenues.
|
|
Year Ended December 31, 2011
|
||||||||||||||||||||||||||||||||||||||
|
|
|
Wholesale Power Generation
|
|
|
|
|
|||||||||||||||||||||||||||||||||
|
|
Reliant
Energy
|
Texas
(a)
|
North -east
(b)
|
South
Central
|
West
|
Inter-national
|
Thermal
|
Corporate
(c)
|
Elimi-nation
|
Total
|
|||||||||||||||||||||||||||||
|
|
(In millions)
|
||||||||||||||||||||||||||||||||||||||
|
Operating revenues
|
$
|
4,938
|
|
$
|
2,868
|
|
$
|
924
|
|
$
|
817
|
|
$
|
160
|
|
$
|
144
|
|
$
|
142
|
|
$
|
715
|
|
$
|
(1,629
|
)
|
$
|
9,079
|
|
|||||||||
|
Operating expenses
|
4,438
|
|
1,957
|
|
846
|
|
701
|
|
101
|
|
118
|
|
111
|
|
745
|
|
(1,629
|
)
|
7,388
|
|
|||||||||||||||||||
|
Depreciation and amortization
|
96
|
|
491
|
|
118
|
|
89
|
|
13
|
|
—
|
|
14
|
|
75
|
|
—
|
|
896
|
|
|||||||||||||||||||
|
Impairment charge on emission allowances
|
—
|
|
160
|
|
—
|
|
—
|
|
—
|
|
—
|
|
—
|
|
—
|
|
—
|
|
160
|
|
|||||||||||||||||||
|
Operating income/(loss)
|
404
|
|
260
|
|
(40
|
)
|
27
|
|
46
|
|
26
|
|
17
|
|
(105
|
)
|
—
|
|
635
|
|
|||||||||||||||||||
|
Equity in earnings/(loss) of unconsolidated affiliates
|
—
|
|
4
|
|
11
|
|
—
|
|
11
|
|
9
|
|
—
|
|
—
|
|
—
|
|
35
|
|
|||||||||||||||||||
|
Impairment charge on investment
|
—
|
|
—
|
|
—
|
|
—
|
|
—
|
|
—
|
|
—
|
|
(495
|
)
|
—
|
|
(495
|
)
|
|||||||||||||||||||
|
Other income/(loss), net
|
—
|
|
1
|
|
2
|
|
2
|
|
3
|
|
5
|
|
—
|
|
21
|
|
(15
|
)
|
19
|
|
|||||||||||||||||||
|
Loss on debt extinguishment and refinancing expense
|
—
|
|
—
|
|
—
|
|
—
|
|
—
|
|
—
|
|
—
|
|
(175
|
)
|
—
|
|
(175
|
)
|
|||||||||||||||||||
|
Interest (expense)/income
|
(4
|
)
|
5
|
|
(47
|
)
|
(41
|
)
|
(7
|
)
|
(6
|
)
|
(9
|
)
|
(571
|
)
|
15
|
|
(665
|
)
|
|||||||||||||||||||
|
Income/(loss) before income taxes
|
400
|
|
270
|
|
(74
|
)
|
(12
|
)
|
53
|
|
34
|
|
8
|
|
(1,325
|
)
|
—
|
|
(646
|
)
|
|||||||||||||||||||
|
Income tax expense/(benefit)
|
—
|
|
—
|
|
—
|
|
—
|
|
—
|
|
7
|
|
—
|
|
(850
|
)
|
—
|
|
(843
|
)
|
|||||||||||||||||||
|
Net income/(loss)
|
400
|
|
270
|
|
(74
|
)
|
(12
|
)
|
53
|
|
27
|
|
8
|
|
(475
|
)
|
—
|
|
197
|
|
|||||||||||||||||||
|
Balance sheet
|
|
|
|
|
|
|
|
|
|
|
|||||||||||||||||||||||||||||
|
Equity investments in affiliates
|
$
|
—
|
|
$
|
100
|
|
$
|
136
|
|
$
|
—
|
|
$
|
34
|
|
$
|
308
|
|
$
|
—
|
|
$
|
62
|
|
$
|
—
|
|
$
|
640
|
|
|||||||||
|
Capital expenditures
(d)
|
19
|
|
121
|
|
188
|
|
25
|
|
2,088
|
|
—
|
|
20
|
|
141
|
|
—
|
|
2,602
|
|
|||||||||||||||||||
|
Goodwill
|
—
|
|
1,713
|
|
—
|
|
—
|
|
—
|
|
—
|
|
—
|
|
173
|
|
—
|
|
1,886
|
|
|||||||||||||||||||
|
Total assets
|
$
|
1,876
|
|
$
|
13,680
|
|
$
|
2,042
|
|
$
|
1,436
|
|
$
|
3,122
|
|
$
|
634
|
|
$
|
350
|
|
$
|
20,592
|
|
$
|
(17,017
|
)
|
$
|
26,715
|
|
|||||||||
|
(a)
|
Includes inter-segment sales of
$1,567 million
to other segments.
|
|
(b)
|
Includes inter-segment sales of
$44 million
to other segments.
|
|
(c)
|
Includes Green Mountain Energy results, and Energy Plus results for the period September 30, 2011 to December 31, 2011
|
|
(d)
|
Includes accruals.
|
172
|
|
Year Ended December 31, 2010
|
||||||||||||||||||||||||||||||||||||||
|
|
|
Wholesale Power Generation
|
|
|
|
|
|||||||||||||||||||||||||||||||||
|
|
Reliant
Energy
|
Texas
(a)
|
North-east
|
South
Central
|
West
|
Inter-national
|
Thermal
|
Corporate
(b)
|
Elimi-nation
|
Total
|
|||||||||||||||||||||||||||||
|
|
(In millions)
|
||||||||||||||||||||||||||||||||||||||
|
Operating revenues
|
$
|
4,990
|
|
$
|
3,057
|
|
$
|
1,025
|
|
$
|
608
|
|
$
|
144
|
|
$
|
128
|
|
$
|
143
|
|
$
|
66
|
|
$
|
(1,312
|
)
|
$
|
8,849
|
|
|||||||||
|
Operating expenses
|
4,510
|
|
1,773
|
|
838
|
|
503
|
|
98
|
|
101
|
|
120
|
|
95
|
|
(1,312
|
)
|
6,726
|
|
|||||||||||||||||||
|
Depreciation and amortization
|
117
|
|
491
|
|
122
|
|
67
|
|
11
|
|
—
|
|
12
|
|
18
|
|
—
|
|
838
|
|
|||||||||||||||||||
|
Gains on sale of asset
|
—
|
|
—
|
|
—
|
|
—
|
|
—
|
|
—
|
|
—
|
|
23
|
|
—
|
|
23
|
|
|||||||||||||||||||
|
Operating income/(loss)
|
363
|
|
793
|
|
65
|
|
38
|
|
35
|
|
27
|
|
11
|
|
(24
|
)
|
—
|
|
1,308
|
|
|||||||||||||||||||
|
Equity in earnings of unconsolidated affiliates
|
—
|
|
14
|
|
1
|
|
—
|
|
6
|
|
24
|
|
—
|
|
(1
|
)
|
—
|
|
44
|
|
|||||||||||||||||||
|
Other income/(loss), net
|
—
|
|
2
|
|
4
|
|
1
|
|
1
|
|
18
|
|
—
|
|
24
|
|
(17
|
)
|
33
|
|
|||||||||||||||||||
|
Loss on debt extinguishment and refinancing expense
|
—
|
|
—
|
|
—
|
|
—
|
|
—
|
|
—
|
|
—
|
|
(2
|
)
|
—
|
|
(2
|
)
|
|||||||||||||||||||
|
Interest (expense)/income
|
(5
|
)
|
67
|
|
(57
|
)
|
(46
|
)
|
(3
|
)
|
(7
|
)
|
(7
|
)
|
(589
|
)
|
17
|
|
(630
|
)
|
|||||||||||||||||||
|
Income/(loss) before income taxes
|
358
|
|
876
|
|
13
|
|
(7
|
)
|
39
|
|
62
|
|
4
|
|
(592
|
)
|
—
|
|
753
|
|
|||||||||||||||||||
|
Income tax expense
|
—
|
|
—
|
|
—
|
|
—
|
|
—
|
|
17
|
|
—
|
|
260
|
|
—
|
|
277
|
|
|||||||||||||||||||
|
Net income/(loss)
|
358
|
|
876
|
|
13
|
|
(7
|
)
|
39
|
|
45
|
|
4
|
|
(852
|
)
|
—
|
|
476
|
|
|||||||||||||||||||
|
Less: Net loss attributable to noncontrolling interest
|
—
|
|
(1
|
)
|
—
|
|
—
|
|
—
|
|
—
|
|
—
|
|
—
|
|
—
|
|
(1
|
)
|
|||||||||||||||||||
|
Net income/(loss) attributable to NRG Energy, Inc.
|
$
|
358
|
|
$
|
877
|
|
$
|
13
|
|
$
|
(7
|
)
|
$
|
39
|
|
$
|
45
|
|
$
|
4
|
|
$
|
(852
|
)
|
$
|
—
|
|
$
|
477
|
|
|||||||||
|
Balance sheet
|
|
|
|
|
|
|
|
|
|
|
|||||||||||||||||||||||||||||
|
Equity investments in affiliates
|
$
|
—
|
|
$
|
101
|
|
$
|
67
|
|
$
|
—
|
|
$
|
42
|
|
$
|
312
|
|
$
|
—
|
|
$
|
14
|
|
$
|
—
|
|
$
|
536
|
|
|||||||||
|
Capital expenditures
(c)
|
12
|
|
88
|
|
206
|
|
18
|
|
100
|
|
—
|
|
29
|
|
646
|
|
—
|
|
1,099
|
|
|||||||||||||||||||
|
Goodwill
|
—
|
|
1,713
|
|
—
|
|
—
|
|
—
|
|
—
|
|
—
|
|
155
|
|
—
|
|
1,868
|
|
|||||||||||||||||||
|
Total assets
|
$
|
1,544
|
|
$
|
13,357
|
|
$
|
1,891
|
|
$
|
1,350
|
|
$
|
449
|
|
$
|
743
|
|
$
|
337
|
|
$
|
30,513
|
|
$
|
(23,288
|
)
|
$
|
26,896
|
|
|||||||||
|
(a)
|
Includes inter-segment sales of
$1,301 million
to Reliant Energy, and
$2 million
to Green Mountain Energy, and
$69 million
interest income from intercompany receivables due from Corporate.
|
|
(b)
|
Includes Green Mountain Energy results for the period November 5, 2010, to December 31, 2010.
|
|
(c)
|
Includes accruals.
|
|
|
Year Ended December 31, 2009
|
||||||||||||||||||||||||||||||||||||||
|
|
Wholesale Power Generation
|
|
|
|
|
||||||||||||||||||||||||||||||||||
|
|
Reliant
Energy (a) |
Texas
(b)
|
North-east
|
South
Central
|
West
|
Inter-national
|
Thermal
|
Corporate
|
Elimi-nation
|
Total
|
|||||||||||||||||||||||||||||
|
|
(In millions)
|
||||||||||||||||||||||||||||||||||||||
|
Operating revenues
|
$
|
4,182
|
|
$
|
2,946
|
|
$
|
1,201
|
|
$
|
581
|
|
$
|
150
|
|
$
|
144
|
|
$
|
135
|
|
$
|
28
|
|
$
|
(415
|
)
|
$
|
8,952
|
|
|||||||||
|
Operating expenses
|
3,044
|
|
1,634
|
|
740
|
|
508
|
|
110
|
|
116
|
|
112
|
|
129
|
|
(418
|
)
|
5,975
|
|
|||||||||||||||||||
|
Depreciation and amortization
|
137
|
|
472
|
|
118
|
|
67
|
|
8
|
|
—
|
|
10
|
|
6
|
|
—
|
|
818
|
|
|||||||||||||||||||
|
Operating income/(loss)
|
1,001
|
|
840
|
|
343
|
|
6
|
|
32
|
|
28
|
|
13
|
|
(107
|
)
|
3
|
|
2,159
|
|
|||||||||||||||||||
|
Equity in earnings/(loss) of
unconsolidated affiliates
|
—
|
|
—
|
|
—
|
|
—
|
|
10
|
|
31
|
|
—
|
|
—
|
|
—
|
|
41
|
|
|||||||||||||||||||
|
Gains on sales of equity method investments
|
—
|
|
—
|
|
—
|
|
—
|
|
—
|
|
128
|
|
—
|
|
—
|
|
—
|
|
128
|
|
|||||||||||||||||||
|
Other income, net
|
—
|
|
7
|
|
2
|
|
1
|
|
—
|
|
(20
|
)
|
—
|
|
27
|
|
(22
|
)
|
(5
|
)
|
|||||||||||||||||||
|
Loss on debt extinguishment and refinancing expense
|
(1
|
)
|
—
|
|
—
|
|
—
|
|
—
|
|
—
|
|
—
|
|
(19
|
)
|
—
|
|
(20
|
)
|
|||||||||||||||||||
|
Interest expense
|
(34
|
)
|
(4
|
)
|
(54
|
)
|
(48
|
)
|
(2
|
)
|
(8
|
)
|
(5
|
)
|
(497
|
)
|
18
|
|
(634
|
)
|
|||||||||||||||||||
|
Income/(loss) before income taxes
|
966
|
|
843
|
|
291
|
|
(41
|
)
|
40
|
|
159
|
|
8
|
|
(596
|
)
|
(1
|
)
|
1,669
|
|
|||||||||||||||||||
|
Income tax expense
|
—
|
|
171
|
|
—
|
|
—
|
|
—
|
|
9
|
|
—
|
|
548
|
|
—
|
|
728
|
|
|||||||||||||||||||
|
Net income/(loss)
|
966
|
|
672
|
|
291
|
|
(41
|
)
|
40
|
|
150
|
|
8
|
|
(1,144
|
)
|
(1
|
)
|
941
|
|
|||||||||||||||||||
|
Less: Net loss attributable to noncontrolling interest
|
—
|
|
(1
|
)
|
—
|
|
—
|
|
—
|
|
—
|
|
—
|
|
—
|
|
—
|
|
(1
|
)
|
|||||||||||||||||||
|
Net income/(loss) attributable to NRG Energy, Inc
.
|
$
|
966
|
|
$
|
673
|
|
$
|
291
|
|
$
|
(41
|
)
|
$
|
40
|
|
$
|
150
|
|
$
|
8
|
|
$
|
(1,144
|
)
|
$
|
(1
|
)
|
$
|
942
|
|
|||||||||
|
(a)
|
Results are for the period May 1, 2009, to December 31, 2009.
|
|
(b)
|
Includes inter-segment sales of
$411 million
to Reliant Energy.
|
173
The income tax provision from continuing operations consisted of the following amounts:
|
|
Year Ended December 31,
|
||||||||||
|
|
2011
|
2010
|
2009
|
||||||||
|
|
(In millions, except percentages)
|
||||||||||
|
Current
|
|
|
|
||||||||
|
U.S. Federal
|
$
|
(538
|
)
|
$
|
211
|
|
$
|
99
|
|
||
|
State
|
10
|
|
35
|
|
20
|
|
|||||
|
Foreign
|
16
|
|
23
|
|
18
|
|
|||||
|
(512
|
)
|
269
|
|
137
|
|
||||||
|
Deferred
|
|
|
|
||||||||
|
U.S. Federal
|
(317
|
)
|
23
|
|
599
|
|
|||||
|
State
|
(5
|
)
|
(9
|
)
|
1
|
|
|||||
|
Foreign
|
(9
|
)
|
(6
|
)
|
(9
|
)
|
|||||
|
(331
|
)
|
8
|
|
591
|
|
||||||
|
Total income tax
|
$
|
(843
|
)
|
$
|
277
|
|
$
|
728
|
|
||
|
Effective tax rate
|
130.5
|
%
|
36.8
|
%
|
43.6
|
%
|
|||||
The following represents the domestic and foreign components of income before income tax expense:
|
|
Year Ended December 31,
|
||||||||||
|
|
2011
|
2010
|
2009
|
||||||||
|
|
(In millions)
|
||||||||||
|
U.S.
|
$
|
(680
|
)
|
$
|
691
|
|
$
|
1,508
|
|
||
|
Foreign
|
34
|
|
62
|
|
161
|
|
|||||
|
Total
|
$
|
(646
|
)
|
$
|
753
|
|
$
|
1,669
|
|
||
174
A reconciliation of the U.S. federal statutory rate of
35%
to NRG's effective rate is as follows:
|
|
Year Ended December 31,
|
||||||||||
|
|
2011
|
2010
|
2009
|
||||||||
|
|
(In millions, except percentages)
|
||||||||||
|
(Loss)/Income Before Income Taxes
|
$
|
(646
|
)
|
$
|
753
|
|
$
|
1,669
|
|
||
|
Tax at 35%
|
(226
|
)
|
264
|
|
584
|
|
|||||
|
State taxes, net of federal benefit
|
15
|
|
18
|
|
23
|
|
|||||
|
Foreign operations
|
(3
|
)
|
(3
|
)
|
(53
|
)
|
|||||
|
Federal and state tax credits
|
(1
|
)
|
(7
|
)
|
—
|
|
|||||
|
Valuation allowance
|
(63
|
)
|
(34
|
)
|
119
|
|
|||||
|
Expiration/utilization of capital losses
|
45
|
|
—
|
|
249
|
|
|||||
|
Reversal of valuation allowance on expired/utilized capital losses
|
(45
|
)
|
—
|
|
(249
|
)
|
|||||
|
Change in state effective tax rate
|
—
|
|
—
|
|
(5
|
)
|
|||||
|
Foreign earnings
|
4
|
|
17
|
|
33
|
|
|||||
|
Non-deductible interest
|
—
|
|
4
|
|
10
|
|
|||||
|
Interest accrued on uncertain tax positions
|
2
|
|
25
|
|
9
|
|
|||||
|
Production tax credit
|
(14
|
)
|
(11
|
)
|
(10
|
)
|
|||||
|
Reversal of uncertain tax position reserves
|
(561
|
)
|
—
|
|
—
|
|
|||||
|
Other
|
4
|
|
4
|
|
18
|
|
|||||
|
Income tax (benefit)/expense
|
$
|
(843
|
)
|
$
|
277
|
|
$
|
728
|
|
||
|
Effective income tax rate
|
130.5
|
%
|
36.8
|
%
|
43.6
|
%
|
|||||
The effective tax rate for the year ended
December 31, 2011
, differs from the statutory rate of
35%
primarily due to a benefit of
$633 million
resulting from the resolution of the federal tax audit. The benefit is predominantly due to the recognition of previously uncertain tax benefits that were settled upon audit in 2011 and that were mainly composed of net operating losses of
$536 million
which had been classified as capital loss carryforwards for financial statement purposes.
The effective tax rate for the year ended December 31, 2010, differs from the statutory rate of
35%
primarily due to the impact of state and local income taxes and interest on uncertain tax positions, which were partially offset by the reduction in the valuation allowance resulting from realized capital gains as well as federal and state tax credits generated during the current year.
The effective income tax rate for the year ended December 31, 2009, differs from the U.S. statutory rate of
35%
primarily due to an increase in the valuation allowance as a result of capital losses generated during the period. In addition, the current earnings in foreign jurisdictions are taxed at rates lower than the U.S. statutory rate, including the sale of the MIBRAG facility which resulted in minimal tax due to the local jurisdiction.
175
The temporary differences, which gave rise to the Company's deferred tax assets and liabilities consisted of the following:
|
|
As of December 31,
|
||||||
|
|
2011
|
2010
|
|||||
|
|
(In millions)
|
||||||
|
Deferred tax liabilities:
|
|
|
|||||
|
Discount/premium on notes
|
$
|
7
|
|
$
|
9
|
|
|
|
Emissions allowances
|
92
|
|
116
|
|
|||
|
Difference between book and tax basis of property
|
1,604
|
|
1,652
|
|
|||
|
Derivatives, net
|
244
|
|
362
|
|
|||
|
Goodwill
|
139
|
|
117
|
|
|||
|
Anticipated repatriation of foreign earnings
|
—
|
|
6
|
|
|||
|
Cumulative translation adjustments
|
27
|
|
28
|
|
|||
|
Intangibles amortization (excluding goodwill)
|
229
|
|
180
|
|
|||
|
Investment in projects
|
111
|
|
71
|
|
|||
|
Other
|
8
|
|
—
|
|
|||
|
Total deferred tax liabilities
|
2,461
|
|
2,541
|
|
|||
|
Deferred tax assets:
|
|
|
|||||
|
Deferred compensation, pension, accrued vacation and other reserves
|
80
|
|
67
|
|
|||
|
Differences between book and tax basis of contracts
|
225
|
|
59
|
|
|||
|
Pension and other postretirement benefits
|
137
|
|
111
|
|
|||
|
Non-depreciable property
|
—
|
|
19
|
|
|||
|
Equity compensation
|
36
|
|
30
|
|
|||
|
Bad debt reserve
|
15
|
|
12
|
|
|||
|
U.S. capital loss carryforwards
|
1
|
|
92
|
|
|||
|
U.S. Federal net operating loss carryforwards
|
84
|
|
—
|
|
|||
|
Foreign net operating loss carryforwards
|
70
|
|
74
|
|
|||
|
State net operating loss carryforwards
|
53
|
|
23
|
|
|||
|
Foreign capital loss carryforwards
|
1
|
|
1
|
|
|||
|
Deferred financing costs
|
—
|
|
6
|
|
|||
|
Federal and state tax credits
|
64
|
|
34
|
|
|||
|
Federal benefit on state uncertain tax positions
|
20
|
|
31
|
|
|||
|
Contingent liability reserve
|
—
|
|
30
|
|
|||
|
NINA impairment
|
183
|
|
—
|
|
|||
|
Emission allowance impairment
|
59
|
|
—
|
|
|||
|
Other
|
—
|
|
46
|
|
|||
|
Total deferred tax assets
|
1,028
|
|
635
|
|
|||
|
Valuation allowance
|
(83
|
)
|
(191
|
)
|
|||
|
Net deferred tax assets
|
945
|
|
444
|
|
|||
|
Net deferred tax liability
|
$
|
1,516
|
|
$
|
2,097
|
|
|
176
The following table summarizes NRG's net deferred tax position:
|
|
As of December 31,
|
||||||
|
|
2011
|
2010
|
|||||
|
|
(In millions)
|
||||||
|
Current deferred tax liability
|
$
|
127
|
|
$
|
108
|
|
|
|
Non-current deferred tax liability
|
1,389
|
|
1,989
|
|
|||
|
Net deferred tax liability
|
$
|
1,516
|
|
$
|
2,097
|
|
|
Tax Receivable and Payable
As of
December 31, 2011
, NRG recorded a current tax payable of
$17 million
that represents a tax liability due for domestic state taxes of
$14 million
, as well as foreign taxes payable of
$3 million
. NRG has a domestic tax receivable of
$56 million
, of which
$25 million
relates to federal cash grants applied for eligible solar energy projects under development in New Mexico and Arizona,
$18 million
is related to property tax refunds due to the New York State Empire Zone program and
$13 million
primarily is due to federal refunds on prior year returns. In addition, we have recorded a
$49 million
non-current asset for Empire Zone credits generated in 2010 and 2011 that are being deferred pursuant to New York State law.
Deferred tax assets and valuation allowance
Net deferred tax balance
— As of
December 31, 2011
, and
2010
, NRG recorded a net deferred tax liability of
$1.4 billion
and
$1.9 billion
, respectively. However, due to an assessment of positive and negative evidence, including projected capital gains and available tax planning strategies, NRG believes that it is more likely than not that a benefit will not be realized on
$83 million
and
$191 million
of tax assets, thus a valuation allowance has remained, resulting in a net deferred tax liability of
$1.5 billion
and
$2.1 billion
as of
December 31, 2011
, and
2010
, respectively. NRG believes it is more likely than not that future earnings will be sufficient to utilize the Company's deferred tax assets, net of the existing valuation allowances at
December 31, 2011
.
NOL carryforwards
— At
December 31, 2011
, the Company had domestic net operating losses, or NOLs, consisting of carryforwards for federal income tax purposes of
$84 million
and cumulative state NOLs of
$53 million
. In addition, NRG has cumulative foreign NOL carryforwards of
$70 million
of which
$20 million
will expire starting 2012 through 2019 and of which
$50 million
do not have an expiration date. At December 31, 2010 the Company had state NOLs of
$23 million
and cumulative foreign NOL carryforwards of
$74 million
.
Valuation allowance
— As of
December 31, 2011
, the Company's valuation allowance was reduced by
$108 million
, primarily due to resolution of the federal tax audit.
Uncertain tax benefits
NRG has identified uncertain tax benefits whose after-tax value was
$178 million
that if recognized, would impact the Company's income tax expense.
As of
December 31, 2011
, and
2010
, NRG has recorded a non-current tax liability of
$58 million
and
$582 million
, respectively. As of December 31, 2011, the balance primarily related to positions taken on various state returns, including accrued interest. As of December 31, 2010, the balance primarily related to taxable earnings for the period for which there are no NOLs available to offset for financial statement purposes.
The Company recognizes interest and penalties related to uncertain tax benefits in income tax expense. During the year ended December 31, 2011, the Company recognized a benefit of
$32 million
in interest and penalties due to the IRS settlement and accrued interest of
$2 million
. For the year ended December 31, 2010, the Company recognized
$25 million
in interest and penalties. As of December 31, 2011, and 2010, NRG had accrued interest and penalties related to these uncertain tax benefits of
$12 million
and
$42 million
, respectively.
Tax jurisdictions
— NRG is subject to examination by taxing authorities for income tax returns filed in the U.S. federal jurisdiction and various state and foreign jurisdictions including operations located in Germany and Australia. The Company is no longer subject to U.S. federal income tax examinations for years prior to 2007. With few exceptions, state and local income tax examinations are no longer open for years before 2003. The Company's significant foreign operations are also no longer subject to examination by local jurisdictions for years prior to 2004.
177
During 2011, the Company settled the Internal Revenue Service's audit examination for the years 2004 through 2006 and recognized a benefit of
$633 million
. The benefit is predominantly due to the recognition of previously uncertain tax benefits mainly composed of net operating losses of
$536 million
which had been classified as capital loss carryforwards for financial statement purposes. The Company continues to be under examination for various state jurisdictions for multiple years.
The following table reconciles the total amounts of uncertain tax benefits:
|
|
As of December 31,
|
||||||
|
|
2011
|
2010
|
|||||
|
|
(In millions)
|
||||||
|
Balance as of January 1
|
$
|
663
|
|
$
|
643
|
|
|
|
Increase due to current year positions
|
12
|
|
27
|
|
|||
|
Decrease due to current year positions
|
(6
|
)
|
(15
|
)
|
|||
|
Increase due to prior year positions
|
6
|
|
16
|
|
|||
|
Decrease due to prior year positions
|
(2
|
)
|
(7
|
)
|
|||
|
Decrease due to settlements and payments
|
(495
|
)
|
—
|
|
|||
|
Decrease due to statute expirations
|
—
|
|
(1
|
)
|
|||
|
Uncertain tax benefits as of December 31
|
$
|
178
|
|
$
|
663
|
|
|
Included in the balance at
December 31, 2011
, are
$30 million
of tax positions for which the ultimate deductibility is highly certain but for which there is uncertainty about the timing of such deductions. Because of the impact of deferred tax accounting, other than interest and penalties, the disallowance of the shorter deductibility period would not affect the annual effective tax rate but would accelerate the payment of cash or use of net operating loss carryforwards to an earlier period.
178
Long-Term Incentive Plan, or LTIP
As of
December 31, 2011
, and
2010
, a total of
22,000,000
shares of NRG common stock were authorized for issuance under the LTIP, subject to adjustments in the event of reorganization, recapitalization, stock split, reverse stock split, stock dividend, and a combination of shares, merger or similar change in NRG's structure or outstanding shares of common stock. There were
7,957,697
and
10,141,819
shares of common stock remaining available for grants under NRG's LTIP as of
December 31, 2011
, and
2010
, respectively.
Non-Qualified Stock Options, or NQSOs
NQSOs granted under the LTIP typically have
three
or
five
-year graded vesting schedules beginning on the grant date and become exercisable at the end of the requisite service period. NRG recognizes compensation costs for NQSOs over the requisite service period for the entire award. The maximum contractual term is
ten
years for
3.0 million
of NRG's outstanding NQSOs, and
six
years for the remaining
2.6 million
NQSOs.
The following table summarizes the Company's NQSO activity and changes during the year:
|
Shares
|
Weighted
Average
Exercise Price
|
Weighted
Average
Remaining
Contractual Term
(In years)
|
Aggregate
Intrinsic Value
(In millions)
|
||||||||||
|
|
(In whole)
|
|
|
||||||||||
|
Outstanding at December 31, 2010
|
5,079,399
|
|
$
|
24.22
|
|
4
|
|
$
|
8
|
|
|||
|
Granted
|
1,168,000
|
|
19.86
|
|
|
|
|
|
|||||
|
Forfeited
|
(564,433
|
)
|
28.21
|
|
|
|
|
|
|||||
|
Exercised
|
(99,777
|
)
|
22.28
|
|
|
|
|
|
|||||
|
Outstanding at December 31, 2011
|
5,583,189
|
|
22.93
|
|
4
|
|
7
|
|
|||||
|
Exercisable at December 31, 2011
|
3,706,813
|
|
23.72
|
|
2
|
|
7
|
|
|||||
The following table summarizes the weighted average grant date fair value of options granted, the total intrinsic value of options exercised, and the cash received from the exercises of options:
|
|
Year Ended December 31,
|
||||||||||
|
|
2011
|
2010
|
2009
|
||||||||
|
|
(In millions, except for weighted average)
|
||||||||||
|
Weighted average grant date fair value per option granted
|
$
|
8.73
|
|
$
|
10.22
|
|
$
|
8.64
|
|
||
|
Total intrinsic value of options exercised
|
0.2
|
|
0.3
|
|
1.4
|
|
|||||
|
Cash received from the exercise of options exercised
|
2
|
|
2
|
|
2
|
|
|||||
The fair value of the Company's NQSOs is estimated on the date of grant using the Black-Scholes option-pricing model. Significant assumptions used in the fair value model with respect to the Company's NQSOs are summarized below:
|
|
Year Ended December 31,
|
|||||
|
|
2011
|
2010
|
2009
|
|||
|
Expected volatility
|
42.38%-42.57%
|
41.28%-42.57%
|
44.36%-48.29%
|
|
||
|
Expected term (in years)
|
6
|
6-6.5
|
4
|
|
||
|
Risk free rate
|
1.42%-2.71%
|
1.54%-3.01%
|
1.43%-1.93%
|
|
||
For the years ended
December 31, 2011
,
2010
, and
2009
, expected volatility is calculated based on NRG's historical stock price volatility data over the period commensurate with the expected term of the stock option. Typically, the expected term for the Company's NQSOs is based on the simple average of the contractual term and vesting term. The Company uses this simplified method as it does not have sufficient historical exercise data to provide a reasonable basis upon which to estimate the expected term.
179
Restricted Stock Units, or RSUs
Typically, RSUs granted under the Company's LTIP fully vest three years from the date of issuance. Fair value of the RSUs is based on the closing price of NRG common stock on the date of grant. The following table summarizes the Company's non-vested RSU awards and changes during the year:
|
Units
|
Weighted Average
Grant-Date Fair
Value per Unit
|
|||||
|
|
(In whole)
|
|||||
|
Non-vested at December 31, 2010
|
1,439,839
|
|
$
|
26.30
|
|
|
|
Granted
|
1,186,900
|
|
21.22
|
|
||
|
Forfeited
|
(182,880
|
)
|
22.97
|
|
||
|
Vested
|
(101,344
|
)
|
36.44
|
|
||
|
Non-vested at December 31, 2011
|
2,342,515
|
|
23.54
|
|
||
The total fair value of RSUs vested during the years ended
December 31, 2011
,
2010
, and
2009
, was
$2 million
,
$9 million
and
$8 million
, respectively. The weighted average grant date fair value of RSUs granted during the years ended
December 31, 2011
,
2010
, and
2009
was
$21.22
,
$22.78
, and
$26.13
, respectively.
Deferred Stock Units, or DSUs
DSUs represent the right of a participant to be paid one share of NRG common stock at the end of a deferral period established under the terms of the award. DSUs granted under the Company's LTIP are fully vested at the date of issuance. Fair value of the DSUs, which is based on the closing price of NRG common stock on the date of grant, is recorded as compensation expense in the period of grant.
The following table summarizes the Company's outstanding DSU awards and changes during the year:
|
Units
|
Weighted Average
Grant-Date Fair
Value per Unit
|
|||||
|
|
(In whole)
|
|||||
|
Outstanding at December 31, 2010
|
334,721
|
|
$
|
19.63
|
|
|
|
Granted
|
53,896
|
|
24.31
|
|
||
|
Conversions
|
(14,933
|
)
|
25.41
|
|
||
|
Outstanding at December 31, 2011
|
373,684
|
|
20.07
|
|
||
The aggregate intrinsic values for DSUs outstanding as of
December 31, 2011
,
2010
, and
2009
were approximately
$8 million
,
$7 million
, and
$7 million
respectively. The aggregate intrinsic values for DSUs converted to common stock for the years ended
December 31, 2011
,
2010
, and
2009
were
$0.4 million
,
$0.7 million
and
$0.5 million
, respectively. The weighted average grant date fair value of DSUs granted during the years ended
December 31, 2011
,
2010
, and
2009
was
$24.31
,
$22.18
and
$22.77
, respectively.
Performance Units, or PUs
PUs granted under the Company's LTIP fully vest three years from the date of issuance.
PUs granted prior to January 1, 2009, are paid out upon vesting if the closing price of NRG's common stock on the vesting date, or the Measurement Price, is equal to or greater than the Target Price. PUs granted after January 1, 2009, are paid out upon vesting if the Measurement Price is equal to or greater than Threshold Price. The Threshold Price, Target Price and Maximum Price are determined on the date of issuance. The payout for each PU will be equal to: (i) a pro-rata amount between 0.5 and 1 share of common stock, if the Measurement Price is equal to or greater than the target Threshold Price but less than the Target Price, for grants made after January 1, 2009; (ii) one share of common stock, if the Measurement Price equals the Target Price; (iii) a pro-rata amount between one and two shares of common stock, if the Measurement Price is greater than the Target Price but less than the Maximum Price; and (iv) two shares of common stock, if the Measurement Price is equal to, or greater than, the Maximum Price.
180
The following table summarizes the Company's non-vested PU awards and changes during the year:
|
Outstanding
Units
|
Weighted Average
Grant-Date Fair
Value per Unit
|
|||||
|
|
(In whole)
|
|||||
|
Non-vested at December 31, 2010
|
819,000
|
|
$
|
23.71
|
|
|
|
Granted
|
504,800
|
|
20.80
|
|
||
|
Forfeited
|
(284,300
|
)
|
24.98
|
|
||
|
Non-vested at December 31, 2011
|
1,039,500
|
|
21.95
|
|
||
The weighted average grant date fair value of PUs granted during the years ended
December 31, 2011
,
2010
, and
2009
was
$20.80
,
$22.70
, and
$22.91
, respectively.
The fair value of PUs is estimated on the date of grant using a Monte Carlo simulation model and expensed over the service period, which equals the vesting period. Significant assumptions used in the fair value model with respect to the Company's PUs are summarized below:
|
2011
|
2010
|
2009
|
||||
|
Expected volatility
|
46.96%-53.15%
|
44.77%-53.81%
|
48.48%-53.00%
|
|
||
|
Expected term (in years)
|
3
|
3-5
|
3
|
|
||
|
Risk free rate
|
0.50%-1.41%
|
0.59%-1.66%
|
1.14%-1.48%
|
|
||
For the years ended
December 31, 2011
,
2010
, and
2009
, expected volatility is calculated based on NRG's historical stock price volatility data over the period commensurate with the expected term of the PU, which equals the vesting period.
Supplemental Information
The following table summarizes NRG's total compensation expense recognized for the years presented as well as total non-vested compensation costs not yet recognized and the period over which this expense is expected to be recognized as of
December 31, 2011
, for each of the
four
types of awards issued under the Company's LTIP. Minimum tax withholdings of
$1 million
,
$4 million
, and
$3 million
during
2011
,
2010
, and
2009
, respectively, are reflected as a reduction to Additional Paid-in Capital on the Company's statement of financial position, and are reflected as operating activities on the Company's statement of cash flows.
|
|
|
|
|
Non-vested Compensation Cost
|
|||||||||||||||
|
|
Compensation Expense
|
Unrecognized
Total Cost
|
Weighted Average
Recognition Period
Remaining
(In years)
|
||||||||||||||||
|
|
Year Ended December 31
|
As of December 31
|
|||||||||||||||||
|
Award
|
2011
|
2010
|
2009
|
2011
|
2011
|
||||||||||||||
|
|
(In millions, except weighted average data)
|
||||||||||||||||||
|
NQSOs
|
$
|
8
|
|
$
|
8
|
|
$
|
9
|
|
$
|
10
|
|
$
|
0.6
|
|
||||
|
RSUs
|
12
|
|
15
|
|
11
|
|
28
|
|
1.9
|
|
|||||||||
|
DSUs
|
2
|
|
1
|
|
1
|
|
—
|
|
—
|
|
|||||||||
|
PUs
|
5
|
|
6
|
|
5
|
|
10
|
|
1.4
|
|
|||||||||
|
Total
|
$
|
27
|
|
$
|
30
|
|
$
|
26
|
|
$
|
48
|
|
|
|
|||||
|
Tax benefit recognized
|
$
|
1
|
|
$
|
2
|
|
$
|
4
|
|
|
|
|
|
||||||
Other Compensation Arrangements
NRG also sponsored certain cash-settled equity award programs, under which employees are eligible to receive future cash compensation upon fulfillment of the vesting criteria for the particular program. The aggregate compensation expense for these arrangements was
$0.1 million
,
$1 million
, and
$2 million
for the years ended
December 31, 2011
,
2010
, and
2009
, respectively.
181
The following table summarizes NRG's material related party transactions with affiliates that are included in the Company's operating revenues, operating costs and other income and expense:
|
|
Year Ended December 31,
|
||||||||||
|
|
2011
|
2010
|
2009
|
||||||||
|
|
(In millions)
|
||||||||||
|
Revenues from Related Parties Included in Operating Revenues
|
|
|
|
||||||||
|
MIBRAG
(a)
|
$
|
—
|
|
$
|
—
|
|
$
|
2
|
|
||
|
Gladstone
|
7
|
|
3
|
|
2
|
|
|||||
|
GenConn
(b)(c)
|
3
|
|
5
|
|
7
|
|
|||||
|
Total
|
$
|
10
|
|
$
|
8
|
|
$
|
11
|
|
||
|
Expenses from Related Parties Included in Cost of Operations
|
|
|
|
||||||||
|
Cost of purchased coal — MIBRAG
(a)
|
$
|
—
|
|
$
|
—
|
|
$
|
43
|
|
||
|
Interest income from Related Parties Included in Other Income and Expense
|
|
|
|
||||||||
|
GenConn
(b)(c)
|
1
|
|
3
|
|
2
|
|
|||||
|
Kraftwerke Schkopau GBR
|
4
|
|
4
|
|
4
|
|
|||||
|
Total
|
$
|
5
|
|
$
|
7
|
|
$
|
6
|
|
||
|
(a)
|
The period in 2009 is from January 1, 2009, to June 10, 2009.
|
|
(b)
|
The period in 2009 is from April 1, 2009, to December 31, 2009.
|
|
(c)
|
The period in 2011 is from January 1, 2011 to June 30, 2011.
|
Gladstone
— NRG provides services to Gladstone, an equity method investment, under an operation and maintenance, or O&M, agreement. Fees for services under this contract primarily include recovery of NRG's costs of operating the plant as approved in the annual budget, as well as a base monthly fee.
GenConn
— Under a construction management agreement, or CMA, with GenConn , NRG has received fees for management, design and construction services. The construction at GenConn was completed in June 2011. In addition, NRG entered into a loan agreement with GenConn during 2009, pursuant to which it received interest income, which was converted into equity during 2011. See further discussion in Note 16,
Investments Accounted for by the Equity Method and Variable Interest Entities.
MIBRAG
— Prior to NRG's sale of its
50%
ownership in MIBRAG on June 10, 2009, NRG rendered technical consulting services to MIBRAG under a consulting agreement and had entered into long-term coal purchase agreements with MIBRAG to supply coal to Schkopau. Subsequent to the sale, MIBRAG is no longer a related party.
Kraftwerke Schkopau GBR
— A subsidiary of NRG, Saale Energie GmbH, has entered into a loan agreement with Kraftwerke Schkopau GBR, a partnership between Saale and E.ON Kraftwerke GmbH, pursuant to which NRG receives interest income. See further discussion in Note 9,
Capital Leases and Notes Receivable
.
182
Operating Lease Commitments
NRG leases certain Company facilities and equipment under operating leases, some of which include escalation clauses, expiring on various dates through 2040. NRG also has certain tolling arrangements to purchase power which qualifies as operating leases. Certain operating lease agreements over their lease term include provisions such as scheduled rent increases, leasehold incentives, and rent concessions. The Company recognizes the effects of these scheduled rent increases, leasehold incentives, and rent concessions on a straight-line basis over the lease term unless another systematic and rational allocation basis is more representative of the time pattern in which the leased property is physically employed. Lease expense under operating leases was
$81 million
,
$111 million
, and
$102 million
for the years ended
December 31, 2011
,
2010
, and
2009
, respectively.
Future minimum lease commitments under operating leases for the years ending after
December 31, 2011
, are as follows:
|
Period
|
(In millions)
|
||
|
2012
|
$
|
67
|
|
|
2013
|
63
|
|
|
|
2014
|
62
|
|
|
|
2015
|
57
|
|
|
|
2016
|
49
|
|
|
|
Thereafter
|
280
|
|
|
|
Total
|
$
|
578
|
|
Coal, Gas and Transportation Commitments
NRG has entered into long-term contractual arrangements to procure fuel and transportation services for the Company's generation assets and for the years ended
December 31, 2011
,
2010
, and
2009
, the Company purchased
$1.6 billion
,
$1.5 billion
, and
$1.4 billion
, respectively, under such arrangements.
As of
December 31, 2011
, the Company's commitments under such outstanding agreements are estimated as follows:
|
Period
|
(In millions)
|
||
|
2012
|
$
|
891
|
|
|
2013
|
130
|
|
|
|
2014
|
136
|
|
|
|
2015
|
103
|
|
|
|
2016
|
101
|
|
|
|
Thereafter
|
484
|
|
|
|
Total
(a)
|
$
|
1,845
|
|
|
(a)
|
Includes those coal transportation and lignite commitments for 2012 as no other nominations were made as of
December 31, 2011
. Natural gas nomination is through February 2016.
|
Purchased Power Commitments
NRG has purchased power contracts of various quantities and durations that are not classified as derivative assets and liabilities and do not qualify as operating leases. These contracts are not included in the consolidated balance sheet as of
December 31, 2011
. Minimum purchase commitment obligations are as follows as of
December 31, 2011
:
|
Period
|
(In millions)
|
||
|
2012
|
$
|
37
|
|
|
2013
|
21
|
|
|
|
2014
|
11
|
|
|
|
2015
|
9
|
|
|
|
2016
|
9
|
|
|
|
Thereafter
|
9
|
|
|
|
Total
(a)
|
$
|
96
|
|
|
(a)
|
As of
December 31, 2011
, the maximum remaining term under any individual purchased power contract is
six
years.
|
183
Lignite Contract with Texas Westmoreland Coal Co.
The lignite used to fuel the Texas region's Limestone facility is obtained from a surface mine, or the Jewett mine, adjacent to the Limestone facility under a long-term contract with Texas Westmoreland Coal Co., or TWCC. The contract is based on a cost-plus arrangement with incentives and penalties to ensure proper management of the mine. NRG has the flexibility to increase or decrease lignite purchases from the mine within certain ranges, including the ability to suspend or terminate lignite purchases with adequate notice. The mining period extends through 2018 with an option to further extend the mining period by
two five-year intervals
.
TWCC is responsible for performing ongoing reclamation activities at the mine until all lignite reserves have been produced. When production is completed at the mine, NRG will be responsible for final mine reclamation obligations. The Railroad Commission of Texas has imposed a bond obligation of
$108 million
on TWCC for the reclamation of this lignite mine. Pursuant to the contract with TWCC, NRG supports this obligation as follows:
$50 million
is guaranteed by NRG Energy, Inc.,
$32 million
is supported by letters of credit posted by NRG, and NRG pays the cost of TWCC bonding the remaining
$26 million
. Additionally, NRG is required to provide additional performance assurance over TWCC's current bond obligations if required by the Railroad Commission of Texas.
First Lien Structure
NRG has granted first liens to certain counterparties on substantially all of the Company's assets to reduce the amount of cash collateral and letters of credit that it would otherwise be required to post from time to time to support its obligations under out-of-the-money hedge agreements for forward sales of power or MWh equivalents. The Company's lien counterparties may have a claim on NRG's assets to the extent market prices exceed the hedged price. As of December 31, 2011, all hedges under the first lien were in-the-money for NRG on a counterparty aggregate basis.
Nuclear Insurance
STP maintains required insurance coverage for liability claims arising from nuclear incidents pursuant to the Price-Anderson Amendment to the Energy Policy Act of 2005, referred to as the Price-Anderson Act. As of December 31, 2011, the current liability limit per incident was
$12.6 billion
and is subject to change to account for the effects of inflation and changes in the number of licensed reactors. An inflation adjustment must be made at least once every
five
years with the most recent adjustment effective October 29, 2008. Under the Price-Anderson Act, owners of nuclear power plants in the U.S. are required to purchase primary insurance limits of
$375 million
for each operating site. In addition, the Price-Anderson Act requires an additional layer of protection through mandatory participation in a retrospective rating plan for power reactors resulting in an additional
$12.2 billion
in funds available for public liability claims. The current maximum assessment per incident, per reactor, is
$117.5 million
, payable at no more than
$17.5 million
per year. NRG would be responsible for
44%
of the maximum assessment, or
$7.7 million
per year. In addition, the U.S. Congress retains the ability to impose additional financial requirements on the nuclear industry to pay liability claims that exceed
$12.6 billion
for a single incident. The liabilities of the co-owners of STP with respect to the retrospective premium assessments for nuclear liability insurance are joint and several.
STP purchases insurance for property damage and site decontamination cleanup costs from Nuclear Electric Insurance Limited, or NEIL, an industry mutual insurance company, of which STP is a member. STP has purchased
$2.75 billion
in limits, the maximum available from NEIL. The upper
$1 billion
in limits (excess of the first
$1.75 billion
in limits) is a single limit blanket policy shared with the DC Cook and Diablo Canyon nuclear reactors, two reactors that have no affiliation with the Company. This shared limit is not subject to automatic reinstatement in the event of a loss. The NEIL policy covers both nuclear and non-nuclear property damage events, and includes coverage for
6
weeks of lost revenue following a property damage event, at a weekly indemnity limit of
$3.5 million
, subject to a
17
week waiting period. NRG also purchased an Accidental Outage policy from NEIL, which provides additional protection for lost revenue due to an insurable event. This coverage allows for reimbursement up to
$3.5 million
per week up to a maximum of
$473.2 million
, and is subject to a
23
week waiting period. Under the terms of the NEIL policies, member companies may be assessed up to
10
times their annual premium if the NEIL Board of Directors determines their surplus has been depleted due to the payment of property losses at any of the licensed reactors in a single policy year. NEIL requires that its members maintain an investment grade credit rating or insure their annual retrospective obligation by providing a financial guarantee, letter of credit, deposit premium, or an insurance policy. NRG has purchased an insurance policy from NEIL to guarantee the Company's obligation; however this insurance will only respond to retrospective premium adjustments assessed within
24
months after the policy term, whereas NEIL's Board of Directors can make such an adjustment up to
6
years after the policy expires.
184
Contingencies
Set forth below is a description of the Company's material legal proceedings. The Company believes that it has valid defenses to these legal proceedings and intends to defend them vigorously. Pursuant to the requirements of ASC 450,
Contingencies
and related guidance, NRG records reserves for estimated losses from contingencies when information available indicates that a loss is probable and the amount of the loss, or range of loss, can be reasonably estimated. In addition, legal costs are expensed as incurred. Management has assessed each of the following matters based on current information and made a judgment concerning its potential outcome, considering the nature of the claim, the amount and nature of damages sought, and the probability of success. Unless specified below, the Company is unable to predict the outcome of these legal proceedings or reasonably estimate the scope or amount of any associated costs and potential liabilities. As additional information becomes available, management adjusts its assessment and estimates of such contingencies accordingly. Because litigation is subject to inherent uncertainties and unfavorable rulings or developments, it is possible that the ultimate resolution of the Company's liabilities and contingencies could be at amounts that are different from its currently recorded reserves and that such difference could be material.
In addition to the legal proceedings noted below, NRG and its subsidiaries are party to other litigation or legal proceedings arising in the ordinary course of business. In management's opinion, the disposition of these ordinary course matters will not materially adversely affect NRG's consolidated financial position, results of operations, or cash flows.
California Department of Water Resources
This matter concerns, among other contracts and other defendants, the California Department of Water Resources, or CDWR, and its wholesale power contract with subsidiaries of WCP (Generation) Holdings, Inc., or WCP. The case originated with a February 2002 complaint filed by the State of California alleging that many parties, including WCP subsidiaries, overcharged the State of California. For WCP, the alleged overcharges totaled approximately
$940 million
for 2001 and 2002. The complaint demanded that the Federal Energy Regulatory Commission, or FERC, abrogate the CDWR contract and sought refunds associated with revenues collected under the contract. In 2003, the FERC rejected this complaint, denied rehearing, and the case was appealed to the U.S. Court of Appeals for the Ninth Circuit where oral argument was held on December 8, 2004. On December 19, 2006, the Ninth Circuit decided that in the FERC's review of the contracts at issue, the FERC could not rely on the
Mobile-Sierra
standard presumption of just and reasonable rates, where such contracts were not reviewed by the FERC with full knowledge of the then existing market conditions. WCP and others sought review by the U.S. Supreme Court. WCP's appeal was not selected, but instead held by the Supreme Court. In the appeal that was selected by the Supreme Court, on June 26, 2008, the Supreme Court ruled: (i) that the
Mobile-Sierra
public interest standard of review applied to contracts made under a seller's market-based rate authority; (ii) that the public interest “bar” required to set aside a contract remains a very high one to overcome; and (iii) that the
Mobile-Sierra
presumption of contract reasonableness applies when a contract is formed during a period of market dysfunction unless (a) such market conditions were caused by the illegal actions of one of the parties or (b) the contract negotiations were tainted by fraud or duress. In this related case, the U.S. Supreme Court affirmed the Ninth Circuit's decision agreeing that the case should be remanded to the FERC to clarify the FERC's 2003 reasoning regarding its rejection of the original complaint relating to the financial burdens under the contracts at issue and to alleged market manipulation at the time these contracts were formed. As a result, the U.S. Supreme Court then reversed and remanded the WCP CDWR case to the Ninth Circuit for treatment consistent with its June 26, 2008, decision in the related case. On October 20, 2008, the Ninth Circuit asked the parties in the remanded CDWR case, including WCP and the FERC, whether that Court should answer a question the U.S. Supreme Court did not address in its June 26, 2008, decision; whether the
Mobile-Sierra
doctrine applies to a third-party that was not a signatory to any of the wholesale power contracts, including the CDWR contract, at issue in that case. Without answering that reserved question, on December 4, 2008, the Ninth Circuit vacated its prior opinion and remanded the WCP CDWR case back to the FERC for proceedings consistent with the U.S. Supreme Court's June 26, 2008, decision.
On December 15, 2008, WCP and the other seller-defendants filed with the FERC a Motion for Order Governing Proceedings on Remand. On January 14, 2009, the Public Utilities Commission of the State of California filed an Answer and Cross Motion for an Order Governing Procedures on Remand and on January 28, 2009, WCP and the other seller-defendants filed their reply. At this time, the FERC has not acted on remand.
At this time, while NRG cannot predict with certainty whether WCP will be required to make refunds for rates collected under the CDWR contract or estimate the range of any such possible refunds, a reconsideration of the CDWR contract by the FERC with a resulting order mandating significant refunds could have a material adverse impact on NRG's financial position, statement of operations, and statement of cash flows. As part of the 2006 acquisition of Dynegy's
50%
ownership interest in WCP, WCP and NRG assumed responsibility for any risk of loss arising from this case, unless any such loss was deemed to have resulted from certain acts of gross negligence or willful misconduct on the part of Dynegy, in which case any such loss would be shared equally between WCP and Dynegy.
185
On January 14, 2010, the U.S. Supreme Court issued its decision in an unrelated proceeding involving the
Mobile-Sierra
doctrine that will affect the standard of review applied to the CDWR contract on remand before the FERC. In
NRG Power Marketing v. Maine Public Utilities Commission
, the Supreme Court held that the
Mobile-Sierra
presumption regarding the reasonableness of contract rates does not depend on the identity of the complainant who seeks a FERC investigation/refund.
Louisiana Generating, LLC
On February 11, 2009, the U.S. Department of Justice, or U.S. DOJ, acting at the request of the U.S. Environmental Protection Agency, or U.S. EPA, commenced a lawsuit against Louisiana Generating, LLC, or LaGen, in federal district court in the Middle District of Louisiana alleging violations of the Clean Air Act, or CAA, at the Big Cajun II power plant. This is the same matter for which Notices of Violation, or NOVs, were issued to LaGen on February 15, 2005, and on December 8, 2006. Specifically, it is alleged that in the late 1990's, several years prior to NRG's acquisition of the Big Cajun II power plant from the Cajun Electric bankruptcy and several years prior to the NRG bankruptcy, modifications were made to Big Cajun II Units 1 and 2 by the prior owners without appropriate or adequate permits and without installing and employing the best available control technology, or BACT, to control emissions of nitrogen oxides and/or sulfur dioxides. The relief sought in the complaint includes a request for an injunction to: (i) preclude the operation of Units 1 and 2 except in accordance with the CAA; (ii) order the installation of BACT on Units 1 and 2 for each pollutant subject to regulation under the CAA; (iii) obtain all necessary permits for Units 1 and 2; (iv) order the surrender of emission allowances or credits; (v) conduct audits to determine if any additional modifications have been made which would require compliance with the CAA's Prevention of Significant Deterioration program; (vi) award to the U.S. DOJ its costs in prosecuting this litigation; and (vii) assess civil penalties of up to
$27,500
per day for each CAA violation found to have occurred between January 31, 1997, and March 15, 2004, up to
$32,500
for each CAA violation found to have occurred between March 15, 2004, and January 12, 2009, and up to
$37,500
for each CAA violation found to have occurred after January 12, 2009.
On April 27, 2009, LaGen filed an objection in the Cajun Electric Cooperative Power, Inc.'s bankruptcy proceeding in the U.S. Bankruptcy Court for the Middle District of Louisiana to seek to prevent the bankruptcy from closing. LaGen also filed a complaint, or adversary proceeding, in the same bankruptcy proceeding, seeking a judgment that: (i) it did not assume liability from Cajun Electric for any claims or other liabilities under environmental laws with respect to Big Cajun II that arose, or are based on activities that were undertaken, prior to the closing date of the acquisition; (ii) it is not otherwise the successor to Cajun Electric with respect to environmental liabilities arising prior to the acquisition; and (iii) Cajun Electric and/or the Bankruptcy Trustee are exclusively liable for any of the violations alleged in the February 11, 2009, lawsuit to the extent that such claims are determined to have merit. On April 15, 2010, the bankruptcy court signed an order granting LaGen's stipulation of voluntary dismissal without prejudice of the adversary proceeding. The bankruptcy proceeding has since closed.
On August 24, 2009, LaGen filed a motion to dismiss this lawsuit, and on September 25, 2009, the U.S. DOJ filed its opposition to the motion. Thereafter, on February 18, 2010, the Louisiana Department of Environmental Quality, or LDEQ, filed a motion to intervene in the above lawsuit and a complaint against LaGen for alleged violations of Louisiana's Prevention of Significant Deterioration, or PSD, regulations and Louisiana's Title V operating permit program. LDEQ seeks substantially similar relief to that requested by the U.S. DOJ. On February 19, 2010, the district court granted LDEQ's motion to intervene. On April 26, 2010, LaGen filed a motion to dismiss the LDEQ complaint. On July 21, 2010, the motions to dismiss the U.S. DOJ and LDEQ complaints were argued to the district court. On August 20, 2010, the parties submitted proposed findings of fact and conclusions of law, and thereafter submitted additional briefing on emerging jurisprudence from other jurisdictions touching on the issues at stake in the lawsuit. On February 4, 2011, LaGen filed motions for summary judgment requesting that the court dismiss all of the U.S. DOJ's claims. Also on February 4, 2011, the U.S. DOJ filed
three
motions for partial summary judgment. Additional summary judgment briefing was filed by the parties on April 4, 2011. On November 2, 2011, the court heard oral argument on
three
motions for summary judgment. On December 1, 2011, the court issued an order denying two of LaGen's motions for summary judgment addressing potential legal defenses to CAA liability. In the same Order, the court also granted, in part, the U.S. DOJ's motion for summary judgment on its successor liability theory. The court held that LaGen could be found to have assumed liability for alleged PSD violations under the terms of the agreement through which LaGen acquired Big Cajun II in 2000, but ruled that the facts necessary to determine whether any such liabilities were actually assumed must be determined at a liability-phase trial, if necessary. In its December 1, 2011, decision, the court also ruled that any potential civil penalties would not be available for the periods prior to the five year period preceding the filing of the lawsuit on February 11, 2009.
186
Three additional motions for summary judgment and multiple motions in limine, including motions that could result in dismissal of the governments' claims before trial if resolved in LaGen's favor, remain pending before the court, with some of these motions set to be argued on March 21, 2012. On January 17, 2012, LaGen filed a demand for a jury trial. On January 20, 2012, the court scheduled a liability-phase trial for October 15, 2012, should the case proceed to that stage, and a remedy-phase trial set to occur at a later date to be determined in the event of an adverse decision in a liability-phase trial. Because of the inherent uncertainty of litigation, including the fact that no determination of liability has yet been made by the Court, NRG cannot predict the impact, at this time, that this matter may have on the Company's business, results of operations, financial position, or cash flows.
In a related matter, soon after the filing of the above referenced U.S. DOJ lawsuit, LaGen sought insurance coverage from its insurance carrier, Illinois Union Insurance Company, or ILU. ILU denied coverage and thereafter LaGen filed this lawsuit (which was consolidated with a prior suit filed by ILU) seeking a declaration that ILU must provide coverage to LaGen for the defense costs incurred in defending the U.S. DOJ lawsuit. LaGen and ILU both filed motions for summary judgment and on January 30, 2012, the court issued an order granting LaGen's motion finding that ILU has a duty to defend LaGen.
Excess Mitigation Credits
From January 2002 to April 2005, CenterPoint Energy applied excess mitigation credits, or EMCs, to its monthly charges to retail electric providers as ordered by the PUCT. The PUCT imposed these credits to facilitate the transition to competition in Texas, which had the effect of lowering the retail electric providers' monthly charges payable to CenterPoint Energy. As indicated in its Petition for Review filed with the Supreme Court of Texas on June 2, 2008, CenterPoint Energy has claimed that the portion of those EMCs credited to Reliant Energy Retail Services, LLC, or RERS, a retail electric provider and NRG subsidiary acquired from RRI Energy, Inc. (formerly Reliant Energy, Inc.), totaled
$385 million
for RERS's “Price to Beat” Customers. It is unclear what the actual number may be. “Price to Beat” was the rate RERS was required by state law to charge residential and small commercial customers that were transitioned to RERS from the incumbent integrated utility company commencing in 2002. In its original stranded cost case brought before the PUCT on March 31, 2004, CenterPoint Energy sought recovery of all EMCs that were credited to all retail electric providers, including RERS, and the PUCT ordered that relief in its Order on Rehearing in Docket No. 29526, on December 17, 2004. After an appeal to state district court, the court entered a final judgment on August 26, 2005, affirming the PUCT's order with regard to EMCs credited to RERS. Various parties filed appeals of that judgment, and on April 17, 2008, the Court of Appeals for the Third District reversed the lower court's decision ruling that CenterPoint Energy's stranded cost recovery should exclude only EMCs credited to RERS for its “Price to Beat” customers. On June 2, 2008, CenterPoint Energy's Petition for Review with the Supreme Court of Texas was accepted. Oral argument occurred on October 6, 2009, and on March 18, 2011, the Texas Supreme Court reversed the Court of Appeals, finding no basis for deducting EMCs credited to RERS. Motions for rehearing were filed on May 4, 2011. On June 10, 2011, the Texas Supreme Court denied all motions for rehearing, thereby ending the matter.
In November 2008, CenterPoint Energy and Reliant Energy Inc., or REI, on behalf of itself and affiliates including RERS, agreed to suspend unexpired deadlines, if any, related to limitations periods that might exist for possible claims against REI and its affiliates if CenterPoint Energy is ultimately not allowed to include in its stranded cost calculation those EMCs previously credited to RERS. The agreed upon suspension of unexpired deadlines ceased on August 29, 2011. NRG believes that any possible future CenterPoint Energy claim against RERS for EMCs credited to RERS would lack legal merit. No such claim has been filed.
Wise v. Energy Plus Holdings, LLC
On October 18, 2011, plaintiff filed a purported class action lawsuit on behalf of New York consumers against Energy Plus in the U.S. District Court for the Southern District of New York. Claiming statutory damages in excess of
$5 million
, the plaintiff alleges violations of New York business laws as well as unjust enrichment. Specifically, the plaintiff claims that Energy Plus misrepresents that its rates are competitive in the market; fails to disclose that its rates are substantially higher than those in the market and that Energy Plus has engaged in deceptive practices in its marketing of energy services. Plaintiff seeks that this matter be certified as a class action, with treble damages, interest, costs, attorneys fees, and any other relief that the court deems just and proper. On January 11, 2012, plaintiff filed an amended complaint in which they added another co-plaintiff, made additional claims as to how they became customers of Energy Plus and made some additional allegations as to alleged representations on the Energy Plus website. On February 1, 2012, Energy Plus filed a motion to dismiss the amended complaint. Oral argument on the motion to dismiss is scheduled to be heard on March 23, 2012.
187
NRG operates in a highly regulated industry and is subject to regulation by various federal and state agencies. As such, NRG is affected by regulatory developments at both the federal and state levels and in the regions in which NRG operates. In addition, NRG is subject to the market rules, procedures, and protocols of the various ISO markets in which NRG participates. These power markets are subject to ongoing legislative and regulatory changes that may impact NRG's wholesale and Retail Businesses.
In addition to the regulatory proceedings noted below, NRG and its subsidiaries are a party to other regulatory proceedings arising in the ordinary course of business or have other regulatory exposure. In management's opinion, the disposition of these ordinary course matters will not materially adversely affect NRG's consolidated financial position, results of operations, or cash flows.
California
— On May 4, 2010, in
Southern California Edison Company v. FERC,
the U.S. Court of Appeals for the D.C. Circuit vacated FERC's acceptance of station power rules for the CAISO market, and remanded the case for further proceedings at FERC. On August 30, 2010, FERC issued an Order on Remand effectively disclaiming jurisdiction over how the states impose retail station power charges. Due to reservation-of-rights language in the California utilities' state-jurisdictional station power tariffs, FERC's ruling arguably requires California generators to pay state-imposed retail charges back to the date of enrollment by the facilities in the CAISO's station period program (February 1, 2009, for the Company's Encina and El Segundo facilities; March 1, 2009, for the Company's Long Beach facility). On February 28, 2011, FERC issued an order denying rehearing. The Company, together with other generators, filed an appeal and briefing of the case is currently underway. On November 18, 2011, Southern California Edison Company filed with the California Public Utilities Commission, or CPUC, seeking authorization to begin charging generators station power charges, and to assess such charges retroactively, which the Company and other generators have challenged. The Company has filed a protest with the CPUC objecting to Southern California Edison's filing. The Company believes it has established an appropriate reserve.
Retail (Replacement Reserve)
—
On November 14, 2006, Constellation Energy Commodities Group, or Constellation, filed a complaint with the PUCT alleging that ERCOT misapplied the Replacement Reserve Settlement, or RPRS, Formula contained in the ERCOT protocols from April 10, 2006, through September 27, 2006. Specifically, Constellation disputed approximately
$4 million
in under-scheduling charges for capacity insufficiency asserting that ERCOT applied the wrong protocol. Retail Electric Providers, or REPS, other market participants, ERCOT, and PUCT staff opposed Constellation's complaint. On January 25, 2008, the PUCT entered an order finding that ERCOT correctly settled the capacity insufficiency charges for the disputed dates in accordance with ERCOT protocols and denied Constellation's complaint. On April 9, 2008, Constellation appealed the PUCT order to the Civil District Court of Travis County, Texas and on June 19, 2009, the court issued a judgment reversing the PUCT order, finding that the ERCOT protocols were in irreconcilable conflict with each other. Under the PUCT ordered formula, Qualified Scheduling Entities, or QSEs, who under-scheduled capacity within any of ERCOT's
four
congestion zones were assessed under-scheduling charges which defrayed the costs incurred by ERCOT for RPRS that would otherwise be spread among all load-serving QSEs. Under the Court's decision, all RPRS costs would be assigned to all load-serving QSEs based upon their load ratio share without assessing any separate charge to those QSEs who under-scheduled capacity. If under-scheduling charges for capacity insufficient QSEs were not used to defray RPRS costs, REPS's share of the total RPRS costs allocated to QSEs would increase. On July 20, 2009, REPS filed an appeal to the Third Court of Appeals in Travis County, Texas, thereby staying the effect of the trial court's decision. On October 6, 2010, the parties argued the appeal before the Court of Appeals for the Third District in Austin, Texas. On September 28, 2011, the Court of Appeals reversed the trial court decision, reinstating the PUCT's order, consistent with REPS' position. On January 13, 2012, Constellation filed a Petition for Review in the Supreme Court of Texas asking the Court to grant review of and reverse the Court of Appeals decision.
Retail (Midwest ISO SECA)
-
Green Mountain Energy previously provided competitive retail energy supply in the Midwest ISO region during the relevant period of January 1, 2002, to December 31, 2005. By order dated November 18, 2004, FERC eliminated certain regional through-and-out transmission rates charged by transmission owners in the regional electric grids operated by the Midwest Independent Transmission Systems Operator, Inc., or MISO, and PJM Interconnection, L.L.C., or PJM. In order to temporarily compensate the transmission owners for revenue lost as a result of the elimination of the through-and-out transmission rates, FERC also ordered MISO, PJM and their respective transmission owners to provide for the recovery of certain Seams Elimination Charge/Cost Adjustments/Assignments, or SECA, charges effective December 1, 2004, through March 31, 2006, based on usage during 2002 and 2003. The tariff amendments filed by MISO and the MISO transmission owners allocated certain SECA charges to various zones and sub-zones within MISO, including a sub-zone called the Green Mountain Energy Company Sub-zone. Over the last several years, there has been extensive litigation before FERC relating to these charges, seeking, among other things, to recover monies from Green Mountain Energy, and before the federal appellate courts. Green Mountain Energy has not paid any asserted SECA charges.
188
On May 21, 2010, FERC issued
two
orders. In its Order on Rehearing, FERC denied all requests for rehearing of its past orders directing and accepting the SECA compliance filings of MISO, PJM, and the transmission owners. In its Order on Initial Decision, FERC: (1) affirmed an order by the Administrative Law Judge granting Green Mountain Energy partial summary judgment and holding Green Mountain Energy not liable for SECA charges for January
-
March 2006; and (2) reversed an August 2006 determination by the Administrative Law Judge that Green Mountain Energy could be held directly liable for some amount of SECA charges. The Order on Initial Decision also directed that the two RTOs and their respective transmission owners submit further compliance filings, which were filed on August 19, 2010. FERC has not yet ruled on those compliance filings.
With regard to the SECA charges that had been invoiced to Green Mountain Energy, FERC determined that most of those charges, approximately
$22 million
plus interest, were owed not by Green Mountain Energy but rather by BP Energy
—
one
of Green Mountain Energy's suppliers during the period at issue. On August 19, 2010, the transmission owners and MISO made compliance filings in accordance with FERC's Orders allocating SECA charges to a BP Energy Sub-zone, and making no allocation to a Green Mountain Energy sub-zone. BP Energy has not asserted any contractual claims against Green Mountain Energy. The Company believes it has established an appropriate reserve.
On September 30, 2011, FERC issued orders denying BP Energy's request for rehearing of the May 2010 Order on Rehearing, denying all requests for rehearing of the Order on Initial Decision, and again determined that SECA charges were not owed by Green Mountain Energy. Numerous parties have sought judicial review of FERC's Order on Initial Decision, and BP Energy has sought judicial review of the May 2010 Order on Rehearing. These appeals have been consolidated with previous appeals of orders relating to the SECA before the U.S. Court of Appeals for the DC Circuit. Green Mountain Energy has been granted intervenor status in the consolidated appeals. A briefing schedule has not yet been set.
189
NRG is subject to a wide range of environmental regulations across a broad number of jurisdictions in the development, ownership, construction and operation of domestic and international projects. These laws and regulations generally require that governmental permits and approvals be obtained before construction and during operation of power plants. Environmental laws have become increasingly stringent and NRG expects this trend to continue. The electric generation industry will face new requirements to address air emissions, climate change, combustion byproducts and water use. In general, future laws and regulations are expected to require the addition of emission controls or other environmental quality equipment or the imposition of certain restrictions on the operations of the Company's facilities. NRG expects that future liability under, or compliance with, environmental requirements could have a material effect on the Company's operations or competitive position.
Environmental Capital Expenditures
Based on current rules, technology and plans as well as preliminary plans based on proposed rules, NRG has estimated that environmental capital expenditures from
2012
through
2016
to meet NRG's regulatory environmental commitments will be approximately
$553 million
. These costs are primarily associated with mercury controls to satisfy the Mercury and Air Toxics Standards, or MATS, on the Company's Big Cajun II, W.A. Parish and Limestone facilities and a number of intake modification projects across the fleet under state or proposed federal 316(b) rules. NRG continues to explore cost effective compliance alternatives to reduce costs. While this estimate reflects anticipated schedules and controls related to the proposed 316(b) Rule, the full impact on the scope and timing of environmental retrofits from any new or revised regulations cannot be determined until these rules are final. However, NRG believes it is positioned to meet more stringent environmental regulations through its planned capital expenditures, existing controls, and increasing generation from renewable resources.
NRG's current contracts with the Company's rural electric cooperative customers in the South Central region allow for recovery of a portion of the region's environmental capital costs incurred as the result of complying with any change in environmental law. Cost recoveries begin once the environmental equipment becomes operational and include a capital return. The actual recoveries will depend, among other things, on the timing of the completion of the capital projects and the remaining duration of the contracts.
The U.S. EPA released the final Cross-State Air Pollution Rule, or CSAPR, on July 7, 2011, which was scheduled to replace the Clean Air Interstate Rule, or CAIR, on January 1, 2012. On December 30, 2011, the U.S. Court of Appeals for the D.C. Circuit stayed the rule pending resolution of the numerous petitions for judicial review. Under CSAPR, use of discounted Acid Rain SO
2
and CAIR NO
x
allowances would be discontinued and replaced with completely distinct allowance programs. Acid Rain allowances would still be required on a
1
:1 basis under the Acid Rain Program. Consequently, in the third quarter 2011, the Company recorded an impairment charge of
$160 million
on the Company's Acid Rain Program SO
2
emission allowances, which were recorded as an intangible asset on the Company's balance sheet. The impairment charge reflects the write-off of the value of emission allowances in excess of those required for compliance with the Acid Rain Program.
Northeast Region
In January 2006, NRG's Indian River Operations, Inc. received a letter of informal notification from Delaware Department of Natural Resources and Environmental Control, or DNREC, stating that it may be a potentially responsible party with respect to Burton Island Old Ash Landfill, a historic captive landfill located at the Indian River facility. On October 1, 2007, NRG signed an agreement with DNREC to investigate the site through the Voluntary Clean-up Program. On February 4, 2008, DNREC issued findings that no further action is required in relation to surface water and that a previously planned shoreline stabilization project would satisfactorily address shoreline erosion. The landfill itself will require a further Remedial Investigation and Feasibility Study to determine the type and scope of any additional work required. Until the Remedial Investigation and Feasibility Study is approved, the Company is unable to predict the impact of any required remediation. On May 29, 2008, DNREC requested that NRG's Indian River Operations, Inc. participate in the development and performance of a Natural Resource Damage Assessment, or NRDA, at the Burton Island Old Ash Landfill. NRG is currently working with DNREC and other trustees to close out the assessment phase.
Pursuant to a consent order dated September 25, 2007, and amended July 21, 2010, between NRG and DNREC regarding the Indian River plant, NRG agreed to limit the emissions of NO
x
and SO
2
, and to mothball Unit 1. Unit 1 was mothballed as planned on May 1, 2011.
190
South Central Region
On February 11, 2009, the U.S. DOJ acting at the request of the U.S. EPA commenced a lawsuit against LaGen in federal district court in the Middle District of Louisiana alleging violations of the CAA at the Big Cajun II power plant. This is the same matter for which NOVs were issued to LaGen on February 15, 2005, and on December 8, 2006. Further discussion on this matter can be found in Note 22,
Commitments and Contingencies
-
Louisiana Generating, LLC.
The construction and operation of power projects are subject to stringent environmental and safety protection and land use laws and regulation in the U.S. If such laws and regulations become more stringent, or new laws, interpretations or compliance policies apply and NRG's facilities are not exempt from coverage, the Company could be required to make modifications to further reduce potential environmental impacts. In general, the effect of such future laws or regulations is expected to require the addition of pollution control equipment or the imposition of restrictions or additional costs on the Company's operations.
Detail of supplemental disclosures of cash flow and non-cash investing and financing information was:
|
|
|||||||||||
|
|
Year Ended December 31,
|
||||||||||
|
|
2011
|
2010
|
2009
|
||||||||
|
|
(In millions)
|
||||||||||
|
Interest paid, net of amount capitalized
|
$
|
642
|
|
$
|
609
|
|
$
|
587
|
|
||
|
Income taxes paid
(a)
|
26
|
|
20
|
|
47
|
|
|||||
|
Non-cash investing and financing activities:
|
|||||||||||
|
Additions to fixed assets for accrued capital expenditures
|
292
|
|
393
|
|
44
|
|
|||||
|
Decrease to fixed assets for accrued grants and related tax impact
|
(32
|
)
|
—
|
|
(132
|
)
|
|||||
|
Decrease to 4.0% preferred stock from conversion to common stock
|
—
|
|
149
|
|
257
|
|
|||||
|
Decrease to notes receivable for equity conversion
|
63
|
|
56
|
|
—
|
|
|||||
|
Decrease to 5.75% preferred stock from conversion to common stock
|
—
|
|
—
|
|
447
|
|
|||||
|
(Increase)/decrease to treasury stock from the net impact of shares loaned to and returned by affiliates of CS
|
—
|
|
(160
|
)
|
160
|
|
|||||
|
(a)
|
2011
,
2010
, and
2009
income taxes paid are net of
$8 million
,
$14 million
, and
$3 million
, respectively, of income tax refunds received.
|
191
NRG and its subsidiaries enter into various contracts that include indemnification and guarantee provisions as a routine part of the Company's business activities. Examples of these contracts include asset purchases and sale agreements, commodity sale and purchase agreements, retail contracts, joint venture agreements, EPC agreements, operation and maintenance agreements, service agreements, settlement agreements, and other types of contractual agreements with vendors and other third parties, as well as affiliates. These contracts generally indemnify the counterparty for tax, environmental liability, litigation and other matters, as well as breaches of representations, warranties and covenants set forth in these agreements. The Company is also obligated with respect to customer deposits associated with the Retail Businesses. In some cases, NRG's maximum potential liability cannot be estimated, since the underlying agreements contain no limits on potential liability. In accordance with ASC 460,
Guarantees
, or ASC 460, NRG has estimated that the current fair value for issuing these guarantees was
$4.5 million
as of
December 31, 2011
, and the liability in this amount is included in the Company's non-current liabilities.
The following table summarizes the maximum potential exposures that can be estimated for NRG's guarantees, indemnities, and other contingent liabilities by maturity:
|
|
By Remaining Maturity at December 31,
|
||||||||||||||||||||||
|
|
2011
|
|
|||||||||||||||||||||
|
Guarantees
|
Under
1 Year
|
1-3 Years
|
3-5 Years
|
Over
5 Years
|
Total
|
2010
Total |
|||||||||||||||||
|
|
(In millions)
|
||||||||||||||||||||||
|
Letters of credit and surety bonds
|
$
|
1,562
|
|
$
|
108
|
|
$
|
—
|
|
$
|
—
|
|
$
|
1,670
|
|
$
|
887
|
|
|||||
|
Asset sales guarantee obligations
|
60
|
|
—
|
|
567
|
|
8
|
|
635
|
|
1,022
|
|
|||||||||||
|
Commercial sales arrangements
|
91
|
|
100
|
|
91
|
|
1,123
|
|
1,405
|
|
1,285
|
|
|||||||||||
|
Other guarantees
|
1
|
|
—
|
|
—
|
|
460
|
|
461
|
|
171
|
|
|||||||||||
|
Total guarantees
|
$
|
1,714
|
|
$
|
208
|
|
$
|
658
|
|
$
|
1,591
|
|
$
|
4,171
|
|
$
|
3,365
|
|
|||||
Letters of credit and surety bonds
— As of
December 31, 2011
, NRG and its consolidated subsidiaries were contingently obligated for a total of
$1.7 billion
under letters of credit and surety bonds. Most of these letters of credit and surety bonds are issued in support of the Company's obligations to perform under commodity agreements and in support of equity contribution requirements for solar projects in construction, as well as for financing or other arrangements. A majority of these letters of credit and surety bonds expire within
one
year of issuance, and it is typical for the Company to renew them on similar terms.
The material indemnities, within the scope of ASC 460, are as follows:
Asset purchases and divestitures
— The purchase and sale agreements which govern NRG's asset or share investments and divestitures customarily contain guarantees and indemnifications of the transaction to third parties. The contracts indemnify the parties for liabilities incurred as a result of a breach of a representation or warranty by the indemnifying party, or as a result of a change in tax laws. These obligations generally have a discrete term and are intended to protect the parties against risks that are difficult to predict or estimate at the time of the transaction. In several cases, the contract limits the liability of the indemnifier. NRG has no reason to believe that the Company currently has any material liability relating to such routine indemnification obligations.
Commercial sales arrangements
— In connection with the purchase and sale of fuel, emission allowances and power generation products to and from third parties with respect to the operation of some of NRG's generation facilities in the United States, the Company may be required to guarantee a portion of the obligations of certain of its subsidiaries. These obligations may include liquidated damages payments or other unscheduled payments.
192
Other guarantees
— NRG has issued guarantees of obligations that its subsidiaries may incur as a provision for environmental site remediation, payment of debt obligations, rail car leases, performance under purchase, EPC and operating and maintenance agreements. NRG also executed a guarantee with related parties for one of its subsidiary's obligations as construction manager under EPC contracts for the construction of the peaking power plant at GenConn's Middletown site. See Note 16,
Investments Accounted for by the Equity Method and Variable Interest Entities,
for more information on this equity investment. The Company does not believe that it will be required to perform under these guarantees.
Other indemnities
— Other indemnifications NRG has provided cover operational, tax, litigation and breaches of representations, warranties and covenants. NRG has also indemnified, on a routine basis in the ordinary course of business, consultants or other vendors who have provided services to the Company. NRG's maximum potential exposure under these indemnifications can range from a specified dollar amount to an indeterminate amount, depending on the nature of the transaction. Total maximum potential exposure under these indemnifications is not estimable due to uncertainty as to whether claims will be made or how they will be resolved. NRG does not have any reason to believe that the Company will be required to make any material payments under these indemnity provisions.
Because many of the guarantees and indemnities NRG issues to third parties and affiliates do not limit the amount or duration of its obligations to perform under them, there exists a risk that the Company may have obligations in excess of the amounts described above. For those guarantees and indemnities that do not limit the Company's liability exposure, it may not be able to estimate what the Company's liability would be, until a claim is made for payment or performance, due to the contingent nature of these contracts.
Certain NRG subsidiaries own undivided interests in jointly-owned plants, as described below. These plants are maintained and operated pursuant to their joint ownership participation and operating agreements. NRG is responsible for its subsidiaries' share of operating costs and direct expenses and includes its proportionate share of the facilities and related revenues and direct expenses in these jointly-owned plants in the corresponding balance sheet and income statement captions of the Company's consolidated financial statements.
The following table summarizes NRG's proportionate ownership interest in the Company's jointly-owned facilities:
|
As of December 31, 2011
|
Ownership
Interest
|
Property, Plant &
Equipment
|
Accumulated
Depreciation
|
Construction in
Progress
|
||||||||||
|
|
(In millions unless otherwise stated)
|
|||||||||||||
|
South Texas Project Units 1 and 2, Bay City, TX
|
44.00
|
%
|
$
|
3,101
|
|
$
|
(980
|
)
|
$
|
9
|
|
|||
|
Big Cajun II Unit 3, New Roads, LA
|
58.00
|
%
|
175
|
|
(75
|
)
|
10
|
|
||||||
|
Cedar Bayou Unit 4, Baytown, TX
|
50.00
|
%
|
213
|
|
(27
|
)
|
1
|
|
||||||
|
Keystone, Shelocta, PA
|
3.70
|
%
|
90
|
|
(27
|
)
|
1
|
|
||||||
|
Conemaugh, New Florence, PA
|
3.72
|
%
|
79
|
|
(30
|
)
|
3
|
|
||||||
193
Summarized unaudited quarterly financial data is as follows:
|
|
Quarter Ended
|
||||||||||||||
|
|
2011
|
||||||||||||||
|
|
December 31
|
September 30
|
June 30
|
March 31
|
|||||||||||
|
|
(In millions, except per share data)
|
||||||||||||||
|
Operating revenues
|
$
|
2,132
|
|
$
|
2,674
|
|
$
|
2,278
|
|
$
|
1,995
|
|
|||
|
Operating income
|
9
|
|
43
|
|
269
|
|
314
|
|
|||||||
|
Net (loss)/income attributable to NRG Energy, Inc.
|
$
|
(109
|
)
|
$
|
(55
|
)
|
$
|
621
|
|
$
|
(260
|
)
|
|||
|
Weighted average number of common shares outstanding — basic
|
229
|
|
240
|
|
243
|
|
247
|
|
|||||||
|
Net (loss)/income per weighted average common share — basic
|
$
|
(0.48
|
)
|
$
|
(0.24
|
)
|
$
|
2.54
|
|
$
|
(1.06
|
)
|
|||
|
Weighted average number of common shares outstanding — diluted
|
229
|
|
240
|
|
244
|
|
247
|
|
|||||||
|
Net (loss)/income per weighted average common share — diluted
|
$
|
(0.48
|
)
|
$
|
(0.24
|
)
|
$
|
2.53
|
|
$
|
(1.06
|
)
|
|||
|
|
Quarter Ended
|
||||||||||||||
|
|
2010
|
||||||||||||||
|
|
December 31
|
September 30
|
June 30
|
March 31
|
|||||||||||
|
|
(In millions, except per share data)
|
||||||||||||||
|
Operating revenues
|
$
|
1,816
|
|
$
|
2,685
|
|
$
|
2,133
|
|
$
|
2,215
|
|
|||
|
Operating income
|
152
|
|
454
|
|
444
|
|
258
|
|
|||||||
|
Net (loss)/income attributable to NRG Energy, Inc.
|
$
|
(15
|
)
|
$
|
223
|
|
$
|
211
|
|
$
|
58
|
|
|||
|
Weighted average number of common shares outstanding — basic
|
248
|
|
252
|
|
255
|
|
254
|
|
|||||||
|
Net (loss)/income per weighted average common share — basic
|
$
|
(0.07
|
)
|
$
|
0.88
|
|
$
|
0.82
|
|
$
|
0.22
|
|
|||
|
Weighted average number of common shares outstanding — diluted
|
248
|
|
253
|
|
256
|
|
257
|
|
|||||||
|
Net (loss)/income per weighted average common share — diluted
|
$
|
(0.07
|
)
|
$
|
0.87
|
|
$
|
0.81
|
|
$
|
0.22
|
|
|||
194
As of
December 31, 2011
, the Company had
$1.1 billion
of
7.375%
Senior Notes due 2017,
$1.2 billion
of
7.625%
Senior Notes due 2018,
$700 million
of
8.50%
Senior Notes due 2019,
$800 million
of
7.625%
Senior Notes due 2019,
$1.1 billion
of
8.25%
Senior Notes due 2020, and
$1.2 billion
of
7.875%
Senior Notes due 2021. These notes are guaranteed by certain of NRG's current and future wholly-owned domestic subsidiaries, or guarantor subsidiaries.
Unless otherwise noted below, each of the following guarantor subsidiaries fully and unconditionally guaranteed the Senior Notes as of
December 31, 2011
:
|
Arthur Kill Power LLC
|
NEO Power Services Inc.
|
NRG Retail LLC
|
|
Astoria Gas Turbine Power LLC
|
New Genco GP, LLC
|
NRG Rockford Acquisition LLC
|
|
Cabrillo Power I LLC
|
Norwalk Power LLC
|
NRG Saguaro Operations Inc.
|
|
Cabrillo Power II LLC
|
NRG Affiliate Services Inc.
|
NRG Services Corporation
|
|
Carbon Management Solutions LLC
|
NRG Artesian Energy LLC
|
NRG SimplySmart Solutions LLC
|
|
Clean Edge Energy LLC
|
NRG Arthur Kill Operations Inc.
|
NRG South Central Affiliate Services Inc.
|
|
Conemaugh Power LLC
|
NRG Astoria Gas Turbine Operations Inc.
|
NRG South Central Generating LLC
|
|
Connecticut Jet Power LLC
|
NRG Bayou Cove LLC
|
NRG South Central Operations Inc.
|
|
Cottonwood Development LLC
|
NRG Cabrillo Power Operations Inc.
|
NRG South Texas LP
|
|
Cottonwood Energy Company LP
|
NRG California Peaker Operations LLC
|
NRG Texas LLC
|
|
Cottonwood Generating Partners I LLC
|
NRG Cedar Bayou Development Company, LLC
|
NRG Texas C&I Supply LLC
|
|
Cottonwood Generating Partners II LLC
|
NRG Connecticut Affiliate Services Inc.
|
NRG Texas Holding Inc.
|
|
Cottonwood Generating Partners III LLC
|
NRG Construction LLC
|
NRG Texas Power LLC
|
|
Cottonwood Technology Partners LP
|
NRG Development Company Inc.
|
NRG West Coast LLC
|
|
Devon Power LLC
|
NRG Devon Operations Inc.
|
NRG Western Affiliate Services Inc.
|
|
Dunkirk Power LLC
|
NRG Dunkirk Operations Inc.
|
O'Brien Cogeneration, Inc. II
|
|
Eastern Sierra Energy Company
|
NRG El Segundo Operations Inc.
|
ONSITE Energy, Inc.
|
|
Elbow Creek Wind Project LLC
|
NRG Energy Labor Services LLC
|
Oswego Harbor Power LLC
|
|
Energy Plus Holdings LLC
|
NRG Energy Services Group LLC
|
Pennywise Power LLC
|
|
Energy Plus Natural Gas LLC
|
NRG Energy Services LLC
|
RE Retail Receivable LLC
|
|
El Segundo Power LLC
|
NRG Generation Holdings Inc.
|
Reliant Energy Northeast LLC
|
|
El Segundo Power II, LLC
|
NRG Huntley Operations Inc.
|
Reliant Energy Power Supply LLC
|
|
Energy Protection Insurance Company
|
NRG Ilion Limited Partnership
|
Reliant Energy Retail Holdings LLC
|
|
GCP Funding Company LLC
|
NRG Ilion LP LLC
|
Reliant Energy Retail Services LLC
|
|
Green Mountain Energy Company
|
NRG International LLC
|
Reliant Energy Texas Retail LLC
|
|
Huntley Power LLC
|
NRG Maintenance Services LLC
|
RERH Holdings LLC
|
|
Independence Energy Alliance LLC
|
NRG Mextrans Inc.
|
Saguaro Power LLC
|
|
Independence Energy Group LLC
|
NRG MidAtlantic Affiliate Services Inc.
|
Somerset Operations Inc.
|
|
Independence Energy Natural Gas LLC
|
NRG Middletown Operations Inc.
|
Somerset Power LLC
|
|
Indian River Operations Inc.
|
NRG Montville Operations Inc.
|
Texas Genco Financing Corp.
|
|
Indian River Power LLC
|
NRG New Jersey Energy Sales LLC
|
Texas Genco GP, LLC
|
|
Keystone Power LLC
|
NRG New Roads Holdings LLC
|
Texas Genco Holdings, Inc.
|
|
Langford Wind Power, LLC
|
NRG North Central Operations Inc.
|
Texas Genco LP, LLC
|
|
Louisiana Generating LLC
|
NRG Northeast Affiliate Services Inc.
|
Texas Genco Operating Services LLC
|
|
Meriden Gas Turbines LLC
|
NRG Norwalk Harbor Operations Inc.
|
Texas Genco Services, LP
|
|
Middletown Power LLC
|
NRG Operating Services, Inc.
|
Vienna Operations, Inc.
|
|
Montville Power LLC
|
NRG Oswego Harbor Power Operations Inc.
|
Vienna Power LLC
|
|
NEO Corporation
|
NRG PacGen Inc.
|
WCP (Generation) Holdings LLC
|
|
NEO Freehold-Gen LLC
|
NRG Power Marketing LLC
|
West Coast Power LLC
|
195
The non-guarantor subsidiaries include all of NRG's foreign subsidiaries and certain domestic subsidiaries. NRG conducts much of its business through and derives much of its income from its subsidiaries. Therefore, the Company's ability to make required payments with respect to its indebtedness and other obligations depends on the financial results and condition of its subsidiaries and NRG's ability to receive funds from its subsidiaries. Except for NRG Bayou Cove, LLC, which is subject to certain restrictions under the Company's Peaker financing agreements, there are no restrictions on the ability of any of the guarantor subsidiaries to transfer funds to NRG. In addition, there may be restrictions for certain non-guarantor subsidiaries.
The following condensed consolidating financial information presents the financial information of NRG Energy, Inc., the guarantor subsidiaries and the non-guarantor subsidiaries in accordance with Rule 3-10 under the Securities and Exchange Commission's Regulation S-X. The financial information may not necessarily be indicative of results of operations or financial position had the guarantor subsidiaries or non-guarantor subsidiaries operated as independent entities.
In this presentation, NRG Energy, Inc. consists of parent company operations. Guarantor subsidiaries and non-guarantor subsidiaries of NRG are reported on an equity basis. For companies acquired, the fair values of the assets and liabilities acquired have been presented on a push-down accounting basis.
196
NRG ENERGY, INC. AND SUBSIDIARIES
CONDENSED CONSOLIDATING STATEMENTS OF OPERATIONS
For the Year Ended
December 31, 2011
|
Guarantor
Subsidiaries
|
Non-Guarantor
Subsidiaries
|
NRG Energy, Inc.
(Note Issuer)
|
Eliminations
(a)
|
Consolidated
Balance
|
|||||||||||||||
|
|
(In millions)
|
||||||||||||||||||
|
Operating Revenues
|
|
|
|
|
|
||||||||||||||
|
Total operating revenues
|
$
|
8,730
|
|
$
|
381
|
|
$
|
—
|
|
$
|
(32
|
)
|
$
|
9,079
|
|
||||
|
Operating Costs and Expenses
|
|
|
|
|
|
||||||||||||||
|
Cost of operations
|
6,430
|
|
266
|
|
—
|
|
(21
|
)
|
6,675
|
|
|||||||||
|
Depreciation and amortization
|
843
|
|
40
|
|
13
|
|
—
|
|
896
|
|
|||||||||
|
Impairment charge on emission allowances
|
160
|
|
—
|
|
—
|
|
—
|
|
160
|
|
|||||||||
|
Selling, general and administrative
|
393
|
|
27
|
|
252
|
|
(4
|
)
|
668
|
|
|||||||||
|
Development costs
|
—
|
|
(1
|
)
|
46
|
|
—
|
|
45
|
|
|||||||||
|
Total operating costs and expenses
|
7,826
|
|
332
|
|
311
|
|
(25
|
)
|
8,444
|
|
|||||||||
|
Operating Income/(Loss)
|
904
|
|
49
|
|
(311
|
)
|
(7
|
)
|
635
|
|
|||||||||
|
Other Income/(Expense)
|
|
|
|
|
|
||||||||||||||
|
Equity in earnings of consolidated subsidiaries
|
24
|
|
(7
|
)
|
593
|
|
(610
|
)
|
—
|
|
|||||||||
|
Equity in earnings of unconsolidated affiliates
|
10
|
|
25
|
|
—
|
|
—
|
|
35
|
|
|||||||||
|
Impairment charge on investment
|
(495
|
)
|
—
|
|
—
|
|
—
|
|
(495
|
)
|
|||||||||
|
Other income, net
|
2
|
|
13
|
|
4
|
|
—
|
|
19
|
|
|||||||||
|
Loss on debt extinguishment and refinancing
|
—
|
|
—
|
|
(175
|
)
|
—
|
|
(175
|
)
|
|||||||||
|
Interest expense
|
(59
|
)
|
(56
|
)
|
(550
|
)
|
—
|
|
(665
|
)
|
|||||||||
|
Total other expense
|
(518
|
)
|
(25
|
)
|
(128
|
)
|
(610
|
)
|
(1,281
|
)
|
|||||||||
|
Income/(Loss) Before Income Taxes
|
386
|
|
24
|
|
(439
|
)
|
(617
|
)
|
(646
|
)
|
|||||||||
|
Income tax (benefit)/expense
|
(214
|
)
|
7
|
|
(636
|
)
|
—
|
|
(843
|
)
|
|||||||||
|
Net Income/(Loss) attributable to NRG Energy, Inc
.
|
$
|
600
|
|
$
|
17
|
|
$
|
197
|
|
$
|
(617
|
)
|
$
|
197
|
|
||||
|
(a)
|
All significant intercompany transactions have been eliminated in consolidation.
|
197
NRG ENERGY, INC. AND SUBSIDIARIES
CONDENSED CONSOLIDATING BALANCE SHEETS
December 31, 2011
|
Guarantor
Subsidiaries
|
Non-Guarantor
Subsidiaries
|
NRG Energy, Inc.
|
Eliminations
(a)
|
Consolidated Balance
|
|||||||||||||||
|
|
(In millions)
|
||||||||||||||||||
|
ASSETS
|
|||||||||||||||||||
|
Current Assets
|
|
|
|
|
|
||||||||||||||
|
Cash and cash equivalents
|
$
|
44
|
|
$
|
85
|
|
$
|
976
|
|
$
|
—
|
|
$
|
1,105
|
|
||||
|
Funds deposited by counterparties
|
258
|
|
—
|
|
—
|
|
—
|
|
258
|
|
|||||||||
|
Restricted cash
|
8
|
|
231
|
|
53
|
|
—
|
|
292
|
|
|||||||||
|
Accounts receivable-trade, net
|
789
|
|
45
|
|
—
|
|
—
|
|
834
|
|
|||||||||
|
Inventory
|
300
|
|
8
|
|
—
|
|
—
|
|
308
|
|
|||||||||
|
Derivative instruments
|
4,222
|
|
—
|
|
—
|
|
(6
|
)
|
4,216
|
|
|||||||||
|
Cash collateral paid in support of energy risk management activities
|
311
|
|
—
|
|
—
|
|
—
|
|
311
|
|
|||||||||
|
Prepayments and other current assets
|
1,229
|
|
28
|
|
(983
|
)
|
(1
|
)
|
273
|
|
|||||||||
|
Total current assets
|
7,161
|
|
397
|
|
46
|
|
(7
|
)
|
7,597
|
|
|||||||||
|
Net Property, Plant and Equipment
|
10,456
|
|
3,116
|
|
67
|
|
(18
|
)
|
13,621
|
|
|||||||||
|
Other Assets
|
|
|
|
|
|
||||||||||||||
|
Investment in subsidiaries
|
225
|
|
491
|
|
16,169
|
|
(16,885
|
)
|
—
|
|
|||||||||
|
Equity investments in affiliates
|
33
|
|
607
|
|
—
|
|
—
|
|
640
|
|
|||||||||
|
Capital leases and notes receivable, less current portion
|
1
|
|
341
|
|
172
|
|
(172
|
)
|
342
|
|
|||||||||
|
Goodwill
|
1,886
|
|
—
|
|
—
|
|
—
|
|
1,886
|
|
|||||||||
|
Intangible assets, net
|
1,340
|
|
84
|
|
33
|
|
(38
|
)
|
1,419
|
|
|||||||||
|
Nuclear decommissioning trust fund
|
424
|
|
—
|
|
—
|
|
—
|
|
424
|
|
|||||||||
|
Derivative instruments
|
450
|
|
—
|
|
—
|
|
—
|
|
450
|
|
|||||||||
|
Other non-current assets
|
55
|
|
72
|
|
209
|
|
—
|
|
336
|
|
|||||||||
|
Total other assets
|
4,414
|
|
1,595
|
|
16,583
|
|
(17,095
|
)
|
5,497
|
|
|||||||||
|
Total Assets
|
$
|
22,031
|
|
$
|
5,108
|
|
$
|
16,696
|
|
$
|
(17,120
|
)
|
$
|
26,715
|
|
||||
|
LIABILITIES AND STOCKHOLDERS' EQUITY
|
|||||||||||||||||||
|
Current Liabilities
|
|
|
|
|
|
||||||||||||||
|
Current portion of long-term debt and capital leases
|
$
|
—
|
|
$
|
72
|
|
$
|
15
|
|
$
|
—
|
|
$
|
87
|
|
||||
|
Accounts payable
|
(407
|
)
|
122
|
|
1,093
|
|
—
|
|
808
|
|
|||||||||
|
Derivative instruments
|
3,712
|
|
23
|
|
22
|
|
(6
|
)
|
3,751
|
|
|||||||||
|
Deferred income taxes
|
534
|
|
(51
|
)
|
(356
|
)
|
—
|
|
127
|
|
|||||||||
|
Cash collateral received in support of energy risk management activities
|
258
|
|
—
|
|
—
|
|
—
|
|
258
|
|
|||||||||
|
Accrued expenses and other current liabilities
|
371
|
|
23
|
|
247
|
|
(1
|
)
|
640
|
|
|||||||||
|
Total current liabilities
|
4,468
|
|
189
|
|
1,021
|
|
(7
|
)
|
5,671
|
|
|||||||||
|
Other Liabilities
|
|
|
|
|
|
||||||||||||||
|
Long-term debt and capital leases
|
264
|
|
1,999
|
|
7,654
|
|
(172
|
)
|
9,745
|
|
|||||||||
|
Nuclear decommissioning reserve
|
335
|
|
—
|
|
—
|
|
—
|
|
335
|
|
|||||||||
|
Nuclear decommissioning trust liability
|
254
|
|
—
|
|
—
|
|
—
|
|
254
|
|
|||||||||
|
Postretirement and other benefit obligations
|
367
|
|
—
|
|
33
|
|
—
|
|
400
|
|
|||||||||
|
Deferred income taxes
|
950
|
|
273
|
|
166
|
|
—
|
|
1,389
|
|
|||||||||
|
Derivative instruments
|
394
|
|
66
|
|
4
|
|
—
|
|
464
|
|
|||||||||
|
Out-of-market commodity contracts
|
208
|
|
6
|
|
—
|
|
(31
|
)
|
183
|
|
|||||||||
|
Other non-current liabilities
|
177
|
|
96
|
|
83
|
|
—
|
|
356
|
|
|||||||||
|
Total non-current liabilities
|
2,949
|
|
2,440
|
|
7,940
|
|
(203
|
)
|
13,126
|
|
|||||||||
|
Total liabilities
|
7,417
|
|
2,629
|
|
8,961
|
|
(210
|
)
|
18,797
|
|
|||||||||
|
3.625% Preferred Stock
|
—
|
|
—
|
|
249
|
|
—
|
|
249
|
|
|||||||||
|
Stockholders' Equity
|
14,614
|
|
2,479
|
|
7,486
|
|
(16,910
|
)
|
7,669
|
|
|||||||||
|
Total Liabilities and Stockholders' Equity
|
$
|
22,031
|
|
$
|
5,108
|
|
$
|
16,696
|
|
$
|
(17,120
|
)
|
$
|
26,715
|
|
||||
|
(a)
|
All significant intercompany transactions have been eliminated in consolidation.
|
198
NRG ENERGY, INC. AND SUBSIDIARIES
CONDENSED CONSOLIDATING STATEMENTS OF CASH FLOWS
For the Year Ended
December 31, 2011
|
Guarantor
Subsidiaries
|
Non-Guarantor
Subsidiaries
|
NRG Energy, Inc.
|
Eliminations
(a)
|
Consolidated
Balance
|
|||||||||||||||
|
|
(In millions)
|
||||||||||||||||||
|
Cash Flows from Operating Activities
|
|
|
|
|
|
||||||||||||||
|
Net income
|
$
|
600
|
|
$
|
17
|
|
$
|
197
|
|
$
|
(617
|
)
|
$
|
197
|
|
||||
|
Adjustments to reconcile net income to net cash provided/(used) by operating activities:
|
|
|
|
|
|
||||||||||||||
|
Distributions and equity in earnings of unconsolidated affiliates and consolidated subsidiaries
|
(11
|
)
|
3
|
|
776
|
|
(759
|
)
|
9
|
|
|||||||||
|
Depreciation and amortization
|
843
|
|
40
|
|
13
|
|
—
|
|
896
|
|
|||||||||
|
Provision for bad debts
|
59
|
|
—
|
|
—
|
|
—
|
|
59
|
|
|||||||||
|
Amortization of nuclear fuel
|
39
|
|
—
|
|
—
|
|
—
|
|
39
|
|
|||||||||
|
Amortization of financing costs and debt discounts/premiums
|
—
|
|
6
|
|
26
|
|
—
|
|
32
|
|
|||||||||
|
Loss on debt extinguishment
|
—
|
|
—
|
|
58
|
|
—
|
|
58
|
|
|||||||||
|
Amortization of intangibles and out-of-market contracts.
|
166
|
|
1
|
|
—
|
|
—
|
|
167
|
|
|||||||||
|
Changes in deferred income taxes and liability for uncertain tax benefits
|
(214
|
)
|
7
|
|
(652
|
)
|
—
|
|
(859
|
)
|
|||||||||
|
Changes in nuclear decommissioning liability
|
20
|
|
—
|
|
—
|
|
—
|
|
20
|
|
|||||||||
|
Changes in derivative instruments
|
(137
|
)
|
(1
|
)
|
—
|
|
—
|
|
(138
|
)
|
|||||||||
|
Impairment charges and asset write downs
|
648
|
|
9
|
|
—
|
|
—
|
|
657
|
|
|||||||||
|
Loss on disposals and sales of assets
|
13
|
|
1
|
|
—
|
|
—
|
|
14
|
|
|||||||||
|
Amortization of unearned equity compensation
|
—
|
|
—
|
|
28
|
|
—
|
|
28
|
|
|||||||||
|
Other assets and liabilities
|
(1,405
|
)
|
211
|
|
1,174
|
|
7
|
|
(13
|
)
|
|||||||||
|
Net Cash Provided/(Used) by Operating Activities
|
621
|
|
294
|
|
1,620
|
|
(1,369
|
)
|
1,166
|
|
|||||||||
|
Cash Flows from Investing Activities
|
|
|
|
|
|
||||||||||||||
|
Intercompany loans to subsidiaries
|
796
|
|
—
|
|
287
|
|
(1,083
|
)
|
—
|
|
|||||||||
|
Investment in Subsidiaries
|
—
|
|
(1,300
|
)
|
—
|
|
1,300
|
|
—
|
|
|||||||||
|
Acquisition of business, net of cash acquired
|
—
|
|
(115
|
)
|
(262
|
)
|
—
|
|
(377
|
)
|
|||||||||
|
Capital expenditures
|
(383
|
)
|
(1,882
|
)
|
(45
|
)
|
—
|
|
(2,310
|
)
|
|||||||||
|
Increase in restricted cash, net
|
(5
|
)
|
(29
|
)
|
(1
|
)
|
—
|
|
(35
|
)
|
|||||||||
|
Increase in restricted cash - U.S. DOE projects
|
—
|
|
(162
|
)
|
(53
|
)
|
—
|
|
(215
|
)
|
|||||||||
|
Decrease in notes receivable
|
—
|
|
12
|
|
—
|
|
—
|
|
12
|
|
|||||||||
|
Purchases of emission allowances, net of proceeds
|
(19
|
)
|
—
|
|
—
|
|
—
|
|
(19
|
)
|
|||||||||
|
Investments in nuclear decommissioning trust fund securities
|
(406
|
)
|
—
|
|
—
|
|
—
|
|
(406
|
)
|
|||||||||
|
Proceeds from sales of nuclear decommissioning trust fund securities
|
385
|
|
—
|
|
—
|
|
—
|
|
385
|
|
|||||||||
|
Proceeds/(purchases) from sale of assets, net
|
13
|
|
(6
|
)
|
—
|
|
—
|
|
7
|
|
|||||||||
|
Equity investment in unconsolidated affiliates
|
(2
|
)
|
(64
|
)
|
—
|
|
—
|
|
(66
|
)
|
|||||||||
|
Other
|
(2
|
)
|
(8
|
)
|
(13
|
)
|
—
|
|
(23
|
)
|
|||||||||
|
Net Cash Provided/(Used) by Investing Activities
|
377
|
|
(3,554
|
)
|
(87
|
)
|
217
|
|
(3,047
|
)
|
|||||||||
|
Cash Flows from Financing Activities
|
|
|
|
|
|
||||||||||||||
|
(Payments)/proceeds from intercompany loans
|
(1,112
|
)
|
825
|
|
(796
|
)
|
1,083
|
|
—
|
|
|||||||||
|
Payment of dividends to preferred stockholders
|
—
|
|
—
|
|
(9
|
)
|
—
|
|
(9
|
)
|
|||||||||
|
Payments of intercompany dividends
|
(65
|
)
|
(4
|
)
|
—
|
|
69
|
|
—
|
|
|||||||||
|
Payment for treasury stock
|
—
|
|
—
|
|
(430
|
)
|
—
|
|
(430
|
)
|
|||||||||
|
Net payments to settle acquired derivatives that include financing elements
|
(83
|
)
|
—
|
|
—
|
|
—
|
|
(83
|
)
|
|||||||||
|
Proceeds from issuance of long-term debt
|
138
|
|
1,290
|
|
4,796
|
|
—
|
|
6,224
|
|
|||||||||
|
Decrease in restricted cash supporting funded letter of credit facility
|
—
|
|
1,300
|
|
—
|
|
—
|
|
1,300
|
|
|||||||||
|
Payment for settlement of funded letter of credit
|
—
|
|
—
|
|
(1,300
|
)
|
—
|
|
(1,300
|
)
|
|||||||||
|
Cash proceeds from noncontrolling interest in subsidiaries
|
—
|
|
29
|
|
—
|
|
—
|
|
29
|
|
|||||||||
|
Proceeds from issuance of common stock
|
—
|
|
—
|
|
2
|
|
—
|
|
2
|
|
|||||||||
|
Payment of debt issuance and hedging costs
|
—
|
|
(92
|
)
|
(115
|
)
|
—
|
|
(207
|
)
|
|||||||||
|
Payments for short and long-term debt
|
—
|
|
(116
|
)
|
(5,377
|
)
|
—
|
|
(5,493
|
)
|
|||||||||
|
Net Cash (Used)/Provided by Financing Activities
|
(1,122
|
)
|
3,232
|
|
(3,229
|
)
|
1,152
|
|
33
|
|
|||||||||
|
Effect of exchange rate changes on cash and cash equivalents
|
—
|
|
2
|
|
—
|
|
—
|
|
2
|
|
|||||||||
|
Net Decrease in Cash and Cash Equivalents
|
(124
|
)
|
(26
|
)
|
(1,696
|
)
|
—
|
|
(1,846
|
)
|
|||||||||
|
Cash and Cash Equivalents at Beginning of Period
|
168
|
|
111
|
|
2,672
|
|
—
|
|
2,951
|
|
|||||||||
|
Cash and Cash Equivalents at End of Period
|
$
|
44
|
|
$
|
85
|
|
$
|
976
|
|
$
|
—
|
|
$
|
1,105
|
|
||||
|
(a)
|
All significant intercompany transactions have been eliminated in consolidation.
|
199
NRG ENERGY, INC. AND SUBSIDIARIES
CONDENSED CONSOLIDATING STATEMENTS OF OPERATIONS
For the Year Ended
December 31, 2010
|
Guarantor
Subsidiaries
|
Non-Guarantor
Subsidiaries
|
NRG Energy, Inc.
(Note Issuer)
|
Eliminations
(a)
|
Consolidated
Balance
|
|||||||||||||||
|
|
(In millions)
|
||||||||||||||||||
|
Operating Revenues
|
|
|
|
|
|
||||||||||||||
|
Total operating revenues
|
$
|
8,507
|
|
$
|
374
|
|
$
|
—
|
|
$
|
(32
|
)
|
$
|
8,849
|
|
||||
|
Operating Costs and Expenses
|
|
|
|
|
|
||||||||||||||
|
Cost of operations
|
5,849
|
|
256
|
|
—
|
|
(32
|
)
|
6,073
|
|
|||||||||
|
Depreciation and amortization
|
796
|
|
32
|
|
10
|
|
—
|
|
838
|
|
|||||||||
|
Selling, general and administrative
|
325
|
|
12
|
|
261
|
|
—
|
|
598
|
|
|||||||||
|
Development costs
|
—
|
|
10
|
|
45
|
|
—
|
|
55
|
|
|||||||||
|
Total operating costs and expenses
|
6,970
|
|
310
|
|
316
|
|
(32
|
)
|
7,564
|
|
|||||||||
|
Gain on sale of assets
|
—
|
|
—
|
|
23
|
|
—
|
|
23
|
|
|||||||||
|
Operating Income/(Loss)
|
1,537
|
|
64
|
|
(293
|
)
|
—
|
|
1,308
|
|
|||||||||
|
Other Income/(Expense)
|
|
|
|
|
|
||||||||||||||
|
Equity in earnings of consolidated subsidiaries
|
38
|
|
(1
|
)
|
979
|
|
(1,016
|
)
|
—
|
|
|||||||||
|
Equity in earnings of unconsolidated affiliates
|
6
|
|
38
|
|
—
|
|
—
|
|
44
|
|
|||||||||
|
Other income, net
|
4
|
|
25
|
|
4
|
|
—
|
|
33
|
|
|||||||||
|
Loss on debt extinguishment and refinancing expense
|
—
|
|
—
|
|
(2
|
)
|
—
|
|
(2
|
)
|
|||||||||
|
Interest expense
|
(11
|
)
|
(52
|
)
|
(567
|
)
|
—
|
|
(630
|
)
|
|||||||||
|
Total other income/(expense)
|
37
|
|
10
|
|
414
|
|
(1,016
|
)
|
(555
|
)
|
|||||||||
|
Income Before Income Taxes
|
1,574
|
|
74
|
|
121
|
|
(1,016
|
)
|
753
|
|
|||||||||
|
Income tax expense/(benefit)
|
593
|
|
40
|
|
(356
|
)
|
—
|
|
277
|
|
|||||||||
|
Net Income
|
981
|
|
34
|
|
477
|
|
(1,016
|
)
|
476
|
|
|||||||||
|
Less: Net loss attributable to noncontrolling interest
|
(1
|
)
|
—
|
|
—
|
|
—
|
|
(1
|
)
|
|||||||||
|
Net Income attributable to NRG Energy, Inc
.
|
$
|
982
|
|
$
|
34
|
|
$
|
477
|
|
$
|
(1,016
|
)
|
$
|
477
|
|
||||
|
(a)
|
All significant intercompany transactions have been eliminated in consolidation.
|
200
NRG ENERGY, INC. AND SUBSIDIARIES
CONDENSED CONSOLIDATING BALANCE SHEETS
December 31, 2010
|
Guarantor
Subsidiaries
|
Non-Guarantor
Subsidiaries
|
NRG Energy, Inc.
|
Eliminations
(a)
|
Consolidated
Balance
|
|||||||||||||||
|
|
(In millions)
|
||||||||||||||||||
|
ASSETS
|
|||||||||||||||||||
|
Current Assets
|
|
|
|
|
|
||||||||||||||
|
Cash and cash equivalents
|
$
|
168
|
|
$
|
111
|
|
$
|
2,672
|
|
$
|
—
|
|
$
|
2,951
|
|
||||
|
Funds deposited by counterparties
|
408
|
|
—
|
|
—
|
|
—
|
|
408
|
|
|||||||||
|
Restricted cash
|
2
|
|
6
|
|
—
|
|
—
|
|
8
|
|
|||||||||
|
Accounts receivable-trade, net
|
693
|
|
38
|
|
3
|
|
—
|
|
734
|
|
|||||||||
|
Inventory
|
445
|
|
8
|
|
—
|
|
—
|
|
453
|
|
|||||||||
|
Derivative instruments
|
1,964
|
|
—
|
|
—
|
|
—
|
|
1,964
|
|
|||||||||
|
Cash collateral paid in support of energy risk management activities
|
321
|
|
2
|
|
—
|
|
—
|
|
323
|
|
|||||||||
|
Prepayments and other current assets
|
112
|
|
60
|
|
1,313
|
|
(1,189
|
)
|
296
|
|
|||||||||
|
Total current assets
|
4,113
|
|
225
|
|
3,988
|
|
(1,189
|
)
|
7,137
|
|
|||||||||
|
Net Property, Plant and Equipment
|
10,816
|
|
1,515
|
|
186
|
|
—
|
|
12,517
|
|
|||||||||
|
Other Assets
|
|
|
|
|
|
||||||||||||||
|
Investment in subsidiaries
|
811
|
|
248
|
|
22,046
|
|
(23,105
|
)
|
—
|
|
|||||||||
|
Equity investments in affiliates
|
47
|
|
489
|
|
—
|
|
—
|
|
536
|
|
|||||||||
|
Notes receivable - affiliate and capital leases, less current portion
|
6,507
|
|
380
|
|
2,130
|
|
(8,633
|
)
|
384
|
|
|||||||||
|
Goodwill
|
1,868
|
|
—
|
|
—
|
|
—
|
|
1,868
|
|
|||||||||
|
Intangible assets, net
|
1,716
|
|
58
|
|
33
|
|
(31
|
)
|
1,776
|
|
|||||||||
|
Nuclear decommissioning trust fund
|
412
|
|
—
|
|
—
|
|
—
|
|
412
|
|
|||||||||
|
Derivative instruments
|
758
|
|
—
|
|
—
|
|
—
|
|
758
|
|
|||||||||
|
Restricted cash supporting funded letter of credit facility
|
—
|
|
1,300
|
|
—
|
|
—
|
|
1,300
|
|
|||||||||
|
Other non-current assets
|
42
|
|
22
|
|
144
|
|
—
|
|
208
|
|
|||||||||
|
Total other assets
|
12,161
|
|
2,497
|
|
24,353
|
|
(31,769
|
)
|
7,242
|
|
|||||||||
|
Total Assets
|
$
|
27,090
|
|
$
|
4,237
|
|
$
|
28,527
|
|
$
|
(32,958
|
)
|
$
|
26,896
|
|
||||
|
LIABILITIES AND STOCKHOLDERS' EQUITY
|
|||||||||||||||||||
|
Current Liabilities
|
|
|
|
|
|
||||||||||||||
|
Current portion of long-term debt and capital leases
|
$
|
1,150
|
|
$
|
223
|
|
$
|
240
|
|
$
|
(1,150
|
)
|
$
|
463
|
|
||||
|
Accounts payable
|
(2,665
|
)
|
229
|
|
3,219
|
|
—
|
|
783
|
|
|||||||||
|
Derivative instruments
|
1,665
|
|
3
|
|
17
|
|
—
|
|
1,685
|
|
|||||||||
|
Deferred income taxes
|
515
|
|
(51
|
)
|
(356
|
)
|
—
|
|
108
|
|
|||||||||
|
Cash collateral received in support of energy risk management activities
|
408
|
|
—
|
|
—
|
|
—
|
|
408
|
|
|||||||||
|
Accrued expenses and other current liabilities
|
399
|
|
34
|
|
379
|
|
(39
|
)
|
773
|
|
|||||||||
|
Total current liabilities
|
1,472
|
|
438
|
|
3,499
|
|
(1,189
|
)
|
4,220
|
|
|||||||||
|
Other Liabilities
|
|
|
|
|
|
||||||||||||||
|
Long-term debt and capital leases
|
1,857
|
|
991
|
|
14,533
|
|
(8,633
|
)
|
8,748
|
|
|||||||||
|
Funded letter of credit
|
—
|
|
—
|
|
1,300
|
|
—
|
|
1,300
|
|
|||||||||
|
Nuclear decommissioning reserve
|
317
|
|
—
|
|
—
|
|
—
|
|
317
|
|
|||||||||
|
Nuclear decommissioning trust liability
|
272
|
|
—
|
|
—
|
|
—
|
|
272
|
|
|||||||||
|
Postretirement and other benefit obligations
|
309
|
|
(1
|
)
|
14
|
|
—
|
|
322
|
|
|||||||||
|
Deferred income taxes
|
1,464
|
|
279
|
|
246
|
|
—
|
|
1,989
|
|
|||||||||
|
Derivative instruments
|
294
|
|
34
|
|
37
|
|
—
|
|
365
|
|
|||||||||
|
Out-of-market commodity contracts
|
248
|
|
6
|
|
—
|
|
(31
|
)
|
223
|
|
|||||||||
|
Other non-current liabilities
|
195
|
|
30
|
|
595
|
|
—
|
|
820
|
|
|||||||||
|
Total non-current liabilities
|
4,956
|
|
1,339
|
|
16,725
|
|
(8,664
|
)
|
14,356
|
|
|||||||||
|
Total liabilities
|
6,428
|
|
1,777
|
|
20,224
|
|
(9,853
|
)
|
18,576
|
|
|||||||||
|
3.625% Preferred Stock
|
—
|
|
—
|
|
248
|
|
—
|
|
248
|
|
|||||||||
|
Stockholders' Equity
|
20,662
|
|
2,460
|
|
8,055
|
|
(23,105
|
)
|
8,072
|
|
|||||||||
|
Total Liabilities and Stockholders' Equity
|
$
|
27,090
|
|
$
|
4,237
|
|
$
|
28,527
|
|
$
|
(32,958
|
)
|
$
|
26,896
|
|
||||
|
(a)
|
All significant intercompany transactions have been eliminated in consolidation.
|
201
NRG ENERGY, INC. AND SUBSIDIARIES
CONDENSED CONSOLIDATING STATEMENTS OF CASH FLOWS
For the Year Ended
December 31, 2010
|
Guarantor
Subsidiaries
|
Non-Guarantor
Subsidiaries
|
NRG Energy, Inc.
|
Eliminations
(a)
|
Consolidated
Balance
|
|||||||||||||||
|
|
(In millions)
|
||||||||||||||||||
|
Cash Flows from Operating Activities
|
|
|
|
|
|
||||||||||||||
|
Net income
|
$
|
981
|
|
$
|
34
|
|
$
|
477
|
|
$
|
(1,016
|
)
|
$
|
476
|
|
||||
|
Adjustments to reconcile net income to net cash provided by operating activities:
|
|
|
|
|
|
||||||||||||||
|
Distributions and equity (earnings)/losses of unconsolidated affiliates and consolidated subsidiaries
|
14
|
|
(12
|
)
|
(914
|
)
|
893
|
|
(19
|
)
|
|||||||||
|
Depreciation and amortization
|
796
|
|
32
|
|
10
|
|
—
|
|
838
|
|
|||||||||
|
Provision for bad debts
|
54
|
|
—
|
|
—
|
|
—
|
|
54
|
|
|||||||||
|
Amortization of nuclear fuel
|
40
|
|
—
|
|
—
|
|
—
|
|
40
|
|
|||||||||
|
Amortization of financing costs and debt discounts/premiums
|
—
|
|
6
|
|
26
|
|
—
|
|
32
|
|
|||||||||
|
Amortization of intangibles and out-of-market contracts.
|
4
|
|
—
|
|
—
|
|
—
|
|
4
|
|
|||||||||
|
Impairment charges and asset write downs
|
20
|
|
—
|
|
5
|
|
—
|
|
25
|
|
|||||||||
|
Changes in deferred income taxes and liability for uncertain tax benefits
|
593
|
|
27
|
|
(365
|
)
|
—
|
|
255
|
|
|||||||||
|
Changes in nuclear decommissioning liability
|
34
|
|
—
|
|
—
|
|
—
|
|
34
|
|
|||||||||
|
Changes in derivatives
|
(113
|
)
|
(1
|
)
|
—
|
|
—
|
|
(114
|
)
|
|||||||||
|
Loss/(gain) on disposals and sales of assets
|
27
|
|
—
|
|
(23
|
)
|
—
|
|
4
|
|
|||||||||
|
Amortization of unearned equity compensation
|
—
|
|
—
|
|
30
|
|
—
|
|
30
|
|
|||||||||
|
Other assets and liabilities
|
(625
|
)
|
(187
|
)
|
776
|
|
—
|
|
(36
|
)
|
|||||||||
|
Net Cash Provided/(Used) by Operating Activities
|
1,825
|
|
(101
|
)
|
22
|
|
(123
|
)
|
1,623
|
|
|||||||||
|
Cash Flows from Investing Activities
|
|
|
|
|
|
||||||||||||||
|
Intercompany (loans to)/receipts from subsidiaries
|
(1,620
|
)
|
—
|
|
(195
|
)
|
1,815
|
|
—
|
|
|||||||||
|
Investment in subsidiaries
|
—
|
|
1,727
|
|
(1,727
|
)
|
—
|
|
—
|
|
|||||||||
|
Capital expenditures
|
(308
|
)
|
(323
|
)
|
(75
|
)
|
—
|
|
(706
|
)
|
|||||||||
|
Acquisition of businesses, net of cash acquired
|
—
|
|
(142
|
)
|
(864
|
)
|
—
|
|
(1,006
|
)
|
|||||||||
|
Decrease/(increase) in restricted cash, net
|
1
|
|
(5
|
)
|
—
|
|
—
|
|
(4
|
)
|
|||||||||
|
Decrease in notes receivable
|
—
|
|
39
|
|
—
|
|
—
|
|
39
|
|
|||||||||
|
Purchases of emission allowances, net of proceeds
|
(34
|
)
|
—
|
|
—
|
|
—
|
|
(34
|
)
|
|||||||||
|
Investments in nuclear decommissioning trust fund securities
|
(341
|
)
|
—
|
|
—
|
|
—
|
|
(341
|
)
|
|||||||||
|
Proceeds from sales of nuclear decommissioning trust fund securities
|
307
|
|
—
|
|
—
|
|
—
|
|
307
|
|
|||||||||
|
Proceeds from renewable energy grants
|
84
|
|
18
|
|
—
|
|
—
|
|
102
|
|
|||||||||
|
Proceeds from sale of assets, net
|
14
|
|
—
|
|
29
|
|
—
|
|
43
|
|
|||||||||
|
Equity investment in unconsolidated affiliate
|
4
|
|
(22
|
)
|
(5
|
)
|
—
|
|
(23
|
)
|
|||||||||
|
Net Cash (Used)/Provided by Investing Activities
|
(1,893
|
)
|
1,292
|
|
(2,837
|
)
|
1,815
|
|
(1,623
|
)
|
|||||||||
|
Cash Flows from Financing Activities
|
|
|
|
|
|
||||||||||||||
|
Proceeds/(payments) from intercompany loans
|
69
|
|
126
|
|
1,620
|
|
(1,815
|
)
|
—
|
|
|||||||||
|
Payment of intercompany dividends
|
(58
|
)
|
(65
|
)
|
—
|
|
123
|
|
—
|
|
|||||||||
|
Payment of dividends to preferred stockholders
|
—
|
|
—
|
|
(9
|
)
|
—
|
|
(9
|
)
|
|||||||||
|
Net receipts from acquired derivatives that include financing elements
|
137
|
|
—
|
|
—
|
|
—
|
|
137
|
|
|||||||||
|
Payment for treasury stock
|
—
|
|
—
|
|
(180
|
)
|
—
|
|
(180
|
)
|
|||||||||
|
Installment proceeds from sale of noncontrolling interest in subsidiary
|
—
|
|
50
|
|
—
|
|
—
|
|
50
|
|
|||||||||
|
Proceeds from issuance of common stock
|
—
|
|
—
|
|
2
|
|
—
|
|
2
|
|
|||||||||
|
Proceeds from issuance of long-term debt
|
73
|
|
306
|
|
1,105
|
|
—
|
|
1,484
|
|
|||||||||
|
Proceeds from issuance of term loan for funded letter of credit facility
|
—
|
|
—
|
|
1,300
|
|
—
|
|
1,300
|
|
|||||||||
|
Increase in restricted cash supporting funded letter of credit facility
|
—
|
|
(1,300
|
)
|
—
|
|
—
|
|
(1,300
|
)
|
|||||||||
|
Payment of debt issuance and hedging costs
|
(5
|
)
|
(9
|
)
|
(61
|
)
|
—
|
|
(75
|
)
|
|||||||||
|
Payments of short and long-term debt
|
—
|
|
(304
|
)
|
(454
|
)
|
—
|
|
(758
|
)
|
|||||||||
|
Net Cash Provided/(Used) by Financing Activities
|
216
|
|
(1,196
|
)
|
3,323
|
|
(1,692
|
)
|
651
|
|
|||||||||
|
Effect of exchange rate changes on cash and cash equivalents
|
—
|
|
(4
|
)
|
—
|
|
—
|
|
(4
|
)
|
|||||||||
|
Net Increase/(Decrease) in Cash and Cash Equivalents
|
148
|
|
(9
|
)
|
508
|
|
—
|
|
647
|
|
|||||||||
|
Cash and Cash Equivalents at Beginning of Period
|
20
|
|
120
|
|
2,164
|
|
—
|
|
2,304
|
|
|||||||||
|
Cash and Cash Equivalents at End of Period
|
$
|
168
|
|
$
|
111
|
|
$
|
2,672
|
|
$
|
—
|
|
$
|
2,951
|
|
||||
|
(a)
|
All significant intercompany transactions have been eliminated in consolidation.
|
202
NRG ENERGY, INC. AND SUBSIDIARIES
CONDENSED CONSOLIDATING STATEMENTS OF OPERATIONS
For the Year Ended December 31,
2009
|
Guarantor
Subsidiaries
|
Non-Guarantor
Subsidiaries
|
NRG Energy, Inc.
|
Eliminations
(a)
|
Consolidated
Balance
|
|||||||||||||||
|
|
(In millions)
|
||||||||||||||||||
|
Operating Revenues
|
|
|
|
|
|
||||||||||||||
|
Total operating revenues
|
$
|
8,584
|
|
$
|
357
|
|
$
|
31
|
|
$
|
(20
|
)
|
$
|
8,952
|
|
||||
|
Operating Costs and Expenses
|
|
|
|
|
|
||||||||||||||
|
Cost of operations
|
5,110
|
|
236
|
|
1
|
|
(24
|
)
|
5,323
|
|
|||||||||
|
Depreciation and amortization
|
772
|
|
40
|
|
6
|
|
—
|
|
818
|
|
|||||||||
|
Selling, general and administrative
|
266
|
|
11
|
|
273
|
|
—
|
|
550
|
|
|||||||||
|
Acquisition-related transaction and integration costs
|
—
|
|
—
|
|
54
|
|
—
|
|
54
|
|
|||||||||
|
Development costs
|
6
|
|
8
|
|
34
|
|
—
|
|
48
|
|
|||||||||
|
Total operating costs and expenses
|
6,154
|
|
295
|
|
368
|
|
(24
|
)
|
6,793
|
|
|||||||||
|
Operating Income/(Loss)
|
2,430
|
|
62
|
|
(337
|
)
|
4
|
|
2,159
|
|
|||||||||
|
Other Income/(Expense)
|
|
|
|
|
|
||||||||||||||
|
Equity in earnings of consolidated subsidiaries
|
166
|
|
—
|
|
1,503
|
|
(1,669
|
)
|
—
|
|
|||||||||
|
Equity in earnings of unconsolidated affiliates
|
10
|
|
31
|
|
—
|
|
—
|
|
41
|
|
|||||||||
|
Gains on sales of equity method investments
|
—
|
|
128
|
|
—
|
|
—
|
|
128
|
|
|||||||||
|
Other income/(expense), net
|
9
|
|
(16
|
)
|
6
|
|
(4
|
)
|
(5
|
)
|
|||||||||
|
Refinancing expense
|
(1
|
)
|
—
|
|
(19
|
)
|
—
|
|
(20
|
)
|
|||||||||
|
Interest expense
|
(106
|
)
|
(86
|
)
|
(442
|
)
|
—
|
|
(634
|
)
|
|||||||||
|
Total other income/(expense)
|
78
|
|
57
|
|
1,048
|
|
(1,673
|
)
|
(490
|
)
|
|||||||||
|
Income Before Income Taxes
|
2,508
|
|
119
|
|
711
|
|
(1,669
|
)
|
1,669
|
|
|||||||||
|
Income tax expense/(benefit)
|
964
|
|
(5
|
)
|
(231
|
)
|
—
|
|
728
|
|
|||||||||
|
Net Income
|
1,544
|
|
124
|
|
942
|
|
(1,669
|
)
|
941
|
|
|||||||||
|
Less: Net loss attributable to noncontrolling interest
|
(1
|
)
|
—
|
|
—
|
|
—
|
|
(1
|
)
|
|||||||||
|
Net Income attributable to NRG Energy, Inc
.
|
$
|
1,545
|
|
$
|
124
|
|
$
|
942
|
|
$
|
(1,669
|
)
|
$
|
942
|
|
||||
|
(a)
|
All significant intercompany transactions have been eliminated in consolidation.
|
203
NRG ENERGY, INC. AND SUBSIDIARIES
CONDENSED CONSOLIDATING STATEMENTS OF CASH FLOWS
For the Year Ended December 31,
2009
|
Guarantor
Subsidiaries
|
Non-Guarantor
Subsidiaries
|
NRG Energy, Inc.
|
Elimin-ations
(a)
|
Consolidated
Balance
|
|||||||||||||||
|
|
(In millions)
|
||||||||||||||||||
|
Cash Flows from Operating Activities
|
|
|
|
|
|
||||||||||||||
|
Net income
|
$
|
1,544
|
|
$
|
124
|
|
$
|
942
|
|
$
|
(1,669
|
)
|
$
|
941
|
|
||||
|
Adjustments to reconcile net income to net cash provided/(used) by operating activities:
|
|
|
|
|
|
||||||||||||||
|
Distributions and equity (earnings)/losses of unconsolidated affiliates
|
154
|
|
(31
|
)
|
(1,173
|
)
|
1,009
|
|
(41
|
)
|
|||||||||
|
Depreciation and amortization
|
772
|
|
40
|
|
6
|
|
—
|
|
818
|
|
|||||||||
|
Provision for bad debts
|
61
|
|
—
|
|
—
|
|
|
|
61
|
|
|||||||||
|
Amortization of nuclear fuel
|
36
|
|
—
|
|
—
|
|
—
|
|
36
|
|
|||||||||
|
Amortization of financing costs and debt discount/premiums
|
—
|
|
13
|
|
31
|
|
—
|
|
44
|
|
|||||||||
|
Amortization of intangibles and out-of-market contracts
|
153
|
|
—
|
|
—
|
|
—
|
|
153
|
|
|||||||||
|
Changes in deferred income taxes and liability for uncertain tax benefits
|
934
|
|
(16
|
)
|
(229
|
)
|
—
|
|
689
|
|
|||||||||
|
Change in nuclear decommissioning trust liability
|
26
|
|
—
|
|
—
|
|
—
|
|
26
|
|
|||||||||
|
Changes in derivatives
|
(228
|
)
|
3
|
|
—
|
|
—
|
|
(225
|
)
|
|||||||||
|
Loss on disposals and sales of assets
|
13
|
|
—
|
|
—
|
|
—
|
|
13
|
|
|||||||||
|
Gain on sales of equity method investments
|
—
|
|
(128
|
)
|
—
|
|
—
|
|
(128
|
)
|
|||||||||
|
Gain recognized on settlement of pre-existing relationship
|
—
|
|
—
|
|
(31
|
)
|
—
|
|
(31
|
)
|
|||||||||
|
Amortization of unearned equity compensation
|
—
|
|
—
|
|
26
|
|
—
|
|
26
|
|
|||||||||
|
Other assets and liabilities
|
(640
|
)
|
29
|
|
335
|
|
—
|
|
(276
|
)
|
|||||||||
|
Net Cash Provided/(Used) by Operating Activities
|
2,825
|
|
34
|
|
(93
|
)
|
(660
|
)
|
2,106
|
|
|||||||||
|
Cash Flows from Investing Activities
|
|
|
|
|
|
||||||||||||||
|
Intercompany (loans to)/receipts from subsidiaries
|
(1,755
|
)
|
—
|
|
159
|
|
1,596
|
|
—
|
|
|||||||||
|
Investment in subsidiaries
|
200
|
|
60
|
|
(260
|
)
|
—
|
|
—
|
|
|||||||||
|
Capital expenditures
|
(507
|
)
|
(197
|
)
|
(30
|
)
|
—
|
|
(734
|
)
|
|||||||||
|
Acquisition of business, net of cash acquired
|
(72
|
)
|
(67
|
)
|
(288
|
)
|
—
|
|
(427
|
)
|
|||||||||
|
Increase in restricted cash
|
6
|
|
8
|
|
—
|
|
—
|
|
14
|
|
|||||||||
|
(Increase)/decrease in notes receivable
|
—
|
|
(58
|
)
|
36
|
|
—
|
|
(22
|
)
|
|||||||||
|
Purchases of emission allowances, net of proceeds
|
(38
|
)
|
—
|
|
—
|
|
—
|
|
(38
|
)
|
|||||||||
|
Investments in nuclear decommissioning trust fund securities
|
(305
|
)
|
—
|
|
—
|
|
—
|
|
(305
|
)
|
|||||||||
|
Proceeds from sales of nuclear decommissioning trust fund securities
|
279
|
|
—
|
|
—
|
|
—
|
|
279
|
|
|||||||||
|
Proceeds from sale of assets, net
|
6
|
|
—
|
|
—
|
|
—
|
|
6
|
|
|||||||||
|
Proceeds from sales of/(investments in) unconsolidated affiliates, net
|
—
|
|
284
|
|
(6
|
)
|
—
|
|
278
|
|
|||||||||
|
Other
|
—
|
|
—
|
|
(5
|
)
|
—
|
|
(5
|
)
|
|||||||||
|
Net Cash (Used)/Provided by Investing Activities
|
(2,186
|
)
|
30
|
|
(394
|
)
|
1,596
|
|
(954
|
)
|
|||||||||
|
Cash Flows from Financing Activities
|
|
|
|
|
|
||||||||||||||
|
(Payments)/proceeds from intercompany loans
|
(258
|
)
|
99
|
|
1,755
|
|
(1,596
|
)
|
—
|
|
|||||||||
|
Payment of intercompany dividends
|
(330
|
)
|
(330
|
)
|
—
|
|
660
|
|
—
|
|
|||||||||
|
Payment for dividends to preferred stockholders
|
—
|
|
—
|
|
(33
|
)
|
—
|
|
(33
|
)
|
|||||||||
|
Net payments to settle acquired derivatives including financing elements
|
(79
|
)
|
—
|
|
—
|
|
—
|
|
(79
|
)
|
|||||||||
|
Payment for treasury stock
|
—
|
|
—
|
|
(500
|
)
|
—
|
|
(500
|
)
|
|||||||||
|
Installment proceeds from sale of noncontrolling interest of subsidiary
|
—
|
|
50
|
|
—
|
|
—
|
|
50
|
|
|||||||||
|
Proceeds from issuance of common stock, net of issuance costs
|
—
|
|
—
|
|
2
|
|
—
|
|
2
|
|
|||||||||
|
Proceeds from issuance of long-term debt
|
77
|
|
127
|
|
688
|
|
—
|
|
892
|
|
|||||||||
|
Payment of deferred debt issuance costs
|
(2
|
)
|
(3
|
)
|
(26
|
)
|
—
|
|
(31
|
)
|
|||||||||
|
Payments of short and long-term debt
|
(25
|
)
|
(47
|
)
|
(572
|
)
|
—
|
|
(644
|
)
|
|||||||||
|
Net Cash (Used)/Provided by Financing Activities
|
(617
|
)
|
(104
|
)
|
1,314
|
|
(936
|
)
|
(343
|
)
|
|||||||||
|
Effect of exchange rate changes on cash and cash equivalents
|
—
|
|
1
|
|
—
|
|
—
|
|
1
|
|
|||||||||
|
Net Increase/(Decrease) in Cash and Cash Equivalents
|
22
|
|
(39
|
)
|
827
|
|
—
|
|
810
|
|
|||||||||
|
Cash and Cash Equivalents at Beginning of Period
|
(2
|
)
|
159
|
|
1,337
|
|
—
|
|
1,494
|
|
|||||||||
|
Cash and Cash Equivalents at End of Period
|
$
|
20
|
|
$
|
120
|
|
$
|
2,164
|
|
$
|
—
|
|
$
|
2,304
|
|
||||
|
(a)
|
All significant intercompany transactions have been eliminated in consolidation.
|
204
SCHEDULE II. VALUATION AND QUALIFYING ACCOUNTS
For the Years Ended December 31,
2011
,
2010
, and
2009
|
Balance at
Beginning of
Period
|
Charged to
Costs and
Expenses
|
Charged to
Other Accounts
|
Deductions
|
Balance at
End of Period
|
|||||||||||||||
|
|
(In millions)
|
||||||||||||||||||
|
Allowance for doubtful accounts, deducted from accounts receivable
|
|
|
|
|
|
|
|
||||||||||||
|
Year Ended December 31, 2011
|
$
|
25
|
|
$
|
60
|
|
$
|
—
|
|
$
|
(62
|
)
|
(a)
|
$
|
23
|
|
|||
|
Year Ended December 31, 2010
|
29
|
|
54
|
|
—
|
|
(58
|
)
|
(a)
|
25
|
|
||||||||
|
Year Ended December 31, 2009
|
3
|
|
61
|
|
—
|
|
(35
|
)
|
(a)
|
29
|
|
||||||||
|
Income tax valuation allowance, deducted from deferred tax assets
|
|
|
|
|
|
|
|
||||||||||||
|
Year Ended December 31, 2011
|
$
|
191
|
|
$
|
(63
|
)
|
$
|
(45
|
)
|
$
|
—
|
|
|
$
|
83
|
|
|||
|
Year Ended December 31, 2010
|
233
|
|
(34
|
)
|
(8
|
)
|
—
|
|
|
191
|
|
||||||||
|
Year Ended December 31, 2009
|
359
|
|
(130
|
)
|
4
|
|
—
|
|
233
|
|
|||||||||
|
(a)
|
Represents principally net amounts charged as uncollectible.
|
205
SIGNATURES
Pursuant to the requirements of Section 13 or 15(d) of the Securities Exchange Act of 1934, the registrant has duly caused this report to be signed on its behalf by the undersigned thereunto duly authorized.
|
|
NRG ENERGY, INC.
(Registrant)
|
||
|
|
By:
|
/s/ DAVID W. CRANE
|
|
|
|
|
||
|
|
|
David W. Crane
Chief Executive Officer
|
|
Date: February 28, 2012
206
POWER OF ATTORNEY
Each person whose signature appears below constitutes and appoints David W. Crane, Michael R. Bramnick and Brian Curci, each or any of them, such person's true and lawful attorney-in-fact and agent with full power of substitution and resubstitution for such person and in such person's name, place and stead, in any and all capacities, to sign any and all amendments to this report on Form 10-K, and to file the same with all exhibits thereto, and other documents in connection therewith, with the Securities and Exchange Commission, granting unto said attorneys-in-fact and agents, and each of them, full power and authority to do and perform each and every act and thing necessary or desirable to be done in and about the premises, as fully to all intents and purposes as such person, hereby ratifying and confirming all that said attorneys-in-fact and agents, or any of them or his or their substitute or substitutes, may lawfully do or cause to be done by virtue hereof.
In accordance with the Exchange Act, this report has been signed by the following persons on behalf of the registrant in the capacities indicated on February 28, 2012.
|
Signature
|
Title
|
Date
|
||
|
/s/ DAVID W. CRANE
|
President, Chief Executive Officer and
|
February 28, 2012
|
||
|
David W. Crane
|
Director (Principal Executive Officer)
|
|||
|
/s/ KIRKLAND B. ANDREWS
|
Chief Financial Officer
|
February 28, 2012
|
||
|
Kirkland B. Andrews
|
(Principal Financial Officer)
|
|||
|
/s/ JAMES J. INGOLDSBY
|
Chief Accounting Officer
|
February 28, 2012
|
||
|
James J. Ingoldsby
|
(Principal Accounting Officer)
|
|||
|
/s/ HOWARD E. COSGROVE
|
Chairman of the Board
|
February 28, 2012
|
||
|
Howard E. Cosgrove
|
|
|||
|
/s/ KIRBYJON H. CALDWELL
|
Director
|
February 28, 2012
|
||
|
Kirbyjon H. Caldwell
|
|
|||
|
/s/ JOHN F. CHLEBOWSKI
|
Director
|
February 28, 2012
|
||
|
John F. Chlebowski
|
|
|||
|
/s/ LAWRENCE S. COBEN
|
Director
|
February 28, 2012
|
||
|
Lawrence S. Coben
|
|
|||
|
/s/ STEPHEN L. CROPPER
|
Director
|
February 28, 2012
|
||
|
Stephen L. Cropper
|
|
|||
|
/s/ WILLIAM E. HANTKE
|
Director
|
February 28, 2012
|
||
|
William E. Hantke
|
|
|||
|
/s/ PAUL W. HOBBY
|
Director
|
February 28, 2012
|
||
|
Paul W. Hobby
|
|
|||
|
/s/ GERALD LUTERMAN
|
Director
|
February 28, 2012
|
||
|
Gerald Luterman
|
|
|||
|
/s/ KATHLEEN A. MCGINTY
|
Director
|
February 28, 2012
|
||
|
Kathleen A. McGinty
|
|
|||
|
/s/ ANNE C. SCHAUMBURG
|
Director
|
February 28, 2012
|
||
|
Anne C. Schaumburg
|
|
|||
|
/s/ HERBERT H. TATE
|
Director
|
February 28, 2012
|
||
|
Herbert H. Tate
|
|
|||
|
/s/ THOMAS H. WEIDEMEYER
|
Director
|
February 28, 2012
|
||
|
Thomas H. Weidemeyer
|
|
|||
|
|
Director
|
February 28, 2012
|
||
|
Walter R. Young
|
|
|||
207
EXHIBIT INDEX
|
2.1
|
Third Amended Joint Plan of Reorganization of NRG Energy, Inc., NRG Power Marketing, Inc., NRG Capital LLC, NRG Finance Company I LLC, and NRGenerating Holdings (No. 23) B.V.
(5)
|
|
|
2.2
|
First Amended Joint Plan of Reorganization of NRG Northeast Generating LLC (and certain of its subsidiaries), NRG South Central Generating (and certain of its subsidiaries) and Berrians I Gas Turbine Power LLC.
(5)
|
|
|
2.3
|
Acquisition Agreement, dated as of September 30, 2005, by and among NRG Energy, Inc., Texas Genco LLC and the Direct and Indirect Owners of Texas Genco LLC.
(11)
|
|
|
2.4
|
Purchase and Sale Agreement by and between Denali Merger Sub and NRG Energy, Inc. dated as of
August 13, 2010.
(57)
|
|
|
3.1
|
Amended and Restated Certificate of Incorporation.
(45)
|
|
|
3.2
|
Amended and Restated By-Laws.
(47)
|
|
|
3.3
|
Certificate of Designations of 3.625% Convertible Perpetual Preferred Stock, as filed with the Secretary of State of Delaware on August 11, 2005.
(17)
|
|
|
3.4
|
Certificate of Designations relating to the Series 1 Exchangeable Limited Liability Company Preferred Interests of NRG Common Stock Finance I LLC, as filed with the Secretary of State of Delaware on August 14, 2006.
(27)
|
|
|
3.5
|
Certificate of Amendment to Certificate of Designations relating to the Series 1 Exchangeable Limited Liability Company Preferred Interests of NRG Common Stock Finance I LLC, as filed with the Secretary of State of Delaware on February 27, 2008.
(36)
|
|
|
3.6
|
Second Certificate of Amendment to Certificate of Designations relating to the Series 1 Exchangeable Limited Liability Company Preferred Interests of NRG Common Stock Finance I LLC, as filed with the Secretary of State of Delaware on August 8, 2008.
(37)
|
|
|
4.1
|
Supplemental Indenture dated as of December 30, 2005, among NRG Energy, Inc., the subsidiary guarantors named on Schedule A thereto and Law Debenture Trust Company of New York, as trustee.
(13)
|
|
|
4.2
|
Amended and Restated Common Agreement among XL Capital Assurance Inc., Goldman Sachs Mitsui Marine Derivative Products, L.P., Law Debenture Trust Company of New York, as Trustee, The Bank of New York, as Collateral Agent, NRG Peaker Finance Company LLC and each Project Company Party thereto dated as of January 6, 2004, together with Annex A to the Common Agreement.
(2)
|
|
|
4.3
|
Amended and Restated Security Deposit Agreement among NRG Peaker Finance Company, LLC and each Project Company party thereto, and the Bank of New York, as Collateral Agent and Depositary Agent, dated as of
January 6, 2004.
(2)
|
|
|
4.4
|
NRG Parent Agreement by NRG Energy, Inc. in favor of the Bank of New York, as Collateral Agent, dated as of January 6, 2004.
(2)
|
|
|
4.5
|
Indenture dated June 18, 2002, between NRG Peaker Finance Company LLC, as Issuer, Bayou Cove Peaking Power LLC, Big Cajun I Peaking Power LLC, NRG Rockford LLC, NRG Rockford II LLC and Sterlington Power LLC, as Guarantors, XL Capital Assurance Inc., as Insurer, and Law Debenture Trust Company, as Successor Trustee to the Bank of New York.
(3)
|
|
|
4.6
|
Specimen of Certificate representing common stock of NRG Energy, Inc.
(26)
|
|
|
4.7
|
Indenture, dated February 2, 2006, among NRG Energy, Inc. and Law Debenture Trust Company of New York.
(19)
|
|
|
4.8
|
First Supplemental Indenture, dated February 2, 2006, among NRG Energy, Inc., the guarantors named therein and Law Debenture Trust Company of New York as Trustee, re: NRG Energy, Inc.'s 7.250% Senior Notes
due 2014.
(20)
|
|
|
4.9
|
Second Supplemental Indenture, dated February 2, 2006, among NRG Energy, Inc., the guarantors named therein and Law Debenture Trust Company of New York as Trustee, re: NRG Energy, Inc.'s 7.375% Senior Notes
due 2016.
(20)
|
|
|
4.10
|
Form of 7.250% Senior Note due 2014.
(20)
|
|
|
4.11
|
Form of 7.375% Senior Note due 2016.
(20)
|
|
|
4.12
|
Form of 7.375% Senior Note due 2017.
(29)
|
|
|
4.13
|
Form of 8.5% Senior Note due 2019.
(42)
|
|
|
4.14
|
Third Supplemental Indenture, dated March 14, 2006, among NRG, the existing guarantors named therein, the guaranteeing subsidiaries named therein and Law Debenture Trust Company of New York as Trustee, re: NRG Energy, Inc.'s 7.250% Senior Notes due 2014.
(22)
|
|
208
|
4.15
|
Fourth Supplemental Indenture, dated March 14, 2006, among NRG, the existing guarantors named therein, the guaranteeing subsidiaries named therein and Law Debenture Trust Company of New York as Trustee, re: NRG Energy, Inc.'s 7.375% Senior Notes due 2016.
(22)
|
|
|
4.16
|
Fifth Supplemental Indenture, dated April 28, 2006, among NRG, the existing guarantors named therein, the guaranteeing subsidiaries named therein and Law Debenture Trust Company of New York as Trustee, re: NRG Energy, Inc.'s 7.250% Senior Notes due 2014.
(23)
|
|
|
4.17
|
Sixth Supplemental Indenture, dated April 28, 2006, among NRG, the existing guarantors named therein, the guaranteeing subsidiaries named therein and Law Debenture Trust Company of New York as Trustee, re: NRG Energy, Inc.'s 7.375% Senior Notes due 2016.
(23)
|
|
|
4.18
|
Seventh Supplemental Indenture, dated November 13, 2006, among NRG Energy, Inc., the existing guarantors named therein, the guaranteeing subsidiaries named therein and Law Debenture Trust Company of New York as Trustee, re: NRG Energy, Inc.'s 7.250% Senior Notes due 2014.
(28)
|
|
|
4.19
|
Eighth Supplemental Indenture, dated November 13, 2006, among NRG Energy, Inc., the existing guarantors named therein, the guaranteeing subsidiaries named therein and Law Debenture Trust Company of New York as Trustee, re: NRG Energy, Inc.'s 7.375% Senior Notes due 2016.
(28)
|
|
|
4.20
|
Ninth Supplemental Indenture, dated November 13, 2006, among NRG Energy, Inc., the guarantors named therein and Law Debenture Trust Company of New York as Trustee, re: NRG Energy, Inc.'s 7.375% Senior Notes
due 2017.
(29)
|
|
|
4.21
|
Tenth Supplemental Indenture, dated July 19, 2007, among NRG Energy, Inc., the guarantors named therein and Law Debenture Trust Company of New York as Trustee, re: NRG Energy, Inc.'s 7.250% Senior Notes
due 2014.
(33)
|
|
|
4.22
|
Eleventh Supplemental Indenture, dated July 19, 2007, among NRG Energy, Inc., the guarantors named therein and Law Debenture Trust Company of New York as Trustee, re: NRG Energy, Inc.'s 7.375% Senior Notes
due 2016.
(33)
|
|
|
4.23
|
Twelfth Supplemental Indenture, dated July 19, 2007, among NRG Energy, Inc., the guarantors named therein and Law Debenture Trust Company of New York as Trustee, re: NRG Energy, Inc.'s 7.375% Senior Notes
due 2017.
(33)
|
|
|
4.24
|
Thirteenth Supplemental Indenture, dated August 28, 2007, among NRG Energy, Inc., the guarantors named therein and Law Debenture Trust Company of New York as Trustee, re: NRG Energy, Inc.'s 7.250% Senior Notes
due 2014.
(34)
|
|
|
4.25
|
Fourteenth Supplemental Indenture, dated August 28, 2007, among NRG Energy, Inc., the guarantors named therein and Law Debenture Trust Company of New York as Trustee, re: NRG Energy, Inc.'s 7.375% Senior Notes
due 2016.
(34)
|
|
|
4.26
|
Fifteenth Supplemental Indenture, dated August 28, 2007, among NRG Energy, Inc., the guarantors named therein and Law Debenture Trust Company of New York as Trustee, re: NRG Energy, Inc.'s 7.375% Senior Notes
due 2017.
(34)
|
|
|
4.27
|
Sixteenth Supplemental Indenture, dated April 28, 2009, among NRG Energy, Inc., the existing guarantors named therein, the guaranteeing subsidiary named therein and Law Debenture Trust Company of New York as Trustee, re: NRG Energy, Inc.'s 7.250% Senior Notes due 2014.
(40)
|
|
|
4.28
|
Seventeenth Supplemental Indenture, dated April 28, 2009, among NRG Energy, Inc., the existing guarantors named therein, the guaranteeing subsidiary named therein and Law Debenture Trust Company of New York as Trustee, re: NRG Energy, Inc.'s 7.375% Senior Notes due 2016.
(40)
|
|
|
4.29
|
Eighteenth Supplemental Indenture, dated April 28, 2009, among NRG Energy, Inc., the existing guarantors named therein, the guaranteeing subsidiary named therein and Law Debenture Trust Company of New York as Trustee, re: NRG Energy, Inc.'s 7.375% Senior Notes due 2017.
(40)
|
|
|
4.30
|
Nineteenth Supplemental Indenture, dated May 8, 2009, among NRG Energy, Inc., the existing guarantors named therein, the guaranteeing subsidiaries named therein and Law Debenture Trust Company of New York as Trustee, re: NRG Energy, Inc.'s 7.250% Senior Notes due 2014.
(41)
|
|
|
4.31
|
Twentieth Supplemental Indenture, dated May 8, 2009, among NRG Energy, Inc., the existing guarantors named therein, the guaranteeing subsidiaries named therein and Law Debenture Trust Company of New York as Trustee, re: NRG Energy, Inc.'s 7.375% Senior Notes due 2016.
(41)
|
|
|
4.32
|
Twenty-First Supplemental Indenture, dated May 8, 2009, among NRG Energy, Inc., the existing guarantors named therein, the guaranteeing subsidiaries named therein and Law Debenture Trust Company of New York as Trustee, re: NRG Energy, Inc.'s 7.375% Senior Notes due 2017.
(41)
|
|
209
|
4.33
|
Twenty-Second Supplemental Indenture, dated June 5, 2009, among NRG Energy, Inc., the guarantors named therein and Law Debenture Trust Company of New York as Trustee, re: NRG Energy, Inc.'s 8.5% Senior Notes
due 2019.
(42)
|
|
|
4.34
|
Twenty-Third Supplemental Indenture, dated July 14, 2009, among NRG Energy, Inc., the guarantors named therein and Law Debenture Trust Company of New York as Trustee, re: NRG Energy, Inc.'s 8.5% Senior Notes
due 2019.
(44)
|
|
|
4.35
|
Twenty-Fourth Supplemental Indenture, dated October 5, 2009, among NRG Energy, Inc., the existing guarantors named therein, the guaranteeing subsidiaries named therein and Law Debenture Trust Company of New York as Trustee, re: NRG Energy, Inc.'s 7.250% Senior Notes due 2014.
(46)
|
|
|
4.36
|
Twenty-Fifth Supplemental Indenture, dated October 5, 2009, among NRG Energy, Inc., the existing guarantors named therein, the guaranteeing subsidiaries named therein and Law Debenture Trust Company of New York as Trustee, re: NRG Energy, Inc.'s 7.375% Senior Notes due 2016.
(46)
|
|
|
4.37
|
Twenty-Sixth Supplemental Indenture, dated October 5, 2009, among NRG Energy, Inc., the existing guarantors named therein, the guaranteeing subsidiaries named therein and Law Debenture Trust Company of New York as Trustee, re: NRG Energy, Inc.'s 7.375% Senior Notes due 2017.
(46)
|
|
|
4.38
|
Twenty-Seventh Supplemental Indenture, dated October 5, 2009, among NRG Energy, Inc., the existing guarantors named therein, the guaranteeing subsidiaries named therein and Law Debenture Trust Company of New York as Trustee, re: NRG Energy, Inc.'s 8.5% Senior Notes due 2019.
(46)
|
|
|
4.39
|
Twenty-Eighth Supplemental Indenture, dated as of April 16, 2010, among NRG Energy, Inc., the existing guarantors named therein, the guaranteeing subsidiaries named therein and Law Debenture Trust Company of New York as Trustee, re: NRG Energy, Inc.'s 7.250% Senior Notes due 2014.
(49)
|
|
|
4.40
|
Twenty-Ninth Supplemental Indenture, dated as of April 16, 2010, among NRG Energy, Inc., the existing guarantors named therein, the guaranteeing subsidiaries named therein and Law Debenture Trust Company of New York as Trustee, re: NRG Energy, Inc.'s 7.375% Senior Notes due 2016.
(49)
|
|
|
4.41
|
Thirtieth Supplemental Indenture, dated as of April 16, 2010, among NRG Energy, Inc., the existing guarantors named therein, the guaranteeing subsidiaries named therein and Law Debenture Trust Company of New York as Trustee, re: NRG Energy, Inc.'s 7.375% Senior Notes due 2017.
(49)
|
|
|
4.42
|
Thirty-First Supplemental Indenture, dated as of April 16, 2010, among NRG Energy, Inc., the existing guarantors named therein, the guaranteeing subsidiaries named therein and Law Debenture Trust Company of New York as Trustee, re: NRG Energy, Inc.'s 8.50% Senior Notes due 2019.
(49)
|
|
|
4.43
|
Thirty-Second Supplemental Indenture, dated as of June 23, 2010, among NRG Energy, Inc., the existing guarantors named therein, the guaranteeing subsidiaries named therein and Law Debenture Trust Company of New York as Trustee, re: NRG Energy, Inc.'s 7.250% Senior Notes due 2014.
(52)
|
|
|
4.44
|
Thirty-Third Supplemental Indenture, dated as of June 23, 2010, among NRG Energy, Inc., the existing guarantors named therein, the guaranteeing subsidiaries named therein and Law Debenture Trust Company of New York as Trustee, re: NRG Energy, Inc.'s 7.375% Senior Notes due 2016.
(52)
|
|
|
4.45
|
Thirty-Fourth Supplemental Indenture, dated as of June 23, 2010, among NRG Energy, Inc., the existing guarantors named therein, the guaranteeing subsidiaries named therein and Law Debenture Trust Company of New York as Trustee, re: NRG Energy, Inc.'s 7.375% Senior Notes due 2017.
(52)
|
|
|
4.46
|
Thirty-Fifth Supplemental Indenture, dated as of June 23, 2010, among NRG Energy, Inc., the existing guarantors named therein, the guaranteeing subsidiaries named therein and Law Debenture Trust Company of New York as Trustee, re: NRG Energy, Inc.'s 8.50% Senior Notes due 2019.
(52)
|
|
|
4.47
|
Thirty-Sixth Supplemental Indenture, dated August 20, 2010, among NRG Energy, Inc., the guarantors named therein and Law Debenture Trust Company of New York as Trustee, re: NRG Energy, Inc.'s 8.25% Senior Notes due 2020.
(56)
|
|
|
4.48
|
Form of 8.25% Senior Note due 2020.
(56)
|
|
|
4.49
|
Registration Rights Agreement, dated August 20, 2010, among NRG Energy, Inc., the guarantors named therein and Citigroup Global Markets Inc., Banc of America Securities LLC and Deutsche Bank Securities Inc., as representatives of the several initial purchasers.
(56)
|
|
|
4.50
|
Thirty-Seventh Supplemental Indenture, dated as of December 15, 2010, among NRG Energy, Inc., the existing guarantors named therein, the guaranteeing subsidiaries named therein and Law Debenture Trust Company of New York as Trustee, re: NRG Energy, Inc.'s 7.250% Senior Notes due 2014.
(58)
|
|
210
|
4.51
|
Thirty-Eighth Supplemental Indenture, dated as of December 15, 2010, among NRG Energy, Inc., the existing guarantors named therein, the guaranteeing subsidiaries named therein and Law Debenture Trust Company of New York as Trustee, re: NRG Energy, Inc.'s 7.375% Senior Notes due 2016.
(58)
|
|
|
4.52
|
Thirty-Ninth Supplemental Indenture, dated as of December 15, 2010, among NRG Energy, Inc., the existing guarantors named therein, the guaranteeing subsidiaries named therein and Law Debenture Trust Company of New York as Trustee, re: NRG Energy, Inc.'s 7.375% Senior Notes due 2017.
(58)
|
|
|
4.53
|
Fortieth Supplemental Indenture, dated as of December 15, 2010, among NRG Energy, Inc., the existing guarantors named therein, the guaranteeing subsidiaries named therein and Law Debenture Trust Company of New York as Trustee, re: NRG Energy, Inc.'s 8.50% Senior Notes due 2019.
(58)
|
|
|
4.54
|
Forty-First Supplemental Indenture, dated as of December 15, 2010, among NRG Energy, Inc., the existing guarantors named therein, the guaranteeing subsidiaries named therein and Law Debenture Trust Company of New York as Trustee, re: NRG Energy, Inc.'s 8.25% Senior Notes due 2020.
(58)
|
|
|
4.55
|
Forty-Second Supplemental Indenture, dated January 26, 2011, among NRG Energy, Inc., the existing guarantors named therein, the guaranteeing subsidiaries named therein and Law Debenture Trust Company of New York.
(60)
|
|
|
4.56
|
Form of 7.625% Senior Note due 2018.
(60)
|
|
|
4.57
|
Registration Rights Agreement, dated January 26, 2011, among NRG Energy, Inc., the guarantors named therein and J.P. Morgan Securities LLC, as initial purchaser.
(60)
|
|
|
4.58
|
Forty-Third Supplemental Indenture, dated April 22, 2011, among NRG Energy, Inc., the existing guarantors named therein, the guaranteeing subsidiaries named therein and Law Debenture Trust Company of New York.
(63)
|
|
|
4.59
|
Forty-Fourth Supplemental Indenture, dated May 9, 2011, among NRG Energy, Inc., the existing guarantors named therein, the guaranteeing subsidiaries named therein and Law Debenture Trust Company of New York.
(63)
|
|
|
4.60
|
Forty-Fifth Supplemental Indenture, dated May 20, 2011, among NRG Energy, Inc., the existing guarantors named therein, the guaranteeing subsidiaries named therein and Law Debenture Trust Company of New York.
(61)
|
|
|
4.61
|
Forty-Sixth Supplemental Indenture, dated May 20, 2011, among NRG Energy, Inc., the existing guarantors named therein, the guaranteeing subsidiaries named therein and Law Debenture Trust Company of New York.
(61)
|
|
|
4.62
|
Forty-Seventh Supplemental Indenture, dated May 20, 2011, among NRG Energy, Inc., the existing guarantors named therein, the guaranteeing subsidiaries named therein and Law Debenture Trust Company of New York.
(61)
|
|
|
4.63
|
Forty-Eighth Supplemental Indenture, dated May 20, 2011, among NRG Energy, Inc., the existing guarantors named therein, the guaranteeing subsidiaries named therein and Law Debenture Trust Company of New York.
(61)
|
|
|
4.64
|
Forty-Ninth Supplemental Indenture, dated May 20, 2011, among NRG Energy, Inc., the existing guarantors named therein, the guaranteeing subsidiaries named therein and Law Debenture Trust Company of New York.
(61)
|
|
|
4.65
|
Fiftieth Supplemental Indenture, dated May 24, 2011, among NRG Energy, Inc., the existing guarantors named therein, the guaranteeing subsidiaries named therein and Law Debenture Trust Company of New York.
(61)
|
|
|
4.66
|
Form of 7.625% Senior Note due 2019.
(61)
|
|
|
4.67
|
Fifty-First Supplemental Indenture, dated May 24, 2011, among NRG Energy, Inc., the existing guarantors named therein, the guaranteeing subsidiaries named therein and Law Debenture Trust Company of New York.
(61)
|
|
|
4.68
|
Form of 7.875% Senior Note due 2021.
(61)
|
|
|
4.69
|
Registration Rights Agreement, dated May 24, 2011, among NRG Energy, Inc., the guarantors named therein and Morgan Stanley & Co. Incorporated, Merrill Lynch, Pierce, Fenner & Smith Incorporated, Barclays Capital Inc., Citigroup Global Markets Inc., Credit Suisse Securities (USA) LLC, Deutsche Bank Securities Inc., Goldman, Sachs & Co., J.P. Morgan Securities LLC and RBS Securities Inc., as representatives of the initial purchasers.
(61)
|
|
|
4.70
|
Fifty-Second Supplemental Indenture, dated November 8, 2011, among NRG Energy, Inc., the existing guarantors named therein, the guaranteeing subsidiaries named therein and Law Debenture Trust Company of New York.
(65)
|
|
|
4.71
|
Fifty-Third Supplemental Indenture, dated November 8, 2011, among NRG Energy, Inc., the existing guarantors named therein, the guaranteeing subsidiaries named therein and Law Debenture Trust Company of New York.
(65)
|
|
|
4.72
|
Fifty-Fourth Supplemental Indenture, dated November 8, 2011, among NRG Energy, Inc., the existing guarantors named therein, the guaranteeing subsidiaries named therein and Law Debenture Trust Company of New York.
(65)
|
|
|
4.73
|
Fifty-Fifth Supplemental Indenture, dated November 8, 2011, among NRG Energy, Inc., the existing guarantors named therein, the guaranteeing subsidiaries named therein and Law Debenture Trust Company of New York.
(65)
|
|
|
4.74
|
Fifty-Sixth Supplemental Indenture, dated November 8, 2011, among NRG Energy, Inc., the existing guarantors named therein, the guaranteeing subsidiaries named therein and Law Debenture Trust Company of New York.
(65)
|
|
211
|
4.75
|
Fifty-Seventh Supplemental Indenture, dated November 8, 2011, among NRG Energy, Inc., the existing guarantors named therein, the guaranteeing subsidiaries named therein and Law Debenture Trust Company of New York.
(65)
|
|
|
10.1
|
Note Agreement, dated August 20, 1993, between NRG Energy, Inc., Energy Center, Inc. and each of the purchasers named therein.
(4)
|
|
|
10.2
|
Master Shelf and Revolving Credit Agreement, dated August 20, 1993, between NRG Energy, Inc., Energy Center, Inc., The Prudential Insurance Registrants of America and each Prudential Affiliate, which becomes party
thereto.
(4)
|
|
|
10.3*
|
Form of NRG Energy Inc. Long-Term Incentive Plan Deferred Stock Unit Agreement for Officers and Key Management.
(15)
|
|
|
10.4*
|
Form of NRG Energy, Inc. Long-Term Incentive Plan Deferred Stock Unit Agreement for Directors.
(15)
|
|
|
10.5*
|
Form of NRG Energy, Inc. Long-Term Incentive Plan Non-Qualified Stock Option Agreement.
(8)
|
|
|
10.6*
|
Form of NRG Energy, Inc. Long-Term Incentive Plan Restricted Stock Unit Agreement.
(8)
|
|
|
10.7*
|
Form of NRG Energy, Inc. Long Term Incentive Plan Performance Unit Agreement.
(55)
|
|
|
10.8*
|
Annual Incentive Plan for Designated Corporate Officers.
(43)
|
|
|
10.9
|
Railroad Car Full Service Master Leasing Agreement, dated as of February 18, 2005, between General Electric Railcar Services Corporation and NRG Power Marketing Inc.
(15)
|
|
|
10.10
|
Purchase Agreement (West Coast Power) dated as of December 27, 2005, by and among NRG Energy, Inc., NRG West Coast LLC (Buyer), DPC II Inc. (Seller) and Dynegy, Inc.
(14)
|
|
|
10.11
|
Purchase Agreement (Rocky Road Power), dated as of December 27, 2005, by and among Termo Santander Holding, L.L.C.(Buyer), Dynegy, Inc., NRG Rocky Road LLC (Seller) and NRG Energy, Inc.
(14)
|
|
|
10.12
|
Stock Purchase Agreement, dated as of August 10, 2005, by and between NRG Energy, Inc. and Credit Suisse First Boston Capital LLC.
(17)
|
|
|
10.13
|
Agreement with respect to the Stock Purchase Agreement, dated December 19, 2008, by and between NRG Energy, Inc. and Credit Suisse First Boston Capital LLC.
(37)
|
|
|
10.14
|
Investor Rights Agreement, dated as of February 2, 2006, by and among NRG Energy, Inc. and Certain Stockholders of NRG Energy, Inc. set forth therein.
(21)
|
|
|
10.15†
|
Terms and Conditions of Sale, dated as of October 5, 2005, between Texas Genco II LP and Freight Car America, Inc., (including the Proposal Letter and Amendment thereto).
(25)
|
|
|
10.16*
|
Amended and Restated Employment Agreement, dated December 4, 2008, between NRG Energy, Inc. and
David Crane.
(37)
|
|
|
10.17*
|
CEO Compensation Table.
(48)
|
|
|
10.18
|
Limited Liability Company Agreement of NRG Common Stock Finance I LLC.
(27)
|
|
|
10.19
|
Note Purchase Agreement, dated August 4, 2006, between NRG Common Stock Finance I LLC, Credit Suisse International and Credit Suisse Securities (USA) LLC.
(27)
|
|
|
10.20
|
Amendment Agreement, dated February 27, 2008, to the Note Purchase Agreement by and among NRG Common Stock Finance I LLC, Credit Suisse International, and Credit Suisse Securities (USA) LLC.
(36)
|
|
|
10.21
|
Amendment Agreement, dated August 8, 2008, to the Note Purchase Agreement by and among NRG Common Stock Finance I LLC, Credit Suisse International, and Credit Suisse Securities (USA) LLC.
(37)
|
|
|
10.22
|
Amendment Agreement, dated December 19, 2008, to the Note Purchase Agreement by and among NRG Common Stock Finance I LLC, Credit Suisse International, and Credit Suisse Securities (USA) LLC.
(37)
|
|
|
10.23
|
Agreement with respect to Note Purchase Agreement, dated December 19, 2008, by and among NRG Common Stock Finance I LLC, Credit Suisse International, and Credit Suisse Securities (USA) LLC.
(37)
|
|
|
10.24
|
Preferred Interest Purchase Agreement, dated August 4, 2006, between NRG Common Stock Finance I LLC, Credit Suisse Capital LLC and Credit Suisse Securities (USA) LLC, as agent.
(27)
|
|
|
10.25
|
Preferred Interest Amendment Agreement, dated February 27, 2008, by and among NRG Common Stock Finance I LLC, Credit Suisse International, and Credit Suisse Securities (USA) LLC.
(36)
|
|
|
10.26
|
Preferred Interest Amendment Agreement, dated August 8, 2008, by and among NRG Common Stock Finance I LLC, Credit Suisse International, and Credit Suisse Securities (USA) LLC.
(37)
|
|
|
10.27
|
Preferred Interest Amendment Agreement, dated December 19, 2008, by and among NRG Common Stock Finance I LLC, Credit Suisse International, and Credit Suisse Securities (USA) LLC.
(37)
|
|
212
|
10.28
|
Agreement with respect to Preferred Interest Purchase Agreement, dated December 19, 2008, by and among NRG Common Stock Finance I LLC, Credit Suisse International, and Credit Suisse Securities (USA) LLC.
(37)
|
|
|
10.29
|
Second Amended and Restated Credit Agreement, dated June 8, 2007, by and among NRG Energy, Inc., the lenders party thereto, Citigroup Global Markets Inc., Credit Suisse Securities (USA) LLC, Citicorp North America Inc. and Credit Suisse.
(32)
|
|
|
10.30*
|
Amended and Restated Long-Term Incentive Plan.
(43)
|
|
|
10.31*
|
NRG Energy, Inc. Executive Change-in-Control and General Severance Agreement, dated December 9, 2008.
(37)
|
|
|
10.32†
|
Amended and Restated Contribution Agreement (NRG), dated March 25, 2008, by and among Texas Genco Holdings, Inc., NRG South Texas LP and NRG Nuclear Development Company LLC and Certain Subsidiaries Thereof.
(36)
|
|
|
10.33†
|
Contribution Agreement (Toshiba), dated February 29, 2008, by and between Toshiba Corporation and NRG Nuclear Development Company LLC.
(36)
|
|
|
10.34†
|
Multi-Unit Agreement, dated February 29, 2008, by and among Toshiba Corporation, NRG Nuclear Development Company LLC and NRG Energy, Inc.
(36)
|
|
|
10.35†
|
Amended and Restated Operating Agreement of Nuclear Innovation North America LLC, dated May 1, 2008.
(36)
|
|
|
10.36
|
Credit Agreement by and among Nuclear Innovation North America LLC, Nuclear Innovation North America Investments LLC, NINA Texas 3 LLC and NINA Texas 4 LLC, as Borrowers and Toshiba America Nuclear Energy Corporation, as Administrative Agent and as Collateral Agent.
(38)
|
|
|
10.37†
|
LLC Membership Purchase Agreement between Reliant Energy, Inc. and NRG Retail LLC, dated as of
February 28, 2009.
(39)
|
|
|
10.38
|
Project Agreement, Settlement Agreement and Mutual Release, dated March 1, 2010, by and among by and among Nuclear Innovation North America LLC, the City of San Antonio acting by and through the City Public Service Board of San Antonio, a Texas municipal utility, NINA Texas 3 LLC and NINA Texas 4 LLC, and solely for purposes of certain sections of the Settlement Agreement, by NRG Energy, Inc and NRG South Texas LP.
(50)
|
|
|
10.39†
|
STP 3 & 4 Owners Agreement, dated March 1, 2010, by and among Nuclear Innovation North America LLC, the City of San Antonio, NINA Texas 3 LLC and NINA Texas 4 LLC.
(50)
|
|
|
10.40*
|
2009 Executive Change-in-Control and General Severance Plan.
(51)
|
|
|
10.41†
|
Investment and Option Agreement by and among Nuclear Innovation North America LLC, Nuclear Innovation North America Investments Holdings LLC and TEPCO Nuclear Energy America LLC, dated as of
May 10, 2010.
(53)
|
|
|
10.42†
|
Parent Company Agreement by and among NRG Energy, Inc., Nuclear Innovation North America LLC, TEPCO and TEPCO Nuclear Energy America LLC, dated as of May 10, 2010.
(53)
|
|
|
10.43
|
Third Amended and Restated Credit Agreement, dated as of June 30, 2010.
(54)
|
|
|
10.44(a)
|
Letter of Credit and Reimbursement Agreement, dated as of June 30, 2010.
(54)
|
|
|
10.44(b)
|
Letter of Credit and Reimbursement Agreement, dated as of June 30, 2010.
(54)
|
|
|
10.45*
|
The NRG Energy, Inc. Amended and Restated Long Term Incentive Plan.
(59)
|
|
|
10.46
|
Amended and Restated Credit Agreement, dated July 1, 2011, by and among NRG Energy, Inc., the lenders party thereto, and the joint lead bookrunners and joint lead arrangers party thereto.
(62)
|
|
|
10.47*
|
Form of Market Stock Unit Grant Agreement.
(64)
|
|
|
12.1
|
NRG Energy, Inc. Computation of Ratio of Earnings to Fixed Charges.
(1)
|
|
|
12.2
|
NRG Energy, Inc. Computation of Ratio of Earnings to Fixed Charges and Preferred Stock Dividend
Requirements.
(1)
|
|
|
21.1
|
Subsidiaries of NRG Energy, Inc.
(1)
|
|
|
23.1
|
Consent of KPMG LLP.
(1)
|
|
|
31.1
|
Rule 13a-14(a)/15d-14(a) certification of David W. Crane.
(1)
|
|
|
31.2
|
Rule 13a-14(a)/15d-14(a) certification of Kirkland B. Andrews.
(1)
|
|
|
31.3
|
Rule 13a-14(a)/15d-14(a) certification of James J. Ingoldsby.
(1)
|
|
|
32
|
Section 1350 Certification.
(1)
|
|
|
101.INS
|
XBRL Instance Document
(1)
|
|
|
101.SCH
|
XBRL Taxonomy Extension Schema
(1)
|
|
213
|
101.CAL
|
XBRL Taxonomy Extension Calculation Linkbase
(1)
|
|
|
101.DEF
|
XBRL Taxonomy Extension Definition Linkbase
(1)
|
|
|
101.LAB
|
XBRL Taxonomy Extension Label Linkbase
(1)
|
|
|
101.PRE
|
XBRL Taxonomy Extension Presentation Linkbase
(1)
|
|
|
*
|
Exhibit relates to compensation arrangements.
|
|
†
|
Portions of this exhibit have been redacted and are subject to a confidential treatment request filed with the Secretary of the Securities and Exchange Commission pursuant to Rule 24b-2 under the Securities Exchange Act of 1934, as amended.
|
|
(1)
|
Filed herewith.
|
|
(2)
|
Incorporated herein by reference to NRG Energy, Inc.'s annual report on Form 10-K filed on March 16, 2004.
|
|
(3)
|
Incorporated herein by reference to NRG Energy, Inc.'s annual report on Form 10-K filed on March 31, 2003.
|
|
(4)
|
Incorporated herein by reference to NRG Energy Inc.'s Registration Statement on Form S-1, as amended, Registration No. 333-33397.
|
|
(5)
|
Incorporated herein by reference to NRG Energy, Inc.'s current report on Form 8-K filed on November 19, 2003.
|
|
(6)
|
Incorporated herein by reference to NRG Energy, Inc.'s quarterly report on Form 10-Q for the quarter ended
September 30, 2004.
|
|
(7)
|
Incorporated herein by reference to NRG Energy, Inc.'s 2004 proxy statement on Scheduleb14A filed on July 12, 2004.
|
|
(8)
|
Incorporated herein by reference to NRG Energy, Inc.'s quarterly report on Form 10-Q for the quarter ended
March 31, 2004.
|
|
(9)
|
Incorporated herein by reference to NRG Energy, Inc.'s current report on Form 8-K filed on October 3, 2005.
|
|
(10)
|
Incorporated herein by reference to NRG Energy, Inc.'s quarterly report on Form 10-Q for the quarter ended June 30, 2005.
|
|
(11)
|
Incorporated herein by reference to NRG Energy, Inc.'s current report on Form 8-K filed on January 4, 2006.
|
|
(12)
|
Incorporated herein by reference to NRG Energy, Inc.'s current report on Form 8-K filed on December 28, 2005.
|
|
(13)
|
Incorporated herein by reference to NRG Energy, Inc.'s annual report on Form 10-K filed on March 30, 2005.
|
|
(14)
|
Incorporated herein by reference to NRG Energy, Inc.'s current report on Form 8-K filed on May 24, 2005.
|
|
(15)
|
Incorporated herein by reference to NRG Energy, Inc.'s current report on Form 8-K filed on August 11, 2005.
|
|
(16)
|
Incorporated herein by reference to NRG Energy, Inc.'s current report on Form 8-K filed on August 3, 2005.
|
|
(17)
|
Incorporated herein by reference to NRG Energy, Inc.'s Form 8-A filed on January 27, 2006.
|
|
(18)
|
Incorporated herein by reference to NRG Energy, Inc.'s current report on Form 8-K filed on February 6, 2006.
|
|
(19)
|
Incorporated herein by reference to NRG Energy, Inc.'s current report on Form 8-K filed on February 8, 2006.
|
|
(20)
|
Incorporated herein by reference to NRG Energy, Inc.'s current report on Form 8-K filed on March 16, 2006.
|
|
(21)
|
Incorporated herein by reference to NRG Energy, Inc.'s current report on Form 8-K filed on May 3, 2006.
|
|
(22)
|
Incorporated herein by reference to NRG Energy, Inc.'s current report on Form 8-K filed on May 4, 2006.
|
|
(23)
|
Incorporated herein by reference to NRG Energy, Inc.'s annual report on Form 10-K filed on March 7, 2006.
|
|
(24)
|
Incorporated herein by reference to NRG Energy, Inc.'s quarterly report on Form 10-Q filed on August 4, 2006.
|
|
(25)
|
Incorporated herein by reference to NRG Energy, Inc.'s current report on Form 8-K filed on August 10, 2006.
|
|
(26)
|
Incorporated herein by reference to NRG Energy, Inc.'s current report on Form 8-K filed on November 14, 2006.
|
|
(27)
|
Incorporated herein by reference to NRG Energy, Inc.'s current report on Form 8-K filed on November 27, 2006.
|
|
(28)
|
Incorporated herein by reference to NRG Energy, Inc.'s current report on Form 8-K filed on December 26, 2007.
|
|
(29)
|
Incorporated herein by reference to NRG Energy, Inc.'s quarterly report on Form 10-Q filed on May 2, 2007.
|
|
(30)
|
Incorporated herein by reference to NRG Energy, Inc.'s current report on Form 8-K filed on June 13, 2007.
|
|
(31)
|
Incorporated herein by reference to NRG Energy, Inc.'s current report on Form 8-K filed on July 20, 2007.
|
|
(32)
|
Incorporated herein by reference to NRG Energy, Inc.'s current report on Form 8-K filed on September 4, 2007.
|
|
(33)
|
Incorporated herein by reference to NRG Energy, Inc.'s annual report on Form 10-K filed on February 28, 2008.
|
|
(34)
|
Incorporated herein by reference to NRG Energy, Inc.'s quarterly report on Form 10-Q filed on May 1, 2008.
|
|
(35)
|
Incorporated herein by reference to NRG Energy, Inc.'s quarterly report on Form 10-Q filed on October 30, 2008.
|
|
(36)
|
Incorporated herein by reference to NRG Energy, Inc.'s current report on Form 8-K filed on December 9, 2008.
|
|
(37)
|
Incorporated herein by reference to NRG Energy, Inc.'s annual report on Form 10-K filed on February 12, 2009.
|
214
|
(38)
|
Incorporated herein by reference to NRG Energy Inc's current report on Form 8-K filed on February 27, 2009.
|
|
(39)
|
Incorporated herein by reference to NRG Energy, Inc.'s quarterly report on Form 10-Q filed on April 30, 2009.
|
|
(40)
|
Incorporated herein by reference to NRG Energy, Inc's current report on Form 8-K filed on May 4, 2009.
|
|
(41)
|
Incorporated herein by reference to NRG Energy, Inc's current report on Form 8-K filed on May 14, 2009.
|
|
(42)
|
Incorporated herein by reference to NRG Energy, Inc's current report on Form 8-K filed on June 5, 2009.
|
|
(43)
|
Incorporated herein by reference to NRG Energy, Inc.'s 2009 proxy statement on Schedule 14A filed on June 16, 2009.
|
|
(44)
|
Incorporated herein by reference to NRG Energy, Inc's current report on Form 8-K filed on July 15, 2009.
|
|
(45)
|
Incorporated herein by reference to NRG Energy, Inc.'s current report on Form 8-K filed on August 4, 2009.
|
|
(46)
|
Incorporated herein by reference to NRG Energy, Inc.'s current report on Form 8-K filed on October 6, 2009.
|
|
(47)
|
Incorporated herein by reference to NRG Energy, Inc.'s current report on Form 8-K filed on October 21, 2009.
|
|
(48)
|
Incorporated herein by reference to NRG Energy, Inc.'s current report on Form 8-K filed on December 9, 2009.
|
|
(49)
|
Incorporated herein by reference to NRG Energy, Inc.’s current report on Form 8-K filed on April 21, 2010.
|
|
(50)
|
Incorporated herein by reference to NRG Energy, Inc.’s current report on Form 8-K filed on March 2, 2010.
|
|
(51)
|
Incorporated herein by reference to NRG Energy, Inc.’s current report on Form 8-K filed on April 1, 2010.
|
|
(52)
|
Incorporated herein by reference to NRG Energy, Inc.’s current report on Form 8-K filed on June 29, 2010.
|
|
(53)
|
Incorporated herein by reference to NRG Energy, Inc.’s quarterly report on Form 10-Q filed on August 2, 2010.
|
|
(54)
|
Incorporated herein by reference to NRG Energy, Inc.’s current report on Form 8-K filed on July 1, 2010.
|
|
(55)
|
Incorporated herein by reference to NRG Energy, Inc.'s annual report on Form 10-K filed on February 23, 2010.
|
|
(56)
|
Incorporated herein by reference to NRG Energy, Inc.’s current report on Form 8-K filed on August 20, 2010.
|
|
(57)
|
Incorporated herein by reference to NRG Energy Inc.’s current report on Form 8-K filed on August 13, 2010.
|
|
(58)
|
Incorporated herein by reference to NRG Energy Inc.’s current report on Form 8-K filed on December 16, 2010.
|
|
(59)
|
Incorporated herein by reference to NRG Energy Inc.’s current report on Form 8-K filed on August 3, 2010.
|
|
(60)
|
Incorporated herein by reference to NRG Energy, Inc.'s current report on Form 8-K filed on January 28, 2011.
|
|
(61)
|
Incorporated herein by reference to NRG Energy, Inc.'s current report on Form 8-K filed on May 25, 2011.
|
|
(62)
|
Incorporated herein by reference to NRG Energy, Inc.'s current report on Form 8-K filed on July 5, 2011.
|
|
(63)
|
Incorporated herein by reference to NRG Energy, Inc.'s Registration Statement on Form S-4 filed on July 11, 2011.
|
|
(64)
|
Incorporated herein by reference to NRG Energy, Inc.'s current report on Form 8-K/A filed on September 12, 2011.
|
|
(65)
|
Incorporated herein by reference to NRG Energy, Inc.'s current report on Form 8-K filed on November 8, 2011.
|
215
TABLE OF CONTENTS
Part IItem 1 BusinessItem 1A Risk Factors Related To Nrg Energy, IncItem 1B Unresolved Staff CommentsItem 2 PropertiesItem 3 Legal ProceedingsItem 4 Mine Safety DisclosuresPart IIItem 5 Market For Registrant's Common Equity, Related Stockholder Matters and Issuer Purchases Of Equity SecuritiesItem 6 Selected Financial DataItem 7 Management's Discussion and Analysis Of Financial Condition and Results Of OperationsItem 7A Quantitative and Qualitative Disclosures About Market RiskItem 8 Financial Statements and Supplementary DataItem 9 Changes in and Disagreements with Accountants on Accounting and Financial DisclosureItem 9A - Controls and ProceduresItem 9B Other InformationPart IIIItem 10 Directors, Executive Officers and Corporate GovernanceItem 11 Executive CompensationItem 12 Security Ownership Of Certain Beneficial Owners and Management and Related Stockholder MattersItem 13 Certain Relationships and Related Transactions, and Director IndependenceItem 14 Principal Accounting Fees and ServicesPart IVItem 15 Exhibits, Financial Statement SchedulesNote 1 Nature Of BusinessNote 2 Summary Of Significant Accounting PoliciesNote 3 Business Acquisitions and DispositionsNote 4 Nuclear Innovation North America Llc Developments, Including Impairment ChargeNote 5 Fair Value Of Financial InstrumentsNote 6 Accounting For Derivative Instruments and Hedging ActivitiesNote 7 Nuclear Decommissioning Trust FundNote 8 InventoryNote 9 Capital Leases and Notes ReceivableNote 10 Property, Plant, and EquipmentNote 11 Goodwill and Other IntangiblesNote 12 Debt and Capital LeasesNote 13 Asset Retirement ObligationsNote 14 Benefit Plans and Other Postretirement BenefitsNote 15 Capital StructureNote 16 Investments Accounted For By The Equity Method and Variable Interest EntitiesNote 17 Earnings Per ShareNote 18 Segment ReportingNote 19 Income TaxesNote 20 Stock-based CompensationNote 21 Related Party TransactionsNote 22 Commitments and ContingenciesNote 23 Regulatory MattersNote 24 Environmental MattersNote 25 Cash Flow InformationNote 26 GuaranteesNote 27 Jointly Owned PlantsNote 28 Unaudited Quarterly Financial DataNote 29 Condensed Consolidating Financial Information