NRG ENERGY, INC.
10-Ks and 10-Qs
|
|
|
|
|
|
|
|
|
|
|
|
|
|
|
|
|
|
|
|
|
|
|
|
|
|
|
|
|
|
|
|
|
|
|
|
|
|
|
|
|
|
|
|
|
|
|
|
|
|
|
|
|
|
|
|
UNITED STATES SECURITIES AND EXCHANGE COMMISSION
Washington, D.C. 20549
Form 10-K
|
x
|
ANNUAL REPORT PURSUANT TO SECTION 13 OR 15(d) OF THE SECURITIES EXCHANGE ACT OF 1934
For the Fiscal Year ended December 31, 2016.
|
|
|
o
|
TRANSITION REPORT PURSUANT TO SECTION 13 OR 15(d) OF THE SECURITIES EXCHANGE ACT OF 1934
For the Transition period from to .
|
|
Commission file No. 001-15891
NRG Energy, Inc.
(Exact name of registrant as specified in its charter)
|
Delaware
(State or other jurisdiction of incorporation or organization)
|
41-1724239
(I.R.S. Employer Identification No.)
|
|
|
804 Carnegie Center, Princeton, New Jersey
(Address of principal executive offices)
|
08540
(Zip Code)
|
|
(609) 524-4500
(Registrant's telephone number, including area code)
Securities registered pursuant to Section 12(b) of the Act:
|
Title of Each Class
|
Name of Exchange on Which Registered
|
|
|
Common Stock, par value $0.01
|
New York Stock Exchange
|
|
Securities registered pursuant to Section 12(g) of the Act:
None
Indicate by check mark if the registrant is a well-known seasoned issuer, as defined in Rule 405 of the Securities Act. Yes
x
No
o
Indicate by check mark if the registrant is not required to file reports pursuant to Section 13 or Section 15(d) of the Exchange Act. Yes
o
No
x
Indicate by check mark whether the registrant (1) has filed all reports to be filed by Section 13 or 15(d) of the Securities Exchange Act of 1934 during the preceding 12 months (or for such shorter period that the registrant was required to file such reports), and (2) has been subject to such filing requirements for the past 90 days. Yes
x
No
o
Indicate by check mark whether the registrant has submitted electronically and posted on its corporate Web site, if any, every Interactive Data File required to be submitted and posted pursuant to Rule 405 of Regulation S-T (§232.405 of this chapter) during the preceding 12 months (or for such shorter period that the registrant was required to submit and post such files). Yes
x
No
o
Indicate by check mark if disclosure of delinquent filers pursuant to Item 405 of Regulation S-K (§ 229.405 of this chapter) is not contained herein, and will not be contained, to the best of the registrant's knowledge, in definitive proxy or information statements incorporated by reference in Part III of this Form 10-K or any amendment to this Form 10-K.
o
Indicate by check mark whether the registrant is a large accelerated filer, an accelerated filer, a non-accelerated filer, or a smaller reporting company. See the definitions of "large accelerated filer," "accelerated filer" and "smaller reporting company" in Rule 12b-2 of the Exchange Act.
|
Large accelerated filer
x
|
Accelerated filer
o
|
Non-accelerated filer
o
|
Smaller reporting company
o
|
|||
|
(Do not check if a smaller reporting company)
|
||||||
Indicate by check mark whether the registrant is a shell company (as defined in Rule 12b-2 of the Act). Yes
o
No
x
As of the last business day of the most recently completed second fiscal quarter, the aggregate market value of the common stock of the registrant held by non-affiliates was approximately
$4,180,823,320
based on the closing sale price of
$14.99
as reported on the New York Stock Exchange.
Indicate the number of shares outstanding of each of the registrant's classes of common stock as of the latest practicable date.
|
Class
|
|
Outstanding at January 31, 2017
|
|
Common Stock, par value $0.01 per share
|
|
315,972,715
|
Documents Incorporated by Reference:
Portions of the Registrant's definitive Proxy Statement relating to its
2017
Annual Meeting of Stockholders
are incorporated by reference into Part III of this Annual Report on Form 10-K
1
TABLE OF CONTENTS
|
|
||
|
|
||
|
|
||
|
|
||
|
|
||
|
|
||
2
Glossary of Terms
When the following terms and abbreviations appear in the text of this report, they have the meanings indicated below:
|
2016 Revolving Credit Facility
|
The Company's $2.5 billion revolving credit facility, a component of the 2016 Senior Credit Facility. The revolving credit facility consists of $289 million of Tranche A Revolving Credit Facility, due 2018, and $2.2 billion of Tranche B Revolving Credit Facility, due 2021
|
|
|
2016 Senior Credit Facility
|
NRG's senior secured credit facility, comprised of the 2016 Revolving Credit Facility and the 2023 Term Loan Facility
|
|
|
2023 Term Loan Facility
|
The Company's $1.9 billion term loan facility due 2023, a component of the 2016 Senior Credit Facility
|
|
|
AEP
|
American Electric Power
|
|
|
Alta Wind Assets
|
Seven wind facilities that total 947 MW located in Tehachapi, California and a portfolio of land leases
|
|
|
ARO
|
Asset Retirement Obligation
|
|
|
ARRA
|
American Recovery and Reinvestment Act of 2009
|
|
|
ASC
|
The FASB Accounting Standards Codification, which the FASB established as the source of authoritative GAAP
|
|
|
ASU
|
Accounting Standards Updates – updates to the ASC
|
|
|
Average realized prices
|
Volume-weighted average power prices, net of average fuel costs and reflecting the impact of settled hedges
|
|
|
AZNMSNV
|
Arizona, New Mexico and Southern Nevada
|
|
|
Backlog
|
Projects that are under construction, contracted, or awarded and represents a higher level of execution certainty
|
|
|
BACT
|
Best Available Control Technology
|
|
|
Baseload
|
Units expected to satisfy minimum baseload requirements of the system and produce electricity at an essentially constant rate and run continuously
|
|
|
BETM
|
Boston Energy Trading and Marketing LLC
|
|
|
BRA
|
Base Residual Auction
|
|
|
BTU
|
British Thermal Unit
|
|
|
Buffalo Bear
|
Buffalo Bear, LLC, the operating subsidiary of Tapestry Wind LLC, which owns the Buffalo Bear project
|
|
|
Business Solutions
|
NRG's business solutions group, which includes demand response, commodity sales, energy efficiency and energy management services
|
|
|
CAA
|
Clean Air Act
|
|
|
CAIR
|
Clean Air Interstate Rule
|
|
|
CAISO
|
California Independent System Operator
|
|
|
CCF
|
Carbon Capture Facility
|
|
|
CCPI
|
Clean Coal Power Initiative
|
|
|
CDD
|
Cooling Degree Day
|
|
|
CDFW
|
California Department of Fish and Wildlife
|
|
|
CDWR
|
California Department of Water Resources
|
|
|
CEC
|
California Energy Commission
|
|
|
CenterPoint
|
CenterPoint Energy Houston Electric, LLC
|
|
|
CERT
|
Combustion Emissions Reduction Technologies, LLC
|
|
|
CFTC
|
U.S. Commodity Futures Trading Commission
|
|
|
C&I
|
Commercial, industrial and governmental/institutional
|
|
|
CES
|
Clean Energy Standard
|
|
|
CO
2
|
Carbon Dioxide
|
|
|
CO
2e
|
Carbon Dioxide Equivalents
|
|
|
COD
|
Commercial Operation Date
|
|
3
|
ComEd
|
Commonwealth Edison
|
|
|
Company
|
NRG Energy, Inc.
|
|
|
Consolidated Appropriations Act
|
Consolidated Appropriations Act of 2016
|
|
|
CPP
|
Clean Power Plan
|
|
|
CPS
|
Combined Pollutant Standard
|
|
|
CPUC
|
California Public Utilities Commission
|
|
|
CSAPR
|
Cross-State Air Pollution Rule
|
|
|
CVSR
|
California Valley Solar Ranch
|
|
|
CWA
|
Clean Water Act
|
|
|
D.C. Circuit
|
U.S. Court of Appeals for the District of Columbia Circuit
|
|
|
DGPV Holdco 1
|
NRG DGPV Holdco 1 LLC
|
|
|
DGPV Holdco 2
|
NRG DGPV Holdco 2 LLC
|
|
|
Direct Energy
|
Direct Energy Business Marketing, LLC
|
|
|
Distributed Solar
|
Solar power projects that primarily sell power to customers for usage on site, or are interconnected to sell power into a local distribution grid
|
|
|
DNREC
|
Delaware Department of Natural Resources and Environmental Control
|
|
|
Dodd-Frank Act
|
The Dodd-Frank Wall Street Reform and Consumer Protection Act of 2012
|
|
|
Dominion
|
Dominion Resources, Inc.
|
|
|
Drop Down Assets
|
Collectively, the June 2014 Drop Down Assets, the January 2015 Drop Down Assets, the November 2015 Drop Down Assets and the September 2016 Drop Down Assets
|
|
|
DSI
|
Dry Sorbent Injection
|
|
|
DSU
|
Deferred Stock Unit
|
|
|
Dunkirk Power
|
Dunkirk Power LLC
|
|
|
Economic gross margin
|
Sum of energy revenue, capacity revenue, retail revenue and other revenue, less cost of fuels and other cost of sales
|
|
|
EGU
|
Electric Utility Generating Unit
|
|
|
ELG
|
Effluent Limitations Guidelines
|
|
|
El Segundo Energy Center
|
NRG West Holdings LLC, the subsidiary of Natural Gas Repowering LLC, which owns the El Segundo Energy Center project
|
|
|
EME
|
Edison Mission Energy
|
|
|
EMAAC
|
Eastern Mid-Atlantic Area Council
|
|
|
Energy Plus Holdings
|
Energy Plus Holdings LLC
|
|
|
EPA
|
U.S. Environmental Protection Agency
|
|
|
EPC
|
Engineering, Procurement and Construction
|
|
|
EPSA
|
The Electric Power Supply Association
|
|
|
ERCOT
|
Electric Reliability Council of Texas, the Independent System Operator and the regional reliability coordinator of the various electricity systems within Texas
|
|
|
ERISA
|
The Employee Retirement Income Security Act of 1974
|
|
|
ESA
|
Energy Services Agreement
|
|
|
ESCO
|
Energy Service Company
|
|
|
ESP
|
Electrostatic Precipitator
|
|
|
ESPP
|
Amended and Restated Employee Stock Purchase Plan
|
|
|
ESPS
|
Existing Source Performance Standards
|
|
|
EWG
|
Exempt Wholesale Generator
|
|
|
Exchange Act
|
The Securities Exchange Act of 1934, as amended
|
|
|
FASB
|
Financial Accounting Standards Board
|
|
|
FCM
|
Forward Capacity Market
|
|
4
|
FERC
|
Federal Energy Regulatory Commission
|
|
|
FFB
|
Federal Financing Bank
|
|
|
FirstEnergy
|
FirstEnergy Corp.
|
|
|
FPA
|
Federal Power Act
|
|
|
FRCC
|
Florida Reliability Coordinating Council
|
|
|
Fresh Start
|
Reporting requirements as defined by ASC-852,
Reorganizations
|
|
|
FTRs
|
Financial Transmission Rights
|
|
|
GAAP
|
Accounting principles generally accepted in the U.S.
|
|
|
GenConn
|
GenConn Energy LLC
|
|
|
GenOn
|
GenOn Energy, Inc.
|
|
|
GenOn Americas Generation
|
GenOn Americas Generation, LLC
|
|
|
GenOn Americas Generation Senior Notes
|
GenOn Americas Generation's $695 million outstanding unsecured senior notes consisting of $366 million of 8.5% senior notes due 2021 and $329 million of 9.125% senior notes due 2031
|
|
|
GenOn Mid-Atlantic
|
GenOn Mid-Atlantic, LLC and, except where the context indicates otherwise, its subsidiaries, which include the coal generation units at two generating facilities under operating leases
|
|
|
GenOn Senior Notes
|
GenOn's $1.8 billion outstanding unsecured senior notes consisting of $691 million of 7.875% senior notes due 2017, $649 million of 9.5% senior notes due 2018, and $490 million of 9.875% senior notes due 2020
|
|
|
GHG
|
Greenhouse Gas
|
|
|
Goal Zero
|
Goal Zero LLC
|
|
|
Green Mountain Energy
|
Green Mountain Energy Company
|
|
|
GWh
|
Gigawatt Hour
|
|
|
HAP
|
Hazardous Air Pollutant
|
|
|
HDD
|
Heating Degree Day
|
|
|
Heat Rate
|
A measure of thermal efficiency computed by dividing the total BTU content of the fuel burned by the resulting kWhs generated. Heat rates can be expressed as either gross or net heat rates, depending whether the electricity output measured is gross or net generation and is generally expressed as BTU per net kWh
|
|
|
High Desert
|
TA - High Desert, LLC, the operating subsidiary of NRG Solar Mayfair LLC, which owns the High Desert project
|
|
|
HLBV
|
Hypothetical Liquidation at Book Value
|
|
|
HLM
|
High Lonesome Mesa, LLC
|
|
|
IASB
|
Independent Accounting Standards Board
|
|
|
ICAP
|
New York Installed Capacity
|
|
|
ICE
|
Intercontinental Exchange
|
|
|
IFRS
|
International Financial Reporting Standards
|
|
|
ILU
|
Illinois Union Insurance Company
|
|
|
IPA
|
Illinois Power Authority
|
|
|
IPPNY
|
Independent Power Producers of New York
|
|
|
ISO
|
Independent System Operator, also referred to as RTOs
|
|
|
ISO-NE
|
ISO New England Inc.
|
|
|
ITC
|
Investment Tax Credit
|
|
|
January 2015 Drop Down Assets
|
The Laredo Ridge, Tapestry and Walnut Creek projects, which were sold to NRG Yield, Inc. on January 2, 2015
|
|
|
June 2014 Drop Down Assets
|
The High Desert, Kansas South and El Segundo Energy Center projects, which were sold to NRG Yield, Inc. on June 30, 2014
|
|
|
JX Nippon
|
JX Nippon Oil Exploration (EOR) Limited
|
|
|
Kansas South
|
NRG Solar Kansas South LLC, the operating subsidiary of NRG Solar Kansas South Holdings LLC, which owns the RE Kansas South project
|
|
5
|
KPPH
|
1,000 Pounds Per Hour
|
|
|
kV
|
Kilovolts
|
|
|
kWh
|
Kilowatt-hour
|
|
|
LA DEQ
|
Louisiana Department of Environmental Quality
|
|
|
LaGen
|
Louisiana Generating LLC
|
|
|
Laredo Ridge
|
Laredo Ridge Wind, LLC, the operating subsidiary of Mission Wind Laredo, LLC, which owns the Laredo Ridge project
|
|
|
LIBOR
|
London Inter-Bank Offered Rate
|
|
|
LSE
|
Load Serving Entities
|
|
|
LTIPs
|
Collectively, the NRG Long-Term Incentive Plan, as amended, and the NRG GenOn Long-Term Incentive Plan
|
|
|
MAAC
|
Mid-Atlantic Area Council
|
|
|
Marsh Landing
|
NRG Marsh Landing, LLC (formerly known as GenOn Marsh Landing, LLC)
|
|
|
Mass Market
|
Residential and small commercial customers
|
|
|
MATS
|
Mercury and Air Toxics Standards
|
|
|
MDE
|
Maryland Department of the Environment
|
|
|
Merger
|
The merger completed on December 14, 2012 by NRG and GenOn pursuant to the Merger Agreement
|
|
|
Merger Agreement
|
The agreement by and among NRG, GenOn and Plus Merger Corporation, dated as of July 20, 2012
|
|
|
Midwest Generation
|
Midwest Generation, LLC
|
|
|
MISO
|
Midcontinent Independent System Operator, Inc.
|
|
|
MMBtu
|
Million British Thermal Units
|
|
|
MOPR
|
Minimum Offer Price Rule
|
|
|
MSU
|
Market Stock Unit
|
|
|
MW
|
Megawatts
|
|
|
MWh
|
Saleable megawatt hour net of internal/parasitic load megawatt-hour
|
|
|
MWt
|
Megawatts Thermal Equivalent
|
|
|
NAAQS
|
National Ambient Air Quality Standards
|
|
|
NEPGA
|
New England Power Generators Association
|
|
|
NEPOOL
|
New England Power Pool
|
|
|
NERC
|
North American Electric Reliability Corporation
|
|
|
Net Capacity Factor
|
The net amount of electricity that a generating unit produces over a period of time divided by the net amount of electricity it could have produced if it had run at full power over that time period. The net amount of electricity produced is the total amount of electricity generated minus the amount of electricity used during generation
|
|
|
Net Exposure
|
Counterparty credit exposure to NRG, net of collateral
|
|
|
Net Generation
|
The net amount of electricity produced, expressed in kWhs or MWhs, that is the total amount of electricity generated (gross) minus the amount of electricity used during generation.
|
|
|
NextEra
|
NextEra Energy Resources, LLC
|
|
|
NJDEP
|
New Jersey Department of Environmental Protection
|
|
|
NOL
|
Net Operating Loss
|
|
|
NOV
|
Notice of Violation
|
|
|
November 2015 Drop Down Assets
|
75% of the Class B interests of NRG Wind TE Holdco, which owns a portfolio of 12 wind facilities totaling 814 net MW
|
|
|
NO
x
|
Nitrogen Oxides
|
|
|
NPDES
|
National Pollutant Discharge Elimination System
|
|
|
NPNS
|
Normal Purchase Normal Sale
|
|
6
|
NQSO
|
Non-Qualified Stock Option
|
|
|
NRC
|
U.S. Nuclear Regulatory Commission
|
|
|
NRG
|
NRG Energy, Inc.
|
|
|
NRG GenOn LTIP
|
NRG 2010 Stock Plan for GenOn Employees (formerly the GenOn Energy, Inc. 2010 Omnibus Incentive Plan, which was assumed by NRG in connection with the Merger)
|
|
|
NRG LTIP
|
NRG Long-Term Incentive Plan, as amended
|
|
|
NRG Wind TE Holdco
|
NRG Wind TE Holdco LLC
|
|
|
NRG Yield
|
Reporting segment including the projects owned by NRG Yield, Inc.
|
|
|
NRG Yield 2019 Convertible Notes
|
$345 million aggregate principal amount of 3.50% Convertible Senior Notes due 2019 issued by NRG Yield, Inc.
|
|
|
NRG Yield 2020 Convertible Notes
|
$287.5 million aggregate principal amount of 3.25% Convertible Notes due 2020 issued by NRG Yield, Inc.
|
|
|
NRG Yield, Inc.
|
NRG Yield, Inc., the owner of 55.3% of the economic interests of NRG Yield LLC with a controlling interest, and issuer of publicly held shares of Class A and Class C common stock
|
|
|
NRG Yield Operating 2024 Senior Notes
|
NRG Yield Operating LLC's $500 million of 5.375% unsecured senior notes due 2024
|
|
|
NRG Yield Operating 2026 Senior Notes
|
NRGY Yield Operating LLC's $350 million of 5.00% unsecured senior notes due 2026
|
|
|
NRG Yield LLC
|
NRG Yield LLC, which owns, through its wholly owned subsidiary, NRG Yield Operating LLC, all of the assets set forth in the NRG Yield segment
|
|
|
NSPS
|
New Source Performance Standards
|
|
|
NSR
|
New Source Review
|
|
|
Nuclear Decommissioning Trust Fund
|
NRG's nuclear decommissioning trust fund assets, which are for the Company's portion of the decommissioning of the STP, units 1 & 2
|
|
|
Nuclear Waste Policy Act
|
U.S. Nuclear Waste Policy Act of 1982
|
|
|
NYAG
|
State of New York Office of Attorney General
|
|
|
NYISO
|
New York Independent System Operator
|
|
|
NYMEX
|
New York Mercantile Exchange
|
|
|
NYSERDA
|
New York State Energy Research and Development Authority
|
|
|
NYSPSC
|
New York State Public Service Commission
|
|
|
OCI
|
Other Comprehensive Income
|
|
|
PADEP
|
Pennsylvania Department of Environmental Protection
|
|
|
Peaking
|
Units expected to satisfy demand requirements during the periods of greatest or peak load on the system
|
|
|
PER
|
Peak Energy Rate
|
|
|
PG&E
|
Pacific Gas and Electric Company
|
|
|
Pipeline
|
Projects that range from identified lead to shortlisted with an offtake, and represents a lower level of execution certainty
|
|
|
Pinnacle
|
Pinnacle Wind, LLC, the operating subsidiary of Tapestry Wind LLC, which owns the Pinnacle project
|
|
|
PJM
|
PJM Interconnection, LLC
|
|
|
PM
|
Particulate Matter
|
|
|
POJO
|
Powerton and Joliet, of which the Company leases 100% interests in Unit 7 and Unit 8 of the Joliet generating facility and the Powerton generating facility, through Midwest Generation
|
|
|
PPA
|
Power Purchase Agreement
|
|
|
PPTA
|
Power Purchase Tolling Agreement
|
|
|
PSD
|
Prevention of Significant Deterioration
|
|
|
PTC
|
Production Tax Credit
|
|
|
PUCN
|
Public Utilities Commission of Nevada
|
|
|
PUCO
|
Public Utility Commission of Ohio
|
|
7
|
PUCT
|
Public Utility Commission of Texas
|
|
|
PUHCA
|
Public Utility Holding Company Act of 2005
|
|
|
PURPA
|
Public Utility Regulatory Policies Act of 1978
|
|
|
QF
|
Qualifying Facility under PURPA
|
|
|
RAPA
|
Resource Adequacy Purchase Agreement
|
|
|
RCRA
|
Resource Conservation and Recovery Act of 1976
|
|
|
Recurring Customers
|
Customers that subscribe to one or more recurring services, such as electricity, natural gas and protection products, the majority of which are retail electricity customers in Texas and the Northeast
|
|
|
Reliant Energy
|
Reliant Energy Retail Services, LLC
|
|
|
REMA
|
NRG REMA LLC, which in addition to its asset under ownership, leases a 100% interest in the Shawville generating facility and 16.7% and 16.5% interests in the Keystone and Conemaugh generating facilities, respectively
|
|
|
Repowering
|
Technologies utilized to replace, rebuild, or redevelop major portions of an existing electrical generating facility to achieve a substantial emissions reduction, increase facility capacity and improve system efficiency
|
|
|
RESA
|
Retail Electric Supply Association
|
|
|
Retail
|
Reporting segment that includes NRG's residential and small commercial businesses which go to market as Reliant, NRG and other brands owned by NRG, as well as Business Solutions
|
|
|
Revolving Credit Facility
|
Prior to June 30, 2016, the Company's $2.5 billion revolving credit facility due 2018, a component of the Senior Credit Facility. On June 30, 2016, the Company replaced the Senior Credit Facility, including the Revolving Credit Facility, with the 2016 Senior Credit Facility
|
|
|
RFP
|
Request For Proposal
|
|
|
RGGI
|
Regional Greenhouse Gas Initiative
|
|
|
RMR
|
Reliability Must-Run
|
|
|
ROFO Agreement
|
Second Amended and Restated Right of First Offer Agreement by and between NRG Energy, Inc. and NRG Yield, Inc.
|
|
|
RPM
|
Reliability Pricing Model
|
|
|
RPS
|
Renewable Portfolio Standards
|
|
|
RPV Holdco
|
NRG RPV Holdco 1 LLC
|
|
|
RSSA
|
Reliability Support Service Agreement
|
|
|
RSU
|
Restricted Stock Unit
|
|
|
RTO
|
Regional Transmission Organization
|
|
|
Sabine
|
Sabine Cogen, L.P.
|
|
|
SACCWIS
|
Statewide Advisory Committee on Cooling Water Intake Structures
|
|
|
SCE
|
Southern California Edison Company
|
|
|
SCR
|
Selective Catalytic Reduction Control System
|
|
|
SDG&E
|
San Diego Gas & Electric
|
|
|
SEC
|
U.S. Securities and Exchange Commission
|
|
|
SECA
|
Seams Elimination Charge/Cost Adjustments/Assignments
|
|
|
Securities Act
|
The Securities Act of 1933, as amended
|
|
|
Senior Credit Facility
|
Prior to June 30, 2016, the Company's senior secured facility, comprised of the Term Loan Facility and the Revolving Credit Facility. On June 30, 2016, the Company replaced the Senior Credit Facility with the 2016 Senior Credit Facility
|
|
|
Senior Notes
|
NRG's $5.4 billion outstanding unsecured senior notes consisting of $398 million of 7.625% senior notes due 2018, $207 million of 7.875% senior notes due 2021, $992 million of 6.25% senior notes due 2022, $869 million of 6.625% senior notes due 2023 and $733 million of 6.25% senior notes due 2024, $1.0 billion of the 7.25% senior notes due 2026 and $1.25 billion of the 6.625% senior notes due 2027
|
|
|
SERC
|
Southeastern Electric Reliability Council
|
|
|
September 2016 Drop Down Assets
|
The CVSR Holdco interest, which was sold to NRG Yield, Inc. on September 1, 2016
|
|
8
|
Seward
|
The Seward Power Generating Station, a 525 MW coal-fired facility in Pennsylvania
|
|
|
SF6
|
Sulfur Hexafluoride
|
|
|
Shelby
|
The Shelby County Generating Station, a 352 MW natural gas-fired facility in Illinois
|
|
|
Sherwin
|
Sherwin Alumina Company
|
|
|
SIFMA
|
Securities Industry and Financial Markets Association
|
|
|
SNF
|
Spent Nuclear Fuel
|
|
|
SO
2
|
Sulfur Dioxide
|
|
|
S&P
|
Standard & Poor's
|
|
|
SSR
|
System Support Resource
|
|
|
STP
|
South Texas Project — nuclear generating facility located near Bay City, Texas in which NRG owns a 44% interest
|
|
|
STPNOC
|
South Texas Project Nuclear Operating Company
|
|
|
SunPower
|
SunPower Corporation, Systems
|
|
|
Taloga
|
Taloga Wind, LLC, the operating subsidiary of Tapestry Wind LLC, which owns the Taloga project
|
|
|
TCPA
|
Telephone Consumer Protection Act
|
|
|
Term Loan Facility
|
Prior to June 30, 2016, the Company's $2.0 billion term loan facility due 2018, a component of the Senior Credit Facility. On and after June 30, 2016, the 2023 Term Loan Facility, a component of the 2016 Senior Credit Facility
|
|
|
Texas Genco
|
Texas Genco LLC
|
|
|
Thermal Business
|
NRG Yield, Inc.’s thermal business, which consists of thermal infrastructure assets that provide steam, hot water and/or chilled water, and in some instances electricity, to commercial businesses, universities, hospitals and governmental units
|
|
|
TOU
|
Time-of-use
|
|
|
TSA
|
Transportation Services Agreement
|
|
|
TSR
|
Total Shareholder Return
|
|
|
TVA
|
Tennessee Valley Authority
|
|
|
TWCC
|
Texas Westmoreland Coal Co.
|
|
|
TWh
|
Terawatt Hour
|
|
|
UNFCCC
|
United Nations Framework Convention on Climate Change
|
|
|
UPMC
|
University of Pittsburgh Medical Center
|
|
|
U.S.
|
United States of America
|
|
|
U.S. DOE
|
U.S. Department of Energy
|
|
|
Utility Scale Solar
|
Solar power projects, typically 20 MW or greater in size (on an alternating current basis), that are interconnected into the transmission or distribution grid to sell power at a wholesale level
|
|
|
VaR
|
Value at Risk
|
|
|
VCP
|
Voluntary Clean-Up Program
|
|
|
VIE
|
Variable Interest Entity
|
|
|
Walnut Creek
|
NRG Walnut Creek, LLC, the operating subsidiary of WCEP Holdings, LLC, which owns the Walnut Creek project
|
|
|
WECC
|
Western Electricity Coordinating Council
|
|
|
Yield Operating
|
NRG Yield Operating LLC
|
|
9
General
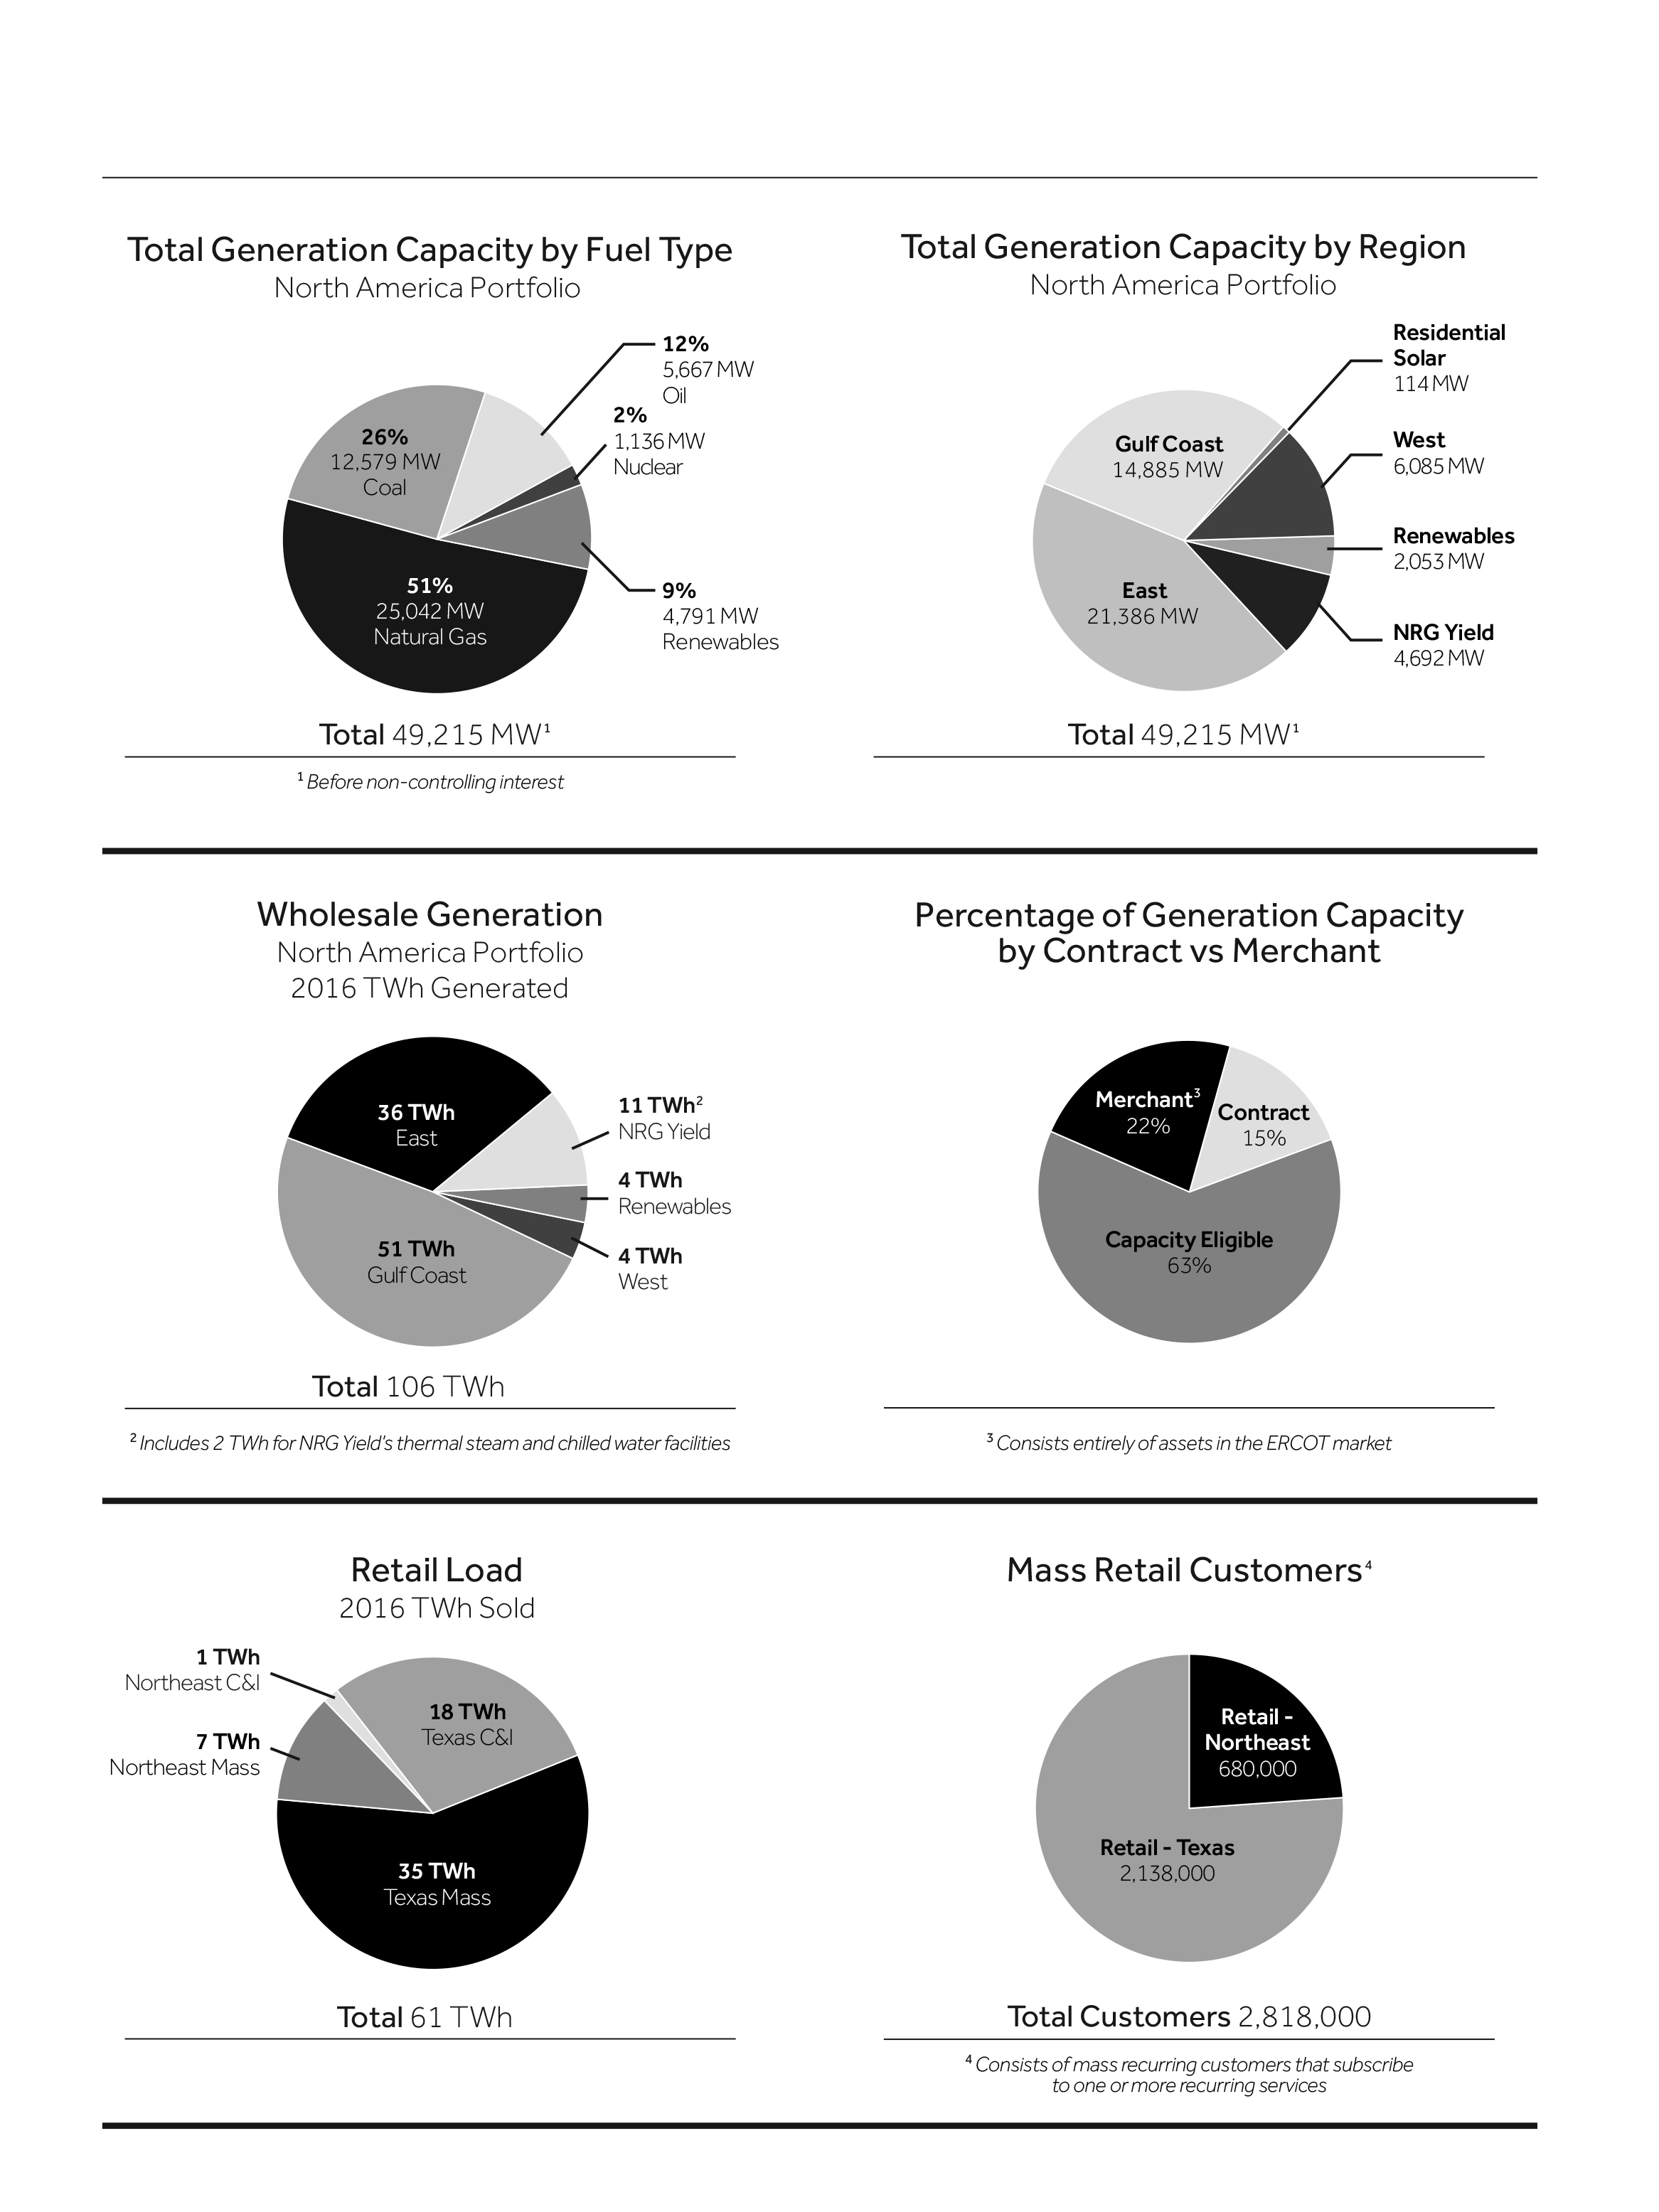
NRG Energy, Inc., or NRG or the Company, is a leading integrated power company built on the strength of the nation's largest and most diverse competitive electric generation portfolio and leading retail electricity platform. NRG aims to create a sustainable energy future by producing, selling and delivering electricity and related products and services in major competitive power markets in the U.S. in a manner that delivers value to all of NRG's stakeholders. The Company owns and operates approximately 47,000 MW of generation; engages in the trading of wholesale energy, capacity and related products; transacts in and trades fuel and transportation services; and directly sells energy, services, and innovative, sustainable products and services to retail customers under the names “NRG”, "Reliant" and other retail brand names owned by NRG. NRG was incorporated as a Delaware corporation on May 29, 1992.
Strategy
NRG's strategy is to maximize stockholder value through the safe production and sale of reliable and affordable power to its customers in the markets served by the Company, while positioning the Company to meet the market's increasing demand for sustainable, low carbon and customized energy solutions for the benefit of the end-use energy consumer. This strategy is intended to enable the Company to achieve sustainable growth at reasonable margins while de-risking the Company in terms of reduced and mitigated exposure both to environmental risk and cyclical commodity price risk. At the same time, the Company's relentless commitment to safety for its employees, customers and partners continues unabated.
To effectuate the Company’s strategy, NRG is focused on: (i) excellence in operating performance of its existing assets including repowering its power generation assets at premium sites and optimal hedging of generation assets and retail load operations; (ii) serving the energy needs of end-use residential, commercial and industrial customers in competitive markets through multiple brands and channels with a variety of retail energy products and services differentiated by innovative features, premium service, sustainability, and loyalty/affinity programs; (iii) investing in alternative power generation technologies in its wholesale business, like wind and solar, and deploying innovative energy solutions for consumers within its retail businesses; and (iv) engaging in a proactive capital allocation plan focused on achieving the regular return of and on stockholder capital within the dictates of prudent balance sheet management, including pursuing selective acquisitions, joint ventures, divestitures and investments.
Business Overview
The Company’s core businesses include wholesale conventional generation, retail electricity including personal power solutions and Business Solutions (included in the Retail segment, effective in January 2017), contracted generation owned by NRG Yield, Inc. (included in the NRG Yield segment) and renewable utility scale and distributed generation assets that are constructed or in development and that are not otherwise owned by NRG Yield, Inc. (included in the Renewables segment).
Generation
The Company’s wholesale power generation business includes the Company's wholesale operations including plant operations, commercial operations, EPC, energy services and other critical related functions. In addition to the traditional functions, the wholesale power generation business also includes NRG’s conventional distributed generation business, consisting of reliability, combined heat and power and large-scale distributed generation.
The wholesale generation business is capital-intensive and commodity-driven with numerous industry participants that compete on the basis of the location of their plants, fuel mix, plant efficiency and the reliability of the services offered. The Company has one of the largest and most diversified power generation portfolios in the U.S., with approximately 42,000 MW of fossil fuel and nuclear generation capacity at 85 plants as of December 31, 2016. The Company's power generation assets are diversified by fuel-type, dispatch level and region, which helps mitigate the risks associated with fuel price volatility and market demand cycles. NRG's U.S. baseload and intermediate facilities provide the Company with a significant source of cash flow, while its peaking facilities provide NRG with opportunities to capture significant upside potential that can arise during periods of high demand, which typically drive higher energy prices. As of December 31, 2016, less than 25% of the Company's consolidated operating revenues were derived from coal-fired operating assets.
10
Wholesale power generation is a regional business that is currently highly fragmented and diverse in terms of industry structure. As such, there is a wide variation in terms of the capabilities, resources, nature and identities of the companies the Company competes with depending on the market. Competitors include regulated utilities, municipalities, cooperatives and other independent power producers, and power marketers or trading companies, including those owned by financial institutions. Many of the Company's generation assets, however, are located within densely populated areas that tend to have higher wholesale pricing as a result of relatively favorable local supply-demand balance. The Company has generation assets located in or near Houston, New York City, Chicago, Washington D.C., New Jersey, southwestern Connecticut, Pittsburgh, Cleveland, and the Los Angeles, San Diego, and San Francisco metropolitan areas. These facilities, some of which are aging, are often ideally situated for repowering or the addition of new capacity because their location and existing infrastructure give them significant advantages over undeveloped sites. The Company believes that its extensive generation portfolio provides many asset optimization opportunities. During 2016, the Company completed gas conversion projects on facilities totaling more than 2,200 MW. The Company currently has over 1,000 MW targeted for Repowering initiatives, all of which are under development or construction.
In addition, the Company continuously evaluates opportunities for development of new generation, on both a merchant and contracted basis. As such, the majority of the Company's current developments are in response to RFPs for new generation and/or generating capacity backed by contracts with credit-worthy counterparties. Many RFPs are issued by regulated utilities or electric system operators in response to reliability or renewable power mandates. The Company competes against other power plant developers when responding to these RFPs. The number and type of competitors vary based on the location, generation type, project size and counterparty specified in the RFP. Bids are awarded based on many factors including price, location of existing generation, prior experience developing generation resources similar to that specified in the RFP, and creditworthiness.
Retail
Retail provides energy and related services as well as personal power to Mass Market consumers through various brands and sales channels across the U.S. Retail also includes C&I customers and other distributed and reliability products which are within NRG's Business Solutions group. In 2016, Retail delivered approximately 42 TWhs and served approximately 2.8 million mass Recurring Customers. Retail's results make it the largest competitive Mass Market energy retailer in the U.S. and Texas, and one of the top six Mass Market energy retailers in the Eastern and Midwestern U.S. The majority of Retail's sales come in the competitive retail energy markets of Connecticut, Delaware, Illinois, Maryland, Massachusetts, New Jersey, New York, Ohio, Pennsylvania and Texas, as well as the District of Columbia.
Mass Market consumers make purchase decisions based on a variety of factors, including price, customer service, brand, product choices and value-added features. These consumers purchase products through a variety of sales channels, including direct sales, call centers, websites, brokers and brick-and-mortar stores. Through its broad range of service offerings and value propositions, Retail is able to attract, retain, and increase the value of its customer relationships. Retail's brands are recognized for exemplary customer service, innovative smart energy and technology product offerings and environmentally friendly solutions.
Included in Retail is the Company's Business Solutions group, which focuses on providing distributed products and services as businesses seek greater reliability, cleaner power or other benefits that they cannot obtain from the grid. These solutions include system power, distributed generation, solar and wind products, carbon management and specialty services, backup generation, storage and distributed solar, demand response and energy efficiency. In providing on-site energy solutions, the Company often benefits from its ability to supply energy products from its wholesale generation portfolio to commercial and industrial retail customers.
The Company also provides energy services including operations, maintenance, technical, development and asset management services to its own facilities and to external customers.
11
Renewables
The Company’s renewables business focuses on the acquisition, development and operation and maintenance of utility scale wind and solar, community solar and distributed solar generation assets as well as the management and operations of the renewable generation assets owned by NRG Yield, Inc. A substantial portion of the utility scale wind and solar generation facilities contained within the Company’s renewables business are subject to the ROFO Agreement between the Company and NRG Yield, Inc. In 2016, the Company acquired 1,637 MW of utility scale solar and wind projects and 107 MW of distributed generation and community solar projects that are currently under development or in operation across 12 states. The renewables business has in-house expertise that covers the full spectrum of development capabilities to execute on utility, distributed generation, and community solar projects. The asset management and operations and maintenance groups within the renewables business manage a portfolio of wind and solar assets across 26 states, serving as the primary commercial asset manager on the vast majority of assets owned by NRG and NRG Yield, Inc. In addition, the operations and maintenance groups self-perform plant operations on 2,675 MW on the consolidated fleet of assets owned by NRG and NRG Yield, Inc. and 224 MW on assets owned by third parties.
The utility wind and solar generation business targets strategic partnerships with utilities, municipalities and large national corporations for offsite wind and solar solutions. The distributed solar business targets partnerships with companies, municipalities, schools and communities to provide on-site and virtual net metering off-site renewable generation. The community solar business targets relationships with companies and municipalities as well as residential homeowners to provide off-site solar generation under community solar regulations and tariffs. In addition to assets in operation, as of December 31, 2016, the Company held a backlog of in-construction, contracted and awarded projects of 543 MW, and a pipeline of 3,268 MW across the utility and distributed solar renewables markets.
Similar to the wholesale business, the renewables business also competes for new generation opportunities through both RFPs and bilateral solicitations. The renewables business selects markets and projects to compete based on resource relative to the value of the power, while seeking to make use of NRG capabilities in a competitive landscape. The number and type of competitors vary based on location, generation type, project size and counterparty. The renewables business competes with traditional utilities as well as companies that provide products and services in the downstream solar and wind energy value chains.
NRG Yield
NRG Yield, Inc. is a publicly-traded, dividend growth-oriented company formed to serve as the primary vehicle through which NRG owns, operates and acquires diversified contracted renewable and conventional generation and thermal infrastructure assets. As of December 31, 2016, NRG owns a 55.1% voting interest in the outstanding common stock of NRG Yield, Inc. NRG Yield, Inc.’s contracted generation portfolio collectively represents 4,563 net MW as of December 31, 2016. Each of the assets sells substantially all of its output pursuant to long-term, fixed price offtake agreements with creditworthy counterparties. NRG Yield, Inc. also owns thermal infrastructure assets with an aggregate steam and chilled water capacity of 1,319 net MWt and electric generation capacity of 123 net MW. These thermal infrastructure assets provide steam, hot water and/or chilled water, and in some instances electricity, to commercial businesses, universities, hospitals and governmental units in multiple locations, principally through long-term contracts or pursuant to rates regulated by state utility commissions.
NRG Yield, Inc. provides the Company with a more competitive cost of capital consistent with the lower risk profile of long-term contracted or regulated assets. As such, NRG believes that it directly benefits from NRG Yield, Inc.’s growth through its controlling interest in NRG Yield, Inc. and by providing NRG Yield, Inc. a platform of growth through the completion of future sales of assets pursuant to the ROFO Agreement. The proceeds of such future sales are expected to provide the Company with a portion of the capital utilized under its capital allocation program.
12
GenOn Liquidity
As disclosed in Item 15 - Note 1,
Nature of Business
, and Note 12,
Debt and Capital Leases
, to the Consolidated Financial Statements, $691 million of GenOn's Senior Notes, excluding $8 million of associated premiums, are current within the GenOn consolidated balance sheet as of December 31, 2016 and are due on June 15, 2017. GenOn's future profitability continues to be adversely affected by (i) a sustained decline in natural gas prices and its resulting effect on wholesale power prices and capacity prices, and (ii) the inability of GenOn Mid-Atlantic and REMA to make distributions of cash and certain other restricted payments to GenOn. Based on current projections, GenOn is not expected to have sufficient liquidity to repay the Senior Notes due in June 2017. As a result of these factors, there is substantial doubt about GenOn's ability to continue as a going concern. As a result of the substantial doubt about GenOn’s ability to continue as a going concern, along with additional factors, there is substantial doubt about certain of GenOn’s subsidiaries’ ability to continue as a going concern.
The Company, GenOn's parent company, has no obligation to provide any financial support to GenOn other than under the secured intercompany revolving credit agreement between the Company and GenOn and NRG Americas. As of December 31, 2016, $228 million was available to be used by GenOn under the $500 million revolving credit agreement. As controlled group members, ERISA requires that NRG and GenOn are jointly and severally liable for the NRG Pension Plan for Bargained Employees and the NRG Pension Plan, including the pension liabilities associated with GenOn employees.
GenOn is currently considering all options available to it, including negotiations with creditors, refinancing the GenOn Senior Notes, potential sales of certain generating assets as well as the possibility for a need to file for protection under Chapter 11 of the U.S. Bankruptcy Code. During 2016, GenOn appointed two independent directors, retained advisors and established a separate audit committee as part of this process. Any resolution may have a material impact on the Company's statement of operations, cash flows and financial position.
As of December 31, 2016, GenOn represents 15.6% of the Company's consolidated total assets, 16.9% of the Company's consolidated total liabilities and contributed $94 million to the Company's consolidated cash from operations in 2016.
NRG Operations
The NRG businesses described above are all supported through the NRG operational infrastructure, which begins with the Company’s asset fleet and the associated commercial and retail operations. The images below illustrate NRG's U.S. power generation and net capacity capabilities as of December 31, 2016, as well as customer, load and regional information surrounding the operation of NRG’s retail businesses:
13
14
The following table summarizes NRG's global generation portfolio as of
December 31, 2016
:
|
Global Generation Portfolio
(a)
|
||||||||||||||||||||||||
|
(In MW)
|
||||||||||||||||||||||||
|
Generation
|
||||||||||||||||||||||||
|
Generation Type
|
Gulf Coast
|
East
|
West
|
Other
|
Renewables
(b)
|
NRG Yield
(c)
|
Corporate
(d)
|
Total Global
|
||||||||||||||||
|
Natural gas
(e)
|
8,635
|
|
8,444
|
|
6,085
|
|
144
|
|
—
|
|
1,878
|
|
—
|
|
25,186
|
|
||||||||
|
Coal
(f)
|
5,114
|
|
7,465
|
|
—
|
|
605
|
|
—
|
|
—
|
|
—
|
|
13,184
|
|
||||||||
|
Oil
(g)
|
—
|
|
5,477
|
|
—
|
|
—
|
|
—
|
|
190
|
|
—
|
|
5,667
|
|
||||||||
|
Nuclear
|
1,136
|
|
—
|
|
—
|
|
—
|
|
—
|
|
—
|
|
—
|
|
1,136
|
|
||||||||
|
Wind
|
—
|
|
—
|
|
—
|
|
—
|
|
961
|
|
2,005
|
|
—
|
|
2,966
|
|
||||||||
|
Utility Scale Solar
|
—
|
|
—
|
|
—
|
|
—
|
|
987
|
|
610
|
|
—
|
|
1,597
|
|
||||||||
|
Distributed Solar
|
—
|
|
—
|
|
—
|
|
—
|
|
105
|
|
9
|
|
114
|
|
228
|
|
||||||||
|
Total generation capacity
(h)
|
14,885
|
|
21,386
|
|
6,085
|
|
749
|
|
2,053
|
|
4,692
|
|
114
|
|
49,964
|
|
||||||||
|
Capacity attributable to noncontrolling interest
(h)
|
—
|
|
—
|
|
—
|
|
—
|
|
(638
|
)
|
(2,110
|
)
|
—
|
|
(2,748
|
)
|
||||||||
|
Total net generation capacity
|
14,885
|
|
21,386
|
|
6,085
|
|
749
|
|
1,415
|
|
2,582
|
|
114
|
|
47,216
|
|
||||||||
(a) All Utility Scale Solar and Distributed Solar facilities are described in MW on an alternating current basis. MW figures provided represent nominal summer net MW capacity of power generated as adjusted for the Company's owned or leased interest excluding capacity from inactive/mothballed units.
(b) Includes Distributed Solar capacity from assets held by DGPV Holdco 1 and DGPV Holdco 2. Excludes 100 MW related to the High Lonesome Mesa facility, which was transferred to lien holders on March 31, 2016.
(c) Does not include NRG Yield, Inc.'s thermal converted (MWt) capacity, which is part of the NRG Yield operating segment.
(d) The Distributed Solar figure within "Corporate" includes the aggregate production capacity of installed and activated residential solar energy systems. Also includes capacity from operating portfolios of residential solar assets held by RPV Holdco.
(e) New Castle Units 3, 4, and 5 and Joliet Units 6, 7, and 8, totaling 1,651 MW, were moved to natural gas from coal following the completion of natural gas addition and conversion projects, respectively, in the second quarter of 2016. Natural gas generation portfolio does not include 878 MW related to Aurora and 450 MW related to Rockford, which were both sold on July 12, 2016. Natural gas generation portfolio includes 597 MW related to Shawville which completed a natural gas addition in the second quarter of 2016 and 275 MW related to Choctaw Unit 1 which is in forced outage and expected to return to service in December 2017.
(f) Coal generation portfolio does not include 94 MW related to Avon Lake 7, which was deactivated in April 2016. New Castle Units 3, 4, and 5 and Joliet Units 6, 7, and 8, totaling 1,651 MW were moved from coal -to natural gas following completion of natural gas addition and conversion projects, respectively, in the second quarter of 2016. Does not include 597 MW related to Shawville which completed a natural gas addition project in the second quarter of 2016. Coal generation portfolio does not include 525 MW related to the Seward generating facility and 380 MW related to the Huntley generating facility, which were sold and deactivated in the first quarter of 2016, respectively.
(g) Oil generation portfolio does not include 104 MW related to the Astoria Oil Turbines which were deactivated in the first quarter of 2016.
(h) NRG Yield's total generation capacity includes 6 MWs for noncontrolling interest for Spring Canyon II and III. NRG Yield's total generation capacity net of this noncontrolling interest was 4,686 MWs.
NRG's portfolio diversification and commercial operations hedging strategy provides the Company with reliable future cash flows.
NRG has hedged a portion of its coal and nuclear capacity with decreasing hedge levels through 2021. Over a third of the Company's generation is in markets with forward capacity markets that extend three years into the future. These capacity revenues not only enhance the reliability of future cash flows but are not correlated to natural gas prices. NRG also has cooperative load contract obligations in the Gulf Coast region extending through various dates in 2025, which largely hedges a portion of the Company's generation in this region. In addition, as of
December 31, 2016
, the Company had purchased fuel forward under fixed price contracts, with contractually-specified price escalators, for approximately 30% of its expected coal requirement from
2017
to 2021. The Company enters into additional hedges when it deems market conditions to be favorable.
The Company also has the advantage of being able to supply its retail businesses with its own generation, which can reduce the need to sell and buy power from other institutions and intermediaries, resulting in lower transaction costs and credit exposures. This combination of generation and retail allows for a reduction in actual and contingent collateral, through offsetting transactions and by reducing the need to hedge the retail power supply through third parties.
The generation and retail combination also provides stability in cash flows, as changes in commodity prices generally have offsetting impacts between the two businesses. The offsetting nature of generation and retail, in relation to changes in market prices, is an integral part of NRG's goal of providing a reliable source of future cash flow for the Company.
15
When developing new renewable and conventional power generation facilities, NRG typically secures long-term PPAs, which insulate the Company from commodity market volatility and provide future cash flow stability. These PPAs are typically contracted with high credit quality local utilities and typically have durations from 10 years to as much as 25 years.
Commercial Operations Overview
NRG seeks to maximize profitability and manage cash flow volatility through the marketing, trading and sale of energy, capacity and ancillary services into spot, intermediate and long-term markets and through the active management and trading of emissions allowances, fuel supplies and transportation-related services. The Company's principal objectives are the realization of the full market value of its asset base, including the capture of its extrinsic value, the management and mitigation of commodity market risk and the reduction of cash flow volatility over time.
NRG enters into power sales and hedging arrangements via a wide range of products and contracts, including PPAs, fuel supply contracts, capacity auctions, natural gas derivative instruments and other financial instruments. In addition, because changes in power prices in the markets where NRG operates are generally correlated to changes in natural gas prices, NRG uses hedging strategies that may include power and natural gas forward sales contracts to manage the commodity price risk primarily associated with the Company's coal and nuclear generation assets. The objective of these hedging strategies is to stabilize the cash flow generated by NRG's portfolio of assets.
NRG also trades electric power, natural gas and related commodity and financial products, including forwards, futures, options and swaps, through its ownership of BETM, which is also an energy management service provider for primarily third-party generating assets. Certain other NRG entities trade to a lesser extent, utilizing similar products as well as oil and weather products. The Company seeks to generate profits from volatility in the price of electricity, capacity, fuels and transmission congestion by buying and selling contracts in wholesale markets under guidelines approved by the Company's risk management committee.
Coal and Nuclear Operations
The following table summarizes NRG's U.S. coal and nuclear capacity and the corresponding revenues and average natural gas prices and positions resulting from coal and nuclear hedge agreements extending beyond
December 31, 2016
and through 2020 for the Company's Gulf Coast region:
|
Gulf Coast
|
2017
|
2018
|
2019
|
2020
|
Annual
Average for
2017-2020
|
|||||||||||||||
|
|
(Dollars in millions unless otherwise stated)
|
|||||||||||||||||||
|
Net Coal and Nuclear Capacity (MW)
(a)
|
6,250
|
|
6,250
|
|
6,250
|
|
6,250
|
|
6,250
|
|
||||||||||
|
Forecasted Coal and Nuclear Capacity (MW)
(b)
|
4,959
|
|
4,411
|
|
4,119
|
|
4,198
|
|
4,422
|
|
||||||||||
|
Total Coal and Nuclear Sales (GWh)
(c)
|
39,002
|
|
19,624
|
|
8,471
|
|
7,653
|
|
18,687
|
|
||||||||||
|
Percentage Coal and Nuclear Capacity Sold Forward
(d)
|
90
|
%
|
51
|
%
|
23
|
%
|
21
|
%
|
46
|
%
|
||||||||||
|
Total Forward Hedged Revenues
(e)
|
$
|
1,429
|
|
$
|
747
|
|
$
|
429
|
|
$
|
406
|
|
$
|
—
|
|
|||||
|
Weighted Average Hedged Price ($ per MWh)
(e)
|
$
|
36.63
|
|
$
|
38.07
|
|
$
|
50.68
|
|
$
|
53.07
|
|
$
|
—
|
|
|||||
|
Average Equivalent Natural Gas Price ($ per MMBtu)
(e)
|
$
|
3.68
|
|
$
|
3.91
|
|
$
|
4.83
|
|
$
|
4.99
|
|
$
|
—
|
|
|||||
|
Gross Margin Sensitivities
|
||||||||||||||||||||
|
Gas Price Sensitivity Up $0.50/MMBtu on Coal and Nuclear Units
|
$
|
1
|
|
$
|
76
|
|
$
|
124
|
|
$
|
147
|
|
$
|
—
|
|
|||||
|
Gas Price Sensitivity Down $0.50/MMBtu on Coal and Nuclear Units
|
$
|
—
|
|
$
|
(69
|
)
|
$
|
(113
|
)
|
$
|
(124
|
)
|
$
|
—
|
|
|||||
|
Heat Rate Sensitivity Up 1 MMBtu/MWh on Coal and Nuclear Units
|
$
|
53
|
|
$
|
100
|
|
$
|
91
|
|
$
|
96
|
|
$
|
—
|
|
|||||
|
Heat Rate Sensitivity Down 1 MMBtu/MWh on Coal and Nuclear Units
|
$
|
(36
|
)
|
$
|
(79
|
)
|
$
|
(71
|
)
|
$
|
(77
|
)
|
$
|
—
|
|
|||||
|
(a)
|
Net coal and nuclear capacity represents nominal summer net MW capacity of power generated as adjusted for the Company's ownership position excluding capacity from inactive/mothballed units, see Item 2 -
Properties
for units scheduled to be deactivated.
|
|
(b)
|
Forecasted generation dispatch output (MWh) based on forward price curves as of
December 31, 2016
, which is then divided by number of hours in a given year to arrive at MW capacity. The dispatch takes into account planned and unplanned outage assumptions.
|
|
(c)
|
Includes amounts under power sales contracts and natural gas hedges. The forward natural gas quantities are reflected in equivalent GWh based on forward market implied heat rate as of December 31, 2016, and then combined with power sales to arrive at equivalent GWh hedged. The coal and nuclear sales include swaps and delta of options sold which is subject to change. For detailed information on the Company's hedging methodology through use of derivative instruments, see discussion in Item 15 - Note 5,
Accounting for Derivative Instruments and Hedging Activities
, to the Consolidated Financial Statements. Includes inter-segment sales from the Company's wholesale power generation business to the retail business.
|
|
(d)
|
Percentage hedged is based on total coal and nuclear sales as described in (c) above divided by the forecasted coal and nuclear capacity.
|
|
(e)
|
Represents U.S. coal and nuclear sales, including energy revenue and demand charges.
|
16
The following table summarizes NRG's U.S. coal capacity and the corresponding revenues and average natural gas prices and positions resulting from coal hedge agreements extending beyond
December 31, 2016
and through 2020 for the East region:
|
East
|
2017
|
2018
|
2019
|
2020
|
Annual
Average for
2017-2020
|
|||||||||||||||
|
|
(Dollars in millions unless otherwise stated)
|
|||||||||||||||||||
|
Net Coal Capacity (MW)
(a)
|
7,465
|
|
7,465
|
|
7,465
|
|
7,167
|
|
7,391
|
|
||||||||||
|
Forecasted Coal Capacity (MW)
(b)
|
3,688
|
|
3,200
|
|
2,483
|
|
2,141
|
|
2,878
|
|
||||||||||
|
Total Coal Sales (GWh)
(c)
|
31,905
|
|
5,265
|
|
455
|
|
81
|
|
9,427
|
|
||||||||||
|
Percentage Coal Capacity Sold Forward
(d)
|
99
|
%
|
19
|
%
|
2
|
%
|
—
|
%
|
30
|
%
|
||||||||||
|
Total Forward Hedged Revenues
(e)
|
$
|
1,162
|
|
$
|
175
|
|
$
|
16
|
|
$
|
2
|
|
$
|
—
|
|
|||||
|
Weighted Average Hedged Price ($ per MWh)
(e)
|
$
|
36.41
|
|
$
|
33.27
|
|
$
|
—
|
|
$
|
—
|
|
$
|
—
|
|
|||||
|
Average Equivalent Natural Gas Price ($ per MMBtu)
(e)
|
$
|
3.69
|
|
$
|
3.29
|
|
$
|
—
|
|
$
|
—
|
|
$
|
—
|
|
|||||
|
Gross Margin Sensitivities
|
||||||||||||||||||||
|
Gas Price Sensitivity Up $0.50/MMBtu on Coal Units
|
$
|
64
|
|
$
|
206
|
|
$
|
230
|
|
$
|
215
|
|
$
|
—
|
|
|||||
|
Gas Price Sensitivity Down $0.50/MMBtu on Coal Units
|
$
|
(35
|
)
|
$
|
(162
|
)
|
$
|
(159
|
)
|
$
|
(140
|
)
|
$
|
—
|
|
|||||
|
Heat Rate Sensitivity Up 1 MMBtu/MWh on Coal Units
|
$
|
64
|
|
$
|
119
|
|
$
|
121
|
|
$
|
110
|
|
$
|
—
|
|
|||||
|
Heat Rate Sensitivity Down 1 MMBtu/MWh on Coal Units
|
$
|
(35
|
)
|
$
|
(99
|
)
|
$
|
(95
|
)
|
$
|
(86
|
)
|
$
|
—
|
|
|||||
|
(a)
|
Net coal capacity represents nominal summer net MW capacity of power generated as adjusted for the Company's ownership position excluding capacity from inactive/mothballed units, see Item 2 -
Properties
for units scheduled to be deactivated.
|
|
(b)
|
Forecasted generation dispatch output (MWh) based on forward price curves as of
December 31, 2016
, which is then divided by number of hours in a given year to arrive at MW capacity. The dispatch takes into account planned and unplanned outage assumptions.
|
|
(c)
|
Includes amounts under power sales contracts and natural gas hedges. The forward natural gas quantities are reflected in equivalent GWh based on forward market implied heat rate as of
December 31, 2016
, and then combined with power sales to arrive at equivalent GWh hedged. The coal sales include swaps and delta of options sold which is subject to change. For detailed information on the Company's hedging methodology through use of derivative instruments, see discussion in Item 15 -
Note 5
,
Accounting for Derivative Instruments and Hedging Activities
, to the Consolidated Financial Statements. Includes inter-segment sales from the Company's wholesale power generation business to the retail business.
|
|
(d)
|
Percentage hedged is based on total coal sales as described in (c) above divided by the forecasted coal capacity.
|
|
(e)
|
Represents U.S. coal sales, including energy revenue and demand charges, excluding revenues derived from capacity auctions.
|
Capacity and Other Contracted Revenue Sources
NRG's revenues and cash flows benefit from capacity/demand payments and other contracted revenue sources, originating from market clearing capacity prices, Resource Adequacy contracts, tolling arrangements, PPAs and other long-term contractual arrangements:
|
•
|
Capacity auctions
— The Company's largest sources of capacity revenues are capacity auctions in PJM, ISO-NE, and NYISO. Both ISO-NE and PJM operate a pay-for-performance model where capacity payments are modified based on real-time performance, where NRG's actual revenues will be the combination of revenues based on the cleared auction MWs plus the net of any over- and under-performance of NRG's fleet. In addition, MISO has an annual auction, known as the Planning Resource Auction, or PRA. The Gulf Coast assets situated in the MISO market may participate in this auction. Recent changes have made the decision to import external capacity into the PJM market more complicated, and the Company is evaluating the feasibility of continuing to import.
|
|
•
|
Resource Adequacy and bilateral contracts
— In California, there is a resource adequacy requirement that is satisfied through bilateral contracts. The Company's newer generation in California is contracted under long-term tolling agreements. Certain other sites in California have short-term tolling agreements or resource adequacy contracts. In addition, NRG earns demand payments from its long-term full-requirements load contracts with nine Louisiana distribution cooperatives, which expire in 2025. NRG also had full requirements contracts in PJM in 2016. Demand payments from the current long-term contracts are tied to summer peak demand and provide a mechanism for recovering a portion of the costs associated with new or changed environmental laws or regulations. In Texas, capacity and contracted revenues are through bilateral contracts with load serving entities.
|
|
•
|
Long-term PPAs
— Output from the majority of renewable energy assets and certain conventional energy plants is sold through long-term PPAs and tolling agreements to a single counterparty, which is often a utility or commercial customer.
|
17
Fuel Supply and Transportation
NRG's fuel requirements consist of various forms of fossil fuel (including coal, natural gas and oil) and nuclear fuel. The prices of fossil fuels are highly volatile. The Company obtains its fossil fuels from multiple suppliers and through multiple transporters. Although availability is generally not an issue, localized shortages, transportation availability, delays arising from extreme weather conditions and supplier financial stability issues can and do occur. The preceding factors related to the sources and availability of raw materials are fairly uniform across the Company's business segments and fuel products used.
Coal
— The Company believes it is adequately hedged, using forward coal supply agreements, for its domestic coal consumption for
2017
. NRG actively manages its coal requirements based on forecasted generation, market volatility and its inventory on site. As of
December 31, 2016
, NRG had purchased forward contracts to provide fuel for approximately 27% of the Company's expected requirements from
2017
through
2021
, including expected coal inventory draw down. NRG purchased approximately 25 million tons of coal in
2016
, of which 84% was Powder River Basin coal and lignite. For fuel transport, NRG has entered into various rail and barge transportation and rail car lease agreements with varying tenures that provide for most of the Company's transportation requirements of Powder River Basin coal for the next 5 years and for all of the Company's transportation requirements of Appalachian and Colorado coal for the next two years.
The following table shows the percentage of the Company's coal requirements from
2017
through 2021 that have been purchased forward as of
December 31, 2016
:
|
|
Percentage of
Company's
Requirement
(a)
|
|
|
2017
|
95
|
%
|
|
2018
|
41
|
%
|
|
2019
|
—
|
%
|
|
2020
|
—
|
%
|
|
2021
|
—
|
%
|
|
(a)
|
Includes expected coal inventory draw down.
|
Natural Gas
— NRG operates a fleet of mid-merit and peaking natural gas plants across all its U.S. wholesale regions. Fuel needs are managed on a spot basis, especially for peaking assets, as the Company does not believe it is prudent to forward purchase natural gas for these types of units, the dispatch of which is highly unpredictable. The Company contracts for natural gas storage services as well as natural gas transportation services to deliver natural gas when needed.
Nuclear Fuel
— STP's owners satisfy their fuel supply requirements by: (i) acquiring uranium concentrates and contracting for conversion of the uranium concentrates into uranium hexafluoride; (ii) contracting for enrichment of uranium hexafluoride; and (iii) contracting for fabrication of nuclear fuel assemblies. Through its proportionate participation in STPNOC, which is the NRC-licensed operator of STP and responsible for all aspects of fuel procurement, NRG is party to a number of long-term forward purchase contracts with many of the world's largest suppliers covering STP's requirements for uranium concentrates with only approximately 25% of STP's requirements outstanding for the duration of the operating license. Similarly, NRG is party to long-term contracts to procure STP's requirements for conversion and enrichment services and fuel fabrication for the life of the operating license.
Retail Operations
In
2016
, NRG's retail businesses sold electricity to residential, commercial and industrial consumers at either fixed, indexed or variable prices. Residential and smaller commercial consumers typically contract for terms ranging from one month to two years while industrial contracts are often between one year and five years in length. In
2016
, NRG's retail businesses sold approximately
61
TWhs of electricity. In any given year, the quantity of TWhs sold can be affected by weather, economic conditions and competition. The wholesale supply is typically purchased as the load is contracted from a combination of NRG's wholesale portfolio and other third parties. The ability to choose supply from the market or the Company's portfolio allows for an optimal combination to support and stabilize retail margins.
18
Operational Statistics
The following are industry statistics for the Company's fossil and nuclear plants, as defined by the NERC, and are more fully described below:
Annual Equivalent Availability Factor, or EAF
— Measures the percentage of maximum generation available over time as the fraction of net maximum generation that could be provided over a defined period of time after all types of outages and deratings, including seasonal deratings, are taken into account.
Net Heat Rate
— The net heat rate represents the total amount of fuel in BTU required to generate one net kWh provided.
Net Capacity Factor
— The net amount of electricity that a generating unit produces over a period of time divided by the net amount of electricity it could have produced if it had run at full power over that time period. The net amount of electricity produced is the total amount of electricity generated minus the amount of electricity used during generation.
The tables below present these performance metrics for the Company's U.S. power generation portfolio, including leased facilities and those accounted for through equity method investments, for the years ended
December 31, 2016
and
2015
:
|
|
Year Ended December 31, 2016
|
|||||||||||||
|
Fossil and Nuclear Plants
|
||||||||||||||
|
|
Net Owned
Capacity (MW)
|
Net Generation (MWh) (In thousands)
|
Annual Equivalent Availability Factor
|
Average Net Heat Rate BTU/kWh
|
Net Capacity
Factor
|
|||||||||
|
|
||||||||||||||
|
Generation
|
||||||||||||||
|
Gulf Coast
|
14,879
|
|
51,100
|
|
86.9
|
%
|
9,846
|
|
39.2
|
%
|
||||
|
East
|
21,386
|
|
35,423
|
|
79.5
|
|
10,397
|
|
18.4
|
|
||||
|
West
|
6,085
|
|
4,369
|
|
88.7
|
|
8,292
|
|
8.3
|
|
||||
|
Renewables
|
2,053
|
|
3,883
|
|
96.8
|
|
—
|
|
40.1
|
|
||||
|
NRG Yield
(a)
|
4,692
|
|
11,174
|
|
97.9
|
|
8,859
|
|
25.5
|
|
||||
|
|
Year Ended December 31, 2015
|
|||||||||||||
|
Fossil and Nuclear Plants
|
||||||||||||||
|
|
Net Owned
Capacity (MW)
|
Net Generation (MWh) (In thousands)
|
Annual Equivalent Availability Factor
|
Average Net Heat Rate BTU/kWh
|
Net Capacity
Factor
|
|||||||||
|
|
||||||||||||||
|
Generation
|
||||||||||||||
|
Gulf Coast
|
14,941
|
|
57,678
|
|
85.7
|
%
|
9,651
|
|
44.4
|
%
|
||||
|
East
|
23,579
|
|
46,286
|
|
84.0
|
|
10,477
|
|
21.6
|
|
||||
|
West
|
6,085
|
|
4,542
|
|
86.4
|
|
9,189
|
|
8.1
|
|
||||
|
Renewables
|
1,966
|
|
3,790
|
|
95.0
|
|
—
|
|
39.4
|
|
||||
|
NRG Yield
(a)
|
4,565
|
|
11,142
|
|
95.7
|
|
8,651
|
|
22.9
|
|
||||
|
(a)
|
NRG Yield includes thermal generation.
|
19
The generation performance by region for the three years ended
December 31, 2016
,
2015
, and
2014
, is shown below:
|
|
Net Generation
|
|||||||
|
|
2016
|
2015
|
2014
|
|||||
|
|
(In thousands of MWh)
|
|||||||
|
Generation
|
||||||||
|
Gulf Coast
|
|
|||||||
|
Coal
|
24,620
|
|
29,301
|
|
36,794
|
|
||
|
Gas
|
16,921
|
|
19,804
|
|
13,967
|
|
||
|
Nuclear
(a)
|
9,559
|
|
8,573
|
|
9,111
|
|
||
|
Total Gulf Coast
|
51,100
|
|
57,678
|
|
59,872
|
|
||
|
East
|
||||||||
|
Coal
|
24,614
|
|
36,245
|
|
42,939
|
|
||
|
Oil
|
1,432
|
|
1,583
|
|
1,269
|
|
||
|
Gas
|
9,377
|
|
8,458
|
|
6,983
|
|
||
|
Total East
|
35,423
|
|
46,286
|
|
51,191
|
|
||
|
West
|
||||||||
|
Gas
|
4,369
|
|
4,542
|
|
4,241
|
|
||
|
Total West
|
4,369
|
|
4,542
|
|
4,241
|
|
||
|
Renewables
|
||||||||
|
Solar
|
1,690
|
|
1,509
|
|
1,220
|
|
||
|
Wind
|
2,193
|
|
2,281
|
|
2,125
|
|
||
|
Total Renewables
|
3,883
|
|
3,790
|
|
3,345
|
|
||
|
NRG Yield
|
||||||||
|
Solar
|
1,226
|
|
1,212
|
|
1,250
|
|
||
|
Wind
|
6,010
|
|
5,199
|
|
3,427
|
|
||
|
Gas and Dual-Fuel
|
3,938
|
|
4,731
|
|
4,396
|
|
||
|
Total NRG Yield
(b)
|
11,174
|
|
11,142
|
|
9,073
|
|
||
|
(a)
|
MWh information reflects the Company's undivided interest in total MWh generated by STP.
|
|
(b)
|
Total NRG Yield includes thermal heating and chilled water generation.
|
20
Segment Review
The Company's segment structure reflects how management currently makes financial decisions and allocates resources. During January 2017, the Company's businesses are segregated as follows: Generation (previously named Generation/Business), which includes generation, international and BETM (previously part of Corporate); Retail (previously named Retail Mass) which includes Mass customers (previously NRG Home Retail), and Business Solutions, which includes C&I customers and other distributed and reliability products (previously in the Generation segment); Renewables (previously named NRG Renew), which includes solar and wind assets, excluding those in NRG Yield; NRG Yield; and corporate activities. The Company's corporate segment include residential solar (previously part of NRG Home) and electric vehicle services. During 2016, the Company began reporting the results of its residential solar business in its corporate segment and its international business in its Generation segment. Intersegment sales are accounted for at market. The Company has recast data from prior periods to reflect changes in reportable segments to conform to the current year presentation. NRG Yield includes certain of the Company's contracted generation assets. On September 1, 2016, NRG Yield acquired the remaining 51.05% interest in CVSR Holdco LLC, which indirectly owns the CVSR solar facility, from the Company. This acquisition was accounted for as transfers of entities under common control and accordingly, all historical periods have been recast to reflect this change.
Revenues
The following table contains a summary of NRG's operating revenues by segment for the years ended
December 31, 2016
,
2015
and
2014
, as discussed in Item 15 —
Note 18
,
Segment Reporting
,
to the consolidated financial statements. Refer to that footnote for additional financial information about NRG's business segments and geographic areas, including a profit measure and total assets. In addition, refer to Item 2
— Properties
, to the consolidated financial statements for information about facilities in each of NRG's business segments.
|
|
Year Ended December 31, 2016
|
||||||||||||||||||||||||||
|
|
Energy
Revenues
|
Capacity
Revenues
|
Retail
Revenues
|
Mark-to-
Market
Activities
|
Contract Amortization
|
Other
Revenues
(a)
|
Total
Operating
Revenues
(b)
|
||||||||||||||||||||
|
|
(In millions)
|
||||||||||||||||||||||||||
|
Generation
|
$
|
4,506
|
|
$
|
1,565
|
|
$
|
—
|
|
$
|
(787
|
)
|
$
|
15
|
|
$
|
380
|
|
$
|
5,679
|
|
||||||
|
Retail
|
2
|
|
82
|
|
6,239
|
|
(1
|
)
|
(1
|
)
|
15
|
|
6,336
|
|
|||||||||||||
|
Renewables
|
375
|
|
—
|
|
—
|
|
(6
|
)
|
(1
|
)
|
49
|
|
417
|
|
|||||||||||||
|
NRG Yield
|
575
|
|
345
|
|
—
|
|
—
|
|
(68
|
)
|
169
|
|
1,021
|
|
|||||||||||||
|
Corporate and Eliminations
(b)
|
(989
|
)
|
(22
|
)
|
35
|
|
(71
|
)
|
—
|
|
(55
|
)
|
(1,102
|
)
|
|||||||||||||
|
Total
|
$
|
4,469
|
|
$
|
1,970
|
|
$
|
6,274
|
|
$
|
(865
|
)
|
$
|
(55
|
)
|
$
|
558
|
|
$
|
12,351
|
|
||||||
|
(a)
|
Primarily consists of revenues generated by the Thermal business (NRG Yield segment), operation and maintenance revenues and unrealized trading activities, primarily at BETM (Generation segment).
|
|
(b)
|
Energy revenues include inter-segment sales primarily between Generation and Retail.
|
|
|
Year Ended December 31, 2015
|
||||||||||||||||||||||||||
|
|
Energy
Revenues
|
Capacity
Revenues
|
Retail
Revenues
|
Mark-to-
Market
Activities
|
Contract Amortization
|
Other
Revenues
(c)
|
Total
Operating
Revenues
(d)
|
||||||||||||||||||||
|
|
(In millions)
|
||||||||||||||||||||||||||
|
Generation
|
$
|
5,716
|
|
$
|
1,831
|
|
$
|
—
|
|
$
|
(254
|
)
|
$
|
15
|
|
$
|
238
|
|
$
|
7,546
|
|
||||||
|
Retail
|
—
|
|
116
|
|
6,778
|
|
4
|
|
—
|
|
16
|
|
6,914
|
|
|||||||||||||
|
Renewables
|
359
|
|
—
|
|
—
|
|
(3
|
)
|
(1
|
)
|
37
|
|
392
|
|
|||||||||||||
|
NRG Yield
|
489
|
|
341
|
|
—
|
|
(2
|
)
|
(54
|
)
|
179
|
|
953
|
|
|||||||||||||
|
Corporate and Eliminations
(d)
|
(1,070
|
)
|
(14
|
)
|
28
|
|
11
|
|
—
|
|
(86
|
)
|
(1,131
|
)
|
|||||||||||||
|
Total
|
$
|
5,494
|
|
$
|
2,274
|
|
$
|
6,806
|
|
$
|
(244
|
)
|
$
|
(40
|
)
|
$
|
384
|
|
$
|
14,674
|
|
||||||
|
(c)
|
Primarily consists of revenues generated by the Thermal business (NRG Yield segment), operation and maintenance revenues and unrealized trading activities, primarily at BETM (Generation segment).
|
|
(d)
|
Energy revenues include inter-segment sales primarily between Generation and Retail.
|
21
|
|
Year Ended December 31, 2014
|
||||||||||||||||||||||||||
|
|
Energy
Revenues
|
Capacity
Revenues
|
Retail
Revenues
(f)
|
Mark-to-
Market
Activities
|
Contract Amortization
|
Other
Revenues
(e)
|
Total
Operating
Revenues
(f)
|
||||||||||||||||||||
|
|
(In millions)
|
||||||||||||||||||||||||||
|
Generation
|
$
|
6,601
|
|
$
|
1,786
|
|
$
|
—
|
|
$
|
535
|
|
$
|
16
|
|
$
|
350
|
|
$
|
9,288
|
|
||||||
|
Retail
|
—
|
|
1
|
|
7,372
|
|
—
|
|
1
|
|
19
|
|
7,393
|
|
|||||||||||||
|
Renewables
|
302
|
|
1
|
|
—
|
|
4
|
|
(1
|
)
|
38
|
|
344
|
|
|||||||||||||
|
NRG Yield
|
352
|
|
321
|
|
—
|
|
2
|
|
(29
|
)
|
182
|
|
828
|
|
|||||||||||||
|
Corporate and Eliminations
(f)
|
(1,833
|
)
|
(22
|
)
|
4
|
|
(40
|
)
|
—
|
|
(94
|
)
|
(1,985
|
)
|
|||||||||||||
|
Total
|
$
|
5,422
|
|
$
|
2,087
|
|
$
|
7,376
|
|
$
|
501
|
|
$
|
(13
|
)
|
$
|
495
|
|
$
|
15,868
|
|
||||||
|
(e)
|
Primarily consists of revenues generated by the Thermal business (NRG Yield segment), operation and maintenance revenues and unrealized trading activities, primarily at BETM (Generation segment).
|
|
(f)
|
Energy revenues include inter-segment sales primarily between Generation and Retail.
|
Seasonality and Price Volatility
Annual and quarterly operating results of the Company's wholesale power generation segments can be significantly affected by weather, including wind resource availability, and energy commodity price volatility. Significant other events, such as the demand for natural gas, interruptions in fuel supply infrastructure and relative levels of hydroelectric capacity can increase seasonal fuel and power price volatility. The preceding factors related to seasonality and price volatility are fairly uniform across the Company's wholesale generation business segments.
The sale of electric power to retail customers is also a seasonal business with the demand for power generally peaking during the summer months. As a result, net working capital requirements for the Company's retail operations generally increase during summer months along with the higher revenues, and then decline during off-peak months. Weather may impact operating results and extreme weather conditions could materially affect results of operations. The rates charged to retail customers may be impacted by fluctuations in total power prices and market dynamics like the price of natural gas, transmission constraints, competitor actions, and changes in market heat rates.
Market Framework
Organized Energy Markets in CAISO, ERCOT, ISO-NE, MISO, NYISO and PJM
The majority of NRG's fleet operates in one of the organized energy markets, known as RTOs or ISOs. Each organized market administers day-ahead and real-time centralized bid-based energy and ancillary services markets pursuant to tariffs approved by FERC, or in the case of ERCOT, market rules approved by the PUCT. These tariffs and rules dictate how the energy markets operate, how market participants make bilateral sales with one another, and how entities with market-based rates are compensated. Established prices reflect the value of energy at the specific location and time it is delivered, which is known as the Locational Marginal Price, or LMP. Each market is subject to market mitigation measures designed to limit the exercise of locational market power. These market structures facilitate NRG's sale of power and capacity products at market-based rates.
Other than ERCOT, each of the ISO regions also operates a capacity or resource adequacy market that provides an opportunity for generating and demand response resources to earn revenues to offset their fixed costs that are not recovered in the energy and ancillary services markets. The ISOs are also responsible for transmission planning and operations.
Gulf Coast
NRG's Gulf Coast wholesale power generation business is principally located in the ERCOT and MISO markets. The ERCOT market is one of the nation's largest and historically fastest growing power markets. ERCOT is an energy only market, and has implemented market rule changes to provide pricing more reflective of higher energy value when operating reserves are scarce or constrained. NRG also operates generation assets that are principally located within MISO, participating in the MISO day-ahead and real-time energy and ancillary services markets. Additionally, MISO employs a one-year forward resource adequacy construct, in which capacity resources can compete for fixed cost recovery in the capacity auction. NRG continues to provide full requirements service to LSEs, including cooperatives and municipalities in the MISO region.
22
East
NRG's generation and demand response assets located in the East region of the U.S. are within the control areas of ISO-NE, NYISO and PJM. Each of the market regions in the East region provides for robust competition in the day-ahead and real-time energy and ancillary services markets. Additionally, the East region receives a significant portion of its revenues from capacity markets in ISO-NE, NYISO and PJM. PJM and ISO-NE use a three-year forward capacity auction construct, while NYISO uses a month-ahead capacity auction construct. Capacity market prices are sensitive to design parameters, as well as additions of new capacity. Both ISO-NE and PJM operate a pay-for-performance model where capacity payments are modified based on real-time generator performance. In such markets, NRG’s actual revenues will be the combination of cleared auction prices times the quantity of MWs cleared, plus the net of any over-performance “bonus payments” and any under-performance charges. In both markets, bidding rules allow for the incorporation of a risk premium into generator bids.
West
NRG operates a fleet of natural gas fired facilities located entirely within the CAISO footprint. The CAISO operates day-ahead and real-time locational markets for energy and ancillary services, while managing congestion primarily through nodal prices. The CAISO system facilitates NRG's sale of power, ancillary services and capacity products at market-based rates, either within the CAISO's centralized energy and ancillary service markets or bilaterally pursuant to tolling arrangements or other capacity sales with California's LSEs. The CPUC also determines capacity requirements for LSEs and for specified local areas utilizing inputs from the CAISO. Both the CAISO and CPUC rules require LSEs to contract with sufficient generation resources in order to maintain minimum levels of generation within defined local areas. Additionally, the CAISO has independent authority to contract with needed resources under certain circumstances, typically either when LSEs have failed to procure sufficient resources, or system conditions change unexpectedly. NRG is also pursuing Repowering projects at several southern California sites pursuant to long-term contracts.
Renewables
NRG operates a fleet of utility scale and distributed renewable generating assets across the U.S. Many states have implemented their own renewable portfolio standards requiring LSEs to provide a given percentage of their energy sales from renewable resources. As a result, a number of LSEs have entered into long-term PPAs with the NRG's utility scale renewable generating facilities. There are examples of states increasing their RPS from initially stated levels, such as California’s recently enacted 50% RPS by 2030 and Hawaii’s goal of achieving 100% renewables by 2045. In addition, given the cost competitiveness of renewables, LSEs are procuring renewables in excess of their RPS obligations. In December 2015, the U.S. Congress extended the 30% solar ITC so that projects which begin construction in 2016 through 2019 will continue to qualify for the 30% ITC. Projects beginning construction in 2020 and 2021 will be eligible for the ITC at the rates of 26% and 22%, respectively. The same legislation also extended the 10-year wind PTC for wind projects which begin construction in years 2016 through 2019. Wind projects which begin construction in the years 2017, 2018 and 2019 are eligible for PTC at 80%, 60% and 40% of the statutory rate per kWh, respectively.
Retail
NRG's retail businesses sell energy and related services as well as portable power and battery solutions to customers across the country. In most of the states that have introduced retail competition, NRG's retail businesses competitively offer retail power, natural gas, portable power or other value-enhancing services to end-use customers. Each retail choice state establishes its own retail competition laws and regulations, and the specific operational, licensing, and compliance requirements vary on a state-by-state basis. In the East markets, incumbent utilities currently provide default service and as a result typically serve a majority of residential customers. In Texas, NRG’s retail business activities are subject to standards and regulations adopted by the PUCT and ERCOT, including the requirement for retailers to be certified by the PUCT in order to contract with end-users to sell electricity. A majority of the retail load is in the ERCOT market region and is served by competitive retail suppliers, except certain areas that are served by municipal utilities and electric cooperatives that have not opted into competitive choice. Regulated terms and conditions of default service, as well as any movement to replace default service with competitive services, as is done in ERCOT, can affect customer participation in retail competition. The attractiveness of NRG's retail offerings in each state may be impacted by the rules, regulations, market structure and communication requirements from public utility commissions across the country.
23
Regulatory Matters
As owners of power plants and participants in wholesale and retail energy markets, certain NRG entities are subject to regulation by various federal and state government agencies. These include the CFTC, FERC, NRC and the PUCT, as well as other public utility commissions in certain states where NRG's generating, thermal, or distributed generation assets are located. In addition, NRG is subject to the market rules, procedures and protocols of the various ISO and RTO markets in which it participates. Likewise, certain NRG entities participating in the retail markets are subject to rules and regulations established by the states in which NRG entities are licensed to sell at retail. NRG must also comply with the mandatory reliability requirements imposed by NERC and the regional reliability entities in the regions where NRG operates.
NRG's operations within the ERCOT footprint are not subject to rate regulation by FERC, as they are deemed to operate solely within the ERCOT market and not in interstate commerce. These operations are subject to regulation by the PUCT, as well as to regulation by the NRC with respect to NRG's ownership interest in STP.
Federal Regulation
CFTC
The CFTC, among other things, regulates the trading of swaps, futures and many commodities under the Commodity Exchange Act, or CEA. Since 2010, there have been a number of reforms to the regulation of the derivatives markets, both in the U.S. and internationally. These regulations, and any further changes thereto, or adoption of additional regulations, including any regulations relating to position limits on futures and other derivatives or margin for derivatives, could negatively impact NRG’s ability to hedge its portfolio in an efficient, cost-effective manner by, among other things, potentially decreasing liquidity in the forward commodity and derivatives markets or limiting NRG’s ability to utilize non-cash collateral for derivatives transactions.
FERC
FERC, among other things, regulates the transmission and the wholesale sale by public utilities of electricity in interstate commerce under the authority of the FPA. Under existing regulations, FERC determines whether an entity owning a generation facility is an EWG as defined in the PUHCA. FERC also determines whether a generation facility meets the ownership and technical criteria of a QF under PURPA. The transmission of electric energy occurring wholly within ERCOT is not subject to FERC's rate jurisdiction under Sections 203 or 205 of the FPA. Each of NRG's non-ERCOT U.S. generating facilities either qualifies as a QF, or the subsidiary owning the facility qualifies as an EWG.
Public utilities are required to obtain FERC's acceptance, pursuant to Section 205 of the FPA, of their rate schedules for the wholesale sale of electricity. Generally all of NRG's non-QF generating and power marketing entities located outside of ERCOT make sales of electricity pursuant to market-based rates, as opposed to traditional cost-of-service regulated rates.
Current Administration and Changeover at FERC
— FERC is currently without a quorum and cannot issue orders in contested proceedings until a new Commissioner is appointed. FERC’s day-to-day work can continue through authority that has been delegated to FERC Staff. With a new administration and three vacant positions at FERC, NRG’s business may be affected because its generation fleet is subject to changes in FERC regulatory policy.
State Regulation
In Texas, NRG's operations within the ERCOT footprint are not subject to rate regulation by FERC, as they are deemed to operate solely within the ERCOT market and not in interstate commerce. These operations are subject to regulation by the PUCT, as well as to regulation by the NRC with respect to NRG's ownership interest in STP.
In New York, NRG's generation subsidiaries are electric corporations subject to "lightened" regulation by the NYSPSC. As such, the NYSPSC exercises its jurisdictional authority over certain non-rate aspects of the facilities, including safety, retirements, and the issuance of debt secured by recourse to NRG's generation assets located in New York. NRG currently has blanket authorization from the NYSPSC for the issuance of $15 billion of debt. Additionally, the NYSPSC has provided GenOn Bowline with a separate debt authorization of $1.488 billion.
In California, NRG's generation subsidiaries are subject to regulation by the CPUC with regard to certain non-rate aspects of the facilities, including health and safety, outage reporting and other aspects of the facilities' operations. Additionally, the competitiveness of many of NRG's new businesses depends on state competition and other policies.
24
Nuclear Operations
NRG South Texas LP is a 44% owner of a joint undivided interest in STP, the other owners of STP being the City of Austin, Texas (16%) and the City Public Service Board of San Antonio (40%). STP Nuclear Operating Company, or STPNOC, was founded by the then-owners in 1997 to operate the plant and it is the operator licensee and holder of the Facility Operating Licenses NPF-76 and NPF-80. STPNOC is a nonstock, nonprofit, nonmember corporation. Each owner of STP appoints a board member (and the three directors then choose a fourth director who also serves as the chief executive officer of STPNOC). A participation agreement establishes an owners' committee with voting interests consistent with ownership interests.
As a holder of an ownership interest in STP, NRG South Texas LP is an NRC licensee and is subject to NRC regulation. The NRC license gives the Company the right only to possess an interest in STP but not to operate it. As a possession-only licensee, i.e., non-operating co-owner, the NRC's regulation of NRG South Texas LP is primarily focused on the Company's ability to meet its financial and decommissioning funding assurance obligations. In connection with the NRC license, the Company and its subsidiaries have a support agreement to provide up to $120 million to support operations at STP.
Decommissioning Trusts
— Upon expiration of the operating licenses for the two generating units at STP, currently scheduled for 2027 and 2028, the co-owners of STP are required under federal law to decontaminate and decommission the STP facility. Under NRC regulations, a power reactor licensee generally must pre-fund the full amount of its estimated NRC decommissioning obligations unless it is a rate-regulated utility, or a state or municipal entity that sets its own rates, or has the benefit of a state-mandated non-bypassable charge available to periodically fund the decommissioning trust such that the trust, plus allowable earnings, will equal the estimated decommissioning obligations by the time the decommissioning is expected to begin.
NRG South Texas LP, through its 44% ownership interest, is the beneficiary of decommissioning trusts that have been established to provide funding for decontamination and decommissioning of STP. CenterPoint and AEP collect, through rates or other authorized charges to their electric utility customers, amounts designated for funding NRG South Texas LP's portion of the decommissioning of the facility. See also Item 15 —
Note 6
,
Nuclear Decommissioning Trust Fund
,
to the Consolidated Financial Statements for additional discussion.
In the event that the funds from the trusts are ultimately determined to be inadequate to decommission the STP facilities, the original owners of the Company's STP interests, CenterPoint and AEP, each will be required to collect, through their PUCT-authorized non-bypassable rates or other charges to customers, additional amounts required to fund NRG South Texas LP's obligations relating to the decommissioning of the facility. Following the completion of the decommissioning, if surplus funds remain in the decommissioning trusts, those excesses will be refunded to the respective rate payers of CenterPoint or AEP, or their successors.
STP License Amendment
— STP Unit 1 was operating with a single-cycle license amendment issued on December 11, 2015 after a control rod was determined to be inoperable following a scheduled refueling and maintenance outage. The approved license amendment to support STP Unit 1 operation with the inoperable control rod and the associated control rod drive shaft removed was granted by the NRC on December 21, 2016.
25
Regional Regulatory Developments
NRG is affected by rule/tariff changes that occur in the ISO regions. For further discussion on regulatory developments see Item 15 —
Note 23
,
Regulatory Matters
,
to the Consolidated Financial Statements.
East Region
PJM
2019/2020 PJM Auction Results
— On May 24, 2016, PJM announced the results of its 2019/2020 base residual auction. NRG cleared approximately 11,155 MW of Capacity Performance product and 371 MW of Base Capacity product in the 2019/2020 base residual auction. NRG’s expected capacity revenues from the base residual auction for the 2019/2020 delivery year are approximately $569 million.
The table below provides a detailed description of NRG’s 2019/2020 base residual auction results from May 24, 2016:
|
|
|
Base Capacity Product
|
|
Capacity Performance Product
|
||||||||
|
Zone
|
|
Cleared Capacity (MW)
(a)(b)
|
|
Price
($/MW-day)
|
|
Cleared Capacity (MW)
(a)(b)
|
|
Price
($/MW-day)
|
||||
|
COMED
|
|
65
|
$
|
182.77
|
|
3,738
|
$
|
202.77
|
|
|||
|
EMAAC
|
|
103
|
$
|
99.77
|
|
895
|
$
|
119.77
|
|
|||
|
MAAC
|
|
10
|
$
|
80.00
|
|
5,972
|
$
|
100.00
|
|
|||
|
RTO
|
193
|
$
|
80.00
|
|
550
|
$
|
100.00
|
|
||||
|
Total
|
|
371
|
|
|
|
11,155
|
|
|
||||
(a) Includes imports. Does not include capacity sold by NRG Curtailment Specialists. Excludes cleared capacity related to Aurora and Rockford, the sales of which were completed on July 12, 2016.
(b) Includes GenOn.
PJM Capacity Performance Appeals
— On or about July 8, 2016, four petitions were filed at the D.C. Circuit seeking review of the FERC orders approving PJM’s Capacity Performance revisions to its forward capacity market after motions for rehearing at FERC were denied on May 10, 2016. NRG intervened in these matters on July 29, 2016. On December 9, 2016, NRG, along with other generators and industry trade groups, filed a joint brief in support of FERC's decision. Briefing is complete and oral argument occurred in February 2017. This case governs capacity revenues already received by NRG, as well as the revenues for forward periods.
PJM Seasonal Capacity Proceeding
— On November 17, 2016, PJM proposed to enhance the ability of capacity storage resources, intermittent resources, demand response, energy efficiency, and environmentally limited resources, or collectively the seasonal capacity performance resources, to participate in the BRA and qualify as a resource providing the capacity performance product through aggregation. NRG filed comments specifically supporting PJM’s proposal to modify the aggregation rules to allow seasonal capacity resources to aggregate across LDAs and to allow aggregations through RPM auctions. On January 23, 2017, PJM amended its proposal to address questions from FERC. The outcome of this proceeding could have a material impact on future PJM capacity prices.
Complaints Related to Extension of Base Capacity
—
In 2015, FERC approved changes to PJM’s capacity market, which included moving from the Base Capacity product to the higher performance Capacity Performance product over the course of a five year transition. Under this transition, as of the May 2017 BRA, the Base Capacity product will no longer be available. Several parties have filed complaints at FERC seeking to maintain the RPM Base Capacity product for at least one more delivery year or until such time as PJM develops a model for seasonal resources to participate. If the transition is delayed, capacity prices could be materially impacted. The matters are pending at FERC.
MOPR Revisions
— On May 2, 2013, FERC accepted PJM's proposal to substantially revise its Minimum Offer Price Rule, or MOPR. Among other things, FERC approved the portions of the PJM proposal that exempt many new entrants from demonstrating that their proposed projects are economic, as well as providing a similar exemption for public power entities and certain self-supply entities. This exemption is subject to certain conditions designed to limit the financial incentive of such entities to suppress market prices. On June 3, 2013, NRG filed a request for rehearing of the FERC order and subsequently protested the manner in which PJM proposed to implement the FERC order. On October 15, 2015, FERC denied the requests for rehearing and accepted PJM’s compliance filing. NRG, along with other parties, filed a petition for review of FERC's decision with the D.C. Circuit. Briefing is complete. The case is pending at the D.C. Circuit.
26
Illinois Zero Emission Credit Legislation and Related PJM Complaint
—
Pursuant to legislation in Illinois
,
the Illinois Power Agency is to procure contracts for Zero Emission Credits, or ZECs, through a process that would take into account environmental benefits, including the preservation of zero emission facilities. The procurement would be subject to review by the Illinois Commerce Commission. These ZECs are out-of-market subsidies that threaten to artificially suppress prices in the PJM auctions. On February 14, 2017, NRG, along with other companies, filed a complaint in the District Court for the Northern District of Illinois; another plaintiff group filed a similar complaint on the same day.
As a result of the ZEC scheme adopted by the Illinois legislature and to address the effect of subsidies set to be paid to Illinois to certain nuclear units, on January 9, 2017, NRG and other generators and its trade association filed a joint amendment to the pending complaint seeking to apply the MOPR in the capacity market to existing resources that receive out-of-market subsidies. This amendment is to the March 21, 2016 complaint filed by NRG and other companies related to ratepayer-funded subsidies approved by the PUCO.
Midwest Generation, LLC Reactive Power Compensation
— On June 21, 2016, FERC issued an order directing MWG to make a compliance filing setting forth refunds for payments received in violation of its 2004 reactive power settlement or to show cause why it has not violated the settlement. FERC also ordered MWG to revise its tariff to reflect the costs of units continuing to provide reactive power or show cause why it should not be required to do so. The Commission also referred this matter to the Commission's Office of Enforcement. On June 30, 2016, MWG filed a revised tariff, and on July 22, 2016, MWG made a compliance filing as ordered by FERC. On October 13, 2016, FERC found that MWG should only be liable for refunds that accrued after bankruptcy on April 1, 2014 through June 30, 2016. MWG is currently in settlement discussions regarding its revised reactive power schedule. The matter is still pending at the Commission's Office of Enforcement.
New England
2020/2021 ISO-NE Auction Results
— On February 6, 2017, ISO-NE announced the results of its 2020/2021 forward capacity auction. NRG cleared 2,641 MW at $5.297 KW per month providing expected annual capacity revenues of $167.9 million. The 333 MWs at Canal Unit 3, which previously cleared the tenth forward capacity auction with a seven year price lock at a price of $7.17 KW per month for the 2020/2021 deliverability year, are excluded from these results.
Peak Energy Rent Adjustment Complaint
— On September 30, 2016, the New England Power Generators Association, or NEPGA, filed a complaint against ISO-NE asking FERC to find the Peak Energy Rent, or PER, unjust and unreasonable. On January 9, 2017, FERC granted NEPGA’s complaint requiring a change to how the PER strike price is calculated and determine any refunds during the time period provided for in the complaint. The first FERC-ordered settlement conference occurred on February 16, 2017.
Performance Incentive Proposal
— On January 17, 2014, ISO-NE filed at FERC to revise its forward capacity market, or FCM, by making a resource’s forward capacity market compensation dependent on resource output during short intervals of operating reserve scarcity. The ISO-NE proposal would replace the existing shortage event penalty structure with a new performance incentive mechanism, resulting in capacity payments to resources that would be the combination of two components: (1) a base capacity payment and (2) a performance payment or charge. The performance payment or charge would be entirely dependent upon the resource’s delivery of energy or operating reserves during scarcity conditions, and could be larger than the base payment.
On May 30, 2014, FERC found that most of the provisions in the ISO-NE proposal, with modifications, together with an increase to the reserve constraint penalty factors, provided a just and reasonable structure. FERC instituted a proceeding for further hearings and required ISO-NE to make a compliance filing to modify its proposal and adopt the increases to the reserve constraint penalty factors. FERC denied rehearing. The NEPGA filed a petition for review of FERC's decision with the D.C. Circuit. Briefing is complete.
New York
Dunkirk Power Reliability Service and Natural Gas Addition
—
On February 13, 2014, Dunkirk Power LLC and National Grid agreed to a term sheet for a 10-year agreement to govern the addition of natural gas-burning capabilities to the Dunkirk facility. This term sheet, known as the DNG Agreement Term Sheet, was approved by the NYSPSC on June 13, 2014. On February 27, 2015, Entergy filed a complaint in the U.S. District Court for the Northern District of New York alleging that the NYSPSC’s approval of the DNG Agreement Term Sheet impermissibly interfered with FERC’s exclusive jurisdiction over the wholesale markets. Entergy moved to withdraw the lawsuit, and on November 18, 2016, the U.S. District Court dismissed the lawsuit with prejudice.
27
New York Clean Energy Standard and Zero Emission Credit Nuclear Bailout
— On August 1, 2016, the NYSPSC issued its Clean Energy Standard, or CES, order. The CES order included three main components: (i) a commitment to move New York to 50% renewables by 2030; (ii) new renewable energy credit pricing for both new and existing renewable facilities; and (iii) a ZEC that would provide more than $7.6 billion over 12 years in out-of-market subsidy payments to certain selected nuclear generating units in the state. The stated purpose of the ZECs is to keep nuclear units running even though they would be uneconomic and likely retire if they received compensation only from the FERC-jurisdictional wholesale power market. The ZECs would have the effect of suppressing wholesale market prices and interfere with the wholesale market. On October 19, 2016, NRG, along with other entities, filed a complaint in the U.S. District Court for the Southern District of New York, challenging the validity of the NYSPSC action and the ZEC program. On December 9, 2016, Exelon, the NYSPSC and other parties filed a motion to dismiss the complaint. On January 6, 2017, NRG, along with other parties, filed an opposition to the motions to dismiss. The motions are pending before the U.S. District Court.
Independent Power Producers of New York (IPPNY) Complaint
— On January 9, 2017, EPSA requested FERC to promptly direct the NYISO to file tariff provisions to address pending market concerns related to out of market payments to existing generation in the NYISO. This request was prompted by the ZEC program initiated by the NYSPSC. This request follows IPPNY’s complaint at FERC against the NYISO on May 10, 2013, as amended on March 25, 2014. The generators asked FERC to direct the NYISO to require that capacity from existing generation resources that would have exited the market but for out-of-market payments. Failure to implement buyer-side mitigation measures could result in uneconomic entry, which artificially decreases capacity prices below competitive market levels.
New York Public Service Commission Retail Energy Market Proceedings
— On February 23, 2016, the NYSPSC issued what it refers to as its “Retail Reset” order, or Reset Order, in docket 12-M-0476
et al
. Among other things, the Reset Order instituted a price cap on energy supply offers and required many retail providers to seek affirmative consent from certain retail customers over a very short period of time to retain those customers. Retail suppliers who cannot meet these conditions will be required to return their customers to energy supply service provided by the local utility. On July 25, 2016, the New York Supreme Court vacated part of the Reset Order on procedural grounds and remanded the matter to the NYSPSC for further consideration. Additionally, the Court affirmed the NYSPSC’s authority to regulate Energy Service Companies prices. The matter is now on appeal before the Supreme Court of New York, Appellate Division. On December 2, 2016 in the same docket, the NYSPSC issued notice of an evidentiary proceeding and collaborative process to determine the future structure of the retail energy market in New York. The outcome of this evidentiary and collaborative process, combined with the outcome of the appeal of the Reset Order, could affect the viability of the New York retail energy market.
Gulf Coast Region
ERCOT
Greens Bayou Unit 5 RMR Status
— On March 29, 2016, NRG filed notice with ERCOT of its intent to mothball Greens Bayou Unit 5. On May 27, 2016, ERCOT made a final determination that the unit is needed for reliability must-run, or RMR, service to address potential operational contingencies. On June 14, 2016, the ERCOT Board confirmed ERCOT’s determination and approved a two-year RMR agreement, effective June 1, 2016 through June 30, 2018; provided, however, ERCOT may terminate the RMR agreement at any time upon 90 days' notice. ERCOT has a standard form contract that provides for recovery of the operating costs of the unit, together with additional performance metrics and incentives. The estimated budget for the unit is $58 million for the contract period, which amount does not include any incentives. Under the RMR agreement, the unit is only available to ERCOT during the months of June through September. On July 13, 2016, ERCOT issued a request for proposals for alternatives to the RMR agreement. No alternatives were selected by ERCOT. As a result of rule changes, ERCOT determined that the RMR agreement is only needed until a new 1,100 MW combined cycle plant at Colorado Bend Generating Station comes on line, expected in mid-2017.
MISO
Revisions to MISO Capacity Construct
— On November 20, 2015, FERC issued a final order denying NRG’s request for rehearing of a 2012 FERC order approving the MISO capacity construct. NRG filed a petition for review of FERC’s decision with the D.C. Circuit on the grounds that FERC’s order denies merchant generators in MISO’s footprint any reasonable opportunity to recover their fixed costs. On November 2, 2016, NRG filed its initial brief and briefing continues. The eventual outcome of this proceeding could impact MISO’s attempts to redesign its capacity markets and thereby affect the value of NRG’s uncontracted assets within the MISO footprint.
28
MISO Forward Capacity Market Design for Retail Choice States
— MISO staff has proposed revisions to its market design by implementing a three-year Forward Resource Auction for Illinois and the portion of Michigan with Retail Choice Load with a Sloped Demand Curve. On November 1, 2016, MISO filed its proposal with FERC. On December 14, 2016, NRG filed a protest to MISO’s proposal. On February 2, 2017, FERC rejected MISO’s proposal.
West Region
CAISO
Carlsbad Energy Center
— On May 21, 2015, the CPUC approved the Carlsbad Energy Center PPTA for a nominally rated 500 MW five unit natural gas peaking plant. On December 7, 2015, three parties filed two petitions for a writ of review with the California Court of Appeal appealing the CPUC's decision. On November 30, 2016, the California Court of Appeals issued a decision affirming the CPUC's approval of the PPTA. The period in which to seek review of that decision in the California Supreme Court has passed, and the CPUC’s decision is now final.
Puente Power Project
— On May 26, 2016, the CPUC approved the resource adequacy purchase agreement, or RAPA, between SCE and NRG for the construction of the 262 MW natural gas peaking Puente Power Project. On July 1, 2016, four different parties sought rehearing of the CPUC's approval of the RAPA. On December 1, 2016, the CPUC affirmed approval of the RAPA in a rehearing decision. On January 4, 2017, a petition for writ of review was filed in the California Court of Appeal seeking to reverse the CPUC's approval of the RAPA.
Environmental Matters
NRG is subject to a wide range of environmental laws in the development, construction, ownership and operation of projects. These laws generally require that governmental permits and approvals be obtained before construction and during operation of power plants. NRG is also subject to laws regarding the protection of wildlife, including migratory birds, eagles and threatened and endangered species. New requirements regarding GHGs, combustion byproducts, water discharge and use, and threatened and endangered species have been put in place in recent years. Future laws may require the addition of emissions controls or other environmental controls or impose restrictions on the operations of the Company's facilities, which could have a material effect on the Company's operations. Complying with environmental laws involves significant capital and operating expenses. NRG decides to invest capital for environmental controls based on the relative certainty of the requirements, an evaluation of compliance options, and the expected economic returns on capital.
A number of regulations with the potential to affect the Company and its facilities are in development, under review or have been recently promulgated by the EPA, including ESPS/NSPS for GHGs, ash disposal requirements, NAAQS revisions and implementation and effluent guidelines. NRG is currently reviewing the outcome and any resulting impact of recently promulgated regulations and cannot fully predict such impact until legal challenges are resolved and the new presidential administration decides how to proceed with some of the more controversial regulations. Federal and state environmental laws generally have become more stringent over time, although this trend could change in the near term with respect to federal laws under the new U.S. presidential administration.
Air
The CAA and the resulting regulations (as well as similar state and local requirements) have the potential to affect air emissions, operating practices and pollution control equipment required at power plants. Under the CAA, the EPA sets NAAQS for certain pollutants including SO
2
, ozone, and PM
2.5
. Many of the Company's facilities are located in or near areas that are classified by the EPA as not achieving certain NAAQS (non-attainment areas). The relevant NAAQS have historically become more stringent. The Company maintains a comprehensive compliance strategy to address continuing and new requirements. Complying with increasingly stringent NAAQS could require the installation of additional emissions control equipment at some NRG facilities or retiring of units if installing such controls is not economical. Significant changes to air regulatory programs affecting the Company are described below.
Ozone NAAQS
— On October 26, 2015, the EPA promulgated a rule that reduces the ozone NAAQS to 0.070 ppm. If it survives legal challenges, this more stringent NAAQS will obligate the states to develop plans to reduce NO
x
(an ozone precursor), which could affect some of the Company's units.
29
Cross-State Air Pollution Rule
— The EPA finalized CSAPR in 2011, which was intended to replace CAIR in January 2012, to address certain states' obligations to reduce emissions so that downwind states can achieve federal air quality standards. In December 2011, the D.C. Circuit stayed the implementation of CSAPR and then vacated CSAPR in August 2012 but kept CAIR in place until the EPA could replace it. In April 2014, the U.S. Supreme Court reversed and remanded the D.C. Circuit's decision. In October 2014, the D.C. Circuit lifted the stay of CSAPR. In response, the EPA in November 2014 amended the CSAPR compliance dates. Accordingly, CSAPR replaced CAIR on January 1, 2015. On July 28, 2015, the D.C. Circuit held that the EPA had exceeded its authority by requiring certain reductions that were not necessary for downwind states to achieve federal standards. Although the D.C. Circuit kept the rule in place, the court ordered the EPA to revise the Phase 2 (or 2017) (i) SO
2
budgets for four states including Texas and (ii) ozone-season NO
x
budgets for 11 states including Maryland, New Jersey, New York, Ohio, Pennsylvania and Texas. On October 26, 2016, the EPA finalized the CSAPR Update Rule, which reduces future NO
x
allocations and discounts the current banked allowances to account for the more stringent 2008 Ozone NAAQS and to address the D.C. Circuit's July 2015 decision. This rule has been challenged in the D.C. Circuit. The Company believes its investment in pollution controls and cleaner technologies leave the fleet well-positioned for compliance.
MATS
— In February 2012, the EPA promulgated standards (the MATS rule) to control emissions of HAPs from coal and oil-fired electric generating units. The rule established limits for mercury, non-mercury metals, certain organics and acid gases, which had to be met beginning in April 2015 (with some units getting a 1-year extension). In June 2015, the U.S. Supreme Court issued a decision in the case of
Michigan v. EPA
, and held that the EPA unreasonably refused to consider costs when it determined that it was "appropriate and necessary" to regulate HAPs emitted by electric generating units. The U.S. Supreme Court did not vacate the MATS rule but rather remanded it to the D.C. Circuit for further proceedings. In December 2015, the D.C. Circuit remanded the MATS rule to the EPA without vacatur. On April 25, 2016, the EPA released a supplemental finding that the benefits of this regulation outweigh the costs to address the U.S. Supreme Court's ruling that the EPA had not properly considered costs. This finding has been challenged in the D.C. Circuit. While NRG cannot predict the final outcome of this rulemaking, NRG believes that because it has already invested in pollution controls and cleaner technologies, the fleet is well-positioned to comply with the MATS rule.
Clean Power Plan
— The attention in recent years on GHG emissions has resulted in federal regulations and state legislative and regulatory action. In October 2015, the EPA finalized the Clean Power Plan, or CPP, addressing GHG emissions from existing EGUs. On February 9, 2016, the U.S. Supreme Court stayed the CPP. The D.C. Circuit, sitting
en banc
, heard oral argument on the legal challenges to the CPP in September 2016. Due to the ongoing litigation and the potential impact of the new U.S. presidential administration, the Company believes the CPP is not likely to survive.
30
CO
2
Emissions
— NRG emits CO
2
when generating electricity at most of its facilities. The graphs presented below illustrate NRG's U.S. Scope 1 emissions of CO
2e
for 2014, 2015 and 2016. The percentage of Scope 1 emissions covered under emissions-limiting regulations is 18% and the percentage of Scope 1 emissions covered under emission-reporting regulations is 82%. NRG anticipates reductions in its future emissions profile as the Company modernizes the fleet through repowering, improves generation efficiencies, and explores methods to capture CO
2
. From 2015 to 2016, the Company's CO
2e
emissions decreased from 86 million metric tons to approximately 66 million metric tons, representing a 19% reduction year over year. Factors leading to the decreased emissions include reductions in fleetwide annual net generation due to an overall decrease in market demand and a market-driven shift towards increased generation from natural gas over coal. The Company's goal is to reduce its total U.S. Scope 1, 2 and 3 CO
2e
emissions by 50% by 2030, and 90% by 2050, using 2014 as a baseline.
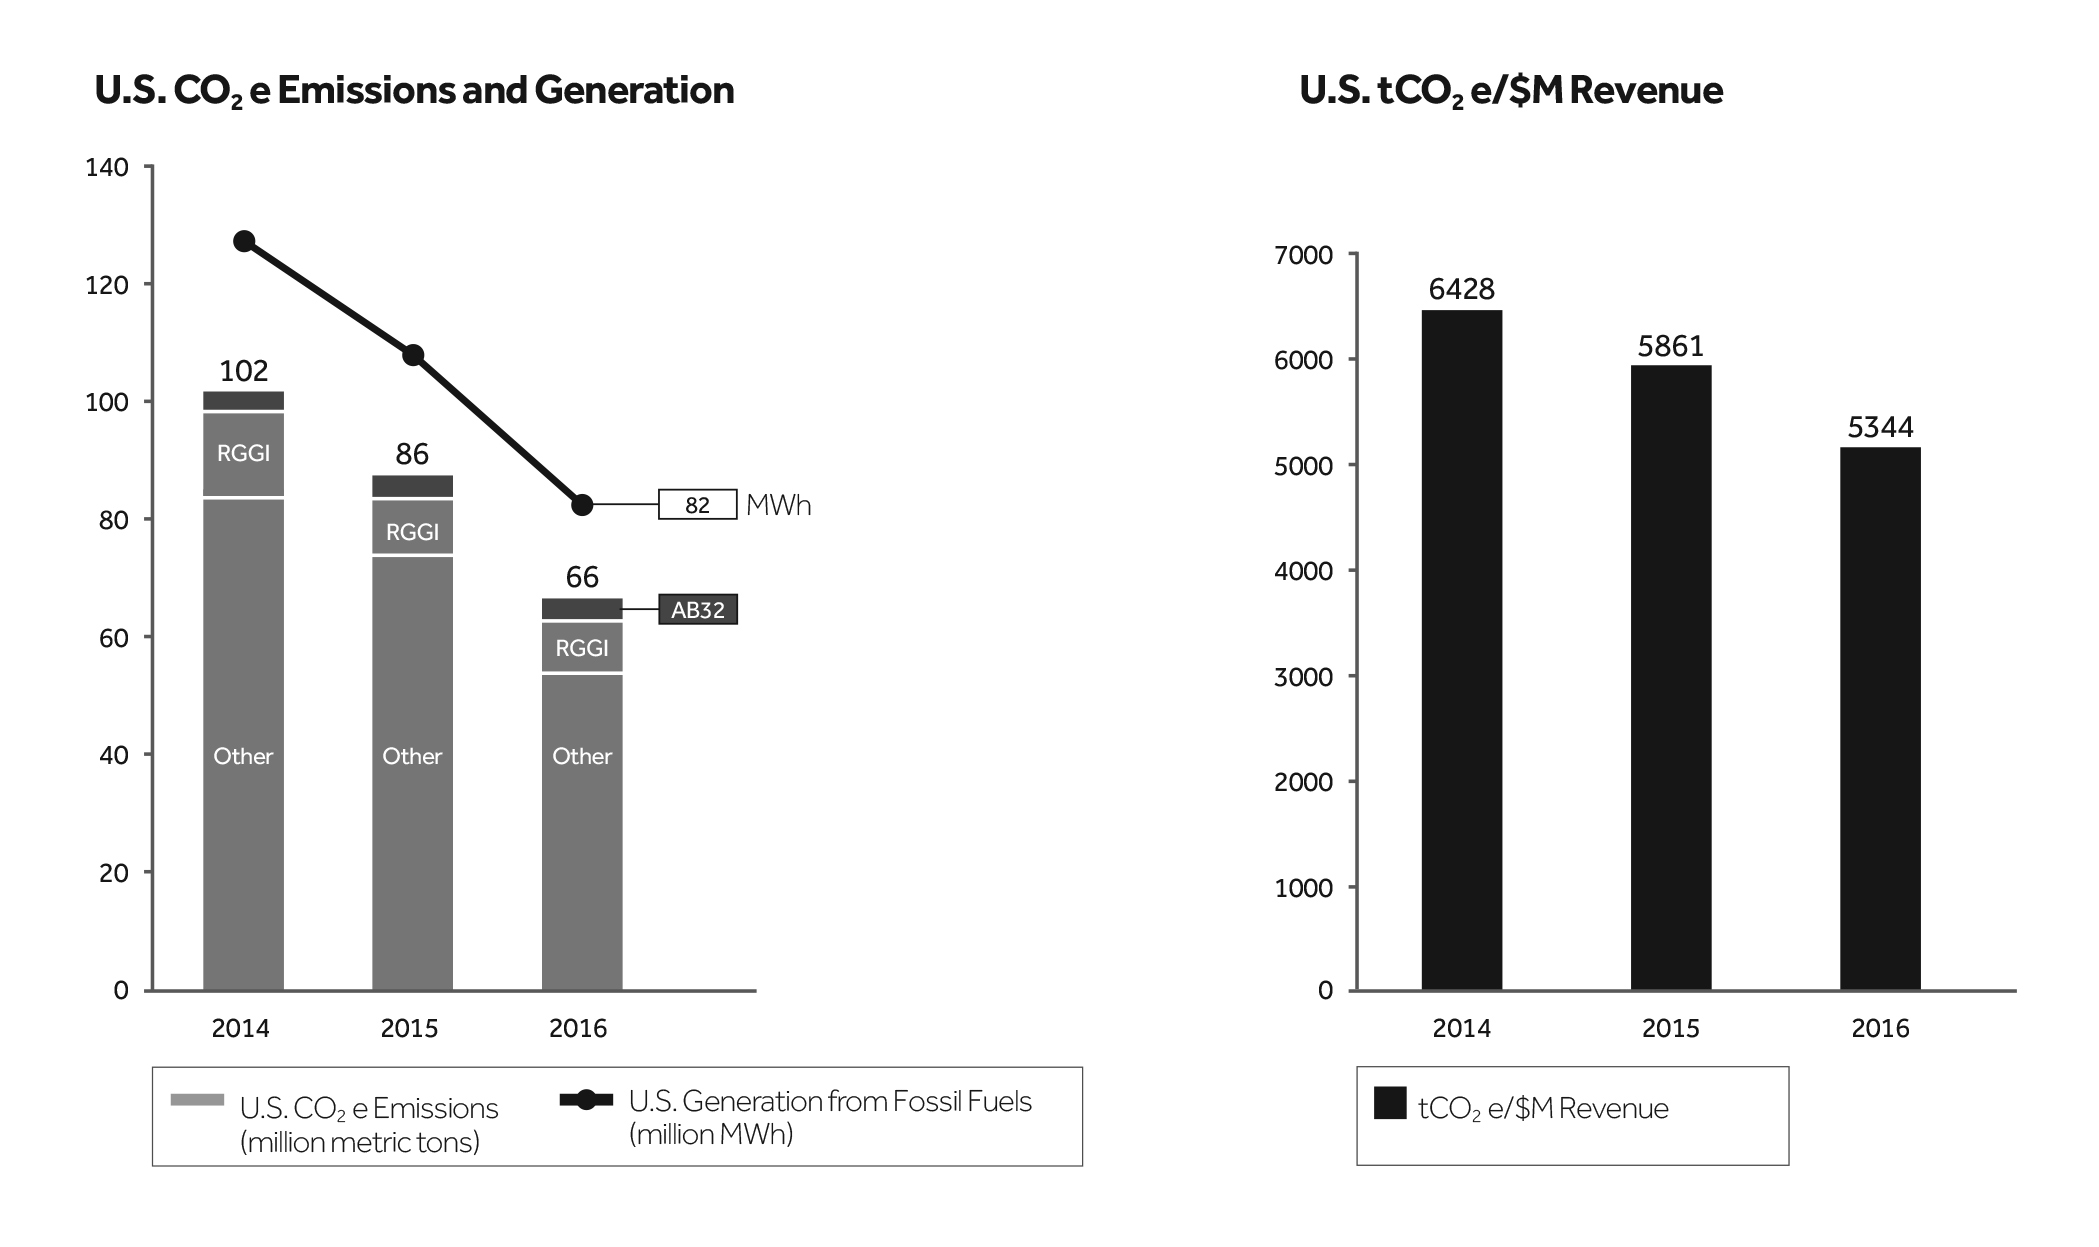
The effects from federal, regional or state regulation of GHGs on the Company's financial performance will depend on a number of factors, including the outcome of the legal challenges, regulatory design, level of GHG reductions, the availability of offsets, actions of the new U.S. presidential administration, and the extent to which NRG would be entitled to receive CO
2
emissions credits without having to purchase them in an auction or on the open market. Thereafter, under any such legislation or regulation, the impact on NRG would depend on the Company's level of success in developing and deploying low and no carbon technologies.
Byproducts, Wastes, Hazardous Materials and Contamination
In April 2015, the EPA finalized the rule regulating byproducts of coal combustion (e.g., ash and gypsum) as solid wastes under the RCRA. The Company has evaluated the impact of the new rule on the Company's consolidated financial position, results of operations, or cash flows and has accrued its environmental and asset retirement obligations under the rule based on current estimates as of December 31, 2016.
31
Domestic Site Remediation Matters
Under certain federal, state and local environmental laws, a current or previous owner or operator of any facility, including an electric generating facility, may be required to investigate and remediate releases or threatened releases of hazardous or toxic substances or petroleum products at the facility. NRG may be responsible for property damage, personal injury and investigation and remediation costs incurred by a party in connection with hazardous material releases or threatened releases. These laws, including the Comprehensive Environmental Response, Compensation and Liability Act of 1980 as amended by the Superfund Amendments and Reauthorization Act of 1986, or SARA, impose liability without regard to whether the owner knew of or caused the presence of the hazardous substances, and the courts have interpreted liability under such laws to be strict (without fault) and joint and several. Cleanup obligations can often be triggered during the closure or decommissioning of a facility, in addition to spills during its operations. Further discussions of affected NRG sites can be found in Item 15 —
Note 24
,
Environmental Matters
, to the Consolidated Financial Statements.
Nuclear Waste
— The federal government's program to construct a nuclear waste repository at Yucca Mountain, Nevada was discontinued in 2010. Since 1998, the U.S. DOE has been in default of the federal government's obligations to begin accepting spent nuclear fuel, or SNF, and high-level radioactive waste, or HLW, under the U.S. Nuclear Waste Policy Act of 1982, or the Nuclear Waste Policy Act. Owners of nuclear plants, including the owners of STP, had been required to enter into contracts setting out the obligations of the owners and the U.S. DOE, including the fees to be paid by the owners for the U.S. DOE's services to license a spent fuel repository. Effective May 16, 2014, the U.S. DOE stopped collecting the fees.
On February 5, 2013, STPNOC entered into a settlement agreement with the U.S. DOE for payment of damages relating to the U.S. DOE's failure to accept SNF and HLW under the Nuclear Waste Policy Act through December 31, 2013, which was extended through an addendum dated January 24, 2014, to December 31, 2016. On December 12, 2016, STPNOC received the federal government's offer of another three-year extension of payment for continued failure to accept SNF and HLW. The proposal has been reviewed for adequacy and, with advice of counsel, was accepted. There are no facilities for the reprocessing or permanent disposal of SNF currently in operation in the U.S., nor has the NRC licensed any such facilities. STPNOC currently stores all SNF generated by its nuclear generating facilities in on-site storage pools. Since STPNOC's SNF storage pools do not have sufficient storage capacity for the life of the units, STPNOC is proceeding to construct dry cask storage capability on-site. STPNOC plans to continue to assert claims against the U.S. DOE for damages relating to the U.S. DOE's failure to accept SNF and HLW.
Under the federal Low-Level Radioactive Waste Policy Act of 1980, as amended, the state of Texas is required to provide, either on its own or jointly with other states in a compact, for the disposal of all low-level radioactive waste generated within the state. STP's warehouse capacity is adequate for on-site storage until a site in Andrews County, Texas becomes fully operational.
Water
Clean Water Act
—
The Company is required under the CWA to comply with intake and discharge requirements, requirements for technological controls and operating practices. As with air quality regulations, federal and state water regulations have become more stringent and imposed new requirements.
Once Through Cooling Regulation
— In August 2014, EPA finalized the regulation regarding the use of water for once through cooling at existing facilities to address impingement and entrainment concerns. NRG anticipates that more stringent requirements will be incorporated into some of its water discharge permits over the next several years as NPDES permits are renewed.
Effluent Limitations Guidelines
— In November 2015, the EPA revised the Effluent Limitations Guidelines for Steam Electric Generating Facilities, which will impose more stringent requirements (as individual permits are renewed) for wastewater streams from flue gas desulfurization, fly ash, bottom ash, and flue gas mercury control. The Company estimates that it would cost approximately $200 million over the next eight years (the majority of the cost would be incurred after 2019) to comply with this rule at 11 coal-fired plants. This regulation has been challenged and is subject to legal uncertainty. The change in U.S. presidential administration increases the likelihood that the legal challenges will succeed. The Company decides to invest capital for environmental controls based on: the certainty of regulations; evaluation of different technologies; options to convert to gas; and the expected economic returns on the capital. Over the next several years, the Company will decide whether to proceed with these investments at each of the plants as permits are renewed based on, among other things, the legal certainty of the regulation and market conditions at that time.
32
Regional Environmental Developments
East Region
New Source Review
— The EPA and various states have been investigating compliance of electric generating facilities with the pre-construction permitting requirements of the CAA known as “new source review,” or NSR. In 2007, Midwest Generation received an NOV from the EPA alleging that past work at Crawford, Fisk, Joliet, Powerton, Waukegan and Will County generating stations violated NSR and other regulations. These alleged violations are the subject of litigation described in Item 15 — Note 22,
Commitments and Contingencies.
In January 2009, GenOn received an NOV from the EPA alleging that past work at Keystone, Portland and Shawville generating stations violated regulations regarding NSR. In June 2011, GenOn received an NOV from the EPA alleging that past work at Avon Lake and Niles generating stations violated NSR. In December 2007, the NJDEP filed suit alleging that NSR violations occurred at the Portland generating station, which suit was resolved pursuant to a July 2013 Consent Decree. Additionally, in April 2013, the Connecticut Department of Energy and Environmental Protection issued four NOVs alleging that past work at oil-fired combustion turbines at the Torrington Terminal, Franklin, Branford and Middletown generating stations violated regulations regarding NSR.
Burton Island Old Ash Landfill
— In January 2006, NRG's Indian River Power LLC was notified that it may be a potentially responsible party with respect to Burton Island Old Ash Landfill, a historic captive landfill located at the Indian River facility. On October 1, 2007, NRG signed an agreement with DNREC to investigate the site through the Voluntary Clean-up Program, or the VCP. On February 4, 2008, DNREC issued findings that no further action was required in relation to surface water and that a previously planned shoreline stabilization project would satisfactorily address shoreline erosion. The landfill itself required a Remedial Investigation and Feasibility Study to determine the type and scope of any additional required work. DNREC approved the Feasibility Study in December 2012. In January 2013, DNREC proposed a remediation plan based on the Feasibility Study. The remediation plan was approved in October 2013. In December 2015, DNREC approved the Company's remediation design and the Company's Long Term Stewardship Plan. The cost of completing the work required by the approved remediation plan is consistent with amounts budgeted in early 2016 and on track for completion in 2017. The estimated cost to comply with the Long-Term Stewardship Plan was added to the liability in December 2016.
In addition to the VCP, on May 29, 2008, DNREC requested that NRG's Indian River Power LLC participate in the development and performance of a Natural Resource Damage Assessment at the Burton Island Old Ash Landfill. NRG is currently working with DNREC and other trustees to close out the assessment process.
RGGI —
The Company operates generating units in Connecticut, Delaware, Maryland, Massachusetts, and New York that are subject to RGGI, which is a regional cap and trade system. In 2013, each of these states finalized a rule that reduced and will continue to reduce the number of allowances through 2020. The nine RGGI states are re-evaluating the program and may alter the rules to further reduce the number of allowances. The revisions being currently contemplated could adversely impact NRG's results of operations, financial condition and cash flows.
Massachusetts Global Warming Solutions Act Proposed Regulation
—
In May 2016, the Massachusetts Supreme Judicial Court held that Massachusetts DEP had not complied with the 2008 Global Warming Solutions Act, which requires establishing limits for sources of GHGs. The Court held that participation in RGGI was not sufficient. In December 2016, the Massachusetts DEP proposed a regulation that would limit GHG emissions from large electric generating facilities located in Massachusetts. A final regulation is expected by August 2017. If promulgated in its current form, the regulation may limit the operations of affected facilities.
Gulf Coast Region
Texas Regional Haze
— In January 2016, the EPA promulgated a final rule that requires 15 coal-fired units (at eight plants in Texas) to reduce their SO
2
rates at various times over the next five years if the rule survives legal challenges. This Regional Haze rule was promulgated under the portion of the CAA that seeks to improve visibility at national parks. Eight of these 15 units already have scrubbers and seven do not. NRG owns two of the affected units, Limestone units 1 and 2, which already have scrubbers. The rule requires that the Limestone units reduce their SO
2
emission rates by 2019. In July 2016, the U.S. Court of Appeals for the Fifth Circuit stayed the rule pending resolution of the legal challenges. On December 2, 2016, the EPA filed a motion in the Fifth Circuit for partial voluntary remand and partial lifting of the stay, but did not request vacatur of the final rule.
33
Illinois Union Insurance Company Litigation
— On October 2, 2015, the U.S. District Court for the Middle District of Louisiana issued an order granting LaGen’s motion for summary judgment on its claims for declaratory judgment and breach of contract against ILU for its failure to indemnify LaGen for the costs LaGen paid pursuant to the consent decree that resolved the NSR lawsuit which was brought by the U.S. EPA and LA DEQ against LaGen related to Big Cajun II. The court entered judgment in favor of LaGen for approximately $27 million. In addition, the court ruled that LaGen is entitled to approximately $7 million for future consent decree costs as they are incurred. On October 14, 2015, ILU filed a motion to stay execution of the judgment, which was granted on October 19, 2015. Also, on October 14, 2015, ILU filed a notice to appeal the judgment. On January 14, 2016, the U.S. District Court granted LaGen's motion for attorney's fees of approximately $2 million for the indemnity phase of the litigation. On January 29, 2016, ILU filed an appeal brief with the U.S. Court of Appeals for the Fifth Circuit. The Court of Appeals issued a decision on August 4, 2016 which vacated the summary judgment ruling and remanded the case to the U.S. District Court. The remanded case has been set for trial on May 8, 2017.
Environmental Capital Expenditures
NRG estimates that environmental capital expenditures from 2017 through 2021 required to comply with environmental laws will be approximately $134 million which includes $61 million for GenOn and $42 million for Midwest Generation. These costs are primarily associated with the cost of complying with anticipated ELG requirements.
Customers
NRG sells to a wide variety of customers. No individual customer accounted for 10% or more of NRG's total revenue in 2016. The Company owns and operates power plants to generate and sell power to wholesale customers such as utilities and other intermediaries. The Company also directly sells to end-use customers in the residential, commercial and industrial sectors. NRG also receives significant revenues from PJM in its capacity as the regional transmission organization for the PJM footprint.
Employees
As of
December 31, 2016
, NRG and its consolidated subsidiaries, including GenOn and NRG Yield, Inc., had 8,763, employees, approximately
30%
of whom were covered by U.S. bargaining agreements. During
2016
, the Company did not experience any labor stoppages or labor disputes at any of its facilities.
Available Information
NRG's annual reports on Form 10-K, quarterly reports on Form 10-Q, current reports on Form 8-K, and amendments to those reports filed or furnished pursuant to section 13(a) or 15(d) of the Exchange Act are available free of charge through the Company's website,
www.nrg.com
, as soon as reasonably practicable after they are electronically filed with, or furnished to, the SEC. The Company also routinely posts press releases, presentations, webcasts, and other information regarding the Company on the Company's website.
34
Risks Related to the Operation of NRG's Business
There is substantial doubt about GenOn's ability continue as a going concern. GenOn’s inability to continue as a going concern could have a material impact on the Company.
As disclosed in Item 15 - Note 1,
Nature of Business,
and Note 12,
Debt and Capital Leases,
to this Form 10-K, as of December 31, 2016, $691 million of GenOn's Senior Notes outstanding, excluding $8 million of associated premiums, are current within the GenOn consolidated balance sheet and are due on June 15, 2017. GenOn's future profitability continues to be adversely affected by (i) a sustained decline in natural gas prices and its resulting effect on wholesale power prices and capacity prices, and (ii) the inability of GenOn Mid-Atlantic and REMA to make distributions of cash and certain other restricted payments to GenOn. Based on current projections, GenOn is not expected to have sufficient liquidity exclusive of cash subject to the restrictions under the GenOn Mid-Atlantic and REMA operating leases to repay the GenOn Senior Notes due in June 2017. As a result, there is substantial doubt about GenOn's ability to continue as a going concern. As a result of the substantial doubt about GenOn’s ability to continue as a going concern, along with additional factors, there is substantial doubt about certain of GenOn’s subsidiaries’ ability to continue as a going concern.
As of December 31, 2016, GenOn has consolidated cash and cash equivalents of $1.0 billion, of which $471 million and $100 million is held by GenOn Mid-Atlantic and REMA, respectively. Under their respective operating leases, GenOn Mid-Atlantic and REMA are not permitted to make any distributions and other restricted payments unless: (a) they satisfy the fixed charge coverage ratio for the most recently ended period for four fiscal quarters; (b) they are projected to satisfy the fixed charge coverage ratio for each of the two following periods of four fiscal quarters, commencing with the fiscal quarter in which such payment is proposed to be made; and (c) no significant lease default or event of default has occurred and is continuing. Additionally, GenOn Mid-Atlantic and REMA must be in compliance with the requirement to provide credit support to the owner lessors securing their obligations to pay scheduled rent under their respective leases. As a result, GenOn Mid-Atlantic has not been able to make distributions of cash and certain other restricted payments since the quarter ended March 31, 2014 which was the last quarterly period for which GenOn Mid-Atlantic satisfied the conditions under its operating agreement. REMA has not satisfied the conditions under its operating agreement to make distributions of cash and certain other restricted payments since GenOn was acquired by NRG in December 2012.
The Company, GenOn's parent company, has no obligation to provide any financial support to GenOn other than under the secured intercompany revolving credit agreement between the Company and GenOn and NRG Americas. As of December 31, 2016, $228 million was available to be used by GenOn under the $500 million revolving credit agreement. As controlled group members, ERISA requires that NRG and GenOn are jointly and severally liable for the NRG Pension Plan for Bargained Employees and the NRG Pension Plan, including the pension liabilities associated with GenOn employees.
GenOn is currently considering all options available to it, including negotiations with creditors, refinancing the GenOn Senior Notes, potential sales of certain generating assets as well as the possibility for a need to file for protection under Chapter 11 of the U.S. Bankruptcy Code. During 2016, GenOn appointed two independent directors, retained advisors and established a separate audit committee as part of this process.
The Company cannot assure you that GenOn’s inability to continue as a going concern will not have a material impact on the Company's statement of operations, cash flows and financial position including, among other things, if GenOn were to file for bankruptcy protection.
As of December 31, 2016, GenOn represents 15.6% of the Company's consolidated total assets, 16.9% of the Company's consolidated total liabilities and contributed $94 million to the Company's consolidated cash from operations in 2016.
35
NRG's financial performance may be impacted by price fluctuations in the wholesale power and natural gas, coal and oil markets and other market factors that are beyond the Company's control.
Market prices for power, capacity, ancillary services, natural gas, coal and oil are unpredictable and tend to fluctuate substantially. Unlike most other commodities, electric power can only be stored on a very limited basis and generally must be produced concurrently with its use. As a result, power prices are subject to significant volatility due to supply and demand imbalances, especially in the day-ahead and spot markets. Long- and short-term power prices may also fluctuate substantially due to other factors outside of the Company's control, including:
|
•
|
changes in generation capacity in the Company’s markets, including the addition of new supplies of power as a result of the development of new plants, expansion of existing plants, the continued operation of uneconomic power plants due to state subsidies, or additional transmission capacity;
|
|
•
|
environmental regulations and legislation;
|
|
•
|
electric supply disruptions, including plant outages and transmission disruptions;
|
|
•
|
changes in power transmission infrastructure;
|
|
•
|
fuel transportation capacity constraints or inefficiencies;
|
|
•
|
weather conditions, including extreme weather conditions and seasonal fluctuations, including the effects of climate change;
|
|
•
|
changes in commodity prices and the supply of commodities, including but not limited to natural gas, coal and oil;
|
|
•
|
changes in the demand for power or in patterns of power usage, including the potential development of demand-side management tools and practices, distributed generation, and more efficient end-use technologies;
|
|
•
|
development of new fuels, new technologies and new forms of competition for the production of power;
|
|
•
|
fuel price volatility;
|
|
•
|
economic and political conditions;
|
|
•
|
regulations and actions of the ISOs and RTOs;
|
|
•
|
federal and state power regulations and legislation;
|
|
•
|
changes in law, including judicial decisions;
|
|
•
|
changes in prices related to RECs; and
|
|
•
|
changes in capacity prices and capacity markets.
|
Such factors and the associated fluctuations in power prices have affected the Company's wholesale power operating results in the past and will continue to do so in the future.
Many of NRG's power generation facilities operate, wholly or partially, without long-term power sale agreements.
Many of NRG's facilities operate as "merchant" facilities without long-term power sales agreements for some or all of their generating capacity and output and therefore are exposed to market fluctuations. Without the benefit of long-term power sales agreements for these assets, NRG cannot be sure that it will be able to sell any or all of the power generated by these facilities at commercially attractive rates or that these facilities will be able to operate profitably. This could lead to future impairments of the Company's property, plant and equipment or to the closing of certain of its facilities, resulting in economic losses and liabilities, which could have a material adverse effect on the Company's results of operations, financial condition or cash flows.
NRG's costs, results of operations, financial condition and cash flows could be adversely impacted by disruption of its fuel supplies.
NRG relies on natural gas, coal and oil to fuel a majority of its power generation facilities. Delivery of these fuels to the facilities is dependent upon the continuing financial viability of contractual counterparties as well as upon the infrastructure (including rail lines, rail cars, barge facilities, roadways, riverways and natural gas pipelines) available to serve each generation facility. As a result, the Company is subject to the risks of disruptions or curtailments in the production of power at its generation facilities if no fuel is available at any price or if a counterparty fails to perform or if there is a disruption in the fuel delivery infrastructure.
36
NRG has sold forward a substantial portion of its coal and nuclear power in order to lock in long-term prices that it deemed to be favorable at the time it entered into the forward power sales contracts. In order to hedge its obligations under these forward power sales contracts, the Company has entered into long-term and short-term contracts for the purchase and delivery of fuel. Many of the forward power sales contracts do not allow the Company to pass through changes in fuel costs or discharge the power sale obligations in the case of a disruption in fuel supply due to force majeure events or the default of a fuel supplier or transporter. Disruptions in the Company's fuel supplies may therefore require it to find alternative fuel sources at higher costs, to find other sources of power to deliver to counterparties at a higher cost, or to pay damages to counterparties for failure to deliver power as contracted. Any such event could have a material adverse effect on the Company's financial performance.
NRG also buys significant quantities of fuel on a short-term or spot market basis. Prices for all of the Company's fuels fluctuate, sometimes rising or falling significantly over a relatively short period of time. The price NRG can obtain for the sale of energy may not rise at the same rate, or may not rise at all, to match a rise in fuel or delivery costs. This may have a material adverse effect on the Company's financial performance. Changes in market prices for natural gas, coal and oil may result from the following:
|
•
|
weather conditions;
|
|
•
|
seasonality;
|
|
•
|
demand for energy commodities and general economic conditions;
|
|
•
|
disruption or other constraints or inefficiencies of electricity, gas or coal transmission or transportation;
|
|
•
|
additional generating capacity;
|
|
•
|
availability and levels of storage and inventory for fuel stocks;
|
|
•
|
natural gas, crude oil, refined products and coal production levels;
|
|
•
|
changes in market liquidity;
|
|
•
|
federal, state and foreign governmental regulation and legislation; and
|
|
•
|
the creditworthiness and liquidity and willingness of fuel suppliers/transporters to do business with the Company.
|
NRG's plant operating characteristics and equipment, particularly at its coal-fired plants, often dictate the specific fuel quality to be combusted. The availability and price of specific fuel qualities may vary due to supplier financial or operational disruptions, transportation disruptions and force majeure. At times, coal of specific quality may not be available at any price, or the Company may not be able to transport such coal to its facilities on a timely basis. In this case, the Company may not be able to run the coal facility even if it would be profitable. Operating a coal facility with different quality coal can lead to emission or operating problems. If the Company had sold forward the power from such a coal facility, it could be required to supply or purchase power from alternate sources, perhaps at a loss. This could have a material adverse impact on the financial results of specific plants and on the Company's results of operations.
Changes in the price of coal and natural gas could cause the Company to hold excess coal inventories and incur contract termination costs.
Low natural gas prices can cause natural gas to be the more cost-competitive fuel compared to coal for generating electricity. Because the Company enters into guaranteed supply contracts to provide for the amount of coal needed to operate its base load coal-fired generating facilities, the Company may experience periods where it holds excess amounts of coal if fuel pricing results in the Company reducing or idling coal-fired generating facilities. In addition, the Company may incur costs to terminate supply contracts for coal in excess of its generating requirements.
37
Volatile power supply costs and demand for power could adversely affect the financial performance of NRG's retail businesses.
Although NRG is the primary provider of its retail businesses' wholesale electricity supply requirements, the retail businesses purchase a significant portion of their supply requirements from third parties. As a result, financial performance depends on the ability to obtain adequate supplies of electric generation from third parties at prices below the prices it charges its customers. Consequently, the Company's earnings and cash flows could be adversely affected in any period in which the retail businesses' wholesale electricity supply costs rise at a greater rate than the rates it charges to customers. The price of wholesale electricity supply purchases associated with the retail businesses' energy commitments can be different than that reflected in the rates charged to customers due to, among other factors:
|
•
|
varying supply procurement contracts used and the timing of entering into related contracts;
|
|
•
|
subsequent changes in the overall price of natural gas;
|
|
•
|
daily, monthly or seasonal fluctuations in the price of natural gas relative to the 12-month forward prices;
|
|
•
|
transmission constraints and the Company's ability to move power to its customers; and
|
|
•
|
changes in market heat rate (i.e., the relationship between power and natural gas prices).
|
The retail businesses' earnings and cash flows could also be adversely affected in any period in which its customers' actual usage of electricity significantly varies from the forecasted usage, which could occur due to, among other factors, weather events, competition and economic conditions.
There may be periods when NRG will not be able to meet its commitments under forward sale obligations at a reasonable cost or at all.
A substantial portion of the output from NRG's coal and nuclear facilities has been sold forward under fixed price power sales contracts through 2017 and the Company also sells forward the output from its intermediate and peaking facilities when it deems it commercially advantageous to do so. The Company also sells fixed price gas as a proxy for power. Because the obligations under most of these agreements are not contingent on a unit being available to generate power, NRG is generally required to deliver power to the buyer, even in the event of a plant outage, fuel supply disruption or a reduction in the available capacity of the unit. To the extent that the Company does not have sufficient lower cost capacity to meet its commitments under its forward sale obligations, the Company would be required to supply replacement power either by running its other, higher cost power plants or by obtaining power from third-party sources at market prices that could substantially exceed the contract price. If NRG fails to deliver the contracted power, it would be required to pay the difference between the market price at the delivery point and the contract price, and the amount of such payments could be substantial.
In the Gulf Coast region, NRG has long-term contracts with rural cooperatives that require it to serve all of the cooperatives' requirements at prices for energy that generally reflect the cost of coal-fired generation. On December 19, 2013, the Entergy region joined the MISO RTO, which employs a two settlement market in which NRG submits bids for energy to cover its load obligations and submits offers to sell energy from its resources. Given the “full requirements” obligation contained in the cooperative contracts, and the possibility of unplanned forced outages of its generation, NRG may be exposed to locational market prices as a net buyer of energy for certain periods, which could have a negative impact on NRG's financial returns from its Gulf Coast region.
NRG's trading operations and use of hedging agreements could result in financial losses that negatively impact its results of operations.
The Company typically enters into hedging agreements, including contracts to purchase or sell commodities at future dates and at fixed prices, in order to manage the commodity price risks inherent in its power generation operations. These activities, although intended to mitigate price volatility, expose the Company to other risks. When the Company sells power forward, it gives up the opportunity to sell power at higher prices in the future, which not only may result in lost opportunity costs but also may require the Company to post significant amounts of cash collateral or other credit support to its counterparties. The Company also relies on counterparty performance under its hedging agreements and is exposed to the credit quality of its counterparties under those agreements. Further, if the values of the financial contracts change in a manner that the Company does not anticipate, or if a counterparty fails to perform under a contract, it could harm the Company's business, operating results or financial position.
NRG does not typically hedge the entire exposure of its operations against commodity price volatility. To the extent it does not hedge against commodity price volatility, the Company's results of operations and financial position may be improved or diminished based upon movement in commodity prices.
38
NRG may engage in trading activities, including the trading of power, fuel and emissions allowances that are not directly related to the operation of the Company's generation facilities or the management of related risks. These trading activities take place in volatile markets and some of these trades could be characterized as speculative. The Company would expect to settle these trades financially rather than through the production of power or the delivery of fuel. This trading activity may expose the Company to the risk of significant financial losses which could have a material adverse effect on its business and financial condition.
NRG may not have sufficient liquidity to hedge market risks effectively.
The Company is exposed to market risks through its power marketing business, which involves the sale of energy, capacity and related products and the purchase and sale of fuel, transmission services and emission allowances. These market risks include, among other risks, volatility arising from location and timing differences that may be associated with buying and transporting fuel, converting fuel into energy and delivering energy to a buyer.
NRG undertakes these marketing activities through agreements with various counterparties. Many of the Company's agreements with counterparties include provisions that require the Company to provide guarantees, offset of netting arrangements, letters of credit, a first lien on assets and/or cash collateral to protect the counterparties against the risk of the Company's default or insolvency. The amount of such credit support that must be provided typically is based on the difference between the price of the commodity in a given contract and the market price of the commodity. Significant movements in market prices can result in the Company being required to provide cash collateral and letters of credit in very large amounts. The effectiveness of the Company's strategy may be dependent on the amount of collateral available to enter into or maintain these contracts, and liquidity requirements may be greater than the Company anticipates or will be able to meet. Without a sufficient amount of working capital to post as collateral in support of performance guarantees or as a cash margin, the Company may not be able to manage price volatility effectively or to implement its strategy. An increase in the amount of letters of credit or cash collateral required to be provided to the Company's counterparties may negatively affect the Company's liquidity and financial condition.
Further, if any of NRG's facilities experience unplanned outages, the Company may be required to procure replacement power at spot market prices in order to fulfill contractual commitments. Without adequate liquidity to meet margin and collateral requirements, the Company may be exposed to significant losses, may miss significant opportunities, and may have increased exposure to the volatility of spot markets.
The accounting for NRG's hedging activities may increase the volatility in the Company's quarterly and annual financial results.
NRG engages in commodity-related marketing and price-risk management activities in order to financially hedge its exposure to market risk with respect to electricity sales from its generation assets, fuel utilized by those assets and emission allowances.
NRG generally attempts to balance its fixed-price physical and financial purchases and sales commitments in terms of contract volumes and the timing of performance and delivery obligations through the use of financial and physical derivative contracts. These derivatives are accounted for in accordance with the FASB ASC 815,
Derivatives and Hedging,
or ASC 815, which requires the Company to record all derivatives on the balance sheet at fair value with changes in the fair value resulting from fluctuations in the underlying commodity prices immediately recognized in earnings, unless the derivative qualifies for cash flow hedge accounting treatment. Whether a derivative qualifies for cash flow hedge accounting treatment depends upon it meeting specific criteria used to determine if the cash flow hedge is and will remain appropriate for the term of the derivative. All economic hedges may not necessarily qualify for cash flow hedge accounting treatment. As a result, the Company's quarterly and annual results are subject to significant fluctuations caused by changes in market prices.
Competition in wholesale power markets may have a material adverse effect on NRG's results of operations, cash flows and the market value of its assets.
NRG has numerous competitors in all aspects of its business, and additional competitors may enter the industry. Because many of the Company's facilities are old, newer plants owned by the Company's competitors are often more efficient than NRG's aging plants, which may put some of the Company's plants at a competitive disadvantage to the extent the Company's competitors are able to consume the same or less fuel as the Company's plants consume. Over time, the Company's plants may be squeezed out of their markets or may be unable to compete with these more efficient plants.
In NRG's power marketing and commercial operations, NRG competes on the basis of its relative skills, financial position and access to capital with other providers of electric energy in the procurement of fuel and transportation services, and the sale of capacity, energy and related products. In order to compete successfully, the Company seeks to aggregate fuel supplies at competitive prices from different sources and locations and to efficiently utilize transportation services from third-party pipelines, railways and other fuel transporters and transmission services from electric utilities.
39
Other companies with which NRG competes may have greater liquidity, greater access to credit and other financial resources, lower cost structures, more effective risk management policies and procedures, greater ability to incur losses, longer-standing relationships with customers, greater potential for profitability from ancillary services or greater flexibility in the timing of their sale of generation capacity and ancillary services than NRG does.
NRG's competitors may be able to respond more quickly to new laws or regulations or emerging technologies, or to devote greater resources to the construction, expansion or refurbishment of their power generation facilities than NRG can. In addition, current and potential competitors may make strategic acquisitions or establish cooperative relationships among themselves or with third parties. Accordingly, it is possible that new competitors or alliances among current and new competitors may emerge and rapidly gain significant market share. There can be no assurance that NRG will be able to compete successfully against current and future competitors, and any failure to do so would have a material adverse effect on the Company's business, financial condition, results of operations and cash flow.
Operation of power generation facilities involves significant risks and hazards customary to the power industry that could have a material adverse effect on NRG's revenues and results of operations, and NRG may not have adequate insurance to cover these risks and hazards.
The ongoing operation of NRG's facilities involves risks that include the breakdown or failure of equipment or processes, performance below expected levels of output or efficiency and the inability to transport the Company's product to its customers in an efficient manner due to a lack of transmission capacity. Unplanned outages of generating units, including extensions of scheduled outages due to mechanical failures or other problems occur from time to time and are an inherent risk of the Company's business. Unplanned outages typically increase the Company's operation and maintenance expenses and may reduce the Company's revenues as a result of selling fewer MWh or non-performance penalties or require NRG to incur significant costs as a result of running one of its higher cost units or obtaining replacement power from third parties in the open market to satisfy the Company's forward power sales obligations. NRG's inability to operate the Company's plants efficiently, manage capital expenditures and costs, and generate earnings and cash flow from the Company's asset-based businesses could have a material adverse effect on the Company's results of operations, financial condition or cash flows. While NRG maintains insurance, obtains warranties from vendors and obligates contractors to meet certain performance levels, the proceeds of such insurance, warranties or performance guarantees may not be adequate to cover the Company's lost revenues, increased expenses or liquidated damages payments should the Company experience equipment breakdown or non-performance by contractors or vendors.
Power generation involves hazardous activities, including acquiring, transporting and unloading fuel, operating large pieces of rotating equipment and delivering electricity to transmission and distribution systems. In addition to natural risks such as earthquake, flood, lightning, hurricane and wind, other hazards, such as fire, explosion, structural collapse and machinery failure are inherent risks in the Company's operations. These and other hazards can cause significant personal injury or loss of life, severe damage to and destruction of property, plant and equipment, contamination of, or damage to, the environment and suspension of operations. The occurrence of any one of these events may result in NRG being named as a defendant in lawsuits asserting claims for substantial damages, including for environmental cleanup costs, personal injury and property damage and fines and/or penalties. NRG maintains an amount of insurance protection that it considers adequate, but the Company cannot provide any assurance that its insurance will be sufficient or effective under all circumstances and against all hazards or liabilities to which it may be subject. A successful claim for which the Company is not fully insured could hurt its financial results and materially harm NRG's financial condition. NRG cannot provide any assurance that its insurance coverage will continue to be available at all or at rates or on terms similar to those presently available. Any losses not covered by insurance could have a material adverse effect on the Company's financial condition, results of operations or cash flows.
Maintenance, expansion and refurbishment of power generation facilities involve significant risks that could result in unplanned power outages or reduced output and could have a material adverse effect on NRG's results of operations, cash flows and financial condition.
Many of NRG's facilities are old and require periodic upgrading, improvement, maintenance and repair. Any unexpected failure, including failure associated with breakdowns, forced outages or any unanticipated capital expenditures could result in reduced profitability.
NRG cannot be certain of the level of capital expenditures that will be required due to changing environmental and safety laws (including changes in the interpretation or enforcement thereof), needed facility repairs and unexpected events (such as natural disasters or terrorist attacks). The unexpected requirement of large capital expenditures could have a material adverse effect on the Company's liquidity and financial condition.
If NRG significantly modifies a unit, the Company may be required to install the best available control technology or to achieve the lowest achievable emission rates as such terms are defined under the new source review provisions of the CAA, which would likely result in substantial additional capital expenditures.
40
The Company may incur additional costs or delays in the development, construction and operation of new plants, improvements to existing plants, or the implementation of environmental control equipment at existing plants and may not be able to recover their investment or complete the project.
The Company is developing or constructing new generation facilities, improving its existing facilities and adding environmental controls to its existing facilities. The development, construction, expansion, modification and refurbishment of power generation facilities involve many risks, including:
|
•
|
inability to obtain sufficient funding on reasonable terms and/or necessary government financial incentives;
|
|
•
|
delays in obtaining necessary permits and licenses;
|
|
•
|
inability to sell down interests in a project or develop successful partnering relationships;
|
|
•
|
environmental remediation of soil or groundwater at contaminated sites;
|
|
•
|
interruptions to dispatch at the Company's facilities;
|
|
•
|
supply interruptions;
|
|
•
|
work stoppages;
|
|
•
|
labor disputes;
|
|
•
|
weather interferences;
|
|
•
|
unforeseen engineering, environmental and geological problems, including those related to climate change;
|
|
•
|
unanticipated cost overruns;
|
|
•
|
exchange rate risks; and
|
|
•
|
failure of contracting parties to perform under contracts, including EPC contractors.
|
Any of these risks could cause NRG's financial returns on new investments to be lower than expected or could cause the Company to operate below expected capacity or availability levels, which could result in lost revenues, increased expenses, higher maintenance costs and penalties. Insurance is maintained to protect against these risks, warranties are generally obtained for limited periods relating to the construction of each project and its equipment in varying degrees, and contractors and equipment suppliers are obligated to meet certain performance levels. The insurance, warranties or performance guarantees, however, may not be adequate to cover increased expenses. As a result, a project may cost more than projected and may be unable to fund principal and interest payments under its construction financing obligations, if any. A default under such a financing obligation could result in the Company losing its interest in a power generation facility.
Furthermore, where the Company has partnering relationships with a third party, the Company is subject to the viability and performance of the third party. The Company's inability to find a replacement contracting party, particularly an EPC contractor, where the original contracting party has failed to perform, could result in the abandonment of the development and/or construction of such project, while the Company could remain obligated on other agreements associated with the project, including PPAs.
If the Company is unable to complete the development or construction of a facility or environmental control, or decides to delay, downsize, or cancel such project, it may not be able to recover its investment in that facility or environmental control. Furthermore, if construction projects are not completed according to specification, the Company may incur liabilities and suffer reduced plant efficiency, higher operating costs and reduced net income.
NRG and its subsidiaries have guaranteed the performance of third parties, which may result in substantial costs in the event of non-performance.
NRG and its subsidiaries have issued certain guarantees of the performance of others, which obligate NRG and its subsidiaries to perform in the event that the third parties do not perform. In the event of non-performance by the third parties, NRG could incur substantial cost to fulfill their obligations under these guarantees. Such performance guarantees could have a material impact on the operating results, financial condition, or cash flows of the Company.
41
The Company's development programs are subject to financing and public policy risks that could adversely impact NRG's financial performance or result in the abandonment of such development projects.
While NRG currently intends to develop and finance its more capital intensive projects on a non-recourse or limited recourse basis through separate project financed entities and intends to seek additional investments in most of these projects from third parties, NRG anticipates that it will need to make significant equity investments in these projects. NRG may also decide to develop and finance some of the projects, such as smaller gas-fired and renewable projects, using corporate financial resources rather than non-recourse debt, which could subject NRG to significant capital expenditure requirements and to risks inherent in the development and construction of new generation facilities. In addition to providing some or all of the equity required to develop and build the proposed projects, NRG's ability to finance these projects on a non-recourse basis is contingent upon a number of factors, including the terms of the EPC contracts, construction costs, PPAs and fuel procurement contracts, capital markets conditions, the availability of tax credits and other government incentives for certain new technologies. To the extent NRG is not able to obtain non-recourse financing for any project or should credit rating agencies attribute a material amount of the project finance debt to NRG's credit, the financing of the development projects could have a negative impact on the credit ratings of NRG.
NRG may also choose to undertake the repowering, refurbishment or upgrade of current facilities based on the Company's assessment that such activity will provide adequate financial returns. Such projects often require several years of development and capital expenditures before commencement of commercial operations, and key assumptions underpinning a decision to make such an investment may prove incorrect, including assumptions regarding construction costs, timing, available financing and future fuel and power prices.
Furthermore, the viability of the Company's renewable development projects are contingent on public policy mechanisms including production and investment tax credits, cash grants, loan guarantees, accelerated depreciation tax benefits, renewable portfolio standards, or RPS, and carbon-related mandates or controls. These mechanisms have been implemented at the state and federal levels to support the development of renewable generation, demand-side and smart grid, and other clean infrastructure technologies. The availability and continuation of public policy support mechanisms will drive a significant part of the economics and viability of the Company's development program and expansion into clean energy investments.
The Company’s renewables business has a pipeline of projects across the utility scale and distributed generation markets, including both organically developed projects and projects acquired from third-parties. If a number of the projects fail to proceed to construction or are not completed, the Company’s business, financial condition or operating results could be materially adversely affected.
The development process is long and includes many steps such as project siting, financing, construction, permitting, government approvals and the negotiation of project development agreements. There can be no assurance that the projects in the Company’s renewables project pipeline will be completed on schedule or within budget, generate revenues, receive the necessary financing for construction, among other risks. As the Company develops its renewables project pipeline, some of the projects in the pipeline may not be completed or proceed to construction as a result of various factors. These factors may include changes in applicable laws and regulations, including government incentives, environmental concerns regarding a project or changes in the economics related to a project, including the ability to finance a particular project. If a number of projects are not completed, the Company’s business, financial condition or operating results could be materially adversely affected.
Supplier and/or customer concentration at certain of NRG's facilities may expose the Company to significant financial credit or performance risks.
NRG often relies on a single contracted supplier or a small number of suppliers for the provision of fuel, transportation of fuel and other services required for the operation of certain of its facilities. If these suppliers cannot perform, the Company utilizes the marketplace to provide these services. There can be no assurance that the marketplace can provide these services as, when and where required or at comparable prices.
At times, NRG relies on a single customer or a few customers to purchase all or a significant portion of a facility's output, in some cases under long-term agreements that account for a substantial percentage of the anticipated revenue from a given facility. The Company has also hedged a portion of its exposure to power price fluctuations through forward fixed price power sales and natural gas price swap agreements. Counterparties to these agreements may breach or may be unable to perform their obligations. NRG may not be able to enter into replacement agreements on terms as favorable as its existing agreements, or at all. If the Company was unable to enter into replacement PPAs, the Company would sell its plants' power at market prices. If the Company is unable to enter into replacement fuel or fuel transportation purchase agreements, NRG would seek to purchase the Company's fuel requirements at market prices, exposing the Company to market price volatility and the risk that fuel and transportation may not be available during certain periods at any price.
42
The failure of any supplier or customer to fulfill its contractual obligations to NRG could have a material adverse effect on the Company's financial results. Consequently, the financial performance of the Company's facilities is dependent on the credit quality of, and continued performance by, suppliers and customers.
The Company's retail businesses may lose a significant number of retail customers due to competitive marketing activity by other retail electricity providers which could adversely affect the financial performance of the Company's retail businesses.
The Company's retail businesses face competition for customers. Competitors may offer different products, lower prices, and other incentives, which may attract customers away from NRG's retail businesses. In some retail electricity markets, the principal competitor may be the incumbent utility. The incumbent utility has the advantage of long-standing relationships with its customers and strong brand recognition. Furthermore, NRG's retail businesses may face competition from a number of other energy service providers, other energy industry participants, or nationally branded providers of consumer products and services, who may develop businesses that will compete with NRG and its retail businesses.
NRG relies on power transmission facilities that it does not own or control and that are subject to transmission constraints within a number of the Company's core regions. If these facilities fail to provide NRG with adequate transmission capacity, the Company may be restricted in its ability to deliver wholesale electric power to its customers and the Company may either incur additional costs or forego revenues. Conversely, improvements to certain transmission systems could also reduce revenues.
NRG depends on transmission facilities owned and operated by others to deliver the wholesale power it sells from the Company's power generation plants to its customers. If transmission is disrupted, or if the transmission capacity infrastructure is inadequate, NRG's ability to sell and deliver wholesale power may be adversely impacted. If a region's power transmission infrastructure is inadequate, the Company's recovery of wholesale costs and profits may be limited. If restrictive transmission price regulation is imposed, the transmission companies may not have sufficient incentive to invest in expansion of transmission infrastructure. The Company also cannot predict whether transmission facilities will be expanded in specific markets to accommodate competitive access to those markets.
In addition, in certain of the markets in which NRG operates, energy transmission congestion may occur and the Company may be deemed responsible for congestion costs if it schedules delivery of power between congestion zones during times when congestion occurs between the zones. If NRG were liable for such congestion costs, the Company's financial results could be adversely affected.
The Company has a significant amount of generation located in load pockets, making that generation valuable, particularly with respect to maintaining the reliability of the transmission grid. Expansion of transmission systems to reduce or eliminate these load pockets could negatively impact the value or profitability of the Company's existing facilities in these areas.
The Company’s use and enjoyment of real property rights for its projects may be adversely affected by the rights of lienholders and leaseholders that are superior to those of the grantors of those real property rights to the Company.
Solar and wind projects generally are, and are likely to be, located on land occupied by the project pursuant to long-term easements and leases. The ownership interests in the land subject to these easements and leases may be subject to mortgages securing loans or other liens (such as tax liens) and other easement and lease rights of third parties (such as leases of oil or mineral rights) that were created prior to the project’s easements and leases. As a result, the project’s rights under these easements or leases may be subject, and subordinate, to the rights of those third parties. The Company performs title searches and obtains title insurance to protect itself against these risks. Such measures may, however, be inadequate to protect the Company against all risk of loss of its rights to use the land on which the renewable projects are located, which could have a material adverse effect on the Company’s business, financial condition and results of operations.
One of the Company's subsidiaries is a publicly traded corporation, NRG Yield, Inc., which may involve a greater exposure to legal liability than the Company's historic business operations.
One of the Company's subsidiaries is NRG Yield, Inc., a publicly traded corporation. NRG's controlling voting interest in NRG Yield, Inc. and the position of certain of its executive officers that are serving on the Board of Directors of NRG Yield, Inc. or as executive officers may increase the possibility of claims of breach of fiduciary duties including claims of conflicts of interest related to NRG Yield, Inc. Any liability resulting from such claims could have a material adverse effect on NRG's future business, financial condition, results of operations and cash flows.
43
Because NRG owns less than a majority of the ownership interests of some of its project investments, the Company cannot exercise complete control over their operations.
NRG has limited control over the operation of some project investments and joint ventures because the Company's investments are in projects where it beneficially owns less than a majority of the ownership interests. NRG seeks to exert a degree of influence with respect to the management and operation of projects in which it owns less than a majority of the ownership interests by negotiating to obtain positions on management committees or to receive certain limited governance rights, such as rights to veto significant actions. However, the Company may not always succeed in such negotiations. NRG may be dependent on its co-venturers to operate such projects. The Company's co-venturers may not have the level of experience, technical expertise, human resources management and other attributes necessary to operate these projects optimally. The approval of co-venturers also may be required for NRG to receive distributions of funds from projects or to transfer the Company's interest in projects.
NRG may be unable to integrate the operations of acquired entities in the manner expected.
NRG enters into acquisitions that result in various benefits, including, among other things, cost savings and operating efficiencies. Achieving the anticipated benefits of these acquisitions depends on whether the businesses can be integrated into NRG in an efficient and effective manner. The integration process could take longer than anticipated and could result in the loss of valuable employees, the disruption of NRG's businesses, processes and systems or inconsistencies in standards, controls, procedures, practices, policies and compensation arrangements, any of which could adversely affect the Company's ability to achieve the anticipated benefits of the acquisitions. NRG may have difficulty addressing possible differences in corporate cultures and management philosophies. Failure to achieve these anticipated benefits could result in increased costs or decreases in the amount of expected revenues and could adversely affect NRG's future business, financial condition, operating results and prospects.
Future acquisition activities may have materially adverse effects.
NRG may seek to acquire additional companies or assets in the Company's industry or which complement the Company's industry. The acquisition of companies and assets is subject to substantial risks, including the failure to identify material problems during due diligence, the risk of over-paying for assets, the ability to retain customers and the inability to arrange financing for an acquisition as may be required or desired. Further, the integration and consolidation of acquisitions requires substantial human, financial and other resources and, ultimately, the Company's acquisitions may not be successfully integrated. There can be no assurances that any future acquisitions will perform as expected or that the returns from such acquisitions will support the indebtedness incurred to acquire them or the capital expenditures needed to develop them.
NRG's business, financial condition and results of operations could be adversely impacted by strikes or work stoppages by its unionized employees or inability to replace employees as they retire.
As of
December 31, 2016
, approximately
30%
of NRG's employees at its U.S. generation plants were covered by collective bargaining agreements. In the event that the Company's union employees strike, participate in a work stoppage or slowdown or engage in other forms of labor strife or disruption, NRG would be responsible for procuring replacement labor or the Company could experience reduced power generation or outages. Although NRG's ability to procure such labor is uncertain, contingency staffing planning is completed as part of each respective contract negotiations. Strikes, work stoppages or the inability to negotiate future collective bargaining agreements on favorable terms could have a material adverse effect on the Company's business, financial condition, results of operations and cash flows. In addition, a number of the Company's employees at NRG's plants are close to retirement. The Company's inability to replace retiring workers could create potential knowledge and expertise gaps as such workers retire.
Changes in technology may impair the value of NRG's power plants.
Research and development activities are ongoing to provide alternative and more efficient technologies to produce power, including "clean" coal and coal gasification, wind, photovoltaic (solar) cells, energy storage, and improvements in traditional technologies and equipment, such as more efficient gas turbines. Advances in these or other technologies could reduce the costs of power production to a level below what the Company has currently forecasted, which could adversely affect its cash flows, results of operations or competitive position.
44
Risks that are beyond NRG's control, including but not limited to acts of terrorism or related acts of war, natural disaster, hostile cyber intrusions or other catastrophic events could have a material adverse effect on NRG's financial condition, results of operations and cash flows.
NRG's generation facilities and the facilities of third parties on which they rely may be targets of terrorist activities, as well as events occurring in response to or in connection with them, that could cause environmental repercussions and/or result in full or partial disruption of the facilities ability to generate, transmit, transport or distribute electricity or natural gas. Strategic targets, such as energy-related facilities, may be at greater risk of future terrorist activities than other domestic targets. Hostile cyber intrusions, including those targeting information systems as well as electronic control systems used at the generating plants and for the distribution systems, could severely disrupt business operations and result in loss of service to customers, as well as significant expense to repair security breaches or system damage. Any such environmental repercussions or disruption could result in a significant decrease in revenues or significant reconstruction or remediation costs, beyond what could be recovered through insurance policies which could have a material adverse effect on the Company's financial condition, results of operations and cash flows. In addition, significant weather events or terrorist actions could damage or shut down the power transmission and distribution facilities upon which the Company's retail businesses are dependent. Power supply may be sold at a loss if these events cause a significant loss of retail customer load.
The operation of NRG’s businesses is subject to cyber-based security and integrity risk.
Numerous functions affecting the efficient operation of NRG’s businesses are dependent on the secure and reliable storage, processing and communication of electronic data and the use of sophisticated computer hardware and software systems. The operation of NRG’s generation plants, including STP, and of NRG's energy and fuel trading businesses are reliant on cyber-based technologies and, therefore, subject to the risk that such systems could be the target of disruptive actions, particularly through cyber-attack or cyber intrusion, including by computer hackers, foreign governments and cyber terrorists, or otherwise be compromised by unintentional events. As a result, operations could be interrupted, property could be damaged and sensitive customer information could be lost or stolen, causing NRG to incur significant losses of revenues, other substantial liabilities and damages, costs to replace or repair damaged equipment and damage to NRG's reputation. In addition, NRG may experience increased capital and operating costs to implement increased security for its cyber systems and plants.
The Company's retail businesses are subject to the risk that sensitive customer data may be compromised, which could result in an adverse impact to its reputation and/or the results of operations of the Company's retail businesses.
The Company's retail businesses require access to sensitive customer data in the ordinary course of business. Examples of sensitive customer data are names, addresses, account information, historical electricity usage, expected patterns of use, payment history, credit bureau data, credit and debit card account numbers, driver's license numbers, social security numbers and bank account information. NRG's retail businesses may need to provide sensitive customer data to vendors and service providers, who require access to this information in order to provide services, such as call center operations, to NRG's retail businesses. If a significant breach occurred, the reputation of NRG and its retail businesses may be adversely affected, customer confidence may be diminished, or NRG and its retail businesses may be subject to legal claims, any of which may contribute to the loss of customers and have a negative impact on the business and/or results of operations.
Risks Related to Governmental Regulation and Laws
NRG's business is subject to substantial governmental regulation and may be adversely affected by legislative or regulatory changes, as well as liability under, or any future inability to comply with, existing or future regulations or requirements.
NRG's business is subject to extensive U.S. federal, state and local laws and foreign laws. Compliance with the requirements under these legal and regulatory regimes may cause the Company to incur significant additional costs, and failure to comply with such requirements could result in the shutdown of a non-complying facility, the imposition of liens, fines, and/or civil or criminal liability.
45
Public utilities under the FPA are required to obtain FERC acceptance of their rate schedules for wholesale sales of electricity. Except for ERCOT generating facilities and power marketers, all of NRG's non-qualifying facility generating companies and power marketing affiliates in the U.S. make sales of electricity in interstate commerce and are public utilities for purposes of the FPA. FERC has granted each of NRG's generating and power marketing companies that make sales of electricity outside of ERCOT the authority to sell electricity at market-based rates. FERC's orders that grant NRG's generating and power marketing companies market-based rate authority reserve the right to revoke or revise that authority if FERC subsequently determines that NRG can exercise market power in transmission or generation, create barriers to entry, or engage in abusive affiliate transactions. In addition, NRG's market-based sales are subject to certain market behavior rules, and if any of NRG's generating and power marketing companies were deemed to have violated those rules, they are subject to potential disgorgement of profits associated with the violation and/or suspension or revocation of their market-based rate authority. If NRG's generating and power marketing companies were to lose their market-based rate authority, such companies would be required to obtain FERC's acceptance of a cost-of-service rate schedule and could become subject to the accounting, record-keeping, and reporting requirements that are imposed on utilities with cost-based rate schedules. This could have a material adverse effect on the rates NRG charges for power from its facilities.
Substantially all of the Company's generation assets are also subject to the reliability standards promulgated by the designated Electric Reliability Organization (currently NERC) and approved by FERC. If NRG fails to comply with the mandatory reliability standards, NRG could be subject to sanctions, including substantial monetary penalties and increased compliance obligations. NRG is also affected by legislative and regulatory changes, as well as changes to market design, market rules, tariffs, cost allocations, and bidding rules that occur in the existing ISOs. The ISOs that oversee most of the wholesale power markets impose, and in the future may continue to impose, mitigation, including price limitations, offer caps, non-performance penalties and other mechanisms to address some of the volatility and the potential exercise of market power in these markets. These types of price limitations and other regulatory mechanisms may have a material adverse effect on the profitability of NRG's generation facilities that sell energy and capacity into the wholesale power markets.
The regulatory environment has undergone significant changes in the last several years due to state and federal policies affecting wholesale and retail competition and the creation of incentives for the addition of large amounts of new renewable generation and, in some cases, transmission. These changes are ongoing, and the Company cannot predict the future design of the wholesale power markets or the ultimate effect that the changing regulatory environment will have on NRG's business. In addition, in some of these markets, interested parties have proposed material market design changes, including the elimination of a single clearing price mechanism, as well as proposals to reinstate the vertical monopoly utility of the markets or require divestiture by generating companies to reduce their market share. If competitive restructuring of the electric power markets is reversed, discontinued, or delayed, the Company's business prospects and financial results could be negatively impacted. In addition, since 2010, there have been a number of reforms to the regulation of the derivatives markets, both in the United States and internationally. These regulations, and any further changes thereto, or adoption of additional regulations, including any regulations relating to position limits on futures and other derivatives or margin for derivatives, could negatively impact NRG’s ability to hedge its portfolio in an efficient, cost-effective manner by, among other things, potentially decreasing liquidity in the forward commodity and derivatives markets or limiting NRG’s ability to utilize non-cash collateral for derivatives transactions.
NRG’s business may be affected by state interference in the competitive wholesale marketplace.
NRG’s legacy generation and competitive retail businesses rely on a competitive wholesale marketplace. The competitive wholesale marketplace may be undermined by out-of-market subsidies provided by states or state entities, including bailouts of uneconomic nuclear plants, imports of power from Canada, renewable mandates or subsidies, as well as out-of-market payments to new generators. These out-of-market subsidies to existing or new generation undermine the competitive wholesale marketplace, which can lead to premature retirement of existing facilities, including those owned by the Company. If these measures continue, capacity and energy prices may be suppressed, and the Company may not be successful in its efforts to insulate the competitive market from this interference.
46
Government regulations providing incentives for renewable generation could change at any time and such changes may adversely impact NRG's business, revenues, margins, results of operations and cash flows.
The Company's growth strategy depends in part on government policies that support renewable generation and enhance the economic viability of owning renewable electric generation assets. Renewable generation assets currently benefit from various federal, state and local governmental incentives such as ITCs, PTCs, cash grants in lieu of ITCs, loan guarantees, RPS programs, modified accelerated cost-recovery system of depreciation and bonus depreciation. For example, in December 2015, the U.S. Congress enacted an extension of the 30% solar ITC so that projects which began construction in 2016 through 2019 will continue to qualify for the 30% ITC. Projects beginning construction in 2020 and 2021 will be eligible for the ITC at the rates of 26% and 22%, respectively. The same legislation also extended the 10-year wind PTC for wind projects which began construction in 2016 through 2019. Wind projects which begin construction in the years 2017, 2018 and 2019 are eligible for PTCs at 80%, 60% and 40% of the statutory rate per kWh, respectively.
Many states have adopted RPS programs mandating that a specified percentage of electricity sales come from eligible sources of renewable energy. However, the regulations that govern the RPS programs, including pricing incentives for renewable energy, or reasonableness guidelines for pricing that increase valuation compared to conventional power (such as a projected value for carbon reduction or consideration of avoided integration costs), may change. If the RPS requirements are reduced or eliminated, it could lead to fewer future power contracts or lead to lower prices for the sale of power in future power contracts, which could have a material adverse effect on the Company's future growth prospects.
Such material adverse effects may result from decreased revenues, reduced economic returns on certain project company investments, increased financing costs, and/or difficulty obtaining financing. Furthermore, the ARRA included incentives to encourage investment in the renewable energy sector, such as cash grants in lieu of ITCs, bonus depreciation and expansion of the U.S. DOE loan guarantee program. It is uncertain what loan guarantees may be made by the U.S. DOE loan guarantee program in the future. In addition, the cash grant in lieu of ITCs program only applies to facilities that commenced construction prior to December 31, 2011, which commencement date may be determined in accordance with the safe harbor if more than 5% of the total cost of the eligible property was paid or incurred by December 31, 2011.
If the Company is unable to utilize various federal, state and local government incentives to acquire additional renewable assets in the future, or the terms of such incentives are revised in a manner that is less favorable to the Company, it may suffer a material adverse effect on the business, financial condition, results of operations and cash flows.
The integration of the Capacity Performance product into the PJM market and the Pay-for-Performance mechanism in ISO-NE could lead to substantial changes in capacity income and non-performance penalties, which could have a material adverse effect on NRG’s results of operations, financial condition and cash flows.
Both ISO-NE and PJM operate a pay-for-performance model where capacity payments are modified based on real-time generator performance. Capacity market prices are sensitive to design parameters, as well as additions of new capacity. NRG may experience substantial changes in capacity income and non-performance penalties, which could have a material adverse effect on NRG’s results of operations, financial condition and cash flows.
Certain of NRG's long-term bilateral contracts result from state-mandated procurements and could be declared invalid by a court of competent jurisdiction.
A significant portion of NRG’s revenues are derived from long-term bilateral contracts with utilities that are regulated by their respective states, and have been entered into pursuant to certain state programs. Certain long-term contracts that other companies have with state-regulated utilities have been challenged in federal court and have been declared unconstitutional on the grounds that the rate for energy and capacity established by the contracts impermissibly conflicts with the rate for energy and capacity established by FERC pursuant to the FPA. If certain of the Company's state-mandated agreements with utilities are ever held to be invalid, NRG may be unable to replace such contracts, which could have a material adverse effect on NRG's business, financial condition, results of operations and cash flows.
47
NRG's ownership interest in a nuclear power facility subjects the Company to regulations, costs and liabilities uniquely associated with these types of facilities.
Under the Atomic Energy Act of 1954, as amended, or AEA, ownership and operation of STP, of which NRG indirectly owns a 44% interest, is subject to regulation by the NRC. Such regulation includes licensing, inspection, enforcement, testing, evaluation and modification of all aspects of nuclear reactor power plant design and operation, environmental and safety performance, technical and financial qualifications, decommissioning funding assurance and transfer and foreign ownership restrictions. The current facility operating licenses for STP expire on August 20, 2027 (Unit 1) and December 15, 2028 (Unit 2). STP has applied for the renewal of such licenses for a period of 20 years beyond the expirations of the current licenses. STP Unit 1 was operating with a single-cycle license amendment issued on December 11, 2015 after a control rod was determined to be inoperable following a scheduled refueling and maintenance outage. The approved license amendment to support STP Unit 1 operation with the inoperable control rod and the associated control rod drive shaft removed was granted by the NRC on December 21, 2016.
There are unique risks to owning and operating a nuclear power facility. These include liabilities related to the handling, treatment, storage, disposal, transport, release and use of radioactive materials, particularly with respect to spent nuclear fuel, and uncertainties regarding the ultimate, and potential exposure to, technical and financial risks associated with modifying or decommissioning a nuclear facility. The NRC could require the shutdown of the plant for safety reasons or refuse to permit restart of the unit after unplanned or planned outages. New or amended NRC safety and regulatory requirements may give rise to additional operation and maintenance costs and capital expenditures. Additionally, aging equipment may require more capital expenditures to keep each of these nuclear power plants operating efficiently. This equipment is also likely to require periodic upgrading and improvement. Any unexpected failure, including failure associated with breakdowns, forced outages, or any unanticipated capital expenditures, could result in reduced profitability. STP will be obligated to continue storing spent nuclear fuel if the U.S. DOE continues to fail to meet its contractual obligations to STP made pursuant to the U.S. Nuclear Waste Policy Act of 1982 to accept and dispose of STP's spent nuclear fuel. See also Item 1
—
Regulatory Matters — Nuclear Operations - Decommissioning Trusts
and Item 1
— Environmental Matters — Federal Environmental Initiatives — Nuclear Waste
for further discussion. Costs associated with these risks could be substantial and could have a material adverse effect on NRG's results of operations, financial condition or cash flow to the extent not covered by the Decommissioning Trusts or recovered from ratepayers. In addition, to the extent that all or a part of STP is required by the NRC to permanently or temporarily shut down or modify its operations, or is otherwise subject to a forced outage, NRG may incur additional costs to the extent it is obligated to provide power from more expensive alternative sources — either NRG's own plants, third party generators or the ERCOT — to cover the Company's then existing forward sale obligations. Such shutdown or modification could also lead to substantial costs related to the storage and disposal of radioactive materials and spent nuclear fuel.
While STP maintains property and liability insurance for losses related to nuclear operations, there may be limitations on the amounts and types of insurance commercially available. See also Item 15
—
Note 22
,
Commitments and Contingencies
,
Nuclear Insurance
. An accident at STP or another nuclear facility could have a material adverse effect on NRG's financial condition, its operational results, or liquidity as losses may exceed the insurance coverage available and/or may result in the obligation to pay retrospective premium obligations.
NRG is subject to environmental laws that impose extensive and increasingly stringent requirements on the Company's ongoing operations, as well as potentially substantial liabilities arising out of environmental contamination. These environmental requirements and liabilities could adversely impact NRG's results of operations, financial condition and cash flows.
NRG is subject to the environmental laws of foreign and U.S., federal, state and local authorities. The Company must comply with numerous environmental laws and obtain numerous governmental permits and approvals to build and operate the Company's plants. Should NRG fail to comply with any environmental requirements that apply to its operations, the Company could be subject to administrative, civil and/or criminal liability and fines, and regulatory agencies could take other actions seeking to curtail the Company's operations. In addition, when new requirements take effect or when existing environmental requirements are revised, reinterpreted or subject to changing enforcement policies, NRG's business, results of operations, financial condition and cash flows could be adversely affected.
Federal and state environmental laws generally have become more stringent although this trend could change with respect to federal laws under the new U.S. presidential administration.
48
NRG's businesses are subject to physical, market and economic risks relating to potential effects of climate change.
Climate change may produce changes in weather or other environmental conditions, including temperature or precipitation levels, and thus may impact consumer demand for electricity. In addition, the potential physical effects of climate change, such as increased frequency and severity of storms, floods and other climatic events, could disrupt NRG's operations and cause it to incur significant costs in preparing for or responding to these effects. These or other meteorological changes could lead to increased operating costs, capital expenses or power purchase costs. Climate change could also affect the availability of a secure and economical supply of water in some locations, which is essential for the continued operation of NRG's generation plants.
GHG regulation could increase the cost of electricity, particularly power generated by fossil fuels, and such increases could have a depressive effect on regional economies. Reduced economic and consumer activity in NRG's service areas — both generally and specific to certain industries and consumers accustomed to previously lower cost power — could reduce demand for the power NRG generates and markets. Also, demand for NRG's energy-related services could be similarly reduced by consumers’ preferences or market factors favoring energy efficiency, low-carbon power sources or reduced electricity usage.
Policies at the national, regional and state levels to regulate GHG emissions, as well as climate change, could adversely impact NRG's results of operations, financial condition and cash flows.
NRG's GHG emissions for
2016
can be found in Item 1,
Business — Environmental Matters.
On October 23, 2015, the EPA promulgated the final GHG emissions rules for new and existing fossil-fuel-fired electric generating units. The impact of these newly promulgated rules and further legislation or regulation of GHGs on the Company's financial performance will depend on a number of factors, including the actions of the new U.S. presidential administration, the outcome of the legal challenges to promulgated regulations, and the extent to which NRG will be entitled to receive CO
2
emissions credits without having to purchase them in an auction or on the open market.
The Company operates generating units in Connecticut, Delaware, Maryland, Massachusetts, and New York that are subject to RGGI, which is a regional cap and trade system. In 2013, each of these states finalized a rule that reduced and will continue to reduce the number of allowances through 2020. The nine RGGI states are re-evaluating the program and may alter the rules to further reduce the number of allowances. The revisions being currently contemplated could adversely impact NRG's results of operations, financial condition and cash flows.
California has a CO
2
cap and trade program for electric generating units greater than 25 MW. The impact on the Company depends on the cost of the allowances and the ability to pass these costs through to customers.
On October 26, 2015, the EPA promulgated a rule that reduces the ozone NAAQS to 0.070 ppm. If it survives legal challenges, this more stringent NAAQS will obligate the states to develop plans to reduce NO
x
(an ozone precursor), which could affect some of the Company's units.
Hazards customary to the power production industry include the potential for unusual weather conditions, which could affect fuel pricing and availability, the Company's route to market or access to customers, i.e., transmission and distribution lines, or critical plant assets. To the extent that climate change contributes to the frequency or intensity of weather-related events, NRG's operations and planning process could be affected.
NRG's retail businesses are subject to changing state rules and regulations that could have a material impact on the profitability of its business lines.
The competitiveness of NRG's retail businesses is partially dependent on state regulatory policies that establish the structure, rules, terms and conditions on which services are offered to retail customers. These state policies, which can include controls on the retail rates NRG's retail businesses can charge, the imposition of additional costs on sales, restrictions on the Company's ability to obtain new customers through various marketing channels and disclosure requirements, which can affect the competitiveness of NRG's retail businesses. Additionally, state or federal imposition of net metering or RPS programs can make it more or less expensive for retail customers to supplement or replace their reliance on grid power. NRG's retail businesses have limited ability to influence development of these policies, and its business model may be more or less effective, depending on changes to the regulatory environment.
49
The Company's international operations are exposed to political and economic risks, commercial instability and events beyond the Company's control in the countries in which it operates, which risks may negatively impact the Company's business.
The Company's international operations are dependent upon products manufactured, purchased and sold in the U.S. and internationally, including in countries with political and economic instability. In some cases, these countries have greater political and economic volatility and greater vulnerability to infrastructure and labor disruptions than in NRG's other markets. The Company's business could be negatively impacted by adverse fluctuations in freight costs, limitations on shipping and receiving capacity, and other disruptions in the transportation and shipping infrastructure at important geographic points of exit and entry for the Company's products. Operating and seeking to expand business in a number of different regions and countries exposes the Company to a number of risks, including:
|
•
|
multiple and potentially conflicting laws, regulations and policies that are subject to change;
|
|
•
|
imposition of currency restrictions on repatriation of earnings or other restraints;
|
|
•
|
imposition of burdensome tariffs or quotas;
|
|
•
|
national and international conflict, including terrorist acts; and
|
|
•
|
political and economic instability or civil unrest that may severely disrupt economic activity in affected countries.
|
The occurrence of one or more of these events may negatively impact the Company's business, results of operations and financial condition.
The Company may potentially be affected by emerging technologies that may over time affect change in capacity markets and the energy industry overall with the inclusion of distributed generation and clean technology.
Some technologies like, distributed renewable energy technologies, broad consumer adoption of electric vehicles and energy storage devices could affect the price of energy. These distributed technologies may affect the financial viability of utility counterparties and could have significant impacts on wholesale market prices.
Risks Related to Economic and Financial Market Conditions
NRG's level of indebtedness could adversely affect its ability to raise additional capital to fund its operations or return capital to stockholders. It could also expose it to the risk of increased interest rates and limit its ability to react to changes in the economy or its industry.
NRG's substantial debt could have negative consequences, including:
|
•
|
increasing NRG's vulnerability to general economic and industry conditions;
|
|
•
|
requiring a substantial portion of NRG's cash flow from operations to be dedicated to the payment of principal and interest on its indebtedness, therefore reducing NRG's ability to pay dividends to holders of its preferred or common stock or to use its cash flow to fund its operations, capital expenditures and future business opportunities;
|
|
•
|
limiting NRG's ability to enter into long-term power sales or fuel purchases which require credit support;
|
|
•
|
exposing NRG to the risk of increased interest rates because certain of its borrowings, including borrowings under its senior secured credit facility are at variable rates of interest;
|
|
•
|
limiting NRG's ability to obtain additional financing for working capital including collateral postings, capital expenditures, debt service requirements, acquisitions and general corporate or other purposes; and
|
|
•
|
limiting NRG's ability to adjust to changing market conditions and placing it at a competitive disadvantage compared to its competitors who have less debt.
|
The indentures for NRG's notes and senior secured credit facility contain financial and other restrictive covenants that may limit the Company's ability to return capital to stockholders or otherwise engage in activities that may be in its long-term best interests. Furthermore, financial and other restrictive covenants contained in any project level subsidiary debt may limit the ability of NRG to receive distributions from such subsidiary. NRG's failure to comply with those covenants could result in an event of default which, if not cured or waived, could result in the acceleration of all of the Company's indebtedness.
50
In addition, NRG's ability to arrange financing, either at the corporate level, a non-recourse project-level subsidiary or otherwise, and the costs of such capital, are dependent on numerous factors, including:
|
•
|
general economic and capital market conditions;
|
|
•
|
credit availability from banks and other financial institutions;
|
|
•
|
investor confidence in NRG, its partners and the regional wholesale power markets;
|
|
•
|
NRG's financial performance and the financial performance of its subsidiaries;
|
|
•
|
NRG's level of indebtedness and compliance with covenants in debt agreements;
|
|
•
|
maintenance of acceptable credit ratings;
|
|
•
|
cash flow; and
|
|
•
|
provisions of tax and securities laws that may impact raising capital.
|
NRG may not be successful in obtaining additional capital for these or other reasons. The failure to obtain additional capital from time to time may have a material adverse effect on its business and operations.
Adverse economic conditions could adversely affect NRG’s business, financial condition, results of operations and cash flows.
Adverse economic conditions and declines in wholesale energy prices, partially resulting from adverse economic conditions, may impact NRG’s earnings. The breadth and depth of negative economic conditions may have a wide-ranging impact on the U.S. business environment, including NRG’s businesses. In addition, adverse economic conditions also reduce the demand for energy commodities. Reduced demand from negative economic conditions continues to impact the key domestic wholesale energy markets NRG serves. The combination of lower demand for power and increased supply of natural gas has put downward price pressure on wholesale energy markets in general, further impacting NRG’s energy marketing results. In general, economic and commodity market conditions will continue to impact NRG’s unhedged future energy margins, liquidity, earnings growth and overall financial condition. In addition, adverse economic conditions, declines in wholesale energy prices, reduced demand for power and other factors may negatively impact the trading price of NRG’s common stock and impact forecasted cash flows, which may require NRG to evaluate its goodwill and other long-lived assets for impairment. Any such impairment could have a material impact on NRG’s financial statements.
Goodwill and/or other intangible assets not subject to amortization that NRG has recorded in connection with its acquisitions are subject to mandatory annual impairment evaluations and as a result, the Company could be required to write off some or all of this goodwill and other intangible assets, which may adversely affect the Company's financial condition and results of operations.
In accordance with ASC 350,
Intangibles — Goodwill and Other,
or ASC 350, goodwill is not amortized but is reviewed annually or more frequently for impairment and other intangibles are also reviewed at least annually or more frequently, if certain conditions exist, and may be amortized. Any reduction in or impairment of the value of goodwill or other intangible assets will result in a charge against earnings which could materially adversely affect NRG's reported results of operations and financial position in future periods.
A valuation allowance may be required for NRG's deferred tax assets.
A valuation allowance may need to be recorded against the net deferred tax assets, which are predominantly related to NRG Yield, Inc., that the Company estimates as more likely than not to be unrealizable, based on available evidence including cumulative and forecasted pretax book earnings at the time the estimate is made. A valuation allowance related to deferred tax assets can be affected by changes to tax laws, statutory tax rates and future taxable income levels. In the event that the Company determines that it would not be able to realize all or a portion of its net deferred tax assets in the future, the Company would reduce such amounts accordingly through a charge to income tax expense in the period in which that determination was made, which could have a material adverse impact on the Company's financial condition and results of operations.
51
The Company has made investments, and may continue to make investments, in new business initiatives predominantly focused on consumer products and in markets that may not be successful, may not achieve the intended financial results or may result in product liability and reputational risk that could adversely affect the Company.
NRG continues to pursue growth in its existing businesses and markets and further diversification across the competitive energy value chain. NRG is continuing to pursue investment opportunities in renewables, consumer products and distributed generation. Such initiatives may involve significant risks and uncertainties, including distraction of management from current operations, inadequate return on capital, and unidentified issues not discovered in the diligence performed prior to launching an initiative or entering a market.
As part of these initiatives, the Company may be liable to customers for any damage caused to customers’ homes, facilities, belongings or property during the installation of Company products and systems, such as residential solar systems and mass market back-up generators. In addition, shortages of skilled labor for Company projects could significantly delay a project or otherwise increase its costs. The products that the Company sells or manufactures may expose the Company to product liability claims relating to personal injury, death, or environmental or property damage, and may require product recalls or other actions. Although the Company maintains liability insurance, the Company cannot be certain that its coverage will be adequate for liabilities actually incurred or that insurance will continue to be available to the Company on economically reasonable terms, or at all. Further, any product liability claim or damage caused by the Company could significantly impair the Company’s brand and reputation, which may result in a failure to maintain customers and achieve the Company’s desired growth initiatives in these new businesses.
52
CAUTIONARY STATEMENT REGARDING FORWARD-LOOKING INFORMATION
This Annual Report on Form 10-K of NRG Energy, Inc., or NRG or the Company, includes forward-looking statements within the meaning of Section 27A of the Securities Act of 1933, as amended, or Securities Act, and Section 21E of the Securities Exchange Act of 1934, as amended, or Exchange Act. The words "believes," "projects," "anticipates," "plans," "expects," "intends," "estimates" and similar expressions are intended to identify forward-looking statements. These forward-looking statements involve known and unknown risks, uncertainties and other factors that may cause NRG's actual results, performance and achievements, or industry results, to be materially different from any future results, performance or achievements expressed or implied by such forward-looking statements. These factors, risks and uncertainties include the factors described under Item 1A —
Risk Factors Related to NRG Energy, Inc.
and the following:
|
•
|
GenOn's and certain of its subsidiaries' ability to continue as a going concern;
|
|
•
|
General economic conditions, changes in the wholesale power markets and fluctuations in the cost of fuel;
|
|
•
|
Volatile power supply costs and demand for power;
|
|
•
|
Hazards customary to the power production industry and power generation operations such as fuel and electricity price volatility, unusual weather conditions, catastrophic weather-related or other damage to facilities, unscheduled generation outages, maintenance or repairs, unanticipated changes to fuel supply costs or availability due to higher demand, shortages, transportation problems or other developments, environmental incidents, or electric transmission or gas pipeline system constraints and the possibility that NRG may not have adequate insurance to cover losses as a result of such hazards;
|
|
•
|
The effectiveness of NRG's risk management policies and procedures, and the ability of NRG's counterparties to satisfy their financial commitments;
|
|
•
|
Counterparties' collateral demands and other factors affecting NRG's liquidity position and financial condition;
|
|
•
|
NRG's ability to operate its businesses efficiently, manage capital expenditures and costs tightly, and generate earnings and cash flows from its asset-based businesses in relation to its debt and other obligations;
|
|
•
|
NRG's ability to enter into contracts to sell power and procure fuel on acceptable terms and prices;
|
|
•
|
The liquidity and competitiveness of wholesale markets for energy commodities;
|
|
•
|
Government regulation, including compliance with regulatory requirements and changes in market rules, rates, tariffs and environmental laws and increased regulation of carbon dioxide and other GHG emissions;
|
|
•
|
Changes in law, including judicial decisions;
|
|
•
|
Price mitigation strategies and other market structures employed by ISOs or RTOs that result in a failure to adequately and fairly compensate NRG's generation units;
|
|
•
|
NRG's ability to mitigate forced outage risk for units subject to capacity performance requirements in PJM, performance incentives in ISO-NE, and scarcity pricing in ERCOT;
|
|
•
|
NRG's ability to borrow funds and access capital markets, as well as NRG's substantial indebtedness and the possibility that NRG may incur additional indebtedness going forward;
|
|
•
|
NRG's ability to receive loan guarantees or cash grants to support development projects;
|
|
•
|
Operating and financial restrictions placed on NRG and its subsidiaries that are contained in the indentures governing NRG's outstanding notes, in NRG's 2016 Senior Credit Facility, and in debt and other agreements of certain of NRG subsidiaries and project affiliates generally;
|
|
•
|
Cyber terrorism and inadequate cybersecurity, or the occurrence of a catastrophic loss and the possibility that NRG may not have adequate insurance to cover losses resulting from such hazards or the inability of NRG's insurers to provide coverage;
|
|
•
|
NRG's ability to develop and build new power generation facilities, including new renewable projects;
|
|
•
|
NRG's ability to develop and innovate new products as retail and wholesale markets continue to change and evolve;
|
|
•
|
NRG's ability to implement its strategy of finding ways to meet the challenges of climate change, clean air and protecting natural resources while taking advantage of business opportunities;
|
|
•
|
NRG's ability to increase cash from operations through operational and commercial initiatives, corporate efficiencies, asset strategy, and a range of other programs throughout NRG to reduce costs or generate revenues;
|
|
•
|
NRG's ability to sell assets to NRG Yield, Inc. and to close drop-down transactions;
|
|
•
|
NRG's ability to achieve its strategy of regularly returning capital to stockholders;
|
|
•
|
NRG's ability to obtain and maintain retail market share;
|
|
•
|
NRG's ability to successfully evaluate investments and achieve intended financial results in new business and growth initiatives;
|
|
•
|
NRG's ability to engage in successful mergers and acquisitions activity;
|
53
|
•
|
NRG's ability to successfully integrate, realize cost savings and manage any acquired businesses; and
|
|
•
|
NRG's ability to develop and maintain successful partnering relationships.
|
Forward-looking statements speak only as of the date they were made, and NRG Energy, Inc. undertakes no obligation to publicly update or revise any forward-looking statements, whether as a result of new information, future events or otherwise. The foregoing review of factors that could cause NRG's actual results to differ materially from those contemplated in any forward-looking statements included in this Annual Report on Form 10-K should not be construed as exhaustive.
None.
54
Listed below are descriptions of NRG's interests in facilities, operations and/or projects owned or leased as of
December 31, 2016
. The MW figures provided represent nominal summer net MW capacity of power generated as adjusted for the Company's owned or leased interest excluding capacity from inactive/mothballed units as of
December 31, 2016
. The following table summarizes NRG's power production and cogeneration facilities by region:
|
Name of Facility
|
Power Market
|
Plant Type
|
Primary Fuel
|
Location
|
Rated MW Capacity
|
Net MW Capacity
(a)
|
% Owned
|
||||||||||
|
Gulf Coast Region
|
|||||||||||||||||
|
Bayou Cove
|
MISO
|
Fossil
|
Natural Gas
|
LA
|
225
|
|
225
|
|
100.0
|
|
|||||||
|
Big Cajun I
|
MISO
|
Fossil
|
Natural Gas
|
LA
|
430
|
|
430
|
|
100.0
|
|
|||||||
|
Big Cajun II
|
MISO
|
Fossil
|
Coal
|
LA
|
580
|
|
580
|
|
100.0
|
|
|||||||
|
Big Cajun II
|
MISO
|
Fossil
|
Natural Gas
|
LA
|
540
|
|
540
|
|
100.0
|
|
|||||||
|
Big Cajun II
|
MISO
|
Fossil
|
Coal
|
LA
|
588
|
|
341
|
|
58.0
|
|
|||||||
|
Cedar Bayou
|
ERCOT
|
Fossil
|
Natural Gas
|
TX
|
1,495
|
|
1,495
|
|
100.0
|
|
|||||||
|
Cedar Bayou 4
|
ERCOT
|
Fossil
|
Natural Gas
|
TX
|
498
|
|
249
|
|
50.0
|
|
|||||||
|
Choctaw
(j)
|
TVA
(f)
|
Fossil
|
Natural Gas
|
MS
|
800
|
|
800
|
|
100.0
|
|
|||||||
|
Cottonwood
|
MISO
|
Fossil
|
Natural Gas
|
TX
|
1,263
|
|
1,263
|
|
100.0
|
|
|||||||
|
Greens Bayou
|
ERCOT
|
Fossil
|
Natural Gas
|
TX
|
715
|
|
715
|
|
100.0
|
|
|||||||
|
Gregory
|
ERCOT
|
Fossil
|
Natural Gas
|
TX
|
388
|
|
388
|
|
100.0
|
|
|||||||
|
Limestone
|
ERCOT
|
Fossil
|
Coal
|
TX
|
1,689
|
|
1,689
|
|
100.0
|
|
|||||||
|
Petra Nova Cogen
|
ERCOT
|
Fossil
|
Natural Gas
|
TX
|
22
|
|
22
|
|
50.0
|
|
|||||||
|
San Jacinto
|
ERCOT
|
Fossil
|
Natural Gas
|
TX
|
162
|
|
162
|
|
100.0
|
|
|||||||
|
South Texas Project
(b)
|
ERCOT
|
Nuclear
|
Uranium
|
TX
|
2,673
|
|
1,136
|
|
44.0
|
|
|||||||
|
Sterlington
|
MISO
|
Fossil
|
Natural Gas
|
LA
|
176
|
|
176
|
|
100.0
|
|
|||||||
|
T.H. Wharton
|
ERCOT
|
Fossil
|
Natural Gas
|
TX
|
1,025
|
|
1,025
|
|
100.0
|
|
|||||||
|
W.A. Parish
|
ERCOT
|
Fossil
|
Coal
|
TX
|
2,504
|
|
2,504
|
|
100.0
|
|
|||||||
|
W.A. Parish
(c)
|
ERCOT
|
Fossil
|
Natural Gas
|
TX
|
1,145
|
|
1,145
|
|
100.0
|
|
|||||||
|
Total Gulf Coast Region
|
16,918
|
|
14,885
|
|
|||||||||||||
|
East Region
|
|||||||||||||||||
|
Arthur Kill
|
NYISO
|
Fossil
|
Natural Gas
|
NY
|
858
|
|
858
|
|
100.0
|
|
|||||||
|
Astoria Gas Turbines
|
NYISO
|
Fossil
|
Natural Gas
|
NY
|
404
|
|
404
|
|
100.0
|
|
|||||||
|
Avon Lake
(j)
|
PJM
|
Fossil
|
Coal
|
OH
|
638
|
|
638
|
|
100.0
|
|
|||||||
|
Avon Lake
(j)
|
PJM
|
Fossil
|
Oil
|
OH
|
21
|
|
21
|
|
100.0
|
|
|||||||
|
Blossburg
(j)
|
PJM
|
Fossil
|
Natural Gas
|
PA
|
19
|
|
19
|
|
100.0
|
|
|||||||
|
Bowline
(j)
|
NYISO
|
Fossil
|
Natural Gas
|
NY
|
1,147
|
|
1,147
|
|
100.0
|
|
|||||||
|
Brunot Island
(j)
|
PJM
|
Fossil
|
Natural Gas
|
PA
|
244
|
|
244
|
|
100.0
|
|
|||||||
|
Brunot Island
(j)
|
PJM
|
Fossil
|
Oil
|
PA
|
15
|
|
15
|
|
100.0
|
|
|||||||
|
Canal
(j)
|
ISO-NE
|
Fossil
|
Oil
|
MA
|
1,112
|
|
1,112
|
|
100.0
|
|
|||||||
|
Chalk Point
(j)
|
PJM
|
Fossil
|
Coal
|
MD
|
667
|
|
667
|
|
100.0
|
|
|||||||
|
Chalk Point
(j)
|
PJM
|
Fossil
|
Natural Gas
|
MD
|
1,570
|
|
1,570
|
|
100.0
|
|
|||||||
|
Chalk Point
(j)
|
PJM
|
Fossil
|
Oil
|
MD
|
42
|
|
42
|
|
100.0
|
|
|||||||
|
Cheswick
(j)
|
PJM
|
Fossil
|
Coal
|
PA
|
565
|
|
565
|
|
100.0
|
|
|||||||
|
Conemaugh
(i)
(j)
|
PJM
|
Fossil
|
Coal
|
PA
|
1,698
|
|
343
|
|
20.2
|
|
|||||||
|
Conemaugh
(i)
(j)
|
PJM
|
Fossil
|
Oil
|
PA
|
10
|
|
2
|
|
20.2
|
|
|||||||
|
Connecticut Jet Power
|
ISO-NE
|
Fossil
|
Oil
|
CT
|
142
|
|
142
|
|
100.0
|
|
|||||||
|
Devon
|
ISO-NE
|
Fossil
|
Oil
|
CT
|
133
|
|
133
|
|
100.0
|
|
|||||||
|
Dickerson
(d)
(j)
|
PJM
|
Fossil
|
Coal
|
MD
|
537
|
|
537
|
|
100.0
|
|
|||||||
|
Dickerson
(d)
(j)
|
PJM
|
Fossil
|
Natural Gas
|
MD
|
294
|
|
294
|
|
100.0
|
|
|||||||
55
|
Name of Facility
|
Power Market
|
Plant Type
|
Primary Fuel
|
Location
|
Rated MW Capacity
|
Net MW Capacity
(a)
|
% Owned
|
||||||||||
|
East Region (continued)
|
|||||||||||||||||
|
Dickerson
(d)
(j)
|
PJM
|
Fossil
|
Oil
|
MD
|
18
|
|
18
|
|
100.0
|
|
|||||||
|
Fisk
|
PJM
|
Fossil
|
Oil
|
IL
|
172
|
|
172
|
|
100.0
|
|
|||||||
|
Gilbert
(j)
|
PJM
|
Fossil
|
Natural Gas
|
NJ
|
438
|
|
438
|
|
100.0
|
|
|||||||
|
Hamilton
(j)
|
PJM
|
Fossil
|
Oil
|
PA
|
20
|
|
20
|
|
100.0
|
|
|||||||
|
Hunterstown CCGT
(j)
|
PJM
|
Fossil
|
Natural Gas
|
PA
|
810
|
|
810
|
|
100.0
|
|
|||||||
|
Hunterstown CTS
(j)
|
PJM
|
Fossil
|
Natural Gas
|
PA
|
60
|
|
60
|
|
100.0
|
|
|||||||
|
Indian River
|
PJM
|
Fossil
|
Coal
|
DE
|
410
|
|
410
|
|
100.0
|
|
|||||||
|
Indian River
|
PJM
|
Fossil
|
Oil
|
DE
|
16
|
|
16
|
|
100.0
|
|
|||||||
|
Joliet
(e)
|
PJM
|
Fossil
|
Natural Gas
|
IL
|
1,326
|
|
1,326
|
|
100.0
|
|
|||||||
|
Keystone
(i)
(j)
|
PJM
|
Fossil
|
Coal
|
PA
|
1,696
|
|
346
|
|
20.4
|
|
|||||||
|
Keystone
(i)
(j)
|
PJM
|
Fossil
|
Oil
|
PA
|
10
|
|
2
|
|
20.4
|
|
|||||||
|
Martha's Vineyard
(j)
|
ISO-NE
|
Fossil
|
Oil
|
MA
|
14
|
|
14
|
|
100.0
|
|
|||||||
|
Middletown
|
ISO-NE
|
Fossil
|
Oil
|
CT
|
770
|
|
770
|
|
100.0
|
|
|||||||
|
Montville
|
ISO-NE
|
Fossil
|
Oil
|
CT
|
494
|
|
494
|
|
100.0
|
|
|||||||
|
Morgantown
(d)
(j)
|
PJM
|
Fossil
|
Coal
|
MD
|
1,229
|
|
1,229
|
|
100.0
|
|
|||||||
|
Morgantown
(d)
(j)
|
PJM
|
Fossil
|
Oil
|
MD
|
248
|
|
248
|
|
100.0
|
|
|||||||
|
Mountain
(j)
|
PJM
|
Fossil
|
Oil
|
PA
|
40
|
|
40
|
|
100.0
|
|
|||||||
|
New Castle
(j)
|
PJM
|
Fossil
|
Natural Gas
|
PA
|
325
|
|
325
|
|
100.0
|
|
|||||||
|
New Castle
(j)
|
PJM
|
Fossil
|
Oil
|
PA
|
3
|
|
3
|
|
100.0
|
|
|||||||
|
Niles
(j)
|
PJM
|
Fossil
|
Oil
|
OH
|
25
|
|
25
|
|
100.0
|
|
|||||||
|
Orrtanna
(j)
|
PJM
|
Fossil
|
Oil
|
PA
|
20
|
|
20
|
|
100.0
|
|
|||||||
|
Oswego
|
NYISO
|
Fossil
|
Oil
|
NY
|
1,628
|
|
1,628
|
|
100.0
|
|
|||||||
|
Portland
(j)
|
PJM
|
Fossil
|
Oil
|
PA
|
169
|
|
169
|
|
100.0
|
|
|||||||
|
Powerton
(e)
|
PJM
|
Fossil
|
Coal
|
IL
|
1,538
|
|
1,538
|
|
100.0
|
|
|||||||
|
Sayreville
(j)
|
PJM
|
Fossil
|
Natural Gas
|
NJ
|
217
|
|
217
|
|
100.0
|
|
|||||||
|
Shawnee
(j)
|
PJM
|
Fossil
|
Oil
|
PA
|
20
|
|
20
|
|
100.0
|
|
|||||||
|
Shawville
(d)
(j)
|
PJM
|
Fossil
|
Oil
|
PA
|
6
|
|
6
|
|
100.0
|
|
|||||||
|
Shawville
(d)
(j)
|
PJM
|
Fossil
|
Natural Gas
|
PA
|
597
|
|
597
|
|
100.0
|
|
|||||||
|
SMECO
|
PJM
|
Fossil
|
Natural Gas
|
MD
|
78
|
|
78
|
|
100.0
|
|
|||||||
|
Titus
(j)
|
PJM
|
Fossil
|
Oil
|
PA
|
31
|
|
31
|
|
100.0
|
|
|||||||
|
Tolna
(j)
|
PJM
|
Fossil
|
Oil
|
PA
|
39
|
|
39
|
|
100.0
|
|
|||||||
|
Vienna
|
PJM
|
Fossil
|
Oil
|
MD
|
167
|
|
167
|
|
100.0
|
|
|||||||
|
Warren
(j)
|
PJM
|
Fossil
|
Natural Gas
|
PA
|
57
|
|
57
|
|
100.0
|
|
|||||||
|
Waukegan
|
PJM
|
Fossil
|
Coal
|
IL
|
682
|
|
682
|
|
100.0
|
|
|||||||
|
Waukegan
|
PJM
|
Fossil
|
Oil
|
IL
|
108
|
|
108
|
|
100.0
|
|
|||||||
|
Will County
|
PJM
|
Fossil
|
Coal
|
IL
|
510
|
|
510
|
|
100.0
|
|
|||||||
|
Total East Region
|
24,107
|
|
21,386
|
|
|||||||||||||
|
West Region
|
|||||||||||||||||
|
Ellwood
(j)
|
CAISO
|
Fossil
|
Natural Gas
|
CA
|
54
|
|
54
|
|
100.0
|
|
|||||||
|
Encina
(l)
|
CAISO
|
Fossil
|
Natural Gas
|
CA
|
965
|
|
965
|
|
100.0
|
|
|||||||
|
Etiwanda
(j)
|
CAISO
|
Fossil
|
Natural Gas
|
CA
|
640
|
|
640
|
|
100.0
|
|
|||||||
|
Long Beach
|
CAISO
|
Fossil
|
Natural Gas
|
CA
|
260
|
|
260
|
|
100.0
|
|
|||||||
|
Mandalay
(j)
|
CAISO
|
Fossil
|
Natural Gas
|
CA
|
560
|
|
560
|
|
100.0
|
|
|||||||
|
Midway-Sunset
|
CAISO
|
Fossil
|
Natural Gas
|
CA
|
226
|
|
113
|
|
50.0
|
|
|||||||
|
Ormond Beach
(j)
|
CAISO
|
Fossil
|
Natural Gas
|
CA
|
1,516
|
|
1,516
|
|
100.0
|
|
|||||||
|
Pittsburg
(j)(k)
|
CAISO
|
Fossil
|
Natural Gas
|
CA
|
1,029
|
|
1,029
|
|
100.0
|
|
|||||||
56
|
Name of Facility
|
Power Market
|
Plant Type
|
Primary Fuel
|
Location
|
Rated MW Capacity
|
Net MW Capacity
(a)
|
% Owned
|
||||||||||
|
West Region (continued)
|
|||||||||||||||||
|
Saguaro Power Co.
|
WECC
|
Fossil
|
Natural Gas
|
NV
|
92
|
|
46
|
|
50.0
|
|
|||||||
|
San Diego Combustion Turbines
(g)
|
CAISO
|
Fossil
|
Natural Gas
|
CA
|
112
|
|
112
|
|
100.0
|
|
|||||||
|
Sunrise
|
CAISO
|
Fossil
|
Natural Gas
|
CA
|
586
|
|
586
|
|
100.0
|
|
|||||||
|
Watson
|
CAISO
|
Fossil
|
Natural Gas
|
CA
|
416
|
|
204
|
|
49.0
|
|
|||||||
|
Total West Region
|
6,456
|
|
6,085
|
|
|||||||||||||
|
Other
|
|||||||||||||||||
|
Gladstone Power Station
|
Fossil
|
Coal
|
AUS
|
756
|
|
605
|
|
80.0
|
|
||||||||
|
Doga
|
Fossil
|
Natural Gas
|
TUR
|
384
|
|
144
|
|
37.5
|
|
||||||||
|
Total Other
|
1,140
|
|
749
|
|
|||||||||||||
|
Renewables
|
|||||||||||||||||
|
Agua Caliente
(m)
|
CAISO/WECC
|
Renewable
|
Solar
|
AZ
|
290
|
|
148
|
|
51.0
|
|
|||||||
|
Bingham Lake
|
MISO
|
Renewable
|
Wind
|
MN
|
15
|
|
15
|
|
99.0
|
|
|||||||
|
Broken Bow
(m)
|
MISO
|
Renewable
|
Wind
|
NE
|
80
|
|
13
|
|
16.0
|
|
|||||||
|
Cedro Hill
(m)
|
ERCOT
|
Renewable
|
Wind
|
TX
|
150
|
|
47
|
|
31.0
|
|
|||||||
|
Community Solar
|
CAISO
|
Renewable
|
Solar
|
CA
|
6
|
|
6
|
|
100.0
|
|
|||||||
|
Community Wind North
|
MISO
|
Renewable
|
Wind
|
MN
|
30
|
|
30
|
|
99.0
|
|
|||||||
|
Crofton Bluffs
(m)
|
MISO
|
Renewable
|
Wind
|
NE
|
42
|
|
8
|
|
20.0
|
|
|||||||
|
Distributed Solar
|
AZNMSNV/WECC
|
Renewable
|
Solar
|
various
|
105
|
|
105
|
|
100.0
|
|
|||||||
|
Eastridge
|
MISO
|
Renewable
|
Wind
|
MN
|
10
|
|
10
|
|
99.0
|
|
|||||||
|
Four Brothers Solar
|
WECC
|
Renewable
|
Solar
|
UT
|
320
|
|
160
|
|
50.0
|
|
|||||||
|
Granite Mountain
|
WECC
|
Renewable
|
Solar
|
UT
|
130
|
|
65
|
|
50.0
|
|
|||||||
|
Guam
|
Renewable
|
Solar
|
Guam
|
26
|
|
26
|
|
100.0
|
|
||||||||
|
Iron Springs
|
WECC
|
Renewable
|
Solar
|
UT
|
80
|
|
40
|
|
50.0
|
|
|||||||
|
Ivanpah
(m)
|
CAISO
|
Renewable
|
Solar
|
CA
|
390
|
|
195
|
|
50.1
|
|
|||||||
|
Jeffers
|
MISO
|
Renewable
|
Wind
|
MN
|
50
|
|
50
|
|
99.9
|
|
|||||||
|
Langford Wind Farm
|
ERCOT
|
Renewable
|
Wind
|
TX
|
150
|
|
150
|
|
100.0
|
|
|||||||
|
Mountain Wind I
(m)
|
WECC
|
Renewable
|
Wind
|
WY
|
61
|
|
19
|
|
31.0
|
|
|||||||
|
Mountain Wind II
(m)
|
WECC
|
Renewable
|
Wind
|
WY
|
80
|
|
25
|
|
31.0
|
|
|||||||
|
Sherbino Wind Farm
|
ERCOT
|
Renewable
|
Wind
|
TX
|
150
|
|
75
|
|
50.0
|
|
|||||||
|
Spanish Town
|
Renewable
|
Solar
|
USVI
|
4
|
|
4
|
|
100.0
|
|
||||||||
|
Stadiums
|
Renewable
|
Solar
|
various
|
6
|
|
6
|
|
100.0
|
|
||||||||
|
Westridge
|
MISO
|
Renewable
|
Wind
|
MN
|
18
|
|
17
|
|
96.9
|
|
|||||||
|
2,193
|
|
1,214
|
|
||||||||||||||
|
Renewables capacity for Co-Owned Facilities with NRG Yield
|
201
|
|
|||||||||||||||
|
Net Renewables
|
1,415
|
|
|||||||||||||||
|
NRG Yield
|
|||||||||||||||||
|
Alpine
|
CAISO
|
Renewable
|
Solar
|
CA
|
66
|
|
66
|
|
100.0
|
|
|||||||
|
Alta Wind
|
CAISO
|
Renewable
|
Wind
|
CA
|
947
|
|
947
|
|
100.0
|
|
|||||||
|
Avenal
|
CAISO
|
Renewable
|
Solar
|
CA
|
45
|
|
23
|
|
50.0
|
|
|||||||
|
Avra Valley
|
CAISO
|
Renewable
|
Solar
|
AZ
|
26
|
|
26
|
|
100.0
|
|
|||||||
|
Blythe
|
CAISO
|
Renewable
|
Solar
|
CA
|
21
|
|
21
|
|
100.0
|
|
|||||||
|
Borrego
|
CAISO
|
Renewable
|
Solar
|
CA
|
26
|
|
26
|
|
100.0
|
|
|||||||
|
Buffalo Bear
|
SPP
|
Renewable
|
Wind
|
OK
|
19
|
|
19
|
|
100.0
|
|
|||||||
57
|
Name of Facility
|
Power Market
|
Plant Type
|
Primary Fuel
|
Location
|
Rated MW Capacity
|
Net MW Capacity
(a)
|
% Owned
|
||||||||||
|
NRG Yield (continued)
|
|||||||||||||||||
|
California Valley Solar Ranch
|
CAISO/WECC
|
Renewable
|
Solar
|
OK
|
250
|
|
250
|
|
100.0
|
|
|||||||
|
Desert Sunlight
|
CAISO
|
Renewable
|
Solar
|
IA
|
550
|
|
138
|
|
25.0
|
|
|||||||
|
AZ DG Solar
|
AZNMSNV
|
Renewable
|
Solar
|
CA
|
5
|
|
5
|
|
100.0
|
|
|||||||
|
PFMG DG Solar
|
WECC
|
Renewable
|
Solar
|
AZ
|
9
|
|
4
|
|
51.0
|
|
|||||||
|
Dover Cogeneration
|
PJM
|
Fossil
|
Natural Gas
|
DE
|
103
|
|
103
|
|
100.0
|
|
|||||||
|
El Segundo Energy Center
|
CAISO
|
Fossil
|
Natural Gas
|
CA
|
550
|
|
550
|
|
100.0
|
|
|||||||
|
GenConn Devon
|
ISO-NE
|
Fossil
|
Dual-fuel
|
CT
|
190
|
|
95
|
|
50.0
|
|
|||||||
|
GenConn
|
ISO-NE
|
Fossil
|
Dual-fuel
|
CT
|
190
|
|
95
|
|
50.0
|
|
|||||||
|
High Desert
|
WECC
|
Renewable
|
Solar
|
CA
|
20
|
|
20
|
|
100.0
|
|
|||||||
|
Kansas South
|
WECC
|
Renewable
|
Solar
|
CA
|
20
|
|
20
|
|
100.0
|
|
|||||||
|
Laredo Ridge
|
MISO
|
Renewable
|
Wind
|
NE
|
80
|
|
80
|
|
100.0
|
|
|||||||
|
Marsh Landing
|
CAISO
|
Fossil
|
Natural Gas
|
CA
|
720
|
|
720
|
|
100.0
|
|
|||||||
|
Paxton Creek Cogeneration
|
PJM
|
Fossil
|
Natural Gas
|
PA
|
12
|
|
12
|
|
100.0
|
|
|||||||
|
Pinnacle
|
PJM
|
Renewable
|
Wind
|
WV
|
55
|
|
55
|
|
100.0
|
|
|||||||
|
Princeton Hospital
(h)
|
PJM
|
Fossil
|
Natural Gas
|
NJ
|
5
|
|
5
|
|
100.0
|
|
|||||||
|
Roadrunner
|
WECC
|
Renewable
|
Solar
|
NM
|
20
|
|
20
|
|
100.0
|
|
|||||||
|
South Trent Wind Farm
|
ERCOT
|
Renewable
|
Wind
|
TX
|
101
|
|
101
|
|
100.0
|
|
|||||||
|
Spring Canyon II and III
|
WECC
|
Renewable
|
Wind
|
CO
|
60
|
|
54
|
|
90.1
|
|
|||||||
|
Taloga
|
SPP
|
Renewable
|
Wind
|
OK
|
130
|
|
130
|
|
100.0
|
|
|||||||
|
Tucson Convention Center
|
WECC
|
Fossil
|
Natural Gas
|
AZ
|
2
|
|
2
|
|
100.0
|
|
|||||||
|
University of Bridgeport
|
ISO-NE
|
Fossil
|
Natural Gas
|
CT
|
1
|
|
1
|
|
100.0
|
|
|||||||
|
Walnut Creek
|
CAISO
|
Fossil
|
Natural Gas
|
CA
|
485
|
|
485
|
|
100.0
|
|
|||||||
|
4,708
|
|
4,073
|
|
||||||||||||||
|
NRG Yield net capacity for Co-Owned Facilities with NRG
|
613
|
|
|||||||||||||||
|
Total NRG Yield
|
4,686
|
|
|||||||||||||||
|
NRG's Noncontrolling Interest
|
(2,104
|
)
|
|||||||||||||||
|
Net NRG Yield
|
2,582
|
|
|||||||||||||||
|
Corporate
|
|||||||||||||||||
|
Residential solar
|
Renewable
|
Solar
|
various
|
114
|
|
114
|
|
100.0
|
|
||||||||
|
Total Corporate
|
114
|
|
114
|
|
|||||||||||||
|
Total
|
55,636
|
|
47,216
|
|
|
|
|||||||||||
|
(a)
|
Actual capacity can vary depending on factors including weather conditions, operational conditions, and other factors. Additionally, ERCOT requires periodic demonstration of capability, and the capacity may vary individually and in the aggregate from time to time.
|
|
(b)
|
Generation capacity figure consists of the Company's 44% interest in the two units at STP.
|
|
(c)
|
W.A. Parish Unit Petra Nova GT2 (75 MW of the 1,220 MW at W.A. Parish Natural Gas) was mothballed for part of 2016 in connection with the Petra Nova project and returned to service in the fourth quarter of 2016.
|
|
(d)
|
GenOn Mid-Atlantic leases 100% interests in the Dickerson and Morgantown coal generation units through facility lease agreements expiring in 2029 and 2034, respectively. GenOn Mid-Atlantic owns 312 MW and 248 MW of peaking capacity at the Dickerson and Morgantown generating facilities, respectively. REMA also leases a 100% interest in Shawville through a facility lease agreement expiring in 2026. GenOn operates the Dickerson, Morgantown and Shawville facilities.
|
|
(e)
|
NRG leases 100% interests in the Powerton facility and Units 7 and 8 of the Joliet facility through facility lease agreements expiring in 2034 and 2030, respectively. NRG owns 100% interest in Joliet Unit 6. NRG operates the Powerton and Joliet facilities.
|
|
(f)
|
Dual interconnect between TVA and MISO.
|
|
(g)
|
These units are located on property owned by SDG&E under an annual license agreement. The Miramar and El Cajon sites (51 MW) retired on January, 1, 2017.
|
|
(h)
|
The output of Princeton Hospital is primarily dedicated to serving the hospital. Excess power is sold to the local utility under its state-jurisdictional tariff.
|
|
(i)
|
REMA has 16.45% and 16.67% leased interests in the Conemaugh and Keystone facilities, respectively, with NRG holding a 3.7% ownership interest in each facility. GenOn operates the Conemaugh and Keystone facilities.
|
|
(j)
|
Denotes a GenOn or GenOn subsidiary property.
|
|
(k)
|
GenOn Americas Generation deactivated Pittsburg on January 1, 2017.
|
|
(l)
|
NRG plans to deactivate Encina Unit 1 on March 1, 2017.
|
|
(m)
|
Capacity attributable to noncontrolling interest for these Renewables facilities was 638 MWs as of December 31, 2016.
|
58
Co-Owned Facilities between NRG and NRG Yield
Listed below are descriptions of NRG's interests in facilities, operations and/or projects owned or leased with NRG Yield as of
December 31, 2016
. The MW figures provided represent nominal summer net MW capacity of power generated as adjusted for the Company's owned or leased interest excluding capacity from inactive/mothballed units as of
December 31, 2016
. The following table summarizes power production and cogeneration facilities that are co-owned by NRG and NRG Yield:
|
Name of Facility
|
Power Market
|
Plant Type
|
Primary Fuel
|
Location
|
Rated MW Capacity
|
Net MW Capacity for Renewables
|
% Owned for Renew-ables
|
Net MW Capacity for NRG Yield
|
% Owned for NRG Yield
|
||||||||||||||
|
Crosswinds
|
MISO
|
Renewable
|
Wind
|
CA
|
21
|
|
5
|
|
25.7
|
|
16
|
|
74.3
|
|
|||||||||
|
Elbow Creek
|
ERCOT
|
Renewable
|
Wind
|
TX
|
122
|
|
30
|
|
25.0
|
|
92
|
|
75.0
|
|
|||||||||
|
Elkhorn Ridge
|
MISO
|
Renewable
|
Wind
|
NE
|
54
|
|
13
|
|
49.7
|
|
41
|
|
50.3
|
|
|||||||||
|
Forward
|
PJM
|
Renewable
|
Wind
|
PA
|
29
|
|
7
|
|
25.0
|
|
22
|
|
75.0
|
|
|||||||||
|
Goat Mountain Wind
|
ERCOT
|
Renewable
|
Wind
|
TX
|
150
|
|
37
|
|
25.1
|
|
113
|
|
74.9
|
|
|||||||||
|
Hardin
|
MISO
|
Renewable
|
Wind
|
IA
|
15
|
|
4
|
|
25.7
|
|
11
|
|
74.3
|
|
|||||||||
|
Lookout
|
PJM
|
Renewable
|
Wind
|
PA
|
38
|
|
9
|
|
25.0
|
|
29
|
|
75.0
|
|
|||||||||
|
Odin
|
MISO
|
Renewable
|
Wind
|
MN
|
20
|
|
5
|
|
25.1
|
|
15
|
|
74.9
|
|
|||||||||
|
San Juan Mesa
|
MISO
|
Renewable
|
Wind
|
NM
|
90
|
|
22
|
|
43.7
|
|
68
|
|
56.3
|
|
|||||||||
|
Sleeping Bear
|
SPP
|
Renewable
|
Wind
|
OK
|
95
|
|
24
|
|
25.0
|
|
71
|
|
75.0
|
|
|||||||||
|
Spanish Fork, UT
|
WECC
|
Renewable
|
Wind
|
UT
|
19
|
|
5
|
|
25.0
|
|
14
|
|
75.0
|
|
|||||||||
|
Wildorado
|
ERCOT
|
Renewable
|
Wind
|
TX
|
161
|
|
40
|
|
25.1
|
|
121
|
|
74.9
|
|
|||||||||
|
Total
|
814
|
|
201
|
|
613
|
|
|||||||||||||||||
59
Thermal Facilities
The Company's thermal businesses in Pittsburgh, Harrisburg and San Francisco are regulated by their respective state's Public Utility Commission. The other thermal businesses are subject to contract terms with their customers. The Company's thermal businesses are owned by NRG Yield LLC. The following table summarizes NRG's thermal steam and chilled water facilities as of
December 31, 2016
:
|
Name and Location of Facility
|
Thermal Energy Purchaser
|
% Owned
|
Rated Megawatt Thermal Equivalent Capacity (MWt)
|
Net Megawatt
Thermal
Equivalent
Capacity (MWt)
|
Generating
Capacity
|
||||||||
|
NRG Energy Center Minneapolis, MN
|
Approx. 100 steam and 55 chilled water customers
|
100
|
|
322
136 |
|
322
136 |
|
Steam: 1,100 MMBtu/hr.
Chilled water: 38,700 tons |
|||||
|
NRG Energy Center San Francisco, CA
|
Approx 180 steam customers
|
100
|
|
133
|
|
133
|
|
Steam: 454 MMBtu/hr.
|
|||||
|
NRG Energy Center Omaha, NE
|
Approx 60 steam and 65 chilled water customers
|
100
12 (a) 100
0
(a)
|
|
142
73 77
26
|
|
142
9 77
0
|
|
Steam: 485 MMBtu/hr
Steam: 250 MMBtu/hr
Chilled water: 22,000 tons
Chilled water: 7,250 tons
|
|||||
|
NRG Energy Center Harrisburg, PA
|
Approx 130 steam and 5 chilled water customers
|
100
|
|
108
13 |
|
108
13 |
|
Steam: 370 MMBtu/hr.
Chilled water: 3,600 tons |
|||||
|
NRG Energy Center Phoenix, AZ
|
Approx 35 chilled water customers
|
24
(a)
100
12
(a)
0
(a)
|
|
5
104
14
28
|
|
1
104
2
0
|
|
Steam: 17 MMBtu/hr
Chilled water: 29,600 tons
Chilled water: 3,920 tons
Chilled water: 8,000 tons
|
|||||
|
NRG Energy Center Pittsburgh, PA
|
Approx 25 steam and 25 chilled water customers
|
100
|
|
88
49 |
|
88
49 |
|
Steam: 302 MMBtu/hr.
Chilled water: 13,874 tons |
|||||
|
NRG Energy Center San Diego, CA
|
Approx 20 chilled water customers
|
100
|
|
31
|
|
31
|
|
Chilled water: 7,425 tons
|
|||||
|
NRG Energy Center Dover, DE
|
Kraft Foods Inc. and Procter & Gamble Company
|
100
|
|
66
|
|
66
|
|
Steam: 225 MMBtu/hr.
|
|||||
|
NRG Energy Center Princeton, NJ
|
Princeton HealthCare System
|
100
|
|
21
17 |
|
21
17 |
|
Steam: 72 MMBtu/hr.
Chilled water: 4,700 tons |
|||||
|
Total Generating Capacity (MWt)
|
1,453
|
|
1,319
|
|
|||||||||
|
(a)
|
Net MWt capacity excludes 134 MWt available under the right-to-use provisions contained in agreements between two of NRG Yield Inc.'s thermal facilities and certain of its customers.
|
Other Properties
In addition, NRG owns several real properties and facilities relating to its generation assets, other vacant real property unrelated to the Company's generation assets, interests in construction projects, and properties not used for operational purposes. NRG believes it has satisfactory title to its plants and facilities in accordance with standards generally accepted in the electric power industry, subject to exceptions that, in the Company's opinion, would not have a material adverse effect on the use or value of its portfolio.
NRG leases its financial and commercial corporate headquarters at 804 Carnegie Center, Princeton, New Jersey, its operational headquarters in Houston, Texas, its retail business offices and call centers, and various other office space.
60
See Item 15
—
Note 22,
Commitments and Contingencies
, to the Consolidated Financial Statements for discussion of the material legal proceedings to which NRG is a party.
Not applicable.
61
Market Information and Holders and Dividends
NRG's authorized capital stock consists of 500,000,000 shares of NRG common stock and 10,000,000 shares of preferred stock. A total of 22,000,000 shares of the Company's common stock are authorized for issuance under the NRG LTIP. A total of
5,558,390 shares
of NRG common stock were authorized for issuance under the NRG GenOn LTIP. For more information about the NRG LTIP and the NRG GenOn LTIP, refer to Item 12 — S
ecurity Ownership of Certain Beneficial Owners and Management and Related Stockholder Matters
and Item 15 —
Note 20
,
Stock-Based Compensation
, to the Consolidated Financial Statements
.
NRG's common stock is listed on the New York Stock Exchange and has been assigned the symbol: NRG. The high and low sales prices, as well as the closing price for the Company's common stock on a per share basis for
2016
and
2015
are set forth below:
|
Common Stock Price
|
Fourth
Quarter
2016
|
Third
Quarter
2016
|
Second
Quarter
2016
|
First
Quarter
2016
|
Fourth
Quarter
2015
|
Third
Quarter
2015
|
Second
Quarter
2015
|
First
Quarter
2015
|
|||||||||||||||||||||||
|
High
|
$
|
13.06
|
|
$
|
16.02
|
|
$
|
18.32
|
|
$
|
14.47
|
|
$
|
16.11
|
|
$
|
23.22
|
|
$
|
26.93
|
|
$
|
27.90
|
|
|||||||
|
Low
|
9.84
|
|
10.70
|
|
11.69
|
|
8.92
|
|
8.80
|
|
14.43
|
|
22.83
|
|
22.78
|
|
|||||||||||||||
|
Closing
|
12.26
|
|
11.21
|
|
14.99
|
|
13.01
|
|
11.77
|
|
14.85
|
|
22.88
|
|
25.19
|
|
|||||||||||||||
|
Dividends Per Common Share
|
$
|
0.030
|
|
$
|
0.030
|
|
$
|
0.030
|
|
$
|
0.145
|
|
$
|
0.145
|
|
$
|
0.145
|
|
$
|
0.145
|
|
$
|
0.145
|
|
|||||||
NRG had
315,443,011
shares outstanding as of
December 31, 2016
.
As of January 31, 2017, there were
315,972,715
shares outstanding, and there were
22,610
common stockholders of record.
On
January 18, 2017
, NRG declared a quarterly dividend on the Company's common stock of
$0.030
per share, or
$0.12
per share on an annualized basis, payable on
February 15, 2017
, to stockholders of record as of February 1, 2017.
The Company's common stock dividends are subject to available capital, market conditions, and compliance with associated laws and regulations.
62
Stock Performance Graph
The performance graph below compares NRG's cumulative total stockholder return on the Company's common stock for the period December 31, 2011, through
December 31, 2016
, with the cumulative total return of the Standard & Poor's 500 Composite Stock Price Index, or S&P 500, and the Philadelphia Utility Sector Index, or UTY. NRG's common stock trades on the New York Stock Exchange under the symbol "NRG."
The performance graph shown below is being furnished and compares each period assuming that $100 was invested on December 31, 2011, in each of the common stock of NRG, the stocks included in the S&P 500 and the stocks included in the UTY, and that all dividends were reinvested.
Comparison of Cumulative Total Return
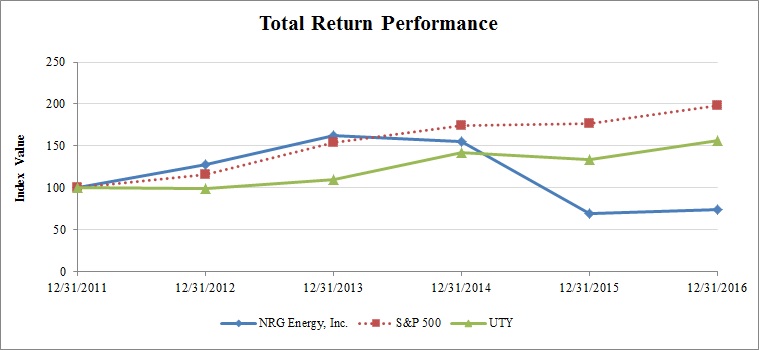
|
Dec-2011
|
Dec-2012
|
Dec-2013
|
Dec-2014
|
Dec-2015
|
Dec-2016
|
||||||||||||||||||
|
NRG Energy, Inc.
|
$
|
100.00
|
|
$
|
127.98
|
|
$
|
162.56
|
|
$
|
155.29
|
|
$
|
69.83
|
|
$
|
74.30
|
|
|||||
|
S&P 500
|
100.00
|
|
116.00
|
|
153.57
|
|
174.60
|
|
177.01
|
|
198.18
|
|
|||||||||||
|
UTY
|
100.00
|
|
99.44
|
|
110.35
|
|
142.29
|
|
133.39
|
|
156.59
|
|
|||||||||||
63
The following table presents NRG's historical selected financial data. This historical data should be read in conjunction with the Consolidated Financial Statements and the related notes thereto in Item 15 and Item 7,
Management's Discussion and Analysis of Financial Condition and Results of Operations.
The Company has completed several acquisitions and dispositions, as described in Item 15
—
Note 3
,
Business Acquisitions and Dispositions
.
|
Year Ended December 31,
|
|||||||||||||||||||
|
2016
|
2015
|
2014
|
2013
|
2012
|
|||||||||||||||
|
(In millions except ratios and per share data)
|
|||||||||||||||||||
|
Statement of income data:
|
|||||||||||||||||||
|
Total operating revenues
|
$
|
12,351
|
|
$
|
14,674
|
|
$
|
15,868
|
|
$
|
11,295
|
|
$
|
8,422
|
|
||||
|
Total operating costs and expenses, and other expenses
(a)
|
12,255
|
|
14,703
|
|
15,655
|
|
11,371
|
|
8,432
|
|
|||||||||
|
Impairment losses
(b)
|
918
|
|
5,030
|
|
97
|
|
459
|
|
—
|
|
|||||||||
|
Operating income/(loss)
|
527
|
|
(4,040
|
)
|
1,271
|
|
343
|
|
350
|
|
|||||||||
|
Impairment losses on investments
|
268
|
|
56
|
|
—
|
|
99
|
|
2
|
|
|||||||||
|
(Loss)/income from continuing operations, net
|
(891
|
)
|
(6,436
|
)
|
132
|
|
(352
|
)
|
315
|
|
|||||||||
|
Net (loss)/income attributable to NRG Energy, Inc.
|
$
|
(774
|
)
|
$
|
(6,382
|
)
|
$
|
134
|
|
$
|
(386
|
)
|
$
|
295
|
|
||||
|
Common share data:
|
|||||||||||||||||||
|
Basic shares outstanding — average
|
316
|
|
329
|
|
334
|
|
323
|
|
232
|
|
|||||||||
|
Diluted shares outstanding — average
|
316
|
|
329
|
|
339
|
|
323
|
|
234
|
|
|||||||||
|
Shares outstanding — end of year
|
315
|
|
314
|
|
337
|
|
324
|
|
323
|
|
|||||||||
|
Per share data:
|
|||||||||||||||||||
|
Net (loss)/income attributable to NRG — basic
|
$
|
(2.22
|
)
|
$
|
(19.46
|
)
|
$
|
0.23
|
|
$
|
(1.22
|
)
|
$
|
1.23
|
|
||||
|
Net (loss)/income attributable to NRG — diluted
|
(2.22
|
)
|
(19.46
|
)
|
0.23
|
|
(1.22
|
)
|
1.22
|
|
|||||||||
|
Dividends declared per common share
|
0.24
|
|
0.58
|
|
0.54
|
|
0.45
|
|
0.18
|
|
|||||||||
|
Book value
|
$
|
14.09
|
|
$
|
17.29
|
|
$
|
34.67
|
|
$
|
32.33
|
|
$
|
31.83
|
|
||||
|
Business metrics:
|
|||||||||||||||||||
|
Cash flow from operations
|
$
|
2,072
|
|
$
|
1,309
|
|
$
|
1,510
|
|
$
|
1,270
|
|
$
|
1,149
|
|
||||
|
Liquidity position
(c)
|
$
|
3,636
|
|
$
|
3,305
|
|
$
|
3,940
|
|
$
|
3,695
|
|
$
|
3,362
|
|
||||
|
Ratio of earnings to fixed charges
|
0.49
|
(3.27
|
)
|
1.14
|
|
0.45
|
|
0.84
|
|
||||||||||
|
Ratio of earnings to fixed charges and preferred dividends
|
0.48
|
(3.18
|
)
|
1.06
|
|
0.45
|
|
0.83
|
|
||||||||||
|
Return on equity
|
(17.41
|
)%
|
(117.45
|
)%
|
1.15
|
%
|
(3.69
|
)%
|
2.87
|
%
|
|||||||||
|
Ratio of debt to total capitalization
|
79.69
|
%
|
75.95
|
%
|
60.41
|
%
|
57.60
|
%
|
56.74
|
%
|
|||||||||
|
Balance sheet data:
|
|||||||||||||||||||
|
Current assets
|
$
|
6,395
|
|
$
|
7,391
|
|
$
|
8,408
|
|
$
|
7,596
|
|
$
|
7,972
|
|
||||
|
Current liabilities
|
4,382
|
|
4,375
|
|
4,859
|
|
4,204
|
|
4,670
|
|
|||||||||
|
Property, plant and equipment, net
|
17,912
|
|
18,732
|
|
22,367
|
|
19,851
|
|
20,153
|
|
|||||||||
|
Total assets
|
30,355
|
|
32,882
|
|
40,466
|
|
33,902
|
|
34,983
|
|
|||||||||
|
Long-term debt, including current maturities, and capital leases
(d)
|
19,414
|
|
19,636
|
|
20,374
|
|
16,847
|
|
15,883
|
|
|||||||||
|
Total stockholders' equity
|
$
|
4,446
|
|
$
|
5,434
|
|
$
|
11,676
|
|
$
|
10,467
|
|
$
|
10,269
|
|
||||
|
(a)
|
Excludes impairment losses and impairment losses on investments.
|
|
(b)
|
Includes goodwill impairment as described in Item 15 - Note 11,
Goodwill and Other Intangibles
, to the Consolidated Financial Statements.
|
|
(c)
|
Liquidity position is determined as disclosed in Item 7,
Management's Discussion and Analysis of Financial Condition and Results of Operations, Liquidity and Capital Resources, Liquidity Position
. It excludes collateral funds deposited by counterparties of
$2 million
,
$106 million
, and
$271 million
as of
December 31, 2016
,
2015
, and
2014
, respectively, which represents cash held as collateral from hedge counterparties in support of energy risk management activities. It is the Company's intention to limit the use of these funds for repayment of the related current liability for collateral received in support of energy risk management activities.
|
|
(d)
|
Includes debt issuance cost in 2016, 2015 and 2014.
|
64
The following table provides the details of NRG's operating revenues:
|
|
Year Ended December 31,
|
||||||||||||||||||
|
|
2016
|
2015
|
2014
|
2013
|
2012
|
||||||||||||||
|
|
(In millions)
|
||||||||||||||||||
|
Energy revenue
|
$
|
5,458
|
|
$
|
6,564
|
|
$
|
7,255
|
|
$
|
5,606
|
|
$
|
3,776
|
|
||||
|
Capacity revenue
|
1,992
|
|
2,288
|
|
2,109
|
|
1,860
|
|
800
|
|
|||||||||
|
Retail revenue
|
6,239
|
|
6,778
|
|
7,372
|
|
6,297
|
|
5,888
|
|
|||||||||
|
Mark-to-market for economic hedging activities
|
(794
|
)
|
(255
|
)
|
541
|
|
(542
|
)
|
(450
|
)
|
|||||||||
|
Contract amortization
|
(55
|
)
|
(40
|
)
|
(13
|
)
|
(32
|
)
|
(97
|
)
|
|||||||||
|
Other revenues
|
613
|
|
470
|
|
589
|
|
433
|
|
302
|
|
|||||||||
|
Eliminations
|
(1,102
|
)
|
(1,131
|
)
|
(1,985
|
)
|
(2,327
|
)
|
(1,797
|
)
|
|||||||||
|
Total operating revenues
(a)
|
$
|
12,351
|
|
$
|
14,674
|
|
$
|
15,868
|
|
$
|
11,295
|
|
$
|
8,422
|
|
||||
(a)
Inter-segment sales and net derivative gains and losses included in operating revenues.
Energy revenue consists of revenues received from third parties as well as from the Company's retail businesses, for sales of electricity in the day-ahead and real-time markets, as well as bilateral sales. It also includes energy sold through long-term PPAs for renewable facilities. In addition, energy revenue includes revenues from the settlement of financial instruments and net realized trading revenues.
Capacity revenue consists of revenues received from a third party at either the market or negotiated contract rates for making installed generation capacity available in order to satisfy system integrity and reliability requirements. Capacity revenue also includes revenues from the settlement of financial instruments. In addition, capacity revenue includes revenues received under tolling arrangements, which entitle third parties to dispatch NRG's facilities and assume title to the electrical generation produced from that facility.
Retail revenue, representing operating revenues of NRG's retail businesses, consists of revenues from retail sales to residential, small business, commercial, industrial and governmental/institutional customers, revenues from the sale of excess supply into various markets, primarily in Texas, as well as product sales.
Mark-to-market for economic hedging activities includes asset-backed hedges that have not been designated as cash flow hedges and ineffectiveness on cash flow hedges.
Contract amortization revenue consists of the amortization of the intangible assets for net in-market C&I contracts established in connection with the acquisitions of Reliant Energy and Green Mountain Energy, as well as acquired power contracts, gas derivative instruments, and certain power sales agreements assumed at Fresh Start and Texas Genco purchase accounting dates related to the sale of electric capacity and energy in future periods. These amounts are amortized into revenue over the term of the underlying contracts based on actual generation or contracted volumes.
Other revenues include revenues generated by the Thermal Business consisting of revenues received from the sale of steam, hot and chilled water generally produced at a central district energy plant and sold to commercial, governmental and residential buildings for space heating, domestic hot water heating and air conditioning. It also includes the sale of high-pressure steam produced and delivered to industrial customers that is used as part of an industrial process. Other revenues also consists of operations and maintenance fees, or O&M fees, construction management services, or CMA fees, sale of natural gas and emission allowances, and revenues from ancillary services. O&M fees consist of revenues received from providing certain unconsolidated affiliates with services under long-term operating agreements. CMA fees are earned where NRG provides certain management and oversight of construction projects pursuant to negotiated agreements such as for the GenConn, Cedar Bayou 4 and certain solar construction projects. Ancillary services are comprised of the sale of energy-related products associated with the generation of electrical energy such as spinning reserves, reactive power and other similar products. Other revenues also include unrealized trading activities.
65
The discussion and analysis below has been organized as follows:
|
•
|
Executive Summary, including the business environment in which NRG operates, a discussion of regulation, weather, competition and other factors that affect the business, and significant events that are important to understanding the results of operations and financial condition;
|
|
•
|
Results of operations, including an explanation of significant differences between the periods in the specific line items of NRG's Consolidated Statements of Operations;
|
|
•
|
Financial condition addressing credit ratings, liquidity position, sources and uses of cash, capital resources and requirements, commitments, and off-balance sheet arrangements; and
|
|
•
|
Critical accounting policies which are most important to both the portrayal of the Company's financial condition and results of operations, and which require management's most difficult, subjective or complex judgment.
|
As you read this discussion and analysis, refer to NRG's Consolidated Statements of Operations to this Form 10-K, which presents the results of the Company's operations for the years ended
December 31, 2016
,
2015
, and
2014
, and also refer to Item 1 to this Form 10-K for more detailed discussion about the Company's business.
Executive Summary
NRG Energy, Inc., or NRG or the Company, is a leading integrated power company built on the strength of the nation's largest and most diverse competitive electric generation portfolio and leading retail electricity platform. NRG aims to create a sustainable energy future by producing, selling and delivering electricity and related products and services in major competitive power markets in the U.S. in a manner that delivers value to all of NRG's stakeholders. The Company owns and operates approximately
47,000 MW
of generation; engages in the trading of wholesale energy, capacity and related products; transacts in and trades fuel and transportation services; and directly sells energy, services, and innovative, sustainable products and services to retail customers under the names “NRG”, "Reliant" and other retail brand names owned by NRG.
Business Environment
The industry dynamics and external influences affecting the Company and its businesses, and the power generation and retail energy industry in general in
2016
and for the future medium term include:
Capacity Markets
— Capacity markets are a major source of revenue for the Company. Centralized capacity markets exist in ISO-NE, MISO, NYISO and PJM. Bilateral markets exist in CAISO and MISO. These auctions are either an annual market held three years ahead of the delivery period as in the case of PJM and ISO-NE, or six months to one month ahead as in the case of NYISO. Many variables affect the prices derived in these auctions. These variables include the load forecast, the target reserve margin, rules surrounding demand response, capacity performance penalties, capacity imports and exports from the region, new generation entrants, slope of the demand curve, generation retirements, the cost of retrofitting old generation to meet new environmental rules, expected profitability of the plant itself in the energy market and various other auction rules. In theory, a high capacity price should be an indication that the ISO doesn't have sufficient generation capacity against its needed reserve margin and new construction should enter the market. Similarly, a low capacity price suggests the market is over-built and units should retire. The Company has seen many swings in the pricing for capacity markets and the rules in many of the markets are undergoing significant changes, as discussed in this
Management's Discussion and Analysis of Financial Condition and Results of Operations
.
Commodities Markets
— The price of natural gas plays an important role in setting the price of electricity in many of the regions where NRG operates power plants. Natural gas prices are driven by variables including demand from the industrial, residential, and electric sectors, productivity across natural gas supply basins, costs of natural gas production, changes in pipeline infrastructure, and the financial and hedging profile of natural gas consumers and producers. In 2016, average natural gas prices at Henry Hub were 7.5% lower than 2015.
66
If long-term gas prices further decrease or remain depressed, the Company is likely to encounter lower realized energy prices, leading to lower energy revenues as higher priced hedge contracts mature and are replaced by contracts with lower gas and power prices. NRG's retail gross margins have historically improved as natural gas prices decline and are likely to partially offset the impact of declining gas prices on conventional wholesale power generation. To further mitigate this impact, NRG may increase its percentage of coal and nuclear capacity sold forward using a variety of hedging instruments, as described under the heading "Energy-Related Commodities" in Item 15 —
Note 5
,
Accounting for Derivative Instruments and Hedging Activities
,
to the Consolidated Financial Statements. The Company also mitigates declines in long-term gas prices through its increased investment in renewable power generation supported by PPAs.
Natural gas prices are a primary driver of coal demand. The low priced commodity environment has stressed coal equities, leading coal suppliers to file for bankruptcy protection, launch debt exchanges, rationalize assets, and cut production. If multiple parties withdraw from the market, liquidity could be challenged in the short term. Inventory overhang will be utilized to offset production losses. Coal prices are typically affected by the price of natural gas.
Electricity Prices
— The price of electricity is a key determinant of the profitability of the Company. Many variables such as the price of different fuels, weather, load growth and unit availability all coalesce to impact the final price for electricity and the Company's profitability. The following table summarizes average on-peak power prices for each of the major markets in which NRG operates for the years ended
December 31, 2016
,
2015
, and
2014
. For the year ended
December 31, 2016
as compared to the same period in
2015
, and for the year ended
December 31, 2015
as compared to the same period in
2014
the average on-peak power prices decreased primarily due to the decrease in natural gas prices.
|
|
Average on Peak Power Price ($/MWh)
(a)
|
||||||||||||||||
|
Year Ended December 31
|
2016 vs 2015
|
2015 vs 2014
|
|||||||||||||||
|
Region
|
2016
|
2015
|
2014
|
Change %
|
Change %
|
||||||||||||
|
Gulf Coast
(b)
|
|||||||||||||||||
|
ERCOT - Houston
|
$
|
26.91
|
|
$
|
28.15
|
|
$
|
43.73
|
|
(4
|
)%
|
(36
|
)%
|
||||
|
ERCOT - North
|
24.53
|
|
27.61
|
|
43.34
|
|
(11
|
)%
|
(36
|
)%
|
|||||||
|
MISO - Louisiana Hub
|
34.30
|
|
34.55
|
|
48.72
|
|
(1
|
)%
|
(29
|
)%
|
|||||||
|
East
|
|
||||||||||||||||
|
NY J/NYC
|
35.29
|
|
46.42
|
|
71.72
|
|
(24
|
)%
|
(35
|
)%
|
|||||||
|
NY A/West NY
|
34.82
|
|
42.07
|
|
58.16
|
|
(17
|
)%
|
(28
|
)%
|
|||||||
|
NEPOOL
|
35.05
|
|
48.25
|
|
75.28
|
|
(27
|
)%
|
(36
|
)%
|
|||||||
|
PEPCO (PJM)
|
37.92
|
|
46.48
|
|
70.69
|
|
(18
|
)%
|
(34
|
)%
|
|||||||
|
PJM West Hub
|
33.79
|
|
41.97
|
|
61.15
|
|
(19
|
)%
|
(31
|
)%
|
|||||||
|
West
|
|||||||||||||||||
|
CAISO - NP15
|
31.73
|
|
35.50
|
|
49.27
|
|
(11
|
)%
|
(28
|
)%
|
|||||||
|
CAISO - SP15
|
31.17
|
|
32.45
|
|
48.39
|
|
(4
|
)%
|
(33
|
)%
|
|||||||
(a) Average on-peak power prices based on real time settlement prices as published by the respective ISOs.
(b) Gulf Coast region also transacts in PJM - West Hub.
The following table summarizes average realized power prices for each region in which NRG operates for the years ended
December 31, 2016
,
2015
and
2014
, which reflects the impact of settled hedges.
|
|
Average Realized Power Price ($/MWh)
|
||||||||||||||||
|
Year Ended December 31
|
2016 vs 2015
|
2015 vs 2014
|
|||||||||||||||
|
Region
|
2016
|
2015
|
2014
|
Change %
|
Change %
|
||||||||||||
|
Gulf Coast
|
$
|
38.40
|
|
$
|
41.36
|
|
$
|
42.45
|
|
(7
|
)%
|
(3
|
)%
|
||||
|
East
|
48.11
|
|
50.32
|
|
71.00
|
|
(4
|
)%
|
(29
|
)%
|
|||||||
|
West
|
39.90
|
|
42.58
|
|
68.36
|
|
(6
|
)%
|
(38
|
)%
|
|||||||
Though the average on peak power prices have decreased on average by
15%
for the year ended
December 31, 2016
as compared to the same period in
2015
, and decreased on average by
33%
for the year ended
December 31, 2015
as compared to the same period in
2014
, average realized prices by region for the Company have generally decreased at a slower rate year-over-year due to the Company's multi-year hedging program and the success of the Company's commercial operations team in optimizing the value of the Company's assets on a daily basis.
67
Environmental Regulatory Landscape
— The MATS rule, finalized in 2012, is the primary regulatory force behind the decision to retrofit, repower or retire uncontrolled coal fired power plants. In June 2015, the U.S. Supreme Court held that the EPA unreasonably refused to consider costs when it determined to regulate HAPs emitted by electric generating units. The U.S. Supreme Court did not vacate the MATS rule but rather remanded it to the D.C. Circuit for further proceedings. In December 2015, the D.C. Circuit remanded the MATS rule to the EPA without vacatur. On April 25, 2016, the EPA released a supplemental finding that the benefits of this regulation outweigh the costs to address the U.S. Supreme Court's ruling that the EPA had not properly considered costs. This finding has been challenged in the D.C. Circuit. A number of regulations on GHGs, ambient air quality, coal combustion byproducts and water use with the potential for increased capital costs or operational impacts have been finalized and are under review by the courts. The design, timing and stringency of these regulations and the legal outcomes will affect the framework for the retrofit or retirement of existing fossil plants and deployment of new, cleaner technologies in the next decade. See Item 1— Business,
Environmental Matters
, for further discussion.
Public Policy Support and Government Financial Incentives for Clean Infrastructure Development
— Policy mechanisms including production and investment tax credits, cash grants, loan guarantees, accelerated depreciation tax benefits, RPS, and carbon trading plans have been implemented at the state and federal levels to support the development of renewable generation, demand-side and smart grid, and other clean infrastructure technologies. The availability and continuation of public policy support mechanisms will drive a significant part of the economics of the Company's development program. In December 2015, the U.S. Congress enacted an extension of the 30% solar ITC so that projects which began construction in 2016 through 2019 will continue to qualify for the 30% ITC. Projects beginning construction in 2020 and 2021 will be eligible for the ITC at the rates of 26% and 22% respectively. The same legislation also extended the 10 year wind PTC for wind projects which began construction in years 2016 through 2019. Wind projects which begin construction in the years 2017, 2018 and 2019 are eligible for PTC at 80%, 60% and 40% of the statutory rate per kilowatt hour respectively.
Weather
— Weather conditions in the regions of the U.S. in which NRG does business influence the Company's financial results. Weather conditions can affect the supply and demand for electricity and fuels. Weather may also impact the availability of the Company's generating assets. Changes in energy supply and demand may impact the price of these energy commodities in both the spot and forward markets, which may affect the Company's results in any given period. Typically, demand for and the price of electricity is higher in the summer and the winter seasons, when temperatures are more extreme. The demand for and price of natural gas is also generally higher in the winter. However, all regions of the U.S. typically do not experience extreme weather conditions at the same time, thus NRG is typically not exposed to the effects of extreme weather in all parts of its business at once.
Wind and Solar Resource Availability
— The availability of the wind and solar resources affects the financial performance of the wind and solar facilities, which may impact the Company’s overall financial performance. Due to the variable nature of the wind and solar resources, the Company cannot predict the availability of the wind and solar resources and the potential variances from expected performance levels from quarter to quarter. To the extent the wind and solar resources are not available at expected levels, it could have a negative impact on the Company’s financial performance for such periods.
Capital
Market Conditions
— The Company and its peer group, along with the broader energy sector, have recently experienced volatile conditions in the capital markets, including debt and equity markets, due to continued depressed commodity markets. These conditions, if they persist, may make it difficult for the Company, including GenOn and NRG Yield, Inc., to satisfy debt obligations which mature over the next few years at a reasonable cost. Further, NRG Yield, Inc.’s growth strategy depends on its ability to identify and acquire additional conventional and renewable facilities from the Company and unaffiliated third parties. A prolonged disruption in the equity capital market conditions could make it difficult for NRG Yield, Inc. to obtain the necessary financing to successfully acquire projects, which could impact a source of the Company’s liquidity.
Other Factors
— A number of other factors significantly influence the level and volatility of prices for energy commodities and related derivative products for NRG's business. These factors include:
|
•
|
seasonal, daily and hourly changes in demand;
|
|
•
|
extreme peak demands;
|
|
•
|
available supply resources;
|
|
•
|
transportation and transmission availability and reliability within and between regions;
|
|
•
|
location of NRG's generating facilities relative to the location of its load-serving opportunities;
|
|
•
|
procedures used to maintain the integrity of the physical electricity system during extreme conditions; and
|
|
•
|
changes in the nature and extent of federal and state regulations.
|
68
These factors can affect energy commodity and derivative prices in different ways and to different degrees. These effects may vary throughout the country as a result of regional differences in:
|
•
|
weather conditions;
|
|
•
|
market liquidity;
|
|
•
|
capability and reliability of the physical electricity and gas systems;
|
|
•
|
local transportation systems; and
|
|
•
|
the nature and extent of electricity deregulation.
|
Environmental Matters, Regulatory Matters and Legal Proceedings
— Details of environmental matters are presented in Item 15 —
Note 24
,
Environmental Matters
, to the Consolidated Financial Statements and Item 1
—
Business,
Environmental Matters,
section. Details of regulatory matters are presented in Item 15 —
Note 23
,
Regulatory Matters
, to the Consolidated Financial Statements and Item 1
—
Business,
Regulatory Matters,
section. Details of legal proceedings are presented in Item 15 —
Note 22
,
Commitments and Contingencies
, to the Consolidated Financial Statements. Some of this information relates to costs that may be material to the Company's financial results.
69
Significant events during the year ended
December 31, 2016
|
•
|
Acquisitions
—
During 2016, the Company completed the acquisition of approximately 1,000 MWs of utility-scale solar and wind assets and 29 MWs of distributed generation assets as discussed in more detail in Item 15 - Note 3,
Business Acquisitions and Dispositions
, to the Consolidated Financial Statements
.
|
|
•
|
Disposition
s — During 2016, the Company completed the sale of its Seward, Shelby, Rockford and Aurora generating stations. In addition, the Company completed the sale of its majority interest in the EVgo business and the sale of real property at the Potrero site, as discussed in more detail in Item 15 - Note 3,
Business Acquisitions and Dispositions
, to the Consolidated Financial Statements
.
|
|
•
|
Debt Issuances
— During 2016, the Company issued approximately $2.3 billion in recourse debt, approximately $0.5 billion in non-recourse debt and replaced its Term Loan Facility as discussed in more detail in Item 15 - Note 12,
Debt and Capital Leases
, to the Consolidated Financial Statements.
|
|
•
|
Debt Repurchases
—
During 2016, the Company repurchased $3.0 billion in aggregate principal of outstanding Senior Notes for $3.1 billion, including accrued interest, as discussed in more detail in Item 15 - Note 12,
Debt and Capital Leases
, to the Consolidated Financial Statements.
|
|
•
|
Preferred Stock Repurchase
— On June 13, 2016, the Company completed the repurchase from Credit Suisse of 100% of the outstanding shares of its $344.5 million 2.822% preferred stock at a price of $226 million.
|
|
•
|
Impairment losses
— During 2016, the Company recorded impairment losses of $918 million related to various facilities, as well as goodwill for its Texas reporting units, as discussed in more detail in Item 15
—
Note 10
,
Asset Impairments
and
Note 11
,
Goodwill and Other Intangibles
, to the Consolidated Financial Statements
.
|
|
•
|
Impairment losses on investments
— During 2016, the Company recorded impairment losses of $268 million related to various investments as discussed in more detail in Item 15
—
Note 10
,
Asset Impairments
to the Consolidated Financial Statements
.
|
|
•
|
Transfers of Assets under Common Control
—
On September 1, 2016, the Company sold its remaining 51.05% interest in CVSR Holdco LLC, which indirectly owns the CVSR solar facility, to NRG Yield, Inc. for total cash consideration of $78.5 million, plus an immaterial working capital adjustment. NRG Yield, Inc. also assumed additional debt of $496 million, which represents 51.05% of the CVSR project level debt and 51.05% of the notes issued under the CVSR Holdco Financing Agreement. In connection with the retrospective adjustment of prior periods, the Company now consolidates CVSR and
100%
of its debt, consisting of
$771 million
of project level debt and
$200 million
of notes issued under the CVSR Holdco Financing Agreement as of September 1, 2016.
|
|
•
|
Fleet Optimization
— The Company completed four coal-to-gas projects at the Big Cajun II, Joliet, Shawville and New Castle Generating Stations. Collectively, the modified units can generate more than 2,780 MW. Given the anticipated reductions in carbon emissions resulting from these modifications, combined with the expected operating profiles for the units, the four plants are expected to reduce their combined carbon footprint by more than 80%.
|
|
•
|
Petra Nova Project Completion
— The Company announced that its Petra Nova Carbon Capture Project, or the Petra Nova Project, reached commercial operation in the fourth quarter of 2016. The Petra Nova Project is a commercial-scale carbon capture system that captures CO
2
in the processed flue gas from an existing unit at the WA Parish power plant in Fort Bend County, southwest of Houston.
|
|
•
|
Cottonwood Flooding
— During March 2016, NRG's Cottonwood generating station was damaged by record flooding of the nearby Sabine River. The generating station was returned to service in the third quarter of 2016. The Company expects the restoration costs to be reimbursed through insurance recoveries. Through December 31, 2016, the Company has expensed $2 million and collected $27.5 million of insurance proceeds from property damage and $10 million of insurance proceeds from business interruption insurance. The Company is continuing to work with insurers on further property and business interruption insurance recovery. The Company does not anticipate recognizing additional expenses related to restoration costs.
|
70
Operational Matters
Sherwin Bankruptcy
The Company's Gregory cogeneration plant provided steam, processed water and a small percentage of its electrical generation to the Corpus Christi Sherwin Alumina plant pursuant to an Energy Service Agreement, or ESA. On January 11, 2016, Sherwin Alumina Company, or Sherwin, filed a voluntary petition with the United States Bankruptcy Court for the Southern District of Texas for relief under Title 11 of the United States Code. Sherwin agreed to pay all owed pre-petition amounts and, post-petition, Sherwin performed its obligations under the ESA through September 2016 when it shut down its operations. On September 28, 2016, Sherwin filed a motion with the Bankruptcy Court to reject the ESA, which includes Gregory's lease, effective September 29, 2016. Gregory objected to the rejection and is asserting its right to remain on its leasehold. The Company is currently evaluating potential options for the Gregory cogeneration plant.
71
Consolidated Results of Operations for the years ended 2016 and 2015
The following table provides selected financial information for the Company:
|
|
Year Ended December 31,
|
||||||||||
|
(in millions except otherwise noted)
|
2016
|
2015
|
Change
|
||||||||
|
Operating Revenues
|
|
|
|
||||||||
|
Energy revenue
(a)
|
$
|
4,469
|
|
|
$
|
5,494
|
|
$
|
(1,025
|
)
|
|
|
Capacity revenue
(a)
|
1,970
|
|
|
2,274
|
|
(304
|
)
|
||||
|
Retail revenue
|
6,274
|
|
6,806
|
|
(532
|
)
|
|||||
|
Mark-to-market for economic hedging activities
|
(865
|
)
|
(244
|
)
|
(621
|
)
|
|||||
|
Contract amortization
|
(55
|
)
|
(40
|
)
|
(15
|
)
|
|||||
|
Other revenues
(b)
|
558
|
|
|
384
|
|
174
|
|
||||
|
Total operating revenues
|
12,351
|
|
14,674
|
|
(2,323
|
)
|
|||||
|
Operating Costs and Expenses
|
|
|
|
||||||||
|
Cost of sales
(b)
|
6,564
|
|
7,846
|
|
1,282
|
|
|||||
|
Mark-to-market for economic hedging activities
|
(580
|
)
|
128
|
|
708
|
|
|||||
|
Contract and emissions credit amortization
(c)
|
5
|
|
11
|
|
6
|
|
|||||
|
Operations and maintenance
|
2,163
|
|
2,334
|
|
171
|
|
|||||
|
Other cost of operations
|
403
|
|
|
465
|
|
62
|
|
||||
|
Total cost of operations
|
8,555
|
|
10,784
|
|
2,229
|
|
|||||
|
Depreciation and amortization
|
1,367
|
|
1,566
|
|
199
|
|
|||||
|
Impairment losses
|
918
|
|
5,030
|
|
4,112
|
|
|||||
|
Selling, marketing, general and administrative
|
1,101
|
|
|
1,199
|
|
98
|
|
||||
|
Acquisition-related transaction and integration costs
|
8
|
|
10
|
|
2
|
|
|||||
|
Development costs
|
90
|
|
146
|
|
56
|
|
|||||
|
Total operating costs and expenses
|
12,039
|
|
18,735
|
|
6,696
|
|
|||||
|
Gain on sale of assets
|
215
|
|
—
|
|
215
|
|
|||||
|
Gain on postretirement benefits curtailment
|
—
|
|
21
|
|
(21
|
)
|
|||||
|
Operating Income/(Loss)
|
527
|
|
(4,040
|
)
|
4,567
|
|
|||||
|
Other Income/(Expense)
|
|
|
|
||||||||
|
Equity in earnings of unconsolidated affiliates
|
27
|
|
36
|
|
(9
|
)
|
|||||
|
Impairment losses on investments
|
(268
|
)
|
(56
|
)
|
(212
|
)
|
|||||
|
Other income, net
|
42
|
|
33
|
|
9
|
|
|||||
|
Loss on sale of equity method investment
|
—
|
|
(14
|
)
|
14
|
|
|||||
|
Net (loss)/gain on debt extinguishment
|
(142
|
)
|
75
|
|
(217
|
)
|
|||||
|
Interest expense
|
(1,061
|
)
|
(1,128
|
)
|
67
|
|
|||||
|
Total other expense
|
(1,402
|
)
|
(1,054
|
)
|
(348
|
)
|
|||||
|
Loss before income taxes
|
(875
|
)
|
(5,094
|
)
|
4,219
|
|
|||||
|
Income tax expense
|
16
|
|
1,342
|
|
(1,326
|
)
|
|||||
|
Net Loss
|
(891
|
)
|
(6,436
|
)
|
5,545
|
|
|||||
|
Less: Net loss attributable to noncontrolling interests and redeemable noncontrolling interests
|
(117
|
)
|
(54
|
)
|
(63
|
)
|
|||||
|
Net loss attributable to NRG Energy, Inc.
|
$
|
(774
|
)
|
$
|
(6,382
|
)
|
$
|
5,608
|
|
||
|
Business Metrics
|
|
|
|
||||||||
|
Average natural gas price — Henry Hub ($/MMBtu)
|
$
|
2.46
|
|
$
|
2.66
|
|
(8
|
)%
|
|||
|
(a)
|
Includes realized gains and losses from financially settled transactions.
|
|
(b)
|
Includes unrealized trading gains and losses.
|
|
(c)
|
Includes amortization of SO
2
and NO
x
credits and excludes amortization of RGGI credits.
|
72
Gross Margin
The Company calculates gross margin in order to evaluate operating performance as operating revenues less cost of sales, which includes cost of fuel, other costs of sales, contract and emission credit amortization and mark-to-market for economic hedging activities.
Economic Gross Margin
In addition to gross margin, the Company evaluates its operating performance using the measure of economic gross margin, which is not a GAAP measure and may not be comparable to other companies’ presentations or deemed more useful than the GAAP information provided elsewhere in this report. Economic gross margin should be viewed as a supplement to and not a substitute for the Company's presentation of gross margin, which is the most directly comparable GAAP measure. Economic gross margin is not intended to represent gross margin. The Company believes that economic gross margin is useful to investors as it is a key operational measure reviewed by the Company's chief operating decision maker. Economic gross margin is defined as the sum of energy revenue, capacity revenue and other revenue, less cost of fuels and other cost of sales.
Economic gross margin does not include mark-to-market gains or losses on economic hedging activities, contract amortization, emission credit amortization, or other operating costs.
The tables below present the composition and reconciliation of gross margin and economic gross margin which reflects the Company's current view of reporting segments for the years ended
December 31, 2016
and
2015
:
|
Year Ended December 31, 2016
|
|||||||||||||||||||||||||||||||||||||||||||
|
Generation
|
|||||||||||||||||||||||||||||||||||||||||||
|
(In millions except otherwise noted)
|
Gulf Coast
|
East
|
West
|
Other
|
Eliminations
|
Subtotal
|
Retail
|
Renewables
|
NRG Yield
|
Corporate/Eliminations
|
Total
|
||||||||||||||||||||||||||||||||
|
Energy revenue
|
$
|
2,157
|
|
$
|
2,071
|
|
$
|
217
|
|
$
|
61
|
|
$
|
—
|
|
$
|
4,506
|
|
$
|
2
|
|
$
|
375
|
|
|
$
|
575
|
|
$
|
(989
|
)
|
$
|
4,469
|
|
|||||||||
|
Capacity revenue
|
293
|
|
1,091
|
|
181
|
|
—
|
|
—
|
|
1,565
|
|
82
|
|
—
|
|
|
345
|
|
(22
|
)
|
1,970
|
|
||||||||||||||||||||
|
Retail revenue
|
—
|
|
—
|
|
—
|
|
—
|
|
—
|
|
—
|
|
6,239
|
|
—
|
|
|
—
|
|
35
|
|
6,274
|
|
||||||||||||||||||||
|
Mark-to-market for economic hedging activities
|
(515
|
)
|
(269
|
)
|
(3
|
)
|
—
|
|
(787
|
)
|
(1
|
)
|
(6
|
)
|
—
|
|
(71
|
)
|
(865
|
)
|
|||||||||||||||||||||||
|
Contract amortization
|
15
|
|
—
|
|
—
|
|
—
|
|
—
|
|
15
|
|
(1
|
)
|
(1
|
)
|
(68
|
)
|
—
|
|
(55
|
)
|
|||||||||||||||||||||
|
Other revenue
(a)
|
255
|
|
79
|
|
60
|
|
1
|
|
(15
|
)
|
380
|
|
15
|
|
49
|
|
169
|
|
(55
|
)
|
558
|
|
|||||||||||||||||||||
|
Operating revenue
|
2,205
|
|
2,972
|
|
455
|
|
62
|
|
(15
|
)
|
5,679
|
|
6,336
|
|
417
|
|
1,021
|
|
(1,102
|
)
|
12,351
|
|
|||||||||||||||||||||
|
Cost of fuel
|
(994
|
)
|
(948
|
)
|
(121
|
)
|
—
|
|
—
|
|
(2,063
|
)
|
(8
|
)
|
(3
|
)
|
(33
|
)
|
—
|
|
(2,107
|
)
|
|||||||||||||||||||||
|
Other costs of sales
(b)
|
(392
|
)
|
(352
|
)
|
(28
|
)
|
—
|
|
—
|
|
(772
|
)
|
(4,680
|
)
|
(11
|
)
|
(28
|
)
|
1,034
|
|
(4,457
|
)
|
|||||||||||||||||||||
|
Mark-to-market for economic hedging activities
|
71
|
|
89
|
|
(17
|
)
|
—
|
|
—
|
|
143
|
|
365
|
|
—
|
|
—
|
|
72
|
|
580
|
|
|||||||||||||||||||||
|
Contract and emission credit amortization
|
(21
|
)
|
22
|
|
4
|
|
(2
|
)
|
—
|
|
3
|
|
(6
|
)
|
—
|
|
(6
|
)
|
4
|
|
(5
|
)
|
|||||||||||||||||||||
|
Gross margin
|
$
|
869
|
|
$
|
1,783
|
|
$
|
293
|
|
$
|
60
|
|
$
|
(15
|
)
|
$
|
2,990
|
|
$
|
2,007
|
|
$
|
403
|
|
$
|
954
|
|
$
|
8
|
|
$
|
6,362
|
|
||||||||||
|
Less: Mark-to-market for economic hedging activities, net
|
(444
|
)
|
(180
|
)
|
(20
|
)
|
—
|
|
—
|
|
(644
|
)
|
364
|
|
(6
|
)
|
—
|
|
1
|
|
(285
|
)
|
|||||||||||||||||||||
|
Less: Contract and emission credit amortization, net
|
(6
|
)
|
22
|
|
4
|
|
(2
|
)
|
—
|
|
18
|
|
(7
|
)
|
(1
|
)
|
(74
|
)
|
4
|
|
(60
|
)
|
|||||||||||||||||||||
|
Economic gross margin
|
$
|
1,319
|
|
$
|
1,941
|
|
$
|
309
|
|
$
|
62
|
|
$
|
(15
|
)
|
$
|
3,616
|
|
$
|
1,650
|
|
$
|
410
|
|
$
|
1,028
|
|
$
|
3
|
|
$
|
6,707
|
|
||||||||||
|
Business Metrics
|
|||||||||||||||||||||||||||||||||||||||||||
|
MWh sold (thousands)
(c)(d)
|
56,170
|
|
43,045
|
|
5,438
|
|
3,883
|
|
7,236
|
|
|||||||||||||||||||||||||||||||||
|
MWh generated (thousands)
(e)
|
51,100
|
|
35,423
|
|
4,369
|
|
3,883
|
|
8,933
|
|
|||||||||||||||||||||||||||||||||
(a) Renewables Other revenue includes $20 million of intercompany revenue to NRG Yield.
(b) Includes purchased energy, capacity and emissions credits.
(c) MWh sold excludes generation at facilities in the West and NRG Yield that generate revenue under tolling agreements.
(d) Does not include MWh of 71 thousand or MWt of 1,966 thousand for thermal sold by NRG Yield.
(e) Does not include MWh of 275 thousand or MWt of 1,966 thousand for thermal generated by NRG Yield.
73
|
Year Ended December 31, 2015
|
|||||||||||||||||||||||||||||||||||||||||||
|
Generation
|
|||||||||||||||||||||||||||||||||||||||||||
|
(In millions except otherwise noted)
|
Gulf Coast
|
East
|
West
|
Other
|
Eliminations
|
Subtotal
|
Retail
|
Renewables
|
NRG Yield
|
Corporate/Eliminations
|
Total
|
||||||||||||||||||||||||||||||||
|
Energy revenue
|
$
|
2,548
|
|
|
$
|
2,880
|
|
|
$
|
269
|
|
|
$
|
19
|
|
|
$
|
—
|
|
$
|
5,716
|
|
$
|
—
|
|
|
$
|
359
|
|
|
$
|
489
|
|
|
$
|
(1,070
|
)
|
$
|
5,494
|
|
|||
|
Capacity revenue
|
291
|
|
|
1,345
|
|
|
195
|
|
|
—
|
|
|
—
|
|
1,831
|
|
116
|
|
|
—
|
|
|
341
|
|
|
(14
|
)
|
2,274
|
|
||||||||||||||
|
Retail revenue
|
—
|
|
|
—
|
|
|
—
|
|
|
—
|
|
|
—
|
|
—
|
|
6,778
|
|
|
—
|
|
|
—
|
|
|
28
|
|
6,806
|
|
||||||||||||||
|
Mark-to-market for economic hedging activities
|
(66
|
)
|
|
(198
|
)
|
|
10
|
|
|
—
|
|
|
—
|
|
(254
|
)
|
4
|
|
|
(3
|
)
|
|
(2
|
)
|
|
11
|
|
(244
|
)
|
||||||||||||||
|
Contract amortization
|
15
|
|
|
—
|
|
|
—
|
|
|
—
|
|
|
—
|
|
15
|
|
—
|
|
|
(1
|
)
|
|
(54
|
)
|
|
—
|
|
(40
|
)
|
||||||||||||||
|
Other revenue
(a)
|
215
|
|
|
66
|
|
|
11
|
|
|
(40
|
)
|
|
(14
|
)
|
238
|
|
16
|
|
|
37
|
|
|
179
|
|
|
(86
|
)
|
384
|
|
||||||||||||||
|
Operating revenue
|
3,003
|
|
4,093
|
|
485
|
|
(21
|
)
|
(14
|
)
|
7,546
|
|
6,914
|
|
392
|
|
953
|
|
(1,131
|
)
|
14,674
|
|
|||||||||||||||||||||
|
Cost of fuel
|
(1,214
|
)
|
|
(1,398
|
)
|
|
(159
|
)
|
|
—
|
|
|
—
|
|
(2,771
|
)
|
(9
|
)
|
|
(4
|
)
|
|
(43
|
)
|
|
15
|
|
(2,812
|
)
|
||||||||||||||
|
Other costs of sales
(b)
|
(352
|
)
|
|
(493
|
)
|
|
(33
|
)
|
|
—
|
|
|
—
|
|
(878
|
)
|
(5,235
|
)
|
|
(12
|
)
|
|
(28
|
)
|
|
1,119
|
|
(5,034
|
)
|
||||||||||||||
|
Mark-to-market for economic hedging activities
|
(17
|
)
|
|
(78
|
)
|
|
(18
|
)
|
|
—
|
|
|
—
|
|
(113
|
)
|
(4
|
)
|
|
—
|
|
|
—
|
|
|
(11
|
)
|
(128
|
)
|
||||||||||||||
|
Contract and emission credit amortization
|
(20
|
)
|
|
19
|
|
|
(2
|
)
|
|
(2
|
)
|
|
—
|
|
(5
|
)
|
(6
|
)
|
|
—
|
|
|
—
|
|
|
—
|
|
(11
|
)
|
||||||||||||||
|
Gross margin
|
$
|
1,400
|
|
$
|
2,143
|
|
$
|
273
|
|
$
|
(23
|
)
|
$
|
(14
|
)
|
$
|
3,779
|
|
$
|
1,660
|
|
$
|
376
|
|
$
|
882
|
|
$
|
(8
|
)
|
$
|
6,689
|
|
||||||||||
|
Less: Mark-to-market for economic hedging activities, net
|
(83
|
)
|
(276
|
)
|
(8
|
)
|
—
|
|
—
|
|
(367
|
)
|
—
|
|
(3
|
)
|
(2
|
)
|
—
|
|
(372
|
)
|
|||||||||||||||||||||
|
Less: Contract and emission credit amortization, net
|
(5
|
)
|
19
|
|
(2
|
)
|
(2
|
)
|
—
|
|
10
|
|
(6
|
)
|
(1
|
)
|
(54
|
)
|
—
|
|
(51
|
)
|
|||||||||||||||||||||
|
Economic gross margin
|
$
|
1,488
|
|
$
|
2,400
|
|
$
|
283
|
|
$
|
(21
|
)
|
$
|
(14
|
)
|
$
|
4,136
|
|
$
|
1,666
|
|
$
|
380
|
|
$
|
938
|
|
$
|
(8
|
)
|
$
|
7,112
|
|
||||||||||
|
Business Metrics
|
|||||||||||||||||||||||||||||||||||||||||||
|
MWh sold (thousands)
(c)(d)
|
61,599
|
|
|
57,235
|
|
|
6,317
|
|
|
|
|
|
|
|
|
|
|
|
|
|
|
3,736
|
|
|
6,412
|
|
|
|
|
|
|
|
|||||||||||
|
MWh generated (thousands)
(e)
|
57,678
|
|
|
46,286
|
|
|
4,542
|
|
|
|
|
|
|
|
|
|
|
|
|
|
|
3,790
|
|
|
8,899
|
|
|
|
|
|
|
|
|||||||||||
(a) Renewables Other revenue includes $11 million of intercompany revenue to NRG Yield.
(b) Includes purchased energy, capacity and emissions credits.
(c) MWh sold excludes generation at facilities in the West and NRG Yield that generate revenue under tolling agreements.
(d) Does not include MWh of 297 thousand or MWt of 1,946 thousand for thermal sold by NRG Yield.
(e) Does not include MWh of 297 thousand or MWt of 1,946 thousand for thermal generated by NRG Yield.
The table below represents the weather metrics for
2016
and
2015
:
|
|
Years ended December 31,
|
Quarters ended December 31,
|
Quarters ended September 30,
|
Quarters ended June 30,
|
Quarters ended March 31,
|
|||||||||||||||||||||||||||||||||||||||
|
Weather Metrics
|
Gulf Coast
(b)
|
East
|
West
|
Gulf Coast
(b)
|
East
|
West
|
Gulf Coast
(b)
|
East
|
West
|
Gulf Coast
(b)
|
East
|
West
|
Gulf Coast
(b)
|
East
|
West
|
|||||||||||||||||||||||||||||
|
2016
|
|
|
||||||||||||||||||||||||||||||||||||||||||
|
CDDs
(a)
|
2,966
|
|
1,415
|
|
925
|
|
362
|
|
87
|
|
55
|
|
1,655
|
|
947
|
|
666
|
|
873
|
|
348
|
|
199
|
|
76
|
|
33
|
|
5
|
|
||||||||||||||
|
HDDs
(a)
|
1,529
|
|
4,391
|
|
1,990
|
|
545
|
|
1,530
|
|
759
|
|
—
|
|
32
|
|
14
|
|
53
|
|
578
|
|
243
|
|
931
|
|
2,251
|
|
974
|
|
||||||||||||||
|
2015
|
||||||||||||||||||||||||||||||||||||||||||||
|
CDDs
|
2,871
|
|
1,336
|
|
1,111
|
|
286
|
|
88
|
|
127
|
|
1,652
|
|
824
|
|
772
|
|
892
|
|
391
|
|
195
|
|
41
|
|
33
|
|
17
|
|
||||||||||||||
|
HDDs
|
1,888
|
|
4,697
|
|
1,948
|
|
556
|
|
1,246
|
|
813
|
|
—
|
|
26
|
|
7
|
|
47
|
|
465
|
|
315
|
|
1,285
|
|
2,960
|
|
813
|
|
||||||||||||||
|
10 year average
|
||||||||||||||||||||||||||||||||||||||||||||
|
CDDs
|
240
|
|
74
|
|
57
|
|
1,597
|
|
746
|
|
631
|
|
969
|
|
347
|
|
171
|
|
90
|
|
29
|
|
3
|
|
||||||||||||||||||||
|
HDDs
|
754
|
|
1,624
|
|
842
|
|
4
|
|
76
|
|
22
|
|
77
|
|
526
|
|
370
|
|
1,092
|
|
2,499
|
|
1,154
|
|
||||||||||||||||||||
|
(a)
|
National Oceanic and Atmospheric Administration-Climate Prediction Center - A Cooling Degree Day, or CDD, represents the number of degrees that the mean temperature for a particular day is above 65 degrees Fahrenheit in each region. A Heating Degree Day, or HDD, represents the number of degrees that the mean temperature for a particular day is below 65 degrees Fahrenheit in each region. The CDDs/HDDs for a period of time are calculated by adding the CDDs/HDDs for each day during the period.
|
(b) CDDs/HDDs for the Gulf Coast region represent an average of cumulative population-weighted CDDs/HDDs for Texas and the West South-Central Climate region.
74
Generation gross margin and economic gross margin
The tables below present the primary changes in Generation gross margin and economic gross margin, which include intercompany sales, during the year ended
December 31, 2016
compared to the same period in
2015
:
|
(In millions)
|
Gross Margin (increase/(decrease))
|
Economic Gross Margin (increase/(decrease))
|
|||||
|
Gulf Coast region
|
$
|
(531
|
)
|
$
|
(169
|
)
|
|
|
East region
|
(360
|
)
|
(459
|
)
|
|||
|
West region
|
20
|
|
26
|
|
|||
|
Other
|
83
|
|
83
|
|
|||
|
$
|
(788
|
)
|
$
|
(519
|
)
|
||
The tables below describe the decrease in Generation gross margin and economic gross margin by region:
Gulf Coast Region
|
(In millions)
|
|||
|
Lower gross margin resulting from lower average realized energy prices due to a decline in natural gas prices and increased wind generation in Texas
|
$
|
(148
|
)
|
|
Lower gross margin primarily due to 11% lower coal generation and 21% lower gas generation in Texas, which was driven by lower gas prices, increased wind generation in Texas, an increase in unplanned outages and timing of planned outages
|
(82
|
)
|
|
|
Higher gross margin resulting from a 12% increase in nuclear generation driven by reduced unplanned outages and the timing of planned outages
|
55
|
|
|
|
Other
|
6
|
|
|
|
Decrease in economic gross margin
|
$
|
(169
|
)
|
|
Decrease in mark-to-market for economic hedging primarily due to net unrealized gains/losses on open positions related to economic hedges
|
(361
|
)
|
|
|
Decrease in contract and emission credit amortization
|
(1
|
)
|
|
|
Decrease in gross margin
|
$
|
(531
|
)
|
75
East Region
|
(In millions)
|
|||
|
Lower gross margin due to a 24% decrease in generation primarily driven by the environmental control work at Avon Lake and Powerton, fuel conversion projects at Joliet, Shawville and New Castle facilities and the sale of the Seward, Aurora, Rockford and Shelby generating stations in 2016. In addition, there was a 3% decrease in generation as a result of prior year winter weather conditions and current year planned outages
|
$
|
(295
|
)
|
|
Lower gross margin driven by a 12% decrease in capacity volumes due to plant deactivations and asset sales and a 7% decrease in PJM cleared auction capacity prices
|
(144
|
)
|
|
|
Lower gross margin driven primarily by a 9% decrease in New York and New England hedged capacity prices as well as the expiration of the Dunkirk RSS contract and a 7% decrease in capacity volume related to the retirement of Huntley and certain units at the Astoria facility
|
(99
|
)
|
|
|
Lower gross margin as a result of a 10% decrease in average realized energy prices due to a decline in natural gas prices in 2016
|
(76
|
)
|
|
|
Lower gross margin as a result of a decrease in ancillary services driven by lower generation in the current year
|
(24
|
)
|
|
|
Higher gross margin due to the closure and financial settlement of hedge positions with counterparties that would have otherwise been realized in 2017, 2018 and 2019
|
119
|
|
|
|
Changes in commercial optimization activities
|
50
|
|
|
|
Higher gross margin in 2016 due to a prior year lower cost of market adjustment for oil at Chalk Point and Bowline
|
17
|
|
|
|
Other
|
(7
|
)
|
|
|
Decrease in economic gross margin
|
$
|
(459
|
)
|
|
Increase in mark-to-market for economic hedging primarily due to net unrealized gains/losses on open positions related to economic hedges
|
96
|
|
|
|
Increase in contract and emission credit amortization
|
3
|
|
|
|
Decrease in gross margin
|
$
|
(360
|
)
|
West Region
|
(In millions)
|
|||
|
Gain on sale of excess emission credits
|
$
|
47
|
|
|
Lower gross margin due to a 6% decrease in capacity volumes and a 1% decrease in capacity prices due to higher reserve margins driven by more competition in certain areas
|
(14
|
)
|
|
|
Lower gross margin resulting from a 14% decrease in generation due to plant retirements and unfavorable market conditions, partially offset by higher availability at the Sunrise power plant, as well as Pittsburg generating station's merchant status due to toll expiration in the third quarter of 2015 and fewer planned outages. There was also a 6% decrease in average realized energy prices
|
(7
|
)
|
|
|
Increase in economic gross margin
|
$
|
26
|
|
|
Decrease in mark-to-market for economic hedging primarily due to net unrealized gains/losses on open positions related to economic hedges
|
(12
|
)
|
|
|
Increase in contract and emission credit amortization
|
6
|
|
|
|
Increase in gross margin
|
$
|
20
|
|
Other
Other gross margin and economic gross margin both increased $83 million for the year ended
December 31, 2016
, compared to the same period in
2015
, due to BETM gains on both over the counter and congestion strategies.
76
Retail gross margin and economic gross margin
The following is a discussion of gross margin and economic gross margin for Retail.
|
Years ended December 31,
|
|||||||
|
(In millions except otherwise noted)
|
2016
|
2015
|
|||||
|
Retail revenue
|
$
|
6,085
|
|
$
|
6,613
|
|
|
|
Supply management revenue
|
154
|
|
165
|
|
|||
|
Capacity revenues
|
82
|
|
116
|
|
|||
|
Customer mark-to-market
|
(1
|
)
|
4
|
|
|||
|
Contract amortization
|
(1
|
)
|
—
|
|
|||
|
Other
|
17
|
|
16
|
|
|||
|
Operating revenue
(a)
|
6,336
|
|
6,914
|
|
|||
|
Cost of sales
(b)
|
(4,688
|
)
|
(5,244
|
)
|
|||
|
Mark-to-market for economic hedging activities
|
365
|
|
(4
|
)
|
|||
|
Contract amortization
|
(6
|
)
|
(6
|
)
|
|||
|
Gross margin
|
$
|
2,007
|
|
$
|
1,660
|
|
|
|
Less: Mark-to-market for economic hedging activities, net
|
364
|
|
—
|
|
|||
|
Less: Contract and emission credit amortization
|
(7
|
)
|
(6
|
)
|
|||
|
Economic gross margin
|
$
|
1,650
|
|
$
|
1,666
|
|
|
|
Business Metrics
|
|||||||
|
Electricity sales volume (GWh) - Gulf Coast
|
52,642
|
|
51,815
|
|
|||
|
Electricity sales volume (GWh) - All other regions
|
8,130
|
|
10,217
|
|
|||
|
Natural gas sales volumes (MDth)
|
2,199
|
|
1,901
|
|
|||
|
Average Retail Mass customer count (in thousands)
|
2,778
|
|
2,775
|
|
|||
|
Ending Retail Mass customer count (in thousands)
|
2,818
|
|
2,755
|
|
|||
|
(a)
|
Includes intercompany sales of $4 million and $6 million in
2016
and
2015
, respectively, representing sales from Retail to the Gulf Coast region.
|
|
(b)
|
Includes intercompany purchases of $994 million and $1,054 million in
2016
and
2015
, respectively.
|
Retail gross margin increased
$347 million
and economic gross margin decreased
$16 million
for the year ended
December 31, 2016
, compared to the same period in
2015
, due to:
|
(In millions)
|
|||
|
Higher gross margin due to lower supply costs of $452 million or approximately $7.00 per MWh driven by a decrease in natural gas prices, partially offset by lower rates to customers of $431 million or approximately $6.50 per MWh
|
$
|
21
|
|
|
Lower gross margin of $19 million due to the unfavorable impact of selling back excess supply and $3 million in lower margin from a reduction in load of 86,000 MWhs due to milder weather conditions in 2016 as compared to 2015
|
(22
|
)
|
|
|
Lower gross margin due to lower volumes driven by lower average customer usage and mix
|
(15
|
)
|
|
|
Decrease in economic gross margin
|
$
|
(16
|
)
|
|
Increase in mark-to-market for economic hedging primarily due to net unrealized gains/losses on open positions related to economic hedges
|
364
|
|
|
|
Decrease in contract and emission credit amortization
|
(1
|
)
|
|
|
Increase in gross margin
|
$
|
347
|
|
Renewables gross margin and economic gross margin
Renewables gross margin increased
$27 million
and economic gross margin increased
$30 million
for the year ended
December 31, 2016
, compared to the same period in
2015
, primarily driven by a 15% increase in generation at both the Mountain Wind I and II facilities, a 4% increase in generation at the Ivanpah solar plant and generation from the Guam solar plant that reached COD in the third quarter of 2015.
77
NRG Yield gross margin and economic gross margin
NRG Yield gross margin increased
$72 million
and economic gross margin increased
$90 million
for the year ended
December 31, 2016
, compared to the same period in
2015
, primarily related to a 26% increase in volume generated at Alta wind projects as well as an increase in price per MWh at Alta X and XI wind projects as the PPAs began in January 2016 compared to merchant prices in 2015.
Mark-to-market for Economic Hedging Activities
Mark-to-market for economic hedging activities includes asset-backed hedges that have not been designated as cash flow hedges and ineffectiveness on cash flow hedges. Total net mark-to-market results increased by
$87 million
during the year ended
December 31, 2016
, compared to the same period in
2015
.
The breakdown of gains and losses included in operating revenues and operating costs and expenses by region was as follows:
|
Year Ended December 31, 2016
|
|||||||||||||||||||||||||||||||
|
Generation
|
|||||||||||||||||||||||||||||||
|
Gulf Coast
|
East
|
West
|
Retail
|
Renewables
|
Corporate
|
Elimination
(a)
|
Total
|
||||||||||||||||||||||||
|
|
(In millions)
|
||||||||||||||||||||||||||||||
|
Mark-to-market results in operating revenues
|
|
|
|
|
|
||||||||||||||||||||||||||
|
Reversal of previously recognized unrealized (gains)/losses on settled positions related to economic hedges
|
$
|
(389
|
)
|
$
|
(284
|
)
|
$
|
(4
|
)
|
$
|
(2
|
)
|
$
|
—
|
|
$
|
—
|
|
$
|
30
|
|
$
|
(649
|
)
|
|||||||
|
Reversal of acquired gain positions related to economic hedges
|
—
|
|
(48
|
)
|
—
|
|
—
|
|
—
|
|
—
|
|
—
|
|
(48
|
)
|
|||||||||||||||
|
Net unrealized (losses)/gains on open positions related to economic hedges
|
(126
|
)
|
63
|
|
1
|
|
1
|
|
(6
|
)
|
1
|
|
(102
|
)
|
(168
|
)
|
|||||||||||||||
|
Total mark-to-market (losses)/gains in operating revenues
|
$
|
(515
|
)
|
$
|
(269
|
)
|
$
|
(3
|
)
|
$
|
(1
|
)
|
$
|
(6
|
)
|
$
|
1
|
|
$
|
(72
|
)
|
$
|
(865
|
)
|
|||||||
|
Mark-to-market results in operating costs and expenses
|
|
|
|
|
|
||||||||||||||||||||||||||
|
Reversal of previously recognized unrealized losses/(gains) on settled positions related to economic hedges
|
$
|
31
|
|
$
|
100
|
|
$
|
(2
|
)
|
$
|
305
|
|
$
|
—
|
|
$
|
—
|
|
$
|
(30
|
)
|
$
|
404
|
|
|||||||
|
Reversal of acquired gain positions related to economic hedges
|
—
|
|
—
|
|
(12
|
)
|
—
|
|
—
|
|
—
|
|
—
|
|
(12
|
)
|
|||||||||||||||
|
Net unrealized gains/(losses) on open positions related to economic hedges
|
40
|
|
(11
|
)
|
(3
|
)
|
60
|
|
—
|
|
—
|
|
102
|
|
188
|
|
|||||||||||||||
|
Total mark-to-market gains/(losses) in operating costs and expenses
|
$
|
71
|
|
$
|
89
|
|
$
|
(17
|
)
|
$
|
365
|
|
$
|
—
|
|
$
|
—
|
|
$
|
72
|
|
$
|
580
|
|
|||||||
|
(a)
|
Represents the elimination of the intercompany activity between Retail and Generation.
|
78
|
Year Ended December 31, 2015
|
|||||||||||||||||||||||||||||||
|
Generation
|
|||||||||||||||||||||||||||||||
|
Gulf Coast
|
East
|
West
|
Retail
|
Renewables
|
NRG Yield
|
Elimination
(a)
|
Total
|
||||||||||||||||||||||||
|
|
(In millions)
|
||||||||||||||||||||||||||||||
|
Mark-to-market results in operating revenues
|
|
|
|
|
|
||||||||||||||||||||||||||
|
Reversal of previously recognized unrealized (gains)/losses on settled positions related to economic hedges
|
$
|
(408
|
)
|
$
|
(288
|
)
|
$
|
6
|
|
$
|
(1
|
)
|
$
|
(3
|
)
|
$
|
(2
|
)
|
$
|
(46
|
)
|
$
|
(742
|
)
|
|||||||
|
Reversal of acquired gain positions related to economic hedges
|
—
|
|
(84
|
)
|
—
|
|
—
|
|
—
|
|
—
|
|
—
|
|
(84
|
)
|
|||||||||||||||
|
Net unrealized gains on open positions related to economic hedges
|
342
|
|
174
|
|
4
|
|
5
|
|
—
|
|
—
|
|
57
|
|
582
|
|
|||||||||||||||
|
Total mark-to-market (losses)/gains in operating revenues
|
$
|
(66
|
)
|
$
|
(198
|
)
|
$
|
10
|
|
$
|
4
|
|
$
|
(3
|
)
|
$
|
(2
|
)
|
$
|
11
|
|
$
|
(244
|
)
|
|||||||
|
Mark-to-market results in operating costs and expenses
|
|
|
|
|
|
||||||||||||||||||||||||||
|
Reversal of previously recognized unrealized losses/(gains) on settled positions related to economic hedges
|
$
|
34
|
|
$
|
15
|
|
$
|
(1
|
)
|
$
|
373
|
|
$
|
—
|
|
$
|
—
|
|
$
|
46
|
|
$
|
467
|
|
|||||||
|
Reversal of acquired gain positions related to economic hedges
|
—
|
|
—
|
|
(18
|
)
|
(4
|
)
|
—
|
|
—
|
|
—
|
|
(22
|
)
|
|||||||||||||||
|
Net unrealized (losses)/gains on open positions related to economic hedges
|
(51
|
)
|
(93
|
)
|
1
|
|
(373
|
)
|
—
|
|
—
|
|
(57
|
)
|
(573
|
)
|
|||||||||||||||
|
Total mark-to-market gains/(losses) in operating costs and expenses
|
$
|
(17
|
)
|
$
|
(78
|
)
|
$
|
(18
|
)
|
$
|
(4
|
)
|
$
|
—
|
|
$
|
—
|
|
$
|
(11
|
)
|
$
|
(128
|
)
|
|||||||
(a) Represents the elimination of the intercompany activity between Retail and Generation.
Mark-to-market results consist of unrealized gains and losses on contacts that are yet to be settled. The settlement of these transactions is reflected in the same revenue or cost caption as the items being hedged.
The reversals of acquired gain or loss positions were valued based upon the forward prices on the acquisition date.
For the year ended
December 31, 2016
, the
$865 million
loss in operating revenues from economic hedge positions was driven primarily by the reversal of previously recognized unrealized gains on contracts that settled during the period, a decrease in value of open positions as a result of increases in gas prices, in addition to the reversal of acquired contracts. The
$580 million
gain in operating costs and expenses from economic hedge positions was driven primarily by the reversal of previously recognized unrealized losses on contracts that settled during the period and an increase in the value of open positions as a result of increases in coal and gas prices partially offset by the reversal of acquired contracts. As discussed in Item 15 — Note 5,
Accounting for Derivative Instruments and Hedging Activities
, to the Consolidated Financial Statements, the reversal of previously recognized gains and losses on settled positions related to economic hedges included in operating revenues and operating costs and expenses during the year ended December 31, 2016 include any gains or losses associated with positions that were closed out and financially settled with certain counterparties that would have otherwise been realized in future periods.
79
In accordance with ASC 815, the following table represents the results of the Company's financial and physical trading of energy commodities for the years ended
December 31, 2016
and
2015
. The realized and unrealized financial and physical trading results are included in operating revenue. The Company's trading activities are subject to limits within the Company's Risk Management Policy and are primarily transacted through BETM.
|
|
Year ended December 31,
|
||||||
|
(In millions)
|
2016
|
2015
|
|||||
|
Trading gains/(losses)
|
|
||||||
|
Realized
|
$
|
71
|
|
$
|
57
|
|
|
|
Unrealized
|
28
|
|
(76
|
)
|
|||
|
Total trading gains/(losses)
|
$
|
99
|
|
$
|
(19
|
)
|
|
In addition, trading activities reflect an increase in gross margin of
$88 million
, reflected in the Generation segment, for the year ended
December 31, 2016
, as compared to the same period in
2015
.
Operations and Maintenance Expense
|
Generation
|
Retail
|
Renewables
|
NRG Yield
|
Corporate
|
Eliminations
|
||||||||||||||||||||||||||||||||||||||
|
Gulf Coast
|
East
|
West
|
Other
|
Eliminations
|
Total
|
||||||||||||||||||||||||||||||||||||||
|
(In millions)
|
|||||||||||||||||||||||||||||||||||||||||||
|
Year Ended December 31, 2016
|
$
|
590
|
|
$
|
935
|
|
$
|
127
|
|
$
|
1
|
|
$
|
(15
|
)
|
$
|
248
|
|
$
|
121
|
|
$
|
174
|
|
$
|
13
|
|
$
|
(31
|
)
|
$
|
2,163
|
|
||||||||||
|
Year Ended December 31, 2015
|
$
|
656
|
|
$
|
1,006
|
|
$
|
143
|
|
$
|
1
|
|
$
|
(14
|
)
|
$
|
253
|
|
$
|
94
|
|
$
|
178
|
|
$
|
22
|
|
$
|
(5
|
)
|
$
|
2,334
|
|
||||||||||
Operations and maintenance expenses decreased by
$171 million
for the year ended
December 31, 2016
, compared to the same period in
2015
, due to the following:
|
(In millions)
|
|||
|
Decrease in Gulf Coast operations and maintenance expense primarily related to the timing of planned outages at the Texas coal plants and STP
|
$
|
(66
|
)
|
|
Decrease in East operating costs due to the sale of the Seward, Aurora, Rockford and Shelby generating stations in 2016
|
(63
|
)
|
|
|
Decrease in East operations and maintenance expense due primarily to deactivations of the Huntley, Dunkirk, and Astoria facilities coupled with a decrease in maintenance costs related to Canal, Waukegan, and Bowline facilities
|
(52
|
)
|
|
|
Decrease in West operations and maintenance expense primarily due to the retirement of the El Segundo facility and lower maintenance costs across the region
|
(17
|
)
|
|
|
Increase in East operating costs driven by fuel conversion projects at the Joliet, New Castle, and Shawville facilities and environmental control work at the Avon Lake and Powerton facilities
|
19
|
|
|
|
Increase in East operating costs due to environmental work at Maryland ash sites
|
16
|
|
|
|
Increase in Renewables operating costs due primarily to increased production at the Ivanpah solar plant, Mountain Wind I and II facilities and the Guam solar plant which reached COD in the fourth quarter of 2015
|
9
|
|
|
|
Other
|
(17
|
)
|
|
|
$
|
(171
|
)
|
|
80
Other Cost of Operations
|
Generation
|
Retail
|
Renewables
|
NRG Yield
|
Corporate
|
|||||||||||||||||||||||||||||||
|
Gulf Coast
|
East
|
West
|
Other
|
Total
|
|||||||||||||||||||||||||||||||
|
(In millions)
|
|||||||||||||||||||||||||||||||||||
|
Year Ended December 31, 2016
|
$
|
103
|
|
$
|
91
|
|
$
|
29
|
|
$
|
—
|
|
$
|
93
|
|
$
|
20
|
|
$
|
65
|
|
$
|
2
|
|
$
|
403
|
|
||||||||
|
Year Ended December 31, 2015
|
$
|
103
|
|
$
|
131
|
|
$
|
25
|
|
$
|
—
|
|
$
|
113
|
|
$
|
21
|
|
$
|
72
|
|
$
|
—
|
|
$
|
465
|
|
||||||||
Other cost of operations, comprised of asset retirement expense, insurance expense and property tax expense, decreased by
$62 million
for the year ended
December 31, 2016
, compared to the same period in
2015
, primarily due to a $29 million reduction in property tax for the Chalk Point and Dickerson facilities located in the East region and a decrease in gross receipts taxes of $10 million related to lower retail revenue and $10 million related to a favorable settlement of a Texas sales tax audit.
Depreciation and Amortization
|
Generation
|
Retail
|
Renewables
|
NRG Yield
|
Corporate
|
|||||||||||||||||||||||||||||||
|
Gulf Coast
|
East
|
West
|
Other
|
Total
|
|||||||||||||||||||||||||||||||
|
(In millions)
|
|||||||||||||||||||||||||||||||||||
|
Year Ended December 31, 2016
|
$
|
432
|
|
$
|
212
|
|
$
|
57
|
|
$
|
1
|
|
$
|
115
|
|
$
|
190
|
|
$
|
297
|
|
$
|
63
|
|
$
|
1,367
|
|
||||||||
|
Year Ended December 31, 2015
|
$
|
546
|
|
$
|
299
|
|
$
|
51
|
|
$
|
—
|
|
$
|
134
|
|
$
|
180
|
|
$
|
297
|
|
$
|
59
|
|
$
|
1,566
|
|
||||||||
Depreciation and amortization expense decreased by
$199 million
for the year ended
December 31, 2016
, compared to the same period in
2015
, primarily due to a $116 million decrease related to the impairment of the Limestone and W.A. Parish facilities located in the Gulf Coast region in 2015 and a $68 million decrease related to the impairment of the Dunkirk and Huntley facilities located in the East region in 2015.
Impairment Losses
For the year ended
December 31, 2016
, the Company recorded impairment losses of
$918 million
related to various facilities, as well as goodwill for its Texas reporting units, as further described in Item 15
—
Note 10
,
Asset Impairments
and
Note 11
,
Goodwill and Other Intangibles
, to the Consolidated Financial Statements
.
In 2015, the Company recorded impairment losses of
$5,030 million
related to various facilities, as well as goodwill for its Texas and Home Solar reporting units, as further described in Item 15
—
Note 10
,
Asset Impairments
and
Note 11
,
Goodwill and Other Intangibles
, to the Consolidated Financial Statements
.
Selling, Marketing, General and Administrative Expenses
|
Generation
|
Retail
|
Renewables
|
NRG Yield
|
Corporate
|
Total
|
||||||||||||||||||
|
(In millions)
|
|||||||||||||||||||||||
|
Year Ended December 31, 2016
|
$
|
372
|
|
$
|
497
|
|
$
|
60
|
|
$
|
16
|
|
$
|
156
|
|
$
|
1,101
|
|
|||||
|
Year Ended December 31, 2015
|
$
|
393
|
|
$
|
494
|
|
$
|
53
|
|
$
|
12
|
|
$
|
247
|
|
$
|
1,199
|
|
|||||
Selling, marketing, general and administrative expenses decreased by $98 million for the year ended December 31, 2016 compared to the same period in 2015, due primarily to a decrease in advertising and the continued focus on cost management.
Development Costs
Development costs decreased by
$56 million
for the year ended
December 31, 2016
, compared to the same period in
2015
, due to the strategic decision for a more focused development program primarily related to Renewables and the sale of EVgo in 2016.
81
Gain on Sale of Assets
During the year ended
December 31, 2016
, the Company recognized a
$215 million
gain on sale of assets primarily related to the sale of the Aurora generating station, the sale of real property at the Potrero location and the sale of the Shelby generating station. The Company also sold a majority interest in its EVgo business to Vision Ridge Partners, which resulted in a loss on sale, as described in Item 15
—
Note 3
,
Business Acquisitions and Dispositions
,
to the Consolidated Financial Statements.
Impairment Losses on Investments
For the year ended
December 31, 2016
, the Company recorded other-than-temporary impairment losses of
$268 million
, which is primarily due to other-than-temporary impairments on the Company's interests in Petra Nova Parish Holdings, Sherbino and Community Wind North, as further described in
Note 10
,
Asset Impairments
.
For the year ended
December 31, 2015
, the Company recorded other-than-temporary impairment losses on certain of its cost and equity method investments of
$56 million
, as further described in Item 15
—
Note 10
,
Asset Impairments
, to the Consolidated Financial Statements.
A loss on debt extinguishment of
$142 million
was recorded for the year ended
December 31, 2016
, primarily driven by the repurchase of NRG senior notes at a price above par value and the write-off of the unamortized debt issuance costs related to the replacement of the 2018 Term Loan Facility with the new 2023 Term Loan Facility.
A gain on debt extinguishment of
$75 million
was recorded for the year ended
December 31, 2015
, primarily driven by the repurchase of NRG senior notes due 2023 and 2024, GenOn senior notes due 2020 and GenOn Americas Generation senior notes due 2021 and 2031 at a price below par value, combined with the write-off of unamortized premium.
Interest Expense
NRG's interest expense decreased by
$67 million
for the year ended
December 31, 2016
, compared to the same period in
2015
, due to the following:
|
(In millions)
|
|||
|
Decrease due to the repurchases of Senior Notes at the end of 2015 and 2016
|
$
|
(63
|
)
|
|
Decrease in derivative interest expense from changes in fair value of interest rate swaps
|
(19
|
)
|
|
|
Decrease due to the redemption of outstanding bonds related to NRG Peakers Finance Company
|
(8
|
)
|
|
|
Decrease due to the termination of Alta X and XI term loans and the related interest rate swaps in 2015
|
(6
|
)
|
|
|
Increase due to the replacement of the 2018 Term Loan Facility with the 2023 Term Loan Facility
|
9
|
|
|
|
Increase due to the issuance of NRG Yield Inc. 3.25% Convertible Senior Notes due 2020 and NRG Yield Operating LLC Revolving Credit Facility issued in 2015
|
8
|
|
|
|
Increase due to the issuance of NRG Yield Operating LLC 5.00% Senior Notes due 2026
|
7
|
|
|
|
Increase due to $200 million of debt issued by CVSR Holdco in August 2016
|
4
|
|
|
|
Other
|
1
|
|
|
|
$
|
(67
|
)
|
|
As a result of the reduction in corporate debt in 2016 and debt repurchases in 2015 as well as the extension of debt maturities at a lower average coupon rate, the Company realized annual interest savings of approximately $87 million in 2016.
82
Income Tax Expense
For the year ended
December 31, 2016
, NRG recorded income tax expense of
$16 million
on a pre-tax loss of $
875 million
. For the same period in
2015
, NRG recorded income tax expense of $
1,342 million
on a pre-tax loss of $
5,094 million
. The effective tax rate was
(1.8)%
and
(26.3)%
for the years ended
December 31, 2016
and
2015
, respectively.
For the year ended
December 31, 2016
, NRG's overall effective tax rate was different than the statutory rate of 35% primarily due to the change in valuation allowance, the impact of non-taxable equity earnings and current state tax expense, partially offset by the generation of PTC's from various wind facilities.
|
|
Year Ended December 31,
|
||||||
|
|
2016
|
2015
|
|||||
|
|
(In millions
except as otherwise stated)
|
||||||
|
Loss before income taxes
|
$
|
(875
|
)
|
$
|
(5,094
|
)
|
|
|
Tax at 35%
|
(306
|
)
|
(1,783
|
)
|
|||
|
State taxes
|
11
|
|
(218
|
)
|
|||
|
Foreign operations
|
10
|
|
1
|
|
|||
|
Federal and state tax credits, excluding PTCs
|
—
|
|
(5
|
)
|
|||
|
Valuation allowance
|
306
|
|
3,039
|
|
|||
|
Book goodwill impairment
|
—
|
|
340
|
|
|||
|
Impact of non-taxable entity earnings
|
22
|
|
(10
|
)
|
|||
|
Net interest accrued on uncertain tax positions
|
1
|
|
(3
|
)
|
|||
|
Production tax credits
|
(26
|
)
|
(33
|
)
|
|||
|
Recognition of uncertain tax benefits
|
2
|
|
(15
|
)
|
|||
|
Tax expense attributable to consolidated partnerships
|
(1
|
)
|
12
|
|
|||
|
Impact of change in effective state tax rate
|
1
|
|
19
|
|
|||
|
Other
|
(4
|
)
|
(2
|
)
|
|||
|
Income tax expense
|
$
|
16
|
|
|
$
|
1,342
|
|
|
Effective income tax rate
|
(1.8
|
)%
|
(26.3
|
)%
|
|||
The effective income tax rate may vary from period to period depending on, among other factors, the geographic and business mix of earnings and losses and changes in valuation allowances in accordance with ASC 740,
Income Taxes,
or ASC 740. These factors and others, including the Company's history of pre-tax earnings and losses, are taken into account in assessing the ability to realize deferred tax assets.
Net loss attributable to noncontrolling interests and redeemable noncontrolling interests
Net loss attributable to noncontrolling interests and redeemable noncontrolling interests was
$117 million
for the year ended
December 31, 2016
, compared to
$54 million
for the year ended
December 31, 2015
. For the years ended
December 31, 2016
, and
2015
, the net losses attributable to noncontrolling interests primarily reflect losses allocated to tax equity investors using the hypothetical liquidation at book value, or HLBV, method, as well as NRG Yield, Inc.'s share of losses for the period.
83
Consolidated Results of Operations for the years ended 2015 and 2014
The following table provides selected financial information for the Company:
|
|
Year Ended December 31,
|
||||||||||
|
(In millions except otherwise noted)
|
2015
|
2014
(a)
|
Change
|
||||||||
|
Operating Revenues
|
|
|
|
||||||||
|
Energy revenue
(b)
|
$
|
5,494
|
|
$
|
5,422
|
|
$
|
72
|
|
||
|
Capacity revenue
(b)
|
2,274
|
|
2,087
|
|
187
|
|
|||||
|
Retail revenue
|
6,806
|
|
7,376
|
|
(570
|
)
|
|||||
|
Mark-to-market for economic hedging activities
|
(244
|
)
|
501
|
|
(745
|
)
|
|||||
|
Contract amortization
|
(40
|
)
|
(13
|
)
|
(27
|
)
|
|||||
|
Other revenues
(c)
|
384
|
|
495
|
|
(111
|
)
|
|||||
|
Total operating revenues
|
14,674
|
|
15,868
|
|
(1,194
|
)
|
|||||
|
Operating Costs and Expenses
|
|
|
|
||||||||
|
Cost of sales
(b)
|
7,846
|
|
8,623
|
|
777
|
|
|||||
|
Mark-to-market for economic hedging activities
|
128
|
|
488
|
|
360
|
|
|||||
|
Contract and emissions credit amortization
(d)
|
11
|
|
31
|
|
20
|
|
|||||
|
Operations and maintenance
|
2,334
|
|
2,244
|
|
(90
|
)
|
|||||
|
Other cost of operations
|
465
|
|
422
|
|
(43
|
)
|
|||||
|
Total cost of operations
|
10,784
|
|
11,808
|
|
1,024
|
|
|||||
|
Depreciation and amortization
|
1,566
|
|
1,523
|
|
(43
|
)
|
|||||
|
Impairment losses
|
5,030
|
|
97
|
|
(4,933
|
)
|
|||||
|
Selling, marketing, general and administrative
|
1,199
|
|
1,016
|
|
(183
|
)
|
|||||
|
Acquisition-related transaction and integration costs
|
10
|
|
84
|
|
74
|
|
|||||
|
Development costs
|
146
|
|
88
|
|
(58
|
)
|
|||||
|
Total operating costs and expenses
|
18,735
|
|
14,616
|
|
(4,119
|
)
|
|||||
|
Gain on sale of assets
|
—
|
|
19
|
|
(19
|
)
|
|||||
|
Gain on postretirement benefits curtailment
|
21
|
|
—
|
|
21
|
|
|||||
|
Operating (Loss)/Income
|
(4,040
|
)
|
1,271
|
|
(5,311
|
)
|
|||||
|
Other Income/(Expense)
|
|
|
|
||||||||
|
Equity in earnings of unconsolidated affiliates
|
36
|
|
38
|
|
(2
|
)
|
|||||
|
Impairment losses on investments
|
(56
|
)
|
—
|
|
(56
|
)
|
|||||
|
Other income, net
|
33
|
|
22
|
|
11
|
|
|||||
|
(Loss)/gain on sale of equity method investment
|
(14
|
)
|
18
|
|
(32
|
)
|
|||||
|
Net gain/(loss) on debt extinguishment
|
75
|
|
(95
|
)
|
170
|
|
|||||
|
Interest expense
|
(1,128
|
)
|
(1,119
|
)
|
(9
|
)
|
|||||
|
Total other expense
|
(1,054
|
)
|
(1,136
|
)
|
82
|
|
|||||
|
(Loss)/Income before income tax expense
|
(5,094
|
)
|
135
|
|
(5,229
|
)
|
|||||
|
Income tax expense
|
1,342
|
|
3
|
|
(1,339
|
)
|
|||||
|
Net (Loss)/Income
|
(6,436
|
)
|
132
|
|
(6,568
|
)
|
|||||
|
Less: Net loss attributable to noncontrolling interests and redeemable noncontrolling interests
|
(54
|
)
|
(2
|
)
|
(52
|
)
|
|||||
|
Net (loss)/income attributable to NRG Energy, Inc.
|
$
|
(6,382
|
)
|
$
|
134
|
|
$
|
(6,516
|
)
|
||
|
Business Metrics
|
|
|
|||||||||
|
Average natural gas price — Henry Hub ($/MMBtu)
|
$
|
2.66
|
|
$
|
4.41
|
|
(40
|
)%
|
|||
|
(a)
|
Includes the results of EME from April 1, 2014, to December 31, 2014
|
|
(b)
|
Includes realized gains and losses from financially settled transactions.
|
|
(c)
|
Includes unrealized trading gains and losses.
|
|
(d)
|
Includes amortization of SO
2
and NO
x
credits and excludes amortization of RGGI.
|
84
Gross Margin
The Company calculates gross margin in order to evaluate operating performance as operating revenues less cost of sales, which includes cost of fuel, other costs of sales, contract and emission credit amortization and mark-to-market for economic hedging activities.
Economic Gross Margin
In addition to gross margin, the Company evaluates its operating performance using the measure of economic gross margin, which is not a GAAP measure and may not be comparable to other companies’ presentations or deemed more useful than the GAAP information provided elsewhere in this report. Economic gross margin should be viewed as a supplement to and not a substitute for the Company's presentation of gross margin, which is the most directly comparable GAAP measure. Economic gross margin is not intended to represent gross margin. The Company believes that economic gross margin is useful to investors as it is a key operational measure reviewed by the Company's chief operating decision maker. Economic gross margin is defined as the sum of energy revenue, capacity revenue and other revenue, less cost of fuels and other cost of sales.
Economic gross margin does not include mark-to-market gains or losses on economic hedging activities, contract amortization, emission credit amortization, or other operating costs.
The tables below present the composition and reconciliation of gross margin and economic gross margin which reflects the Company's current view of reporting segments for the years ended
December 31, 2015
and
2014
:
|
Year Ended December 31, 2015
|
|||||||||||||||||||||||||||||||||||||||||||
|
Generation
|
|||||||||||||||||||||||||||||||||||||||||||
|
(In millions except otherwise noted)
|
Gulf Coast
|
East
|
West
|
Other
|
Eliminations
|
Subtotal
|
Retail
|
Renewables
|
NRG Yield
|
Corporate/Eliminations
|
Total
|
||||||||||||||||||||||||||||||||
|
Energy revenue
|
$
|
2,548
|
|
$
|
2,880
|
|
$
|
269
|
|
$
|
19
|
|
$
|
—
|
|
$
|
5,716
|
|
$
|
—
|
|
$
|
359
|
|
$
|
489
|
|
$
|
(1,070
|
)
|
$
|
5,494
|
|
||||||||||
|
Capacity revenue
|
291
|
|
1,345
|
|
195
|
|
—
|
|
—
|
|
1,831
|
|
116
|
|
—
|
|
341
|
|
(14
|
)
|
2,274
|
|
|||||||||||||||||||||
|
Retail revenue
|
—
|
|
—
|
|
—
|
|
—
|
|
—
|
|
—
|
|
6,778
|
|
—
|
|
—
|
|
28
|
|
6,806
|
|
|||||||||||||||||||||
|
Mark-to-market for economic hedging activities
|
(66
|
)
|
(198
|
)
|
10
|
|
—
|
|
—
|
|
(254
|
)
|
4
|
|
(3
|
)
|
(2
|
)
|
11
|
|
(244
|
)
|
|||||||||||||||||||||
|
Contract amortization
|
15
|
|
—
|
|
—
|
|
—
|
|
—
|
|
15
|
|
—
|
|
(1
|
)
|
(54
|
)
|
—
|
|
(40
|
)
|
|||||||||||||||||||||
|
Other revenue
(a)
|
215
|
|
66
|
|
11
|
|
(40
|
)
|
(14
|
)
|
238
|
|
16
|
|
37
|
|
179
|
|
(86
|
)
|
384
|
|
|||||||||||||||||||||
|
Operating revenue
|
3,003
|
|
4,093
|
|
485
|
|
(21
|
)
|
(14
|
)
|
7,546
|
|
6,914
|
|
392
|
|
953
|
|
(1,131
|
)
|
14,674
|
|
|||||||||||||||||||||
|
Cost of fuel
|
(1,214
|
)
|
(1,398
|
)
|
(159
|
)
|
—
|
|
—
|
|
(2,771
|
)
|
(9
|
)
|
(4
|
)
|
(43
|
)
|
15
|
|
(2,812
|
)
|
|||||||||||||||||||||
|
Other costs of sales
(b)
|
(352
|
)
|
(493
|
)
|
(33
|
)
|
—
|
|
—
|
|
(878
|
)
|
(5,235
|
)
|
(12
|
)
|
(28
|
)
|
1,119
|
|
(5,034
|
)
|
|||||||||||||||||||||
|
Mark-to-market for economic hedging activities
|
(17
|
)
|
(78
|
)
|
(18
|
)
|
—
|
|
—
|
|
(113
|
)
|
(4
|
)
|
—
|
|
—
|
|
(11
|
)
|
(128
|
)
|
|||||||||||||||||||||
|
Contract and emission credit amortization
|
(20
|
)
|
19
|
|
(2
|
)
|
(2
|
)
|
—
|
|
(5
|
)
|
(6
|
)
|
—
|
|
—
|
|
—
|
|
(11
|
)
|
|||||||||||||||||||||
|
Gross margin
|
$
|
1,400
|
|
$
|
2,143
|
|
$
|
273
|
|
$
|
(23
|
)
|
$
|
(14
|
)
|
$
|
3,779
|
|
$
|
1,660
|
|
$
|
376
|
|
$
|
882
|
|
$
|
(8
|
)
|
$
|
6,689
|
|
||||||||||
|
Less: Mark-to-market for economic hedging activities, net
|
(83
|
)
|
(276
|
)
|
(8
|
)
|
—
|
|
—
|
|
(367
|
)
|
—
|
|
(3
|
)
|
(2
|
)
|
—
|
|
(372
|
)
|
|||||||||||||||||||||
|
Less: Contract and emission credit amortization, net
|
(5
|
)
|
19
|
|
(2
|
)
|
(2
|
)
|
—
|
|
10
|
|
(6
|
)
|
(1
|
)
|
(54
|
)
|
—
|
|
(51
|
)
|
|||||||||||||||||||||
|
Economic gross margin
|
$
|
1,488
|
|
$
|
2,400
|
|
$
|
283
|
|
$
|
(21
|
)
|
$
|
(14
|
)
|
$
|
4,136
|
|
$
|
1,666
|
|
$
|
380
|
|
$
|
938
|
|
$
|
(8
|
)
|
$
|
7,112
|
|
||||||||||
|
Business Metrics
|
|||||||||||||||||||||||||||||||||||||||||||
|
MWh sold (thousands)
(c)(d)
|
61,599
|
|
57,235
|
|
6,317
|
|
|
|
|
|
3,736
|
|
6,412
|
|
|||||||||||||||||||||||||||||
|
MWh generated (thousands)
(e)
|
57,678
|
|
46,286
|
|
4,542
|
|
|
|
|
|
3,790
|
|
8,899
|
|
|||||||||||||||||||||||||||||
(a) Renewables Other revenue includes $11 million of intercompany revenue to NRG Yield.
(b) Includes purchased energy, capacity and emissions credits.
(c) MWh sold excludes generation at facilities in the West and NRG Yield that generate revenue under tolling agreements.
(d) Does not include MWh of 297 thousand or MWt of 1,946 thousand for thermal sold by NRG Yield.
(e) Does not include MWh of 297 thousand or MWt of 1,946 thousand for thermal generated by NRG Yield.
85
|
Year Ended December 31, 2014
|
|||||||||||||||||||||||||||||||||||||||||||
|
Generation
|
|||||||||||||||||||||||||||||||||||||||||||
|
(In millions except otherwise noted)
|
Gulf Coast
|
East
|
West
|
Other
|
Eliminations
|
Subtotal
|
Retail
|
Renewables
|
NRG Yield
|
Corporate/Eliminations
|
Total
|
||||||||||||||||||||||||||||||||
|
Energy revenue
|
$
|
2,711
|
|
$
|
3,523
|
|
$
|
326
|
|
$
|
41
|
|
$
|
—
|
|
$
|
6,601
|
|
$
|
—
|
|
$
|
302
|
|
$
|
352
|
|
$
|
(1,833
|
)
|
$
|
5,422
|
|
||||||||||
|
Capacity revenue
|
260
|
|
1,269
|
|
257
|
|
—
|
|
—
|
|
1,786
|
|
1
|
|
1
|
|
321
|
|
(22
|
)
|
2,087
|
|
|||||||||||||||||||||
|
Retail revenue
|
—
|
|
—
|
|
—
|
|
—
|
|
—
|
|
—
|
|
7,372
|
|
—
|
|
—
|
|
4
|
|
7,376
|
|
|||||||||||||||||||||
|
Mark-to-market for economic hedging activities
|
504
|
|
42
|
|
(11
|
)
|
—
|
|
—
|
|
535
|
|
—
|
|
4
|
|
2
|
|
(40
|
)
|
501
|
|
|||||||||||||||||||||
|
Contract amortization
|
16
|
|
—
|
|
—
|
|
—
|
|
—
|
|
16
|
|
1
|
|
(1
|
)
|
(29
|
)
|
—
|
|
(13
|
)
|
|||||||||||||||||||||
|
Other revenue
(a)
|
216
|
|
107
|
|
8
|
|
30
|
|
(11
|
)
|
350
|
|
19
|
|
38
|
|
182
|
|
(94
|
)
|
495
|
|
|||||||||||||||||||||
|
Operating revenue
|
3,707
|
|
4,941
|
|
580
|
|
71
|
|
(11
|
)
|
9,288
|
|
7,393
|
|
344
|
|
828
|
|
(1,985
|
)
|
15,868
|
|
|||||||||||||||||||||
|
Cost of fuel
|
(1,494
|
)
|
(1,924
|
)
|
(235
|
)
|
—
|
|
—
|
|
(3,653
|
)
|
(16
|
)
|
(4
|
)
|
(61
|
)
|
157
|
|
(3,577
|
)
|
|||||||||||||||||||||
|
Other costs of sales
(b)
|
(391
|
)
|
(413
|
)
|
(31
|
)
|
—
|
|
—
|
|
(835
|
)
|
(5,941
|
)
|
(7
|
)
|
(28
|
)
|
1,765
|
|
(5,046
|
)
|
|||||||||||||||||||||
|
Mark-to-market for economic hedging activities
|
(23
|
)
|
1
|
|
1
|
|
—
|
|
—
|
|
(21
|
)
|
(508
|
)
|
—
|
|
—
|
|
41
|
|
(488
|
)
|
|||||||||||||||||||||
|
Contract and emission credit amortization
|
(40
|
)
|
8
|
|
8
|
|
—
|
|
(1
|
)
|
(25
|
)
|
(6
|
)
|
—
|
|
—
|
|
—
|
|
(31
|
)
|
|||||||||||||||||||||
|
Gross margin
|
$
|
1,759
|
|
$
|
2,613
|
|
$
|
323
|
|
$
|
71
|
|
$
|
(12
|
)
|
$
|
4,754
|
|
$
|
922
|
|
$
|
333
|
|
$
|
739
|
|
$
|
(22
|
)
|
$
|
6,726
|
|
||||||||||
|
Less: Mark-to-market for economic hedging activities, net
|
481
|
|
43
|
|
(10
|
)
|
—
|
|
—
|
|
514
|
|
(508
|
)
|
4
|
|
2
|
|
1
|
|
13
|
|
|||||||||||||||||||||
|
Less: Contract and emission credit amortization, net
|
(24
|
)
|
8
|
|
8
|
|
—
|
|
(1
|
)
|
(9
|
)
|
(5
|
)
|
(1
|
)
|
(29
|
)
|
—
|
|
(44
|
)
|
|||||||||||||||||||||
|
Economic gross margin
|
$
|
1,302
|
|
$
|
2,562
|
|
$
|
325
|
|
$
|
71
|
|
$
|
(11
|
)
|
$
|
4,249
|
|
$
|
1,435
|
|
$
|
330
|
|
$
|
766
|
|
$
|
(23
|
)
|
$
|
6,757
|
|
||||||||||
|
Business Metrics
|
|||||||||||||||||||||||||||||||||||||||||||
|
MWh sold (thousands)
(c)(d)
|
63,860
|
|
49,619
|
|
4,769
|
|
3,345
|
|
4,659
|
|
|||||||||||||||||||||||||||||||||
|
MWh generated (thousands)
(e)
|
59,872
|
|
51,191
|
|
4,241
|
|
3,345
|
|
6,789
|
|
|||||||||||||||||||||||||||||||||
(a) Renewables Other revenue includes $8 million of intercompany revenue to NRG Yield.
(b) Includes purchased energy, capacity and emissions credits.
(c) MWh sold excludes generation at facilities in the West and NRG Yield that generate revenue under tolling agreements.
(d) Does not include MWh of 205 thousand or MWt of 2,060 thousand for thermal sold by NRG Yield.
(e) Does not include MWh of 224 thousand or MWt of 2,060 thousand for thermal generated by NRG Yield.
The table below represents the weather metrics for
2015
and
2014
:
|
|
Years ended December 31,
|
Quarter ended December 31,
|
Quarter ended September 30,
|
Quarter ended June 30,
|
Quarter ended March 31,
|
|||||||||||||||||||||||||||||||||||||||
|
Weather Metrics
|
Gulf Coast
(b)
|
East
|
West
|
Gulf Coast
(b)
|
East
|
West
|
Gulf Coast
(b)
|
East
|
West
|
Gulf Coast
(b)
|
East
|
West
|
Gulf Coast
(b)
|
East
|
West
|
|||||||||||||||||||||||||||||
|
2015
|
|
|
||||||||||||||||||||||||||||||||||||||||||
|
CDDs
(a)
|
2,871
|
|
1,336
|
|
1,111
|
|
286
|
|
88
|
|
127
|
|
1,652
|
|
824
|
|
772
|
|
892
|
|
391
|
|
195
|
|
41
|
|
33
|
|
17
|
|
||||||||||||||
|
HDDs
(a)
|
1,888
|
|
4,697
|
|
1,948
|
|
556
|
|
1,246
|
|
813
|
|
—
|
|
26
|
|
7
|
|
47
|
|
465
|
|
315
|
|
1,285
|
|
2,960
|
|
813
|
|
||||||||||||||
|
2014
|
||||||||||||||||||||||||||||||||||||||||||||
|
CDDs
|
2,737
|
|
1,068
|
|
1,157
|
|
246
|
|
62
|
|
103
|
|
1,559
|
|
667
|
|
803
|
|
888
|
|
313
|
|
250
|
|
44
|
|
26
|
|
1
|
|
||||||||||||||
|
HDDs
|
2,157
|
|
5,122
|
|
1,712
|
|
748
|
|
1,655
|
|
610
|
|
3
|
|
67
|
|
3
|
|
95
|
|
528
|
|
226
|
|
1,311
|
|
2,872
|
|
873
|
|
||||||||||||||
|
10 year average
|
||||||||||||||||||||||||||||||||||||||||||||
|
CDDs
|
247
|
|
72
|
|
49
|
|
1,598
|
|
751
|
|
611
|
|
968
|
|
337
|
|
160
|
|
89
|
|
27
|
|
1
|
|
||||||||||||||||||||
|
HDDs
|
762
|
|
1,655
|
|
828
|
|
4
|
|
74
|
|
24
|
|
80
|
|
538
|
|
383
|
|
1,053
|
|
2,445
|
|
1,168
|
|
||||||||||||||||||||
(a) National Oceanic and Atmospheric Administration-Climate Prediction Center - A Cooling Degree Day, or CDD, represents the number of degrees that the mean temperature for a particular day is above 65 degrees Fahrenheit in each region. A Heating Degree Day, or HDD, represents the number of degrees that the mean temperature for a particular day is below 65 degrees Fahrenheit in each region. The CDDs/HDDs for a period of time are calculated by adding the CDDs/HDDs for each day during the period.
(b) CDDs/HDDs for the Gulf Coast region represent an average of cumulative population-weighted CDDs/HDDs for Texas and the West South-Central Climate region.
86
Generation gross margin and economic gross margin
The tables below present the changes in Generation gross margin and economic gross margin which include intercompany sales, during the year ended
December 31, 2015
, compared to the same period in
2014
:
|
(In millions)
|
Gross Margin (increase/(decrease))
|
Economic Gross Margin (increase/(decrease))
|
|||||
|
Gulf Coast region
|
$
|
(359
|
)
|
$
|
186
|
|
|
|
East region
|
(470
|
)
|
(162
|
)
|
|||
|
West region
|
(50
|
)
|
(42
|
)
|
|||
|
Other
|
(94
|
)
|
(92
|
)
|
|||
|
$
|
(973
|
)
|
$
|
(110
|
)
|
||
The tables below describe the decrease in Generation gross margin and economic gross margin by region:
Gulf Coast Region
|
(In millions)
|
|||
|
Higher gross margin which reflects a decrease in ERCOT merchant power prices, offset by the impact of beneficial hedges, as well as a decrease in natural gas prices
|
$
|
174
|
|
|
Higher gross margin due to an increase in capacity revenue from higher pricing for certain South Central facilities as well as an increase in average realized prices which reflects the impact of beneficial hedges
|
139
|
|
|
|
Higher gross margin from an increase in gas generation in Texas, which reflects lower supply costs from lower natural gas prices
|
28
|
|
|
|
Lower gross margin due to lower coal generation in Texas, which was driven by lower natural gas prices
|
(71
|
)
|
|
|
Lower capacity revenue due to the expiration of contracts in Texas and South Central
|
(49
|
)
|
|
|
Lower coal gross margin due to lower coal generation in South Central, primarily for the conversion of Big Cajun Unit 2 to gas
|
(32
|
)
|
|
|
Lower gross margin from a decrease in nuclear generation driven by increased planned and unplanned outages
|
(21
|
)
|
|
|
Change in commercial optimization activities and other
|
18
|
|
|
|
Increase in economic gross margin
|
$
|
186
|
|
|
Decrease in mark-to-market for economic hedging primarily due to net unrealized gains/losses on open positions related to economic hedges
|
(564
|
)
|
|
|
Increase in contract and emission credit amortization
|
19
|
|
|
|
Decrease in gross margin
|
$
|
(359
|
)
|
87
East Region
|
(In millions)
|
|||
|
Lower gross margin due to a 27% decrease in coal generation as a result of prior year winter weather conditions and plant deactivations
|
$
|
(324
|
)
|
|
Lower gross margin driven by a 7% decrease in PJM cleared auction capacity volumes primarily from unit deactivations, coupled with increased purchased capacity, partially offset by a 4% increase in PJM cleared auction capacity prices
|
(60
|
)
|
|
|
Changes in commercial optimization activities
|
(34
|
)
|
|
|
Lower gross margin due to market adjustments for fuel oil inventory
|
(8
|
)
|
|
|
Higher gross margin due to the EME acquisition in April 2014
|
121
|
|
|
|
Higher gross margin for gas facilities due to a decrease in natural gas prices, partially offset by a 6% decrease in average realized energy prices, which reflect the impact of beneficial hedges
|
55
|
|
|
|
Higher gross margin due to new load contracts starting in June 2014 and lower supply cost
|
50
|
|
|
|
Higher gross margin primarily driven by a 9% increase in New York and New England hedged capacity prices offset by purchased capacity
|
29
|
|
|
|
Other
|
9
|
|
|
|
Decrease in economic gross margin
|
$
|
(162
|
)
|
|
Decrease in mark-to-market for economic hedging primarily due to net unrealized gains/losses on open positions related to economic hedges
|
(319
|
)
|
|
|
Increase in contract and emission credit amortization
|
11
|
|
|
|
Decrease in gross margin
|
$
|
(470
|
)
|
West Region
|
(In millions)
|
|||
|
Lower capacity gross margin due to a 17% decrease in price as a result of higher reserve margins driven by more competition in certain areas and the expiration of certain tolling arrangements, which were replaced with lower price agreements
|
$
|
(43
|
)
|
|
Lower gross margin due to the retirement of Coolwater
|
(21
|
)
|
|
|
Higher energy gross margin due to a 15% increase in volume driven by more available generation resulting from the expiration of certain tolling arrangements and a 39% decrease in gas prices, partially offset by a 27% decrease in energy prices
|
11
|
|
|
|
Higher gross margin due to the EME acquisition
|
8
|
|
|
|
Other
|
3
|
|
|
|
Decrease in economic gross margin
|
$
|
(42
|
)
|
|
Increase in mark-to-market for economic hedging primarily due to net unrealized gains/losses on open positions related to economic hedges
|
2
|
|
|
|
Decrease in contract and emission credit amortization
|
(10
|
)
|
|
|
Decrease in gross margin
|
$
|
(50
|
)
|
Other
Other gross margin decreased $94 million and economic gross margin decreased $92 million for the year ended
December 31, 2016
, compared to the same period in
2015
, due to BETM over the counter and congestion losses.
88
Retail gross margin and economic gross margin
The following is a discussion of gross margin and economic gross margin for Retail.
|
Years ended December 31,
|
|||||||
|
(In millions except otherwise noted)
|
2015
|
2014
|
|||||
|
Retail revenue
|
$
|
6,613
|
|
$
|
6,985
|
|
|
|
Supply management revenue
|
165
|
|
387
|
|
|||
|
Capacity revenues
|
116
|
|
1
|
|
|||
|
Customer mark-to-market
|
4
|
|
—
|
|
|||
|
Contract amortization
|
—
|
|
1
|
|
|||
|
Other
|
16
|
|
19
|
|
|||
|
Operating revenue
(a)
|
6,914
|
|
7,393
|
|
|||
|
Cost of sales
(b)
|
(5,244
|
)
|
(5,957
|
)
|
|||
|
Mark-to-market for economic hedging activities
|
(4
|
)
|
(508
|
)
|
|||
|
Contract amortization
|
(6
|
)
|
(6
|
)
|
|||
|
Gross margin
|
$
|
1,660
|
|
$
|
922
|
|
|
|
Less: Mark-to-market for economic hedging activities, net
|
—
|
|
(508
|
)
|
|||
|
Less: Contract and emission credit amortization
|
(6
|
)
|
(5
|
)
|
|||
|
Economic gross margin
|
$
|
1,666
|
|
$
|
1,435
|
|
|
|
Business Metrics
|
|||||||
|
Electricity sales volume (GWh) - Gulf Coast
|
51,815
|
|
51,039
|
|
|||
|
Electricity sales volume (GWh) - All other regions
|
10,217
|
|
12,331
|
|
|||
|
Natural gas sales volumes (MDth)
|
1,901
|
|
2,363
|
|
|||
|
Average Retail Mass customer count (in thousands)
|
2,775
|
|
2,718
|
|
|||
|
Ending Retail Mass customer count (in thousands)
|
2,755
|
|
2,844
|
|
|||
|
(a)
|
Includes intercompany sales of $6 million and $7 million in
2015
and
2014
, respectively, representing sales from Retail to the Gulf Coast region.
|
|
(b)
|
Includes intercompany purchases of $1,054 million and $1,846 million in
2015
and
2014
, respectively.
|
Retail gross margin increased
$738 million
and economic gross margin increased
$231 million
for the year ended
December 31, 2015
, compared to the same period in
2014
, due to:
|
(In millions)
|
|||
|
Higher gross margin due to lower supply costs, partially offset by lower rates to customers driven by a decrease in natural gas prices.
|
$
|
189
|
|
|
Higher gross margin due to lower supply costs on higher sales volumes resulting from weather in 2015.
|
50
|
|
|
|
Lower gross margin due to lower volumes driven by lower average customer usage and mix
|
(8
|
)
|
|
|
Increase in economic gross margin
|
$
|
231
|
|
|
Increase in mark-to-market for economic hedging primarily due to net unrealized gains/losses on open positions related to economic hedges
|
508
|
|
|
|
Decrease in contract and emission credit amortization
|
(1
|
)
|
|
|
Increase in gross margin
|
$
|
738
|
|
89
Renewables gross margin and economic gross margin
Renewables gross margin increased
$43 million
and economic gross margin increased
$50 million
for the year ended
December 31, 2015
, compared to the same period in
2014
, primarily driven by the EME acquisition in April 2014 and improved performance at the Ivanpah solar plant, as it continued toward full production capabilities.
NRG Yield gross margin and economic gross margin
NRG Yield gross margin increased
$143 million
and economic gross margin increased
$172 million
for the year ended
December 31, 2015
, compared to the same period in
2014
, primarily related to the acquisition of the Alta Wind Assets in August 2014 as well as the acquisition of the January 2015 Drop Down Assets and the November 2015 Drop Down Assets from NRG, the majority of which were acquired by NRG from EME in April 2014.
Mark-to-market for Economic Hedging Activities
Mark-to-market for economic hedging activities includes asset-backed hedges that have not been designated as cash flow hedges and ineffectiveness on cash flow hedges. Total net mark-to-market results decreased by $385 million in the year ended
December 31, 2015
, compared to the same period in
2014
.
The breakdown of gains and losses included in operating revenues and operating costs and expenses by region are as follows:
|
Year Ended December 31, 2015
|
|||||||||||||||||||||||||||||||
|
Generation
|
|||||||||||||||||||||||||||||||
|
Gulf Coast
|
East
|
West
|
Retail
|
Renewables
|
NRG Yield
|
Elimination
(a)
|
Total
|
||||||||||||||||||||||||
|
|
(In millions)
|
||||||||||||||||||||||||||||||
|
Mark-to-market results in operating revenues
|
|
|
|
|
|
||||||||||||||||||||||||||
|
Reversal of previously recognized unrealized (gains)/losses on settled positions related to economic hedges
|
$
|
(408
|
)
|
$
|
(288
|
)
|
$
|
6
|
|
$
|
(1
|
)
|
$
|
(3
|
)
|
$
|
(2
|
)
|
$
|
(46
|
)
|
$
|
(742
|
)
|
|||||||
|
Reversal of acquired gain positions related to economic hedges
|
—
|
|
(84
|
)
|
—
|
|
—
|
|
—
|
|
—
|
|
—
|
|
(84
|
)
|
|||||||||||||||
|
Net unrealized gains on open positions related to economic hedges
|
342
|
|
174
|
|
4
|
|
5
|
|
—
|
|
—
|
|
57
|
|
582
|
|
|||||||||||||||
|
Total mark-to-market (losses)/gains in operating revenues
|
$
|
(66
|
)
|
$
|
(198
|
)
|
$
|
10
|
|
$
|
4
|
|
$
|
(3
|
)
|
$
|
(2
|
)
|
$
|
11
|
|
$
|
(244
|
)
|
|||||||
|
Mark-to-market results in operating costs and expenses
|
|
|
|
|
|
||||||||||||||||||||||||||
|
Reversal of previously recognized unrealized losses/(gains) on settled positions related to economic hedges
|
$
|
34
|
|
$
|
15
|
|
$
|
(1
|
)
|
$
|
373
|
|
$
|
—
|
|
$
|
—
|
|
$
|
46
|
|
$
|
467
|
|
|||||||
|
Reversal of acquired gain positions related to economic hedges
|
—
|
|
—
|
|
(18
|
)
|
(4
|
)
|
—
|
|
—
|
|
—
|
|
(22
|
)
|
|||||||||||||||
|
Net unrealized (losses)/gains on open positions related to economic hedges
|
(51
|
)
|
(93
|
)
|
1
|
|
(373
|
)
|
—
|
|
—
|
|
(57
|
)
|
(573
|
)
|
|||||||||||||||
|
Total mark-to-market gains/(losses) in operating costs and expenses
|
$
|
(17
|
)
|
$
|
(78
|
)
|
$
|
(18
|
)
|
$
|
(4
|
)
|
$
|
—
|
|
$
|
—
|
|
$
|
(11
|
)
|
$
|
(128
|
)
|
|||||||
|
(a)
|
Represents the elimination of the intercompany activity between Retail and Generation.
|
90
|
Year Ended December 31, 2014
|
|||||||||||||||||||||||||||||||
|
Generation
|
|||||||||||||||||||||||||||||||
|
Gulf Coast
|
East
|
West
|
Retail
|
Renewables
|
NRG Yield
|
Elimination
(a)
|
Total
|
||||||||||||||||||||||||
|
|
(In millions)
|
||||||||||||||||||||||||||||||
|
Mark-to-market results in operating revenues
|
|
|
|
|
|
||||||||||||||||||||||||||
|
Reversal of previously recognized unrealized (gains)/losses on settled positions related to economic hedges
|
$
|
(6
|
)
|
$
|
10
|
|
$
|
(5
|
)
|
$
|
—
|
|
$
|
1
|
|
$
|
—
|
|
$
|
(1
|
)
|
$
|
(1
|
)
|
|||||||
|
Reversal of acquired (gain)/loss positions related to economic hedges
|
—
|
|
(325
|
)
|
1
|
|
—
|
|
—
|
|
—
|
|
—
|
|
(324
|
)
|
|||||||||||||||
|
Net unrealized gains/(losses) on open positions related to economic hedges
|
510
|
|
357
|
|
(7
|
)
|
—
|
|
3
|
|
2
|
|
(39
|
)
|
826
|
|
|||||||||||||||
|
Total mark-to-market gains/(losses) in operating revenues
|
$
|
504
|
|
$
|
42
|
|
$
|
(11
|
)
|
$
|
—
|
|
$
|
4
|
|
$
|
2
|
|
$
|
(40
|
)
|
$
|
501
|
|
|||||||
|
Mark-to-market results in operating costs and expenses
|
|
|
|
|
|
||||||||||||||||||||||||||
|
Reversal of previously recognized unrealized (gains)/losses on settled positions related to economic hedges
|
$
|
2
|
|
$
|
10
|
|
$
|
—
|
|
$
|
(27
|
)
|
$
|
—
|
|
$
|
—
|
|
$
|
1
|
|
$
|
(14
|
)
|
|||||||
|
Reversal of acquired (gain)/loss positions related to economic hedges
|
—
|
|
11
|
|
—
|
|
(20
|
)
|
—
|
|
—
|
|
—
|
|
(9
|
)
|
|||||||||||||||
|
Net unrealized (losses)/gains on open positions related to economic hedges
|
(25
|
)
|
(20
|
)
|
1
|
|
(461
|
)
|
—
|
|
—
|
|
40
|
|
(465
|
)
|
|||||||||||||||
|
Total mark-to-market (losses)/gains in operating costs and expenses
|
$
|
(23
|
)
|
$
|
1
|
|
$
|
1
|
|
$
|
(508
|
)
|
$
|
—
|
|
$
|
—
|
|
$
|
41
|
|
$
|
(488
|
)
|
|||||||
|
(a)
|
Represents the elimination of the intercompany activity between Retail and Generation.
|
Mark-to-market results consist of unrealized gains and losses on contracts that are not yet settled. The settlement of these transactions is reflected in the same revenue or cost caption as the items being hedged.
The reversals of acquired gain or loss positions were valued based upon the forward prices on the acquisition date.
For the year ended
December 31, 2015
, the
$244 million
loss in operating revenues from economic hedge positions was driven primarily by the reversal of previously recognized unrealized gains on contracts that settled during the period and the reversal of acquired contracts largely offset by an increase in value of open positions as a result of decreases in ERCOT and PJM electricity prices. The
$128 million
loss in operating costs and expenses from economic hedge positions was driven primarily by a decrease in the value of open positions as a result of decreases in ERCOT electricity and coal prices and the reversal of acquired contracts, largely offset by the reversal of previously recognized unrealized losses on contracts that settled during the period.
In accordance with ASC 815, the following table represents the results of the Company's financial and physical trading of energy commodities for the years ended
December 31, 2015
and
2014
. The realized and unrealized financial and physical trading results are included in operating revenues. The Company's trading activities are subject to limits within the Company's Risk Management Policy.
|
|
Year Ended December 31,
|
||||||
|
|
2015
|
2014
|
|||||
|
|
(In millions)
|
||||||
|
Trading gains/(losses)
|
|
|
|||||
|
Realized
|
$
|
57
|
|
$
|
136
|
|
|
|
Unrealized
|
(76
|
)
|
14
|
|
|||
|
Total trading (losses)/gains
|
$
|
(19
|
)
|
$
|
150
|
|
|
91
In addition, trading activities reflect a decrease in gross margin of
$69 million
, reflected in the Generation segment, for the year ended
December 31, 2015
, as compared to the same period in
2014
.
Operations and Maintenance Expense
|
Generation
|
Retail
|
Renewables
|
NRG Yield
|
Corporate
|
Eliminations
|
||||||||||||||||||||||||||||||||||||||
|
Gulf Coast
|
East
|
West
|
Other
|
Eliminations
|
Total
|
||||||||||||||||||||||||||||||||||||||
|
(In millions)
|
|||||||||||||||||||||||||||||||||||||||||||
|
Year Ended December 31, 2015
|
$
|
656
|
|
$
|
1,006
|
|
$
|
143
|
|
$
|
1
|
|
$
|
(14
|
)
|
$
|
253
|
|
$
|
94
|
|
$
|
178
|
|
$
|
22
|
|
$
|
(5
|
)
|
$
|
2,334
|
|
||||||||||
|
Year Ended December 31, 2014
|
$
|
636
|
|
$
|
1,014
|
|
$
|
159
|
|
$
|
1
|
|
$
|
(11
|
)
|
$
|
235
|
|
$
|
128
|
|
$
|
140
|
|
$
|
3
|
|
$
|
(61
|
)
|
$
|
2,244
|
|
||||||||||
Operations and maintenance expenses increased by $90 million for the year ended
December 31, 2015
, compared to the same period in
2014
, due to the following:
|
(In millions)
|
|||
|
Increase due to the acquisition of EME in April 2014 and the Alta Wind Assets in August 2014
|
$
|
116
|
|
|
Increase in operations and maintenance expense related to planned outages at Cottonwood and Big Cajun
|
42
|
|
|
|
Increase in Retail operations and maintenance expense related to retail acquisitions and product expansion in the core retail business.
|
18
|
|
|
|
Increase in operations and maintenance expense related to Ivanpah solar plant reaching commercial operations in early 2014
|
8
|
|
|
|
Increase in operations and maintenance expense related to El Segundo Energy Center's forced outage in 2015
|
6
|
|
|
|
Increase due to the acquisition of Dominion in March 2014
|
4
|
|
|
|
Decrease in East operations and maintenance expense related to the timing end expense for prior year outages at various plants
|
(64
|
)
|
|
|
Decrease in operations and maintenance expense due to the retirement of Coolwater
|
(30
|
)
|
|
|
Decrease in operations and maintenance expense related to Texas coal facilities due to timing of outages
|
(14
|
)
|
|
|
Other
|
4
|
|
|
|
$
|
90
|
|
|
Other cost of operations
|
Generation
|
Retail
|
Renewables
|
NRG Yield
|
Corporate
|
|||||||||||||||||||||||||||||||
|
Gulf Coast
|
East
|
West
|
Other
|
Total
|
|||||||||||||||||||||||||||||||
|
(In millions)
|
|||||||||||||||||||||||||||||||||||
|
Year Ended December 31, 2015
|
$
|
103
|
|
$
|
131
|
|
$
|
25
|
|
$
|
—
|
|
$
|
113
|
|
$
|
21
|
|
$
|
72
|
|
$
|
—
|
|
$
|
465
|
|
||||||||
|
Year Ended December 31, 2014
|
$
|
110
|
|
$
|
122
|
|
$
|
22
|
|
$
|
—
|
|
$
|
109
|
|
$
|
16
|
|
$
|
48
|
|
$
|
(5
|
)
|
$
|
422
|
|
||||||||
Other cost of operations, comprised of asset retirement expense, insurance expense and property tax expense, increased by
$43 million
for the year ended
December 31, 2015
, compared to the same period in
2014
, primarily due to an increase in property tax expense related to the acquisition of EME in April 2014 and the Alta Wind Assets in August 2014.
92
Depreciation and Amortization
|
Generation
|
Retail
|
Renewables
|
NRG Yield
|
Corporate
|
|||||||||||||||||||||||||||||||
|
Gulf Coast
|
East
|
West
|
Other
|
Total
|
|||||||||||||||||||||||||||||||
|
(In millions)
|
|||||||||||||||||||||||||||||||||||
|
Year Ended December 31, 2015
|
$
|
546
|
|
$
|
299
|
|
$
|
51
|
|
$
|
—
|
|
$
|
134
|
|
$
|
180
|
|
$
|
297
|
|
$
|
59
|
|
$
|
1,566
|
|
||||||||
|
Year Ended December 31, 2014
|
$
|
590
|
|
$
|
294
|
|
$
|
70
|
|
$
|
—
|
|
$
|
134
|
|
$
|
164
|
|
$
|
233
|
|
$
|
38
|
|
$
|
1,523
|
|
||||||||
Depreciation and amortization expense increased by
$43 million
for the year ended
December 31, 2015
, compared to the same period in
2014
, primarily due to increases of $19 million and $40 million due to the acquisitions of EME in April 2014 and the Alta Wind Assets in August 2014, respectively, partially offset by a decrease in expense for facilities impaired during 2015.
Impairment Losses
In 2015, the Company recorded impairment losses of
$5,030 million
related to various facilities, as well as goodwill for its Texas and Home Solar reporting units, as further described in Item 15 -
Note 10
,
Asset Impairments
and
Note 11
,
Goodwill and Other Intangibles
, to the Consolidated Financial Statements
.
In 2014, the Company recorded an impairment loss of
$97 million
related primarily to the Osceola and Coolwater facilities, as further described in Item 15
—
Note 10
,
Asset Impairments
, to the Consolidated Financial Statements
.
Selling, Marketing, General and Administrative Expenses
|
Generation
|
Retail
|
Renewables
|
NRG Yield
|
Corporate
|
Total
|
||||||||||||||||||
|
(In millions)
|
|||||||||||||||||||||||
|
Year Ended December 31, 2015
|
$
|
393
|
|
$
|
494
|
|
$
|
53
|
|
$
|
12
|
|
$
|
247
|
|
$
|
1,199
|
|
|||||
|
Year Ended December 31, 2014
|
$
|
398
|
|
$
|
455
|
|
$
|
36
|
|
$
|
8
|
|
$
|
119
|
|
$
|
1,016
|
|
|||||
Selling, marketing, general and administrative expenses increased by $183 million for the year ended December 31, 2015 compared to the same period in 2014, due primarily to the expansion of the residential solar business and an increase in retail acquisitions as well as channel and product expansions in the core retail business.
Acquisition-related Transaction and Integration Costs
NRG incurred transaction and integration costs of
$10 million
for the year ended
December 31, 2015
, compared to
$84 million
for the same period in
2014
. The reduction in transaction and integration costs is due primarily to the substantial completion of integration activities for the acquisition of Alta Wind, Dominion and EME in 2014.
Development Costs
NRG incurred development costs of
$146 million
for the year ended
December 31, 2015
, compared to
$88 million
for the same period in
2014
. This increase in development costs is due to increased development activities, primarily for Renewables and NRG EVgo.
Impairment Losses on Investments
In 2015, the Company recorded other-than-temporary impairment losses on certain of its cost and equity method investments of
$56 million
, as further described in Item 15
—
Note 10
,
Asset Impairments
, to the Consolidated Financial Statements.
93
(Loss)/Gain on Sale of Equity Method Investment
In the fourth quarter of 2015, the Company sold its 32% interest in Altenex, as described in Item 15
—
Note 3
,
Business Acquisitions and Dispositions
, to the Consolidated Financial Statements. In connection with the sale, the Company received cash proceeds of $26 million and recorded a loss on sale of
$14 million
.
In the fourth quarter of 2014, the Company sold its investment in Sabine, as described in Item 15
—
Note 3
,
Business Acquisitions and Dispositions
, to the Consolidated Financial Statements. In connection with the sale, the Company received cash proceeds of $35 million and recorded a gain on sale of
$18 million
.
Gain/(Loss) on Debt Extinguishment
A gain on debt extinguishment of
$75 million
was recorded for the year ended
December 31, 2015
, primarily driven by the repurchase of NRG senior notes due 2023 and 2024, GenOn senior notes due 2020 and GenOn Americas Generation senior notes due 2021 and 2031 at a price below par value, combined with the write-off of unamortized premium.
In the fourth quarter of 2014, a loss of
$95 million
was recorded primarily due to the redemption premiums from the redemption of the 2019 Senior Notes. These gains/losses also included the write-off of previously deferred financing costs.
Interest Expense
NRG's interest expense increased by
$9 million
for the year ended
December 31, 2015
, compared to the same period in
2014
, due to the following:
|
(In millions)
|
|||
|
Increase due to the acquisition of EME in April 2014 and Alta Wind in August 2014
|
$
|
51
|
|
|
Increase for the 2022 Senior Notes issued in January 2014 and the 2024 Senior Notes issued in April 2014
|
24
|
|
|
|
Increase due to issuance of the NRG Yield Operating LLC 2024 Senior Notes issued in 2014
|
17
|
|
|
|
Decrease in derivative interest expense primarily from changes in fair value of interest rate swaps
|
(40
|
)
|
|
|
Decrease due to the redemption of 7.625% and 8.5% Senior Notes due 2019
|
(38
|
)
|
|
|
Other
|
(5
|
)
|
|
|
$
|
9
|
|
|
94
Income Tax Expense
For the year ended
December 31, 2015
, NRG recorded an income tax expense of
$1,342 million
on a pre-tax loss of
$5,094 million
. For the same period in
2014
, NRG recorded an income tax expense of
$3 million
on pre-tax income of
$135 million
. The effective tax rate was
(26.3)%
and
2.2%
for the years ended
December 31, 2015
and
2014
, respectively.
For the year ended
December 31, 2015
, NRG's overall effective tax rate was different than the statutory rate of 35% primarily due to recording of a valuation allowance on the federal and certain state net deferred tax assets that may not be realizable under a “more likely than not” measurement. In addition, a portion of the book goodwill impairment is classified as a permanent reversal impacting the effective tax rate.
|
|
Year Ended December 31,
|
||||||
|
|
2015
|
2014
|
|||||
|
|
(In millions
except as otherwise stated)
|
||||||
|
(Loss)/income before income taxes
|
$
|
(5,094
|
)
|
$
|
135
|
|
|
|
Tax at 35%
|
(1,783
|
)
|
47
|
|
|||
|
State taxes
|
(218
|
)
|
9
|
|
|||
|
Foreign operations
|
1
|
|
1
|
|
|||
|
Federal and state tax credits, excluding PTCs
|
(5
|
)
|
(1
|
)
|
|||
|
Valuation allowance
|
3,039
|
|
6
|
|
|||
|
Book goodwill impairment
|
340
|
|
—
|
|
|||
|
Impact of non-taxable entity earnings
|
(10
|
)
|
(11
|
)
|
|||
|
Net interest accrued on uncertain tax positions
|
(3
|
)
|
(2
|
)
|
|||
|
Production tax credits
|
(33
|
)
|
(48
|
)
|
|||
|
Recognition of uncertain tax benefits
|
(15
|
)
|
(30
|
)
|
|||
|
Tax expense attributable to consolidated partnerships
|
12
|
|
4
|
|
|||
|
Impact of change in effective state tax rate
|
19
|
|
22
|
|
|||
|
Other
|
(2
|
)
|
6
|
|
|||
|
Income tax expense
|
$
|
1,342
|
|
$
|
3
|
|
|
|
Effective income tax rate
|
(26.3
|
)%
|
2.2
|
%
|
|||
The effective income tax rate may vary from period to period depending on, among other factors, the geographic and business mix of earnings and losses and changes in valuation allowances in accordance with ASC 740. These factors and others, including the Company's history of pre-tax earnings and losses, are taken into account in assessing the ability to realize deferred tax assets.
Net loss attributable to noncontrolling interests and redeemable noncontrolling interests
Net loss attributable to noncontrolling interests and redeemable noncontrolling interests was
$54 million
for the year ended
December 31, 2015
, compared to
$2 million
for the year ended
December 31, 2014
. For the years ended
December 31, 2015
and
2014
, the net losses attributable to noncontrolling interests primarily reflect losses allocated to tax equity investors using the hypothetical liquidation at book value, or HLBV, method, offset in part by NRG Yield, Inc.'s share of net income for the period.
Liquidity and Capital Resources
Liquidity Position
As of
December 31, 2016
and
2015
, NRG's liquidity, excluding collateral funds deposited by counterparties, was approximately $3.6 billion and $3.3 billion, respectively, comprised of the following:
|
|
As of December 31,
|
||||||
|
|
2016
|
2015
|
|||||
|
|
(In millions)
|
||||||
|
Cash and cash equivalents:
|
|||||||
|
NRG excluding NRG Yield and GenOn
(b)
|
$
|
622
|
|
$
|
742
|
|
|
|
NRG Yield and subsidiaries
|
317
|
|
111
|
|
|||
|
GenOn and subsidiaries
(b)(c)
|
1,034
|
|
665
|
|
|||
|
Restricted cash - operating
|
56
|
|
127
|
|
|||
|
Restricted cash - reserves
(a)
|
390
|
|
287
|
|
|||
|
Total
|
2,419
|
|
1,932
|
|
|||
|
Total credit facility availability
|
1,217
|
|
1,373
|
|
|||
|
Total liquidity, excluding collateral funds deposited by counterparties
|
$
|
3,636
|
|
$
|
3,305
|
|
|
|
(a)
|
Includes reserves primarily for debt service, performance obligations, and capital expenditures
|
|
(b)
|
GenOn has the ability to draw on letters of credit associated with their intercompany revolving credit agreement with NRG. As of December 31, 2016, $272 million of letters of credit were outstanding under this agreement for GenOn. Of this amount, $199 million were issued on behalf of GenOn Americas Generation, which includes $128 million issued on behalf of GenOn Mid-Atlantic.
|
|
(c)
|
See Restricted Payments Tests, described below.
|
For the year ended
December 31, 2016
, total liquidity, excluding collateral funds deposited by counterparties, increased by $331 million. Changes in cash and cash equivalent balances are further discussed hereinafter under the heading
Cash Flow Discussion
. Cash and cash equivalents at
December 31, 2016
were predominantly held in money market funds invested in treasury securities, treasury repurchase agreements or government agency debt.
Management believes that the Company's liquidity position and cash flows from operations will be adequate to finance operating and maintenance capital expenditures, to fund dividends to NRG's common stockholders, and other liquidity commitments with exception of commitments related to GenOn as further described below. Management continues to regularly monitor the Company's ability to finance the needs of its operating, financing and investing activity within the dictates of prudent balance sheet management.
Restricted Payments Tests
Of the $2.0 billion of cash and cash equivalents of the Company as of
December 31, 2016
, $471 million and $100 million were held by GenOn Mid-Atlantic and REMA, respectively. The ability of certain of GenOn’s and GenOn Americas Generation’s subsidiaries to pay dividends and make distributions is restricted under the terms of certain agreements, including the GenOn Mid-Atlantic and REMA operating leases. Under their respective operating leases, GenOn Mid-Atlantic and REMA are not permitted to make any distributions and other restricted payments unless: (a) they satisfy the fixed charge coverage ratio for the most recently ended period of four fiscal quarters; (b) they are projected to satisfy the fixed charge coverage ratio for each of the two following periods of four fiscal quarters, commencing with the fiscal quarter in which such payment is proposed to be made; and (c) no significant lease default or event of default has occurred and is continuing. In addition, prior to making a dividend or other restricted payment, GenOn Mid-Atlantic and REMA must be in compliance with the requirement to provide credit support to the owner lessors securing their obligations to pay scheduled rent under their respective leases. Based on GenOn Mid-Atlantic’s and REMA’s most recent calculations of these tests, GenOn Mid-Atlantic and REMA did not satisfy the restricted payments tests. As a result, as of
December 31, 2016
, GenOn Mid-Atlantic and REMA could not make distributions of cash and certain other restricted payments. Each of GenOn Mid-Atlantic and REMA may recalculate its fixed charge coverage ratios from time to time and, subject to compliance with the restricted payments test described above, make dividends or other restricted payments.
To the extent GenOn Mid-Atlantic or REMA are able to pay dividends to GenOn, the GenOn Senior Notes due 2018 and 2020 and the related indentures restrict the ability of GenOn to incur additional liens and make certain restricted payments, including dividends. In the event of a default or if restricted payment tests are not satisfied, GenOn would not be able to distribute cash to its parent, NRG. At
December 31, 2016
, GenOn did not meet the consolidated debt ratio component of the restricted payments test.
95
GenOn Liquidity
As disclosed in Item 15 - Note 1,
Nature of Business
, and Note 12,
Debt and Capital Leases
, to the Consolidated Financial Statements, $691 million of GenOn's Senior Notes, excluding $8 million of associated premiums, are current within the GenOn consolidated balance sheet as of December 31, 2016 and are due on June 15, 2017. GenOn's future profitability continues to be adversely affected by (i) a sustained decline in natural gas prices and its resulting effect on wholesale power prices and capacity prices, and (ii) the inability of GenOn Mid-Atlantic and REMA to make distributions of cash and certain other restricted payments to GenOn. Based on current projections, GenOn is not expected to have sufficient liquidity to repay the Senior Notes due in June 2017. As a result of these factors, there is substantial doubt about GenOn's ability to continue as a going concern. As a result of the substantial doubt about GenOn’s ability to continue as a going concern, along with additional factors, there is substantial doubt about certain of GenOn’s subsidiaries’ ability to continue as a going concern.
The Company, GenOn's parent company, has no obligation to provide any financial support to GenOn other than under the secured intercompany revolving credit agreement between the Company and GenOn and NRG Americas. As of December 31, 2016, $228 million was available to be used by GenOn under the $500 million revolving credit agreement. As controlled group members, ERISA requires that NRG and GenOn are jointly and severally liable for the NRG Pension Plan for Bargained Employees and the NRG Pension Plan, including the pension liabilities associated with GenOn employees.
GenOn is currently considering all options available to it, including negotiations with creditors, refinancing the GenOn Senior Notes, potential sales of certain generating assets as well as the possibility for a need to file for protection under Chapter 11 of the U.S. Bankruptcy Code. During 2016, GenOn appointed two independent directors, retained advisors and established a separate audit committee as part of this process. Any resolution may have a material impact on the Company's statement of operations, cash flows and financial position.
As of December 31, 2016, GenOn represents 15.6% of the Company's consolidated total assets, 16.9% of the Company's consolidated total liabilities and contributed $94 million to the Company's consolidated cash from operations in 2016.
Credit Ratings
On March 3, 2016 and March 21, 2016, respectively, S&P and Moody's reaffirmed the corporate credit ratings on NRG Energy, Inc.
On October 7, 2016, GenOn's corporate credit rating was lowered by Moody's from Caa2 to Caa3 and its probability of default rating was lowered from Caa2-PD to Caa3-PD. In addition, Moody's also lowered the ratings of REMA and GenOn Mid-Atlantic's pass through certificates to Caa1 from B2. This is an update from March 21, 2016, at which time GenOn's corporate credit rating was lowered from B3 to Caa2. At that time, Moody's also lowered the issue level ratings on the GenOn senior notes from B3 to Caa2 and the GenOn America's Generation senior notes from Caa1 to Caa2.
On August 15, 2016, S&P lowered its corporate credit ratings on NRG Yield, Inc. and the NRG Yield Operating 2024 Senior Notes to BB from BB+. The ratings outlook is stable.
On January 10, 2017, GenOn's corporate credit rating was further lowered by S&P to CCC- from CCC. The ratings outlook for GenOn, GenOn Americas Generation, GenOn Mid-Atlantic and REMA is negative. In addition, S&P also lowered the issue-level ratings on the GenOn Senior Notes to CCC from CCC+, the GenOn Americas Generation Senior Notes to CCC- from CCC, and the pass-through certificates at REMA and GenOn Mid-Atlantic to CCC+ from B-.
96
The following table summarizes the Company's current credit ratings:
|
|
S&P
|
Moody's
|
|
|
NRG Energy, Inc.
|
BB- Stable
|
Ba3 Stable
|
|
|
7.625% Senior Notes, due 2018
|
BB-
|
B1
|
|
|
8.25% Senior Notes, due 2020
|
BB-
|
B1
|
|
|
7.875% Senior Notes, due 2021
|
BB-
|
B1
|
|
|
6.25% Senior Notes, due 2022
|
BB-
|
B1
|
|
|
6.625% Senior Notes, due 2023
|
BB-
|
B1
|
|
|
6.25% Senior Notes, due 2024
|
BB-
|
B1
|
|
|
7.25% Senior Notes, due 2026
|
BB-
|
B1
|
|
|
6.625% Senior Notes, due 2027
|
BB-
|
B1
|
|
|
Term Loan Facility, due 2023
|
BB+
|
Baa3
|
|
|
GenOn 7.875% Senior Notes, due 2017
|
CCC
|
Caa3
|
|
|
GenOn 9.500% Senior Notes, due 2018
|
CCC
|
Caa3
|
|
|
GenOn 9.875% Senior Notes, due 2020
|
CCC
|
Caa3
|
|
|
GenOn Americas Generation 8.500% Senior Notes, due 2021
|
CCC-
|
Caa3
|
|
|
GenOn Americas Generation 9.125% Senior Notes, due 2031
|
CCC-
|
Caa3
|
|
|
NRG Yield, Inc.
|
BB
|
Ba2
|
|
|
5.375% NRG Yield Operating LLC Senior Notes, due 2024
|
BB
|
Ba2
|
|
|
5.00% NRG Yield Operating LLC Senior Notes, due 2026
|
BB
|
Ba2
|
|
97
Sources of Liquidity
The principal sources of liquidity for NRG's future operating and capital expenditures are expected to be derived from new and existing financing arrangements, existing cash on hand, cash flows from operations and cash proceeds from future sales of assets, including sales to NRG Yield, Inc. As described in Item 15 —
Note 12
,
Debt and Capital Leases
,
to the Consolidated Financial Statements, the Company's financing arrangements consist mainly of the 2016 Senior Credit Facility, the Senior Notes, the GenOn Senior Notes, the GenOn Americas Generation Senior Notes, the NRG Yield 2019 Convertible Notes, the NRG Yield 2020 Convertible Notes, the Yield Operating 2020 senior unsecured notes, the NRG Yield, Inc. revolving credit facility, and project-related financings.
Offer and Drop Down of Assets to NRG Yield, Inc.
In December 2016, NRG offered NRG Yield, Inc. the opportunity to purchase the following assets: (i) the Minnesota Portfolio, a 40 MW portfolio of wind project; (ii) the 30 MW Community wind projects; (iii) the 50 MW Jeffers wind projects; and (iv) a 16% interest in the 290 MW Agua Caliente solar project, pursuant to the ROFO Agreement. In addition to these ROFO Agreement assets, NRG also offered NRG Yield, Inc. the opportunity to purchase NRG's 50% interests in seven utility-scale solar projects located in Utah, representing 265 net MW of capacity.
On February 24, 2017, the Company and NRG Yield, Inc. entered into a definitive agreement regarding the sale of the following projects to NRG Yield, Inc.: (i) a 16% interest (approximately 31% of NRG's 51% interest) in the Agua Caliente solar project, one of the ROFO Agreement assets, representing ownership of approximately 46 net MW of capacity; and (ii) NRG's 50% interests in seven utility-scale solar projects located in Utah representing 265 net MW of capacity. NRG expects total cash consideration for the transaction to be $130 million, plus assumed non-recourse project debt of approximately $464 million, excluding working capital and other adjustments.
NRG Yield, Inc. elected not to pursue the acquisition of the Minnesota, Community, and Jeffers wind projects at this time, but may continue its evaluation of the projects. NRG Yield, Inc. has retained the right with NRG, pursuant to the ROFO Agreement, to participate in any third party process to the extent NRG elected to pursue a third party sale of these assets.
ROFO Agreement Expansion
On February 24, 2017, the Company amended and restated the ROFO Agreement to expand the ROFO assets pipeline with the addition of 234 net MW of utility-scale solar projects. These assets include Buckthorn Solar, a 154 net MW facility located in Texas, and the Hawaii Solar projects, which have a combined capacity of 80 net MW.
Sale of CVSR to NRG Yield, Inc. and CVSR Financing Arrangement
On July 15, 2016, CVSR Holdco LLC issued $200 million of senior secured notes
that bear interest at 4.68% and mature on March 31, 2037
. The $199 million of net proceeds from the notes were distributed to a subsidiary of NRG and to NRG Yield Operating LLC, the owners of CVSR Holdco LLC, based on their pro-rata ownership. NRG Yield Operating LLC utilized its net proceeds of $97.5 million to reduce the outstanding balance of its revolving credit facility. NRG expects to utilize its net proceeds in connection with the 2016 Capital Allocation Program. On September 1, 2016, the Company sold its remaining
51.05%
interest in CVSR Holdco LLC, which indirectly owns the CVSR solar facility, to NRG Yield, Inc. for total cash consideration of
$78.5 million
plus an immaterial working capital adjustment. NRG Yield, Inc. also assumed
$496 million
of non-recourse debt as of the closing date.
Thermal Financing
On October 31, 2016, NRG Energy Center Minneapolis LLC, a subsidiary of NRG Yield, Inc., received proceeds of $125 million from the issuance of 3.55% Series D notes due October 31, 2031, or the Series D Notes, and entered into a shelf facility for the anticipated issuance of an additional $70 million of notes. In the first quarter of 2017, NRG Energy Center Minneapolis LLC, anticipates amending the shelf facility to allow for the issuance of an additional $10 million of notes
, increasing the total principal amount of notes available for issuance under the shelf facility to $80 million
. The Series D Notes are, and the additional notes, if issued, will be secured by substantially all of the assets of NRG Energy Center Minneapolis LLC. NRG Thermal LLC has guaranteed the indebtedness and its guarantee is secured by a pledge of the equity interests in all of NRG Thermal LLC’s subsidiaries. NRG Energy Center Minneapolis LLC distributed the proceeds of the Series D Notes to NRG Thermal LLC, who in turn distributed the proceeds to NRG Yield Operating LLC to be utilized for general corporate purposes, including potential acquisitions.
98
Issuance of 2027 Senior Notes
On August 2, 2016, NRG issued
$1.25 billion
in aggregate principal amount at par of 6.625% senior notes due 2027, or the 2027 Senior Notes. The 2027 Senior Notes are senior unsecured obligations of NRG and are guaranteed by certain of its subsidiaries. Interest is paid semi-annually beginning on January 15, 2017, until the maturity date of January 15, 2027. The proceeds from the issuance of the 2027 Senior Notes were utilized to retire the Company's 8.250% senior notes due 2020 and to reduce the balance of the Company's 7.875% senior notes due 2021.
2023 Term Loan Facility
On January 24, 2017, NRG repriced the 2023 Term Loan Facility, reducing the interest rate margin by 50 basis points to LIBOR plus 2.25%, the LIBOR floor remains 0.75%. As a result of the repricing the Company expects interest savings of approximately $9 million in 2017 and approximately $60 million in interest savings over the life of the loan.
Capistrano Refinancing
In July 2016, Cedro Hill, Broken Bow and Crofton Bluffs, subsidiaries of Capistrano Wind Partners, each amended their respective credit facilities to increase borrowings to a total of $312 million and to lower their respective interest rates. The net proceeds of $87 million were distributed to Capistrano Wind Partners and subsequently distributed to the holders of the Class B preferred equity interests of Capistrano Wind Partners.
EVgo
On June 17, 2016, the Company completed the sale of a majority interest in its EVgo business to Vision Ridge Partners for total consideration of approximately $39 million, including $17 million in cash received net of $2.5 million in working capital adjustments, $15 million contributed as capital to the EVgo business and $7 million of future contributions by Vision Ridge Partners, all of which were determined based on forecasted cash requirements to operate the business in future periods. In addition, the Company has future earnout potential of up to $70 million based on future profitability targets. NRG will retain its original financial obligation of $102.5 million under its agreement with the CPUC, whereby EVgo will build at least 200 public fast charging Freedom Station sites and perform the associated work to prepare 10,000 commercial and multi-family parking spaces for electric vehicle charging in California. As a result of the sale, the Company recorded the accrual of NRG's remaining obligation under its agreement with the CPUC of
$56 million
, of which
$47 million
remains as of December 31, 2016.
Issuance of 2026 Senior Notes
On May 23, 2016, NRG issued
$1.0 billion
in aggregate principal amount at par of
7.25%
senior notes due 2026, or the 2026 Senior Notes. The 2026 Senior Notes are senior unsecured obligations of NRG and are guaranteed by certain of its subsidiaries. Interest is paid semi-annually beginning on November 15, 2016, until the maturity date of May 15, 2026. The proceeds from the issuance of the 2026 Senior Notes were utilized to redeem a portion of the Senior Notes as discussed in
Uses of Liquidity
.
Midwest Generation
On April 7, 2016, Midwest Generation, LLC, or MWG, entered into an agreement to sell certain quantities of unforced capacity that has cleared various PJM Reliability Pricing Model auctions to a trading counterparty for net proceeds of $253 million. MWG will continue to operate the applicable generation facilities and remains responsible for performance penalties and is eligible for performance bonus payments, if any. Accordingly, MWG will continue to account for all revenues and costs as before; however, the proceeds will be recorded as a financing obligation while capacity payments by PJM to the counterparty will be reflected as debt amortization and interest expense through the end of the 2018/19 delivery year. MWG will amortize the upfront discount to interest expense, at an effective interest rate of 4.39%, over the term of the arrangement, through June 2019.
Asset Dispositions
During the year ended December 31, 2016, the Company received proceeds of $118 million related to the sale of GenOn's Seward and Shelby generating stations, proceeds of $56 million related to the sale of its Rockford generating stations, proceeds of $369 million related to the sale of GenOn's Aurora generating station and proceeds of $74 million related to the sale of the Potrero real property.
99
First Lien Structure
NRG has granted first liens to certain counterparties on a substantial portion of the Company's assets, excluding assets acquired in the GenOn and EME (including Midwest Generation) acquisitions, assets held by NRG Yield, Inc. and NRG's assets that have project-level financing. NRG uses the first lien structure to reduce the amount of cash collateral and letters of credit that it would otherwise be required to post from time to time to support its obligations under out-of-the-money hedge agreements for forward sales of power or gas used as a proxy for power. To the extent that the underlying hedge positions for a counterparty are out-of-the-money to NRG, the counterparty would have claim under the first lien program. The first lien program limits the volume that can be hedged, not the value of underlying out-of-the-money positions. The first lien program does not require NRG to post collateral above any threshold amount of exposure. Within the first lien structure, the Company can hedge up to 80% of its coal and nuclear capacity, excluding GenOn coal capacity, and 10% of its other assets, excluding GenOn's other assets, with these counterparties for the first 60 months and then declining thereafter. Net exposure to a counterparty on all trades must be positively correlated to the price of the relevant commodity for the first lien to be available to that counterparty. The first lien structure is not subject to unwind or termination upon a ratings downgrade of a counterparty and has no stated maturity date.
The Company's first lien counterparties may have a claim on its assets to the extent market prices exceed the hedged prices. As of
December 31, 2016
, all hedges under the first liens were
out-of-the-money
on a counterparty aggregate basis.
The following table summarizes the amount of MW hedged against the Company's coal and nuclear assets and as a percentage relative to the Company's coal and nuclear capacity under the first lien structure as of
December 31, 2016
:
|
Equivalent Net Sales Secured by First Lien Structure
(a)
|
2017
|
2018
|
2019
|
2020
|
|||||||
|
In MW
(b)
|
2,637
|
|
1,187
|
|
—
|
|
—
|
|
|||
|
As a percentage of total net coal and nuclear capacity
(c)
|
47
|
%
|
22
|
%
|
—
|
%
|
—
|
%
|
|||
|
(a)
|
Equivalent Net Sales include natural gas swaps converted using a weighted average heat rate by region.
|
|
(b)
|
Net coal and nuclear capacity represents 80% of the Company's total coal and nuclear assets eligible under the first lien, which excludes coal assets acquired in the GenOn and EME (including Midwest Generation) acquisitions, assets in NRG Yield, Inc. and NRG's assets that have project-level financing.
|
Uses of Liquidity
The Company's requirements for liquidity and capital resources, other than for operating its facilities, can generally be categorized by the following: (i) commercial operations activities; (ii) debt service obligations, as described more fully in Item 15 —
Note 12
,
Debt and Capital Leases
, to the Consolidated Financial Statements; (iii) capital expenditures, including repowering and renewable development, and environmental; and (iv) allocations in connection with acquisition opportunities, debt repayments, return of capital and dividend payments to stockholders, as described in Item 15 —
Note 15
,
Capital Structure
, to the Consolidated Financial Statements.
Commercial Operations
The Company's commercial operations activities require a significant amount of liquidity and capital resources. These liquidity requirements are primarily driven by: (i) margin and collateral posted with counterparties; (ii) margin and collateral required to participate in physical markets and commodity exchanges; (iii) timing of disbursements and receipts (i.e. buying fuel before receiving energy revenues); (iv) initial collateral for large structured transactions; and (v) collateral for project development. As of
December 31, 2016
, commercial operations had total cash collateral outstanding of
$203 million
and
$882 million
outstanding in letters of credit to third parties primarily to support its commercial activities for both wholesale and retail transactions. As of
December 31, 2016
, total collateral held from counterparties was
$2 million
in cash and
$15 million
of letters of credit.
Future liquidity requirements may change based on the Company's hedging activities and structures, fuel purchases, and future market conditions, including forward prices for energy and fuel and market volatility. In addition, liquidity requirements are dependent on the Company's credit ratings and general perception of its creditworthiness.
Debt Service Obligations
Principal payments on debt and capital leases as of
December 31, 2016
are due in the following periods:
|
Description
|
2017
|
2018
|
2019
|
2020
|
2021
|
Thereafter
|
Total
|
||||||||||||||||||||
|
|
(In millions)
|
||||||||||||||||||||||||||
|
NRG Recourse Debt:
|
|
|
|
|
|
||||||||||||||||||||||
|
Senior notes, due 2018
|
$
|
—
|
|
$
|
398
|
|
$
|
—
|
|
$
|
—
|
|
$
|
—
|
|
$
|
—
|
|
$
|
398
|
|
||||||
|
Senior notes, due 2021
|
—
|
|
—
|
|
—
|
|
—
|
|
206
|
|
—
|
|
206
|
|
|||||||||||||
|
Senior notes, due 2022
|
—
|
|
—
|
|
—
|
|
—
|
|
—
|
|
992
|
|
992
|
|
|||||||||||||
|
Senior notes, due 2023
|
—
|
|
—
|
|
—
|
|
—
|
|
—
|
|
869
|
|
869
|
|
|||||||||||||
|
Senior notes, due 2024
|
—
|
|
—
|
|
—
|
|
—
|
|
—
|
|
733
|
|
733
|
|
|||||||||||||
|
Senior notes, due 2026
|
—
|
|
—
|
|
—
|
|
—
|
|
—
|
|
1,000
|
|
1,000
|
|
|||||||||||||
|
Senior notes, due 2027
|
—
|
|
—
|
|
—
|
|
—
|
|
—
|
|
1,250
|
|
1,250
|
|
|||||||||||||
|
Term loan facility, due 2023
|
19
|
|
19
|
|
19
|
|
19
|
|
19
|
|
1,796
|
|
1,891
|
|
|||||||||||||
|
Tax-exempt bonds
|
—
|
|
—
|
|
—
|
|
—
|
|
—
|
|
455
|
|
455
|
|
|||||||||||||
|
Subtotal NRG Recourse Debt
|
19
|
|
417
|
|
19
|
|
19
|
|
225
|
|
7,095
|
|
7,794
|
|
|||||||||||||
|
NRG Non-Recourse Debt:
|
|||||||||||||||||||||||||||
|
GenOn senior notes
|
691
|
|
649
|
|
—
|
|
490
|
|
—
|
|
—
|
|
1,830
|
|
|||||||||||||
|
GenOn Americas Generation senior notes
|
—
|
|
—
|
|
—
|
|
—
|
|
366
|
|
329
|
|
695
|
|
|||||||||||||
|
GenOn Other
|
4
|
|
5
|
|
5
|
|
5
|
|
5
|
|
72
|
|
96
|
|
|||||||||||||
|
Subtotal GenOn debt (non-recourse to NRG)
|
695
|
|
|
654
|
|
5
|
|
495
|
|
371
|
|
401
|
|
2,621
|
|
||||||||||||
|
Yield Operating LLC Senior Notes, due 2024
|
—
|
|
—
|
|
—
|
|
—
|
|
—
|
|
500
|
|
500
|
|
|||||||||||||
|
Yield Operating LLC Senior Notes, due 2026
|
—
|
|
—
|
|
—
|
|
—
|
|
—
|
|
350
|
|
350
|
|
|||||||||||||
|
Yield Inc. Convertible Senior Notes, due 2019
|
—
|
|
—
|
|
345
|
|
—
|
|
—
|
|
—
|
|
345
|
|
|||||||||||||
|
Yield Inc. Convertible Senior Notes, due 2020
|
—
|
|
—
|
|
—
|
|
288
|
|
—
|
|
—
|
|
288
|
|
|||||||||||||
|
El Segundo Energy Center, due 2023
|
43
|
|
48
|
|
49
|
|
53
|
|
57
|
|
193
|
|
443
|
|
|||||||||||||
|
Marsh Landing, due 2017 and 2023
|
52
|
|
55
|
|
57
|
|
60
|
|
62
|
|
84
|
|
370
|
|
|||||||||||||
|
Alta Wind I-V lease financing arrangements, due 2034 and 2035
|
39
|
|
40
|
|
42
|
|
43
|
|
45
|
|
756
|
|
965
|
|
|||||||||||||
|
Walnut Creek, term loans due 2023
|
43
|
|
45
|
|
47
|
|
49
|
|
53
|
|
73
|
|
310
|
|
|||||||||||||
|
Tapestry, due 2021
|
10
|
|
11
|
|
11
|
|
11
|
|
129
|
|
—
|
|
172
|
|
|||||||||||||
|
Alpine, due 2022
|
9
|
|
8
|
|
8
|
|
8
|
|
8
|
|
104
|
|
145
|
|
|||||||||||||
|
CVSR, due 2037
|
25
|
|
26
|
|
24
|
|
21
|
|
23
|
|
652
|
|
771
|
|
|||||||||||||
|
CVSR Holdco, due 2037
|
5
|
|
6
|
|
6
|
|
7
|
|
6
|
|
169
|
|
199
|
|
|||||||||||||
|
Energy Center Minneapolis, due 2017, 2025 and 2031
|
13
|
|
7
|
|
11
|
|
11
|
|
11
|
|
168
|
|
221
|
|
|||||||||||||
|
Viento, due 2023
|
14
|
|
16
|
|
18
|
|
15
|
|
16
|
|
99
|
|
178
|
|
|||||||||||||
|
NRG Yield Other
|
29
|
|
30
|
|
33
|
|
75
|
|
29
|
|
344
|
|
540
|
|
|||||||||||||
|
Subtotal NRG Yield debt (non-recourse to NRG)
|
282
|
|
292
|
|
651
|
|
641
|
|
439
|
|
3,492
|
|
5,797
|
|
|||||||||||||
|
Ivanpah, due 2033 and 2038
|
40
|
|
40
|
|
42
|
|
44
|
|
45
|
|
902
|
|
1,113
|
|
|||||||||||||
|
Agua Caliente, due 2037
|
31
|
|
32
|
|
33
|
|
34
|
|
35
|
|
684
|
|
849
|
|
|||||||||||||
|
Dandan, due 2033
|
3
|
|
4
|
|
3
|
|
4
|
|
4
|
|
58
|
|
76
|
|
|||||||||||||
|
Cedro Hill, due 2025
|
12
|
|
12
|
|
12
|
|
12
|
|
12
|
|
103
|
|
163
|
|
|||||||||||||
|
Midwest Gen - PJM Capacity
|
79
|
|
103
|
|
49
|
|
—
|
|
—
|
|
—
|
|
231
|
|
|||||||||||||
|
Utah Portfolio, due 2022
|
9
|
|
12
|
|
14
|
|
13
|
|
13
|
|
226
|
|
287
|
|
|||||||||||||
|
NRG Other
|
50
|
|
82
|
|
10
|
|
9
|
|
12
|
|
231
|
|
394
|
|
|||||||||||||
|
Subtotal other NRG non-recourse debt
|
224
|
|
285
|
|
163
|
|
116
|
|
121
|
|
2,204
|
|
3,113
|
|
|||||||||||||
|
Subtotal all non-recourse debt
|
1,201
|
|
1,231
|
|
819
|
|
1,252
|
|
931
|
|
6,097
|
|
11,531
|
|
|||||||||||||
|
Subtotal long-term debt
|
1,220
|
|
1,648
|
|
838
|
|
1,271
|
|
1,156
|
|
13,192
|
|
19,325
|
|
|||||||||||||
|
Capital Leases:
|
|
||||||||||||||||||||||||||
|
Capital leases
|
2
|
|
2
|
|
1
|
|
1
|
|
—
|
|
—
|
|
6
|
|
|||||||||||||
|
Other
|
—
|
|
—
|
|
—
|
|
1
|
|
1
|
|
—
|
|
2
|
|
|||||||||||||
|
Subtotal NRG Capital Leases
|
2
|
|
2
|
|
1
|
|
2
|
|
1
|
|
—
|
|
8
|
|
|||||||||||||
|
Total Debt and Capital Leases
|
$
|
1,222
|
|
$
|
1,650
|
|
$
|
839
|
|
$
|
1,273
|
|
$
|
1,157
|
|
$
|
13,192
|
|
19,333
|
|
|||||||
In addition to the debt and capital leases shown in the above table, NRG had issued
$1.3 billion
of letters of credit under the Company's
$2.5 billion
Revolving Credit Facility as of
December 31, 2016
.
100
Capital Expenditures
The following table and descriptions summarize the Company's capital expenditures for maintenance, environmental, and growth investments, for the year ended
December 31, 2016
and the estimated capital expenditure and growth investments forecast for
2017
.
|
Maintenance
|
Environmental
|
Growth Investments
|
Total
|
||||||||||||
|
|
(In millions)
|
||||||||||||||
|
Generation
|
|||||||||||||||
|
Gulf Coast
|
$
|
157
|
|
$
|
7
|
|
$
|
8
|
|
$
|
172
|
|
|||
|
East
|
138
|
|
278
|
|
107
|
|
523
|
|
|||||||
|
West
|
3
|
|
—
|
|
88
|
|
91
|
|
|||||||
|
Retail
|
27
|
|
—
|
|
4
|
|
31
|
|
|||||||
|
Renewables
|
14
|
|
—
|
|
308
|
|
322
|
|
|||||||
|
NRG Yield
|
16
|
|
—
|
|
4
|
|
20
|
|
|||||||
|
Corporate
|
12
|
|
—
|
|
73
|
|
85
|
|
|||||||
|
Total cash capital expenditures for the year ended
December 31, 2016
|
367
|
|
285
|
|
592
|
|
1,244
|
|
|||||||
|
Other investments
(a)
|
—
|
|
—
|
|
392
|
|
392
|
|
|||||||
|
Funding from debt financing, net of fees
|
—
|
|
—
|
|
(141
|
)
|
(141
|
)
|
|||||||
|
Funding from third party equity partners and cash grants
|
—
|
|
—
|
|
(171
|
)
|
(171
|
)
|
|||||||
|
Total capital expenditures and investments, net of financings
|
$
|
367
|
|
$
|
285
|
|
$
|
672
|
|
$
|
1,324
|
|
|||
|
Estimated capital expenditures for 2017
|
$
|
318
|
|
$
|
25
|
|
$
|
796
|
|
$
|
1,139
|
|
|||
|
Other investments
(a)
|
—
|
|
—
|
|
59
|
|
59
|
|
|||||||
|
Funding from debt financing, net of fees
|
—
|
|
—
|
|
(662
|
)
|
(662
|
)
|
|||||||
|
NRG estimated capital expenditures for 2017, net of financings
|
$
|
318
|
|
$
|
25
|
|
$
|
193
|
|
$
|
536
|
|
|||
(a) Other investments include restricted cash activity and $191 million of cash related to acquisitions .
|
•
|
Environmental capital expenditures
— For the year ended
December 31, 2016
, the Company's environmental capital expenditures included DSI/ESP upgrades at the Powerton facility and the Joliet gas conversion to satisfy CPS as well as controls to satisfy MATS at the Avon Lake Facility.
|
|
•
|
Growth Investments capital expenditures
— For the year ended
December 31, 2016
, the Company's growth investment capital expenditures included
$315 million
for solar projects, $32 million for wind projects,
$107 million
for fuel conversions, $96 million for repowering projects, $4 million for thermal projects and $38 million for the Company's other growth projects.
|
Environmental Capital Expenditures Estimate
NRG estimates that environmental capital expenditures from 2017 through 2021 required to comply with environmental laws will be approximately $134 million, which includes $61 million for GenOn and $42 million for Midwest Generation. These costs are primarily associated with the cost of complying with anticipated ELG requirements.
101
The table below summarizes the status of NRG's coal fleet with respect to air quality controls. Planned investments are either in construction or budgeted in the existing capital expenditures budget. Changes to regulations could result in changes to planned installation dates. NRG uses an integrated approach to fuels, controls and emissions markets to meet environmental standards.
|
SO
2
|
NO
x
|
Mercury
|
Particulate
|
|||||||||||||||
|
Units
(a)
|
State
|
Control Equipment
|
Install Date
|
Control Equipment
|
Install Date
|
Control Equipment
|
Install Date
|
Control Equipment
|
Install Date
|
|||||||||
|
Avon 9
|
OH
|
DSI
|
2016
|
LNBOFA
|
2004
|
ACI/ESP
|
2016
|
ESP/upgrade
|
1970/2016
|
|||||||||
|
Big Cajun II 1
|
LA
|
DSI
|
2015
|
LNBOFA/ SNCR
|
2005/2014
|
ACI
|
2015
|
ESP/upgrade
|
1981/2015
|
|||||||||
|
Big Cajun II 2
|
LA
|
Gas Conversion
|
2015
|
LNBOFA/ SNCR
|
2004/2014
|
Gas Conversion
|
2015
|
Gas Conversion
|
2015
|
|||||||||
|
Big Cajun II 3
|
LA
|
PAL
|
2013
|
LNBOFA/ SNCR
|
2002/2014
|
ACI
|
2015
|
ESP/upgrade
|
1983/2015
|
|||||||||
|
Chalk Point 1
|
MD
|
FGD
|
2009
|
SCR
|
2008
|
FGD/ESP
|
2009
|
ESP/upgrade
|
1964/1980
|
|||||||||
|
Chalk Point 2
|
MD
|
FGD
|
2009
|
SACR
|
2006
|
FGD/ESP
|
2009
|
ESP/upgrade
|
1964/1980
|
|||||||||
|
Cheswick 1
|
PA
|
FGD
|
2010
|
SCR
|
2003
|
FGD/ESP
|
2010
|
ESP
|
1970
|
|||||||||
|
Conemaugh 1-2
|
PA
|
FGD
|
1994, 95
|
SCR
|
2014
|
FGD/ESP/SCR
|
1994,95/
2014
|
ESP
|
1970, 1971
|
|||||||||
|
Dickerson 1-3
|
MD
|
FGD
|
2009
|
SNCR
|
2009
|
FGD/FF
|
2009
|
ESP/FF
|
1959,1960,
1962/2003
|
|||||||||
|
Indian River 4
|
DE
|
CDS
|
2011
|
LNBOFA/SCR
|
1999/2011
|
ACI
|
2008
|
ESP/FF
|
1980/2011
|
|||||||||
|
Joliet 6
|
IL
|
Gas Conversion
|
2016
|
Gas Conversion/FGR
|
2016
|
Gas Conversion
|
2016
|
Gas Conversion
|
2016
|
|||||||||
|
Joliet 7, 8
|
IL
|
Gas Conversion
|
2016
|
Gas Conversion
|
2016
|
Gas Conversion
|
2016
|
Gas Conversion
|
2016
|
|||||||||
|
Keystone 1-2
|
PA
|
FGD
|
2009
|
SCR
|
2003
|
FGD/ESP/SCR
|
2003
|
ESP
|
1967, 1968
|
|||||||||
|
Limestone 1-2
|
TX
|
FGD
|
1985-86
|
LNBOFA/ SNCR
|
2002/2022,2023
|
ACI
|
2015
|
ESP
|
1985-1986
|
|||||||||
|
Morgantown 1-2
|
MD
|
FGD
|
2009
|
SCR
|
2007-2008
|
FGD/ESP
|
2009
|
ESP
|
1970, 1971
|
|||||||||
|
New Castle 3, 4, 5
|
PA
|
Gas Addition
|
2016
|
Gas Addition/FGR
|
2016
|
Gas Addition
|
2016
|
Gas Addition
|
2016
|
|||||||||
|
Powerton 5
|
IL
|
DSI
|
2016
|
OFA/SNCR
|
2003/2012
|
ACI
|
2009
|
ESP/upgrade
|
1973/2016
|
|||||||||
|
Powerton 6
|
IL
|
DSI
|
2014
|
OFA/SNCR
|
2002/2012
|
ACI
|
2009
|
ESP/upgrade
|
1976/2014
|
|||||||||
|
Shawville 1-2
|
PA
|
Gas Addition
|
2016
|
Gas Addition/FGR
|
2016
|
Gas Addition
|
2016
|
Gas Addition
|
2016
|
|||||||||
|
Shawville 3-4
|
PA
|
Gas Addition
|
2016
|
Gas Addition
|
2016
|
Gas Addition
|
2016
|
Gas Addition
|
2016
|
|||||||||
|
W.A. Parish 5, 6, 7
|
TX
|
FF co-benefit
|
1988
|
SCR
|
2004
|
ACI
|
2015
|
FF
|
1988
|
|||||||||
|
W.A. Parish 8
(b)
|
TX
|
FGD
|
1982
|
SCR
|
2004
|
ACI
|
2015
|
FF
|
1988
|
|||||||||
|
Waukegan 7
|
IL
|
DSI
|
2014
|
LNBOFA
|
2002
|
ACI
|
2008
|
ESP/upgrade
|
1958/2002, 2014
|
|||||||||
|
Waukegan 8
|
IL
|
DSI
|
2015
|
LNBOFA
|
1999
|
ACI
|
2008
|
ESP/upgrade
|
1962/1999, 2015
|
|||||||||
|
Will County 4
|
IL
|
DSI
|
2017
|
LNBOFA/SNCR
|
1999,2001/
2012
|
ACI
|
2009
|
ESP/upgrade
|
1963,72/
2000
|
|||||||||
(a) NRG added natural gas capabilities at its New Castle, Shawville, and Joliet facilities in 2016. Joliet cannot switch back to coal.
(b) Unit expected to be converted into a cogeneration facility to provide power and steam to the Petra Nova CCF.
|
ACI - Activated Carbon Injection
CDS - Circulating Dry Scrubber
DSI - Dry Sorbent Injection with Trona
ESP - Electrostatic Precipitator
FGD - Flue Gas Desulfurization (wet)
FF- Fabric Filter
|
FBL - Fluidized Bed Limestone Injection
LNBOFA - Low NO
x
Burner with Overfire Air
PAL - Plantwide Applicability Limit
SCR - Selective Catalytic Reduction
SACR - Selective Auto-Catalytic Reduction
SNCR - Selective Non-Catalytic Reduction
|
102
The following table summarizes the estimated environmental capital expenditures for the referenced periods by region:
|
Gulf Coast - Legacy NRG
|
Gulf Coast -GenOn
|
East - Legacy NRG
|
East - GenOn
|
East - MWG
|
Total
|
|||||||||||||||||||
|
|
(In millions)
|
|||||||||||||||||||||||
|
2017
|
$
|
1
|
|
$
|
3
|
|
$
|
—
|
|
$
|
10
|
|
$
|
11
|
|
$
|
25
|
|
||||||
|
2018
|
—
|
|
—
|
|
1
|
|
2
|
|
—
|
|
3
|
|
||||||||||||
|
2019
|
2
|
|
—
|
|
—
|
|
8
|
|
—
|
|
10
|
|
||||||||||||
|
2020
|
11
|
|
—
|
|
1
|
|
11
|
|
3
|
|
26
|
|
||||||||||||
|
2021
|
13
|
|
—
|
|
2
|
|
27
|
|
28
|
|
70
|
|
||||||||||||
|
Total
|
$
|
27
|
|
$
|
3
|
|
$
|
4
|
|
$
|
58
|
|
$
|
42
|
|
$
|
134
|
|
||||||
NRG's current contracts with the Company's rural electrical customers in the Gulf Coast region allow for recovery of a portion of the regions' capital costs once in operation, along with a capital return incurred by complying with any change in law, including interest over the asset life of the required expenditures. The actual recoveries will depend, among other things, on the timing of the completion of the capital projects and the remaining duration of the contracts.
Debt Reduction
The following table lists the repurchases of senior notes in 2016.
|
Principal Repurchased
|
Cash Paid
(a)
|
Average Early Redemption Percentage
|
||||||||
|
Amount in millions, except rates
|
||||||||||
|
7.625% senior notes due 2018
|
$
|
641
|
|
$
|
706
|
|
107.89
|
%
|
||
|
8.250% senior notes due 2020
|
1,058
|
|
1,129
|
|
103.12
|
%
|
||||
|
7.875% senior notes due 2021
|
922
|
|
978
|
|
104.00
|
%
|
||||
|
6.250% senior notes due 2022
|
108
|
|
105
|
|
94.73
|
%
|
||||
|
6.625% senior notes due 2023
|
67
|
|
64
|
|
94.13
|
%
|
||||
|
6.250% senior notes due 2024
|
171
|
|
163
|
|
94.52
|
%
|
||||
|
Total at December 31, 2016
|
$
|
2,967
|
|
$
|
3,145
|
|
||||
(a) Includes payment for accrued interest.
In 2017, the Company reserved $200 million of additional capital allocated to discretionary debt reduction, which brings the total expected discretionary debt reduction allocation in 2017 to $600 million.
Preferred Stock
On May 24, 2016, the Company entered an agreement with Credit Suisse Group to repurchase
100%
of the outstanding shares of its
$344.5 million
2.822%
preferred stock. On June 13, 2016, the Company completed the repurchase from Credit Suisse of
100%
of the outstanding shares at a price of
$226 million
. The Company anticipates the transaction to generate approximately $10 million in annual dividend savings.
Common Stock Dividends
The following table lists the dividends paid during 2016:
|
Fourth Quarter 2016
|
Third Quarter 2016
|
Second Quarter 2016
|
First Quarter 2016
|
||||||||||||
|
Dividends per Common Share
|
$
|
0.030
|
|
$
|
0.030
|
|
$
|
0.030
|
|
$
|
0.145
|
|
|||
On January 18, 2017, NRG declared a quarterly dividend on the Company's common stock of
$0.03
per share, or
$0.12
per share on an annualized basis, payable on February 15, 2017, to stockholders of record as of February 1, 2017. The Company's common stock dividends are subject to available capital, market conditions, and compliance with associated laws and regulations. The Company expects that, based on current circumstances, comparable cash dividends will continue to be paid in the foreseeable future.
UPMC Thermal Project
On October 31, 2016, NRG Business Services LLC, a subsidiary of the Company, and NRG Energy Center Pittsburgh LLC, or NECP, a subsidiary of NRG Yield, Inc., entered into a EPC agreement for the construction of a 73 MWt district energy system for NECP to provide 150 kpph of steam, 6,750 tons of chilled water and 7.5 MW of emergency backup power service to UPMC. The initial term of the energy services agreement with UPMC Mercy will be for a period of twenty years from the service commencement date. Pursuant to the terms of the EPC agreement, NECP shall pay NRG Business Services LLC $79 million, subject to adjustment based upon certain conditions in the EPC agreement, upon substantial completion of the project. The project is expected to reach COD in the first quarter of 2018. On January 5, 2017, the parties amended the EPC agreement, based on a customer change order, to increase the capacity of the district energy system from 73 MWt to 80 MWt, which also increased the payment from $79 million to $87 million.
2016 Utility-Scale Solar and Wind Acquisition
On November 2, 2016, the Company acquired equity interests in a tax equity portfolio from SunEdison, located in Utah, comprised of
530
MW of mechanically-complete solar assets, of which NRG’s net interest based on cash to be distributed is
265
MW, for upfront cash consideration of
$111 million
. In connection with the acquisition, the Company assumed non-recourse debt of $222 million. The Company also borrowed additional amounts of
$65 million
during the fourth quarter of 2016, as described in
Note 12
,
Debt and Capital Leases
, which effectively reduced the Company's use of liquidity related to the acquisition. The Company does not have a controlling interest in the tax equity portfolio and, accordingly, its interest is recorded as an equity method investment. The purchase price was preliminarily allocated to the equity method investment balance of approximately
$328 million
, current assets of
$5 million
and the assumed non-recourse debt of
$222 million
. The assets reached commercial operations during the fourth quarter of 2016 and have 20-year PPAs with PacificCorp.
The Company acquired a
110
MW portfolio of construction-ready and 71 MW of development solar assets in Hawaii from SunEdison for upfront cash consideration of
$2 million
on October 3, 2016 and a
154
MW construction-ready solar project in Texas for upfront cash consideration of
$11 million
on November 9, 2016.
In addition to the total
$124 million
in upfront cash consideration paid for the above three acquisitions, the Company expects to make an estimated
$59 million
in additional payments contingent upon future development milestones.
2016 Solar Distributed Generation Acquisition
On October 3, 2016, the Company acquired a
29
MW portfolio of mechanically-complete and construction-ready distributed generation solar assets from SunEdison for cash consideration of approximately
$67 million
excluding post-closing adjustments which reduced the purchase price by
$5 million
. Subsequent to the acquisition, the Company sold the majority of these assets into a tax-equity financed portfolio within the DGPV Holdco partnership between NRG and NRG Yield, Inc., and expects to sell the remaining assets into a similar portfolio in 2017. The purchase price was preliminarily allocated to $47 million in construction in progress and $15 million in intangibles.
GenOn Mid-Atlantic Prepaid Letter of Credit
On January 27, 2017, GenOn Mid-Atlantic entered into an agreement with Natixis under which Natixis will procure payment and credit support for the payment of certain lease payments owed pursuant to the GenOn Mid-Atlantic operating leases for Morgantown and Dickerson. GenOn Mid-Atlantic made a payment of $130 million plus fees of $1 million as consideration for Natixis applying for the issuance of, and obtaining, letters of credit from Natixis, New York Branch, the LC Provider, to support the lease payments. Natixis is solely responsible for (i) obtaining letters of credit from the LC Provider, (ii) causing the letters of credit to be issued to the lessors to support the lease payments on behalf of GenOn Mid-Atlantic, (iii) making lease payments and (iv) satisfying any reimbursement obligations payable to the LC Provider.
103
On February 24, 2017, GenOn Mid-Atlantic received a series of notices from the owner lessors under its operating leases of the Morgantown coal generation unit alleging default, or Notices. The Notices allege the existence of lease events of default as a result of, among other items, the purported failure by GenOn Mid-Atlantic to comply with a covenant requiring the maintenance of qualifying credit support. The Notices instructed the relevant trustees to draw on letters of credit under the secured intercompany revolving credit agreement between NRG and GenOn, supporting the GenOn Mid-Atlantic operating leases that were set to expire on February 28, 2017. On February 28, 2017, the trustees drew on the letters of credit under the 2016 Revolving Credit Facility, which resulted in borrowings of $125 million. The Company will provide written notification to GenOn with respect to the draw and GenOn will become obligated under the secured intercompany revolving credit agreement between NRG and GenOn. The Company is unaware of whether any further action will be taken by the owner lessors or any other person in connection with the Notices. GenOn Mid-Atlantic disagrees with the owner lessors as to the existence of any lease events of default and/or any breaches by GenOn Mid-Atlantic of any terms and conditions of the operating leases and believes that the declaration of a lease event of default, the instruction to draw on the letters of credit under the secured intercompany revolving credit agreement between NRG and GenOn and any actual draw thereon constitutes a violation by the owner lessors and the relevant trustees of the terms and conditions of the GenOn Mid-Atlantic operating leases. GenOn Mid-Atlantic intends to vigorously pursue its rights and remedies in connection with these actions.
Fuel Repowerings
The table below lists the Company's currently projected repowering projects. With respect to facilities that are currently operating, the timing of the projects listed below could adversely impact the Company's operating revenues, gross margin and other operating costs during the period prior to the targeted COD. For further information on the status of certain of the Company's repowering projects, refer to Item 1 - Business,
Regulatory Matters.
|
Facility
|
Net Generation Capacity (MW)
|
Project Type
|
Fuel Type
|
Targeted COD
|
|||||
|
Repowerings
|
|||||||||
|
Carlsbad Peakers (formerly Encina) Units 1, 2, 3, 4, 5 and GT
|
527
|
|
Growth
|
Natural Gas
|
Q4 2018
|
||||
|
Puente (formerly Mandalay) Units 1 and 2
(a)
|
262
|
|
Growth
|
Natural Gas
|
Q2 2020
|
||||
|
Bacliff (formerly Cielo Lindo/P.H. Robinson) Peakers 1-6
|
360
|
|
Growth
|
Natural Gas
|
Q2 2017
|
||||
|
Total Fuel Repowerings
|
1,149
|
|
|||||||
(a) Projects are subject to applicable regulatory approvals and permits.
104
Cash Flow Discussion
2016 compared to 2015
The following table reflects the changes in cash flows for the comparative years:
|
Year ended December 31,
|
|||||||||||
|
(In millions)
|
2016
|
2015
|
Change
|
||||||||
|
Net cash provided by operating activities
|
$
|
2,072
|
|
$
|
1,309
|
|
$
|
763
|
|
||
|
Net cash used by investing activities
|
(824
|
)
|
(1,485
|
)
|
661
|
|
|||||
|
Net cash used by financing activities
|
(794
|
)
|
(432
|
)
|
(362
|
)
|
|||||
Net Cash Provided By Operating Activities
Changes to net cash provided by operating activities were driven by:
|
(In millions)
|
|||
|
Change in cash collateral in support of risk management activities
|
$
|
746
|
|
|
Decrease in accounts payable primarily related to lower operations and maintenance expense in 2016
|
191
|
|
|
|
Decrease in inventory primarily related to plant fuel conversions at Shawville, Joliet, New Castle and Unit 2 at the Big Cajun II facility and deactivations of the Huntley and Dunkirk facilities
|
160
|
|
|
|
Increase in accounts receivable due to timing of receipts
|
(171
|
)
|
|
|
Decrease in operating income adjusted for non-cash items
|
(52
|
)
|
|
|
Increase in prepaid expense primarily related to timing of property tax and insurance payments that occurred in the first half of the year, and state tax receivables
|
(47
|
)
|
|
|
Other changes in working capital driven by various timing differences
|
(37
|
)
|
|
|
Decrease in accrued interest primarily driven by redemption of Senior Notes in late 2015 and 2016
|
(27
|
)
|
|
|
$
|
763
|
|
|
Net Cash Used By Investing Activities
Changes to net cash used by investing activities were driven by:
|
(In millions)
|
|||
|
Proceeds from the sale of assets related to the majority interest sale of EVgo, the sale of real property at the Potrero generating station and the sale of the Aurora, Seward and Shelby generating stations in 2016
|
$
|
635
|
|
|
Decrease in investments in unconsolidated affiliates in 2016 compared to 2015, primarily related to the 25% investment in Desert Sunlight of $285 million, as well as, Petra Nova and Altenex in 2015
|
361
|
|
|
|
Decrease in capital expenditures, primarily related to environmental projects at the Powerton and Joliet facilities
|
39
|
|
|
|
Insurance proceeds primarily related to the Cottonwood generation station outage in 2016
|
29
|
|
|
|
Increase in cash paid for acquisitions in 2016 compared to 2015
|
(178
|
)
|
|
|
Decrease in restricted cash primarily related to the Agua Caliente and CVSR projects
|
(75
|
)
|
|
|
Decrease in cash grants received as the final Ivanpah cash grant amount was received in 2015 after resolution of all open inquiries
|
(46
|
)
|
|
|
Net decrease in nuclear decommissioning trust fund activity due to increase in purchases of securities in Q4, 2016
|
(43
|
)
|
|
|
Net decrease in emission allowances activity
|
(42
|
)
|
|
|
Other
|
(19
|
)
|
|
|
$
|
661
|
|
|
105
Net Cash Used By Financing Activities
Changes in net cash used by financing activities were driven by:
|
(In millions)
|
|||
|
Repurchases of treasury stock in 2015
|
$
|
437
|
|
|
Net decrease in borrowings, offset by debt payments, which includes debt repurchases in 2016
|
209
|
|
|
|
Decrease in payment of dividends which reflects the reduction to the annualized dividend rate in 2016 from $0.58/share to $0.12/share
|
125
|
|
|
|
Other
|
9
|
|
|
|
Decrease in cash contributions from noncontrolling interest in 2016, primarily related to the NRG Yield, Inc. public offering in 2015 which had proceeds of $599 million
|
(803
|
)
|
|
|
Repurchase of preferred stock in 2016
|
(226
|
)
|
|
|
Increase in debt issuance costs primarily due to the refinancing of the senior credit facility and the issuance of the 2026 and 2027 Senior Notes
|
(68
|
)
|
|
|
Decrease in settlement of financing element related to acquired derivatives
|
(45
|
)
|
|
|
$
|
(362
|
)
|
|
106
2015 compared to 2014
The following table reflects the changes in cash flows for the comparative years:
|
Year ended December 31,
|
|||||||||||
|
(In millions)
|
2015
|
2014
|
Change
|
||||||||
|
Net cash provided by operating activities
|
$
|
1,309
|
|
$
|
1,510
|
|
$
|
(201
|
)
|
||
|
Net cash used by investing activities
|
(1,485
|
)
|
(2,903
|
)
|
1,418
|
|
|||||
|
Net cash used by financing activities
|
(432
|
)
|
1,265
|
|
(1,697
|
)
|
|||||
Net Cash Provided By Operating Activities
Changes to net cash provided by operating activities were driven by:
|
(In millions)
|
|||
|
Increase in operating income adjusted for non-cash items
|
$
|
365
|
|
|
Change in cash paid in support of risk management activities
|
(39
|
)
|
|
|
Other changes in working capital
|
(527
|
)
|
|
|
$
|
(201
|
)
|
|
Net Cash Used By Investing Activities
Changes to net cash used by investing activities were driven by:
|
(In millions)
|
|||
|
Increase in cash paid for acquisitions, due primarily related to the EME and Alta Wind acquisitions in 2014
|
$
|
2,905
|
|
|
Decrease in cash grants, primarily reflecting the 2014 receipt of the CVSR cash grant
|
(834
|
)
|
|
|
Increase in capital expenditures related to maintenance and environmental projects
|
(374
|
)
|
|
|
Increase in equity investments, primarily related to 25% investment in Desert sunlight in 2015
|
(301
|
)
|
|
|
Decrease in proceeds from sale of assets, due to the sales of Kendall, Bayou Cove and 50% of the company's interest in Petra Nova
|
(167
|
)
|
|
|
Decrease in restricted cash
|
192
|
|
|
|
Cash proceeds to fund cash grant bridge loan payment in 2014
|
(57
|
)
|
|
|
Other
|
54
|
|
|
|
$
|
1,418
|
|
|
Net Cash Used By Financing Activities
Changes in net cash used by financing activities were driven by:
|
(In millions)
|
|||
|
Net decrease in borrowings, offset by debt payments which primarily reflect the issuance of the 2021 and 2024 Senior Notes in 2014
|
$
|
(1,331
|
)
|
|
Increase in repurchase of treasury stock
|
(398
|
)
|
|
|
Decrease in cash contributions from noncontrolling interests
|
(172
|
)
|
|
|
Decrease in proceeds from issuance of common stock
|
(20
|
)
|
|
|
Increase in payments of dividends
|
(5
|
)
|
|
|
Increase in contingent consideration payments
|
(4
|
)
|
|
|
Increase in financing element of acquired derivatives
|
187
|
|
|
|
Decrease in cash paid for deferred financing cost
|
46
|
|
|
|
$
|
(1,697
|
)
|
|
107
NOLs, Deferred Tax Assets and Uncertain Tax Position Implications, under ASC 740
As of
December 31, 2016
, the Company had domestic pre-tax book loss of
$886 million
and foreign pre-tax book income of
$11 million
. For the year ended
December 31, 2016
, the Company utilized carryforward NOLs of $507 million to fully offset current year taxable income. As of
December 31, 2016
, the Company has cumulative domestic federal NOL carryforwards of
$3.4 billion
which will begin expiring in 2026 and cumulative state NOL carryforwards of
$4.9 billion
for financial statement purposes. In addition, NRG has cumulative foreign NOL carryforwards of
$196 million
, which do not have an expiration date. As a result of the Company's tax position, and based on current forecasts, the Company anticipates income tax payments, primarily due to state and local jurisdictions, of up to $35 million in 2017.
In addition to these amounts, the Company has
$34 million
of tax effected uncertain tax benefits for which the Company has recorded a non-current tax liability of
$37 million
until such final resolution with the related taxing authority. The
$37 million
non-current tax liability for uncertain tax benefits is from positions taken on various state returns, including accrued interest.
The Company is no longer subject to U.S. federal income tax examinations for years prior to 2015. With few exceptions, state and local income tax examinations are no longer open for years before 2010.
Off-Balance Sheet Arrangements
Obligations under Certain Guarantee Contracts
NRG and certain of its subsidiaries enter into guarantee arrangements in the normal course of business to facilitate commercial transactions with third parties. These arrangements include financial and performance guarantees, stand-by letters of credit, debt guarantees, surety bonds and indemnifications. See also Item 15 —
Note 26
,
Guarantees
,
to the Consolidated Financial Statements for additional discussion.
Retained or Contingent Interests
NRG does not have any material retained or contingent interests in assets transferred to an unconsolidated entity.
Obligations Arising Out of a Variable Interest in an Unconsolidated Entity
Variable interest in Equity investments
— As of
December 31, 2016
, NRG has several investments with an ownership interest percentage of 50% or less in energy and energy-related entities that are accounted for under the equity method of accounting. Several of these investments are variable interest entities for which NRG is not the primary beneficiary.
NRG's pro-rata share of non-recourse debt held by unconsolidated affiliates was approximately
$633 million
as of
December 31, 2016
. This indebtedness may restrict the ability of these subsidiaries to issue dividends or distributions to NRG. See also Item 15 —
Note 16
,
Investments Accounted for by the Equity Method and Variable Interest Entities
,
to the Consolidated Financial Statements for additional discussion.
108
Contractual Obligations and Commercial Commitments
NRG has a variety of contractual obligations and other commercial commitments that represent prospective cash requirements in addition to the Company's capital expenditure programs. The following tables summarize NRG's contractual obligations and contingent obligations for guarantees. See also Item 15 —
Note 12
,
Debt and Capital Leases
,
Note 22
,
Commitments and Contingencies
, and
Note 26
,
Guarantees
, to the Consolidated Financial Statements for additional discussion.
|
|
By Remaining Maturity at December 31,
|
||||||||||||||||||||||
|
|
2016
|
|
|||||||||||||||||||||
|
Contractual Cash Obligations
|
Under
1 Year
|
1-3 Years
|
3-5 Years
|
Over
5 Years
|
Total
(a)
|
2015 Total
|
|||||||||||||||||
|
|
(In millions)
|
||||||||||||||||||||||
|
Long-term debt (including estimated interest)
|
$
|
2,304
|
|
$
|
4,421
|
|
$
|
4,091
|
|
$
|
16,670
|
|
$
|
27,486
|
|
$
|
27,038
|
|
|||||
|
Capital lease obligations (including estimated interest)
|
3
|
|
4
|
|
2
|
|
—
|
|
9
|
|
17
|
|
|||||||||||
|
Operating leases
|
292
|
|
509
|
|
376
|
|
1,308
|
|
2,485
|
|
2,712
|
|
|||||||||||
|
Fuel purchase and transportation obligations
|
638
|
|
425
|
|
249
|
|
415
|
|
1,727
|
|
2,335
|
|
|||||||||||
|
Fixed purchased power commitments
|
25
|
|
30
|
|
32
|
|
—
|
|
87
|
|
70
|
|
|||||||||||
|
Pension minimum funding requirement
(b)
|
34
|
|
107
|
|
62
|
|
172
|
|
375
|
|
452
|
|
|||||||||||
|
Other postretirement benefits minimum funding requirement
(c)
|
8
|
|
17
|
|
17
|
|
38
|
|
80
|
|
102
|
|
|||||||||||
|
Other liabilities
(d)
|
288
|
|
187
|
|
173
|
|
697
|
|
1,345
|
|
991
|
|
|||||||||||
|
Total
|
$
|
3,592
|
|
$
|
5,700
|
|
$
|
5,002
|
|
$
|
19,300
|
|
$
|
33,594
|
|
$
|
33,717
|
|
|||||
|
(a)
|
Excludes
$34 million
non-current payable relating to NRG's uncertain tax benefits under ASC 740 as the period of payment cannot be reasonably estimated. Also excludes
$940 million
of asset retirement obligations which are discussed in Item 15 —
Note 13
,
Asset Retirement Obligations
, to the Consolidated Financial Statements.
|
|
(b)
|
These amounts represent the Company's estimated minimum pension contributions required under the Pension Protection Act of 2006. These amounts represent estimates that are based on assumptions that are subject to change.
|
|
(c)
|
These amounts represent estimates that are based on assumptions that are subject to change. The minimum required contribution for years after 2020 are currently not available.
|
|
(d)
|
Includes water right agreements, service and maintenance agreements, stadium naming rights, LTSA commitments and other contractual obligations.
|
|
|
By Remaining Maturity at December 31,
|
||||||||||||||||||||||
|
|
2016
|
|
|||||||||||||||||||||
|
Guarantees
|
Under
1 Year
|
1-3 Years
|
3-5 Years
|
Over
5 Years
|
Total
|
2015 Total
|
|||||||||||||||||
|
|
(In millions)
|
||||||||||||||||||||||
|
Letters of credit and surety bonds
|
$
|
2,122
|
|
$
|
80
|
|
$
|
—
|
|
$
|
15
|
|
$
|
2,217
|
|
$
|
1,899
|
|
|||||
|
Asset sales guarantee obligations
|
—
|
|
420
|
|
257
|
|
—
|
|
677
|
|
257
|
|
|||||||||||
|
Other guarantees
|
—
|
|
—
|
|
5
|
|
731
|
|
736
|
|
722
|
|
|||||||||||
|
Total guarantees
|
$
|
2,122
|
|
$
|
500
|
|
$
|
262
|
|
$
|
746
|
|
$
|
3,630
|
|
$
|
2,878
|
|
|||||
109
Fair Value of Derivative Instruments
NRG may enter into power purchase and sales contracts, fuel purchase contracts and other energy-related financial instruments to mitigate variability in earnings due to fluctuations in spot market prices and to hedge fuel requirements at generation facilities or retail load obligations. In addition, in order to mitigate interest rate risk associated with the issuance of the Company's variable rate and fixed rate debt, NRG enters into interest rate swap agreements.
NRG's trading activities are subject to limits in accordance with the Company's Risk Management Policy. These contracts are recognized on the balance sheet at fair value and changes in the fair value of these derivative financial instruments are recognized in earnings.
The tables below disclose the activities that include both exchange and non-exchange traded contracts accounted for at fair value in accordance with ASC 820,
Fair Value Measurements and Disclosures
, or ASC 820. Specifically, these tables disaggregate realized and unrealized changes in fair value; disaggregate estimated fair values at
December 31, 2016
, based on their level within the fair value hierarchy defined in ASC 820; and indicate the maturities of contracts at
December 31, 2016
. For a full discussion of the Company's valuation methodology of its contracts, see
Derivative Fair Value Measurements
in Item 15 —
Note 4
,
Fair Value of Financial Instruments
, to the Consolidated Financial Statements.
|
Derivative Activity Gains/(Losses)
|
(In millions)
|
||
|
Fair value of contracts as of December 31, 2015
|
$
|
6
|
|
|
Contracts realized or otherwise settled during the period
|
(206
|
)
|
|
|
Changes in fair value
|
73
|
|
|
|
Fair value of contracts as of December 31, 2016
|
$
|
(127
|
)
|
|
|
Fair Value of Contracts as of December 31, 2016
|
||||||||||||||||||
|
Maturity
|
|||||||||||||||||||
|
Fair value hierarchy Gains/(Losses)
|
1 Year or Less
|
Greater Than 1 Year to 3 Years
|
Greater Than 3 Years to 5 Years
|
Greater Than
5 Years
|
Total Fair
Value
|
||||||||||||||
|
|
(In millions)
|
||||||||||||||||||
|
Level 1
|
$
|
110
|
|
$
|
(34
|
)
|
$
|
(11
|
)
|
$
|
—
|
|
$
|
65
|
|
||||
|
Level 2
|
(95
|
)
|
(34
|
)
|
5
|
|
1
|
|
(123
|
)
|
|||||||||
|
Level 3
|
(37
|
)
|
(20
|
)
|
(3
|
)
|
(9
|
)
|
(69
|
)
|
|||||||||
|
Total
|
$
|
(22
|
)
|
$
|
(88
|
)
|
$
|
(9
|
)
|
$
|
(8
|
)
|
$
|
(127
|
)
|
||||
The Company has elected to disclose derivative assets and liabilities on a trade-by-trade basis and does not offset amounts at the counterparty master agreement level. Also, collateral received or posted on the Company's derivative assets or liabilities are recorded on a separate line item on the balance sheet. Consequently, the magnitude of the changes in individual current and non-current derivative assets or liabilities is higher than the underlying credit and market risk of the Company's portfolio. As discussed in Item 7A
— Quantitative and Qualitative Disclosures About Market Risk, Commodity Price Risk
, NRG measures the sensitivity of the Company's portfolio to potential changes in market prices using VaR, a statistical model which attempts to predict risk of loss based on market price and volatility. NRG's risk management policy places a limit on one-day holding period VaR, which limits the Company's net open position. As the Company's trade-by-trade derivative accounting results in a gross-up of the Company's derivative assets and liabilities, the net derivative assets and liability position is a better indicator of NRG's hedging activity. As of
December 31, 2016
, NRG's net derivative liability was
$127 million
, a decrease to total fair value of
$133 million
as compared to
December 31, 2015
. This decrease was primarily driven by the roll-off of trades that settled during the period partially offset by gains in fair value.
Based on a sensitivity analysis using simplified assumptions, the impact of a $0.50 per MMBtu increase in natural gas prices across the term of the derivative contracts would result in a decrease of approximately
$30 million
in the net value of derivatives as of
December 31, 2016
.
The impact of a $0.50 per MMBtu decrease in natural gas prices across the term of the derivative contracts would result in an increase of approximately
$15 million
in the net value of derivatives as of
December 31, 2016
.
110
Critical Accounting Policies and Estimates
NRG's discussion and analysis of the financial condition and results of operations are based upon the Consolidated Financial Statements, which have been prepared in accordance with GAAP. The preparation of these financial statements and related disclosures in compliance with GAAP requires the application of appropriate technical accounting rules and guidance as well as the use of estimates and judgments that affect the reported amounts of assets, liabilities, revenues and expenses, and related disclosures of contingent assets and liabilities. The application of these policies involves judgments regarding future events, including the likelihood of success of particular projects, legal and regulatory challenges, and the fair value of certain assets and liabilities. These judgments, in and of themselves, could materially affect the financial statements and disclosures based on varying assumptions, which may be appropriate to use. In addition, the financial and operating environment may also have a significant effect, not only on the operation of the business, but on the results reported through the application of accounting measures used in preparing the financial statements and related disclosures, even if the nature of the accounting policies have not changed.
On an ongoing basis, NRG evaluates these estimates, utilizing historic experience, consultation with experts and other methods the Company considers reasonable. In any event, actual results may differ substantially from the Company's estimates. Any effects on the Company's business, financial position or results of operations resulting from revisions to these estimates are recorded in the period in which the information that gives rise to the revision becomes known.
NRG's significant accounting policies are summarized in Item 15 —
Note 2
,
Summary of Significant Accounting Policies
, to the consolidated financial statements. The Company identifies its most critical accounting policies as those that are the most pervasive and important to the portrayal of the Company's financial position and results of operations, and that require the most difficult, subjective and/or complex judgments by management regarding estimates about matters that are inherently uncertain.
|
Accounting Policy
|
Judgments/Uncertainties Affecting Application
|
|
Derivative Instruments
|
Assumptions used in valuation techniques
|
|
Assumptions used in forecasting generation
|
|
|
Assumptions used in forecasting borrowings
|
|
|
Market maturity and economic conditions
|
|
|
Contract interpretation
|
|
|
Market conditions in the energy industry, especially the effects of price volatility on contractual commitments
|
|
|
Income Taxes and Valuation Allowance for Deferred Tax Assets
|
Ability to be sustained upon audit examination of taxing authorities
|
|
Interpret existing tax statute and regulations upon application to transactions
|
|
|
Ability to utilize tax benefits through carry backs to prior periods and carry forwards to future periods
|
|
|
Impairment of Long-Lived Assets and Investments
|
Recoverability of investment through future operations
|
|
Regulatory and political environments and requirements
|
|
|
Estimated useful lives of assets
|
|
|
Environmental obligations and operational limitations
|
|
|
Estimates of future cash flows
|
|
|
Estimates of fair value
|
|
|
Judgment about impairment triggering events
|
|
|
Goodwill and Other Intangible Assets
|
Estimated useful lives for finite-lived intangible assets
|
|
Judgment about impairment triggering events
|
|
|
Estimates of reporting unit's fair value
|
|
|
Fair value estimate of intangible assets acquired in business combinations
|
|
|
Contingencies
|
Estimated financial impact of event(s)
|
|
Judgment about likelihood of event(s) occurring
|
|
|
Regulatory and political environments and requirements
|
|
111
Derivative Instruments
The Company follows the guidance of ASC 815 to account for derivative instruments. ASC 815 requires the Company to mark-to-market all derivative instruments on the balance sheet and recognize changes in the fair value of non-hedge derivative instruments immediately in earnings. In certain cases, NRG may apply hedge accounting to the Company's derivative instruments. The criteria used to determine if hedge accounting treatment is appropriate are: (i) the designation of the hedge to an underlying exposure; (ii) whether the overall risk is being reduced; and (iii) if there is a correlation between the changes in fair value of the derivative instrument and the underlying hedged item. Changes in the fair value of derivatives instruments accounted for as hedges are either recognized in earnings as an offset to the changes in the fair value of the related hedged item, or deferred and recorded as a component of OCI and subsequently recognized in earnings when the hedged transactions occur.
For purposes of measuring the fair value of derivative instruments, NRG uses quoted exchange prices and broker quotes. When external prices are not available, NRG uses internal models to determine the fair value. These internal models include assumptions of the future prices of energy commodities based on the specific market in which the energy commodity is being purchased or sold, using externally available forward market pricing curves for all periods possible under the pricing model. In order to qualify the derivative instruments for hedged transactions, NRG estimates the forecasted generation and forecasted borrowings for interest rate swaps occurring within a specified time period. Judgments related to the probability of forecasted generation occurring are based on available baseload capacity, internal forecasts of sales and generation, and historical physical delivery on similar contracts. Judgments related to the probability of forecasted borrowings are based on the estimated timing of project construction, which can vary based on various factors. The probability that hedged forecasted generation and forecasted borrowings will occur by the end of a specified time period could change the results of operations by requiring amounts currently classified in OCI to be reclassified into earnings, creating increased variability in the Company's earnings. These estimations are considered to be critical accounting estimates.
Certain derivative instruments that meet the criteria for derivative accounting treatment also qualify for a scope exception to derivative accounting, as they are considered to be NPNS. The availability of this exception is based upon the assumption that NRG has the ability and it is probable to deliver or take delivery of the underlying item. These assumptions are based on available baseload capacity, internal forecasts of sales and generation and historical physical delivery on contracts. Derivatives that are considered to be NPNS are exempt from derivative accounting treatment and are accounted for under accrual accounting. If it is determined that a transaction designated as NPNS no longer meets the scope exception due to changes in estimates, the related contract would be recorded on the balance sheet at fair value combined with the immediate recognition through earnings.
Income Taxes and Valuation Allowance for Deferred Tax Assets
As of
December 31, 2016
, NRG had a valuation allowance of
$3.9 billion
. This amount is comprised of domestic federal net deferred tax assets of approximately
$3.4 billion
, domestic state net deferred tax assets of
$534 million
, foreign net operating loss carryforwards of
$63 million
, and foreign capital loss carryforwards of approximately
$1 million
. The Company believes it is more likely than not that the results of future operations will not generate sufficient taxable income which includes the future reversal of existing taxable temporary differences to realize deferred tax assets, requiring a valuation allowance to be recorded.
NRG continues to be under audit for multiple years by taxing authorities in other jurisdictions. Considerable judgment is required to determine the tax treatment of a particular item that involves interpretations of complex tax laws. NRG is subject to examination by taxing authorities for income tax returns filed in the U.S. federal jurisdiction and various state and foreign jurisdictions including operations located in Australia.
The Company is no longer subject to U.S. federal income tax examinations for years prior to 2015. With few exceptions, state and local income tax examinations are no longer open for years before 2010.
112
Evaluation of Assets for Impairment and Other-Than-Temporary Decline in Value
In accordance with ASC 360,
Property, Plant, and Equipment
, or ASC 360, NRG evaluates property, plant and equipment and certain intangible assets for impairment whenever indicators of impairment exist. Examples of such indicators or events are:
|
•
|
Significant decrease in the market price of a long-lived asset;
|
|
•
|
Significant adverse change in the manner an asset is being used or its physical condition;
|
|
•
|
Adverse business climate;
|
|
•
|
Accumulation of costs significantly in excess of the amount originally expected for the construction or acquisition of an asset;
|
|
•
|
Current period loss combined with a history of losses or the projection of future losses; and
|
|
•
|
Change in the Company's intent about an asset from an intent to hold to a greater than 50% likelihood that an asset will be sold or disposed of before the end of its previously estimated useful life.
|
Recoverability of assets to be held and used is measured by a comparison of the carrying amount of the assets to the future net cash flows expected to be generated by the asset, through considering project specific assumptions for long-term power pool prices, escalated future project operating costs and expected plant operations. If such assets are considered to be impaired, the impairment to be recognized is measured by the amount by which the carrying amount of the assets exceeds the fair value of the assets by factoring in the probability weighting of different courses of action available to the Company. Generally, fair value will be determined using valuation techniques such as the present value of expected future cash flows. NRG uses its best estimates in making these evaluations and considers various factors, including forward price curves for energy, fuel costs and operating costs. However, actual future market prices and project costs could vary from the assumptions used in the Company's estimates, and the impact of such variations could be material.
For assets to be held and used, if the Company determines that the undiscounted cash flows from the asset are less than the carrying amount of the asset, NRG must estimate fair value to determine the amount of any impairment loss. Assets held-for-sale are reported at the lower of the carrying amount or fair value less the cost to sell. The estimation of fair value under ASC 360, whether in conjunction with an asset to be held and used or with an asset held-for-sale, and the evaluation of asset impairment are, by their nature, subjective. NRG considers quoted market prices in active markets to the extent they are available. In the absence of such information, the Company may consider prices of similar assets, consult with brokers, or employ other valuation techniques. NRG will also discount the estimated future cash flows associated with the asset using a single interest rate representative of the risk involved with such an investment or employ an expected present value method that probability-weights a range of possible outcomes. The use of these methods involves the same inherent uncertainty of future cash flows as previously discussed with respect to undiscounted cash flows. Actual future market prices and project costs could vary from those used in the Company's estimates, and the impact of such variations could be material. Annually, during the fourth quarter, the Company revises its views of power and fuel prices including the Company's fundamental view for long term prices, forecasted generation and operating and capital expenditures, in connection with the preparation of its annual budget. Changes to the Company’s views of long term power and fuel prices impacted the Company’s projections of profitability, based on management's estimate of supply and demand within the sub-markets for each plant and the physical and economic characteristics of each plant.
The following long-lived asset impairments were recorded during 2016, as further described in Item 15 —
Note 10
,
Asset Impairments
, to the consolidated financial statements:
•
During the second quarter of 2016, the Company identified triggering events for the Mandalay and Ormond Beach facilities and performed impairment tests. Based on the results of the impairment tests, the Company determined that the carrying amount of these assets was higher than the estimated future net cash flows expected to be generated by the respective assets and that the Mandalay and Ormond Beach assets were impaired. The fair value of the Mandalay and Ormond Beach operating units was determined using the income approach which utilizes estimates of discounted future cash flows, and include key inputs such as forecasted contract prices, forecasted operating expenses and discount rates. The Company recorded an impairment loss of $16 million and $43 million for Mandalay and Ormond Beach, respectively.
•
During the second quarter of 2016, the Company also recorded impairment losses of $17 million to record the Rockford generating station at its sale price.
113
•
During the fourth quarter of 2016, the Company identified triggering events for the following facilities:
◦
Wind Facilities
- In connection with the preparation of the annual budget, it was noted that the cash flows for the Elbow Creek and Goat Wind projects, located in Texas, and the Forward project, located in Pennsylvania, were below the carrying value of the related assets, primarily driven by declining merchant power prices in post-contract periods, and the assets were considered impaired. The fair value of the facilities was determined using an income approach by applying a discounted cash flow methodology to the long-term budgets for each respective plant. The income approach utilized estimates of discounted future cash flows and includes key inputs such as forecasted power prices, operations and maintenance expense, and discount rates. The Company recorded impairment losses of $117 million, $60 million and $6 million for Elbow Creek, Goat Wind and Forward, respectively.
◦
Long Beach
- The Company determined that it would retire its Long Beach generation station by the end of 2017, as it was not awarded a PPA in the recent SCE capacity auction and the current PPA will expire on July 31, 2017. The fair value was determined using an income approach and the Company recorded an impairment loss of $36 million to reduce the carrying amount of the facility to the value of the underlying land.
◦
Ormond Beach
- In connection with the preparation of the annual budget, the Company concluded that the declining prices for resource adequacy contracts in the area in which Ormond Beach operates further reduced expected cash flows for the facility and considered this to be an indicator of impairment. The cash flows associated with Ormond Beach were less than the carrying amount and the Company determined the facility was impaired. The fair value was determined using an income approach, which utilizes estimates of discounted future cash flows and include key inputs such as forecasted contract prices, forecasted operating expenses and discount rates. The Company recorded an impairment loss of $28 million to reduce the carrying amount to fair value.
◦
Keystone and Conemaugh Leased Interests
- In connection with the preparation of the annual budget, the Company noted that the cash flows for the leased interests in Keystone and Conemaugh were below the carrying amount of the assets, primarily driven by a reduction in long-term energy and capacity prices in PJM and maintenance costs , and the assets were impaired. The fair value of the interests in Keystone and Conemaugh were determined using the income approach, which utilizes estimates of future discounted cash flows and include key inputs such as forecasted power, capacity and fuel prices, forecasted operating expenses, contractual lease payments, and discount rates. The Company recorded impairment losses of $97 million and $10 million for Conemaugh and Keystone, respectively.
◦
Pittsburg
- The Company determined that it would need to retire the Pittsburg facility earlier than anticipated as it did not receive a resource adequacy contract for 2017. The Company considered this to be a triggering event, and tested the asset for impairment. The fair value of the facility was determined using an income approach and the Company recorded an impairment loss of $20 million to reduce the carrying amount to the value of the underlying land.
Other Impairments
- During 2016, the Company recorded other impairment losses of $131 million, which included $23 million in excess SO
2
allowances,
$23 million
for intangible assets,
$19 million
in previously purchased solar panels, $18 million in deferred marketing expenses, and $48 million of other impairment losses.
114
NRG is also required to evaluate its equity method and cost method investments to determine whether or not they are impaired in accordance with ASC 323,
Investments - Equity Method and Joint Ventures
, or ASC 323. The standard for determining whether an impairment must be recorded under ASC 323 is whether a decline in the value is considered an other-than-temporary decline in value. The evaluation and measurement of impairments under ASC 323 involves the same uncertainties as described for long-lived assets that the Company owns directly and accounts for in accordance with ASC 360. Similarly, the estimates that NRG makes with respect to its equity and cost-method investments are subjective, and the impact of variations in these estimates could be material. Additionally, if the projects in which the Company holds these investments recognize an impairment under the provisions of ASC 360, NRG would record its proportionate share of that impairment loss and would evaluate its investment for an other-than-temporary decline in value under ASC 323. During the year ended December 31, 2016, the Company recorded impairment losses on its equity method and cost method investments of
$268 million
due to other-than-temporary declines in value, including the following:
•
During the first quarter of 2016, management changed its plans with respect to its future capital commitments driven in part by the continued decline in oil prices. As a result, the Company reviewed its 50% interest in Petra Nova Parish Holdings for impairment utilizing the other-than-temporary impairment model. In determining fair value, the Company utilized an income approach and considered project specific assumptions for the future project cash flows. The carrying amount of the Company's equity method investment exceeded the fair value of the investment and the Company concluded that the decline is considered to be other-than-temporary. As a result, the Company measured the impairment loss as the difference between the carrying amount and the fair value of the investment and recorded an impairment loss of $140 million.
•
During the fourth quarter of 2016, the Company offered several projects to NRG Yield Operating LLC including its interest in Community Wind North. The offer price was below its current carrying amount and this decline in fair value was determined to be other-than-temporary. Accordingly, the Company recorded an impairment loss of $36 million to reduce its carrying amount to fair value. In addition, in connection with the preparation of the annual budget, the Company noted that it could not budget for its interest in the Sherbino wind facility beyond 2018 due to its debt maturity date and the anticipated difficulty in refinancing the debt that would mature in 2018. Accordingly, the Company determined that an other-than-temporary impairment existed and recorded an impairment loss on its investment in Sherbino of $70 million.
•
During 2016, the Company recorded $22 million of impairment losses for other investments.
Goodwill and Other Intangible Assets
At
December 31, 2016
, NRG reported goodwill of
$662 million
, consisting of $276 million associated with the acquisition of EME, $341 million for retail business acquisitions, and $45 million associated with other business acquisitions. The Company also recorded intangible assets, measured primarily based on significant inputs that are not observable in the market and thus represent a Level 3 measurement as defined in ASC 820. See Item 15 —
Note 3
,
Business Acquisitions and Dispositions
, and
Note 11
,
Goodwill and Other Intangibles
, to the consolidated financial statements for further discussion.
The Company applies ASC 805,
Business Combinations
, or ASC 805, and ASC 350, to account for its goodwill and intangible assets. Under these standards, the Company amortizes all finite-lived intangible assets over their respective estimated weighted-average useful lives, while goodwill has an indefinite life and is not amortized. Goodwill and all intangible assets not subject to amortization are tested for impairments at least annually, or more frequently whenever an event or change in circumstances occurs that would more likely than not reduce the fair value of a reporting unit below its carrying amount. The Company tests goodwill for impairment at the reporting unit level, which is identified by assessing whether the components of the Company's operating segments constitute businesses for which discrete financial information is available and whether segment management regularly reviews the operating results of those components. The Company performs the annual goodwill impairment assessment as of December 31 or when events or changes in circumstances indicate that the carrying value may not be recoverable. NRG first evaluates qualitative factors to determine if it is more likely than not that impairment has occurred. In the absence of sufficient qualitative factors, goodwill impairment is determined utilizing a two-step process. If it is determined that the fair value of a reporting unit is below its carrying amount, where necessary, the Company's goodwill and/or intangible asset with indefinite lives will be impaired at that time.
The Company performed step zero of the goodwill impairment test, performing its qualitative assessment of macroeconomic, industry and market events and circumstances, and the overall financial performance of the NRG Business Solutions (NRG Curtailment Solutions) and Retail Mass reporting unit. The Company determined it was not more likely than not that the fair value of the goodwill attributed to these reporting units were less than their carrying amount and accordingly, no impairment existed for the year ended December 31, 2016.
115
The Company performed step one of the two-step impairment test for the reporting units in the following table. The Company determined the fair value of these reporting units using primarily an income approach. Under the income approach, the Company estimated the fair value of the reporting units' invested capital exceeds its carrying value and, as such, the Company concluded that goodwill associated with the reporting units in the following table is not impaired as of December 31, 2016:
|
Reporting Unit (Segment)
|
% Fair Value Over Carrying Value
|
||
|
BETM (Generation, formerly Corporate)
|
169
|
%
|
|
|
Midwest Generation (Generation)
|
105
|
|
|
|
Texas Non-Commodity (excluding Goal Zero) (Retail, formerly Retail Mass)
|
286
|
|
|
|
Solar Power Partners (Renewables)
|
132
|
|
|
|
Goal Zero (Retail, formerly Retail Mass)
|
123
|
|
|
The Company also performed step one of the two-step impairment test for its Texas reporting unit. The Company determined the fair value of the Texas reporting unit primarily using an income approach. The fair value of the reporting unit was determined to be less than its carrying amount and, accordingly, the Company performed step two of the two-step impairment test. The results of this impairment test are detailed below and in Item 15 -
Note 10
,
Asset Impairments
, to the consolidated financial statements.
The Company believes the methodology and assumptions used in the valuation are consistent with the views of market participants. Significant inputs to the determination of fair value were as follows:
|
•
|
The Company applied a discounted cash flow methodology to the long-term budgets for all of the plants in the region. The significant assumptions used to derive the long-term budgets used in the income approach are affected by the following key inputs:
|
|
◦
|
The Company's views of power and fuel prices consider market prices for the first five-year period and the Company's fundamental view for the longer term, which reflect the Company's long-term view of the price of natural gas. The Company's fundamental view for the longer term reflects the implied power price and heat rate that would support new build of a combined cycle gas plant in the Texas region. The price of natural gas plays an important role in setting the price of electricity in many of the regions where NRG operates power plants. Hedging is included to the extent of contracts already in place;
|
|
◦
|
The Company's estimate of generation, fuel costs, capital expenditure requirements and the existing and anticipated impact of environmental regulations;
|
|
◦
|
The Company's fundamental view for the longer term, cash flows for the plants in the region were included in the fair value calculation through the end of each plants' estimated useful life; and
|
|
◦
|
Projected generation and resulting energy gross margin in the long-term budgets is based on an hourly dispatch that simulates dispatch of each unit into the power market. The dispatch simulation is based on power prices, fuel prices, and the physical and economic characteristics of each plant.
|
|
•
|
The additional significant assumptions used in overall valuation of the Texas reporting unit were as follows:
|
|
◦
|
The discount rate applied to internally developed cash flow projections for the Texas reporting unit represents the weighted average cost of capital consistent with the risk inherent in future cash flows and based upon an assumed capital structure, cost of long-term debt and cost of equity consistent with comparable companies in the integrated utility industry.
|
|
◦
|
The intangible value to Texas for synergies it provides to NRG’s retail businesses. The estimates of annual collateral cost savings resulting from utilizing the Company's wholesale generation assets to provide supply to retail represent the cost of collateral that would otherwise need to be held in reserve to support potential postings to third parties in the case of a significant price move. This is calculated from a combination of the volume the Company would otherwise need to buy from these third parties, based on historical volumes, and historical price movements calibrated to an appropriate probability. The estimates of annual supply cost savings are based on historical volumes of retail purchases from Texas, an average bid-ask spread based on broker quotes and the assumption that Texas will realize half of the benefits associated with this savings.
|
116
Under step one, if the fair value of a reporting unit exceeds its carrying value, goodwill of the reporting unit is not considered impaired. Under the income approach described above, the Company estimated that the fair value of Texas' invested capital was
43%
below its carrying value as of
December 31, 2016
and concluded that step two was required. Step two requires an allocation of fair value to the individual asset and liabilities using a hypothetical purchase price allocation in order to determine the implied fair value of goodwill. If the implied fair value of goodwill is less than the carrying amount, an impairment loss is recorded. Under the step two analysis it was determined that the carrying amount of the goodwill exceeded its fair value by the remaining
$337 million
and an impairment loss of this amount was recorded.
The Company’s Midwest Generation reporting unit receives a significant portion of its revenues from the capacity markets in PJM and the results of each annual auction can have a significant impact on Midwest Generation’s future performance. Accordingly, if Midwest Generation’s future revenues are significantly reduced as a result of the 2017 annual auction, the Company may consider that to be a triggering event and may be required to evaluate the Midwest Generation goodwill of $165 million for impairment. The Company may also be required to evaluate the property, plant and equipment for the Midwest Generation facilities for impairment. Depending on the results, it is possible that one of both of the assets could be impaired.
Fair value determinations require considerable judgment and are sensitive to changes in underlying assumptions and factors. As a result, there can be no assurance that the estimates and assumptions made for purposes of the annual goodwill impairment test will prove to be accurate predictions of the future.
Contingencies
NRG records reserves for estimated losses from contingencies when information available indicates that a loss is probable and the amount of the loss, or range of loss, can be reasonably estimated. Gain contingencies are not recorded until management determines it is certain that the future event will become or does become a reality. Such determinations are subject to interpretations of current facts and circumstances, forecasts of future events, and estimates of the financial impacts of such events. NRG describes in detail its contingencies in Item 15 —
Note 22
,
Commitments and Contingencies
,
to the consolidated financial statements.
Recent Accounting Developments
See Item 15 —
Note 2
,
Summary of Significant Accounting Policies
,
to the consolidated financial statements for a discussion of recent accounting developments.
117
NRG is exposed to several market risks in the Company's normal business activities. Market risk is the potential loss that may result from market changes associated with the Company's merchant power generation or with an existing or forecasted financial or commodity transaction. The types of market risks the Company is exposed to are commodity price risk, interest rate risk, liquidity risk, credit risk and currency exchange risk. In order to manage, these risks the Company uses various fixed-price forward purchase and sales contracts, futures and option contracts traded on NYMEX, and swaps and options traded in the over-the-counter financial markets to:
|
•
|
Manage and hedge fixed-price purchase and sales commitments;
|
|
•
|
Manage and hedge exposure to variable rate debt obligations;
|
|
•
|
Reduce exposure to the volatility of cash market prices, and
|
|
•
|
Hedge fuel requirements for the Company's generating facilities.
|
Commodity Price Risk
Commodity price risks result from exposures to changes in spot prices, forward prices, volatilities, and correlations between various commodities, such as natural gas, electricity, coal, oil, and emissions credits. NRG manages the commodity price risk of the Company's merchant generation operations and load serving obligations by entering into various derivative or non-derivative instruments to hedge the variability in future cash flows from forecasted sales and purchases of electricity and fuel. These instruments include forwards, futures, swaps, and option contracts traded on various exchanges, such as NYMEX and ICE, as well as over-the-counter markets. The portion of forecasted transactions hedged may vary based upon management's assessment of market, weather, operation and other factors.
While some of the contracts the Company uses to manage risk represent commodities or instruments for which prices are available from external sources, other commodities and certain contracts are not actively traded and are valued using other pricing sources and modeling techniques to determine expected future market prices, contract quantities, or both. NRG uses the Company's best estimates to determine the fair value of those derivative contracts. However, it is likely that future market prices could vary from those used in recording mark-to-market derivative instrument valuation and such variations could be material.
NRG measures the risk of the Company's portfolio using several analytical methods, including sensitivity tests, scenario tests, stress tests, position reports, and VaR. NRG uses a Monte Carlo simulation based VaR model to estimate the potential loss in the fair value of the Company's energy assets and liabilities, which includes generation assets, load obligations, and bilateral physical and financial transactions. The key assumptions for the Company's VaR model include: (i) lognormal distribution of prices; (ii) one-day holding period; (iii) 95% confidence interval; (iv) rolling 36-month forward looking period; and (v) market implied volatilities and historical price correlations.
As of
December 31, 2016
, the VaR for NRG's commodity portfolio, including generation assets, load obligations and bilateral physical and financial transactions calculated using the VaR model was
$41 million
.
The following table summarizes average, maximum and minimum VaR for NRG for the years ended
December 31, 2016
and
2015
:
|
(In millions)
|
2016
|
2015
|
|||||
|
VaR as of December 31,
|
$
|
41
|
|
$
|
54
|
|
|
|
For the year ended December 31,
|
|||||||
|
Average
|
$
|
53
|
|
$
|
42
|
|
|
|
Maximum
|
72
|
|
55
|
|
|||
|
Minimum
|
32
|
|
30
|
|
|||
Due to the inherent limitations of statistical measures such as VaR, the evolving nature of the competitive markets for electricity and related derivatives, and the seasonality of changes in market prices, the VaR calculation may not capture the full extent of commodity price exposure. As a result, actual changes in the fair value of mark-to-market energy assets and liabilities could differ from the calculated VaR, and such changes could have a material impact on the Company's financial results.
In order to provide additional information, the Company also uses VaR to estimate the potential loss of derivative financial instruments that are subject to mark-to-market accounting. These derivative instruments include transactions that were entered into for both asset management and trading purposes. The VaR for the derivative financial instruments calculated using the diversified VaR model for the entire term of these instruments entered into for both asset management and trading was
$65 million
as of December 31, 2016, primarily driven by asset-backed transactions.
118
Interest Rate Risk
NRG is exposed to fluctuations in interest rates through the Company's issuance of fixed rate and variable rate debt. Exposures to interest rate fluctuations may be mitigated by entering into derivative instruments known as interest rate swaps, caps, collars and put or call options. These contracts reduce exposure to interest rate volatility and result in primarily fixed rate debt obligations when taking into account the combination of the variable rate debt and the interest rate derivative instrument. NRG's risk management policies allow the Company to reduce interest rate exposure from variable rate debt obligations.
In addition to those discussed above, the Company's project subsidiaries enter into interest rate swaps, intended to hedge the risks associated with interest rates on non-recourse project level debt. See Item 15 —
Note 12
,
Debt and Capital Leases
, to the Consolidated Financial Statements, for more information about interest rate swaps of the Company's project subsidiaries.
If all of the above swaps had been discontinued on
December 31, 2016
, the Company would have owed the counterparties
$46 million
. Based on the investment grade rating of the counterparties, NRG believes its exposure to credit risk due to nonperformance by counterparties to its hedge contracts to be insignificant.
NRG has both long and short-term debt instruments that subject the Company to the risk of loss associated with movements in market interest rates. As of
December 31, 2016
, a 1% change in interest rates would result in a
$13 million
change in interest expense on a rolling twelve month basis.
As of
December 31, 2016
, the Company's debt fair value was $18.6 billion and carrying value was $19.4 billion. NRG estimates that a 1% decrease in market interest rates would have increased the fair value of the Company's long-term debt by
$1.5 billion
.
Liquidity Risk
Liquidity risk arises from the general funding needs of the Company's activities and in the management of the Company's assets and liabilities. The Company is currently exposed to additional collateral posting if natural gas prices decline primarily due to the long natural gas equivalent position at various exchanges used to hedge NRG's retail supply load obligations.
Based on a sensitivity analysis for power and gas positions under marginable contracts, a $0.50 per MMBtu change in natural gas prices across the term of the marginable contracts would cause a change in margin collateral posted of approximately
$192 million
as of
December 31, 2016
, and a 1.00 MMBtu/MWh change in heat rates for heat rate positions would result in a change in margin collateral posted of approximately
$243 million
as of
December 31, 2016
. This analysis uses simplified assumptions and is calculated based on portfolio composition and margin-related contract provisions as of
December 31, 2016
.
Counterparty Credit Risk
Credit risk relates to the risk of loss resulting from non-performance or non-payment by counterparties pursuant to the terms of their contractual obligations. The Company monitors and manages credit risk through credit policies that include: (i) an established credit approval process; (ii) a daily monitoring of counterparties' credit limits; (iii) the use of credit mitigation measures such as margin, collateral, prepayment arrangements, or volumetric limits; (iv) the use of payment netting agreements; and (v) the use of master netting agreements that allow for the netting of positive and negative exposures of various contracts associated with a single counterparty. Risks surrounding counterparty performance and credit could ultimately impact the amount and timing of expected cash flows. The Company seeks to mitigate counterparty risk by having a diversified portfolio of counterparties. The Company also has credit protection within various agreements to call on additional collateral support if and when necessary. Cash margin is collected and held at the Company to cover the credit risk of the counterparty until positions settle.
119
As of
December 31, 2016
, aggregate counterparty credit exposure to a significant portion of the Company's counterparties totaled
$231 million
, of which the Company held collateral (cash and letters of credit) against those positions of
$2 million
resulting in a net exposure of
$229 million
. Approximately
95%
of the Company's exposure before collateral is expected to roll off by the end of
2018
. The following table highlights the net counterparty credit exposure by industry sector and by counterparty credit quality. Net counterparty credit exposure is defined as the aggregate net asset position for NRG with counterparties where netting is permitted under the enabling agreement and includes all cash flow, mark-to-market, NPNS, and non-derivative transactions. As of
December 31, 2016
, the aggregate credit exposure is shown net of collateral held, and includes amounts net of receivables or payables.
|
Category
|
Net Exposure
(a) (b)
(% of Total)
|
|
|
Utilities, energy merchants, marketers and other
|
100
|
%
|
|
Total
|
100
|
%
|
|
Category
|
Net Exposure
(a) (b)
(% of Total)
|
|
|
Investment grade
|
67
|
%
|
|
Non-Investment grade/Non-Rated
|
33
|
|
|
Total
|
100
|
%
|
|
(a)
|
Counterparty credit exposure excludes uranium and coal transportation contracts because of the unavailability of market prices.
|
|
(b)
|
The figures in the tables above exclude potential counterparty credit exposure related to RTOs, ISOs, registered commodity exchanges and certain long term contracts.
|
The Company has credit exposure to certain wholesale counterparties, each of which represent more than 10% of the total net exposure discussed above and the aggregate credit exposure to such counterparties was
$80 million
as of December 31, 2016. Changes in hedge positions and market prices will affect credit exposure and counterparty concentration. Given the credit quality, diversification and term of the exposure in the portfolio, the Company does not anticipate a material impact on its financial position or results of operations from nonperformance by any counterparty.
RTOs and ISOs
The Company participates in the organized markets of CAISO, ERCOT, ISO-NE, MISO, NYISO and PJM, known as RTOs or ISOs. Trading in these markets is approved by FERC, or in the case of ERCOT, approved by the PUCT and include credit policies that, under certain circumstances, require that losses arising from the default of one member on spot market transactions be shared by the remaining participants. As a result, the counterparty credit risk to these markets is limited to NRG’s applicable share of the overall market and are excluded from the above exposures.
Exchange Traded Transactions
The Company enters into commodity transactions on registered exchanges, notably ICE and NYMEX. These clearinghouses act as the counterparty and transactions are subject to extensive collateral and margining requirements. As a result, these commodity transactions have limited counterparty credit risk.
120
Long Term Contracts
Counterparty credit exposure described above excludes credit risk exposure under certain long term contracts, including California tolling agreements, Gulf Coast load obligations, and wind and solar PPAs. As external sources or observable market quotes are not available to estimate such exposure, the Company values these contracts based on various techniques including but not limited to internal models based on a fundamental analysis of the market and extrapolation of observable market data with similar characteristics. Based on these valuation techniques, as of
December 31, 2016
, aggregate credit risk exposure managed by NRG to these counterparties was approximately
$4.1 billion
, of which
$2.6 billion
related to assets of NRG Yield, Inc., for the next five years. This amount excludes potential credit exposures for projects with long term PPAs that have not reached commercial operations. The majority of these power contracts are with utilities or public power entities with strong credit quality and public utility commission or other regulatory support. However, such regulated utility counterparties can be impacted by changes in government regulations, which NRG is unable to predict.
Retail Customer Credit Risk
NRG is exposed to retail credit risk through its retail electricity providers, which serve C&I customers and the Mass market. Retail credit risk results in losses when a customer fails to pay for services rendered. The losses could be incurred from nonpayment of customer accounts receivable and any in-the-money forward value. NRG manages retail credit risk through the use of established credit policies that include monitoring of the portfolio, and the use of credit mitigation measures such as deposits or prepayment arrangements.
As of
December 31, 2016
, the Company's retail customer credit exposure to C&I and Mass customers was diversified across many customers and various industries, as well as government entities. The Company is also subject to risk with respect to its residential solar customers. The Company's bad debt expense resulting from credit risk was
$48 million
,
$64 million
, and
$64 million
for the years ending December 31,
2016
,
2015
and
2014
, respectively. Current economic conditions may affect the Company's customers' ability to pay bills in a timely manner, which could increase customer delinquencies and may lead to an increase in bad debt expense.
Credit Risk Related Contingent Features
Certain of the Company's hedging agreements contain provisions that require the Company to post additional collateral if the counterparty determines that there has been deterioration in credit quality, generally termed "adequate assurance" under the agreements, or require the Company to post additional collateral if there were a one notch downgrade in the Company's credit rating. The collateral required for contracts that have adequate assurance clauses that are in a net liability position as of
December 31, 2016
was
$36 million
. The collateral required for contracts with credit rating contingent features that are in a net liability position as of
December 31, 2016
was
$56 million
. The Company is also a party to certain marginable agreements under which it has a net liability position but the counterparty has not called for the collateral due, which is approximately
$14 million
as of
December 31, 2016
.
Currency Exchange Risk
NRG's foreign earnings and investments may be subject to foreign currency exchange risk, which NRG generally does not hedge. As these earnings and investments are not material to NRG's consolidated results, the Company's foreign currency exposure is limited.
The financial statements and schedules are listed in Part IV, Item 15 of this Form 10-K.
121
None.
Conclusion Regarding the Effectiveness of Disclosure Controls and Procedures and Internal Control Over Financial Reporting
Under the supervision and with the participation of NRG's management, including its principal executive officer, principal financial officer and principal accounting officer, NRG conducted an evaluation of the effectiveness of the design and operation of its disclosure controls and procedures, as such term is defined in Rules 13a-15(e) or 15d-15(e) of the Exchange Act. Based on this evaluation, the Company's principal executive officer, principal financial officer and principal accounting officer concluded that the disclosure controls and procedures were effective as of the end of the period covered by this Annual Report on Form 10-K. Management's report on the Company's internal control over financial reporting and the report of the Company's independent registered public accounting firm are incorporated under the caption "Management's Report on Internal Control over Financial Reporting" and under the caption "Report of Independent Registered Public Accounting Firm" in this Annual Report on Form 10-K for the fiscal year ended
December 31, 2016
.
Changes in Internal Control over Financial Reporting
There were no changes in NRG’s internal control over financial reporting (as such term is defined in Rule 13a-15(f) under the Exchange Act) that occurred in the fourth quarter of
2016
that materially affected, or are reasonably likely to materially affect, NRG’s internal control over financial reporting.
Inherent Limitations over Internal Controls
NRG's internal control over financial reporting is designed to provide reasonable assurance regarding the reliability of financial reporting and the preparation of consolidated financial statements for external purposes in accordance with GAAP. The Company's internal control over financial reporting includes those policies and procedures that:
|
1.
|
Pertain to the maintenance of records that, in reasonable detail, accurately and fairly reflect the transactions and dispositions of the Company's assets;
|
|
2.
|
Provide reasonable assurance that transactions are recorded as necessary to permit preparation of consolidated financial statements in accordance with GAAP, and that the Company's receipts and expenditures are being made only in accordance with authorizations of its management and directors; and
|
|
3.
|
Provide reasonable assurance regarding prevention or timely detection of unauthorized acquisition, use or disposition of the Company's assets that could have a material effect on the consolidated financial statements.
|
Internal control over financial reporting cannot provide absolute assurance of achieving financial reporting objectives because of its inherent limitations, including the possibility of human error and circumvention by collusion or overriding of controls. Accordingly, even an effective internal control system may not prevent or detect material misstatements on a timely basis. Also, projections of any evaluation of effectiveness to future periods are subject to the risk that controls may become inadequate because of changes in conditions or that the degree of compliance with the policies or procedures may deteriorate.
Management's Report on Internal Control over Financial Reporting
The Company's management is responsible for establishing and maintaining adequate internal control over financial reporting, as such term is defined in Exchange Act Rule 13a-15(f). Under the supervision and with the participation of the Company's management, including its principal executive officer, principal financial officer and principal accounting officer, the Company conducted an evaluation of the effectiveness of its internal control over financial reporting based on the framework in
Internal Control — Integrated Framework (2013)
issued by the Committee of Sponsoring Organizations of the Treadway Commission. Based on the Company's evaluation under the framework in
Internal Control — Integrated Framework (2013)
, the Company's management concluded that its internal control over financial reporting was effective as of
December 31, 2016
.
The effectiveness of the Company's internal control over financial reporting as of
December 31, 2016
has been audited by KPMG LLP, the Company's independent registered public accounting firm, as stated in its report which is included in this Annual Report on Form 10‑K.
122
REPORT OF INDEPENDENT REGISTERED PUBLIC ACCOUNTING FIRM
The Board of Directors and Stockholders
NRG Energy, Inc.:
We have audited NRG Energy, Inc.’s internal control over financial reporting as of
December 31, 2016
, based on criteria established in
Internal Control — Integrated Framework (2013)
issued by the Committee of Sponsoring Organizations of the Treadway Commission (COSO)
.
NRG Energy, Inc.’s management is responsible for maintaining effective internal control over financial reporting and for its assessment of the effectiveness of internal control over financial reporting, included in the accompanying Management’s Report on Internal Control over Financial Reporting. Our responsibility is to express an opinion on the Company’s internal control over financial reporting based on our audit.
We conducted our audit in accordance with the standards of the Public Company Accounting Oversight Board (United States). Those standards require that we plan and perform the audit to obtain reasonable assurance about whether effective internal control over financial reporting was maintained in all material respects. Our audit included obtaining an understanding of internal control over financial reporting, assessing the risk that a material weakness exists, and testing and evaluating the design and operating effectiveness of internal control based on the assessed risk. Our audit also included performing such other procedures as we considered necessary in the circumstances. We believe that our audit provides a reasonable basis for our opinion.
A company’s internal control over financial reporting is a process designed to provide reasonable assurance regarding the reliability of financial reporting and the preparation of financial statements for external purposes in accordance with generally accepted accounting principles. A company’s internal control over financial reporting includes those policies and procedures that (1) pertain to the maintenance of records that, in reasonable detail, accurately and fairly reflect the transactions and dispositions of the assets of the company; (2) provide reasonable assurance that transactions are recorded as necessary to permit preparation of financial statements in accordance with generally accepted accounting principles, and that receipts and expenditures of the company are being made only in accordance with authorizations of management and directors of the company; and (3) provide reasonable assurance regarding prevention or timely detection of unauthorized acquisition, use, or disposition of the company’s assets that could have a material effect on the financial statements.
Because of its inherent limitations, internal control over financial reporting may not prevent or detect misstatements. Also, projections of any evaluation of effectiveness to future periods are subject to the risk that controls may become inadequate because of changes in conditions, or that the degree of compliance with the policies or procedures may deteriorate.
In our opinion, NRG Energy, Inc. maintained, in all material respects, effective internal control over financial reporting as of
December 31, 2016
, based on criteria established in
Internal Control — Integrated Framework (2013)
issued by the Committee of Sponsoring Organizations of the Treadway Commission (COSO).
We also have audited, in accordance with the standards of the Public Company Accounting Oversight Board (United States), the consolidated balance sheets of NRG Energy, Inc. and subsidiaries as of
December 31, 2016
and
2015
, and the related consolidated statements of operations, comprehensive (loss)/income, cash flows, and stockholders’ equity for each of the years in the three-year period ended
December 31, 2016
, and our report dated
February 28, 2017
expressed
an unqualified opinion on those consolidated financial statements
.
(signed) KPMG LLP
Philadelphia, PA
February 28, 2017
123
None.
124
Directors
E. Spencer Abraham
has been a director of NRG since December 2012. Previously, he served as a director of GenOn Energy, Inc. from January 2012 to December 2012. He is Chairman and Chief Executive Officer of The Abraham Group, an international strategic consulting firm based in Washington, D.C which he founded in 2005. Prior to that, Secretary Abraham served as Secretary of Energy under President George W. Bush from 2001 through January 2005 and was a U.S. Senator for the State of Michigan from 1995 to 2001. Secretary Abraham serves on the boards of the following public companies: Occidental Petroleum Corporation, PBF Energy, Two Harbors Investment Corp. and Uranium Energy Corp. He also serves on the board of C3 IOT, a private company. Secretary Abraham also serves as chairman of the advisory committee of Lynx Global Realty Asset Fund. Secretary Abraham previously served as the non-executive chairman of AREVA, Inc., the U.S. subsidiary of the French-owned nuclear company, and as a director of Deepwater Wind LLC, International Battery, Green Rock Energy, ICx Technologies, PetroTiger and Sindicatum Sustainable Resources. He also previously served on the advisory board or committees of Midas Medici (Utilipoint), Millennium Private Equity, Sunovia and Wetherly Capital.
Kirbyjon H. Caldwell
has been a director of NRG since March 2009. He was a director of Reliant Energy, Inc. from August 2003 to March 2009. Since 1982, he has served as Senior Pastor at the 16,000-member Windsor Village United Methodist Church in Houston, Texas. Pastor Caldwell was also a director of United Continental Holdings, Inc. (formerly Continental Airlines, Inc.) from 1999 to September 2011. Pastor Caldwell is also on the Board of Trustees of Baylor College of Medicine.
Lawrence S. Coben
has served as Chairman of the Board of NRG since February 2017 and has been a director of NRG since December 2003. He is currently Chairman and Chief Executive Officer of Tremisis Energy Corporation LLC. Dr. Coben was Chairman and Chief Executive Officer of Tremisis Energy Acquisition Corporation II, a publicly held company, from July 2007 through March 2009 and of Tremisis Energy Acquisition Corporation from February 2004 to May 2006. From January 2001 to January 2004, he was a Senior Principal of Sunrise Capital Partners L.P., a private equity firm. From 1997 to January 2001, Dr. Coben was an independent consultant. From 1994 to 1996, Dr. Coben was Chief Executive Officer of Bolivian Power Company. Dr. Coben serves on the board of Freshpet, Inc. and served on the advisory board of Morgan Stanley Infrastructure II, L.P. from September 2014 through December 2016. Dr. Coben is also Executive Director of the Sustainable Preservation Initiative and a Consulting Scholar at the University of Pennsylvania Museum of Archaeology and Anthropology.
Terry G. Dallas
has been a director of NRG since December 2012. Previously, he served as a director of GenOn from December 2010 to December 2012. Mr. Dallas served as a director of Mirant Corporation from 2006 until December 2010. Mr. Dallas was also the former Executive Vice President and Chief Financial Officer of Unocal Corporation, an oil and gas exploration and production company prior to its merger with Chevron Corporation, from 2000 to 2005. Prior to that, Mr. Dallas held various executive finance positions in his 21-year career with Atlantic Richfield Corporation, an oil and gas company with major operations in the United States, Latin America, Asia, Europe and the Middle East.
Mauricio Gutierrez
has served as President and Chief Executive Officer of NRG since December 2015 and as a director of NRG since January 2016. Prior to December 2015, Mr. Gutierrez was the Executive Vice President and Chief Operating Officer of NRG from July 2010 to December 2015. Mr. Gutierrez also served as the Interim President and Chief Executive Officer of NRG Yield, Inc. from December 2015 to May 2016 and Executive Vice President and Chief Operating Officer of NRG Yield, Inc. from December 2012 to December 2015. Mr. Gutierrez has also served on the board of NRG Yield, Inc. since its formation in December 2012. Mr. Gutierrez has been with NRG since August 2004 and served in multiple executive positions within NRG including Executive Vice President - Commercial Operations from January 2009 to July 2010 and Senior Vice President - Commercial Operations from March 2008 to January 2009. Prior to joining NRG in August 2004, Mr. Gutierrez held various commercial positions within Dynegy, Inc.
125
William E. Hantke
has been a director of NRG since March 2006. Mr. Hantke served as Executive Vice President and Chief Financial Officer of Premcor, Inc., a refining company, from February 2002 until December 2005. Mr. Hantke was Corporate Vice President of Development of Tosco Corporation, a refining and marketing company, from September 1999 until September 2001, and he also served as Corporate Controller from December 1993 until September 1999. Prior to that position, he was employed by Coopers & Lybrand as Senior Manager, Mergers and Acquisitions from 1989 until 1990. He also held various positions from 1975 until 1988 with AMAX, Inc., including Corporate Vice President, Operations Analysis and Senior Vice President, Finance and Administration, Metals and Mining. He was employed by Arthur Young from 1970 to 1975 as Staff/Senior Accountant. Mr. Hantke was Non-Executive Chairman of Process Energy Solutions, a private alternative energy company until March 31, 2008 and served as director and Vice-Chairman of NTR Acquisition Co., an oil refining start-up, until January 2009. Mr. Hantke has served on the board of PBF Energy Inc. since February 2016.
Paul W. Hobby
has been a director of NRG since March 2006. Mr. Hobby is the Managing Partner of Genesis Park, L.P., a Houston-based private equity business specializing in technology and communications investments which he founded in 1999. Mr. Hobby routinely provides management and governance services to Genesis Park portfolio companies, and is currently serving as Chairman of Texas Monthly. He previously served as the Chief Executive Officer of Alpheus Communications, Inc., a Texas wholesale telecommunications provider from 2004 to 2011, and as former Chairman of CapRock Services Corp., the largest provider of satellite services to the global energy business from 2002 to 2006. From November 1992 until January 2001, he served as Chairman and Chief Executive Officer of Hobby Media Services and was Chairman of Columbine JDS Systems, Inc. from 1995 until 1997. Mr. Hobby is former Chairman of the Houston Branch of the Federal Reserve Bank of Dallas and the Greater Houston Partnership and is former Chairman of the Texas Ethics Commission. He was an Assistant U.S. Attorney for the Southern District of Texas from 1989 to 1992, Chief of Staff to the Lieutenant Governor of Texas, Bob Bullock and an Associate at Fulbright & Jaworski from 1986 to 1989.
Anne C. Schaumburg
has been a director of NRG since April 2005. From 1984 until her retirement in January 2002, she was Managing Director of Credit Suisse First Boston and a Senior Banker in the Global Energy Group. From 1979 to 1984, she was in the Utilities Group at Dean Witter Financial Services Group, where she last served as Managing Director. From 1971 to 1978, she was at The First Boston Corporation in the Public Utilities Group. Ms. Schaumburg is also a director of Brookfield Infrastructure Partners L.P.
Evan J. Silverstein
has been a director of NRG since December 2012. Previously, he served as a director of GenOn from August 2006 to December 2012. He served as General Partner and Portfolio Manager of SILCAP LLC, a market-neutral hedge fund that principally invests in utilities and energy companies, from January 1993 until his retirement in December 2005. Previously, he served as portfolio manager specializing in utilities and energy companies and as senior equity utility analyst. Mr. Silverstein has given numerous speeches and has testified before Congress on a variety of energy-related issues. He is an audit committee financial expert.
Barry T. Smitherman
has been a director of NRG since February 2017. Mr. Smitherman is currently an energy industry consultant and senior advisor, as well as an adjunct professor of Energy Law at The University of Texas School of Law. From April 2015 to January 2017, Mr. Smitherman was a partner with the law firm Vinson & Elkins LLP. Mr. Smitherman served on the Railroad Commission of Texas from July 2011 through January 2015 where he acted as chairman from February 2012 to August 2014. From April 2004 through July 2011, Mr. Smitherman served on the Public Utility Commission of Texas where he acted as chairman from November 2007 through July 2011.
Thomas H. Weidemeyer
has been a director of NRG since December 2003. Until his retirement in December 2003, Mr. Weidemeyer served as Director, Senior Vice President and Chief Operating Officer of United Parcel Service, Inc., the world's largest transportation company and President of UPS Airlines. Mr. Weidemeyer became Manager of the Americas International Operation in 1989, and in that capacity directed the development of the UPS delivery network throughout Central and South America. In 1990, Mr. Weidemeyer became Vice President and Airline Manager of UPS Airlines and, in 1994, was elected its President and Chief Operating Officer. Mr. Weidemeyer became Senior Vice President and a member of the Management Committee of United Parcel Service, Inc. that same year, and he became Chief Operating Officer of United Parcel Service, Inc. in January 2001. Mr. Weidemeyer also serves as a director of The Goodyear Tire & Rubber Co., Waste Management, Inc. and Amsted Industries Incorporated.
C. John Wilder
has been a director of NRG since February 2017. Mr. Wilder has served as the Executive Chairman and a member of Investment Committees of three investment vehicles: (i) Bluescape Resources Company; (ii) Parallel Resource Partners; (iii) and Bluescape Energy Partners since 2007. Since September 2015, Mr. Wilder has served as Executive Chairman and director of Exco Resources, Inc. Mr. Wilder is on the advisory boards of the McCombs School of Business at the University of Texas at Austin and the A.B. Freeman School of Business at Tulane University. Mr. Wilder is a Trustee of Texas Health Resources and is a past member of the National Petroleum Council, a Secretary of Energy Appointment.
126
Walter R. Young
has been a director of NRG since December 2003. From May 1990 to June 2003, Mr. Young was Chairman, Chief Executive Officer and President of Champion Enterprises, Inc., an assembler and manufacturer of manufactured homes. Mr. Young has held senior management positions with The Henley Group, The Budd Company and BFGoodrich.
Cooperation Agreements with Elliott and Bluescape
On February 13, 2017, the Company entered into a letter agreement, or the Elliott Cooperation Agreement, with Elliott Associates, L.P., Elliott International, L.P. and Elliott International Capital Advisors Inc. (collectively, Elliott), and a letter agreement, or the Bluescape Cooperation Agreement, with Bluescape Energy Partners LLC and BEP Special Situations 2 LLC (together, Bluescape). Under the Elliott Cooperation Agreement and the Bluescape Cooperation Agreement, the Company agreed to appoint
Messrs. Smitherman and Wilder to the Company’s board of directors and to nominate each of them for election as directors of the Company at the 2017 Annual Meeting of Stockholders. In addition, Elliott and Bluescape agreed to vote all shares beneficially owned by them or their affiliates, which they are entitled to vote on the record date, in favor of the election of directors nominated by the Board and otherwise in accordance with the Board’s recommendation.
Under the terms of the Elliott Cooperation Agreement, Elliott agreed to customary standstill restrictions that, subject to earlier termination under certain circumstances, expire upon the earlier of (x) December 31, 2017, and (y) thirty (30) days prior to the first day of the time period established pursuant to the Company’s by-laws for stockholders to deliver notice to the Company of director nominations to be brought before the 2018 Annual Meeting of Stockholders. Under the terms of the Bluescape Cooperation Agreement, Bluescape agreed to customary standstill restrictions that, subject to earlier termination or automatic extension under certain circumstances, expire upon the earlier of (x) December 31, 2018, and (y) thirty (30) days prior to the first day of the time period established pursuant to the Company’s by-laws for stockholders to deliver notice to the Company of director nominations to be brought before the 2019 Annual Meeting of Stockholders.
Executive Officers
Mauricio Gutierrez
has served as President and Chief Executive Officer of NRG since December 2015 and as a director of NRG since January 2016. For additional biographical information for Mr. Gutierrez, see above under "Directors."
Kirkland Andrews
has served as Executive Vice President and Chief Financial Officer of NRG Energy since September 2011. Mr. Andrews is a director of NRG Yield, Inc. and also served as Executive Vice President, Chief Financial Officer of NRG Yield, Inc. from December 2012 to November 2016. Prior to joining NRG, he served as Managing Director and Co-Head Investment Banking, Power and Utilities - Americas at Deutsche Bank Securities from June 2009 to September 2011. Prior to this, he served in several capacities at Citigroup Global Markets Inc., including Managing Director, Group Head, North American Power from November 2007 to June 2009, and Head of Power M&A, Mergers and Acquisitions from July 2005 to November 2007. In his banking career, Mr. Andrews led multiple large and innovative strategic, debt, equity and commodities transactions.
David Callen
has served as Senior Vice President and Chief Accounting Officer since February 2016 and Vice President and Chief Accounting Officer from March 2015 to February 2016. In this capacity, Mr. Callen is responsible for directing NRG's financial accounting and reporting activities. Mr. Callen also has served as Vice President and Chief Accounting Officer of NRG Yield, Inc. since March 2015. Prior to this, Mr. Callen served as the Company's Vice President, Financial Planning & Analysis from November 2010 to March 2015. He previously served as Director, Finance from October 2007 through October 2010, Director, Financial Reporting from February 2006 through October 2007, and Manager, Accounting Research from September 2004 through February 2006. Prior to NRG, Mr. Callen was an auditor for KPMG LLP in both New York City and Tel Aviv Israel from October 1996 through April 2001.
John Chillemi
has served as Executive Vice President, National Business Development of NRG since December 2015. In this role, Mr. Chillemi is responsible for all wholesale generation development activities for NRG across the nation. Prior to December 2015, Mr. Chillemi was Senior Vice President and Regional President, West since the acquisition of GenOn in December 2012. Mr. Chillemi served as the Regional President in California and the West for GenOn from December 2010 to December 2012, and as President and Vice President of the West at Mirant Corporation from 2007 to December 2010. Mr. Chillemi has also served as a director of NRG Yield, Inc. since May 2016. Mr. Chillemi has 30 years of power industry experience, beginning with Georgia Power in 1986.
David R. Hill
has served as Executive Vice President and General Counsel since September 2012. Mr. Hill also has served as the Executive Vice President and General Counsel of NRG Yield, Inc. since December 2012. Prior to joining NRG, Mr. Hill was a partner and co-head of Sidley Austin LLP's global energy practice group from February 2009 to August 2012. Prior to this, Mr. Hill served as General Counsel of the U.S. Department of Energy from August 2005 to January 2009 and, for the three years prior to that, as Deputy General Counsel for Energy Policy of the U.S. Department of Energy. Before his federal government service, Mr. Hill was a partner in major law firms in Washington, D.C. and Kansas City, Missouri, and handled a variety of regulatory, litigation and corporate matters.
127
Elizabeth Killinger
has served as Executive Vice President and President, NRG Retail and Reliant of NRG since February 2016. Ms. Killinger was Senior Vice President and President, NRG Retail from June 2015 to February 2016 and Senior Vice President and President, NRG Texas Retail from January 2013 to June 2015. Ms. Killinger has also served as President of Reliant, a subsidiary of NRG, since October 2012. Prior to that, Ms. Killinger was Senior Vice President of Retail Operations and Reliant Residential from January 2011 to October 2012. Ms. Killinger has been with the Company and its predecessors since 2002 and has held various operational and business leadership positions within the retail organization. Prior to joining the Company, Ms. Killinger spent a decade providing strategy, management and systems consulting to energy, oilfield services and retail distribution companies across the U.S. and in Europe.
Code of Ethics
NRG has adopted a code of ethics entitled "NRG Code of Conduct" that applies to directors, officers and employees, including the chief executive officer and senior financial officers of NRG. It may be accessed through the "Governance" section of the Company's website at
www.nrg.com.
NRG also elects to disclose the information required by Form 8-K, Item 5.05, "Amendments to the Registrant's Code of Ethics, or Waiver of a Provision of the Code of Ethics," through the Company's website, and such information will remain available on this website for at least a 12-month period. A copy of the "NRG Energy, Inc. Code of Conduct" is available in print to any stockholder who requests it.
Other information required by this Item will be incorporated by reference to the similarly named section of NRG's Definitive Proxy Statement for its
2017
Annual Meeting of Stockholders.
Information required by this Item will be incorporated by reference to the similarly named section of NRG's Definitive Proxy Statement for its
2017
Annual Meeting of Stockholders.
Securities Authorized for Issuance under Equity Compensation Plans
|
Plan Category
|
(a)
Number of Securities
to be Issued Upon
Exercise of
Outstanding Options,
Warrants and Rights
|
(b)
Weighted-Average Exercise
Price of Outstanding
Options, Warrants and
Rights
|
(c)
Number of Securities
Remaining Available
for Future Issuance
Under Equity Compensation
Plans (Excluding
Securities Reflected
in Column (a))
|
|||||||
|
Equity compensation plans approved by security holders
|
5,065,060
|
|
(1)
|
$
|
21.39
|
|
8,154,877
|
|
||
|
Equity compensation plans not approved by security holders
|
1,216,253
|
|
(2)
|
24.64
|
|
960,904
|
|
|||
|
Total
|
6,281,313
|
|
$
|
22.83
|
|
9,115,781
|
|
(3)
|
||
|
(1)
|
Consists of shares issuable under the NRG LTIP and the ESPP. The NRG LTIP became effective upon the Company's emergence from bankruptcy. On July 28, 2010, the NRG LTIP was amended to increase the number of shares available for issuance to 22,000,000. The ESPP was approved by the Company's stockholders on May 8, 2014. As of December 31, 2016, there were
667,819
shares reserved from the Company's treasury shares for the ESPP.
|
|
(2)
|
Consists of shares issuable under the NRG GenOn LTIP. On December 14, 2012, in connection with the Merger, NRG assumed the GenOn Energy, Inc. 2010 Omnibus Incentive Plan and changed the name to the NRG 2010 Stock Plan for GenOn Employees, or the NRG GenOn LTIP. While the GenOn Energy, Inc. 2010 Omnibus Incentive Plan was previously approved by stockholders of RRI Energy, Inc. before it became GenOn, the plan is listed as “not approved” because the NRG GenOn LTIP was not subject to separate line item approval by NRG's stockholders when the Merger (which included the assumption of this plan) was approved. NRG intends to make subsequent grants under the NRG GenOn LTIP. As part of the Merger, NRG also assumed the GenOn Energy, Inc. 2002 Long-Term Incentive Plan, the GenOn Energy, Inc. 2002 Stock Plan, and the Mirant Corporation 2005 Omnibus Incentive Compensation Plan. NRG has no intention of making any grants or awards of its own equity securities under these plans. The number of securities to be issued upon the exercise of outstanding awards under these plans is
240,596
at a weighted-average exercise price of
$36.72
. See Item 15
—
Note 20
,
Stock-Based Compensation
, to Consolidated Financial Statements for a discussion of the NRG GenOn LTIP.
|
|
(3)
|
Consists of
7,487,058
shares of common stock under NRG's LTIP,
960,904
shares of common stock under the NRG GenOn LTIP, and
667,819
shares of treasury stock reserved for issuance under the ESPP. In the first quarter of 2017,
282,530
shares were issued to employees' accounts from the treasury stock reserve for the ESPP.
|
128
Both the NRG LTIP and the NRG GenOn LTIP provide for grants of stock options, restricted stock, market stock units, performance stock units, deferred stock units and dividend equivalent rights. NRG's directors, officers and employees, as well as other individuals performing services for, or to whom an offer of employment has been extended by the Company, are eligible to receive grants under the NRG LTIP and the NRG GenOn LTIP. However, participants eligible for the NRG LTIP at the time of the Merger are not eligible to receive grants under the NRG GenOn LTIP. The purpose of the NRG LTIP and the NRG GenOn LTIP is to promote the Company's long-term growth and profitability by providing these individuals with incentives to maximize stockholder value and otherwise contribute to the Company's success and to enable the Company to attract, retain and reward the best available persons for positions of responsibility. The Compensation Committee of the Board of Directors administers the NRG LTIP and the NRG GenOn LTIP.
Other information required by this Item will be incorporated by reference to the similarly named section of NRG's Definitive Proxy Statement for its
2017
Annual Meeting of Stockholders.
Information required by this Item will be incorporated by reference to the similarly named section of NRG's Definitive Proxy Statement for its
2017
Annual Meeting of Stockholders.
Information required by this Item will be incorporated by reference to the similarly named section of NRG's Definitive Proxy Statement for its
2017
Annual Meeting of Stockholders.
129
(a)(1) Financial Statements
The following consolidated financial statements of NRG Energy, Inc. and related notes thereto, together with the reports thereon of KPMG LLP, are included herein:
Consolidated Statements of Operations — Years ended
December 31, 2016
,
2015
, and
2014
Consolidated Statements of Comprehensive (Loss)/Income — Years ended
December 31, 2016
,
2015
, and
2014
Consolidated Balance Sheets — As of
December 31, 2016
and
2015
Consolidated Statements of Cash Flows — Years ended
December 31, 2016
,
2015
, and
2014
Consolidated Statement of Stockholders' Equity — Years ended
December 31, 2016
,
2015
, and
2014
Notes to Consolidated Financial Statements
(a)(2) Financial Statement Schedule
The following Consolidated Financial Statement Schedule of NRG Energy, Inc. is filed as part of Item 15 of this report and should be read in conjunction with the Consolidated Financial Statements.
Schedule II — Valuation and Qualifying Accounts
All other schedules for which provision is made in the applicable accounting regulation of the Securities and Exchange Commission are not required under the related instructions or are inapplicable, and therefore, have been omitted.
(a)(3) Exhibits: See Exhibit Index submitted as a separate section of this report.
(b) Exhibits
See Exhibit Index submitted as a separate section of this report.
(c) Not applicable
130
REPORT OF INDEPENDENT REGISTERED PUBLIC ACCOUNTING FIRM
The Board of Directors and Stockholders
NRG Energy, Inc.:
We have audited the accompanying consolidated balance sheets of NRG Energy, Inc. and subsidiaries as of December 31, 2016 and 2015, and the related consolidated statements of operations, comprehensive (loss)/income, cash flows, and stockholders’ equity for each of the years in the three‑year period ended December 31, 2016. In connection with our audits of the consolidated financial statements, we also have audited financial statement schedule “Schedule II. Valuation and Qualifying Accounts.” These consolidated financial statements and financial statement schedule are the responsibility of the Company’s management. Our responsibility is to express an opinion on these consolidated financial statements and financial statement schedule based on our audits.
We conducted our audits in accordance with the standards of the Public Company Accounting Oversight Board (United States). Those standards require that we plan and perform the audit to obtain reasonable assurance about whether the financial statements are free of material misstatement. An audit includes examining, on a test basis, evidence supporting the amounts and disclosures in the financial statements. An audit also includes assessing the accounting principles used and significant estimates made by management, as well as evaluating the overall financial statement presentation. We believe that our audits provide a reasonable basis for our opinion.
In our opinion, the consolidated financial statements referred to above present fairly, in all material respects, the financial position of NRG Energy, Inc. and subsidiaries as of December 31, 2016 and 2015, and the results of their operations and their cash flows for each of the years in the three‑year period ended December 31, 2016, in conformity with U.S. generally accepted accounting principles. Also in our opinion, the related financial statement schedule, when considered in relation to the basic consolidated financial statements taken as a whole, present fairly, in all material respects, the information set forth therein.
We also have audited, in accordance with the standards of the Public Company Accounting Oversight Board (United States), NRG Energy, Inc.’s internal control over financial reporting as of December 31, 2016, based on criteria established in
Internal Control - Integrated Framework (2013)
issued by the Committee of Sponsoring Organizations of the Treadway Commission (COSO), and our report dated February 28, 2017 expressed an unqualified opinion on the effectiveness of the Company’s internal control over financial reporting.
As disclosed in Note 12,
Debt and Capital Leases
, to the consolidated financial statements, as of December 31, 2016, $691 million of senior notes issued by GenOn Energy, Inc. (GenOn), a consolidated subsidiary, are classified as current within the consolidated balance sheet and are due on June 15, 2017. GenOn’s future profitability continues to be adversely affected by (i) a sustained decline in natural gas prices and its resulting effect on wholesale power prices and capacity prices, and (ii) the inability of certain of its subsidiaries to make distributions of cash and certain other restricted payments to GenOn. Based on current projections, GenOn is not expected to have sufficient liquidity exclusive of cash subject to the restrictions under certain of its subsidiaries’ operating leases to satisfy the senior notes due in June 2017. As a result of these factors, there is no assurance GenOn will continue as a going concern. GenOn and its consolidated subsidiaries represents total assets constituting 16 percent and 17 percent in 2016 and 2015 and total revenues constituting 15 percent, 16 percent and 19 percent in 2016, 2015 and 2014, respectively, of the related consolidated totals.
(signed) KPMG LLP
Philadelphia, Pennsylvania
February 28, 2017
131
NRG ENERGY, INC. AND SUBSIDIARIES
|
|
For the Year Ended December 31,
|
||||||||||
|
(In millions, except per share amounts)
|
2016
|
2015
|
2014
|
||||||||
|
Operating Revenues
|
|
||||||||||
|
Total operating revenues
|
$
|
12,351
|
|
|
$
|
14,674
|
|
|
$
|
15,868
|
|
|
Operating Costs and Expenses
|
|
||||||||||
|
Cost of operations
|
8,555
|
|
|
10,784
|
|
|
11,808
|
|
|||
|
Depreciation and amortization
|
1,367
|
|
|
1,566
|
|
|
1,523
|
|
|||
|
Impairment losses
|
918
|
|
5,030
|
|
97
|
|
|||||
|
Selling, general and administrative
|
1,101
|
|
|
1,199
|
|
1,016
|
|
||||
|
Acquisition-related transaction and integration costs
|
8
|
|
|
10
|
|
84
|
|
||||
|
Development costs
|
90
|
|
|
146
|
|
88
|
|
||||
|
Total operating costs and expenses
|
12,039
|
|
18,735
|
|
14,616
|
|
|||||
|
Gain on sale of assets
|
215
|
|
—
|
|
19
|
|
|||||
|
Gain on postretirement benefits curtailment
|
—
|
|
|
21
|
|
|
—
|
|
|||
|
Operating Income/(Loss)
|
527
|
|
(4,040
|
)
|
1,271
|
|
|||||
|
Other Income/(Expense)
|
|
||||||||||
|
Equity in earnings of unconsolidated affiliates
|
27
|
|
|
36
|
|
38
|
|
||||
|
Impairment losses on investments
|
(268
|
)
|
|
(56
|
)
|
—
|
|
||||
|
Other income, net
|
42
|
|
|
33
|
|
22
|
|
||||
|
(Loss)/gain on sale of equity method investment
|
—
|
|
(14
|
)
|
18
|
|
|||||
|
Net (loss)/gain on debt extinguishment
|
(142
|
)
|
|
75
|
|
(95
|
)
|
||||
|
Interest expense
|
(1,061
|
)
|
|
(1,128
|
)
|
(1,119
|
)
|
||||
|
Total other expense
|
(1,402
|
)
|
(1,054
|
)
|
(1,136
|
)
|
|||||
|
(Loss)/Income Before Income Taxes
|
(875
|
)
|
|
(5,094
|
)
|
|
135
|
|
|||
|
Income tax expense
|
16
|
|
|
1,342
|
|
|
3
|
|
|||
|
Net (Loss)/Income
|
(891
|
)
|
|
(6,436
|
)
|
|
132
|
|
|||
|
Less: Net loss attributable to noncontrolling interests and redeemable noncontrolling interests
|
(117
|
)
|
|
(54
|
)
|
|
(2
|
)
|
|||
|
Net (Loss)/Income Attributable to NRG Energy, Inc.
|
(774
|
)
|
|
(6,382
|
)
|
|
134
|
|
|||
|
Dividends for preferred shares
|
5
|
|
|
20
|
|
|
56
|
|
|||
|
Gain on redemption of preferred shares
|
(78
|
)
|
|
—
|
|
|
—
|
|
|||
|
(Loss)/Income Available for Common Stockholders
|
$
|
(701
|
)
|
$
|
(6,402
|
)
|
$
|
78
|
|
||
|
(Loss)/Earnings Per Share Attributable to NRG Energy, Inc. Common Stockholders
|
|||||||||||
|
Weighted average number of common shares outstanding — basic
|
316
|
|
329
|
|
334
|
|
|||||
|
Net (Loss)/Income per Weighted Average Common Share — Basic
|
$
|
(2.22
|
)
|
$
|
(19.46
|
)
|
$
|
0.23
|
|
||
|
Weighted average number of common shares outstanding — diluted
|
316
|
|
329
|
|
339
|
|
|||||
|
Net (Loss)/Income per Weighted Average Common Share — Diluted
|
$
|
(2.22
|
)
|
$
|
(19.46
|
)
|
$
|
0.23
|
|
||
|
Dividends Per Common Share
|
$
|
0.24
|
|
|
$
|
0.58
|
|
|
$
|
0.54
|
|
See notes to Consolidated Financial Statements.
132
NRG ENERGY, INC. AND SUBSIDIARIES
CONSOLIDATED STATEMENTS OF COMPREHENSIVE (LOSS)/INCOME
|
For the Year Ended December 31,
|
|||||||||||
|
2016
|
2015
|
2014
|
|||||||||
|
(In millions)
|
|||||||||||
|
Net (Loss)/Income
|
$
|
(891
|
)
|
$
|
(6,436
|
)
|
$
|
132
|
|
||
|
Other Comprehensive Income/(Loss), net of tax
|
|
||||||||||
|
Unrealized gain/(loss) on derivatives, net of income tax expense/(benefit) of $1, $19, and $(21)
|
35
|
|
(15
|
)
|
(45
|
)
|
|||||
|
Foreign currency translation adjustments, net of income tax benefit of $0, $0, and $5
|
(1
|
)
|
(11
|
)
|
(8
|
)
|
|||||
|
Available-for-sale securities, net of income tax benefit of $0, $3, and $2
|
1
|
|
17
|
|
(7
|
)
|
|||||
|
Defined benefit plan, net of income tax expense/(benefit) of $0, $69, and $(88)
|
3
|
|
10
|
|
(129
|
)
|
|||||
|
Other comprehensive income/(loss)
|
38
|
|
1
|
|
(189
|
)
|
|||||
|
Comprehensive Loss
|
(853
|
)
|
(6,435
|
)
|
(57
|
)
|
|||||
|
Less: Comprehensive (loss)/income attributable to noncontrolling interests and redeemable noncontrolling interests
|
(117
|
)
|
(73
|
)
|
8
|
|
|||||
|
Comprehensive Loss Attributable to NRG Energy, Inc.
|
(736
|
)
|
(6,362
|
)
|
(65
|
)
|
|||||
|
Dividends for preferred shares
|
5
|
|
|
20
|
|
|
56
|
|
|||
|
Gain on redemption of preferred shares
|
(78
|
)
|
—
|
|
—
|
|
|||||
|
Comprehensive Loss Available for Common Stockholders
|
$
|
(663
|
)
|
$
|
(6,382
|
)
|
$
|
(121
|
)
|
||
See notes to Consolidated Financial Statements.
133
NRG ENERGY, INC. AND SUBSIDIARIES
|
|
As of December 31,
|
||||||
|
|
2016
|
2015
|
|||||
|
|
(In millions)
|
||||||
|
ASSETS
|
|
|
|||||
|
Current Assets
|
|
|
|||||
|
Cash and cash equivalents
|
$
|
1,973
|
|
|
$
|
1,518
|
|
|
Funds deposited by counterparties
|
2
|
|
106
|
|
|||
|
Restricted cash
|
446
|
|
414
|
|
|||
|
Accounts receivable — trade
|
1,166
|
|
1,157
|
|
|||
|
Inventory
|
1,111
|
|
|
1,252
|
|
||
|
Derivative instruments
|
1,062
|
|
1,915
|
|
|||
|
Cash collateral posted in support of energy risk management activities
|
203
|
|
568
|
|
|||
|
Current assets held-for-sale
|
9
|
|
6
|
|
|||
|
Prepayments and other current assets
|
423
|
|
455
|
|
|||
|
Total current assets
|
6,395
|
|
7,391
|
|
|||
|
Property, plant and equipment, net
|
17,912
|
|
|
18,732
|
|
||
|
Other Assets
|
|
||||||
|
Equity investments in affiliates
|
1,120
|
|
1,045
|
|
|||
|
Notes receivable, less current portion
|
17
|
|
|
53
|
|
||
|
Goodwill
|
662
|
|
999
|
|
|||
|
Intangible assets, net
|
2,036
|
|
|
2,310
|
|
||
|
Nuclear decommissioning trust fund
|
610
|
|
561
|
|
|||
|
Derivative instruments
|
189
|
|
305
|
|
|||
|
Deferred income taxes
|
225
|
|
|
167
|
|
||
|
Non-current assets held-for-sale
|
10
|
|
105
|
|
|||
|
Other non-current assets
|
1,179
|
|
1,214
|
|
|||
|
Total other assets
|
6,048
|
|
6,759
|
|
|||
|
Total Assets
|
$
|
30,355
|
|
$
|
32,882
|
|
|
See notes to Consolidated Financial Statements.
134
NRG ENERGY, INC. AND SUBSIDIARIES
CONSOLIDATED BALANCE SHEETS (Continued)
|
|
As of December 31,
|
||||||
|
|
2016
|
2015
|
|||||
|
|
(In millions, except share data)
|
||||||
|
LIABILITIES AND STOCKHOLDERS' EQUITY
|
|
|
|||||
|
Current Liabilities
|
|
||||||
|
Current portion of long-term debt and capital leases
|
$
|
1,220
|
|
|
$
|
481
|
|
|
Accounts payable
|
895
|
|
869
|
|
|||
|
Derivative instruments
|
1,084
|
|
|
1,721
|
|
||
|
Cash collateral received in support of energy risk management activities
|
2
|
|
106
|
|
|||
|
Accrued interest expense
|
220
|
|
242
|
|
|||
|
Other accrued expenses
|
543
|
|
568
|
|
|||
|
Current liabilities held-for-sale
|
—
|
|
2
|
|
|||
|
Other current liabilities
|
418
|
|
386
|
|
|||
|
Total current liabilities
|
4,382
|
|
4,375
|
|
|||
|
Other Liabilities
|
|
||||||
|
Long-term debt and capital leases
|
18,006
|
|
|
18,983
|
|
||
|
Nuclear decommissioning reserve
|
287
|
|
326
|
|
|||
|
Nuclear decommissioning trust liability
|
339
|
|
283
|
|
|||
|
Postretirement and other benefit obligations
|
553
|
|
588
|
|
|||
|
Deferred income taxes
|
20
|
|
|
19
|
|
||
|
Derivative instruments
|
294
|
|
|
493
|
|
||
|
Out-of-market contracts, net
|
1,040
|
|
1,146
|
|
|||
|
Non-current liabilities held-for-sale
|
12
|
|
4
|
|
|||
|
Other non-current liabilities
|
930
|
|
900
|
|
|||
|
Total non-current liabilities
|
21,481
|
|
22,742
|
|
|||
|
Total Liabilities
|
25,863
|
|
27,117
|
|
|||
|
2.822% convertible perpetual preferred stock; $0.01 par value; 250,000 shares issued and outstanding at December 31, 2015
|
—
|
|
302
|
|
|||
|
Redeemable noncontrolling interest in subsidiaries
|
46
|
|
29
|
|
|||
|
Commitments and Contingencies
|
|||||||
|
Stockholders' Equity
|
|||||||
|
Common stock; $0.01 par value; 500,000,000 shares authorized; 417,583,825 and 416,939,950 shares issued; and 315,443,011 and 314,190,042 shares outstanding at December 31, 2016 and 2015
|
4
|
|
4
|
|
|||
|
Additional paid-in capital
|
8,358
|
|
8,296
|
|
|||
|
Accumulated deficit
|
(3,787
|
)
|
(3,007
|
)
|
|||
|
Treasury stock, at cost; 102,140,814 and 102,749,908 shares at December 31, 2016 and 2015
|
(2,399
|
)
|
(2,413
|
)
|
|||
|
Accumulated other comprehensive loss
|
(135
|
)
|
(173
|
)
|
|||
|
Noncontrolling interest
|
2,405
|
|
2,727
|
|
|||
|
Total Stockholders' Equity
|
4,446
|
|
5,434
|
|
|||
|
Total Liabilities and Stockholders' Equity
|
$
|
30,355
|
|
$
|
32,882
|
|
|
See notes to Consolidated Financial Statements.
135
NRG ENERGY, INC. AND SUBSIDIARIES
|
|
For the Year Ended December 31,
|
||||||||||
|
|
2016
|
2015
|
2014
|
||||||||
|
(In millions)
|
|||||||||||
|
Cash Flows from Operating Activities
|
|
|
|
||||||||
|
Net (loss)/income
|
$
|
(891
|
)
|
$
|
(6,436
|
)
|
$
|
132
|
|
||
|
Adjustments to reconcile net income/(loss) to net cash provided by operating activities:
|
|
|
|
||||||||
|
Equity in earnings and distribution of unconsolidated affiliates
|
54
|
|
|
37
|
|
49
|
|
||||
|
Depreciation and amortization
|
1,367
|
|
1,566
|
|
1,523
|
|
|||||
|
Provision for bad debts
|
48
|
|
64
|
|
64
|
|
|||||
|
Amortization of nuclear fuel
|
49
|
|
45
|
|
46
|
|
|||||
|
Amortization of financing costs and debt discount/premiums
|
3
|
|
(11
|
)
|
(12
|
)
|
|||||
|
Adjustment to loss/(gain) on debt extinguishment
|
21
|
|
(75
|
)
|
25
|
|
|||||
|
Amortization of intangibles and out-of-market contracts
|
91
|
|
81
|
|
64
|
|
|||||
|
Amortization of unearned equity compensation
|
10
|
|
41
|
|
42
|
|
|||||
|
Net (gain)/loss on sale of assets and equity method investments
|
(224
|
)
|
14
|
|
(4
|
)
|
|||||
|
Gain on post retirement benefits curtailment
|
—
|
|
|
(21
|
)
|
|
—
|
|
|||
|
Impairment losses
|
1,186
|
|
5,086
|
|
97
|
|
|||||
|
Changes in derivative instruments
|
23
|
|
233
|
|
(61
|
)
|
|||||
|
Changes in deferred income taxes and liability for uncertain tax benefits
|
(43
|
)
|
1,326
|
|
(154
|
)
|
|||||
|
Changes in collateral deposits in support of risk management activities
|
365
|
|
(381
|
)
|
146
|
|
|||||
|
Proceeds from sale of emission allowances
|
47
|
|
|
—
|
|
|
—
|
|
|||
|
Changes in nuclear decommissioning trust liability
|
41
|
|
(2
|
)
|
19
|
|
|||||
|
Cash provided/(used) by changes in other working capital, net of acquisition and disposition effects:
|
|||||||||||
|
Accounts receivable - trade
|
(12
|
)
|
136
|
|
(2
|
)
|
|||||
|
Inventory
|
134
|
|
(26
|
)
|
(245
|
)
|
|||||
|
Prepayments and other current assets
|
(39
|
)
|
8
|
|
36
|
|
|||||
|
Accounts payable
|
(27
|
)
|
(218
|
)
|
(12
|
)
|
|||||
|
Accrued expenses and other current liabilities
|
(39
|
)
|
(9
|
)
|
(26
|
)
|
|||||
|
Other assets and liabilities
|
(92
|
)
|
(149
|
)
|
(217
|
)
|
|||||
|
Net Cash Provided by Operating Activities
|
2,072
|
|
1,309
|
|
1,510
|
|
|||||
|
Cash Flows from Investing Activities
|
|
|
|
||||||||
|
Acquisition of businesses, net of cash acquired
|
(209
|
)
|
(31
|
)
|
(2,936
|
)
|
|||||
|
Capital expenditures
|
(1,244
|
)
|
(1,283
|
)
|
(909
|
)
|
|||||
|
(Increase)/decrease in restricted cash, net
|
(29
|
)
|
8
|
|
57
|
|
|||||
|
(Increase)/decrease in restricted cash to support equity requirements for U.S. DOE funded projects
|
(3
|
)
|
35
|
|
(206
|
)
|
|||||
|
Net cash proceeds from notes receivable
|
17
|
|
18
|
|
25
|
|
|||||
|
Proceeds from renewable energy grants
|
36
|
|
82
|
|
916
|
|
|||||
|
Purchases of emission allowances, net of proceeds
|
(1
|
)
|
41
|
|
(16
|
)
|
|||||
|
Investments in nuclear decommissioning trust fund securities
|
(551
|
)
|
(629
|
)
|
(619
|
)
|
|||||
|
Proceeds from sales of nuclear decommissioning trust fund securities
|
510
|
|
631
|
|
600
|
|
|||||
|
Proceeds from sale of assets, net
|
636
|
|
27
|
|
203
|
|
|||||
|
Investments in unconsolidated affiliates
|
(34
|
)
|
(395
|
)
|
(103
|
)
|
|||||
|
Other
|
48
|
|
11
|
|
85
|
|
|||||
|
Net Cash Used by Investing Activities
|
(824
|
)
|
(1,485
|
)
|
(2,903
|
)
|
|||||
|
Cash Flows from Financing Activities
|
|
|
|
||||||||
|
Payments of dividends to preferred and common stockholders
|
(76
|
)
|
(201
|
)
|
(196
|
)
|
|||||
|
Net receipts from settlement of acquired derivatives that include financing elements
|
151
|
|
196
|
|
9
|
|
|||||
|
Payments for treasury stock
|
—
|
|
(437
|
)
|
(39
|
)
|
|||||
|
Payments for preferred shares
|
(226
|
)
|
|
—
|
|
|
—
|
|
|||
|
Distributions from, net of contributions to, noncontrolling interests in subsidiaries
|
(156
|
)
|
47
|
|
189
|
|
|||||
|
Proceeds from sale of noncontrolling interests in subsidiaries
|
—
|
|
|
600
|
|
|
630
|
|
|||
|
Proceeds from issuance of common stock
|
1
|
|
1
|
|
21
|
|
|||||
|
Proceeds from issuance of long-term debt
|
5,527
|
|
1,004
|
|
4,563
|
|
|||||
|
Payments of debt issuance and hedging costs
|
(89
|
)
|
(21
|
)
|
(67
|
)
|
|||||
|
Payments for short and long-term debt
|
(5,913
|
)
|
(1,599
|
)
|
(3,827
|
)
|
|||||
|
Other
|
(13
|
)
|
(22
|
)
|
(18
|
)
|
|||||
|
Net Cash (Used)/Provided by Financing Activities
|
(794
|
)
|
(432
|
)
|
1,265
|
|
|||||
|
Effect of exchange rate changes on cash and cash equivalents
|
1
|
|
10
|
|
(10
|
)
|
|||||
|
Net Increase/(Decrease) in Cash and Cash Equivalents
|
455
|
|
(598
|
)
|
(138
|
)
|
|||||
|
Cash and Cash Equivalents at Beginning of Period
|
1,518
|
|
2,116
|
|
2,254
|
|
|||||
|
Cash and Cash Equivalents at End of Period
|
$
|
1,973
|
|
$
|
1,518
|
|
$
|
2,116
|
|
||
See notes to Consolidated Financial Statements.
136
NRG ENERGY, INC. AND SUBSIDIARIES
CONSOLIDATED STATEMENT OF STOCKHOLDERS' EQUITY
|
Common
Stock
|
Additional
Paid-In
Capital
|
Retained
Earnings/ (Accumu-lated Deficit)
|
Treasury
Stock
|
Accumulated
Other
Comprehensive
Income/(Loss)
|
Noncon- trolling
Interest
|
Total
Stock-holders'
Equity
|
|||||||||||||||||||||
|
(In millions)
|
|||||||||||||||||||||||||||
|
Balances at December 31, 2013
|
$
|
4
|
|
$
|
7,840
|
|
$
|
3,695
|
|
$
|
(1,942
|
)
|
$
|
5
|
|
$
|
865
|
|
10,467
|
|
|||||||
|
Net income
|
134
|
|
17
|
|
151
|
|
|||||||||||||||||||||
|
Other comprehensive loss
|
(179
|
)
|
(179
|
)
|
|||||||||||||||||||||||
|
Issuance of shares for acquisition of EME
|
401
|
|
401
|
|
|||||||||||||||||||||||
|
Acquisition of EME noncontrolling interests
|
352
|
|
352
|
|
|||||||||||||||||||||||
|
Distributions to noncontrolling interests
|
(57
|
)
|
(57
|
)
|
|||||||||||||||||||||||
|
Equity-based compensation
|
45
|
|
45
|
|
|||||||||||||||||||||||
|
Purchase of treasury stock
|
(44
|
)
|
(44
|
)
|
|||||||||||||||||||||||
|
Preferred stock dividends
|
(9
|
)
|
(9
|
)
|
|||||||||||||||||||||||
|
Common stock dividends
|
(181
|
)
|
(181
|
)
|
|||||||||||||||||||||||
|
ESPP share purchases
|
(4
|
)
|
3
|
|
(1
|
)
|
|||||||||||||||||||||
|
Sale of assets to NRG Yield, Inc.
|
41
|
|
(41
|
)
|
—
|
|
|||||||||||||||||||||
|
Dividend for refinancing of preferred stock
|
(47
|
)
|
(47
|
)
|
|||||||||||||||||||||||
|
Equity component of NRG Yield, Inc. convertible notes
|
23
|
|
23
|
|
|||||||||||||||||||||||
|
Impact of NRG Yield, Inc. public offering
|
|
|
630
|
|
630
|
|
|||||||||||||||||||||
|
Sales proceeds and other contributions from noncontrolling interests
|
125
|
|
125
|
|
|||||||||||||||||||||||
|
Balances at December 31, 2014
|
$
|
4
|
|
$
|
8,327
|
|
$
|
3,588
|
|
$
|
(1,983
|
)
|
$
|
(174
|
)
|
$
|
1,914
|
|
$
|
11,676
|
|
||||||
|
Net loss
|
(6,382
|
)
|
(37
|
)
|
(6,419
|
)
|
|||||||||||||||||||||
|
Other comprehensive income/(loss)
|
1
|
|
(4
|
)
|
(3
|
)
|
|||||||||||||||||||||
|
Sale of assets to NRG Yield, Inc.
|
(56
|
)
|
83
|
|
27
|
|
|||||||||||||||||||||
|
ESPP share purchases
|
(1
|
)
|
7
|
|
6
|
|
|||||||||||||||||||||
|
Equity-based compensation
|
26
|
|
(2
|
)
|
24
|
|
|||||||||||||||||||||
|
Purchase of treasury stock
|
(437
|
)
|
(437
|
)
|
|||||||||||||||||||||||
|
Common stock dividends
|
(191
|
)
|
(191
|
)
|
|||||||||||||||||||||||
|
Preferred stock dividends
|
(20
|
)
|
(20
|
)
|
|||||||||||||||||||||||
|
Distributions to noncontrolling interests
|
(159
|
)
|
(159
|
)
|
|||||||||||||||||||||||
|
Contributions from noncontrolling interests
|
|
|
|
|
234
|
|
234
|
|
|||||||||||||||||||
|
Acquisition of noncontrolling interests by NRG Yield, Inc.
|
|
|
74
|
|
74
|
|
|||||||||||||||||||||
|
Impact of NRG Yield, Inc. public offering
|
|
|
599
|
|
599
|
|
|||||||||||||||||||||
|
Equity component of NRG Yield, Inc. convertible notes
|
23
|
|
23
|
|
|||||||||||||||||||||||
|
Balances at December 31, 2015
|
$
|
4
|
|
$
|
8,296
|
|
$
|
(3,007
|
)
|
$
|
(2,413
|
)
|
$
|
(173
|
)
|
$
|
2,727
|
|
$
|
5,434
|
|
||||||
|
Net loss
|
(774
|
)
|
(79
|
)
|
(853
|
)
|
|||||||||||||||||||||
|
Other comprehensive income
|
38
|
|
|
|
38
|
|
|||||||||||||||||||||
|
Sale of assets to NRG Yield, Inc.
|
59
|
|
(16
|
)
|
43
|
|
|||||||||||||||||||||
|
ESPP share purchases
|
(2
|
)
|
(6
|
)
|
14
|
|
6
|
|
|||||||||||||||||||
|
Equity-based compensation
|
5
|
|
1
|
|
6
|
|
|||||||||||||||||||||
|
Common stock dividends
|
(74
|
)
|
(74
|
)
|
|||||||||||||||||||||||
|
Dividend for preferred shares
|
(5
|
)
|
(5
|
)
|
|||||||||||||||||||||||
|
Gain on redemption of preferred shares
|
78
|
|
78
|
|
|||||||||||||||||||||||
|
Distributions to noncontrolling interests
|
(158
|
)
|
(158
|
)
|
|||||||||||||||||||||||
|
Dividends paid to NRG Yield, Inc.
|
(92
|
)
|
(92
|
)
|
|||||||||||||||||||||||
|
Contributions from noncontrolling interests
|
30
|
|
30
|
|
|||||||||||||||||||||||
|
Redemption of noncontrolling interests
|
(7
|
)
|
(7
|
)
|
|||||||||||||||||||||||
|
Balances at December 31, 2016
|
$
|
4
|
|
|
$
|
8,358
|
|
|
$
|
(3,787
|
)
|
|
$
|
(2,399
|
)
|
|
$
|
(135
|
)
|
|
$
|
2,405
|
|
|
$
|
4,446
|
|
See notes to Consolidated Financial Statements.
137
NRG ENERGY, INC. AND SUBSIDIARIES
NOTES TO CONSOLIDATED FINANCIAL STATEMENTS
Note 1
—
Nature of Business
General
NRG Energy, Inc., or NRG or the Company, is a leading integrated power company built on the strength of the nation's largest and most diverse competitive electric generation portfolio and leading retail electricity platform. NRG aims to create a sustainable energy future by producing, selling and delivering electricity and related products and services in major competitive power markets in the U.S. in a manner that delivers value to all of NRG's stakeholders. The Company owns and operates approximately
47,000
MW of generation; engages in the trading of wholesale energy, capacity and related products; transacts in and trades fuel and transportation services; and directly sells energy, services, and innovative, sustainable products and services to retail customers under the names “NRG”, "Reliant" and other retail brand names owned by NRG.
Generation consists of the Company’s wholesale operations, commercial operations, EPC operations, energy services and other critical related functions. NRG has traditionally referred to this business as its wholesale power generation business. In addition to the traditional functions from NRG’s wholesale power generation business, Generation also includes NRG’s business solutions, which include demand response, commodity sales, energy efficiency and energy management services, and NRG’s conventional distributed generation business, consisting of reliability, combined heat and power, thermal and district heating and cooling and large-scale distributed generation.
Retail is a consumer facing business that includes the Company’s residential retail and C&I business. Products and services range from retail energy, portable solar and battery products home services, and a variety of bundled products which combine energy with protection products, energy efficiency and renewable energy solutions as well as other distributed and reliability products.
Renewables operates the Company’s existing renewables business, including operation of the NRG Yield renewable assets. Renewables is also one of the largest solar and wind power developers and owner-operators in the U.S., having developed, constructed and financed a full range of solutions for utilities, schools, municipalities and commercial market segments.
GenOn Liquidity and Ability to Continue as a Going Concern
As disclosed in Note 12,
Debt and Capital Leases
,
$691 million
of GenOn's Senior Notes excluding
$8 million
of associated premiums, are current within the GenOn consolidated balance sheet as of December 31, 2016 and are due on June 15, 2017. GenOn's future profitability continues to be adversely affected by (i) a sustained decline in natural gas prices and its resulting effect on wholesale power prices and capacity prices, and (ii) the inability of GenOn Mid-Atlantic and REMA to make distributions of cash and certain other restricted payments to GenOn. Based on current projections, GenOn is not expected to have sufficient liquidity to repay the GenOn Senior Notes due in June 2017. As a result of these factors, there is substantial doubt about GenOn's ability to continue as a going concern. As a result of the substantial doubt about GenOn’s ability to continue as a going concern, along with additional factors, there is substantial doubt about certain of GenOn’s subsidiaries’ ability to continue as a going concern.
As of December 31, 2016, GenOn has cash and cash equivalents of
$1.0 billion
, of which
$471 million
and
$100 million
is held by GenOn Mid-Atlantic and REMA, respectively. Under their respective operating leases, GenOn Mid-Atlantic and REMA are not permitted to make any distributions and other restricted payments unless: (a) they satisfy the fixed charge coverage ratio for the most recently ended period for four fiscal quarters; (b) they are projected to satisfy the fixed charge coverage ratio for each of the two following periods of four fiscal quarters, commencing with the fiscal quarter in which such payment is proposed to be made; and (c) no significant lease default or event of default has occurred and is continuing. Additionally, GenOn Mid-Atlantic and REMA must be in compliance with the requirement to provide credit support to the owner lessors securing their obligations to pay scheduled rent under their respective leases. As a result, GenOn Mid-Atlantic has not been able to make distributions of cash and certain other restricted payments since the quarter ended March 31, 2014 which was the last quarterly period for which GenOn Mid-Atlantic satisfied the conditions under its operating agreement. REMA has not satisfied the conditions under its operating agreement to make distributions of cash and certain other restricted payments since 2009.
NRG, GenOn's parent company, has no obligation to provide any financial support to GenOn other than under the secured intercompany revolving credit agreement between NRG and GenOn and NRG Americas. As of December 31, 2016,
$228 million
was available to be used by GenOn under the
$500 million
revolving credit agreement. As controlled group members, ERISA requires that NRG and GenOn are jointly and severally liable for the NRG Pension Plan for Bargained Employees and the NRG Pension Plan, including the pension liabilities associated with GenOn employees.
GenOn is currently considering all options available to it, including negotiations with creditors, refinancing the GenOn Senior Notes, potential sales of certain generating assets as well as the possibility for a need to file for protection under Chapter 11 of the U.S. Bankruptcy Code. During 2016, GenOn appointed two independent directors, retained advisors and established a separate audit committee as part of this process. Any resolution may have a material impact on the Company's statement of operations, cash flows and financial position.
As of December 31, 2016, GenOn represents
15.6%
of the Company's consolidated total assets,
16.9%
of the Company's consolidated total liabilities and contributed
$94 million
to the Company's consolidated cash from operations in 2016.
NRG Yield, Inc. Ownership
In 2013, the Company formed NRG Yield, Inc. to own and operate a portfolio of contracted generation assets and thermal infrastructure assets that have historically been owned and/or operated by NRG and its subsidiaries. In 2013 and 2014, NRG Yield, Inc. issued Class A common stock to its public shareholders and utilized the proceeds to acquire a controlling interest in NRG Yield LLC, through its ownership of Class A units. At that time, the Company owned the Class B common stock of NRG Yield, Inc. and the Class B units of NRG Yield LLC. On May 14, 2015, NRG Yield, Inc. completed a stock split in connection with which each outstanding share of Class A common stock was split into one share of Class A common stock and one share of Class C common stock, and each outstanding share of Class B common stock was split into one share of Class B common stock and one share of Class D common stock. A similar split was effected at NRG Yield LLC with respect to its member units. The Company consolidates NRG Yield, Inc. for financial reporting purposes as it maintains a controlling voting interest, and presents the public ownership of the Class A and Class C common stock as noncontrolling interest. The Company receives distributions from NRG Yield LLC, through its ownership of Class B and Class D units.
The following table represents the structure of NRG Yield, Inc. as of
December 31, 2016
:
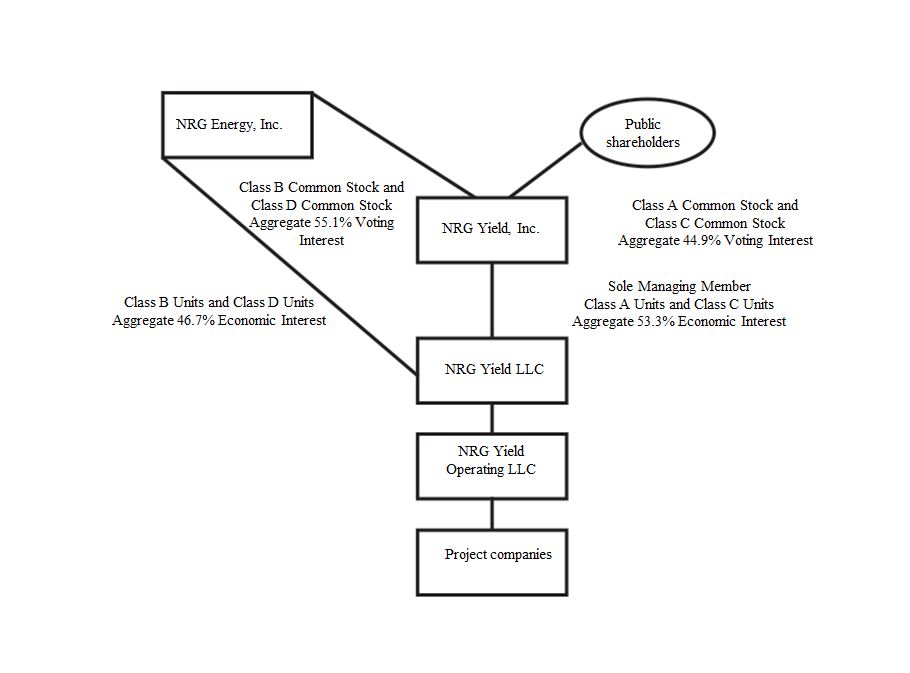
138
Note 2
—
Summary of Significant Accounting Policies
Basis of Presentation and Principles of Consolidation
The Company's consolidated financial statements have been prepared in accordance with GAAP. The ASC, established by the FASB, is the source of authoritative GAAP to be applied by nongovernmental entities. In addition, the rules and interpretative releases of the SEC under authority of federal securities laws are also sources of authoritative GAAP for SEC registrants.
The consolidated financial statements include NRG's accounts and operations and those of its subsidiaries in which the Company has a controlling interest. All significant intercompany transactions and balances have been eliminated in consolidation. The usual condition for a controlling financial interest is ownership of a majority of the voting interests of an entity. However, a controlling financial interest may also exist through arrangements that do not involve controlling voting interests. As such, NRG applies the guidance of ASC 810,
Consolidations,
or ASC 810, to determine when an entity that is insufficiently capitalized or not controlled through its voting interests, referred to as a VIE, should be consolidated.
Segment Reporting
The Company's businesses are segregated as follows: Generation (previously named Generation/Business), which includes generation, international and BETM (previously part of Corporate); Retail which includes Mass customers (previously Retail Mass), and Business Solutions, which includes C&I customers and other distributed and reliability products (previously in the Generation segment); Renewables (previously named NRG Renew), which includes solar and wind assets, excluding those in NRG Yield; NRG Yield; and corporate activities. The Company's corporate segment include residential solar (previously part of NRG Home) and electric vehicle services. During 2016, the Company began reporting the results of its residential solar business in its corporate segment and its international business in its Generation segment. The Company's segment structure and its allocation of corporate expenses were updated to reflect how management makes financial decisions and allocates resources. The Company has recast data from prior periods to reflect this change in reportable segments to conform to the current year presentation.
Cash and Cash Equivalents
Cash and cash equivalents include highly liquid investments with an original maturity of three months or less at the time of purchase.
Funds Deposited by Counterparties
Funds deposited by counterparties consist of cash held by the Company as a result of collateral posting obligations from its counterparties. Some amounts are segregated into separate accounts that are not contractually restricted but, based on the Company's intention, are not available for the payment of general corporate obligations. Depending on market fluctuations and the settlement of the underlying contracts, the Company will refund this collateral to the hedge counterparties pursuant to the terms and conditions of the underlying trades. Since collateral requirements fluctuate daily and the Company cannot predict if any collateral will be held for more than
twelve
months, the funds deposited by counterparties are classified as a current asset on the Company's balance sheet, with an offsetting liability for this cash collateral received within current liabilities. Changes in funds deposited by counterparties are closely associated with the Company's operating activities and are classified as an operating activity in the Company's consolidated statements of cash flows.
Restricted Cash
Restricted cash consists primarily of funds held to satisfy the requirements of certain debt agreements and funds held within the Company's projects that are restricted in their use. Of these funds, as of December 31, 2016, approximately
$53 million
is designated for current debt service payments,
$51 million
is designated to fund operating expenses, and
$58 million
is designated to fund distributions, with the remaining
$284 million
restricted for reserves including debt service, performance obligations and other reserves, as well as capital expenditures.
139
Trade Receivables and Allowance for Doubtful Accounts
Trade receivables are reported in the balance sheet at outstanding principal adjusted for any write-offs and the allowance for doubtful accounts. For its retail business, the Company accrues an allowance for doubtful accounts based on estimates of uncollectible revenues by analyzing counterparty credit ratings (for commercial and industrial customers), historical collections, accounts receivable aging and other factors. The retail business writes-off accounts receivable balances against the allowance for doubtful accounts when it determines a receivable is uncollectible. In addition, the Company considers a reserve for doubtful accounts based on the credit worthiness of the customers and continually reviews and adjusts for current economic trends that might impact the level of future credit losses. The reserve represents management's best estimate of uncollectible amounts. As of December 31, 2016 and 2015, the allowance for doubtful accounts was
$30 million
and
$21 million
, respectively.
Inventory
Inventory is valued at the lower of weighted average cost or market, and consists principally of fuel oil, coal and raw materials used to generate electricity or steam. The Company removes these inventories as they are used in the production of electricity or steam. Spare parts inventory is valued at weighted average cost. The Company removes these inventories when they are used for repairs, maintenance or capital projects. The Company expects to recover the fuel oil, coal, raw materials, and spare parts costs in the ordinary course of business. Finished goods inventory is valued at the lower of cost or net realizable value with cost being determined on a first-in first-out basis. The Company removes these inventories as they are sold to customers. Sales of inventory are classified as an operating activity in the consolidated statements of cash flows.
Property, Plant and Equipment
Property, plant and equipment are stated at cost or, in the case of business acquisitions, fair value; however, impairment adjustments are recorded whenever events or changes in circumstances indicate that their carrying values may not be recoverable. See
Note 3
,
Business Acquisitions and Dispositions
,
for more information on acquired property, plant and equipment. NRG also classifies nuclear fuel related to the Company's
44%
ownership interest in STP as part of the Company's property, plant, and equipment. Significant additions or improvements extending asset lives are capitalized as incurred, while repairs and maintenance that do not improve or extend the life of the respective asset are charged to expense as incurred. Depreciation, other than nuclear fuel, is computed using the straight-line method, while nuclear fuel is amortized based on units of production over the estimated useful lives. Certain assets and their related accumulated depreciation amounts are adjusted for asset retirements and disposals with the resulting gain or loss included in cost of operations in the consolidated statements of operations.
Asset Impairments
Long-lived assets that are held and used are reviewed for impairment whenever events or changes in circumstances indicate carrying values may not be recoverable. Such reviews are performed in accordance with ASC 360. An impairment loss is indicated if the total future estimated undiscounted cash flows expected from an asset are less than its carrying value. An impairment charge is measured by the difference between an asset's carrying amount and fair value with the difference recorded in operating costs and expenses in the consolidated statements of operations. Fair values are determined by a variety of valuation methods, including third-party appraisals, sales prices of similar assets, and present value techniques.
Investments accounted for by the equity method are reviewed for impairment in accordance with ASC 323,
Investments-Equity Method and Joint Ventures
, or ASC 323, which requires that a loss in value of an investment that is an other-than-temporary decline should be recognized. The Company identifies and measures losses in the value of equity method investments based upon a comparison of fair value to carrying value.
For further discussion of these matters, refer to
Note 10
,
Asset Impairments
.
Development Costs and Capitalized Interest
Development costs include project development costs, which are expensed in the preliminary stages of a project and capitalized when the project is deemed to be commercially viable. Commercial viability is determined by one or a series of actions including, among others, Board of Director approval pursuant to a formal project plan that subjects the Company to significant future obligations that can only be discharged by the use of a Company asset. When a project is available for operations, capitalized interest, and capitalized project development costs are reclassified to property, plant and equipment and depreciated on a straight-line basis over the estimated useful life of the project's related assets. Capitalized costs are charged to expense if a project is abandoned or management otherwise determines the costs to be unrecoverable.
Interest incurred on funds borrowed to finance capital projects is capitalized until the project under construction is ready for its intended use. The amount of interest capitalized for the years ended
December 31, 2016
,
2015
, and
2014
, was
$43 million
,
$30 million
, and
$29 million
, respectively.
140
Debt Issuance Costs
Debt issuance costs are capitalized and amortized as interest expense on a basis which approximates the effective interest method over the term of the related debt. Debt issuance costs are presented as a direct deduction from the carrying amount of the related debt.
Intangible Assets
Intangible assets represent contractual rights held by the Company. The Company recognizes specifically identifiable intangible assets including customer contracts, customer relationships, energy supply contracts, marketing partnerships, power purchase agreements, trade names, emission allowances, and fuel contracts when specific rights and contracts are acquired. In addition, the Company also established values for emission allowances and power contracts upon adoption of Fresh Start reporting. These intangible assets are amortized based on expected volumes, expected delivery, expected discounted future net cash flows, straight line or units of production basis. As of December 31, 2016 and 2015, the Company had accumulated amortization related to its intangible assets of
$1.8 billion
and
$1.5 billion
, respectively.
Intangible assets determined to have indefinite lives are not amortized, but rather are tested for impairment at least annually or more frequently if events or changes in circumstances indicate that such acquired intangible assets have been determined to have finite lives and should now be amortized over their useful lives. NRG had
no
intangible assets with indefinite lives recorded as of
December 31, 2016
.
Emission allowances held-for-sale, which are included in other non-current assets on the Company's consolidated balance sheet, are not amortized; they are carried at the lower of cost or fair value and reviewed for impairment in accordance with ASC 360.
Goodwill
In accordance with ASC 350, the Company recognizes goodwill for the excess cost of an acquired entity over the net value assigned to assets acquired and liabilities assumed. NRG performs goodwill impairment tests annually, during the fourth quarter, and when events or changes in circumstances indicate that the carrying value may not be recoverable.
The Company first assesses qualitative factors to determine whether it is more likely than not that the fair value of a reporting unit is less than its carrying amount as a basis for determining whether it is necessary to perform the two-step goodwill impairment test. The more-likely-than-not threshold is defined as having a likelihood of more than 50 percent.
In the absence of sufficient qualitative factors, goodwill impairment is determined using a two-step process:
|
|
Step one —
|
Identify potential impairment by comparing the fair value of a reporting unit to the book value, including goodwill. If the fair value exceeds book value, goodwill of the reporting unit is not considered impaired. If the book value exceeds fair value, proceed to step two.
|
|
|
Step two —
|
Compare the implied fair value of the reporting unit's goodwill to the book value of the reporting unit goodwill. If the book value of goodwill exceeds the implied fair value, an impairment charge is recognized for the excess.
|
For further discussion of goodwill and goodwill impairment losses recognized during 2016 and 2015, refer to
Note 11
,
Goodwill and Other Intangibles
.
Income Taxes
The Company accounts for income taxes using the liability method in accordance with ASC 740, which requires that the Company use the asset and liability method of accounting for deferred income taxes and provide deferred income taxes for all significant temporary differences.
The Company has two categories of income tax expense or benefit — current and deferred, as follows:
|
•
|
Current income tax expense or benefit consists solely of current taxes payable less applicable tax credits, and
|
|
•
|
Deferred income tax expense or benefit is the change in the net deferred income tax asset or liability, excluding amounts charged or credited to accumulated other comprehensive income.
|
141
The Company reports some of its revenues and expenses differently for financial statement purposes than for income tax return purposes, resulting in temporary and permanent differences between the Company's financial statements and income tax returns. The tax effects of such temporary differences are recorded as either deferred income tax assets or deferred income tax liabilities in the Company's consolidated balance sheets. The Company measures its deferred income tax assets and deferred income tax liabilities using income tax rates that are currently in effect. The Company believes it is more likely than not that the results of future operations will generate sufficient taxable income which includes the future reversal of existing taxable temporary differences to realize deferred tax assets, net of valuation allowances. In arriving at this conclusion to utilize projections of future profit before tax in its estimate of future taxable income, the Company considered the profit before tax generated in recent years. A valuation allowance is recorded to reduce the Company's net deferred tax assets to an amount that is more-likely-than-not to be realized.
The Company reduces its current income tax expense in the consolidated statement of operations for any investment tax credits, or ITCs, that are not convertible into cash grants, as well as other tax credits, in the period the tax credit is generated. ITCs that are convertible into cash grants, as well as the deferred income tax benefit generated by the difference in the financial statement and tax basis of the related assets, are recorded as a reduction to the carrying value of the underlying property and subsequently amortized to earnings on a straight-line basis over the useful life of each underlying property.
The Company accounts for uncertain tax positions in accordance with ASC 740, which applies to all tax positions related to income taxes. Under ASC 740, tax benefits are recognized when it is more-likely-than-not that a tax position will be sustained upon examination by the authorities. The benefit recognized from a position that has surpassed the more-likely-than-not threshold is the largest amount of benefit that is more than
50%
likely to be realized upon settlement. The Company recognizes interest and penalties accrued related to uncertain tax benefits as a component of income tax expense.
In accordance with ASC 805 and as discussed further in
Note 19
,
Income Taxes
, changes to existing net deferred tax assets or valuation allowances or changes to uncertain tax benefits, are recorded to income tax expense.
Revenue Recognition
Energy
— Both physical and financial transactions are entered into to optimize the financial performance of the Company's generating facilities. Electric energy revenue is recognized upon transmission to the customer. Physical transactions, or the sale of generated electricity to meet supply and demand, are recorded on a gross basis in the Company's consolidated statements of operations. Financial transactions, or the buying and selling of energy for trading purposes, are recorded net within operating revenues in the consolidated statements of operations in accordance with ASC 815.
Capacity
— Capacity revenues are recognized when contractually earned, and consist of revenues billed to a third party at either the market or a negotiated contract price for making installed generation capacity available in order to satisfy system integrity and reliability requirements.
Sale of Emission Allowances
— The Company records its bank of emission allowances as part of intangible assets. From time to time, management may authorize the transfer of emission allowances in excess of usage from the Company's emission bank to intangible assets held-for-sale for trading purposes. The Company records the sale of emission allowances on a net basis within operating revenue in the Company's consolidated statements of operations.
Contract Amortization
— Assets and liabilities recognized from power sales agreements assumed at Fresh Start and through acquisitions related to the sale of electric capacity and energy in future periods for which the fair value has been determined to be significantly less (more) than market are amortized to revenue over the term of each underlying contract based on actual generation and/or contracted volumes.
Retail revenues
— Gross revenues for energy sales and services to retail customers are recognized upon delivery under the accrual method. Energy sales and services that have been delivered but not billed by period end are estimated. Gross revenues also includes energy revenues from resales of purchased power, which were
$154 million
,
$165 million
and
$387 million
for the years ended
December 31, 2016
,
2015
, and
2014
, respectively. These revenues represent the sale of excess supply to third parties in the market.
Accrued unbilled revenues are based on estimates of customer usage since the date of the last meter reading provided by the independent system operators or electric distribution companies. Volume estimates are based on daily forecasted volumes and estimated customer usage by class. Unbilled revenues are calculated by multiplying these volume estimates by the applicable rate by customer class. Estimated amounts are adjusted when actual usage is known and billed. The Company recorded receivables for unbilled revenues of
$321 million
,
$309 million
and
$341 million
as of
December 31, 2016
,
2015
, and
2014
, respectively, for retail energy sales and services.
142
Consumer product revenues are recognized when title and risk of loss pass to the retailer, distributor, or end-customer and when all of the following have occurred: a firm sales agreement is in place, delivery has occurred, pricing is fixed and determinable, and collection is reasonably assured. Revenue is recognized as the net amount expected to be received after deducting estimated amounts for product returns, discounts, and allowances based on historical return rates and reasonable judgment.
Lessor Accounting
Certain of the Company’s revenues are obtained through PPAs or other contractual agreements. Many of these agreements are accounted for as operating leases under ASC 840
Leases.
Certain of these leases have no minimum lease payments and all of the rent is recorded as contingent rent on an actual basis when the electricity is delivered. Judgment is required by management in determining the economic life of each generating facility, in evaluating whether certain lease provisions constitute minimum payments or represent contingent rent and other factors in determining whether a contract contains a lease and whether the lease is an operating lease or capital lease. Contingent rental income recognized in the years ended
December 31, 2016
,
2015
, and
2014
was
$936 million
,
$777 million
, and
$544 million
, respectively.
Gross Receipts and Sales Taxes
In connection with its retail business, the Company records gross receipts taxes on a gross basis in revenues and cost of operations in its consolidated statements of operations. During the years ended
December 31, 2016
,
2015
, and
2014
, the Company's revenues and cost of operations included gross receipts taxes of
$102 million
,
$110 million
, and
$108 million
, respectively. Additionally, the retail business records sales taxes collected from its taxable customers and remitted to the various governmental entities on a net basis; thus, there is no impact on the Company's consolidated statement of operations.
Cost of Energy for Retail Operations
The cost of energy for electricity sales and services to retail customers is included in cost of operations and is based on estimated supply volumes for the applicable reporting period. A portion of the cost of energy (
$90 million
,
$85 million
and
$86 million
as of
December 31, 2016
,
2015
, and
2014
, respectively) was accrued and consisted of estimated transmission and distribution charges not yet billed by the transmission and distribution utilities. In estimating supply volumes, the Company considers the effects of historical customer volumes, weather factors and usage by customer class. Transmission and distribution delivery fees are estimated using the same method used for electricity sales and services to retail customers. In addition, ISO fees are estimated based on historical trends, estimated supply volumes and initial ERCOT ISO settlements. Volume estimates are then multiplied by the supply rate and recorded as cost of operations in the applicable reporting period.
Derivative Financial Instruments
The Company accounts for derivative financial instruments under ASC 815, which requires the Company to record all derivatives on the balance sheet at fair value unless they qualify for a NPNS exception. Changes in the fair value of non-hedge derivatives are immediately recognized in earnings. Changes in the fair value of derivatives accounted for as hedges, if elected for hedge accounting, are either:
|
•
|
Recognized in earnings as an offset to the changes in the fair value of the related hedged assets, liabilities and firm commitments; or
|
|
•
|
Deferred and recorded as a component of accumulated OCI until the hedged transactions occur and are recognized in earnings.
|
The Company's primary derivative instruments are power purchase or sales contracts, fuels purchase contracts, other energy related commodities, and interest rate instruments used to mitigate variability in earnings due to fluctuations in market prices and interest rates. On an ongoing basis, the Company assesses the effectiveness of all derivatives that are designated as hedges for accounting purposes in order to determine that each derivative continues to be highly effective in offsetting changes in fair values or cash flows of hedged items. Internal analyses that measure the statistical correlation between the derivative and the associated hedged item determine the effectiveness of such a contract designated as a hedge. If it is determined that the derivative instrument is not highly effective as a hedge, hedge accounting will be discontinued prospectively. In this case, the gain or loss previously deferred in accumulated OCI would be frozen until the underlying hedged instrument is delivered unless the transactions being hedged are no longer probable of occurring in which case the amount in OCI would be immediately reclassified into earnings. If the derivative instrument is terminated, the effective portion of this derivative deferred in accumulated OCI will be frozen until the underlying hedged item is delivered.
143
Revenues and expenses on contracts that qualify for the NPNS exception are recognized when the underlying physical transaction is delivered. While these contracts are considered derivative financial instruments under ASC 815, they are not recorded at fair value, but on an accrual basis of accounting. If it is determined that a transaction designated as NPNS no longer meets the scope exception, the fair value of the related contract is recorded on the balance sheet and immediately recognized through earnings.
NRG's trading activities are subject to limits in accordance with the Company's Risk Management Policy. These contracts are recognized on the balance sheet at fair value and changes in the fair value of these derivative financial instruments are recognized in earnings.
Foreign Currency Translation and Transaction Gains and Losses
The local currencies are generally the functional currency of NRG's foreign operations. Foreign currency denominated assets and liabilities are translated at end-of-period rates of exchange. Revenues, expenses, and cash flows are translated at the weighted-average rates of exchange for the period. The resulting currency translation adjustments are not included in the Company's consolidated statements of operations for the period, but are accumulated and reported as a separate component of stockholders' equity until sale or complete or substantially complete liquidation of the net investment in the foreign entity takes place. Foreign currency transaction gains or losses are reported within other income/(expense) in the Company's consolidated statements of operations. For the years ended
December 31, 2016
,
2015
, and
2014
, amounts recognized as foreign currency transaction gains (losses) were immaterial. The Company's cumulative translation adjustment balances as of
December 31, 2016
,
2015
, and
2014
were
$(11) million
,
$(10) million
and
$1 million
, respectively.
Concentrations of Credit Risk
Financial instruments which potentially subject the Company to concentrations of credit risk consist primarily of trust funds, accounts receivable, notes receivable, derivatives, and investments in debt securities. Trust funds are held in accounts managed by experienced investment advisors. Certain accounts receivable, notes receivable, and derivative instruments are concentrated within entities engaged in the energy industry. These industry concentrations may impact the Company's overall exposure to credit risk, either positively or negatively, in that the customers may be similarly affected by changes in economic, industry or other conditions. Receivables and other contractual arrangements are subject to collateral requirements under the terms of enabling agreements. However, the Company believes that the credit risk posed by industry concentration is offset by the diversification and creditworthiness of its customer base. See
Note 4
,
Fair Value of Financial Instruments
,
for a further discussion of derivative concentrations.
Fair Value of Financial Instruments
The carrying amount of cash and cash equivalents, funds deposited by counterparties, receivables, accounts payable, and accrued liabilities approximate fair value because of the short-term maturity of these instruments. See
Note 4
,
Fair Value of Financial Instruments
,
for a further discussion of fair value of financial instruments.
Asset Retirement Obligations
The Company accounts for AROs in accordance with ASC 410-20,
Asset Retirement Obligations,
or ASC 410-20. Retirement obligations associated with long-lived assets included within the scope of ASC 410-20 are those for which a legal obligation exists under enacted laws, statutes, and written or oral contracts, including obligations arising under the doctrine of promissory estoppel, and for which the timing and/or method of settlement may be conditional on a future event. ASC 410-20 requires an entity to recognize the fair value of a liability for an ARO in the period in which it is incurred and a reasonable estimate of fair value can be made.
Upon initial recognition of a liability for an ARO, the Company capitalizes the asset retirement cost by increasing the carrying amount of the related long-lived asset by the same amount. Over time, the liability is accreted to its future value, while the capitalized cost is depreciated over the useful life of the related asset. See
Note 13
,
Asset Retirement Obligations
,
for a further discussion of AROs.
144
Pensions and Other Postretirement Benefits
The Company offers pension benefits through a defined benefit pension plan. In addition, the Company provides postretirement health and welfare benefits for certain groups of employees. The Company accounts for pension and other postretirement benefits in accordance with ASC 715,
Compensation — Retirement Benefits.
The Company recognizes the funded status of the Company's defined benefit plans in the statement of financial position and records an offset for gains and losses as well as all prior service costs that have not been included as part of the Company's net periodic benefit cost to other comprehensive income. The determination of the Company's obligation and expenses for pension benefits is dependent on the selection of certain assumptions. These assumptions determined by management include the discount rate, the expected rate of return on plan assets and the rate of future compensation increases. The Company's actuarial consultants determine assumptions for such items as retirement age. The assumptions used may differ materially from actual results, which may result in a significant impact to the amount of pension obligation or expense recorded by the Company.
The Company measures the fair value of its pension assets in accordance with ASC 820,
Fair Value Measurements and Disclosures,
or ASC 820.
Stock-Based Compensation
The Company accounts for its stock-based compensation in accordance with ASC 718,
Compensation — Stock Compensation,
or ASC 718
.
The fair value of the Company's non-qualified stock options and market stock units are estimated on the date of grant using the Black-Scholes option-pricing model and the Monte Carlo valuation model, respectively. NRG uses the Company's common stock price on the date of grant as the fair value of the Company's restricted stock units and deferred stock units. Forfeiture rates are estimated based on an analysis of the Company's historical forfeitures, employment turnover, and expected future behavior. The Company recognizes compensation expense for both graded and cliff vesting awards on a straight-line basis over the requisite service period for the entire award.
Investments Accounted for by the Equity Method
The Company has investments in various domestic energy projects, as well as one Australian project. The equity method of accounting is applied to such investments in affiliates, which include joint ventures and partnerships, because the ownership structure prevents the Company from exercising a controlling influence over the operating and financial policies of the projects. Under this method, equity in pre-tax income or losses of domestic partnerships and, generally, in the net income or losses of its Australian project, are reflected as equity in earnings of unconsolidated affiliates. For certain investments that relate to tax equity arrangements, equity earnings are allocated using the hypothetical liquidation at book value, or HLBV, method which is described below. Distributions from equity method investments that represent earnings on the Company's investment are included within cash flows from operating activities and distributions from equity method investments that represent a return of the Company's investment are included within cash flows from investing activities.
Tax Equity Arrangements
The Company’s redeemable noncontrolling interest in subsidiaries and noncontrolling interest, included in stockholders' equity, represents third-party interests in the net assets under certain tax equity arrangements, which are consolidated by the Company, that have been entered into to finance the cost of solar energy systems under operating leases and wind facilities eligible for certain tax credits. The Company has determined that the provisions in the contractual agreements of these structures represent substantive profit sharing arrangements. Further, the Company has determined that the appropriate methodology for calculating the noncontrolling interest and redeemable noncontrolling interest that reflects the substantive profit sharing arrangements is a balance sheet approach utilizing the HLBV method. Under the HLBV method, the amounts reported as noncontrolling interest and redeemable noncontrolling interests represent the amounts the investors that are party to the tax equity arrangements would hypothetically receive at each balance sheet date under the liquidation provisions of the contractual agreements, assuming the net assets of the funding structures were liquidated at their recorded amounts determined in accordance with GAAP. The investors’ interests in the results of operations of the funding structures are determined as the difference in noncontrolling interest and redeemable noncontrolling interests at the start and end of each reporting period, after taking into account any capital transactions between the structures and the funds’ investors. The calculations utilized to apply the HLBV method include estimated calculations of taxable income or losses for each reporting period.
145
Redeemable Noncontrolling Interest
To the extent that the third-party has the right to redeem their interests for cash or other assets, the Company has included the noncontrolling interest attributable to the third party as a component of temporary equity in the mezzanine section of the consolidated balance sheet. The following table reflects the changes in the Company's redeemable noncontrolling interest balance for the years ended
December 31, 2016
,
2015
, and
2014
.
|
(In millions)
|
|||
|
Balance as of December 31, 2013
|
$
|
2
|
|
|
Cash contributions from redeemable noncontrolling interest
|
36
|
|
|
|
Comprehensive loss attributable to redeemable noncontrolling interest
|
(19
|
)
|
|
|
Balance as of December 31, 2014
|
19
|
|
|
|
Cash contributions from redeemable noncontrolling interest
|
27
|
|
|
|
Comprehensive loss attributable to redeemable noncontrolling interest
|
(17
|
)
|
|
|
Balance as of December 31, 2015
|
29
|
|
|
|
Distributions to redeemable noncontrolling interest
|
(1
|
)
|
|
|
Contributions from redeemable noncontrolling interest
|
56
|
|
|
|
Comprehensive loss attributable to redeemable noncontrolling interest
|
(38
|
)
|
|
|
Balance as of December 31, 2016
|
$
|
46
|
|
Sale-Leaseback Arrangements
NRG is party to sale-leaseback arrangements that provide for the sale of certain assets to a third party and simultaneous leaseback to the Company. In accordance with ASC 840-40,
Sale-Leaseback Transactions
, if the seller-lessee retains, through the leaseback, substantially all of the benefits and risks incident to the ownership of the property sold, the sale-leaseback transaction is accounted for as a financing arrangement. An example of this type of continuing involvement would include an option to repurchase the assets or the buyer-lessor having the option to sell the assets back to the Company. This provision is included in most of the Company’s sale-leaseback arrangements. As such, the Company accounts for these arrangements as financings.
Under the financing method, the Company does not recognize as income any of the sale proceeds received from the lessor that contractually constitutes payment to acquire the assets subject to these arrangements. Instead, the sale proceeds received are accounted for as financing obligations and leaseback payments made by the Company are allocated between interest expense and as a reduction to the financing obligation. Interest on the financing obligation is calculated using the Company’s incremental borrowing rate at the inception of the arrangement on the outstanding financing obligation. Judgment is required to determine the appropriate borrowing rate for the arrangement and in determining any gain or loss on the transaction that would be recorded either at the end of or over the lease term.
Marketing and Advertising Costs
The Company expenses its marketing and advertising costs as incurred and which are included within selling, general and administrative expenses. Marketing and advertising expenses for the years ended December 31, 2016, 2015, and 2014 were
$247 million
,
$307 million
, and
$208 million
, respectively. The costs of tangible assets used in advertising campaigns are recorded as fixed assets or deferred advertising costs and amortized as advertising costs over the shorter of the useful life of the asset or the advertising campaign. The Company has several long-term sponsorship arrangements. Payments related to these arrangements are deferred and expensed over the term of the arrangement. Advertising expenses for the years ended December 31, 2016, 2015 and 2014 were
$53 million
,
$135 million
, and
$87 million
, respectively.
Business Combinations
The Company accounts for its business combinations in accordance with ASC 805,
Business Combinations,
or ASC 805. ASC 805 requires an acquirer to recognize and measure in its financial statements the identifiable assets acquired, the liabilities assumed, and any noncontrolling interest in the acquiree at fair value at the acquisition date. It also recognizes and measures the goodwill acquired or a gain from a bargain purchase in the business combination and determines what information to disclose to enable users of an entity's financial statements to evaluate the nature and financial effects of the business combination. In addition, transaction costs are expensed as incurred.
146
Use of Estimates
The preparation of financial statements in conformity with accounting principles generally accepted in the United States requires management to make estimates and assumptions that affect the reported amounts of assets and liabilities at the date of the financial statements, disclosure of contingent assets and liabilities at the date of the financial statements, and the reported amounts of revenues and expenses during the reporting period. Actual results could differ from these estimates.
In recording transactions and balances resulting from business operations, the Company uses estimates based on the best information available. Estimates are used for such items as plant depreciable lives, tax provisions, uncollectible accounts, actuarially determined benefit costs, the valuation of energy commodity contracts, environmental liabilities, legal costs incurred in connection with recorded loss contingencies, and assets acquired and liabilities assumed in business combinations, among others. In addition, estimates are used to test long-lived assets and goodwill for impairment and to determine the fair value of impaired assets. As better information becomes available or actual amounts are determinable, the recorded estimates are revised. Consequently, operating results can be affected by revisions to prior accounting estimates.
Reclassifications
Certain prior-year amounts have been reclassified for comparative purposes. The reclassifications did not affect results from operations, net assets or cash flows.
Recent Accounting Developments
ASU 2017-04
- In January 2017, the FASB issued ASU No. 2017-04,
Intangibles - Goodwill and Other (Topic 350)
, Simplifying the Test for Goodwill Impairment, or ASU No. 2017-04. The amendments of ASU No. 2017-04 aim at simplifying the subsequent measurement of goodwill. As a result, ASU No. 2017-04 eliminates Step 2 from the goodwill impairment test which previously required an entity to determine the fair value at the impairment testing date of the assets and liabilities following the procedures which would be required in determining the fair value of assets acquired and liabilities assumed under a business combination. Under ASU No. 2017-04, an entity shall perform its goodwill impairment test by comparing the fair value of the reporting unit with its carrying amount and recognize an impairment charge for the amount the carrying amount exceeds the reporting unit’s fair value. The amendments of ASU No. 2017-04 are effective for annual reporting periods beginning after December 15, 2019, and interim periods within those annual periods. Early adoption is permitted for interim or annual goodwill impairment tests performed on testing dates after January 1, 2017 and the adoption should be applied prospectively.
ASU 2016-18
— In November 2016, the FASB issued ASU No. 2016-18,
Statement of Cash Flows (Topic 230)
, Restricted Cash, or ASU No. 2016-18. The amendments of ASU No. 2016-18 were issued to address the diversity in classification and presentation of changes in restricted cash and restricted cash equivalents on the statement of cash flows which is currently not addressed under Topic 230. The amendments of ASU No. 2016-18 would require an entity to include amounts generally described as restricted cash and restricted cash equivalents with cash and cash equivalents when reconciling the beginning of period and end of period total amounts on the statement of cash flows. The amendments of ASU No. 2016-18 are effective for annual reporting periods beginning after December 15, 2017, and interim periods within those annual periods. Early adoption is permitted and the adoption of ASU No. 2016-18 should be applied retrospectively. The Company is currently evaluating the impact of the standard on the Company’s statement of cash flows.
ASU 2016-16
— In October 2016, the FASB issued ASU No. 2016-16,
Income Taxes (Topic 740)
, Intra-Entity Transfers of Assets Other Than Inventory, or ASU No. 2016-16. The amendments of ASU No. 2016-16 were issued to improve the accounting for the income tax consequences of intra-entity transfers of assets other than inventory. Current GAAP prohibits the recognition of current and deferred income taxes for an intra-entity asset transfer until the asset has been sold to an outside party which has resulted in diversity in practice and increased complexity within financial reporting. The amendments of ASU No. 2016-16 would require an entity to recognize the income tax consequences of an intra-entity transfer of an asset other than inventory when the transfer occurs and do not require new disclosure requirements. The amendments of ASU No. 2016-16 are effective for annual reporting periods beginning after December 15, 2017, and interim periods within those annual periods. Early adoption is permitted and the adoption of ASU No. 2016-16 should be applied on a modified retrospective basis through a cumulative-effect adjustment directly to retained earnings as of the beginning of the period of adoption. The Company is currently evaluating the impact of the standard on the Company’s results of operations, cash flows and financial position.
147
ASU 2016-15
— In August 2016, the FASB issued ASU No. 2016-15,
Statement of Cash Flows (Topic 230)
, Classification of Certain Cash Receipts and Cash Payments, or ASU No. 2016-15. The amendments of ASU No. 2016-15 were issued to address eight specific cash flow issues for which stakeholders have indicated to the FASB that a diversity in practice existed in how entities were presenting and classifying these items in the statement of cash flows. The issues addressed by ASU No. 2016-15 include but are not limited to the classification of debt prepayment and debt extinguishment costs, payments made for contingent consideration for a business combination, proceeds from the settlement of insurance proceeds, distributions received from equity method investees and separately identifiable cash flows and the application of the predominance principle. The amendments of ASU No. 2016-15 are effective for public entities for fiscal years beginning after December 15, 2017 and interim periods in those fiscal years. Early adoption is permitted, including adoption in an interim fiscal period with all amendments adopted in the same period. The adoption of ASU No. 2016-15 is required to be applied retrospectively. The Company is currently evaluating the impact of the standard on the Company's statement of cash flows.
ASU 2016-09
— In March 2016, the FASB issued ASU No. 2016-09,
Compensation - Stock Compensation
(Topic 718), or ASU No. 2016-09. The amendments of ASU No. 2016-09 were issued as part of the FASB's Simplification Initiative focused on improving areas of GAAP for which cost and complexity may be reduced while maintaining or improving the usefulness of information disclosed within the financial statements. The amendments focused on simplification specifically with regard to share-based payment transactions, including income tax consequences, classification of awards as equity or liabilities and classification on the statement of cash flows. The guidance in ASU No. 2016-09 is effective for fiscal years beginning after December 15, 2016, and interim periods within those annual periods. The Company adopted this standard effective January 1, 2017. The adoption of this standard will not have a material impact on the Company's results of operations, cash flows and financial position.
ASU 2016-07
— In March 2016, the FASB issued ASU No. 2016-07,
Investments - Equity Method and Joint Ventures
(Topic 323), or ASU No. 2016-07. The amendments of ASU No. 2016-07 eliminate the requirement that when an investment qualifies for use of the equity method as a result of an increase in the level of ownership interest or degree of influence, an investor must adjust the investment, results of operations, and retained earnings retroactively on a step-by-step basis as if the equity method had been in effect during all previous periods that the investment had been held. The amendments require that the equity method investor add the cost of acquiring the additional interest in the investee to the current basis of the investor's previously held interest and adopt the equity method of accounting with no retroactive adjustment to the investment. In addition, ASU No. 2016-07 requires that an entity that has an available-for-sale equity security that becomes qualified for the equity method of accounting recognize through earnings the unrealized holding gain or loss in accumulated other comprehensive income at the date the investment becomes qualified for use of the equity method. The guidance in ASU No. 2016-07 is effective for fiscal years beginning after December 15, 2016, and interim periods within those annual periods. The Company adopted this standard effective January 1, 2017. The adoption of ASU No. 2016-07 is required to be applied prospectively. The adoption of this standard will not have a material impact on the Company's results of operations, cash flows and financial position.
ASU 2016-02
— In 2016, the FASB issued ASU No. 2016-02,
Leases
(Topic 842), or Topic 842 with the objective to increase transparency and comparability among organizations by recognizing lease assets and lease liabilities on the balance sheet and to improve financial reporting by expanding the related disclosures. The guidance in Topic 842 provides that a lessee that may have previously accounted for a lease as an operating lease under current GAAP should recognize the assets and liabilities that arise from a lease on the balance sheet. In addition, Topic 842 expands the required quantitative and qualitative disclosures with regards to lease arrangements. The Company expects to adopt the standard effective January 1, 2019 utilizing the required modified retrospective approach for the earliest period presented. The Company expects to elect certain of the practical expedients permitted, including the expedient that permits the Company to retain its existing lease assessment and classification. The Company is currently working through an adoption plan which includes the evaluation of lease contracts compared to the new standard. While the Company is currently evaluating the impact the new guidance will have on its financial position and results of operations, the Company expects to recognize lease liabilities and right of use assets. The extent of the increase to assets and liabilities associated with these amounts remains to be determined pending the Company’s review of its existing lease contracts and service contracts which may contain embedded leases. As this review is still in process, it is currently not practicable to quantify the impact of adopting the ASU at this time.
148
ASU 2016-01
— In January 2016, the FASB issued ASU No. 2016-01,
Financial Instruments - Overall
(Subtopic 825-10): Recognition and Measurement of Financial Assets and Financial Liabilities, or ASU No. 2016-01. The amendments of ASU No. 2016-01 eliminate available-for-sale classification of equity investments and require that equity investments (except those accounted for under the equity method of accounting, or those that result in consolidation of the investee) to be generally measured at fair value with changes in fair value recognized in net income. Further, the amendments require that financial assets and financial liabilities to be presented separately in the notes to the financial statements, grouped by measurement category and form of financial asset. The guidance in ASU No. 2016-01 is effective for financial statements issued for fiscal years beginning after December 15, 2017, and interim periods within those annual periods. The Company is currently evaluating the impact of the standard on the Company's results of operations, cash flows and financial position.
ASU 2015-16
— In September 2015, the FASB issued ASU No. 2015-16,
Business Combinations
(Topic 805)
: Simplifying the Accounting for Measurement-Period Adjustments
, or ASU No. 2015-16. The amendments of ASU No. 2015-16 require that an acquirer recognize measurement period adjustments to the provisional amounts recognized in a business combination in the reporting period during which the adjustments are determined. Additionally, the amendments of ASU No. 2015-16 require the acquirer to record in the same period's financial statements the effect on earnings of changes in depreciation, amortization or other income effects, if any, as a result of the measurement period adjustment, calculated as if the accounting had been completed at the acquisition date as well as disclosing either on the face of the income statement or in the notes the portion of the amount recorded in current period earnings that would have been recorded in previous reporting periods. The guidance in ASU No. 2015-16 is effective for financial statements issued for fiscal years beginning after December 15, 2015, and interim periods within those fiscal years. The amendments should be applied prospectively. The Company adopted ASU No. 2015-16 for the year ended December 31, 2016, and the adoption did not have a material impact on the Company's results of operations, cash flows and financial position.
ASU 2014-15
— In August 2014, the FASB issued ASU No. 2014-15,
Presentation of Financial Statements - Going Concern (Subtopic 205-40): Disclosures of Uncertainties about an Entity's Ability to Continue as a Going Concern
, which requires management to evaluate whether there are conditions and events that raise substantial doubt about an entity's ability to continue as a going concern within one year after the financial statements are available to be issued. The Company adopted this ASU effective January 1, 2016.
ASU 2014-09
— In May 2014, the FASB issued ASU No. 2014-09,
Revenue from Contracts with Customers
(Topic 606), or ASU No. 2014-09, which was further amended through various updates issued by the FASB thereafter. The amendments of ASU No. 2014-09 completed the joint effort between the FASB and the IASB, to develop a common revenue standard for GAAP and IFRS, and to improve financial reporting. The guidance under Topic 606 provides that an entity should recognize revenue to depict the transfer of goods or services to customers in an amount that reflects the consideration to which the entity expects to be entitled to in exchange for the goods or services provided and establishes a five step model to be applied by an entity in evaluating its contracts with customers. The Company expects to adopt the standard effective January 1, 2018 and apply the guidance retrospectively to contracts at the date of adoption. The Company will recognize the cumulative effect of applying Topic 606 at the date of initial application, as prescribed under the modified retrospective transition method. The Company also expects to elect the practical expedient available under Topic 606 for measuring progress toward complete satisfaction of a performance obligation and for disclosure requirements of remaining performance obligations. The practical expedient allows an entity to recognize revenue in the amount to which the entity has the right to invoice such that the entity has a right to the consideration in an amount that corresponds directly with the value to the customer for performance completed to date by the entity. In 2016, the Company continued to assess the new standard with a focus on identifying the performance obligations included within its revenue arrangements with customers and evaluating the Company’s methods of estimating the amount and timing of variable consideration. Based on the assessment to date, the Company is currently evaluating the impact of the new standard on the Company’s results of operations, financial position or cash flows.
Note 3
—
Business Acquisitions and Dispositions
The Company has completed the following business acquisitions and dispositions that are material to the Company's financial statements:
Acquisitions
2016 Utility-Scale Solar and Wind Acquisition
On November 2, 2016, the Company acquired equity interests in a tax equity portfolio from SunEdison, located in Utah, comprised of
530
MW of mechanically-complete solar assets, of which NRG’s net interest based on cash to be distributed is
265
MW, for upfront cash consideration of
$111 million
. In connection with the acquisition, the Company assumed non-recourse debt of
$222 million
. The Company also borrowed additional amounts of
$65 million
during the fourth quarter of 2016, as described in
Note 12
,
Debt and Capital Leases
, which effectively reduced the Company's use of liquidity related to the acquisition. The Company does not have a controlling interest in the tax equity portfolio and, accordingly, its interest is recorded as an equity method investment. The purchase price was preliminarily allocated to the equity method investment balance of approximately
$328 million
, current assets of
$5 million
and the assumed non-recourse debt of
$222 million
. The assets reached commercial operations during the fourth quarter of 2016 and have 20-year PPAs with PacificCorp.
The Company acquired a
110
MW portfolio of construction-ready and
71
MW of development solar assets in Hawaii from SunEdison for upfront cash consideration of
$2 million
on October 3, 2016 and a
154
MW construction-ready solar project in Texas for upfront cash consideration of
$11 million
on November 9, 2016.
In addition to the total
$124 million
in upfront cash consideration paid for the above acquisitions, the Company expects to make an estimated
$59 million
in additional payments contingent upon future development milestones.
2016 Solar Distributed Generation Acquisition
On October 3, 2016, the Company acquired a
29
MW portfolio of mechanically-complete and construction-ready distributed generation solar assets from SunEdison for cash consideration of approximately
$67 million
excluding post-closing adjustments which reduced the purchase price by
$5 million
. Subsequent to the acquisition, the Company sold the majority of these assets into a tax-equity financed portfolio within the DGPV Holdco partnership between NRG and NRG Yield, Inc., and expects to sell the remaining assets into a similar portfolio in 2017. The purchase price was preliminarily allocated to
$47 million
in construction in progress and
$15 million
in intangible assets.
2015 Acquisition of Desert Sunlight
On June 29, 2015, NRG Yield, Inc., through its subsidiary NRG Yield Operating LLC, acquired
25%
of the membership interest in Desert Sunlight Investment Holdings, LLC, which owns two solar photovoltaic facilities that total
550
MW located in Desert Center, California from EFS Desert Sun, LLC, an affiliate of GE Energy Financial Services, for a purchase price of
$285 million
. The Company accounts for its
25%
investment as an equity method investment.
2014 Acquisition of Alta Wind
On August 12, 2014, NRG Yield, Inc., through its subsidiary NRG Yield Operating LLC, or Yield Operating, completed the acquisition of
100%
of the membership interests of Alta Wind Asset Management Holdings, LLC, Alta Wind Company, LLC, Alta Wind X Holding Company, LLC, and Alta Wind XI Holding Company, LLC, which collectively own seven wind facilities that total
947
MW located in Tehachapi, California and a portfolio of land leases, or the Alta Wind Assets. Power generated by the Alta Wind facility is sold to Southern California Edison under long-term power purchase agreements with
21 years
of remaining contract life for Alta I-V. The Alta X and XI power purchase agreements began in January 2016 with terms of
22 years
and sold energy and renewable energy credits on a merchant basis during the years ended December 31, 2015 and 2014.
The purchase price of the Alta Wind Assets was
$923 million
, which was comprised of a purchase price of
$870 million
and
$53 million
paid for working capital balances. In order to fund the purchase price of the acquisition, NRG Yield, Inc. issued
12,075,000
shares of its Class A common stock on July 29, 2014 for net proceeds of
$630 million
. In addition, on August 5, 2014, Yield Operating issued
$500 million
in aggregate principal amount at par of
5.375%
senior notes due August 2024. Interest on the notes is payable semi-annually on February 15 and August 15 of each year, and commenced on February 15, 2015. The notes are senior unsecured obligations of Yield Operating and are guaranteed by NRG Yield LLC, Yield Operating’s parent company, and by certain of Yield Operating’s wholly owned subsidiaries.
The acquisition was recorded as a business combination under ASC 805, with identifiable assets acquired and liabilities assumed provisionally recorded at their estimated fair values on the acquisition date. The accounting for the business combination was completed as of August 11, 2015, at which point the fair values became final. The following table summarizes the provisional amounts recognized for assets acquired and liabilities assumed as of December 31, 2014, as well as adjustments made through August 11, 2015, when the allocation became final. The purchase price of
$923 million
was allocated as follows:
|
Acquisition Date Fair Value at December 31, 2014
|
Measurement period adjustments
|
Revised Acquisition Date
|
|||||||||
|
(In millions)
|
|||||||||||
|
Assets
|
|||||||||||
|
Cash
|
$
|
22
|
|
—
|
|
$
|
22
|
|
|||
|
Current and non-current assets
|
49
|
|
(2
|
)
|
47
|
|
|||||
|
Property, plant and equipment
|
1,304
|
|
6
|
|
1,310
|
|
|||||
|
Intangible assets
|
1,177
|
|
(6
|
)
|
1,171
|
|
|||||
|
Total assets acquired
|
2,552
|
|
(2
|
)
|
2,550
|
|
|||||
|
Liabilities
|
|||||||||||
|
Debt
|
1,591
|
|
—
|
|
1,591
|
|
|||||
|
Current and non-current liabilities
|
38
|
|
(2
|
)
|
36
|
|
|||||
|
Total liabilities assumed
|
1,629
|
|
(2
|
)
|
1,627
|
|
|||||
|
Net assets acquired
|
$
|
923
|
|
$
|
—
|
|
$
|
923
|
|
||
149
2014 Acquisition of Dominion's Competitive Electric Retail Business
On March 31, 2014, the Company acquired the competitive retail electricity business of Dominion Resources, Inc., or Dominion. The acquisition of Dominion's competitive retail electricity business increased NRG’s retail portfolio by approximately
540,000
customers in the aggregate by the end of 2014. The acquisition supports NRG's ongoing efforts to expand the Company's retail footprint in the Northeast and to grow its retail position in Texas. The Company paid approximately
$192 million
as cash consideration for the acquisition, including
$165 million
of purchase price and
$27 million
paid for working capital balances, which was funded by cash on hand. The purchase price was allocated to the following:
$40 million
to accounts receivable-trade,
$64 million
to customer relationships,
$9 million
to trade names,
$14 million
to current assets,
$21 million
to derivative assets,
$47 million
to current and non-current liabilities, and goodwill of
$91 million
of which
$8 million
is deductible for U.S. income tax purposes in future periods. The consideration and assets include amounts paid for customer relationships in the Northeast that were accounted for as an asset acquisition. The factors that resulted in goodwill arising from the acquisition include the revenues associated with new customers in new regions and through the synergies associated with combining a new retail business with the Company's existing retail and generation assets. The accounting for the Dominion acquisition was completed as of March 30, 2015, at which point the provisional fair values became final with no material changes.
2014 Acquisition of EME
On April 1, 2014, the Company acquired substantially all of the assets of EME. EME, through its subsidiaries and affiliates, owned or leased and operated a portfolio of approximately
8,000
MW consisting of wind energy facilities and coal- and gas-fired generating facilities. The Company paid an aggregate purchase price of
$3.5 billion
, which was funded through the issuance of
12,671,977
shares of NRG common stock on April 1, 2014, the issuance of
$700 million
in newly-issued corporate debt, as described in
Note 12
,
Debt and Capital Leases
,
and cash on hand. The Company also assumed non-recourse debt of approximately
$1.2 billion
.
In connection with the transaction, NRG agreed to certain conditions with the parties to the Powerton and Joliet, or POJO, sale-leaseback transaction subject to which an NRG subsidiary assumed the POJO leveraged leases and NRG guaranteed the remaining payments under each lease, which total
$405 million
through 2034.
On April 30, 2014, subsequent to the acquisition, the Company acquired the remaining
50%
ownership of Mission Del Sol LLC, which owns the Sunrise facility, a
586
MW natural gas facility in Fellows, California, from Chevron Power Holdings Inc. increasing the Company's ownership interest to
100%
in exchange for the Company's
50%
interest in six cogeneration facilities, previously co-owned with Chevron Power Holdings Inc.
150
The acquisition was recorded as a business combination under ASC 805, with identifiable assets acquired and liabilities assumed provisionally recorded at their estimated fair values on the acquisition date. The accounting for the EME acquisition was completed as of March 31, 2015, at which point the fair values became final. The following table summarizes the provisional amounts recognized for assets acquired and liabilities assumed as of December 31, 2014, as well as adjustments made through March 31, 2015, when the allocation became final. Measurement period adjustments primarily reflect the tax impact of the acquisition date fair values and final estimates for asset retirement obligations. The purchase price of
$3.5 billion
was allocated as follows:
|
Acquisition Date Fair Value at December 31, 2014
|
Measurement period adjustments
|
Revised Acquisition Date
|
|||||||||
|
(In millions)
|
|||||||||||
|
Assets
|
|||||||||||
|
Cash
|
$
|
1,422
|
|
$
|
—
|
|
$
|
1,422
|
|
||
|
Current assets
|
724
|
|
72
|
|
796
|
|
|||||
|
Property, plant and equipment
|
2,438
|
|
(3
|
)
|
2,435
|
|
|||||
|
Intangible assets
|
172
|
|
—
|
|
172
|
|
|||||
|
Goodwill
|
334
|
|
(56
|
)
|
278
|
|
|||||
|
Non-current assets
|
773
|
|
—
|
|
773
|
|
|||||
|
Total assets acquired
|
5,863
|
|
13
|
|
5,876
|
|
|||||
|
Liabilities
|
|||||||||||
|
Current and non-current liabilities
|
629
|
|
13
|
|
642
|
|
|||||
|
Out-of-market contracts and leases
|
159
|
|
—
|
|
159
|
|
|||||
|
Long-term debt
|
1,249
|
|
—
|
|
1,249
|
|
|||||
|
Total liabilities assumed
|
2,037
|
|
13
|
|
2,050
|
|
|||||
|
Less: noncontrolling interest
|
352
|
|
—
|
|
352
|
|
|||||
|
Net assets acquired
|
$
|
3,474
|
|
$
|
—
|
|
$
|
3,474
|
|
||
Dispositions
2016 Potrero Disposition
On September 26, 2016, NRG Potrero LLC, or Potrero, an indirect wholly owned subsidiary of GenOn Americas Generation, completed the sale of real property at the Potrero generating station located in San Francisco, CA to California Barrel Company, LLC for total consideration of
$86 million
, consisting of
$74 million
of cash received, which is net of
$8 million
of closing costs and
$4 million
to be held in escrow in order to cover post-closing obligations. This transaction resulted in a gain on sale of
$74 million
.
2016 Disposition of Majority Interest in EVgo
On June 17, 2016, the Company completed the sale of a majority interest in its EVgo business to Vision Ridge Partners for total consideration of approximately
$39 million
, including
$17 million
in cash received, which is net of
$2.5 million
in working capital adjustments,
$15 million
contributed as capital to the EVgo business and
$7 million
of future contributions by Vision Ridge Partners, all of which were determined based on forecasted cash requirements to operate the business in future periods. In addition, the Company has future earnout potential of up to
$70 million
based on future profitability targets. NRG retained its original financial obligation of
$102.5 million
under its agreement with the CPUC whereby EVgo will build at least
200
public fast charging Freedom Station sites and perform the associated work to prepare
10,000
commercial and multi-family parking spaces for electric vehicle charging in California. NRG has contracted with EVgo to continue to build the remaining required Freedom Stations and commercial and multi-family parking spaces for electric vehicle charging required under this obligation and EVgo will be directly reimbursed by NRG for the costs. As a result of the sale, the Company recorded a loss on sale of
$78 million
during the second quarter of 2016, which reflects the loss on the sale of the equity interest of
$27 million
and the accrual of NRG's remaining obligation under its agreement with the CPUC of
$56 million
, of which
$47 million
remains as of December 31, 2016. At December 31, 2016, the Company's remaining
35%
interest in EVgo of
$5 million
was accounted for as an equity method investment.
151
2016 Rockford Disposition
On May 12, 2016, the Company entered into an agreement with RA Generation, LLC to sell
100%
of its interests in the Rockford I and Rockford II generating stations, or Rockford, for cash consideration of
$55 million
, subject to adjustments for working capital and the results of the PJM 2019/2020 base residual auction. Rockford is a
450
MW natural gas facility located in Rockford, Illinois. The transaction triggered an indicator of impairment as the sales price was less than the carrying amount of the assets and as a result, the assets were considered to be impaired. The Company measured the impairment loss as the difference between the carrying amount of the assets and the agreed-upon sales price. The Company recorded an impairment loss of
$17 million
during the quarter ended June 30, 2016 to reduce the carrying amount of the assets held for sale to the fair market value. On July 12, 2016, the Company completed the sale of Rockford for cash proceeds of
$56 million
, including
$1 million
in adjustments for the PJM base residual auction results. For further discussion on this impairment, refer to
Note 10
,
Asset Impairments
.
2016 Aurora Disposition
On May 12, 2016, GenOn entered into an agreement with RA Generation, LLC to sell the Aurora Generating Station, or Aurora, for cash consideration of
$365 million
, subject to adjustments for working capital and the results of the PJM 2019/2020 base residual auction. Aurora is an
878
MW natural gas facility located in Aurora, Illinois. On July 12, 2016, GenOn completed the sale of Aurora for cash proceeds of
$369 million
, including
$4 million
in adjustments for the PJM base residual auction results and estimated working capital, which is subject to further adjustment. The Company recorded a gain of approximately
$188 million
recognized within the Company's consolidated results of operations during the quarter ended September 30, 2016.
2016 Seward Disposition
On November 24, 2015, GenOn entered into an agreement with Seward Generation, LLC and an affiliate of Robindale Energy Services, Inc. to sell the Seward Generating Station, a
525
MW coal-fired facility in Pennsylvania, for cash consideration of
$75 million
. At December 31, 2015, GenOn had classified on its balance sheet the assets and liabilities of Seward as held for sale. On February 2, 2016, GenOn completed the sale of Seward and received gross cash proceeds of
$75 million
, excluding
$3 million
cash on hand transferred to the buyer. GenOn will also receive
$5 million
in deferred cash consideration in five
$1 million
annual installments and up to
$2.5 million
in payments contingent upon certain environmental requirements being imposed by August 2017. In addition, Robindale committed to future inventory purchases from GenOn of
$13 million
through 2019.
2016 Shelby Disposition
On November 9, 2015, GenOn entered into an agreement with an affiliate of Rockland Power Partners II, LP to sell the Shelby Generating Station, a
352
MW natural gas-fired facility located in Illinois for cash consideration of
$46 million
. At December 31, 2015, GenOn had classified on its balance sheet the assets and liabilities of Shelby as held for sale. On March 1, 2016, GenOn completed the sale of Shelby for cash proceeds of
$46 million
, which resulted in a gain of
$29 million
recognized during the first quarter of 2016. In addition, GenOn retained
$10 million
related to future revenue rights retained as part of the agreement of which
$8 million
had been received as of December 31, 2016.
2015 Disposition of Altenex
On December 31, 2015, the Company completed the sale of its
32%
interest in Altenex, LLC to Edison Energy, LLC and Edison Energy NewCo 2, LLC for cash consideration of
$26 million
. The Company had accounted for its investment in Altenex as an equity method investment and recognized a loss of
$14 million
as a result of the transactions within the Company's consolidated statements of operations.
2014 Sale of Sabine
On December 2, 2014, the Company, through its subsidiaries GenOn Sabine (Delaware), Inc. and GenOn Sabine (Texas), Inc., completed the sale of its
50%
interest in Sabine Cogen, L.P., or Sabine, to Bayou Power, LLC, an affiliate of Rockland Capital, LLC. Sabine owns a
105
MW natural gas-fired cogeneration facility located in Texas. The Company received cash consideration of
$35 million
at closing. A gain of
$18 million
was recognized as a result of the transaction and recorded as a gain on sale of equity method investments within the Company's consolidated statements of operations.
152
2014 Disposition of 50% Interest in Petra Nova Parish Holdings LLC
On July 3, 2014, the Company, through its wholly owned subsidiary Petra Nova Holdings LLC, sold
50%
of its interest in Petra Nova Parish Holdings LLC to JX Nippon Oil Exploration (EOR) Limited, or JX Nippon, a wholly owned subsidiary of JX Nippon Oil & Gas Exploration Corporation. As a result of the sale, the Company no longer has a controlling interest in and has deconsolidated Petra Nova Parish Holdings LLC as of the date of the sale. On July 7, 2014, the Company made its initial capital contribution into the partnership of
$35 million
, which was funded with a portion of the sale proceeds of
$76 million
. On March 3, 2014, Petra Nova CCS I LLC, a wholly owned subsidiary of Petra Nova Parish Holdings LLC, entered into a fixed-price agreement to build and operate a CCF at the W.A. Parish facility with a consortium of Mitsubishi Heavy Industries America, Inc. and TIC - The Industrial Company. Notice to proceed for the construction on the CCF was issued on July 15, 2014, and commercial operation began in late 2016.
Petra Nova Parish Holdings LLC also owns a
75
MW peaking unit at W.A. Parish, which achieved commercial operations on June 26, 2013. The peaking unit will be converted into a cogeneration facility to provide power and steam to the CCF. The CCF is being financed by: (i) up to
$167 million
from a U.S. DOE CCPI grant of which
$7 million
has already been received from the grant in the initial design and engineering phase and
$106 million
has already been received from the grant under the construction phase, (ii)
$250 million
in loans provided by the Japan Bank for International Cooperation and Mizuho Bank, Ltd., and (iii) approximately
$300 million
in equity contributions from each of the Company and JX Nippon. The Company’s contribution will include investments already made during the development of the project. In February 2016, Petra Nova Parish Holdings LLC received notice of an additional
$23 million
in U.S. DOE funding.
On July 14, 2014, Petra Nova Parish Holdings LLC entered into two credit facilities, or the Petra Nova Parish Credit Agreements, to fund the cost of construction of the CCF at the W.A. Parish facility. The Petra Nova Parish Credit Agreements are comprised of a
$75 million
Nippon Export and Investment Insurance, or NEXI, covered loan and a
$175 million
Japan Bank for International Cooperation, or JBIC, facility. The NEXI covered loan has an interest rate of
LIBOR
plus an applicable margin of
1.75%
and the JBIC facility has an interest rate of
LIBOR
plus an applicable margin of
0.50%
during the construction phase which escalates to an applicable margin of
1.50%
upon completion of the CCF. Both credit facilities mature in April 2026. NRG has guaranteed its
50%
share of the obligations under the Petra Nova Parish Credit Agreements through mechanical completion as defined by the credit agreements.
Transfer of Assets under Common Control
On September 1, 2016, the Company completed the sale of its remaining
51.05%
interest in the CVSR project to NRG Yield, Inc. for total cash consideration of
$78.5 million
, plus an immaterial working capital adjustment. In addition, NRG Yield, Inc. assumed non-recourse project level debt of
$496 million
.
On November 3, 2015, the Company sold
75%
of the Class B interests of NRG Wind TE Holdco, which owns a portfolio of
12
wind facilities totaling
814
net MW, to NRG Yield, Inc. NRG Yield, Inc. paid total cash consideration of
$209 million
, subject to working capital adjustments. NRG Yield, Inc. is responsible for its pro-rata share of non-recourse project debt of
$193 million
and noncontrolling interest associated with a tax equity structure of
$159 million
(as of the acquisition date). In February 2016, the Company made a final working capital payment of
$2 million
to NRG Yield, Inc. reducing total cash consideration to
$207 million
.
On January 2, 2015, the Company sold the following facilities to NRG Yield, Inc.: Walnut Creek, the Tapestry projects (Buffalo Bear, Pinnacle and Taloga) and Laredo Ridge. NRG Yield, Inc. paid total cash consideration of
$489 million
, including
$9 million
of working capital adjustments, plus assumed project level debt of
$737 million
.
On June 30, 2014, the Company sold the following facilities to NRG Yield, Inc.: High Desert, Kansas South, and El Segundo Energy Center. NRG Yield, Inc. paid total cash consideration of
$357 million
, which represents a base purchase price of
$349 million
and
$8 million
of working capital adjustments, plus assumed project level debt of approximately
$612 million
.
The above sales were recorded as transfers of entities under common control and the related assets were transferred at their carrying value.
153
Note 4
—
Fair Value of Financial Instruments
For cash and cash equivalents, funds deposited by counterparties, accounts and other receivables, accounts payable, restricted cash, and cash collateral posted and received in support of energy risk management activities, the carrying amount approximates fair value because of the short-term maturity of those instruments and are classified as Level 1 within the fair value hierarchy.
The estimated carrying values and fair values of the Company's recorded financial instruments not carried at fair market value are as follows:
|
|
As of December 31,
|
||||||||||||||
|
2016
|
2015
|
||||||||||||||
|
|
Carrying Amount
|
Fair Value
|
Carrying Amount
|
Fair Value
|
|||||||||||
|
|
(In millions)
|
||||||||||||||
|
Assets
|
|||||||||||||||
|
Notes receivable
(a)
|
$
|
34
|
|
$
|
34
|
|
$
|
73
|
|
$
|
73
|
|
|||
|
Liabilities
|
|||||||||||||||
|
Long-term debt, including current portion
(b)
|
$
|
19,406
|
|
$
|
18,566
|
|
$
|
19,620
|
|
$
|
18,263
|
|
|||
(a) Includes the current portion of notes receivable which is recorded in prepayments and other current assets on the Company's consolidated balance sheets.
(b) Excludes deferred financing costs, which are recorded as a reduction to long-term debt on the Company's consolidated balance sheets.
The fair value of the Company's publicly-traded long-term debt is based on quoted market prices and is classified as Level 2 within the fair value hierarchy. The fair value of debt securities, non-publicly traded long-term debt, and certain notes receivable of the Company are based on expected future cash flows discounted at market interest rates or current interest rates for similar instruments with equivalent credit quality and are classified as Level 3 within the fair value hierarchy. The following table presents the level within the fair value hierarchy for long-term debt, including current portion as of December 31, 2016 and 2015:
|
As of December 31, 2016
|
As of December 31, 2015
|
||||||||||||||
|
Level 2
|
Level 3
|
Level 2
|
Level 3
|
||||||||||||
|
|
(In millions)
|
||||||||||||||
|
Long-term debt, including current portion
|
$
|
11,055
|
|
$
|
7,511
|
|
$
|
11,028
|
|
$
|
7,235
|
|
|||
Fair Value Accounting under ASC 820
ASC 820 establishes a fair value hierarchy that prioritizes the inputs to valuation techniques used to measure fair value into three levels as follows:
|
•
|
Level 1 — quoted prices (unadjusted) in active markets for identical assets or liabilities that the Company has the ability to access as of the measurement date. NRG's financial assets and liabilities utilizing Level 1 inputs include active exchange-traded securities, energy derivatives, and trust fund investments.
|
|
•
|
Level 2 — inputs other than quoted prices included within Level 1 that are directly observable for the asset or liability or indirectly observable through corroboration with observable market data. NRG's financial assets and liabilities utilizing Level 2 inputs include fixed income securities, exchange-based derivatives, and over the counter derivatives such as swaps, options and forward contracts.
|
|
•
|
Level 3 — unobservable inputs for the asset or liability only used when there is little, if any, market activity for the asset or liability at the measurement date. NRG's financial assets and liabilities utilizing Level 3 inputs include infrequently-traded, non-exchange-based derivatives and commingled investment funds, and are measured using present value pricing models.
|
In accordance with ASC 820, the Company determines the level in the fair value hierarchy within which each fair value measurement in its entirety falls, based on the lowest level input that is significant to the fair value measurement in its entirety.
154
Recurring Fair Value Measurements
Debt securities, equity securities, and trust fund investments, which are comprised of various U.S. debt and equity securities, and derivative assets and liabilities, are carried at fair market value.
The following tables present assets and liabilities measured and recorded at fair value on the Company's consolidated balance sheets on a recurring basis and their level within the fair value hierarchy:
|
|
As of December 31, 2016
|
||||||||||||||
|
|
Fair Value
|
||||||||||||||
|
|
Level 1
|
Level 2
|
Level 3
|
Total
|
|||||||||||
|
|
(In millions)
|
||||||||||||||
|
Investments in securities (classified within other non-current assets):
|
|
||||||||||||||
|
Debt securities
|
$
|
—
|
|
$
|
—
|
|
$
|
17
|
|
$
|
17
|
|
|||
|
Available-for-sale securities
|
10
|
|
—
|
|
—
|
|
10
|
|
|||||||
|
Other
(a)
|
10
|
|
—
|
|
—
|
|
10
|
|
|||||||
|
Nuclear trust fund investments:
|
|
||||||||||||||
|
Cash and cash equivalents
|
25
|
|
—
|
|
—
|
|
25
|
|
|||||||
|
U.S. government and federal agency obligations
|
72
|
|
1
|
|
—
|
|
73
|
|
|||||||
|
Federal agency mortgage-backed securities
|
—
|
|
62
|
|
—
|
|
62
|
|
|||||||
|
Commercial mortgage-backed securities
|
—
|
|
17
|
|
—
|
|
17
|
|
|||||||
|
Corporate debt securities
|
—
|
|
84
|
|
—
|
|
84
|
|
|||||||
|
Equity securities
|
292
|
|
—
|
|
54
|
|
346
|
|
|||||||
|
Foreign government fixed income securities
|
—
|
|
3
|
|
—
|
|
3
|
|
|||||||
|
Other trust fund investments:
|
|||||||||||||||
|
U.S. government and federal agency obligations
|
1
|
|
—
|
|
—
|
|
1
|
|
|||||||
|
Derivative assets:
|
|
||||||||||||||
|
Commodity contracts
|
559
|
|
551
|
|
92
|
|
1,202
|
|
|||||||
|
Interest rate contracts
|
—
|
|
49
|
|
—
|
|
49
|
|
|||||||
|
Total assets
|
$
|
969
|
|
$
|
767
|
|
$
|
163
|
|
$
|
1,899
|
|
|||
|
Derivative liabilities:
|
|
||||||||||||||
|
Commodity contracts
|
$
|
494
|
|
$
|
635
|
|
$
|
161
|
|
$
|
1,290
|
|
|||
|
Interest rate contracts
|
—
|
|
88
|
|
—
|
|
88
|
|
|||||||
|
Total liabilities
|
$
|
494
|
|
$
|
723
|
|
$
|
161
|
|
$
|
1,378
|
|
|||
|
(a)
|
Consists primarily of mutual funds held in a rabbi trust for non-qualified deferred compensation plans for certain key and highly compensated employees and a total return swap that does not meet the definition of a derivative.
|
155
|
|
As of December 31, 2015
|
||||||||||||||
|
|
Fair Value
|
||||||||||||||
|
|
Level 1
|
Level 2
|
Level 3
|
Total
|
|||||||||||
|
|
(In millions)
|
||||||||||||||
|
Investments in securities (classified within other non-current assets):
|
|
|
|
||||||||||||
|
Debt securities
|
$
|
—
|
|
$
|
—
|
|
$
|
17
|
|
$
|
17
|
|
|||
|
Available-for-sale securities
|
9
|
|
—
|
|
—
|
|
9
|
|
|||||||
|
Other
(a)
|
14
|
|
—
|
|
—
|
|
14
|
|
|||||||
|
Nuclear trust fund investments:
|
|
|
|||||||||||||
|
Cash and cash equivalents
|
6
|
|
—
|
|
—
|
|
6
|
|
|||||||
|
U.S. government and federal agency obligations
|
54
|
|
1
|
|
—
|
|
55
|
|
|||||||
|
Federal agency mortgage-backed securities
|
—
|
|
59
|
|
—
|
|
59
|
|
|||||||
|
Commercial mortgage-backed securities
|
—
|
|
25
|
|
—
|
|
25
|
|
|||||||
|
Corporate debt securities
|
—
|
|
81
|
|
—
|
|
81
|
|
|||||||
|
Equity securities
|
280
|
|
—
|
|
54
|
|
334
|
|
|||||||
|
Foreign government fixed income securities
|
—
|
|
1
|
|
—
|
|
1
|
|
|||||||
|
Other trust fund investments:
|
|||||||||||||||
|
U.S. government and federal agency obligations
|
1
|
|
—
|
|
—
|
|
1
|
|
|||||||
|
Derivative assets:
|
|||||||||||||||
|
Commodity contracts
|
622
|
|
1,449
|
|
149
|
|
2,220
|
|
|||||||
|
Total assets
|
$
|
986
|
|
$
|
1,616
|
|
$
|
220
|
|
$
|
2,822
|
|
|||
|
Derivative liabilities:
|
|
|
|||||||||||||
|
Commodity contracts
|
$
|
868
|
|
$
|
1,036
|
|
$
|
182
|
|
$
|
2,086
|
|
|||
|
Interest rate contracts
|
—
|
|
128
|
|
—
|
|
128
|
|
|||||||
|
Total liabilities
|
$
|
868
|
|
$
|
1,164
|
|
$
|
182
|
|
$
|
2,214
|
|
|||
|
(a)
|
Primarily consists of mutual funds held in a rabbi trusts for non-qualified deferred compensation plans for certain former employees and a total return swap that does not meet the definition of a derivative.
|
There have been
no
transfers during the year ended
December 31, 2016
between Levels 1 and 2. The following tables reconcile, for the years ended
December 31, 2016
and
2015
, the beginning and ending balances for financial instruments that are recognized at fair value in the consolidated financial statements at least annually using significant unobservable inputs:
|
|
For the Year Ended December 31, 2016
|
||||||||||||||
|
|
Fair Value Measurement Using Significant Unobservable Inputs (Level 3)
|
||||||||||||||
|
|
Debt
Securities
|
Trust Fund
Investments
|
Derivatives
(a)
|
Total
|
|||||||||||
|
|
(In millions)
|
||||||||||||||
|
Beginning balance as of January 1, 2016
|
$
|
17
|
|
$
|
54
|
|
$
|
(33
|
)
|
$
|
38
|
|
|||
|
Total gains/(losses) realized/unrealized:
|
|
||||||||||||||
|
Included in earnings
|
—
|
|
—
|
|
12
|
|
12
|
|
|||||||
|
Included in nuclear decommissioning obligations
|
—
|
|
(1
|
)
|
—
|
|
(1
|
)
|
|||||||
|
Purchases
|
—
|
|
1
|
|
(29
|
)
|
(28
|
)
|
|||||||
|
Transfers into Level 3
(b)
|
—
|
|
—
|
|
(18
|
)
|
(18
|
)
|
|||||||
|
Transfers out of Level 3
(b)
|
—
|
|
—
|
|
(1
|
)
|
(1
|
)
|
|||||||
|
Ending balance as of December 31, 2016
|
$
|
17
|
|
$
|
54
|
|
$
|
(69
|
)
|
$
|
2
|
|
|||
|
Losses for the period included in earnings attributable to the change in unrealized gains or losses relating to assets or liabilities still held as of December 31, 2016
|
$
|
—
|
|
$
|
—
|
|
$
|
(14
|
)
|
$
|
(14
|
)
|
|||
|
(a)
|
Consists of derivatives assets and liabilities, net.
|
|
(b)
|
Transfers in/out of Level 3 are related to the availability of external broker quotes, and are valued as of the end of the reporting period. All transfers in/out are with Level 2.
|
156
|
|
For the Year Ended December 31, 2015
|
||||||||||||||||||
|
|
Fair Value Measurement Using Significant Unobservable Inputs (Level 3)
|
||||||||||||||||||
|
|
Debt
Securities
|
Other
|
Trust Fund
Investments
|
Derivatives
(a)
|
Total
|
||||||||||||||
|
|
(In millions)
|
||||||||||||||||||
|
Beginning balance as of January 1, 2015
|
$
|
18
|
|
$
|
11
|
|
$
|
52
|
|
$
|
80
|
|
$
|
161
|
|
||||
|
Total losses realized/unrealized:
|
|
||||||||||||||||||
|
Included in earnings
|
(1
|
)
|
(11
|
)
|
—
|
|
(100
|
)
|
(112
|
)
|
|||||||||
|
Included in nuclear decommissioning obligations
|
—
|
|
—
|
|
(2
|
)
|
—
|
|
(2
|
)
|
|||||||||
|
Purchases
|
—
|
|
—
|
|
4
|
|
(19
|
)
|
(15
|
)
|
|||||||||
|
Transfers into Level 3
(b)
|
—
|
|
—
|
|
—
|
|
3
|
|
3
|
|
|||||||||
|
Transfer out of Level 3
(b)
|
—
|
|
—
|
|
—
|
|
3
|
|
3
|
|
|||||||||
|
Ending balance as of December 31, 2015
|
$
|
17
|
|
$
|
—
|
|
$
|
54
|
|
$
|
(33
|
)
|
$
|
38
|
|
||||
|
Losses for the period included in earnings attributable to the change in unrealized gains or losses relating to assets or liabilities still held as of December 31, 2015
|
$
|
—
|
|
$
|
—
|
|
$
|
—
|
|
$
|
(30
|
)
|
$
|
(30
|
)
|
||||
|
(a)
|
Consists of derivatives assets and liabilities, net.
|
|
(b)
|
Transfers in/out of Level 3 are related to the availability of external broker quotes, and are valued as of the end of the reporting period. All transfers in/out are with Level 2.
|
Realized and unrealized gains and losses included in earnings that are related to the energy derivatives are recorded in operating revenues and cost of operations.
Non-derivative fair value measurements
NRG's investments in debt securities are classified as Level 3 and consist of non-traded debt instruments that are valued based on third-party market value assessments.
The trust fund investments are held primarily to satisfy NRG's nuclear decommissioning obligations. These trust fund investments hold debt and equity securities directly and equity securities indirectly through commingled funds. The fair values of equity securities held directly by the trust funds are based on quoted prices in active markets and are categorized in Level 1. In addition, U.S. government and federal agency obligations are categorized as Level 1 because they trade in a highly liquid and transparent market. The fair values of corporate debt securities are based on evaluated prices that reflect observable market information, such as actual trade information of similar securities, adjusted for observable differences and are categorized in Level 2. Certain equity securities, classified as commingled funds, are analogous to mutual funds, are maintained by investment companies, and hold certain investments in accordance with a stated set of fund objectives. The fair value of the equity securities classified as commingled funds are based on net asset values per fund share (the unit of account), derived from the quoted prices in active markets of the underlying equity securities. However, because the shares in the commingled funds are not publicly quoted, not traded in an active market and are subject to certain restrictions regarding their purchase and sale, the commingled funds are categorized in Level 3. See also
Note 6
,
Nuclear Decommissioning Trust Fund
.
157
Derivative fair value measurements
A portion of the Company's contracts are exchange-traded contracts with readily available quoted market prices. A majority of NRG's contracts are non-exchange-traded contracts valued using prices provided by external sources, primarily price quotations available through brokers or over-the-counter and on-line exchanges. For the majority of NRG markets, the Company receives quotes from multiple sources. To the extent that NRG receives multiple quotes, the Company's prices reflect the average of the bid-ask mid-point prices obtained from all sources that NRG believes provide the most liquid market for the commodity. If the Company receives one quote, then the mid-point of the bid-ask spread for that quote is used. The terms for which such price information is available vary by commodity, region and product. A significant portion of the fair value of the Company's derivative portfolio is based on price quotes from brokers in active markets who regularly facilitate those transactions and the Company believes such price quotes are executable. The Company does not use third party sources that derive price based on proprietary models or market surveys. The remainder of the assets and liabilities represents contracts for which external sources or observable market quotes are not available. These contracts are valued based on various valuation techniques including but not limited to internal models based on a fundamental analysis of the market and extrapolation of observable market data with similar characteristics. Contracts valued with prices provided by models and other valuation techniques make up
7%
of derivative assets and
12%
of derivative liabilities. The fair value of each contract is discounted using a risk free interest rate. In addition, the Company applies a credit reserve to reflect credit risk, which for interest rate swaps is calculated utilizing the bilateral method based on published default probabilities. For commodities, to the extent that NRG's net exposure under a specific master agreement is an asset, the Company uses the counterparty's default swap rate. If the exposure under a specific master agreement is a liability, the Company uses NRG's default swap rate. For interest rate swaps and commodities, the credit reserve is added to the discounted fair value to reflect the exit price that a market participant would be willing to receive to assume NRG's liabilities or that a market participant would be willing to pay for NRG's assets. As of
December 31, 2016
, the credit reserve resulted in an
$11 million
decrease in fair value in operating revenue and cost of operations. As of December 31, 2015 the credit reserve resulted in a
$5 million
increase in fair value which is composed of a
$2 million
gain in OCI and a
$3 million
gain in operating revenue and cost of operations.
The fair values in each category reflect the level of forward prices and volatility factors as of
December 31, 2016
, and may change as a result of changes in these factors. Management uses its best estimates to determine the fair value of commodity and derivative contracts NRG holds and sells. These estimates consider various factors including closing exchange and over-the-counter price quotations, time value, volatility factors and credit exposure. It is possible, however, that future market prices could vary from those used in recording assets and liabilities from energy marketing and trading activities and such variations could be material.
NRG's significant positions classified as Level 3 include physical and financial power and physical coal executed in illiquid markets as well as financial transmission rights, or FTRs. The significant unobservable inputs used in developing fair value include illiquid power and coal location pricing which is derived as a basis to liquid locations. The basis spread is based on observable market data when available or derived from historic prices and forward market prices from similar observable markets when not available. For FTRs, NRG uses the most recent auction prices to derive the fair value.
The following tables quantify the significant unobservable inputs used in developing the fair value of the Company's Level 3 positions as of
December 31, 2016
and 2015:
|
Significant Unobservable Inputs
|
|||||||||||||||||||||||
|
December 31, 2016
|
|||||||||||||||||||||||
|
Fair Value
|
Input/Range
|
||||||||||||||||||||||
|
Assets
|
Liabilities
|
Valuation Technique
|
Significant Unobservable Input
|
Low
|
High
|
Weighted Average
|
|||||||||||||||||
|
(In millions)
|
|||||||||||||||||||||||
|
Power Contracts
|
$
|
40
|
|
$
|
107
|
|
Discounted Cash Flow
|
Forward Market Price (per MWh)
|
$
|
11
|
|
$
|
104
|
|
$
|
31
|
|
||||||
|
Coal Contracts
|
—
|
|
1
|
|
Discounted Cash Flow
|
Forward Market Price (per ton)
|
42
|
|
51
|
|
45
|
|
|||||||||||
|
FTRs
|
52
|
|
53
|
|
Discounted Cash Flow
|
Auction Prices (per MWh)
|
(22
|
)
|
17
|
|
—
|
|
|||||||||||
|
$
|
92
|
|
$
|
161
|
|
||||||||||||||||||
158
|
|
|||||||||||||||||||||||
|
Significant Unobservable Inputs
|
|||||||||||||||||||||||
|
December 31, 2015
|
|||||||||||||||||||||||
|
Fair Value
|
Input/Range
|
||||||||||||||||||||||
|
Assets
|
Liabilities
|
Valuation Technique
|
Significant Unobservable Input
|
Low
|
High
|
Weighted Average
|
|||||||||||||||||
|
(In millions)
|
|||||||||||||||||||||||
|
Power Contracts
|
$
|
86
|
|
$
|
100
|
|
Discounted Cash Flow
|
Forward Market Price (per MWh)
|
$
|
10
|
|
$
|
92
|
|
$
|
27
|
|
||||||
|
Coal Contracts
|
—
|
|
12
|
|
Discounted Cash Flow
|
Forward Market Price (per ton)
|
28
|
|
45
|
|
35
|
|
|||||||||||
|
FTRs
|
63
|
|
70
|
|
Discounted Cash Flow
|
Auction Prices (per MWh)
|
(98
|
)
|
87
|
|
—
|
|
|||||||||||
|
$
|
149
|
|
$
|
182
|
|
||||||||||||||||||
The following table provides sensitivity of fair value measurements to increases/(decreases) in significant unobservable inputs as of
December 31, 2016
and 2015:
|
Significant Unobservable Input
|
Position
|
Change In Input
|
Impact on Fair Value Measurement
|
|||
|
Forward Market Price Power/Coal
|
Buy
|
Increase/(Decrease)
|
Higher/(Lower)
|
|||
|
Forward Market Price Power/Coal
|
Sell
|
Increase/(Decrease)
|
Lower/(Higher)
|
|||
|
FTR Prices
|
Buy
|
Increase/(Decrease)
|
Higher/(Lower)
|
|||
|
FTR Prices
|
Sell
|
Increase/(Decrease)
|
Lower/(Higher)
|
|||
Under the guidance of ASC 815, entities may choose to offset cash collateral posted or received against the fair value of derivative positions executed with the same counterparties under the same master netting agreements. The Company has chosen not to offset positions as defined in ASC 815. As of
December 31, 2016
, the Company recorded
$203 million
of cash collateral posted and
$2 million
of cash collateral received on its balance sheet.
Concentration of Credit Risk
In addition to the credit risk discussion as disclosed in
Note 2
,
Summary of Significant Accounting Policies
, the following item is a discussion of the concentration of credit risk for the Company's financial instruments. Credit risk relates to the risk of loss resulting from non-performance or non-payment by counterparties pursuant to the terms of their contractual obligations. The Company monitors and manages credit risk through credit policies that include: (i) an established credit approval process; (ii) a daily monitoring of counterparties' credit limits; (iii) the use of credit mitigation measures such as margin, collateral, prepayment arrangements, or volumetric limits; (iv) the use of payment netting agreements; and (v) the use of master netting agreements that allow for the netting of positive and negative exposures of various contracts associated with a single counterparty. Risks surrounding counterparty performance and credit could ultimately impact the amount and timing of expected cash flows. The Company seeks to mitigate counterparty risk by having a diversified portfolio of counterparties. The Company also has credit protection within various agreements to call on additional collateral support if and when necessary. Cash margin is collected and held at the Company to cover the credit risk of the counterparty until positions settle.
159
Counterparty Credit Risk
As of
December 31, 2016
, counterparty credit exposure, excluding credit exposure from RTOs, ISOs, and registered commodity exchanges and certain long-term agreements, was
$231 million
and NRG held collateral (cash and letters of credit) against those positions of
$2 million
, resulting in a net exposure of
$229 million
. Approximately
95%
of the Company's exposure before collateral is expected to roll off by the end of
2018
. Counterparty credit exposure is valued through observable market quotes and discounted at a risk free interest rate. The following tables highlight net counterparty credit exposure by industry sector and by counterparty credit quality. Net counterparty credit exposure is defined as the aggregate net asset position for NRG with counterparties where netting is permitted under the enabling agreement and includes all cash flow, mark-to-market and NPNS, and non-derivative transactions. The exposure is shown net of collateral held, and includes amounts net of receivables or payables.
|
Category
|
Net Exposure
(a) (b)
(% of Total)
|
|
|
Utilities, energy merchants, marketers and other
|
100
|
|
|
Total
|
100
|
%
|
|
Category
|
Net Exposure
(a) (b)
(% of Total)
|
|
|
Investment grade
|
67
|
%
|
|
Non-Investment grade/Non-Rated
|
33
|
|
|
Total
|
100
|
%
|
|
(a)
|
Counterparty credit exposure excludes uranium and coal transportation contracts because of the unavailability of market prices.
|
|
(b)
|
The figures in the tables above exclude potential counterparty credit exposure related to RTOs, ISOs, registered commodity exchanges and certain long term contracts.
|
NRG has counterparty credit risk exposure to certain counterparties, each of which represent more than
10%
of total net exposure discussed above. The aggregate of such counterparties' exposure was
$80 million
as of December 31, 2016. Changes in hedge positions and market prices will affect credit exposure and counterparty concentration. Given the credit quality, diversification and term of the exposure in the portfolio, NRG does not anticipate a material impact on the Company's financial position or results of operations from nonperformance by any of NRG's counterparties.
RTOs and ISOs
The Company participates in the organized markets of CAISO, ERCOT, ISO-NE, MISO, NYISO and PJM, known as RTOs or ISOs. Trading in these markets is approved by FERC, or in the case of ERCOT, approved by the PUCT and includes credit policies that, under certain circumstances, require that losses arising from the default of one member on spot market transactions be shared by the remaining participants. As a result, the counterparty credit risk to these markets is limited to NRG’s share of overall market and are excluded from the above exposures.
Exchange Traded Transactions
The Company enters into commodity transactions on registered exchanges, notably ICE and NYMEX. These clearinghouses act as the counterparty and transactions are subject to extensive collateral and margining requirements. As a result, these commodity transactions have limited counterparty credit risk.
Long Term Contracts
Counterparty credit exposure described above excludes credit risk exposure under certain long term agreements, including California tolling agreements, Gulf Coast load obligations, wind and solar PPAs. As external sources or observable market quotes are not available to estimate such exposure, the Company values these contracts based on various techniques including, but not limited to, internal models based on a fundamental analysis of the market and extrapolation of observable market data with similar characteristics. Based on these valuation techniques, as of
December 31, 2016
, aggregate credit risk exposure managed by NRG to these counterparties was approximately
$4.1 billion
, including
$2.6 billion
related to assets of NRG Yield, Inc., for the next
five
years. This amount excludes potential credit exposures for projects with long term PPAs that have not reached commercial operations. The majority of these power contracts are with utilities or public power entities with strong credit quality and public utility commission or other regulatory support. However, such regulated utility counterparties can be impacted by changes in government regulations, which NRG is unable to predict.
160
Retail Customer Credit Risk
The Company is exposed to retail credit risk through the Company's retail electricity providers, which serve C&I customers and the Mass market. Retail credit risk results in losses when a customer fails to pay for services rendered. The losses may result from both nonpayment of customer accounts receivable and the loss of in-the-money forward value. The Company manages retail credit risk through the use of established credit policies that include monitoring of the portfolio and the use of credit mitigation measures such as deposits or prepayment arrangements.
As of
December 31, 2016
, the Company's retail customer credit exposure to C&I and Mass customers was diversified across many customers and various industries, as well as government entities. The Company is also subject to risk with respect to its residential solar customers. The Company's bad debt expense was
$48 million
,
$64 million
, and
$64 million
for the years ending December 31,
2016
,
2015
, and
2014
, respectively. Current economic conditions may affect the Company's customers' ability to pay bills in a timely manner, which could increase customer delinquencies and may lead to an increase in bad debt expense.
Note 5
—
Accounting for Derivative Instruments and Hedging Activities
ASC 815 requires the Company to recognize all derivative instruments on the balance sheet as either assets or liabilities and to measure them at fair value each reporting period unless they qualify for a NPNS exception. The Company may elect to designate certain derivatives as cash flow hedges, if certain conditions are met, and defer the effective portion of the change in fair value of the derivatives to accumulated OCI, until the hedged transactions occur and are recognized in earnings. The ineffective portion of a cash flow hedge is immediately recognized in earnings.
For derivatives designated as hedges of the fair value of assets or liabilities, the changes in fair value of both the derivative and the hedged transaction are recorded in current earnings.
For derivatives that are not designated as cash flow hedges or do not qualify for hedge accounting treatment, the changes in the fair value will be immediately recognized in earnings. Certain derivative instruments may qualify for the NPNS exception and are therefore exempt from fair value accounting treatment. ASC 815 applies to NRG's energy related commodity contracts, interest rate swaps, and equity contracts.
As the Company engages principally in the trading and marketing of its generation assets and retail businesses, some of NRG's commercial activities qualify for hedge accounting. In order for the generation assets to qualify, the physical generation and sale of electricity should be highly probable at inception of the trade and throughout the period it is held, as is the case with the Company's baseload plants. For this reason, many trades in support of NRG's baseload units normally qualify for NPNS or cash flow hedge accounting treatment, and trades in support of NRG's peaking units' asset optimization will generally not qualify for hedge accounting treatment, with any changes in fair value likely to be reflected on a mark-to-market basis in the statement of operations. Most of the retail load contracts either qualify for the NPNS exception or fail to meet the criteria for a derivative and the majority of the retail supply and fuels supply contracts are recorded under mark-to-market accounting. All of NRG's hedging and trading activities are subject to limits within the Company's Risk Management Policy.
Energy-Related Commodities
To manage the commodity price risk associated with the Company's competitive supply activities and the price risk associated with wholesale power sales from the Company's electric generation facilities and retail power sales from NRG's retail businesses, NRG enters into a variety of derivative and non-derivative hedging instruments, utilizing the following:
|
•
|
Forward contracts, which commit NRG to purchase or sell energy commodities or purchase fuels in the future;
|
|
•
|
Futures contracts, which are exchange-traded standardized commitments to purchase or sell a commodity or financial instrument;
|
|
•
|
Swap agreements, which require payments to or from counterparties based upon the differential between two prices for a predetermined contractual, or notional, quantity;
|
|
•
|
Option contracts, which convey to the option holder the right but not the obligation to purchase or sell a commodity;
|
|
•
|
Extendable swaps, which include a combination of swaps and options executed simultaneously for different periods. This combination of instruments allows NRG to sell out-year volatility through call options in exchange for natural gas swaps with fixed prices in excess of the market price for natural gas at that time. The above-market swap combined with its later-year call option are priced in aggregate at market at the trade's inception; and
|
|
•
|
Weather and hurricane derivative products used to mitigate a portion of retail's lost revenue due to weather.
|
161
The objectives for entering into derivative contracts designated as hedges include:
|
•
|
Fixing the price for a portion of anticipated future electricity sales that provides an acceptable return on the Company's electric generation operations;
|
|
•
|
Fixing the price of a portion of anticipated fuel purchases for the operation of the Company's power plants; and
|
|
•
|
Fixing the price of a portion of anticipated power purchases for the Company's retail sales.
|
NRG's trading and hedging activities are subject to limits within the Company's Risk Management Policy. These contracts are recognized on the balance sheet at fair value and changes in the fair value of these derivative financial instruments are recognized in earnings.
As of
December 31, 2016
, NRG's derivative assets and liabilities consisted primarily of the following:
|
•
|
Forward and financial contracts for the purchase/sale of electricity and related products economically hedging NRG's generation assets' forecasted output or NRG's retail load obligations through 2031;
|
|
•
|
Forward and financial contracts for the purchase of fuel commodities relating to the forecasted usage of NRG's generation assets through 2018; and
|
|
•
|
Other energy derivatives instruments extending through 2024.
|
Also, as of
December 31, 2016
, NRG had other energy-related contracts that did not meet the definition of a derivative instrument or qualified for the NPNS exception and were therefore exempt from fair value accounting treatment as follows:
|
•
|
Load-following forward electric sale contracts extending through 2026;
|
|
•
|
Power tolling contracts through 2039;
|
|
•
|
Coal purchase contracts through 2021;
|
|
•
|
Power transmission contracts through 2025;
|
|
•
|
Natural gas transportation contracts and storage agreements through 2030; and
|
|
•
|
Coal transportation contracts through 2029.
|
Interest Rate Swaps
NRG is exposed to changes in interest rates through the Company's issuance of variable rate debt. In order to manage the Company's interest rate risk, NRG enters into interest rate swap agreements. As of
December 31, 2016
, NRG had interest rate derivative instruments on recourse debt extending through 2021 and non-recourse debt extending through 2036, the majority of which are designated as cash flow hedges.
Volumetric Underlying Derivative Transactions
The following table summarizes the net notional volume buy/(sell) of NRG's open derivative transactions broken out by commodity, excluding those derivatives that qualified for the NPNS exception as of
December 31, 2016
and
2015
. Option contracts are reflected using delta volume. Delta volume equals the notional volume of an option adjusted for the probability that the option will be in-the-money at its expiration date.
|
|
|
Total Volume
|
||||||
|
Commodity
|
Units
|
December 31, 2016
|
December 31, 2015
|
|||||
|
|
|
(In millions)
|
||||||
|
Emissions
|
Short Ton
|
—
|
|
1
|
|
|||
|
Coal
|
Short Ton
|
41
|
|
35
|
|
|||
|
Natural Gas
|
MMBtu
|
85
|
|
293
|
|
|||
|
Oil
|
Barrel
|
1
|
|
1
|
|
|||
|
Power
|
MWh
|
(28
|
)
|
(74
|
)
|
|||
|
Capacity
|
MW/Day
|
(1
|
)
|
(1
|
)
|
|||
|
Interest
|
Dollars
|
$
|
3,429
|
|
$
|
2,326
|
|
|
|
Equity
|
Shares
|
1
|
|
1
|
|
|||
The decrease in the natural gas position was primarily the result of the settlement of generation hedge positions and retail hedge positions. The increase in the interest rate position was primarily the result of entering into new interest rate swaps to hedge the Term Loan Facility, as described in
Note 12
,
Debt and Capital Leases
.
162
Fair Value of Derivative Instruments
The following table summarizes the fair value within the derivative instrument valuation on the balance sheet:
|
|
Fair Value
|
||||||||||||||
|
|
Derivative Assets
|
Derivative Liabilities
|
|||||||||||||
|
(In millions)
|
December 31, 2016
|
December 31, 2015
|
December 31, 2016
|
December 31, 2015
|
|||||||||||
|
Derivatives Designated as Cash Flow or Fair Value Hedges
:
|
|
|
|
|
|||||||||||
|
Interest rate contracts current
|
$
|
—
|
|
$
|
—
|
|
$
|
28
|
|
$
|
42
|
|
|||
|
Interest rate contracts long-term
|
12
|
|
—
|
|
41
|
|
68
|
|
|||||||
|
Total Derivatives Designated as Cash Flow or Fair Value Hedges
|
12
|
|
—
|
|
69
|
|
110
|
|
|||||||
|
Derivatives Not Designated as Cash Flow or Fair Value Hedges
:
|
|
|
|
|
|||||||||||
|
Interest rate contracts current
|
—
|
|
—
|
|
7
|
|
5
|
|
|||||||
|
Interest rate contracts long-term
|
37
|
|
—
|
|
12
|
|
13
|
|
|||||||
|
Commodity contracts current
|
1,062
|
|
1,915
|
|
1,049
|
|
1,674
|
|
|||||||
|
Commodity contracts long-term
|
140
|
|
305
|
|
241
|
|
412
|
|
|||||||
|
Total Derivatives Not Designated as Cash Flow or Fair Value Hedges
|
1,239
|
|
2,220
|
|
1,309
|
|
2,104
|
|
|||||||
|
Total Derivatives
|
$
|
1,251
|
|
$
|
2,220
|
|
$
|
1,378
|
|
$
|
2,214
|
|
|||
The Company has elected to present derivative assets and liabilities on the balance sheet on a trade-by-trade basis and does not offset amounts at the counterparty master agreement level. In addition, collateral received or paid on the Company's derivative assets or liabilities are recorded on a separate line item on the balance sheet. The following table summarizes the offsetting derivatives by counterparty master agreement level and collateral received or paid:
|
Gross Amounts Not Offset in the Statement of Financial Position
|
|||||||||||||||
|
Gross Amounts of Recognized Assets/Liabilities
|
Derivative Instruments
|
Cash Collateral (Held)/Posted
|
Net Amount
|
||||||||||||
|
As of December 31, 2016
|
(In millions)
|
||||||||||||||
|
Commodity contracts:
|
|||||||||||||||
|
Derivative assets
|
$
|
1,202
|
|
$
|
(1,005
|
)
|
$
|
(1
|
)
|
$
|
196
|
|
|||
|
Derivative liabilities
|
(1,290
|
)
|
1,005
|
|
14
|
|
(271
|
)
|
|||||||
|
Total commodity contracts
|
(88
|
)
|
|
—
|
|
13
|
|
(75
|
)
|
||||||
|
Interest rate contracts:
|
|||||||||||||||
|
Derivative assets
|
49
|
|
(4
|
)
|
—
|
|
45
|
|
|||||||
|
Derivative liabilities
|
(88
|
)
|
4
|
|
—
|
|
(84
|
)
|
|||||||
|
Total interest rate contracts
|
(39
|
)
|
—
|
|
—
|
|
(39
|
)
|
|||||||
|
Total derivative instruments
|
$
|
(127
|
)
|
$
|
—
|
|
$
|
13
|
|
$
|
(114
|
)
|
|||
163
|
Gross Amounts Not Offset in the Statement of Financial Position
|
|||||||||||||||
|
Gross Amounts of Recognized Assets/Liabilities
|
Derivative Instruments
|
Cash Collateral (Held)/Posted
|
Net Amount
|
||||||||||||
|
As of December 31, 2015
|
(In millions)
|
||||||||||||||
|
Commodity contracts:
|
|||||||||||||||
|
Derivative assets
|
$
|
2,220
|
|
$
|
(1,616
|
)
|
$
|
(113
|
)
|
$
|
491
|
|
|||
|
Derivative liabilities
|
(2,086
|
)
|
1,616
|
|
271
|
|
(199
|
)
|
|||||||
|
Total commodity contracts
|
134
|
|
—
|
|
158
|
|
292
|
|
|||||||
|
Interest rate contracts:
|
|||||||||||||||
|
Derivative liabilities
|
(128
|
)
|
—
|
|
—
|
|
(128
|
)
|
|||||||
|
Total derivative instruments
|
$
|
6
|
|
|
$
|
—
|
|
|
$
|
158
|
|
$
|
164
|
|
|
Accumulated Other Comprehensive Income
The following tables summarize the effects on NRG's accumulated OCI balance attributable to cash flow hedge derivatives, net of tax:
|
|
Year Ended December 31, 2016
|
||||||
|
|
Interest
Rate
|
Total
|
|||||
|
|
(In millions)
|
||||||
|
Accumulated OCI balance at December 31, 2015
|
$
|
(101
|
)
|
$
|
(101
|
)
|
|
|
Reclassified from accumulated OCI to income:
|
|
|
|||||
|
Due to realization of previously deferred amounts
|
21
|
|
21
|
|
|||
|
Mark-to-market of cash flow hedge accounting contracts
|
14
|
|
14
|
|
|||
|
Accumulated OCI balance at December 31, 2016, net of $16 tax
|
$
|
(66
|
)
|
$
|
(66
|
)
|
|
|
Losses expected to be realized from other comprehensive loss during the next 12 months, net of $4 tax
|
$
|
(16
|
)
|
$
|
(16
|
)
|
|
There were
no
gains or losses recognized in income from the ineffective portion of cash flow hedges for the year ended
December 31, 2016
.
|
|
Year Ended December 31, 2015
|
||||||||||
|
|
Energy
Commodities
|
Interest
Rate
|
Total
|
||||||||
|
|
(In millions)
|
||||||||||
|
Accumulated OCI balance at December 31, 2014
|
$
|
(1
|
)
|
$
|
(67
|
)
|
$
|
(68
|
)
|
||
|
Reclassified from accumulated OCI to income:
|
|
|
|
||||||||
|
Due to realization of previously deferred amounts
|
1
|
|
14
|
|
15
|
|
|||||
|
Mark-to-market of cash flow hedge accounting contracts
|
—
|
|
(48
|
)
|
(48
|
)
|
|||||
|
Accumulated OCI balance at December 31, 2015, net of $16 tax
|
$
|
—
|
|
$
|
(101
|
)
|
$
|
(101
|
)
|
||
There were
no
gains or losses recognized in income from the ineffective portion of cash flow hedges for the year ended
December 31, 2015
.
|
|
Year Ended December 31, 2014
|
||||||||||
|
|
Energy
Commodities
|
Interest
Rate
|
Total
|
||||||||
|
|
(In millions)
|
||||||||||
|
Accumulated OCI balance at December 31, 2013
|
$
|
(1
|
)
|
$
|
(22
|
)
|
$
|
(23
|
)
|
||
|
Reclassified from accumulated OCI to income:
|
|||||||||||
|
Due to realization of previously deferred amounts
|
—
|
|
13
|
|
13
|
|
|||||
|
Mark-to-market of cash flow hedge accounting contracts
|
—
|
|
(58
|
)
|
(58
|
)
|
|||||
|
Accumulated OCI balance at December 31, 2014, net of $35 tax
|
$
|
(1
|
)
|
$
|
(67
|
)
|
$
|
(68
|
)
|
||
164
There were
no
gains or losses recognized in income from the ineffective portion of cash flow hedges for the year ended
December 31, 2014
.
Amounts reclassified from accumulated OCI into income and amounts recognized in income from the ineffective portion of cash flow hedges are recorded to operating revenue for commodity contracts and interest expense for interest rate contracts.
Accounting guidelines require a high degree of correlation between the derivative and the hedged item throughout the period in order to qualify as a cash flow hedge. As of December 31, 2016, the Company's regression analysis for Viento Funding II interest rate swaps, while positively correlated, did not meet the required threshold for cash flow hedge accounting. As a result, the Company de-designated the Viento Funding II cash flow hedges as of December 31, 2016, and will prospectively mark these derivatives to market through the income statement.
Impact of Derivative Instruments on the Statement of Operations
Unrealized gains and losses associated with changes in the fair value of derivative instruments not accounted for as cash flow hedges and ineffectiveness of hedge derivatives are reflected in current period earnings.
The following table summarizes the pre-tax effects of economic hedges that have not been designated as cash flow hedges, ineffectiveness on cash flow hedges, and trading activity on the Company's statement of operations. The effect of commodity hedges is included within operating revenues and cost of operations and the effect of interest rate hedges is included in interest expense.
|
|
Year Ended December 31,
|
||||||||||
|
|
2016
|
2015
|
2014
|
||||||||
|
|
(In millions)
|
||||||||||
|
Unrealized mark-to-market results
|
|
|
|||||||||
|
Reversal of previously recognized unrealized gains on settled positions related to economic hedges
|
$
|
(245
|
)
|
$
|
(275
|
)
|
$
|
(15
|
)
|
||
|
Reversal of acquired gain positions related to economic hedges
|
(60
|
)
|
(106
|
)
|
(333
|
)
|
|||||
|
Net unrealized gains on open positions related to economic hedges
|
20
|
|
9
|
|
361
|
|
|||||
|
Total unrealized mark-to-market (losses)/gains for economic hedging activities
|
(285
|
)
|
(372
|
)
|
13
|
|
|||||
|
Reversal of previously recognized unrealized losses/(gains) on settled positions related to trading activity
|
10
|
|
(46
|
)
|
1
|
|
|||||
|
Reversal of acquired gain positions related to trading activity
|
—
|
|
(14
|
)
|
(32
|
)
|
|||||
|
Net unrealized gains/(losses) on open positions related to trading activity
|
18
|
|
(16
|
)
|
45
|
|
|||||
|
Total unrealized mark-to-market gains/(losses) for trading activity
|
28
|
|
(76
|
)
|
14
|
|
|||||
|
Total unrealized (losses)/gains
|
$
|
(257
|
)
|
$
|
(448
|
)
|
$
|
27
|
|
||
|
|
Year Ended December 31,
|
||||||||||
|
|
2016
|
2015
|
2014
|
||||||||
|
|
(In millions)
|
||||||||||
|
Unrealized (losses)/gains included in operating revenues
|
$
|
(837
|
)
|
$
|
(320
|
)
|
$
|
515
|
|
||
|
Unrealized gains/(losses) included in cost of operations
|
580
|
|
(128
|
)
|
(488
|
)
|
|||||
|
Total impact to statement of operations — energy commodities
|
$
|
(257
|
)
|
$
|
(448
|
)
|
$
|
27
|
|
||
|
Total impact to statement of operations — interest rate contracts
|
$
|
36
|
|
$
|
17
|
|
$
|
(31
|
)
|
||
The reversal of gain or loss positions acquired as part of acquisitions were valued based upon the forward prices on the acquisition dates. The roll-off amounts were offset by realized gains or losses at the settled prices and are reflected in revenue or cost of operations during the same period.
For the year ended
December 31, 2016
, the
$20 million
gain from economic hedge positions was primarily the result of an increase in the value of forward purchases of natural gas due to an increase in natural gas prices.
165
During 2016, the Company closed out and financially settled certain open positions with counterparties. The closure and financial settlements with these counterparties were necessary to manage the increase in collateral posting requirements following rating agency downgrades for GenOn and to reduce expected collateral costs associated with exchange cleared hedge transactions. GenOn realized approximately
$38 million
due to the closure and financial settlement of all open positions with one of GenOn's counterparties during the second quarter of 2016, for which
$18 million
,
$19 million
and
$1 million
would have been realized during the remainder of 2016, 2017 and 2018, respectively. During the third quarter of 2016, GenOn realized
$98 million
due to the closure and financial settlement of certain positions with an additional counterparty for which
$82 million
,
$13 million
and
$3 million
would have otherwise been realized in 2017, 2018, and 2019, respectively. GenOn has entered into additional transactions with NRG Power Marketing LLC and an external counterparty in order to re-hedge the positions settled with certain counterparties.
For the year ended
December 31, 2015
, the
$9 million
gain from economic hedge positions was primarily the result of an increase in the value of forward sales of electricity due to a decrease in power prices.
For the year ended
December 31, 2014
, the
$361 million
gain from economic hedge positions was primarily the result of an increase in the value of forward sales of natural gas due to a decrease in natural gas prices.
During 2014, NRG had interest rate swaps designated as cash flow hedges on the Dandan solar project. The notional amount on the swaps exceeded the actual debt draws on the project. As such, the Company discontinued cash flow hedge accounting for these contracts and
$6 million
of losses previously deferred in OCI was recognized in the statement of operations for the year ended
December 31, 2014
.
Credit Risk Related Contingent Features
Certain of the Company's hedging agreements contain provisions that require the Company to post additional collateral if the counterparty determines that there has been deterioration in credit quality, generally termed "adequate assurance" under the agreements, or require the Company to post additional collateral if there were a one notch downgrade in the Company's credit rating. The collateral required for contracts that have adequate assurance clauses that are in net liability positions as of
December 31, 2016
was
$36 million
. The collateral required for contracts with credit rating contingent features that are in a net liability position as of
December 31, 2016
was
$56 million
. The Company is also a party to certain marginable agreements under which it has a net liability position, but the counterparty has not called for the collateral due, which was approximately
$14 million
as of
December 31, 2016
.
See
Note 4
,
Fair Value of Financial Instruments
,
for discussion regarding concentration of credit risk.
Note 6
—
Nuclear Decommissioning Trust Fund
NRG's Nuclear Decommissioning Trust Fund assets, which are for the decommissioning of STP, are comprised of securities classified as available-for-sale and recorded at fair value based on actively quoted market prices. Although NRG is responsible for managing the decommissioning of its
44%
interest in STP, the predecessor utilities that owned STP are authorized by the PUCT to collect decommissioning funds from their ratepayers to cover decommissioning costs on behalf of NRG. NRC requirements determine the decommissioning cost estimate which is the minimum required level of funding. In the event that funds from the ratepayers that accumulate in the nuclear decommissioning trust are ultimately determined to be inadequate to decommission the STP facilities, the utilities will be required to collect through rates charged to rate payers all additional amounts, with no obligation from NRG, provided that NRG has complied with PUCT rules and regulations regarding decommissioning trusts. Following completion of the decommissioning, if surplus funds remain in the decommissioning trusts, any excess will be refunded to the respective ratepayers of the utilities.
NRG accounts for the Nuclear Decommissioning Trust Fund in accordance with ASC 980,
Regulated Operations
, or ASC 980, because the Company's nuclear decommissioning activities are subject to approval by the PUCT, with regulated rates that are designed to recover all decommissioning costs and that can be charged to and collected from the ratepayers per PUCT mandate. Since the Company is in compliance with PUCT rules and regulations regarding decommissioning trusts and the cost of decommissioning is the responsibility of the Texas ratepayers, not NRG, all realized and unrealized gains or losses (including other-than-temporary impairments) related to the Nuclear Decommissioning Trust Fund are recorded to the Nuclear Decommissioning Trust liability and are not included in net income or accumulated other comprehensive income, consistent with regulatory treatment.
166
The following table summarizes the aggregate fair values and unrealized gains and losses (including other-than-temporary impairments) for the securities held in the trust funds, as well as information about the contractual maturities of those securities.
|
|
As of December 31, 2016
|
As of December 31, 2015
|
|||||||||||||||||||||||||||
|
(In millions, except otherwise noted)
|
Fair
Value
|
Unrealized
Gains
|
Unrealized
Losses
|
Weighted-
average
maturities
(in years)
|
Fair
Value
|
Unrealized
Gains
|
Unrealized
Losses
|
Weighted-
average
maturities
(in years)
|
|||||||||||||||||||||
|
Cash and cash equivalents
|
$
|
25
|
|
$
|
—
|
|
$
|
—
|
|
—
|
|
$
|
6
|
|
$
|
—
|
|
$
|
—
|
|
—
|
|
|||||||
|
U.S. government and federal agency obligations
|
73
|
|
1
|
|
—
|
|
11
|
|
55
|
|
1
|
|
—
|
|
11
|
|
|||||||||||||
|
Federal agency mortgage-backed securities
|
62
|
|
1
|
|
1
|
|
25
|
|
59
|
|
1
|
|
—
|
|
25
|
|
|||||||||||||
|
Commercial mortgage-backed securities
|
17
|
|
—
|
|
1
|
|
26
|
|
25
|
|
—
|
|
2
|
|
28
|
|
|||||||||||||
|
Corporate debt securities
|
84
|
|
1
|
|
2
|
|
11
|
|
81
|
|
1
|
|
1
|
|
10
|
|
|||||||||||||
|
Equity securities
|
346
|
|
214
|
|
—
|
|
—
|
|
334
|
|
199
|
|
—
|
|
—
|
|
|||||||||||||
|
Foreign government fixed income securities
|
3
|
|
—
|
|
—
|
|
9
|
|
1
|
|
—
|
|
—
|
|
9
|
|
|||||||||||||
|
Total
|
$
|
610
|
|
$
|
217
|
|
$
|
4
|
|
|
|
$
|
561
|
|
$
|
202
|
|
$
|
3
|
|
|
|
|||||||
The following table summarizes proceeds from sales of available-for-sale securities and the related realized gains and losses from these sales. The cost of securities sold is determined using the specific identification method.
|
|
Year Ended December 31,
|
||||||||||
|
|
2016
|
2015
|
2014
|
||||||||
|
|
(In millions)
|
||||||||||
|
Realized gains
|
$
|
26
|
|
$
|
21
|
|
$
|
29
|
|
||
|
Realized losses
|
11
|
|
14
|
|
8
|
|
|||||
|
Proceeds from sale of securities
|
510
|
|
631
|
|
600
|
|
|||||
Note 7
—
Inventory
Inventory consisted of:
|
|
As of December 31,
|
||||||
|
|
2016
|
2015
|
|||||
|
|
(In millions)
|
||||||
|
Fuel oil
|
$
|
289
|
|
$
|
312
|
|
|
|
Coal/Lignite
|
334
|
|
471
|
|
|||
|
Natural gas
|
28
|
|
12
|
|
|||
|
Spare parts
|
413
|
|
437
|
|
|||
|
Other
|
47
|
|
20
|
|
|||
|
Total Inventory
|
$
|
1,111
|
|
|
$
|
1,252
|
|
During the year ended December 31, 2015, the Company recorded a lower of weighted average cost or market adjustment related to fuel oil of
$19 million
.
167
Note 8
—
Notes Receivable
Notes receivable consist of fixed and variable rate notes related primarily to amounts owed to the Company from transmission owners for certain projects for the financing of network upgrades. The Company's notes receivable were as follows:
|
|
As of December 31,
|
||||||
|
|
2016
|
2015
|
|||||
|
|
(In millions)
|
||||||
|
Notes receivable
|
$
|
34
|
|
$
|
73
|
|
|
|
Less current maturities
(a)
|
17
|
|
20
|
|
|||
|
Total notes receivable — non-current
|
$
|
17
|
|
$
|
53
|
|
|
|
(a)
|
The current portion of notes receivable is recorded in prepayments and other current assets on the consolidated balance sheets.
|
Note 9
—
Property, Plant and Equipment
The Company's major classes of property, plant, and equipment were as follows:
|
|
As of December 31,
|
Depreciable
|
|||||||
|
|
2016
|
2015
|
Lives
|
||||||
|
|
(In millions)
|
|
|||||||
|
Facilities and equipment
|
$
|
21,445
|
|
$
|
21,633
|
|
1-40 Years
|
||
|
Land and improvements
|
1,026
|
|
1,226
|
|
|||||
|
Nuclear fuel
|
601
|
|
545
|
|
5 Years
|
||||
|
Office furnishings and equipment
|
457
|
|
462
|
|
2-10 Years
|
||||
|
Construction in progress
|
697
|
|
627
|
|
|
||||
|
Total property, plant, and equipment
|
24,226
|
|
24,493
|
|
|
||||
|
Accumulated depreciation
|
(6,314
|
)
|
(5,761
|
)
|
|
||||
|
Net property, plant, and equipment
|
$
|
17,912
|
|
$
|
18,732
|
|
|
||
The Company decreased accumulated depreciation and facilities and equipment within total property, plant and equipment by approximately
$1 billion
, respectively, to adjust amounts previously presented as of December 31, 2015. This adjustment had no impact on net assets at December 31, 2015. Accordingly, the Company does not consider the adjustment to be material to the consolidated balance sheet. Consolidated operating income and net income for the year ended December 31, 2016 were not impacted by the adjustment.
The Company recorded long-lived asset impairments during the years ended
December 31, 2016
and
2015
, as further described in
Note 10
,
Asset Impairments
.
Note 10
—
Asset Impairments
2016 Impairment Losses
Rockford
—
As described in
Note 3
,
Business Acquisitions and Dispositions
, on May 12, 2016, the Company entered into an agreement with RA Generation, LLC to sell
100%
of its interests in the Rockford generating stations for cash consideration of
$55 million
. The transaction triggered an indicator of impairment as the sale price was less than the carrying amount of the assets, and, as a result, the assets were considered to be impaired. The Company measured the impairment loss as the difference between the carrying amount of the assets and the agreed-upon sale price. The Company recorded an impairment loss of
$17 million
during the year ended December 31, 2016, to reduce the carrying amount of the assets held for sale to the fair market value.
168
Mandalay and Ormond Beach
—
On May 26
,
2016, the CPUC rejected a multi-year resource adequacy contract between Mandalay and SCE. Also during the second quarter of 2016, the Statewide Advisory Committee on Cooling Water Intake Structures, or SACCWIS, issued a draft April 2016 Report noting that CAISO plans to continue to assume in its transmission studies that Ormond Beach will not operate after December 31, 2020, the deadline for Ormond Beach compliance with California regulations to mitigate once-through cooling (OTC) impacts. The Company does not anticipate that contracts of sufficient value can be secured to support the significant investment required to design, permit, construct and operate measures required for OTC compliance. As a result, on May 6, 2016, the Company notified SACCWIS that it does not expect to continue to operate Ormond Beach beyond 2020. Additionally, during the second quarter of 2016, CAISO issued its Local Capacity Requirements report for 2017 indicating unfavorable changes within the local reliability areas in which both Mandalay and Ormond Beach are located. The culmination of these events were considered to be indicators of impairment and as a result, the Company performed impairment tests for the Mandalay and Ormond Beach assets. Based on the results of the impairment tests, the Company determined that the carrying amount of these assets was higher than the estimated future net cash flows expected to be generated by the respective assets and that the Mandalay and Ormond Beach assets were impaired. The fair value of the Mandalay and Ormond Beach operating units was determined using the income approach which utilizes estimates of discounted future cash flows, which were Level 3 fair value measurements and include key inputs such as forecasted contract prices, forecasted operating expenses and discount rates. The Company measured the impairment losses as the difference between the carrying amount of the Mandalay and Ormond Beach operating units and the present value of the estimated future net cash flows for each respective operating unit. The Company recorded an impairment loss of
$16 million
and
$43 million
for Mandalay and Ormond Beach, respectively, during the second quarter of 2016.
In addition, during the fourth quarter of 2016 the declining prices for resource adequacy contracts available in the reliability sub-area which Ormond Beach operates in further reduced anticipated cash flows to be generated from Ormond Beach through its anticipated retirement in 2020. This was considered to be an indicator of impairment and as a result, the Company performed an impairment test for the Ormond Beach assets. The Company determined that the carrying amount of these assets was higher than the estimated future net cash flows expected to be generated by the assets and that the Ormond Beach assets were impaired. The fair value of the Ormond Beach operating unit was determined using the income approach which utilizes estimates of discounted future cash flows, which were Level 3 fair value measurements and include key inputs such as forecasted contract prices, forecasted operating expenses and discount rates. During the fourth quarter of 2016, the Company recorded an additional impairment loss of
$28 million
for Ormond Beach.
Wind Facilities
— During the fourth quarter of 2016, as the Company updated its estimated future cash flows in connection with the preparation of its annual budget, the Company determined that the cash flows for the Elbow Creek and Goat Wind projects, located in Texas and the Forward project, located in Pennsylvania were below the carrying value of the related assets, primarily driven by the declining merchant power prices in post-contract periods, and the assets were considered impaired. The fair values of the facilities were determined using an income approach by applying a discounted cash flow methodology to the long-term budgets for each respective plant. The income approach utilized estimates of discounted future cash flows, which were Level 3 fair value measurements and include key inputs, such as forecasted power prices, operations and maintenance expense and discount rates. The Company measured the impairment loss as the difference between the carrying amount and the fair value of the assets and recorded impairment losses of
$117 million
,
$60 million
and
$6 million
for Elbow Creek, Goat Wind and Forward, respectively.
Long Beach
—
During the fourth quarter of 2016, the Company determined that by the end of 2017 it would retire its Long Beach generation station located in Long Beach, California. The generating station was not awarded a PPA, in the SCE's capacity auction during the fourth quarter of 2016 and the current PPA will expire on July 31, 2017. The Company considered this to be an indicator of impairment and performed an impairment test. The Company measured the impairment loss as the difference between the carrying amount and the fair value of the assets and recorded an impairment loss of
$36 million
.
Keystone and Conemaugh Leased Interests
—
During the fourth quarter of 2016, the Company revised its estimated future cash flows in connection with the preparation of its annual budget. The Company noted the cash flows for the leased interests in Keystone and Conemaugh were below the carrying value of the related assets, primarily driven by a reduction in long-term energy and capacity prices in PJM, and the assets were impaired. The fair value of the interests in Keystone and Conemaugh were determined using the income approach which utilizes estimates of discounted future cash flows, which were Level 3 fair value measurements and include key inputs such as forecasted power, capacity and fuel prices, forecasted operating expenses, contractual lease payments and discount rates. The Company recorded impairment losses of
$97 million
and
$10 million
for Conemaugh and Keystone respectively, for the year ended December 31, 2016.
Pittsburg
— During the fourth quarter of 2016, the Company determined that it would need to retire the Pittsburg facility earlier than anticipated as it did not receive a resource adequacy contract for 2017. The Company considered this to be a triggering event and tested the assets for impairment. The fair value of the facility was determined using an income approach and the Company recorded an impairment loss of
$20 million
to reduce the carrying amount to the value of the underlying land.
169
Other Impairments
— During 2016, the Company recorded other impairment losses of
$153 million
, which included
$23 million
in excess SO
2
allowances,
$23 million
for other intangible assets,
$19 million
in previously purchased solar panels,
$18 million
in deferred marketing expenses,
$22 million
in other investments and
$48 million
of other impairment losses.
Petra Nova Parish Holdings
—
During the first quarter of 2016, management changed its plans with respect to its future capital commitments driven in part by the continued decline in oil prices. As a result, the Company reviewed its
50%
interest in Petra Nova Parish Holdings for impairment utilizing the other-than-temporary impairment model. In determining fair value, the Company utilized an income approach and considered project specific assumptions for the future project cash flows. The carrying amount of the Company's equity method investment exceeded the fair value of the investment and the Company concluded that the decline is considered to be other-than-temporary. As a result, the Company measured the impairment loss as the difference between the carrying amount and the fair value of the investment and recorded an impairment loss of
$140 million
.
Community Wind North and Sherbino
—
During the fourth quarter of 2016, the Company offered several projects to NRG Yield including its interest in Community Wind North. The offer price was below its current carrying amount and this decline in fair value was determined to be other-than-temporary. Accordingly, the Company recorded an impairment loss of
$36 million
to reduce its carrying amount to fair value. In addition, in connection with the preparation of the annual budget, the Company noted that due to the anticipated difficulty in refinancing Sherbino’s debt that will mature in 2018, the project’s fair value had decreased significantly below its carrying amount and this decline was determined to be other-than-temporary. Accordingly, the Company determined that an other-than-temporary impairment existed and recorded an impairment loss on its investment in Sherbino of
$70 million
.
2015 Impairment Losses
Seward
—
As described in
Note 3
,
Business Acquisitions and Dispositions
, on November 24, 2015, the Company entered into an agreement with Robindale Energy Services, Inc. to sell Seward for cash consideration of
$75 million
. The transaction triggered an impairment indicator as the sale price was less than the carrying amount of the assets, and, as a result, the assets were considered to be impaired. The Company measured the impairment loss as the difference between the carrying amount of the assets and the agreed-upon sale price. The Company recorded an impairment loss of
$134 million
for the year ended December 31, 2015, to reduce the carrying amount of the assets held for sale to the fair market value.
Limestone and W.A. Parish
—
During the fourth quarter of 2015, as the Company updated its estimates of future cash flows in connection with the preparation of its annual budget, it was noted that the cash flows for the Limestone and W.A. Parish coal-fired facilities located in Texas were lower than the carrying amount, primarily driven by declining power prices as the cost of commodities continues to decline and the assets were impaired. The fair value of the Limestone and W.A. Parish plants was determined using an income approach by applying a discounted cash flow methodology to the long-term budgets for each respective plant. The income approach utilized estimates of discounted future cash flows, which were Level 3 fair value measurements, and include key inputs such as forecasted power prices, fuel costs and emissions credit expense, forecasted operating and capital expenditures and discount rates. The Company measured the impairment loss as the difference between the carrying amount and the fair value of the assets and recognized impairment losses of
$1,514 million
and
$1,295 million
related to Limestone and W.A. Parish, respectively.
Huntley
—
On August 25, 2015, the Company filed a notice with the NYSPSC of its intent to retire Huntley's operating units on March 1, 2016. The Company considered this to be an indicator of impairment and performed an impairment test for these assets under ASC 360,
Property, Plant and Equipment
. On October 14, 2015, the Company filed a cost-of-service filing at FERC in anticipation that the Huntley operating units would be needed for reliability purposes, proposing a reliability must run service agreement for a four-year period beginning on March 1, 2016. On October 30, 2015, NYISO released the results of its reliability study, indicating that the Huntley operating units are not needed for bulk system reliability. The Company considered the impact of the reliability study conducted and evaluated the estimated cash flows associated with the facility. Accordingly, the Company determined that the carrying amount of the assets was higher than the estimated future net cash flows expected to be generated by the assets and that the assets were impaired. The fair value of the Huntley operating units was determined using the income approach. The income approach utilized estimates of discounted future cash flows, which were Level 3 fair value measurements, and include key inputs such as forecasted contract prices, forecasted operating expenses and discount rates. The Company recorded an impairment loss of
$132 million
during the year ended December 31, 2015.
170
Dunkirk
—
The Company signed a ten-year agreement in November 2014 with National Grid to add natural gas-burning capabilities at the Dunkirk facility. On August 25, 2015, NRG announced that Dunkirk Unit 2 would be mothballed on January 1, 2016 at the expiration of its reliability support services agreement. The project to add natural gas-burning capabilities has been suspended, pending the outcome of litigation with respect to the gas addition contract and its validity. On October 30, 2015, NYISO released the results of its reliability study, indicating that the Dunkirk facility is not needed for system reliability. In connection with the planned mothball of the facility, the pending litigation and the latest reliability assessment completed by NYISO, the Company evaluated whether the related fixed assets were impaired. The Company determined that the carrying amount of the assets was higher than the estimated future net cash flows expected to be generated by the assets and that the assets were impaired. The fair value of the Dunkirk facility was determined using the income approach. The income approach utilized estimates of discounted future cash flows, which were Level 3 fair value measurements, and include key inputs such as forecasted contract prices, forecasted operating and capital expenditures and discount rates. The Company recorded an impairment loss of
$160 million
during the year ended December 31, 2015.
Gregory
— During the fourth quarter of 2015, the Company determined that the carrying amount of the assets was higher than the estimated future net cash flows expected to be generated by the assets and that the assets were impaired. The fair value of the Gregory facility was determined using the income approach, which utilized estimates of discounted future cash flows, which were Level 3 fair value measurements, and include key inputs such as forecasted prices, operating and capital expenditures and discount rates. The Company recorded an impairment loss of
$176 million
during the year ended December 31, 2015.
Solar Panels
—
During the fourth quarter of 2015, the Company recorded an impairment loss of
$29 million
to reduce the carrying value of certain solar panels to their approximate fair value.
Investments
—
During the fourth quarter of 2015, the Company reviewed certain of its cost method and equity method investments and concluded that losses incurred by these investments were other-than-temporary. These losses were primarily driven by the sustained decline in stock price of a publicly traded investment as well as change in financing structures of certain non-publicly traded investments. As a result, the Company recorded losses related to these investments of
$56 million
.
2014 Impairment Losses
Coolwater
—
During the fourth quarter of 2014, the Company determined that it would retire the
636
MW natural-gas fired Coolwater facility in Dagget, California. The facility faced critical repairs on the cooling towers for units 3 and 4 and, during the fourth quarter of 2014, did not receive any awards in a near-term capacity auction and no interest in a bilateral capacity deal. The Company considered this to be an indicator of impairment and performed an impairment test for these assets under ASC 360,
Property, Plant and Equipment
. The carrying amount of the assets was higher than the future net cash flows expected to be generated by the assets and as a result, the assets are considered to be impaired. The Company measured the impairment loss as the difference between the carrying amount and the fair value of the assets. The Company retired the Coolwater facility effective January 1, 2015. All remaining fixed assets of the station were written off resulting in an impairment loss of
$22 million
recorded during the fourth quarter of 2014.
Osceola
—
During the third quarter of 2014, the Company determined that it would mothball the
463
MW natural gas-fired Osceola facility, in Saint Cloud, Florida. The Company considered this to be an indicator of impairment and performed an impairment test for these assets under ASC 360,
Property, Plant and Equipment
. The carrying amount of the assets was higher than the future net cash flows expected to be generated by the assets and as a result, the assets were considered to be impaired. The Company measured the impairment loss as the difference between the carrying amount and the fair value of the assets. Due to the location of the facility, it was determined that the best indicator of fair value is the market value of the combustion turbines. The Company recorded an impairment loss of approximately
$60 million
during the third quarter of 2014, which represents the excess of the carrying value over the fair market value.
Solar Panels
—
During the third quarter of 2014, the Company recorded an impairment loss of
$10 million
to reduce the carrying value of certain solar panels to their approximate fair value.
Note 11
—
Goodwill and Other Intangibles
Goodwill
NRG's goodwill balance was
$662 million
and
$999 million
as of December 31, 2016 and
2015
, respectively. As of
December 31, 2016
, and
2015
, NRG had approximately
$547 million
and
$620 million
, respectively, of goodwill that is deductible for U.S. income tax purposes in future periods. As of December 31, 2016, goodwill consisted of
$276 million
associated with the acquisition of EME,
$341 million
for Retail business acquisitions, and
$45 million
associated with other business acquisitions.
2016
Impairments of Goodwill
During the year ended December 31, 2016, the Company recorded a goodwill impairment charge of
$337 million
related to its Texas reporting unit, reducing the goodwill balance for Texas to
zero
.
In connection with the annual impairment assessment, the Company performed step one of the two-step impairment test for the Texas reporting unit, for which
$1.7 billion
of goodwill was recognized as part of the Texas Genco acquisition in 2006 and
$1.4 billion
was written off in 2015. The Company determined the fair value of the Texas reporting unit primarily using an income approach through which the Company applied a discounted cash flow methodology to the long-term budgets for all plants in the regions. Significant inputs impacting the income approach include the Company's views of power and fuel prices for the first five-year period and the Company's view for the longer term, which were finalized in connection with the preparation of the fourth quarter financial statements, projected generation based on an hourly dispatch meant to simulate the dispatch of each unit into the power market which is impacted by power prices, fuel prices, and the physical and economic characteristics of each plant, intangible value to Texas for synergies it provides to NRG's retail businesses, and the discount rate applied to cash flow projections. Under step one, the estimated fair value of the Texas invested capital was
43%
below its carrying value as of December 31, 2016, and the Company concluded step two was required. Based on the results of step two of the impairment test, the Company determined the carrying amount of the reporting unit was higher than the fair value, and accordingly, the Company recognized an impairment loss of
$337 million
as of December 31, 2016.
2015
Impairments of Goodwill
During the year ended
December 31, 2015
, the Company recorded goodwill impairment charges of
$1.5 billion
which are comprised of the following:
Texas
— In connection with the annual impairment assessment, the Company performed step one of the two-step impairment test for the Texas reporting unit, for which
$1.7 billion
of goodwill was recognized as part of the Texas Genco acquisition in 2006. The Company determined the fair value of the Texas reporting unit primarily using an income approach through which the Company applied a discounted cash flow methodology to the long-term budgets for all plants in the regions. Significant inputs impacting the income approach include the Company's views of power and fuel prices for the first five-year period and the Company's view for the longer term, which were finalized in connection with the preparation of the fourth quarter financial statements, projected generation based on an hourly dispatch meant to simulate the dispatch of each unit into the power market which is impacted by power prices, fuel prices, and the physical and economic characteristics of each plant, intangible value to Texas for synergies it provides to NRG's retail businesses, and the discount rate applied to cash flow projections. Under step one, the estimated fair value of the Texas invested capital was
76%
below its carrying value as of December 31, 2015, and the Company concluded step two was required. Based on the results of step two of the impairment test, the Company determined the carrying amount of the reporting unit was higher than the fair value, and accordingly, the Company recognized an impairment loss of
$1.4 billion
as of December 31, 2015.
NRG Home Solar
— The Company performed the two-step impairment test as part of its annual impairment testing for the NRG Home Solar reporting unit utilizing an income approach developed through applying a discounted cash flow methodology to the long-term budget for the reporting unit. As a result, the Company determined that the carrying value of the reporting unit was higher than the fair value, and accordingly, the Company recognized an impairment loss of
$125 million
during the year ended December 31, 2015 to reduce the carrying value of the goodwill that was recognized in connection with acquisitions made by NRG Home Solar.
Goal Zero
—
During the third quarter of 2015, the Company agreed to relieve the Goal Zero seller of all known and unknown claims in return for the seller's agreement to forego all contingent consideration. Concurrently, the Company determined that there was an indication of goodwill impairment and performed an impairment test
.
The carrying amount of the reporting unit was higher than the fair value, and accordingly, the Company recognized an impairment loss of
$36 million
during the third quarter of 2015 to reduce the carrying value of the goodwill that was recognized in connection with the acquisition.
171
Intangible Assets
The Company's intangible assets as of
December 31, 2016
, primarily reflect intangible assets established with the acquisitions of various companies and are comprised of the following:
|
•
|
Emission Allowances
— These intangibles primarily consist of SO
2
and NO
x
emission allowances established with the 2012 GenOn acquisition and 2006 Texas Genco acquisition and also include RGGI emission credits which NRG began purchasing in 2009. These emission allowances are held-for-use and are amortized to cost of operations, with NO
x
allowances amortized on a straight-line basis and SO
2
allowances and RGGI credits amortized based on units of production. During the year ended December 31, 2016, the Company recorded an impairment loss of
$23 million
to reduce the value of excess SO
2
allowances to zero.
|
|
•
|
Energy supply contracts
— Established with the acquisitions of Reliant Energy and Green Mountain Energy, these represent the fair value at the acquisition date of in-market contracts for the purchase of energy to serve retail electric customers. The contracts are amortized to cost of operations based on the expected delivery under the respective contracts.
|
|
•
|
In-market fuel (gas and nuclear) contracts
— These intangibles were established with the Texas Genco acquisition in 2006 and are amortized to cost of operations over expected volumes over the life of each contract.
|
|
•
|
Customer contracts
— Established with the acquisitions of Reliant Energy, Green Mountain Energy, and Northwind Phoenix
,
these intangibles represent the fair value at the acquisition date of contracts that primarily provide electricity to Reliant Energy's and Green Mountain Energy's C&I customers. These contracts are amortized to revenues based on expected volumes to be delivered for the portfolio.
|
|
•
|
Customer relationships
— These intangibles represent the fair value at the acquisition date of acquired businesses' customer base, primarily for Dominion, Energy Alternatives, Energy Plus, Reliant Energy, Green Mountain Energy, Energy Systems and Energy Curtailment Specialists. The customer relationships are amortized to depreciation and amortization expense based on the expected discounted future net cash flows by year. During the year ended December 31, 2016, the Company recorded an impairment loss of
$8 million
for certain customer relationships.
|
|
•
|
Marketing partnerships
— Established with the acquisition of Energy Plus, these intangibles represent the fair value at the acquisition date of existing agreements with loyalty and affinity partners. The marketing partnerships are amortized to depreciation and amortization expense based on the expected discounted future net cash flows by year.
|
|
•
|
Trade names
— Established with the Reliant Energy, Green Mountain, Energy Plus and Dominion acquisitions, these intangibles are amortized to depreciation and amortization expense, on a straight-line basis.
|
|
•
|
Power purchase agreements
— Established predominantly with the EME and Alta Wind acquisitions, these represent the fair value of PPAs acquired. These will be amortized to revenues, generally on a straight-line basis, over the terms of the PPAs.
|
|
•
|
Other
— Consists of renewable energy credits, wind leasehold rights, costs to extend the operating license for STP Units 1 and 2, and the intangible asset related to a purchased ground lease. During the year ended December 31, 2016, the Company recorded an impairment loss of
$15 million
of other intangible assets.
|
The following tables summarize the components of NRG's intangible assets subject to amortization:
172
|
|
|
Contracts
|
|
|
|
|
|||||||||||||||||||||||||||||||||
|
Year Ended December 31, 2016
|
Emission
Allowances
|
Energy
Supply
|
Fuel
|
Customer
|
Customer
Relationships
|
Marketing Partnerships
|
Trade
Names
|
PPA
|
Other
|
Total
|
|||||||||||||||||||||||||||||
|
|
(In millions)
|
||||||||||||||||||||||||||||||||||||||
|
January 1, 2016
|
$
|
920
|
|
$
|
54
|
|
$
|
72
|
|
$
|
16
|
|
$
|
834
|
|
$
|
88
|
|
$
|
342
|
|
$
|
1,264
|
|
$
|
245
|
|
$
|
3,835
|
|
|||||||||
|
Purchases
|
50
|
|
—
|
|
—
|
|
—
|
|
—
|
|
—
|
|
—
|
|
—
|
|
34
|
|
84
|
|
|||||||||||||||||||
|
Acquisition of businesses
|
—
|
|
—
|
|
—
|
|
—
|
|
—
|
|
—
|
|
—
|
|
—
|
|
18
|
|
18
|
|
|||||||||||||||||||
|
Usage
|
(1
|
)
|
—
|
|
—
|
|
—
|
|
—
|
|
—
|
|
—
|
|
—
|
|
(44
|
)
|
(45
|
)
|
|||||||||||||||||||
|
Write-off of fully
amortized balances
(a)
|
(10
|
)
|
—
|
|
—
|
|
—
|
|
—
|
|
—
|
|
—
|
|
—
|
|
—
|
|
(10
|
)
|
|||||||||||||||||||
|
Impairment
(b)
|
(23
|
)
|
—
|
|
—
|
|
—
|
|
(18
|
)
|
—
|
|
—
|
|
—
|
|
(23
|
)
|
(64
|
)
|
|||||||||||||||||||
|
Other
|
(7
|
)
|
—
|
|
—
|
|
—
|
|
—
|
|
—
|
|
—
|
|
—
|
|
—
|
|
(7
|
)
|
|||||||||||||||||||
|
December 31, 2016
|
929
|
|
54
|
|
72
|
|
16
|
|
816
|
|
88
|
|
342
|
|
1,264
|
|
230
|
|
3,811
|
|
|||||||||||||||||||
|
Less accumulated amortization
|
(605
|
)
|
(54
|
)
|
(67
|
)
|
(8
|
)
|
(663
|
)
|
(49
|
)
|
(159
|
)
|
(138
|
)
|
(32
|
)
|
(1,775
|
)
|
|||||||||||||||||||
|
Net carrying amount
|
$
|
324
|
|
$
|
—
|
|
$
|
5
|
|
$
|
8
|
|
$
|
153
|
|
$
|
39
|
|
$
|
183
|
|
$
|
1,126
|
|
$
|
198
|
|
$
|
2,036
|
|
|||||||||
(a) Adjusted for write-off of fully amortized emission allowances of
$10 million
.
(b) The impairment of customer relationships and other intangibles included a write-off of accumulated amortization of
$10 million
and
$8 million
respectively.
(a) Adjusted for write-off of fully amortized emission allowances of
$154 million
.
|
|
|
Contracts
|
|
|
|
|
|||||||||||||||||||||||||||||||||
|
Year Ended December 31, 2015
|
Emission
Allowances
|
Energy
Supply
|
Fuel
|
Customer
|
Customer
Relationships
|
Marketing Partnerships
|
Trade
Names
|
PPA
|
Other
|
Total
|
|||||||||||||||||||||||||||||
|
|
(In millions)
|
||||||||||||||||||||||||||||||||||||||
|
January 1, 2015
|
$
|
1,018
|
|
$
|
54
|
|
$
|
72
|
|
$
|
16
|
|
$
|
831
|
|
$
|
88
|
|
$
|
353
|
|
$
|
1,270
|
|
$
|
267
|
|
$
|
3,969
|
|
|||||||||
|
Purchases
|
77
|
|
—
|
|
—
|
|
—
|
|
3
|
|
—
|
|
—
|
|
—
|
|
57
|
|
137
|
|
|||||||||||||||||||
|
Usage
|
(33
|
)
|
—
|
|
—
|
|
—
|
|
—
|
|
—
|
|
—
|
|
—
|
|
(62
|
)
|
(95
|
)
|
|||||||||||||||||||
|
Write-off of fully amortized balances
|
(154
|
)
|
—
|
|
—
|
|
—
|
|
—
|
|
—
|
|
—
|
|
—
|
|
—
|
|
(154
|
)
|
|||||||||||||||||||
|
Impairment
|
—
|
|
—
|
|
—
|
|
—
|
|
—
|
|
—
|
|
(6
|
)
|
—
|
|
(5
|
)
|
(11
|
)
|
|||||||||||||||||||
|
Other
|
12
|
|
—
|
|
—
|
|
—
|
|
—
|
|
—
|
|
(5
|
)
|
(6
|
)
|
(12
|
)
|
(11
|
)
|
|||||||||||||||||||
|
December 31, 2015
|
920
|
|
54
|
|
72
|
|
16
|
|
834
|
|
88
|
|
342
|
|
1,264
|
|
245
|
|
3,835
|
|
|||||||||||||||||||
|
Less accumulated amortization
(a)
|
(502
|
)
|
(47
|
)
|
(65
|
)
|
(6
|
)
|
(624
|
)
|
(41
|
)
|
(137
|
)
|
(75
|
)
|
(28
|
)
|
(1,525
|
)
|
|||||||||||||||||||
|
Net carrying amount
|
$
|
418
|
|
$
|
7
|
|
$
|
7
|
|
$
|
10
|
|
$
|
210
|
|
|
$
|
47
|
|
|
$
|
205
|
|
$
|
1,189
|
|
$
|
217
|
|
|
$
|
2,310
|
|
||||||
The following table presents NRG's amortization of intangible assets for each of the past three years:
|
|
Years Ended December 31,
|
||||||||||
|
Amortization
|
2016
|
2015
|
2014
|
||||||||
|
|
(In millions)
|
||||||||||
|
Emission allowances
|
$
|
113
|
|
$
|
99
|
|
$
|
124
|
|
||
|
Energy supply contracts
|
7
|
|
5
|
|
6
|
|
|||||
|
Fuel contracts
|
2
|
|
2
|
|
2
|
|
|||||
|
Customer contracts
|
2
|
|
2
|
|
—
|
|
|||||
|
Customer relationships
|
49
|
|
67
|
|
70
|
|
|||||
|
Marketing partnerships
|
8
|
|
14
|
|
15
|
|
|||||
|
Trade names
|
22
|
|
23
|
|
21
|
|
|||||
|
Power purchase agreements
|
63
|
|
50
|
|
24
|
|
|||||
|
Other
|
12
|
|
15
|
|
6
|
|
|||||
|
Total amortization
|
$
|
278
|
|
$
|
277
|
|
$
|
268
|
|
||
173
The following table presents estimated amortization of NRG's intangible assets for each of the next five years:
|
|
|
Contracts
|
|
|
|
||||||||||||||||||||||||||||||
|
Year Ended December 31,
|
Emission
Allowances
|
Fuel
|
Customer
|
Customer
Relationships
|
Marketing Partnerships
|
Trade
Names
|
PPA
|
Other
|
Total
|
||||||||||||||||||||||||||
|
|
(In millions)
|
||||||||||||||||||||||||||||||||||
|
2017
|
$
|
82
|
|
$
|
1
|
|
$
|
1
|
|
$
|
26
|
|
$
|
5
|
|
$
|
23
|
|
$
|
57
|
|
$
|
3
|
|
$
|
198
|
|
||||||||
|
2018
|
33
|
|
—
|
|
1
|
|
14
|
|
5
|
|
23
|
|
57
|
|
3
|
|
136
|
|
|||||||||||||||||
|
2019
|
31
|
|
—
|
|
1
|
|
10
|
|
4
|
|
23
|
|
57
|
|
3
|
|
129
|
|
|||||||||||||||||
|
2020
|
16
|
|
—
|
|
1
|
|
8
|
|
4
|
|
23
|
|
57
|
|
3
|
|
112
|
|
|||||||||||||||||
|
2021
|
16
|
|
—
|
|
1
|
|
6
|
|
4
|
|
23
|
|
57
|
|
3
|
|
110
|
|
|||||||||||||||||
Intangible assets held for sale
— From time to time, management may authorize the transfer from the Company's emission bank of emission allowances held-for-use to intangible assets held-for-sale. Emission allowances held-for-sale are included in other non-current assets on the Company's consolidated balance sheet and are not amortized, but rather expensed as sold. As of
December 31, 2016
, the value of emission allowances held-for-sale is
$39 million
and is managed within the Corporate segment. Once transferred to held-for-sale, these emission allowances are prohibited from moving back to held-for-use.
Out-of-market contracts
— Due primarily to business acquisitions, NRG acquired certain out-of-market contracts, which are classified as non-current liabilities on NRG's consolidated balance sheet. These include out-of-market lease contracts of
$159 million
and
$790 million
acquired in the acquisitions of EME and GenOn, respectively, and out-of-market gas transportation and storage contracts of
$327 million
acquired in the acquisition of GenOn. These out-of-market contracts are amortized to cost of operations. As of December 31, 2016 and 2015, the Company had accumulated amortization for out-of-market contracts of
$765 million
and
$664 million
.
The following table summarizes the estimated amortization related to NRG's out-of-market contracts:
|
Year Ended December 31,
|
Power Contracts
|
Leases
|
Gas Transportation
|
Total
|
||||||||||
|
|
(In millions)
|
|||||||||||||
|
2017
|
$
|
16
|
|
47
|
|
$
|
37
|
|
$
|
100
|
|
|||
|
2018
|
16
|
|
47
|
|
32
|
|
95
|
|
||||||
|
2019
|
17
|
|
47
|
|
29
|
|
93
|
|
||||||
|
2020
|
17
|
|
47
|
|
29
|
|
93
|
|
||||||
|
2021
|
10
|
|
47
|
|
26
|
|
83
|
|
||||||
174
Note 12
—
Debt and Capital Leases
Long-term debt and capital leases consisted of the following:
|
|
As of December 31,
|
December 31, 2016
|
|||||||
|
|
2016
|
2015
|
Interest Rate %
(a)
|
||||||
|
|
(In millions except rates)
|
||||||||
|
NRG Recourse Debt:
|
|
|
|||||||
|
Senior notes, due 2018
|
$
|
398
|
|
$
|
1,039
|
|
7.625
|
||
|
Senior notes, due 2020
|
—
|
|
1,058
|
|
8.250
|
||||
|
Senior notes, due 2021
|
207
|
|
1,128
|
|
7.875
|
||||
|
Senior notes, due 2022
|
992
|
|
1,100
|
|
6.250
|
||||
|
Senior notes, due 2023
|
869
|
|
936
|
|
6.625
|
||||
|
Senior notes, due 2024
|
733
|
|
904
|
|
6.250
|
||||
|
Senior notes, due 2026
|
1,000
|
|
—
|
|
7.250
|
||||
|
Senior notes, due 2027
|
1,250
|
|
—
|
|
6.625
|
||||
|
Term loan facility, due 2018
|
—
|
|
1,964
|
|
L+2.00
|
||||
|
Term loan facility, due 2023
|
1,882
|
|
—
|
|
L+2.75
|
||||
|
Tax-exempt Bonds
|
455
|
|
455
|
|
4.125 - 6.00
|
||||
|
Subtotal NRG Recourse Debt
|
7,786
|
|
8,584
|
|
|
||||
|
NRG Non-Recourse Debt:
|
|||||||||
|
GenOn senior notes
|
1,911
|
|
1,956
|
|
7.875 - 9.875
|
||||
|
GenOn Americas Generation senior notes
|
745
|
|
752
|
|
8.500 - 9.125
|
||||
|
GenOn Other
|
96
|
|
56
|
|
|||||
|
Subtotal GenOn debt (non-recourse to NRG)
|
2,752
|
|
2,764
|
|
|||||
|
NRG Yield Operating LLC Senior Notes, due 2024
|
500
|
|
500
|
|
5.375
|
||||
|
NRG Yield Operating LLC Senior Notes, due 2026
|
350
|
|
—
|
|
5.000
|
||||
|
NRG Yield LLC and Yield Operating LLC Revolving Credit Facility, due 2019
|
—
|
|
306
|
|
L+2.75
|
||||
|
NRG Yield Inc. Convertible Senior Notes, due 2019
|
335
|
|
330
|
|
3.500
|
||||
|
NRG Yield Inc. Convertible Senior Notes, due 2020
|
271
|
|
266
|
|
3.250
|
||||
|
El Segundo Energy Center, due 2023
|
443
|
|
485
|
|
L+1.625 - L+2.25
|
||||
|
Marsh Landing, due 2017 and 2023
|
370
|
|
418
|
|
L+1.75 - L+1.875
|
||||
|
Alta Wind I-V lease financing arrangements, due 2034 and 2035
|
965
|
|
1,002
|
|
5.696 - 7.015
|
||||
|
Walnut Creek, term loans due 2023
|
310
|
|
351
|
|
L+1.625
|
||||
|
Tapestry, due 2021
|
172
|
|
181
|
|
L+1.625
|
||||
|
CVSR, due 2037
|
771
|
|
793
|
|
2.339 - 3.775
|
||||
|
CVSR HoldCo, due 2037
|
199
|
|
—
|
|
4.680
|
||||
|
Alpine, due 2022
|
145
|
|
154
|
|
L+1.750
|
||||
|
Energy Center Minneapolis, due 2017 and 2025
|
96
|
|
108
|
|
5.95 - 7.25
|
||||
|
Energy Center Minneapolis, due 2031
|
125
|
|
—
|
|
3.55
|
||||
|
Viento, due 2023
|
178
|
|
189
|
|
L+2.75
|
||||
|
NRG Yield - other
|
540
|
|
573
|
|
various
|
||||
|
Subtotal NRG Yield debt (non-recourse to NRG)
|
5,770
|
|
5,656
|
|
|||||
|
Ivanpah, due 2033 and 2038
|
1,113
|
|
1,149
|
|
2.285 - 4.256
|
||||
|
Agua Caliente, due 2037
|
849
|
|
879
|
|
2.395 - 3.633
|
||||
|
Dandan, due 2033
|
76
|
|
98
|
|
L+2.25
|
||||
|
Peaker bonds, due 2019
|
—
|
|
72
|
|
L+1.07
|
||||
|
Cedro Hill, due 2025
|
163
|
|
103
|
|
L+1.75
|
||||
|
Utah Portfolio, due 2022
|
287
|
|
—
|
|
L+2.65
|
||||
|
Midwest Generation, due 2019
|
218
|
|
—
|
|
4.390
|
||||
|
NRG Other
|
392
|
|
315
|
|
various
|
||||
|
Subtotal other NRG non-recourse debt
|
3,098
|
|
2,616
|
|
|||||
|
Subtotal all non-recourse debt
|
11,620
|
|
11,036
|
|
|||||
|
Subtotal long-term debt (including current maturities)
|
19,406
|
|
19,620
|
|
|
||||
|
Capital leases:
|
8
|
|
16
|
|
various
|
||||
|
Subtotal long-term debt and capital leases (including current maturities)
|
19,414
|
|
19,636
|
|
|||||
|
Less current maturities
|
1,220
|
|
481
|
|
|||||
|
Less debt issuance costs
|
188
|
|
172
|
|
|||||
|
Total long-term debt and capital leases
|
$
|
18,006
|
|
$
|
18,983
|
|
|||
175
|
(a)
|
As of December 31,
2016
, L+ equals
3 month LIBOR
plus x%, with the exception of the Viento term loan, which is
6 month LIBOR
plus x% and the Alpine term loan, the NRG Marsh Landing term loan, the Walnut Creek loan, and 2023 Term Loan Facility, which are 1 month LIBOR plus x%.
|
Long-term debt includes the following premiums/(discounts):
|
As of December 31,
|
||||||||
|
2016
|
2015
|
|||||||
|
(In millions)
|
||||||||
|
Term loan facility, due 2018
(a)
|
$
|
—
|
|
$
|
(3
|
)
|
||
|
Term loan facility, due 2023
(a)
|
(9
|
)
|
—
|
|
||||
|
Peaker bonds, due 2019
(b)
|
—
|
|
(4
|
)
|
||||
|
Yield, Inc. Convertible notes, due 2019
|
(10
|
)
|
(15
|
)
|
||||
|
Yield, Inc. Convertible notes, due 2020
|
(17
|
)
|
(21
|
)
|
||||
|
Midwest Generation, due 2019
|
(13
|
)
|
—
|
|
||||
|
GenOn senior notes, due 2017
(c)
|
8
|
|
23
|
|
||||
|
GenOn senior notes, due 2018
(c)
|
38
|
|
59
|
|
||||
|
GenOn senior notes, due 2020
(c)
|
35
|
|
44
|
|
||||
|
GenOn Americas Generation senior notes, due 2021
(c)
|
26
|
|
32
|
|
||||
|
GenOn Americas Generation senior notes, due 2031
(c)
|
24
|
|
25
|
|
||||
|
Total premium
|
$
|
82
|
|
$
|
140
|
|
||
|
(a)
|
Term loan facility, due 2018 replaced with the Term loan facility due 2023. Discount of
$1 million
was related to current maturities in 2016.
|
|
(b)
|
Repaid in 2016.
|
|
(c)
|
Premiums for long-term debt acquired in the GenOn acquisition represent adjustments to record the debt at fair value in connection with the acquisition.
|
Consolidated Annual Maturities
Annual payments based on the maturities of NRG's debt and capital leases for the years ending after
December 31, 2016
are as follows:
|
|
(In millions)
|
||
|
2017
|
$
|
1,222
|
|
|
2018
|
1,650
|
|
|
|
2019
|
839
|
|
|
|
2020
|
1,273
|
|
|
|
2021
|
1,157
|
|
|
|
Thereafter
|
13,192
|
|
|
|
Total
|
$
|
19,333
|
|
176
NRG Recourse Debt
Senior Notes
Issuance of 2026 Senior Notes
On May 23, 2016, NRG issued
$1.0 billion
in aggregate principal amount at par of
7.25%
senior notes due 2026, or the 2026 Senior Notes. The 2026 Senior Notes are senior unsecured obligations of NRG and are guaranteed by certain of its subsidiaries. Interest is paid semi-annually beginning on November 15, 2016, until the maturity date of May 15, 2026. The proceeds from the issuance of the 2026 Senior Notes were utilized to repurchase a portion of the Senior Notes discussed below under
2016 Senior Note Repurchases
.
Issuance of 2027 Senior Notes
On August 2, 2016, NRG issued
$1.25 billion
in aggregate principal amount at par of
6.625%
senior notes due 2027, or the 2027 Senior Notes. The 2027 Senior Notes are senior unsecured obligations of NRG and are guaranteed by certain of its subsidiaries. Interest is paid semi-annually beginning on January 15, 2017, until the maturity date of January 15, 2027. The proceeds from the issuance of the 2027 Senior Notes were utilized to retire the Company's
8.250%
senior notes due 2020 and reduce the balance of the Company's
7.875%
senior notes due 2021.
2016 Senior Notes Repurchases
During the year ended December 31, 2016, the Company repurchased
$3.0 billion
in aggregate principal of its Senior Notes for
$3.1 billion
, which included accrued interest of
$77 million
. In connection with the repurchases, a
$117 million
loss on debt extinguishment was recorded, which included the write-off of previously deferred financing costs of
$16 million
.
|
Principal Repurchased
|
Cash Paid
(a)
|
Average Early Redemption Percentage
|
||||||||
|
Amount in millions, except rates
|
||||||||||
|
7.625% senior notes due 2018
(b)
|
$
|
641
|
|
$
|
706
|
|
107.89
|
%
|
||
|
8.250% senior notes due 2020
|
1,058
|
|
1,129
|
|
103.12
|
%
|
||||
|
7.875% senior notes due 2021
(c)
|
922
|
|
978
|
|
104.00
|
%
|
||||
|
6.250% senior notes due 2022
|
108
|
|
105
|
|
94.73
|
%
|
||||
|
6.625% senior notes due 2023
|
67
|
|
64
|
|
94.13
|
%
|
||||
|
6.250% senior notes due 2024
|
171
|
|
163
|
|
94.52
|
%
|
||||
|
Total
|
$
|
2,967
|
|
$
|
3,145
|
|
||||
(a) Includes payment for accrued interest.
(b)
$186 million
of the redemptions financed by cash on hand.
(c)
$193 million
of the redemptions financed by cash on hand.
2015 Senior Notes Repurchases
During the year ended December 31, 2015, the Company repurchased
$246 million
in aggregate principal of its Senior Notes for
$231 million
, which included accrued interest of
$5 million
. In connection with the repurchases, a
$19 million
gain on debt extinguishment was recorded, which included the write-off of previously deferred financing costs of
$2 million
.
|
Principal Repurchased
|
Cash Paid
(a)
|
Average Early Redemption Percentage
|
||||||||
|
Amount in millions, except rates
|
||||||||||
|
7.625% senior notes due 2018
|
$
|
92
|
|
$
|
97
|
|
102.23
|
%
|
||
|
8.250% senior notes due 2020
|
5
|
|
5
|
|
96.50
|
%
|
||||
|
6.625% senior notes due 2023
|
54
|
|
47
|
|
85.97
|
%
|
||||
|
6.250% senior notes due 2024
|
95
|
|
82
|
|
84.73
|
%
|
||||
|
Total
|
$
|
246
|
|
$
|
231
|
|
||||
(a) Includes payment for accrued interest.
177
Senior Notes Outstanding
As of
December 31, 2016
, NRG had seven outstanding issuances of senior notes, or Senior Notes:
i.
7.875%
senior notes, issued May 24, 2011 and due May 15, 2021, or the 2021 Senior Notes;
ii.
6.625%
senior notes, issued September 24, 2012 and due March 15, 2023, or the 2023 Senior Notes;
iii.
6.250%
senior notes, issued January 27, 2014 and due July 15, 2022, or the 2022 Senior Notes;
iv.
6.250%
senior notes, issued April 21, 2014 and due November 1, 2024, or the 2024 Senior Notes;
v.
7.250%
senior notes, issued May 23, 2016 and due May 15, 2026, or the 2026 Senior Notes; and
vi.
6.625%
senior notes, issued August 2, 2016 and due January 15, 2027, or the 2027 Senior Notes.
vii.
7.625%
senior notes, issued January 26, 2011 and due January 15, 2018, or the 2018 Senior Notes.
The Company periodically enters into supplemental indentures for the purpose of adding entities under the Senior Notes as guarantors.
The indentures and the forms of notes provide, among other things, that the Senior Notes will be senior unsecured obligations of NRG. The indentures also provide for customary events of default, which include, among others: nonpayment of principal or interest; breach of other agreements in the indentures; defaults in failure to pay certain other indebtedness; the rendering of judgments to pay certain amounts of money against NRG and its subsidiaries; the failure of certain guarantees to be enforceable; and certain events of bankruptcy or insolvency.
Generally, if an event of default occurs, the Trustee or the Holders of at least 25% in principal amount of the then outstanding series of Senior Notes may declare all of the Senior Notes of such series to be due and payable immediately.
The terms of the indentures, among other things, limit NRG's ability and certain of its subsidiaries' ability to return capital to stockholders, grant liens on assets to lenders and incur additional debt. Interest is payable semi-annually on the Senior Notes until their maturity dates.
2021 Senior Notes
On or after May 15, 2016, NRG may redeem some or all of the notes at redemption prices expressed as percentages of principal amount as set forth in the following table, plus accrued and unpaid interest on the notes redeemed to the first applicable redemption date:
|
Redemption Period
|
Redemption
Percentage
|
|
|
May 15, 2016 to May 14, 2017
|
103.938
|
%
|
|
May 15, 2017 to May 14, 2018
|
102.625
|
%
|
|
May 15, 2018 to May 14, 2019
|
101.313
|
%
|
|
May 15, 2019 and thereafter
|
100.000
|
%
|
2022 Senior Notes
At any time prior to July 15, 2017, NRG may redeem up to 35% of the aggregate principal amount of the 2022 Senior Notes, at a redemption price equal to 106.25% of the principal amount of the notes redeemed, plus accrued and unpaid interest, with an amount equal to the net cash proceeds of certain equity offerings.
At any time prior to July 15, 2018, NRG may redeem all or a part of the 2022 Senior Notes, at a redemption price equal to 100% of the principal amount, accrued and unpaid interest to the redemption date, plus a premium. The premium is the greater of: (i) 1% of the principal amount of the notes; or (ii) the excess of the principal amount of the note over the following: the present value of 103.125% of the note, plus interest payments due on the note from the date of redemption through July 15, 2018, computed using a discount rate equal to the Treasury Rate as of such redemption date plus 0.50%.
In addition, on or after July 15, 2018, NRG may redeem some or all of the notes at redemption prices expressed as percentages of principal amount as set forth in the following table, plus accrued and unpaid interest on the notes redeemed to the first applicable redemption date:
|
Redemption Period
|
Redemption
Percentage
|
|
|
July 15, 2018 to July 14, 2019
|
103.125
|
%
|
|
July 15, 2019 to July 14, 2020
|
101.563
|
%
|
|
July 15, 2020 and thereafter
|
100.000
|
%
|
178
2023 Senior Notes
Prior to September 15, 2017, NRG may redeem all or a portion of the 2023 Senior Notes at a price equal to 100% of the principal amount plus a premium and accrued and unpaid interest. The premium is the greater of: (i) 1% of the principal amount of the notes; or (ii) the excess of the principal amount of the note over the following: the present value of 103.313% of the note, plus interest payments due on the note from the date of redemption through September 15, 2017, discounted at a Treasury rate plus 0.50%.
In addition, on or after September 15, 2017, NRG may redeem some or all of the 2023 Senior Notes at redemption prices expressed as percentages of principal amount as set forth in the following table, plus accrued and unpaid interest on the notes redeemed to the first applicable redemption date:
|
Redemption Period
|
Redemption
Percentage
|
|
|
September 15, 2017 to September 14, 2018
|
103.313
|
%
|
|
September 15, 2018 to September 14, 2019
|
102.208
|
%
|
|
September 15, 2019 to September 14, 2020
|
101.104
|
%
|
|
September 15, 2020 and thereafter
|
100.000
|
%
|
2024 Senior Notes
At any time prior to May 1, 2017, NRG may redeem up to 35% of the aggregate principal amount of the 2024 Senior Notes, at a redemption price equal to 106.25% of the principal amount of the notes redeemed, plus accrued and unpaid interest, with an amount equal to the net cash proceeds of certain equity offerings.
At any time prior to May 1, 2019, NRG may redeem all or a part of the 2024 Senior Notes, at a redemption price equal to 100% of the principal amount, accrued and unpaid interest to the redemption date, plus a premium. The premium is the greater of: (i) 1% of the principal amount of the notes; or (ii) the excess of the principal amount of the note over the following: the present value of 103.125% of the note, plus interest payments due on the note from the date of redemption through May 1, 2019 computed using a discount rate equal to the Treasury Rate as of such redemption date plus 0.50%.
In addition, on or after May 1, 2019, NRG may redeem some or all of the notes at redemption prices expressed as percentages of principal amount as set forth in the following table, plus accrued and unpaid interest on the notes redeemed to the first applicable redemption date:
|
Redemption Period
|
Redemption
Percentage
|
|
|
May 1, 2019 to April 30, 2020
|
103.125
|
%
|
|
May 1, 2020 to April 30, 2021
|
102.083
|
%
|
|
May 1, 2021 to April 30, 2022
|
101.042
|
%
|
|
May 1, 2022 and thereafter
|
100.000
|
%
|
2026 Senior Notes
At any time prior to May 15, 2019, NRG may redeem up to 35% of the aggregate principal amount of the 2026 Senior Notes, at a redemption price equal to 107.25% of the principal amount of the notes redeemed, plus accrued and unpaid interest, with an amount equal to the net cash proceeds of certain equity offerings
.
At any time prior to May 15, 2021, NRG may redeem all or a part of the 2026 Senior Notes, at a redemption price equal to 100% of the principal amount, accrued and unpaid interest to the redemption date, plus a premium. The premium is the greater of: (i) 1% of the principal amount of the notes; or (ii) the excess of the principal amount of the note over the following: the present value of 103.625% of the note, plus interest payments due on the note from the date of redemption through May 15, 2021 computed using a discount rate equal to the Treasury Rate as of such redemption date plus 0.50%.
In addition, on or after May 15, 2021, NRG may redeem some or all of the notes at redemption prices expressed as percentages of principal amount as set forth in the following table, plus accrued and unpaid interest on the notes redeemed to the first applicable redemption date:
|
Redemption Period
|
Redemption
Percentage
|
|
|
May 15, 2021 to May 14, 2022
|
103.625
|
%
|
|
May 15, 2022 to May 14, 2023
|
102.417
|
%
|
|
May 15, 2023 to May 14, 2024
|
101.208
|
%
|
|
May 15, 2024 and thereafter
|
100.000
|
%
|
179
2027 Senior Notes
At any time prior to July 15, 2019, NRG may redeem up to 35% of the aggregate principal amount of the 2027 Senior Notes, at a redemption price equal to 106.625% of the principal amount of the notes redeemed, plus accrued and unpaid interest, with an amount equal to the net cash proceeds of certain equity offerings.
At any time prior to July 15, 2021 NRG may redeem all or a part of the 2027 Senior Notes, at a redemption price equal to 100% of the principal amount, accrued and unpaid interest to the redemption date, plus a premium. The premium is the greater of: (i) 1% of the principal amount of the notes; or (ii) the excess of the principal amount of the note over the following: the present value of 103.313% of the note, plus interest payments due on the note from the date of redemption through July 15, 2021 computed using a discount rate equal to the Treasury Rate as of such redemption date plus 0.50%.
In addition, on or after July 15, 2021, NRG may redeem some or all of the notes at redemption prices expressed as percentages of principal amount as set forth in the following table, plus accrued and unpaid interest on the notes redeemed to the first applicable redemption date:
|
Redemption Period
|
Redemption
Percentage
|
|
|
July 15, 2021 to July14, 2022
|
103.313
|
%
|
|
July 15, 2022 to July 14, 2023
|
102.208
|
%
|
|
July 15, 2023 to July 14, 2024
|
101.104
|
%
|
|
July 15, 2024 and thereafter
|
100.000
|
%
|
Senior Credit Facility
On June 30, 2016, NRG replaced its Senior Credit Facility, consisting of its Term Loan Facility and Revolving Credit Facility with a new senior secured facility, or the 2016 Senior Credit Facility, which includes the following:
|
•
|
A
$1.9 billion
term loan facility, or the 2023 Term Loan Facility, with a maturity date of June 30, 2023, which will pay interest at a rate of
LIBOR
plus
2.75%
, with a
LIBOR
floor of
0.75%
. The debt was issued at
99.50%
of face value; the discount will be amortized to interest expense over the life of the loan. Repayments under the 2023 Term Loan Facility will consist of
0.25%
of principal per quarter, with the remainder due at maturity. The proceeds of the new term loan facility as well as cash on hand were used to repay the 2018 Term Loan Facility balance outstanding. A
$21 million
loss on extinguishment of the Term Loan Facility was recorded during the second quarter of 2016, which consisted of the write-off of previously deferred financing costs. On January 24, 2017, NRG repriced the 2023 Term Loan Facility, reducing the interest rate margin by 50 basis points to
LIBOR
plus
2.25%
, the
LIBOR
floor remains
0.75%
.
|
|
•
|
A
$289 million
revolving senior credit facility, or the Tranche A Revolving Facility, with a maturity date of July 1, 2018 and a
$2.2 billion
revolving senior credit facility, or the Tranche B Revolving Facility, with a maturity date of June 30, 2021, which will pay interest at a rate of
LIBOR
plus
2.25%
.
|
The 2016 Senior Credit Facility is guaranteed by substantially all of NRG's existing and future direct and indirect subsidiaries, with certain customary or agreed-upon exceptions for unrestricted foreign subsidiaries, and certain other subsidiaries, including GenOn, NRG Yield, Inc. and their respective subsidiaries. The capital stock of these guarantor subsidiaries has been pledged for the benefit of the 2016 Senior Credit Facility's lenders.
The 2016 Senior Credit Facility is also secured by first-priority perfected security interests in substantially all of the property and assets owned or acquired by NRG and its subsidiaries, other than certain limited exceptions. These exceptions include assets of certain unrestricted subsidiaries, equity interests in certain of NRG's affiliates that have non-recourse debt financing, including GenOn, NRG Yield, Inc. and their respective subsidiaries, and voting equity interests in excess of
66%
of the total outstanding voting equity interest of certain of NRG's foreign subsidiaries.
180
Tax Exempt Bonds
|
As of December 31,
|
||||||||||
|
2016
|
2015
|
Interest Rate %
|
||||||||
|
Amount in millions, except rates
|
||||||||||
|
Indian River Power tax exempt bonds, due 2040
|
$
|
57
|
|
$
|
57
|
|
6.000
|
|||
|
Indian River Power LLC, tax exempt bonds, due 2045
|
190
|
|
190
|
|
5.375
|
|||||
|
Dunkirk Power LLC, tax exempt bonds, due 2042
|
59
|
|
59
|
|
5.875
|
|||||
|
City of Texas City, tax exempt bonds, due 2045
|
22
|
|
22
|
|
4.125
|
|||||
|
Fort Bend County, tax exempt bonds, due 2038
|
54
|
|
54
|
|
4.750
|
|||||
|
Fort Bend County, tax exempt bonds, due 2042
|
73
|
|
73
|
|
4.750
|
|||||
|
Total
|
$
|
455
|
|
$
|
455
|
|
|
|||
NRG Non-Recourse Debt
The following are descriptions of certain indebtedness of NRG's subsidiaries that are outstanding as of
December 31, 2016
. All of NRG's non-recourse debt is secured by the assets in the respective GenOn subsidiaries and project subsidiaries as further described below. The net assets in the GenOn and project subsidiaries are subject to restrictions, including the ability to transfer assets out of the subsidiaries. As of
December 31, 2016
, NRG had net assets of
$4.9 billion
that were deemed restricted for purposes of Rule 4-08(e)(3)(ii) of Regulation S-X.
The indebtedness described below is non-recourse to NRG, unless otherwise noted.
GenOn Senior Notes
|
As of December 31,
|
||||||||||
|
2016
|
2015
|
Interest Rate %
|
||||||||
|
Amount in millions, except rates
|
||||||||||
|
Senior unsecured notes, due 2017
|
$
|
699
|
|
$
|
714
|
|
7.875
|
|||
|
Senior unsecured notes, due 2018
|
687
|
|
708
|
|
9.500
|
|||||
|
Senior unsecured notes, due 2020
|
525
|
|
534
|
|
9.875
|
|||||
|
Total
|
$
|
1,911
|
|
$
|
1,956
|
|
||||
Under the GenOn Senior Notes and the related indentures, the GenOn Senior Notes are the sole obligation of GenOn and are not guaranteed by any subsidiary or affiliate of GenOn. The GenOn Senior Notes are senior unsecured obligations of GenOn having no recourse to any subsidiary or affiliate of GenOn. The GenOn Senior Notes restrict the ability of GenOn and its subsidiaries to encumber their assets. The GenOn Senior Notes are subject to acceleration of GenOn's obligations thereunder upon the occurrence of certain events of default, including: (a) default in interest payment for 30 days, (b) default in the payment of principal or premium, if any, (c) failure after 90 days of specified notice to comply with any other agreements in the indenture, (d) certain cross-acceleration events, (e) failure by GenOn or its significant subsidiaries to pay certain final and non-appealable judgments after 90 days and (f) certain events of bankruptcy and insolvency.
2015 Repurchase of GenOn Senior Notes
During the fourth quarter of 2015, the Company repurchased
$119 million
in aggregate principal of the following outstanding Senior Notes for
$108 million
, including accrued interest.
|
Principal Repurchased
|
Average Early Redemption Percentage
|
Gain on Debt Extinguishment
|
|||||||||
|
Amount in millions, except rates
|
|||||||||||
|
Senior unsecured notes, due 2017
|
$
|
33
|
|
95.172
|
%
|
$
|
3
|
|
|||
|
Senior unsecured notes, due 2018
|
25
|
|
90.950
|
%
|
5
|
|
|||||
|
Senior unsecured notes, due 2020
|
61
|
|
83.847
|
%
|
15
|
|
|||||
|
Total
|
$
|
119
|
|
|
$
|
23
|
|
||||
181
2018 and 2020 GenOn Senior Notes
The GenOn Senior Notes due 2018 and 2020 and the related indentures restrict the ability of GenOn to incur additional liens and make certain restricted payments, including dividends and purchases of capital stock. In the event of a default or if restricted payment tests are not satisfied, GenOn would not be able to distribute cash to its parent, NRG. At
December 31, 2016
, GenOn failed the consolidated debt ratio component of the restricted payments test. Under the related indentures, the ability of GenOn to make restricted payments, including dividends, loans and advances to NRG, is limited to specified exclusions, including up to
$250 million
of such restricted payments. As of
December 31, 2016
, GenOn net assets of
$368 million
were deemed restricted for purposes of Rule 4-08(e)(3)(ii) of Regulation S-X.
Prior to maturity, GenOn may redeem the senior notes due 2018, in whole or in part, at a redemption price equal to 100% of the principal amount plus a premium and accrued and unpaid interest. The premium is the greater of: (i) 1% of the principal amount of the notes; or (ii) the excess of the following: the present value of 100% of the note, plus interest payments due on the note through maturity, discounted at a Treasury rate plus 0.50% over the principal amount of the note.
GenOn may redeem some or all of the Senior Notes due 2020 at redemption prices expressed as percentages of principal amount as set forth in the following table, plus accrued and unpaid interest on the notes redeemed to the first applicable redemption rate:
|
Redemption Period
|
Redemption
Percentage
|
|
|
October 15, 2016 to October 14, 2017
|
103.292
|
%
|
|
October 15, 2017 to October 14, 2018
|
101.646
|
%
|
|
October 15, 2018 and thereafter
|
100.000
|
%
|
2017 GenOn Senior Notes
Prior to maturity, GenOn may redeem all or a part of the GenOn Senior Notes due 2017 at a redemption price equal to 100% of the notes plus a premium and accrued and unpaid interest. The premium is the greater of: (i) 1% of the principal amount of the notes; or (ii) the excess of the following: the present value of 100% of the note, plus interest payments due on the note through maturity, discounted at a Treasury rate plus 0.50% over the principal amount of the note
.
GenOn Americas Generation Senior Notes
|
As of December 31,
|
||||||||||
|
2016
|
2015
|
Interest Rate %
|
||||||||
|
Amount in millions, except rates
|
||||||||||
|
Senior unsecured notes, due 2021
|
$
|
392
|
|
$
|
398
|
|
8.500
|
|||
|
Senior unsecured notes, due 2031
|
353
|
|
354
|
|
9.125
|
|||||
|
Total
|
$
|
745
|
|
$
|
752
|
|
||||
The GenOn Americas Generation Senior Notes due 2021 and 2031 are senior unsecured obligations of GenOn Americas Generation, a wholly owned subsidiary of NRG, having no recourse to any subsidiary or affiliate of GenOn Americas Generation.
2015 Repurchase of GenOn Americas Generation Senior Notes
During the fourth quarter of 2015, the Company repurchased
$155 million
in aggregate principal of the following outstanding Senior Notes for
$128 million
, including accrued interest.
|
Principal Repurchased
|
Average Early Redemption Percentage
|
Gain on Debt Extinguishment
|
|||||||||
|
Amount in millions, except rates
|
|||||||||||
|
Senior unsecured notes, due 2021
|
$
|
84
|
|
84.910
|
%
|
$
|
20
|
|
|||
|
Senior unsecured notes, due 2031
|
71
|
|
77.018
|
%
|
22
|
|
|||||
|
Total
|
$
|
155
|
|
$
|
42
|
|
|||||
182
2021 and 2031 GenOn Americas Senior Notes
Prior to maturity, GenOn Americas Generation may redeem all or a part of the senior notes due 2021 and 2031 at a redemption price equal to 100% of the notes plus a premium and accrued and unpaid interest. The premium is the greater of: (i) the discounted present value of the then-remaining scheduled payments of principal and interest on the outstanding notes, discounted at a Treasury rate plus 0.375%, less the unpaid principal amount; and (ii) zero.
Yield Operating LLC Senior Notes
2024 Yield Operating Senior Notes
On August 5, 2014, Yield Operating issued
$500 million
of senior unsecured notes and utilized the proceeds to fund the acquisition of the Alta Wind Assets. The Yield Operating senior notes bear interest at
5.375%
and mature in August 2024. Interest on the notes is payable semi-annually on February 15 and August 15 of each year, and commenced on February 15, 2015. The notes are senior unsecured obligations of Yield Operating and are guaranteed by NRG Yield LLC, Yield Operating’s parent company, and by certain of Yield Operating’s wholly owned current and future subsidiaries.
Yield LLC and Yield Operating LLC Revolving Credit Facility
NRG Yield LLC and its direct wholly owned subsidiary, NRG Yield Operating LLC, entered into a senior secured revolving credit facility, which can be used for cash and for the issuance of letters of credit. At December 31, 2016, there was
$60 million
of letters of credit issued under the revolving credit facility and
no
borrowing outstanding on the revolver.
Yield, Inc. Convertible Notes
2020 Yield Inc. Convertible Notes
On June 29, 2015, NRG Yield, Inc. closed on its offering of
$287.5 million
aggregate principal amount of
3.25%
Convertible Senior Notes due 2020, or the 2020 Convertible Notes. The 2020 Convertible Notes are convertible, under certain circumstances, into NRG Yield, Inc. Class C common stock, cash or a combination thereof at an initial conversion price of
$27.50
per Class C common share, which is equivalent to an initial conversion rate of approximately
36.3636
shares of Class C common stock per
$1,000
principal amount of notes. Interest on the 2020 Convertible Notes is payable semi-annually in arrears on June 1 and December 1 of each year, commencing on December 1, 2015. The 2020 Convertible Notes mature on June 1, 2020, unless earlier repurchased or converted in accordance with their terms. Prior to the close of business on the business day immediately preceding December 1, 2019, the 2020 Convertible Notes will be convertible only upon the occurrence of certain events and during certain periods, and thereafter, at any time until the close of business on the second scheduled trading day immediately preceding the maturity date. The 2020 Convertible Notes are accounted for in accordance with ASC 470-20, under which issuers of convertible debt instruments that may be settled in cash upon conversion, including partial cash settlement, are required to separately account for the liability (debt) and equity (conversion option) components. The equity component, the
$23 million
conversion option value, was recorded to NRG's noncontrolling interest for NRG Yield, Inc. with the offset to debt discount. The debt discount is being amortized to interest expense over the term of the notes.
183
2019 Yield Inc. Convertible Notes
In the first quarter of 2014, NRG Yield, Inc. closed on its offering of
$345 million
aggregate principal amount of
3.50%
Convertible Senior Notes due 2019, or the 2019 Convertible Notes. The 2019 Convertible Notes were convertible, under certain circumstances, into NRG Yield, Inc. Class A common stock, cash or a combination thereof at an initial conversion price of
$46.55
per Class A common share, which is equivalent to an initial conversion rate of approximately
21.4822
shares of Class A common stock per
$1,000
principal amount of 2019 Convertible Notes. Effective May 15, 2015, the conversion rate was adjusted to
42.9644
shares of Class A common stock per
$1,000
principal amount of 2019 Convertible Notes in accordance with the terms of the related indenture. Interest on the 2019 Convertible Notes is payable semi-annually in arrears on February 1 and August 1 of each year, commencing on August 1, 2014. The 2019 Convertible Notes mature on February 1, 2019, unless earlier repurchased or converted in accordance with their terms. Prior to the close of business on the business day immediately preceding August 1, 2018, the 2019 Convertible Notes will be convertible only upon the occurrence of certain events and during certain periods, and thereafter, at any time until the close of business on the second scheduled trading day immediately preceding the maturity date. The 2019 Convertible Notes are accounted for in accordance with ASC 470-20. The equity component, the
$23 million
conversion option value, was recorded to NRG's noncontrolling interest for NRG Yield, Inc. with the offset to debt discount. The debt discount is being amortized to interest expense over the term of the notes. The 2019 Convertible Notes are guaranteed by NRG Yield Operating LLC and NRG Yield LLC.
NRG Yield Operating 2026 Senior Notes
On August 18, 2016, NRG Yield Operating LLC issued
$350 million
of senior unsecured notes, or the NRG Yield Operating 2026 Senior Notes. The NRG Yield Operating 2026 Senior Notes bear interest of
5.00%
and mature on September 15, 2026. Interest on the notes is payable semi-annually on March 15 and September 15 of each year, and will commence on March 15, 2017. The Yield Operating 2026 Senior Notes are senior unsecured obligations of NRG Yield Operating LLC and are guaranteed by NRG Yield LLC, and by certain of NRG Yield Operating LLC’s wholly owned current and future subsidiaries. A portion of the proceeds from the 2026 Senior Notes was used to repay NRG Yield Operating LLC's revolving credit facility.
Project Financings
The following are descriptions of certain indebtedness of NRG's project subsidiaries that are outstanding as of
December 31, 2016
.
Aqua Caliente Holdco Financing Agreement
On February 17, 2017, Agua Caliente Borrower I LLC and Agua Caliente Borrower II LLC, Agua Caliente Holdco, the indirect owners of the Agua Caliente solar facility, issued
$130 million
of senior secured notes under the Agua Caliente Holdco Financing Agreement, or 2038 Agua Caliente Holdco Notes, that bear interest at
5.43%
and mature on December 31, 2038. Net proceeds were distributed to the Company.
Utah Portfolio
As part of the 2016 utility-scale solar and wind acquisition on November 2, 2016, as discussed in
Note 3
,
Business Acquisitions and Dispositions
, NRG recorded
$222 million
of non-recourse project level debt. As of term conversion for the three associated debt facilities, the Company borrowed an additional
$65 million
of non-recourse debt. Each facility bears interest of
LIBOR
plus
2.625%
and matures on December 16, 2022.
Thermal Financing
On October 31, 2016, NRG Energy Center Minneapolis LLC, a subsidiary of NRG Yield, Inc., received proceeds of
$125 million
from the issuance of
3.55%
Series D notes due October 31, 2031, or the Series D Notes, and entered into a shelf facility for the anticipated issuance of an additional
$70 million
of notes. The Series D Notes are secured by substantially all of the assets of NRG Energy Center Minneapolis LLC. NRG Thermal LLC has guaranteed the indebtedness and its guarantee is secured by a pledge of the equity interests in all of NRG Thermal LLC’s subsidiaries. NRG Energy Center Minneapolis LLC distributed the proceeds of the Series D Notes to NRG Thermal LLC, who in turn distributed the proceeds to NRG Yield Operating LLC to be utilized for general corporate purposes, including potential acquisitions.
184
Alta Wind X and Alta Wind XI due 2021
On June 30, 2015, the Company entered into a tax equity financing arrangement through which Yield Operating, a subsidiary of NRG Yield, Inc., received
$119 million
in net proceeds. These proceeds, as well as proceeds obtained from the June 29, 2015, NRG Yield, Inc. common stock issuance and the 2020 Convertible Notes issuance, were utilized to repay all of the outstanding project indebtedness associated with Alta Wind X and Alta Wind XI facilities. The Company also settled interest rate swaps associated with the project level debt for Alta Wind X and Alta Wind XI and incurred a fee of
$17 million
.
Alta Wind lease financing arrangements
Alta Wind Holdings (Alta Wind II - V) and Alta I have finance lease obligations issued under lease transactions whereby the respective operating entities sold and leased back undivided interests in specific assets of the projects. All of the assets of Alta I-V are pledged as collateral under these arrangements. The sale and related lease transactions are accounted for as financing arrangements as the operating entities have continued involvement with the property.
|
Amount in millions, except rates
|
Lease Financing Arrangement
|
Letter of Credit Facility
|
||||||||||||||
|
Non-Recourse Debt
|
Amount Outstanding as of December 31, 2016
|
Interest Rate
|
Maturity Date
|
Amount Outstanding as of December 31, 2016
|
Interest Rate
|
Maturity Date
|
||||||||||
|
Alta Wind I
|
$
|
242
|
|
7.015%
|
12/30/2034
|
$
|
16
|
|
3.250%
|
1/5/2021
|
||||||
|
Alta Wind II
|
191
|
|
5.696%
|
12/30/2034
|
27
|
|
2.750%
|
6/30/2017& 12/31/2017
|
||||||||
|
Alta Wind III
|
198
|
|
6.067%
|
12/30/2034
|
27
|
|
2.750%
|
various
|
||||||||
|
Alta Wind IV
|
128
|
|
5.938%
|
12/30/2034
|
19
|
|
2.750%
|
various
|
||||||||
|
Alta Wind V
|
206
|
|
6.071%
|
6/30/2035
|
30
|
|
2.750%
|
various
|
||||||||
|
Total
|
$
|
965
|
|
$
|
119
|
|
||||||||||
High Lonesome Mesa Facility
Prior to the Company's acquisition of EME, an intercompany tax credit agreement related to the High Lonesome Mesa facility was terminated. The termination resulted in an event of default under the project financing arrangement. The Company received additional default notices for various items. The facility is secured by the assets of High Lonesome Mesa and is non-recourse to NRG.
On November 3, 2015, the lender sent a notice of acceleration and indicated that it would accept the Company's interest in the assets in lieu of repayment. On January 27, 2016, High Lonesome Mesa, LLC, or HLM, filed at FERC for approval to transfer
100%
of the ownership interests in HLM to subsidiaries of the lien holders, Macquarie Bank Limited and Hannon Armstrong Capital, LLC. On March 2, 2016 HLM received FERC approval and on March 31, 2016 the Company transferred
100%
of its interest in HLM to the lien holders and deconsolidated HLM.
Dandan Financing
In December 2013, NRG, through its wholly-owned subsidiary, NRG Solar Dandan LLC, or Dandan, entered into a credit agreement with a bank, or the Dandan Financing Agreement, for a
$81 million
construction loan and a
$23 million
cash grant loan. On January 29, 2016, the construction loan converted to a
$79 million
term loan with
$23 million
outstanding under the cash grant loan. In addition, a
$4 million
debt service letter of credit was issued replacing the
$5 million
construction letter of credit that was outstanding at year end. In November 2016, Dandan repaid the
$23 million
outstanding under the cash grant loan, including accrued interest and breakage fees, with the proceeds received from the U.S. Treasury Department. As of
December 31, 2016
,
$76 million
was outstanding under the term loan and
$4 million
in letters of credit in support of the project were issued.
El Segundo Energy Center Credit Agreement
On May 29, 2015, NRG West Holdings LLC amended its financing agreement to increase borrowings under the Tranche A facility by
$5 million
and to reduce the related interest rate to
LIBOR
plus an applicable margin of
1.625%
from May 29, 2015, to August 31, 2017,
LIBOR
plus an applicable margin of
1.75%
from September 1, 2017, to August 31, 2020, and
LIBOR
plus
1.875%
from September 1, 2020, through the maturity date; and to reduce Tranche B loan interest rate to
LIBOR
plus an applicable margin of
2.25%
from May 29, 2015, to August 31, 2017,
LIBOR
plus
2.375%
from September 1, 2017, to August 31, 2020, and
LIBOR
plus an applicable margin of
2.50%
from September 1, 2020, through the maturity date and to reduce the working capital facility by
$9 million
. The proceeds of the increased borrowing were used to pay costs associated with the refinancing. Further, the amendment resulted in a
$7 million
loss on debt extinguishment.
185
As of
December 31, 2016
, under the West Holdings Credit Agreement, West Holdings had outstanding
$385 million
under the Tranche A Facility,
$58 million
under the Tranche B Facility, issued a
$33 million
letter of credit in support of the PPA, issued a
$1 million
letter of credit under the working capital facility, and issued a
$48 million
letter of credit under the facility in support of its debt service requirements.
Peakers
On June 30, 2016, in contemplation of the sale of Rockford as further discussed in
Note 3
,
Business Acquisitions and Dispositions
, NRG Peaker Finance Company LLC elected to redeem all of the outstanding bonds at a redemption price equal to the principal amount plus a redemption premium, accrued and unpaid interest, swap breakage, and other fees, totaling approximately
$85 million
in connection with the removal of NRG Rockford LLC, and NRG Rockford II, LLC from the peaker financing collateral package. The Company recognized a
$3 million
loss on extinguishment of the debt related to the write-off of unamortized discount during the second quarter of 2016. On July 12, 2016, NRG completed the sale of the Rockford generating stations.
Midwest Generation
On April 7, 2016, Midwest Generation, LLC, or MWG, entered into an agreement to sell certain quantities of unforced capacity that has cleared various PJM Reliability Pricing Model auctions to a trading counterparty for net proceeds of
$253 million
. MWG will continue to operate the applicable generation facilities and remains responsible for performance penalties and eligible for performance bonus payments, if any. Accordingly, MWG will continue to account for all revenues and costs as before; however, the proceeds will be recorded as a financing obligation while capacity payments by PJM to the counterparty will be reflected as debt amortization and interest expense through the end of the 2018/19 delivery year.
MWG will amortize the upfront discount to interest expense, at an effective interest rate of
4.39%
, over the term of the arrangement, through June 2019. As of
December 31, 2016
,
$218 million
was outstanding.
CVSR
On July 15, 2016, CVSR Holdco LLC, the indirect owner of the CVSR project, issued
$200 million
of senior secured notes. The
$199 million
of net proceeds from the notes were distributed to a subsidiary of NRG and NRG Yield Operating LLC, the owners of CVSR Holdco LLC, based on their pro-rata ownership. The notes were issued at par and bear an interest rate at
4.68%
. Interest is payable semi-annually beginning on September 30, 2016, until the maturity date of March 31, 2037.
Capistrano Refinancing
On July 13, 2016, Cedro Hill, Broken Bow and Crofton Bluffs, subsidiaries of Capistrano Wind Partners, each amended their respective credit facilities to increase borrowings to a total of
$312 million
and to lower their respective interest rates. The net proceeds of
$87 million
, were distributed to Capistrano Wind Partners and subsequently distributed to the holders of the Class B preferred equity interests of Capistrano Wind Partners.
186
Interest Rate Swaps
—
Project Financings
Many of NRG's project subsidiaries entered into interest rate swaps, intended to hedge the risks associated with interest rates on non-recourse project level debt. These swaps amortize in proportion to their respective loans and are floating for fixed where the project subsidiary pays its counterparty the equivalent of a fixed interest payment on a predetermined notional value and will receive quarterly the equivalent of a floating interest payment based on the same notional value. All interest rate swap payments by the project subsidiary and its counterparty are made quarterly, and the LIBOR is determined in advance of each interest period. The following table summarizes the swaps, some of which are forward starting as indicated, related to NRG's project level debt as of
December 31, 2016
.
|
% of Principal
|
Fixed Interest Rate
|
Floating Interest Rate
|
Notional Amount at December 31, 2016 (In millions)
|
Effective Date
|
Maturity Date
|
||||||||||
|
Recourse Debt
|
|||||||||||||||
|
NRG Energy
|
85
|
%
|
various
|
|
1-mo. LIBOR
|
$
|
1,000
|
|
June 30, 2016
|
June 30, 2021
|
|||||
|
Non-Recourse Debt
|
|
|
|
|
|||||||||||
|
El Segundo Energy Center
|
75
|
%
|
2.417
|
%
|
3-mo. LIBOR
|
330
|
|
November 30, 2011
|
August 31, 2023
|
||||||
|
South Trent Wind LLC
|
75
|
%
|
3.265
|
%
|
3-mo. LIBOR
|
43
|
|
June 15, 2010
|
June 14, 2020
|
||||||
|
South Trent Wind LLC
|
75
|
%
|
4.95
|
%
|
3-mo. LIBOR
|
21
|
|
June 30, 2020
|
June 14, 2028
|
||||||
|
NRG Solar Roadrunner LLC
|
75
|
%
|
4.313
|
%
|
3-mo. LIBOR
|
28
|
|
September 30, 2011
|
December 31, 2029
|
||||||
|
NRG Solar Alpine LLC
|
85
|
%
|
2.744
|
%
|
3-mo. LIBOR
|
115
|
|
various
|
December 31, 2029
|
||||||
|
NRG Solar Alpine LLC
|
85
|
%
|
2.421
|
%
|
3-mo. LIBOR
|
8
|
|
June 24, 2014
|
June 30, 2025
|
||||||
|
NRG Solar Avra Valley LLC
|
85
|
%
|
2.333
|
%
|
3-mo. LIBOR
|
49
|
|
November 30, 2012
|
November 30, 2030
|
||||||
|
NRG Marsh Landing
|
75
|
%
|
3.244
|
%
|
3-mo. LIBOR
|
342
|
|
June 28, 2013
|
June 30, 2023
|
||||||
|
Iron Springs
|
80
|
%
|
2.555
|
%
|
1-mo. LIBOR
|
34
|
|
December 15, 2016
|
September 30, 2036
|
||||||
|
Four Brothers
|
80
|
%
|
2.567
|
%
|
1-mo. LIBOR
|
141
|
|
December 15, 2016
|
September 30, 2036
|
||||||
|
Granite Mountain
|
80
|
%
|
2.557
|
%
|
1-mo. LIBOR
|
56
|
|
December 15, 2016
|
September 30, 2036
|
||||||
|
DGPV 4
|
85
|
%
|
various
|
|
3-mo. LIBOR
|
19
|
|
various
|
various
|
||||||
|
Other
|
75
|
%
|
various
|
|
various
|
142
|
|
various
|
various
|
||||||
|
EME Project Financings
|
|||||||||||||||
|
Broken Bow
|
75
|
%
|
various
|
|
3-mo. LIBOR
|
58
|
|
various
|
various
|
||||||
|
Cedro Hill
|
90
|
%
|
various
|
|
3-mo. LIBOR
|
147
|
|
various
|
various
|
||||||
|
Crofton Bluffs
|
75
|
%
|
various
|
|
3-mo. LIBOR
|
38
|
|
various
|
various
|
||||||
|
Laredo Ridge
|
75
|
%
|
2.310
|
%
|
3-mo. LIBOR
|
79
|
|
March 31, 2011
|
March 31, 2026
|
||||||
|
Tapestry
|
75
|
%
|
2.210
|
%
|
3-mo. LIBOR
|
155
|
|
December 30, 2011
|
December 21, 2021
|
||||||
|
Tapestry
|
50
|
%
|
3.570
|
%
|
3-mo. LIBOR
|
60
|
|
December 21, 2021
|
December 21, 2029
|
||||||
|
Viento Funding II
|
90
|
%
|
various
|
|
6-mo. LIBOR
|
160
|
|
various
|
various
|
||||||
|
Viento Funding II
|
90
|
%
|
4.985
|
%
|
6-mo. LIBOR
|
65
|
|
July 11, 2023
|
June 30, 2028
|
||||||
|
Walnut Creek Energy
|
75
|
%
|
various
|
|
3-mo. LIBOR
|
276
|
|
June 28, 2013
|
May 31, 2023
|
||||||
|
WCEP Holdings
|
90
|
%
|
4.003
|
%
|
3-mo. LIBOR
|
46
|
|
June 28, 2013
|
May 21, 2023
|
||||||
|
Alta Wind Project Financings
|
|||||||||||||||
|
AWAM
|
100
|
%
|
2.470
|
%
|
3-mo. LIBOR
|
18
|
|
May 22, 2013
|
May 15, 2031
|
||||||
|
Total
|
$
|
3,430
|
|
||||||||||||
187
Note 13
—
Asset Retirement Obligations
The Company's AROs are primarily related to the future dismantlement of equipment on leased property and environmental obligations related to nuclear decommissioning, ash disposal, site closures, and fuel storage facilities. In addition, the Company has also identified conditional AROs for asbestos removal and disposal, which are specific to certain power generation operations.
See
Note 6
,
Nuclear Decommissioning Trust Fund
,
for a further discussion of the Company's nuclear decommissioning obligations. Accretion for the nuclear decommissioning ARO and amortization of the related ARO asset are recorded to the Nuclear Decommissioning Trust Liability to the ratepayers and are not included in net income, consistent with regulatory treatment.
The following table represents the balance of ARO obligations as of
December 31, 2016
and
2015
, along with the additions, reductions and accretion related to the Company's ARO obligations for the year ended
December 31, 2016
:
|
|
(In millions)
|
||
|
Balance as of December 31, 2015
|
$
|
945
|
|
|
Revisions in estimates for current obligations
|
(103
|
)
|
|
|
Additions
|
49
|
|
|
|
Spending for current obligations
|
(8
|
)
|
|
|
Accretion — Expense
|
42
|
|
|
|
Accretion — Nuclear decommissioning
|
15
|
|
|
|
Balance as of December 31, 2016
|
$
|
940
|
|
Note 14
—
Benefit Plans and Other Postretirement Benefits
NRG sponsors and operates defined benefit pension and other postretirement plans. As part of the GenOn acquisition in 2012, NRG assumed GenOn's defined benefit pension plans and other postretirement benefit plans, and GenOn's benefit plan obligations were recorded at fair value at the time of the acquisition. NRG expects to contribute
$36 million
to the Company's pension plans in
2017
.
NRG pension benefits are available to eligible non-union and union employees through various defined benefit pension plans. These benefits are based on pay, service history and age at retirement. Most pension benefits are provided through tax-qualified plans. Certain executive pension benefits that cannot be provided by the tax-qualified plans are provided through unfunded non-tax-qualified plans. NRG also provides postretirement health and welfare benefits for certain groups of employees. Cost sharing provisions vary by the terms of any applicable collective bargaining agreements.
As part of the change in control associated with the GenOn acquisition, NRG decided to terminate/settle the nonqualified legacy GenOn Benefit Restoration Plan and Supplemental Executive Retirement Plan. Final settlement payments totaling
$12 million
were paid to remaining participants during 2014. On December 31, 2014, NRG merged eight qualified pension plans into two separate qualified pension plans, the NRG Pension Plan for Bargained Employees and the NRG Pension Plan. The NRG Pension Plan for Bargained Employees, GenOn Mirant Bargaining Unit Pension Plan, GenOn First Energy Pension Plan, GenOn Duquesne Pension Plan, and GenOn REMA Pension Plan were merged into the NRG Pension Plan for Bargained Employees. The NRG Texas Retirement Plan, and GenOn Mirant Pension Plan were merged into the NRG Pension Plan for Non-Bargained Employees and renamed the NRG Pension Plan. These actions were conducted to simplify internal administration of the plans, reduce regulatory filings, and lower fees paid to outside vendors. The benefits provided to current participants in the Plans were not impacted. As controlled group members, ERISA requires that NRG and GenOn are jointly and severally liable for the NRG Pension Plan for Bargained Employees and the NRG Pension Plan, including pension liabilities associated with GenOn employees.
188
NRG Defined Benefit Plans
The annual net periodic benefit cost/(credit) related to NRG's pension and other postretirement benefit plans include the following components:
|
|
Year Ended December 31,
|
||||||||||
|
|
Pension Benefits
|
||||||||||
|
|
2016
|
2015
|
2014
|
||||||||
|
|
(In millions)
|
||||||||||
|
Service cost benefits earned
|
$
|
30
|
|
$
|
32
|
|
$
|
30
|
|
||
|
Interest cost on benefit obligation
|
43
|
|
53
|
|
53
|
|
|||||
|
Expected return on plan assets
|
(60
|
)
|
(62
|
)
|
(62
|
)
|
|||||
|
Amortization of unrecognized net loss/(gain)
|
2
|
|
2
|
|
(6
|
)
|
|||||
|
Net periodic benefit cost
|
$
|
15
|
|
$
|
25
|
|
$
|
15
|
|
||
|
|
Year Ended December 31,
|
||||||||||
|
|
Other Postretirement Benefits
|
||||||||||
|
|
2016
|
2015
|
2014
|
||||||||
|
|
(In millions)
|
||||||||||
|
Service cost benefits earned
|
$
|
2
|
|
$
|
3
|
|
$
|
3
|
|
||
|
Interest cost on benefit obligation
|
6
|
|
9
|
|
9
|
|
|||||
|
Amortization of unrecognized prior service credit
|
(5
|
)
|
(5
|
)
|
(17
|
)
|
|||||
|
Amortization of unrecognized net loss
|
—
|
|
1
|
|
—
|
|
|||||
|
Curtailment gain
|
—
|
|
(14
|
)
|
—
|
|
|||||
|
Net periodic benefit cost/(credit)
|
$
|
3
|
|
$
|
(6
|
)
|
$
|
(5
|
)
|
||
A comparison of the pension benefit obligation, other postretirement benefit obligations and related plan assets for NRG's plans on a combined basis is as follows:
|
|
As of December 31,
|
||||||||||||||
|
|
Pension Benefits
|
Other Postretirement
Benefits
|
|||||||||||||
|
|
2016
|
2015
|
2016
|
2015
|
|||||||||||
|
|
(In millions)
|
||||||||||||||
|
Benefit obligation at January 1
|
$
|
1,196
|
|
$
|
1,305
|
|
$
|
178
|
|
$
|
238
|
|
|||
|
Service cost
|
30
|
|
32
|
|
2
|
|
3
|
|
|||||||
|
Interest cost
|
43
|
|
53
|
|
6
|
|
9
|
|
|||||||
|
Plan amendments
|
—
|
|
—
|
|
(42
|
)
|
(6
|
)
|
|||||||
|
Actuarial loss/(gain)
|
40
|
|
(120
|
)
|
(2
|
)
|
(31
|
)
|
|||||||
|
Employee and retiree contributions
|
—
|
|
—
|
|
3
|
|
2
|
|
|||||||
|
Benefit payments
|
(68
|
)
|
(74
|
)
|
(17
|
)
|
(12
|
)
|
|||||||
|
Curtailment
|
—
|
|
—
|
|
—
|
|
(25
|
)
|
|||||||
|
Benefit obligation at December 31
|
1,241
|
|
1,196
|
|
128
|
|
178
|
|
|||||||
|
Fair value of plan assets at January 1
|
916
|
|
988
|
|
—
|
|
—
|
|
|||||||
|
Actual return on plan assets
|
72
|
|
(26
|
)
|
—
|
|
—
|
|
|||||||
|
Employee and retiree contributions
|
—
|
|
—
|
|
3
|
|
2
|
|
|||||||
|
Employer contributions
|
33
|
|
28
|
|
14
|
|
10
|
|
|||||||
|
Benefit payments
|
(68
|
)
|
(74
|
)
|
(17
|
)
|
(12
|
)
|
|||||||
|
Fair value of plan assets at December 31
|
953
|
|
916
|
|
—
|
|
—
|
|
|||||||
|
Funded status at December 31 — excess of obligation over assets
|
$
|
(288
|
)
|
$
|
(280
|
)
|
$
|
(128
|
)
|
$
|
(178
|
)
|
|||
189
Amounts recognized in NRG's balance sheets were as follows:
|
|
As of December 31,
|
||||||||||||||
|
|
Pension Benefits
|
Other Postretirement
Benefits
|
|||||||||||||
|
|
2016
|
2015
|
2016
|
2015
|
|||||||||||
|
|
(In millions)
|
||||||||||||||
|
Current liabilities
|
$
|
—
|
|
$
|
—
|
|
$
|
8
|
|
$
|
12
|
|
|||
|
Non-current liabilities
|
288
|
|
280
|
|
120
|
|
166
|
|
|||||||
Amounts recognized in NRG's accumulated OCI that have not yet been recognized as components of net periodic benefit cost were as follows:
|
|
As of December 31,
|
||||||||||||||
|
|
Pension Benefits
|
Other Postretirement
Benefits
|
|||||||||||||
|
|
2016
|
2015
|
2016
|
2015
|
|||||||||||
|
|
(In millions)
|
||||||||||||||
|
Net loss/(gain)
|
$
|
94
|
|
$
|
68
|
|
$
|
(11
|
)
|
$
|
(9
|
)
|
|||
|
Prior service cost/(credit)
|
3
|
|
3
|
|
(45
|
)
|
(9
|
)
|
|||||||
Other changes in plan assets and benefit obligations recognized in OCI were as follows:
|
|
Year Ended December 31,
|
||||||||||||||
|
|
Pension
Benefits
|
Other Postretirement
Benefits
|
|||||||||||||
|
|
2016
|
2015
|
2016
|
2015
|
|||||||||||
|
|
(In millions)
|
||||||||||||||
|
Net actuarial loss/(gain)
|
$
|
28
|
|
$
|
(31
|
)
|
$
|
(2
|
)
|
$
|
(31
|
)
|
|||
|
Amortization of net actuarial (gain)/loss
|
(2
|
)
|
(2
|
)
|
—
|
|
(1
|
)
|
|||||||
|
Prior service credit
|
—
|
|
(1
|
)
|
(41
|
)
|
(7
|
)
|
|||||||
|
Amortization of prior service cost
|
—
|
|
—
|
|
5
|
|
5
|
|
|||||||
|
Curtailment
|
—
|
|
—
|
|
—
|
|
(11
|
)
|
|||||||
|
Total recognized in other comprehensive loss/(income)
|
$
|
26
|
|
$
|
(34
|
)
|
$
|
(38
|
)
|
$
|
(45
|
)
|
|||
|
Total recognized in net periodic pension cost/(credit) and other comprehensive loss/(income)
|
$
|
41
|
|
$
|
(8
|
)
|
$
|
36
|
|
$
|
(37
|
)
|
|||
The Company's estimated unrecognized loss and unrecognized prior service cost for NRG's pension plan that will be amortized from accumulated OCI to net periodic cost over the next fiscal year is approximately
$4 million
. The Company's estimated unrecognized gain and unrecognized prior service credit for NRG's postretirement plan that will be amortized from accumulated OCI to net periodic cost over the next fiscal year is
$1 million
and
$8 million
, respectively.
The following table presents the balances of significant components of NRG's pension plan:
|
|
As of December 31,
|
||||||
|
|
Pension Benefits
|
||||||
|
|
2016
|
2015
|
|||||
|
|
(In millions)
|
||||||
|
Projected benefit obligation
|
$
|
1,241
|
|
$
|
1,196
|
|
|
|
Accumulated benefit obligation
|
1,174
|
|
1,115
|
|
|||
|
Fair value of plan assets
|
953
|
|
916
|
|
|||
190
NRG's market-related value of its plan assets is the fair value of the assets. The fair values of the Company's pension plan assets by asset category and their level within the fair value hierarchy are as follows:
|
|
Fair Value Measurements as of December 31, 2016
|
||||||||||
|
|
Quoted Prices in
Active Markets for
Identical Assets
(Level 1)
|
Significant
Observable Inputs
(Level 2)
|
Total
|
||||||||
|
|
(In millions)
|
||||||||||
|
Common/collective trust investment — U.S. equity
|
$
|
—
|
|
$
|
283
|
|
$
|
283
|
|
||
|
Common/collective trust investment — non-U.S. equity
|
—
|
|
149
|
|
149
|
|
|||||
|
Common/collective trust investment — global equity
|
—
|
|
104
|
|
104
|
|
|||||
|
Common/collective trust investment — fixed income
|
—
|
|
383
|
|
383
|
|
|||||
|
Partnerships/joint ventures
|
—
|
|
31
|
|
31
|
|
|||||
|
Short-term investment fund
|
3
|
|
—
|
|
3
|
|
|||||
|
Total
|
$
|
3
|
|
$
|
950
|
|
$
|
953
|
|
||
|
|
Fair Value Measurements as of December 31, 2015
|
||||||||||
|
|
Quoted Prices in
Active Markets for
Identical Assets
(Level 1)
|
Significant
Observable Inputs
(Level 2)
|
Total
|
||||||||
|
|
(In millions)
|
||||||||||
|
Common/collective trust investment — U.S. equity
|
$
|
—
|
|
$
|
255
|
|
$
|
255
|
|
||
|
Common/collective trust investment — non-U.S. equity
|
—
|
|
147
|
|
147
|
|
|||||
|
Common/collective trust investment — global equity
|
—
|
|
90
|
|
90
|
|
|||||
|
Common/collective trust investment — fixed income
|
—
|
|
400
|
|
400
|
|
|||||
|
Partnerships/joint ventures
|
—
|
|
18
|
|
18
|
|
|||||
|
Short-term investment fund
|
6
|
|
—
|
|
6
|
|
|||||
|
Total
|
$
|
6
|
|
$
|
910
|
|
$
|
916
|
|
||
In accordance with ASC 820, the Company determines the level in the fair value hierarchy within which each fair value measurement in its entirety falls, based on the lowest level input that is significant to the fair value measurement in its entirety. The fair value of the common/collective trusts is valued at fair value which is equal to the sum of the market value of all of the fund's underlying investments, and is categorized as Level 2. Partnerships/joint ventures Level 2 investments consist primarily of a partnership which invests in emerging market equity securities. There are no investments categorized as Level 3.
The following table presents the significant assumptions used to calculate NRG's benefit obligations:
|
|
As of December 31,
|
||||||||||
|
|
Pension Benefits
|
Other Postretirement Benefits
|
|||||||||
|
Weighted-Average Assumptions
|
2016
|
2015
|
2016
|
2015
|
|||||||
|
Discount rate
|
4.26
|
%
|
4.52
|
%
|
4.29
|
%
|
4.55
|
%
|
|||
|
Rate of compensation increase
|
3.00
|
%
|
3.00
|
%
|
N/A
|
|
N/A
|
|
|||
|
Health care trend rate
|
—
|
|
—
|
|
7.0% grading to 5.0% in 2025
|
|
7.25% grading to 5.0% in 2025
|
|
|||
191
The following table presents the significant assumptions used to calculate NRG's benefit expense:
|
|
As of December 31,
|
||||||||||||||||
|
|
Pension Benefits
|
Other Postretirement Benefits
|
|||||||||||||||
|
Weighted-Average Assumptions
|
2016
|
2015
|
2014
|
2016
|
2015
|
2014
|
|||||||||||
|
Discount rate
|
4.52
|
%
|
4.16
|
%
|
4.99
|
%
|
4.55
|
%
|
4.20
|
%
|
5.06
|
%
|
|||||
|
Expected return on plan assets
|
6.65
|
%
|
6.36
|
%
|
6.81
|
%
|
—
|
|
—
|
|
—
|
|
|||||
|
Rate of compensation increase
|
3.00
|
%
|
3.45
|
%
|
3.65
|
%
|
—
|
|
—
|
|
—
|
|
|||||
|
Health care trend rate
|
—
|
|
—
|
|
—
|
|
7.25% grading to 5.0% in 2025
|
|
8.6% grading to 5.0% in 2023
|
|
8.5% grading to 5.5% in 2019
|
|
|||||
NRG uses December 31 of each respective year as the measurement date for the Company's pension and other postretirement benefit plans. The Company sets the discount rate assumptions on an annual basis for each of NRG's defined benefit retirement plans as of December 31. The discount rate assumptions represent the current rate at which the associated liabilities could be effectively settled at December 31. The Company utilizes the Aon Hewitt AA Above Median, or AA-AM, yield curve to select the appropriate discount rate assumption for each retirement plan. The AA-AM yield curve is a hypothetical AA yield curve represented by a series of annualized individual spot discount rates from
6
months to
99
years. Each bond issue used to build this yield curve must be non-callable, and have an average rating of AA when averaging available Moody's Investor Services, Standard & Poor's and Fitch ratings.
NRG employs a total return investment approach, whereby a mix of equities and fixed income investments are used to maximize the long-term return of plan assets for a prudent level of risk. Risk tolerance is established through careful consideration of plan liabilities, plan funded status, and corporate financial condition. The Investment Committee reviews the asset mix periodically and as the plan assets increase in future years, the Investment Committee may examine other asset classes such as real estate or private equity. NRG employs a building block approach to determining the long-term rate of return assumption for plan assets, with proper consideration given to diversification and rebalancing. Historical markets are studied and long-term historical relationships between equities and fixed income are preserved, consistent with the widely accepted capital market principle that assets with higher volatility generate a greater return over the long run. Current factors such as inflation and interest rates are evaluated before long-term capital market assumptions are determined. Peer data and historical returns are reviewed to check for reasonableness and appropriateness.
In 2016, NRG changed the approach utilized to estimate the service cost and interest cost components of net periodic benefit cost for pension and postretirement benefit plans. Historically, the Company estimated these components by using a single weighted average discount rate derived from the yield curve used to measure the benefit obligation. The Company has elected to use a spot rate approach in the estimation of the components of benefit cost by applying specific spot rates along the yield curve to the relevant projected cash flows, as this provides a better estimate of service and interest costs. This election is considered a change in estimate and, accordingly, has been accounted for starting in 2016. This change does not affect the measurement of NRG's total benefit obligation.
The target allocations of NRG's pension plan assets were as follows for the year ended
December 31, 2016
:
|
U.S. equity
|
27
|
%
|
|
Non-U.S. equity
|
15
|
%
|
|
Global equity
|
10
|
%
|
|
Emerging market equity
|
3
|
%
|
|
U.S. fixed income
|
45
|
%
|
Plan assets are currently invested in a diversified blend of equity and fixed-income investments. Furthermore, equity investments are diversified across U.S., non-U.S., global, and emerging market equities, as well as among growth, value, small and large capitalization stocks.
192
Investment risk and performance are monitored on an ongoing basis through quarterly portfolio reviews of each asset fund class to a related performance benchmark, if applicable, and annual pension liability measurements. Performance benchmarks are composed of the following indices:
|
Asset Class
|
Index
|
|
|
U.S. equities
|
Dow Jones U.S. Total Stock Market Index
|
|
|
Non-U.S. equities
|
MSCI All Country World Ex-U.S. IMI Index
|
|
|
Global equities
|
MSCI World Index
|
|
|
Emerging market equities
|
MSCI Emerging Markets Index
|
|
|
Fixed income securities
|
Barclays Capital Long Term Government/Credit Index & Barclays Strips 20+ Index
|
|
NRG's expected future benefit payments for each of the next five years, and in the aggregate for the five years thereafter, are as follows:
|
|
|
Other Postretirement Benefit
|
|||||||||
|
|
Pension
Benefit Payments
|
Benefit Payments
|
Medicare Prescription Drug Reimbursements
|
||||||||
|
(In millions)
|
|||||||||||
|
2017
|
$
|
66
|
|
$
|
8
|
|
$
|
—
|
|
||
|
2018
|
69
|
|
8
|
|
—
|
|
|||||
|
2019
|
72
|
|
8
|
|
—
|
|
|||||
|
2020
|
76
|
|
9
|
|
—
|
|
|||||
|
2021
|
79
|
|
9
|
|
—
|
|
|||||
|
2022-2026
|
417
|
|
38
|
|
1
|
|
|||||
Assumed health care cost trend rates have a significant effect on the amounts reported for the health care plans. A one-percentage-point change in assumed health care cost trend rates would have the following effect:
|
1-Percentage-
Point Increase
|
1-Percentage-
Point Decrease
|
||||||
|
|
(In millions)
|
||||||
|
Effect on total service and interest cost components
|
$
|
1
|
|
$
|
—
|
|
|
|
Effect on postretirement benefit obligation
|
9
|
|
(8
|
)
|
|||
STP Defined Benefit Plans
NRG has a
44%
undivided ownership interest in STP, as discussed further in
Note 27
,
Jointly Owned Plants
. STPNOC, which operates and maintains STP, provides its employees a defined benefit pension plan as well as postretirement health and welfare benefits. Although NRG does not sponsor the STP plan, it reimburses STPNOC for
44%
of the contributions made towards its retirement plan obligations. For the year ended
December 31, 2016
, NRG reimbursed STPNOC
$7 million
towards its defined benefit plans. For the year ended December 31, 2015, NRG reimbursed STPNOC
$9 million
towards its defined benefit plans. In
2017
, NRG expects to reimburse STPNOC
$12 million
for its contribution towards the plans.
The Company has recognized the following in its statement of financial position, statement of operations and accumulated OCI related to its
44%
interest in STP:
|
|
As of December 31,
|
||||||||||||||
|
|
Pension Benefits
|
Other Postretirement Benefits
|
|||||||||||||
|
|
2016
|
2015
|
2016
|
2015
|
|||||||||||
|
|
(In millions)
|
||||||||||||||
|
Funded status — STPNOC benefit plans
|
$
|
(74
|
)
|
$
|
(63
|
)
|
$
|
(23
|
)
|
$
|
(26
|
)
|
|||
|
Net periodic benefit cost/(credit)
|
7
|
|
10
|
|
(2
|
)
|
(8
|
)
|
|||||||
|
Other changes in plan assets and benefit obligations recognized in other comprehensive income/(loss)
|
11
|
|
(8
|
)
|
(1
|
)
|
6
|
|
|||||||
193
Defined Contribution Plans
NRG's employees are also eligible to participate in defined contribution 401(k) plans. Upon completion of the GenOn acquisition, NRG assumed GenOn's defined contribution 401(k) plans and amended the plan covering the majority of employees with NRG 401(k) plan features, effective January 1, 2013. On July 5, 2013, the GenOn defined contribution 401(k) plans were merged into the NRG 401(k) plan.
The Company's contributions to these plans were as follows:
|
|
Year Ended December 31,
|
||||||||||
|
|
2016
|
2015
|
2014
|
||||||||
|
|
(In millions)
|
||||||||||
|
Company contributions to defined contribution plans
|
$
|
55
|
|
$
|
53
|
|
$
|
47
|
|
||
Note 15
—
Capital Structure
For the period from
December 31, 2013
to
December 31, 2016
, the Company had
10,000,000
shares of preferred stock authorized, and
500,000,000
shares of common stock authorized. The following table reflects the changes in NRG's common shares issued and outstanding for each period presented:
|
|
Common
|
|||||||
|
|
Issued
|
Treasury
|
Outstanding
|
|||||
|
Balance as of December 31, 2013
|
401,126,780
|
|
(77,347,528
|
)
|
323,779,252
|
|
||
|
Shares issued under ESPP
|
—
|
|
128,336
|
|
128,336
|
|
||
|
Shares issued under LTIPs
|
1,707,419
|
|
—
|
|
1,707,419
|
|
||
|
Shares issued in connection with the EME acquisition
|
12,671,977
|
|
—
|
|
12,671,977
|
|
||
|
Share repurchases
|
—
|
|
(1,624,360
|
)
|
(1,624,360
|
)
|
||
|
Balance as of December 31, 2014
|
415,506,176
|
|
(78,843,552
|
)
|
336,662,624
|
|
||
|
Shares issued under ESPP
|
—
|
|
283,139
|
|
283,139
|
|
||
|
Shares issued under LTIPs
|
1,433,774
|
|
—
|
|
1,433,774
|
|
||
|
Share repurchases
|
—
|
|
(24,189,495
|
)
|
(24,189,495
|
)
|
||
|
Balance as of December 31, 2015
|
416,939,950
|
|
(102,749,908
|
)
|
314,190,042
|
|
||
|
Shares issued under ESPP
|
—
|
|
609,094
|
|
609,094
|
|
||
|
Shares issued under LTIPs
|
643,875
|
|
—
|
|
643,875
|
|
||
|
Balance as of December 31, 2016
|
417,583,825
|
|
(102,140,814
|
)
|
315,443,011
|
|
||
Common Stock
The following table summarizes NRG's common stock reserved for the maximum number of shares potentially issuable based on the conversion and redemption features of the long-term incentive plans as of
December 31, 2016
:
|
Equity Instrument
|
Common Stock
Reserve Balance
|
|
|
Long-term incentive plans
|
17,336,092
|
|
Common stock dividends
— In 2014, NRG paid quarterly dividends on the Company's common stock of
$0.14
per share, or
$0.56
per share on an annualized basis. In
2015
, the Company increased its annual common stock dividend by
4%
to
$0.58
per share and in
2016
, as part of the 2016 Capital Allocation Program, the Company decreased its annual common stock dividend by
79%
to
$0.12
per share. The following table lists the dividends paid per common share during
2016
,
2015
and
2014
:
|
Fourth Quarter
|
Third Quarter
|
Second Quarter
|
First Quarter
|
||||||||||||
|
2016
|
$
|
0.030
|
|
$
|
0.030
|
|
$
|
0.030
|
|
$
|
0.145
|
|
|||
|
2015
|
$
|
0.145
|
|
$
|
0.145
|
|
$
|
0.145
|
|
$
|
0.145
|
|
|||
|
2014
|
$
|
0.140
|
|
$
|
0.140
|
|
$
|
0.140
|
|
$
|
0.120
|
|
|||
On
January 18, 2017
, NRG declared a quarterly dividend on the Company's common stock of
$0.03
per share, or
$0.12
per share on an annualized basis, payable on
February 15, 2017
, to stockholders of record as of
February 1, 2017
.
194
Employee Stock Purchase Plan
— Under the ESPP, eligible employees may elect to withhold up to
10%
of their eligible compensation to purchase shares of NRG common stock at the lesser of
85%
of its fair market value on the offering date or
85%
of the fair market value on the exercise date. An offering date occurs each January 1 and July 1. An exercise date occurs each June 30 and December 31. As of
December 31, 2016
, there remained
667,819
shares of treasury stock reserved for issuance under the ESPP, and in the first quarter of
2017
,
282,530
shares of common stock were issued to employee accounts from treasury stock.
Share Repurchases
—
During 2015 and 2014, the Company's board of directors authorized share repurchases of
$481 million
of its common stock, which were made as follows:
|
Total number of shares purchased
|
Average price paid per share
(a)
|
Amounts paid for shares purchased
(in millions)
(a)
|
|||||||||
|
Board Authorized Share Repurchases
|
|||||||||||
|
Fourth Quarter 2014
|
1,624,360
|
|
$
|
26.95
|
|
$
|
44
|
|
|||
|
First Quarter 2015
|
3,146,484
|
|
25.15
|
|
79
|
|
|||||
|
Second Quarter 2015
|
4,379,907
|
|
24.53
|
|
107
|
|
|||||
|
Third Quarter 2015
|
11,104,184
|
|
15.06
|
|
167
|
|
|||||
|
Fourth Quarter 2015
|
5,558,920
|
|
15.03
|
|
84
|
|
|||||
|
Total Board Authorized Share Repurchases
|
25,813,855
|
|
$
|
481
|
|
||||||
(a) The average price paid per share and amounts paid for shares purchased exclude the commissions of
$0.015
per share paid in connection with the share repurchase.
Preferred Stock
2.822% Redeemable Preferred Stock
Preferred Stock
On December 23, 2014, NRG and the Credit Suisse Group amended and restated its
250,000
shares of
3.625%
Convertible Perpetual Preferred Stock, or
3.625%
Preferred Stock, which is treated as redeemable preferred stock, initially issued on August 11, 2005, to the Credit Suisse Group in a private placement. The amendment resulted in a reduction of the rate from
3.625%
to
2.822%
and is hereby referred to as the
2.822%
Preferred Stock. The transaction was accounted for as an extinguishment of the
3.625%
Preferred Stock and the issuance of new
2.822%
Preferred Stock. The loss on extinguishment of the
3.625%
Preferred Stock of
$42 million
represents the increase in redeemable preferred stock as the Company recorded the
2.822%
Preferred Stock at a fair value of
$291 million
in connection with the amendment. The loss on extinguishment of
$42 million
as well as
$5 million
in consent fees paid to Credit Suisse, were recorded as a dividend on the preferred shares. This amount reduced net income to arrive at net income/(loss) available to NRG common stockholders in the calculation of earnings per share for the year ended December 31, 2014.
On May 24, 2016, NRG entered an agreement with Credit Suisse Group to repurchase
100%
of the outstanding shares of its
$344.5 million
2.822%
preferred stock. On June 13, 2016, the Company completed the repurchase from Credit Suisse of
100%
of the outstanding shares at a price of
$226 million
. The transaction resulted in a gain on redemption of
$78 million
, measured as the difference between the fair value of the cash consideration paid upon redemption of
$226 million
and the carrying value of the preferred stock at the time of the redemption of
$304 million
. This amount is reflected in net income/(loss) available to NRG common stockholders in the calculation of earnings per share.
195
The following table reflects the changes in the Company's redeemable preferred stock balance for the years ended
December 31, 2016
,
2015
, and 2014:
|
(In millions)
|
|||
|
Balance as of December 31, 2013
|
$
|
249
|
|
|
Loss recorded in connection with extinguishment of 3.625% preferred stock and issuance of 2.822% preferred stock
|
42
|
|
|
|
Balance as of December 31, 2014
|
291
|
|
|
|
Accretion to redemption value
|
11
|
|
|
|
Balance as of December 31, 2015
|
302
|
|
|
|
Accretion to redemption value
|
2
|
|
|
|
Repurchase of 2.822% redeemable preferred stock
|
(226
|
)
|
|
|
Gain on redemption of 2.822% redeemable preferred stock
|
(78
|
)
|
|
|
Balance as of December 31, 2016
|
$
|
—
|
|
Note 16
—
Investments Accounted for by the Equity Method and Variable Interest Entities
Entities that are not Consolidated
NRG accounts for the Company's significant investments using the equity method of accounting. NRG's carrying value of equity investments can be impacted by impairments, unrealized gains and losses on derivatives and movements in foreign currency exchange rates, as well as other adjustments.
The following table summarizes NRG's equity method investments as of
December 31, 2016
:
|
Name
|
Economic
Interest
|
Investment Balance
|
||||
|
(In millions)
|
||||||
|
Avenal Solar Holdings LLC
(a)
|
50.0
|
%
|
$
|
(7
|
)
|
|
|
Community Wind North, LLC
|
99.0
|
%
|
21
|
|
||
|
Desert Sunlight Investment Holdings, LLC
(a)
|
25.0
|
%
|
282
|
|
||
|
Elkhorn Ridge Wind, LLC
(a)
|
47.0
|
%
|
85
|
|
||
|
GenConn Energy LLC
(a)
|
50.0
|
%
|
106
|
|
||
|
Four Brothers Holdings
(c)
|
50.0
|
%
|
208
|
|
||
|
Granite Mountain Renewables
(c)
|
50.0
|
%
|
90
|
|
||
|
Iron Springs Renewables
(c)
|
50.0
|
%
|
48
|
|
||
|
Midway-Sunset Cogeneration Company
|
50.0
|
%
|
22
|
|
||
|
Petra Nova Parish Holdings LLC
|
50.0
|
%
|
34
|
|
||
|
Saguaro Power Company
|
50.0
|
%
|
(14
|
)
|
||
|
San Juan Mesa Wind Project, LLC
(a)
|
75.0
|
%
|
74
|
|
||
|
Sherbino I Wind Farm LLC
|
50.0
|
%
|
—
|
|
||
|
Watson Cogeneration Company
|
49.0
|
%
|
26
|
|
||
|
Gladstone Power Station
(b)
|
37.5
|
%
|
132
|
|
||
|
Other
|
Various
|
|
13
|
|
||
|
Total equity investments in affiliates
|
$
|
1,120
|
|
|||
(a) Equity method investments owned by NRG Yield
(b) Gladstone Power Station is located in Australia
(c) Economic interest based on cash to be distributed
|
|
As of December 31,
|
||||||
|
|
2016
|
2015
|
|||||
|
|
(In millions)
|
||||||
|
Undistributed earnings from equity investments
|
$
|
101
|
|
$
|
55
|
|
|
196
Utility-Scale Solar Portfolio
—
As described in
Note 3
,
Business Acquisitions and Dispositions
, on November 2, 2016, the Company acquired equity interests in a tax equity portfolio, located in Utah, comprised of
530
MW of mechanically-complete solar assets. These equity interests in Four Brothers Holdings, Granite Mountain Renewables, and Iron Springs Renewables are accounted for as equity method investments.
Variable Interest Entities
NRG accounts for its interests in certain entities that are considered VIEs under ASC 810, for which NRG is not the primary beneficiary, under the equity method.
GenConn
— NRG owns a
50%
interest in GenConn, a limited liability company formed to construct, own and operate
two
190
MW peaking generation facilities in Connecticut at NRG's Devon and Middletown sites.
GenConn has a
$237 million
note with an interest rate of
4.73%
and a maturity date of July 2041 and a
5
-year,
$35 million
working capital facility which can be used to issue letters of credit at an interest rate of
1.875%
. As of
December 31, 2016
,
$212 million
was outstanding under the note and
$14 million
was drawn on the working capital facility. The note is secured by all of the GenConn assets. NRG's maximum exposure to loss is limited to its equity investment, which was
$106 million
as of
December 31, 2016
.
Sherbino
— NRG owns a
50%
interest in Sherbino, a joint venture with BP Wind Energy North America Inc. Sherbino is a
150
MW wind farm, which commenced commercial operations in October 2008. In December 2008, Sherbino entered into a
15
-year term loan facility which is non-recourse to NRG. As of
December 31, 2016
, the outstanding principal balance of the term loan facility was
$72 million
, and is secured by substantially all of Sherbino's assets and membership interests. During the fourth quarter of 2016, the Company recorded an other-than-temporary impairment loss equal to the full value of its investment in Sherbino of
$70 million
as further described in
Note 10
,
Asset Impairments
.
Other Equity Investments
Gladstone
— Through a joint venture, NRG owns a
37.5%
interest in Gladstone, a
1,613
MW coal-fueled power generation facility in Queensland, Australia. The power generation facility is managed by the joint venture participants and the facility is operated by NRG. Operating expenses incurred in connection with the operation of the facility are funded by each of the participants in proportion to their ownership interests. Coal is sourced from local mines in Queensland. NRG and the joint venture participants receive their respective share of revenues directly from the off takers in proportion to the ownership interests in the joint venture. Power generated by the facility is primarily sold to an adjacent aluminum smelter, with excess power sold to the Queensland Government owned utility under long term supply contracts. NRG's investment in Gladstone was
$132 million
as of
December 31, 2016
.
Entities that are Consolidated
The Company has a controlling financial interest in certain entities which have been identified as VIEs under ASC 810. These arrangements are primarily related to tax equity arrangements entered into with third-parties in order to finance the cost of solar energy systems under operating leases and wind facilities eligible for certain tax credits as further described in
Note 2
,
Summary of Significant Accounting Policies
. For one of the tax equity arrangements, the Company has a deficit restoration obligation equal to
$88 million
as of
December 31, 2016
, which would be required to be funded if the arrangement were to be dissolved.
The summarized financial information for the Company's consolidated VIEs consisted of the following:
|
(In millions)
|
December 31, 2016
|
December 31, 2015
|
|||||
|
Current assets
|
$
|
87
|
|
$
|
84
|
|
|
|
Net property, plant and equipment
|
1,534
|
|
1,807
|
|
|||
|
Other long-term assets
|
954
|
|
863
|
|
|||
|
Total assets
|
2,575
|
|
|
2,754
|
|
||
|
Current liabilities
|
59
|
|
56
|
|
|||
|
Long-term debt
|
442
|
|
366
|
|
|||
|
Other long-term liabilities
|
183
|
|
179
|
|
|||
|
Total liabilities
|
684
|
|
|
601
|
|
||
|
Noncontrolling interests
|
529
|
|
493
|
|
|||
|
Net assets less noncontrolling interests
|
$
|
1,362
|
|
|
$
|
1,660
|
|
197
Note 17
—
Earnings/(Loss) Per Share
Basic earnings/(loss) per common share is computed by dividing net income/(loss) less accumulated preferred stock dividends by the weighted average number of common shares outstanding. Shares issued and treasury shares repurchased during the year are weighted for the portion of the year that they were outstanding. Diluted earnings/(loss) per share is computed in a manner consistent with that of basic earnings/(loss) per share while giving effect to all potentially dilutive common shares that were outstanding during the period.
Dilutive effect for equity compensation and other equity instruments
— The outstanding non-qualified stock options, non-vested restricted stock units, and market stock units are not considered outstanding for purposes of computing basic earnings/(loss) per share. However, these instruments are included in the denominator for purposes of computing diluted earnings/(loss) per share under the treasury stock method. The if-converted method was used to determine the dilutive effect of embedded derivatives in the Company's
2.822%
Preferred Stock for the years ended December 31, 2015 and 2014. During 2016, the Company repurchased
100%
of the outstanding shares of its
2.822%
preferred stock.
The reconciliation of NRG's basic earnings/(loss) per share to diluted earnings/(loss) per share is shown in the following table:
|
|
Year Ended December 31,
|
||||||||||
|
|
2016
|
2015
|
2014
|
||||||||
|
|
(In millions, except per share amounts)
|
||||||||||
|
Basic (loss)/earnings per share attributable to NRG common stockholders
|
|
|
|
||||||||
|
Net (loss)/income attributable to NRG Energy, Inc.
|
$
|
(774
|
)
|
$
|
(6,382
|
)
|
$
|
134
|
|
||
|
Dividends for preferred shares
|
5
|
|
20
|
|
9
|
|
|||||
|
Dividends for refinancing of preferred shares
|
—
|
|
—
|
|
47
|
|
|||||
|
Gain on redemption of 2.822% redeemable perpetual preferred shares
|
(78
|
)
|
—
|
|
—
|
|
|||||
|
(Loss)/Income Available to Common Stockholders
|
$
|
(701
|
)
|
$
|
(6,402
|
)
|
|
$
|
78
|
|
|
|
Weighted average number of common shares outstanding
|
316
|
|
|
329
|
|
|
334
|
|
|||
|
(Loss)/Earnings per weighted average common share —
basic
|
$
|
(2.22
|
)
|
$
|
(19.46
|
)
|
$
|
0.23
|
|
||
|
Diluted (loss)/earnings per share attributable to NRG common stockholders
|
|
|
|||||||||
|
Weighted average number of common shares outstanding
|
316
|
|
329
|
|
334
|
|
|||||
|
Incremental shares attributable to the issuance of equity compensation (treasury stock method)
|
—
|
|
—
|
|
5
|
|
|||||
|
Total dilutive shares
|
316
|
|
329
|
|
339
|
|
|||||
|
(Loss)/Earnings per weighted average common share
—
diluted
|
$
|
(2.22
|
)
|
$
|
(19.46
|
)
|
$
|
0.23
|
|
||
The following table summarizes NRG's outstanding equity instruments that are anti-dilutive and were not included in the computation of the Company's diluted earnings/(loss) per share:
|
|
Year Ended December 31,
|
|||||||
|
|
2016
|
2015
|
2014
|
|||||
|
|
(In millions of shares)
|
|||||||
|
Equity compensation
|
5
|
|
6
|
|
1
|
|
||
|
Embedded derivative of 2.822% redeemable perpetual preferred stock
|
—
|
|
16
|
|
16
|
|
||
|
Total
|
5
|
|
22
|
|
17
|
|
||
198
Note 18
—
Segment Reporting
The Company's segment structure reflects how management currently makes financial decisions and allocates resources. During January 2017, the Company's businesses are segregated as follows: Generation, which includes generation, international and BETM (previously part of Corporate); Retail which includes Mass customers (previously Retail Mass), and Business Solutions, which includes C&I customers and other distributed and reliability products (previously in the Generation segment); Renewables, which includes solar and wind assets, excluding those in NRG Yield; NRG Yield; and corporate activities. The Company's corporate segment includes residential solar and electric vehicle services. Intersegment sales are accounted for at market. The financial information for years ended
December 31, 2016
,
2015
, and
2014
have been recast to reflect these changes.
NRG Yield includes certain of the Company's contracted generation assets. On September 1, 2016 NRG Yield acquired the remaining
51.05%
interest in CVSR Holdco LLC, which indirectly owns the CVSR solar facility, from the Company. This acquisition was accounted for as transfers of entities under common control and accordingly, all historical periods have been recast to reflect this change.
NRG’s chief operating decision maker, its chief executive officer, evaluates the performance of its segments based on operational measures including adjusted earnings before interest, taxes, depreciation and amortization, or Adjusted EBITDA, free cash flow and capital for allocation, as well as net income/(loss) and net income/(loss) attributable to NRG Energy, Inc.
During the years ended
December 31, 2016
,
2015
and
2014
, the Company had
one
customer in the East region within Generation which comprised more than
10%
of the Company's consolidated revenues.
|
|
For the Year Ended December 31, 2016
|
||||||||||||||||||||||||||
|
|
Generation
(a)
|
Retail
(a)
|
Renewables
(a)
|
NRG Yield
(a)
|
Corporate
(a)
|
Eliminations
|
Total
|
||||||||||||||||||||
|
|
(In millions)
|
||||||||||||||||||||||||||
|
Operating revenues
(a)
|
$
|
5,679
|
|
$
|
6,336
|
|
$
|
417
|
|
$
|
1,021
|
|
$
|
77
|
|
$
|
(1,179
|
)
|
$
|
12,351
|
|
||||||
|
Operating expenses
|
4,922
|
|
5,169
|
|
215
|
|
322
|
|
212
|
|
(1,184
|
)
|
9,656
|
|
|||||||||||||
|
Depreciation and amortization
|
702
|
|
115
|
|
190
|
|
297
|
|
63
|
|
—
|
|
1,367
|
|
|||||||||||||
|
Impairment losses
|
645
|
|
1
|
|
56
|
|
183
|
|
33
|
|
—
|
|
918
|
|
|||||||||||||
|
Acquisition-related transaction and integration costs
|
—
|
|
—
|
|
—
|
|
1
|
|
7
|
|
—
|
|
8
|
|
|||||||||||||
|
Development costs
|
22
|
|
4
|
|
40
|
|
—
|
|
24
|
|
—
|
|
90
|
|
|||||||||||||
|
Total operating cost and expenses
|
6,291
|
|
5,289
|
|
501
|
|
803
|
|
339
|
|
(1,184
|
)
|
12,039
|
|
|||||||||||||
|
Gain/(loss) on sale of assets
|
294
|
|
(1
|
)
|
—
|
|
—
|
|
(78
|
)
|
—
|
|
215
|
|
|||||||||||||
|
Operating (loss)/income
|
(318
|
)
|
1,046
|
|
(84
|
)
|
218
|
|
(340
|
)
|
5
|
|
527
|
|
|||||||||||||
|
Equity in (losses)/earnings of unconsolidated affiliates
|
(5
|
)
|
—
|
|
(30
|
)
|
37
|
|
7
|
|
18
|
|
27
|
|
|||||||||||||
|
Impairment losses on investments
|
(142
|
)
|
—
|
|
(105
|
)
|
—
|
|
(21
|
)
|
—
|
|
(268
|
)
|
|||||||||||||
|
Other income, net
|
36
|
|
1
|
|
1
|
|
3
|
|
62
|
|
(61
|
)
|
42
|
|
|||||||||||||
|
Loss on debt extinguishment
|
—
|
|
—
|
|
—
|
|
—
|
|
(142
|
)
|
—
|
|
(142
|
)
|
|||||||||||||
|
Interest expense
|
(79
|
)
|
(1
|
)
|
(108
|
)
|
(274
|
)
|
(658
|
)
|
59
|
|
(1,061
|
)
|
|||||||||||||
|
(Loss)/income before income taxes
|
(508
|
)
|
1,046
|
|
(326
|
)
|
(16
|
)
|
(1,092
|
)
|
21
|
|
(875
|
)
|
|||||||||||||
|
Income tax (benefit)/expense
|
(1
|
)
|
1
|
|
(20
|
)
|
(1
|
)
|
37
|
|
—
|
|
16
|
|
|||||||||||||
|
Net (loss)/income
|
$
|
(507
|
)
|
$
|
1,045
|
|
$
|
(306
|
)
|
$
|
(15
|
)
|
$
|
(1,129
|
)
|
$
|
21
|
|
$
|
(891
|
)
|
||||||
|
Less: Net (loss)/income attributable to noncontrolling interests and redeemable noncontrolling interests
|
—
|
|
—
|
|
(13
|
)
|
(54
|
)
|
16
|
|
(66
|
)
|
(117
|
)
|
|||||||||||||
|
Net (loss)/income attributable to NRG Energy, Inc.
|
$
|
(507
|
)
|
$
|
1,045
|
|
$
|
(293
|
)
|
$
|
39
|
|
$
|
(1,145
|
)
|
$
|
87
|
|
$
|
(774
|
)
|
||||||
|
Balance sheet
|
|
|
|
|
|||||||||||||||||||||||
|
Equity investments in affiliates
|
$
|
204
|
|
$
|
—
|
|
$
|
372
|
|
$
|
710
|
|
$
|
91
|
|
$
|
(257
|
)
|
$
|
1,120
|
|
||||||
|
Capital expenditures
(b)
|
767
|
|
12
|
|
330
|
|
23
|
|
110
|
|
—
|
|
1,242
|
|
|||||||||||||
|
Goodwill
|
199
|
|
340
|
|
12
|
|
|
|
111
|
|
|
|
662
|
|
|||||||||||||
|
Total assets
|
$
|
13,256
|
|
$
|
1,977
|
|
$
|
5,280
|
|
$
|
8,383
|
|
$
|
15,590
|
|
$
|
(14,131
|
)
|
$
|
30,355
|
|
||||||
|
(a) Inter-segment sales and net derivative gains and losses included in operating revenues
|
$
|
955
|
|
$
|
4
|
|
$
|
23
|
|
$
|
8
|
|
$
|
189
|
|
$
|
—
|
|
$
|
1,179
|
|
||||||
(b) Includes accruals.
199
|
|
For the Year Ended December 31, 2015
|
||||||||||||||||||||||||||
|
|
Generation
(a)
|
Retail
(a)
|
Renewables
(a)
|
NRG Yield
(a)
|
Corporate
(a)
|
Eliminations
|
Total
|
||||||||||||||||||||
|
|
(In millions)
|
||||||||||||||||||||||||||
|
Operating revenues
(a)
|
$
|
7,546
|
|
$
|
6,914
|
|
$
|
392
|
|
$
|
953
|
|
$
|
39
|
|
$
|
(1,170
|
)
|
$
|
14,674
|
|
||||||
|
Operating expenses
|
6,210
|
|
6,113
|
|
185
|
|
333
|
|
291
|
|
(1,149
|
)
|
11,983
|
|
|||||||||||||
|
Depreciation and amortization
|
896
|
|
133
|
|
181
|
|
297
|
|
59
|
|
—
|
|
1,566
|
|
|||||||||||||
|
Impairment losses
|
4,827
|
|
36
|
|
13
|
|
—
|
|
132
|
|
22
|
|
5,030
|
|
|||||||||||||
|
Acquisition-related transaction and integration costs
|
—
|
|
1
|
|
—
|
|
3
|
|
6
|
|
—
|
|
10
|
|
|||||||||||||
|
Development costs
|
27
|
|
4
|
|
52
|
|
—
|
|
63
|
|
—
|
|
146
|
|
|||||||||||||
|
Total operating cost and expenses
|
11,960
|
|
6,287
|
|
431
|
|
633
|
|
551
|
|
(1,127
|
)
|
18,735
|
|
|||||||||||||
|
Gain on postretirement benefits curtailment
|
21
|
|
—
|
|
—
|
|
—
|
|
—
|
|
—
|
|
21
|
|
|||||||||||||
|
Operating (loss)/income
|
(4,393
|
)
|
627
|
|
|
(39
|
)
|
|
320
|
|
|
(512
|
)
|
|
(43
|
)
|
|
(4,040
|
)
|
||||||||
|
Equity in earnings/(losses) of unconsolidated affiliates
|
10
|
|
—
|
|
9
|
|
26
|
|
—
|
|
(9
|
)
|
36
|
|
|||||||||||||
|
Impairment losses on investments
|
(14
|
)
|
—
|
|
—
|
|
—
|
|
(42
|
)
|
—
|
|
(56
|
)
|
|||||||||||||
|
Other income, net
|
48
|
|
(1
|
)
|
3
|
|
3
|
|
78
|
|
(98
|
)
|
33
|
|
|||||||||||||
|
(Loss)/gain on debt extinguishment
|
—
|
|
—
|
|
—
|
|
(9
|
)
|
84
|
|
—
|
|
75
|
|
|||||||||||||
|
Loss on sale of equity method investment
|
—
|
|
—
|
|
—
|
|
—
|
|
(14
|
)
|
—
|
|
(14
|
)
|
|||||||||||||
|
Interest expense
|
(97
|
)
|
(1
|
)
|
(83
|
)
|
(263
|
)
|
(779
|
)
|
95
|
|
(1,128
|
)
|
|||||||||||||
|
(Loss)/income before income taxes
|
(4,446
|
)
|
625
|
|
|
(110
|
)
|
|
77
|
|
|
(1,185
|
)
|
|
(55
|
)
|
|
(5,094
|
)
|
||||||||
|
Income tax expense/(benefit)
|
—
|
|
1
|
|
(18
|
)
|
12
|
|
1,347
|
|
—
|
|
1,342
|
|
|||||||||||||
|
Net (loss)/income
|
(4,446
|
)
|
624
|
|
(92
|
)
|
65
|
|
(2,532
|
)
|
(55
|
)
|
(6,436
|
)
|
|||||||||||||
|
Less: Net income/(loss) attributable to noncontrolling interests and redeemable noncontrolling interests
|
—
|
|
—
|
|
6
|
|
19
|
|
(37
|
)
|
(42
|
)
|
(54
|
)
|
|||||||||||||
|
Net (loss)/income attributable to NRG Energy, Inc.
|
$
|
(4,446
|
)
|
$
|
624
|
|
$
|
(98
|
)
|
$
|
46
|
|
$
|
(2,495
|
)
|
$
|
(13
|
)
|
$
|
(6,382
|
)
|
||||||
|
Balance sheet
|
|
|
|
|
|
|
|||||||||||||||||||||
|
Equity investments in affiliates
|
$
|
334
|
|
$
|
—
|
|
$
|
134
|
|
$
|
697
|
|
$
|
127
|
|
$
|
(247
|
)
|
$
|
1,045
|
|
||||||
|
Capital expenditures
(b)
|
792
|
|
36
|
|
163
|
|
30
|
|
246
|
|
—
|
|
1,267
|
|
|||||||||||||
|
Goodwill
|
536
|
|
340
|
|
12
|
|
—
|
|
111
|
|
—
|
|
999
|
|
|||||||||||||
|
Total assets
|
$
|
17,625
|
|
$
|
2,017
|
|
$
|
5,142
|
|
$
|
8,689
|
|
$
|
19,720
|
|
$
|
(20,311
|
)
|
$
|
32,882
|
|
||||||
|
(a) Inter-segment sales and net derivative gains and losses included in operating revenues
|
$
|
898
|
|
$
|
6
|
|
$
|
25
|
|
$
|
29
|
|
$
|
212
|
|
$
|
—
|
|
$
|
1,170
|
|
||||||
(b) Includes accruals.
200
|
|
For the Year Ended December 31, 2014
|
||||||||||||||||||||||||||
|
|
Generation
(a)
|
Retail
(a)
|
Renewables
(a)
|
NRG Yield
(a)
|
Corporate
(a)
|
Eliminations
|
Total
|
||||||||||||||||||||
|
|
(In millions)
|
||||||||||||||||||||||||||
|
Operating revenues
(a)
|
$
|
9,288
|
|
$
|
7,393
|
|
$
|
344
|
|
$
|
828
|
|
$
|
19
|
|
$
|
(2,004
|
)
|
$
|
15,868
|
|
||||||
|
Operating expenses
|
6,985
|
|
7,270
|
|
191
|
|
285
|
|
151
|
|
(2,058
|
)
|
12,824
|
|
|||||||||||||
|
Depreciation and amortization
|
957
|
|
134
|
|
164
|
|
233
|
|
35
|
|
—
|
|
1,523
|
|
|||||||||||||
|
Impairment losses
|
87
|
|
—
|
|
32
|
|
—
|
|
(22
|
)
|
—
|
|
97
|
|
|||||||||||||
|
Acquisition-related transaction and integration costs
|
1
|
|
3
|
|
—
|
|
4
|
|
76
|
|
—
|
|
84
|
|
|||||||||||||
|
Development costs
|
12
|
|
1
|
|
40
|
|
—
|
|
35
|
|
—
|
|
88
|
|
|||||||||||||
|
Total operating costs and expenses
|
8,042
|
|
7,408
|
|
427
|
|
522
|
|
275
|
|
(2,058
|
)
|
14,616
|
|
|||||||||||||
|
Gain on sale of assets
|
19
|
|
—
|
|
—
|
|
—
|
|
—
|
|
—
|
|
19
|
|
|||||||||||||
|
Operating income/(loss)
|
1,265
|
|
(15
|
)
|
(83
|
)
|
306
|
|
(256
|
)
|
54
|
|
1,271
|
|
|||||||||||||
|
Equity in earnings/(losses)of unconsolidated affiliates
|
23
|
|
—
|
|
(4
|
)
|
17
|
|
—
|
|
2
|
|
38
|
|
|||||||||||||
|
Other income, net
|
39
|
|
—
|
|
1
|
|
6
|
|
75
|
|
(99
|
)
|
22
|
|
|||||||||||||
|
Gain on sale of equity method investment
|
18
|
|
—
|
|
—
|
|
—
|
|
—
|
|
—
|
|
18
|
|
|||||||||||||
|
Loss on debt extinguishment
|
—
|
|
—
|
|
(1
|
)
|
(1
|
)
|
(93
|
)
|
—
|
|
(95
|
)
|
|||||||||||||
|
Interest expense
|
(94
|
)
|
(2
|
)
|
(97
|
)
|
(216
|
)
|
(806
|
)
|
96
|
|
(1,119
|
)
|
|||||||||||||
|
Income/(loss) before income taxes
|
1,251
|
|
(17
|
)
|
(184
|
)
|
112
|
|
(1,080
|
)
|
53
|
|
135
|
|
|||||||||||||
|
Income tax expense/(benefit)
|
3
|
|
1
|
|
—
|
|
4
|
|
(5
|
)
|
—
|
|
3
|
|
|||||||||||||
|
Net income/(loss)
|
$
|
1,248
|
|
(18
|
)
|
(184
|
)
|
108
|
|
(1,075
|
)
|
53
|
|
132
|
|
||||||||||||
|
Less: Net (loss)/income attributable to noncontrolling interests and redeemable noncontrolling interests
|
(1
|
)
|
—
|
|
2
|
|
16
|
|
5
|
|
(24
|
)
|
(2
|
)
|
|||||||||||||
|
Net income/(loss) attributable to NRG Energy, Inc.
|
$
|
1,249
|
|
$
|
(18
|
)
|
$
|
(186
|
)
|
$
|
92
|
|
$
|
(1,080
|
)
|
$
|
77
|
|
$
|
134
|
|
||||||
|
(a) Inter-segment sales and net derivative gains and losses included in operating revenues
|
$
|
1,873
|
|
$
|
7
|
|
$
|
25
|
|
$
|
12
|
|
$
|
85
|
|
$
|
—
|
|
$
|
2,002
|
|
||||||
201
As of December 31, 2016, the Company's businesses were segregated as follows: Generation (previously named Generation/Business), which includes generation, international and business solutions; Retail Mass (previously NRG Home Retail); Renewables (previously named NRG Renew), which includes solar and wind assets, excluding those in NRG Yield; NRG Yield; and corporate activities. The Company's corporate segment included BETM, residential solar (previously part of NRG Home) and electric vehicle services. During 2016, the Company began reporting the results of its residential solar business in its corporate segment and its international business in its Generation segment. The financial information for years ended
December 31, 2016
,
2015
, and
2014
have been recast to reflect these changes.
NRG Yield includes certain of the Company's contracted generation assets. On September 1, 2016 NRG Yield acquired the remaining
51.05%
interest in CVSR Holdco LLC, which indirectly owns the CVSR solar facility, from the Company. This acquisition was accounted for as transfers of entities under common control and accordingly, all historical periods have been recast to reflect this change.
|
|
For the Year Ended December 31, 2016
|
||||||||||||||||||||||||||
|
|
Generation
(a)
|
Retail Mass
(a)
|
Renewables
(a)
|
NRG Yield
(a)
|
Corporate
(a)
|
Eliminations
|
Total
|
||||||||||||||||||||
|
|
(In millions)
|
||||||||||||||||||||||||||
|
Operating revenues
(a)
|
$
|
6,927
|
|
$
|
4,966
|
|
$
|
417
|
|
$
|
1,021
|
|
$
|
137
|
|
$
|
(1,117
|
)
|
$
|
12,351
|
|
||||||
|
Operating expenses
|
6,020
|
|
3,987
|
|
215
|
|
322
|
|
235
|
|
(1,123
|
)
|
9,656
|
|
|||||||||||||
|
Depreciation and amortization
|
712
|
|
104
|
|
190
|
|
297
|
|
64
|
|
—
|
|
1,367
|
|
|||||||||||||
|
Impairment losses
|
646
|
|
—
|
|
56
|
|
183
|
|
33
|
|
—
|
|
918
|
|
|||||||||||||
|
Acquisition-related transaction and integration costs
|
—
|
|
—
|
|
—
|
|
1
|
|
7
|
|
—
|
|
8
|
|
|||||||||||||
|
Development costs
|
26
|
|
—
|
|
40
|
|
—
|
|
24
|
|
—
|
|
90
|
|
|||||||||||||
|
Total operating cost and expenses
|
7,404
|
|
4,091
|
|
501
|
|
803
|
|
363
|
|
(1,123
|
)
|
12,039
|
|
|||||||||||||
|
Gain/(loss) on sale of assets
|
293
|
|
—
|
|
—
|
|
—
|
|
(78
|
)
|
—
|
|
215
|
|
|||||||||||||
|
Operating (loss)/income
|
(184
|
)
|
875
|
|
(84
|
)
|
218
|
|
(304
|
)
|
6
|
|
527
|
|
|||||||||||||
|
Equity in (losses)/earnings of unconsolidated affiliates
|
(5
|
)
|
—
|
|
(30
|
)
|
37
|
|
7
|
|
18
|
|
27
|
|
|||||||||||||
|
Impairment losses on investments
|
(142
|
)
|
—
|
|
(105
|
)
|
—
|
|
(21
|
)
|
—
|
|
(268
|
)
|
|||||||||||||
|
Other income, net
|
37
|
|
—
|
|
1
|
|
3
|
|
62
|
|
(61
|
)
|
42
|
|
|||||||||||||
|
Loss on debt extinguishment
|
—
|
|
—
|
|
—
|
|
—
|
|
(142
|
)
|
—
|
|
(142
|
)
|
|||||||||||||
|
Interest expense
|
(80
|
)
|
—
|
|
(108
|
)
|
(274
|
)
|
(658
|
)
|
59
|
|
(1,061
|
)
|
|||||||||||||
|
(Loss)/income before income taxes
|
(374
|
)
|
875
|
|
(326
|
)
|
(16
|
)
|
(1,056
|
)
|
22
|
|
(875
|
)
|
|||||||||||||
|
Income tax (benefit)/expense
|
—
|
|
—
|
|
(20
|
)
|
(1
|
)
|
37
|
|
—
|
|
16
|
|
|||||||||||||
|
Net (loss)/income
|
$
|
(374
|
)
|
$
|
875
|
|
$
|
(306
|
)
|
$
|
(15
|
)
|
$
|
(1,093
|
)
|
$
|
22
|
|
$
|
(891
|
)
|
||||||
|
Less: Net (loss)/income attributable to noncontrolling interests and redeemable noncontrolling interests
|
—
|
|
—
|
|
(13
|
)
|
(54
|
)
|
16
|
|
(66
|
)
|
(117
|
)
|
|||||||||||||
|
Net (loss)/income attributable to NRG Energy, Inc.
|
$
|
(374
|
)
|
$
|
875
|
|
$
|
(293
|
)
|
$
|
39
|
|
$
|
(1,109
|
)
|
$
|
88
|
|
$
|
(774
|
)
|
||||||
|
Balance sheet
|
|
|
|
|
|||||||||||||||||||||||
|
Equity investments in affiliates
|
$
|
204
|
|
$
|
—
|
|
$
|
372
|
|
$
|
710
|
|
$
|
91
|
|
$
|
(257
|
)
|
$
|
1,120
|
|
||||||
|
Capital expenditures
(b)
|
779
|
|
59
|
|
330
|
|
23
|
|
51
|
|
—
|
|
1,242
|
|
|||||||||||||
|
Goodwill
|
199
|
|
340
|
|
12
|
|
—
|
|
111
|
|
—
|
|
662
|
|
|||||||||||||
|
Total assets
|
$
|
13,234
|
|
$
|
1,589
|
|
$
|
5,280
|
|
$
|
8,383
|
|
$
|
15,734
|
|
$
|
(13,865
|
)
|
$
|
30,355
|
|
||||||
|
(a) Inter-segment sales and net derivative gains and losses included in operating revenues
|
$
|
893
|
|
$
|
2
|
|
$
|
23
|
|
$
|
8
|
|
$
|
191
|
|
$
|
—
|
|
$
|
1,117
|
|
||||||
(b) Includes accruals.
202
|
|
For the Year Ended December 31, 2015
|
||||||||||||||||||||||||||
|
|
Generation
(a)
|
Retail Mass
(a)
|
Renewables
(a)
|
NRG Yield
(a)
|
Corporate
(a)
|
Eliminations
|
Total
|
||||||||||||||||||||
|
|
(In millions)
|
||||||||||||||||||||||||||
|
Operating revenues
(a)
|
$
|
9,097
|
|
$
|
5,389
|
|
$
|
392
|
|
$
|
953
|
|
$
|
14
|
|
$
|
(1,171
|
)
|
$
|
14,674
|
|
||||||
|
Operating expenses
|
7,744
|
|
4,561
|
|
184
|
|
333
|
|
310
|
|
(1,149
|
)
|
11,983
|
|
|||||||||||||
|
Depreciation and amortization
|
907
|
|
123
|
|
180
|
|
297
|
|
59
|
|
—
|
|
1,566
|
|
|||||||||||||
|
Impairment losses
|
4,827
|
|
36
|
|
13
|
|
—
|
|
132
|
|
22
|
|
5,030
|
|
|||||||||||||
|
Acquisition-related transaction and integration costs
|
—
|
|
1
|
|
—
|
|
3
|
|
6
|
|
—
|
|
10
|
|
|||||||||||||
|
Development costs
|
31
|
|
—
|
|
52
|
|
—
|
|
63
|
|
—
|
|
146
|
|
|||||||||||||
|
Total operating cost and expenses
|
13,509
|
|
4,721
|
|
429
|
|
633
|
|
570
|
|
(1,127
|
)
|
18,735
|
|
|||||||||||||
|
Gain on postretirement benefits curtailment
|
21
|
|
—
|
|
—
|
|
—
|
|
—
|
|
—
|
|
21
|
|
|||||||||||||
|
Operating (loss)/income
|
(4,391
|
)
|
668
|
|
(37
|
)
|
320
|
|
(556
|
)
|
(44
|
)
|
(4,040
|
)
|
|||||||||||||
|
Equity in earnings/(losses) of unconsolidated affiliates
|
10
|
|
—
|
|
9
|
|
26
|
|
(3
|
)
|
(6
|
)
|
36
|
|
|||||||||||||
|
Impairment losses on investments
|
(14
|
)
|
—
|
|
—
|
|
—
|
|
(42
|
)
|
—
|
|
(56
|
)
|
|||||||||||||
|
Other income, net
|
48
|
|
—
|
|
3
|
|
3
|
|
77
|
|
(98
|
)
|
33
|
|
|||||||||||||
|
(Loss)/gain on debt extinguishment
|
—
|
|
—
|
|
—
|
|
(9
|
)
|
84
|
|
—
|
|
75
|
|
|||||||||||||
|
Loss on sale of equity method investment
|
—
|
|
—
|
|
—
|
|
—
|
|
(14
|
)
|
—
|
|
(14
|
)
|
|||||||||||||
|
Interest expense
|
(98
|
)
|
—
|
|
(83
|
)
|
(263
|
)
|
(779
|
)
|
95
|
|
(1,128
|
)
|
|||||||||||||
|
(Loss)/income before income taxes
|
(4,445
|
)
|
668
|
|
(108
|
)
|
77
|
|
(1,233
|
)
|
(53
|
)
|
(5,094
|
)
|
|||||||||||||
|
Income tax expense/(benefit)
|
1
|
|
—
|
|
(18
|
)
|
12
|
|
1,347
|
|
—
|
|
1,342
|
|
|||||||||||||
|
Net (loss)/income
|
(4,446
|
)
|
668
|
|
(90
|
)
|
65
|
|
(2,580
|
)
|
(53
|
)
|
(6,436
|
)
|
|||||||||||||
|
Less: Net income/(loss) attributable to noncontrolling interests and redeemable noncontrolling interests
|
—
|
|
—
|
|
6
|
|
19
|
|
(37
|
)
|
(42
|
)
|
(54
|
)
|
|||||||||||||
|
Net (loss)/income attributable to NRG Energy, Inc.
|
$
|
(4,446
|
)
|
$
|
668
|
|
$
|
(96
|
)
|
$
|
46
|
|
$
|
(2,543
|
)
|
$
|
(11
|
)
|
$
|
(6,382
|
)
|
||||||
|
Balance sheet
|
|
|
|
|
|
|
|||||||||||||||||||||
|
Equity investments in affiliates
|
$
|
334
|
|
$
|
—
|
|
$
|
134
|
|
$
|
697
|
|
$
|
127
|
|
$
|
(247
|
)
|
$
|
1,045
|
|
||||||
|
Capital expenditures
(b)
|
798
|
|
30
|
|
163
|
|
30
|
|
246
|
|
—
|
|
1,267
|
|
|||||||||||||
|
Goodwill
|
536
|
|
340
|
|
12
|
|
—
|
|
111
|
|
—
|
|
999
|
|
|||||||||||||
|
Total assets
|
$
|
17,324
|
|
$
|
1,876
|
|
$
|
5,142
|
|
$
|
8,689
|
|
$
|
19,926
|
|
$
|
(20,075
|
)
|
$
|
32,882
|
|
||||||
|
(a) Inter-segment sales and net derivative gains and losses included in operating revenues
|
$
|
898
|
|
$
|
6
|
|
$
|
25
|
|
$
|
29
|
|
$
|
213
|
|
$
|
—
|
|
$
|
1,171
|
|
||||||
(b) Includes accruals.
203
|
|
For the Year Ended December 31, 2014
|
||||||||||||||||||||||||||
|
|
Generation
(a)
|
Retail Mass
(a)
|
Renewables
(a)
|
NRG Yield
(a)
|
Corporate
(a)
|
Eliminations
|
Total
|
||||||||||||||||||||
|
|
(In millions)
|
||||||||||||||||||||||||||
|
Operating revenues
(a)
|
$
|
11,113
|
|
$
|
5,503
|
|
$
|
344
|
|
$
|
828
|
|
$
|
82
|
|
$
|
(2,002
|
)
|
$
|
15,868
|
|
||||||
|
Operating expenses
|
8,993
|
|
5,236
|
|
191
|
|
285
|
|
171
|
|
(2,052
|
)
|
12,824
|
|
|||||||||||||
|
Depreciation and amortization
|
966
|
|
122
|
|
164
|
|
233
|
|
38
|
|
—
|
|
1,523
|
|
|||||||||||||
|
Impairment losses
|
87
|
|
—
|
|
32
|
|
—
|
|
(22
|
)
|
—
|
|
97
|
|
|||||||||||||
|
Acquisition-related transaction and integration costs
|
1
|
|
3
|
|
—
|
|
4
|
|
76
|
|
—
|
|
84
|
|
|||||||||||||
|
Development costs
|
13
|
|
—
|
|
40
|
|
—
|
|
35
|
|
—
|
|
88
|
|
|||||||||||||
|
Total operating costs and expenses
|
10,060
|
|
5,361
|
|
427
|
|
522
|
|
298
|
|
(2,052
|
)
|
14,616
|
|
|||||||||||||
|
Gain on sale of assets
|
19
|
|
—
|
|
—
|
|
—
|
|
—
|
|
—
|
|
19
|
|
|||||||||||||
|
Operating income/(loss)
|
1,072
|
|
142
|
|
(83
|
)
|
306
|
|
(216
|
)
|
50
|
|
1,271
|
|
|||||||||||||
|
Equity in earnings/(losses)of unconsolidated affiliates
|
23
|
|
—
|
|
(4
|
)
|
17
|
|
—
|
|
2
|
|
38
|
|
|||||||||||||
|
Other income, net
|
39
|
|
—
|
|
1
|
|
6
|
|
75
|
|
(99
|
)
|
22
|
|
|||||||||||||
|
Gain on sale of equity method investment
|
18
|
|
—
|
|
—
|
|
—
|
|
—
|
|
—
|
|
18
|
|
|||||||||||||
|
Loss on debt extinguishment
|
—
|
|
—
|
|
(1
|
)
|
(1
|
)
|
(93
|
)
|
—
|
|
(95
|
)
|
|||||||||||||
|
Interest expense
|
(95
|
)
|
(1
|
)
|
(97
|
)
|
(216
|
)
|
(806
|
)
|
96
|
|
(1,119
|
)
|
|||||||||||||
|
Income/(loss) before income taxes
|
1,057
|
|
141
|
|
(184
|
)
|
112
|
|
(1,040
|
)
|
49
|
|
135
|
|
|||||||||||||
|
Income tax expense/(benefit)
|
4
|
|
—
|
|
—
|
|
4
|
|
(5
|
)
|
—
|
|
3
|
|
|||||||||||||
|
Net income/(loss)
|
1,053
|
|
141
|
|
(184
|
)
|
108
|
|
(1,035
|
)
|
49
|
|
132
|
|
|||||||||||||
|
Less: Net (loss)/income attributable to noncontrolling interests and redeemable noncontrolling interests
|
(1
|
)
|
—
|
|
2
|
|
16
|
|
5
|
|
(24
|
)
|
(2
|
)
|
|||||||||||||
|
Net income/(loss) attributable to NRG Energy, Inc.
|
$
|
1,054
|
|
$
|
141
|
|
$
|
(186
|
)
|
$
|
92
|
|
$
|
(1,040
|
)
|
$
|
73
|
|
$
|
134
|
|
||||||
|
(a) Inter-segment sales and net derivative gains and losses included in operating revenues
|
$
|
1,873
|
|
$
|
7
|
|
$
|
25
|
|
$
|
12
|
|
$
|
85
|
|
$
|
—
|
|
$
|
2,002
|
|
||||||
204
Note 19
—
Income Taxes
The income tax provision from continuing operations consisted of the following amounts:
|
|
Year Ended December 31,
|
||||||||||
|
|
2016
|
2015
|
2014
|
||||||||
|
|
(In millions, except percentages)
|
||||||||||
|
Current
|
|
|
|
||||||||
|
State
|
$
|
17
|
|
$
|
6
|
|
$
|
8
|
|
||
|
Total — current
|
17
|
|
6
|
|
8
|
|
|||||
|
Deferred
|
|
|
|
||||||||
|
U.S. Federal
|
3
|
|
1,020
|
|
(50
|
)
|
|||||
|
State
|
(6
|
)
|
315
|
|
41
|
|
|||||
|
Foreign
|
2
|
|
1
|
|
4
|
|
|||||
|
Total — deferred
|
(1
|
)
|
1,336
|
|
(5
|
)
|
|||||
|
Total income tax expense
|
$
|
16
|
|
$
|
1,342
|
|
$
|
3
|
|
||
|
Effective tax rate
|
(1.8
|
)%
|
(26.3
|
)%
|
2.2
|
%
|
|||||
The following represents the domestic and foreign components of income/(loss) before income tax expense/(benefit):
|
|
Year Ended December 31,
|
||||||||||
|
|
2016
|
2015
|
2014
|
||||||||
|
|
(In millions)
|
||||||||||
|
U.S.
|
$
|
(886
|
)
|
$
|
(5,105
|
)
|
$
|
126
|
|
||
|
Foreign
|
11
|
|
11
|
|
9
|
|
|||||
|
Total
|
$
|
(875
|
)
|
$
|
(5,094
|
)
|
$
|
135
|
|
||
A reconciliation of the U.S. federal statutory rate of
35%
to NRG's effective rate is as follows:
|
|
Year Ended December 31,
|
||||||||||
|
|
2016
|
2015
|
2014
|
||||||||
|
|
(In millions, except percentages)
|
||||||||||
|
(Loss)/income before income taxes
|
$
|
(875
|
)
|
$
|
(5,094
|
)
|
$
|
135
|
|
||
|
Tax at 35%
|
(306
|
)
|
(1,783
|
)
|
47
|
|
|||||
|
State taxes
|
11
|
|
(218
|
)
|
9
|
|
|||||
|
Foreign operations
|
10
|
|
1
|
|
1
|
|
|||||
|
Federal and state tax credits, excluding PTCs
|
—
|
|
(5
|
)
|
(1
|
)
|
|||||
|
Valuation allowance
|
306
|
|
3,039
|
|
6
|
|
|||||
|
Impact of non-taxable equity earnings
|
22
|
|
(10
|
)
|
(11
|
)
|
|||||
|
Book goodwill impairment
|
—
|
|
340
|
|
—
|
|
|||||
|
Net interest accrued on uncertain tax positions
|
1
|
|
(3
|
)
|
(2
|
)
|
|||||
|
Production tax credit
|
(26
|
)
|
(33
|
)
|
(48
|
)
|
|||||
|
Recognition of uncertain tax benefits
|
2
|
|
(15
|
)
|
(30
|
)
|
|||||
|
Tax expense attributable to consolidated partnerships
|
(1
|
)
|
12
|
|
4
|
|
|||||
|
Impact of change in effective state tax rate
|
1
|
|
19
|
|
22
|
|
|||||
|
Other
|
(4
|
)
|
(2
|
)
|
6
|
|
|||||
|
Income tax expense
|
$
|
16
|
|
$
|
1,342
|
|
$
|
3
|
|
||
|
Effective income tax rate
|
(1.8
|
)%
|
(26.3
|
)%
|
2.2
|
%
|
|||||
For the year ended
December 31, 2016
, NRG's overall effective tax rate was different than the statutory rate of
35%
primarily due to the change in valuation allowance, the impact of non-taxable equity earnings and current state tax expense, partially offset by the generation of PTCs from various wind facilities.
For the year ended
December 31, 2015
, NRG's overall effective tax rate was different than the statutory rate of
35%
primarily due to recording of a valuation allowance on the federal and certain state net deferred tax assets that may not be realizable under a “more likely than not” measurement. In addition, a portion of the book goodwill impairment is classified as a permanent reversal impacting the effective tax rate.
205
For the year ended
December 31, 2014
, NRG's overall effective tax rate was different than the statutory rate of
35%
primarily due to the generation of PTCs generated from various wind facilities including assets acquired in the EME transaction, and a benefit resulting from the recognition of uncertain tax benefits, partially offset by state and local income taxes including a change in the effective state rate.
The temporary differences, which gave rise to the Company's deferred tax assets and liabilities consisted of the following:
|
|
As of December 31,
|
||||||
|
|
2016
|
2015
|
|||||
|
|
(In millions)
|
||||||
|
Deferred tax liabilities:
|
|
|
|||||
|
Emissions allowances
|
$
|
30
|
|
$
|
31
|
|
|
|
Derivatives, net
|
—
|
|
22
|
|
|||
|
Cumulative translation adjustments
|
11
|
|
2
|
|
|||
|
Investment in projects
|
374
|
|
838
|
|
|||
|
Total deferred tax liabilities
|
415
|
|
893
|
|
|||
|
Deferred tax assets:
|
|
|
|||||
|
Deferred compensation, accrued vacation and other reserves
|
318
|
|
255
|
|
|||
|
Discount/premium on notes
|
45
|
|
68
|
|
|||
|
Difference between book and tax basis of property
|
1,511
|
|
1,210
|
|
|||
|
Goodwill
|
83
|
|
39
|
|
|||
|
Differences between book and tax basis of contracts
|
301
|
|
516
|
|
|||
|
Pension and other postretirement benefits
|
183
|
|
218
|
|
|||
|
Equity compensation
|
11
|
|
50
|
|
|||
|
Bad debt reserve
|
12
|
|
6
|
|
|||
|
U.S. capital loss carryforwards
|
1
|
|
1
|
|
|||
|
U.S. Federal net operating loss carryforwards
|
1,171
|
|
1,373
|
|
|||
|
Foreign net operating loss carryforwards
|
63
|
|
59
|
|
|||
|
State net operating loss carryforwards
|
223
|
|
230
|
|
|||
|
Foreign capital loss carryforwards
|
1
|
|
1
|
|
|||
|
Deferred financing costs
|
4
|
|
6
|
|
|||
|
Federal and state tax credit carryforwards
|
446
|
|
439
|
|
|||
|
Federal benefit on state uncertain tax positions
|
12
|
|
17
|
|
|||
|
Intangibles amortization (excluding goodwill)
|
211
|
|
90
|
|
|||
|
Derivatives, net
|
101
|
|
—
|
|
|||
|
Inventory obsolescence
|
31
|
|
27
|
|
|||
|
Other
|
8
|
|
11
|
|
|||
|
Total deferred tax assets
|
4,736
|
|
4,616
|
|
|||
|
Valuation allowance
|
(4,116
|
)
|
(3,575
|
)
|
|||
|
Total deferred tax assets, net of valuation allowance
|
620
|
|
1,041
|
|
|||
|
Net deferred tax asset
|
$
|
205
|
|
$
|
148
|
|
|
The following table summarizes NRG's net deferred tax position:
|
|
As of December 31,
|
||||||
|
|
2016
|
2015
|
|||||
|
|
(In millions)
|
||||||
|
Net deferred tax asset — noncurrent
|
$
|
225
|
|
$
|
167
|
|
|
|
Net deferred tax liability — noncurrent
|
(20
|
)
|
(19
|
)
|
|||
|
Net deferred tax asset
|
$
|
205
|
|
$
|
148
|
|
|
Deferred tax assets and valuation allowance
Net deferred tax balance
— As of
December 31, 2016
and
2015
, NRG recorded a net deferred tax asset of
$4.3 billion
and
$3.7 billion
, respectively. The Company believes the federal and certain state net deferred tax assets may not be realizable under a “more likely than not” measurement and as such, a valuation allowance has been recorded to reduce the asset accordingly. The Company assesses cumulative and forecasted pretax book earnings and the future reversal of existing taxable temporary differences.
206
Based on the Company's assessment of positive and negative evidence, including available tax planning strategies, NRG believes that it is more likely than not that a benefit will not be realized on
$4.1 billion
and
$3.6 billion
of tax assets as of
December 31, 2016
, and
2015
, respectively, thus a valuation allowance has been recorded. The net deferred tax asset of
$205 million
is predominantly due to the inclusion of NRG Yield Inc.'s net deferred tax asset consisting primarily of net operating losses.
NOL carryforwards
— At
December 31, 2016
, the Company had tax effected cumulative domestic NOLs consisting of carryforwards for federal income tax purposes of
$1.2 billion
and state of
$223 million
. The Company estimates it will need to generate future taxable income to fully realize the net federal deferred tax asset before expiration commencing in 2026. In addition, NRG has cumulative foreign NOL carryforwards of
$63 million
with no expiration date.
Valuation allowance
— As of
December 31, 2016
, the Company's tax effected valuation allowance was
$4.1 billion
, consisting of domestic federal net deferred tax assets of approximately
$3.6 billion
, domestic state net deferred tax assets of
$504 million
, foreign net operating loss carryforwards of
$63 million
and foreign capital loss carryforwards of approximately
$1 million
. Based upon the assessment of cumulative and forecasted pretax book earnings, and the future reversal of existing taxable temporary differences, it was determined that a valuation allowance was required to be recorded during the year.
Taxes Receivable and Payable
As of
December 31, 2016
, NRG recorded a current tax payable of
$8 million
that represents a tax liability due for state income taxes. NRG has a tax receivable of
$29 million
, comprised of,
$10 million
due from the New York State Empire Zone program, and
$11 million
of refunds due from state income tax estimated payments and return filings for 2016 and 2015, respectively. The remaining balance of
$8 million
relates to federal cash grants applied for eligible solar energy projects, net of sequestration.
Uncertain tax benefits
NRG has identified uncertain tax benefits whose after-tax value is
$34 million
for which, as of December 31, 2016, and 2015, NRG has recorded a non-current tax liability of
$37 million
and
$35 million
, respectively. The Company recognizes interest and penalties related to uncertain tax benefits in income tax expense. During the year ended
December 31, 2016
, the Company recognized an expense of
$1 million
in interest. As of
December 31, 2016
and
2015
, NRG had cumulative interest and penalties related to these uncertain tax benefits of
$4 million
and
$3 million
, respectively.
Tax jurisdictions
— NRG is subject to examination by taxing authorities for income tax returns filed in the U.S. federal jurisdiction and various state and foreign jurisdictions including operations located in Australia.
The Company is no longer subject to U.S. federal income tax examinations for years prior to 2015. With few exceptions, state and local income tax examinations are no longer open for years before 2010.
The following table reconciles the total amounts of uncertain tax benefits:
|
|
As of December 31,
|
||||||
|
|
2016
|
2015
|
|||||
|
|
(In millions)
|
||||||
|
Balance as of January 1
|
$
|
32
|
|
$
|
71
|
|
|
|
Increase due to current year positions
|
8
|
|
4
|
|
|||
|
Decrease due to prior year positions
|
—
|
|
(25
|
)
|
|||
|
Decrease due to settlements and payments
|
(6
|
)
|
(18
|
)
|
|||
|
Uncertain tax benefits as of December 31
|
$
|
34
|
|
$
|
32
|
|
|
Note 20
—
Stock-Based Compensation
NRG Energy, Inc. Long-Term Incentive Plan
As of
December 31, 2016
and
2015
, a total of
22,000,000
shares of NRG common stock were authorized for issuance under the NRG LTIP, and
5,558,390
shares of NRG common stock were authorized for issuance under the NRG GenOn LTIP. The NRG LTIP and the NRG GenOn LTIP are subject to adjustments in the event of reorganization, recapitalization, stock split, reverse stock split, stock dividend, and a combination of shares, merger or similar change in NRG's structure or outstanding shares of common stock. There were
7,487,058
and
6,240,648
shares of common stock remaining available for grants under the NRG LTIP as of
December 31, 2016
and
2015
, respectively. There were
960,904
and
1,671,633
shares of common stock remaining available for grants under the NRG GenOn LTIP as of
December 31, 2016
and
2015
, respectively.
207
Non-Qualified Stock Options
NQSOs granted under the NRG LTIP and the NRG GenOn LTIP typically have
three
-year graded vesting schedules beginning on the grant date and become exercisable at the end of the requisite service period. NRG recognizes compensation costs for NQSOs over the requisite service period for the entire award. The maximum contractual term is
10
years for NRG's outstanding NQSOs.
No
NQSOs were granted in 2016, 2015 or 2014.
The following table summarizes the Company's NQSO activity and changes during the year:
|
Shares
|
Weighted Average
Exercise Price
|
Weighted Average Remaining Contractual Term
|
Aggregate Intrinsic Value
|
|||||||||
|
|
(In years)
|
(In millions)
|
||||||||||
|
Outstanding at December 31, 2015
|
2,071,913
|
|
$
|
32.27
|
|
3
|
$
|
—
|
|
|||
|
Forfeited
|
(548,994
|
)
|
52.34
|
|
||||||||
|
Outstanding at December 31, 2016
|
1,522,919
|
|
25.03
|
|
3
|
—
|
|
|||||
|
Exercisable at December 31, 2016
|
1,522,919
|
|
25.03
|
|
3
|
—
|
|
|||||
The following table summarizes the total intrinsic value of options exercised and the cash received from the exercises of options:
|
|
Year Ended December 31,
|
||||||||||
|
|
2016
|
2015
|
2014
|
||||||||
|
|
(In millions)
|
||||||||||
|
Total intrinsic value of options exercised
|
$
|
—
|
|
$
|
2
|
|
$
|
7
|
|
||
|
Cash received from options exercised
|
—
|
|
9
|
|
21
|
|
|||||
There were
no
options that exercised during the year ended December 31, 2016.
Restricted Stock Units
As of
December 31, 2016
, RSUs granted under the Company's LTIPs typically have
three
-year graded vesting schedules beginning on the grant date. Fair value of the RSUs is based on the closing price of NRG common stock on the date of grant. The following table summarizes the Company's non-vested RSU awards and changes during the year:
|
Units
|
Weighted Average Grant-Date Fair Value per Unit
|
|||||
|
Non-vested at December 31, 2015
|
2,261,996
|
|
$
|
27.59
|
|
|
|
Granted
|
1,226,957
|
|
11.54
|
|
||
|
Forfeited
|
(592,163
|
)
|
22.91
|
|
||
|
Vested
|
(916,649
|
)
|
26.07
|
|
||
|
Non-vested at December 31, 2016
|
1,980,141
|
|
19.29
|
|
||
The total fair value of RSUs vested during the years ended
December 31, 2016
,
2015
, and
2014
, was
$11 million
,
$10 million
and
$26 million
, respectively. The weighted average grant date fair value of RSUs granted during the years ended
December 31, 2016
,
2015
, and
2014
was
$11.54
,
$27.31
, and
$29.90
, respectively.
Deferred Stock Units
DSUs represent the right of a participant to be paid one share of NRG common stock at the end of a deferral period established under the terms of the award. DSUs granted under the Company's LTIPs are fully vested at the date of issuance. Fair value of the DSUs, which is based on the closing price of NRG common stock on the date of grant, is recorded as compensation expense in the period of grant.
208
The following table summarizes the Company's outstanding DSU awards and changes during the year:
|
Units
|
Weighted Average Grant-Date Fair Value per Unit
|
|||||
|
Outstanding at December 31, 2015
|
427,578
|
|
$
|
21.88
|
|
|
|
Granted
|
102,147
|
|
16.85
|
|
||
|
Converted to Common Stock
|
(76,051
|
)
|
18.37
|
|
||
|
Outstanding at December 31, 2016
|
453,674
|
|
21.54
|
|
||
The aggregate intrinsic values for DSUs outstanding as of
December 31, 2016
,
2015
, and
2014
were approximately
$6 million
,
$5 million
, and
$10 million
respectively. The aggregate intrinsic values for DSUs converted to common stock for the years ended
December 31, 2016
,
2015
, and
2014
were
$1 million
,
less than a million
, and
$1 million
, respectively. The weighted average grant date fair value of DSUs granted during the years ended
December 31, 2016
,
2015
, and
2014
was
$16.85
,
$25.14
and
$35.63
, respectively.
Market Stock Units
MSUs are restricted grants where the quantity of shares increases and decreases alongside the Company's Total Shareholder Return, or TSR. Each MSU represents the potential to receive NRG common stock after the completion of the performance period, typically three years of service from the date of grant. The number of shares of NRG common stock to be paid (if any) as of the vesting date for each MSU will depend on the TSR. The number of shares of common stock to be paid as of the vesting date for each MSU is equal to: (i) three quarters of one share of common stock if the TSR has decreased by no more than 25% over the performance period; (ii) one share of common stock, if there is no change in TSR over the performance period; and (iii) two shares of common stock if the TSR increases 100% or more over the performance period. If there is more than a 25% reduction in TSR over the performance period, no common stock will be paid. If the TSR is between 75% and 100% over the performance period, shares awarded are interpolated. The value of the common stock on the date of grant is based on the closing price of NRG common stock on the date of grant.
The following table summarizes the Company's non-vested MSU awards and changes during the year:
|
Units
|
Weighted Average Grant-Date Fair Value per Unit
|
|||||
|
Non-vested at December 31, 2015
|
1,980,157
|
|
$
|
29.54
|
|
|
|
Granted
|
806,409
|
|
14.73
|
|
||
|
Forfeited
|
(1,499,963
|
)
|
27.76
|
|
||
|
Vested
|
(4,015
|
)
|
33.81
|
|
||
|
Non-vested at December 31, 2016
|
1,282,588
|
|
21.47
|
|
||
The weighted average grant date fair value of MSUs granted during the years ended
December 31, 2016
,
2015
and
2014
, was
$14.73
,
$26.68
and
$31.90
, respectively.
The fair value of MSUs is estimated on the date of grant using a Monte Carlo simulation model and expensed over the service period, which equals the vesting period. Significant assumptions used in the fair value model with respect to the Company's MSUs are summarized below:
|
2016
|
2015
|
|||
|
Expected volatility
|
34.33
|
%
|
24.08%-25.20%
|
|
|
Expected term (in years)
|
3
|
|
1-3
|
|
|
Risk free rate
|
1.31
|
%
|
0.25%-1.07%
|
|
For the years ended
December 31, 2016
and
2015
, expected volatility is calculated based on NRG's historical stock price volatility data over the period commensurate with the expected term of the MSU, which equals the vesting period.
209
Supplemental Information
The following table summarizes NRG's total compensation expense recognized for the years presented as well as total non-vested compensation costs not yet recognized and the period over which this expense is expected to be recognized as of
December 31, 2016
for each of the types of awards issued under the LTIPs. Minimum tax withholdings of
$5 million
,
$21 million
, and
$16 million
for the years ended
December 31, 2016
,
2015
, and
2014
, respectively, are reflected as a reduction to additional paid-in capital on the Company's consolidated balance sheet and are reflected as operating activities on the Company's consolidated statement of cash flows.
|
|
|
|
|
Non-vested Compensation Cost
|
||||||||||||||
|
|
Compensation Expense
|
Unrecognized
Total Cost
|
Weighted Average Recognition Period Remaining (In years)
|
|||||||||||||||
|
|
Year Ended December 31
|
As of December 31
|
||||||||||||||||
|
Award
|
2016
|
2015
|
2014
|
2016
|
2016
|
|||||||||||||
|
|
(In millions, except weighted average data)
|
|||||||||||||||||
|
NQSOs
(a)
|
$
|
—
|
|
$
|
—
|
|
$
|
1
|
|
$
|
—
|
|
—
|
|
||||
|
RSUs
|
14
|
|
23
|
|
20
|
|
12
|
|
1.46
|
|
||||||||
|
DSUs
|
2
|
|
2
|
|
2
|
|
—
|
|
—
|
|
||||||||
|
MSUs
|
3
|
|
16
|
|
19
|
|
7
|
|
1.54
|
|
||||||||
|
PRSUs
(b)
|
5
|
|
—
|
|
—
|
|
8
|
|
1.30
|
|
||||||||
|
Total
|
$
|
24
|
|
$
|
41
|
|
$
|
42
|
|
$
|
27
|
|
|
|
||||
|
Tax detriment recognized
|
$
|
(4
|
)
|
$
|
(12
|
)
|
$
|
(8
|
)
|
|
|
|
|
|||||
(a) All NQSOs granted under the Company's LTIP were fully vested as of December 31, 2016 and 2015.
(b) Phantom Restricted Stock Units, PRSUs, are liability-classified time-based awards that typically vest ratably over a
three
-year period. The amount to be paid upon vesting is based on NRG's closing stock price for the period.
Note 21
—
Related Party Transactions
The following table summarizes NRG's material related party transactions with third party affiliates that are included in the Company's operating revenues, operating costs and other income and expense:
|
|
Year Ended December 31,
|
||||||||||
|
|
2016
|
2015
|
2014
|
||||||||
|
|
(In millions)
|
||||||||||
|
Revenues from Related Parties Included in Operating Revenues
|
|
|
|
||||||||
|
Gladstone
|
$
|
2
|
|
$
|
4
|
|
$
|
6
|
|
||
|
GenConn
|
5
|
|
4
|
|
6
|
|
|||||
|
Total
|
$
|
7
|
|
$
|
8
|
|
$
|
12
|
|
||
Gladstone
— NRG provides services to Gladstone, an equity method investment, under an operations and maintenance agreement. Fees for services under this contract primarily include recovery of NRG's costs of operating the plant as approved in the annual budget, as well as a base monthly fee.
GenConn
— NRG provides services to GenConn under operations and maintenance agreements with GenConn Devon and GenConn Middletown that began in June 2011.
Keystone and Conemaugh facilities
— The Company operates the Keystone and Conemaugh facilities under five-year agreements that initially expired in December 2015 and were renewed through December 2020 that, subject to certain provisions and notifications, could be terminated annually with one year's notice. The Company is reimbursed by the other owners for the cost of direct services provided to the Conemaugh and Keystone facilities. Additionally, the Company received fees of
$11 million
in
2016
,
$11 million
in
2015
, and
$10 million
in
2014
.
210
Note 22
—
Commitments and Contingencies
Operating Lease Commitments
Powerton and Joliet Leases
The Company leases
100%
interests in the Powerton facility and Unit 7 and Unit 8 of the Joliet facility through
2034
and
2030
, respectively, through its indirect subsidiary, Midwest Generation, LLC. The Company accounts for these leases as operating leases and records lease expense on a straight-line basis over the lease term. As further described in
Note 3
,
Business Acquisitions and Dispositions
, in connection with the acquisition of EME, the Company recorded the out-of-market value as a liability in out-of-market contracts of
$159 million
. The liability will be amortized through rent expense on a straight-line basis over the term of the lease. The Company expects to record lease expense, net of amortization of the out-of-market liability, of approximately
$14 million
per year through the term of the lease.
Future minimum lease commitments under the Powerton and Joliet operating leases for the years ending after
December 31, 2016
, are as follows:
|
Period
|
(In millions)
|
||
|
2017
|
$
|
1
|
|
|
2018
|
1
|
|
|
|
2019
|
1
|
|
|
|
2020
|
1
|
|
|
|
2021
|
3
|
|
|
|
Thereafter
|
234
|
|
|
|
Total
|
$
|
241
|
|
GenOn Mid-Atlantic Leases
The Company leases
100%
interests in the Dickerson and Morgantown coal generation units and associated property through
2029
and
2034
, respectively, through its indirect subsidiary, GenOn MidAtlantic, LLC. The Company accounts for these leases as operating leases and records lease expense on a straight-line basis over the lease term. In connection with the acquisition of GenOn, the Company recorded the out-of-market value as a liability in out-of-market contracts of
$604 million
. The liability is being amortized through rent expense on a straight-line basis over the term of the lease. The Company expects to record lease expense, net of amortization of the out-of-market liability, of approximately
$43 million
per year through the term of the lease.
Future minimum lease commitments under the GenOn Mid-Atlantic operating leases for the years ending after
December 31, 2016
are as follows:
|
Period
|
(In millions)
|
||
|
2017
|
$
|
144
|
|
|
2018
|
105
|
|
|
|
2019
|
139
|
|
|
|
2020
|
105
|
|
|
|
2021
|
42
|
|
|
|
Thereafter
|
400
|
|
|
|
Total
|
$
|
935
|
|
211
REMA Leases
The Company, through its indirect subsidiary, NRG REMA, LLC, leases a
100%
interest in the Shawville coal generation facility through
2026
and leases
16.5%
and
16.7%
interests in the Conemaugh and Keystone coal generation facilities through 2034, and expects to make payments under the leases through 2029 in accordance with the terms of the leases. The Company accounts for these leases as operating leases and records lease expense on a straight-line basis over the lease term. In connection with the acquisition of GenOn, the Company recorded the out-of-market value as a liability in out-of-market contracts of
$186 million
. The liability is being amortized through rent expense on a straight-line basis over the term of the lease. The Company expects to record lease expense, net of amortization of the out-of-market liability, of approximately
$29 million
per year through the term of the lease.
Future minimum lease commitments under the REMA operating leases for the years ending after
December 31, 2016
are as follows:
|
Period
|
(In millions)
|
||
|
2017
|
$
|
63
|
|
|
2018
|
55
|
|
|
|
2019
|
65
|
|
|
|
2020
|
56
|
|
|
|
2021
|
47
|
|
|
|
Thereafter
|
231
|
|
|
|
Total
|
$
|
517
|
|
Other Operating Leases
NRG leases certain Company facilities and equipment under operating leases, some of which include escalation clauses, expiring on various dates through 2050. NRG also has certain tolling arrangements to purchase power, which qualify as operating leases. Certain operating lease agreements include provisions such as scheduled rent increases, leasehold incentives, and rent concessions over their lease term. The Company recognizes the effects of these scheduled rent increases, leasehold incentives, and rent concessions on a straight-line basis over the lease term unless another systematic and rational allocation basis is more representative of the time pattern in which the leased property is physically employed. Lease expense under operating leases was
$102 million
,
$100 million
, and
$106 million
for the years ended
December 31, 2016
,
2015
, and
2014
, respectively.
Future minimum lease commitments under operating leases for the years ending after
December 31, 2016
are as follows:
|
Period
|
(In millions)
|
||
|
2017
|
$
|
84
|
|
|
2018
|
76
|
|
|
|
2019
|
67
|
|
|
|
2020
|
61
|
|
|
|
2021
|
52
|
|
|
|
Thereafter
|
443
|
|
|
|
Total
(a)
|
$
|
783
|
|
(a) Amounts in the table exclude future sublease income of
$14 million
associated with long-term leases for office locations.
Coal, Gas and Transportation Commitments
NRG has entered into long-term contractual arrangements to procure fuel and transportation services for the Company's generation assets and for the years ended
December 31, 2016
,
2015
, and
2014
, the Company purchased
$1.8 billion
,
$2.6 billion
, and
$3.5 billion
, respectively, under such arrangements.
As of
December 31, 2016
, the Company's commitments under such outstanding agreements are as follows:
|
Period
|
(In millions)
|
||
|
2017
|
$
|
638
|
|
|
2018
|
251
|
|
|
|
2019
|
174
|
|
|
|
2020
|
140
|
|
|
|
2021
|
109
|
|
|
|
Thereafter
|
415
|
|
|
|
Total
|
$
|
1,727
|
|
212
Purchased Power Commitments
NRG has purchased power contracts of various quantities and durations that are not classified as derivative assets and liabilities and do not qualify as operating leases. These contracts are not included in the consolidated balance sheet as of
December 31, 2016
. Minimum purchase commitment obligations are as follows as of
December 31, 2016
:
|
Period
|
(In millions)
|
||
|
2017
|
$
|
25
|
|
|
2018
|
17
|
|
|
|
2019
|
13
|
|
|
|
2020
|
11
|
|
|
|
2021
|
21
|
|
|
|
Thereafter
|
—
|
|
|
|
Total
(a)
|
$
|
87
|
|
|
(a)
|
As of
December 31, 2016
, the maximum remaining term under any individual purchased power contract is
five
years.
|
Lignite Contract with Texas Westmoreland Coal Co.
The Company's Limestone facility utilizes a blend of coal including lignite obtained from the Jewett mine, a surface mine adjacent to the Limestone facility, under a long-term contract with Texas Westmoreland Coal Co., or TWCC. The contract is a cost-plus arrangement with certain performance incentives and penalties. On August 18, 2016, NRG gave notice to TWCC terminating the active mining of lignite under the contract, effective on December 31, 2016.
Under the contract, TWCC continues to be responsible for reclamation activities. NRG is responsible for reclamation costs and has recorded an adequate ARO liability. The Railroad Commission of Texas has imposed a bond obligation of
$95.5 million
on TWCC for the reclamation of the mine. Pursuant to the contract with TWCC, NRG supports this obligation through surety bonds. Additionally, NRG is obligated to provide additional performance assurance if required by the Railroad Commission of Texas.
First Lien Structure
NRG has granted first liens to certain counterparties on a substantial portion of the Company's assets, excluding assets acquired in the GenOn and EME (including Midwest Generation) acquisitions, assets held by NRG Yield, Inc. and NRG's assets that have project-level financing, to reduce the amount of cash collateral and letters of credit that it would otherwise be required to post from time to time to support its obligations under out-of-the-money hedge agreements for forward sales of power or MWh equivalents. The Company's lien counterparties may have a claim on NRG's assets to the extent market prices exceed the hedged price. As of
December 31, 2016
, hedges under the first lien were
out-of-the-money
for NRG on a counterparty aggregate basis.
Nuclear Insurance
STP maintains required insurance coverage for liability claims arising from nuclear incidents pursuant to the Price-Anderson Act. Effective January 1, 2017, the current liability limit per incident is
$13.44 billion
, subject to change to account for the effects of inflation and the number of licensed reactors. An inflation adjustment must be made at least once every five years with the next due no later than September 10, 2018. Under the Price-Anderson Act, owners of nuclear power plants in the U.S. are required to purchase primary insurance limits of
$450 million
for each operating site. In addition, the Price-Anderson Act requires an additional layer of protection through mandatory participation in a retrospective rating plan for power reactors resulting in an additional
$13 billion
in funds available for public liability claims. The current maximum assessment per incident, per reactor, is approximately
$127 million
, taking into account a
5%
adjustment for administrative fees, payable at approximately
$19 million
per year, per reactor. NRG would be responsible for
44%
of the maximum assessment, or
$8 million
per year, per reactor, and a maximum of
$112 million
per incident. In addition, the U.S. Congress retains the ability to impose additional financial requirements on the nuclear industry to pay liability claims that exceed
$13 billion
for a single incident. The liabilities of the co-owners of STP with respect to the retrospective premium assessments for nuclear liability insurance are joint and several.
213
STP purchases insurance for property damage and site decontamination cleanup costs from Nuclear Electric Insurance Limited, or NEIL, an industry mutual insurance company, of which STP is a member. STP has purchased
$2.75 billion
in limits for nuclear events and
$1.5 billion
in limits for non-nuclear events, the maximum available from NEIL. The upper
$1.25 billion
in limits (excess of the first
$1.5 billion
in limits) is a single limit blanket policy shared with two Diablo Canyon nuclear reactors, which have no affiliation with the Company. This shared limit is not subject to automatic reinstatement in the event of a loss. The NEIL policy covers both nuclear and non-nuclear property damage events, and a NEIL companion policy provides Accidental Outage coverage for the co-owners of STP's lost revenue following a property damage event, at a weekly indemnity limit of
$2.52 million
per unit up to a maximum of
$274.4 million
nuclear and
$183.5 million
non-nuclear, and is subject to an eight-week waiting period. NRG also purchases an Accidental Outage policy from NEIL, which provides protection for lost revenue due to an insurable event. This coverage allows for reimbursement up to
$1.98 million
per week per unit up to a maximum of
$215.6 million
nuclear and
$144 million
non-nuclear, and is subject to an eight-week waiting period. Under the terms of the NEIL policies, member companies may be assessed up to
ten
times their annual premium if the NEIL Board of Directors determines their surplus has been depleted due to the payment of property losses at any of the licensed reactors in a single policy year. NEIL requires that its members maintain an investment grade credit rating or insure their annual retrospective obligation by providing a financial guarantee, letter of credit, deposit premium, or an insurance policy. NRG has purchased an insurance policy from NEIL to guarantee the Company's obligation; however this insurance will only respond to retrospective premium adjustments assessed within
twenty-four
months after the policy term, whereas NEIL's Board of Directors can make such an adjustment up to
6
years after the policy expires.
Ivanpah Energy Production Guarantee
The Company's PPAs with PG&E with respect to the Ivanpah plant contain provisions for contract quantity and guaranteed energy production, which require that Ivanpah units 1 and 3 deliver to PG&E no less than the guaranteed energy production amount specified in the PPAs in any period of twenty-four consecutive months, or performance measurement period, during the term of the PPAs. In January 2017, the Company and PG&E executed amendments to the PPAs that provide, among other things, the ability to cure any failure to meet the guaranteed energy production amounts through performance and liquidated damage provisions. On February 2, 2017, PG&E filed a request with the CPUC to approve the amendments. Pending final and nonappealable CPUC approval, PG&E agreed to refrain from declaring any event of default with respect to any failure to deliver the guaranteed energy production amounts.
Contingencies
The Company's material legal proceedings are described below. The Company believes that it has valid defenses to these legal proceedings and intends to defend them vigorously. NRG records reserves for estimated losses from contingencies when information available indicates that a loss is probable and the amount of the loss, or range of loss, can be reasonably estimated. As applicable, the Company has established an adequate reserve for the matters discussed below. In addition, legal costs are expensed as incurred. Management has assessed each of the following matters based on current information and made a judgment concerning its potential outcome, considering the nature of the claim, the amount and nature of damages sought, and the probability of success. Unless specified below, the Company is unable to predict the outcome of these legal proceedings or reasonably estimate the scope or amount of any associated costs and potential liabilities. As additional information becomes available, management adjusts its assessment and estimates of such contingencies accordingly. Because litigation is subject to inherent uncertainties and unfavorable rulings or developments, it is possible that the ultimate resolution of the Company's liabilities and contingencies could be at amounts that are different from its currently recorded reserves and that such difference could be material.
In addition to the legal proceedings noted below, NRG and its subsidiaries are party to other litigation or legal proceedings arising in the ordinary course of business. In management's opinion, the disposition of these ordinary course matters will not materially adversely affect NRG's consolidated financial position, results of operations, or cash flows.
Midwest Generation Asbestos Liabilities
— The Company, through its subsidiary, Midwest Generation, may be subject to potential asbestos liabilities as a result of its acquisition of EME. The Company is currently analyzing the scope of potential liability as it may relate to Midwest Generation. The Company believes that it has established an adequate reserve for these cases.
214
Actions Pursued by MC Asset Recovery
— With Mirant Corporation's emergence from bankruptcy protection in 2006, certain actions filed by GenOn Energy Holdings and some of its subsidiaries against third parties were transferred to MC Asset Recovery, a wholly owned subsidiary of GenOn Energy Holdings. MC Asset Recovery is governed by a manager who is independent of NRG and GenOn. MC Asset Recovery is a disregarded entity for income tax purposes. Under the remaining action transferred to MC Asset Recovery, MC Asset Recovery seeks to recover damages from Commerzbank AG and various other banks, or the Commerzbank Defendants, for alleged fraudulent transfers that occurred prior to Mirant's bankruptcy proceedings. In December 2010, the U.S. District Court for the Northern District of Texas dismissed MC Asset Recovery's complaint against the Commerzbank Defendants. In January 2011, MC Asset Recovery appealed the District Court's dismissal of its complaint against the Commerzbank Defendants to the U.S. Court of Appeals for the Fifth Circuit, or the Fifth Circuit. In March 2012, the Fifth Circuit reversed the District Court's dismissal and reinstated MC Asset Recovery's amended complaint against the Commerzbank Defendants. On December 10, 2015, the District Court granted summary judgment in favor of the Commerzbank Defendants. On December 29, 2015, MC Asset Recovery filed a notice to appeal this judgment with the Fifth Circuit. The appeal has been fully briefed by the parties and was argued before the Fifth Circuit on February 8, 2017.
Natural Gas Litigation
—
GenOn is party to several lawsuits, certain of which are class action lawsuits, in state and federal courts in Kansas, Missouri, Nevada and Wisconsin. These lawsuits were filed in the aftermath of the California energy crisis in 2000 and 2001 and the resulting FERC investigations and relate to alleged conduct to increase natural gas prices in violation of state antitrust law and similar laws. The lawsuits seek treble or punitive damages, restitution and/or expenses. The lawsuits also name as parties a number of energy companies unaffiliated with NRG. In July 2011, the U.S. District Court for the District of Nevada, which was handling four of the five cases, granted the defendants' motion for summary judgment and dismissed all claims against GenOn in those cases. The plaintiffs appealed to the U.S. Court of Appeals for the Ninth Circuit which reversed the decision of the District Court. GenOn along with the other defendants in the lawsuit filed a petition for a writ of certiorari to the U.S. Supreme Court challenging the Court of Appeals' decision and the Supreme Court granted the petition. On April 21, 2015, the Supreme Court affirmed the Ninth Circuit’s holding that plaintiffs’ state antitrust law claims are not field-preempted by the federal Natural Gas Act and the Supremacy Clause of the U.S. Constitution. The Supreme Court left open whether the claims were preempted on the basis of conflict preemption. The Supreme Court directed that the case be remanded to the U.S. District Court for the District of Nevada for further proceedings. On March 7, 2016, class plaintiffs filed their motions for class certification. Defendants filed their briefs in opposition to class plaintiffs' motions for class certification on June 24, 2016. On January 26, 2017, the court heard oral argument on several motions, including plaintiffs' motion on class certification. In May 2016, the U.S. District Court for the District of Nevada granted the defendants' motion for summary judgment in one of the Kansas cases. Subsequently in December 2016, the plaintiffs filed a notice of appeal with the Ninth Circuit. GenOn has agreed to indemnify CenterPoint against certain losses relating to these lawsuits.
In September 2012, the State of Nevada Supreme Court, which was handling the remaining case, affirmed dismissal by the Eighth Judicial District Court for Clark County, Nevada of all plaintiffs' claims against GenOn. In February 2013, the plaintiffs in the Nevada case filed a petition for a writ of certiorari to the U.S. Supreme Court. In June 2013, the Supreme Court denied the petition for a writ of certiorari, thereby ending one of the five lawsuits.
Energy Plus Holdings
—
On August 7, 2012, Energy Plus Holdings received a subpoena from the NYAG which generally sought information and business records related to Energy Plus Holdings' sales, marketing and business practices. Energy Plus Holdings provided documents and information to the NYAG. On June 22, 2015, the NYAG issued another subpoena seeking additional information. Energy Plus Holdings provided responsive documents to this second subpoena. The Company does not expect the resolution of this matter to have a material impact on the Company’s consolidated financial position, results of operation, or cash flows.
Maryland Department of the Environment v. GenOn Chalk Point and GenOn Mid-Atlantic
— On January 25, 2013, Food & Water Watch, the Patuxent Riverkeeper and the Potomac Riverkeeper (together, the Citizens Group) sent GenOn Mid-Atlantic a letter alleging that the Chalk Point, Dickerson and Morgantown generating facilities were violating the terms of the three National Pollution Discharge Elimination System permits by discharging nitrogen and phosphorous in excess of the limits in each permit. On March 21, 2013, the MDE sent GenOn Mid-Atlantic a similar letter with respect to the Chalk Point and Dickerson generating facilities, threatening to sue within 60 days if the generating facilities were not brought into compliance. On June 11, 2013, the Maryland Attorney General on behalf of the MDE filed a complaint in the U.S. District Court for the District of Maryland alleging violations of the CWA and Maryland environmental laws related to water.
In August 2016, the court approved a consent decree to settle the matter. The consent decree requires: (1) improving the wastewater treatment systems at the Chalk Point and Dickerson facilities which was completed in October 2016; (2) completing supplemental environmental projects worth
$1 million
; and (3) paying a civil penalty of
$1 million
. The Company has improved the wastewater treatment systems at the Chalk Point and Dickerson facilities and paid the civil penalty of
$1 million
.
215
Midwest Generation New Source Review Litigation
— In August 2009, the EPA and the Illinois Attorney General, or the Government Plaintiffs, filed a complaint, or the Governments’ Complaint, in the U.S. District Court for the Northern District of Illinois alleging violations of CAA PSD requirements by Midwest Generation arising from maintenance, repair or replacement projects at six Illinois coal-fired electric generating stations performed by Midwest Generation or ComEd, a prior owner of the stations, including alleged failures to obtain PSD construction permits and to comply with BACT requirements. The Government Plaintiffs also alleged violations of opacity and PM standards at the Midwest Generation plants. Finally, the Government Plaintiffs alleged that Midwest Generation violated certain operating permit requirements under Title V of the CAA allegedly arising from such claimed PSD, opacity and PM emission violations. In addition to seeking penalties of up to
$37,500
per violation, per day, the complaint seeks an injunction ordering Midwest Generation to install controls sufficient to meet BACT emission rates at the units subject to the complaint and other remedies, which could go well beyond the requirements of the CPS. Several environmental groups intervened as plaintiffs in this litigation and filed a complaint, or the Intervenors’ Complaint, which alleged opacity, PM and related Title V violations. Midwest Generation filed a motion to dismiss nine of the ten PSD counts in the Governments’ Complaint, and to dismiss the tenth PSD count to the extent the Governments’ Complaint sought civil penalties for that count. The trial court granted the motion in March 2010.
In June 2010, the Government Plaintiffs and Intervenors each filed an amended complaint. The Governments’ Amended Complaint again alleged that Midwest Generation violated PSD (based upon the same projects as alleged in their original complaint, but adding allegations that the Company was liable as the “successor” to ComEd), Title V and opacity and PM standards. It named EME and ComEd as additional defendants and alleged PSD violations (again, premised on the same projects) against them. The Intervenors’ Amended Complaint named only Midwest Generation as a defendant and alleged Title V and opacity/PM violations, as well as one of the ten PSD violations alleged in the Governments’ Amended Complaint. Midwest Generation again moved to dismiss all but one of the Government Plaintiffs’ PSD claims and the related Title V claims. Midwest Generation also filed a motion to dismiss the PSD claim in the Intervenors’ Amended Complaint and the related Title V claims. In March 2011, the trial court granted Midwest Generation’s partial motion to dismiss the Government Plaintiffs’ PSD claims. The trial court denied Midwest Generation’s motion to dismiss the PSD claim asserted in the Intervenors’ Amended Complaint, but noted that the plaintiffs would be required to convince the court that the statute of limitations should be equitably tolled. The trial court did not address other counts in the amended complaints that allege violations of opacity and PM emission limitations under the Illinois State Implementation Plan and related Title V claims. The trial court also granted the motions to dismiss the PSD claims asserted against EME and ComEd.
Following the trial court ruling, the Government Plaintiffs appealed the trial court’s dismissals of their PSD claims, including the dismissal of nine of the ten PSD claims against Midwest Generation and of the PSD claims against the other defendants. Those PSD claim dismissals were affirmed by the U.S. Court of Appeals for the Seventh Circuit in July 2013. In addition, in 2012, all but one of the environmental groups that had intervened in the case dismissed their claims without prejudice. As a result, only one environmental group remains a plaintiff intervenor in the case. The Company does not expect the resolution of this matter to have a material impact on the Company’s consolidated financial position, results of operations or cash flows.
Potomac River Environmental Investigation
— In March 2013, NRG Potomac River LLC received notice that the District of Columbia Department of Environment (now renamed the Department of Energy and Environment, or DOEE) was investigating potential discharges to the Potomac River originating from the Potomac River Generating facility site, a site where the generation facility is no longer in operation. In connection with that investigation, DOEE served a civil subpoena on NRG Potomac River LLC requesting information related to the site and potential discharges occurring from the site. NRG Potomac River LLC provided various responsive materials. In January 2016, DOEE advised NRG Potomac River LLC that DOEE believed various environmental violations had occurred as a result of discharges DOEE believes occurred to the Potomac River from the Potomac River Generating facility site and as a result of associated failures to accurately or sufficiently report such discharges. DOEE has indicated it believes that penalties are appropriate in light of the violations. NRG is currently reviewing the information provided by DOEE.
Telephone Consumer Protection Act Purported Class Actions
—
Three purported class action lawsuits have been filed against NRG Residential Solar Solutions, LLC — one in California and two in New Jersey. The plaintiffs generally allege misrepresentation by the call agents and violations of the TCPA, claiming that the defendants engaged in a telemarketing campaign placing unsolicited calls to individuals on the “Do Not Call List.” The plaintiffs seek statutory damages of up to
$1,500
per plaintiff, actual damages and equitable relief. On July 8, 2016, NRG filed a Rule 11 Motion seeking dismissal of NRG from the California case. The Rule 11 Motion was denied on August 16, 2016. Class certification hearings are scheduled on June 5, 2017 and June 19, 2017 in the New Jersey and California cases respectively.
216
California Department of Water Resources and San Diego Gas & Electric Company v. Sunrise Power Company LLC
— On January 29, 2016, CDWR and SDG&E filed a lawsuit against Sunrise Power Company, along with NRG and Chevron Power Corporation. In June 2001, CDWR and Sunrise entered into a 10-year PPA under which Sunrise would construct and operate a generating facility and provide power to CDWR. At the time the PPA was entered into, Sunrise had a transportation services agreement, or TSA, to purchase natural gas from Kern River through April 30, 2018. In August 2003, CDWR entered into an agreement with Sunrise and Kern River in which CDWR accepted assignment of the TSA through the term of the PPA. After the PPA expired, Kern River demanded that any reassignment be to a party which met certain creditworthiness standards which Sunrise did not. As such, the plaintiffs have brought this lawsuit against the defendants alleging breach of contract, breach of covenant of good faith and fair dealing and improper distributions. Plaintiffs generally claim damages of
$1.2 million
per month for the remaining
70
months of the TSA. On April 20, 2016, the defendants filed demurrers in response to the plaintiffs' complaint. The demurrers were granted on June 14, 2016; however, the plaintiffs were allowed to file amended complaints on July 1, 2016. On July 27, 2016, defendants filed demurrers to the amended complaints. On November 18, 2016, the court sustained the demurrers and allowed plaintiffs another opportunity to file a second amended lawsuit which they did on January 13, 2017.
Braun v. NRG Yield, Inc.
— On April 19, 2016, plaintiffs filed a putative class action lawsuit against NRG Yield, Inc., the current and former members of its board of directors individually, and other parties in California Superior Court in Kern County, CA. Plaintiffs allege various violations of the Securities Act due to the defendants’ alleged failure to disclose material facts related to low wind production prior to the NRG Yield, Inc.'s June 22, 2015 Class C common stock offering. Plaintiffs seek compensatory damages, rescission, attorney’s fees and costs. On August 3, 2016, the court approved a stipulation entered into by the parties. The stipulation provided that the plaintiffs would file an amended complaint by August 19, 2016, which they did on August 18, 2016. The Defendants filed demurrers and a motion challenging jurisdiction on October 18, 2016. On February 24, 2017, the court approved the parties' stipulation which provides the plaintiffs' opposition is due on June 15, 2017 and defendants' reply is due on August 14, 2017.
Ahmed v. NRG Energy, Inc. and the NRG Yield Board of Directors
— On September 15, 2016, plaintiffs filed a putative class action lawsuit against NRG Energy, Inc., the directors of NRG Yield, Inc., and other parties in the Delaware Chancery Court. The complaint alleges that the defendants breached their respective fiduciary duties with regard to the recapitalization of NRG Yield, Inc. common stock in 2015. The plaintiffs generally seek economic damages, attorney’s fees and injunctive relief. The defendants filed a motion to dismiss the lawsuit on December 21, 2016. Plaintiffs filed their objection to the motion to dismiss on February 15, 2017. Oral argument is scheduled for June 20, 2017.
GenOn Noteholders' Lawsuit
—
On December 13, 2016, certain indenture trustees for an ad hoc group of holders, or the Noteholders, of the GenOn Energy, Inc.
7.875%
Senior Notes due 2017,
9.500%
Notes due 2018, and
9.875%
Notes due 2020, and the GenOn Americas Generation, LLC
8.50%
Senior Notes due 2021 and
9.125%
Senior Notes due 2031, or collectively, the GenOn Notes, along with certain of the Noteholders, filed a complaint in the Superior Court of the State of Delaware against NRG and GenOn alleging certain claims related to a services agreement between NRG and GenOn. Plaintiffs generally seek recovery of all monies paid under the services agreement and any other damages that the court deems appropriate. On February 3, 2017, the court entered an order approving a Standstill Agreement whereby the parties agreed to suspend all deadlines in the case until March 1, 2017. This agreement may be extended by mutual agreement of the parties.
Note 23
—
Regulatory Matters
NRG operates in a highly regulated industry and is subject to regulation by various federal and state agencies. As such, NRG is affected by regulatory developments at both the federal and state levels and in the regions in which NRG operates. In addition, NRG is subject to the market rules, procedures, and protocols of the various ISO and RTO markets in which NRG participates. These power markets are subject to ongoing legislative and regulatory changes that may impact NRG's wholesale and retail businesses.
In addition to the regulatory proceedings noted below, NRG and its subsidiaries are parties to other regulatory proceedings arising in the ordinary course of business or have other regulatory exposure. In management's opinion, the disposition of these ordinary course matters will not materially adversely affect NRG's consolidated financial position, results of operations, or cash flows.
217
National
Zero-Emission Credits for Nuclear Plants
—
Pursuant to legislation in Illinois
,
the Illinois Power Agency, or IPA, is to procure contracts for ZECs. The IPA is to procure ZECs through a process that would take into account environmental benefits, including the preservation of zero emission facilities. In New York, on August 1, 2016, the NYSPSC issued its Clean Energy Standard, or CES, which provided for ZECs which would provide more than
$7.6 billion
over
12 years
in out-of-market subsidy payments to certain selected nuclear generating units in the state. Other states located in organized markets may also be considering the implementation of ZECs. These ZECs are out-of-market subsidies that threaten to artificially suppress market prices and interferer with the wholesale power market.
Current Administration and Changeover at FERC
— FERC is currently without a quorum and cannot issue orders in contested proceedings until a new Commissioner is appointed. FERC’s day-to-day work can continue through authority that has been delegated to FERC Staff. With a new administration and three vacant positions at FERC, NRG’s business may be affected because its generation fleet is subject to changes in FERC regulatory policy.
East Region
Montgomery County Station Power Tax
—
On December 20, 2013, NRG received a letter from Montgomery County, Maryland requesting payment of an energy tax for the consumption of station power at the Dickerson Facility over the previous three years. Montgomery County seeks payment in the amount of
$22 million
, which includes tax, interest and penalties. NRG disputed the applicability of the tax. On December 11, 2015, the Maryland Tax Court reversed Montgomery County's assessment. Montgomery County filed an appeal, and on February 2, 2017, the Montgomery County Circuit Court affirmed the decision of the tax court. On February 17, 2017, Montgomery County filed an appeal to the Court of Special Appeals of Maryland.
Retail
MISO SECA
— Green Mountain Energy previously provided competitive retail energy supply in the MISO region during the period of January 1, 2002, to December 31, 2005. By order dated November 18, 2004, FERC eliminated certain regional through-and-out transmission rates charged by transmission owners in MISO and PJM. In order to temporarily compensate the transmission owners for lost revenues, FERC ordered MISO, PJM and their respective transmission owners to eliminate seams charges and in the meantime, as a temporary measure, allowed them to recover transition charges known as SECA charges. The tariff amendments filed by MISO and the MISO transmission owners allocated certain SECA charges to various zones and sub-zones within MISO, including a sub-zone called the Green Mountain Energy Company Sub-zone. During several years of extensive litigation before FERC, several transmission owners sought to recover SECA charges from Green Mountain Energy. Green Mountain Energy denied responsibility for any SECA charges and did not pay any asserted SECA charges.
On May 21, 2010, FERC issued
two
orders, including its Order on Initial Decision, in which FERC determined that approximately
$22 million
plus interest of SECA charges were owed not by Green Mountain Energy but rather by BP Energy — one of Green Mountain Energy's suppliers during the period at issue. On August 19, 2010, the transmission owners and MISO made compliance filings in accordance with FERC's Orders allocating SECA charges to a BP Energy Sub-zone, and making no allocation to a Green Mountain Energy Sub-zone. On September 16, 2015, FERC issued an order conditionally accepting those compliance filings, and setting for hearing and settlement proceedings issues related to service to certain Michigan customers during 2002 and 2003.
On September 30, 2011, FERC issued orders denying all requests for rehearing and again determined that SECA charges were not owed by Green Mountain Energy. Numerous parties, including BP Energy, sought judicial review of FERC's orders, and Green Mountain Energy was granted intervenor status in the consolidated appeals. Most appellants subsequently settled with the transmission owners and withdrew their appeals, including BP Energy, which agreed to pay approximately
$24 million
to the
three
transmission owners signing the agreement, with another
$1 million
offered to the remaining PJM transmission owners, should they choose to join the settlement; all chose to do so. FERC approved the settlement, and BP Energy moved to dismiss its appeals; its motions to dismiss were granted by the Court. Subsequently, all remaining appeals either settled or were rejected by the Court.
West Region
Carlsbad Energy Center
— On May 21, 2015, the CPUC approved the Carlsbad Energy Center PPTA for a nominally rated
500
MW five unit natural gas peaking plant. On December 7, 2015, three parties filed two petitions for a writ of review with the California Court of Appeal appealing the CPUC's decision. On November 30, 2016, the California Court of Appeals issued a decision affirming the CPUC's approval of the PPTA. The period in which to seek review of that decision in the California Supreme Court has passed, and the CPUC’s decision is now final.
218
California Station Power
—
As the result of unfavorable final and non-appealable litigation, the Company has accrued a liability associated with its power plants’ consumption of station power in California, after August 30, 2010. The majority of the liability is associated with the Company's Encina, El Segundo, and Long Beach facilities. The Company has established an appropriate reserve and is awaiting final billing decisions from SCE.
Note 24
—
Environmental Matters
NRG is subject to a wide range of environmental laws in the development, construction, ownership and operation of projects. These laws generally require that governmental permits and approvals be obtained before construction and during operation of power plants. NRG is also subject to laws regarding the protection of wildlife, including migratory birds, eagles and threatened and endangered species. The electric generation industry is facing new requirements regarding GHGs, combustion byproducts, water discharge and use, and threatened and endangered species have been put in place in recent years. In general, future laws are expected to require the addition of emissions controls or other environmental controls or to impose certain restrictions on the operations of the Company's facilities, which could have a material effect on the Company's consolidated financial position, results of operations, or cash flows. Federal and state environmental laws generally have become more stringent over time, although this trend could change in the near term with respect to federal laws under the new U.S. presidential administration.
The EPA finalized CSAPR in 2011, which was intended to replace CAIR in January 2012, to address certain states' obligations to reduce emissions so that downwind states can achieve federal air quality standards. In December 2011, the D.C. Circuit stayed the implementation of CSAPR and then vacated CSAPR in August 2012 but kept CAIR in place until the EPA could replace it. In April 2014, the U.S. Supreme Court reversed and remanded the D.C. Circuit's decision. In October 2014, the D.C. Circuit lifted the stay of CSAPR. In response, the EPA in November 2014 amended the CSAPR compliance dates. Accordingly, CSAPR replaced CAIR on January 1, 2015. On July 28, 2015, the D.C. Circuit held that the EPA had exceeded its authority by requiring certain reductions that were not necessary for downwind states to achieve federal standards. Although the D.C. Circuit kept the rule in place, the court ordered the EPA to revise the Phase 2 (or 2017) (i) SO2 budgets for four states including Texas and (ii) ozone-season NOx budgets for 11 states including Maryland, New Jersey, New York, Ohio, Pennsylvania and Texas. On October 26, 2016, the EPA finalized the CSAPR Update Rule, which reduces future NOx allocations and discounts the current banked allowances to account for the more stringent 2008 Ozone NAAQS and to address the D.C. Circuit's July 2015 decision. This rule has been challenged in the D.C. Circuit. The Company believes its investment in pollution controls and cleaner technologies leave the fleet well-positioned for compliance.
In February 2012, the EPA promulgated standards (the MATS rule) to control emissions of HAPs from coal and oil-fired electric generating units. The rule established limits for mercury, non-mercury metals, certain organics and acid gases, which had to be met beginning in April 2015 (with some units getting a 1-year extension). In June 2015, the U.S. Supreme Court issued a decision in the case of Michigan v. EPA, and held that the EPA unreasonably refused to consider costs when it determined that it was "appropriate and necessary" to regulate HAPs emitted by electric generating units. The U.S. Supreme Court did not vacate the MATS rule but rather remanded it to the D.C. Circuit for further proceedings. In December 2015, the D.C. Circuit remanded the MATS rule to the EPA without vacatur. On April 25, 2016, the EPA released a supplemental finding that the benefits of this regulation outweigh the costs to address the U.S. Supreme Court's ruling that the EPA had not properly considered costs. This finding has been challenged in the D.C. Circuit. While NRG cannot predict the final outcome of this rulemaking, NRG believes that because it has already invested in pollution controls and cleaner technologies, the fleet is well-positioned to comply with the MATS rule.
Water
In August 2014, the EPA finalized the regulation regarding the use of water for once through cooling at existing facilities to address impingement and entrainment concerns. NRG anticipates that more stringent requirements will be incorporated into some of its water discharge permits over the next several years as NPDES permits are renewed.
Byproducts, Wastes, Hazardous Materials and Contamination
In April 2015, the EPA finalized the rule regulating byproducts of coal combustion (e.g., ash and gypsum) as solid wastes under the RCRA. The Company has evaluated the impact of the new rule on the Company's consolidated financial position, results of operations, or cash flows and has accrued its environmental and asset retirement obligations under the rule based on current estimates as of December 31, 2016.
219
East Region
New Source Review
—
The EPA and various states are investigating compliance of electric generating facilities with the pre-construction permitting requirements of the CAA known as “new source review,” or NSR. In 2007, Midwest Generation received an NOV from the EPA alleging that past work at Crawford, Fisk, Joliet, Powerton, Waukegan and Will County generating stations violated NSR and other regulations. These alleged violations are the subject of the litigation described in Item 15 — Note 22,
Commitments and Contingencies
.
In January 2009, GenOn received an NOV from the EPA alleging that past work at Keystone, Portland and Shawville generating stations violated regulations regarding NSR. In June 2011, GenOn received an NOV from the EPA alleging that past work at Avon Lake and Niles generating stations violated NSR. In December 2007, the NJDEP filed suit alleging that NSR violations occurred at the Portland generating station, which suit was resolved pursuant to a July 2013 consent decree. Additionally, in April 2013, the Connecticut Department of Energy and Environmental Protection issued four NOVs alleging that past work at oil-fired combustion turbines at the Torrington Terminal, Franklin, Branford and Middletown generation stations violated regulations regarding NSR.
Burton Island Old Ash Landfill
— In January 2006, NRG's Indian River Power LLC was notified that it may be a potentially responsible party with respect to Burton Island Old Ash Landfill, a historic captive landfill located at the Indian River facility. On October 1, 2007, NRG signed an agreement with DNREC to investigate the site through the Voluntary Clean-up Program, or the VCP. On February 4, 2008, DNREC issued findings that no further action was required in relation to surface water and that a previously planned shoreline stabilization project would satisfactorily address shoreline erosion. The landfill itself required a Remedial Investigation and Feasibility Study to determine the type and scope of any additional required work. DNREC approved the Feasibility Study in December 2012. In January 2013, DNREC proposed a remediation plan based on the Feasibility Study. The remediation plan was approved in October 2013. In December 2015, DNREC approved the Company's remediation design and the Company's Long Term Stewardship Plan. The cost of completing the work required by the approved remediation plan is consistent with amounts budgeted in early 2016 and on track for completion in 2017. The estimated cost to comply with the Long-Term Stewardship Plan was added to the liability in December 2016.
In addition to the VCP, on May 29, 2008, DNREC requested that NRG's Indian River Power LLC participate in the development and performance of a Natural Resource Damage Assessment at the Burton Island Old Ash Landfill. NRG is currently working with DNREC and other trustees to close out the assessment process.
For further discussion of these matters, refer to
Note 22
,
Commitments and Contingencies
.
Note 25
—
Cash Flow Information
Detail of supplemental disclosures of cash flow and non-cash investing and financing information was:
|
|
Year Ended December 31,
|
||||||||||
|
|
2016
|
2015
|
2014
|
||||||||
|
|
(In millions)
|
||||||||||
|
Interest paid, net of amount capitalized
|
$
|
1,106
|
|
$
|
1,172
|
|
$
|
1,067
|
|
||
|
Income taxes (refunded)/paid
(a)
|
27
|
|
16
|
|
(6
|
)
|
|||||
|
Consent fee paid, preferred stock
|
—
|
|
—
|
|
5
|
|
|||||
|
Non-cash investing and financing activities:
|
|||||||||||
|
(Decrease)/additions to fixed assets for accrued capital expenditures
|
(33
|
)
|
(24
|
)
|
87
|
|
|||||
|
Decrease to fixed assets for accrued grants and related tax impact
|
—
|
|
—
|
|
(711
|
)
|
|||||
|
Issuance of shares for EME acquisition
|
—
|
|
—
|
|
(401
|
)
|
|||||
(a) In
2016
, the net income taxes paid reflect
$29 million
in income taxes paid and
$2 million
in income tax refunds. In
2015
, the net income taxes refunded are net of
$17 million
income taxes paid and
$1 million
income tax refunds. In
2014
, the net income taxes refunded are net of
$15 million
income taxes paid and
$21 million
income tax refunds.
220
Note 26
—
Guarantees
NRG and its subsidiaries enter into various contracts that include indemnification and guarantee provisions as a routine part of the Company's business activities. Examples of these contracts include asset purchases and sale agreements, commodity sale and purchase agreements, retail contracts, joint venture agreements, EPC agreements, operation and maintenance agreements, service agreements, settlement agreements, and other types of contractual agreements with vendors and other third parties, as well as affiliates. These contracts generally indemnify the counterparty for tax, environmental liability, litigation and other matters, as well as breaches of representations, warranties and covenants set forth in these agreements. The Company is obligated with respect to customer deposits associated with the Company's retail businesses. NRG has also assumed guarantees for some non-qualified benefits of existing retirees resulting from the acquisition of GenOn. In some cases, NRG's maximum potential liability cannot be estimated, since the underlying agreements contain no limits on potential liability.
In accordance with ASC 460,
Guarantees
, or ASC 460, NRG has estimated that the current fair value for issuing these guarantees was
$2.2 million
as of
December 31, 2016
and the liability in this amount is included in the Company's non-current liabilities.
The following table summarizes the maximum potential exposures that can be estimated for NRG's guarantees, indemnities, and other contingent liabilities by maturity:
|
|
By Remaining Maturity at December 31,
|
||||||||||||||||||||||
|
|
2016
|
|
|||||||||||||||||||||
|
Guarantees
|
Under
1 Year
|
1-3 Years
|
3-5 Years
|
Over
5 Years
|
Total
|
2015 Total
|
|||||||||||||||||
|
|
(In millions)
|
||||||||||||||||||||||
|
Letters of credit and surety bonds
|
$
|
2,122
|
|
|
$
|
80
|
|
|
$
|
—
|
|
|
$
|
15
|
|
|
$
|
2,217
|
|
|
$
|
1,899
|
|
|
Asset sales guarantee obligations
|
—
|
|
|
420
|
|
|
—
|
|
|
257
|
|
|
677
|
|
|
257
|
|
||||||
|
Other guarantees
|
—
|
|
|
—
|
|
|
5
|
|
|
731
|
|
|
736
|
|
|
722
|
|
||||||
|
Total guarantees
|
$
|
2,122
|
|
|
$
|
500
|
|
|
$
|
5
|
|
|
$
|
1,003
|
|
|
$
|
3,630
|
|
|
$
|
2,878
|
|
Letters of credit and surety bonds
— As of
December 31, 2016
, NRG and its consolidated subsidiaries were contingently obligated for a total of
$2.2 billion
under letters of credit and surety bonds. Most of these letters of credit and surety bonds are issued in support of the Company's obligations to perform under commodity agreements and obligations associated with future closure and maintenance of ash sites, as well as for financing or other arrangements. A majority of these letters of credit and surety bonds expire within
one
year of issuance, and it is typical for the Company to renew them on similar terms.
The material indemnities, within the scope of ASC 460, are as follows:
Asset sales
— The purchase and sale agreements which govern NRG's asset or share investments and divestitures customarily contain guarantees and indemnifications of the transaction to third parties. The contracts indemnify the parties for liabilities incurred as a result of a breach of a representation or warranty by the indemnifying party, or as a result of a change in tax laws. These obligations generally have a discrete term and are intended to protect the parties against risks that are difficult to predict or estimate at the time of the transaction. In several cases, the contract limits the liability of the indemnifier. NRG has no reason to believe that the Company currently has any material liability relating to such routine indemnification obligations.
Other guarantees
— NRG has issued other guarantees of obligations including payments under certain agreements with respect to certain of its unconsolidated subsidiaries, payment or performance by fuel providers and payment or reimbursement of credit support and deposits. The Company does not believe that it will be required to perform under these guarantees.
Other indemnities
— Other indemnifications NRG has provided cover operational, tax, litigation and breaches of representations, warranties and covenants. NRG has also indemnified, on a routine basis in the ordinary course of business, consultants or other vendors who have provided services to the Company. NRG's maximum potential exposure under these indemnifications can range from a specified dollar amount to an indeterminate amount, depending on the nature of the transaction. Total maximum potential exposure under these indemnifications is not estimable due to uncertainty as to whether claims will be made or how they will be resolved. NRG does not have any reason to believe that the Company will be required to make any material payments under these indemnity provisions.
Because many of the guarantees and indemnities NRG issues to third parties and affiliates do not limit the amount or duration of its obligations to perform under them, there exists a risk that the Company may have obligations in excess of the amounts described above. For those guarantees and indemnities that do not limit the Company's liability exposure, it may not be able to estimate what the Company's liability would be, until a claim is made for payment or performance, due to the contingent nature of these contracts.
221
Note 27
—
Jointly Owned Plants
Certain NRG subsidiaries own undivided interests in jointly-owned plants, as described below. These plants are maintained and operated pursuant to their joint ownership participation and operating agreements. NRG is responsible for its subsidiaries' share of operating costs and direct expenses and includes its proportionate share of the facilities and related revenues and direct expenses in these jointly-owned plants in the corresponding balance sheet and income statement captions of the Company's consolidated financial statements.
The following table summarizes NRG's proportionate ownership interest in the Company's jointly-owned facilities:
|
As of December 31, 2016
|
Ownership
Interest
|
Property, Plant &
Equipment
|
Accumulated
Depreciation
|
Construction in
Progress
|
||||||||||
|
|
(In millions unless otherwise stated)
|
|||||||||||||
|
South Texas Project Units 1 and 2, Bay City, TX
|
44.00
|
%
|
$
|
3,275
|
|
$
|
(1,734
|
)
|
$
|
39
|
|
|||
|
Big Cajun II Unit 3, New Roads, LA
|
58.00
|
%
|
204
|
|
123
|
|
—
|
|
||||||
|
Cedar Bayou Unit 4, Baytown, TX
|
50.00
|
%
|
216
|
|
(67
|
)
|
5
|
|
||||||
|
Keystone, Shelocta, PA
|
3.70
|
%
|
97
|
|
(48
|
)
|
—
|
|
||||||
|
Conemaugh, New Florence, PA
|
3.72
|
%
|
103
|
|
(51
|
)
|
1
|
|
||||||
222
Note 28
—
Unaudited Quarterly Financial Data
Refer to
Note 3
,
Business Acquisitions and Dispositions
, and
Note 10
,
Asset Impairments
, for a description of the effect of unusual or infrequently occurring events during the quarterly periods. Summarized unaudited quarterly financial data is as follows:
|
|
Quarter Ended
|
||||||||||||||
|
|
2016
|
||||||||||||||
|
|
December 31
|
September 30
|
June 30
|
March 31
|
|||||||||||
|
|
(In millions, except per share data)
|
||||||||||||||
|
Operating revenues
|
$
|
2,532
|
|
$
|
3,952
|
|
$
|
2,638
|
|
$
|
3,229
|
|
|||
|
Operating (loss)/income
|
(791
|
)
|
755
|
|
87
|
|
476
|
|
|||||||
|
Net (loss)/income
|
(1,055
|
)
|
393
|
|
(276
|
)
|
47
|
|
|||||||
|
Less: Net loss attributable to noncontrolling interests and redeemable noncontrolling interests
|
(68
|
)
|
(9
|
)
|
(5
|
)
|
(35
|
)
|
|||||||
|
Net (loss)/income attributable to NRG Energy, Inc.
|
(987
|
)
|
402
|
|
(271
|
)
|
82
|
|
|||||||
|
(Loss)/income available to Common Stockholders
|
$
|
(987
|
)
|
$
|
402
|
|
$
|
(193
|
)
|
$
|
77
|
|
|||
|
Weighted average number of common shares outstanding — basic
|
316
|
|
316
|
|
315
|
|
315
|
|
|||||||
|
Net (loss)/income per weighted average common share — basic
|
$
|
(3.13
|
)
|
$
|
1.27
|
|
$
|
(0.61
|
)
|
$
|
0.24
|
|
|||
|
Weighted average number of common shares outstanding — diluted
|
316
|
|
317
|
|
315
|
|
315
|
|
|||||||
|
Net (loss)/income per weighted average common share — diluted
|
$
|
(3.13
|
)
|
$
|
1.27
|
|
$
|
(0.61
|
)
|
$
|
0.24
|
|
|||
|
|
Quarter Ended
|
||||||||||||||
|
|
2015
|
||||||||||||||
|
|
December 31
|
September 30
|
June 30
|
March 31
|
|||||||||||
|
|
(In millions, except per share data)
|
||||||||||||||
|
Operating revenues
|
$
|
3,011
|
|
$
|
4,434
|
|
$
|
3,400
|
|
$
|
3,829
|
|
|||
|
Operating (loss)/income
|
(4,727
|
)
|
379
|
|
232
|
|
76
|
|
|||||||
|
Net (loss)/income
|
(6,358
|
)
|
67
|
|
(9
|
)
|
(136
|
)
|
|||||||
|
Less: Net (loss)/income attributable to noncontrolling interests and redeemable noncontrolling interests
|
(44
|
)
|
1
|
|
5
|
|
(16
|
)
|
|||||||
|
Net (loss)/income attributable to NRG Energy, Inc.
|
(6,314
|
)
|
66
|
|
(14
|
)
|
(120
|
)
|
|||||||
|
(Loss)/income available to Common Stockholders
|
$
|
(6,319
|
)
|
$
|
61
|
|
$
|
(19
|
)
|
$
|
(125
|
)
|
|||
|
Weighted average number of common shares outstanding — basic
|
315
|
|
331
|
|
333
|
|
336
|
|
|||||||
|
Net (loss)/income per weighted average common share — basic
|
$
|
(20.08
|
)
|
$
|
0.18
|
|
$
|
(0.06
|
)
|
$
|
0.37
|
|
|||
|
Weighted average number of common shares outstanding — diluted
|
315
|
|
332
|
|
333
|
|
336
|
|
|||||||
|
Net (loss)/income per weighted average common share — diluted
|
$
|
(20.08
|
)
|
$
|
0.18
|
|
$
|
(0.06
|
)
|
$
|
(0.37
|
)
|
|||
223
Note 29
—
Condensed Consolidating Financial Information
As of
December 31, 2016
, the Company had outstanding
$5.4 billion
of Senior Notes due 2018 - 2027, as shown in
Note 12
,
Debt and Capital Leases
.
These Senior Notes are guaranteed by certain of NRG's current and future 100% owned domestic subsidiaries, or guarantor subsidiaries. These guarantees are both joint and several. The non-guarantor subsidiaries include all of NRG's foreign subsidiaries and certain domestic subsidiaries, including GenOn and its subsidiaries and NRG Yield, Inc. and its subsidiaries.
Unless otherwise noted below, each of the following guarantor subsidiaries fully and unconditionally guaranteed the Senior Notes as of
December 31, 2016
:
|
Ace Energy, Inc.
|
NEO Freehold-Gen LLC
|
NRG Operating Services, Inc.
|
|
Allied Warranty LLC
|
NEO Power Services Inc.
|
NRG Oswego Harbor Power Operations Inc.
|
|
Arthur Kill Power LLC
|
New Genco GP, LLC
|
NRG PacGen Inc.
|
|
Astoria Gas Turbine Power LLC
|
Norwalk Power LLC
|
NRG Portable Power LLC
|
|
Bayou Cove Peaking Power LLC
|
NRG Affiliate Services Inc.
|
NRG Power Marketing LLC
|
|
BidURenergy, Inc.
|
NRG Artesian Energy LLC
|
NRG Reliability Solutions LLC
|
|
Cabrillo Power I LLC
|
NRG Arthur Kill Operations Inc.
|
NRG Renter's Protection LLC
|
|
Cabrillo Power II LLC
|
NRG Astoria Gas Turbine Operations Inc.
|
NRG Retail LLC
|
|
Carbon Management Solutions LLC
|
NRG Bayou Cove LLC
|
NRG Retail Northeast LLC
|
|
Cirro Group, Inc.
|
NRG Business Solutions LLC
|
NRG Rockford Acquisition LLC
|
|
Cirro Energy Services, Inc.
|
NRG Cabrillo Power Operations Inc.
|
NRG Saguaro Operations Inc.
|
|
Clean Edge Energy LLC
|
NRG California Peaker Operations LLC
|
NRG Security LLC
|
|
Conemaugh Power LLC
|
NRG Cedar Bayou Development Company, LLC
|
NRG Services Corporation
|
|
Connecticut Jet Power LLC
|
NRG Connected Home LLC
|
NRG SimplySmart Solutions LLC
|
|
Cottonwood Development LLC
|
NRG Connecticut Affiliate Services Inc.
|
NRG South Central Affiliate Services Inc.
|
|
Cottonwood Energy Company LP
|
NRG Construction LLC
|
NRG South Central Generating LLC
|
|
Cottonwood Generating Partners I LLC
|
NRG Curtailment Solutions LLC
|
NRG South Central Operations Inc.
|
|
Cottonwood Generating Partners II LLC
|
NRG Development Company Inc.
|
NRG South Texas LP
|
|
Cottonwood Generating Partners III LLC
|
NRG Devon Operations Inc.
|
NRG Texas C&I Supply LLC
|
|
Cottonwood Technology Partners LP
|
NRG Dispatch Services LLC
|
NRG Texas Gregory LLC
|
|
Devon Power LLC
|
NRG Distributed Generation PR LLC
|
NRG Texas Holding Inc.
|
|
Dunkirk Power LLC
|
NRG Dunkirk Operations Inc.
|
NRG Texas LLC
|
|
Eastern Sierra Energy Company LLC
|
NRG El Segundo Operations Inc.
|
NRG Texas Power LLC
|
|
El Segundo Power, LLC
|
NRG Energy Efficiency-L LLC
|
NRG Warranty Services LLC
|
|
El Segundo Power II LLC
|
NRG Energy Efficiency-P LLC
|
NRG West Coast LLC
|
|
Energy Alternatives Wholesale, LLC
|
NRG Energy Labor Services LLC
|
NRG Western Affiliate Services Inc.
|
|
Energy Choice Solutions, LLC
|
NRG ECOKAP Holdings, LLC
|
O'Brien Cogeneration, Inc. II
|
|
NRG Curtailment Solutions, Inc.
|
NRG Energy Services Group LLC
|
ONSITE Energy, Inc.
|
|
Energy Plus Holdings LLC
|
NRG Energy Services International Inc.
|
Oswego Harbor Power LLC
|
|
Energy Plus Natural Gas LLC
|
NRG Energy Services LLC
|
RE Retail Receivables, LLC
|
|
Energy Protection Insurance Company
|
NRG Generation Holdings, Inc.
|
Reliant Energy Northeast LLC
|
|
Everything Energy LLC
|
NRG Home & Business Solutions LLC
|
Reliant Energy Power Supply, LLC
|
|
Forward Home Security, LLC
|
NRG Home Solutions LLC
|
Reliant Energy Retail Holdings, LLC
|
|
GCP Funding Company, LLC
|
NRG Home Solutions Product LLC
|
Reliant Energy Retail Services, LLC
|
|
Green Mountain Energy Company
|
NRG Homer City Services LLC
|
RERH Holdings LLC
|
|
Gregory Partners, LLC
|
NRG Huntley Operations Inc.
|
Saguaro Power LLC
|
|
Gregory Power Partners LLC
|
NRG HQ DG LLC
|
Somerset Operations Inc.
|
|
Huntley Power LLC
|
NRG Identity Protect LLC
|
Somerset Power LLC
|
|
Independence Energy Alliance LLC
|
NRG Ilion Limited Partnership
|
Texas Genco Financing Corp.
|
|
Independence Energy Group LLC
|
NRG Ilion LP LLC
|
Texas Genco GP, LLC
|
|
Independence Energy Natural Gas LLC
|
NRG International LLC
|
Texas Genco Holdings, Inc.
|
|
Indian River Operations Inc.
|
NRG Maintenance Services LLC
|
Texas Genco LP, LLC
|
|
Indian River Power LLC
|
NRG Mextrans Inc.
|
Texas Genco Operating Services, LLC
|
|
Keystone Power LLC
|
NRG MidAtlantic Affiliate Services Inc.
|
Texas Genco Services, LP
|
|
Langford Wind Power LLC
|
NRG Middletown Operations Inc.
|
US Retailers LLC
|
|
NRG Home Services LLC
|
NRG Montville Operations Inc.
|
Vienna Operations Inc.
|
|
Louisiana Generating LLC
|
NRG New Roads Holdings LLC
|
Vienna Power LLC
|
|
Meriden Gas Turbines LLC
|
NRG North Central Operations Inc.
|
WCP (Generation) Holdings LLC
|
|
Middletown Power LLC
|
NRG Northeast Affiliate Services Inc.
|
West Coast Power LLC
|
|
Montville Power LLC
|
NRG Norwalk Harbor Operations Inc.
|
|
|
NEO Corporation
|
NRG GreenCo, LLC
|
|
|
NRG Business Services LLC
|
NRG GreenCo Holdings, LLC
|
|
224
The non-guarantor subsidiaries include all of NRG's foreign subsidiaries and certain domestic subsidiaries, including GenOn and its subsidiaries. NRG conducts much of its business through and derives much of its income from its subsidiaries. Therefore, the Company's ability to make required payments with respect to its indebtedness and other obligations depends on the financial results and condition of its subsidiaries and NRG's ability to receive funds from its subsidiaries. Except for NRG Bayou Cove, LLC, which is subject to certain restrictions under the Company's Peaker financing agreements, there are no restrictions on the ability of any of the guarantor subsidiaries to transfer funds to NRG. In addition, there may be restrictions for certain non-guarantor subsidiaries.
The following condensed consolidating financial information presents the financial information of NRG Energy, Inc., the guarantor subsidiaries and the non-guarantor subsidiaries in accordance with Rule 3-10 under the Securities and Exchange Commission's Regulation S-X. The financial information may not necessarily be indicative of results of operations or financial position had the guarantor subsidiaries or non-guarantor subsidiaries operated as independent entities.
In this presentation, NRG Energy, Inc. consists of parent company operations. Guarantor subsidiaries and non-guarantor subsidiaries of NRG are reported on an equity basis. For companies acquired, the fair values of the assets and liabilities acquired have been presented on a push-down accounting basis.
In addition, the condensed parent company financial statements are provided in accordance with Rule 12-04, Schedule I of Regulation S-X, as the restricted net assets of NRG Energy, Inc.’s subsidiaries exceed 25 percent of the consolidated net assets of NRG Energy, Inc. These statements should be read in conjunction with the consolidated statements and notes thereto of NRG Energy, Inc. For a discussion of NRG Energy, Inc.'s long-term debt, see
Note 12
,
Debt and Capital Leases
to the consolidated financial statements. For a discussion of NRG Energy, Inc.'s contingencies, see
Note 22
,
Commitments and Contingencies
to the consolidated financial statements. For a discussion of NRG Energy, Inc.'s guarantees, see
Note 26
,
Guarantees
to the consolidated financial statements.
225
NRG ENERGY, INC. AND SUBSIDIARIES
CONDENSED CONSOLIDATING STATEMENTS OF OPERATIONS
For the Year Ended
December 31, 2016
|
Guarantor
Subsidiaries
|
Non-Guarantor
Subsidiaries
|
NRG Energy, Inc.
(Note Issuer)
|
Eliminations
(a)
|
Consolidated
Balance
|
|||||||||||||||
|
|
(In millions)
|
||||||||||||||||||
|
Operating Revenues
|
|
|
|
|
|
||||||||||||||
|
Total operating revenues
|
$
|
7,509
|
|
$
|
5,082
|
|
$
|
—
|
|
$
|
(240
|
)
|
$
|
12,351
|
|
||||
|
Operating Costs and Expenses
|
|
||||||||||||||||||
|
Cost of operations
|
5,402
|
|
3,355
|
|
42
|
|
(244
|
)
|
8,555
|
|
|||||||||
|
Depreciation and amortization
|
565
|
|
776
|
|
26
|
|
—
|
|
1,367
|
|
|||||||||
|
Impairment losses
|
378
|
|
540
|
|
—
|
|
—
|
|
918
|
|
|||||||||
|
Selling, general and administrative
|
415
|
|
397
|
|
289
|
|
—
|
|
1,101
|
|
|||||||||
|
Acquisition-related transaction and integration costs
|
—
|
|
1
|
|
7
|
|
—
|
|
8
|
|
|||||||||
|
Development costs
|
—
|
|
60
|
|
30
|
|
—
|
|
90
|
|
|||||||||
|
Total operating costs and expenses
|
6,760
|
|
5,129
|
|
394
|
|
(244
|
)
|
12,039
|
|
|||||||||
|
Gain/(loss) on sale of assets
|
—
|
|
294
|
|
(79
|
)
|
—
|
|
215
|
|
|||||||||
|
Operating Income/(Loss)
|
749
|
|
247
|
|
(473
|
)
|
4
|
|
527
|
|
|||||||||
|
Other Income/(Expense)
|
|
|
|
|
|
||||||||||||||
|
Equity in (losses)/earnings of consolidated subsidiaries
|
(148
|
)
|
(58
|
)
|
313
|
|
(107
|
)
|
—
|
|
|||||||||
|
Equity in earnings/(losses) of unconsolidated affiliates
|
5
|
|
37
|
|
(5
|
)
|
(10
|
)
|
27
|
|
|||||||||
|
Impairment losses on investments
|
—
|
|
(268
|
)
|
—
|
|
—
|
|
(268
|
)
|
|||||||||
|
Other income/(loss), net
|
4
|
|
46
|
|
(6
|
)
|
(2
|
)
|
42
|
|
|||||||||
|
Net loss on debt extinguishment
|
—
|
|
(4
|
)
|
(138
|
)
|
—
|
|
(142
|
)
|
|||||||||
|
Interest expense
|
(15
|
)
|
(574
|
)
|
(472
|
)
|
—
|
|
(1,061
|
)
|
|||||||||
|
Total other expense
|
(154
|
)
|
(821
|
)
|
(308
|
)
|
(119
|
)
|
(1,402
|
)
|
|||||||||
|
Income/(Loss) Before Income Taxes
|
595
|
|
(574
|
)
|
(781
|
)
|
(115
|
)
|
(875
|
)
|
|||||||||
|
Income tax expense/(benefit)
|
(1
|
)
|
18
|
|
(63
|
)
|
62
|
|
16
|
|
|||||||||
|
Net Income/(Loss)
|
596
|
|
(592
|
)
|
(718
|
)
|
(177
|
)
|
(891
|
)
|
|||||||||
|
Less: Net (loss)/income attributable to noncontrolling interests and redeemable noncontrolling interests
|
—
|
|
(103
|
)
|
56
|
|
(70
|
)
|
(117
|
)
|
|||||||||
|
Net Income/(Loss) Attributable to NRG Energy, Inc.
|
$
|
596
|
|
$
|
(489
|
)
|
$
|
(774
|
)
|
$
|
(107
|
)
|
$
|
(774
|
)
|
||||
|
(a)
|
All significant intercompany transactions have been eliminated in consolidation.
|
226
NRG ENERGY, INC. AND SUBSIDIARIES
CONDENSED CONSOLIDATING STATEMENTS OF COMPREHENSIVE INCOME/(LOSS)
For the Year Ended
December 31, 2016
|
Guarantor Subsidiaries
|
Non-Guarantor Subsidiaries
|
NRG Energy, Inc.
(Note Issuer)
|
Eliminations
(a)
|
Consolidated Balance
|
|||||||||||||||
|
(In millions)
|
|||||||||||||||||||
|
Net Income/(Loss)
|
$
|
596
|
|
$
|
(592
|
)
|
$
|
(718
|
)
|
$
|
(177
|
)
|
$
|
(891
|
)
|
||||
|
Other Comprehensive Income/(Loss), net of tax
|
|||||||||||||||||||
|
Unrealized gain on derivatives, net
|
—
|
|
32
|
|
89
|
|
(86
|
)
|
35
|
|
|||||||||
|
Foreign currency translation adjustments, net
|
(1
|
)
|
(1
|
)
|
(1
|
)
|
2
|
|
(1
|
)
|
|||||||||
|
Available-for-sale securities, net
|
—
|
|
—
|
|
1
|
|
—
|
|
1
|
|
|||||||||
|
Defined benefit plan, net
|
36
|
|
(23
|
)
|
(51
|
)
|
41
|
|
3
|
|
|||||||||
|
Other comprehensive income
|
35
|
|
8
|
|
38
|
|
(43
|
)
|
38
|
|
|||||||||
|
Comprehensive Income/(Loss)
|
631
|
|
(584
|
)
|
(680
|
)
|
(220
|
)
|
(853
|
)
|
|||||||||
|
Less: Comprehensive (loss)/income attributable to noncontrolling interests and redeemable noncontrolling interests
|
—
|
|
(103
|
)
|
56
|
|
(70
|
)
|
(117
|
)
|
|||||||||
|
Comprehensive Income/(Loss) Attributable to NRG Energy, Inc.
|
631
|
|
(481
|
)
|
(736
|
)
|
(150
|
)
|
(736
|
)
|
|||||||||
|
Dividends for preferred shares
|
—
|
|
—
|
|
5
|
|
—
|
|
5
|
|
|||||||||
|
Gain on redemption of preferred shares
|
—
|
|
—
|
|
(78
|
)
|
—
|
|
(78
|
)
|
|||||||||
|
Comprehensive Income/(Loss) Available for Common Stockholders
|
$
|
631
|
|
$
|
(481
|
)
|
$
|
(663
|
)
|
$
|
(150
|
)
|
$
|
(663
|
)
|
||||
|
(a)
|
All significant intercompany transactions have been eliminated in consolidation.
|
227
NRG ENERGY, INC. AND SUBSIDIARIES
CONDENSED CONSOLIDATING BALANCE SHEETS
December 31, 2016
|
Guarantor
Subsidiaries
|
Non-Guarantor
Subsidiaries
|
NRG Energy, Inc.
|
Eliminations
(a)
|
Consolidated Balance
|
|||||||||||||||
|
|
(In millions)
|
||||||||||||||||||
|
ASSETS
|
|||||||||||||||||||
|
Current Assets
|
|
|
|
|
|
||||||||||||||
|
Cash and cash equivalents
|
$
|
—
|
|
$
|
1,650
|
|
$
|
323
|
|
$
|
—
|
|
$
|
1,973
|
|
||||
|
Funds deposited by counterparties
|
2
|
|
—
|
|
—
|
|
—
|
|
2
|
|
|||||||||
|
Restricted cash
|
11
|
|
435
|
|
—
|
|
—
|
|
446
|
|
|||||||||
|
Accounts receivable - trade, net
|
734
|
|
429
|
|
3
|
|
—
|
|
1,166
|
|
|||||||||
|
Accounts receivable - Affiliate
|
309
|
|
(241
|
)
|
200
|
|
(262
|
)
|
6
|
|
|||||||||
|
Inventory
|
482
|
|
629
|
|
—
|
|
—
|
|
1,111
|
|
|||||||||
|
Derivative instruments
|
962
|
|
305
|
|
—
|
|
(205
|
)
|
1,062
|
|
|||||||||
|
Cash collateral posted in support of energy risk management activities
|
37
|
|
166
|
|
—
|
|
—
|
|
203
|
|
|||||||||
|
Current assets held-for-sale
|
—
|
|
9
|
|
—
|
|
—
|
|
9
|
|
|||||||||
|
Prepayments and other current assets
|
76
|
|
279
|
|
62
|
|
—
|
|
417
|
|
|||||||||
|
Total current assets
|
2,613
|
|
3,661
|
|
588
|
|
(467
|
)
|
6,395
|
|
|||||||||
|
Net Property, Plant and Equipment
|
4,216
|
|
13,472
|
|
251
|
|
(27
|
)
|
17,912
|
|
|||||||||
|
Other Assets
|
|
||||||||||||||||||
|
Investment in subsidiaries
|
837
|
|
1,973
|
|
10,128
|
|
(12,938
|
)
|
—
|
|
|||||||||
|
Equity investments in affiliates
|
(14
|
)
|
1,129
|
|
5
|
|
—
|
|
1,120
|
|
|||||||||
|
Notes receivable, less current portion
|
—
|
|
17
|
|
(76
|
)
|
76
|
|
17
|
|
|||||||||
|
Goodwill
|
359
|
|
303
|
|
—
|
|
—
|
|
662
|
|
|||||||||
|
Intangible assets, net
|
592
|
|
1,447
|
|
—
|
|
(3
|
)
|
2,036
|
|
|||||||||
|
Nuclear decommissioning trust fund
|
610
|
|
—
|
|
—
|
|
—
|
|
610
|
|
|||||||||
|
Deferred income taxes
|
3
|
|
868
|
|
(646
|
)
|
—
|
|
225
|
|
|||||||||
|
Derivative instruments
|
143
|
|
60
|
|
36
|
|
(50
|
)
|
189
|
|
|||||||||
|
Non-current assets held for sale
|
—
|
|
10
|
|
—
|
|
—
|
|
10
|
|
|||||||||
|
Other non-current assets
|
67
|
|
784
|
|
328
|
|
—
|
|
1,179
|
|
|||||||||
|
Total other assets
|
2,597
|
|
6,591
|
|
9,775
|
|
(12,915
|
)
|
6,048
|
|
|||||||||
|
Total Assets
|
$
|
9,426
|
|
$
|
23,724
|
|
$
|
10,614
|
|
$
|
(13,409
|
)
|
$
|
30,355
|
|
||||
|
LIABILITIES AND STOCKHOLDERS' EQUITY
|
|||||||||||||||||||
|
Current Liabilities
|
|
|
|
|
|
||||||||||||||
|
Current portion of long-term debt and capital leases
|
$
|
—
|
|
$
|
1,202
|
|
$
|
(58
|
)
|
$
|
76
|
|
$
|
1,220
|
|
||||
|
Accounts payable
|
499
|
|
362
|
|
34
|
|
—
|
|
895
|
|
|||||||||
|
Accounts payable - affiliate
|
655
|
|
1,834
|
|
(2,227
|
)
|
(262
|
)
|
—
|
|
|||||||||
|
Derivative instruments
|
947
|
|
342
|
|
—
|
|
(205
|
)
|
1,084
|
|
|||||||||
|
Cash collateral received in support of energy risk management activities
|
2
|
|
—
|
|
—
|
|
—
|
|
2
|
|
|||||||||
|
Accrued interest expense
|
3
|
|
94
|
|
123
|
|
—
|
|
220
|
|
|||||||||
|
Other accrued expenses
|
110
|
|
140
|
|
293
|
|
—
|
|
543
|
|
|||||||||
|
Other current liabilities
|
204
|
|
166
|
|
48
|
|
—
|
|
418
|
|
|||||||||
|
Total current liabilities
|
2,420
|
|
4,140
|
|
(1,787
|
)
|
(391
|
)
|
4,382
|
|
|||||||||
|
Other Liabilities
|
|
|
|
|
|
||||||||||||||
|
Long-term debt and capital leases
|
244
|
|
10,302
|
|
7,460
|
|
—
|
|
18,006
|
|
|||||||||
|
Nuclear decommissioning reserve
|
287
|
|
—
|
|
—
|
|
—
|
|
287
|
|
|||||||||
|
Nuclear decommissioning trust liability
|
339
|
|
—
|
|
—
|
|
—
|
|
339
|
|
|||||||||
|
Postretirement and other benefit obligations
|
114
|
|
189
|
|
250
|
|
—
|
|
553
|
|
|||||||||
|
Deferred income taxes
|
186
|
|
(1,094
|
)
|
928
|
|
—
|
|
20
|
|
|||||||||
|
Derivative instruments
|
157
|
|
187
|
|
—
|
|
(50
|
)
|
294
|
|
|||||||||
|
Out-of-market contracts
|
80
|
|
960
|
|
—
|
|
—
|
|
1,040
|
|
|||||||||
|
Non-current liabilities held-for-sale
|
—
|
|
12
|
|
—
|
|
—
|
|
12
|
|
|||||||||
|
Other non-current liabilities
|
283
|
|
573
|
|
74
|
|
—
|
|
930
|
|
|||||||||
|
Total non-current liabilities
|
1,690
|
|
11,129
|
|
8,712
|
|
(50
|
)
|
21,481
|
|
|||||||||
|
Total Liabilities
|
4,110
|
|
15,269
|
|
6,925
|
|
(441
|
)
|
25,863
|
|
|||||||||
|
2.822% Preferred Stock
|
—
|
|
—
|
|
—
|
|
—
|
|
—
|
|
|||||||||
|
Redeemable noncontrolling interest in subsidiaries
|
—
|
|
46
|
|
—
|
|
—
|
|
46
|
|
|||||||||
|
Stockholders' Equity
|
5,316
|
|
8,409
|
|
3,689
|
|
(12,968
|
)
|
4,446
|
|
|||||||||
|
Total Liabilities and Stockholders' Equity
|
$
|
9,426
|
|
$
|
23,724
|
|
$
|
10,614
|
|
$
|
(13,409
|
)
|
$
|
30,355
|
|
||||
|
(a)
|
All significant intercompany transactions have been eliminated in consolidation.
|
228
NRG ENERGY, INC. AND SUBSIDIARIES
CONDENSED CONSOLIDATING STATEMENTS OF CASH FLOWS
For the Year Ended
December 31, 2016
|
Guarantor
Subsidiaries
|
Non-Guarantor
Subsidiaries
|
NRG Energy, Inc. (Note Issuer)
|
Eliminations
(a)
|
Consolidated
Balance
|
|||||||||||||||
|
|
(In millions)
|
||||||||||||||||||
|
Cash Flows from Operating Activities
|
|
|
|
||||||||||||||||
|
Net income/(loss)
|
$
|
596
|
|
$
|
(592
|
)
|
$
|
(718
|
)
|
$
|
(177
|
)
|
$
|
(891
|
)
|
||||
|
Adjustments to reconcile net income/(loss) to net cash provided by operating activities:
|
|
|
|||||||||||||||||
|
Distributions from unconsolidated affiliates
|
—
|
|
89
|
|
—
|
|
(8
|
)
|
81
|
|
|||||||||
|
Equity in earnings of unconsolidated affiliates
|
(5
|
)
|
(37
|
)
|
5
|
|
10
|
|
(27
|
)
|
|||||||||
|
Depreciation and amortization
|
565
|
|
776
|
|
26
|
|
—
|
|
1,367
|
|
|||||||||
|
Provision for bad debts
|
41
|
|
7
|
|
—
|
|
—
|
|
48
|
|
|||||||||
|
Amortization of nuclear fuel
|
49
|
|
—
|
|
—
|
|
—
|
|
49
|
|
|||||||||
|
Amortization of financing costs and debt discount/premiums
|
—
|
|
(18
|
)
|
21
|
|
—
|
|
3
|
|
|||||||||
|
Adjustment to loss on debt extinguishment
|
—
|
|
4
|
|
17
|
|
—
|
|
21
|
|
|||||||||
|
Amortization of intangibles and out-of-market contracts
|
39
|
|
52
|
|
—
|
|
—
|
|
91
|
|
|||||||||
|
Amortization of unearned equity compensation
|
—
|
|
—
|
|
10
|
|
—
|
|
10
|
|
|||||||||
|
Gain on sale of assets and equity method investments, net
|
—
|
|
(294
|
)
|
70
|
|
—
|
|
(224
|
)
|
|||||||||
|
Impairment losses
|
378
|
|
808
|
|
—
|
|
—
|
|
1,186
|
|
|||||||||
|
Changes in derivative instruments
|
(77
|
)
|
136
|
|
(36
|
)
|
—
|
|
23
|
|
|||||||||
|
Changes in deferred income taxes and liability for uncertain tax benefits
|
(1
|
)
|
18
|
|
(60
|
)
|
—
|
|
(43
|
)
|
|||||||||
|
Changes in collateral deposits supporting energy risk management activities
|
437
|
|
(72
|
)
|
—
|
|
—
|
|
365
|
|
|||||||||
|
Proceeds from sale of emission allowances
|
47
|
|
—
|
|
—
|
|
—
|
|
47
|
|
|||||||||
|
Changes in nuclear decommissioning trust liability
|
41
|
|
—
|
|
—
|
|
—
|
|
41
|
|
|||||||||
|
Cash (used)/provided by changes in other working capital
|
(1,806
|
)
|
364
|
|
1,192
|
|
175
|
|
(75
|
)
|
|||||||||
|
Net Cash Provided by Operating Activities
|
304
|
|
|
1,241
|
|
527
|
|
—
|
|
2,072
|
|
||||||||
|
Cash Flows from Investing Activities
|
|
||||||||||||||||||
|
Dividends from NRG Yield, Inc.
|
—
|
|
—
|
|
81
|
|
(81
|
)
|
—
|
|
|||||||||
|
Acquisition of September 2016 Drop Down Assets, net of cash acquired
|
—
|
|
(77
|
)
|
—
|
|
77
|
|
—
|
|
|||||||||
|
Intercompany dividends
|
—
|
|
—
|
|
12
|
|
(12
|
)
|
—
|
|
|||||||||
|
Acquisition of businesses, net of cash acquired
|
—
|
|
(209
|
)
|
—
|
|
—
|
|
(209
|
)
|
|||||||||
|
Capital expenditures
|
(180
|
)
|
(1,016
|
)
|
(48
|
)
|
—
|
|
(1,244
|
)
|
|||||||||
|
Increase in restricted cash, net
|
(4
|
)
|
(25
|
)
|
—
|
|
—
|
|
(29
|
)
|
|||||||||
|
Increase in restricted cash - U.S. DOE projects
|
—
|
|
(3
|
)
|
—
|
|
—
|
|
(3
|
)
|
|||||||||
|
Decrease in notes receivable
|
—
|
|
17
|
|
—
|
|
—
|
|
17
|
|
|||||||||
|
Proceeds from renewable energy grants
|
—
|
|
36
|
|
—
|
|
—
|
|
36
|
|
|||||||||
|
Purchases of emission allowances, net of proceeds
|
(1
|
)
|
—
|
|
—
|
|
—
|
|
(1
|
)
|
|||||||||
|
Investments in nuclear decommissioning trust securities
|
(551
|
)
|
—
|
|
—
|
|
—
|
|
(551
|
)
|
|||||||||
|
Proceeds from sales of nuclear decommissioning trust fund securities
|
510
|
|
—
|
|
—
|
|
—
|
|
510
|
|
|||||||||
|
Proceeds from sale of assets, net
|
—
|
|
619
|
|
17
|
|
—
|
|
636
|
|
|||||||||
|
Investments in unconsolidated affiliates
|
3
|
|
(37
|
)
|
—
|
|
—
|
|
(34
|
)
|
|||||||||
|
Other
|
27
|
|
13
|
|
8
|
|
—
|
|
48
|
|
|||||||||
|
Net Cash (Used)/Provided by Investing Activities
|
(196
|
)
|
(682
|
)
|
70
|
|
(16
|
)
|
(824
|
)
|
|||||||||
|
Cash Flows from Financing Activities
|
|
|
|
|
|
||||||||||||||
|
Dividends from NRG Yield, Inc.
|
—
|
|
(81
|
)
|
—
|
|
81
|
|
—
|
|
|||||||||
|
Payments (for)/from intercompany loans
|
(52
|
)
|
(49
|
)
|
101
|
|
—
|
|
—
|
|
|||||||||
|
Acquisition of September 2016 Drop Down Assets, net of cash acquired
|
—
|
|
—
|
|
77
|
|
(77
|
)
|
—
|
|
|||||||||
|
Intercompany dividends
|
(52
|
)
|
40
|
|
—
|
|
12
|
|
—
|
|
|||||||||
|
Payment of dividends to preferred and common stockholders
|
—
|
|
—
|
|
(76
|
)
|
—
|
|
(76
|
)
|
|||||||||
|
Net receipts from settlement of acquired derivatives that include financing elements
|
—
|
|
151
|
|
—
|
|
—
|
|
151
|
|
|||||||||
|
Payments for preferred shares
|
—
|
|
—
|
|
(226
|
)
|
—
|
|
(226
|
)
|
|||||||||
|
Distributions from, net of contributions to noncontrolling interests in subsidiaries
|
—
|
|
(156
|
)
|
—
|
|
—
|
|
(156
|
)
|
|||||||||
|
Proceeds from issuance of common stock
|
—
|
|
—
|
|
1
|
|
—
|
|
1
|
|
|||||||||
|
Proceeds from issuance of long-term debt
|
—
|
|
1,387
|
|
4,140
|
|
—
|
|
5,527
|
|
|||||||||
|
Payments for short and long-term debt
|
(1
|
)
|
(988
|
)
|
(4,924
|
)
|
—
|
|
(5,913
|
)
|
|||||||||
|
Payment of debt issuance costs and hedging costs
|
—
|
|
(29
|
)
|
(60
|
)
|
—
|
|
(89
|
)
|
|||||||||
|
Other
|
(3
|
)
|
(10
|
)
|
—
|
|
—
|
|
(13
|
)
|
|||||||||
|
Net Cash (Used)/Provided by Financing Activities
|
(108
|
)
|
265
|
|
(967
|
)
|
16
|
|
(794
|
)
|
|||||||||
|
Effect of exchange rate changes on cash and cash equivalents
|
—
|
|
1
|
|
—
|
|
—
|
|
1
|
|
|||||||||
|
Net Increase/(Decrease) in Cash and Cash Equivalents
|
—
|
|
825
|
|
(370
|
)
|
—
|
|
455
|
|
|||||||||
|
Cash and Cash Equivalents at Beginning of Period
|
—
|
|
825
|
|
693
|
|
—
|
|
1,518
|
|
|||||||||
|
Cash and Cash Equivalents at End of Period
|
$
|
—
|
|
$
|
1,650
|
|
$
|
323
|
|
$
|
—
|
|
$
|
1,973
|
|
||||
|
(a)
|
All significant intercompany transactions have been eliminated in consolidation.
|
229
NRG ENERGY, INC. AND SUBSIDIARIES
CONDENSED CONSOLIDATING STATEMENTS OF OPERATIONS
For the Year Ended
December 31, 2015
|
Guarantor
Subsidiaries
|
Non-Guarantor
Subsidiaries
|
NRG Energy, Inc.
(Note Issuer)
|
Eliminations
(a)
|
Consolidated
Balance
|
|||||||||||||||
|
|
(In millions)
|
||||||||||||||||||
|
Operating Revenues
|
|
|
|
|
|
||||||||||||||
|
Total operating revenues
|
$
|
10,024
|
|
$
|
4,768
|
|
$
|
—
|
|
$
|
(118
|
)
|
$
|
14,674
|
|
||||
|
Operating Costs and Expenses
|
|
||||||||||||||||||
|
Cost of operations
|
7,712
|
|
3,176
|
|
14
|
|
(118
|
)
|
10,784
|
|
|||||||||
|
Depreciation and amortization
|
787
|
|
759
|
|
20
|
|
—
|
|
1,566
|
|
|||||||||
|
Impairment losses
|
4,655
|
|
375
|
|
—
|
|
—
|
|
5,030
|
|
|||||||||
|
Selling, general and administrative
|
467
|
|
382
|
|
350
|
|
—
|
|
1,199
|
|
|||||||||
|
Acquisition-related transactions and integration costs
|
1
|
|
(5
|
)
|
14
|
|
—
|
|
10
|
|
|||||||||
|
Development costs
|
—
|
|
53
|
|
93
|
|
—
|
|
146
|
|
|||||||||
|
Total operating costs and expenses
|
13,622
|
|
4,740
|
|
491
|
|
(118
|
)
|
18,735
|
|
|||||||||
|
Gain on postretirement benefits curtailment
|
—
|
|
21
|
|
—
|
|
—
|
|
21
|
|
|||||||||
|
Operating (Loss)/Income
|
(3,598
|
)
|
49
|
|
(491
|
)
|
—
|
|
(4,040
|
)
|
|||||||||
|
Other Income/(Expense)
|
|
|
|
|
|
||||||||||||||
|
Equity in losses of consolidated subsidiaries
|
(86
|
)
|
(29
|
)
|
(2,799
|
)
|
2,914
|
|
—
|
|
|||||||||
|
Equity in earnings of unconsolidated affiliates
|
8
|
|
37
|
|
—
|
|
(9
|
)
|
36
|
|
|||||||||
|
Impairment losses on investments
|
—
|
|
(25
|
)
|
(31
|
)
|
—
|
|
(56
|
)
|
|||||||||
|
Other income, net
|
4
|
|
29
|
|
—
|
|
—
|
|
33
|
|
|||||||||
|
Loss on sale of equity method investment
|
—
|
|
—
|
|
(14
|
)
|
—
|
|
(14
|
)
|
|||||||||
|
Net gain on debt extinguishment
|
—
|
|
56
|
|
19
|
|
—
|
|
75
|
|
|||||||||
|
Interest expense
|
(18
|
)
|
(564
|
)
|
(546
|
)
|
—
|
|
(1,128
|
)
|
|||||||||
|
Total other expense
|
(92
|
)
|
(496
|
)
|
(3,371
|
)
|
2,905
|
|
(1,054
|
)
|
|||||||||
|
Loss Before Income Taxes
|
(3,690
|
)
|
(447
|
)
|
(3,862
|
)
|
2,905
|
|
(5,094
|
)
|
|||||||||
|
Income tax (benefit)/expense
|
(1,104
|
)
|
(96
|
)
|
2,489
|
|
53
|
|
1,342
|
|
|||||||||
|
Net Loss
|
(2,586
|
)
|
(351
|
)
|
(6,351
|
)
|
2,852
|
|
(6,436
|
)
|
|||||||||
|
Less: Net (loss)/income attributable to noncontrolling interests and redeemable noncontrolling interests
|
—
|
|
(23
|
)
|
31
|
|
(62
|
)
|
(54
|
)
|
|||||||||
|
Net Loss Attributable to NRG Energy, Inc.
|
$
|
(2,586
|
)
|
$
|
(328
|
)
|
$
|
(6,382
|
)
|
$
|
2,914
|
|
$
|
(6,382
|
)
|
||||
|
(a)
|
All significant intercompany transactions have been eliminated in consolidation.
|
230
NRG ENERGY, INC. AND SUBSIDIARIES
CONDENSED CONSOLIDATING STATEMENTS OF COMPREHENSIVE INCOME/(LOSS)
For the Year Ended
December 31, 2015
|
Guarantor Subsidiaries
|
Non-Guarantor Subsidiaries
|
NRG Energy, Inc.
(Note Issuer)
|
Eliminations
(a)
|
Consolidated Balance
|
|||||||||||||||
|
(In millions)
|
|||||||||||||||||||
|
Net Loss
|
$
|
(2,586
|
)
|
$
|
(351
|
)
|
$
|
(6,351
|
)
|
$
|
2,852
|
|
$
|
(6,436
|
)
|
||||
|
Other Comprehensive (Loss)/Income, net of tax
|
|||||||||||||||||||
|
Unrealized (loss)/gain on derivatives, net
|
(9
|
)
|
(13
|
)
|
48
|
|
(41
|
)
|
(15
|
)
|
|||||||||
|
Foreign currency translation adjustments, net
|
—
|
|
(7
|
)
|
(4
|
)
|
—
|
|
(11
|
)
|
|||||||||
|
Available-for-sale securities, net
|
—
|
|
(1
|
)
|
18
|
|
—
|
|
17
|
|
|||||||||
|
Defined benefit plan, net
|
(22
|
)
|
(15
|
)
|
(42
|
)
|
89
|
|
10
|
|
|||||||||
|
Other comprehensive (loss)/income
|
(31
|
)
|
(36
|
)
|
20
|
|
48
|
|
1
|
|
|||||||||
|
Comprehensive Loss
|
(2,617
|
)
|
(387
|
)
|
(6,331
|
)
|
2,900
|
|
(6,435
|
)
|
|||||||||
|
Less: Comprehensive (loss)/income attributable to noncontrolling interests and redeemable noncontrolling interests
|
—
|
|
(42
|
)
|
31
|
|
(62
|
)
|
(73
|
)
|
|||||||||
|
Comprehensive Loss Attributable to NRG Energy, Inc.
|
(2,617
|
)
|
(345
|
)
|
(6,362
|
)
|
2,962
|
|
(6,362
|
)
|
|||||||||
|
Dividends for preferred shares
|
—
|
|
—
|
|
20
|
|
—
|
|
20
|
|
|||||||||
|
Comprehensive Loss Available for Common Stockholders
|
$
|
(2,617
|
)
|
$
|
(345
|
)
|
$
|
(6,382
|
)
|
$
|
2,962
|
|
$
|
(6,382
|
)
|
||||
|
(a)
|
All significant intercompany transactions have been eliminated in consolidation.
|
231
NRG ENERGY, INC. AND SUBSIDIARIES
CONDENSED CONSOLIDATING BALANCE SHEETS
December 31, 2015
|
Guarantor
Subsidiaries
|
Non-Guarantor
Subsidiaries
|
NRG Energy, Inc.
|
Eliminations
(a)
|
Consolidated
Balance
|
|||||||||||||||
|
|
(In millions)
|
||||||||||||||||||
|
ASSETS
|
|||||||||||||||||||
|
Current Assets
|
|
|
|
|
|
||||||||||||||
|
Cash and cash equivalents
|
$
|
—
|
|
$
|
825
|
|
$
|
693
|
|
$
|
—
|
|
$
|
1,518
|
|
||||
|
Funds deposited by counterparties
|
55
|
|
51
|
|
—
|
|
—
|
|
106
|
|
|||||||||
|
Restricted cash
|
5
|
|
409
|
|
—
|
|
—
|
|
414
|
|
|||||||||
|
Accounts receivable - trade, net
|
851
|
|
304
|
|
2
|
|
—
|
|
1,157
|
|
|||||||||
|
Inventory
|
570
|
|
682
|
|
—
|
|
—
|
|
1,252
|
|
|||||||||
|
Derivative instruments
|
1,202
|
|
871
|
|
—
|
|
(158
|
)
|
1,915
|
|
|||||||||
|
Cash collateral posted in support of energy risk management activities
|
474
|
|
94
|
|
—
|
|
—
|
|
568
|
|
|||||||||
|
Accounts receivable - affiliate
|
395
|
|
260
|
|
571
|
|
(1,222
|
)
|
4
|
|
|||||||||
|
Current assets held-for-sale
|
—
|
|
6
|
|
—
|
|
—
|
|
6
|
|
|||||||||
|
Prepayments and other current assets
|
93
|
|
287
|
|
71
|
|
—
|
|
451
|
|
|||||||||
|
Total current assets
|
3,645
|
|
3,789
|
|
1,337
|
|
(1,380
|
)
|
7,391
|
|
|||||||||
|
Net Property, Plant and Equipment
|
4,767
|
|
13,773
|
|
219
|
|
(27
|
)
|
18,732
|
|
|||||||||
|
Other Assets
|
|
|
|
|
|
||||||||||||||
|
Investment in subsidiaries
|
842
|
|
2,244
|
|
11,039
|
|
(14,125
|
)
|
—
|
|
|||||||||
|
Equity investments in affiliates
|
(14
|
)
|
1,160
|
|
1
|
|
(102
|
)
|
1,045
|
|
|||||||||
|
Notes receivable, less current portion
|
—
|
|
46
|
|
7
|
|
—
|
|
53
|
|
|||||||||
|
Goodwill
|
697
|
|
302
|
|
—
|
|
—
|
|
999
|
|
|||||||||
|
Intangible assets, net
|
763
|
|
1,551
|
|
2
|
|
(6
|
)
|
2,310
|
|
|||||||||
|
Nuclear decommissioning trust fund
|
561
|
|
—
|
|
—
|
|
—
|
|
561
|
|
|||||||||
|
Derivative instruments
|
153
|
|
184
|
|
—
|
|
(32
|
)
|
305
|
|
|||||||||
|
Deferred income taxes
|
(6
|
)
|
815
|
|
(642
|
)
|
—
|
|
167
|
|
|||||||||
|
Non-current assets held for sale
|
—
|
|
105
|
|
—
|
|
—
|
|
105
|
|
|||||||||
|
Other non-current assets
|
80
|
|
749
|
|
385
|
|
—
|
|
1,214
|
|
|||||||||
|
Total other assets
|
3,076
|
|
7,156
|
|
10,792
|
|
(14,265
|
)
|
6,759
|
|
|||||||||
|
Total Assets
|
$
|
11,488
|
|
$
|
24,718
|
|
$
|
12,348
|
|
$
|
(15,672
|
)
|
$
|
32,882
|
|
||||
|
LIABILITIES AND STOCKHOLDERS' EQUITY
|
|||||||||||||||||||
|
Current Liabilities
|
|
|
|
|
|
||||||||||||||
|
Current portion of long-term debt and capital leases
|
$
|
2
|
|
$
|
460
|
|
$
|
19
|
|
$
|
—
|
|
$
|
481
|
|
||||
|
Accounts payable
|
553
|
|
277
|
|
39
|
|
—
|
|
869
|
|
|||||||||
|
Accounts payable - affiliate
|
151
|
|
2,000
|
|
(929
|
)
|
(1,222
|
)
|
—
|
|
|||||||||
|
Derivative instruments
|
1,130
|
|
749
|
|
—
|
|
(158
|
)
|
1,721
|
|
|||||||||
|
Cash collateral received in support of energy risk management activities
|
55
|
|
51
|
|
—
|
|
—
|
|
106
|
|
|||||||||
|
Accrued interest expense
|
5
|
|
91
|
|
147
|
|
(1
|
)
|
242
|
|
|||||||||
|
Other accrued expenses
|
122
|
|
151
|
|
295
|
|
—
|
|
568
|
|
|||||||||
|
Current liabilities held-for-sale
|
—
|
|
2
|
|
—
|
|
—
|
|
2
|
|
|||||||||
|
Other current liabilities
|
192
|
|
187
|
|
7
|
|
—
|
|
386
|
|
|||||||||
|
Total current liabilities
|
2,210
|
|
3,968
|
|
(422
|
)
|
(1,381
|
)
|
4,375
|
|
|||||||||
|
Other Liabilities
|
|
|
|
|
|
||||||||||||||
|
Long-term debt and capital leases
|
302
|
|
10,496
|
|
8,185
|
|
—
|
|
18,983
|
|
|||||||||
|
Nuclear decommissioning reserve
|
326
|
|
—
|
|
—
|
|
—
|
|
326
|
|
|||||||||
|
Nuclear decommissioning trust liability
|
283
|
|
—
|
|
—
|
|
—
|
|
283
|
|
|||||||||
|
Postretirement and other benefit obligations
|
236
|
|
200
|
|
152
|
|
—
|
|
588
|
|
|||||||||
|
Deferred income taxes
|
179
|
|
(1,088
|
)
|
928
|
|
—
|
|
19
|
|
|||||||||
|
Derivative instruments
|
301
|
|
224
|
|
—
|
|
(32
|
)
|
493
|
|
|||||||||
|
Out-of-market contracts
|
95
|
|
1,051
|
|
—
|
|
—
|
|
1,146
|
|
|||||||||
|
Non-current liabilities held-for-sale
|
—
|
|
4
|
|
—
|
|
—
|
|
4
|
|
|||||||||
|
Other non-current liabilities
|
318
|
|
535
|
|
47
|
|
—
|
|
900
|
|
|||||||||
|
Total non-current liabilities
|
2,040
|
|
11,422
|
|
9,312
|
|
(32
|
)
|
22,742
|
|
|||||||||
|
Total Liabilities
|
4,250
|
|
15,390
|
|
8,890
|
|
(1,413
|
)
|
27,117
|
|
|||||||||
|
2.822% Preferred Stock
|
—
|
|
—
|
|
302
|
|
—
|
|
302
|
|
|||||||||
|
Redeemable noncontrolling interest in subsidiaries
|
—
|
|
29
|
|
—
|
|
—
|
|
29
|
|
|||||||||
|
Stockholders' Equity
|
7,238
|
|
9,299
|
|
3,156
|
|
(14,259
|
)
|
5,434
|
|
|||||||||
|
Total Liabilities and Stockholders' Equity
|
$
|
11,488
|
|
$
|
24,718
|
|
$
|
12,348
|
|
$
|
(15,672
|
)
|
$
|
32,882
|
|
||||
|
(a)
|
All significant intercompany transactions have been eliminated in consolidation.
|
232
NRG ENERGY, INC. AND SUBSIDIARIES
CONDENSED CONSOLIDATING STATEMENTS OF CASH FLOWS
For the Year Ended
December 31, 2015
|
Guarantor
Subsidiaries
|
Non-Guarantor
Subsidiaries
|
NRG Energy, Inc.
|
Eliminations
(a)
|
Consolidated
Balance
|
|||||||||||||||
|
|
(In millions)
|
||||||||||||||||||
|
Cash Flows from Operating Activities
|
|
|
|
|
|
||||||||||||||
|
Net loss
|
$
|
(2,586
|
)
|
$
|
(351
|
)
|
$
|
(6,351
|
)
|
$
|
2,852
|
|
$
|
(6,436
|
)
|
||||
|
Adjustments to reconcile net loss to net cash provided by operating activities:
|
|||||||||||||||||||
|
Distributions from unconsolidated affiliates
|
3
|
|
91
|
|
—
|
|
(21
|
)
|
73
|
|
|||||||||
|
Equity in earnings of unconsolidated affiliates
|
(8
|
)
|
(37
|
)
|
—
|
|
9
|
|
(36
|
)
|
|||||||||
|
Depreciation and amortization
|
787
|
|
759
|
|
20
|
|
—
|
|
1,566
|
|
|||||||||
|
Provision for bad debts
|
58
|
|
3
|
|
3
|
|
—
|
|
64
|
|
|||||||||
|
Amortization of nuclear fuel
|
45
|
|
—
|
|
—
|
|
—
|
|
45
|
|
|||||||||
|
Amortization of financing costs and debt discount/premiums
|
—
|
|
(37
|
)
|
26
|
|
—
|
|
(11
|
)
|
|||||||||
|
Adjustment to gain on debt extinguishment
|
—
|
|
(56
|
)
|
(19
|
)
|
—
|
|
(75
|
)
|
|||||||||
|
Amortization of intangibles and out-of-market contracts
|
52
|
|
29
|
|
—
|
|
—
|
|
81
|
|
|||||||||
|
Amortization of unearned equity compensation
|
—
|
|
—
|
|
41
|
|
—
|
|
41
|
|
|||||||||
|
Gain on postretirement benefits curtailment
|
—
|
|
(21
|
)
|
—
|
|
—
|
|
(21
|
)
|
|||||||||
|
Loss on sale of assets
|
—
|
|
—
|
|
14
|
|
—
|
|
14
|
|
|||||||||
|
Impairment losses
|
4,655
|
|
400
|
|
31
|
|
—
|
|
5,086
|
|
|||||||||
|
Changes in derivative instruments
|
264
|
|
(31
|
)
|
—
|
|
—
|
|
233
|
|
|||||||||
|
Changes in deferred income taxes and liability for uncertain tax benefits
|
(1,092
|
)
|
(237
|
)
|
2,655
|
|
—
|
|
1,326
|
|
|||||||||
|
Changes in nuclear decommissioning trust liability
|
(2
|
)
|
—
|
|
—
|
|
—
|
|
(2
|
)
|
|||||||||
|
Changes in collateral deposits supporting energy risk management activities
|
(360
|
)
|
(21
|
)
|
—
|
|
—
|
|
(381
|
)
|
|||||||||
|
Cash (used)/provided by changes in other working capital
|
(8,744
|
)
|
(847
|
)
|
12,173
|
|
(2,840
|
)
|
(258
|
)
|
|||||||||
|
Net Cash (Used)/Provided by Operating Activities
|
(6,928
|
)
|
(356
|
)
|
8,593
|
|
—
|
|
1,309
|
|
|||||||||
|
Cash Flows from Investing Activities
|
|
||||||||||||||||||
|
Dividends from NRG Yield, Inc.
|
—
|
|
—
|
|
70
|
|
(70
|
)
|
—
|
|
|||||||||
|
Intercompany dividends
|
—
|
|
—
|
|
33
|
|
(33
|
)
|
—
|
|
|||||||||
|
Acquisition of 2015 Drop Down Assets, net of cash acquired
|
—
|
|
(698
|
)
|
—
|
|
698
|
|
—
|
|
|||||||||
|
Acquisition of businesses, net of cash acquired
|
—
|
|
(31
|
)
|
—
|
|
—
|
|
(31
|
)
|
|||||||||
|
Capital expenditures
|
(316
|
)
|
(908
|
)
|
(59
|
)
|
—
|
|
(1,283
|
)
|
|||||||||
|
(Increase)/decrease in restricted cash, net
|
(1
|
)
|
9
|
|
—
|
|
—
|
|
8
|
|
|||||||||
|
Decrease in restricted cash - U.S. DOE projects
|
—
|
|
34
|
|
1
|
|
—
|
|
35
|
|
|||||||||
|
Decrease in notes receivable
|
—
|
|
18
|
|
—
|
|
—
|
|
18
|
|
|||||||||
|
Proceeds from renewable energy grants
|
—
|
|
82
|
|
—
|
|
—
|
|
82
|
|
|||||||||
|
Purchases of emission allowances, net of proceeds
|
41
|
|
—
|
|
—
|
|
—
|
|
41
|
|
|||||||||
|
Investments in nuclear decommissioning trust fund securities
|
(629
|
)
|
—
|
|
—
|
|
—
|
|
(629
|
)
|
|||||||||
|
Proceeds from sales of nuclear decommissioning trust fund securities
|
631
|
|
—
|
|
—
|
|
—
|
|
631
|
|
|||||||||
|
Proceeds from sale of assets, net
|
—
|
|
1
|
|
26
|
|
—
|
|
27
|
|
|||||||||
|
Investments in unconsolidated affiliates
|
1
|
|
(357
|
)
|
(39
|
)
|
—
|
|
(395
|
)
|
|||||||||
|
Other
|
—
|
|
11
|
|
—
|
|
—
|
|
11
|
|
|||||||||
|
Net Cash (Used)/Provided by Investing Activities
|
(273
|
)
|
(1,839
|
)
|
32
|
|
595
|
|
(1,485
|
)
|
|||||||||
|
Cash Flows from Financing Activities
|
|
|
|
|
|
||||||||||||||
|
Dividends from NRG Yield, Inc.
|
—
|
|
(70
|
)
|
—
|
|
70
|
|
—
|
|
|||||||||
|
Intercompany dividends
|
—
|
|
(33
|
)
|
—
|
|
33
|
|
—
|
|
|||||||||
|
Payments from/(for) intercompany loans
|
7,183
|
|
1,258
|
|
(8,441
|
)
|
—
|
|
—
|
|
|||||||||
|
Acquisition of 2015 Drop Down Assets, net of cash acquired
|
—
|
|
—
|
|
698
|
|
(698
|
)
|
—
|
|
|||||||||
|
Payment of dividends to preferred stockholders
|
—
|
|
—
|
|
(201
|
)
|
—
|
|
(201
|
)
|
|||||||||
|
Net receipts from acquired derivatives that include financing elements
|
—
|
|
196
|
|
—
|
|
—
|
|
196
|
|
|||||||||
|
Payment for treasury stock
|
—
|
|
—
|
|
(437
|
)
|
—
|
|
(437
|
)
|
|||||||||
|
Distributions from, net of contributions to, noncontrolling interests in subsidiaries
|
—
|
|
47
|
|
—
|
|
—
|
|
47
|
|
|||||||||
|
Proceeds from sale of noncontrolling interests in subsidiaries
|
—
|
|
600
|
|
—
|
|
—
|
|
600
|
|
|||||||||
|
Proceeds from issuance of common stock
|
—
|
|
—
|
|
1
|
|
—
|
|
1
|
|
|||||||||
|
Proceeds from issuance of long-term debt
|
—
|
|
953
|
|
51
|
|
—
|
|
1,004
|
|
|||||||||
|
Payments of short and long-term debt
|
—
|
|
(1,353
|
)
|
(246
|
)
|
—
|
|
(1,599
|
)
|
|||||||||
|
Payment of debt issuance and hedging costs
|
—
|
|
(21
|
)
|
—
|
|
—
|
|
(21
|
)
|
|||||||||
|
Other
|
—
|
|
(22
|
)
|
—
|
|
—
|
|
(22
|
)
|
|||||||||
|
Net Cash Provided/(Used) by Financing Activities
|
7,183
|
|
1,555
|
|
(8,575
|
)
|
(595
|
)
|
(432
|
)
|
|||||||||
|
Effect of exchange rate changes on cash and cash equivalents
|
—
|
|
10
|
|
—
|
|
—
|
|
10
|
|
|||||||||
|
Net (Decrease)/Increase in Cash and Cash Equivalents
|
(18
|
)
|
(630
|
)
|
50
|
|
—
|
|
(598
|
)
|
|||||||||
|
Cash and Cash Equivalents at Beginning of Period
|
18
|
|
1,455
|
|
643
|
|
—
|
|
2,116
|
|
|||||||||
|
Cash and Cash Equivalents at End of Period
|
$
|
—
|
|
$
|
825
|
|
$
|
693
|
|
$
|
—
|
|
$
|
1,518
|
|
||||
|
(a)
|
All significant intercompany transactions have been eliminated in consolidation.
|
233
NRG ENERGY, INC. AND SUBSIDIARIES
CONDENSED CONSOLIDATING STATEMENTS OF OPERATIONS
For the Year Ended December 31,
2014
|
Guarantor
Subsidiaries
|
Non-Guarantor
Subsidiaries
|
NRG Energy, Inc.
|
Eliminations
(a)
|
Consolidated
Balance
|
|||||||||||||||
|
|
(In millions)
|
||||||||||||||||||
|
Operating Revenues
|
|
|
|
|
|
||||||||||||||
|
Total operating revenues
|
$
|
9,974
|
|
$
|
6,287
|
|
$
|
—
|
|
$
|
(393
|
)
|
$
|
15,868
|
|
||||
|
Operating Costs and Expenses
|
|
||||||||||||||||||
|
Cost of operations
|
7,909
|
|
4,220
|
|
4
|
|
(325
|
)
|
11,808
|
|
|||||||||
|
Depreciation and amortization
|
801
|
|
706
|
|
16
|
|
—
|
|
1,523
|
|
|||||||||
|
Impairment losses
|
—
|
|
119
|
|
—
|
|
(22
|
)
|
97
|
|
|||||||||
|
Selling, general and administrative
|
333
|
|
379
|
|
304
|
|
—
|
|
1,016
|
|
|||||||||
|
Acquisition-related transaction and integration costs
|
3
|
|
15
|
|
66
|
|
—
|
|
84
|
|
|||||||||
|
Development costs
|
—
|
|
32
|
|
56
|
|
—
|
|
88
|
|
|||||||||
|
Total operating costs and expenses
|
9,046
|
|
5,471
|
|
446
|
|
(347
|
)
|
14,616
|
|
|||||||||
|
Gain on sale of assets
|
—
|
|
19
|
|
—
|
|
—
|
|
19
|
|
|||||||||
|
Operating Income/(Loss)
|
928
|
|
835
|
|
(446
|
)
|
(46
|
)
|
1,271
|
|
|||||||||
|
Other Income/(Expense)
|
|
|
|
|
|
||||||||||||||
|
Equity in earnings of consolidated subsidiaries
|
317
|
|
219
|
|
775
|
|
(1,311
|
)
|
—
|
|
|||||||||
|
Equity in earnings of unconsolidated affiliates
|
13
|
|
33
|
|
—
|
|
(8
|
)
|
38
|
|
|||||||||
|
Other income, net
|
7
|
|
14
|
|
3
|
|
(2
|
)
|
22
|
|
|||||||||
|
Gain on sale of equity method investment
|
—
|
|
18
|
|
—
|
|
—
|
|
18
|
|
|||||||||
|
Loss on debt extinguishment
|
—
|
|
(9
|
)
|
(86
|
)
|
—
|
|
(95
|
)
|
|||||||||
|
Interest expense
|
(19
|
)
|
(525
|
)
|
(575
|
)
|
—
|
|
(1,119
|
)
|
|||||||||
|
Total other income/(expense)
|
318
|
|
(250
|
)
|
117
|
|
(1,321
|
)
|
(1,136
|
)
|
|||||||||
|
Income/(Loss) Before Income Taxes
|
1,246
|
|
585
|
|
(329
|
)
|
(1,367
|
)
|
135
|
|
|||||||||
|
Income tax expense/(benefit)
|
322
|
|
159
|
|
(478
|
)
|
—
|
|
3
|
|
|||||||||
|
Net Income
|
924
|
|
426
|
|
149
|
|
(1,367
|
)
|
132
|
|
|||||||||
|
Less: Net income attributable to noncontrolling interests and redeemable noncontrolling interests
|
—
|
|
57
|
|
15
|
|
(74
|
)
|
(2
|
)
|
|||||||||
|
Net Income Attributable to NRG Energy, Inc
|
$
|
924
|
|
$
|
369
|
|
$
|
134
|
|
$
|
(1,293
|
)
|
$
|
134
|
|
||||
|
(a)
|
All significant intercompany transactions have been eliminated in consolidation.
|
234
NRG ENERGY, INC. AND SUBSIDIARIES
CONDENSED CONSOLIDATING STATEMENTS OF COMPREHENSIVE INCOME
For the Year Ended
December 31, 2014
|
Guarantor Subsidiaries
|
Non-Guarantor Subsidiaries
|
NRG Energy, Inc.
(Note Issuer)
|
Eliminations
(a)
|
Consolidated Balance
|
|||||||||||||||
|
(In millions)
|
|||||||||||||||||||
|
Net Income
|
$
|
924
|
|
$
|
426
|
|
$
|
149
|
|
$
|
(1,367
|
)
|
$
|
132
|
|
||||
|
Other Comprehensive (Loss)/Income, net of tax
|
|||||||||||||||||||
|
Unrealized loss on derivatives, net
|
(49
|
)
|
(89
|
)
|
(215
|
)
|
308
|
|
(45
|
)
|
|||||||||
|
Foreign currency translation adjustments, net
|
—
|
|
(12
|
)
|
4
|
|
—
|
|
(8
|
)
|
|||||||||
|
Available-for-sale securities, net
|
—
|
|
1
|
|
(8
|
)
|
—
|
|
(7
|
)
|
|||||||||
|
Defined benefit plan, net
|
5
|
|
(104
|
)
|
20
|
|
(50
|
)
|
(129
|
)
|
|||||||||
|
Other comprehensive loss
|
(44
|
)
|
(204
|
)
|
(199
|
)
|
258
|
|
(189
|
)
|
|||||||||
|
Comprehensive Income/(Loss)
|
880
|
|
222
|
|
(50
|
)
|
(1,109
|
)
|
(57
|
)
|
|||||||||
|
Less: Comprehensive income attributable to noncontrolling interest
|
—
|
|
67
|
|
15
|
|
(74
|
)
|
8
|
|
|||||||||
|
Comprehensive Income/(Loss) Attributable to NRG Energy, Inc.
|
880
|
|
155
|
|
(65
|
)
|
(1,035
|
)
|
(65
|
)
|
|||||||||
|
Dividends for preferred shares
|
—
|
|
—
|
|
56
|
|
—
|
|
56
|
|
|||||||||
|
Comprehensive Income/(Loss) Available for Common Stockholders
|
$
|
880
|
|
$
|
155
|
|
$
|
(121
|
)
|
$
|
(1,035
|
)
|
$
|
(121
|
)
|
||||
|
(a)
|
All significant intercompany transactions have been eliminated in consolidation.
|
235
NRG ENERGY, INC. AND SUBSIDIARIES
CONDENSED CONSOLIDATING STATEMENTS OF CASH FLOWS
For the Year Ended December 31,
2014
|
Guarantor
Subsidiaries
|
Non-Guarantor
Subsidiaries
|
NRG Energy, Inc.
|
Eliminations
(a)
|
Consolidated
Balance
|
|||||||||||||||
|
|
(In millions)
|
||||||||||||||||||
|
Cash Flows from Operating Activities
|
|
|
|
|
|
||||||||||||||
|
Net income
|
$
|
924
|
|
$
|
426
|
|
$
|
149
|
|
$
|
(1,367
|
)
|
$
|
132
|
|
||||
|
Adjustments to reconcile net income to net cash provided by operating activities:
|
|||||||||||||||||||
|
Distributions from unconsolidated affiliates
|
—
|
|
87
|
|
—
|
|
—
|
|
87
|
|
|||||||||
|
Equity in earnings of unconsolidated affiliates
|
(13
|
)
|
(33
|
)
|
—
|
|
8
|
|
(38
|
)
|
|||||||||
|
Depreciation and amortization
|
801
|
|
706
|
|
16
|
|
—
|
|
1,523
|
|
|||||||||
|
Provision for bad debts
|
64
|
|
—
|
|
—
|
|
—
|
|
64
|
|
|||||||||
|
Amortization of nuclear fuel
|
46
|
|
—
|
|
—
|
|
—
|
|
46
|
|
|||||||||
|
Amortization of financing costs and debt discount/premiums
|
—
|
|
(40
|
)
|
28
|
|
—
|
|
(12
|
)
|
|||||||||
|
Adjustment to loss on debt extinguishment
|
—
|
|
8
|
|
17
|
|
—
|
|
25
|
|
|||||||||
|
Amortization of intangibles and out-of-market contracts
|
65
|
|
(1
|
)
|
—
|
|
—
|
|
64
|
|
|||||||||
|
Amortization of unearned equity compensation
|
—
|
|
—
|
|
42
|
|
—
|
|
42
|
|
|||||||||
|
Gain on sale of assets
|
—
|
|
(4
|
)
|
—
|
|
—
|
|
(4
|
)
|
|||||||||
|
Impairment losses
|
—
|
|
119
|
|
—
|
|
(22
|
)
|
97
|
|
|||||||||
|
Changes in derivative instruments
|
(149
|
)
|
88
|
|
—
|
|
—
|
|
(61
|
)
|
|||||||||
|
Changes in deferred income taxes and liability for uncertain tax benefits
|
242
|
|
(115
|
)
|
(281
|
)
|
—
|
|
(154
|
)
|
|||||||||
|
Changes in nuclear decommissioning trust liability
|
19
|
|
—
|
|
—
|
|
—
|
|
19
|
|
|||||||||
|
Changes in collateral deposits supporting energy risk management activities
|
101
|
|
45
|
|
—
|
|
—
|
|
146
|
|
|||||||||
|
Cash provided/(used) by changes in other working capital
|
686
|
|
(958
|
)
|
(1,575
|
)
|
1,381
|
|
(466
|
)
|
|||||||||
|
Net Cash Provided/(Used) by Operating Activities
|
2,786
|
|
328
|
|
(1,604
|
)
|
—
|
|
1,510
|
|
|||||||||
|
Cash Flows from Investing Activities
|
|
||||||||||||||||||
|
Dividends from NRG Yield, Inc.
|
—
|
|
—
|
|
60
|
|
(60
|
)
|
—
|
|
|||||||||
|
Acquisition of business, net of cash acquired
|
—
|
|
(25
|
)
|
(2,911
|
)
|
—
|
|
(2,936
|
)
|
|||||||||
|
Capital expenditures
|
(252
|
)
|
(619
|
)
|
(38
|
)
|
—
|
|
(909
|
)
|
|||||||||
|
Decrease in restricted cash
|
—
|
|
57
|
|
—
|
|
—
|
|
57
|
|
|||||||||
|
(Increase)/decrease in restricted cash - U.S. DOE projects
|
—
|
|
(209
|
)
|
3
|
|
—
|
|
(206
|
)
|
|||||||||
|
Decrease in notes receivable
|
—
|
|
25
|
|
—
|
|
—
|
|
25
|
|
|||||||||
|
Proceeds from renewable energy grants
|
—
|
|
916
|
|
—
|
|
—
|
|
916
|
|
|||||||||
|
Purchases of emission allowances, net of proceeds
|
(16
|
)
|
—
|
|
—
|
|
—
|
|
(16
|
)
|
|||||||||
|
Investments in nuclear decommissioning trust fund securities
|
(619
|
)
|
—
|
|
—
|
|
—
|
|
(619
|
)
|
|||||||||
|
Proceeds from sales of nuclear decommissioning trust fund securities
|
600
|
|
—
|
|
—
|
|
—
|
|
600
|
|
|||||||||
|
Proceeds from sale of assets, net
|
—
|
|
—
|
|
203
|
|
—
|
|
203
|
|
|||||||||
|
Investments in unconsolidated affiliates, net
|
—
|
|
(25
|
)
|
(78
|
)
|
—
|
|
(103
|
)
|
|||||||||
|
Other
|
—
|
|
85
|
|
—
|
|
—
|
|
85
|
|
|||||||||
|
Net Cash (Used)/Provided by Investing Activities
|
(287
|
)
|
205
|
|
(2,761
|
)
|
(60
|
)
|
(2,903
|
)
|
|||||||||
|
Cash Flows from Financing Activities
|
|
|
|
|
|
||||||||||||||
|
Dividends from NRG Yield, Inc.
|
—
|
|
(60
|
)
|
—
|
|
60
|
|
—
|
|
|||||||||
|
Payments (for)/from intercompany loans
|
(2,523
|
)
|
(685
|
)
|
3,208
|
|
|
|
—
|
|
|||||||||
|
Payment for dividends to preferred stockholders
|
—
|
|
—
|
|
(196
|
)
|
—
|
|
(196
|
)
|
|||||||||
|
Net receipts from acquired derivatives that include financing elements
|
—
|
|
9
|
|
—
|
|
—
|
|
9
|
|
|||||||||
|
Payment for treasury stock
|
—
|
|
—
|
|
(39
|
)
|
—
|
|
(39
|
)
|
|||||||||
|
Distributions from, net of contributions to, noncontrolling interests in subsidiaries
|
—
|
|
189
|
|
—
|
|
—
|
|
189
|
|
|||||||||
|
Proceeds from sale of noncontrolling interests in subsidiaries
|
—
|
|
630
|
|
—
|
|
—
|
|
630
|
|
|||||||||
|
Proceeds from issuance of common stock
|
—
|
|
—
|
|
21
|
|
—
|
|
21
|
|
|||||||||
|
Proceeds from issuance of long-term debt
|
—
|
|
1,182
|
|
3,381
|
|
—
|
|
4,563
|
|
|||||||||
|
Payments of short and long-term debt
|
—
|
|
(1,160
|
)
|
(2,667
|
)
|
—
|
|
(3,827
|
)
|
|||||||||
|
Payment of debt issuance and hedging costs
|
—
|
|
(39
|
)
|
(28
|
)
|
—
|
|
(67
|
)
|
|||||||||
|
Other
|
(14
|
)
|
(4
|
)
|
—
|
|
—
|
|
(18
|
)
|
|||||||||
|
Net Cash (Used)/Provided by Financing Activities
|
(2,537
|
)
|
62
|
|
3,680
|
|
60
|
|
1,265
|
|
|||||||||
|
Effect of exchange rate changes on cash and cash equivalents
|
—
|
|
(10
|
)
|
—
|
|
—
|
|
(10
|
)
|
|||||||||
|
Net (Decrease)/Increase in Cash and Cash Equivalents
|
(38
|
)
|
585
|
|
(685
|
)
|
—
|
|
(138
|
)
|
|||||||||
|
Cash and Cash Equivalents at Beginning of Period
|
56
|
|
870
|
|
1,328
|
|
—
|
|
2,254
|
|
|||||||||
|
Cash and Cash Equivalents at End of Period
|
$
|
18
|
|
$
|
1,455
|
|
$
|
643
|
|
$
|
—
|
|
$
|
2,116
|
|
||||
|
(a)
|
All significant intercompany transactions have been eliminated in consolidation.
|
236
SCHEDULE II. VALUATION AND QUALIFYING ACCOUNTS
For the Years Ended December 31,
2016
,
2015
, and
2014
|
Balance at
Beginning of
Period
|
Charged to
Costs and
Expenses
|
Charged to
Other Accounts
|
Deductions
|
Balance at
End of Period
|
|||||||||||||||
|
|
(In millions)
|
||||||||||||||||||
|
Allowance for doubtful accounts, deducted from accounts receivable
|
|
|
|
|
|
|
|||||||||||||
|
Year Ended December 31, 2016
|
$
|
21
|
|
$
|
48
|
|
$
|
—
|
|
$
|
(39
|
)
|
(a)
|
$
|
30
|
|
|||
|
Year Ended December 31, 2015
|
23
|
|
62
|
|
—
|
|
(64
|
)
|
(a)
|
21
|
|
||||||||
|
Year Ended December 31, 2014
|
40
|
|
64
|
|
—
|
|
(81
|
)
|
(a)
|
23
|
|
||||||||
|
Income tax valuation allowance, deducted from deferred tax assets
|
|
|
|
|
|
|
|
||||||||||||
|
Year Ended December 31, 2016
|
$
|
3,575
|
|
$
|
306
|
|
$
|
235
|
|
$
|
—
|
|
$
|
4,116
|
|
||||
|
Year Ended December 31, 2015
|
265
|
|
3,039
|
|
271
|
|
—
|
|
|
3,575
|
|
||||||||
|
Year Ended December 31, 2014
|
291
|
|
—
|
|
(10
|
)
|
(16
|
)
|
265
|
|
|||||||||
|
(a)
|
Represents principally net amounts charged as uncollectible.
|
237
EXHIBIT INDEX
|
Number
|
Description
|
Method of Filing
|
||
|
2.1
|
Third Amended Joint Plan of Reorganization of NRG Energy, Inc., NRG Power Marketing, Inc., NRG Capital LLC, NRG Finance Company I LLC, and NRGenerating Holdings (No. 23) B.V.
|
Incorporated herein by reference to Exhibit 99.1 to the Registrant's current report on Form 8-K filed on November 19, 2003.
|
||
|
2.2
|
First Amended Joint Plan of Reorganization of NRG Northeast Generating LLC (and certain of its subsidiaries), NRG South Central Generating (and certain of its subsidiaries) and Berrians I Gas Turbine Power LLC.
|
Incorporated herein by reference to Exhibit 99.2 to the Registrant's current report on Form 8-K filed on November 19, 2003.
|
||
|
2.3
|
Acquisition Agreement, dated as of September 30, 2005, by and among NRG Energy, Inc., Texas Genco LLC and the Direct and Indirect Owners of Texas Genco LLC.
|
Incorporated herein by reference to Exhibit 2.1 to the Registrant's current report on Form 8-K filed on October 3, 2005.
|
||
|
2.4
|
Purchase and Sale Agreement by and between Denali Merger Sub Inc. and NRG Energy, Inc. dated as of August 13, 2010.
|
Incorporated herein by reference to Exhibit 99.2 to the Registrant's current report on Form 8-K filed on August 13, 2010.
|
||
|
2.5
|
Agreement and Plan of Merger, dated as of July 20, 2012, by and among NRG Energy, Inc., Plus Merger Corporation and GenOn Energy, Inc.
|
Incorporated herein by reference to Exhibit 2.1 to the Registrant's current report on Form 8-K filed on July 23, 2012.
|
||
|
2.6
|
Plan Sponsor Agreement, dated October 18, 2013, by and among NRG Energy, Inc., NRG Energy Holdings, Inc., Edison Mission Energy, certain of Edison Mission Energy’s debtor subsidiaries, the Official Committee of Unsecured Creditors of Edison Mission Energy and its affiliated debtors, the PoJo Parties (as defined therein) and the proponent noteholders thereto.
|
Incorporated herein by reference to Exhibit 2.1 to Amendment No. 1 to the Registrant’s current report on Form 8-K filed on October 21, 2013.
|
||
|
2.7
|
Asset Purchase Agreement, dated October 18, 2013, by and among NRG Energy, Inc., Edison Mission Energy and NRG Energy Holdings Inc.
|
Incorporated herein by reference to Exhibit 2.2 to Amendment No. 1 to the Registrant’s current report on Form 8-K filed on October 21, 2013.
|
||
|
3.1
|
Amended and Restated Certificate of Incorporation.
|
Incorporated herein by reference to Exhibit 3.1 to the Registrant's quarterly report on Form 10-Q filed on May 3, 2012.
|
||
|
3.2
|
Certificate of Amendment to Amended and Restated Certificate of Incorporation.
|
Incorporated herein by reference to Exhibit 3.1 to the Registrant's current report on Form 8-K filed on December 14, 2012.
|
||
|
3.3
|
Fourth Amended and Restated By-Laws.
|
Incorporated herein by reference to Exhibit 3.1 to the Registrant's current report on Form 8-K filed on February 13, 2017.
|
||
|
3.4
|
Certificate of Designations relating to the Series 1 Exchangeable Limited Liability Company Preferred Interests of NRG Common Stock Finance I LLC, as filed with the Secretary of State of Delaware on August 4, 2006.
|
Incorporated herein by reference to Exhibit 10.7 to the Registrant's current report on Form 8-K filed on August 10, 2006.
|
||
|
3.5
|
Certificate of Amendment to Certificate of Designations relating to the Series 1 Exchangeable Limited Liability Company Preferred Interests of NRG Common Stock Finance I LLC, as filed with the Secretary of State of Delaware on February 27, 2008.
|
Incorporated herein by reference to Exhibit 3.1 to the Registrant's quarterly report on Form 10-Q filed on May 1, 2008.
|
||
|
3.6
|
Second Certificate of Amendment to Certificate of Designations relating to the Series 1 Exchangeable Limited Liability Company Preferred Interests of NRG Common Stock Finance I LLC, as filed with the Secretary of State of Delaware on August 8, 2008.
|
Incorporated herein by reference to Exhibit 3.1 to the Registrant's quarterly report on Form 10-Q filed on October 30, 2008.
|
||
|
3.7
|
Certificate of Designations of 2.822% Convertible Perpetual Preferred Stock, as filed with the Secretary of State of the State of Delaware on December 30, 2014.
|
Incorporated herein by reference to Exhibit 3.1 to the Registrant's current report on Form 8-K filed on December 30, 2014.
|
||
|
4.1
|
Supplemental Indenture, dated as of December 30, 2005, among NRG Energy, Inc., the subsidiary guarantors named on Schedule A thereto and Law Debenture Trust Company of New York, as trustee.
|
Incorporated herein by reference to Exhibit 10.1 to the Registrant's current report on Form 8-K filed on January 4, 2006.
|
||
|
4.2
|
Amended and Restated Common Agreement among XL Capital Assurance Inc., Goldman Sachs Mitsui Marine Derivative Products, L.P., Law Debenture Trust Company of New York, as Trustee, The Bank of New York, as Collateral Agent, NRG Peaker Finance Company LLC and each Project Company Party thereto, dated as of January 6, 2004, together with Annex A to the Common Agreement.
|
Incorporated herein by reference to Exhibit 4.9 to the Registrant's annual report on Form 10-K filed on March 16, 2004.
|
||
|
4.3
|
Amended and Restated Security Deposit Agreement among NRG Peaker Finance Company, LLC and each Project Company party thereto, and the Bank of New York, as Collateral Agent and Depositary Agent, dated as of January 6, 2004.
|
Incorporated herein by reference to Exhibit 4.10 to the Registrant's annual report on Form 10-K filed on March 16, 2004.
|
||
238
|
4.4
|
NRG Parent Agreement by NRG Energy, Inc. in favor of the Bank of New York, as Collateral Agent, dated as of January 6, 2004.
|
Incorporated herein by reference to Exhibit 4.11 to the Registrant's annual report on Form 10-K filed on March 16, 2004.
|
||
|
4.5
|
Indenture dated June 18, 2002, between NRG Peaker Finance Company LLC, as Issuer, Bayou Cove Peaking Power LLC, Big Cajun I Peaking Power LLC, NRG Rockford LLC, NRG Rockford II LLC and Sterlington Power LLC, as Guarantors, XL Capital Assurance Inc., as Insurer, and Law Debenture Trust Company, as Successor Trustee to the Bank of New York.
|
Incorporated herein by reference to Exhibit 4.23 to the Registrant's annual report on Form 10-K filed on March 31, 2003.
|
||
|
4.6
|
Specimen of Certificate representing common stock of NRG Energy, Inc.
|
Incorporated herein by reference to Exhibit 4.3 to the Registrant's quarterly report on Form 10-Q filed on August 4, 2006.
|
||
|
4.7
|
Indenture, dated February 2, 2006, among NRG Energy, Inc. and Law Debenture Trust Company of New York.
|
Incorporated herein by reference to Exhibit 4.1 to the Registrant's current report on Form 8-K filed on February 6, 2006.
|
||
|
4.8
|
Thirty-Sixth Supplemental Indenture, dated August 20, 2010, among NRG Energy, Inc., the guarantors named therein and Law Debenture Trust Company of New York as Trustee, re: NRG Energy, Inc.'s 8.25% Senior Notes due 2020.
|
Incorporated herein by reference to Exhibit 4.1 to the Registrant's current report on Form 8-K filed on August 20, 2010.
|
||
|
4.9
|
Form of 8.25% Senior Note due 2020.
|
Incorporated herein by reference to Exhibit 4.2 to the Registrant's current report on Form 8-K filed on August 20, 2010.
|
||
|
4.10
|
Registration Rights Agreement, dated August 20, 2010, among NRG Energy, Inc., the guarantors named therein and Citigroup Global Markets Inc., Banc of America Securities LLC and Deutsche Bank Securities Inc., as representatives of the several initial purchasers.
|
Incorporated herein by reference to Exhibit 10.1 to the Registrant's current report on Form 8-K filed on August 20, 2010.
|
||
|
4.11
|
Forty-First Supplemental Indenture, dated as of December 15, 2010, among NRG Energy, Inc., the existing guarantors named therein, the guaranteeing subsidiaries named therein and Law Debenture Trust Company of New York as Trustee, re: NRG Energy, Inc.'s 8.25% Senior Notes due 2020.
|
Incorporated herein by reference to Exhibit 4.5 to the Registrant's current report on Form 8-K filed on December 16, 2010.
|
||
|
4.12
|
Forty-Second Supplemental Indenture, dated January 26, 2011, among NRG Energy, Inc., the existing guarantors named therein, the guaranteeing subsidiaries named therein and Law Debenture Trust Company of New York as Trustee, re: NRG Energy, Inc.’s 7.625% Senior Notes due 2018.
|
Incorporated herein by reference to Exhibit 4.1 to the Registrant's current report on Form 8-K filed on January 28, 2011.
|
||
|
4.13
|
Form of 7.625% Senior Note due 2018.
|
Incorporated herein by reference to Exhibit 4.2 to the Registrant's current report on Form 8-K filed on January 28, 2011.
|
||
|
4.14
|
Registration Rights Agreement, dated January 26, 2011, among NRG Energy, Inc., the guarantors named therein and J.P. Morgan Securities LLC, as initial purchaser.
|
Incorporated herein by reference to Exhibit 10.1 to the Registrant's current report on Form 8-K filed on January 28, 2011.
|
||
|
4.15
|
Forty-Eighth Supplemental Indenture, dated May 20, 2011, among NRG Energy, Inc., the existing guarantors named therein, the guaranteeing subsidiaries named therein and Law Debenture Trust Company of New York as Trustee, re: NRG Energy, Inc.’s 8.25% Senior Notes due 2020.
|
Incorporated herein by reference to Exhibit 4.4 to the Registrant's current report on Form 8-K filed on May 25, 2011.
|
||
|
4.16
|
Forty-Ninth Supplemental Indenture, dated May 20, 2011, among NRG Energy, Inc., the existing guarantors named therein, the guaranteeing subsidiaries named therein and Law Debenture Trust Company of New York as Trustee, re: NRG Energy, Inc.’s 7.625% Senior Notes due 2018.
|
Incorporated herein by reference to Exhibit 4.5 to the Registrant's current report on Form 8-K filed on May 25, 2011.
|
||
|
4.17
|
Fifty-First Supplemental Indenture, dated May 24, 2011, among NRG Energy, Inc., the existing guarantors named therein, the guaranteeing subsidiaries named therein and Law Debenture Trust Company of New York as Trustee, re: NRG Energy, Inc.’s 7.875% Senior Notes due 2021.
|
Incorporated herein by reference to Exhibit 4.3 to the Registrant's current report on Form 8-K filed on May 25, 2011.
|
||
|
4.18
|
Form of 7.875% Senior Note due 2021.
|
Incorporated herein by reference to Exhibit 4.4 to the Registrant's current report on Form 8-K filed on May 25, 2011.
|
||
|
4.19
|
Registration Rights Agreement, dated May 24, 2011, among NRG Energy, Inc., the guarantors named therein and Morgan Stanley & Co. Incorporated, Merrill Lynch, Pierce, Fenner & Smith Incorporated, Barclays Capital Inc., Citigroup Global Markets Inc., Credit Suisse Securities (USA) LLC, Deutsche Bank Securities Inc., Goldman, Sachs & Co., J.P. Morgan Securities LLC and RBS Securities Inc., as representatives of the initial purchasers.
|
Incorporated herein by reference to Exhibit 4.5 to the Registrant's current report on Form 8-K filed on May 25, 2011.
|
||
239
|
4.20
|
Fifty-Fourth Supplemental Indenture, dated November 8, 2011, among NRG Energy, Inc., the existing guarantors named therein, the guaranteeing subsidiaries named therein and Law Debenture Trust Company of New York as Trustee, re: NRG Energy, Inc.’s 8.25% Senior Notes due 2020.
|
Incorporated herein by reference to Exhibit 4.3 to the Registrant's current report on Form 8-K filed on November 8, 2011.
|
||
|
4.21
|
Fifty-Fifth Supplemental Indenture, dated November 8, 2011, among NRG Energy, Inc., the existing guarantors named therein, the guaranteeing subsidiaries named therein and Law Debenture Trust Company of New York as Trustee, re: NRG Energy, Inc.’s 7.625% Senior Notes due 2018.
|
Incorporated herein by reference to Exhibit 4.4 to the Registrant's current report on Form 8-K filed on November 8, 2011.
|
||
|
4.22
|
Fifty-Seventh Supplemental Indenture, dated November 8, 2011, among NRG Energy, Inc., the existing guarantors named therein, the guaranteeing subsidiaries named therein and Law Debenture Trust Company of New York as Trustee, re: NRG Energy, Inc.’s 7.875% Senior Notes due 2021.
|
Incorporated herein by reference to Exhibit 4.6 to the Registrant's current report on Form 8-K filed on November 8, 2011.
|
||
|
4.23
|
Sixtieth Supplemental Indenture, dated April 5, 2012, among NRG Energy, Inc., the existing guarantors named therein, the guaranteeing subsidiaries named therein and Law Debenture Trust Company of New York as Trustee, re: NRG Energy, Inc.’s 8.25% Senior Notes due 2020.
|
Incorporated herein by reference to Exhibit 4.3 to the Registrant's current report on Form 8-K filed on April 6, 2012.
|
||
|
4.24
|
Sixty-First Supplemental Indenture, dated April 5, 2012, among NRG Energy, Inc., the existing guarantors named therein, the guaranteeing subsidiaries named therein and Law Debenture Trust Company of New York as Trustee, re: NRG Energy, Inc.’s 7.625% Senior Notes due 2018.
|
Incorporated herein by reference to Exhibit 4.4 to the Registrant's current report on Form 8-K filed on April 6, 2012.
|
||
|
4.25
|
Sixty-Third Supplemental Indenture, dated April 5, 2012, among NRG Energy, Inc., the existing guarantors named therein, the guaranteeing subsidiaries named therein and Law Debenture Trust Company of New York as Trustee, re: NRG Energy, Inc.’s 7.875% Senior Notes due 2021.
|
Incorporated herein by reference to Exhibit 4.6 to the Registrant's current report on Form 8-K filed on April 6, 2012.
|
||
|
4.26
|
Sixty-Sixth Supplemental Indenture, dated May 9, 2012, among NRG Energy, Inc., the existing guarantors named therein, the guaranteeing subsidiaries named therein and Law Debenture Trust Company of New York as Trustee, re: NRG Energy, Inc.’s 8.25% Senior Notes due 2020.
|
Incorporated herein by reference to Exhibit 4.3 to the Registrant's current report on Form 8-K filed on May 11, 2012.
|
||
|
4.27
|
Sixty-Seventh Supplemental Indenture, dated May 9, 2012, among NRG Energy, Inc., the existing guarantors named therein, the guaranteeing subsidiaries named therein and Law Debenture Trust Company of New York as Trustee, re: NRG Energy, Inc.’s 7.625% Senior Notes due 2018.
|
Incorporated herein by reference to Exhibit 4.4 to the Registrant's current report on Form 8-K filed on May 11, 2012.
|
||
|
4.28
|
Sixty-Ninth Supplemental Indenture, dated May 9, 2012, among NRG Energy, Inc., the existing guarantors named therein, the guaranteeing subsidiaries named therein and Law Debenture Trust Company of New York as Trustee, re: NRG Energy, Inc.’s 7.875% Senior Notes due 2021.
|
Incorporated herein by reference to Exhibit 4.6 to the Registrant's current report on Form 8-K filed on May 11, 2012.
|
||
|
4.29
|
Seventieth Supplemental Indenture, dated September 24, 2012, among NRG Energy, Inc., the existing guarantors named therein, the guaranteeing subsidiaries named therein and Law Debenture Trust Company of New York as Trustee, re: NRG Energy, Inc.’s 6.625% Senior Notes due 2023.
|
Incorporated herein by reference to Exhibit 4.1 to the Registrant's current report on Form 8-K filed on September 24, 2012.
|
||
|
4.30
|
Form of 6.625% Senior Note due 2023.
|
Incorporated herein by reference to Exhibit 4.2 to the Registrant's current report on Form 8-K filed on September 24, 2012.
|
||
|
4.31
|
Seventy-Second Supplemental Indenture, dated October 9, 2012, among NRG Energy, Inc., the existing guarantors named therein, the guaranteeing subsidiaries named therein and Law Debenture Trust Company of New York as Trustee, re: NRG Energy, Inc.’s 8.25% Senior Notes due 2020.
|
Incorporated herein by reference to Exhibit 4.2 to the Registrant's current report on Form 8-K filed on October 12, 2012.
|
||
|
4.32
|
Seventy-Third Supplemental Indenture, dated October 9, 2012, among NRG Energy, Inc., the existing guarantors named therein, the guaranteeing subsidiaries named therein and Law Debenture Trust Company of New York as Trustee, re: NRG Energy, Inc.’s 7.625% Senior Notes due 2018.
|
Incorporated herein by reference to Exhibit 4.3 to the Registrant's current report on Form 8-K filed on October 12, 2012.
|
||
|
4.33
|
Seventy-Fifth Supplemental Indenture, dated October 9, 2012, among NRG Energy, Inc., the existing guarantors named therein, the guaranteeing subsidiaries named therein and Law Debenture Trust Company of New York as Trustee, re: NRG Energy, Inc.’s 7.875% Senior Notes due 2021.
|
Incorporated herein by reference to Exhibit 4.5 to the Registrant's current report on Form 8-K filed on October 12, 2012.
|
||
240
|
4.34
|
Seventy-Sixth Supplemental Indenture, dated October 9, 2012, among NRG Energy, Inc., the existing guarantors named therein, the guaranteeing subsidiaries named therein and Law Debenture Trust Company of New York as Trustee, re: NRG Energy, Inc.’s 6.625% Senior Notes due 2023.
|
Incorporated herein by reference to Exhibit 4.6 to the Registrant's current report on Form 8-K filed on October 12, 2012.
|
||
|
4.35
|
Senior Indenture, dated December 22, 2004, between Reliant Energy, Inc. and Wilmington Trust Company.
|
Incorporated herein by reference to Exhibit 4.1 to GenOn Energy, Inc.’s current report on Form 8-K filed on December 27, 2004.
|
||
|
4.36
|
Fourth Supplemental Indenture, dated June 13, 2007, among Reliant Energy, Inc., the Guarantors listed therein and Wilmington Trust Company as Trustee, re: GenOn Energy, Inc.’s 7.625% Senior Notes due 2014.
|
Incorporated herein by reference to Exhibit 4.1 to GenOn Energy Inc.'s current report on Form 8-K filed on June 15, 2007.
|
||
|
4.37
|
Fifth Supplemental Indenture, dated June 13, 2007, among Reliant Energy, Inc., the Guarantors listed therein and Wilmington Trust Company as Trustee, re: GenOn Energy, Inc.’s 7.875% Senior Notes due 2017.
|
Incorporated herein by reference to Exhibit 4.2 to GenOn Energy Inc.'s current report on Form 8-K filed June 15, 2007.
|
||
|
4.38
|
Indenture, dated May 1, 2001, between Mirant Americas Generation, Inc. and Bankers Trust Company as Trustee.
|
Incorporated herein by reference to Exhibit 4.1 to Mirant Americas Generation, Inc.'s Registration Statement on Form S-4 filed on June 18, 2001.
|
||
|
4.39
|
Third Supplemental Indenture, dated May 1, 2001, between Mirant Americas Generation, Inc. and Bankers Trust Company as Trustee, re: GenOn Americas Generation, LLC’s 9.125% Senior Notes due 2031.
|
Incorporated herein by reference to Exhibit 4.4 to Mirant Americas Generation, Inc.'s Registration Statement on Form S-4 filed on June 18, 2001.
|
||
|
4.40
|
Fifth Supplemental Indenture, dated October 9, 2001, between Mirant Americas Generation, Inc. and Bankers Trust Company as Trustee, re: GenOn Americas Generation, LLC’s 8.5% Senior Notes due 2021.
|
Incorporated herein by reference to Exhibit 4.6 to Mirant Americas Generation, Inc.'s Registration Statement on Form S-4/A filed on May 7, 2002.
|
||
|
4.41
|
Sixth Supplemental Indenture, dated November 1, 2001, between Mirant Americas Generation LLC and Bankers Trust Company, re: Indenture, dated May 1, 2001.
|
Incorporated herein by reference to Exhibit 4.6 to Mirant Corporation's annual report on Form 10-K filed on February 27, 2009.
|
||
|
4.42
|
Seventh Supplemental Indenture, dated January 3, 2006, between Mirant Americas Generation LLC and Wells Fargo Bank National Association (as successor to Bankers Trust Company), re: Indenture, dated May 1, 2001.
|
Incorporated herein by reference to Exhibit 4.1 to Mirant Americas Generation, LLC's quarterly report on Form 10-Q filed on May 14, 2007.
|
||
|
4.43
|
Senior Notes Indenture, dated October 4, 2010, by GenOn Escrow Corp. and Wilmington Trust Company as trustee, re: GenOn Energy, Inc.’s 9.5% Senior Notes due 2018 and 9.875% Senior Notes due 2020.
|
Incorporated by reference to Exhibit 4.4 to Mirant Corporation's quarterly report on Form 10-Q filed on November 5, 2010.
|
||
|
4.44
|
Supplemental Indenture, dated December 3, 2010, by and among GenOn Energy, Inc., GenOn Escrow Corp. and Wilmington Trust Company as trustee, re: GenOn Energy, Inc.’s 9.5% Senior Notes due 2018 and 9.875% Senior Notes due 2020.
|
Incorporated by reference to Exhibit 4.2 to GenOn Energy Inc.'s current report on Form 8-K filed on December 7, 2010.
|
||
|
4.45
|
Seventy-Eighth Supplemental Indenture, dated as of January 3, 2013, among NRG Energy, Inc., the guarantors named therein and Law Debenture Trust Company of New York as trustee, re: NRG Energy, Inc.’s 8.25% Senior Notes due 2020.
|
Incorporated herein by reference to Exhibit 4.2 to the Registrant’s current report on Form 8-K filed on January 9, 2013.
|
||
|
4.46
|
Seventy-Ninth Supplemental Indenture, dated as of January 3, 2013, among NRG Energy, Inc., the guarantors named therein and Law Debenture Trust Company of New York as trustee, re: NRG Energy, Inc.’s 7.625% Senior Notes due 2018.
|
Incorporated herein by reference to Exhibit 4.3 to the Registrant’s current report on Form 8-K filed on January 9, 2013.
|
||
|
4.47
|
Eighty-First Supplemental Indenture, dated as of January 3, 2013, among NRG Energy, Inc., the guarantors named therein and Law Debenture Trust Company of New York as trustee, re: NRG Energy, Inc.’s 7.875% Senior Notes due 2021.
|
Incorporated herein by reference to Exhibit 4.5 to the Registrant’s current report on Form 8-K filed on January 9, 2013.
|
||
|
4.48
|
Eighty-Second Supplemental Indenture, dated as of January 3, 2013, among NRG Energy, Inc., the guarantors named therein and Law Debenture Trust Company of New York as trustee, re: NRG Energy, Inc.’s 6.625% Senior Notes due 2023.
|
Incorporated herein by reference to Exhibit 4.6 to the Registrant’s current report on Form 8-K filed on January 9, 2013.
|
||
|
4.49
|
Eighty-Fourth Supplemental Indenture, dated as of March 13, 2013, among NRG Energy, Inc., the guarantors named therein and Law Debenture Trust Company of New York as trustee, re: NRG Energy, Inc.’s 8.25% Senior Notes due 2020.
|
Incorporated herein by reference to Exhibit 4.2 to the Registrant’s current report on Form 8-K filed on March 13, 2013.
|
||
|
4.50
|
Eighty-Fifth Supplemental Indenture, dated as of March 13, 2013, among NRG Energy, Inc., the guarantors named therein and Law Debenture Trust Company of New York as trustee, re: NRG Energy, Inc.’s 7.625% Senior Notes due 2018.
|
Incorporated herein by reference to Exhibit 4.3 to the Registrant’s current report on Form 8-K filed on March 13, 2013.
|
||
|
4.51
|
Eighty-Seventh Supplemental Indenture, dated as of March 13, 2013, among NRG Energy, Inc., the guarantors named therein and Law Debenture Trust Company of New York as trustee, re: NRG Energy, Inc.’s 7.875% Senior Notes due 2021.
|
Incorporated herein by reference to Exhibit 4.5 to the Registrant’s current report on Form 8-K filed on March 13, 2013.
|
||
241
|
4.52
|
Eighty-Eighth Supplemental Indenture, dated as of March 13, 2013, among NRG Energy, Inc., the guarantors named therein and Law Debenture Trust Company of New York as trustee, re: NRG Energy, Inc.’s 6.625% Senior Notes due 2023.
|
Incorporated herein by reference to Exhibit 4.6 to the Registrant’s current report on Form 8-K filed on March 13, 2013.
|
||
|
4.53
|
Eighty-Ninth Supplemental Indenture, dated as of March 13, 2013, among NRG Energy, Inc., the guarantors named therein and Law Debenture Trust Company of New York.
|
Incorporated herein by reference to Exhibit 4.7 to the Registrant’s current report on Form 8-K filed on March 13, 2013.
|
||
|
4.54
|
Ninety-First Supplemental Indenture, dated as of May 2, 2013, among NRG Energy, Inc., the guarantors named therein and Law Debenture Trust Company of New York as trustee, re: NRG Energy, Inc.’s 8.25% Senior Notes due 2020.
|
Incorporated herein by reference to Exhibit 4.2 to the Registrant’s current report on Form 8-K filed on May 3, 2013.
|
||
|
4.55
|
Ninety-Second Supplemental Indenture, dated as of May 2, 2013, among NRG Energy, Inc., the guarantors named therein and Law Debenture Trust Company of New York as trustee, re: NRG Energy, Inc.’s 7.625% Senior Notes due 2018.
|
Incorporated herein by reference to Exhibit 4.3 to the Registrant’s current report on Form 8-K filed on May 3, 2013.
|
||
|
4.56
|
Ninety-Fourth Supplemental Indenture, dated as of May 2, 2013, among NRG Energy, Inc., the guarantors named therein and Law Debenture Trust Company of New York as trustee, re: NRG Energy, Inc.’s 7.875% Senior Notes due 2021.
|
Incorporated herein by reference to Exhibit 4.5 to the Registrant’s current report on Form 8-K filed on May 3, 2013.
|
||
|
4.57
|
Ninety-Fifth Supplemental Indenture, dated as of May 2, 2013, among NRG Energy, Inc., the guarantors named therein and Law Debenture Trust Company of New York as trustee, re: NRG Energy, Inc.’s 6.625% Senior Notes due 2023.
|
Incorporated herein by reference to Exhibit 4.6 to the Registrant’s current report on Form 8-K filed on May 3, 2013.
|
||
|
4.58
|
Ninety-Seventh Supplemental Indenture, dated as of September 4, 2013, among NRG Energy, Inc., the guarantors named therein and Law Debenture Trust Company of New York as trustee, re: NRG Energy, Inc.’s 8.25% Senior Notes due 2020.
|
Incorporated herein by reference to Exhibit 4.2 to the Registrant’s current report on Form 8-K filed on September 6, 2013.
|
||
|
4.59
|
Ninety-Eighth Supplemental Indenture, dated as of September 4, 2013, among NRG Energy, Inc., the guarantors named therein and Law Debenture Trust Company of New York as trustee, re: NRG Energy, Inc.’s 7.625% Senior Notes due 2018
|
Incorporated herein by reference to Exhibit 4.3 to the Registrant’s current report on Form 8-K filed on September 6, 2013.
|
||
|
4.60
|
One Hundredth Supplemental Indenture, dated as of September 4, 2013, among NRG Energy, Inc., the guarantors named therein and Law Debenture Trust Company of New York as trustee, re: NRG Energy, Inc.’s 7.875% Senior Notes due 2021.
|
Incorporated herein by reference to Exhibit 4.5 to the Registrant’s current report on Form 8-K filed on September 6, 2013.
|
||
|
4.61
|
One Hundred-First Supplemental Indenture, dated as of September 4, 2013, among NRG Energy, Inc., the guarantors named therein and Law Debenture Trust Company of New York as trustee, re: NRG Energy, Inc.’s 6.625% Senior Notes due 2023.
|
Incorporated herein by reference to Exhibit 4.6 to the Registrant’s current report on Form 8-K filed on September 6, 2013.
|
||
|
4.62
|
One Hundred-Third Supplemental Indenture, dated as of October 7, 2013, among NRG Energy, Inc., the guarantors named therein and Law Debenture Trust Company of New York as trustee, re: NRG Energy, Inc.’s 8.25% Senior Notes due 2020.
|
Incorporated herein by reference to Exhibit 4.2 to the Registrant’s current report on Form 8-K filed on October 8, 2013.
|
||
|
4.63
|
One Hundred-Fourth Supplemental Indenture, dated as of October 7, 2013, among NRG Energy, Inc., the guarantors named therein and Law Debenture Trust Company of New York as trustee, re: NRG Energy, Inc.’s 7.625% Senior Notes due 2018.
|
Incorporated herein by reference to Exhibit 4.3 to the Registrant’s current report on Form 8-K filed on October 8, 2013.
|
||
|
4.64
|
One Hundred-Sixth Supplemental Indenture, dated as of October 7, 2013, among NRG Energy, Inc., the guarantors named therein and Law Debenture Trust Company of New York as trustee, re: NRG Energy, Inc.’s 7.875% Senior Notes due 2021.
|
Incorporated herein by reference to Exhibit 4.5 to the Registrant’s current report on Form 8-K filed on October 8, 2013.
|
||
|
4.65
|
One Hundred-Seventh Supplemental Indenture, dated as of October 7, 2013, among NRG Energy, Inc., the guarantors named therein and Law Debenture Trust Company of New York as trustee, re: NRG Energy, Inc.’s 6.625% Senior Notes due 2023.
|
Incorporated herein by reference to Exhibit 4.6 to the Registrant’s current report on Form 8-K filed on October 8, 2013.
|
||
|
4.66
|
One Hundred-Eighth Supplemental Indenture, dated as of November 13, 2013, among NRG Energy, Inc., the guarantors named therein and Law Debenture Trust Company of New York as trustee, re: NRG Energy, Inc.’s 8.5% Senior Notes due 2019, 8.25% Senior Notes due 2020, 7.625% Senior Notes due 2018, 7.625% Senior Notes due 2019, 7.875% Senior Notes due 2021 and 6.625% Senior Notes due 2023.
|
Incorporated herein by reference to Exhibit 4.1 to the Registrant’s current report on Form 8-K filed on November 13, 2013.
|
||
|
4.67
|
One Hundred-Ninth Supplemental Indenture, dated as of January 27, 2014, among NRG Energy, Inc., the guarantors named therein and Law Debenture Trust Company of New York as Trustee, re: NRG Energy's 6.25% Senior Notes due 2022.
|
Incorporated herein by reference to Exhibit 4.1 to the Company's Current Report on Form 8-K filed on January 27, 2014.
|
||
242
|
4.68
|
Form of 6.25% Senior Note due 2022.
|
Incorporated herein by reference to Exhibit 4.2 to the Company's Current Report on Form 8-K filed on January 27, 2014.
|
||
|
4.69
|
Registration Rights Agreement, dated January 27, 2014, among NRG Energy, Inc., the guarantors named therein and Barclays Capital Inc., Deutsche Bank Securities Inc., Goldman, Sachs & Co., Morgan Stanley & Co. LLC, Credit Agricole Securities (USA) Inc., Natixis Securities Americas LLC and RBC Capital Markets, LLC, as initial purchasers.
|
Incorporated herein by reference to Exhibit 4.3 to the Company's Current Report on Form 8-K filed on January 27, 2014.
|
||
|
4.70
|
One Hundred-Tenth Supplemental Indenture, dated as of March 24, 2014, among NRG Energy, Inc., the guarantors named therein and Law Debenture Trust Company of New York
as trustee, re: NRG Energy, Inc.'s 8.5% Senior Notes due 2019, 8.25% Senior Notes due 2020, 7.625% Senior Notes due 2018, 7.625% Senior Notes due 2019, 7.875% Senior Notes due 2021, 6.625% Senior Notes due 2023 and 6.25% Senior Notes due 2022.
|
Incorporated herein by reference to Exhibit 4.1 to the Company's Current Report on Form 8-K filed on March 28, 2014.
|
||
|
4.71
|
Indenture, dated as of April 21, 2014, among NRG Energy, Inc., the guarantors named therein and Law Debenture Trust Company of New York as Trustee, re: NRG Energy, Inc.'s 6.25% Senior Notes due 2024.
|
Incorporated herein by reference to Exhibit 4.1 to the Company's Current Report on Form 8-K filed on April 21, 2014.
|
||
|
4.72
|
Form of 6.25% Senior Note due 2024.
|
Incorporated herein by reference to Exhibit 4.2 to the Company's Current Report on Form 8-K filed on April 21, 2014.
|
||
|
4.73
|
Registration Rights Agreement, dated April 21, 2014, among NRG Energy, Inc., the guarantors named therein and Citigroup Global Markets Inc., Merrill Lynch, Pierce, Fenner & Smith Incorporated, Credit Suisse Securities (USA), Inc., J.P. Morgan Securities LLC, Mitsubishi UFJ Securities (USA), Inc., SMBC Nikko Securities America, Inc. and RBS Securities Inc.
|
Incorporated herein by reference to Exhibit 4.3 to the Company's Current Report on Form 8-K filed on April 21, 2014.
|
||
|
4.74
|
One Hundred-Eleventh Supplemental Indenture, dated as of April 28, 2014, among NRG Energy, Inc., the guarantors named therein and Law Debenture Trust Company of New York as trustee, re: NRG Energy, Inc.'s 8.5% Senior Notes due 2019, 8.25% Senior Notes due 2020, 7.625% Senior Notes due 2018, 7.625% Senior Notes due 2019, 7.875% Senior Notes due 2021, 6.625% Senior Notes due 2023 and 6.25% Senior Notes due 2022.
|
Incorporated herein by reference to Exhibit 4.1 to the Company's Current Report on Form 8-K filed on May 2, 2014.
|
||
|
4.75
|
First Supplemental Indenture, dated as of May 2, 2014, among NRG Energy, Inc., the guarantors named therein and Law Debenture Trust Company of New York as trustee, re: NRG Energy, Inc.'s 6.25% Senior Notes due 2024.
|
Incorporated herein by reference to Exhibit 4.2 to the Company's Current Report on Form 8-K filed on May 2, 2014.
|
||
|
4.76
|
One Hundred-Twelfth Supplemental Indenture, dated as of October 3, 2014, among NRG Energy, Inc., the guarantors named therein and Law Debenture Trust Company of New York.
|
Incorporated herein by reference to Exhibit 4.1 to the Company's Current Report on Form 8-K filed on October 3, 2014.
|
||
|
4.77
|
Second Supplemental Indenture, dated as of October 3, 2014, among NRG Energy, Inc., the guarantors named therein and Law Debenture Trust Company of New York
as trustee, re: NRG Energy, Inc.'s 6.25% Senior Notes due 2024.
|
Incorporated herein by reference to Exhibit 4.2 to the Company's Current Report on Form 8-K filed on October 3, 2014.
|
||
|
4.78
|
One Hundred-Thirteenth Supplemental Indenture, dated as of November 12, 2014, among NRG Energy, Inc., the guarantors named therein and Law Debenture Trust Company of New York as trustee, re: NRG Energy, Inc.'s 8.25% Senior Notes due 2020, 7.625% Senior Notes due 2018, 7.875% Senior Notes due 2021, 6.625% Senior Notes due 2023 and 6.25% Senior Notes due 2022.
|
Incorporated herein by reference to Exhibit 4.1 to the Company's Current Report on Form 8-K filed on November 14, 2014.
|
||
|
4.79
|
Third Supplemental Indenture, dated as of November 12, 2014, among NRG Energy, Inc., the guarantors named therein and Law Debenture Trust Company of New York.
|
Incorporated herein by reference to Exhibit 4.2 to the Company's Current Report on Form 8-K filed on November 14, 2014.
|
||
|
4.80
|
One Hundred-Fourteenth Supplemental Indenture, dated as of November 24, 2014, among NRG Energy, Inc., the guarantors named therein and Law Debenture Trust Company of New York, as trustee, re: NRG Energy, Inc.'s 8.25% Senior Notes due 2020, 7.625% Senior Notes due 2018, 7.875% Senior Notes due 2021, 6.625% Senior Notes due 2023 and 6.25% Senior Notes due 2022.
|
Incorporated herein by reference to Exhibit 4.1 to the Registrant's current report on Form 8-K filed on November 25, 2014.
|
||
|
4.81
|
Fourth Supplemental Indenture, dated as of November 24, 2014, among NRG Energy, Inc., the guarantors named therein and Law Debenture Trust Company of New York, as trustee, re: NRG Energy, Inc.'s 6.25% Senior Notes due 2024.
|
Incorporated herein by reference to Exhibit 4.2 to the Registrant's current report on Form 8-K filed on November 25, 2014.
|
||
|
4.82
|
One Hundred-Fifteenth Supplemental Indenture, dated as of April 8, 2015, among NRG Energy, Inc., the guarantors named therein and Law Debenture Trust Company of New York.
|
Incorporated herein by reference to Exhibit 4.1 to the Company's current report on Form 8-K filed on April 9, 2015.
|
||
243
|
4.83
|
Fifth Supplemental Indenture, dated as of April 8, 2015, among NRG Energy, Inc., the guarantors named therein and Law Debenture Trust Company of New York.
|
Incorporated herein by reference to Exhibit 4.2 to the Company's current report on Form 8-K filed on April 9, 2015.
|
||
|
4.84
|
One Hundred-Sixteenth Supplemental Indenture, dated as of April 29, 2015, among NRG Energy, Inc., the guarantors named therein and Law Debenture Trust Company of New York.
|
Incorporated herein by reference to Exhibit 4.1 to the Company's current report on Form 8-K filed on April 30, 2015.
|
||
|
4.85
|
Sixth Supplemental Indenture, dated as of April 29, 2015, among NRG Energy, Inc., the guarantors named therein and Law Debenture Trust Company of New York.
|
Incorporated herein by reference to Exhibit 4.2 to the Company's current report on Form 8-K filed on April 30, 2015.
|
||
|
4.86
|
One Hundred-Seventeenth Supplemental Indenture, dated as of May 22, 2015, among NRG Energy, Inc., the guarantors named therein and Law Debenture Trust Company of New York.
|
Incorporated herein by reference to Exhibit 4.1 to the Company's current report on Form 8-K filed on May 22, 2015.
|
||
|
4.87
|
Seventh Supplemental Indenture, dated as of May 22, 2015, among NRG Energy, Inc., the guarantors named therein and Law Debenture Trust Company of New York.
|
Incorporated herein by reference to Exhibit 4.2 to the Company's current report on Form 8-K filed on May 22, 2015.
|
||
|
4.88
|
One Hundred-Eighteenth Supplemental Indenture, dated as of October 28, 2015, among NRG Energy, Inc., the guarantors named therein and Law Debenture Trust Company of New York.
|
Incorporated herein by reference to Exhibit 4.1 to the Company's current report on Form 8-K filed on November 2, 2015.
|
||
|
4.89
|
Eighth Supplemental Indenture, dated as of October 28, 2015, among NRG Energy, Inc., the guarantors named therein and Law Debenture Trust Company of New York.
|
Incorporated herein by reference to Exhibit 4.2 to the Company's current report on Form 8-K filed on November 2, 2015.
|
||
|
4.90
|
Indenture, dated May 23, 2016, between NRG Energy, Inc. and Law Debenture Trust Company of New York.
|
Incorporated herein by reference to Exhibit 4.1 to the Registrant's Current Report on Form 8-K, filed on May 23, 2016.
|
||
|
4.91
|
Supplemental Indenture, dated May 23, 2016, among NRG Energy, Inc., the guarantors named therein and Law Debenture Trust Company of New York.
|
Incorporated herein by reference to Exhibit 4.2 to the Registrant's Current Report on Form 8-K, filed on May 23, 2016.
|
||
|
4.92
|
Form of 7.250% Senior Note due 2026.
|
Incorporated herein by reference to Exhibit 4.3 to the Registrant's Current Report on Form 8-K, filed on May 23, 2016.
|
||
|
4.93
|
Registration Rights Agreement, dated May 23, 2016, among NRG Energy, Inc., the guarantors named therein and Deutsche Bank Securities Inc., as representative to the initial purchasers listed in Schedule I thereto.
|
Incorporated herein by reference to Exhibit 4.4 to the Registrant's Current Report on Form 8-K, filed on May 23, 2016.
|
||
|
4.94
|
One Hundred-Nineteenth Supplemental Indenture, dated as of July 19, 2016, among NRG Energy, Inc., the guarantors named therein and Law Debenture Trust Company of New York.
|
Incorporated herein by reference to Exhibit 4.1 to the Registrant's Current Report on Form 8-K, filed on July 25, 2016.
|
||
|
4.95
|
Ninth Supplemental Indenture, dated as of July 19, 2016, among NRG Energy, Inc., the guarantors named therein and Law Debenture Trust Company of New York.
|
Incorporated herein by reference to Exhibit 4.2 to the Registrant's Current Report on Form 8-K, filed on July 25, 2016.
|
||
|
4.96
|
Second Supplemental Indenture, dated as of July 19, 2016, among NRG Energy, Inc., the guarantors named therein and Law Debenture Trust Company of New York.
|
Incorporated herein by reference to Exhibit 4.3 to the Registrant's Current Report on Form 8-K, filed on July 25, 2016.
|
||
|
4.97
|
Third Supplemental Indenture, dated August 2, 2016, among NRG Energy, Inc., the guarantors named therein and Law Debenture Trust Company of New York.
|
Incorporated herein by reference to Exhibit 4.2 to the Registrant's Current Report on Form 8-K, filed on August 3, 2016.
|
||
|
4.98
|
Form of 6.625% Senior Note due 2027.
|
Incorporated herein by reference to Exhibit 4.3 to the Registrant's Current Report on Form 8-K, filed on August 3, 2016.
|
||
|
4.99
|
Registration Rights Agreement, dated August 2, 2016, among NRG Energy, Inc., the guarantors named therein and Morgan Stanley & Co. LLC, as representative to the initial purchasers listed in Schedule I thereto.
|
Incorporated herein by reference to Exhibit 4.4 to the Registrant's Current Report on Form 8-K, filed on August 3, 2016.
|
||
|
10.1
|
Note Agreement, dated August 20, 1993, between NRG Energy, Inc., Energy Center, Inc. and each of the purchasers named therein.
|
Incorporated herein by reference to Exhibit 10.5 to the Registrant's Registration Statement on Form S-1, as amended, Registration No. 333-33397.
|
||
244
|
10.2
|
Master Shelf and Revolving Credit Agreement, dated August 20, 1993, between NRG Energy, Inc., Energy Center, Inc., The Prudential Insurance Registrants of America and each Prudential Affiliate, which becomes party thereto.
|
Incorporated herein by reference to Exhibit 10.4 to the Registrant's Registration Statement on Form S-1, as amended, Registration No. 333-33397.
|
||
|
10.3*
|
Form of NRG Energy Inc. Long-Term Incentive Plan Deferred Stock Unit Agreement for Officers and Key Management.
|
Incorporated herein by reference to Exhibit 10.14 to the Registrant's annual report on Form 10-K filed on March 30, 2005.
|
||
|
10.4*
|
Form of NRG Energy, Inc. Long-Term Incentive Plan Deferred Stock Unit Agreement for Directors.
|
Incorporated herein by reference to Exhibit 10.15 to the Registrant's annual report on Form 10-K filed on March 30, 2005.
|
||
|
10.5*
|
Form of NRG Energy, Inc. Long-Term Incentive Plan Non-Qualified Stock Option Agreement.
|
Incorporated herein by reference to Exhibit 10.1 to the Registrant's quarterly report on Form 10-Q filed on November 9, 2004.
|
||
|
10.6*
|
Form of NRG Energy, Inc. Long-Term Incentive Plan Restricted Stock Unit Agreement.
|
Incorporated herein by reference to Exhibit 10.2 to the Registrant's quarterly report on Form 10-Q filed on November 9, 2004.
|
||
|
10.7*
|
Form of NRG Energy, Inc. Long-Term Incentive Plan Performance Stock Unit Agreement.
|
Incorporated herein by reference to Exhibit 10.7 to the Registrant's annual report on Form 10-K filed on February 23, 2010.
|
||
|
10.8*
|
Second Amended and Restated Annual Incentive Plan for Designated Corporate Officers.
|
Incorporated herein by reference to Exhibit 10.1 to the Registrant's current report on Form 8-K filed on May 7, 2015.
|
||
|
10.9
|
Railroad Car Full Service Master Leasing Agreement, dated as of February 18, 2005, between General Electric Railcar Services Corporation and NRG Power Marketing Inc.
|
Incorporated herein by reference to Exhibit 10.28 to the Registrant's annual report on Form 10-K filed on March 30, 2005.
|
||
|
10.10
|
Purchase Agreement (West Coast Power) dated as of December 27, 2005, by and among NRG Energy, Inc., NRG West Coast LLC (Buyer), DPC II Inc. (Seller) and Dynegy, Inc.
|
Incorporated herein by reference to Exhibit 10.1 to the Registrant's current report on Form 8-K filed on December 28, 2005.
|
||
|
10.11
|
Purchase Agreement (Rocky Road Power), dated as of December 27, 2005, by and among Termo Santander Holding, L.L.C.(Buyer), Dynegy, Inc., NRG Rocky Road LLC (Seller) and NRG Energy, Inc.
|
Incorporated herein by reference to Exhibit 10.2 to the Registrant's current report on Form 8-K filed on December 28, 2005.
|
||
|
10.12
|
Stock Purchase Agreement, dated as of August 10, 2005, by and between NRG Energy, Inc. and Credit Suisse First Boston Capital LLC.
|
Incorporated herein by reference to Exhibit 10.1 to the Registrant's current report on Form 8-K filed on August 11, 2005.
|
||
|
10.13
|
Agreement with respect to the Stock Purchase Agreement, dated December 19, 2008, by and between NRG Energy, Inc. and Credit Suisse First Boston Capital LLC.
|
Incorporated herein by reference to Exhibit 10.13 to the Registrant's annual report on Form 10-K filed on February 12, 2009.
|
||
|
10.14
|
Investor Rights Agreement, dated as of February 2, 2006, by and among NRG Energy, Inc. and Certain Stockholders of NRG Energy, Inc. set forth therein.
|
Incorporated herein by reference to Exhibit 10.1 to the Registrant's current report on Form 8-K filed on February 8, 2006.
|
||
|
10.15†
|
Terms and Conditions of Sale, dated as of October 5, 2005, between Texas Genco II LP and Freight Car America, Inc., (including the Proposal Letter and Amendment thereto).
|
Incorporated herein by reference to Exhibit 10.32 to the Registrant's annual report on Form 10-K filed on March 7, 2006.
|
||
|
10.16*
|
Amended and Restated Employment Agreement, dated December 4, 2008, between NRG Energy, Inc. and David Crane.
|
Incorporated herein by reference to Exhibit 10.16 to the Registrant's annual report on Form 10-K filed on February 12, 2009.
|
||
|
10.17*
|
Amendment 2014-1 to the Amended and Restated Employment Agreement between NRG Energy, Inc. and David Crane, dated December 4, 2014.
|
Incorporated herein by reference to Exhibit 10.1 to the Registrant's current report on Form 8-K filed on December 10, 2014.
|
||
|
10.18*
|
General Release, dated January 4, 2016, between NRG Energy, Inc. and David Crane.
|
Incorporated herein by reference to Exhibit 10.2 to the Registrant's current report on Form 8-K/A filed on January 8, 2016.
|
||
|
10.19
|
Limited Liability Company Agreement of NRG Common Stock Finance I LLC.
|
Incorporated herein by reference to Exhibit 10.1 to the Registrant's current report on Form 8-K filed on August 10, 2006.
|
||
|
10.20
|
Note Purchase Agreement, dated August 4, 2006, between NRG Common Stock Finance I LLC, Credit Suisse International and Credit Suisse Securities (USA) LLC.
|
Incorporated herein by reference to Exhibit 10.3 to the Registrant's current report on Form 8-K filed on August 10, 2006.
|
||
|
10.21
|
Amendment Agreement, dated February 27, 2008, to the Note Purchase Agreement by and among NRG Common Stock Finance I LLC, Credit Suisse International, and Credit Suisse Securities (USA) LLC.
|
Incorporated herein by reference to Exhibit 10.5 to the Registrant's quarterly report on Form 10-Q filed on May 1, 2008.
|
||
|
10.22
|
Amendment Agreement, dated December 19, 2008, to the Note Purchase Agreement by and among NRG Common Stock Finance I LLC, Credit Suisse International, and Credit Suisse Securities (USA) LLC.
|
Incorporated herein by reference to Exhibit 10.23 to the Registrant's annual report on Form 10-K filed on February 12, 2009.
|
||
245
|
10.23
|
Amendment Agreement, dated December 19, 2008, to the Note Purchase Agreement by and among NRG Common Stock Finance II LLC, Credit Suisse International, and Credit Suisse Securities (USA) LLC.
|
Incorporated herein by reference to Exhibit 10.26 to the Registrant's annual report on Form 10-K filed on February 12, 2009.
|
||
|
10.24
|
Agreement with respect to Note Purchase Agreement, dated December 19, 2008, by and among NRG Common Stock Finance I LLC, NRG Energy, Inc., Credit Suisse International, and Credit Suisse Securities (USA) LLC.
|
Incorporated herein by reference to Exhibit 10.24 to the Registrant's annual report on Form 10-K filed on February 12, 2009.
|
||
|
10.25
|
Agreement with respect to Note Purchase Agreement, dated December 19, 2008, by and among NRG Common Stock Finance II LLC, NRG Energy, Inc., Credit Suisse International, and Credit Suisse Securities (USA) LLC.
|
Incorporated herein by reference to Exhibit 10.27 to the Registrant's annual report on Form 10-K filed on February 12, 2009.
|
||
|
10.26
|
Preferred Interest Purchase Agreement, dated August 4, 2006, between NRG Common Stock Finance I LLC, Credit Suisse Capital LLC and Credit Suisse Securities (USA) LLC, as agent.
|
Incorporated herein by reference to Exhibit 10.5 to the Registrant's current report on Form 8-K filed on August 10, 2006.
|
||
|
10.27
|
Preferred Interest Amendment Agreement, dated February 27, 2008, by and among NRG Common Stock Finance I LLC, Credit Suisse Capital LLC, and Credit Suisse Securities (USA) LLC.
|
Incorporated herein by reference to Exhibit 10.6 to the Registrant's quarterly report on Form 10-Q filed on May 1, 2008.
|
||
|
10.28
|
Preferred Interest Amendment Agreement, dated December 19, 2008, by and among NRG Common Stock Finance I LLC, Credit Suisse International, and Credit Suisse Securities (USA) LLC.
|
Incorporated herein by reference to Exhibit 10.31 to the Registrant's annual report on Form 10-K filed on February 12, 2009.
|
||
|
10.29
|
Preferred Interest Amendment Agreement, dated December 19, 2008, by and among NRG Common Stock Finance II LLC, Credit Suisse Capital LLC, and Credit Suisse Securities (USA) LLC.
|
Incorporated herein by reference to Exhibit 10.34 to the Registrant's annual report on Form 10-K filed on February 12, 2009.
|
||
|
10.30
|
Agreement with respect to Preferred Interest Purchase Agreement, dated December 19, 2008, by and among NRG Common Stock Finance I LLC, NRG Energy, Inc., Credit Suisse Capital LLC, and Credit Suisse Securities (USA) LLC.
|
Incorporated herein by reference to Exhibit 10.32 to the Registrant's annual report on Form 10-K filed on February 12, 2009.
|
||
|
10.31
|
Agreement with respect to Preferred Interest Purchase Agreement, dated December 19, 2008, by and among NRG Common Stock Finance II LLC, NRG Energy, Inc., Credit Suisse Capital LLC, and Credit Suisse Securities (USA) LLC.
|
Incorporated herein by reference to Exhibit 10.35 to the Registrant's annual report on Form 10-K filed on February 12, 2009.
|
||
|
10.32*
|
NRG Energy, Inc. Executive Change-in-Control and General Severance Agreement, dated December 9, 2008.
|
Incorporated herein by reference to Exhibit 10.40 to the Registrant's annual report on Form 10-K filed on February 12, 2009.
|
||
|
10.33†
|
Amended and Restated Contribution Agreement (NRG), dated March 25, 2008, by and among Texas Genco Holdings, Inc., NRG South Texas LP and NRG Nuclear Development Company LLC and Certain Subsidiaries Thereof.
|
Incorporated herein by reference to Exhibit 10.1 to the Registrant's quarterly report on Form 10-Q filed on May 1, 2008.
|
||
|
10.34†
|
Contribution Agreement (Toshiba), dated February 29, 2008, by and between Toshiba Corporation and NRG Nuclear Development Company LLC.
|
Incorporated herein by reference to Exhibit 10.2 to the Registrant's quarterly report on Form 10-Q filed on May 1, 2008.
|
||
|
10.35†
|
Multi-Unit Agreement, dated February 29, 2008, by and among Toshiba Corporation, NRG Nuclear Development Company LLC and NRG Energy, Inc.
|
Incorporated herein by reference to Exhibit 10.3 to the Registrant's quarterly report on Form 10-Q filed on May 1, 2008.
|
||
|
10.36†
|
Amended and Restated Operating Agreement of Nuclear Innovation North America LLC, dated May 1, 2008.
|
Incorporated herein by reference to Exhibit 10.4 to the Registrant's quarterly report on Form 10-Q filed on May 1, 2008.
|
||
|
10.37†
|
LLC Membership Interest Purchase Agreement between Reliant Energy, Inc. and NRG Retail LLC, dated as of February 28, 2009.
|
Incorporated herein by reference to Exhibit 10.1 to the Registrant's quarterly report on Form 10-Q filed on April 30, 2009.
|
||
|
10.38
|
Project Agreement, Settlement Agreement and Mutual Release, dated March 1, 2010, by and among by and among Nuclear Innovation North America LLC, the City of San Antonio acting by and through the City Public Service Board of San Antonio, a Texas municipal utility, NINA Texas 3 LLC and NINA Texas 4 LLC, and solely for purposes of certain sections of the Settlement Agreement, by NRG Energy, Inc and NRG South Texas LP.
|
Incorporated herein by reference to Exhibit 10.1 to the Registrant's current report on Form 8-K filed on March 2, 2010.
|
||
|
10.39†
|
STP 3 & 4 Owners Agreement, dated March 1, 2010, by and among Nuclear Innovation North America LLC, the City of San Antonio, NINA Texas 3 LLC and NINA Texas 4 LLC.
|
Incorporated herein by reference to Exhibit 10.2 to the Registrant's current report on Form 8-K filed on March 2, 2010.
|
||
|
10.40*
|
Amended and Restated 2009 Executive Change-in-Control and General Severance Plan.
|
Incorporated herein by reference to Exhibit 10.3 to the Registrant's quarterly report on Form 10-Q filed on August 9, 2016.
|
||
246
|
10.41†
|
Investment and Option Agreement by and among NINA Investments Holdings LLC, Nuclear Innovation North America LLC and TEPCO Nuclear Energy America LLC, dated as of May 10, 2010.
|
Incorporated herein by reference to Exhibit 10.3 to the Registrant's quarterly report on Form 10-Q filed on August 2, 2010.
|
||
|
10.42†
|
Parent Company Agreement by and among NRG Energy, Inc., Nuclear Innovation North America LLC, The Tokyo Electric Power Company and TEPCO Nuclear Energy America LLC, dated as of May 10, 2010.
|
Incorporated herein by reference to Exhibit 10.4 to the Registrant's quarterly report on Form 10-Q filed on August 2, 2010.
|
||
|
10.43(a)
|
Letter of Credit and Reimbursement Agreement, dated as of June 30, 2010, by and among NRG LC Facility Company LLC, NRG Energy, Inc. and Citibank, N.A.
|
Incorporated herein by reference to Exhibit 10.2(a) the Registrant's current report on Form 8-K filed on July 1, 2010.
|
||
|
10.43(b)
|
Letter of Credit and Reimbursement Agreement, dated as of June 30, 2010, by and among NRG LC Facility Company LLC, NRG Energy, Inc. and Deutsche Bank AG, New York Bank.
|
Incorporated herein by reference to Exhibit 10.2(b) to the Registrant's current report on Form 8-K filed on July 1, 2010.
|
||
|
10.44*
|
The NRG Energy, Inc. Amended and Restated Long-Term Incentive Plan.
|
Incorporated herein by reference to Exhibit 10.1 to the Registrant's current report on Form 8-K filed on August 3, 2010.
|
||
|
10.45
|
Amended and Restated Credit Agreement, dated July 1, 2011, by and among NRG Energy, Inc., the lenders party thereto, the joint lead bookrunners and joint lead arrangers party thereto, Citicorp North America, Inc., Morgan Stanley Senior Funding, Inc. and the documentation agents party thereto.
|
Incorporated herein by reference to Exhibit 10.1 to the Registrant's current report on Form 8-K filed on July 5, 2011.
|
||
|
10.46*
|
Form of Market Stock Unit Grant Agreement.
|
Incorporated herein by reference to Exhibit 10.1 to the Registrant's current report on Form 8-K/A filed on September 12, 2011.
|
||
|
10.47
|
Registration Rights Agreement, dated September 24, 2012, among NRG Energy, Inc., the guarantors named therein and Deutsche Bank Securities Inc., Merrill, Lynch, Pierce, Fenner & Smith Incorporated, Barclays Capital Inc., Citigroup Global Markets Inc., Credit Suisse Securities (USA) LLC, Goldman, Sachs & Co., J.P. Morgan Securities LLC, Morgan Stanley & Co. LLC and RBS Securities Inc., as initial purchasers.
|
Incorporated herein by reference to Exhibit 10.1 to the Registrant's current report on Form 8-K filed on September 24, 2012.
|
||
|
10.48*
|
NRG 2010 Stock Plan for GenOn Employees.
|
Incorporated herein by reference to Exhibit 10.49 to the Registrant’s annual report on Form 10-K filed on February 27, 2013.
|
||
|
10.49
|
Revolving Credit Agreement among GenOn Energy, Inc., as Borrower, GenOn Americas, Inc., as Borrower, the several lenders from time to time parties thereto, and NRG Energy, Inc., as Administrative Agent, dated as of December 14, 2012.
|
Incorporated herein by reference to Exhibit 10.50 to the Registrant’s annual report on Form 10-K filed on February 27, 2013.
|
||
|
10.50
|
First Amendment Agreement, dated as of February 6, 2013, to the Amended and Restated Credit Agreement and the Second Amended and Restated Collateral Trust Agreement.
|
Incorporated herein by reference to Exhibit 10.1 to the Registrant’s quarterly report on Form 10-Q filed on May 7, 2013.
|
||
|
10.51
|
Second Amendment Agreement, dated as of June 4, 2013, to the Amended and Restated Credit Agreement, the Second Amended and Restated Collateral Trust Agreement and the Amended and Restated Guarantee and Collateral Agreement.
|
Incorporated herein by reference to Exhibit 10.1 to the Registrant’s current report on Form 8-K filed on June 10, 2013.
|
||
|
10.52*
|
NRG Energy, Inc. Long-Term Incentive Plan Market Stock Unit Agreement.
|
Incorporated herein by reference to Exhibit 10.53 to the Registrant's annual report on Form 10-K filed on February 28, 2014.
|
||
|
10.53*
|
NRG Energy, Inc. 2010 Stock Plan For GenOn Employees Market Stock Unit Agreement
|
Incorporated herein by reference to Exhibit 10.54 to the Registrant's annual report on Form 10-K filed on February 28, 2014.
|
||
|
10.54*
|
Amended and Restated Employee Stock Purchase Plan.
|
Incorporated herein by reference to Exhibit 10.1 to the Registrant's quarterly report on Form 10-Q filed on August 7, 2014.
|
||
|
10.55
|
Amendment Agreement, dated as of December 23, 2014, by and between NRG Energy, Inc. and Credit Suisse First Boston Capital LLC.
|
Incorporated herein by reference to Exhibit 10.1 to the Registrant's current report on Form 8-K filed on December 30, 2014.
|
||
|
10.56
|
Employment Agreement, dated December 21, 2015, by and between NRG Energy, Inc. and Mauricio Gutierrez.
|
Incorporated herein by reference to Exhibit 10.1 to the Registrant's current report on Form 8-K filed on December 24, 2015.
|
||
|
10.57
|
Amendment and Restatement Agreement, dated as of June 30, 2016, to the Amended and Restated Credit Agreement, the Second Amended and Restated Collateral Trust Agreement and the Amended and Restated Guarantee and Collateral Agreement.
|
Incorporated herein by reference to Exhibit 10.1 to the Registrant's quarterly report on Form 10-Q filed on August 9, 2016.
|
||
247
|
10.58
|
Second Amended and Restated Credit Agreement, dated as of June 30, 2016, by and among NRG Energy, Inc., the lenders party thereto, the joint lead arrangers and joint lead bookrunners party thereto, Citicorp North America, Inc., Commerzbank AG, New York Branch, Keybank Capital Markets Inc. and CIT Bank, N.A.
|
Incorporated herein by reference to Exhibit 10.2 to the Registrant's quarterly report on Form 10-Q filed on August 9, 2016.
|
||
|
10.59
|
First Amendment Agreement, dated as of January 24, 2017, dated as of January 24, 2017, by and among NRG Energy, Inc., the lenders from time to time parties thereto and Citicorp North America, Inc., as administrative agent and collateral agent.
|
Incorporated herein by reference to Exhibit 10.1 to the Registrant's Current Report on Form 8-K filed on January 24, 2017.
|
||
|
10.60
|
Cooperation Agreement, dated as of February 13, 2017, by and among NRG Energy, Inc., Elliott Associates, L.P., Elliott International, L.P. and Elliott International Capital Advisors Inc.
|
Incorporated herein by reference to Exhibit 10.1 to the Registrant's Current Report on Form 8-K filed on February 13, 2017.
|
||
|
10.61
|
Cooperation Agreement, dated as of February 13, 2017, by and among NRG Energy, Inc., Bluescape Energy Partners LLC and BEP Special Situations 2 LLC.
|
Incorporated herein by reference to Exhibit 10.2 to the Registrant's Current Report on Form 8-K filed on February 13, 2017.
|
||
|
12.1
|
NRG Energy, Inc. Computation of Ratio of Earnings to Fixed Charges.
|
Filed herewith.
|
||
|
12.2
|
NRG Energy, Inc. Computation of Ratio of Earnings to Fixed Charges and Preferred Stock Dividend Requirements.
|
Filed herewith.
|
||
|
21.1
|
Subsidiaries of NRG Energy, Inc.
|
Filed herewith.
|
||
|
23.1
|
Consent of KPMG LLP.
|
Filed herewith.
|
||
|
31.1
|
Rule 13a-14(a)/15d-14(a) certification of Mauricio Gutierrez
|
Filed herewith.
|
||
|
31.2
|
Rule 13a-14(a)/15d-14(a) certification of Kirkland B. Andrews.
|
Filed herewith.
|
||
|
31.3
|
Rule 13a-14(a)/15d-14(a) certification of David Callen.
|
Filed herewith.
|
||
|
32
|
Section 1350 Certification.
|
Furnished herewith.
|
||
|
99.1
|
Services Agreement between NRG Energy, Inc. and GenOn Energy, Inc., dated December 20, 2012.
|
Incorporated herein by reference to Exhibit 99.1 to the Registrant's current report on Form 8-K filed on December 13, 2016.
|
||
|
101 INS
|
XBRL Instance Document.
|
Filed herewith.
|
||
|
101 SCH
|
XBRL Taxonomy Extension Schema.
|
Filed herewith.
|
||
|
101 CAL
|
XBRL Taxonomy Extension Calculation Linkbase.
|
Filed herewith.
|
||
|
101 DEF
|
XBRL Taxonomy Extension Definition Linkbase.
|
Filed herewith.
|
||
|
101 LAB
|
XBRL Taxonomy Extension Label Linkbase.
|
Filed herewith.
|
||
|
101 PRE
|
XBRL Taxonomy Extension Presentation Linkbase.
|
Filed herewith.
|
||
|
*
|
Exhibit relates to compensation arrangements.
|
|
|
†
|
Portions of this exhibit have been redacted and are subject to a confidential treatment request filed with the Secretary of the Securities and Exchange Commission pursuant to Rule 24b-2 under the Securities Exchange Act of 1934, as amended.
|
|
None.
248
SIGNATURES
Pursuant to the requirements of Section 13 or 15(d) of the Securities Exchange Act of 1934, the registrant has duly caused this report to be signed on its behalf by the undersigned thereunto duly authorized.
|
|
NRG ENERGY, INC.
(Registrant)
|
||
|
|
By:
|
/s/ MAURICIO GUTIERREZ
|
|
|
|
|
Mauricio Gutierrez
Chief Executive Officer
|
|
Date:
February 28, 2017
249
POWER OF ATTORNEY
Each person whose signature appears below constitutes and appoints David R. Hill and Brian E. Curci, each or any of them, such person's true and lawful attorney-in-fact and agent with full power of substitution and resubstitution for such person and in such person's name, place and stead, in any and all capacities, to sign any and all amendments to this report on Form 10-K, and to file the same with all exhibits thereto, and other documents in connection therewith, with the Securities and Exchange Commission, granting unto said attorneys-in-fact and agents, and each of them, full power and authority to do and perform each and every act and thing necessary or desirable to be done in and about the premises, as fully to all intents and purposes as such person, hereby ratifying and confirming all that said attorneys-in-fact and agents, or any of them or his or their substitute or substitutes, may lawfully do or cause to be done by virtue hereof.
In accordance with the Exchange Act, this report has been signed by the following persons on behalf of the registrant in the capacities indicated on
February 28, 2017
.
|
Signature
|
Title
|
Date
|
||
|
/s/ MAURICIO GUTIERREZ
|
President, Chief Executive Officer and
|
February 28, 2017
|
||
|
Mauricio Gutierrez
|
Director (Principal Executive Officer)
|
|||
|
/s/ KIRKLAND B. ANDREWS
|
Chief Financial Officer
|
February 28, 2017
|
||
|
Kirkland B. Andrews
|
(Principal Financial Officer)
|
|||
|
/s/ DAVID CALLEN
|
Chief Accounting Officer
|
February 28, 2017
|
||
|
David Callen
|
(Principal Accounting Officer)
|
|||
|
/s/ LAWRENCE S. COBEN
|
Chairman of the Board
|
February 28, 2017
|
||
|
Lawrence S. Coben
|
||||
|
/s/ E. SPENCER ABRAHAM
|
Director
|
February 28, 2017
|
||
|
E. Spencer Abraham
|
||||
|
/s/ KIRBYJON H. CALDWELL
|
Director
|
February 28, 2017
|
||
|
Kirbyjon H. Caldwell
|
||||
|
/s/ TERRY G. DALLAS
|
Director
|
February 28, 2017
|
||
|
Terry G. Dallas
|
||||
|
/s/ WILLIAM E. HANTKE
|
Director
|
February 28, 2017
|
||
|
William E. Hantke
|
||||
|
/s/ PAUL W. HOBBY
|
Director
|
February 28, 2017
|
||
|
Paul W. Hobby
|
||||
|
/s/ ANNE C. SCHAUMBURG
|
Director
|
February 28, 2017
|
||
|
Anne C. Schaumburg
|
||||
|
/s/ EVAN J. SILVERSTEIN
|
Director
|
February 28, 2017
|
||
|
Evan J. Silverstein
|
||||
|
/s/ BARRY T. SMITHERMAN
|
Director
|
February 28, 2017
|
||
|
Barry T. Smitherman
|
||||
|
/s/ THOMAS H. WEIDEMEYER
|
Director
|
February 28, 2017
|
||
|
Thomas H. Weidemeyer
|
||||
|
/s/ C. JOHN WILDER
|
Director
|
February 28, 2017
|
||
|
C. John Wilder
|
||||
|
/s/ WALTER R. YOUNG
|
Director
|
February 28, 2017
|
||
|
Walter R. Young
|
||||
250
TABLE OF CONTENTS
Part IItem 1 BusinessItem 1A Risk Factors Related To Nrg Energy, IncItem 1B Unresolved Staff CommentsItem 2 PropertiesItem 3 Legal ProceedingsItem 4 Mine Safety DisclosuresPart IIItem 5 Market For Registrant's Common Equity, Related Stockholder Matters and Issuer Purchases Of Equity SecuritiesItem 6 Selected Financial DataItem 7 Management's Discussion and Analysis Of Financial Condition and Results Of OperationsItem 7A Quantitative and Qualitative Disclosures About Market RiskItem 8 Financial Statements and Supplementary DataItem 9 Changes in and Disagreements with Accountants on Accounting and Financial DisclosureItem 9A Controls and ProceduresItem 9B Other InformationPart IIIItem 10 Directors, Executive Officers and Corporate GovernanceItem 11 Executive CompensationItem 12 Security Ownership Of Certain Beneficial Owners and Management and Related Stockholder MattersItem 13 Certain Relationships and Related Transactions, and Director IndependenceItem 14 Principal Accounting Fees and ServicesPart IVItem 15 Exhibits, Financial Statement SchedulesNote 1 Nature Of BusinessNote 2 Summary Of Significant Accounting PoliciesNote 3 Business Acquisitions and DispositionsNote 4 Fair Value Of Financial InstrumentsNote 5 Accounting For Derivative Instruments and Hedging ActivitiesNote 6 Nuclear Decommissioning Trust FundNote 7 InventoryNote 8 Notes ReceivableNote 9 Property, Plant and EquipmentNote 10 Asset ImpairmentsNote 11 Goodwill and Other IntangiblesNote 12 Debt and Capital LeasesNote 13 Asset Retirement ObligationsNote 14 Benefit Plans and Other Postretirement BenefitsNote 15 Capital StructureNote 16 Investments Accounted For By The Equity Method and Variable Interest EntitiesNote 17 Earnings/(loss) Per ShareNote 18 Segment ReportingNote 19 Income TaxesNote 20 Stock-based CompensationNote 21 Related Party TransactionsNote 22 Commitments and ContingenciesNote 23 Regulatory MattersNote 24 Environmental MattersNote 25 Cash Flow InformationNote 26 GuaranteesNote 27 Jointly Owned PlantsNote 28 Unaudited Quarterly Financial DataNote 29 Condensed Consolidating Financial InformationItem 16. Form 10-k Summary