NRG ENERGY, INC.
10-Ks and 10-Qs
|
|
|
|
|
|
|
|
|
|
|
|
|
|
|
|
|
|
|
|
|
|
|
|
|
|
|
|
|
|
|
|
|
|
|
|
|
|
|
|
|
|
|
|
|
|
|
|
|
|
|
|
|
|
|
|
UNITED STATES SECURITIES AND EXCHANGE COMMISSION
Washington, D.C. 20549
FORM 10-Q
|
x
|
|
Quarterly report pursuant to Section 13 or 15(d) of the Securities Exchange Act of 1934
|
|
For the Quarterly Period Ended: September 30, 2013
|
||
|
o
|
Transition report pursuant to Section 13 or 15(d) of the Securities Exchange Act of 1934
|
|
Commission File Number: 001-15891
NRG Energy, Inc.
(Exact name of registrant as specified in its charter)
|
Delaware
(State or other jurisdiction
of incorporation or organization)
|
41-1724239
(I.R.S. Employer
Identification No.)
|
|
|
|
|
|
|
211 Carnegie Center, Princeton, New Jersey
(Address of principal executive offices)
|
08540
(Zip Code)
|
|
(609) 524-4500
(Registrant’s telephone number, including area code)
Indicate by check mark whether the registrant (1) has filed all reports required to be filed by Section 13 or 15(d) of the Securities Exchange Act of 1934 during the preceding 12 months (or for such shorter period that the registrant was required to file such reports), and (2) has been subject to such filing requirements for the past 90 days.
Yes
x
No
o
Indicate by check mark whether the registrant has submitted electronically and posted on its corporate Web site, if any, every Interactive Data File required to be submitted and posted pursuant to Rule 405 of Regulation S-T (§232.405 of this chapter) during the preceding 12 months (or for such shorter period that the registrant was required to submit and post such files).
Yes
x
No
o
Indicate by check mark whether the registrant is a large accelerated filer, an accelerated filer, a non-accelerated filer, or a smaller reporting company. See the definitions of “large accelerated filer,” “accelerated filer,” and “smaller reporting company” in Rule 12b-2 of the Exchange Act.
|
Large accelerated filer
x
|
Accelerated filer
o
|
Non-accelerated filer
o
|
Smaller reporting company
o
|
|||
|
(Do not check if a smaller reporting company)
|
||||||
Indicate by check mark whether the registrant is a shell company (as defined in Rule 12b-2 of the Exchange Act).
Yes
o
No
x
As of
October 31, 2013
, there were
323,416,260
shares of common stock outstanding, par value $0.01 per share.
TABLE OF CONTENTS
Index
|
CAUTIONARY STATEMENT REGARDING FORWARD LOOKING INFORMATION
|
|
|
GLOSSARY OF TERMS
|
|
|
PART I — FINANCIAL INFORMATION
|
|
|
ITEM 1 — CONDENSED CONSOLIDATED FINANCIAL STATEMENTS AND NOTES
|
|
|
ITEM 2 — MANAGEMENT’S DISCUSSION AND ANALYSIS OF FINANCIAL CONDITION AND RESULTS OF OPERATIONS
|
|
|
ITEM 3 — QUANTITATIVE AND QUALITATIVE DISCLOSURES ABOUT MARKET RISK
|
|
|
ITEM 4 — CONTROLS AND PROCEDURES
|
|
|
PART II — OTHER INFORMATION
|
|
|
ITEM 1 — LEGAL PROCEEDINGS
|
|
|
ITEM 1A — RISK FACTORS
|
|
|
ITEM 2 — UNREGISTERED SALES OF EQUITY SECURITIES AND USE OF PROCEEDS
|
|
|
ITEM 3 — DEFAULTS UPON SENIOR SECURITIES
|
|
|
ITEM 4 — MINE SAFETY DISCLOSURES
|
|
|
ITEM 5 — OTHER INFORMATION
|
|
|
ITEM 6 — EXHIBITS
|
|
|
SIGNATURES
|
|
2
CAUTIONARY STATEMENT REGARDING FORWARD-LOOKING INFORMATION
This Quarterly Report on Form 10-Q of NRG Energy, Inc., or NRG or the Company, includes forward-looking statements within the meaning of Section 27A of the Securities Act of 1933, as amended, or Securities Act, and Section 21E of the Securities Exchange Act of 1934, as amended, or Exchange Act. The words "believes," "projects," "anticipates," "plans," "expects," "intends," "estimates" and similar expressions are intended to identify forward-looking statements. These forward-looking statements involve known and unknown risks, uncertainties and other factors that may cause NRG's actual results, performance and achievements, or industry results, to be materially different from any future results, performance or achievements expressed or implied by such forward-looking statements. These factors, risks and uncertainties include the factors described under Item 1A —
Risk Factors Related to NRG Energy, Inc.
, in Part I, Item 1A of the Company's Annual Report on Form 10-K for the year ended
December 31, 2012
, including, but not limited to, the following:
|
•
|
General economic conditions, changes in the wholesale power markets and fluctuations in the cost of fuel;
|
|
•
|
Volatile power supply costs and demand for power;
|
|
•
|
Hazards customary to the power production industry and power generation operations such as fuel and electricity price volatility, unusual weather conditions, catastrophic weather-related or other damage to facilities, unscheduled generation outages, maintenance or repairs, unanticipated changes to fuel supply costs or availability due to higher demand, shortages, transportation problems or other developments, environmental incidents, or electric transmission or gas pipeline system constraints and the possibility that NRG may not have adequate insurance to cover losses as a result of such hazards;
|
|
•
|
The effectiveness of NRG's risk management policies and procedures, and the ability of NRG's counterparties to satisfy their financial commitments;
|
|
•
|
Counterparties' collateral demands and other factors affecting NRG's liquidity position and financial condition;
|
|
•
|
NRG's ability to operate its businesses efficiently, manage capital expenditures and costs tightly, and generate earnings and cash flows from its asset-based businesses, including NRG Yield, in relation to its debt and other obligations;
|
|
•
|
NRG's ability to enter into contracts to sell power and procure fuel on acceptable terms and prices;
|
|
•
|
The liquidity and competitiveness of wholesale markets for energy commodities;
|
|
•
|
Government regulation, including compliance with regulatory requirements and changes in market rules, rates, tariffs and environmental laws;
|
|
•
|
Price mitigation strategies and other market structures employed by ISOs or RTOs;
|
|
•
|
NRG's ability to borrow additional funds and access capital markets, as well as NRG's substantial indebtedness and the possibility that NRG may incur additional indebtedness going forward;
|
|
•
|
NRG's ability to receive federal loan guarantees or cash grants to support development projects;
|
|
•
|
Operating and financial restrictions placed on NRG and its subsidiaries that are contained in the indentures governing NRG's outstanding notes, in NRG's Senior Credit Facility, and in debt and other agreements of certain of NRG subsidiaries and project affiliates generally;
|
|
•
|
NRG's ability to implement its strategy of developing and building new power generation facilities, including new solar projects;
|
|
•
|
NRG's ability to implement its econrg strategy of finding ways to address environmental challenges while taking advantage of business opportunities;
|
|
•
|
NRG's ability to implement its
FOR
NRG strategy to increase cash from operations through operational and commercial initiatives, corporate efficiencies, asset strategies, and a range of other programs throughout the Company to reduce costs or generate revenues;
|
|
•
|
NRG's ability to achieve its strategy of regularly returning capital to stockholders;
|
|
•
|
NRG's ability to maintain and grow retail market share;
|
|
•
|
NRG's ability to successfully evaluate investments in new businesses and growth initiatives;
|
|
•
|
NRG's ability to successfully integrate and manage any acquired businesses; and
|
|
•
|
NRG's ability to develop and maintain successful partnering relationships.
|
Forward-looking statements speak only as of the date they were made, and NRG undertakes no obligation to publicly update or revise any forward-looking statements, whether as a result of new information, future events or otherwise. The foregoing review of factors that could cause NRG's actual results to differ materially from those contemplated in any forward-looking statements included in this Quarterly Report on Form 10-Q should not be construed as exhaustive.
3
GLOSSARY OF TERMS
When the following terms and abbreviations appear in the text of this report, they have the meanings indicated below:
|
2012 Form 10-K
|
NRG’s Annual Report on Form 10-K for the year ended December 31, 2012
|
|
|
ASC
|
The FASB Accounting Standards Codification, which the FASB established as the source of authoritative U.S. GAAP
|
|
|
ASU
|
Accounting Standards Updates - updates to the ASC
|
|
|
BACT
|
Best Available Control Technology
|
|
|
Baseload
|
Units expected to satisfy minimum baseload requirements for the system and produce electricity at an essentially constant rate and run continuously
|
|
|
BTU
|
British Thermal Unit
|
|
|
CAA
|
Clean Air Act
|
|
|
CAIR
|
Clean Air Interstate Rule
|
|
|
CAISO
|
California Independent System Operator
|
|
|
Capital Allocation Program
|
NRG's plan of allocating capital
between debt reduction, reinvestment
in the business, share
repurchases and shareholder dividends
|
|
|
CCUS
|
Carbon capture, utilization and storage project
|
|
|
CO
2
|
Carbon dioxide
|
|
|
CPUC
|
California Public Utilities Commission
|
|
|
CSAPR
|
Cross-State Air Pollution Rule
|
|
|
CWA
|
Clean Water Act
|
|
|
Distributed Solar
|
Solar power projects, typically less than 20 MW in size, that primarily sell power produced to customers for usage on site, or are interconnected to sell power into the local distribution grid
|
|
|
DNREC
|
Delaware Department of Natural Resources and Environmental Control
|
|
|
EME
|
Edison Mission Energy
|
|
|
Energy Plus Holdings
|
Energy Plus Holdings LLC
|
|
|
EPA
|
U.S. Environmental Protection Agency
|
|
|
ERCOT
|
Electric Reliability Council of Texas, the Independent System Operator and the regional reliability coordinator of the various electricity systems within Texas
|
|
|
ESEC
|
El Segundo Energy Center LLC
|
|
|
ESPP
|
Employee Stock Purchase Plan
|
|
|
Exchange Act
|
The Securities Exchange Act of 1934, as amended
|
|
|
FASB
|
Financial Accounting Standards Board
|
|
|
FERC
|
Federal Energy Regulatory Commission
|
|
|
GenOn
|
GenOn Energy, Inc.
|
|
|
GenOn Americas Generation
|
GenOn Americas Generation, LLC
|
|
|
GenOn Americas Generation Senior Notes
|
GenOn Americas Generation's $850 million outstanding unsecured senior notes consisting of $450 million of 8.55% senior notes due 2021 and $400 million of 9.125% senior notes due 2031
|
|
|
GenOn Mid-Atlantic
|
GenOn Mid- Atlantic, LLC and, except where the context indicates otherwise, its subsidiaries, which include the coal generation units at two generating facilities under operating leases
|
|
|
GenOn Senior Notes
|
GenOn's $1.9 billion outstanding unsecured senior notes consisting of $725 million of 7.875% senior notes due 2017, $675 million of 9.5% senior notes due 2018, and $550 million of 9.875% senior notes due 2020
|
|
|
GHG
|
Greenhouse gases
|
|
|
Green Mountain Energy
|
Green Mountain Energy Company
|
|
|
GWh
|
Gigawatt hour
|
|
|
Heat Rate
|
A measure of thermal efficiency computed by dividing the total BTU content of the fuel burned by the resulting kWhs generated. Heat rates can be expressed as either gross or net heat rates, depending whether the electricity output measured is gross or net generation and is generally expressed as BTU per net kWh
|
|
4
|
High Desert
|
TA - High Desert, LLC
|
|
|
High Desert Facility
|
High Desert's $82 million non-recourse project level financing facility under the Note Purchase and Private Shelf Agreement
|
|
|
Intermediate
|
Units expected to satisfy system requirements that are greater than baseload and less than peaking
|
|
|
ISO
|
Independent System Operator, also referred to as Regional Transmission Organization, or RTO
|
|
|
ITC
|
Investment Tax Credit
|
|
|
Kansas South
|
NRG Solar Kansas South LLC
|
|
|
kWh
|
Kilowatt-hours
|
|
|
LIBOR
|
London Inter-Bank Offered Rate
|
|
|
LTIPs
|
Collectively, the NRG Long-Term Incentive Plan and the NRG GenOn Long-Term Incentive Plan
|
|
|
Marsh Landing
|
NRG Marsh Landing, LLC (formerly known as GenOn Marsh Landing, LLC)
|
|
|
Mass
|
Residential and small business
|
|
|
MATS
|
Mercury and Air Toxics Standards promulgated by the EPA
|
|
|
MDE
|
Maryland Department of the Environment
|
|
|
Merger
|
The merger completed on December 14, 2012 by NRG and GenOn pursuant to the Merger Agreement
|
|
|
Merger Agreement
|
Agreement and Plan of Merger by and among NRG Energy, Inc., Plus Merger Corporation and GenOn Energy, Inc. dated as of July 20, 2012
|
|
|
MISO
|
Midcontinent Independent System Operator, Inc.
|
|
|
MMBtu
|
Million British Thermal Units
|
|
|
MOPR
|
Minimum Offer Price Rule
|
|
|
MW
|
Megawatt
|
|
|
MWh
|
Saleable megawatt hours, net of internal/parasitic load megawatt-hours
|
|
|
MWt
|
Megawatts Thermal Equivalent
|
|
|
NAAQS
|
National Ambient Air Quality Standards
|
|
|
Net Exposure
|
Counterparty credit exposure to NRG, net of collateral
|
|
|
Net Generation
|
The net amount of electricity produced, expressed in kWh or MWhs, that is the total amount of electricity generated (gross) minus the amount of electricity used during generation
|
|
|
NJDEP
|
New Jersey Department of Environmental Protection
|
|
|
NOL
|
Net Operating Loss
|
|
|
NOV
|
Notice of Violation
|
|
|
NO
x
|
Nitrogen oxide
|
|
|
NPNS
|
Normal Purchase Normal Sale
|
|
|
NRC
|
U.S. Nuclear Regulatory Commission
|
|
|
NRG Yield
|
Reporting segment including the following projects: Alpine, Avenal, Avra Valley, AZ DG Solar, Blythe, Borrego, CVSR, GenConn, Marsh Landing, PFMG DG Solar, Roadrunner, South Trent and Thermal.
|
|
|
NRG Yield, Inc.
|
NRG Yield, Inc., the owner of 34.5% of NRG Yield LLC with a controlling interest, and issuer of publicly held shares of Class A common stock
|
|
|
NRG Yield LLC
|
NRG Yield LLC, which owns, through its wholly owned subsidiary, NRG Yield Operating LLC, all of the assets contributed to NRG Yield LLC in connection with the initial public offering of Class A common stock of NRG Yield, Inc.
|
|
|
NSPS
|
New Source Performance Standards
|
|
|
NSR
|
New Source Review
|
|
|
Nuclear Decommissioning Trust Fund
|
NRG's nuclear decommissioning trust fund assets, which are for the Company's portion of the decommissioning of the STP, units 1 & 2
|
|
|
NYISO
|
New York Independent System Operator
|
|
|
NYSPSC
|
New York State Public Service Commission
|
|
|
OCI
|
Other comprehensive income
|
|
5
|
PADEP
|
Pennsylvania Department of Environmental Protection
|
|
|
Peaking
|
Units expected to satisfy demand requirements during the periods of greatest or peak load on the system
|
|
|
PG&E
|
Pacific Gas & Electric Company
|
|
|
PJM
|
PJM Interconnection, LLC
|
|
|
PPA
|
Power Purchase Agreement
|
|
|
PUCT
|
Public Utility Commission of Texas
|
|
|
Reliant Energy
|
Reliant Energy Retail Services, LLC
|
|
|
Repowering
|
Technologies utilized to replace, rebuild, or redevelop major portions of an existing electrical generating facility, generally to achieve a substantial emissions reduction, increase facility capacity, and improve system efficiency
|
|
|
Retail Business
|
NRG's retail energy brands, including Reliant, Green Mountain, Energy Plus and NRG Residential Solutions
|
|
|
Revolving Credit Facility
|
The Company's $2.5 billion revolving credit facility due 2018, a component of the Senior Credit Facility
|
|
|
RGGI
|
Regional Greenhouse Gas Initiative
|
|
|
RMR
|
Reliability Must Run
|
|
|
RSS
|
Reliability Support Service
|
|
|
Schkopau
|
Kraftwerk Schkopau Betriebsgesellschaft mbH
|
|
|
Senior Credit Facility
|
NRG's senior secured facility, comprised of the Term Loan Facility and the Revolving Credit Facility
|
|
|
Senior Notes
|
The Company’s $5.7 billion outstanding unsecured senior notes, consisting of $1.1 billion of 7.625% senior notes due 2018, $607 million of 8.5% senior notes due 2019, $800 million of 7.625% senior notes due 2019, $1.1 billion of 8.25% senior notes due 2020, $1.1 billion of 7.875% senior notes due 2021, and $990 million of 6.625% senior notes due 2023
|
|
|
SO
2
|
Sulfur dioxide
|
|
|
STP
|
South Texas Project — nuclear generating facility located near Bay City, Texas in which NRG owns a 44% interest
|
|
|
Term Loan Facility
|
The Company's $2.0 billion term loan facility due 2018, a component of the Senior Credit Facility
|
|
|
Texas Genco
|
Texas Genco LLC, now referred to as the Company's Texas Region
|
|
|
U.S.
|
United States of America
|
|
|
U.S. DOE
|
U.S. Department of Energy
|
|
|
U.S. DOJ
|
U.S. Department of Justice
|
|
|
U.S. GAAP
|
Accounting principles generally accepted in the United States
|
|
|
Utility Scale Solar
|
Solar power projects, typically 20 MW or greater in size (on an alternating current basis), that are interconnected into the transmission or distribution grid to sell power at a wholesale level
|
|
|
VaR
|
Value at Risk
|
|
|
VIE
|
Variable Interest Entity
|
|
6
NRG ENERGY, INC. AND SUBSIDIARIES
(Unaudited)
|
Three months ended September 30,
|
Nine months ended September 30,
|
||||||||||||||
|
(In millions, except for per share amounts)
|
2013
|
2012
|
2013
|
2012
|
|||||||||||
|
Operating Revenues
|
|||||||||||||||
|
Total operating revenues
|
$
|
3,490
|
|
$
|
2,331
|
|
$
|
8,500
|
|
$
|
6,359
|
|
|||
|
Operating Costs and Expenses
|
|||||||||||||||
|
Cost of operations
|
2,355
|
|
1,740
|
|
6,179
|
|
4,660
|
|
|||||||
|
Depreciation and amortization
|
318
|
|
239
|
|
921
|
|
703
|
|
|||||||
|
Selling, general and administrative
|
229
|
|
224
|
|
671
|
|
613
|
|
|||||||
|
Acquisition-related transaction and integration costs
|
26
|
|
18
|
|
95
|
|
18
|
|
|||||||
|
Development activity expenses
|
27
|
|
24
|
|
63
|
|
52
|
|
|||||||
|
Total operating costs and expenses
|
2,955
|
|
2,245
|
|
7,929
|
|
6,046
|
|
|||||||
|
Operating Income
|
535
|
|
86
|
|
571
|
|
313
|
|
|||||||
|
Other Income/(Expense)
|
|||||||||||||||
|
Equity in (losses)/earnings of unconsolidated affiliates
|
(5
|
)
|
4
|
|
6
|
|
|
26
|
|
||||||
|
Other income, net
|
5
|
|
|
9
|
|
9
|
|
|
12
|
|
|||||
|
Loss on debt extinguishment
|
(1
|
)
|
|
(41
|
)
|
(50
|
)
|
|
(41
|
)
|
|||||
|
Interest expense
|
(228
|
)
|
|
(163
|
)
|
(630
|
)
|
|
(495
|
)
|
|||||
|
Total other expense
|
(229
|
)
|
(191
|
)
|
(665
|
)
|
(498
|
)
|
|||||||
|
Income/(Loss) Before Income Taxes
|
306
|
|
(105
|
)
|
(94
|
)
|
(185
|
)
|
|||||||
|
Income tax expense/(benefit)
|
163
|
|
(113
|
)
|
(47
|
)
|
(246
|
)
|
|||||||
|
Net Income/(Loss)
|
143
|
|
8
|
|
(47
|
)
|
61
|
|
|||||||
|
Less: Net income attributable to noncontrolling interest
|
19
|
|
9
|
|
27
|
|
18
|
|
|||||||
|
Net Income/(Loss) Attributable to NRG Energy, Inc.
|
124
|
|
(1
|
)
|
(74
|
)
|
43
|
|
|||||||
|
Dividends for preferred shares
|
2
|
|
2
|
|
7
|
|
7
|
|
|||||||
|
Income/(Loss) Available for Common Stockholders
|
$
|
122
|
|
$
|
(3
|
)
|
$
|
(81
|
)
|
$
|
36
|
|
|||
|
Earnings/(Loss) Per Share Attributable to NRG Energy, Inc. Common Stockholders
|
|||||||||||||||
|
Weighted average number of common shares outstanding — basic
|
323
|
|
228
|
|
323
|
|
228
|
|
|||||||
|
Earnings/(Loss) per Weighted Average Common Share — Basic
|
$
|
0.38
|
|
$
|
(0.01
|
)
|
$
|
(0.25
|
)
|
$
|
0.16
|
|
|||
|
Weighted average number of common shares outstanding — diluted
|
327
|
|
228
|
|
323
|
|
230
|
|
|||||||
|
Earnings/(Loss) per Weighted Average Common Share — Diluted
|
$
|
0.37
|
|
$
|
(0.01
|
)
|
$
|
(0.25
|
)
|
$
|
0.16
|
|
|||
|
Dividends Per Common Share
|
$
|
0.12
|
|
$
|
0.09
|
|
$
|
0.33
|
|
$
|
0.09
|
|
|||
See accompanying notes to condensed consolidated financial statements.
7
NRG ENERGY, INC. AND SUBSIDIARIES
CONDENSED CONSOLIDATED STATEMENTS OF COMPREHENSIVE INCOME/(LOSS)
(Unaudited)
|
Three months ended September 30,
|
Nine months ended September 30,
|
||||||||||||||
|
2013
|
2012
|
2013
|
2012
|
||||||||||||
|
(In millions)
|
|||||||||||||||
|
Net Income/(Loss)
|
$
|
143
|
|
$
|
8
|
|
$
|
(47
|
)
|
$
|
61
|
|
|||
|
Other Comprehensive (Loss)/Income, net of tax
|
|||||||||||||||
|
Unrealized (loss)/gain on derivatives, net of income tax benefit of $5, $24, $2 and $76
|
(16
|
)
|
(43
|
)
|
8
|
|
(132
|
)
|
|||||||
|
Foreign currency translation adjustments, net of income tax benefit of $1, $0, $13 and $1
|
5
|
|
1
|
|
(14
|
)
|
(1
|
)
|
|||||||
|
Reclassification adjustment for translation gain realized upon sale of Schkopau, net of income tax expense of $0, $6, $0 and $6
|
—
|
|
(11
|
)
|
—
|
|
(11
|
)
|
|||||||
|
Available-for-sale securities, net of income tax expense of $0, $1, $1 and $1
|
—
|
|
2
|
|
2
|
|
2
|
|
|||||||
|
Defined benefit plans, net of tax expense of $0, $0, $4 and $0
|
—
|
|
—
|
|
25
|
|
—
|
|
|||||||
|
Other comprehensive (loss)/income
|
(11
|
)
|
(51
|
)
|
21
|
|
(142
|
)
|
|||||||
|
Comprehensive Income/(Loss)
|
132
|
|
(43
|
)
|
(26
|
)
|
(81
|
)
|
|||||||
|
Less: Comprehensive income attributable to noncontrolling interest
|
18
|
|
9
|
|
26
|
|
18
|
|
|||||||
|
Comprehensive Income/(Loss) Attributable to NRG Energy, Inc.
|
114
|
|
(52
|
)
|
(52
|
)
|
(99
|
)
|
|||||||
|
Dividends for preferred shares
|
2
|
|
2
|
|
7
|
|
7
|
|
|||||||
|
Comprehensive Income/(Loss) Available for Common Stockholders
|
$
|
112
|
|
$
|
(54
|
)
|
$
|
(59
|
)
|
$
|
(106
|
)
|
|||
See accompanying notes to condensed consolidated financial statements.
8
NRG ENERGY, INC. AND SUBSIDIARIES
|
September 30, 2013
|
December 31, 2012
|
||||||
|
(In millions, except shares)
|
(unaudited)
|
|
|||||
|
ASSETS
|
|
|
|||||
|
Current Assets
|
|
|
|||||
|
Cash and cash equivalents
|
$
|
2,129
|
|
$
|
2,087
|
|
|
|
Funds deposited by counterparties
|
122
|
|
271
|
|
|||
|
Restricted cash
|
307
|
|
217
|
|
|||
|
Accounts receivable — trade, less allowance for doubtful accounts of $41 and $32
|
1,366
|
|
1,061
|
|
|||
|
Inventory
|
861
|
|
911
|
|
|||
|
Derivative instruments
|
1,389
|
|
2,644
|
|
|||
|
Cash collateral paid in support of energy risk management activities
|
288
|
|
229
|
|
|||
|
Deferred income taxes
|
—
|
|
56
|
|
|||
|
Renewable energy grant receivable
|
345
|
|
58
|
|
|||
|
Prepayments and other current assets
|
442
|
|
401
|
|
|||
|
Total current assets
|
7,249
|
|
7,935
|
|
|||
|
Property, plant and equipment, net of accumulated depreciation of $6,264 and $5,417
|
20,600
|
|
20,241
|
|
|||
|
Other Assets
|
|
|
|||||
|
Equity investments in affiliates
|
626
|
|
676
|
|
|||
|
Notes receivable, less current portion
|
76
|
|
79
|
|
|||
|
Goodwill
|
1,953
|
|
1,956
|
|
|||
|
Intangible assets, net of accumulated amortization of $1,915 and $1,706
|
1,141
|
|
1,200
|
|
|||
|
Nuclear decommissioning trust fund
|
524
|
|
473
|
|
|||
|
Derivative instruments
|
506
|
|
662
|
|
|||
|
Deferred income taxes
|
1,499
|
|
1,282
|
|
|||
|
Other non-current assets
|
689
|
|
600
|
|
|||
|
Total other assets
|
7,014
|
|
6,928
|
|
|||
|
Total Assets
|
$
|
34,863
|
|
$
|
35,104
|
|
|
|
LIABILITIES AND STOCKHOLDERS’ EQUITY
|
|
|
|||||
|
Current Liabilities
|
|
|
|||||
|
Current portion of long-term debt and capital leases
|
$
|
911
|
|
$
|
147
|
|
|
|
Accounts payable
|
1,140
|
|
1,171
|
|
|||
|
Derivative instruments
|
1,064
|
|
1,981
|
|
|||
|
Deferred income taxes
|
112
|
|
—
|
|
|||
|
Cash collateral received in support of energy risk management activities
|
122
|
|
271
|
|
|||
|
Accrued expenses and other current liabilities
|
1,033
|
|
1,085
|
|
|||
|
Total current liabilities
|
4,382
|
|
4,655
|
|
|||
|
Other Liabilities
|
|
|
|||||
|
Long-term debt and capital leases
|
15,802
|
|
15,736
|
|
|||
|
Nuclear decommissioning reserve
|
290
|
|
354
|
|
|||
|
Nuclear decommissioning trust liability
|
303
|
|
273
|
|
|||
|
Deferred income taxes
|
50
|
|
55
|
|
|||
|
Derivative instruments
|
372
|
|
500
|
|
|||
|
Out-of-market contracts
|
1,157
|
|
1,231
|
|
|||
|
Other non-current liabilities
|
1,377
|
|
1,553
|
|
|||
|
Total non-current liabilities
|
19,351
|
|
|
19,702
|
|
||
|
Total Liabilities
|
23,733
|
|
24,357
|
|
|||
|
3.625% convertible perpetual preferred stock (at liquidation value, net of issuance costs)
|
249
|
|
249
|
|
|||
|
Commitments and Contingencies
|
|
|
|
|
|||
|
Stockholders’ Equity
|
|
|
|||||
|
Common stock
|
4
|
|
4
|
|
|||
|
Additional paid-in capital
|
7,843
|
|
7,587
|
|
|||
|
Retained earnings
|
4,272
|
|
4,459
|
|
|||
|
Less treasury stock, at cost — 77,347,528 and 76,505,718 shares, respectively
|
(1,942
|
)
|
(1,920
|
)
|
|||
|
Accumulated other comprehensive loss
|
(129
|
)
|
(150
|
)
|
|||
|
Noncontrolling interest
|
833
|
|
518
|
|
|||
|
Total Stockholders’ Equity
|
10,881
|
|
10,498
|
|
|||
|
Total Liabilities and Stockholders’ Equity
|
$
|
34,863
|
|
$
|
35,104
|
|
|
See accompanying notes to condensed consolidated financial statements.
9
NRG ENERGY, INC. AND SUBSIDIARIES
(Unaudited)
|
Nine months ended September 30,
|
|||||||
|
2013
|
2012
|
||||||
|
(In millions)
|
|||||||
|
Cash Flows from Operating Activities
|
|||||||
|
Net (loss)/income
|
$
|
(47
|
)
|
$
|
61
|
|
|
|
Adjustments to reconcile net (loss)/income to net cash provided by operating activities:
|
|
|
|||||
|
Distributions and equity in earnings of unconsolidated affiliates
|
23
|
|
8
|
|
|||
|
Depreciation and amortization
|
921
|
|
703
|
|
|||
|
Provision for bad debts
|
49
|
|
40
|
|
|||
|
Amortization of nuclear fuel
|
27
|
|
29
|
|
|||
|
Amortization of financing costs and debt discount/premiums
|
(22
|
)
|
25
|
|
|||
|
Adjustment to loss on debt extinguishment
|
(15
|
)
|
8
|
|
|||
|
Amortization of intangibles and out-of-market contracts
|
75
|
|
108
|
|
|||
|
Amortization of unearned equity compensation
|
32
|
|
27
|
|
|||
|
Changes in deferred income taxes and liability for uncertain tax benefits
|
39
|
|
(261
|
)
|
|||
|
Changes in nuclear decommissioning trust liability
|
25
|
|
25
|
|
|||
|
Changes in derivative instruments
|
189
|
|
360
|
|
|||
|
Changes in collateral deposits supporting energy risk management activities
|
(59
|
)
|
213
|
|
|||
|
Gain on sale of emission allowances
|
(8
|
)
|
(3
|
)
|
|||
|
Cash used by changes in other working capital
|
(406
|
)
|
(285
|
)
|
|||
|
Net Cash Provided by Operating Activities
|
823
|
|
1,058
|
|
|||
|
Cash Flows from Investing Activities
|
|
|
|||||
|
Acquisitions of businesses, net of cash acquired
|
(374
|
)
|
(40
|
)
|
|||
|
Capital expenditures
|
(1,581
|
)
|
(2,474
|
)
|
|||
|
Increase in restricted cash, net
|
(67
|
)
|
(96
|
)
|
|||
|
(Increase)/decrease in restricted cash to support equity requirements for U.S. DOE funded projects
|
(20
|
)
|
151
|
|
|||
|
Increase in notes receivable
|
(22
|
)
|
(22
|
)
|
|||
|
Investments in nuclear decommissioning trust fund securities
|
(369
|
)
|
(341
|
)
|
|||
|
Proceeds from sales of nuclear decommissioning trust fund securities
|
344
|
|
316
|
|
|||
|
Proceeds from renewable energy grants
|
52
|
|
49
|
|
|||
|
Proceeds from sale of assets, net of cash disposed of
|
13
|
|
137
|
|
|||
|
Other
|
(7
|
)
|
(9
|
)
|
|||
|
Net Cash Used by Investing Activities
|
(2,031
|
)
|
(2,329
|
)
|
|||
|
Cash Flows from Financing Activities
|
|
|
|||||
|
Payment of dividends to common and preferred stockholders
|
(113
|
)
|
(28
|
)
|
|||
|
Payment for treasury stock
|
(25
|
)
|
—
|
|
|||
|
Net receipts from/(payments for) settlement of acquired derivatives that include financing elements
|
177
|
|
(65
|
)
|
|||
|
Proceeds from issuance of long-term debt
|
1,605
|
|
2,541
|
|
|||
|
Contributions and sale proceeds from noncontrolling interest in subsidiaries
|
504
|
|
316
|
|
|||
|
Proceeds from issuance of common stock
|
14
|
|
—
|
|
|||
|
Payment of debt issuance costs
|
(43
|
)
|
(30
|
)
|
|||
|
Payments for short and long-term debt
|
(868
|
)
|
(955
|
)
|
|||
|
Net Cash Provided by Financing Activities
|
1,251
|
|
1,779
|
|
|||
|
Effect of exchange rate changes on cash and cash equivalents
|
(1
|
)
|
(3
|
)
|
|||
|
Net Increase in Cash and Cash Equivalents
|
42
|
|
505
|
|
|||
|
Cash and Cash Equivalents at Beginning of Period
|
2,087
|
|
1,105
|
|
|||
|
Cash and Cash Equivalents at End of Period
|
$
|
2,129
|
|
$
|
1,610
|
|
|
See accompanying notes to condensed consolidated financial statements.
10
NRG ENERGY, INC. AND SUBSIDIARIES
NOTES TO CONDENSED CONSOLIDATED FINANCIAL STATEMENTS
(Unaudited)
Note 1
—
Basis of Presentation
NRG Energy, Inc., or NRG or the Company, is historically a competitive power and energy company that aspires to be a leader in the way residential, industrial and commercial consumers think about, use, produce and deliver energy and energy services in major competitive power markets in the United States. NRG engages in the ownership and operation of power generation facilities; the trading of energy, capacity and related products; the transacting in and trading of fuel and transportation services and the direct sale of energy, services, and innovative, sustainable products to retail customers in competitive markets in which NRG owns generation. The Company sells retail electric products and services under the name “NRG” and various brands owned by NRG. Finally, NRG is a clean energy leader and is focused on the deployment and commercialization of potentially transformative technologies, like electric vehicles, Distributed Solar and smart meter/home automation technology that collectively have the potential to fundamentally change the nature of the power industry, including a substantial change in the role of the national electric transmission grid and distribution system. On December 14, 2012, the Company acquired GenOn as further described in
Note 3
,
Business Acquisitions and Dispositions
,
and has reported results of operations from the acquisition date forward.
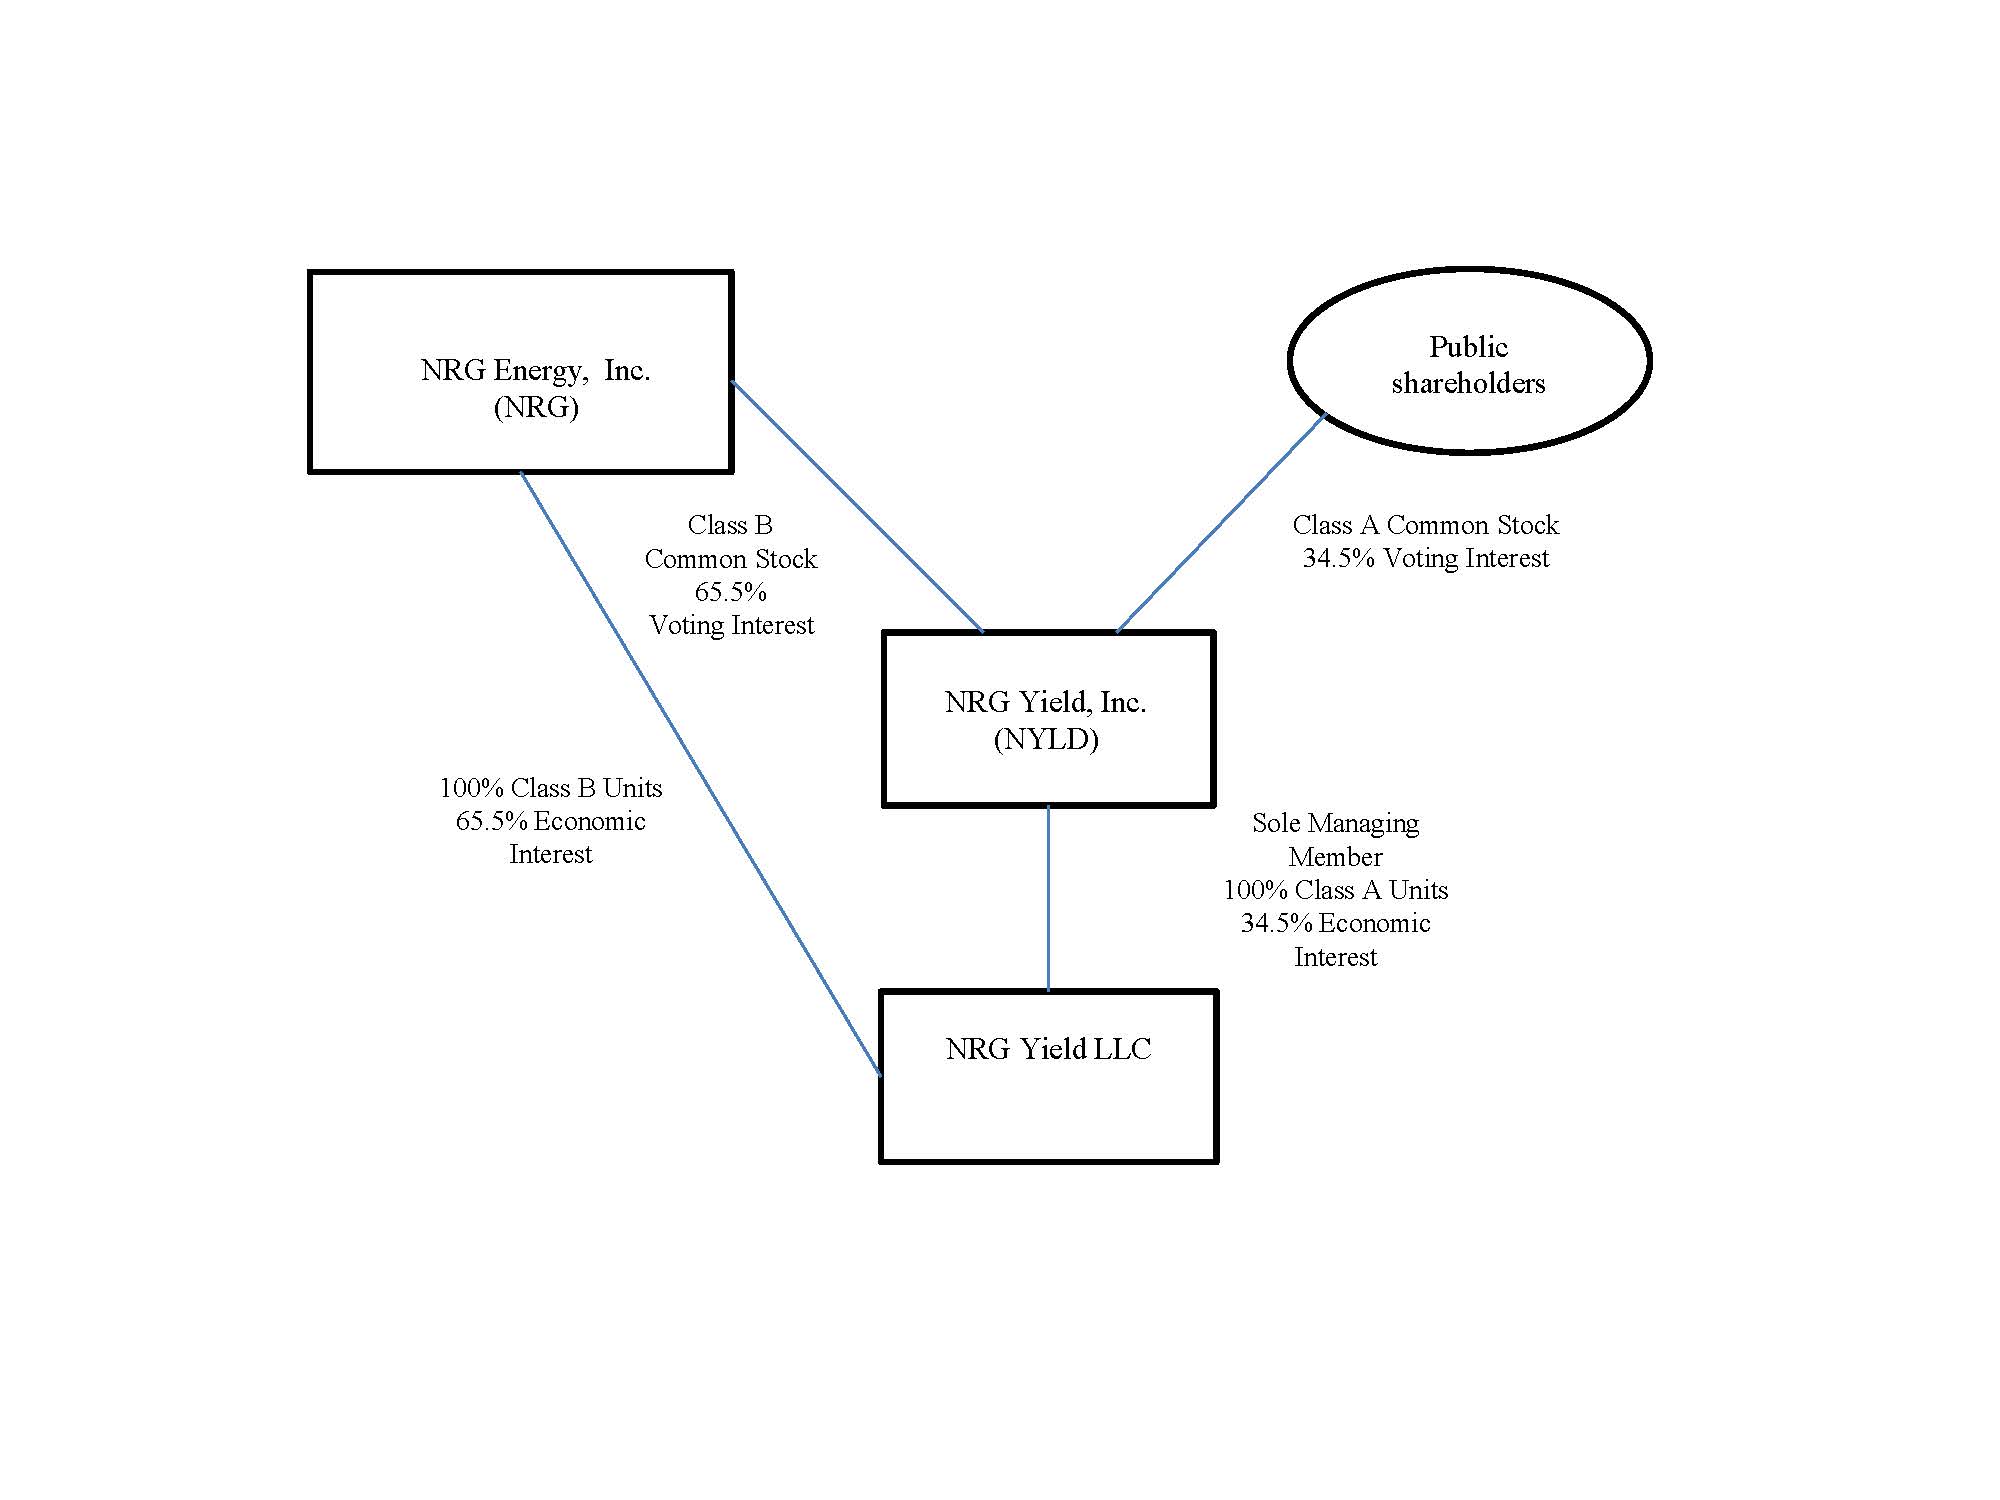
The Company formed NRG Yield, Inc. to own and operate a portfolio of contracted generation assets and thermal infrastructure assets that have historically been owned and/or operated by NRG and its subsidiaries. On July 22, 2013, NRG Yield, Inc. closed its initial public offering of
22,511,250 shares
of Class A common stock at a price of
$22 per share
. Net proceeds to NRG Yield, Inc. from the sale of the Class A common stock were approximately
$468 million
, net of underwriting discounts and commissions of
$27 million
. The Company retained
42,738,250 shares
of Class B common stock of NRG Yield, Inc. As a result, the Company owns a controlling interest in NRG Yield, Inc. and will consolidate this entity for financial reporting purposes. In addition, the Company retained a
65.5%
interest in NRG Yield LLC. The initial public offering represented the sale of a
34.5%
interest in NRG Yield LLC. NRG Yield LLC's initial assets consist of
three
natural gas or dual-fired facilities,
eight
utility-scale solar and wind generation facilities,
two
portfolios of distributed solar facilities that collectively represent
1,324
net MW, and thermal infrastructure assets with an aggregate steam and chilled water capacity of
1,098
net MWt and electric generation capacity of
123
net MW. The following table represents the structure of NRG Yield, Inc. after the initial public offering:
11
The Company has revised its segment reporting to include an NRG Yield segment, as further described in
Note 11
,
Segment Reporting
.
The accompanying unaudited interim condensed consolidated financial statements have been prepared in accordance with the SEC's regulations for interim financial information and with the instructions to Form 10-Q. Accordingly, they do not include all of the information and notes required by generally accepted accounting principles for complete financial statements. The following notes should be read in conjunction with the accounting policies and other disclosures as set forth in the notes to the financial statements in the Company's
2012
Form 10-K. Interim results are not necessarily indicative of results for a full year.
In the opinion of management, the accompanying unaudited interim condensed consolidated financial statements contain all material adjustments consisting of normal and recurring accruals necessary to present fairly the Company's consolidated financial position as of
September 30, 2013
, and the results of operations, comprehensive income/(loss) and cash flows for the three and
nine
months ended
September 30, 2013
, and
2012
.
Use of Estimates
The preparation of financial statements in conformity with accounting principles generally accepted in the United States requires management to make estimates and assumptions that affect the reported amounts of assets and liabilities at the date of the financial statements, disclosure of contingent assets and liabilities at the date of the financial statements, and the reported amounts of revenues and expenses during the reporting period. Actual results could differ from these estimates.
Reclassifications
Certain prior year amounts have been reclassified for comparative purposes. The reclassifications did not affect results from operations or cash flows. The Company reclassified certain plant-related expenses from selling, general and administrative to cost of operations and certain general and administrative expenses to development activity expenses.
12
Note 2
—
Summary of Significant Accounting Policies
Development Activity Expenses
Development activity expenses include project development costs, which are expensed in the preliminary stages of a project and capitalized when the project is deemed to be commercially viable. Commercial viability is determined by one or a series of actions including, among others, Board of Director approval pursuant to a formal project plan that subjects the Company to significant future obligations that can only be discharged by the use of a Company asset. When a project is available for operations, capitalized project development costs are reclassified to property, plant and equipment and amortized on a straight-line basis over the estimated useful life of the project's related assets. Capitalized costs are charged to expense if a project is abandoned or management otherwise determines the costs to be unrecoverable.
Development activity expenses also include selling, general, and administrative expenses associated with the current operations of certain developing businesses including residential solar, electric vehicles, waste-to-energy, carbon capture and other emerging technologies. The revenue associated with these businesses was immaterial for the
three
and
nine
months ended
September 30, 2013
and
2012
. When it is determined that a business will remain an ongoing part of the Company's operations or when operating revenues become material relative to the operating costs of the underlying business, the Company no longer classifies a business as a development activity.
Other Cash Flow Information
NRG’s investing activities exclude capital expenditures of
$127 million
which were accrued and unpaid at
September 30, 2013
, primarily for solar projects under construction.
Noncontrolling Interest
The following table reflects the changes in NRG's noncontrolling interest balance:
|
(In millions)
|
|||
|
Balance as of December 31, 2012
|
$
|
518
|
|
|
Contributions from noncontrolling interest
|
289
|
|
|
|
Comprehensive income attributable to noncontrolling interest
|
26
|
|
|
|
Balance as of September 30, 2013
|
$
|
833
|
|
The contributions from noncontrolling interest primarily reflect the value of the underlying net assets sold to the NRG Yield, Inc. Class A common shareholders in the initial public offering. The transaction resulted in a gain of
$221 million
, which was recorded in NRG's additional paid-in capital balance.
Recent Accounting Developments
ASU 2011-11
- Effective January 1, 2013, the Company adopted the provisions of ASU No. 2011-11,
Balance Sheet (Topic 210) Disclosures about Offsetting Assets and Liabilities
, or ASU No. 2011-11, and began providing enhanced disclosures regarding the effect or potential effect of netting arrangements on an entity's financial position by improving information about financial instruments and derivative instruments that either (1) offset in accordance with either ASC 210-20-45 or ASC 810-20-45 or (2) are subject to an enforceable master netting arrangement or similar agreement, irrespective of whether they are offset. Reporting entities are required to disclose both gross and net information about both instruments and transactions eligible for offset in the statement of financial position and instruments and transactions subject to an agreement similar to a master netting arrangement. The disclosures required by ASU No. 2011-11 are required to be adopted retroactively. As this guidance provides only disclosure requirements, the adoption of this standard did not impact the Company's results of operations, cash flows or financial position.
ASU 2013-02
- Effective January 1, 2013, the Company adopted the provisions of ASU No. 2013-02,
Other Comprehensive Income (Topic 220) Reporting of Amounts Reclassified Out of Accumulated Other Comprehensive Income
, or ASU No. 2013-02, and began reporting the effect of significant reclassifications out of accumulated other comprehensive income on the respective line items in net income within the notes to the financial statements if the amount being reclassified is required under U.S. GAAP to be reclassified in its entirety to net income in the same reporting period. For other amounts not required by U.S. GAAP to be reclassified in their entirety to net income in the same reporting period, an entity is required to cross-reference other disclosures which provide additional information about the amounts. The provisions of ASU No. 2013-02 are required to be adopted prospectively. As this guidance provides only presentation requirements, the adoption of this standard did not impact the Company's results of operations, cash flows or financial position.
13
Note 3
—
Business Acquisitions and Dispositions
Pending Acquisition
On October 18, 2013, the Company entered into an agreement to acquire substantially all of the assets of Edison Mission Energy, or EME. EME, through its subsidiaries and affiliates, owns, operates, and leases a portfolio of
8,000
MW consisting of wind energy facilities and coal- and gas-fired generating facilities. On December 17, 2012, EME and certain of its direct and indirect subsidiaries filed voluntary petitions for relief under chapter 11 of title 11 of the United States Code, or the Bankruptcy Code. EME was deconsolidated from its parent company, Edison International, for financial statement purposes but not for tax purposes on December 17, 2012. On May 2, 2013, certain other subsidiaries of EME filed voluntary petitions for relief under the Bankruptcy Code.
The Company will pay an aggregate purchase price of
$2.6 billion
(subject to adjustment), which will consist of
12,671,977
shares of NRG common stock (valued at
$350 million
based upon the volume-weighted average trading price over the 20 trading days prior to October 18, 2013) with the balance to be paid in cash. The Company expects to fund the net cash portion of the purchase price using a combination of cash on hand, including acquired cash on hand of
$1.1 billion
, and approximately
$700 million
in newly-issued corporate debt. The Company also expects to assume non-recourse debt of approximately
$1.5 billion
.
In connection with the transaction, NRG has agreed to certain conditions with the parties to the Powerton and Joliet, or POJO, sale-leaseback transaction subject to which an NRG subsidiary will assume the POJO leveraged leases and NRG will guarantee the remaining payments under each lease. In connection with this agreement, NRG has committed to fund up to
$350 million
in capital expenditures for plant modifications at Powerton and Joliet to install controls to comply with MATS.
The acquisition is subject to customary conditions, including approval of the U.S. Bankruptcy Court for the Northern District of Illinois and required regulatory approvals, and is expected to close by the first quarter of 2014. However, EME may continue to solicit alternative transaction proposals from third parties through December 6, 2013. Under certain circumstances, including if EME enters into or seeks approval of an alternative transaction, NRG will receive a cash fee of
$65 million
plus expense reimbursement. There are no assurances that the conditions to the acquisition of EME will be satisfied, that EME will not seek or enter into an alternative transaction, or that the acquisition of EME will be consummated on the terms agreed to, if at all.
Gregory Acquisition
On August 7, 2013, NRG Texas Gregory, LLC, a wholly owned subsidiary of NRG, acquired Gregory Power Partners, L.P. for approximately
$245 million
in cash, net of
$32 million
cash acquired. Gregory is a cogeneration plant located in Corpus Christi, Texas, which has generation capacity of
388
MW and steam capacity of
160
MWt. The Gregory cogeneration plant provides steam, processed water and a small percentage of its electrical generation to the Corpus Christi Sherwin Alumina plant. The majority of the plant's generation is available for sale in the ERCOT market. The acquisition was recorded as a business combination under ASC 805, with identifiable assets acquired and liabilities assumed provisionally recorded at their estimated fair values on the acquisition date. The purchase price was provisionally allocated primarily to property, plant, and equipment. The initial accounting for the business combination is not complete because the evaluations necessary to assess the fair value of certain net assets acquired are still in process.
GenOn Acquisition
On December 14, 2012, NRG acquired GenOn Energy, Inc., or GenOn. GenOn, a generator of wholesale electricity, has baseload, intermediate and peaking power generation facilities using coal, natural gas and oil, totaling approximately
21,440
MW. Consideration for the acquisition was valued at
$2.2 billion
and was comprised of
0.1216
shares of NRG common stock for each outstanding share of GenOn, including restricted stock units outstanding, on the acquisition date, except for fractional shares which were paid in cash. The Company issued
93.9 million
shares of NRG common stock, or
29%
of total common shares outstanding following the closing of the transaction. The acquisition was recorded as a business combination, with identifiable assets acquired and liabilities assumed provisionally recorded at their estimated fair values on the acquisition date. The initial accounting for the business combination is not complete because the evaluations necessary to assess the fair value of certain net assets acquired are still in process. See Note 3,
Business Acquisitions and Dispositions,
in the Company's 2012 Form 10-K for additional information related to the GenOn acquisition.
14
The following table summarizes the provisional amounts recognized for assets acquired and liabilities assumed as of the acquisition date as well as adjustments made during the
nine
months ended
September 30, 2013
to the amounts initially recorded in 2012 due to the ongoing evaluation of initial estimates. The measurement period adjustments were recorded as an adjustment to the gain on bargain purchase and did not have a significant impact on the Company's consolidated statements of operations, cash flows or financial position in any period. The allocation of the purchase price may be modified up to one year from the date of the acquisition as more information is obtained about the fair value of assets acquired and liabilities assumed.
|
(In millions)
|
Amounts Recognized
as of Acquisition Date
(as previously reported)
|
Measurement Period Adjustments
|
Amounts Recognized
as of Acquisition Date
(as adjusted)
|
||||||||
|
Assets
|
|||||||||||
|
Cash
|
$
|
983
|
|
$
|
—
|
|
$
|
983
|
|
||
|
Current and non-current assets
|
1,385
|
|
(18
|
)
|
1,367
|
|
|||||
|
Property, plant and equipment
|
3,936
|
|
(27
|
)
|
3,909
|
|
|||||
|
Derivative assets
|
1,157
|
|
—
|
|
1,157
|
|
|||||
|
Deferred income taxes
|
2,265
|
|
21
|
|
2,286
|
|
|||||
|
Total assets acquired
|
$
|
9,726
|
|
$
|
(24
|
)
|
$
|
9,702
|
|
||
|
Liabilities
|
|||||||||||
|
Current and non-current liabilities
|
$
|
1,312
|
|
$
|
(7
|
)
|
$
|
1,305
|
|
||
|
Out-of-market contracts and leases
|
1,064
|
|
15
|
|
1,079
|
|
|||||
|
Derivative liabilities
|
399
|
|
—
|
|
399
|
|
|||||
|
Long-term debt and capital leases
|
4,203
|
|
3
|
|
4,206
|
|
|||||
|
Total liabilities assumed
|
6,978
|
|
11
|
|
6,989
|
|
|||||
|
Net assets acquired
|
2,748
|
|
(35
|
)
|
2,713
|
|
|||||
|
Consideration paid
|
2,188
|
|
—
|
|
2,188
|
|
|||||
|
Gain on bargain purchase
|
$
|
560
|
|
$
|
(35
|
)
|
$
|
525
|
|
||
2012 Dispositions
Agua Caliente
On January 18, 2012, the Company sold a
49%
interest in NRG Solar AC Holdings LLC, the indirect owner of the Agua Caliente project, to MidAmerican Energy Holdings Company, or MidAmerican. A majority of the
$122 million
of cash consideration received at closing represented
49%
of construction costs funded by NRG's equity contributions. The excess of the consideration over the carrying value of the divested interest was recorded to additional paid-in capital. MidAmerican will fund its proportionate share of future equity contributions and other credit support for the project. NRG continues to hold a majority interest in and consolidates the project.
Saale Energie GmbH
On July 17, 2012, the Company sold its
100%
interest in Saale Energie GmbH, which holds a
41.9%
interest in Kraftwerke Schkopau GbR and a
44.4%
interest in Kraftwerke Schkopau Betriebsgesllschaft mbH, collectively, Schkopau. Schkopau holds a fixed
400
MW participation in the
900
MW Schkopau Power Station located in Germany. In connection with the sale of Schkopau, NRG entered into a foreign currency swap contract to hedge the impact of exchange rate fluctuations on the sale proceeds of
€141 million
. The Company received cash consideration, net of selling expenses, of
$174 million
, which included
$4 million
related to the settlement of the swap contract that was recorded as a gain within Other income, net in the quarter ended September 30, 2012. The cash consideration approximated the book value of the net assets, including cash of
$38 million
, on the date of the sale.
15
Note 4
—
Fair Value of Financial Instruments
This footnote should be read in conjunction with the complete description under
Note 4
,
Fair Value of Financial Instruments
, to the Company's
2012
Form 10-K.
For cash and cash equivalents, funds deposited by counterparties, accounts and other receivables, accounts payable, restricted cash, and cash collateral paid and received in support of energy risk management activities, the carrying amount approximates fair value because of the short-term maturity of those instruments and are classified as Level 1 within the fair value hierarchy.
The estimated carrying amounts and fair values of NRG's recorded financial instruments not carried at fair market value are as follows:
|
As of September 30, 2013
|
As of December 31, 2012
|
||||||||||||||
|
Carrying Amount
|
Fair Value
|
Carrying Amount
|
Fair Value
|
||||||||||||
|
|
(In millions)
|
||||||||||||||
|
Assets:
|
|
|
|
|
|||||||||||
|
Notes receivable
(a)
|
$
|
107
|
|
$
|
107
|
|
$
|
88
|
|
$
|
88
|
|
|||
|
Liabilities:
|
|||||||||||||||
|
Long-term debt, including current portion
|
16,699
|
|
17,061
|
|
15,866
|
|
16,492
|
|
|||||||
(a) Includes the current portion of notes receivable which is recorded in prepayments and other current assets on the Company's consolidated balance sheets.
The fair value of the Company's publicly-traded long-term debt is based on quoted market prices and is classified as Level 1 within the fair value hierarchy. The fair value of non publicly-traded long-term debt and certain notes receivable of the Company are based on expected future cash flows discounted at market interest rates, or current interest rates for similar instruments with equivalent credit quality, and are classified as Level 3 within the fair value hierarchy.
Recurring Fair Value Measurements
Debt securities, equity securities, and trust fund investments, which are comprised of various U.S. debt and equity securities, and derivative assets and liabilities, are carried at fair market value.
The following tables present assets and liabilities measured and recorded at fair value on the Company's condensed consolidated balance sheets on a recurring basis and their level within the fair value hierarchy:
|
As of September 30, 2013
|
|||||||||||||||
|
Fair Value
|
|||||||||||||||
|
(In millions)
|
Level 1
|
Level 2
|
Level 3
|
Total
|
|||||||||||
|
Investment in available-for-sale securities (classified within other
non-current assets):
|
|
||||||||||||||
|
Debt securities
|
$
|
—
|
|
$
|
—
|
|
$
|
15
|
|
$
|
15
|
|
|||
|
Other
(a)
|
37
|
|
—
|
|
—
|
|
37
|
|
|||||||
|
Trust fund investments:
|
|
||||||||||||||
|
Cash and cash equivalents
|
2
|
|
—
|
|
—
|
|
2
|
|
|||||||
|
U.S. government and federal agency obligations
|
51
|
|
4
|
|
—
|
|
55
|
|
|||||||
|
Federal agency mortgage-backed securities
|
—
|
|
58
|
|
—
|
|
58
|
|
|||||||
|
Commercial mortgage-backed securities
|
—
|
|
12
|
|
—
|
|
12
|
|
|||||||
|
Corporate debt securities
|
—
|
|
60
|
|
—
|
|
60
|
|
|||||||
|
Equity securities
|
281
|
|
—
|
|
55
|
|
336
|
|
|||||||
|
Foreign government fixed income securities
|
—
|
|
2
|
|
—
|
|
2
|
|
|||||||
|
Derivative assets:
|
|
||||||||||||||
|
Commodity contracts
|
436
|
|
1,337
|
|
111
|
|
1,884
|
|
|||||||
|
Interest rate contracts
|
—
|
|
11
|
|
—
|
|
11
|
|
|||||||
|
Total assets
|
$
|
807
|
|
$
|
1,484
|
|
$
|
181
|
|
$
|
2,472
|
|
|||
|
Derivative liabilities:
|
|
||||||||||||||
|
Commodity contracts
|
$
|
344
|
|
$
|
892
|
|
$
|
118
|
|
$
|
1,354
|
|
|||
|
Interest rate contracts
|
—
|
|
82
|
|
—
|
|
82
|
|
|||||||
|
Total liabilities
|
$
|
344
|
|
$
|
974
|
|
$
|
118
|
|
$
|
1,436
|
|
|||
16
|
As of December 31, 2012
|
|||||||||||||||
|
Fair Value
|
|||||||||||||||
|
(In millions)
|
Level 1
|
Level 2
|
Level 3
|
Total
|
|||||||||||
|
Investment in available-for-sale securities (classified within other
non-current assets):
|
|
||||||||||||||
|
Debt securities
|
$
|
—
|
|
$
|
—
|
|
$
|
12
|
|
$
|
12
|
|
|||
|
Other
(a)
|
44
|
|
—
|
|
—
|
|
44
|
|
|||||||
|
Trust fund investments:
|
|||||||||||||||
|
Cash and cash equivalents
|
10
|
|
—
|
|
—
|
|
10
|
|
|||||||
|
U.S. government and federal agency obligations
|
34
|
|
—
|
|
—
|
|
34
|
|
|||||||
|
Federal agency mortgage-backed securities
|
—
|
|
59
|
|
—
|
|
59
|
|
|||||||
|
Commercial mortgage-backed securities
|
—
|
|
9
|
|
—
|
|
9
|
|
|||||||
|
Corporate debt securities
|
—
|
|
80
|
|
—
|
|
80
|
|
|||||||
|
Equity securities
|
233
|
|
—
|
|
47
|
|
280
|
|
|||||||
|
Foreign government fixed income securities
|
—
|
|
2
|
|
—
|
|
2
|
|
|||||||
|
Derivative assets:
|
|
||||||||||||||
|
Commodity contracts
|
1,457
|
|
1,711
|
|
135
|
|
3,303
|
|
|||||||
|
Interest rate contracts
|
—
|
|
3
|
|
—
|
|
3
|
|
|||||||
|
Total assets
|
$
|
1,778
|
|
$
|
1,864
|
|
$
|
194
|
|
$
|
3,836
|
|
|||
|
Derivative liabilities:
|
|
||||||||||||||
|
Commodity contracts
|
$
|
1,144
|
|
$
|
1,047
|
|
$
|
147
|
|
$
|
2,338
|
|
|||
|
Interest rate contracts
|
—
|
|
143
|
|
—
|
|
143
|
|
|||||||
|
Total liabilities
|
$
|
1,144
|
|
$
|
1,190
|
|
$
|
147
|
|
$
|
2,481
|
|
|||
(a) Primarily consists of mutual funds held in rabbi trusts for non-qualified deferred compensation plans for certain former employees.
There were
no
transfers during the
three
and
nine
months ended
September 30, 2013
and
2012
, between Levels 1 and 2. The following tables reconcile, for the
three
and
nine
months ended
September 30, 2013
and
2012
, the beginning and ending balances for financial instruments that are recognized at fair value in the consolidated financial statements, at least annually, using significant unobservable inputs:
|
Fair Value Measurement Using Significant Unobservable Inputs (Level 3)
|
|||||||||||||||||||||||||||||||
|
Three months ended September 30, 2013
|
Nine months ended September 30, 2013
|
||||||||||||||||||||||||||||||
|
(In millions)
|
Debt Securities
|
Trust Fund Investments
|
Derivatives
(a)
|
Total
|
Debt Securities
|
Trust Fund Investments
|
Derivatives
(a)
|
Total
|
|||||||||||||||||||||||
|
Beginning balance
|
$
|
15
|
|
$
|
50
|
|
$
|
(12
|
)
|
$
|
53
|
|
$
|
12
|
|
$
|
47
|
|
$
|
(12
|
)
|
$
|
47
|
|
|||||||
|
Total gains/(losses) — realized/unrealized:
|
|
|
|||||||||||||||||||||||||||||
|
Included in earnings
|
—
|
|
—
|
|
14
|
|
14
|
|
—
|
|
—
|
|
(4
|
)
|
(4
|
)
|
|||||||||||||||
|
Included in OCI
|
—
|
|
—
|
|
—
|
|
—
|
|
3
|
|
—
|
|
—
|
|
3
|
|
|||||||||||||||
|
Included in nuclear decommissioning obligations
|
—
|
|
5
|
|
—
|
|
5
|
|
—
|
|
7
|
|
—
|
|
7
|
|
|||||||||||||||
|
Purchases
|
—
|
|
—
|
|
4
|
|
4
|
|
—
|
|
1
|
|
(3
|
)
|
(2
|
)
|
|||||||||||||||
|
Transfers into Level 3
(b)
|
—
|
|
—
|
|
(36
|
)
|
(36
|
)
|
—
|
|
—
|
|
(9
|
)
|
(9
|
)
|
|||||||||||||||
|
Transfers out of Level 3
(b)
|
—
|
|
—
|
|
23
|
|
23
|
|
—
|
|
—
|
|
21
|
|
21
|
|
|||||||||||||||
|
Ending balance as of
September 30, 2013
|
$
|
15
|
|
$
|
55
|
|
$
|
(7
|
)
|
$
|
63
|
|
$
|
15
|
|
$
|
55
|
|
$
|
(7
|
)
|
$
|
63
|
|
|||||||
|
Gains for the period included in earnings attributable to the change in unrealized gains or losses relating to assets or liabilities still held as of September 30, 2013
|
$
|
—
|
|
$
|
—
|
|
$
|
(7
|
)
|
$
|
(7
|
)
|
$
|
—
|
|
$
|
—
|
|
$
|
(4
|
)
|
$
|
(4
|
)
|
|||||||
|
(a)
|
Consists of derivative assets and liabilities, net.
|
|
(b)
|
Transfers in/out of Level 3 are related to the availability of external broker quotes and are valued as of the end of the reporting period. All transfers in/out are with Level 2.
|
17
|
Fair Value Measurement Using Significant Unobservable Inputs (Level 3)
|
|||||||||||||||||||||||||||||||
|
Three months ended September 30, 2012
|
Nine months ended September 30, 2012
|
||||||||||||||||||||||||||||||
|
(In millions)
|
Debt Securities
|
Trust Fund Investments
|
Derivatives
(a)
|
Total
|
Debt Securities
|
Trust Fund Investments
|
Derivatives
(a)
|
Total
|
|||||||||||||||||||||||
|
Beginning balance
|
$
|
9
|
|
$
|
43
|
|
$
|
171
|
|
$
|
223
|
|
$
|
7
|
|
$
|
42
|
|
$
|
8
|
|
$
|
57
|
|
|||||||
|
Total (losses)/gains — realized/unrealized:
|
|
|
|
|
|
||||||||||||||||||||||||||
|
Included in earnings
|
—
|
|
—
|
|
(9
|
)
|
(9
|
)
|
—
|
|
—
|
|
(3
|
)
|
(3
|
)
|
|||||||||||||||
|
Included in OCI
|
2
|
|
—
|
|
—
|
|
2
|
|
4
|
|
—
|
|
—
|
|
4
|
|
|||||||||||||||
|
Included in nuclear decommissioning obligations
|
—
|
|
3
|
|
—
|
|
3
|
|
—
|
|
3
|
|
—
|
|
3
|
|
|||||||||||||||
|
Purchases
|
—
|
|
—
|
|
(109
|
)
|
(109
|
)
|
—
|
|
1
|
|
(1
|
)
|
—
|
|
|||||||||||||||
|
Transfers into Level 3
(b)
|
—
|
|
—
|
|
(31
|
)
|
(31
|
)
|
—
|
|
—
|
|
4
|
|
4
|
|
|||||||||||||||
|
Transfers out of Level 3
(b)
|
—
|
|
—
|
|
(20
|
)
|
(20
|
)
|
—
|
|
—
|
|
(6
|
)
|
(6
|
)
|
|||||||||||||||
|
Ending balance as of
September 30, 2012
|
$
|
11
|
|
$
|
46
|
|
$
|
2
|
|
$
|
59
|
|
$
|
11
|
|
$
|
46
|
|
$
|
2
|
|
$
|
59
|
|
|||||||
|
(Losses)/gains for the period included in earnings attributable to the change in unrealized gains or losses relating to assets or liabilities still held as of September 30, 2012
|
$
|
—
|
|
$
|
—
|
|
$
|
(5
|
)
|
$
|
(5
|
)
|
$
|
—
|
|
$
|
—
|
|
$
|
1
|
|
|
$
|
1
|
|
||||||
|
(a)
|
Consists of derivative assets and liabilities, net.
|
|
(b)
|
Transfers in/out of Level 3 are related to the availability of external broker quotes and are valued as of the end of the reporting period. All transfers in/out are with Level 2.
|
Realized and unrealized gains and losses included in earnings that are related to the energy derivatives are recorded in operating revenues and cost of operations.
Derivative Fair Value Measurements
A portion of NRG's contracts are exchange-traded contracts with readily available quoted market prices. A majority of NRG's contracts are non-exchange-traded contracts valued using prices provided by external sources, primarily price quotations available through brokers or over-the-counter and on-line exchanges. For the majority of NRG's markets, the Company receives quotes from multiple sources. To the extent that NRG receives multiple quotes, the Company's prices reflect the average of the bid-ask mid-point prices obtained from all sources that NRG believes provide the most liquid market for the commodity. If the Company receives one quote, then the mid-point of the bid-ask spread for that quote is used. The terms for which such price information is available vary by commodity, region and product. A significant portion of the fair value of the Company's derivative portfolio is based on price quotes from brokers in active markets who regularly facilitate those transactions and the Company believes such price quotes are executable. The Company does not use third party sources that derive price based on proprietary models or market surveys. The remainder of the assets and liabilities represent contracts for which external sources or observable market quotes are not available for the whole term or for certain delivery months or the contracts are retail and load following power contracts. These contracts are valued using various valuation techniques including but not limited to internal models that apply fundamental analysis of the market and corroboration with similar markets. As of
September 30, 2013
, contracts valued with prices provided by models and other valuation techniques make up
6%
of the total derivative assets and
8%
of the total derivative liabilities.
The fair value of each contract is discounted using a risk free interest rate. In addition, the Company applies a credit reserve to reflect credit risk which is calculated based on published default probabilities. To the extent that NRG's net exposure under a specific master agreement is an asset, the Company uses the counterparty's default swap rate. If the net exposure under a specific master agreement is a liability, the Company uses NRG's default swap rate. The credit reserve is added to the discounted fair value to reflect the exit price that a market participant would be willing to receive to assume NRG's liabilities or that a market participant would be willing to pay for NRG's assets. As of
September 30, 2013
, the credit reserve resulted in a
$1 million
decrease in fair value which is composed of a
$1 million
gain in OCI, and a
$2 million
loss in operating revenue and cost of operations. As of
September 30, 2012
, the credit reserve resulted in a
$9 million
increase in fair value which is composed of a
$4 million
gain in OCI and a
$5 million
gain in operating revenue and cost of operations.
18
Concentration of Credit Risk
In addition to the credit risk discussion as disclosed in
Note 2
,
Summary of Significant Accounting Policies
, to the Company's
2012
Form 10-K, the following is a discussion of the concentration of credit risk for the Company's contractual obligations. Credit risk relates to the risk of loss resulting from non-performance or non-payment by counterparties pursuant to the terms of their contractual obligations. NRG is exposed to counterparty credit risk through various activities including wholesale sales, fuel purchases and retail supply arrangements, and retail customer credit risk through its retail load activities.
Counterparty Credit Risk
The Company monitors and manages counterparty credit risk through credit policies that include: (i) an established credit approval process; (ii) daily monitoring of counterparties' credit limits; (iii) the use of credit mitigation measures such as margin, collateral, prepayment arrangements, or volumetric limits; (iv) the use of payment netting arrangements; and (v) the use of master netting agreements that allow for the netting of positive and negative exposures of various contracts associated with a single counterparty. Risk surrounding counterparty performance and credit could ultimately impact the amount and timing of expected cash flows. The Company seeks to mitigate counterparty credit risk with a diversified portfolio of counterparties. The Company also has credit protection within various agreements to call on additional collateral support if and when necessary. Cash margin is collected and held at NRG to cover the credit risk of the counterparty until positions settle.
As of
September 30, 2013
, counterparty credit exposure, excluding credit risk exposure under certain long term agreements, was
$975 million
and NRG held collateral (cash and letters of credit) against those positions of
$44 million
, resulting in a net exposure of
$931 million
. Approximately
85%
of the Company's exposure before collateral is expected to roll off by the end of 2014. Counterparty credit exposure is valued through observable market quotes and discounted at a risk free interest rate. The following tables highlight net counterparty credit exposure by industry sector and by counterparty credit quality. Net counterparty credit exposure is defined as the aggregate net asset position for NRG with counterparties where netting is permitted under the enabling agreement and includes all cash flow, mark-to-market and NPNS, and non-derivative transactions. The exposure is shown net of collateral held, and includes amounts net of receivables or payables.
|
|
Net Exposure
(a)
|
|
|
Category
|
(% of Total)
|
|
|
Financial institutions
|
58
|
%
|
|
Utilities, energy merchants, marketers and other
|
34
|
|
|
ISOs
|
6
|
|
|
Coal and emissions
|
2
|
|
|
Total as of September 30, 2013
|
100
|
%
|
|
|
Net Exposure
(a)
|
|
|
Category
|
(% of Total)
|
|
|
Investment grade
|
96
|
%
|
|
Non-rated
(b)
|
4
|
|
|
Total as of September 30, 2013
|
100
|
%
|
|
(a)
|
Counterparty credit exposure excludes uranium and coal transportation contracts because of the unavailability of market prices.
|
|
(b)
|
For non-rated counterparties, a significant portion are related to ISO and municipal public power entities, which are considered investment grade equivalent ratings based on NRG's internal credit ratings.
|
NRG has counterparty credit risk exposure to certain counterparties, each of which, represent more than
10%
of total net exposure discussed above. The aggregate of such counterparties' exposure was
$316 million
. Changes in hedge positions and market prices will affect credit exposure and counterparty concentration. Given the credit quality, diversification and term of the exposure in the portfolio, NRG does not anticipate a material impact on the Company's financial position or results of operations from nonperformance by any of NRG's counterparties.
19
Counterparty credit exposure described above excludes credit risk exposure under certain long term agreements, including California tolling agreements, South Central load obligations, and solar PPAs. As external sources or observable market quotes are not available to estimate such exposure, the Company values these contracts based on various techniques including, but not limited to, internal models based on a fundamental analysis of the market and extrapolation of observable market data with similar characteristics. Based on these valuation techniques, as of
September 30, 2013
, aggregate credit risk exposure managed by NRG to these counterparties was approximately
$2.3 billion
, including
$649 million
related to assets of NRG Yield, Inc., for the next
five
years. This amount excludes potential credit exposures for projects with long term PPAs that have not reached commercial operations. The majority of these power contracts are with utilities or public power entities with strong credit quality and public utility commission or other regulatory support. However, such regulated utility counterparties can be impacted by changes in government regulations, which NRG is unable to predict.
Retail Customer Credit Risk
NRG is exposed to retail credit risk through the Company's retail electricity providers, which serve commercial, industrial and governmental/institutional customers and the Mass market. Retail credit risk results when a customer fails to pay for products or services rendered. The losses may result from both nonpayment of customer accounts receivable and the loss of in-the-money forward value. NRG manages retail credit risk through the use of established credit policies that include monitoring of the portfolio, and the use of credit mitigation measures such as deposits or prepayment arrangements.
As of
September 30, 2013
, the Company's retail customer credit exposure was diversified across many customers and various industries, as well as government entities.
Note 5
—
Nuclear Decommissioning Trust Fund
NRG's Nuclear Decommissioning Trust Fund assets are comprised of securities classified as available-for-sale and recorded at fair value based on actively quoted market prices. NRG accounts for the Nuclear Decommissioning Trust Fund in accordance with ASC 980,
Regulated Operations
, because the Company's nuclear decommissioning activities are subject to approval by the PUCT with regulated rates that are designed to recover all decommissioning costs and that can be charged to and collected from the ratepayers per PUCT mandate. Since the Company is in compliance with PUCT rules and regulations regarding decommissioning trusts and the cost of decommissioning is the responsibility of the Texas ratepayers, not NRG, all realized and unrealized gains or losses (including other-than-temporary impairments) related to the Nuclear Decommissioning Trust Fund are recorded to nuclear decommissioning trust liability and are not included in net income or accumulated other comprehensive income, consistent with regulatory treatment.
The following table summarizes the aggregate fair values and unrealized gains and losses (including other-than-temporary impairments) for the securities held in the trust funds, as well as information about the contractual maturities of those securities.
|
|
As of September 30, 2013
|
As of December 31, 2012
|
|||||||||||||||||||||||
|
(In millions, except otherwise noted)
|
Fair Value
|
Unrealized Gains
|
Unrealized Losses
|
Weighted-average Maturities (In years)
|
Fair Value
|
Unrealized Gains
(a)
|
Weighted-average Maturities (In years)
|
||||||||||||||||||
|
Cash and cash equivalents
|
$
|
2
|
|
$
|
—
|
|
$
|
—
|
|
—
|
|
$
|
10
|
|
$
|
—
|
|
—
|
|
||||||
|
U.S. government and federal agency obligations
|
54
|
|
2
|
|
1
|
|
9
|
|
33
|
|
2
|
|
10
|
|
|||||||||||
|
Federal agency mortgage-backed securities
|
58
|
|
1
|
|
1
|
|
24
|
|
59
|
|
2
|
|
23
|
|
|||||||||||
|
Commercial mortgage-backed securities
|
12
|
|
—
|
|
—
|
|
29
|
|
9
|
|
—
|
|
30
|
|
|||||||||||
|
Corporate debt securities
|
60
|
|
2
|
|
1
|
|
9
|
|
80
|
|
4
|
|
11
|
|
|||||||||||
|
Equity securities
|
336
|
|
187
|
|
—
|
|
—
|
|
280
|
|
143
|
|
—
|
|
|||||||||||
|
Foreign government fixed income securities
|
2
|
|
—
|
|
—
|
|
9
|
|
2
|
|
—
|
|
6
|
|
|||||||||||
|
Total
|
$
|
524
|
|
$
|
192
|
|
$
|
3
|
|
$
|
473
|
|
$
|
151
|
|
||||||||||
(a)There were
no
unrealized losses as of December 31, 2012.
The following table summarizes proceeds from sales of available-for-sale securities and the related realized gains and losses from these sales. The cost of securities sold is determined on the specific identification method.
|
|
Nine months ended September 30,
|
||||||
|
2013
|
2012
|
||||||
|
(In millions)
|
|||||||
|
Realized gains
|
$
|
10
|
|
$
|
8
|
|
|
|
Realized losses
|
7
|
|
5
|
|
|||
|
Proceeds from sale of securities
|
344
|
|
316
|
|
|||
20
Note 6
—
Accounting for Derivative Instruments and Hedging Activities
This footnote should be read in conjunction with the complete description under
Note 5
,
Accounting for Derivative Instruments and Hedging Activities
, to the Company's
2012
Form 10-K.
Energy-Related Commodities
As of
September 30, 2013
, NRG had energy-related derivative financial instruments extending through 2015, which are designated as cash flow hedges.
Interest Rate Swaps
NRG is exposed to changes in interest rates through the Company's issuance of variable and fixed rate debt. In order to manage the Company's interest rate risk, NRG enters into interest rate swap agreements. As of
September 30, 2013
, the Company had interest rate derivative instruments on non-recourse debt extending through 2030, the majority of which are designated as cash flow hedges.
Volumetric Underlying Derivative Transactions
The following table summarizes the net notional volume buy/(sell) of NRG's open derivative transactions broken out by commodity, excluding those derivatives that qualified for the NPNS exception as of
September 30, 2013
and
December 31, 2012
. Option contracts are reflected using delta volume. Delta volume equals the notional volume of an option adjusted for the probability that the option will be in-the-money at its expiration date.
|
|
|
Total Volume
|
||||||
|
September 30, 2013
|
December 31, 2012
|
|||||||
|
Commodity
|
Units
|
(In millions)
|
||||||
|
Emissions
|
Short Ton
|
(1
|
)
|
(1
|
)
|
|||
|
Coal
|
Short Ton
|
42
|
|
37
|
|
|||
|
Natural Gas
|
MMBtu
|
(215
|
)
|
(413
|
)
|
|||
|
Oil
|
Barrel
|
—
|
|
1
|
|
|||
|
Power
|
MWh
|
(16
|
)
|
(14
|
)
|
|||
|
Interest
|
Dollars
|
$
|
1,520
|
|
$
|
2,612
|
|
|
The decrease in the natural gas position was the result of additional purchases entered into during the year to hedge our retail portfolio as well as the settlement of positions during the period. These amounts were slightly offset by natural gas sales entered into during the year to hedge our conventional power generation. The decrease in the interest rate position was primarily the result of the settlement of interest rate swaps.
Fair Value of Derivative Instruments
The following table summarizes the fair value within the derivative instrument valuation on the balance sheets:
|
|
Fair Value
|
||||||||||||||
|
|
Derivative Assets
|
Derivative Liabilities
|
|||||||||||||
|
September 30, 2013
|
December 31, 2012
|
September 30, 2013
|
December 31, 2012
|
||||||||||||
|
(In millions)
|
|||||||||||||||
|
Derivatives designated as cash flow hedges:
|
|
|
|
|
|||||||||||
|
Interest rate contracts current
|
$
|
—
|
|
$
|
—
|
|
$
|
27
|
|
$
|
29
|
|
|||
|
Interest rate contracts long-term
|
8
|
|
3
|
|
47
|
|
96
|
|
|||||||
|
Commodity contracts current
|
—
|
|
—
|
|
2
|
|
3
|
|
|||||||
|
Commodity contracts long-term
|
—
|
|
—
|
|
1
|
|
1
|
|
|||||||
|
Total derivatives designated as cash flow hedges
|
8
|
|
3
|
|
77
|
|
129
|
|
|||||||
|
Derivatives not designated as cash flow hedges
:
|
|
|
|
|
|||||||||||
|
Interest rate contracts current
|
—
|
|
—
|
|
5
|
|
7
|
|
|||||||
|
Interest rate contracts long-term
|
3
|
|
—
|
|
3
|
|
11
|
|
|||||||
|
Commodity contracts current
|
1,389
|
|
2,644
|
|
1,030
|
|
1,942
|
|
|||||||
|
Commodity contracts long-term
|
495
|
|
659
|
|
321
|
|
392
|
|
|||||||
|
Total derivatives not designated as cash flow hedges
|
1,887
|
|
3,303
|
|
1,359
|
|
2,352
|
|
|||||||
|
Total derivatives
|
$
|
1,895
|
|
$
|
3,306
|
|
$
|
1,436
|
|
$
|
2,481
|
|
|||
21
The Company has elected to present derivative assets and liabilities on the balance sheet on a trade-by-trade basis and does not offset amounts at the counterparty master agreement level. In addition, collateral received or paid on the Company's derivative assets or liabilities are recorded on a separate line item on the balance sheet. The following table summarizes the offsetting of derivatives by counterparty master agreement level and collateral received or paid:
|
Gross Amounts Not Offset in the Statement of Financial Position
|
||||||||||||||||
|
Gross Amounts of Recognized Assets / Liabilities
|
Derivative Instruments
|
Cash Collateral (Held) / Posted
|
Net Amount
|
|||||||||||||
|
As of September 30, 2013
|
(In millions)
|
|||||||||||||||
|
Commodity contracts:
|
||||||||||||||||
|
Derivative assets
|
$
|
1,884
|
|
$
|
(1,151
|
)
|
$
|
(195
|
)
|
$
|
538
|
|
||||
|
Derivative liabilities
|
(1,354
|
)
|
1,151
|
|
65
|
|
(138
|
)
|
||||||||
|
Total commodity contracts
|
530
|
|
—
|
|
(130
|
)
|
400
|
|
||||||||
|
Interest rate contracts:
|
||||||||||||||||
|
Derivative assets
|
11
|
|
(6
|
)
|
—
|
|
5
|
|
||||||||
|
Derivative liabilities
|
(82
|
)
|
6
|
|
—
|
|
(76
|
)
|
||||||||
|
Total interest rate contracts
|
(71
|
)
|
—
|
|
—
|
|
(71
|
)
|
||||||||
|
Total derivative instruments
|
$
|
459
|
|
$
|
—
|
|
$
|
(130
|
)
|
$
|
329
|
|
||||
|
Gross Amounts Not Offset in the Statement of Financial Position
|
||||||||||||||||
|
Gross Amounts of Recognized Assets / Liabilities
|
Derivative Instruments
|
Cash Collateral (Held) / Posted
|
Net Amount
|
|||||||||||||
|
As of December 31, 2012
|
(In millions)
|
|||||||||||||||
|
Commodity contracts:
|
|
|||||||||||||||
|
Derivative assets
|
$
|
3,303
|
|
$
|
(2,024
|
)
|
$
|
(374
|
)
|
$
|
905
|
|
||||
|
Derivative liabilities
|
(2,338
|
)
|
2,024
|
|
28
|
|
(286
|
)
|
||||||||
|
Total commodity contracts
|
965
|
|
—
|
|
(346
|
)
|
619
|
|
||||||||
|
Interest rate contracts:
|
|
|||||||||||||||
|
Derivative assets
|
3
|
|
—
|
|
—
|
|
3
|
|
||||||||
|
Derivative liabilities
|
(143
|
)
|
—
|
|
—
|
|
(143
|
)
|
||||||||
|
Total interest rate contracts
|
(140
|
)
|
—
|
|
—
|
|
(140
|
)
|
||||||||
|
Total derivative instruments
|
$
|
825
|
|
$
|
—
|
|
$
|
(346
|
)
|
|
$
|
479
|
|
|||
Accumulated Other Comprehensive Income
The following table summarizes the effects of ASC 815,
Derivatives and Hedging
, or ASC 815, on the Company's accumulated OCI balance attributable to cash flow hedge derivatives, net of tax:
|
Three months ended September 30, 2013
|
Nine months ended September 30, 2013
|
||||||||||||||||||||||
|
Energy Commodities
|
Interest Rate
|
Total
|
Energy Commodities
|
Interest Rate
|
Total
|
||||||||||||||||||
|
(In millions)
|
|||||||||||||||||||||||
|
Accumulated OCI beginning balance
|
$
|
24
|
|
$
|
(31
|
)
|
$
|
(7
|
)
|
$
|
41
|
|
$
|
(72
|
)
|
$
|
(31
|
)
|
|||||
|
Reclassified from accumulated OCI to income:
|
|||||||||||||||||||||||
|
Due to realization of previously deferred amounts
|
(15
|
)
|
2
|
|
(13
|
)
|
(38
|
)
|
6
|
|
(32
|
)
|
|||||||||||
|
Mark-to-market of cash flow hedge accounting contracts
|
1
|
|
(4
|
)
|
(3
|
)
|
7
|
|
33
|
|
40
|
|
|||||||||||
|
Accumulated OCI ending balance, net of $13 tax
|
$
|
10
|
|
$
|
(33
|
)
|
$
|
(23
|
)
|
$
|
10
|
|
$
|
(33
|
)
|
$
|
(23
|
)
|
|||||
|
Gains/(losses) expected to be realized from OCI during the next 12 months, net of $1 tax
|
$
|
11
|
|
$
|
(9
|
)
|
$
|
2
|
|
$
|
11
|
|
$
|
(9
|
)
|
$
|
2
|
|
|||||
|
Gains recognized in income from the ineffective portion of cash flow hedges
|
$
|
1
|
|
$
|
—
|
|
$
|
1
|
|
$
|
—
|
|
$
|
—
|
|
$
|
—
|
|
|||||
22
|
Three months ended September 30, 2012
|
Nine months ended September 30, 2012
|
||||||||||||||||||||||
|
Energy Commodities
|
Interest Rate
|
Total
|
Energy Commodities
|
Interest Rate
|
Total
|
||||||||||||||||||
|
(In millions)
|
|||||||||||||||||||||||
|
Accumulated OCI beginning balance
|
$
|
111
|
|
$
|
(68
|
)
|
$
|
43
|
|
$
|
188
|
|
$
|
(56
|
)
|
$
|
132
|
|
|||||
|
Reclassified from accumulated OCI to income:
|
|||||||||||||||||||||||
|
Due to realization of previously deferred amounts
|
(30
|
)
|
3
|
|
(27
|
)
|
(106
|
)
|
11
|
|
(95
|
)
|
|||||||||||
|
Mark-to-market of cash flow hedge accounting contracts
|
(1
|
)
|
(15
|
)
|
(16
|
)
|
(2
|
)
|
(35
|
)
|
(37
|
)
|
|||||||||||
|
Accumulated OCI ending balance, net of $12 tax
|
$
|
80
|
|
$
|
(80
|
)
|
$
|
—
|
|
$
|
80
|
|
$
|
(80
|
)
|
$
|
—
|
|
|||||
|
Gains/(losses) expected to be realized from OCI during the next 12 months, net of $38 tax
|
$
|
77
|
|
$
|
(11
|
)
|
$
|
66
|
|
$
|
77
|
|
$
|
(11
|
)
|
$
|
66
|
|
|||||
|
Losses recognized in income from the ineffective portion of cash flow hedges
|
$
|
—
|
|
$
|
—
|
|
$
|
—
|
|
$
|
(51
|
)
|
$
|
—
|
|
$
|
(51
|
)
|
|||||
Amounts reclassified from accumulated OCI into income and amounts recognized in income from the ineffective portion of cash flow hedges are recorded to operating revenue for commodity contracts and interest expense for interest rate contracts.
Impact of Derivative Instruments on the Statements of Operations
Unrealized gains and losses associated with changes in the fair value of derivative instruments not accounted for as cash flow hedges and ineffectiveness of hedge derivatives are reflected in current period earnings.
The following table summarizes the pre-tax effects of economic hedges that have not been designated as cash flow hedges, ineffectiveness on cash flow hedges and trading activity on the Company's statement of operations. The effect of commodity hedges is included within operating revenues and cost of operations and the effect of interest rate hedges is included in interest expense.
|
Three months ended September 30,
|
Nine months ended September 30,
|
||||||||||||||
|
2013
|
2012
|
2013
|
2012
|
||||||||||||
|
Unrealized mark-to-market results
|
(In millions)
|
||||||||||||||
|
Reversal of previously recognized unrealized gains on settled positions related to economic hedges
|
$
|
(48
|
)
|
$
|
(85
|
)
|
$
|
(80
|
)
|
$
|
(160
|
)
|
|||
|
Reversal of (gain)/loss positions acquired as part of the Reliant Energy, Green Mountain Energy and GenOn acquisitions
|
(82
|
)
|
(15
|
)
|
(269
|
)
|
5
|
|
|||||||
|
Net unrealized gains/(losses) on open positions related to economic hedges
|
76
|
|
(159
|
)
|
131
|
|
(78
|
)
|
|||||||
|
Gains/(losses) on ineffectiveness associated with open positions treated as
cash flow hedges
|
1
|
|
—
|
|
—
|
|
(51
|
)
|
|||||||
|
Total unrealized mark-to-market losses for economic hedging activities
|
(53
|
)
|
(259
|
)
|
(218
|
)
|
(284
|
)
|
|||||||
|
Reversal of previously recognized unrealized gains on settled positions related to trading activity
|
(13
|
)
|
(15
|
)
|
(42
|
)
|
(45
|
)
|
|||||||
|
Reversal of gain positions acquired as part of the GenOn acquisitions
|
(2
|
)
|
—
|
|
(2
|
)
|
—
|
|
|||||||
|
Net unrealized gains/(losses) on open positions related to trading activity
|
26
|
|
(3
|
)
|
—
|
|
33
|
|
|||||||
|
Total unrealized mark-to-market gains/(losses) for trading activity
|
11
|
|
(18
|
)
|
(44
|
)
|
(12
|
)
|
|||||||
|
Total unrealized losses
|
$
|
(42
|
)
|
$
|
(277
|
)
|
$
|
(262
|
)
|
$
|
(296
|
)
|
|||
|
Three months ended September 30,
|
Nine months ended September 30,
|
||||||||||||||
|
2013
|
2012
|
2013
|
2012
|
||||||||||||
|
(In millions)
|
|||||||||||||||
|
Unrealized losses included in operating revenues
|
$
|
(64
|
)
|
$
|
(395
|
)
|
$
|
(404
|
)
|
$
|
(470
|
)
|
|||
|
Unrealized gains included in cost of operations
|
22
|
|
118
|
|
142
|
|
174
|
|
|||||||
|
Total impact to statement of operations — energy commodities
|
$
|
(42
|
)
|
$
|
(277
|
)
|
$
|
(262
|
)
|
$
|
(296
|
)
|
|||
|
Total impact to statement of operations — interest rate contracts
|
$
|
4
|
|
$
|
—
|
|
$
|
10
|
|
$
|
(12
|
)
|
|||
23
The reversal of gain or loss positions acquired as part of the Reliant Energy, Green Mountain Energy and GenOn acquisitions were valued based upon the forward prices on the acquisition dates.
For the
nine
months ended
September 30, 2013
, the unrealized gain from open economic hedge positions was primarily the result of an increase in value of forward sales of natural gas and electricity due to a decrease in forward natural gas and electricity prices.
As of June 30, 2013, NRG had interest rate swaps designated as cash flow hedges on the CVSR solar project. The notional amount on the swaps exceeded the actual debt draws on the project. As such, NRG discontinued cash flow hedge accounting for these contracts and
$5 million
of loss previously deferred in OCI was recognized in earnings for the
nine
months ended
September 30, 2013
.
For the
nine
months ended
September 30, 2012
, the unrealized loss from open economic hedge positions was primarily the result of a decrease in forward coal prices.
As of June 30, 2012, NRG had interest rate swaps designated as cash flow hedges on the Alpine solar project. The notional amount on the swaps exceeded the actual debt draws on the project. As such, NRG discontinued cash flow hedge accounting for these contracts and
$4 million
of loss previously deferred in OCI was recognized in earnings for the
nine
months ended
September 30, 2012
.
Credit Risk Related Contingent Features
Certain of the Company's hedging agreements contain provisions that require the Company to post additional collateral if the counterparty determines that there has been deterioration in credit quality, generally termed “adequate assurance” under the agreements, or requires the Company to post additional collateral if there were a one notch downgrade in the Company's credit rating. The collateral required for contracts with adequate assurance clauses that are in a net liability position as of
September 30, 2013
was
$103 million
. The collateral required for contracts with credit rating contingent features was
$39 million
. The Company is also a party to certain marginable agreements where NRG has a net liability position, but the counterparty has not called for the collateral due, which was approximately
$15 million
as of
September 30, 2013
.
See
Note 4
,
Fair Value of Financial Instruments
, to this Form 10-Q for discussion regarding concentration of credit risk.
24
Note 7
—
Debt and Capital Leases
This footnote should be read in conjunction with the complete description under
Note 11
,
Debt and Capital Leases
, to the Company's
2012
Form 10-K.
Long-term debt and capital leases consisted of the following:
|
September 30, 2013
|
December 31, 2012
|
Current interest rate %
(a)
|
||||||||
|
(In millions, except rates)
|
||||||||||
|
NRG recourse debt:
|
||||||||||
|
Senior notes, due 2018
|
$
|
1,130
|
|
$
|
1,200
|
|
7.625
|
|||
|
Senior notes, due 2019
|
800
|
|
800
|
|
7.625
|
|||||
|
Senior notes, due 2019
|
601
|
|
693
|
|
8.500
|
|||||
|
Senior notes, due 2020
|
1,063
|
|
1,100
|
|
8.250
|
|||||
|
Senior notes, due 2021
|
1,128
|
|
1,128
|
|
7.875
|
|||||
|
Senior notes, due 2023
|
990
|
|
990
|
|
6.625
|
|||||
|
Term loan facility, due 2018
|
2,006
|
|
1,573
|
|
L+2.00
|
|||||
|
Indian River Power LLC, tax-exempt bonds, due 2040 and 2045
|
247
|
|
247
|
|
5.375 - 6.000
|
|||||
|
Dunkirk Power LLC, tax-exempt bonds, due 2042
|
59
|
|
59
|
|
5.875
|
|||||
|
Fort Bend County, tax-exempt bonds, due 2038 and 2042
|
67
|
|
28
|
|
4.750
|
|||||
|
Subtotal NRG Recourse Debt
|
8,091
|
|
7,818
|
|
||||||
|
NRG non-recourse debt:
|
||||||||||
|
GenOn senior notes, due 2014
|
—
|
|
617
|
|
7.625
|
|||||
|
GenOn senior notes, due 2017
|
787
|
|
800
|
|
7.875
|
|||||
|
GenOn senior notes, due 2018
|
785
|
|
801
|
|
9.500
|
|||||
|
GenOn senior notes, due 2020
|
624
|
|
631
|
|
9.875
|
|||||
|
GenOn Americas Generation senior notes, due 2021
|
504
|
|
509
|
|
8.500
|
|||||
|
GenOn Americas Generation senior notes, due 2031
|
435
|
|
437
|
|
9.125
|
|||||
|
NRG Marsh Landing, due 2017 and 2023
|
500
|
|
390
|
|
L+2.50 - 2.75
|
|||||
|
CVSR - High Plains Ranch II LLC, due 2013 and 2037
|
1,104
|
|
786
|
|
0.611 - 3.579
|
|||||
|
NRG West Holdings LLC, due 2023
|
475
|
|
350
|
|
L+2.25 - 2.75
|
|||||
|
Agua Caliente Solar LLC, due 2037
|
764
|
|
640
|
|
2.395 - 3.473
|
|||||
|
Ivanpah Financing, due 2014 and 2038
|
1,561
|
|
1,437
|
|
1.116 - 4.256
|
|||||
|
South Trent Wind LLC, due 2020
|
69
|
|
72
|
|
L+2.625
|
|||||
|
NRG Peaker Finance Co. LLC, bonds, due 2019
|
176
|
|
173
|
|
L+1.07
|
|||||
|
NRG Energy Center Minneapolis LLC, senior secured notes, due 2013, 2017 and 2025
|
129
|
|
137
|
|
5.95 - 7.25
|
|||||
|
NRG Solar Alpine LLC, due 2013 and 2022
|
223
|
|
2
|
|
L+2.25 - 2.50
|
|||||
|
NRG Solar Borrego I LLC, due 2024 and 2038
|
79
|
|
—
|
|
L+2.50/5.65
|
|||||
|
NRG Solar Avra Valley LLC
|
64
|
|
66
|
|
L+2.25
|
|||||
|
TA - High Desert LLC, due 2013, 2023 and 2033
|
82
|
|
—
|
|
L+2.50/5.15
|
|||||
|
NRG Solar Kansas South LLC, due 2013 and 2031
|
59
|
|
—
|
|
L+2.00 - 2.625
|
|||||
|
Other
|
188
|
|
200
|
|
various
|
|||||
|
Subtotal NRG Non-Recourse Debt
|
8,608
|
|
8,048
|
|
||||||
|
Subtotal long-term debt (including current maturities)
|
16,699
|
|
15,866
|
|
||||||
|
Capital leases:
|
||||||||||
|
Chalk Point capital lease, due 2015
|
11
|
|
14
|
|
8.190
|
|||||
|
Other
|
3
|
|
3
|
|
various
|
|||||
|
Subtotal long-term debt and capital leases (including current maturities)
|
16,713
|
|
15,883
|
|
||||||
|
Less current maturities
|
911
|
|
147
|
|
||||||
|
Total long-term debt and capital leases
|
$
|
15,802
|
|
$
|
15,736
|
|
||||
(a) As of
September 30, 2013
, L+ equals 3 month LIBOR plus x%, with the exception of NRG Solar Alpine LLC cash grant loan and NRG Solar Kansas South LLC cash grant bridge loan which are 1 month LIBOR plus x% and NRG Solar Kansas South LLC term loan which is 6 month LIBOR plus x%.
25
NRG Recourse Debt
Senior Credit Facility
On June 4, 2013, NRG amended the Term Loan Facility to (i) obtain additional financing of
$450 million
, which was issued at a discount of
99.5%
; and (ii) adjust the interest rate from
LIBOR
plus
2.50%
to
LIBOR
plus
2.00%
. In addition, the Company redeemed and re-issued
$407 million
of the Term Loan Facility to new lenders resulting in a
$7 million
loss on debt extinguishment, recorded during the three months ended June 30, 2013, which primarily consisted of the write-off of previously deferred financing costs and unamortized discount. The proceeds from the additional
$450 million
borrowed were used for general corporate purposes. Debt issuance costs of
$23 million
and a discount on debt issuance of
$4 million
will be amortized to interest expense through the maturity date of the Term Loan Facility.
The Company also amended the Revolving Credit Facility to (i) increase the capacity by
$211 million
to a total of
$2.5 billion
; (ii) adjust the interest rate to
LIBOR
plus
2.25%
; and (iii) extend the maturity date to July 1, 2018 to coincide with the maturity date of the Term Loan Facility. As a result of the amended Revolving Credit Facility, the Company capitalized debt issuance costs of
$4 million
, which will be amortized to interest expense through the maturity date of the Revolving Credit Facility. A
$3 million
loss on debt extinguishment was recorded during the three months ended June 30, 2013 related to the write-off of previously deferred financing costs.
Senior Notes Repurchases
On December 17, 2012, NRG entered into an agreement with a financial institution to repurchase up to
$200 million
of the Senior Notes in the open market by February 27, 2013. In the first quarter of 2013, the Company paid
$80 million
,
$104 million
, and
$42 million
, at an average price of
114.179%
,
111.700%
, and
113.082%
of face value, for repurchases of the Company's 2018 Senior Notes, 2019 Senior Notes and 2020 Senior Notes, respectively. A
$28 million
loss on the debt extinguishment of the 2018 Senior Notes, 2019 Senior Notes and 2020 Senior Notes was recorded during the three months ended March 31, 2013 which primarily consisted of the premiums paid on the repurchases and the write-off of previously deferred financing costs.
NRG Non-Recourse Debt
Redemption of GenOn Senior Notes
In June 2013, the Company redeemed all of the 2014 GenOn Senior Notes with an aggregate outstanding principal amount of
$575 million
at a redemption price of
106.778%
of face value as well as any accrued and unpaid interest as of the redemption date. In connection with the redemption, an
$11 million
loss on the debt extinguishment of the 2014 GenOn Senior Notes was recorded during the three months ended June 30, 2013 which primarily consisted of a make whole premium payment offset by the write-off of unamortized premium.
Kansas South Facility
In the second quarter of 2013, the Company, through its wholly owned subsidiary, NRG Solar PV LLC, acquired Kansas South, a
20
MW utility-scale photovoltaic solar facility located in Kings County, California, shortly before commercial operation. In June 2013, NRG recorded
$59 million
of non-recourse project level debt under the Kansas South Facility which includes a
$38 million
term loan due 2031 and a
$21 million
cash grant bridge loan due the earlier of
10 days
after receipt of the cash grant or March 2014. The term loan has an interest rate of
6 month LIBOR
plus an applicable margin of
2.625%
and increases by
0.25%
every
four years
. The cash grant bridge loan has an interest rate of
1 month LIBOR
plus an applicable margin of
2.00%
. The term loan amortizes on a predetermined schedule and is secured by all of the assets of Kansas South. As of
September 30, 2013
,
$4 million
of letters of credit were issued under the Kansas South Facility.
NRG Repowering Holdings LLC Facility
In June 2013,
$82 million
of letters of credit issued under the NRG Repowering Holdings LLC Facility were returned to the Company. In July 2013, the NRG Repowering Holding LLC Facility was terminated and the Company issued replacement letters of credit under its Revolving Credit Facility.
Marsh Landing Credit Agreement Term Conversion
In May 2013, Marsh Landing met the conditions under the credit agreement to convert the construction loan for the facility to a term loan, which will amortize on a predetermined basis. Prior to term conversion, the Company drew the remaining funds available under the facility in order to pay costs due for construction. The Company issued a
$26 million
letter of credit under the facility in support of its debt service requirements.
26
Alpine Financing
In March 2012, NRG Solar Alpine LLC, or Alpine, entered into a credit agreement with a group of lenders for a
$166 million
construction loan that will convert to a term loan upon completion of the project and a
$68 million
cash grant loan. In January 2013, the credit agreement was amended reducing the cash grant loan to
$63 million
. In March 2013, Alpine met the conditions under the credit agreement to convert the construction loan for the facility to a term loan. Immediately prior to the conversion, the Company drew an additional
$164 million
under the construction loan and
$62 million
under the cash grant loan. The term loan amortizes on a predetermined schedule with final maturity in November 2022. As of
September 30, 2013
,
$161 million
was outstanding under the term loan,
$62 million
under the cash grant loan, and
$37 million
of letters of credit were issued under the credit agreement.
Borrego Financing
In March 2013, NRG Solar Borrego I LLC, or Borrego, entered into a credit agreement with a group of lenders, or the Borrego Financing Agreement, for
$45 million
of
5.65%
fixed rate notes and a
$36 million
term loan. The term loan has an interest rate of
3 month LIBOR
plus an applicable margin of
2.50%
, which escalates
0.25%
on the fourth and eighth anniversary of the closing date. The fixed rate notes mature in February 2038 and the term loan matures in December 2024. Both amortize based upon predetermined schedules. The Borrego Financing Agreement also includes a letter of credit facility on behalf of Borrego of up to
$5 million
. Borrego pays an availability fee of
100%
of the applicable margin on issued letters of credit. As of
September 30, 2013
,
$45 million
was outstanding under the fixed rate notes,
$34 million
was outstanding under the term loan, and
$5 million
of letters of credit in support of the project were issued.
Under the terms of the Borrego Financing Agreement, on March 28, 2013, Borrego was required to enter into
two
fixed for floating interest rate swaps that would fix the interest rate for a minimum of
75%
of the outstanding notional amount. Borrego will pay its counterparty the equivalent of a
1.125%
fixed interest payment on a predetermined notional value, and Borrego will receive quarterly the equivalent of a floating interest payment based on a
3 month LIBOR
calculated on the same notional value through June 30, 2020. All interest rate swap payments by Borrego and its counterparties are made quarterly and the LIBOR rate is determined in advance of each interest period. The original notional amount of the swaps, which became effective April 3, 2013, is
$15 million
and will amortize in proportion to the term loan.
High Desert Facility
In the first quarter of 2013, the Company, through its wholly owned subsidiary, NRG Solar PV LLC, acquired High Desert, a
20
MW utility-scale photovoltaic solar facility located in Lancaster, California, shortly before commercial operation. As part of the acquisition of High Desert, NRG recorded
$82 million
of non-recourse project level debt in March 2013 issued under the High Desert Facility which is comprised of
$53 million
of fixed rate notes due 2033 at an interest rate of
5.15%
,
$7 million
of floating rate notes due 2023,
$22 million
of bridge notes due the earlier of
10
days after receipt of the cash grant or February 2014 and a revolving facility of
$12 million
. The floating rate notes, bridge notes and revolving facility have an interest rate of
3 month LIBOR
plus
2.50%
. The revolving facility can be used for cash or for the issuance of up to
$9 million
in letters of credit. As of
September 30, 2013
,
$9 million
of letters of credit were issued under the revolving facility. The notes amortize on predetermined schedules and are secured by all of the assets of High Desert.
NRG Yield Revolving Credit Facility
In connection with the initial public offering of Class A common stock of NRG Yield, Inc. in July 2013, as further described in Note 1,
Basis of Presentation
, NRG Yield LLC and its direct wholly owned subsidiary, NRG Yield Operating LLC, entered into a senior secured revolving credit facility, which provides a revolving line of credit of
$60 million
. The NRG Yield revolving credit facility can be used for cash or for the issuance of letters of credit. There was no cash drawn or letters of credit issued under the NRG Yield revolving credit facility as of
September 30, 2013
.
27
Note 8
—
Variable Interest Entities
NRG has interests in entities that are considered VIEs under ASC 810,
Consolidation
, but NRG is not considered the primary beneficiary. NRG accounts for its interests in these entities under the equity method of accounting.
GenConn Energy LLC
—
Through its subsidiary, NRG Connecticut Peaking Development LLC, NRG owns a
50%
interest in GenConn, a limited liability company which owns and operates
two
190
MW peaking generation facilities in Connecticut at NRG's Devon and Middletown sites. NRG's maximum exposure to loss is limited to its equity investment, which was
$118 million
as of
September 30, 2013
.
Sherbino I Wind Farm LLC
—
NRG owns a
50%
interest in Sherbino, a joint venture with BP Wind Energy North America Inc. NRG's maximum exposure to loss is limited to its equity investment, which was
$88 million
as of
September 30, 2013
.
Texas Coastal Ventures LLC
—
NRG owns a
50%
interest in Texas Coastal Ventures, a joint venture with Hilcorp Energy I, L.P., through its subsidiary Petra Nova LLC. NRG's maximum exposure to loss is limited to its equity investment, which was
$63 million
as of
September 30, 2013
.
Note 9
—
Changes in Capital Structure
As of
September 30, 2013
and
December 31, 2012
, the Company had
500,000,000
shares of common stock authorized. The following table reflects the changes in NRG's common shares issued and outstanding:
|
Issued
|
Treasury
|
Outstanding
|
||||||
|
Balance as of December 31, 2012
|
399,112,616
|
|
(76,505,718
|
)
|
322,606,898
|
|
||
|
Shares issued under LTIP
|
1,562,480
|
|
—
|
|
1,562,480
|
|
||
|
Shares issued under ESPP
|
—
|
|
130,482
|
|
130,482
|
|
||
|
Shares repurchased under Capital Allocation Program
|
—
|
|
(972,292
|
)
|
(972,292
|
)
|
||
|
Balance as of September 30, 2013
|
400,675,096
|
|
(77,347,528
|
)
|
323,327,568
|
|
||
As discussed in Note 3,
Business Acquisition and Dispositions
, the Company announced its intention to issue
12,671,977
shares of NRG common stock in connection with the acquisition of EME, expected to close in the first quarter of 2014.
2013 Capital Allocation Program
In 2013, the Company increased its annual common stock dividend by
33%
, to $
0.48
per share. The following table lists the dividends paid during 2013:
|
First Quarter 2013
|
Second Quarter 2013
|
Third Quarter 2013
|
|||||||||
|
Dividends per Common Share
|
$
|
0.09
|
|
$
|
0.12
|
|
$
|
0.12
|
|
||
On October 16, 2013, NRG declared a quarterly dividend on the Company's common stock of
$0.12
per share, payable on November 15, 2013, to shareholders of record as of November 1, 2013.
In addition, the Company is authorized to repurchase
$200 million
of its common stock in 2013 under the 2013 Capital Allocation Program. During the first quarter, the Company purchased
972,292
shares of NRG common stock for approximately
$25 million
at an average cost of
$25.88
per share. As a result of the proposed acquisition of EME, the Company has not completed the remaining
$175 million
of share repurchases under the 2013 Capital Allocation Program and does not expect to do so through the remainder of the 2013 fiscal year.
The Company's common stock dividend and share repurchases are subject to available capital, market conditions, and compliance with associated laws and regulations.
28
Note 10
—
Earnings/(Loss) Per Share
Basic earnings/(loss) per common share is computed by dividing net income/(loss) less accumulated preferred stock dividends by the weighted average number of common shares outstanding. Shares issued and treasury shares repurchased during the year are weighted for the portion of the year that they were outstanding. Diluted earnings/(loss) per share is computed in a manner consistent with that of basic earnings/(loss) per share while giving effect to all potentially dilutive common shares that were outstanding during the period.
The reconciliation of NRG's basic and diluted earnings/(loss) per share is shown in the following table:
|
Three months ended September 30,
|
Nine months ended September 30,
|
||||||||||||||
|
(In millions, except per share data)
|
2013
|
2012
|
2013
|
2012
|
|||||||||||
|
Basic earnings/(loss) per share attributable to NRG common stockholders
|
|||||||||||||||
|
Net income/(loss) attributable to NRG Energy, Inc.
|
$
|
124
|
|
$
|
(1
|
)
|
$
|
(74
|
)
|
$
|
43
|
|
|||
|
Dividends for preferred shares
|
2
|
|
2
|
|
7
|
|
7
|
|
|||||||
|
Income/(loss) Available for Common Stockholders
|
$
|
122
|
|
$
|
(3
|
)
|
$
|
(81
|
)
|
|
$
|
36
|
|
||
|
Weighted average number of common shares outstanding
|
323
|
|
|
228
|
|
|
323
|
|
|
228
|
|
||||
|
Earnings/(loss) per weighted average common share — basic
|
$
|
0.38
|
|
$
|
(0.01
|
)
|
$
|
(0.25
|
)
|
$
|
0.16
|
|
|||
|
Diluted earnings/(loss) per share attributable to NRG common stockholders
|
|||||||||||||||
|
Weighted average number of common shares outstanding
|
323
|
|
228
|
|
323
|
|
228
|
|
|||||||
|
Incremental shares attributable to the issuance of equity compensation (treasury stock method)
|
4
|
|
—
|
|
—
|
|
2
|
|
|||||||
|
Total dilutive shares
|
327
|
|
228
|
|
323
|
|
230
|
|
|||||||
|
Earnings/(loss) per weighted average common share — diluted
|
$
|
0.37
|
|
$
|
(0.01
|
)
|
$
|
(0.25
|
)
|
$
|
0.16
|
|
|||
The following table summarizes NRG’s outstanding equity instruments that are anti-dilutive and were not included in the computation of the Company’s diluted earnings/(loss) per share:
|
Three months ended September 30,
|
Nine months ended September 30,
|
||||||||||
|
(In millions of shares)
|
2013
|
2012
|
2013
|
2012
|
|||||||
|
Equity compensation plans
|
2
|
|
11
|
|
10
|
|
6
|
|
|||
|
Embedded derivative of 3.625% redeemable perpetual preferred stock
|
16
|
|
16
|
|
16
|
|
16
|
|
|||
|
Total
|
18
|
|
27
|
|
26
|
|
22
|
|
|||
29
Note 11
—
Segment Reporting
Effective June 2013, the Company's segment structure and its allocation of corporate expenses were updated to reflect how management currently makes financial decisions and allocates resources. The Company has recast data from prior periods to reflect this change in reportable segments to conform to the current year presentation. The Company's businesses are primarily segregated based on the Retail Business, conventional power generation, alternative energy businesses, NRG Yield, and corporate activities. Within NRG's conventional power generation, there are distinct components with separate operating results and management structures for the following geographical regions: Texas, East, South Central, West and Other, which includes international businesses and maintenance services. The Company's alternative energy segment includes solar and wind assets, excluding those in the NRG Yield segment, electric vehicle services and the carbon capture business. NRG Yield includes certain of the Company's contracted generation assets including three natural gas or dual-fired facilities, eight utility-scale solar and wind generation facilities, two portfolios of distributed solar facilities and thermal infrastructure assets. Intersegment sales are accounted for at market.
|
(In millions)
|
|
Conventional Power Generation
|
|
|
|
|
|||||||||||||||||||||||||||||||||||||
|
Three months ended September 30, 2013
|
Retail
(a)
|
Texas
(a)
|
East
(a)
|
South
(a)
Central
|
West
(a)
|
Other
(a)
|
Alternative Energy
(a)
|
NRG Yield
(a)
|
Corporate
(a)(b)
|
Elimination
|
Total
|
||||||||||||||||||||||||||||||||
|
Operating revenues
|
$
|
1,994
|
|
$
|
881
|
|
$
|
1,011
|
|
$
|
244
|
|
$
|
134
|
|
$
|
38
|
|
$
|
83
|
|
$
|
95
|
|
$
|
—
|
|
$
|
(990
|
)
|
$
|
3,490
|
|
||||||||||
|
Depreciation and amortization
|
37
|
|
116
|
|
79
|
|
24
|
|
13
|
|
1
|
|
27
|
|
16
|
|
5
|
|
—
|
|
318
|
|
|||||||||||||||||||||
|
Equity in earnings/(losses) of unconsolidated affiliates
|
—
|
|
—
|
|
—
|
|
1
|
|
(10
|
)
|
—
|
|
(3
|
)
|
12
|
|
—
|
|
(5
|
)
|
(5
|
)
|
|||||||||||||||||||||
|
(Loss)/income before income taxes
|
(60
|
)
|
265
|
|
245
|
|
17
|
|
30
|
|
1
|
|
1
|
|
45
|
|
(217
|
)
|
(21
|
)
|
306
|
|
|||||||||||||||||||||
|
Net (loss)/income attributable to NRG Energy, Inc.
|
$
|
(60
|
)
|
$
|
265
|
|
$
|
245
|
|
$
|
17
|
|
$
|
30
|
|
$
|
1
|
|
$
|
(21
|
)
|
$
|
31
|
|
$
|
(375
|
)
|
$
|
(9
|
)
|
$
|
124
|
|
||||||||||
|
Total assets as of September 30, 2013
|
$
|
4,296
|
|
$
|
11,914
|
|
$
|
8,329
|
|
$
|
2,290
|
|
$
|
1,553
|
|
$
|
461
|
|
$
|
6,162
|
|
$
|
2,331
|
|
$
|
4,863
|
|
$
|
(7,336
|
)
|
$
|
34,863
|
|
||||||||||
|
(a) Operating revenues include inter-segment sales and net derivative gains and losses of:
|
$
|
2
|
|
$
|
910
|
|
$
|
55
|
|
$
|
—
|
|
$
|
—
|
|
$
|
15
|
|
$
|
8
|
|
$
|
—
|
|
$
|
—
|
|
||||||||
(b)
Includes loss on debt extinguishment of
$1 million
.
|
(In millions)
|
|
Conventional Power Generation
|
|
|
|
|
|||||||||||||||||||||||||||||||||||||
|
Three months ended September 30, 2012
|
Retail
(c)
|
Texas
(c)
|
East
(c)
|
South
(c)
Central
|
West
(c)
|
Other
(c)
|
Alternative Energy
(c)
|
NRG Yield
(c)
|
Corporate
(c)(d)
|
Elimination
|
Total
|
||||||||||||||||||||||||||||||||
|
Operating revenues
|
$
|
1,856
|
|
$
|
877
|
|
$
|
274
|
|
$
|
270
|
|
$
|
87
|
|
$
|
28
|
|
$
|
49
|
|
$
|
47
|
|
$
|
4
|
|
$
|
(1,161
|
)
|
$
|
2,331
|
|
||||||||||
|
Depreciation and amortization
|
41
|
|
115
|
|
32
|
|
23
|
|
3
|
|
1
|
|
15
|
|
6
|
|
3
|
|
—
|
|
239
|
|
|||||||||||||||||||||
|
Equity in earnings/(losses) of unconsolidated affiliates
|
—
|
|
—
|
|
—
|
|
—
|
|
4
|
|
3
|
|
(9
|
)
|
6
|
|
—
|
|
—
|
|
4
|
|
|||||||||||||||||||||
|
(Loss)/income before income taxes
|
(300
|
)
|
299
|
|
30
|
|
19
|
|
35
|
|
5
|
|
(8
|
)
|
12
|
|
(197
|
)
|
—
|
|
(105
|
)
|
|||||||||||||||||||||
|
Net (loss)/income attributable to NRG Energy, Inc.
|
$
|
(300
|
)
|
$
|
299
|
|
$
|
30
|
|
$
|
19
|
|
$
|
35
|
|
$
|
5
|
|
$
|
(16
|
)
|
$
|
4
|
|
$
|
(77
|
)
|
$
|
—
|
|
$
|
(1
|
)
|
||||||||||
|
(c) Operating revenues include inter-segment sales and net derivative gains and losses of:
|
$
|
3
|
|
$
|
1,126
|
|
$
|
6
|
|
$
|
—
|
|
$
|
—
|
|
$
|
12
|
|
$
|
10
|
|
$
|
—
|
|
$
|
4
|
|
||||||||
(d)
Includes loss on debt extinguishment of
$41 million
.
30
|
(In millions)
|
|
Conventional Power Generation
|
|
|
|
|
|||||||||||||||||||||||||||||||||||||
|
Nine months ended September 30, 2013
|
Retail
(e)
|
Texas
(e)
|
East
(e)
|
South
(e)
Central
|
West
(e)
|
Other
(e)
|
Alternative Energy
(e)
|
NRG Yield
(e)
|
Corporate
(e)(f)
|
Elimination
|
Total
|
||||||||||||||||||||||||||||||||
|
Operating revenues
|
$
|
4,760
|
|
$
|
1,712
|
|
$
|
2,432
|
|
$
|
656
|
|
$
|
347
|
|
$
|
110
|
|
$
|
177
|
|
$
|
227
|
|
$
|
9
|
|
$
|
(1,930
|
)
|
$
|
8,500
|
|
||||||||||
|
Depreciation and amortization
|
105
|
|
340
|
|
236
|
|
73
|
|
37
|
|
3
|
|
78
|
|
35
|
|
14
|
|
—
|
|
921
|
|
|||||||||||||||||||||
|
Equity in (losses)/earnings of unconsolidated affiliates
|
—
|
|
—
|
|
—
|
|
3
|
|
(8
|
)
|
2
|
|
(7
|
)
|
18
|
|
—
|
|
(2
|
)
|
6
|
|
|||||||||||||||||||||
|
Income/(loss) before income taxes
|
231
|
|
14
|
|
238
|
|
17
|
|
62
|
|
3
|
|
(48
|
)
|
90
|
|
(695
|
)
|
(6
|
)
|
(94
|
)
|
|||||||||||||||||||||
|
Net income/(loss) attributable to NRG Energy, Inc.
|
$
|
231
|
|
$
|
14
|
|
$
|
238
|
|
$
|
17
|
|
$
|
62
|
|
$
|
2
|
|
$
|
(75
|
)
|
$
|
76
|
|
$
|
(642
|
)
|
$
|
3
|
|
$
|
(74
|
)
|
||||||||||
|
(e) Operating revenues include inter-segment sales and net derivative gains and losses of:
|
$
|
4
|
|
$
|
1,732
|
|
$
|
99
|
|
$
|
16
|
|
$
|
3
|
|
$
|
48
|
|
$
|
19
|
|
—
|
|
$
|
9
|
|
||||||||
(f)
Includes loss on debt extinguishment of
$50 million
.
|
(In millions)
|
|
Conventional Power Generation
|
|
|
|
|
|||||||||||||||||||||||||||||||||||||
|
Nine months ended September 30, 2012
|
Retail
(g)
|
Texas
(g)
|
East
(g)
|
South
(g)
Central
|
West
|
Other
(g)
|
Alternative Energy
(g)
|
NRG Yield
(g)
|
Corporate
(g)(h)
|
Elimination
|
Total
|
||||||||||||||||||||||||||||||||
|
Operating revenues
|
$
|
4,492
|
|
$
|
1,462
|
|
$
|
598
|
|
$
|
653
|
|
$
|
185
|
|
$
|
152
|
|
$
|
91
|
|
$
|
133
|
|
$
|
11
|
|
$
|
(1,418
|
)
|
$
|
6,359
|
|
||||||||||
|
Depreciation and amortization
|
126
|
|
343
|
|
96
|
|
69
|
|
8
|
|
1
|
|
34
|
|
18
|
|
8
|
|
—
|
|
703
|
|
|||||||||||||||||||||
|
Equity in earnings/(losses) of unconsolidated affiliates
|
—
|
|
—
|
|
—
|
|
—
|
|
6
|
|
8
|
|
(3
|
)
|
15
|
|
—
|
|
$
|
—
|
|
$
|
26
|
|
|||||||||||||||||||
|
Income/(loss) before income taxes
|
504
|
|
(202
|
)
|
(31
|
)
|
—
|
|
42
|
|
22
|
|
(27
|
)
|
18
|
|
(511
|
)
|
—
|
|
(185
|
)
|
|||||||||||||||||||||
|
Net income/(loss) attributable to NRG Energy, Inc.
|
$
|
504
|
|
$
|
(202
|
)
|
$
|
(31
|
)
|
$
|
—
|
|
$
|
42
|
|
$
|
18
|
|
$
|
(45
|
)
|
$
|
8
|
|
$
|
(251
|
)
|
$
|
—
|
|
$
|
43
|
|
||||||||||
|
(g) Operating revenues include inter-segment sales and net derivative gains and losses of:
|
$
|
3
|
|
$
|
1,287
|
|
$
|
51
|
|
$
|
—
|
|
$
|
—
|
|
$
|
55
|
|
$
|
18
|
|
$
|
—
|
|
$
|
4
|
|
||||||||
(h)
Includes loss on debt extinguishment of
$41 million
.
31
Note 12
—
Income Taxes
Effective Tax Rate
The income tax provision consisted of the following:
|
|
Three months ended September 30,
|
Nine months ended September 30,
|
||||||||||||
|
(In millions except otherwise noted)
|
2013
|
2012
|
2013
|
2012
|
||||||||||
|
Income/(loss) before income taxes
|
$
|
306
|
|
$
|
(105
|
)
|
(94
|
)
|
$
|
(185
|
)
|
|||
|
Income tax expense/(benefit)
|
163
|
|
(113
|
)
|
(47
|
)
|
(246
|
)
|
||||||
|
Effective tax rate
|
53.3
|
%
|
107.6
|
%
|
50.0
|
%
|
133.0
|
%
|
||||||
For the three months ended
September 30, 2013
, NRG's overall effective tax rate was different than the statutory rate of
35%
primarily due to the impact of state and local income taxes. For the nine months ended September 30, 2013, NRG's overall effective rate was different than the statutory rate of 35% primarily due to the recognition of ITCs from the Company's Agua Caliente solar project in Arizona and the impact of non-taxable equity earnings, partially offset by state and local income taxes.
For the three and
nine
months ended
September 30, 2012
, NRG's overall effective tax rate was different than the statutory rate of
35%
primarily due to the recognition of ITCs from the Company's Agua Caliente solar project in Arizona and production tax credits generated from certain Texas wind facilities.
Uncertain Tax Benefits
As of
September 30, 2013
, NRG has recorded a non-current tax liability of
$74 million
for uncertain tax benefits from positions taken on various state income tax returns, including accrued interest. NRG has accrued interest related to these uncertain tax benefits of
$1 million
for the
nine
months ended
September 30, 2013
, and has accrued
$17 million
of interest and penalties since adoption. The Company recognizes interest and penalties related to uncertain tax benefits in income tax expense.
NRG is subject to examination by taxing authorities for income tax returns filed in the U.S. federal jurisdiction and various state and foreign jurisdictions including operations located in Australia. The Company is not subject to U.S. federal income tax examinations for years prior to 2007. With few exceptions, state and local income tax examinations are no longer open for years before 2004. The Company's primary foreign operations are also no longer subject to examination by local jurisdictions for years prior to 2010.
32
Note 13
—
Commitments and Contingencies
Commitments
First Lien Structure
NRG has granted first liens to certain counterparties on a substantial portion of the Company's assets, excluding assets acquired in the GenOn acquisition and assets held by NRG Yield, Inc., to reduce the amount of cash collateral and letters of credit that it would otherwise be required to post from time to time to support its obligations under out-of-the-money hedge agreements for forward sales of power or MWh equivalents. The Company's lien counterparties may have a claim on NRG's assets to the extent market prices exceed the hedged price. As of
September 30, 2013
, hedges under the first lien were
in-the-money
for NRG on a counterparty aggregate basis.
Nuclear Insurance
STP maintains required insurance coverage for liability claims arising from nuclear incidents pursuant to the Price-Anderson Amendment to the Energy Policy Act of 2005, referred to as the Price-Anderson Act. As of
September 30, 2013
, the liability limit per incident was
$13.6 billion
, subject to changes to account for the effects of inflation and the number of licensed reactors. Under the Price-Anderson Act, owners of nuclear power plants in the U.S. are required to purchase primary insurance limits of
$375 million
for each operating site. In addition, the Price-Anderson Act requires an additional layer of protection through mandatory participation in a retrospective rating plan for power reactors resulting in an additional
$13.2 billion
in funds available for public liability claims. The current maximum assessment per incident, per reactor, is approximately
$127 million
, taking into account a
5%
adjustment for administrative fees, payable at no more than approximately
$19 million
per year, per reactor. NRG would be responsible for
44%
of the maximum assessment, or
$8 million
per year, per reactor, and a maximum of
$112 million
per incident. In addition, the U.S. Congress retains the ability to impose additional financial requirements on the nuclear industry to pay liability claims that exceed
$13.6 billion
for a single incident. The liabilities of the co-owners of STP with respect to the retrospective premium assessments for nuclear liability insurance are joint and several.
STP purchases insurance for property damage and site decontamination cleanup costs from Nuclear Electric Insurance Limited, or NEIL, an industry mutual insurance company, of which STP is a member. STP has purchased
$2.75 billion
in limits for nuclear events and
$1.5 billion
in limits for non-nuclear events, the maximum available from NEIL. The upper
$1 billion
in limits (excess of the first
$1.75 billion
in limits) is a single limit blanket policy shared with two Diablo Canyon nuclear reactors, which have no affiliation with the Company. This shared limit is not subject to automatic reinstatement in the event of a loss. The NEIL policy covers both nuclear and non-nuclear property damage events. NRG also purchases an Accidental Outage policy from NEIL, which provides protection for lost revenue due to an insurable event. This coverage allows for reimbursement up to
$1.98 million
per week per unit up to a maximum of
$215.6 million
nuclear and
$144 million
non-nuclear, and is subject to an
eight
week waiting period. Under the terms of the NEIL policies, member companies may be assessed up to
ten
times their annual premium if the NEIL Board of Directors determines their surplus has been depleted due to the payment of property losses at any of the licensed reactors in a single policy year. NEIL requires that its members maintain an investment grade credit rating or insure their annual retrospective obligation by providing a financial guarantee, letter of credit, deposit premium, or an insurance policy. NRG has purchased an insurance policy from NEIL to guarantee the Company's obligation; however this insurance will only respond to retrospective premium adjustments assessed within
twenty-four
months after the policy term, whereas NEIL's Board of Directors can make such an adjustment up to
six
years after the policy expires.
Contingencies
The Company's material legal proceedings are described below. The Company believes that it has valid defenses to these legal proceedings and intends to defend them vigorously. NRG records reserves for estimated losses from contingencies when information available indicates that a loss is probable and the amount of the loss, or range of loss, can be reasonably estimated. In addition, legal costs are expensed as incurred. Management has assessed each of the following matters based on current information and made a judgment concerning its potential outcome, considering the nature of the claim, the amount and nature of damages sought, and the probability of success. Unless specified below, the Company is unable to predict the outcome of these legal proceedings or reasonably estimate the scope or amount of any associated costs and potential liabilities. As additional information becomes available, management adjusts its assessment and estimates of such contingencies accordingly. Because litigation is subject to inherent uncertainties and unfavorable rulings or developments, it is possible that the ultimate resolution of the Company's liabilities and contingencies could be at amounts that are different from its currently recorded reserves and that such difference could be material.
In addition to the legal proceedings noted below, NRG and its subsidiaries are party to other litigation or legal proceedings arising in the ordinary course of business. In management's opinion, the disposition of these ordinary course matters will not materially adversely affect NRG's consolidated financial position, results of operations, or cash flows.
33
Louisiana Generating, LLC
In 2009, the U.S. DOJ, on behalf of the EPA, and later the Louisiana Department of Environmental Quality, or LDEQ, on behalf of the State of Louisiana, sued Louisiana Generating, LLC, or LaGen, a wholly owned subsidiary of NRG, in federal district court in the Middle District of Louisiana alleging violations of the CAA at the Big Cajun II power plant. On March 6, 2013, the court entered a Consent Decree resolving the matter. In addition to a fine of
$3.5 million
and mitigation projects totaling
$10.5 million
, the Consent Decree includes: (i) annual emission caps for NO
x
and SO
2
;
(ii) installation of selective non-catalytic reduction on Units 1, 2 and 3 by May 1, 2014; (iii) installation of dry sorbent injection on Unit 1 by April 15, 2015 followed by a further reduction in SO
2
in March 2025; (iv) conversion of Unit 2 to natural gas; and (v) surrender of any excess allowances associated with the NRG owned portion of the plant. Further discussion of this matter can be found in
Note 15
,
Environmental Matters
- South Central Region
.
In a related matter, soon after the filing of the above referenced U.S. DOJ lawsuit, LaGen sought insurance coverage from its insurance carrier, Illinois Union Insurance Company, or ILU. ILU denied coverage and refused to provide a defense for LaGen, and thereafter LaGen filed a lawsuit in federal district court in the Middle District of Louisiana (which was consolidated with a prior suit filed by ILU) seeking a declaration that ILU must provide coverage to LaGen for the defense costs incurred in defending the U.S. DOJ lawsuit as well as indemnity costs. LaGen and ILU both filed motions for summary judgment and on January 30, 2012, the court issued an order granting LaGen's motion finding that ILU had a duty to defend LaGen. On May 25, 2012, ILU filed a petition with the U.S. Court of Appeals for the Fifth Circuit seeking to appeal the trial court's summary judgment ruling. The Fifth Circuit heard oral argument on March 6, 2013. On May 15, 2013, the Fifth Circuit affirmed the district court's ruling that ILU has a duty to defend LaGen against the U.S. DOJ lawsuit. On May 29, 2013, ILU filed a petition for rehearing. The Fifth Circuit denied ILU's petition for rehearing on June 12, 2013. On October 2, 2013, LaGen filed a motion for summary judgment in the federal district court for the Middle District of Louisiana for recovery of LaGen's fees and costs related to the U.S. DOJ lawsuit, as well as its fees and costs related to the insurance coverage action.
Big Cajun II Alleged Opacity Violations
—
On September 7, 2012, LaGen received a Consolidated Compliance Order & Notice of Potential Penalty, or CCO&NPP, from the LDEQ. The CCO&NPP alleges there were opacity exceedance events from the Big Cajun II Power Plant on certain dates during the years 2007-2012. On October 8, 2012, LaGen filed a Request for Administrative Adjudicatory hearing. LaGen and LDEQ have since reached an agreement in principle to resolve the matter for approximately
$47,000
. Following execution of a settlement agreement with LDEQ, notice of the settlement will be published for public comment, and is subject to approval by the Louisiana Attorney General within
90 days
of the notice.
Global Warming
In February 2008, the Native Village of Kivalina and the City of Kivalina, Alaska filed a suit in the U.S. District Court for the Northern District of California against GenOn and
23
other electric generating and oil and gas companies. The lawsuit sought damages of up to
$400 million
for the cost of relocating the village allegedly because of global warming caused by the GHG emissions of the defendants. In late 2009, the District Court ordered that the case be dismissed and the plaintiffs appealed. In September 2012, the U.S. Court of Appeals for the Ninth Circuit dismissed plaintiffs' appeal. In October 2012, the plaintiffs petitioned for en banc rehearing of the case, which petition was denied in November 2012. In February 2013, plaintiffs filed a petition for certiorari with the U.S. Supreme Court seeking review of the decision of the U.S. Court of Appeals. In May 2013, the U.S. Supreme Court denied plaintiffs' petition, thereby ending the case.
Actions Pursued by MC Asset Recovery
With Mirant Corporation's emergence from bankruptcy protection in 2006, certain actions filed by GenOn Energy Holdings and some of its subsidiaries against third parties were transferred to MC Asset Recovery, a wholly owned subsidiary of GenOn Energy Holdings. MC Asset Recovery is governed by a manager who is independent of NRG and GenOn. MC Asset Recovery is a disregarded entity for income tax purposes.
Under the remaining action transferred to MC Asset Recovery, MC Asset Recovery seeks to recover damages from Commerzbank AG and various other banks, or the Commerzbank Defendants, for alleged fraudulent transfers that occurred prior to GenOn Energy Holdings' bankruptcy proceedings. In December 2010, the U.S. District Court for the Northern District of Texas dismissed MC Asset Recovery's complaint against the Commerzbank Defendants. In January 2011, MC Asset Recovery appealed the District Court's dismissal of its complaint against the Commerzbank Defendants to the U.S. Court of Appeals for the Fifth Circuit. In March 2012, the Court of Appeals reversed the District Court's dismissal and reinstated MC Asset Recovery's amended complaint against the Commerzbank Defendants. If MC Asset Recovery succeeds in obtaining any recoveries from the Commerzbank Defendants, the Commerzbank Defendants have asserted that they will seek to file claims in GenOn Energy Holdings' bankruptcy proceedings for the amount of those recoveries. GenOn Energy Holdings would vigorously contest the allowance of any such claims. If the Commerzbank Defendants were to receive an allowed claim as a result of a recovery by MC Asset Recovery on its claims against them, GenOn Energy Holdings would retain from the net amount recovered by MC Asset Recovery an amount equal to the dollar amount of the resulting allowed claim.
34
Pending Natural Gas Litigation
GenOn is party to
five
lawsuits, several of which are class action lawsuits, in state and federal courts in Kansas, Missouri, Nevada and Wisconsin. These lawsuits were filed in the aftermath of the California energy crisis in 2000 and 2001 and the resulting FERC investigations and relate to alleged conduct to increase natural gas prices in violation of antitrust and similar laws. The lawsuits seek treble or punitive damages, restitution and/or expenses. The lawsuits also name as parties a number of energy companies unaffiliated with NRG. In July 2011, the U.S. District Court for the District of Nevada, which is handling
four
of the
five
cases, granted the defendants' motion for summary judgment and dismissed all claims against GenOn in those cases. The plaintiffs appealed to the U.S. Court of Appeals for the Ninth Circuit. The Ninth Circuit reversed the decision of the U.S. District Court for the District of Nevada. On August 26, 2013, GenOn along with the other defendants in the lawsuit filed a petition for certiorari to the U.S. Supreme Court challenging the Ninth Circuit’s decision. In September 2012, the State of Nevada Supreme Court, which is handling the remaining case, affirmed dismissal by the Eighth Judicial District Court for Clark County, Nevada of all plaintiffs' claims against GenOn. In February 2013, the plaintiffs in the Nevada case filed a petition for certiorari to the U.S. Supreme Court. In June 2013, the U.S. Supreme Court denied the petition for certiorari, thereby ending
one
of the
five
lawsuits. GenOn has agreed to indemnify CenterPoint against certain losses relating to these lawsuits.
New Source Review Matters
The EPA and various states are investigating compliance of electric generating facilities with the pre-construction permitting requirements of the CAA known as “new source review.” Since 2000, the EPA has made information requests concerning several of the Company's subsidiaries' plants. The Company continues to correspond with the EPA regarding some of these requests. The EPA agreed to share information relating to its investigations with state environmental agencies. In 2005 and 2006, the Company received an NOV from the EPA alleging that past work at Big Cajun II violated regulations regarding new source review. Further discussion of this matter can be found in Note 15,
Environmental Matters - South Central Region.
In January 2009, the EPA issued an NOV alleging that past work at the Shawville, Portland and Keystone generating facilities violated regulations regarding new source review. In June 2011, the EPA issued an NOV alleging that past work at the Niles and Avon Lake generating facilities violated regulations regarding new source review. In April 2013, the Connecticut Department of Energy and Environmental Protection issued
four
NOVs alleging that past work at combustion turbines at
three
of the Company's Connecticut Jet Power facilities and Middletown facility violated regulations regarding new source review.
In December 2007, the NJDEP sued GenOn in the U.S. District Court for the Eastern District of Pennsylvania, alleging that new source review violations occurred at the Portland generating facility. The suit sought installation of BACT for each pollutant, to enjoin GenOn from operating the generating facility if it is not in compliance with the CAA and civil penalties. The suit also named past owners of the plant as defendants, but the claims against the past owners were dismissed. In March 2009, the Connecticut Department of Energy and Environmental Protection became an intervening party to the suit. In July 2013, the court entered a Consent Decree which generally requires the cessation of coal combustion at Portland Units 1 and 2 and the payment of
$1 million
to benefit the environment in New Jersey and Connecticut. The entry of the Consent Decree resolved this matter.
Cheswick Class Action Complaint
In April 2012, a putative class action lawsuit was filed against GenOn in the Court of Common Pleas of Allegheny County, Pennsylvania alleging that emissions from the Cheswick generating facility have damaged the property of neighboring residents. The Company disputes these allegations. Plaintiffs have brought nuisance, negligence, trespass and strict liability claims seeking both damages and injunctive relief. Plaintiffs seek to certify a class that consists of people who own property or live within
one
mile of the Company's plant. In July 2012, the Company removed the lawsuit to the U.S. District Court for the Western District of Pennsylvania. In October 2012, the court granted the Company's motion to dismiss, which Plaintiffs appealed to the U.S. Court of Appeals for the Third Circuit. On August 20, 2013, the Third Circuit reversed the decision of the District Court. On September 3, 2013, the Company filed a petition for rehearing with the Third Circuit which was subsequently denied on September 23, 2013. On October 15, 2013, the Company filed a motion with the District Court seeking to stay the District Court case while it petitions for certiorari to the U.S. Supreme Court.
Cheswick Monarch Mine NOV
In 2008, the PADEP issued an NOV related to the Monarch mine located near the Cheswick generating facility. It has not been mined for many years. The Company uses it for disposal of low-volume wastewater from the Cheswick generating facility and for disposal of leachate collected from ash disposal facilities. The NOV addresses the alleged requirement to maintain a minimum pumping volume from the mine. The PADEP indicated it will seek a civil penalty of approximately
$200,000
. The Company contests the allegations in the NOV and has not agreed to such penalty. The Company is currently planning capital expenditures in connection with wastewater from Cheswick and leachate from ash disposal facilities.
35
Ormond Beach Alleged Federal Clean Water Act Violations
In October 2012, the Wishtoyo Foundation, a California-based cultural and environmental advocacy organization, through its Ventura Coastkeeper Program, filed suit in the U.S. District Court for the Central District of California regarding alleged violations of the CWA associated with discharges of stormwater from the Ormond Beach generating facility. The Wishtoyo Foundation alleged that elevated concentrations of pollutants in stormwater discharged from the Ormond Beach generating facility were affecting adjacent aquatic resources in violation of (i) the Statewide General Industrial Stormwater permit (a general National Pollution Discharge Elimination System permit issued by the California State Water Resources Control Board that authorizes stormwater discharges from industrial facilities in California) and (ii) the state's Porter-Cologne Water Quality Control Act. The Wishtoyo Foundation further alleged that the Company had not implemented effective stormwater control and treatment measures and that the Company had not complied with the sampling and reporting requirements of the General Industrial Stormwater permit. The Company settled this matter in May 2013 and agreed to make operational changes and pay
$79,000
in legal fees,
$65,000
for supplemental environmental projects, and
$15,000
for monitoring costs.
Maryland Fly Ash Facilities
The Company has
three
fly ash facilities in Maryland: Faulkner, Westland and Brandywine. Fly ash from the Morgantown and Chalk Point generating facilities is disposed of at Brandywine. Fly ash from the Dickerson generating facility is disposed of at Westland. Fly ash is no longer disposed of at the Faulkner facility. As described below, the MDE had sued NRG MD Ash Management and GenOn Mid-Atlantic regarding Faulkner, Brandywine and Westland. The MDE also had threatened not to renew the water discharge permits for all
three
facilities.
Faulkner Litigation
—
In May 2008, the MDE sued GenOn MidAtlantic and NRG MD Ash Management in the Circuit Court for Charles County, Maryland alleging violations of Maryland's water pollution laws at Faulkner. The MDE contended that the operation of Faulkner had resulted in the discharge of pollutants that exceeded Maryland's water quality criteria and without the appropriate NPDES permit. The MDE also alleged that GenOn failed to perform certain sampling and reporting required under an applicable NPDES permit. The MDE complaint requested that the court (i) prohibit continuation of the alleged unpermitted discharges, (ii) require GenOn to cease from further disposal of any coal combustion byproducts at Faulkner and close and cap the existing disposal cells and (iii) assess civil penalties. In July 2008, GenOn filed a motion to dismiss the complaint, arguing that the discharges are permitted by a December 2000 Consent Order. In January 2011, the MDE dismissed without prejudice its complaint and informed GenOn that it intended to file a similar lawsuit in federal court. In May 2011, the MDE filed a complaint against GenOn Mid-Atlantic and NRG MD Ash Management in the U.S. District Court for the District of Maryland alleging violations at Faulkner of the Clean Water Act and Maryland's Water Pollution Control Law. The MDE contends that (i) certain of GenOn's water discharges are not authorized by the existing permit and (ii) operation of the Faulkner facility has resulted in discharges of pollutants that violate water quality criteria. The complaint asked the court to, among other things, (i) enjoin further disposal of coal ash; (ii) enjoin discharges that are not authorized by the existing permit; (iii) require numerous technical studies; (iv) impose civil penalties and (v) award MDE attorneys' fees. The Company disputed these allegations.
Brandywine Litigation
— In April 2010, the MDE filed a complaint against GenOn MidAtlantic and NRG MD Ash Management in the U.S. District Court for the District of Maryland asserting violations at Brandywine of the CWA and Maryland's Water Pollution Control Law. The MDE contended that the operation of Brandywine has resulted in discharges of pollutants that violate Maryland's water quality criteria. The complaint requested that the court, among other things, (i) enjoin further disposal of coal combustion waste at Brandywine, (ii) require the existing open disposal cells to be closed and capped within
one year
, (iii) impose civil penalties and (iv) award MDE attorneys' fees. In September 2010,
four
environmental advocacy groups became intervening parties in the proceeding.
Westland Litigation
—
In January 2011, the MDE informed GenOn that it intended to sue for alleged violations at Westland of Maryland's water pollution laws, which suit was filed in U.S. District Court for the District of Maryland in December 2012.
Permit Renewals
—
In March 2011, the MDE tentatively determined to deny NRG MD Ash Management's application for the renewal of the water discharge permit for Brandywine, which could have resulted in a significant increase in operating expenses for the GenOn Mid Atlantic's Chalk Point and Morgantown generating facilities. The MDE also had indicated that it was planning to deny the Company's applications for the renewal of the water discharge permits for Faulkner and Westland. Denial of the renewal of the water discharge permit for the latter facility could have resulted in a significant increase in operating expenses for the Dickerson generating facility.
36
Settlement
— In April 2013, NRG MD Ash Management and MDE signed a Consent Decree settling the disputes at each of the three ash facilities. GenOn agreed to pay a civil penalty of
$1.9 million
for alleged past violations and an additional
$0.6 million
(for agreed prospective penalties while the settlement is implemented). GenOn agreed to develop a technical solution, which includes installing synthetic caps on the closed cells of each of the
three
ash facilities, for which
$47 million
has been reserved, and to remediate the site. At this time, the Company cannot reasonably estimate the upper range of its obligation for remediating the sites because the Company has not: (i) finished assessing each site including identifying the full impacts to both ground and surface water and the impacts to the surrounding habitat; (ii) finalized with the MDE the standards to which it must remediate; and (iii) identified the technologies required, if any, to meet the yet to be determined remediation standards at each site nor the timing of the design and installation of such technologies.
Energy Plus Holdings Purported Class Actions
Energy Plus Holdings was sued in
six
purported class action lawsuits,
two
in New York,
two
in New Jersey, and
two
in Pennsylvania. On February 28, 2013, Energy Plus Holdings entered into a settlement agreement with plaintiffs to resolve all of the claims in the
six
pending suits, subject to court approval. On September 17, 2013, the U.S. District Court, for the Southern District of New York entered an order approving the settlement. This settlement became final and nonappealable on October 27, 2013. Energy Plus Holdings continues to cooperate with the Connecticut Office of Attorney General and Office of Consumer Counsel and the State of New York Office of Attorney General to resolve certain issues related to Energy Plus Holdings's sales, marketing and business practices. Energy Plus Holdings and the Connecticut Office of Attorney General and Office of Consumer Counsel have been involved in settlement discussions and their efforts to reach a resolution continue.
Purported Class Actions related to July 22, 2012 Announcement of NRG/GenOn Merger Agreement
NRG was named as a defendant in
eight
purported class actions in Texas and Delaware related to its announcement of its agreement to acquire all outstanding shares of GenOn. These cases were consolidated into
one
state court case in each of Delaware and Texas and a federal court case in Texas. The plaintiffs generally alleged breach of fiduciary duties, as well as conspiracy, aiding and abetting breaches of fiduciary duties. Plaintiffs generally sought to: be certified as a class; enjoin the merger; direct the defendants to exercise their fiduciary duties; rescind the acquisition; and be awarded attorneys' fees costs and other relief that the court deems appropriate. Plaintiffs also demanded that there be additional disclosures regarding the merger terms. On October 24, 2012, the parties to the Delaware state court case executed a Memorandum of Understanding to resolve the Delaware purported class action lawsuit. In March 2013, the parties finalized the settlement of the Delaware action. On June 3, 2013, the court approved the Delaware class action settlement thereby ending the Delaware lawsuit. The remaining Texas state and federal court cases were dismissed in July 2013 and August 2013, respectively, thereby ending these matters.
Maryland Department of the Environment v. GenOn Chalk Point and GenOn Mid-Atlantic
On January 25, 2013, Food & Water Watch, the Patuxent Riverkeeper and the Potomac Riverkeeper (together, the Citizens Group) sent NRG a letter alleging that the Chalk Point, Dickerson and Morgantown generating facilities were violating the terms of the
three
National Pollution Discharge Elimination System permits by discharging nitrogen and phosphorous in excess of the limits in each permit. On March 21, 2013, the MDE sent the Company a similar letter with respect to the Chalk Point and Dickerson facilities, threatening to sue within
60
days if the Company did not bring itself into compliance. On June 11, 2013, the Maryland Attorney General on behalf of the MDE filed a complaint in the U.S. District Court for the District of Maryland alleging violations of the Clean Water Act and Maryland environmental laws related to water. The lawsuit seeks injunctive relief and civil penalties in excess of
$100,000
.
Huntley Power LLC Subpoena
Huntley Power LLC was served with a subpoena on May 13, 2013 from the U.S. Department of Justice requesting information regarding the plant's use and handling of diesel fuel. The Company is cooperating with the U.S Department of Justice to address the issues related to the use and handling of diesel fuel.
Texas Franchise Audit
During the second quarter of 2013, the Company settled the Texas Franchise tax dispute with the state relating to years 2001 through 2007. Prior to the GenOn acquisition, the State of Texas issued franchise tax assessments against GenOn as a result of its audit indicating an underpayment of franchise tax of
$72 million
(including interest and penalties through June 30, 2013 of
$29 million
). These assessments relate primarily to a claim by Texas that would change the sourcing of intercompany receipts thereby increasing the amount of tax due. GenOn disagreed with most of the State's assessment and its determination and had accordingly accrued a portion of the liability but had protested the entire assessment. In June 2013, the Company settled the matter with the State by agreeing to pay
$11 million
on issues arising from the audit, and reversed the remainder of the accrual. The reversal was recorded as a measurement period adjustment to the amounts recognized on the acquisition date.
37
Note 14
—
Regulatory Matters
NRG operates in a highly regulated industry and is subject to regulation by various federal and state agencies. As such, NRG is affected by regulatory developments at both the federal and state levels and in the regions in which NRG operates. In addition, NRG is subject to the market rules, procedures, and protocols of the various ISO and RTO markets in which NRG participates. These power markets are subject to ongoing legislative and regulatory changes that may impact NRG's wholesale and retail businesses.
In addition to the regulatory proceedings noted below, NRG and its subsidiaries are a party to other regulatory proceedings arising in the ordinary course of business or have other regulatory exposure. In management's opinion, the disposition of these ordinary course matters will not materially adversely affect NRG's consolidated financial position, results of operations, or cash flows.
East Region
Reliability Must Run Agreements for Elrama and Niles
— In May 2012, GenOn filed with FERC an RMR rate schedule governing operation of unit 4 of the Elrama generating facility and unit 1 of the Niles generating facility. PJM determined that each of these units was needed past its planned deactivation date of June 1, 2012 to maintain transmission system reliability on the PJM system pending the completion of transmission upgrades. The RMR rate schedule sets forth the terms, conditions and cost-based rates under which GenOn operated the units for reliability purposes through September 30, 2012, the date PJM indicated the units would no longer be needed for reliability. In July 2012, FERC accepted GenOn's RMR rate schedule subject to hearing and settlement procedures. In the settlement discussions ordered by FERC, or in any subsequent hearing, the Company's RMR rate schedule may be modified from that which was filed. The rates GenOn charged are subject to refund pending a ruling or settlement. The Company filed a settlement of all outstanding issues in May 2013, which several parties are contesting. The matter is pending before FERC.
Retail
MISO SECA
— Green Mountain Energy previously provided competitive retail energy supply in the MISO region during the relevant period of January 1, 2002, to December 31, 2005. By order dated November 18, 2004, FERC eliminated certain regional through-and-out transmission rates charged by transmission owners in MISO and PJM. In order to temporarily compensate the transmission owners for lost revenues, FERC ordered MISO, PJM and their respective transmission owners to revamp the way that ISOs manage certain cross-system congestion costs, known as Seams Elimination Charge/Cost Adjustments/Assignments, or SECA, charges effective December 1, 2004, through March 31, 2006. The tariff amendments filed by MISO and the MISO transmission owners allocated certain SECA charges to various zones and sub-zones within MISO, including a sub-zone called the Green Mountain Energy Company Sub-zone. During several years of extensive litigation before FERC, several transmission owners sought to recover SECA charges from Green Mountain Energy. Green Mountain Energy denied responsibility for any SECA charges and did not pay any asserted SECA charges.
On May 21, 2010, FERC issued
two
orders, including its Order on Initial Decision, in which FERC determined that approximately
$22 million
plus interest of SECA charges were owed not by Green Mountain Energy but rather by BP Energy - one of Green Mountain Energy's suppliers during the period at issue. On August 19, 2010, the transmission owners and MISO made compliance filings in accordance with FERC's Orders allocating SECA charges to a BP Energy Sub-zone, and making no allocation to a Green Mountain Energy sub-zone. FERC has not yet ruled on those compliance filings.
On September 30, 2011, FERC issued orders denying all requests for rehearing and again determined that SECA charges were not owed by Green Mountain Energy. Numerous parties, including BP Energy, sought judicial review of FERC's orders, and Green Mountain Energy was granted intervenor status in the consolidated appeals. Most appellants subsequently settled with the transmission owners and withdrew their appeals, including BP Energy, which agreed to pay approximately
$24 million
to the
three
transmission owners signing the agreement, with another
$1 million
offered to the remaining PJM transmission owners, should they choose to join the settlement; all chose to do so. FERC approved the settlement, and BP Energy moved to dismiss its appeals; its motions to dismiss were granted by the Court.
West Region
California Station Power
— On December 18, 2012, in
Calpine Corporation v. FERC,
the U.S. Court of Appeals for the D.C. Circuit upheld a decision by FERC disclaiming jurisdiction over how the states impose retail station power charges. The CPUC may now establish retail charges for future station power consumption. Due to reservation-of-rights language in the California utilities' state-jurisdictional station power tariffs, the court's ruling arguably requires California generators to pay state-imposed retail charges back to the date of enrollment by the facilities in the CAISO's station period program (February 1, 2009, for the Company's Encina and El Segundo facilities; March 1, 2009, for the Company's Long Beach facility).
38
On November 18, 2011, Southern California Edison Company filed with the CPUC, seeking authorization to begin charging generators station power charges, and to assess such charges retroactively, which the Company and other generators have challenged. On August 13, 2012, the CPUC Energy Division issued a draft resolution in which it rejected the Company's arguments and approved Southern California Edison's proposed station power charges, including retroactive implementation, but proposing a credit to generators for some portion of their retail station power bill. However, the CPUC withdrew the draft resolution from the calendar and consideration of the measure has not yet been rescheduled. The Company believes it has established an appropriate reserve.
Note 15
—
Environmental Matters
NRG is subject to a wide range of environmental regulations in the development, ownership, construction and operation of projects in the United States and Australia. These laws and regulations generally require that governmental permits and approvals be obtained before construction and during operation of power plants. Environmental regulations have become increasingly stringent and NRG expects this trend to continue. The electric generation industry is likely to face new requirements to address various emissions, including greenhouse gases, as well as combustion byproducts, water discharge and use, and threatened and endangered species. In general, future laws and regulations are expected to require the addition of emissions controls or other environmental controls or to impose certain restrictions on the operations of the Company's facilities, which could have a material effect on the Company's operations.
The EPA released CSAPR on July 7, 2011, which was scheduled to replace CAIR on January 1, 2012. On August 21, 2012, the U.S. Court of Appeals for the D.C. Circuit issued an opinion vacating CSAPR and keeping CAIR in place until the EPA can replace it. The EPA petitioned the Supreme Court seeking review of this decision, which petition was granted. The Supreme Court will hear oral argument in the case on December 10, 2013. The Court of Appeals decision was beneficial to the Company as it eliminated an SO
2
allowance reduction which was to have occurred before the MATS compliance date. While NRG is unable to predict the final outcome of the ongoing litigation, the Company's investment in pollution controls and cleaner technologies coupled with planned strategic plant retirements leaves the fleet well positioned for compliance.
Environmental Capital Expenditures
Based on current rules, technology and preliminary plans based on some proposed rules, NRG estimates that environmental capital expenditures from 2013 through 2017 required to comply with environmental laws will be approximately
$530 million
which includes
$223 million
for GenOn. These costs are primarily associated with (i) controls to satisfy MATS and the recent NSR settlement at Big Cajun II; (ii) controls to satisfy MATS at W.A. Parish, Limestone and Conemaugh; and (iii) NO
x
controls for Sayreville and Gilbert. The decrease from NRG's estimate disclosed in the Company's 2012 Form 10‑K is related to changes in technology related to complying with MATS and the NSR settlement at Big Cajun II, and the selection of more cost-effective environmental compliance solutions at Cheswick. NRG continues to explore cost-effective compliance alternatives to further reduce costs.
NRG's contracts with its rural electric cooperative customers in the South Central region allow for recovery of a portion of the region's environmental capital costs incurred as the result of complying with any change in environmental law. Cost recoveries begin once the environmental equipment becomes operational and include a return on capital. The actual recoveries will depend, among other things, on the timing of the completion of the capital projects and the remaining duration of the contracts.
East Region
The EPA and various states are investigating compliance of electric generating facilities with the pre-construction permitting requirements of the CAA known as “new source review,” or NSR. In January 2009, GenOn received an NOV from the EPA alleging that past work at Keystone, Portland and Shawville generating facilities violated regulations regarding NSR. In June 2011, GenOn received an NOV from the EPA alleging that past work at Avon Lake and Niles generating stations violated NSR. In December 2007, the NJDEP filed suit alleging that NSR violations occurred at the Portland generating station, which suit was resolved pursuant to a July 2013 Consent Decree. The Shawville, Niles and Portland generating units that are the subject of the NOVs are scheduled for retirement soon. Additionally, in April 2013, the Connecticut Department of Energy and Environmental Protection issued four NOVs alleging that past work at oil-fired combustion turbines at the Torrington Terminal, Franklin, Branford and Middletown violated regulations regarding NSR.
In 2008, the PADEP issued an NOV related to the inactive Monarch mine where low-volume wastewater from the Cheswick Generating Station and ash leachate was historically disposed. Resolution of the NOV could result in operational requirements such as pumping a minimum volume of water from the mine and a penalty of approximately
$200,000
.
39
In January 2006, NRG's Indian River Operations, Inc. was notified that it may be a potentially responsible party with respect to Burton Island Old Ash Landfill, a historic captive landfill located at the Indian River facility. On October 1, 2007, NRG signed an agreement with DNREC to investigate the site through the Voluntary Clean-up Program. On February 4, 2008, DNREC issued findings that no further action is required in relation to surface water and that a previously planned shoreline stabilization project would satisfactorily address shoreline erosion. The landfill itself required a Remedial Investigation and Feasibility Study to determine the type and scope of any additional required work. The DNREC approved the Feasibility Study in December 2012. In January 2013, DNREC proposed a remediation plan based on the Feasibility Study. The remediation plan was approved in October 2013. The cost of completing the work required by the approved remediation plan is consistent with amounts previously budgeted. On May 29, 2008, DNREC requested that NRG's Indian River Operations, Inc. participate in the development and performance of a Natural Resource Damage Assessment at the Burton Island Old Ash Landfill. NRG is currently working with DNREC and other trustees to close out the assessment process.
The MDE sued GenOn for alleged violations of water pollution laws at three fly ash disposal sites in Maryland: Faulkner (2008/2011), Brandywine (2010) and Westland (2012). On April 30, 2013, the court approved the consent decree resolving these issues. GenOn has discontinued use of the Faulkner disposal site and opened a new, state of the art carbon burnout facility at its Morgantown plant that allows greater beneficial reuse (as a cement substitute).
For further discussion of these matters, refer to
Note 13
,
Commitments and Contingencies
.
South Central Region
In 2009, the U.S. DOJ, on behalf of the EPA, and later the Louisiana Department of Environmental Quality on behalf of the state of Louisiana, sued LaGen in federal district court in the Middle District of Louisiana alleging violations of the CAA at the Big Cajun II power plant. On March 6, 2013, the court entered a Consent Decree resolving the matter. In addition to a fine of
$3.5 million
and mitigation projects totaling
$10.5 million
, the Consent Decree includes: (i) annual emission caps for NO
x
and SO
2
; (ii) installation of selective non-catalytic reduction on Units 1, 2 and 3 by May 1, 2014; (iii) installation of dry sorbent injection on Unit 1 by April 15, 2015 followed by a further reduction in SO
2
in March 2025; (iv) conversion of Unit 2 to natural gas; and (v) surrender of any excess allowances associated with the NRG owned portion of the plant. For further discussion of this matter, refer to
Note 13
,
Commitments and Contingencies
.
40
Note 16
—
Condensed Consolidating Financial Information
As of
September 30, 2013
, the Company had outstanding
$5.7 billion
of Senior Notes due from 2018 - 2023, as shown in
Note 7
,
Debt and Capital Leases
. These Senior Notes are guaranteed by certain of NRG's current and future 100% owned domestic subsidiaries, or guarantor subsidiaries. These guarantees are both joint and several. The non-guarantor subsidiaries include all of NRG's foreign subsidiaries and certain domestic subsidiaries, including GenOn and its subsidiaries.
Unless otherwise noted below, each of the following guarantor subsidiaries fully and unconditionally guaranteed the Senior Notes as of
September 30, 2013
:
|
Ace Energy, Inc.
|
Middletown Power LLC
|
NRG Oswego Harbor Power Operations, Inc.
|
|
Allied Warranty LLC
|
Montville Power LLC
|
NRG PacGen Inc.
|
|
Arthur Kill Power LLC
|
NEO Corporation
|
NRG Power Marketing LLC
|
|
Astoria Gas Turbine Power LLC
|
NEO Freehold-Gen LLC
|
NRG Reliability Solutions LLC
|
|
Bidurenergy, Inc.
|
NEO Power Services Inc.
|
NRG Renter's Protection LLC
|
|
Cabrillo Power I LLC
|
New Genco GP, LLC
|
NRG Retail LLC
|
|
Cabrillo Power II LLC
|
Norwalk Power LLC
|
NRG Rockford Acquisition LLC
|
|
Carbon Management Solutions LLC
|
NRG Affiliate Services Inc.
|
NRG Saguaro Operations Inc.
|
|
Clean Edge Energy LLC
|
NRG Artesian Energy LLC
|
NRG Security LLC
|
|
Conemaugh Power LLC
|
NRG Arthur Kill Operations Inc.
|
NRG Services Corporation
|
|
Connecticut Jet Power LLC
|
NRG Astoria Gas Turbine Operations Inc.
|
NRG SimplySmart Solutions LLC
|
|
Cottonwood Development LLC
|
NRG Bayou Cove LLC
|
NRG South Central Affiliate Services Inc.
|
|
Cottonwood Energy Company LP
|
NRG Cabrillo Power Operations Inc.
|
NRG South Central Generating LLC
|
|
Cottonwood Generating Partners I LLC
|
NRG California Peaker Operations LLC
|
NRG South Central Operations Inc.
|
|
Cottonwood Generating Partners II LLC
|
NRG Cedar Bayou Development Company, LLC
|
NRG South Texas LP
|
|
Cottonwood Generating Partners III LLC
|
NRG Connecticut Affiliate Services Inc.
|
NRG Texas C&I Supply LLC
|
|
Cottonwood Technology Partners LP
|
NRG Construction LLC
|
NRG Texas Gregory LLC
|
|
Devon Power LLC
|
NRG Curtailment Solutions LLC
|
NRG Texas Holding Inc.
|
|
Dunkirk Power LLC
|
NRG Development Company Inc.
|
NRG Texas LLC
|
|
Eastern Sierra Energy Company LLC
|
NRG Devon Operations Inc.
|
NRG Texas Power LLC
|
|
El Segundo Power, LLC
|
NRG Dispatch Services LLC
|
NRG Unemployment Protection LLC
|
|
El Segundo Power II LLC
|
NRG Dunkirk Operations Inc.
|
NRG Warranty Services LLC
|
|
Elbow Creek Wind Project LLC
|
NRG El Segundo Operations Inc.
|
NRG West Coast LLC
|
|
Energy Alternatives Wholesale, LLC
|
NRG Energy Labor Services LLC
|
NRG Western Affiliate Services Inc.
|
|
Energy Curtailment Specialists, Inc.
|
NRG Energy Services Group LLC
|
O'Brien Cogeneration, Inc. II
|
|
Energy Plus Holdings LLC
|
NRG Energy Services LLC
|
ONSITE Energy, Inc.
|
|
Energy Plus Natural Gas LLC
|
NRG Generation Holdings, Inc.
|
Oswego Harbor Power LLC
|
|
Energy Protection Insurance Company
|
NRG Home & Business Solutions LLC
|
RE Retail Receivables, LLC
|
|
Everything Energy LLC
|
NRG Home Solutions LLC
|
Reliant Energy Northeast LLC
|
|
GCP Funding Company, LLC
|
NRG Home Solutions Product LLC
|
Reliant Energy Power Supply, LLC
|
|
Green Mountain Energy Company
|
NRG Homer City Services LLC
|
Reliant Energy Retail Holdings, LLC
|
|
Green Mountain Energy Company
|
NRG Huntley Operations Inc.
|
Reliant Energy Retail Services, LLC
|
|
(NY Com) LLC
|
NRG Identity Protect LLC
|
RERH Holdings, LLC
|
|
Green Mountain Energy Company
|
NRG Ilion Limited Partnership
|
Saguaro Power LLC
|
|
(NY Res) LLC
|
NRG Ilion LP LLC
|
Somerset Operations Inc.
|
|
Gregory Partners, LLC
|
NRG International LLC
|
Somerset Power LLC
|
|
Gregory Power Partners LLC
|
NRG Maintenance Services LLC
|
Texas Genco Financing Corp.
|
|
Huntley Power LLC
|
NRG Mextrans Inc.
|
Texas Genco GP, LLC
|
|
Independence Energy Alliance LLC
|
NRG MidAtlantic Affiliate Services Inc.
|
Texas Genco Holdings, Inc.
|
|
Independence Energy Group LLC
|
NRG Middletown Operations Inc.
|
Texas Genco LP, LLC
|
|
Independence Energy Natural Gas LLC
|
NRG Montville Operations Inc.
|
Texas Genco Operating Services, LLC
|
|
Indian River Operations Inc.
|
NRG New Jersey Energy Sales LLC
|
Texas Genco Services, LP
|
|
Indian River Power LLC
|
NRG New Roads Holdings LLC
|
US Retailers LLC
|
|
Keystone Power LLC
|
NRG North Central Operations Inc.
|
Vienna Operations Inc.
|
|
Langford Wind Power, LLC
|
NRG Northeast Affiliate Services Inc.
|
Vienna Power LLC
|
|
Lone Star A/C & Appliance Repair, LLC
|
NRG Norwalk Harbor Operations Inc.
|
WCP (Generation) Holdings LLC
|
|
Louisiana Generating LLC
|
NRG Operating Services, Inc.
|
West Coast Power LLC
|
|
Meriden Gas Turbines LLC
|
||
41
NRG conducts much of its business through and derives much of its income from its subsidiaries. Therefore, the Company's ability to make required payments with respect to its indebtedness and other obligations depends on the financial results and condition of its subsidiaries and NRG's ability to receive funds from its subsidiaries. Except for NRG Bayou Cove, LLC, which is subject to certain restrictions under the Company's Peaker financing agreements, there are no restrictions on the ability of any of the guarantor subsidiaries to transfer funds to NRG. In addition, there may be restrictions for certain non-guarantor subsidiaries.
The following condensed consolidating financial information presents the financial information of NRG Energy, Inc., the guarantor subsidiaries and the non-guarantor subsidiaries in accordance with Rule 3-10 under the Securities and Exchange Commission's Regulation S-X. The financial information may not necessarily be indicative of results of operations or financial position had the guarantor subsidiaries or non-guarantor subsidiaries operated as independent entities.
In this presentation, NRG Energy, Inc. consists of parent company operations. Guarantor subsidiaries and non-guarantor subsidiaries of NRG are reported on an equity basis. For companies acquired, the fair values of the assets and liabilities acquired have been presented on a push-down accounting basis.
42
NRG ENERGY, INC. AND SUBSIDIARIES
CONDENSED CONSOLIDATING STATEMENTS OF OPERATIONS
For the Three Months Ended September 30, 2013
(Unaudited)
|
Guarantor Subsidiaries
|
Non-Guarantor Subsidiaries
|
NRG Energy, Inc.
(Note Issuer)
|
Eliminations
(a)
|
Consolidated
|
|||||||||||||||
|
(In millions)
|
|||||||||||||||||||
|
Operating Revenues
|
|
|
|
|
|
||||||||||||||
|
Total operating revenues
|
$
|
2,464
|
|
$
|
1,019
|
|
$
|
—
|
|
$
|
7
|
|
$
|
3,490
|
|
||||
|
Operating Costs and Expenses
|
|
|
|
|
|
||||||||||||||
|
Cost of operations
|
1,792
|
|
566
|
|
(6
|
)
|
3
|
|
2,355
|
|
|||||||||
|
Depreciation and amortization
|
213
|
|
102
|
|
3
|
|
—
|
|
318
|
|
|||||||||
|
Selling, general and administrative
|
116
|
|
70
|
|
39
|
|
4
|
|
229
|
|
|||||||||
|
Acquisition-related transaction and integration costs
|
—
|
|
13
|
|
13
|
|
—
|
|
26
|
|
|||||||||
|
Development activity expenses
|
—
|
|
14
|
|
13
|
|
—
|
|
27
|
|
|||||||||
|
Total operating costs and expenses
|
2,121
|
|
765
|
|
62
|
|
7
|
|
2,955
|
|
|||||||||
|
Operating Income/(Loss)
|
343
|
|
254
|
|
(62
|
)
|
—
|
|
535
|
|
|||||||||
|
Other Income/(Expense)
|
|
|
|
|
|
||||||||||||||
|
Equity in (loss)/earnings of consolidated subsidiaries
|
(25
|
)
|
(5
|
)
|
309
|
|
(279
|
)
|
—
|
|
|||||||||
|
Equity in (loss)/earnings of unconsolidated affiliates
|
(10
|
)
|
10
|
|
—
|
|
(5
|
)
|
(5
|
)
|
|||||||||
|
Other income, net
|
5
|
|
3
|
|
1
|
|
(4
|
)
|
5
|
|
|||||||||
|
Loss on debt extinguishment
|
—
|
|
(1
|
)
|
—
|
|
—
|
|
(1
|
)
|
|||||||||
|
Interest expense
|
(3
|
)
|
(88
|
)
|
(137
|
)
|
—
|
|
(228
|
)
|
|||||||||
|
Total other (expense)/income
|
(33
|
)
|
(81
|
)
|
173
|
|
(288
|
)
|
(229
|
)
|
|||||||||
|
Income Before Income Taxes
|
310
|
|
173
|
|
111
|
|
(288
|
)
|
306
|
|
|||||||||
|
Income tax expense/(benefit)
|
126
|
|
59
|
|
(22
|
)
|
—
|
|
163
|
|
|||||||||
|
Net Income
|
184
|
|
114
|
|
133
|
|
(288
|
)
|
143
|
|
|||||||||
|
Less: Net income attributable to noncontrolling interest
|
—
|
|
32
|
|
9
|
|
(22
|
)
|
19
|
|
|||||||||
|
Net Income attributable to
NRG Energy, Inc.
|
$
|
184
|
|
$
|
82
|
|
$
|
124
|
|
$
|
(266
|
)
|
$
|
124
|
|
||||
|
(a)
|
All significant intercompany transactions have been eliminated in consolidation.
|
43
NRG ENERGY, INC. AND SUBSIDIARIES
CONDENSED CONSOLIDATING STATEMENTS OF OPERATIONS
For the Nine Months Ended September 30, 2013
(Unaudited)
|
Guarantor Subsidiaries
|
Non-Guarantor Subsidiaries
|
NRG Energy, Inc.
(Note Issuer)
|
Eliminations
(a)
|
Consolidated
|
|||||||||||||||
|
(In millions)
|
|||||||||||||||||||
|
Operating Revenues
|
|
|
|
|
|
||||||||||||||
|
Total operating revenues
|
$
|
6,225
|
|
$
|
2,394
|
|
$
|
—
|
|
$
|
(119
|
)
|
$
|
8,500
|
|
||||
|
Operating Costs and Expenses
|
|
|
|
|
|
||||||||||||||
|
Cost of operations
|
4,697
|
|
1,593
|
|
1
|
|
(112
|
)
|
6,179
|
|
|||||||||
|
Depreciation and amortization
|
624
|
|
288
|
|
9
|
|
—
|
|
921
|
|
|||||||||
|
Selling, general and administrative
|
341
|
|
173
|
|
164
|
|
(7
|
)
|
671
|
|
|||||||||
|
Acquisition-related transaction and integration costs
|
—
|
|
54
|
|
41
|
|
—
|
|
95
|
|
|||||||||
|
Development activity expenses
|
—
|
|
24
|
|
39
|
|
—
|
|
63
|
|
|||||||||
|
Total operating costs and expenses
|
5,662
|
|
2,132
|
|
254
|
|
(119
|
)
|
7,929
|
|
|||||||||
|
Operating Income/(Loss)
|
563
|
|
262
|
|
(254
|
)
|
—
|
|
571
|
|
|||||||||
|
Other Income/(Expense)
|
|
|
|
|
|
||||||||||||||
|
Equity in (loss)/earnings of consolidated subsidiaries
|
(4
|
)
|
(9
|
)
|
363
|
|
(350
|
)
|
—
|
|
|||||||||
|
Equity in (loss)/earnings of unconsolidated affiliates
|
(8
|
)
|
16
|
|
—
|
|
(2
|
)
|
6
|
|
|||||||||
|
Other income, net
|
7
|
|
5
|
|
3
|
|
(6
|
)
|
9
|
|
|||||||||
|
Loss on debt extinguishment
|
—
|
|
(12
|
)
|
(38
|
)
|
—
|
|
(50
|
)
|
|||||||||
|
Interest expense
|
(13
|
)
|
(229
|
)
|
(388
|
)
|
—
|
|
(630
|
)
|
|||||||||
|
Total other expense
|
(18
|
)
|
(229
|
)
|
(60
|
)
|
(358
|
)
|
(665
|
)
|
|||||||||
|
Income/(Loss) Before Income Taxes
|
545
|
|
33
|
|
(314
|
)
|
(358
|
)
|
(94
|
)
|
|||||||||
|
Income tax expense/(benefit)
|
212
|
|
(10
|
)
|
(249
|
)
|
—
|
|
(47
|
)
|
|||||||||
|
Net Income/(Loss)
|
333
|
|
43
|
|
(65
|
)
|
(358
|
)
|
(47
|
)
|
|||||||||
|
Less: Net income attributable to noncontrolling interest
|
—
|
|
40
|
|
9
|
|
(22
|
)
|
27
|
|
|||||||||
|
Net Income/(Loss) attributable to
NRG Energy, Inc.
|
$
|
333
|
|
$
|
3
|
|
$
|
(74
|
)
|
$
|
(336
|
)
|
$
|
(74
|
)
|
||||
|
(a)
|
All significant intercompany transactions have been eliminated in consolidation.
|
44
NRG ENERGY, INC. AND SUBSIDIARIES
CONDENSED CONSOLIDATING STATEMENTS OF COMPREHENSIVE INCOME
For the Three Months Ended September 30, 2013
(Unaudited)
|
Guarantor Subsidiaries
|
Non-Guarantor Subsidiaries
|
NRG Energy, Inc.
(Note Issuer)
|
Eliminations
(a)
|
Consolidated
|
|||||||||||||||
|
(In millions)
|
|||||||||||||||||||
|
Net Income
|
$
|
184
|
|
$
|
114
|
|
$
|
133
|
|
$
|
(288
|
)
|
$
|
143
|
|
||||
|
Other comprehensive (loss)/income, net of tax
|
|||||||||||||||||||
|
Unrealized (loss)/gain on derivatives, net
|
(13
|
)
|
(8
|
)
|
17
|
|
(12
|
)
|
(16
|
)
|
|||||||||
|
Foreign currency translation adjustments, net
|
—
|
|
4
|
|
1
|
|
—
|
|
5
|
|
|||||||||
|
Other comprehensive (loss)/income
|
(13
|
)
|
(4
|
)
|
18
|
|
(12
|
)
|
(11
|
)
|
|||||||||
|
Comprehensive income
|
171
|
|
110
|
|
151
|
|
(300
|
)
|
132
|
|
|||||||||
|
Less: Comprehensive income attributable to noncontrolling interest
|
—
|
|
29
|
|
9
|
|
(20
|
)
|
18
|
|
|||||||||
|
Comprehensive income attributable to NRG Energy, Inc.
|
171
|
|
81
|
|
142
|
|
(280
|
)
|
114
|
|
|||||||||
|
Dividends for preferred shares
|
—
|
|
—
|
|
2
|
|
—
|
|
2
|
|
|||||||||
|
Comprehensive income available for common stockholders
|
$
|
171
|
|
$
|
81
|
|
$
|
140
|
|
$
|
(280
|
)
|
$
|
112
|
|
||||
|
(a)
|
All significant intercompany transactions have been eliminated in consolidation.
|
45
NRG ENERGY, INC. AND SUBSIDIARIES
CONDENSED CONSOLIDATING STATEMENTS OF COMPREHENSIVE INCOME/(LOSS)
For the Nine Months Ended September 30, 2013
(Unaudited)
|
Guarantor Subsidiaries
|
Non-Guarantor Subsidiaries
|
NRG Energy, Inc.
(Note Issuer)
|
Eliminations
(a)
|
Consolidated
|
|||||||||||||||
|
(In millions)
|
|||||||||||||||||||
|
Net Income/(Loss)
|
$
|
333
|
|
$
|
43
|
|
$
|
(65
|
)
|
$
|
(358
|
)
|
$
|
(47
|
)
|
||||
|
Other comprehensive (loss)/income, net of tax
|
|||||||||||||||||||
|
Unrealized (loss)/gain on derivatives, net
|
(54
|
)
|
41
|
|
9
|
|
12
|
|
8
|
|
|||||||||
|
Foreign currency translation adjustments, net
|
—
|
|
(11
|
)
|
(3
|
)
|
—
|
|
(14
|
)
|
|||||||||
|
Available-for-sale securities, net
|
—
|
|
—
|
|
2
|
|
—
|
|
2
|
|
|||||||||
|
Defined benefit plan, net
|
—
|
|
25
|
|
—
|
|
—
|
|
25
|
|
|||||||||
|
Other comprehensive (loss)/income
|
(54
|
)
|
55
|
|
8
|
|
12
|
|
21
|
|
|||||||||
|
Comprehensive income/(loss)
|
279
|
|
98
|
|
(57
|
)
|
(346
|
)
|
(26
|
)
|
|||||||||
|
Less: Comprehensive income attributable to noncontrolling interest
|
—
|
|
39
|
|
9
|
|
(22
|
)
|
26
|
|
|||||||||
|
Comprehensive income/(loss) attributable to NRG Energy, Inc.
|
279
|
|
59
|
|
(66
|
)
|
(324
|
)
|
(52
|
)
|
|||||||||
|
Dividends for preferred shares
|
—
|
|
—
|
|
7
|
|
—
|
|
7
|
|
|||||||||
|
Comprehensive income/(loss) available for common stockholders
|
$
|
279
|
|
$
|
59
|
|
$
|
(73
|
)
|
$
|
(324
|
)
|
$
|
(59
|
)
|
||||
|
(a)
|
All significant intercompany transactions have been eliminated in consolidation.
|
46
NRG ENERGY, INC. AND SUBSIDIARIES
CONDENSED CONSOLIDATING BALANCE SHEETS
September 30, 2013
(Unaudited)
|
Guarantor Subsidiaries
|
Non-Guarantor Subsidiaries
|
NRG Energy, Inc.
(Note Issuer)
|
Eliminations
(a)
|
Consolidated
|
|||||||||||||||
|
ASSETS
|
(In millions)
|
||||||||||||||||||
|
Current Assets
|
|
|
|
|
|
||||||||||||||
|
Cash and cash equivalents
|
$
|
23
|
|
$
|
1,110
|
|
$
|
996
|
|
$
|
—
|
|
$
|
2,129
|
|
||||
|
Funds deposited by counterparties
|
—
|
|
122
|
|
—
|
|
—
|
|
122
|
|
|||||||||
|
Restricted cash
|
18
|
|
278
|
|
11
|
|
—
|
|
307
|
|
|||||||||
|
Accounts receivable, net
|
1,132
|
|
234
|
|
—
|
|
—
|
|
1,366
|
|
|||||||||
|
Inventory
|
406
|
|
455
|
|
—
|
|
—
|
|
861
|
|
|||||||||
|
Derivative instruments
|
914
|
|
491
|
|
—
|
|
(16
|
)
|
1,389
|
|
|||||||||
|
Cash collateral paid in support of energy risk management activities
|
253
|
|
35
|
|
—
|
|
—
|
|
288
|
|
|||||||||
|
Renewable energy grant receivable
|
—
|
|
344
|
|
1
|
|
—
|
|
345
|
|
|||||||||
|
Prepayments and other current assets
|
4,103
|
|
283
|
|
(3,414
|
)
|
(530
|
)
|
442
|
|
|||||||||
|
Total current assets
|
6,849
|
|
3,352
|
|
(2,406
|
)
|
(546
|
)
|
7,249
|
|
|||||||||
|
Net property, plant and equipment
|
9,651
|
|
10,822
|
|
149
|
|
(22
|
)
|
20,600
|
|
|||||||||
|
Other Assets
|
|
|
|
|
|
||||||||||||||
|
Investment in subsidiaries
|
108
|
|
(108
|
)
|
18,218
|
|
(18,218
|
)
|
—
|
|
|||||||||
|
Equity investments in affiliates
|
18
|
|
724
|
|
10
|
|
(126
|
)
|
626
|
|
|||||||||
|
Notes receivable, less current portion
|
—
|
|
66
|
|
255
|
|
(245
|
)
|
76
|
|
|||||||||
|
Goodwill
|
1,941
|
|
12
|
|
—
|
|
—
|
|
1,953
|
|
|||||||||
|
Intangible assets, net
|
988
|
|
172
|
|
33
|
|
(52
|
)
|
1,141
|
|
|||||||||
|
Nuclear decommissioning trust fund
|
524
|
|
—
|
|
—
|
|
—
|
|
524
|
|
|||||||||
|
Deferred income tax
|
—
|
|
784
|
|
715
|
|
—
|
|
1,499
|
|
|||||||||
|
Derivative instruments
|
202
|
|
307
|
|
—
|
|
(3
|
)
|
506
|
|
|||||||||
|
Other non-current assets
|
80
|
|
239
|
|
370
|
|
—
|
|
689
|
|
|||||||||
|
Total other assets
|
3,861
|
|
2,196
|
|
19,601
|
|
(18,644
|
)
|
7,014
|
|
|||||||||
|
Total Assets
|
$
|
20,361
|
|
$
|
16,370
|
|
$
|
17,344
|
|
$
|
(19,212
|
)
|
$
|
34,863
|
|
||||
|
LIABILITIES AND STOCKHOLDERS’ EQUITY
|
|||||||||||||||||||
|
Current Liabilities
|
|
|
|
|
|
||||||||||||||
|
Current portion of long-term debt and capital leases
|
$
|
1
|
|
$
|
890
|
|
$
|
20
|
|
$
|
—
|
|
$
|
911
|
|
||||
|
Accounts payable
|
678
|
|
436
|
|
26
|
|
—
|
|
1,140
|
|
|||||||||
|
Accounts payable — affiliate
|
6
|
|
1,973
|
|
(1,572
|
)
|
(407
|
)
|
—
|
|
|||||||||
|
Derivative instruments
|
887
|
|
193
|
|
—
|
|
(16
|
)
|
1,064
|
|
|||||||||
|
Deferred income taxes
|
369
|
|
(264
|
)
|
7
|
|
—
|
|
112
|
|
|||||||||
|
Cash collateral received in support of energy risk management activities
|
—
|
|
122
|
|
—
|
|
—
|
|
122
|
|
|||||||||
|
Accrued expenses and other current liabilities
|
283
|
|
478
|
|
272
|
|
—
|
|
1,033
|
|
|||||||||
|
Total current liabilities
|
2,224
|
|
3,828
|
|
(1,247
|
)
|
(423
|
)
|
4,382
|
|
|||||||||
|
Other Liabilities
|
|
|
|
|
|
||||||||||||||
|
Long-term debt and capital leases
|
316
|
|
7,965
|
|
7,766
|
|
(245
|
)
|
15,802
|
|
|||||||||
|
Nuclear decommissioning reserve
|
290
|
|
—
|
|
—
|
|
—
|
|
290
|
|
|||||||||
|
Nuclear decommissioning trust liability
|
303
|
|
—
|
|
—
|
|
—
|
|
303
|
|
|||||||||
|
Deferred income taxes
|
886
|
|
(836
|
)
|
—
|
|
—
|
|
50
|
|
|||||||||
|
Derivative instruments
|
279
|
|
96
|
|
—
|
|
(3
|
)
|
372
|
|
|||||||||
|
Out-of-market contracts
|
162
|
|
1,026
|
|
—
|
|
(31
|
)
|
1,157
|
|
|||||||||
|
Other non-current liabilities
|
510
|
|
631
|
|
236
|
|
—
|
|
1,377
|
|
|||||||||
|
Total non-current liabilities
|
2,746
|
|
8,882
|
|
8,002
|
|
(279
|
)
|
19,351
|
|
|||||||||
|
Total liabilities
|
4,970
|
|
12,710
|
|
6,755
|
|
(702
|
)
|
23,733
|
|
|||||||||
|
3.625% convertible perpetual preferred stock
|
—
|
|
—
|
|
249
|
|
—
|
|
249
|
|
|||||||||
|
Stockholders’ Equity
|
15,391
|
|
3,660
|
|
10,340
|
|
(18,510
|
)
|
10,881
|
|
|||||||||
|
Total Liabilities and Stockholders’ Equity
|
$
|
20,361
|
|
$
|
16,370
|
|
$
|
17,344
|
|
$
|
(19,212
|
)
|
$
|
34,863
|
|
||||
|
(a)
|
All significant intercompany transactions have been eliminated in consolidation.
|
47
NRG ENERGY, INC. AND SUBSIDIARIES
CONDENSED CONSOLIDATING STATEMENTS OF CASH FLOWS
For the Nine Months Ended September 30, 2013
(Unaudited)
|
Guarantor Subsidiaries
|
Non-Guarantor Subsidiaries
|
NRG Energy, Inc.
(Note Issuer)
|
Eliminations
(a)
|
Consolidated
|
|||||||||||||||
|
(In millions)
|
|||||||||||||||||||
|
Cash Flows from Operating Activities
|
|
|
|
|
|
||||||||||||||
|
Net Cash Provided/(Used) by Operating Activities
|
1,334
|
|
135
|
|
(1,800
|
)
|
1,154
|
|
823
|
|
|||||||||
|
Cash Flows from Investing Activities
|
|
|
|
|
|
|
|
||||||||||||
|
Intercompany loans to subsidiaries
|
(1,158
|
)
|
4
|
|
1,154
|
|
—
|
|
—
|
|
|||||||||
|
Acquisition of businesses, net of cash acquired
|
—
|
|
(59
|
)
|
(315
|
)
|
—
|
|
(374
|
)
|
|||||||||
|
Capital expenditures
|
(154
|
)
|
(1,388
|
)
|
(39
|
)
|
—
|
|
(1,581
|
)
|
|||||||||
|
(Increase)/decrease in restricted cash, net
|
(7
|
)
|
(61
|
)
|
1
|
|
—
|
|
(67
|
)
|
|||||||||
|
Increase in restricted cash — U.S. DOE projects
|
—
|
|
(18
|
)
|
(2
|
)
|
—
|
|
(20
|
)
|
|||||||||
|
Decrease/(increase) in notes receivable
|
2
|
|
(16
|
)
|
(8
|
)
|
—
|
|
(22
|
)
|
|||||||||
|
Investments in nuclear decommissioning trust fund securities
|
(369
|
)
|
—
|
|
—
|
|
—
|
|
(369
|
)
|
|||||||||
|
Proceeds from sales of nuclear decommissioning trust fund securities
|
344
|
|
—
|
|
—
|
|
—
|
|
344
|
|
|||||||||
|
Proceeds from renewable energy grants
|
—
|
|
52
|
|
—
|
|
—
|
|
52
|
|
|||||||||
|
Proceeds from sale of assets, net of cash disposed of
|
13
|
|
—
|
|
—
|
|
—
|
|
13
|
|
|||||||||
|
Other
|
7
|
|
(1
|
)
|
(13
|
)
|
—
|
|
(7
|
)
|
|||||||||
|
Net Cash (Used)/Provided by Investing Activities
|
(1,322
|
)
|
(1,487
|
)
|
778
|
|
—
|
|
(2,031
|
)
|
|||||||||
|
Cash Flows from Financing Activities
|
|
|
|
|
|
|
|
||||||||||||
|
Proceeds from intercompany loans
|
—
|
|
—
|
|
1,154
|
|
(1,154
|
)
|
—
|
|
|||||||||
|
Payment of dividends to common and preferred stockholders
|
—
|
|
—
|
|
(113
|
)
|
—
|
|
(113
|
)
|
|||||||||
|
Payment for treasury stock
|
—
|
|
—
|
|
(25
|
)
|
—
|
|
(25
|
)
|
|||||||||
|
Net (payments for)/receipts from settlement of acquired derivatives that include financing elements
|
(67
|
)
|
244
|
|
—
|
|
—
|
|
177
|
|
|||||||||
|
Contributions from noncontrolling interest in subsidiaries
|
—
|
|
504
|
|
—
|
|
—
|
|
504
|
|
|||||||||
|
Proceeds from issuance of long-term debt
|
—
|
|
1,120
|
|
485
|
|
—
|
|
1,605
|
|
|||||||||
|
Proceeds from issuance of common stock
|
—
|
|
—
|
|
14
|
|
—
|
|
14
|
|
|||||||||
|
Payment of debt issuance and hedging costs
|
—
|
|
(9
|
)
|
(34
|
)
|
—
|
|
(43
|
)
|
|||||||||
|
Payments for short and long-term debt
|
—
|
|
(654
|
)
|
(214
|
)
|
—
|
|
(868
|
)
|
|||||||||
|
Net Cash (Used)/Provided by Financing Activities
|
(67
|
)
|
1,205
|
|
1,267
|
|
(1,154
|
)
|
1,251
|
|
|||||||||
|
Effect of exchange rate changes on cash and cash equivalents
|
—
|
|
(1
|
)
|
—
|
|
—
|
|
(1
|
)
|
|||||||||
|
Net (Decrease)/Increase in Cash and Cash Equivalents
|
(55
|
)
|
(148
|
)
|
245
|
|
—
|
|
42
|
|
|||||||||
|
Cash and Cash Equivalents at Beginning of Period
|
78
|
|
1,258
|
|
751
|
|
—
|
|
2,087
|
|
|||||||||
|
Cash and Cash Equivalents at End of Period
|
$
|
23
|
|
$
|
1,110
|
|
$
|
996
|
|
$
|
—
|
|
$
|
2,129
|
|
||||
|
(a)
|
All significant intercompany transactions have been eliminated in consolidation.
|
48
NRG ENERGY, INC. AND SUBSIDIARIES
CONDENSED CONSOLIDATING STATEMENTS OF OPERATIONS
For the Three Months Ended September 30, 2012
(Unaudited)
|
Guarantor Subsidiaries
|
Non-Guarantor Subsidiaries
|
NRG Energy, Inc.
(Note Issuer)
|
Eliminations
(a)
|
Consolidated
|
|||||||||||||||
|
(In millions)
|
|||||||||||||||||||
|
Operating Revenues
|
|
|
|
|
|
||||||||||||||
|
Total operating revenues
|
$
|
2,237
|
|
$
|
120
|
|
$
|
—
|
|
$
|
(26
|
)
|
$
|
2,331
|
|
||||
|
Operating Costs and Expenses
|
|
||||||||||||||||||
|
Cost of operations
|
1,715
|
|
47
|
|
1
|
|
(23
|
)
|
1,740
|
|
|||||||||
|
Depreciation and amortization
|
217
|
|
20
|
|
2
|
|
—
|
|
239
|
|
|||||||||
|
Selling, general and administrative
|
154
|
|
—
|
|
73
|
|
(3
|
)
|
224
|
|
|||||||||
|
Acquisition-related transaction and integration costs
|
—
|
|
—
|
|
18
|
|
—
|
|
18
|
|
|||||||||
|
Development activity expenses
|
—
|
|
14
|
|
10
|
|
—
|
|
24
|
|
|||||||||
|
Total operating costs and expenses
|
2,086
|
|
81
|
|
104
|
|
(26
|
)
|
2,245
|
|
|||||||||
|
Operating Income/(Loss)
|
151
|
|
39
|
|
(104
|
)
|
—
|
|
86
|
|
|||||||||
|
Other Income/(Expense)
|
|
|
|
|
|
||||||||||||||
|
Equity in (losses)/earnings of consolidated subsidiaries
|
(10
|
)
|
1
|
|
121
|
|
(112
|
)
|
—
|
|
|||||||||
|
Equity in earnings of unconsolidated affiliates
|
4
|
|
—
|
|
—
|
|
—
|
|
4
|
|
|||||||||
|
Other income, net
|
—
|
|
2
|
|
7
|
|
—
|
|
9
|
|
|||||||||
|
Loss on debt extinguishment
|
—
|
|
—
|
|
(41
|
)
|
—
|
|
(41
|
)
|
|||||||||
|
Interest expense
|
(5
|
)
|
(21
|
)
|
(137
|
)
|
—
|
|
(163
|
)
|
|||||||||
|
Total other expense
|
(11
|
)
|
(18
|
)
|
(50
|
)
|
(112
|
)
|
(191
|
)
|
|||||||||
|
Income/(Loss) Before Income Taxes
|
140
|
|
21
|
|
(154
|
)
|
(112
|
)
|
(105
|
)
|
|||||||||
|
Income tax expense/(benefit)
|
67
|
|
(27
|
)
|
(153
|
)
|
—
|
|
(113
|
)
|
|||||||||
|
Net Income/(Loss)
|
73
|
|
48
|
|
(1
|
)
|
(112
|
)
|
8
|
|
|||||||||
|
Less: Net income attributable to noncontrolling interest
|
—
|
|
9
|
|
—
|
|
—
|
|
9
|
|
|||||||||
|
Net Income/(Loss) attributable to NRG Energy, Inc.
|
$
|
73
|
|
$
|
39
|
|
$
|
(1
|
)
|
$
|
(112
|
)
|
$
|
(1
|
)
|
||||
|
(a)
|
All significant intercompany transactions have been eliminated in consolidation.
|
49
NRG ENERGY, INC. AND SUBSIDIARIES
CONDENSED CONSOLIDATING STATEMENTS OF OPERATIONS
For the Nine Months Ended September 30, 2012
(Unaudited)
|
Guarantor Subsidiaries
|
Non-Guarantor Subsidiaries
|
NRG Energy, Inc.
(Note Issuer)
|
Eliminations
(a)
|
Consolidated
|
|||||||||||||||
|
(In millions)
|
|||||||||||||||||||
|
Operating Revenues
|
|
|
|
|
|
||||||||||||||
|
Total operating revenues
|
$
|
6,058
|
|
$
|
353
|
|
$
|
—
|
|
$
|
(52
|
)
|
$
|
6,359
|
|
||||
|
Operating Costs and Expenses
|
|
|
|
|
|
||||||||||||||
|
Cost of operations
|
4,512
|
|
186
|
|
7
|
|
(45
|
)
|
4,660
|
|
|||||||||
|
Depreciation and amortization
|
647
|
|
48
|
|
8
|
|
—
|
|
703
|
|
|||||||||
|
Selling, general and administrative
|
387
|
|
6
|
|
227
|
|
(7
|
)
|
613
|
|
|||||||||
|
Acquisition-related transaction and integration costs
|
—
|
|
—
|
|
18
|
|
—
|
|
18
|
|
|||||||||
|
Development activity expenses
|
—
|
|
22
|
|
30
|
|
—
|
|
52
|
|
|||||||||
|
Total operating costs and expenses
|
5,546
|
|
262
|
|
290
|
|
(52
|
)
|
6,046
|
|
|||||||||
|
Operating Income/(Loss)
|
512
|
|
91
|
|
(290
|
)
|
—
|
|
313
|
|
|||||||||
|
Other Income/(Expense)
|
|
|
|
|
|
||||||||||||||
|
Equity in earnings/(losses) of consolidated subsidiaries
|
6
|
|
(11
|
)
|
463
|
|
(458
|
)
|
—
|
|
|||||||||
|
Equity in earnings of unconsolidated affiliates
|
6
|
|
20
|
|
—
|
|
—
|
|
26
|
|
|||||||||
|
Other income, net
|
—
|
|
4
|
|
8
|
|
—
|
|
12
|
|
|||||||||
|
Loss on debt extinguishment
|
—
|
|
—
|
|
(41
|
)
|
—
|
|
(41
|
)
|
|||||||||
|
Interest expense
|
(21
|
)
|
(60
|
)
|
(414
|
)
|
—
|
|
(495
|
)
|
|||||||||
|
Total other (expense)/income
|
(9
|
)
|
(47
|
)
|
16
|
|
(458
|
)
|
(498
|
)
|
|||||||||
|
Income/(Loss) Before Income Taxes
|
503
|
|
44
|
|
(274
|
)
|
(458
|
)
|
(185
|
)
|
|||||||||
|
Income tax expense/(benefit)
|
193
|
|
(122
|
)
|
(317
|
)
|
—
|
|
(246
|
)
|
|||||||||
|
Net Income
|
310
|
|
166
|
|
43
|
|
(458
|
)
|
61
|
|
|||||||||
|
Less: Net income attributable to noncontrolling interest
|
—
|
|
18
|
|
—
|
|
—
|
|
18
|
|
|||||||||
|
Net Income attributable to NRG Energy, Inc.
|
$
|
310
|
|
$
|
148
|
|
$
|
43
|
|
$
|
(458
|
)
|
$
|
43
|
|
||||
|
(a)
|
All significant intercompany transactions have been eliminated in consolidation.
|
50
NRG ENERGY, INC. AND SUBSIDIARIES
CONDENSED CONSOLIDATING STATEMENTS OF COMPREHENSIVE INCOME/(LOSS)
For the Three Months Ended September 30, 2012
(Unaudited)
|
Guarantor Subsidiaries
|
Non-Guarantor Subsidiaries
|
NRG Energy, Inc.
(Note Issuer)
|
Eliminations
(a)
|
Consolidated
|
|||||||||||||||
|
(In millions)
|
|||||||||||||||||||
|
Net Income/(Loss)
|
$
|
73
|
|
$
|
48
|
|
$
|
(1
|
)
|
$
|
(112
|
)
|
$
|
8
|
|
||||
|
Other comprehensive loss, net of tax
|
|||||||||||||||||||
|
Unrealized loss on derivatives, net
|
(43
|
)
|
(14
|
)
|
(54
|
)
|
68
|
|
(43
|
)
|
|||||||||
|
Foreign currency translation adjustments, net
|
—
|
|
—
|
|
1
|
|
—
|
|
1
|
|
|||||||||
|
Foreign currency translation realized upon sale of Schkopau
|
—
|
|
(11
|
)
|
—
|
|
—
|
|
(11
|
)
|
|||||||||
|
Available-for-sale securities, net
|
—
|
|
—
|
|
2
|
|
—
|
|
2
|
|
|||||||||
|
Other comprehensive loss
|
(43
|
)
|
(25
|
)
|
(51
|
)
|
68
|
|
(51
|
)
|
|||||||||
|
Comprehensive income/(loss)
|
30
|
|
23
|
|
(52
|
)
|
(44
|
)
|
(43
|
)
|
|||||||||
|
Less: Comprehensive income attributable to noncontrolling interest
|
—
|
|
9
|
|
—
|
|
—
|
|
9
|
|
|||||||||
|
Comprehensive income/(loss) attributable to NRG Energy, Inc.
|
30
|
|
14
|
|
(52
|
)
|
(44
|
)
|
(52
|
)
|
|||||||||
|
Dividends for preferred shares
|
—
|
|
—
|
|
2
|
|
—
|
|
2
|
|
|||||||||
|
Comprehensive income/(loss) available for common stockholders
|
$
|
30
|
|
$
|
14
|
|
$
|
(54
|
)
|
$
|
(44
|
)
|
$
|
(54
|
)
|
||||
|
(a)
|
All significant intercompany transactions have been eliminated in consolidation.
|
51
NRG ENERGY, INC. AND SUBSIDIARIES
CONDENSED CONSOLIDATING STATEMENTS OF COMPREHENSIVE INCOME/(LOSS)
For the Nine Months Ended September 30, 2012
(Unaudited)
|
Guarantor Subsidiaries
|
Non-Guarantor Subsidiaries
|
NRG Energy, Inc.
(Note Issuer)
|
Eliminations
(a)
|
Consolidated
|
|||||||||||||||
|
(In millions)
|
|||||||||||||||||||
|
Net Income
|
$
|
310
|
|
$
|
166
|
|
$
|
43
|
|
$
|
(458
|
)
|
$
|
61
|
|
||||
|
Other comprehensive loss, net of tax
|
|||||||||||||||||||
|
Unrealized loss on derivatives, net
|
(122
|
)
|
(33
|
)
|
(145
|
)
|
168
|
|
(132
|
)
|
|||||||||
|
Foreign currency translation adjustments, net
|
—
|
|
(2
|
)
|
1
|
|
—
|
|
(1
|
)
|
|||||||||
|
Foreign currency translation realized upon sale of Schkopau
|
—
|
|
(11
|
)
|
—
|
|
—
|
|
(11
|
)
|
|||||||||
|
Available-for-sale securities, net
|
—
|
|
—
|
|
2
|
|
—
|
|
2
|
|
|||||||||
|
Other comprehensive loss
|
(122
|
)
|
(46
|
)
|
(142
|
)
|
168
|
|
(142
|
)
|
|||||||||
|
Comprehensive income/(loss)
|
188
|
|
120
|
|
(99
|
)
|
(290
|
)
|
(81
|
)
|
|||||||||
|
Less: Comprehensive income attributable to noncontrolling interest
|
—
|
|
18
|
|
—
|
|
—
|
|
18
|
|
|||||||||
|
Comprehensive income/(loss) attributable to NRG Energy, Inc.
|
188
|
|
102
|
|
(99
|
)
|
(290
|
)
|
(99
|
)
|
|||||||||
|
Dividends for preferred shares
|
—
|
|
—
|
|
7
|
|
—
|
|
7
|
|
|||||||||
|
Comprehensive income/(loss) available for common stockholders
|
$
|
188
|
|
$
|
102
|
|
$
|
(106
|
)
|
$
|
(290
|
)
|
$
|
(106
|
)
|
||||
|
(a)
|
All significant intercompany transactions have been eliminated in consolidation.
|
52
NRG ENERGY, INC. AND SUBSIDIARIES
CONDENSED CONSOLIDATING BALANCE SHEETS
December 31, 2012
|
Guarantor Subsidiaries
|
Non-Guarantor Subsidiaries
|
NRG Energy, Inc.
(Note Issuer)
|
Eliminations
(a)
|
Consolidated
|
|||||||||||||||
|
ASSETS
|
(In millions)
|
||||||||||||||||||
|
Current Assets
|
|
|
|
|
|
||||||||||||||
|
Cash and cash equivalents
|
$
|
78
|
|
$
|
1,258
|
|
$
|
751
|
|
$
|
—
|
|
$
|
2,087
|
|
||||
|
Funds deposited by counterparties
|
131
|
|
140
|
|
—
|
|
—
|
|
271
|
|
|||||||||
|
Restricted cash
|
11
|
|
196
|
|
10
|
|
—
|
|
217
|
|
|||||||||
|
Accounts receivable, net
|
807
|
|
254
|
|
—
|
|
—
|
|
1,061
|
|
|||||||||
|
Inventory
|
472
|
|
439
|
|
—
|
|
—
|
|
911
|
|
|||||||||
|
Derivative instruments
|
2,058
|
|
604
|
|
—
|
|
(18
|
)
|
2,644
|
|
|||||||||
|
Deferred income taxes
|
(153
|
)
|
10
|
|
199
|
|
—
|
|
56
|
|
|||||||||
|
Cash collateral paid in support of energy risk management activities
|
81
|
|
148
|
|
—
|
|
—
|
|
229
|
|
|||||||||
|
Renewable energy grant receivable
|
—
|
|
58
|
|
—
|
|
—
|
|
58
|
|
|||||||||
|
Prepayments and other current assets
|
2,966
|
|
(57
|
)
|
(2,518
|
)
|
10
|
|
401
|
|
|||||||||
|
Total current assets
|
6,451
|
|
3,050
|
|
(1,558
|
)
|
(8
|
)
|
7,935
|
|
|||||||||
|
Net Property, Plant and Equipment
|
9,905
|
|
10,235
|
|
121
|
|
(20
|
)
|
20,241
|
|
|||||||||
|
Other Assets
|
|
|
|
|
|
||||||||||||||
|
Investment in subsidiaries
|
244
|
|
(102
|
)
|
17,655
|
|
(17,797
|
)
|
—
|
|
|||||||||
|
Equity investments in affiliates
|
33
|
|
633
|
|
10
|
|
—
|
|
676
|
|
|||||||||
|
Capital leases and notes receivable, less current portion
|
3
|
|
74
|
|
531
|
|
(529
|
)
|
79
|
|
|||||||||
|
Goodwill
|
1,944
|
|
12
|
|
—
|
|
—
|
|
1,956
|
|
|||||||||
|
Intangible assets, net
|
1,042
|
|
177
|
|
33
|
|
(52
|
)
|
1,200
|
|
|||||||||
|
Nuclear decommissioning trust fund
|
473
|
|
—
|
|
—
|
|
—
|
|
473
|
|
|||||||||
|
Deferred income taxes
|
(915
|
)
|
1,829
|
|
368
|
|
—
|
|
1,282
|
|
|||||||||
|
Derivative instruments
|
149
|
|
515
|
|
—
|
|
(2
|
)
|
662
|
|
|||||||||
|
Other non-current assets
|
85
|
|
305
|
|
210
|
|
—
|
|
600
|
|
|||||||||
|
Total other assets
|
3,058
|
|
3,443
|
|
18,807
|
|
(18,380
|
)
|
6,928
|
|
|||||||||
|
Total Assets
|
$
|
19,414
|
|
$
|
16,728
|
|
$
|
17,370
|
|
$
|
(18,408
|
)
|
$
|
35,104
|
|
||||
|
LIABILITIES AND STOCKHOLDERS’ EQUITY
|
|||||||||||||||||||
|
Current Liabilities
|
|
|
|
|
|
||||||||||||||
|
Current portion of long-term debt and capital leases
|
$
|
1
|
|
$
|
137
|
|
$
|
15
|
|
$
|
(6
|
)
|
$
|
147
|
|
||||
|
Accounts payable
|
541
|
|
584
|
|
46
|
|
—
|
|
1,171
|
|
|||||||||
|
Accounts payable — affiliate
|
(55
|
)
|
1,421
|
|
(1,366
|
)
|
—
|
|
—
|
|
|||||||||
|
Derivative instruments
|
1,726
|
|
271
|
|
2
|
|
(18
|
)
|
1,981
|
|
|||||||||
|
Cash collateral received in support of energy risk management activities
|
131
|
|
140
|
|
—
|
|
—
|
|
271
|
|
|||||||||
|
Accrued expenses and other current liabilities
|
354
|
|
488
|
|
243
|
|
—
|
|
1,085
|
|
|||||||||
|
Total current liabilities
|
2,698
|
|
3,041
|
|
(1,060
|
)
|
(24
|
)
|
4,655
|
|
|||||||||
|
Other Liabilities
|
|
|
|
|
|
||||||||||||||
|
Long-term debt and capital leases
|
310
|
|
8,459
|
|
7,496
|
|
(529
|
)
|
15,736
|
|
|||||||||
|
Nuclear decommissioning reserve
|
354
|
|
—
|
|
—
|
|
—
|
|
354
|
|
|||||||||
|
Nuclear decommissioning trust liability
|
273
|
|
—
|
|
—
|
|
—
|
|
273
|
|
|||||||||
|
Deferred income taxes
|
—
|
|
55
|
|
—
|
|
—
|
|
55
|
|
|||||||||
|
Derivative instruments
|
312
|
|
190
|
|
—
|
|
(2
|
)
|
500
|
|
|||||||||
|
Out-of-market contracts
|
180
|
|
1,082
|
|
—
|
|
(31
|
)
|
1,231
|
|
|||||||||
|
Other non-current liabilities
|
618
|
|
800
|
|
135
|
|
—
|
|
1,553
|
|
|||||||||
|
Total non-current liabilities
|
2,047
|
|
10,586
|
|
7,631
|
|
(562
|
)
|
19,702
|
|
|||||||||
|
Total liabilities
|
4,745
|
|
13,627
|
|
6,571
|
|
(586
|
)
|
24,357
|
|
|||||||||
|
3.625% Preferred Stock
|
—
|
|
—
|
|
249
|
|
—
|
|
249
|
|
|||||||||
|
Stockholders’ Equity
|
14,669
|
|
3,101
|
|
10,550
|
|
(17,822
|
)
|
10,498
|
|
|||||||||
|
Total Liabilities and Stockholders’ Equity
|
$
|
19,414
|
|
$
|
16,728
|
|
$
|
17,370
|
|
$
|
(18,408
|
)
|
$
|
35,104
|
|
||||
|
(a)
|
All significant intercompany transactions have been eliminated in consolidation.
|
53
NRG ENERGY, INC. AND SUBSIDIARIES
CONDENSED CONSOLIDATING STATEMENTS OF CASH FLOWS
For the Nine Months Ended September 30, 2012
(Unaudited)
|
Guarantor Subsidiaries
|
Non-Guarantor Subsidiaries
|
NRG Energy, Inc.
(Note Issuer)
|
Eliminations
(a)
|
Consolidated Balance
|
|||||||||||||||
|
(In millions)
|
|||||||||||||||||||
|
Cash Flows from Operating Activities
|
|
|
|
|
|
||||||||||||||
|
Net Cash Provided/(Used) by Operating Activities
|
1,942
|
|
177
|
|
(883
|
)
|
(178
|
)
|
1,058
|
|
|||||||||
|
Cash Flows from Investing Activities
|
|
|
|
|
|
||||||||||||||
|
Intercompany loans to subsidiaries
|
(1,686
|
)
|
416
|
|
—
|
|
1,270
|
|
—
|
|
|||||||||
|
Acquisition of businesses, net of cash acquired
|
—
|
|
(17
|
)
|
(23
|
)
|
—
|
|
(40
|
)
|
|||||||||
|
Capital expenditures
|
(183
|
)
|
(2,241
|
)
|
(50
|
)
|
—
|
|
(2,474
|
)
|
|||||||||
|
Increase in restricted cash, net
|
(2
|
)
|
(94
|
)
|
—
|
|
—
|
|
(96
|
)
|
|||||||||
|
Decrease in restricted cash — U.S. DOE projects
|
—
|
|
113
|
|
38
|
|
—
|
|
151
|
|
|||||||||
|
Increase in notes receivable
|
—
|
|
(20
|
)
|
(2
|
)
|
—
|
|
(22
|
)
|
|||||||||
|
Investments in nuclear decommissioning trust fund securities
|
(341
|
)
|
—
|
|
—
|
|
—
|
|
(341
|
)
|
|||||||||
|
Proceeds from sales of nuclear decommissioning trust fund securities
|
316
|
|
—
|
|
—
|
|
—
|
|
316
|
|
|||||||||
|
Proceeds from renewable energy grants
|
3
|
|
46
|
|
—
|
|
—
|
|
49
|
|
|||||||||
|
Proceeds from sale of assets
|
133
|
|
—
|
|
4
|
|
—
|
|
137
|
|
|||||||||
|
Other
|
13
|
|
(8
|
)
|
(14
|
)
|
—
|
|
(9
|
)
|
|||||||||
|
Net Cash Used by Investing Activities
|
(1,747
|
)
|
(1,805
|
)
|
(47
|
)
|
1,270
|
|
(2,329
|
)
|
|||||||||
|
Cash Flows from Financing Activities
|
|
|
|
|
|
||||||||||||||
|
Proceeds from intercompany loans
|
—
|
|
—
|
|
1,270
|
|
(1,270
|
)
|
—
|
|
|||||||||
|
Payment of dividends to preferred stockholders
|
(172
|
)
|
(6
|
)
|
—
|
|
178
|
|
—
|
|
|||||||||
|
Payment of intercompany dividends
|
—
|
|
—
|
|
(28
|
)
|
—
|
|
(28
|
)
|
|||||||||
|
Net payment for settlement of acquired derivatives that include financing elements
|
(65
|
)
|
—
|
|
—
|
|
—
|
|
(65
|
)
|
|||||||||
|
Proceeds from issuance of long-term debt
|
9
|
|
1,526
|
|
1,006
|
|
—
|
|
2,541
|
|
|||||||||
|
Sale proceeds and other contributions from noncontrolling interest in subsidiaries
|
—
|
|
316
|
|
—
|
|
—
|
|
316
|
|
|||||||||
|
Payment of debt issuance costs
|
—
|
|
(16
|
)
|
(14
|
)
|
—
|
|
(30
|
)
|
|||||||||
|
Payments for short and long-term debt
|
—
|
|
(51
|
)
|
(904
|
)
|
—
|
|
(955
|
)
|
|||||||||
|
Net Cash (Used)/Provided by Financing Activities
|
(228
|
)
|
1,769
|
|
1,330
|
|
(1,092
|
)
|
1,779
|
|
|||||||||
|
Effect of exchange rate changes on cash and cash equivalents
|
—
|
|
(3
|
)
|
—
|
|
—
|
|
(3
|
)
|
|||||||||
|
Net (Decrease)/Increase in Cash and Cash Equivalents
|
(33
|
)
|
138
|
|
400
|
|
—
|
|
505
|
|
|||||||||
|
Cash and Cash Equivalents at Beginning of Period
|
44
|
|
85
|
|
976
|
|
—
|
|
1,105
|
|
|||||||||
|
Cash and Cash Equivalents at End of Period
|
$
|
11
|
|
$
|
223
|
|
$
|
1,376
|
|
$
|
—
|
|
$
|
1,610
|
|
||||
|
(a)
|
All significant intercompany transactions have been eliminated in consolidation.
|
54
As you read this discussion and analysis, refer to NRG's Condensed Consolidated Statements of Operations to this Form 10-Q, which present the results of operations for the
three
and
nine
months ended
September 30, 2013
and
2012
. Also refer to NRG's
2012
Form 10-K, which includes detailed discussions of various items impacting the Company's business, results of operations and financial condition, including: Introduction and Overview section which provides a description of NRG's business segments; Strategy section; Business Environment section, including how regulation, weather, and other factors affect NRG's business; and Critical Accounting Policies and Estimates section.
The discussion and analysis below has been organized as follows:
|
•
|
Executive summary, including introduction and overview, business strategy, and changes to the business environment during the period, including environmental and regulatory matters;
|
|
•
|
Results of operations;
|
|
•
|
Financial condition, addressing liquidity position, sources and uses of liquidity, capital resources and requirements, commitments, and off-balance sheet arrangements; and
|
|
•
|
Known trends that may affect NRG’s results of operations and financial condition in the future.
|
55
Executive Summary
Introduction and Overview
NRG Energy, Inc., or NRG or the Company, is historically a competitive power and energy company that aspires to be a leader in the way residential, industrial and commercial consumers think about, use, produce and deliver energy and energy services in major competitive power markets in the United States. NRG engages in the ownership and operation of power generation facilities; the trading of energy, capacity and related products; the transacting in and trading of fuel and transportation services and the direct sale of energy, services, and innovative, sustainable products to retail customers in competitive markets in which NRG owns generation. The Company sells retail electric products and services under the name “NRG” and various brands owned by NRG. Finally, NRG is a clean energy leader and is focused on the deployment and commercialization of potentially transformative technologies, like electric vehicles, Distributed Solar and smart meter/home automation technology that collectively have the potential to fundamentally change the nature of the power industry, including a substantial change in the role of the national electric transmission grid and distribution system.
On December 14, 2012, the Company acquired GenOn as further described in Note 3,
Business Acquisitions and Dispositions
, and has reported results of operations from the acquisition date forward. In July 2013, NRG Yield, Inc. closed its initial public offering as further described in Note 1,
Basis of Presentation
. As a result of the initial public offering of NRG Yield, Inc., the Company revised its segment reporting to include a specific NRG Yield segment, as further described in
Note 11
,
Segment Reporting
.
The following table summarizes NRG's global generation portfolio as of
September 30, 2013
, by operating segment, which includes 86 fossil fuel plants, nine Utility Scale Solar facilities and four wind farms, as well as Distributed Solar facilities. Also included is one Utility Scale Solar facility and additional Distributed Solar facilities currently under construction and one Utility Scale Solar facility partially in-service. All Utility Scale Solar and Distributed Solar facilities are described in megawatts on an alternating current basis. MW figures provided represent nominal summer net megawatt capacity of power generated as adjusted for the Company's owned or leased interest excluding capacity from inactive/mothballed units:
|
Fossil Fuel, Nuclear, and Renewable
|
||||||||||||||||||||||||||
|
(In MW)
|
||||||||||||||||||||||||||
|
Texas
|
East
|
South Central
|
West
|
Alternative Energy
|
NRG Yield
|
Total Domestic
|
Other
(Inter-national)
|
Total Global
|
||||||||||||||||||
|
Primary Fuel-type
|
||||||||||||||||||||||||||
|
Natural gas
|
5,927
|
|
7,651
|
|
3,817
|
|
6,779
|
|
—
|
|
843
|
|
25,017
|
|
—
|
|
25,017
|
|
||||||||
|
Coal
|
4,193
|
|
7,272
|
|
1,496
|
|
—
|
|
—
|
|
—
|
|
12,961
|
|
605
|
|
13,566
|
|
||||||||
|
Oil
(a)
|
—
|
|
5,533
|
|
—
|
|
—
|
|
—
|
|
190
|
|
5,723
|
|
—
|
|
5,723
|
|
||||||||
|
Nuclear
|
1,176
|
|
—
|
|
—
|
|
—
|
|
—
|
|
—
|
|
1,176
|
|
—
|
|
1,176
|
|
||||||||
|
Wind
|
—
|
|
—
|
|
—
|
|
—
|
|
347
|
|
101
|
|
448
|
|
—
|
|
448
|
|
||||||||
|
Utility Scale Solar
|
—
|
|
—
|
|
—
|
|
—
|
|
406
|
|
253
|
|
659
|
|
—
|
|
659
|
|
||||||||
|
Distributed Solar
|
—
|
|
—
|
|
—
|
|
—
|
|
37
|
|
10
|
|
47
|
|
—
|
|
47
|
|
||||||||
|
Total generation capacity
|
11,296
|
|
20,456
|
|
5,313
|
|
6,779
|
|
790
|
|
1,397
|
|
46,031
|
|
605
|
|
46,636
|
|
||||||||
|
Capacity attributable to noncontrolling interest
|
—
|
|
—
|
|
—
|
|
—
|
|
(142
|
)
|
(482
|
)
|
(624
|
)
|
—
|
|
(624
|
)
|
||||||||
|
Total net generation capacity
|
11,296
|
|
20,456
|
|
5,313
|
|
6,779
|
|
648
|
|
915
|
|
45,407
|
|
605
|
|
46,012
|
|
||||||||
|
Under Construction
|
||||||||||||||||||||||||||
|
Utility Scale Solar
|
—
|
|
—
|
|
—
|
|
—
|
|
444
|
|
50
|
|
494
|
|
—
|
|
494
|
|
||||||||
|
Distributed Solar
|
—
|
|
—
|
|
—
|
|
—
|
|
6
|
|
—
|
|
6
|
|
—
|
|
6
|
|
||||||||
|
Total under construction
|
—
|
|
—
|
|
—
|
|
—
|
|
450
|
|
50
|
|
500
|
|
—
|
|
500
|
|
||||||||
|
Capacity attributable to noncontrolling interest
|
—
|
|
—
|
|
—
|
|
(195
|
)
|
(17
|
)
|
(212
|
)
|
—
|
|
(212
|
)
|
||||||||||
|
Total net under construction
|
—
|
|
—
|
|
—
|
|
—
|
|
255
|
|
33
|
|
288
|
|
—
|
|
288
|
|
||||||||
(a) The NRG Yield operating segment consists of two dual-fuel (natural gas and oil) simple-cycle generation facilities.
In addition, the Company's thermal assets, which are part of the NRG Yield operating segment, provide steam and chilled water capacity of approximately 1,098 MWt through its district energy business.
For the
nine
months ended
September 30, 2013
, the Contra Costa and Norwalk facilities were deactivated, partially offset by the commissioning of the Marsh Landing facility and the W.A. Parish peaking unit.
56
NRG's Business Strategy
The Company's business is focused on: (i) excellence in safety and operating performance of its existing assets; (ii) serving the energy needs of end-use residential, commercial and industrial customers in competitive markets through multiple brands and channels with a variety of retail energy products and services differentiated by innovative features, premium service, sustainability, and loyalty/affinity programs; (iii) optimal hedging of generation assets and retail load operations; (iv) repowering of power generation assets at premium sites; (v) investing in, and deploying, alternative energy technologies both in its wholesale and, particularly, in and around its Retail Business and its customers; (vi) pursuing selective acquisitions, joint ventures, divestitures and investments; and (vii) engaging in a proactive capital allocation plan focused on achieving the regular return of and on stockholder capital within the dictates of prudent balance sheet management.
In addition, the Company created NRG Yield, Inc. to enhance value for its stockholders by seeking to achieve the following objectives: (i) gain access to an alternative investor base with a more competitive source of equity capital that would accelerate NRG Yield, Inc.'s long-term growth and acquisition strategy and optimize the NRG Yield, Inc. capital structure; (ii) highlight the value inherent in the contracted conventional and renewable generation and thermal infrastructure assets by separating them from other NRG non-contracted assets; and (iii) create a pure-play public issue with operating, financial and tax characteristics that the Company believes will appeal to dividend growth-oriented investors seeking exposure to the contracted power sector.
The Company believes that the U.S. energy industry is going to be increasingly impacted by the long-term societal trend towards sustainability, which is both generational and irreversible. Moreover, it further believes the information technology-driven revolution, which has enabled greater and easier personal choice in other sectors of the consumer economy, will do the same in the U.S. energy sector over the years to come. As a result, energy consumers are expected to have increasing personal control over whom they buy their energy from, how that energy is generated and used and what environmental impact these individual choices will have. The Company's initiatives in this area of future growth are focused on: (i) renewables, with a concentration in solar development; (ii) electric vehicle ecosystems; (iii) customer-facing energy products and services, including smart energy services that give consumers individual energy insights, choices and convenience, a variety of renewable and energy efficiency products, and numerous loyalty and affinity options and tailored product and service bundles sold through unique retail sales channels; and (iv) construction of other forms of on-site clean power generation. The Company's advances in each of these areas are driven by select acquisitions, joint ventures, and investments that are more fully described in Item 1,
Business - New and On-going Company Initiatives and Development Projects,
of the Company's 2012 Form 10-K, and in
Management's Discussion and Analysis of Financial Condition and Results of Operations
,
New and On-going Company Initiatives and Development Projects,
in this Form 10-Q.
In summary, NRG's business strategy is intended to maximize stockholder value through the production and sale of safe, reliable and affordable power to its customers in the markets served by the Company, while aggressively positioning the Company to meet the market's increasing demand for sustainable and low carbon energy solutions. This strategy is designed to enhance the Company's core business of competitive power generation and mitigate the risk of declining power prices. The Company expects to become a leading provider of sustainable energy solutions that promotes national energy security, while utilizing the Company's Retail Business to complement and advance its initiatives.
57
Environmental Matters
Environmental Regulatory Landscape
A number of regulations with the potential to affect the Company and its facilities are in development or under review by the EPA: NSPS for GHGs, NAAQS revisions and implementation, coal combustion byproducts regulation, effluent limitation guidelines and once-through cooling regulations. The outcomes and any resulting impact on NRG cannot be fully predicted until the rules are finalized (and any resulting legal challenges resolved).
Air
The CAA and the resulting regulations (as well as similar state and local requirements) have the potential to impact air emissions, operating practices and pollution control equipment at power plants. Under the CAA, the EPA sets NAAQS for certain pollutants including SO
2
, ozone, and PM
2.5
. Many of the Company's facilities are located in or near areas that are classified by the EPA as not achieving certain NAAQS (non-attainment areas). The relevant NAAQS have become more stringent and NRG expects that trend to continue. The Company expects increased regulation at both the federal and state levels of its air emissions and maintains a comprehensive compliance strategy to address these continuing and new requirements. Complying with increasingly stringent NAAQS may require the installation of additional emissions control equipment at some NRG facilities. Significant changes to air regulatory programs to which the Company is subject are described below. See Item 1,
Business - Environmental Matters,
of NRG's 2012 Form 10-K for a full description of environmental matters impacting the Company.
Before year end, EPA intends to re-propose the NSPS for CO
2
emissions from new fossil-fuel-fired electric generating units that was previously proposed in April 2012. Based on the prepublication version of the reproposal released by EPA in September 2013, the Company expects the reproposed standards to be 1,000 pounds of CO
2
per MWh for large gas units and 1,100 pounds of CO
2
per MWh for coal units and small gas units. Proposed standards are in effect until a final rule is published or another rule is re-proposed. In 2014, EPA intends to propose another rule that would require states to develop CO
2
standards that would apply to existing fossil-fueled generating facilities.
Cross-State Air Pollution Rule
— In 2005, the EPA promulgated CAIR which established SO
2
and NO
x
cap-and-trade programs applicable directly to states and indirectly to generating facilities in the eastern United States. In July 2008, the U.S. Court of Appeals for the D.C. Circuit in
State of North Carolina v. Environmental Protection Agency
issued an opinion that would have vacated CAIR. In December 2008, the U.S. Court of Appeals for the D.C. Circuit issued a second opinion that simply remanded the case to the EPA without vacating CAIR.
In August 2011, the EPA finalized CSAPR, which was intended to replace CAIR starting in 2012. It was designed to address interstate SO
2
and NO
X
emissions from certain power plants in the eastern half of the United States. In September 2011, GenOn and others asked the U.S. Court of Appeals for the D.C. Circuit to stay and vacate CSAPR because, among other reasons, the rule circumvented the state implementation plan process expressly provided for in the CAA, afforded affected parties no time to install compliance equipment before the compliance period started and included numerous material changes from the proposed rule, which deprived parties of an opportunity to provide comments. In December 2011, the court issued an order that stayed implementation of CSAPR and
ordered EPA to keep CAIR in place until the court could rule on the legal deficiencies alleged with respect to CSAPR. In August 2012, the D.C. Circuit issued an order vacating CSAPR and keeping CAIR in place. In October 2012, the EPA filed a petition asking the D.C. Circuit to rehear the case
en banc
, which was denied in January 2013. The EPA petitioned the U.S. Supreme Court seeking review of the D.C. Circuit's decision, which petition was granted. The Supreme Court will hold oral argument on this case on December 10, 2013.
East Region
RGGI
— In February 2013, RGGI, Inc. released a proposed model rule that if promulgated by the nine RGGI member states would reduce the RGGI CO
2
emissions cap from 165 million tons to 91 million tons in 2014 with a 2.5% reduction each year from 2015 to 2020. Each of the RGGI member states has published a proposed rule. Each of the RGGI states intends to finalize these regulations later this year. If this occurs, the Company expects earnings at its plants in Connecticut, Delaware, Massachusetts, New York, and particularly those in Maryland, to be negatively affected. The extent to which they would be negatively affected depends on the price of the CO
2
emissions allowances, which in turn will be significantly influenced by future natural gas prices, power prices, generation resource mix, dispatch order, and any nuclear plant retirements.
58
Regulatory Matters
As operators of power plants and participants in wholesale and retail energy markets, certain NRG entities are subject to regulation by various federal and state government agencies. These include the U.S. Commodity Futures Trading Commission, FERC, NRC, and the PUCT, as well as other public utility commissions in certain states where NRG's generating, thermal, or distributed generation assets are located. In addition, NRG is subject to the market rules, procedures and protocols of the various ISO and RTO markets in which it participates. Likewise, certain NRG entities participating in the retail markets are subject to rules and regulations established by the states in which NRG entities are licensed to sell at retail. NRG must also comply with the mandatory reliability requirements imposed by the North American Electric Reliability Corporation and the regional reliability entities in the regions where the Company operates.
NRG's operations within the ERCOT footprint are not subject to rate regulation by FERC, as they are deemed to operate solely within the ERCOT market and not in interstate commerce. These operations are subject to regulation by PUCT, as well as to regulation by the NRC with respect to the Company's ownership interest in STP.
East Region
PJM
MOPR Litigation
—
On April 12, 2011, FERC issued an order addressing a complaint filed by PJM Power Providers Group seeking to require PJM to address the potential adverse impacts of out-of-market generation on the PJM Reliability Pricing Model capacity market, as well as PJM's subsequent submission seeking revisions to the capacity market design, in particular the MOPR. In its order, FERC generally strengthened the MOPR and the protections against market price distortion from out-of-market generation. On November 17, 2011, FERC largely denied rehearing of its April 12, 2011 order. Several parties have appealed FERC's decision to federal court, and those appeals have been consolidated in the Third Circuit Court of Appeals. Oral arguments were held on September 10, 2013. The outcome of this proceeding could drive future capacity prices.
MOPR Revisions
—
On December 7, 2012, PJM filed comprehensive revisions to its MOPR rules at FERC. On May 2, 2013, FERC accepted PJM's proposal in part, and rejected it in part. Among other things, FERC approved the portions of the PJM proposal that exempt many new entrants from MOPR rules, including projects proposed by merchant generators, public power entities and certain self-supply entities. This exemption is subject to certain conditions designed to limit the financial incentive of such entities to suppress market prices. However, FERC rejected PJM's proposal to eliminate the unit specific review process, and instead directed PJM to continue allowing units to demonstrate their actual costs and revenues, and bid into the auction at that price. On June 3, 2013, the Company filed a request for rehearing of the FERC order and subsequently protested the manner in which PJM proposed to implement the FERC order. These challenges are both pending.
New Jersey's Long-Term Capacity Agreement Pilot Program
— In 2011, the New Jersey Board of Public Utilities, or NJBPU, awarded New Jersey Power Development LLC, a subsidiary of the Company, a Standard Offer Capacity Agreement, or SOCA, with each of the four New Jersey electric utilities with respect to the proposed Old Bridge facility as part of New Jersey's Long-Term Capacity Agreement Pilot Program.
The constitutionality of the SOCAs awarded by the NJBPU to the Company and other entities were challenged in the U.S. District Court for the District of New Jersey. On October 11, 2013, the New Jersey Federal Court held that the SOCAs violated the Supremacy Clause of the U.S. Constitution because they intruded on the authority Congress had granted to FERC under the Federal Power Act to set wholesale energy prices, which authority FERC had expressed through the PJM capacity auction. Additionally, the Court found that the SOCA poses an obstacle to FERC’s implementation of the PJM capacity auction. Based on these findings, the New Jersey Federal Court found the SOCAs to be null and void.
In a similar challenge lodged in the U.S. District Court for the District of Maryland against a comparable long-term contract issued to a generator in Maryland by the Public Service Commission of Maryland, the Maryland Court ruled on September 30, 2013, the Maryland contract violated the Supremacy Clause of the U.S. Constitution and was preempted. The Court based this holding on its finding that the compensation under the Maryland contract amounted to the PSC effectively setting the wholesale price when Congress had vested that authority in FERC, thus preempting state regulatory action to establish the wholesale price.
59
New England
New England Power Generators Association, or NEPGA, Complaint
— On May 17, 2013, the NEPGA filed a complaint against ISO New England, Inc., or ISO-NE, asking FERC to clarify that under ISO-NE's existing tariff, a capacity resource's inability to procure or schedule fuel when called upon is not a tariff violation or an attempt to manipulate the ISO-NE energy markets. On August 27, 2013, FERC granted the complaint after making a distinction between being unable to procure fuel or transportation and making an economic determination not to do so. FERC found that if a capacity resource cannot procure fuel or transportation when called upon, then the resource is not physically available and may be excused for non-performance. As an operator of gas fired generation facilities in New England, the Company could have been subject to sanction when gas is not available, had FERC not granted the NEPGA complaint.
New York
NYSPSC Order Rescinding Danskammer Retirement
— On October 29, 2013, the NYSPSC took emergency action to rescind its approval for the 530 MW Danskammer facility to retire on October 30, 2013. The NYSPSC’s stated goal was to allow the facility to return to service in order to constrain rate increases in New York. The return to service of this facility may affect capacity prices received by NRG for its resources in the Rest-of-State capacity zone and the Lower Hudson Valley capacity zone.
NYISO May 2013 Capacity Auction Results
— On May 3, 2013, the NYISO announced that the monthly spot capacity auction prices for the May 2013 delivery month were not calculated properly due to an anomaly in the data used to calculate the Minimum Unforced Capacity Requirements for Load Serving Entities and to translate the Installed Capacity, or ICAP, Demand Curves into Unforced Capacity Demand Curves for the Summer Capability Period beginning May 1, 2013. The NYISO stated that the issue impacted the May 2013 ICAP Spot Market Auction clearing prices for New York Control Area and the New York City and Long Island Localities. On May 4, 2013, the NYISO stated that it was correcting May auction prices. NRG does not anticipate that the error has had or will have any impact on monthly auctions.
Dunkirk Power LLC Reliability Service
—
On March 14, 2012, Dunkirk Power LLC, or Dunkirk Power, filed a notice with the NYSPSC of its intent to mothball the Dunkirk Station no later than September 10, 2012. The effects of the mothball on electric system reliability were reviewed by Niagara Mohawk Power Corporation, d/b/a National Grid, or NG. As a result of those studies, NG determined that the mothball of the Dunkirk Station would have a negative impact on the reliability of the New York transmission system and that portions of the Dunkirk Station may be retained for reliability purposes via a non-market compensation arrangement. On July 12, 2012, Dunkirk Power filed a RMR agreement with FERC. On July 20, 2012, NG and Dunkirk Power agreed on the material terms for a bilateral reliability support services, or RSS, agreement and submitted those terms to the NYSPSC for rate recovery in NG's rates. On August 16, 2012, the NYSPSC approved terms and on August 27, 2012, Dunkirk Power and NG entered into the RSS agreement that began on September 1, 2012 and expired on May 31, 2013. In late 2012, NG issued a request for proposals with respect to its reliability need in the Dunkirk area for the two years beginning June 1, 2014. Dunkirk Power submitted a proposal and signed a second, two-year, contract on March 4, 2013 pursuant to which one unit at Dunkirk will continue operating through May 31, 2015. The contract was submitted to the NYSPSC in March 2013 and approved in May 2013.
Champlain-Hudson Transmission Line
— On April 18, 2013, the NYSPSC approved construction of the Champlain-Hudson transmission line from Canada into New York City. Construction of this transmission expansion could have a material impact on capacity and energy prices in New York.
Independent Power Producers of New York Complaint
— On May 10, 2013, generators in New York filed a complaint at FERC against the NYISO. The generators asked FERC to direct the NYISO to require that capacity from existing generation resources that would have exited the market but for out-of-market payments under RMR type agreements be excluded from the capacity market altogether or be offered at levels no lower than the resources' going-forward costs. The generators point to the recent reliability services agreements entered into between the NYSPSC and generators, including Dunkirk Power, and seek to prevent below-cost offers from artificially suppressing prices in the New York Control Area Installed Capacity Spot Market Auction. A number of New York Transmission Owners protested the filing and the case is pending.
60
West Region
The CAISO and CPUC launched a joint stakeholder initiative to develop a multi-year reliability market framework. In a whitepaper issued on July 10, 2013, the CAISO/CPUC proposed a joint reliability framework that combined multi-year resource adequacy obligations for Load Serving Entities with a multi-year market-based CAISO backstop capacity procurement mechanism. Specifically, the proposal (i) retains the current one-year forward system and local capacity procurement obligations and extends those procurement obligations to system, local and flexible capacity for two and three years forward; (ii) develops a CAISO-run capacity auction; and (iii) provides for an annual long-term reliability planning assessment focusing on the four to ten-year forward period. The CAISO and CPUC held a joint workshop to discuss the proposal on July 17, 2013, and stakeholders, including the Company, filed comments on the proposal on July 25, 2013. While the whitepaper lacks specificity, the Company views any attempt to extend the procurement obligations forward, and adopt a market structure to help meet those obligations, as a potentially positive step.
South Central Region
On July 5, 2013, AmerenEnergy Resources Generating Company, or Ameren, filed a complaint against MISO pertaining to the compensation for generators asked by MISO to provide service past their retirement date due to reliability concerns. Ameren asked FERC to require MISO to provide such generators their full cost of service as compensation and not merely cover the generator's incremental costs of operation going-forward costs. The Company supports the Ameren complaint. The matter remains pending.
ERCOT
At its September 12, 2013 open meeting, the PUCT directed ERCOT to implement an operating reserve demand curve, or ORDC, by the summer of 2014, known as ORDC B+. ORDC B+ simulates real-time co-optimization and adjusts prices to reflect outcomes expected under real-time co-optimization. The demand curve will be set to achieve an imputed value of lost load of $9,000 per MWh when ERCOT reaches 2,000 MWs of available reserves. As part of prior market reforms, system wide offer caps (currently $5,000) will increase to $7,000 per MWh in June 2014 and $9,000 per MWh in June 2015.
The PUCT is currently considering adoption of mandatory reserve margins in order to remedy forecasted resource shortfalls and assure system reliability. The PUCT held a workshop on October 8, 2013 to engage stakeholders on the merits of a reserve margin mandate and related issues, including refinements to ERCOT load forecasting and possible changes to reserve margin calculations. On October 25, 2013, at the regular PUCT open meeting, two of the three commissioners expressed support for mandatory reserve margins although no formal vote was taken.
Changes in Accounting Standards
See
Note 2
,
Summary of Significant Accounting Policies
, to this Form 10-Q as found in Item 1 for a discussion of recent accounting developments.
61
Consolidated Results of Operations
The following table provides selected financial information for the Company:
|
|
Three months ended September 30,
|
Nine months ended September 30,
|
|||||||||||||||||||
|
(In millions except otherwise noted)
|
2013
|
2012
|
Change %
|
2013
|
2012
|
Change %
|
|||||||||||||||
|
Operating Revenues
|
|||||||||||||||||||||
|
Energy revenue
(a)
|
$
|
931
|
|
$
|
626
|
|
49
|
%
|
$
|
2,627
|
|
$
|
1,603
|
|
64
|
%
|
|||||
|
Capacity revenue
(a)
|
534
|
|
194
|
|
175
|
|
1,295
|
|
557
|
|
132
|
|
|||||||||
|
Retail revenue
|
1,999
|
|
1,860
|
|
7
|
|
4,805
|
|
4,576
|
|
5
|
|
|||||||||
|
Mark-to-market for economic hedging activities
|
(75
|
)
|
(377
|
)
|
80
|
|
(360
|
)
|
(458
|
)
|
21
|
|
|||||||||
|
Contract amortization
|
(3
|
)
|
(10
|
)
|
70
|
|
(32
|
)
|
(69
|
)
|
54
|
|
|||||||||
|
Other revenues
(b)
|
104
|
|
38
|
|
174
|
|
165
|
|
150
|
|
10
|
|
|||||||||
|
Total operating revenues
|
3,490
|
|
2,331
|
|
50
|
|
8,500
|
|
6,359
|
|
34
|
|
|||||||||
|
Operating Costs and Expenses
|
|||||||||||||||||||||
|
Generation cost of sales
(a)
|
1,010
|
|
694
|
|
46
|
|
2,606
|
|
1,655
|
|
57
|
|
|||||||||
|
Retail cost of sales
(a)
|
879
|
|
847
|
|
4
|
|
2,134
|
|
2,197
|
|
(3
|
)
|
|||||||||
|
Mark-to-market for economic hedging activities
|
(22
|
)
|
(118
|
)
|
81
|
|
(142
|
)
|
(174
|
)
|
18
|
|
|||||||||
|
Contract and emissions credit amortization
(c)
|
3
|
|
13
|
|
(77
|
)
|
7
|
|
32
|
|
(78
|
)
|
|||||||||
|
Other cost of operations
|
485
|
|
|
304
|
|
60
|
|
1,574
|
|
950
|
|
66
|
|
||||||||
|
Total cost of operations
|
2,355
|
|
1,740
|
|
35
|
|
6,179
|
|
4,660
|
|
33
|
|
|||||||||
|
Depreciation and amortization
|
318
|
|
239
|
|
33
|
|
921
|
|
703
|
|
31
|
|
|||||||||
|
Selling, general and administrative
|
229
|
|
|
224
|
|
2
|
|
671
|
|
613
|
|
9
|
|
||||||||
|
Acquisition-related transaction and integration costs
|
26
|
|
|
18
|
|
44
|
|
95
|
|
18
|
|
428
|
|
||||||||
|
Development activity expenses
|
27
|
|
|
24
|
|
13
|
|
63
|
|
52
|
|
21
|
|
||||||||
|
Total operating costs and expenses
|
2,955
|
|
2,245
|
|
32
|
|
7,929
|
|
6,046
|
|
31
|
|
|||||||||
|
Operating Income
|
535
|
|
86
|
|
N/M
|
|
571
|
|
313
|
|
82
|
|
|||||||||
|
Other Income/(Expense)
|
|||||||||||||||||||||
|
Equity in (losses)/earnings of unconsolidated affiliates
|
(5
|
)
|
4
|
|
(225
|
)
|
6
|
|
26
|
|
(77
|
)
|
|||||||||
|
Other income, net
|
5
|
|
9
|
|
(44
|
)
|
9
|
|
12
|
|
(25
|
)
|
|||||||||
|
Loss on debt extinguishment
|
(1
|
)
|
(41
|
)
|
(98
|
)
|
(50
|
)
|
(41
|
)
|
22
|
|
|||||||||
|
Interest expense
|
(228
|
)
|
(163
|
)
|
40
|
|
(630
|
)
|
(495
|
)
|
27
|
|
|||||||||
|
Total other expense
|
(229
|
)
|
(191
|
)
|
20
|
|
(665
|
)
|
(498
|
)
|
34
|
|
|||||||||
|
Income/(Loss) before Income Taxes
|
306
|
|
(105
|
)
|
391
|
|
(94
|
)
|
(185
|
)
|
49
|
|
|||||||||
|
Income tax expense/(benefit)
|
163
|
|
(113
|
)
|
244
|
|
(47
|
)
|
(246
|
)
|
81
|
|
|||||||||
|
Net Income/(Loss)
|
143
|
|
8
|
|
N/M
|
|
(47
|
)
|
61
|
|
(177
|
)
|
|||||||||
|
Less: Net income attributable to noncontrolling interest
|
19
|
|
9
|
|
111
|
|
27
|
|
18
|
|
50
|
|
|||||||||
|
Net Income/(Loss) Attributable to NRG Energy, Inc.
|
$
|
124
|
|
$
|
(1
|
)
|
N/M
|
|
$
|
(74
|
)
|
$
|
43
|
|
(272
|
)
|
|||||
|
Business Metrics
|
|
|
|||||||||||||||||||
|
Average natural gas price — Henry Hub ($/MMBtu)
|
$
|
3.58
|
|
$
|
2.81
|
|
27
|
%
|
$
|
3.67
|
|
$
|
2.59
|
|
42
|
%
|
|||||
|
(a)
|
Includes realized gains and losses from financially settled transactions.
|
|
(b)
|
Includes unrealized trading gains and losses.
|
|
(c)
|
Includes amortization of SO
2
and NO
x
credits and excludes amortization of RGGI credits.
|
N/M - Not meaningful.
62
Management’s discussion of the results of operations for the three months ended
September 30, 2013
and
2012
Income/(loss) before income taxes
— The pre-tax income of
$306 million
for the three months ended
September 30, 2013
, compared to a pre-tax loss of $
105 million
for the three months ended
September 30, 2012
, primarily reflects:
|
•
|
in the current year, an increase in gross margin as a result of i) a
$439 million
increase in Conventional Generation gross margin, ii) a $47 million increase in NRG Yield gross margin and iii) a $36 million increase in Alternative Energy gross margin, offset by a $13 million decrease in Retail gross margin; and
|
|
•
|
a $206 million increase in net mark-to-market results from economic hedging activities; offset by
|
|
•
|
a $276 million increase in operating costs primarily from increased other operating costs, depreciation and amortization, selling, general and administrative expenses, acquisition-related transaction and integration costs, and development activity expenses; and
|
|
•
|
an increase of $25 million in interest expense and loss on debt extinguishment.
|
Net income
— The increase in net income of
$135 million
primarily reflects the drivers discussed above, offset by an income tax expense for the three months ended
September 30, 2013
of
$163 million
, compared to an income tax benefit of
$113 million
in the comparable period.
Conventional Generation gross margin
The following is a discussion of gross margin for NRG's Conventional Generation businesses, adjusted to eliminate intersegment activity, primarily with the Retail Business.
|
Three months ended September 30, 2013
|
|||||||||||||||||||||||||||||||||||||||
|
Conventional Generation
|
|||||||||||||||||||||||||||||||||||||||
|
(In millions except otherwise noted)
|
Texas
|
East
|
South Central
|
West
|
Other
|
Subtotal
|
Alternative Energy
|
NRG Yield
|
Eliminations/Corporate
|
Consolidated Total
|
|||||||||||||||||||||||||||||
|
Energy revenue
|
$
|
657
|
|
$
|
698
|
|
$
|
167
|
|
$
|
41
|
|
$
|
—
|
|
$
|
1,563
|
|
$
|
74
|
|
$
|
28
|
|
$
|
(734
|
)
|
$
|
931
|
|
|||||||||
|
Capacity revenue
|
42
|
|
325
|
|
64
|
|
90
|
|
2
|
|
523
|
|
—
|
|
39
|
|
(28
|
)
|
534
|
|
|||||||||||||||||||
|
Other revenue
|
14
|
|
32
|
|
5
|
|
1
|
|
36
|
|
88
|
|
10
|
|
29
|
|
(23
|
)
|
104
|
|
|||||||||||||||||||
|
Generation revenue
|
713
|
|
1,055
|
|
236
|
|
132
|
|
38
|
|
2,174
|
|
84
|
|
$
|
96
|
|
$
|
(785
|
)
|
$
|
1,569
|
|
||||||||||||||||
|
Generation cost of sales
|
(358
|
)
|
(425
|
)
|
(177
|
)
|
(35
|
)
|
(14
|
)
|
(1,009
|
)
|
(1
|
)
|
(18
|
)
|
18
|
|
(1,010
|
)
|
|||||||||||||||||||
|
Generation gross margin
|
$
|
355
|
|
$
|
630
|
|
$
|
59
|
|
$
|
97
|
|
$
|
24
|
|
$
|
1,165
|
|
$
|
83
|
|
$
|
78
|
|
|
||||||||||||||
|
Business Metrics
|
|||||||||||||||||||||||||||||||||||||||
|
MWh sold (in thousands)
(a)
|
13,697
|
|
9,972
|
|
4,759
|
|
552
|
|
|
|
527
|
|
263
|
|
|||||||||||||||||||||||||
|
MWh generated (in thousands)
|
12,717
|
|
9,628
|
|
4,314
|
|
1,155
|
|
|
|
527
|
|
332
|
|
|||||||||||||||||||||||||
|
Average on-peak market power prices ($/MWh)
(b)(c)
|
$
|
40.79
|
|
$
|
52.39
|
|
$
|
34.23
|
|
$
|
46.60
|
|
N/A
|
|
|||||||||||||||||||||||||
|
(a) MWh sold excludes generation at facilities that generate revenue under capacity agreements.
|
|||||||||||||||||||||||||||||||||||||||
|
(b) Average on-peak market power prices calculated based on average settled market prices in the following zones: for Texas region, in ERCOT - Houston and ERCOT - North; for East region, in NYISO - West, NYISO - New York City, ISO - NE - Mass Hub, PJM - West Hub and PJM - DPL; and for West region, in CAISO - NP15 and CAISO - SP15.
|
|||||||||||||||||||||||||||||||||||||||
|
(c) Average on-peak market power prices for South Central region are calculated based on average day ahead market prices for "into Entergy" as published in the Platts Megawatt Daily report.
|
|||||||||||||||||||||||||||||||||||||||
63
|
|
Three months ended September 30, 2012
|
||||||||||||||||||||||||||||||||||||||
|
Conventional Generation
|
|||||||||||||||||||||||||||||||||||||||
|
(In millions except otherwise noted)
|
Texas
|
East
|
South Central
|
West
|
Other
|
Subtotal
|
Alternative Energy
|
NRG Yield
|
Eliminations/Corporate
|
Consolidated Total
|
|||||||||||||||||||||||||||||
|
Energy revenue
|
$
|
767
|
|
$
|
183
|
|
$
|
196
|
|
$
|
43
|
|
$
|
—
|
|
$
|
1,189
|
|
$
|
47
|
|
$
|
11
|
|
$
|
(621
|
)
|
$
|
626
|
|
|||||||||
|
Capacity revenue
|
27
|
|
84
|
|
59
|
|
31
|
|
3
|
|
204
|
|
—
|
|
2
|
|
(12
|
)
|
194
|
|
|||||||||||||||||||
|
Other revenue
|
(16
|
)
|
5
|
|
(3
|
)
|
4
|
|
25
|
|
15
|
|
—
|
|
35
|
|
(12
|
)
|
38
|
|
|||||||||||||||||||
|
Generation revenue
|
778
|
|
272
|
|
252
|
|
78
|
|
28
|
|
1,408
|
|
47
|
|
$
|
48
|
|
$
|
(645
|
)
|
$
|
858
|
|
||||||||||||||||
|
Generation cost of sales
|
(306
|
)
|
(145
|
)
|
(187
|
)
|
(35
|
)
|
(9
|
)
|
(682
|
)
|
—
|
|
(17
|
)
|
5
|
|
(694
|
)
|
|||||||||||||||||||
|
Generation gross margin
|
$
|
472
|
|
$
|
127
|
|
$
|
65
|
|
$
|
43
|
|
$
|
19
|
|
$
|
726
|
|
$
|
47
|
|
$
|
31
|
|
|||||||||||||||
|
Business Metrics
|
|
||||||||||||||||||||||||||||||||||||||
|
MWh sold (in thousands)
|
13,061
|
|
2,592
|
|
6,021
|
|
863
|
|
376
|
|
93
|
|
|||||||||||||||||||||||||||
|
MWh generated (in thousands)
|
11,949
|
|
2,140
|
|
4,474
|
|
863
|
|
376
|
|
93
|
|
|||||||||||||||||||||||||||
|
Average on-peak market power prices ($/MWh)
(a)(b)
|
$
|
31.92
|
|
$
|
47.29
|
|
$
|
31.07
|
|
$
|
38.77
|
|
N/A
|
|
|||||||||||||||||||||||||
|
(a) Average on-peak market power prices calculated based on average settled market prices in the following zones: for Texas region, in ERCOT - Houston and ERCOT - North; for East region, in NYISO - West, NYISO - New York City, ISO - NE - Mass Hub, PJM - West Hub and PJM - DPL; and for West region, in CAISO - NP15 and CAISO - SP15.
|
|||||||||||||||||||||||||||||||||||||||
|
(b) Average on-peak market power prices for South Central region are calculated based on average day ahead market prices for "into Entergy" as published in the Platts Megawatt Daily report.
|
|||||||||||||||||||||||||||||||||||||||
|
|
Three months ended September 30,
|
||||||||||||||||||||||||||||||||||||||
|
Weather Metrics
|
Texas
|
East
|
South Central
|
West
|
|||||||||||||||||||||||||||||||||||
|
2013
|
|
|
|
|
|||||||||||||||||||||||||||||||||||
|
CDDs
(a)
|
1,617
|
|
536
|
|
980
|
|
680
|
|
|||||||||||||||||||||||||||||||
|
HDDs
(a)
|
—
|
|
170
|
|
24
|
|
35
|
|
|||||||||||||||||||||||||||||||
|
2012
|
|||||||||||||||||||||||||||||||||||||||
|
CDDs
|
1,594
|
|
586
|
|
1,096
|
|
724
|
|
|||||||||||||||||||||||||||||||
|
HDDs
|
—
|
|
122
|
|
41
|
|
44
|
|
|||||||||||||||||||||||||||||||
|
10 year average
|
|||||||||||||||||||||||||||||||||||||||
|
CDDs
|
1,571
|
|
520
|
|
1,093
|
|
636
|
|
|||||||||||||||||||||||||||||||
|
HDDs
|
2
|
|
111
|
|
26
|
|
56
|
|
|||||||||||||||||||||||||||||||
|
(a)
|
National Oceanic and Atmospheric Administration-Climate Prediction Center - A Cooling Degree Day, or CDD, represents the number of degrees that the mean temperature for a particular day is above 65 degrees Fahrenheit in each region. A Heating Degree Day, or HDD, represents the number of degrees that the mean temperature for a particular day is below 65 degrees Fahrenheit in each region. The CDDs/HDDs for a period of time are calculated by adding the CDDs/HDDs for each day during the period.
|
64
Conventional Generation gross margin
—
increased by
$439 million
, including intercompany sales, during the three months ended
September 30, 2013
, compared to the same period in
2012
, due to:
|
Decrease in Texas region
|
$
|
(117
|
)
|
|
Increase in East region
|
503
|
|
|
|
Decrease in South Central region
|
(6
|
)
|
|
|
Increase in West region
|
54
|
|
|
|
Other
(a)
|
5
|
|
|
|
$
|
439
|
|
|
|
(a)
|
Other gross margin primarily represents revenues from the maintenance services business, which are eliminated in consolidation.
|
The decrease in gross margin in the Texas region was driven by:
|
Lower gross margin from a decrease in average realized energy prices
|
$
|
(167
|
)
|
|
Change in unrealized commercial optimization activities
|
21
|
|
|
|
Higher gross margin from 7% increase in coal generation driven by 2% fewer outage hours in 2013
|
13
|
|
|
|
Higher revenue due to additional bilateral contracts with load serving entities, including the Retail Business
|
10
|
|
|
|
Higher gross margin due to the acquisition of Gregory in August 2013
|
6
|
|
|
|
$
|
(117
|
)
|
|
The increase in gross margin in the East region was driven by:
|
Higher gross margin from the acquisition of GenOn in December 2012
|
$
|
477
|
|
|
Higher revenue due to an increase of 26% in New York and PJM hedged capacity prices and the New York RSS contract
|
21
|
|
|
|
Change in unrealized commercial optimization activities
|
6
|
|
|
|
Lower margins realized on certain load-serving contracts due to increased pricing for power purchases
|
(7
|
)
|
|
|
Lower gross margin from coal plants primarily due to a 6% decrease in average realized energy prices
|
(6
|
)
|
|
|
Other
|
12
|
|
|
|
$
|
503
|
|
|
The decrease in gross margin in the South Central region was driven by:
|
Lower gross margin from a decrease in generation due to milder weather in 2013
|
$
|
(13
|
)
|
|
Lower gross margin from higher fuel and purchased power costs
|
(6
|
)
|
|
|
Higher gross margin due to an increase in average realized energy prices
|
8
|
|
|
|
Change in unrealized commercial optimization activities and other
|
5
|
|
|
|
$
|
(6
|
)
|
|
The increase in gross margin in the West region was driven by:
|
Higher gross margin from the acquisition of GenOn in December 2012
|
$
|
48
|
|
|
Increase in capacity revenue due primarily to El Segundo Energy Center reaching COD
|
10
|
|
|
|
Decrease due to higher emissions expense
|
(5
|
)
|
|
|
Other
|
1
|
|
|
|
$
|
54
|
|
|
Alternative Energy gross margin
NRG's Alternative Energy business segment, which is comprised mainly of certain solar and wind businesses that are not part of NRG Yield, had gross margin of
$83 million
for the three months ended
September 30, 2013
, compared to gross margin of
$47 million
for the same period in
2012
, primarily as a result of new project phases reaching their commercial operations date, or COD, including 132 MW for Agua Caliente and 126 MW for CVSR.
65
NRG Yield gross margin
NRG Yield had gross margin of
$78 million
for the three months ended
September 30, 2013
, compared to gross margin of
$31 million
for the same period in
2012
, primarily as a result of new projects reaching COD during late 2012 and 2013 including Avra Valley, Alpine, Borrego and Marsh Landing.
Retail gross margin
The following is a detailed discussion of retail gross margin for NRG's Retail Business segment.
|
Three months ended September 30,
|
|||||||
|
(In millions except otherwise noted)
|
2013
|
2012
|
|||||
|
Mass revenues
|
$
|
1,374
|
|
$
|
1,249
|
|
|
|
Commercial and Industrial revenues
|
535
|
|
557
|
|
|||
|
Supply management and other revenues
|
91
|
|
55
|
|
|||
|
Retail revenue
(a)(b)
|
2,000
|
|
1,861
|
|
|||
|
Retail cost of sales
(c)
|
1,629
|
|
1,477
|
|
|||
|
Retail gross margin
|
$
|
371
|
|
$
|
384
|
|
|
|
Business Metrics
|
|
|
|||||
|
Electricity sales volume — GWh
|
|
||||||
|
Mass
|
10,902
|
|
10,443
|
|
|||
|
Commercial and Industrial
(d)
|
7,378
|
|
7,892
|
|
|||
|
Electricity sales volume — GWh
|
|||||||
|
Texas
|
15,708
|
|
16,496
|
|
|||
|
All other regions
|
2,572
|
|
1,839
|
|
|||
|
Average retail customers count (in thousands, metered locations)
|
|||||||
|
Mass
(e)
|
2,157
|
|
2,074
|
|
|||
|
Commercial and Industrial
(d)
|
101
|
|
98
|
|
|||
|
Retail customers count (in thousands, metered locations)
|
|||||||
|
Mass
(e)
|
2,153
|
|
2,091
|
|
|||
|
Commercial and Industrial
(d)
|
106
|
|
100
|
|
|||
|
(a)
|
Includes customers of the Texas General Land Office for which the Company provides services, as well as sales to utility partner and natural gas customers.
|
|
(b)
|
Includes intercompany sales of $1 million and $1 million in 2013 and 2012, respectively, representing sales from Retail to the Texas region.
|
|
(c)
|
Includes intercompany purchases of $750 million and $630 million, respectively.
|
|
(d)
|
Includes customers of the Texas General Land Office for which the Company provides services.
|
|
(e)
|
Excludes utility partner and natural gas customers.
|
|
•
|
Retail gross margin —
Retail gross margin decreased $13 million for the three months ended
September 30, 2013
, compared to the same period in
2012
, driven by:
|
|
Decrease in unit margins due to customer and regional mix and lower prices on customer acquisition and renewals consistent with competitive offers, and higher supply costs
|
$
|
(25
|
)
|
|
Increase in Mass customer count and usage offset by decreases in Texas C&I volumes
|
11
|
|
|
|
Impact from the acquisition of Energy Curtailment Specialists in August 2013
|
8
|
|
|
|
Decrease due to a greater unfavorable impact of weather in 2013 compared to 2012
|
(7
|
)
|
|
|
$
|
(13
|
)
|
|
|
•
|
Trends —
Competition and higher supply costs based on forward natural gas prices and higher heat rates could drive lower unit margins in the future.
|
66
Mark-to-market for Economic Hedging Activities
Mark-to-market for economic hedging activities includes asset-backed hedges that have not been designated as cash flow hedges and ineffectiveness on cash flow hedges. Total net mark-to-market results increased by $206 million during the three months ended
September 30, 2013
compared to the same period in
2012
.
The breakdown of gains and losses included in operating revenues and operating costs and expenses by region was as follows:
|
Three months ended September 30, 2013
|
|||||||||||||||||||||||||||||||
|
Conventional Generation
|
|||||||||||||||||||||||||||||||
|
Retail
|
Texas
|
East
|
South
Central
|
West
|
Alternative Energy
|
Elimination
(a)
|
Total
|
||||||||||||||||||||||||
|
|
(In millions)
|
||||||||||||||||||||||||||||||
|
Mark-to-market results in operating revenues
|
|
|
|
|
|
|
|
||||||||||||||||||||||||
|
Reversal of previously recognized unrealized (gains)/losses on settled positions related to economic hedges
|
$
|
(1
|
)
|
$
|
46
|
|
$
|
4
|
|
$
|
9
|
|
$
|
(1
|
)
|
$
|
—
|
|
$
|
(52
|
)
|
$
|
5
|
|
|||||||
|
Reversal of (gain)/loss positions acquired as part of the GenOn acquisition
|
—
|
|
—
|
|
(82
|
)
|
—
|
|
1
|
|
—
|
|
—
|
|
(81
|
)
|
|||||||||||||||
|
Net unrealized gains/(losses) on open positions related to economic hedges
|
3
|
|
122
|
|
34
|
|
(7
|
)
|
2
|
|
(1
|
)
|
(152
|
)
|
1
|
|
|||||||||||||||
|
Total mark-to-market gains/(losses) in operating revenues
|
$
|
2
|
|
$
|
168
|
|
$
|
(44
|
)
|
$
|
2
|
|
$
|
2
|
|
$
|
(1
|
)
|
|
$
|
(204
|
)
|
$
|
(75
|
)
|
||||||
|
Mark-to-market results in operating costs and expenses
|
|
|
|
|
|
|
|
||||||||||||||||||||||||
|
Reversal of previously recognized unrealized (gains)/losses on settled positions related to economic hedges
|
$
|
(116
|
)
|
$
|
4
|
|
$
|
2
|
|
$
|
5
|
|
$
|
—
|
|
$
|
—
|
|
$
|
52
|
|
$
|
(53
|
)
|
|||||||
|
Reversal of (gain)/loss positions acquired as part of the Reliant Energy, Green Mountain Energy and GenOn acquisitions
|
(8
|
)
|
—
|
|
7
|
|
—
|
|
—
|
|
—
|
|
—
|
|
(1
|
)
|
|||||||||||||||
|
Net unrealized (losses)/gains on open positions related to economic hedges
|
(66
|
)
|
3
|
|
(15
|
)
|
2
|
|
—
|
|
—
|
|
152
|
|
76
|
|
|||||||||||||||
|
Total mark-to-market (losses)/gains in operating costs and expenses
|
$
|
(190
|
)
|
$
|
7
|
|
$
|
(6
|
)
|
$
|
7
|
|
$
|
—
|
|
$
|
—
|
|
$
|
204
|
|
$
|
22
|
|
|||||||
|
(a)
|
Represents the elimination of the intercompany activity between the Retail Business and the Conventional Generation and Alternative Energy regions.
|
|
|
Three months ended September 30, 2012
|
||||||||||||||||||||||||||||||
|
Conventional Generation
|
|||||||||||||||||||||||||||||||
|
Retail
|
Texas
|
East
|
South
Central
|
West
|
Alternative Energy
|
Elimination
(a)
|
Total
|
||||||||||||||||||||||||
|
|
(In millions)
|
||||||||||||||||||||||||||||||
|
Mark-to-market results in operating revenues
|
|
|
|
|
|
|
|
||||||||||||||||||||||||
|
Reversal of previously recognized unrealized (gains)/losses on settled positions related to economic hedges
|
$
|
(2
|
)
|
$
|
(2
|
)
|
$
|
1
|
|
$
|
10
|
|
$
|
5
|
|
$
|
—
|
|
$
|
(19
|
)
|
$
|
(7
|
)
|
|||||||
|
Net unrealized gains/(losses) on open positions related to economic hedges
|
13
|
|
101
|
|
1
|
|
2
|
|
4
|
|
1
|
|
(492
|
)
|
(370
|
)
|
|||||||||||||||
|
Total mark-to-market gains/(losses) in operating revenues
|
$
|
11
|
|
$
|
99
|
|
$
|
2
|
|
$
|
12
|
|
$
|
9
|
|
$
|
1
|
|
$
|
(511
|
)
|
$
|
(377
|
)
|
|||||||
|
Mark-to-market results in operating costs and expenses
|
|
|
|
|
|
|
|
||||||||||||||||||||||||
|
Reversal of previously recognized unrealized (gains)/losses on settled positions related to economic hedges
|
$
|
(103
|
)
|
$
|
3
|
|
$
|
2
|
|
$
|
1
|
|
$
|
—
|
|
$
|
—
|
|
$
|
19
|
|
$
|
(78
|
)
|
|||||||
|
Reversal of loss positions acquired as part of the Reliant Energy and Green Mountain Energy acquisitions
|
(15
|
)
|
—
|
|
—
|
|
—
|
|
—
|
|
—
|
|
—
|
|
(15
|
)
|
|||||||||||||||
|
Net unrealized (losses)/gains on open positions related to economic hedges
|
(308
|
)
|
9
|
|
7
|
|
11
|
|
—
|
|
—
|
|
492
|
|
211
|
|
|||||||||||||||
|
Total mark-to-market (losses)/gains in operating costs and expenses
|
$
|
(426
|
)
|
$
|
12
|
|
$
|
9
|
|
$
|
12
|
|
$
|
—
|
|
$
|
—
|
|
$
|
511
|
|
$
|
118
|
|
|||||||
|
(a)
|
Represents the elimination of the intercompany activity between the Retail Business and the Conventional Generation and Alternative Energy regions.
|
Mark-to-market results consist of unrealized gains and losses. The settlement of these transactions is reflected in the same caption as the items being hedged.
67
The reversal of gain or loss positions on acquired companies were valued based upon the forward prices on the acquisition date.
For the three months ended
September 30, 2013
, the net gains on open positions were due to decreases in forward natural gas and power prices.
For the three months ended
September 30, 2012
, the net losses on open positions were due to increases in forward natural gas and power prices.
In accordance with ASC 815, the following table represents the results of the Company's financial and physical trading of energy commodities for the three months ended
September 30, 2013
and
2012
. The realized and unrealized financial and physical trading results are included in operating revenue. The Company's trading activities are subject to limits within the Company's Risk Management Policy.
|
|
Three months ended September 30,
|
||||||
|
(In millions)
|
2013
|
2012
|
|||||
|
Trading gains/(losses)
|
|
|
|||||
|
Realized
|
$
|
2
|
|
$
|
40
|
|
|
|
Unrealized
|
11
|
|
(18
|
)
|
|||
|
Total trading gains
|
$
|
13
|
|
$
|
22
|
|
|
Contract Amortization Revenue
Contract amortization represents the roll-off of in-market customer contracts valued under purchase accounting and the favorable change of $7 million, as compared to the prior period in
2012
, related primarily to lower contract amortization for Reliant Energy.
Other Operating Costs
|
Conventional Generation
|
|||||||||||||||||||||||||||||||||||||||
|
Retail
|
Texas
|
East
|
South
Central
|
West
|
Other
|
Alternative Energy
|
NRG Yield
|
Eliminations/Corporate
|
Total
|
||||||||||||||||||||||||||||||
|
(In millions)
|
|||||||||||||||||||||||||||||||||||||||
|
Three months ended September 30, 2013
|
$
|
71
|
|
$
|
109
|
|
$
|
224
|
|
$
|
27
|
|
$
|
37
|
|
$
|
14
|
|
$
|
10
|
|
$
|
15
|
|
$
|
(22
|
)
|
$
|
485
|
|
|||||||||
|
Three months ended September 30, 2012
|
$
|
66
|
|
|
$
|
121
|
|
$
|
60
|
|
$
|
27
|
|
$
|
12
|
|
$
|
12
|
|
$
|
5
|
|
$
|
11
|
|
$
|
(10
|
)
|
$
|
304
|
|
||||||||
Other operating costs increased by $181 million for the three months ended
September 30, 2013
, compared to the same period in
2012
, due to:
|
Increase in operations and maintenance expense for GenOn plants acquired in December 2012
|
$
|
186
|
|
|
Gain on sale of land recorded in other operating costs in 2013
|
(10
|
)
|
|
|
Increase in Alternative Energy operations and maintenance expense as phases of Agua Caliente and CVSR reached commercial operations in 2013
|
4
|
|
|
|
Increase in NRG Yield operations and maintenance expense as Marsh Landing, Avra Valley and Borrego reached commercial operations in 2013
|
3
|
|
|
|
Other
|
(2
|
)
|
|
|
$
|
181
|
|
|
Depreciation and Amortization
Depreciation and amortization increased by $79 million for the three months ended
September 30, 2013
, compared to the same period in 2012, due primarily to $60 million from the acquisition of GenOn in December 2012 and additional depreciation from solar facilities that reached commercial operations in late 2012 and early 2013.
68
Selling, General and Administrative Expenses
Selling, general and administrative expenses is comprised of the following:
|
Three months ended September 30,
|
|||||||
|
(In millions)
|
2013
|
2012
|
|||||
|
General and administrative expenses
|
$
|
158
|
|
$
|
144
|
|
|
|
Selling and marketing expenses
|
71
|
|
80
|
|
|||
|
$
|
229
|
|
$
|
224
|
|
||
General and administrative expenses increased by $14 million for the three months ended
September 30, 2013
compared to the same period in
2012
, which was due primarily to the following:
|
•
|
Increase in general and administrative costs for GenOn, which was acquired in December 2012, offset by cost savings as a result of realized synergies for the combined company; and
|
|
•
|
Impact of prior year EPA settlement regarding LaGen of $14 million.
|
Selling and marketing expense decreased due to reduced channel costs, the elimination of the Independence Energy sales channel and reduced employee costs.
Acquisition-related Transaction and Integration Costs
NRG incurred transaction and integration costs of
$26 million
in the three months ended
September 30, 2013
, primarily in connection with the acquisition of GenOn, consisting mostly of severance costs.
Equity in (Losses)/Earnings of Unconsolidated Affiliates
NRG's equity in losses of unconsolidated affiliates was
$5 million
for the three months ended
September 30, 2013
compared to equity in earnings of unconsolidated affiliates of
$4 million
for the same period in
2012
, primarily resulting from a long-term natural gas hedge entered into by Saguaro in July 2013.
Interest Expense
NRG's interest expense increased by $65 million compared to the same period in
2012
due to the following:
|
Increase/(decrease) in interest expense
|
(In millions)
|
||
|
Increase for acquisition of GenOn in December 2012
|
$
|
48
|
|
|
Increase from additional project financings, net of reduction in capitalized interest as projects were placed in service
|
24
|
|
|
|
Decrease for 2017 Senior Notes redeemed in September 2012
|
(19
|
)
|
|
|
Increase for 2023 Senior Notes issued in September 2012
|
16
|
|
|
|
Decrease for derivative interest expense primarily from losses on Alpine in the prior year compared to gains in the current year
|
(4
|
)
|
|
|
$
|
65
|
|
|
Income Tax Expense/(Benefit)
For the three months ended
September 30, 2013
, NRG recorded an income tax expense of $
163 million
on pre-tax income of $
306 million
. For the same period in
2012
, NRG recorded an income tax benefit of $
113 million
on pre-tax loss of $
105 million
. The effective tax rate was
53.3%
and
107.6%
for the three months ended
September 30, 2013
, and
2012
, respectively.
For the three months ended
September 30, 2013
, NRG's overall effective tax rate was different than the statutory rate of 35% primarily due to state and local income taxes.
For the three months ended September 30, 2012, NRG's overall effective tax rate was different than the statutory rate of 35% primarily due to the generation of ITCs from the Company's Agua Caliente solar project in Arizona and production tax credits generated from certain Texas wind facilities.
Noncontrolling Interest
For the three months ended September 30, 2013, income attributable to noncontrolling interests primarily reflects NRG Yield Inc.'s share of net income for the period after the initial public offering, as well as income attributable to the noncontrolling partner for Agua Caliente. For the three months ended September 30, 2012, income attributable to noncontrolling interests primarily reflects income attributable to the noncontrolling partner for Agua Caliente.
69
Management’s discussion of the results of operations for the
nine
months ended
September 30, 2013
and
2012
Loss before income taxes
— The pre-tax loss of
$94 million
for the
nine
months ended
September 30, 2013
, compared to a pre-tax loss of $
185 million
for the
nine
months ended
September 30, 2012
, primarily reflects:
|
•
|
in the current year, an increase in gross margin as a result of i) a
$1,021 million
increase in Conventional Generation gross margin, ii) a $92 million increase in NRG Yield gross margin and iii) an $86 million increase in Alternative Energy gross margin, offset by an $84 million decrease in Retail gross margin; and
|
|
•
|
a $66 million increase in net mark-to-market results from economic hedging activities; offset by
|
|
•
|
a $988 million increase in operating costs primarily from increased other operating costs, depreciation and amortization, selling, general and administrative expenses, acquisition-related transaction and integration costs, and development activity expenses; and
|
|
•
|
an increase of $144 million in interest expense and loss on debt extinguishment.
|
Net (loss)/income
— The decrease in net income of
$108 million
primarily reflects the drivers discussed above as well as an income tax benefit for the
nine
months ended
September 30, 2013
of
$47 million
compared to
$246 million
in the comparable period.
Conventional Generation gross margin
The following is a discussion of gross margin for NRG's Conventional Generation businesses, adjusted to eliminate intersegment activity, primarily with the Retail Business.
|
Nine months ended September 30, 2013
|
|||||||||||||||||||||||||||||||||||||||
|
Conventional Generation
|
|||||||||||||||||||||||||||||||||||||||
|
(In millions except otherwise noted)
|
Texas
|
East
|
South Central
|
West
|
Other
|
Subtotal
|
Alternative Energy
|
NRG Yield
|
Eliminations/Corporate
|
Consolidated Total
|
|||||||||||||||||||||||||||||
|
Energy revenue
|
$
|
1,672
|
|
$
|
1,831
|
|
$
|
437
|
|
$
|
116
|
|
$
|
—
|
|
$
|
4,056
|
|
$
|
164
|
|
$
|
68
|
|
$
|
(1,661
|
)
|
$
|
2,627
|
|
|||||||||
|
Capacity revenue
|
78
|
|
789
|
|
182
|
|
226
|
|
6
|
|
1,281
|
|
—
|
|
58
|
|
(44
|
)
|
1,295
|
|
|||||||||||||||||||
|
Other revenue
|
11
|
|
52
|
|
(5
|
)
|
2
|
|
104
|
|
164
|
|
13
|
|
102
|
|
(114
|
)
|
165
|
|
|||||||||||||||||||
|
Generation revenue
|
1,761
|
|
2,672
|
|
614
|
|
344
|
|
110
|
|
5,501
|
|
177
|
|
228
|
|
$
|
(1,819
|
)
|
$
|
4,087
|
|
|||||||||||||||||
|
Generation cost of sales
|
(871
|
)
|
(1,161
|
)
|
(469
|
)
|
(89
|
)
|
(41
|
)
|
(2,631
|
)
|
(1
|
)
|
(47
|
)
|
73
|
|
(2,606
|
)
|
|||||||||||||||||||
|
Generation gross margin
|
$
|
890
|
|
$
|
1,511
|
|
$
|
145
|
|
$
|
255
|
|
$
|
69
|
|
$
|
2,870
|
|
$
|
176
|
|
$
|
181
|
|
|||||||||||||||
|
Business Metrics
|
|||||||||||||||||||||||||||||||||||||||
|
MWh sold (in thousands)
(a)
|
34,756
|
|
27,386
|
|
13,390
|
|
1,246
|
|
1,571
|
|
764
|
|
|||||||||||||||||||||||||||
|
MWh generated (in thousands)
|
30,747
|
|
26,541
|
|
12,926
|
|
2,422
|
|
1,571
|
|
914
|
|
|||||||||||||||||||||||||||
|
Average on-peak market power prices ($/MWh)
(b)(c)
|
$
|
35.25
|
|
$
|
53.58
|
|
$
|
33.77
|
|
$
|
46.12
|
|
N/A
|
|
|||||||||||||||||||||||||
|
(a) MWh sold excludes generation at facilities that generate revenue under capacity agreements.
|
|||||||||||||||||||||||||||||||||||||||
|
(b) Average on-peak market power prices calculated based on average settled market prices in the following zones: for Texas region, in ERCOT - Houston and ERCOT - North; for East region, in NYISO - West, NYISO - New York City, ISO - NE - Mass Hub, PJM - West Hub and PJM - DPL; and for West region, in CAISO - NP15 and CAISO - SP15.
|
|||||||||||||||||||||||||||||||||||||||
|
(c) Average on-peak market power prices for South Central region are calculated based on average day ahead market prices for "into Entergy" as published in the Platts Megawatt Daily report.
|
|||||||||||||||||||||||||||||||||||||||
70
|
|
Nine months ended September 30, 2012
|
||||||||||||||||||||||||||||||||||||||
|
Conventional Generation
|
|||||||||||||||||||||||||||||||||||||||
|
(In millions except otherwise noted)
|
Texas
|
East
|
South Central
|
West
|
Other
|
Subtotal
|
Alternative Energy
|
NRG Yield
|
Eliminations/Corporate
|
Consolidated Total
|
|||||||||||||||||||||||||||||
|
Energy revenue
|
$
|
1,866
|
|
$
|
370
|
|
$
|
436
|
|
$
|
85
|
|
$
|
32
|
|
$
|
2,789
|
|
$
|
88
|
|
$
|
30
|
|
$
|
(1,304
|
)
|
$
|
1,603
|
|
|||||||||
|
Capacity revenue
|
64
|
|
211
|
|
181
|
|
91
|
|
35
|
|
582
|
|
—
|
|
5
|
|
(30
|
)
|
557
|
|
|||||||||||||||||||
|
Other revenue
|
4
|
|
14
|
|
(7
|
)
|
4
|
|
86
|
|
101
|
|
2
|
|
99
|
|
(52
|
)
|
150
|
|
|||||||||||||||||||
|
Generation revenue
|
1,934
|
|
595
|
|
610
|
|
180
|
|
153
|
|
3,472
|
|
90
|
|
$
|
134
|
|
$
|
(1,386
|
)
|
$
|
2,310
|
|
||||||||||||||||
|
Generation cost of sales
|
(752
|
)
|
(310
|
)
|
(424
|
)
|
(63
|
)
|
(74
|
)
|
(1,623
|
)
|
—
|
|
(45
|
)
|
13
|
|
(1,655
|
)
|
|||||||||||||||||||
|
Generation gross margin
|
$
|
1,182
|
|
$
|
285
|
|
$
|
186
|
|
$
|
117
|
|
$
|
79
|
|
$
|
1,849
|
|
$
|
90
|
|
$
|
89
|
|
|||||||||||||||
|
Business Metrics
|
|
||||||||||||||||||||||||||||||||||||||
|
MWh sold (in thousands)
|
33,935
|
|
5,494
|
|
14,699
|
|
1,618
|
|
1,091
|
|
343
|
|
|||||||||||||||||||||||||||
|
MWh generated (in thousands)
|
28,796
|
|
4,286
|
|
12,733
|
|
1,618
|
|
1,091
|
|
343
|
|
|||||||||||||||||||||||||||
|
Average on-peak market power prices ($/MWh)
(a)(b)
|
$
|
29.43
|
|
$
|
40.44
|
|
$
|
27.59
|
|
$
|
31.49
|
|
N/A
|
|
|||||||||||||||||||||||||
|
(a) Average on-peak market power prices calculated based on average settled market prices in the following zones: for Texas region, in ERCOT - Houston and ERCOT - North; for East region, in NYISO - West, NYISO - New York City, ISO - NE - Mass Hub, PJM - West Hub and PJM - DPL; and for West region, in CAISO - NP15 and CAISO - SP15.
|
|||||||||||||||||||||||||||||||||||||||
|
(b) Average on-peak market power prices for South Central region are calculated based on average day ahead market prices for "into Entergy" as published in the Platts Megawatt Daily report.
|
|||||||||||||||||||||||||||||||||||||||
|
|
Nine months ended September 30,
|
||||||||||||||||||||||||||||||||||||||
|
Weather Metrics
|
Texas
|
East
|
South Central
|
West
|
|||||||||||||||||||||||||||||||||||
|
2013
|
|
|
|
|
|||||||||||||||||||||||||||||||||||
|
CDDs
(a)
|
2,636
|
|
703
|
|
1,510
|
|
866
|
|
|||||||||||||||||||||||||||||||
|
HDDs
(a)
|
1,154
|
|
3,972
|
|
2,250
|
|
1,852
|
|
|||||||||||||||||||||||||||||||
|
2012
|
|||||||||||||||||||||||||||||||||||||||
|
CDDs
|
2,843
|
|
752
|
|
1,761
|
|
844
|
|
|||||||||||||||||||||||||||||||
|
HDDs
|
816
|
|
3,317
|
|
1,564
|
|
1,935
|
|
|||||||||||||||||||||||||||||||
|
10 year average
|
|||||||||||||||||||||||||||||||||||||||
|
CDDs
|
2,669
|
|
651
|
|
1,688
|
|
794
|
|
|||||||||||||||||||||||||||||||
|
HDDs
|
1,114
|
|
3,911
|
|
2,083
|
|
1,953
|
|
|||||||||||||||||||||||||||||||
|
(a)
|
National Oceanic and Atmospheric Administration-Climate Prediction Center - A Cooling Degree Day, or CDD, represents the number of degrees that the mean temperature for a particular day is above 65 degrees Fahrenheit in each region. A Heating Degree Day, or HDD, represents the number of degrees that the mean temperature for a particular day is below 65 degrees Fahrenheit in each region. The CDDs/HDDs for a period of time are calculated by adding the CDDs/HDDs for each day during the period.
|
71
Conventional Generation gross margin
—
increased by
$1,021 million
, including intercompany sales, during the
nine
months ended
September 30, 2013
, compared to the same period in
2012
, due to:
|
Decrease in Texas region
|
$
|
(292
|
)
|
|
Increase in East region
|
1,226
|
|
|
|
Decrease in South Central region
|
(41
|
)
|
|
|
Increase in West region
|
138
|
|
|
|
Other
(a)
|
(10
|
)
|
|
|
$
|
1,021
|
|
|
|
(a)
|
Other gross margin primarily represents revenues from the maintenance services business, which are eliminated in consolidation.
|
The decrease in gross margin in the Texas region was driven by:
|
Lower gross margin from a decrease in average realized energy prices
|
$
|
(311
|
)
|
|
Lower gross margin from a 28% decrease in gas generation due to milder weather in 2013
|
(30
|
)
|
|
|
Higher gross margin from a 14% increase in coal generation driven by 6% fewer outage hours in 2013
|
53
|
|
|
|
Other
|
(4
|
)
|
|
|
$
|
(292
|
)
|
|
The increase in gross margin in the East region was driven by:
|
Higher gross margin from the acquisition of GenOn in December 2012
|
$
|
1,158
|
|
|
Higher revenue due to a 28% increase in New York and PJM hedged capacity prices and the New York RSS contract
|
68
|
|
|
|
Higher gross margin from coal plants due to a 31% increase in generation
|
29
|
|
|
|
Lower margins realized on certain load-serving contracts due to increased pricing for power purchases
|
(27
|
)
|
|
|
Change in unrealized commercial optimization activities and other
|
(2
|
)
|
|
|
$
|
1,226
|
|
|
The decrease in gross margin in the South Central region was driven by:
|
Lower gross margin from higher gas prices
|
$
|
(64
|
)
|
|
Lower gross margin from higher coal transportation costs
|
(8
|
)
|
|
|
Higher revenue from an increase in average realized energy prices
|
34
|
|
|
|
Change in unrealized commercial optimization activities and other
|
(3
|
)
|
|
|
$
|
(41
|
)
|
|
The increase in gross margin in the West region was driven by:
|
Higher gross margin from the acquisition of GenOn in December 2012
|
$
|
150
|
|
|
Higher gross margin due to increases in average realized energy prices
|
16
|
|
|
|
Decrease due to higher emissions expense
|
(12
|
)
|
|
|
Decrease in capacity revenue due to lower pricing and outage revenue in 2012 for Long Beach, offset in part by El Segundo Energy Center reaching COD
|
(7
|
)
|
|
|
Change in unrealized commercial optimization activities and other
|
(9
|
)
|
|
|
$
|
138
|
|
|
Alternative Energy gross margin
NRG's Alternative Energy business segment, which is comprised mainly of certain solar and wind businesses that are not part of NRG Yield, had gross margin of
$176 million
for the
nine
months ended
September 30, 2013
, compared to gross margin of
$90 million
for the same period in
2012
, primarily as a result of new project phases reaching COD during the period including 132 MW for Agua Caliente and 126 MW for CVSR.
72
NRG Yield gross margin
NRG Yield had gross margin of
$181 million
for the
nine
months ended
September 30, 2013
, compared to gross margin of
$89 million
for the same period in 2012, primarily as a result of new projects reaching COD during late 2012 and 2013 including Avra Valley, Alpine, Borrego and Marsh Landing.
Retail gross margin
The following is a detailed discussion of retail gross margin for NRG's Retail Business segment.
|
Nine months ended September 30,
|
|||||||
|
(In millions except otherwise noted)
|
2013
|
2012
|
|||||
|
Mass revenues
|
$
|
3,155
|
|
$
|
3,015
|
|
|
|
Commercial and Industrial revenues
|
1,485
|
|
1,444
|
|
|||
|
Supply management and other revenues
|
168
|
|
120
|
|
|||
|
Retail revenues
(a)(b)
|
4,808
|
|
4,579
|
|
|||
|
Retail cost of sales
(c)
|
3,834
|
|
3,521
|
|
|||
|
Retail gross margin
|
$
|
974
|
|
$
|
1,058
|
|
|
|
Business Metrics
|
|
||||||
|
Electricity sales volume — GWh
|
|
||||||
|
Mass
|
25,499
|
|
24,859
|
|
|||
|
Commercial and Industrial
(d)
|
20,550
|
|
20,906
|
|
|||
|
Electricity sales volume — GWh
|
|||||||
|
Texas
|
39,335
|
|
41,705
|
|
|||
|
All other regions
|
6,715
|
|
4,060
|
|
|||
|
Average retail customers count (in thousands, metered locations)
|
|||||||
|
Mass
(e)
|
2,141
|
|
2,039
|
|
|||
|
Commercial and Industrial
(d)
|
102
|
|
87
|
|
|||
|
Retail customers count (in thousands, metered locations)
|
|||||||
|
Mass
(e)
|
2,153
|
|
2,091
|
|
|||
|
Commercial and Industrial
(d)
|
106
|
|
100
|
|
|||
|
(a)
|
Includes customers of the Texas General Land Office for which the Company provides services, as well as sales to utility partner and natural gas customers.
|
|
(b)
|
Includes intercompany sales of $3 million and $3 million in 2013 and 2012, respectively, representing sales from Retail to the Texas region.
|
|
(c)
|
Includes intercompany purchases of $1,700 million and $1,324 million, respectively.
|
|
(d)
|
Includes customers of the Texas General Land Office for which the Company provides services.
|
|
(e)
|
Excludes utility partner and natural gas customers.
|
|
•
|
Retail gross margin —
Retail gross margin decreased $84 million for the
nine
months ended
September 30, 2013
, compared to the same period in
2012
, driven by:
|
|
Decrease in unit margins due to customer and regional mix and lower prices on customer acquisition and renewals consistent with competitive offers and higher supply costs
|
$
|
(77
|
)
|
|
Unfavorable impact of weather in 2013 as compared to favorable weather in 2012
|
(54
|
)
|
|
|
Increase in customer count and usage
|
47
|
|
|
|
$
|
(84
|
)
|
|
|
•
|
Trends —
Customer counts increased by approximately 49,000 since December 31, 2012, which was primarily due to selling and marketing efforts in the Northeast and ERCOT markets. Competition and higher supply costs based on forward natural gas prices and higher heat rates could drive lower unit margins in the future.
|
73
Mark-to-market for Economic Hedging Activities
Mark-to-market for economic hedging activities includes asset-backed hedges that have not been designated as cash flow hedges and ineffectiveness on cash flow hedges. Total net mark-to-market results increased by $66 million during the
nine
months ended
September 30, 2013
compared to the same period in
2012
.
The breakdown of gains and losses included in operating revenues and operating costs and expenses by region was as follows:
|
Nine months ended September 30, 2013
|
|||||||||||||||||||||||||||||||
|
Conventional Generation
|
|||||||||||||||||||||||||||||||
|
Retail
|
Texas
|
East
|
South
Central
|
West
|
Alternative Energy
|
Elimination
(a)
|
Total
|
||||||||||||||||||||||||
|
|
(In millions)
|
||||||||||||||||||||||||||||||
|
Mark-to-market results in operating revenues
|
|
|
|
|
|
|
|
||||||||||||||||||||||||
|
Reversal of previously recognized unrealized (gains)/losses on settled positions related to economic hedges
|
$
|
(5
|
)
|
$
|
(215
|
)
|
$
|
1
|
|
$
|
27
|
|
$
|
(3
|
)
|
$
|
—
|
|
$
|
44
|
|
$
|
(151
|
)
|
|||||||
|
Reversal on gain positions acquired as part of the GenOn acquisition
|
—
|
|
—
|
|
(299
|
)
|
—
|
|
(1
|
)
|
—
|
|
—
|
|
(300
|
)
|
|||||||||||||||
|
Net unrealized gains/(losses) on open positions related to economic hedges
|
3
|
|
166
|
|
58
|
|
—
|
|
7
|
|
—
|
|
(143
|
)
|
91
|
|
|||||||||||||||
|
Total mark-to-market (losses)/gains in operating revenues
|
$
|
(2
|
)
|
$
|
(49
|
)
|
$
|
(240
|
)
|
$
|
27
|
|
$
|
3
|
|
$
|
—
|
|
$
|
(99
|
)
|
$
|
(360
|
)
|
|||||||
|
Mark-to-market results in operating costs and expenses
|
|
|
|
|
|
|
|
||||||||||||||||||||||||
|
Reversal of previously recognized unrealized losses/(gains) on settled positions related to economic hedges
|
$
|
72
|
|
$
|
16
|
|
$
|
11
|
|
$
|
16
|
|
$
|
—
|
|
$
|
—
|
|
$
|
(44
|
)
|
$
|
71
|
|
|||||||
|
Reversal of gain/(loss) positions acquired as part of the Reliant Energy, Green Mountain Energy and GenOn acquisitions
|
(1
|
)
|
—
|
|
32
|
|
—
|
|
—
|
|
—
|
|
—
|
|
31
|
|
|||||||||||||||
|
Net unrealized (losses)/gains on open positions related to economic hedges
|
(105
|
)
|
11
|
|
(12
|
)
|
3
|
|
—
|
|
—
|
|
143
|
|
40
|
|
|||||||||||||||
|
Total mark-to-market (losses)/gains in operating costs and expenses
|
$
|
(34
|
)
|
$
|
27
|
|
$
|
31
|
|
$
|
19
|
|
$
|
—
|
|
$
|
—
|
|
$
|
99
|
|
$
|
142
|
|
|||||||
|
(a)
|
Represents the elimination of the intercompany activity between the Retail Business and the Conventional Generation and Alternative Energy regions.
|
|
|
Nine months ended September 30, 2012
|
||||||||||||||||||||||||||||||
|
Conventional Generation
|
|||||||||||||||||||||||||||||||
|
Retail
|
Texas
|
East
|
South
Central
|
West
|
Alternative Energy
|
Elimination
(a)
|
Total
|
||||||||||||||||||||||||
|
|
(In millions)
|
||||||||||||||||||||||||||||||
|
Mark-to-market results in operating revenues
|
|
|
|
|
|
|
|
||||||||||||||||||||||||
|
Reversal of previously recognized unrealized (gains)/losses on settled positions related to economic hedges
|
$
|
(5
|
)
|
$
|
(330
|
)
|
$
|
2
|
|
$
|
31
|
|
$
|
7
|
|
$
|
—
|
|
$
|
65
|
|
$
|
(230
|
)
|
|||||||
|
Net unrealized gains/(losses) on open positions related to economic hedges
|
1
|
|
(142
|
)
|
1
|
|
(3
|
)
|
(2
|
)
|
—
|
|
(83
|
)
|
(228
|
)
|
|||||||||||||||
|
Total mark-to-market (losses)/gains in operating revenues
|
$
|
(4
|
)
|
$
|
(472
|
)
|
$
|
3
|
|
$
|
28
|
|
$
|
5
|
|
$
|
—
|
|
$
|
(18
|
)
|
$
|
(458
|
)
|
|||||||
|
Mark-to-market results in operating costs and expenses
|
|
|
|
|
|
|
|
||||||||||||||||||||||||
|
Reversal of previously recognized unrealized losses/(gains) on settled positions related to economic hedges
|
$
|
112
|
|
$
|
12
|
|
$
|
8
|
|
$
|
3
|
|
$
|
—
|
|
$
|
—
|
|
$
|
(65
|
)
|
$
|
70
|
|
|||||||
|
Reversal of loss positions acquired as part of the Reliant Energy and Green Mountain Energy acquisitions
|
5
|
|
—
|
|
—
|
|
—
|
|
—
|
|
—
|
|
—
|
|
5
|
|
|||||||||||||||
|
Net unrealized gains/(losses) on open positions related to economic hedges
|
99
|
|
(47
|
)
|
(4
|
)
|
(32
|
)
|
—
|
|
—
|
|
83
|
|
99
|
|
|||||||||||||||
|
Total mark-to-market gains/(losses) in operating costs and expenses
|
$
|
216
|
|
$
|
(35
|
)
|
$
|
4
|
|
$
|
(29
|
)
|
$
|
—
|
|
$
|
—
|
|
$
|
18
|
|
$
|
174
|
|
|||||||
|
(a)
|
Represents the elimination of the intercompany activity between the Retail Business and the Conventional Generation and Alternative Energy regions.
|
Mark-to-market results consist of unrealized gains and losses. The settlement of these transactions is reflected in the same caption as the items being hedged.
The reversal of gain or loss positions on acquired companies were valued based upon the forward prices on the acquisition date.
74
For the
nine
months ended
September 30, 2013
, the net gains on open positions were due to decreases in forward natural gas and power prices.
For the
nine
months ended
September 30, 2012
, the net losses on open positions were primarily due to decreases in coal prices.
In accordance with ASC 815, the following table represents the results of the Company's financial and physical trading of energy commodities for the
nine
months ended
September 30, 2013
and
2012
. The realized and unrealized financial and physical trading results are included in operating revenue. The Company's trading activities are subject to limits within the Company's Risk Management Policy.
|
|
Nine months ended September 30,
|
||||||
|
(In millions)
|
2013
|
2012
|
|||||
|
Trading gains/(losses)
|
|
||||||
|
Realized
|
$
|
60
|
|
$
|
71
|
|
|
|
Unrealized
|
(44
|
)
|
(12
|
)
|
|||
|
Total trading gains
|
$
|
16
|
|
$
|
59
|
|
|
Contract Amortization Revenue
Contract amortization represents the roll-off of in-market customer contracts valued under purchase accounting and the favorable change of $37 million, as compared to the prior period in
2012
, related primarily to lower contract amortization for Reliant Energy and Green Mountain Energy of $30 million and $7 million, respectively.
Other Operating Costs
|
Conventional Generation
|
|||||||||||||||||||||||||||||||||||||||
|
Retail
|
Texas
|
East
|
South
Central
|
West
|
Other
|
Alternative Energy
|
NRG Yield
|
Eliminations/Corporate
|
Total
|
||||||||||||||||||||||||||||||
|
(In millions)
|
|||||||||||||||||||||||||||||||||||||||
|
Nine months ended September 30, 2013
|
$
|
198
|
|
$
|
384
|
|
$
|
702
|
|
$
|
89
|
|
$
|
135
|
|
$
|
43
|
|
$
|
28
|
|
$
|
45
|
|
$
|
(50
|
)
|
$
|
1,574
|
|
|||||||||
|
Nine months ended September 30, 2012
|
$
|
183
|
|
$
|
404
|
|
$
|
177
|
|
$
|
81
|
|
$
|
45
|
|
$
|
52
|
|
$
|
19
|
|
$
|
36
|
|
$
|
(47
|
)
|
$
|
950
|
|
|||||||||
Other operating costs increased by $624 million for the
nine
months ended
September 30, 2013
compared to the same period in
2012
, due to:
|
Increase in operations and maintenance expense for GenOn plants acquired in December 2012
|
$
|
628
|
|
|
Decrease as prior year reflected return to service costs for S.R. Bertron
|
(14
|
)
|
|
|
Gain on sale of land recorded in other operating costs in 2013
|
(10
|
)
|
|
|
Increase in property tax expense, primarily due to the annual reduction of credits for the New York Empire Zone program
|
9
|
|
|
|
Increase in Alternative Energy operations and maintenance expense as phases of Agua Caliente and CVSR reached commercial operations in 2013.
|
7
|
|
|
|
Increase in NRG Yield operations and maintenance expense as Marsh Landing, Avra Valley and Borrego reached commercial operations in 2013
|
8
|
|
|
|
Other
|
(4
|
)
|
|
|
$
|
624
|
|
|
75
Depreciation and Amortization
Depreciation and amortization increased by $218 million for the nine months ended
September 30, 2013
, compared to the same period in 2012, due primarily to $181 million from the acquisition of GenOn in December 2012 and additional depreciation from solar facilities that reached commercial operations in late 2012 and early 2013.
Selling, General and Administrative Expenses
Selling, general and administrative expenses is comprised of the following:
|
Nine months ended September 30,
|
|||||||
|
(In millions)
|
2013
|
2012
|
|||||
|
General and administrative expenses
|
$
|
444
|
|
$
|
391
|
|
|
|
Selling and marketing expenses
|
227
|
|
222
|
|
|||
|
$
|
671
|
|
$
|
613
|
|
||
General and administrative expenses increased by $53 million for the
nine
months ended
September 30, 2013
, compared to the same period in
2012
, which was due primarily to the following:
|
•
|
Increase in general and administrative costs for GenOn, which was acquired in December 2012, offset by cost savings as a result of realized synergies for the combined company, offset by;
|
|
•
|
Impact of prior year EPA settlement regarding LaGen of $14 million and CDWR settlement of $20 million; and
|
|
•
|
Impact in prior year of $9 million of transaction costs associated with the sale of 49% of Agua Caliente.
|
Selling and marketing expenses increased due to customer growth efforts and new market expansion, offset in part by the elimination of the Independence Energy sales channel and lower employee costs.
Acquisition-related Transaction and Integration Costs
NRG incurred transaction and integration costs of
$95 million
in the
nine
months ended
September 30, 2013
, primarily in connection with the Merger, consisting mostly of severance costs.
Equity in Earnings of Unconsolidated Affiliates
NRG's equity in earnings of unconsolidated affiliates was
$6 million
for the
nine
months ended
September 30, 2013
, compared to
$26 million
for the same period in
2012
, primarily resulting from a long-term natural gas hedge entered into by Saguaro in July 2013.
Loss on Debt Extinguishment
A loss on debt extinguishment of
$50 million
was recorded in the
nine
months ended
September 30, 2013
, including $28 million related to open market repurchases of the 2018 Senior Notes, 2019 Senior Notes and 2020 Senior Notes in the first quarter of 2013. These losses primarily consisted of the premiums paid on redemption and the write-off of previously deferred financing costs. In the second quarter of 2013, a $21 million loss on debt extinguishment was recorded and included $11 million related to the redemption of the 2014 GenOn Senior Notes, which consisted of redemption premiums offset by the write-off of the remaining unamortized premium, and $10 million related to the amendments to the Senior Credit Facility, which consisted primarily of the write-off of previously deferred financing costs.
76
Interest Expense
NRG's interest expense increased by $135 million compared to the same period in
2012
due to the following:
|
Increase/(decrease) in interest expense
|
(In millions)
|
||
|
Increase for acquisition of GenOn in December 2012
|
$
|
145
|
|
|
Decrease for 2017 Senior Notes redeemed in September 2012
|
(59
|
)
|
|
|
Increase from additional project financings, net of reduction in capitalized interest as projects were placed in service
|
58
|
|
|
|
Increase for 2023 Senior Notes issued in September 2012
|
49
|
|
|
|
Decrease for the repricing of the term loan in 2013
|
(25
|
)
|
|
|
Decrease for derivative interest expense primarily from losses on Alpine in the prior year compared to gains in the current year
|
(23
|
)
|
|
|
Decrease in other interest expense
|
(10
|
)
|
|
|
$
|
135
|
|
|
Income Tax Benefit
For the
nine
months ended
September 30, 2013
, NRG recorded an income tax benefit of
$47 million
on a pre-tax loss of
$94 million
. For the same period in
2012
, NRG recorded an income tax benefit of
$246 million
on a pre-tax loss of
$185 million
. The effective tax rate was
50.0%
and
133.0%
for the
nine
months ended
September 30, 2013
, and
2012
, respectively.
For the
nine
months ended September 30, 2012, NRG's overall effective tax rate was different than the statutory rate of 35% primarily due to the recognition of ITCs from the Company's Agua Caliente solar project in Arizona and production tax credits generated from certain Texas wind facilities.
Noncontrolling Interest
For the nine months ended September 30, 2013, income attributable to noncontrolling interests primarily reflects NRG Yield Inc.'s share of net income for the period after the initial public offering, as well as income attributable to the noncontrolling partner for Agua Caliente. For the nine months ended September 30, 2012, income attributable to noncontrolling interests primarily reflects income attributable to the noncontrolling partner for Agua Caliente.
Liquidity and Capital Resources
LIQUIDITY POSITION
As of
September 30, 2013
, and
December 31, 2012
, NRG's liquidity, excluding collateral received, was approximately
$3.7 billion
and
$3.4 billion
, respectively, comprised of the following:
|
(In millions)
|
September 30, 2013
|
December 31, 2012
|
|||||
|
Cash and cash equivalents
|
$
|
2,129
|
|
$
|
2,087
|
|
|
|
Restricted cash
|
307
|
|
217
|
|
|||
|
Total
|
2,436
|
|
2,304
|
|
|||
|
Total credit facility availability
|
1,235
|
|
1,058
|
|
|||
|
Total liquidity, excluding collateral received
|
$
|
3,671
|
|
$
|
3,362
|
|
|
For the
nine
months ended
September 30, 2013
, total liquidity, excluding collateral received, increased by
$309 million
. Changes in cash and cash equivalent balances are further discussed hereinafter under the heading
Cash
Flow Discussion
. Cash and cash equivalents at
September 30, 2013
were predominantly held in money market mutual funds and bank deposits.
Management believes that the Company's liquidity position and cash flows from operations will be adequate to finance operating and maintenance capital expenditures, to fund dividends to NRG's common and preferred stockholders, and other liquidity commitments. Management continues to regularly monitor the Company's ability to finance the needs of its operating, financing and investing activity within the dictates of prudent balance sheet management.
77
SOURCES OF LIQUIDITY
The principal sources of liquidity for NRG's future operating and capital expenditures are expected to be derived from new and existing financing arrangements, the initial public offering of NRG Yield, Inc. as discussed in Note 1,
Basis of Presentation
, to this Form 10-Q, existing cash on hand and cash flows from operations. As described in
Note 7
,
Debt and Capital Leases
, to this Form 10-Q and
Note 11
,
Debt and Capital Leases
, to the Company's
2012
Form 10-K, the Company's financing arrangements consist mainly of the Senior Credit Facility, the Senior Notes, the GenOn Senior Notes, the GenOn Americas Generation Senior Notes, and project-related financings.
In June 2013, the Company amended the Revolving Credit Facility to (i) increase the capacity by $211 million to a total of $2.5 billion; (ii) adjust the interest rate to LIBOR plus 2.25%; and (iii) extend the maturity date to July 1, 2018 to coincide with the maturity date of the Term Loan Facility. In July 2013, the NRG Repowering Holding LLC Facility was terminated and the Company issued replacement letters of credit under its Revolving Credit Facility in the amount of $82 million.
In addition, in June 2013, the Company amended its Term Loan Facility to obtain additional financing of
$450 million
and to adjust the interest rate to
LIBOR
plus
2.00%
. The proceeds from the additional
$450 million
borrowed were used for general corporate purposes, including the redemption of the 2014 GenOn Senior Notes. The Company redeemed the
$575 million
of 2014 GenOn Senior Notes at a redemption price of
106.778%
as well as any accrued and unpaid interest as of the redemption date.
On July 22, 2013, NRG Yield, Inc. closed its initial public offering of 22,511,250 shares of Class A common stock at a price of $22 per share. Net proceeds to NRG Yield, Inc. were approximately $468 million, net of underwriting discounts. The Company retained 42,738,250 shares of Class B common stock of NRG Yield, Inc.
As a result, the Company owns a controlling interest in NRG Yield, Inc. and will consolidate this entity for financial reporting purposes.
In connection with the initial public offering of Class A common stock of NRG Yield, Inc., NRG Yield LLC and its direct wholly-owned subsidiary, NRG Yield Operating LLC, entered into a senior secured revolving credit facility, which provides a revolving line of credit of $60 million. The NRG Yield LLC revolving credit facility can be used for cash or for the issuance of letters of credit.
In addition, NRG has granted first liens to certain counterparties on a substantial portion of the Company's assets, excluding assets acquired in the GenOn acquisition and the assets held by NRG Yield, Inc. NRG uses the first lien structure to reduce the amount of cash collateral and letters of credit that it would otherwise be required to post from time to time to support its obligations under out-of-the-money hedge agreements for forward sales of power or gas used as a proxy for power. To the extent that the underlying hedge positions for a counterparty are in-the-money to NRG, the counterparty would have no claim under the lien program. The lien program limits the volume that can be hedged, not the value of underlying out-of-the-money positions. The first lien program does not require NRG to post collateral above any threshold amount of exposure. Within the first lien structure, the Company can hedge up to 80% of its coal and nuclear capacity, excluding GenOn coal capacity, and 10% of its other assets, excluding GenOn's other assets, with these counterparties for the first 60 months and then declining thereafter. Net exposure to a counterparty on all trades must be positively correlated to the price of the relevant commodity for the first lien to be available to that counterparty. The first lien structure is not subject to unwind or termination upon a ratings downgrade of a counterparty and has no stated maturity date.
The Company's lien counterparties may have a claim on its assets to the extent market prices exceed the hedged prices. As of
September 30, 2013
, in aggregate, the hedge portfolio under the lien was in-the-money.
The following table summarizes the amount of MWs hedged against the Company's coal and nuclear assets and as a percentage relative to the Company's coal and nuclear capacity under the first lien structure as of
September 30, 2013
:
|
Equivalent Net Sales Secured by First Lien Structure
(a)
|
2014
|
2015
|
2016
|
2017
|
|||||||
|
In MW
|
1,674
|
|
351
|
|
432
|
|
137
|
|
|||
|
As a percentage of total net coal and nuclear capacity
(b)
|
26
|
%
|
6
|
%
|
7
|
%
|
2
|
%
|
|||
|
(a)
|
Equivalent net sales include natural gas swaps converted using a weighted average heat rate by region.
|
|
(b)
|
Net coal and nuclear capacity represents 80% of the Company’s total coal and nuclear assets eligible under the first lien which excludes coal assets acquired in the GenOn acquisition as well as assets in NRG Yield.
|
78
USES OF LIQUIDITY
The Company's requirements for liquidity and capital resources, other than for operating its facilities, can generally be categorized by the following: (i) commercial operations activities; (ii) debt service obligations; (iii) capital expenditures, including repowering and renewable development, and environmental; and (iv) corporate transactions including return of capital and dividend payments to stockholders.
Commercial Operations
NRG's commercial operations activities require a significant amount of liquidity and capital resources. These liquidity requirements are primarily driven by: (i) margin and collateral posted with counterparties; (ii) margin and collateral required to participate in physical markets and commodity exchanges; (iii) timing of disbursements and receipts (i.e. buying fuel before receiving energy revenues); (iv) initial collateral for large structured transactions; and (v) collateral for project development. As of
September 30, 2013
, commercial operations had total cash collateral outstanding of
$288 million
, and
$943 million
outstanding in letters of credit to third parties primarily to support its commercial activities for both wholesale and retail transactions. As of
September 30, 2013
, total collateral held from counterparties was
$122 million
in cash and
$20 million
of letters of credit.
Future liquidity requirements may change based on the Company's hedging activities and structures, fuel purchases, and future market conditions, including forward prices for energy and fuel and market volatility. In addition, liquidity requirements are dependent on NRG's credit ratings and general perception of its creditworthiness.
Debt Service Obligations
As of September 30, 2013, the Company has submitted applications for reimbursement of approximately $345 million, in the aggregate, net of sequestration adjustment, with the U.S. Treasury under the 1603 Cash Grant Program in connection with the following projects: CVSR, Alpine, Borrego, High Desert, Kansas South, and Lincoln Financial Field. The Company expects to submit applications for reimbursement of approximately $755 million, in the aggregate, net of sequestration adjustment, with the U.S. Treasury under the 1603 Cash Grant Program upon completion of CVSR, Ivanpah and Community Solar.
With respect to certain projects, the Company obtained cash grant bridge loans to fund the construction costs of such projects, which were to be repaid upon receipt of the related cash grant proceeds. As of September 30, 2013, there are approximately $860 million outstanding under the cash grant bridge loans, of which $405 million will become due and payable during the first quarter of 2014. The Company has complied with all obligations under the 1603 Cash Grant Program and is working with the U.S. Treasury to obtain final payment of the related cash grant proceeds.
79
Capital Expenditures
The following tables and descriptions summarize the Company's capital expenditures for maintenance, environmental, and growth investments for the
nine
months ended
September 30, 2013
, and the estimated capital expenditure and growth investments forecast for the remainder of
2013
.
|
Maintenance
|
Environmental
|
Growth Investments
|
Total
|
||||||||||||
|
|
(In millions)
|
||||||||||||||
|
East
|
$
|
120
|
|
$
|
40
|
|
$
|
160
|
|
||||||
|
Texas
|
71
|
|
3
|
|
74
|
|
|||||||||
|
South Central
|
19
|
|
8
|
|
27
|
|
|||||||||
|
West
|
6
|
|
—
|
|
98
|
|
104
|
|
|||||||
|
Other Conventional
|
4
|
|
—
|
|
2
|
|
6
|
|
|||||||
|
Retail
|
20
|
|
—
|
|
—
|
|
20
|
|
|||||||
|
Alternative Energy
|
—
|
|
—
|
|
740
|
|
740
|
|
|||||||
|
NRG Yield
|
5
|
|
—
|
|
440
|
|
445
|
|
|||||||
|
Corporate
|
5
|
|
—
|
|
—
|
|
5
|
|
|||||||
|
Total cash capital expenditures for the nine months ended
September 30, 2013 |
250
|
|
51
|
|
1,280
|
|
1,581
|
|
|||||||
|
Other investments
(a)
|
150
|
|
150
|
|
|||||||||||
|
Funding from debt financing, net of fees
|
(7
|
)
|
(1
|
)
|
(1,130
|
)
|
(1,138
|
)
|
|||||||
|
Funding from third party equity partners
|
(56
|
)
|
(56
|
)
|
|||||||||||
|
Total capital expenditures and investments, net of financings
|
$
|
243
|
|
$
|
50
|
|
$
|
244
|
|
$
|
537
|
|
|||
|
Estimated capital expenditures for the remainder of 2013
|
$
|
119
|
|
$
|
79
|
|
$
|
870
|
|
$
|
1,068
|
|
|||
|
Other investments
(a)
|
(151
|
)
|
(151
|
)
|
|||||||||||
|
Funding from debt financing, net of fees
|
(14
|
)
|
1
|
|
(450
|
)
|
(463
|
)
|
|||||||
|
Funding from third party equity partners and cash grants
|
(108
|
)
|
(108
|
)
|
|||||||||||
|
NRG estimated capital expenditures for the remainder of 2013, net of financings
|
$
|
105
|
|
$
|
80
|
|
$
|
161
|
|
$
|
346
|
|
|||
|
(a)
|
Other investments includes restricted cash activity.
|
|
•
|
Environmental capital expenditures
— For the
nine
months ended
September 30, 2013
, the Company's environmental capital expenditures included $26 million related to the upgrades at Conemaugh including the installation of selective catalytic reduction technology on both units for enhanced mercury oxidation and removal as well as reduction in NO
x
emissions and the completion of upgrades to the existing flue-gas desulfurization systems for enhanced performance.
|
|
•
|
Growth Investments capital expenditures
— For the
nine
months ended
September 30, 2013
, the Company's growth investment expenditures included $806 million for solar projects and $203 million for the Company's repowering projects.
|
Environmental Capital Expenditures
Based on current rules, technology and preliminary plans based on some proposed rules, NRG estimates that environmental capital expenditures from 2013 through 2017 required to comply with environmental laws will be approximately
$530 million
which includes
$223 million
for GenOn. These costs are primarily associated with (i) controls to satisfy MATS and recent NSR settlement at Big Cajun II; (ii) controls to satisfy MATS at W.A. Parish, Limestone and Conemaugh; and (iii) NO
x
controls for Sayreville and Gilbert. The decrease from NRG's previous estimate, as disclosed in the Company's 2012 Form 10-K, is related to changes in technology related to complying with MATS and the NSR settlement at Big Cajun II, and the selection of more cost-effective environmental solutions at Cheswick. In addition, in connection with the proposed acquisition of EME, the Company expects to incur additional environmental capital expenditures. NRG continues to explore cost-effective compliance alternatives to further reduce costs.
NRG's current contracts with the Company's rural electrical customers in the South Central region allow for recovery of a portion of the region's capital costs once in operation, along with a capital return incurred by complying with any change in law, including interest over the asset life of the required expenditures. The actual recoveries will depend, among other things, on the timing of the completion of the capital projects and the remaining duration of the contracts.
80
Corporate Transactions
With respect to the proposed acquisition of EME, the Company will pay an aggregate purchase price of $2.6 billion (subject to adjustment), which will be partially financed by the issuance of an additional $700 million of senior notes and the issuance of 12,671,977 shares of NRG common stock. The remaining purchase price will be funded by cash on hand, including acquired cash on hand of $1.1 billion. In connection with the acquisition, the Company also expects to assume non-recourse debt of approximately $1.5 billion. The proposed acquisition of EME is further described in Note 3,
Business Acquisitions and Dispositions
.
2013 Capital Allocation Program
During the first quarter of 2013, the Company paid $80 million, $104 million, and $42 million at an average price of 114.179%, 111.700%, and 113.082% of face value, for open market repurchases of the Company's 2018 Senior Notes, 2019 Senior Notes, and 2020 Senior Notes, respectively.
In June 2013, the Company redeemed all of its 2014 GenOn Senior Notes, which had an aggregate outstanding principal amount of
$575 million
, at a redemption price of
106.778%
as well as any accrued and unpaid interest as of the redemption date, with the proceeds of the additional Term Loan Facility borrowings and cash on hand.
In August 2013, the Company increased the annual common stock dividend by
33%
, to $
0.48
per share. The following table lists the dividends paid during 2013:
|
First Quarter 2013
|
Second Quarter 2013
|
Third Quarter 2013
|
|||||||||
|
Dividends per Common Share
|
$
|
0.09
|
|
$
|
0.12
|
|
$
|
0.12
|
|
||
On October 16, 2013, NRG declared a quarterly dividend on the Company's common stock of
$0.12
per share, payable on November 15, 2013, to shareholders of record as of November 1, 2013.
The Company is authorized to repurchase
$200 million
of its common stock in 2013 under the 2013 Capital Allocation Program. During the first quarter, the Company purchased
972,292
shares of NRG common stock for approximately
$25 million
at an average cost of
$25.88
per share. As a result of the proposed acquisition of EME, the Company has not completed the remaining
$175 million
of share repurchases under the 2013 Capital Allocation Program and does not expect to do so through the remainder of the 2013 fiscal year.
The Company's common stock dividend and share repurchases are subject to available capital, market conditions, and compliance with associated laws and regulations.
81
Cash Flow Discussion
The following table reflects the changes in cash flows for the comparative
nine
month periods:
|
Nine months ended September 30,
|
|||||||||||
|
2013
|
2012
|
Change
|
|||||||||
|
(In millions)
|
|||||||||||
|
Net cash provided by operating activities
|
$
|
823
|
|
$
|
1,058
|
|
$
|
(235
|
)
|
||
|
Net cash used by investing activities
|
(2,031
|
)
|
(2,329
|
)
|
298
|
|
|||||
|
Net cash provided by financing activities
|
1,251
|
|
1,779
|
|
(528
|
)
|
|||||
Net Cash Provided/(Used) By Operating Activities
Changes to net cash used by operating activities were driven by:
|
(In millions)
|
|||
|
Increase in operating income adjusted for non-cash items
|
$
|
151
|
|
|
Change in cash paid in support of risk management activities
|
(270
|
)
|
|
|
Other changes in working capital
|
(116
|
)
|
|
|
$
|
(235
|
)
|
|
Net Cash Provided/(Used) By Investing Activities
Changes to net cash provided by investing activities were driven by:
|
(In millions)
|
|||
|
Decrease in capital expenditures due to reduced spending on growth projects
|
$
|
893
|
|
|
Increase in restricted cash, which mainly supports equity requirements for U.S. DOE funded projects
|
(142
|
)
|
|
|
Increase in cash paid for acquisitions, which primarily reflects the acquisitions of High Desert, Kansas South, and Gregory in 2013
|
(334
|
)
|
|
|
Decrease in proceeds from sale of assets, primarily related to the sale of Schkopau in 2012
|
(124
|
)
|
|
|
Other
|
5
|
|
|
|
$
|
298
|
|
|
Net Cash (Used)/Provided By Financing Activities
Changes in net cash used by financing activities were driven by:
|
(In millions)
|
|||
|
Net increase in debt payments primarily related to open market repurchases of Senior Notes and redemption of GenOn Senior Notes
|
$
|
(849
|
)
|
|
Increase in financing element of acquired derivatives due to acquisition of GenOn
|
242
|
|
|
|
Increase in proceeds of noncontrolling interest related primarily to Yield IPO
|
188
|
|
|
|
Payment of dividends to common stockholders in 2013
|
(85
|
)
|
|
|
Cash paid for repurchase of treasury stock in 2013
|
(25
|
)
|
|
|
Increase in cash paid for debt issuance costs
|
(13
|
)
|
|
|
Other
|
14
|
|
|
|
$
|
(528
|
)
|
|
82
NOLs, Deferred Tax Assets and Uncertain Tax Position Implications, under ASC 740
For the
nine
months ended
September 30, 2013
, the Company had a total domestic pre-tax book loss of $98 million and foreign pre-tax book income of $4 million. For the
nine
months ended
September 30, 2013
, the Company generated domestic NOLs of $751 million. As of
September 30, 2013
, the Company has cumulative domestic NOL carryforwards of $2.1 billion for financial statement purposes. In addition, NRG has cumulative foreign NOL carryforwards of $313 million, of which $58 million will expire starting 2013 through 2018 and of which $255 million do not have an expiration date.
In addition to these amounts, the Company has $131 million of tax effected uncertain tax benefits. As a result of the Company's tax position, and based on current forecasts, NRG anticipates income tax payments, primarily to state and local jurisdictions, of up to $30 million in 2013.
However, as the position remains uncertain for the $131 million of tax effected uncertain tax benefits, the Company has recorded a non-current tax liability of
$74 million
and may accrue the remaining balance as an increase to non-current liabilities until final resolution with the related taxing authority. The $74 million non-current tax liability for uncertain tax benefits is from positions taken on various state income tax returns, including accrued interest.
NRG is subject to examination by taxing authorities for income tax returns filed in the U.S. federal jurisdiction and various state and foreign jurisdictions including operations located in Australia. The Company is not subject to U.S. federal income tax examinations for years prior to 2007. With few exceptions, state and local income tax examinations are no longer open for years before 2004. The Company's primary foreign operations are also no longer subject to examination by local jurisdictions for years prior to 2010.
New and On-going Company Initiatives and Development Projects
Proposed EME Acquisition
On October 18, 2013, the Company entered into an agreement to acquire substantially all of the assets of Edison Mission Energy, or EME. EME, through its subsidiaries and affiliates, owns, operates, and leases a portfolio of
8,000
MW consisting of wind energy facilities and coal- and gas-fired generating facilities. On December 17, 2012, EME and certain of its direct and indirect subsidiaries filed voluntary petitions for relief under chapter 11 of title 11 of the United States Code, or the Bankruptcy Code. EME was deconsolidated from its parent company, Edison International, for financial statement purposes but not for tax purposes on December 17, 2012. On May 2, 2013, certain other subsidiaries of EME filed voluntary petitions for relief under the Bankruptcy Code.
The Company will pay an aggregate purchase price of
$2.6 billion
(subject to adjustment), which will consist of
12,671,977
shares of NRG common stock (valued at
$350 million
based upon the volume-weighted average trading price over the 20 trading days prior to October 18, 2013) with the balance to be paid in cash. The Company expects to fund the cash portion of the purchase price using a combination of cash on hand, including acquired cash on hand of $1.1 billion, and approximately
$700 million
in newly-issued corporate debt. The Company also expects to assume non-recourse debt of approximately
$1.5 billion
.
In connection with the transaction, NRG has agreed to certain conditions with the parties to the Powerton and Joliet, or POJO, sale-leaseback transaction subject to which an NRG subsidiary will assume the POJO leveraged leases and NRG will guarantee the remaining payments under each lease. In connection with this agreement, NRG has committed to fund up to $350 million in capital expenditures for plant modifications at Powerton and Joliet to install controls to comply with MATS.
The acquisition is subject to customary conditions, including approval of the U.S. Bankruptcy Court for the Northern District of Illinois and required regulatory approvals, and is expected to close by the first quarter of 2014. However, EME may continue to solicit alternative transaction proposals from third parties through December 6, 2013. Under certain circumstances, including if EME enters into or seeks approval of an alternative transaction, NRG will receive a cash fee of
$65 million
plus expense reimbursement. There are no assurances that the conditions to the acquisition of EME will be satisfied, that EME will not seek or enter into an alternative transaction, or that the acquisition of EME will be consummated on the terms agreed to, if at all.
83
Public Offering of NRG Yield, Inc.
The Company created NRG Yield, Inc. to enhance value for its stockholders by seeking to gain access to an alternative investor base with a more competitive source of equity capital that would accelerate NRG Yield, Inc.'s long-term growth and acquisition strategy and optimize the NRG Yield, Inc. capital structure. In addition, the creation of NRG Yield, Inc. highlights the value inherent in NRG's contracted conventional and renewable generation and thermal infrastructure assets by separating them from other NRG non-contracted assets and creates a pure-play public issue with operating, financial and tax characteristics that the Company believes will appeal to dividend growth-oriented investors seeking exposure to the contracted power sector. NRG Yield, Inc. completed its initial public offering in July 2013, as described in Note 1,
Basis of Presentation
, and received net proceeds after underwriting discounts of $468 million, of which $395 million was utilized to acquire the contracted assets from NRG and $73 million will be utilized for NRG Yield, Inc.'s general corporate purposes.
NRG has given NRG Yield, Inc. the right of first offer for certain of its assets if it should seek to sell the assets. These assets include the following: El Segundo Energy Center, High Desert, Kansas South, NRG's interest in Agua Caliente (51%), a portion of NRG's interest in Ivanpah (49.9%) and NRG's remaining interest in CVSR.
Certain of the contracted assets acquired by NRG Yield, Inc. in July 2013 were in development in 2013 and are further described below, including Alpine, Borrego and CVSR.
Renewable Development and Acquisitions
As part of its core strategy, NRG intends to continue to own, operate and invest in the development and acquisition of renewable energy projects, primarily solar. NRG's renewable strategy is intended to capitalize on scale and first mover advantage in a high growth segment of the energy sector and the Company's existing wholesale and retail businesses in states with policies and market opportunities conducive to the development of a growing utility scale and distributed solar business. In particular, as the installed cost of new renewable resources continues to decline, especially solar, the Company intends to target opportunities in markets where alternative energy solutions have, or are becoming, increasingly price competitive to system power and the electricity distribution systems have become increasingly susceptible to service disruption as a result of, among other factors, extreme weather. This section briefly describes the Company's most notable current activities in renewable development.
Solar
NRG has acquired and is developing a number of solar projects utilizing photovoltaic, or PV, as well as solar thermal technologies. As of
September 30, 2013
, NRG had 706 MW of capacity at its commercially operating solar facilities, which includes the assets in service at Agua Caliente, CVSR, Alpine, Borrego, High Desert, Kansas South, Distributed Solar, among others. The following table is a brief summary of the Company's major Utility Scale Solar projects as of September 30, 2013, that are or were under construction during the nine months ended September 30, 2013.
|
NRG Owned Projects
|
Location
|
PPA
|
MW
(a)
|
Expected COD
|
Status
|
|
|
Ivanpah
(b)
|
Ivanpah, CA
|
20 - 25 year
|
392
|
|
2013
|
Under Construction
|
|
Agua Caliente
(c)
|
Yuma County, AZ
|
25 year
|
290
|
|
2012 - 2014
|
In-Service
|
|
CVSR
(d)
|
San Luis Obispo, CA
|
25 year
|
250
|
|
2012 - 2013
|
Partially In-Service
|
|
Alpine
|
Lancaster, CA
|
20 year
|
66
|
|
2013
|
In-Service
|
|
Borrego
|
Borrego Springs, CA
|
25 year
|
26
|
|
2013
|
In-Service
|
|
High Desert
|
Lancaster, CA
|
20 year
|
20
|
|
2013
|
In-Service
|
|
Kansas South
|
Kings County, CA
|
20 year
|
20
|
|
2013
|
In-Service
|
|
(a)
|
Represents total project size.
|
|
(b)
|
NRG owns a 50.1% stake in the Ivanpah solar project.
|
|
(c)
|
NRG owns a 51% stake in the 290 MW Agua Caliente project which reached commercial operations as of
September 30, 2013
.
|
|
(d)
|
NRG owns an 83% stake in the 250 MW CVSR project which had 148 MW in operation as of
September 30, 2013
and 250 MW in operation as of October 16, 2013.
|
Below is a summary of recent developments related to solar projects:
Ivanpah
—
Construction related matters have resulted in delays for the first two units of the Ivanpah project. As a result, the first unit of the Ivanpah project is now expected to be completed and producing power in the fourth quarter of 2013 instead of July 2013. The second and third units are now both expected to be completed in the fourth quarter of 2013 instead of the third and fourth quarter of 2013, respectively. Power generated from Ivanpah will be sold to Southern California Edison and PG&E under multiple 20 to 25 year PPAs.
84
Agua Caliente
—
On January 18, 2012, the Company completed the sale of a 49% interest in NRG Solar AC Holdings LLC, the indirect owner of Agua Caliente, to MidAmerican Energy Holdings Company. Operations commenced in phases through the third quarter of 2013, with 253 MW having achieved commercial operations from January through December of 2012. Full commercial operations of the entire 290 MW project was achieved as of September 30, 2013. Power generated from Agua Caliente is being sold to PG&E under a 25 year PPA.
CVSR
—
Operations commenced on the first 22 MW phase in September 2012 and 105 MWs for phases 2 and 4 in December 2012. For the completion of the final phase, 21 MWs commenced operation in the third quarter of 2013 and 102 MWs commenced operation in October 2013. Power generated from CVSR is sold to PG&E under 25 year PPAs.
High Desert
—
In the first quarter of 2013, the Company, through its wholly-owned subsidiary, NRG Solar PV LLC, acquired High Desert, a 20 MW utility-scale photovoltaic solar facility located in Lancaster, California. The project was financed with $24 million in equity and $82 million of nonrecourse project level debt as discussed in
Note 7
,
Debt and Capital Leases
. The solar facility provides electricity to Southern California Edison under a 20-year PPA.
Kansas South
—
In the second quarter of 2013, the Company, through its wholly-owned subsidiary, NRG Solar PV LLC, acquired Kansas South, a 20 MW utility-scale photovoltaic solar facility located in Kings County, California. The project was financed with $21 million in equity and $59 million of nonrecourse project level debt as discussed in
Note 7
,
Debt and Capital Leases
. The solar facility provides electricity to PG&E under a 20-year PPA.
Guam Solar Project
— In 2013, the Company, through its wholly-owned subsidiary, NRG Solar Guam LLC, acquired a 26 MW solar project in the development phase on the island of Guam, a U.S. territory. NRG Solar Guam LLC will construct, own and operate the solar project which will sell all of its power output to the Guam Power Authority under a 25-year PPA.
Distributed Solar
—
Approximately 53 MW of distributed solar projects are in operation or construction at five National Football League venues as well as other commercial or institutional sites. A critical initiative of the Company's Distributed Solar growth effort aims to establish alliances with large customers seeking renewable energy at multiple locations. This effort resulted in the May 2013 announcement of a global alliance with Starwood Hotels & Resorts Worldwide and the July 2013 announcement of a planned installation at one of the largest contiguous rooftop solar photovoltaic arrays in the world at the Mandalay Bay Resort Convention Center in Las Vegas. All of the Company's Distributed Solar projects in operation or under construction are supported by long-term PPAs.
Conventional Power Development and Acquisitions
Operational Improvement Activities
NRG has announced its intention to continue operations at the Avon Lake and New Castle facilities, which are currently in operation and had been scheduled for deactivation in April 2015. NRG intends to add natural gas capabilities at these facilities, which is expected to be completed by the summer of 2016. Additionally, the Company deactivated its Norwalk Harbor facility and has accelerated the deactivation of the Portland and Titus facilities to 2014 and 2013, respectively.
Projects Under Construction and Completed in 2013
The Company's ESEC completed construction at its El Segundo Power Generating Station, a 550 MW fast start, gas turbine combined cycle generating facility in El Segundo, California. The facility was constructed pursuant to a 10 year, 550 MW PPA with Southern California Edison. The first and second units reached commercial operation on June 28 and July 10, 2013, respectively.
The Company completed construction of the Marsh Landing project, a 720 MW natural gas-fired peaking facility adjacent to the Company's Contra Costa generating facility near Antioch, California, in 2013. The output of the facility is contracted to PG&E pursuant to a 10 year PPA. The project achieved commercial operations on May 1, 2013. In July 2013, NRG transferred ownership of the Marsh Landing project to NRG Yield LLC.
85
Gregory Acquisition
On August 7, 2013, NRG Texas Gregory LLC, a wholly-owned subsidiary of NRG, acquired the Gregory cogeneration plant in Corpus Christi, Texas from a consortium of affiliates of Atlantic Power Corporation, John Hancock Life Insurance Company (U.S.A.), and Rockland Capital, LLC. NRG paid approximately $245 million, net of $32 million cash acquired, for the plant, which has generation capacity of 388 MW and steam capacity of 160 MWt. The Gregory cogeneration plant provides steam, processed water and a small percentage of its electrical generation to the Corpus Christi Sherwin Alumina plant. The majority of the plant's generation is available for sale in the ERCOT market.
W.A. Parish Peaking Unit and Commercial Scale Carbon Capture, Utilization and Storage System
The 75 MW peaking unit at W.A. Parish achieved commercial operations on June 26, 2013. The unit is expected to be retrofitted for use as a cogeneration facility to provide steam and power to operate the CCUS, which is being partially funded by a grant from the U.S. DOE.
Construction of the CCUS is intended to allow NRG, through its wholly owned subsidiary Petra Nova LLC, to utilize the captured CO
2
in enhanced oil recovery operations in oil fields on the Texas Gulf Coast. On May 23, 2013, the U.S. DOE published the Record of Decision to the Federal Register, announcing its decision to provide cost-shared funding for the project in the amount of $167 million, $7 million of which has already been provided to NRG, as of September 30, 2013. Construction of the CCUS is subject to receipt of appropriate financing and negotiation of material contracts.
Retail Growth Initiatives
NRG's Retail Business continues to develop innovative products and services that help change the way consumers and businesses think about and use energy. In the Texas residential segments, the Company continued to expand its offering by introducing the first 100% solar product in Texas that also helps fund the development of new solar in the state. NRG also introduced a new mobile app that enables customers to manage their energy usage, view and pay their bill, set alerts and handle other account maintenance. NRG continues to expand on the Home Energy Snapshot and personalized insights and recommendations for customers as well as Degrees of Difference, a peak time rebate providing consumers with a bill credit for reducing usage upon request. In the Texas business segment, the Company continued offering energy solutions including the weekly summary email, usage alerts, Nest Thermostat, Entouch Controls, and Smart Outlets, giving them insights, choices and convenient ways to manage energy use.
In the Northeast, NRG has expanded its offerings for both businesses and households. NRG recently completed the acquisition of Energy Curtailment Specialists, or ECS. ECS is primarily a demand response provider offering business customers financial incentives for load reductions during periods of peak demand. In addition, ECS offers energy efficiency solutions and energy advisory and consulting services. ECS has a customer base of more than 5,000 customers and manages more than 1,500 MW of customer demand response throughout its markets. In the residential segment, NRG launched its newest retail brand, NRG Residential Solutions. This is the first consumer brand incorporating the NRG name. NRG Residential Solutions now offers service in 11 utility markets in Pennsylvania, New Jersey, Maryland, Washington DC and Massachusetts. As part of this brand expansion, the Company introduced a web-enrollment tool which allows consumers to customize their product to provide a personalized solution and launched an innovative smartphone application - NRG Clean Power Advisor - which helps customers determine the optimal time to use electricity based on the environmental impacts of power plants dispatched in the area. Finally, NRG is now offering households and small businesses in Philadelphia a time-of-use product which leverages utility smart meter technology, providing the ability to lower a customer’s bill by shifting energy consumption from day time to nights and weekends.
86
Off-Balance Sheet Arrangements
Obligations under Certain Guarantee Contracts
NRG and certain of its subsidiaries enter into guarantee arrangements in the normal course of business to facilitate commercial transactions with third parties. These arrangements include financial and performance guarantees, stand-by letters of credit, debt guarantees, surety bonds and indemnifications.
Retained or Contingent Interests
NRG does not have any material retained or contingent interests in assets transferred to an unconsolidated entity.
Derivative Instrument Obligations
The Company's 3.625% Preferred Stock includes a feature which is considered an embedded derivative per ASC 815. Although it is considered an embedded derivative, it is exempt from derivative accounting as it is excluded from the scope pursuant to ASC 815. As of
September 30, 2013
, based on the Company's stock price, the embedded derivative was out-of-the-money and had no redemption value.
Obligations Arising Out of a Variable Interest in an Unconsolidated Entity
Variable interest in equity investments
— As of
September 30, 2013
, NRG has several investments with an ownership interest percentage of 50% or less in energy and energy-related entities that are accounted for under the equity method of accounting. Several of these investments are variable interest entities for which NRG is not the primary beneficiary. See also
Note 8
,
Variable Interest Entities
,
to this Form 10-Q.
NRG's pro-rata share of non-recourse debt held by unconsolidated affiliates was approximately $236 million as of
September 30, 2013
. This indebtedness may restrict the ability of these subsidiaries to issue dividends or distributions to NRG. See also
Note 15
,
Investments Accounted for by the Equity Method and Variable Interest Entities
,
to the Company's
2012
Form 10-K.
Contractual Obligations and Commercial Commitments
NRG has a variety of contractual obligations and other commercial commitments that represent prospective cash requirements in addition to the Company's capital expenditure programs, as disclosed in the Company's
2012
Form 10-K. See also
Note 7
,
Debt and Capital Leases
, and
Note 13
,
Commitments and Contingencies
, to this Form 10-Q for a discussion of new commitments and contingencies that also include contractual obligations and commercial commitments that occurred during the
nine
months ended
September 30, 2013
.
87
Fair Value of Derivative Instruments
NRG may enter into long-term power purchase and sales contracts, fuel purchase contracts and other energy-related financial instruments to mitigate variability in earnings due to fluctuations in spot market prices and to hedge fuel requirements at generation facilities or retail load obligations. In addition, in order to mitigate interest rate risk associated with the issuance of the Company's variable rate and fixed rate debt, NRG enters into interest rate swap agreements. The following disclosures about fair value of derivative instruments provide an update to, and should be read in conjunction with,
Fair Value of Derivative Instruments
in Item 7 —
Management's Discussion and Analysis of Financial Condition and Results of Operations,
of the Company's
2012
Form 10‑K.
The tables below disclose the activities that include both exchange and non-exchange traded contracts accounted for at fair value in accordance with ASC 820,
Fair Value Measurements and Disclosures
, or ASC 820. Specifically, these tables disaggregate realized and unrealized changes in fair value; disaggregate estimated fair values at
September 30, 2013
, based on their level within the fair value hierarchy defined in ASC 820; and indicate the maturities of contracts at
September 30, 2013
.
|
Derivative Activity Gains/(Losses)
|
(In millions)
|
||
|
Fair value of contracts as of December 31, 2012
|
$
|
825
|
|
|
Contracts realized or otherwise settled during the period
|
(439
|
)
|
|
|
Changes in fair value
|
73
|
|
|
|
Fair value of contracts as of September 30, 2013
|
$
|
459
|
|
|
Fair Value of Contracts as of September 30, 2013
|
|||||||||||||||||||
|
Fair value hierarchy Gains/(Losses)
|
Maturity Less Than
1 Year
|
Maturity
1-3 Years
|
Maturity
3-5 Years
|
Maturity in Excess 5 Years
|
Total Fair
Value
|
||||||||||||||
|
(In millions)
|
|||||||||||||||||||
|
Level 1
|
$
|
15
|
|
$
|
59
|
|
$
|
18
|
|
$
|
—
|
|
$
|
92
|
|
||||
|
Level 2
|
316
|
|
44
|
|
(14
|
)
|
28
|
|
374
|
|
|||||||||
|
Level 3
|
(6
|
)
|
(1
|
)
|
—
|
|
—
|
|
(7
|
)
|
|||||||||
|
Total
|
$
|
325
|
|
$
|
102
|
|
$
|
4
|
|
$
|
28
|
|
$
|
459
|
|
||||
The Company has elected to present derivative assets and liabilities on a trade-by-trade basis and does not offset amounts at the counterparty master agreement level. Also, collateral received or paid on the Company's derivative assets or liabilities are recorded on a separate line item on the balance sheet. Consequently, the magnitude of the changes in individual current and non-current derivative assets or liabilities is higher than the underlying credit and market risk of the Company's portfolio. As discussed in Item 3
- Quantitative and Qualitative Disclosures About Market Risk, Commodity Price Risk
, to this Form 10-Q, NRG measures the sensitivity of the Company's portfolio to potential changes in market prices using VaR, a statistical model which attempts to predict risk of loss based on market price and volatility. NRG's risk management policy places a limit on one-day holding period VaR, which limits the Company's net open position. As the Company's trade-by-trade derivative accounting results in a gross-up of the Company's derivative assets and liabilities, the net derivative asset and liability position is a better indicator of NRG's hedging activity. As of
September 30, 2013
, NRG's net derivative asset was
$459 million
, a decrease to total fair value of $366 million as compared to
December 31, 2012
. This decrease was driven by the roll-off of trades that settled during the period slightly offset by gains in fair value.
Based on a sensitivity analysis using simplified assumptions, the impact of a $0.50 per MMBtu increase in natural gas prices across the term of the derivative contracts would result in a decrease of approximately $282 million in the net value of derivatives as of
September 30, 2013
. The impact of a $0.50 per MMBtu decrease in natural gas prices across the term of derivative contracts would result in an increase of approximately $258 million in the net value of derivatives as of
September 30, 2013
.
88
Critical Accounting Policies and Estimates
NRG's discussion and analysis of the financial condition and results of operations are based upon the consolidated financial statements, which have been prepared in accordance with U.S. GAAP. The preparation of these financial statements and related disclosures in compliance with U.S. GAAP requires the application of appropriate technical accounting rules and guidance as well as the use of estimates and judgments that affect the reported amounts of assets, liabilities, revenues and expenses, and related disclosures of contingent assets and liabilities. The application of these policies necessarily involves judgments regarding future events, including the likelihood of success of particular projects, legal and regulatory challenges, and the fair value of certain assets and liabilities. These judgments, in and of themselves, could materially affect the financial statements and disclosures based on varying assumptions, which may be appropriate to use. In addition, the financial and operating environment may also have a significant effect, not only on the operation of the business, but on the results reported through the application of accounting measures used in preparing the financial statements and related disclosures, even if the nature of the accounting policies has not changed.
On an ongoing basis, NRG evaluates these estimates, utilizing historic experience, consultation with experts and other methods the Company considers reasonable. In any event, actual results may differ substantially from the Company's estimates. Any effects on the Company's business, financial position or results of operations resulting from revisions to these estimates are recorded in the period in which the information that gives rise to the revision becomes known.
The Company identifies its most critical accounting policies as those that are the most pervasive and important to the portrayal of the Company's financial position and results of operations, and that require the most difficult, subjective and/or complex judgments by management regarding estimates about matters that are inherently uncertain. NRG's critical accounting policies include derivative instruments, income taxes and valuation allowance for deferred tax assets, impairment of long lived assets, goodwill and other intangible assets, and contingencies.
Annually during the fourth quarter, the Company revises its views of power and fuel prices including the Company's fundamental view for long term prices in connection with the preparation of its annual budget. Changes to the Company’s views of long term power and fuel prices may impact the Company’s projections of profitability, based on management's estimate of supply and demand within the sub-markets for each plant and the physical and economic characteristics of each plant. The Company believes that its revised views of projected profitability could result in a significant adverse change in the extent to which certain assets in the East region are used. If this occurs, the Company would consider this to be an indicator of impairment and would test these assets for impairment under ASC 360, Property, Plant and Equipment. Recoverability of assets to be held and used is measured by a comparison of the carrying amount of the assets to the future net cash flows expected to be generated by the asset, through considering project specific assumptions for long-term power pool prices, escalated future project operating costs and expected plant operations. If such assets are considered to be impaired, the impairment to be recognized is measured by the amount by which the carrying amount of the assets exceeds the fair value of the assets by factoring in the probability weighting of different courses of action available to the Company.
89
NRG is exposed to several market risks in the Company's normal business activities. Market risk is the potential loss that may result from market changes associated with the Company's merchant power generation or with an existing or forecasted financial or commodity transaction. The types of market risks the Company is exposed to are commodity price risk, interest rate risk, liquidity risk, credit risk and currency exchange risk. The following disclosures about market risk provide an update to, and should be read in conjunction with, Item 7A —
Quantitative and Qualitative Disclosures About Market Risk,
of the Company's
2012
Form 10-K.
Commodity Price Risk
Commodity price risks result from exposures to changes in spot prices, forward prices, volatilities and correlations between various commodities, such as natural gas, electricity, coal, oil and emissions credits. NRG manages the commodity price risk of its merchant generation operations and load serving obligations by entering into various derivative or non-derivative instruments to hedge the variability in future cash flows from forecasted sales and purchases of electricity and fuel. NRG measures the risk of its portfolio using several analytical methods, including sensitivity tests, scenario tests, stress tests, position reports and VaR. NRG uses a Monte Carlo simulation based VaR model to estimate the potential loss in the fair value of its energy assets and liabilities, which includes generation assets, load obligations and bilateral physical and financial transactions.
The following table summarizes average, maximum and minimum VaR for NRG's commodity portfolio, including generation assets, load obligations and bilateral physical and financial transactions, calculated using the VaR model for the
three
and
nine
months ended
September 30, 2013
, and
2012
:
|
(In millions)
|
2013
|
2012
|
|||||
|
VaR as of September 30,
|
$
|
83
|
|
$
|
84
|
|
|
|
Three months ended September 30,
|
|||||||
|
Average
|
$
|
85
|
|
$
|
79
|
|
|
|
Maximum
|
93
|
|
87
|
|
|||
|
Minimum
|
75
|
|
70
|
|
|||
|
Nine months ended September 30,
|
|||||||
|
Average
|
$
|
89
|
|
$
|
59
|
|
|
|
Maximum
|
104
|
|
87
|
|
|||
|
Minimum
|
75
|
|
24
|
|
|||
In order to provide additional information for comparative purposes to NRG's peers, the Company also uses VaR to estimate the potential loss of derivative financial instruments that are subject to mark-to-market accounting. These derivative instruments include transactions that were entered into for both asset management and trading purposes. The VaR for the derivative financial instruments calculated using the diversified VaR model as of
September 30, 2013
for the entire term of these instruments entered into for both asset management and trading was
$31 million
, primarily driven by asset-backed transactions.
Interest Rate Risk
NRG is exposed to fluctuations in interest rates through its issuance of fixed rate and variable rate debt. Exposures to interest rate fluctuations may be mitigated by entering into derivative instruments known as interest rate swaps, caps, collars and put or call options. These contracts reduce exposure to interest rate volatility and result in primarily fixed rate debt obligations when taking into account the combination of the variable rate debt and the interest rate derivative instrument. NRG's risk management policies allow the Company to reduce interest rate exposure from variable rate debt obligations.
The Company's project subsidiaries enter into interest rate swaps, intended to hedge the risks associated with interest rates on non-recourse project level debt. See Note 11,
Debt and Capital Leases,
of the Company's 2012 Form 10-K, as well as Note 7,
Debt and Capital Leases
of this Form 10-Q, for more information on the Company's interest rate swaps.
If all of the above swaps had been discontinued on
September 30, 2013
, the Company would have owed the counterparties
$72 million
. Based on the investment grade rating of the counterparties, NRG believes its exposure to credit risk due to nonperformance by counterparties to its hedge contracts to be insignificant.
As part of the CVSR financing, the Company entered into swaptions in order to hedge the project interest rate risk. As of
September 30, 2013
, the notional value of the swaptions was
$33 million
. If the swaptions were discontinued on
September 30, 2013
, the counterparty would have owed the Company approximately
$1 million
.
90
NRG has both long and short-term debt instruments that subject the Company to the risk of loss associated with movements in market interest rates. As of
September 30, 2013
, a 1% change in variable interest rates would result in a
$22 million
change in interest expense on a rolling twelve month basis.
As of
September 30, 2013
, the fair value of the Company's debt was
$17.1 billion
and the related carrying amount was
$16.7 billion
. NRG estimates that a 1% decrease in market interest rates would have increased the fair value of the Company's long-term debt by
$1.2 billion
.
Liquidity Risk
Liquidity risk arises from the general funding needs of NRG's activities and in the management of the Company's assets and liabilities. The Company is currently exposed to additional collateral posting if natural gas prices decline primarily due to the long natural gas equivalent position at various exchanges used to hedge NRG's retail supply load obligations.
Based on a sensitivity analysis for power and gas positions under marginable contracts, a $0.50 per MMBtu change in natural gas prices across the term of the marginable contracts would cause a change in margin collateral posted of approximately
$87 million
as of
September 30, 2013
, and a 1 MMBtu/MWh change in heat rates for heat rate positions would result in a change in margin collateral posted of approximately
$50 million
as of
September 30, 2013
. This analysis uses simplified assumptions and is calculated based on portfolio composition and margin-related contract provisions as of
September 30, 2013
.
Credit Risk
Credit risk relates to the risk of loss resulting from non-performance or non-payment by counterparties pursuant to the terms of their contractual obligations. NRG is exposed to counterparty credit risk through various activities including wholesale sales, fuel purchases and retail supply arrangements, and retail customer credit risk through its retail load activities. See
Note 4
,
Fair Value of Financial Instruments
, to this Form 10-Q for discussions regarding counterparty credit risk and retail customer credit risk, and
Note 6
,
Accounting for Derivative Instruments and Hedging Activities
, to this Form 10-Q for discussion regarding credit risk contingent features.
Currency Exchange Risk
NRG's foreign earnings and investments may be subject to foreign currency exchange risk, which NRG generally does not hedge. As these earnings and investments are not material to NRG's consolidated results, the Company's foreign currency exposure is limited.
91
Conclusion Regarding the Effectiveness of Disclosure Controls
and
Procedures
Under the supervision and with the participation of NRG's management, including its principal executive officer, principal financial officer and principal accounting officer, NRG conducted an evaluation of the effectiveness of the design and operation of its disclosure controls and procedures, as such term is defined in Rules 13a-15(e) or 15d-15(e) of the Exchange Act. Based on this evaluation, the Company's principal executive officer, principal financial officer and principal accounting officer concluded that the disclosure controls and procedures were effective as of the end of the period covered by this report on Form 10-Q.
Changes in Internal Control over Financial Reporting
NRG continues to integrate certain business operations, information systems, processes and related internal control over financial reporting as a result of the Merger. NRG will continue to assess the effectiveness of its internal control over financial reporting as merger integration activities continue.
92
For a discussion of material legal proceedings in which NRG was involved through
September 30, 2013
, see
Note 13
,
Commitments and Contingencies
, to this Form 10-Q.
Information regarding risk factors appears in Part I, Item 1A,
Risk
Factors Related to NRG Energy, Inc.,
in the Company's
2012
Form 10-K. Except as presented below, there have been no material changes in the Company's risk factors since those reported in its 2012 Form 10-K.
Policies at the national, regional and state levels to regulate GHG emissions, as well as climate change, could adversely impact NRG's results of operations, financial condition and cash flows.
NRG's GHG emissions for 2012 can be found in Item 1,
Business
—
Environmental Matters
, in the Company's 2012 Form 10-K. The impact of further legislation or regulation of GHGs on the Company's financial performance will depend on a number of factors, including the level of GHG standards, the extent to which mitigation is required, the applicability of offsets, and the extent to which NRG would be entitled to receive CO
2
emissions credits without having to purchase them in an auction or on the open market.
The Company operates generating units in Connecticut, Delaware, Maryland, Massachusetts, and New York that are subject to RGGI, which is a regional cap and trade system. In February 2013, RGGI, Inc. released a model rule that if adopted by the member states would reduce the number of allowances available and potentially increase the price of each allowance. Each of these states has proposed a rule that would reduce the number of allowances, which the Company believes would increase the price of each allowance. If adopted, the proposed rule could adversely impact NRG's results of operations, financial condition and cash flows.
The California CO
2
cap and trade program for electric generating units greater than 25 MW commenced in 2013. The impact on the Company depends on the cost of the allowances and the ability to pass these costs through to customers.
GHG emissions from power plants are regulated under various section of the Clean Air Act. In 2012, EPA proposed stringent standards for GHG emissions from certain new fossil-fueled electric generating units (simple-cycle CTs are not covered). The proposed standard is in effect until the rule is finalized or re-proposed. EPA has released a pre-publication version of its re-proposed rule for new units, which the Company expects will be published in the fourth quarter of 2013. The re-proposal is expected to include simple cycle CTs that exceed a certain capacity factor and is expected to create a different but still stringent standard for coal-fired units. The Company expects EPA to issue another rule that will require states to develop CO
2
standards that would apply to existing fossil-fueled generating facilities at some future date. This rule could adversely impact NRG's results of operations, financial condition and cash flows.
Hazards customary to the power production industry include the potential for unusual weather conditions, which could affect fuel pricing and availability, the Company's route to market or access to customers, i.e., transmission and distribution lines, or critical plant assets. To the extent that climate change contributes to the frequency or intensity of weather related events, NRG's operations and planning process could be impacted.
None.
None.
Not applicable.
None.
93
|
Number
|
Description
|
Method of Filing
|
||
|
2.1
|
Plan Sponsor Agreement, dated October 18, 2013, by and among NRG Energy, Inc., NRG Energy Holdings, Inc., Edison Mission Energy, certain of Edison Mission Energy’s debtor subsidiaries, the Official Committee of Unsecured Creditors of Edison Mission Energy and its debtor subsidiaries, the PoJo Parties (as defined therein) and the proponent noteholders thereto.
|
Incorporated herein by reference to Exhibit 2.1 to Amendment No. 1 to the Company's Current Report on Form 8-K filed on October 21, 2013.
|
||
|
2.2
|
Asset Purchase Agreement, dated October 18, 2013, by and among NRG Energy, Inc., Edison Mission Energy and NRG Energy Holdings Inc.
|
Incorporated herein by reference to Exhibit 2.2 to Amendment No. 1 to the Company's Current Report on Form 8-K filed on October 21, 2013.
|
||
|
4.1
|
Ninety-Sixth Supplemental Indenture, dated as of September 4, 2013, among NRG Energy, Inc., the guarantors named therein and Law Debenture Trust Company of New York.
|
Incorporated herein by reference to Exhibit 4.1 to the Company's Current Report on Form 8-K filed on September 6, 2013.
|
||
|
4.2
|
Ninety-Seventh Supplemental Indenture, dated as of September 4, 2013, among NRG Energy, Inc., the guarantors named therein and Law Debenture Trust Company of New York.
|
Incorporated herein by reference to Exhibit 4.2 to the Company's Current Report on Form 8-K filed on September 6, 2013.
|
||
|
4.3
|
Ninety-Eighth Supplemental Indenture, dated as of September 4, 2013, among NRG Energy, Inc., the guarantors named therein and Law Debenture Trust Company of New York.
|
Incorporated herein by reference to Exhibit 4.3 to the Company's Current Report on Form 8-K filed on September 6, 2013.
|
||
|
4.4
|
Ninety-Ninth Supplemental Indenture, dated as of September 4, 2013, among NRG Energy, Inc., the guarantors named therein and Law Debenture Trust Company of New York.
|
Incorporated herein by reference to Exhibit 4.4 to the Company's Current Report on Form 8-K filed on September 6, 2013.
|
||
|
4.5
|
One Hundredth Supplemental Indenture, dated as of September 4, 2013, among NRG Energy, Inc., the guarantors named therein and Law Debenture Trust Company of New York.
|
Incorporated herein by reference to Exhibit 4.5 to the Company's Current Report on Form 8-K filed on September 6, 2013.
|
||
|
4.6
|
One Hundred-First
Supplemental Indenture, dated as of September 4, 2013, among NRG Energy, Inc., the guarantors named therein and Law Debenture Trust Company of New York.
|
Incorporated herein by reference to Exhibit 4.6 to the Company's Current Report on Form 8-K filed on September 6, 2013.
|
||
|
4.7
|
One Hundred-Second
Supplemental Indenture, dated as of October 7, 2013, among NRG Energy, Inc., the guarantors named therein and Law Debenture Trust Company of New York.
|
Incorporated herein by reference to Exhibit 4.1 to the Company's Current Report on Form 8-K filed on October 8, 2013.
|
||
|
4.8
|
One Hundred-Third
Supplemental Indenture, dated as of October 7, 2013, among NRG Energy, Inc., the guarantors named therein and Law Debenture Trust Company of New York.
|
Incorporated herein by reference to Exhibit 4.2 to the Company's Current Report on Form 8-K filed on October 8, 2013.
|
||
|
4.9
|
One Hundred-Fourth
Supplemental Indenture, dated as of October 7, 2013, among NRG Energy, Inc., the guarantors named therein and Law Debenture Trust Company of New York.
|
Incorporated herein by reference to Exhibit 4.3 to the Company's Current Report on Form 8-K filed on October 8, 2013.
|
||
|
4.10
|
One Hundred-Fifth
Supplemental Indenture, dated as of October 7, 2013, among NRG Energy, Inc., the guarantors named therein and Law Debenture Trust Company of New York.
|
Incorporated herein by reference to Exhibit 4.4 to the Company's Current Report on Form 8-K filed on October 8, 2013.
|
||
|
4.11
|
One Hundred-Sixth S
upplemental Indenture, dated as of October 7, 2013, among NRG Energy, Inc., the guarantors named therein and Law Debenture Trust Company of New York.
|
Incorporated herein by reference to Exhibit 4.5 to the Company's Current Report on Form 8-K filed on October 8, 2013.
|
||
|
4.12
|
One Hundred-Seventh
Supplemental Indenture, dated as of October 7, 2013, among NRG Energy, Inc., the guarantors named therein and Law Debenture Trust Company of New York.
|
Incorporated herein by reference to Exhibit 4.6 to the Company's Current Report on Form 8-K filed on October 8, 2013.
|
||
|
31.1
|
Rule 13a-14(a)/15d-14(a) certification of David W. Crane
|
Filed herewith
|
||
|
31.2
|
Rule 13a-14(a)/15d-14(a) certification of Kirkland B. Andrews
|
Filed herewith
|
||
|
31.3
|
Rule 13a-14(a)/15d-14(a) certification of Ronald B. Stark
|
Filed herewith
|
||
|
32
|
Section 1350 Certification
|
Filed herewith
|
||
|
101 INS
|
XBRL Instance Document
|
Filed herewith
|
||
|
101 SCH
|
XBRL Taxonomy Extension Schema
|
Filed herewith
|
||
|
101 CAL
|
XBRL Taxonomy Extension Calculation Linkbase
|
Filed herewith
|
||
|
101 DEF
|
XBRL Taxonomy Extension Definition Linkbase
|
Filed herewith
|
||
|
101 LAB
|
XBRL Taxonomy Extension Label Linkbase
|
Filed herewith
|
||
|
101 PRE
|
XBRL Taxonomy Extension Presentation Linkbase
|
Filed herewith
|
||
94
SIGNATURES
Pursuant to the requirements of the Securities Exchange Act of 1934, the registrant has duly caused this report to be signed on its behalf by the undersigned thereunto duly authorized.
|
|
NRG ENERGY, INC.
(Registrant)
|
|
||
|
|
/s/ DAVID W. CRANE
|
|
||
|
|
David W. Crane
|
|
||
|
|
Chief Executive Officer
(Principal Executive Officer)
|
|
||
|
|
||||
|
|
|
|
||
|
|
/s/ KIRKLAND B. ANDREWS
|
|
||
|
|
Kirkland B. Andrews
|
|
||
|
|
Chief Financial Officer
(Principal Financial Officer)
|
|
||
|
|
||||
|
|
|
|
||
|
|
/s/ RONALD B. STARK
|
|
||
|
|
Ronald B. Stark
|
|
||
|
Date: November 12, 2013
|
Chief Accounting Officer
(Principal Accounting Officer)
|
|
||
|
|
||||
95
TABLE OF CONTENTS
Part I Financial InformationItem 1 Condensed Consolidated Financial Statements and NotesNote 1 Basis Of PresentationNote 2 Summary Of Significant Accounting PoliciesNote 3 Business Acquisitions and DispositionsNote 4 Fair Value Of Financial InstrumentsNote 5 Nuclear Decommissioning Trust FundNote 6 Accounting For Derivative Instruments and Hedging ActivitiesNote 7 Debt and Capital LeasesNote 8 Variable Interest EntitiesNote 9 Changes in Capital StructureNote 10 Earnings/(loss) Per ShareNote 11 Segment ReportingNote 12 Income TaxesNote 13 Commitments and ContingenciesNote 14 Regulatory MattersNote 15 Environmental MattersNote 16 Condensed Consolidating Financial InformationItem 2 Management S Discussion and Analysis Of Financial Condition and Results Of OperationsItem 3 Quantitative and Qualitative Disclosures About Market RiskItem 4 Controls and ProceduresPart II Other InformationItem 1 Legal ProceedingsItem 1A Risk FactorsItem 2 Unregistered Sales Of Equity Securities and Use Of ProceedsItem 3 Defaults Upon Senior SecuritiesItem 4 Mine Safety DisclosuresItem 5 Other InformationItem 6 Exhibits